

Assessment of Post-Wildfire Geomorphic Change in the North Fork Eagle Creek Stream Channel, New Mexico, 2017–21
Links
- Document: Report (7.22 MB pdf) , HTML , XML
- Data Releases:
- USGS data release - Data supporting the 2017 geomorphic survey of North Fork Eagle Creek, New Mexico
- USGS data release - Data supporting the 2018 geomorphic survey of North Fork Eagle Creek, New Mexico
- USGS data release - Data supporting the 2019 geomorphic survey of North Fork Eagle Creek, New Mexico
- USGS data release - Data supporting the 2020 and 2021 geomorphic surveys of North Fork Eagle Creek, New Mexico
- NGMDB Index Page: National Geologic Map Database Index Page (html)
- Download citation as: RIS | Dublin Core
Abstract
The 2012 Little Bear Fire caused substantial vegetation loss in the Eagle Creek Basin of south-central New Mexico. This loss was expected to alter the localized hydrologic response to precipitation by creating conditions that amplify surface runoff, which might alter the geomorphology of North Fork Eagle Creek, a major tributary to Eagle Creek. To monitor short-term geomorphic change, annual geomorphic surveys of North Fork Eagle Creek were conducted from 2017 to 2021. The surveys measured 14 cross sections, stream gradients, woody debris accumulations, and pools found within the study reach. During the 2017–21 study period, the study reach experienced multiple high-flow events that resulted from both monsoonal rainfall and snowmelt runoff. Comparisons of the cross-section and channel profile data for the repeat geomorphic surveys indicate localized erosion and deposition occurred as a result of the high-flow events but overall study reach geomorphology shower little change through the study period. Additionally, the number of woody debris accumulations and pools increased during the study period. Evidence from the 5-year geomorphic survey indicates that the North Fork Eagle Creek’s geomorphology did not change substantially during the study period. Wildfire severity and frequency within mountainous regions of the Southwest are projected to increase and their effect on fluvial systems remains uncertain; however, continued geomorphic studies can provide informative insight on watershed post-wildfire resiliency and recovery by establishing baselines that can be used in the event of a future severe wildfire within the Eagle Creek Basin.
Introduction
Water supply for the Village of Ruidoso, New Mexico, is derived from surface-water and groundwater resources of the Eagle Creek and Rio Ruidoso Basins (U.S. Department of Agriculture [USDA] Forest Service, 2015), both of which are located within the Upper Rio Hondo Basin in south-central New Mexico (fig. 1). On average, 24–29 percent of the annual water supply for the village is derived from three active (of four total) production wells (hereafter referred to as “North Fork wells”) located along North Fork Eagle Creek in the Lincoln National Forest near Alto, N. Mex. (USDA Forest Service, 2016) (figs. 1 and 2). The North Fork Eagle Creek Basin is one of two basins (the other is the South Fork Eagle Creek Basin) that together compose nearly all of the 8.1-square-mile (mi2) portion of the Eagle Creek Basin located upstream from the U.S. Geological Survey (USGS) Eagle Creek below South Fork near Alto, New Mexico, streamgage (USGS site 08387600; hereafter referred to as the “Eagle Creek streamgage”) (fig. 2).
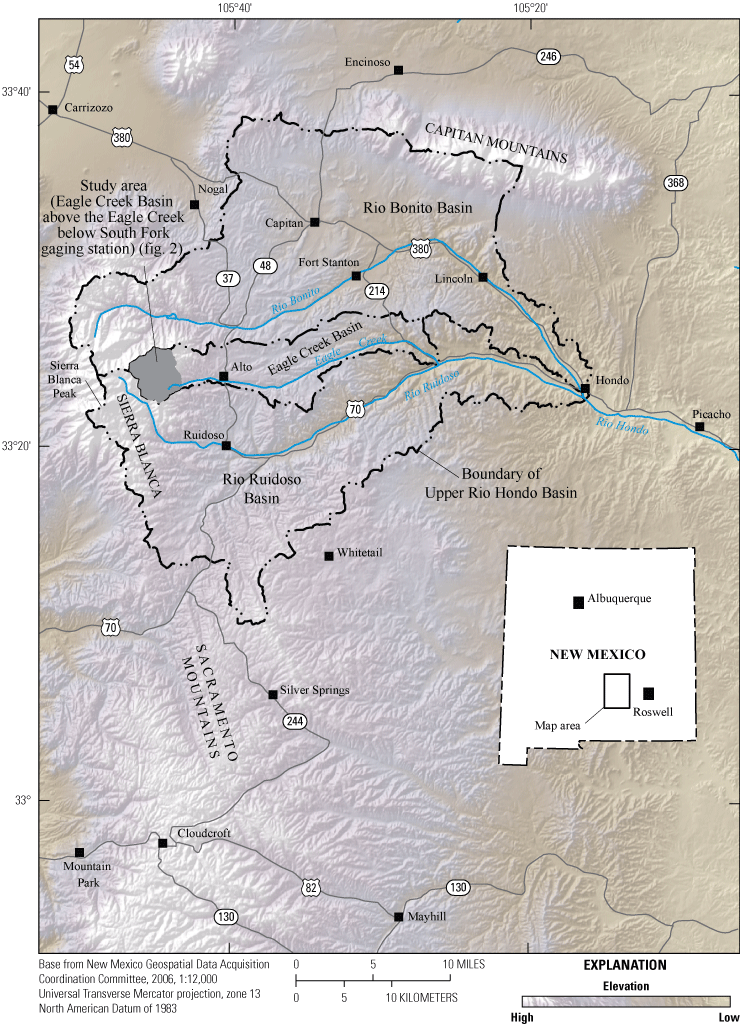
Location of the Eagle Creek Basin study area and geographic features in south-central New Mexico (modified from Matherne and others, 2010).
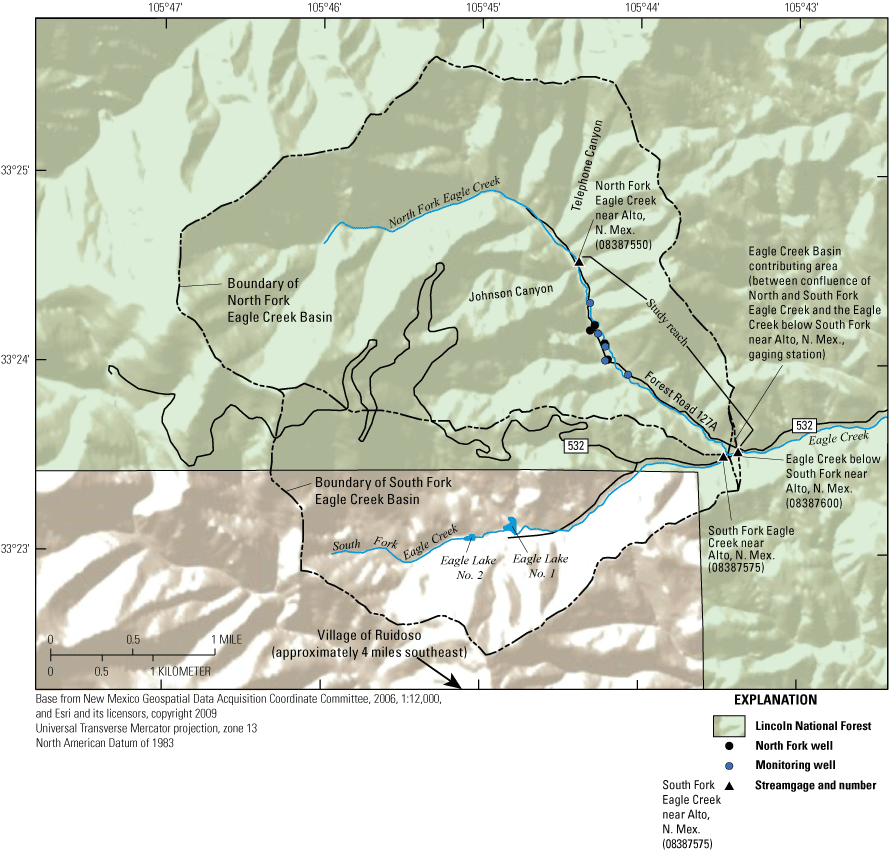
Location of the study reach, Eagle Creek Basin contributing area, Lincoln National Forest boundaries, streamgages, and wells in the study area in the Eagle Creek Basin, south-central New Mexico (modified from Matherne and others, 2010).
Production from the North Fork wells began in 1988, and the special use permit for operation of the wells (granted by the USDA Forest Service) expired in 1995 (USDA Forest Service, 2015). At that time, discussions began regarding the renewal of the special use permit with some parties concerned by the potential effects of well operations on streamflow in Eagle Creek (USDA Forest Service, 2015). As a result of these concerns, the USGS, in cooperation with the Village of Ruidoso, conducted a study of North Fork Eagle Creek from 2007 to 2009 to characterize the hydrology of the Eagle Creek Basin upstream from the Eagle Creek streamgage and the effects of groundwater pumping on streamflow (Matherne and others, 2010). The study found a decrease in mean annual streamflow, direct runoff, and base flows within the North Fork Eagle Creek after groundwater pumping started in the North Fork well field.
Following the USGS study (Matherne and others, 2010), the USDA Forest Service issued the “North Fork Eagle Creek Wells Special Use Authorization Project Draft Environmental Impact Statement” in May 2012, shortly before the start of the Little Bear Fire, which burned approximately 3,380 acres of the 3,400-acre North Fork Eagle Creek Basin in June 2012 (USDA Forest Service, Little Bear Fire Burned Area Emergency Response [BAER] Team, 2012) (fig. 3). Burn severities in the basin ranged from high to very low or unburned. Specifically, 26 percent of the basin burned at high severity, 26 percent burned at moderate severity, 27 percent burned at low severity, and 21 percent either burned at very low severity or remained unburned (USDA Forest Service Little Bear Fire BAER Team, 2012) (fig. 3). Notably, the North Fork Eagle Creek riparian corridor (defined as the area extending 200 feet [ft] on either side of the channel) primarily burned at low severity or below resulting in little loss of vegetation in this area (USDA Forest Service Little Bear Fire BAER Team, 2012).
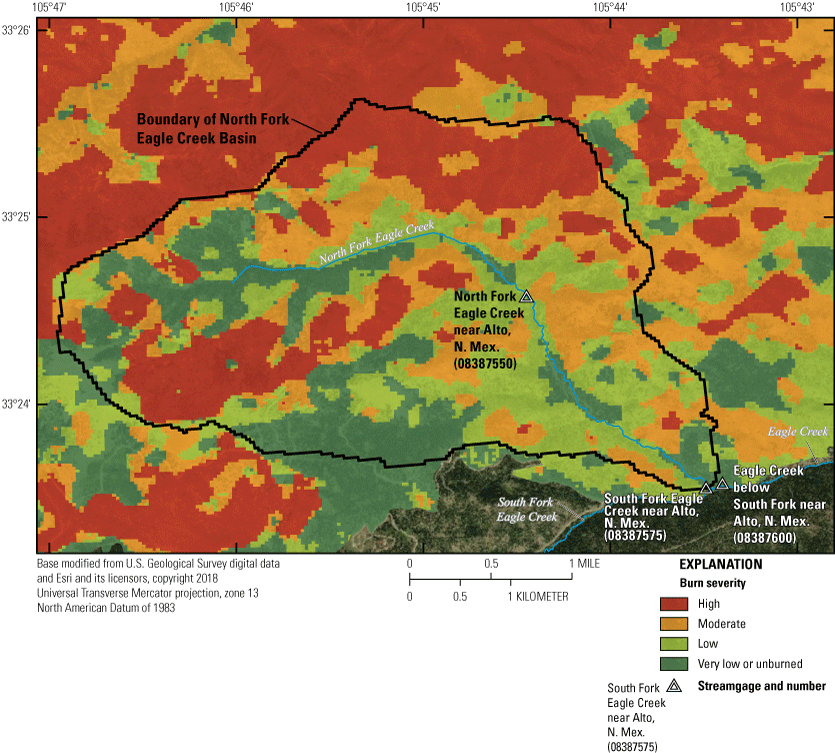
Little Bear Fire burn severity in the North Fork Eagle Creek Basin, south-central New Mexico, as established by the Burned Area Emergency Response (BAER) Team, June 18, 2012. Modified from data published in U.S. Department of Agriculture (USDA) Forest Service Little Bear Fire BAER Team (2012) and in Graziano (2019).
Following the Little Bear Fire, changes in some aspects of the hydrology of North Fork Eagle Creek Basin were expected, including reduced infiltration and associated increased overland runoff, temporary increases in “flashy” responses to rainfall and snowmelt runoff, increased sediment and debris yields, and changes to vegetation as a result of flooding (Tillery and Matherne, 2013; USDA Forest Service, 2016; Tillery and Rengers, 2020). On the basis of the altered post-wildfire watershed conditions, the USDA Forest Service, released the “Record of Decision, North Fork Eagle Creek Wells Special Use Authorization,” in February 2016, which established new monitoring and mitigation requirements (USDA Forest Service, 2016). The requirements included the implementation of multiple monitoring measures designed to help determine direct or indirect effects of pumping on the quantity and quality of both surface water and groundwater post-wildfire; therefore, the Village of Ruidoso entered into a cooperative agreement with the USGS for assistance in one of these monitoring efforts, which involves yearly geomorphic surveys of a portion of North Fork Eagle Creek. The objective of this study is to address the geomorphic monitoring requirements of the USDA Forest Service record of decision (USDA Forest Service, 2016) by conducting annual geomorphic surveys of North Fork Eagle Creek along the stream reach between the North Fork Eagle Creek near Alto, New Mexico, streamgage (USGS site 08387550; hereafter referred to as the “North Fork streamgage”) and the Eagle Creek streamgage (fig. 2). Specific plans for this study included conducting annual geomorphic surveys for 5 years (from 2017 to 2021), publishing all quality-assured survey data in a series of data releases, and publishing annual reports that summarize the surveyed geomorphic characteristics of the reach and changes from previous surveys. This report combines the results from the last 2 years of surveys (2020 and 2021) in addition to providing a summary of documented geomorphic changes and characteristics for the 5-year span of the study.
Purpose and Scope
The purpose of this report is to present the results from the 2017–21 geomorphic surveys of North Fork Eagle Creek. The annual geomorphic surveys are summarized, interpreted, and compared in order to assess any geomorphic change to the stream channel over the period of study. The 2017–19 survey data used for this report are published in previous geomorphic data releases (Graziano, 2018, 2020a; Graziano and Chavarria, 2022a). Interpretations of surveyed data were made in previous USGS Open-File Reports (Graziano, 2019, 2020b; Graziano and Chavarria, 2022a). The data from the 2020 and 2021 surveys are presented in this report and can be accessed through their associated data release (Nichols and Chavarria, 2023).
Study Area
The study area is the portion of the Eagle Creek Basin located upstream from the Eagle Creek streamgage (drainage area of 8.14 mi2) (figs. 1 and 2; table 1). The study area is located on the eastern flank of the Sierra Blanca within the Upper Rio Hondo Basin, about 4 miles (mi) northwest of the Village of Ruidoso, N. Mex., and about 2.5 mi west of Alto, N. Mex. (fig. 1). Included in the study area are the North Fork Eagle Creek Basin (drainage area of 3.16 mi2), the South Fork Eagle Creek Basin (drainage area of 2.79 mi2), and a small contributing area from the Eagle Creek Basin (fig. 2). The study area is a forested mountain watershed whose dominant tree species are Pinus ponderosa (ponderosa pine) and mixed conifers (U.S. Forest Service, written commun., 2007).
Table 1.
U.S. Geological Survey streamgages in the study area in the North Fork Eagle Creek Basin, south-central New Mexico (U.S. Geological Survey, 2022a, b, c).[Streamgage locations shown on figure 2. mi2, square mile; ft, foot; NGVD 29, National Geodetic Vertical Datum of 1929].
Streamflow in the study area is measured by the USGS at three streamgages (fig. 2; table 1). These streamgages include the previously mentioned North Fork and Eagle Creek streamgages in addition to the South Fork Eagle Creek near Alto, New Mexico, streamgage (USGS site 08387575; hereafter referred to as the “South Fork streamgage”). The Eagle Creek streamgage is located 270 ft (0.05 mi) downstream from the confluence of North Fork Eagle Creek and South Fork Eagle Creek, 1.84 mi downstream from the North Fork streamgage, and 430 ft (0.08 mi) downstream from the South Fork streamgage (fig. 2). The North Fork streamgage is located 1.79 mi upstream from the confluence of North Fork Eagle Creek and South Fork Eagle Creek, and the South Fork streamgage is located 160 ft (0.03 mi) upstream from the confluence of North Fork Eagle Creek and South Fork Eagle Creek (fig. 2).
The focus of the study is the North Fork Eagle Creek Basin, which was substantially burned by the 2012 Little Bear Fire (fig. 3). It is a mostly undeveloped basin, except for the public-supply wells and their associated infrastructure and a group of 22 cabins, which are mostly located upstream from the North Fork streamgage (Matherne and others, 2010). The basin is characterized by narrow, steep drainages. The head of the North Fork Eagle Creek drainage has an elevation of about 10,500 ft above the North American Vertical Datum of 1988 (NAVD 88). The Eagle Creek streamgage has an elevation of about 7,600 ft, giving North Fork Eagle Creek an average stream gradient of about 640 feet per mile (ft/mi) (Matherne and others, 2010).
The study reach begins about 260 ft upstream from the North Fork streamgage (where there is a bridge along Forest Road 127A that crosses over North Fork Eagle Creek) and ends at the Eagle Creek streamgage (fig. 2). In total, the study reach is 1.89 mi long. The study reach for the 2018–21 surveys is about 160 ft longer than the study reach defined for the 2017 survey, with the additional 160 ft being used to visually identify and quantify woody debris accumulations, pools, and other features of geomorphic significance. The study reach for the 2017 survey began about 100 ft upstream from the North Fork streamgage (Graziano, 2019) instead of 260 ft upstream from the North Fork streamgage.
Large sections of the study reach are characterized by intermittent streamflow, and streamflow volumes in the study reach have likely been affected by the North Fork wells that pump groundwater from the bedrock aquifer to supply water to the Village of Ruidoso (Matherne and others, 2010). Specifically, Matherne and others (2010) estimated that after the installation of the North Fork wells, the groundwater flow out of the basin decreased from 33 percent of the basin yield to 16 percent, with 17 percent being diverted to groundwater pumping. Matherne and others (2010) also found that the sum of streamflows recorded at the South Fork and North Fork streamgages was greater than the streamflow recorded at the Eagle Creek streamgage the majority of the time during the 19-month period from September 2007 through March 2009, which would indicate surface-water loss from infiltration within the study reach.
Methods
Field surveys were conducted on June 19–23, 2017, June 12–14, 2018, June 17–20, 2019, June 8–10, 2020, and May 17–20, 2021. During the field surveys, 14 cross-section locations, established in 2017 (Graziano, 2019) (fig. 4), were surveyed using USGS techniques and methods for single-base real-time kinematic global navigation satellite system (RTK GNSS) surveys (Rydlund and Densmore, 2012). All accumulations of woody debris, all pools, and all other features of geomorphic significance found in the reach were identified, cataloged, photographed, and surveyed for location (by using RTK GNSS receivers or estimation methods). All accumulations of woody debris were classified by their potential to form debris jams, all pools were measured for residual depth, and selected pools were surveyed for thalweg elevation by using RTK GNSS receivers. Streamflow data collected from streamgages can be obtained from the National Water Information System database (U.S. Geological Survey, 2022a, b, c), whereas the survey data for each year surveyed are available in the accompanying data releases (Graziano, 2018; 2020a; Graziano and Chavarria, 2022b; Nichols and Chavarria, 2023). The following sections describe the specific methods used for the geomorphic surveys.
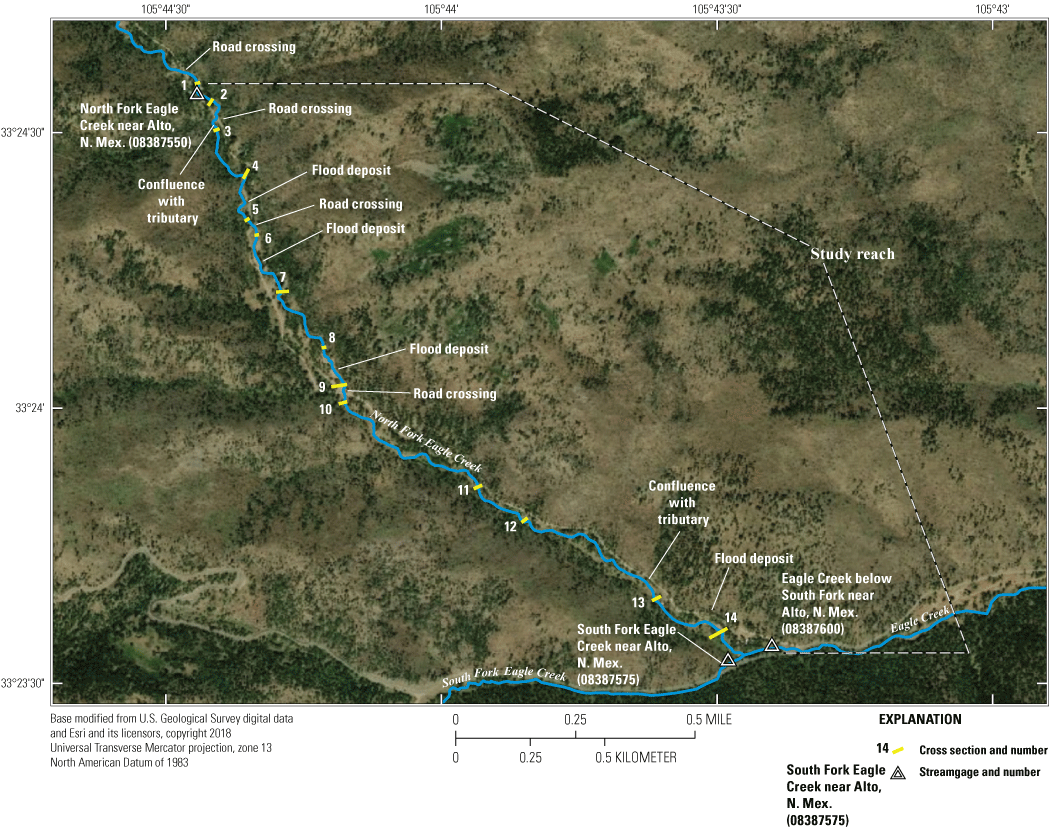
Study reach extent, locations of streamgages, locations and extents of cross sections, and locations of other features in the North Fork Eagle Creek Basin, south-central New Mexico, 2017−21 (Graziano, 2019).
Cross-Section Surveys
In 2017, cross sections were surveyed at 14 locations along the study reach on North Fork Eagle Creek (Graziano, 2019) (fig. 4). The cross-section locations were initially chosen on the basis of equal distance estimations, with one cross section established approximately every 1,500 ft, beginning 100 ft upstream from the North Fork streamgage and ending 380 ft upstream from the confluence with South Fork Eagle Creek (Graziano, 2019). Additional cross sections were then established in 2017 at locations that were thought to be particularly susceptible to geomorphic change. These additional cross sections were established directly downstream from tributaries and road crossings and in the middle of large flood deposits. These deposits were identified as sections of the study reach where floodplain vegetation was sparse and floodplain surface materials were primarily composed of coarse, unconsolidated sediments that appeared to have been transported and deposited during recent seasonal high-flow events.
At the 14 locations where cross sections were established and surveyed in 2017, reference marks for future surveys were monumented in concrete on both banks (Graziano, 2019). For the 2018–21 surveys, those reference marks were used to identify and resurvey the same 14 cross sections (fig. 4). Cross sections were surveyed from left to right from the perspective oriented downstream and included points within the channel and on the adjacent floodplains. Cross sections were surveyed in accordance with USGS standard protocols (Benson and Dalrymple, 1967), whereby an individual survey point was selected on the basis of where substantial changes in slope occurred. Selected survey points also included the points of lowest elevation in each cross section.
Individual cross-section points, woody debris accumulations, and pools were surveyed for location and elevation by using RTK GNSS surveys as described in Rydlund and Densmore (2012). The Online Positioning User Service (National Geodetic Survey, 2020) was used with one base station position to correct all survey points to the North American Datum of 1983 (NAD 83) and to NAVD 88. Horizontal and vertical positional accuracies, quantified in the RTK GNSS output files, for most points ranged from plus or minus (±) 0.1 to ±0.3 ft, relative to those datums. In Graziano (2020a), Graziano and Chavarria (2022a), and in Nichols and Chavarria (2023), all cross-section points having an error in positional accuracy greater than ±0.3 ft are noted. Many of the woody debris accumulations and pools were found in places where RTK GNSS reception was poor; therefore, their locations have approximated horizontal positional accuracies ranging from ±0.1 to ±3.0 ft relative to NAD 83. In Graziano (2020a), Graziano and Chavarria (2022a), and in Nichols and Chavarria (2023), all woody debris accumulations and pools having an error in horizontal positional accuracy greater than ±3.0 ft (that were surveyed by using RTK GNSS) are noted.
Additionally, various considerations such as RTK GNSS reception issues made it impossible to determine the location of some woody debris accumulations and pools using RTK GNSS receivers. In such cases, locations were estimated by using (1) field notes and photographs that recorded tape measurements from nearby benchmarks, (2) placement descriptions (which included estimated distances between all features), and (3) digital mapping software (ArcGIS Pro 2.8.2). The horizontal positional accuracies of locations determined by using this method were estimated to be ±50 ft. This accuracy estimate was largely based on how well the estimated distances between features surveyed using RTK GNSS (from the field notes) compared with the actual distances between those features (from the RTK GNSS survey results). In Graziano (2020a), Graziano and Chavarria (2022a), and in Nichols and Chavarria (2023), the location source (either RTK GNSS or digital map) is included for each surveyed point.
Cross-Section Plots and Characteristics
Cross-section plots for 2017–20 were developed using the slope-area computation graphical user interface (SACGUI) application (Bradley, 2012), whereas 2021 cross-section plots were developed by the International River Interface Cooperative’s (iRIC’s) Slope Area Computation (SAC) solver (International River Interface Cooperative, 2022). The SACGUI application and SAC solver both utilize version 7 of the SAC program, which is described in Fulford (1994). Both were developed on the basis of the standard USGS slope-area measurement technique presented in Dalrymple and Benson (1968). SACGUI and SAC include a method for the development of cross-section plots by using x-y-z coordinates. For this study, both applications were used to convert x-y coordinates to “distance from left bank” values, which represent the distance from the left bank reference mark.
Additionally, other cross-section characteristics (including channel width and area and bank height and slope) based on bankfull stage estimates were derived from SACGUI and SAC output files. Bankfull stage is the water level of the bankfull streamflow, which has been defined as the streamflow that completely fills the channel without spilling onto the floodplain (Leopold and others, 1964; Knighton, 1998). The method to estimate bankfull stage for each survey was largely based on methods described in the reports documenting the 2017 and 2018 surveys (Graziano, 2019, 2020b). Bankfull estimates were confirmed/adjusted with field observations of bank locations and were also informed by the cross-section plots, and photographs of the cross sections. The primary topographic features used to determine bankfull stage were the abrupt decreases in slope typically associated with the transition between the channel and the floodplain. These determinations were then secondarily verified by water mark indicators such as channel terraces, changes in soil composition, and vegetation type. However, because the transition point between the channel and floodplain was poorly defined in some areas, making accurate estimates of bankfull stage was difficult at some cross-section locations.
Determining bankfull stage is characteristically subjective (Johnson and Heil, 1996); therefore, to retain consistency in the methods used to determine bankfull stage, two criteria established in Graziano (2019) for the 2018 survey were utilized for estimating bankfull stage for the following surveys of North Fork Eagle Creek. As stated in Graziano (2019), when the tops of the left and right banks were asymmetrical but close enough in height that could be reasonably used for estimating bankfull stage, it was decided that estimates of bankfull stage would always be based directly on the lowest height of the two banks. Second, at the locations where banks were well defined, the channel often appeared to be between 1 and 3 ft deep; therefore, it was decided that for the locations where banks were poorly defined, any decreases in slope between the depths of about 1 and 3 ft would be carefully considered when making estimates of bankfull stage.
Estimates of bankfull stage were then used to calculate the following characteristics for each cross section: maximum depth at bankfull stage (in feet), cross-section width (in feet), cross-section area (in square feet), left and right bank heights looking downstream (in feet), and left and right bank slopes looking downstream (dimensionless, in feet per foot). Maximum depth at bankfull stage was defined as the depth of the thalweg at bankfull stage. Cross-section width was defined as the width of the water surface of the main channel at bankfull stage. Cross-section area was defined as the wetted area of the main channel at bankfull stage. Left and right bank heights were defined as the heights of the two banks of the main channel at bankfull stage and left and right bank slopes were defined as the bank’s height divided by its width at bankfull stage (fig. 5). Maximum depths, cross-section areas, and cross-section widths at bankfull stage were calculated in RStudio using SAC cross-section outputs (RStudio, 2022). Bank heights and slopes were calculated from interpretations of SAC cross-section outputs by defining the top of a bank as the point at which bankfull stage intersected the bank, and by defining bottom of bank as the cross-section point at the base of the corresponding bank where abrupt increases in slope began moving from the channel bed to the bank.
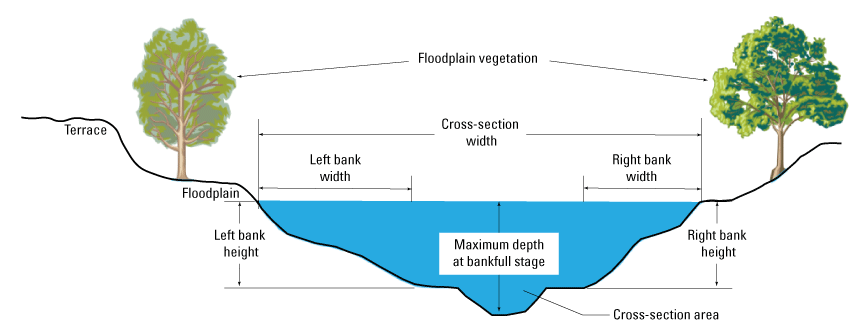
Conceptual diagram of a typical stream cross-section showing the measurements used to define channel characters within the North Fork Eagle Creek during the 2017–21 surveys. Modified from Parrett and Johnson (2004).
Woody Debris
Woody debris is an important component of forested watersheds that can substantially affect the hydrology, geomorphology, and ecology of streams (Wallace and others, 1995; Abbe and Montgomery, 1996; Gurnell and others, 2002). Geomorphic studies of woody debris often focus on large woody debris (LWD), typically defined as logs and branches greater than 0.3 ft in diameter and 5 ft in length (Heimann, 2017), a definition that is also used for LWD in this report. Importantly, LWD can serve as “key members” in debris jams (Abbe and Montgomery, 1996), meaning that they can initiate debris jam formation. Debris jams can control pool and bar formation (Abbe and Montgomery, 1996), pool spacing (Montgomery and others, 1995), sediment storage, channel width, and stream gradient (Nakamura and Swanson, 1993), in addition to other geomorphic channel characteristics (Gurnell and others, 2002).
During the 2020 and 2021 surveys, all areas where woody debris accumulated in the channel of the study reach on the North Fork Eagle Creek were identified, cataloged, photographed, and surveyed for location using the same methods that were used for the 2018 and 2019 surveys (Graziano, 2020b, Graziano and Chavarria, 2022b), and generally the same methods that were used for the 2017 survey (Graziano, 2019) but with more rigorous application. Woody debris was identified by walking the study reach of the channel from upstream to downstream. Generally, areas having woody debris of any size were cataloged and referred to as “woody debris accumulations,” including individually scattered pieces of LWD and small piles of twigs and sticks. However, individually scattered twigs and sticks were not cataloged, photographed, or surveyed for location, as this type of debris mostly looked to have fallen directly into the channel from nearby trees instead of being deposited by streamflow. Additionally, the potential geomorphic effects of this type of debris were presumed to be negligible.
From the photographs, all identified woody debris accumulations were later classified on the basis of whether they were debris deposits, potential debris jams, or active debris jams. These classifications were originally defined in Graziano (2019) for the 2017 survey. For the 2018–21 surveys, the definitions remained the same and are provided in the remainder of this section.
Debris deposits are wood collections that appear to have been deposited in a largely random fashion during the recessions of wood-mobilizing streamflow (Graziano, 2019). Debris deposits can be found anywhere in the channel and can include scattered LWD or loose accumulations of smaller woody debris. Because debris deposits were not characterized by tightly packed debris and did not appear to contain key members that could potentially initiate the formation of a debris jam (particularly, not in the location where they were found), they were not identified as active or potential debris jams (Abbe and Montgomery, 1996). Further, the debris deposits often did not contain woody debris that met the size limit for LWD (0.3 ft in diameter and 5 ft long) (Heimann, 2017), and they did not typically retain any branches; therefore, the likelihood that this type of debris could later snag and anchor floating material, and thereby become a key member of a debris jam was presumed to be low. However, pieces of debris deposits could be remobilized during a subsequent high flow event and add to the volume of debris jams downstream.
Potential debris jams are pieces of LWD that, because of their placement and size, have the potential to later serve as key members in debris jams (Heimann, 2017; Graziano, 2019). The LWD found in potential debris jams could be trees that fell from the adjacent floodplain or hillslope into or across the channel and may still be anchored to the bank, logs that were placed across the channel by people for recreational purposes, or logs that were carried downstream by high flows and settled perpendicular or oblique to flow direction and were long enough to span most, if not all, of the channel in their settled locations. The likelihood that the LWD found in these areas could become key members in debris jams, particularly in the areas where they were found, was presumed to be higher than that of the woody debris accumulations defined only as debris deposits (Abbe and Montgomery, 1996).
Active debris jams are areas where debris jams have already formed (Graziano, 2019). They were identified by the presence of woody debris and possibly other debris (including grass, pinecones, pine needles, and sediment) packed tightly against one or more key members of woody debris. Further, the tightly packed debris was usually observed to be on the upstream side of the key members (Abbe and Montgomery, 1996). The key members were typically LWD, but because of the relatively small size of the channel in some locations, they could be smaller than the LWD definition used for this study (Heimann, 2017). Because woody debris jams have the potential to control geomorphic channel characteristics, active debris jams were presumed to be the most likely woody debris accumulations that had served, or could later serve, as drivers of geomorphic change in the study reach (Nakamura and Swanson, 1993).
Pools
Pools, which are important components of stream ecosystems, provide habitat for various aquatic species (Wallace and others, 1995) and contribute to hydraulic complexity, which supports habitat diversity (Buffington and others, 2002). Pool dimensions and frequency can be affected by woody debris (Montgomery and others, 1995; Abbe and Montgomery, 1996), sediment load (Madej and Ozaki, 1996), and other watershed disturbances (Lisle, 1982).
During the 2017–21 surveys, all pools in the main channel of the study reach on North Fork Eagle Creek were identified, cataloged, photographed, surveyed for location, and measured for residual depth. Additionally, during the 2018–20 surveys the deepest parts of selected pools (where RTK GNSS reception was good) were surveyed for thalweg elevation. In wet sections of the study reach, pools were identified as locations at base flow where velocities decreased and water depths increased. They were verified by the presence of downstream riffle crests or artificial weirs, which were at higher elevations than the channel thalweg and controlled the stage. In dry sections of the study reach, pools were primarily identified as locations where the thalweg of the channel appeared to be longitudinally concave and, in the presence of water, would presumably adopt the features previously mentioned.
During the 2018 and 2019 surveys, pools were measured for residual depth by the difference in depth or bed elevation between a pool and the downstream riffle crest (Graziano, 2020b; Graziano and Chavarria, 2022b). Residual depth is a simple, unbiased, and ecologically important pool dimension that is independent of variations caused by streamflow (Lisle, 1987) and thus is a good metric for monitoring geomorphic change to pools over time. For measuring residual depth at pools identified in wet sections of the study reach, an engineer’s rule was used to measure water depth at both the deepest part of each pool and the deepest part of each pool’s downstream riffle crest. Residual depth for each pool was calculated by taking the difference between the two values. Using this method, residual depths were measured to the nearest 0.01 ft, and on the basis of uncertainty in the correct selection of the deepest parts of the pools and riffle crests, accuracy was estimated to be ±0.1 ft.
For measuring residual depth at pools identified in dry sections of the study reach, a survey rod with engineer’s scale was held vertically at the deepest part of each dry pool, and the depth of the lowest point of each dry pool’s downstream riffle crest was roughly measured by line of sight. The depth determined for each dry pool’s downstream riffle crest in relation to the deepest part of the dry pool was the residual depth. Using this method, the residual depths were measured to the nearest 0.5 ft, and the accuracy was estimated to be ±0.5 ft, which means that dry pools with a residual depth of 0.5 ft were within the level of detection but may not actually function as pools during periods when water is present. The large uncertainty in the residual depths of dry pools reflects the difficulty in both the identification of pools and the measuring of the residual depths of pools in dry sections of the study reach. The Graziano (2020a) and Graziano and Chavarria (2022a) data releases include the residual depth measurements and information on the streamflow condition (flowing, standing, or dry) for each pool at the time it was surveyed.
On the basis of the residual depth results from the 2018 survey and of the accuracy of the dry pool measurements, residual depth classifications were developed for all pools surveyed in 2018 (Graziano 2020b). All pools with residual depths less than 0.75 ft were classified as shallow, all pools with residual depths between 0.75 and 1.25 ft were classified as intermediate, and all pools with residual depths greater than 1.25 ft were classified as deep. These same classifications are used in this report.
Other Features of Geomorphic Significance
Beginning with the 2018 survey and continuing with the 2019–21 surveys, other features of geomorphic significance, including road crossings, flood deposits, tributary confluences, channel bifurcations, and fine-sediment accumulations (Nanson and Knighton, 1996) found in the study reach on North Fork Eagle Creek were identified, cataloged, photographed, and surveyed for location (Graziano 2020a; Graziano and Chavarria, 2022a; Nichols and Chavarria, 2023). Road crossings were identified as locations where the study reach crosses Forest Road 127A (fig. 2) by flowing under a bridge or through a culvert or by flowing over the road as a low water crossing. Flood deposits were identified as sections of the study reach where floodplain vegetation was sparse and floodplain surface materials were primarily composed of coarse, unconsolidated sediments that appeared to have been transported during, and deposited subsequent to, recent seasonal high-flow events. The larger flood deposits were also associated with braiding of the channel. Tributary confluences were identified either by flowing water seen entering the study reach during the survey or by the presence of culverts seen along the road adjacent to the study reach. Channel bifurcations were identified as areas where the main channel forked before reconverging again within about 100 ft. For each channel bifurcation, points both where the channel forked and reconverged were identified and surveyed. Areas where the channel appeared to separate into more than two distributaries were not identified as channel bifurcations (Graziano, 2020b). Fine-sediment accumulations were identified as fine-grained deposits (finer than those in the surrounding streambed) that were impounded by obstructions in the main channel (for example, woody debris accumulations, boulders, and bedrock).
The methods for identifying fine-sediment accumulations were not rigorously adhered to throughout the study period; therefore, the catalog of these features was not comprehensive for the study reach. However, because at least some fine-sediment accumulations were photographed and surveyed, the information that was collected for them can be used for spot monitoring of geomorphic change to the study reach. If the fine-sediment accumulations or other identifiable features (such as the collocated active debris jams) remain in place, photographs taken during the 2018–21 surveys were used to provide evidence of change, either to the stability or the dimensions of the fine-sediment accumulations.
Road crossings and flood deposits were first identified in the field during the 2018 survey and then located by using aerial imagery from March 2016 in Google Earth. These features were identified again in the same locations during the 2019 and 2020 surveys. Because the locations of road crossings and flood deposits were defined as points (rather than polygons) and could be verified by characteristics that were visible in aerial imagery (for example, in aerial imagery, flood deposits could be identified by a lack of vegetation and by sand-colored surface material extending out 25 ft or more from the sides of the channel), horizontal positional accuracy for those features was not determined because it would not have exceeded the relatively large size of the features. For the rest of the features of geomorphic significance, the locations were determined by using either RTK GNSS receivers or the estimation methods used for woody debris accumulations and pools. In Graziano (2020a) and in Graziano and Chavarria (2022a), the location source (either RTK GNSS or digital map) is included for each surveyed point.
Considerations in the Comparison Between Survey Results
To compare high flow events that were observed between the surveys to the historical streamflow record, exceedance probabilities were calculated from daily mean streamflow of the North Fork Eagle Creek from January 1, 1992, to May 20, 2021 (Matherne and others, 2010). The daily mean streamflow exceedance probabilities were then plotted on a log y-axis with each day probability point being color coded to month in which it was observed. This was done to identify any seasonal patterns within the streamflow record. Daily mean exceedance probabilities were calculated by (Dunne and Leopold, 1978):
whereP
= the percent probability that a given streamflow value will be equaled or exceeded,
M
= the rank-value of a recorded streamflow value in descending order, and
n
= the total number of recorded streamflow values.
To compare the results of the 2017–21 geomorphic surveys of North Fork Eagle Creek, certain discrepancies among the five datasets needed to be considered and accounted for. First, all of the published cross-section elevation data from the 2017 and 2018 surveys (Graziano, 2018, 2020a) needed to be corrected to NAVD 88 (the vertical datum of the 2019 survey). The cross-section elevation data published for the 2017 and 2018 surveys had documented local vertical positional accuracies (between ±0.1 and ±0.2 ft), but the vertical positional accuracies relative to NAVD 88 were unknown when the data were published (Graziano, 2019, 2020b). In contrast, the 2019–21 survey cross-section data had documented vertical positional accuracies (between ±0.1 and ±0.3 ft) locally and relative to NAVD 88 (Graziano and Chavarria, 2022a; Nichols and Chavarria, 2023).
The elevations of selected cross-section reference marks from 2019 were used to correct all cross-section elevation data from 2017, 2018, and 2021 for comparison and plotting purposes. Elevation correction factors were determined by differencing selected reference marks from the 2019 survey, based on RTK GNSS elevation accuracy recorded in the survey’s metadata, to those same reference marks in the 2017, 2018, and 2021 surveys (table 2). For example, the 2017 elevation data for cross sections 1–10 were corrected by adding 2.60 ft, quantified by differencing the cross-section 3 right bank reference mark. Likewise, cross sections 11–14 were corrected by adding 0.38 ft, quantified by differencing the cross-section 13 left bank reference mark. Single correction factors for the 2017 and 2018 surveys could not be used, because the base station was moved during both surveys. Comparisons of the 2020 cross-section elevations with 2019 elevations indicated small average elevation differences of 0.07 ft, which is below the RTK GNSS accuracy limit; therefore, no elevation corrections were applied to 2020 cross sections. Lastly, the 2019 distance published in Graziano and Chavarria (2022b) for cross section 4 needed to be corrected to be accurately compared with the other surveys. This correction was necessary because the horizontal positions for three of the points in cross section for the 2019 survey were surveyed with poor accuracy (greater than 3.3 ft). These corrections introduced about ±0.1 to ±0.2 ft of additional uncertainty to the comparisons. Table 2 lists the elevation correction factors applied to the cross sections and their respective reference marks for each of the surveys.
Table 2.
Cross-section elevation and distance correction factors for the 2017–21 surveys.[ft, foot; XS, cross section; --, not calculated because correction factor was not needed]
Other sources of uncertainty in cross-section data comparisons included the RTK GNSS accuracies (discussed previously in the “Cross-Section Surveys” section) and the roughness of the topography (Graziano, 2020b; Graziano and Chavarria, 2022b). Features that contributed to the roughness of the topography included coarse surface materials, such as rocks and vegetation. Field measurements that could be used to calculate uncertainty from the roughness of the topography have not been made; therefore, uncertainties in 2017–21 cross-section data comparisons could not be completely and accurately quantified. However, these sources of uncertainty were considered and are discussed in the comparison of the channel-profile and cross-section results from the surveys in the “Geomorphic Survey of North Fork Eagle Creek from 2017 to 2021” section. During the 2019 survey, cross section 2 right bank elevations had large uncertainties and were excluded (Graziano and Chavarria, 2022b). Also, during the 2021 survey, cross section 2 had more than 50 percent of its elevation points labeled as erroneous outliers (single elevation points having a difference greater than 2.5 ft from previous surveys and fluctuations greater than 2 ft between each individual elevation point) resulting in a high degree of uncertainty for this cross section; therefore, it was removed from the 2021 survey data.
Other discrepancies considered when comparing the results of the 2018–21 surveys to the 2017 survey included possible differences in the methods used for identifying woody debris accumulations and known differences in the methods used for identifying pools (Graziano, 2020b; Graziano and Chavarria, 2022b). These discrepancies were also sources of uncertainty that were considered and are discussed in the “Woody Debris” and “Pools” sections. Generally, these comparisons relied heavily on photographic evidence.
Results
Streamflow Prior to 2017 Survey
Streamflow records before the 2017 geomorphic survey are presented and discussed in Graziano (2019). Generally, Graziano (2019) found that, for the period up to 2017 (see table 1 for the period of record for individual streamgages), streamflow at the streamgages in the Eagle Creek Basin mostly was less than 2.0 ft3/s. Sustained periods of streamflow greater than 2.0 ft3/s were typically a result of snowmelt runoff in March, April, and May. Matherne and others (2010) estimated that sustained streamflow greater than 2.2 ft3/s is needed to maintain continuous streamflow through the entire channel of North Fork Eagle Creek. Graziano (2019) also found that, for the period ending in 2017, peak annual streamflows greater than 50 ft3/s had a 2-year recurrence interval at the North Fork and Eagle Creek streamgages. At all three streamgages in the Eagle Creek Basin, when peak annual streamflows greater than 50 ft3/s occurred, they were most often a result of heavy rainfall occurring during the North American monsoon season from July through September. Graziano (2019) also chose a streamflow of 50 ft3/s at the Eagle Creek streamgage to categorize a high flow event. For the remainder of this report, the same streamflow threshold will be used when describing such events. From the start of the Little Bear Fire (in 2012) to 2017, the average daily streamflow was 2.33 ft3/s, and there was a total of nine high flow events, with the highest instantaneous streamflow of 166 ft3/s occurring on July 14, 2014.
Streamflow During Surveying
During the days in which the five surveys took place, continuous streamflow (recorded at 15-minute intervals) at the North Fork Eagle Creek streamgage during the days of the survey ranged from 0.31 to 0.36 ft3/s, 0.12 to 0.18 ft3/s, 0.14 to 0.23 ft3/s, 0.17 to 0.29 ft3/s, and 0.15 to 0.23 ft3/s, respectively (U.S. Geological Survey, 2022b). During the 2017, 2018, and 2021 field surveys, there was no streamflow at the Eagle Creek streamgage during the days of the survey, although streamflow at the streamgage ranged from 0.13 to 0.24 ft3/s and from 0.16 to 0.28 ft3/s during the 2019 and 2020 surveys, respectively (U.S. Geological Survey, 2022a). During the days of the five surveys, the streamflow at South Fork Eagle Creek ranged from 0.22 to 0.44 ft3/s, 0.01 to 0.19 ft3/s, 0.10 to 0.52 ft3/s, 0.05 to 0.20 ft3/s, and 0 to 0.03 ft3/s, respectively (U.S. Geological Survey, 2022c). A substantial amount of the Eagle Creek study reach was observed to have a dry streambed during all five surveys (Graziano, 2019, 2020b; Graziano and Chavarria, 2022b).
Period 1—June 19, 2017, to June 14, 2018
Daily mean streamflow (a 24-hour average of 15-minute instantaneous streamflow starting at 12:00 a.m. each day) at the Eagle Creek streamgage for period 1 (Graziano, 2020b) ranged from 0 ft3/s, which occurred between May 29, 2018, and June 14, 2018, to 82 ft3/s, which occurred on February 17, 2018, and had an overall average of 1.8 ft3/s (U.S. Geological Survey, 2022a). At the North Fork streamgage, daily mean streamflow ranged from 0.1 ft3/s, which occurred on June 12 and 13, 2018, to 40 ft3/s, occurring on February 17, 2018 (U.S. Geological Survey, 2022b). Daily mean streamflow at the South Fork streamgage ranged from 0.1 ft3/s, which occurred on May 31, 2018, and June 1, 2018, to 1.5 ft3/s, which occurred on July 31, 2017 (U.S. Geological Survey, 2022c). During period 1, the daily mean streamflow at the Eagle Creek and North Fork streamgages was less than 2.0 ft3/s for 325 and 332 days, respectively (U.S. Geological Survey, 2022a, b). Daily mean streamflow was less than 1.0 ft3/s for 346 of the 361 days at the South Fork streamgage (U.S. Geological Survey, 2022c).
Two distinct high-flow events, indicated by a peak instantaneous streamflow exceeding 50 ft3/s, occurred at the Eagle Creek streamgage during period 1. Peak instantaneous streamflows for these events were 99 and 120 ft3/s and occurred on July 31, 2017, and February 16, 2018, respectively (U.S. Geological Survey, 2022a). The high-flow event that produced the peak on July 31, 2017, was distinctly flashier than the high-flow event that produced the peak on February 16, 2018. Specifically, the peak on July 31, 2017, was reached about 45 minutes after the start of the event, whereas the peak on February 16, 2018, was reached about 35 hours after the start of the event (U.S. Geological Survey, 2022a). Further, streamflow during the event that produced the peak on February 16, 2018, remained greater than 50 ft3/s for about 2 days in total, whereas streamflow during the event that produced the peak on July 31, 2017, only remained greater than 50 ft3/s for about 2 hours (fig. 6A) (U.S. Geological Survey, 2022a).
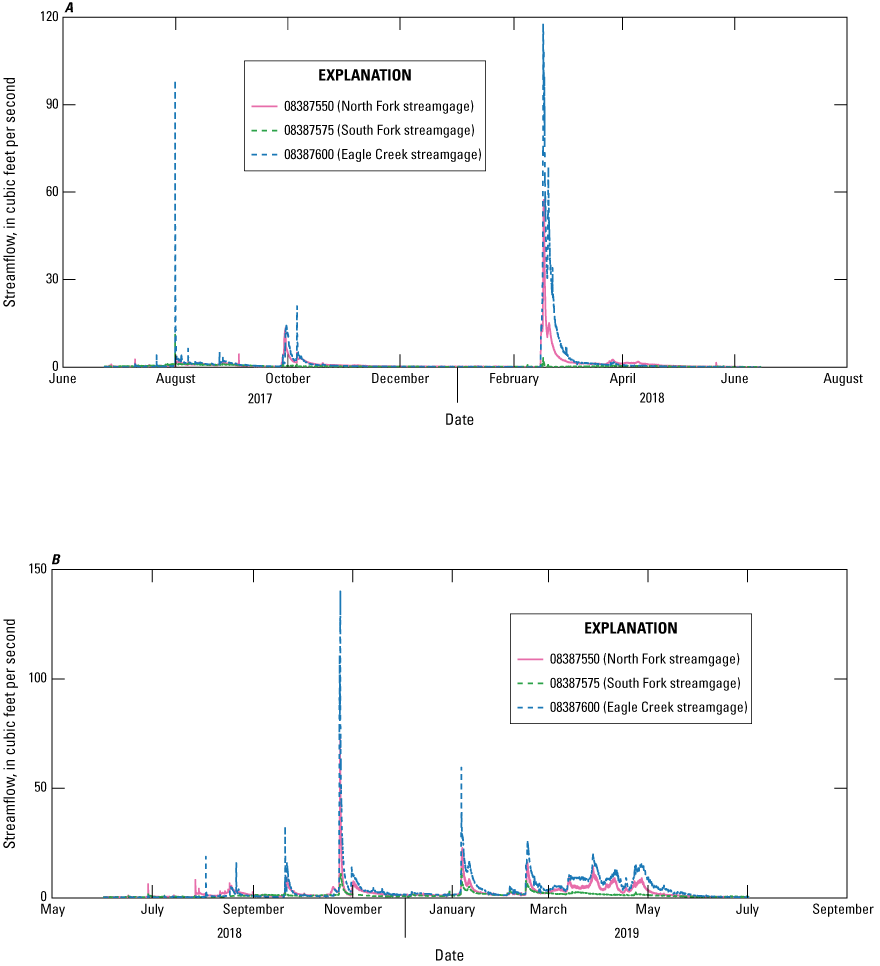
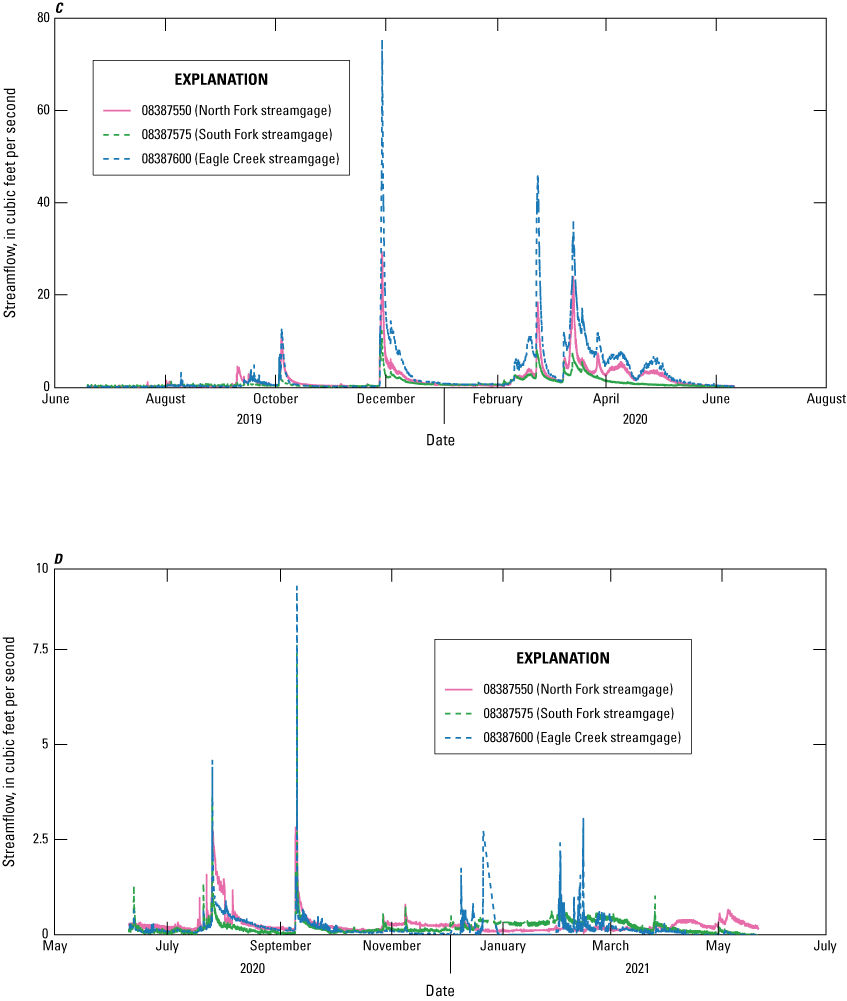
Instantaneous streamflow at the three U.S. Geological Survey (USGS) streamgages in the Eagle Creek Basin, south-central New Mexico, June 19, 2017, to May 20, 2021 (U.S. Geological Survey, 2022a, b, c). A, Period 1—June 19, 2017, to June 14, 2018; B, period 2—June 14, 2018, to June 20, 2019; C, period 3—June 20, 2019, to June 10, 2020; D, period 4—June 10, 2020, to May 20, 2021.
Only one distinct high-flow event occurred at the North Fork streamgage during period 1. The high-flow event had a peak instantaneous streamflow of 57 ft3/s, which occurred on February 17, 2018 (U.S. Geological Survey, 2022b) (fig. 6A). Similar to the peak at the Eagle Creek streamgage on February 16, 2018, the peak at the North Fork streamgage on February 17, 2018, was not reached until about 2 days after the high-flow event began (U.S. Geological Survey, 2022a, b). The February 17, 2018, high-flow event at the North Fork streamgage was greater than 50 ft3/s for approximately 6 hours, as compared to 2 days for the same event that occurred at the downstream Eagle Creek streamgage (U.S. Geological Survey, 2022a, b). There were no high-flow events at the South Fork streamgage during period 1, with the highest streamflow event of 11.2 ft3/s occurring on July 31, 2017 (U.S. Geological Survey, 2022c) (fig. 6A).
Period 2—June 14, 2018, to June 20, 2019
Daily mean streamflow at the Eagle Creek streamgage for period 2 ranged from 0 ft3/s, which occurred between June 14 and 16, 2018, to 84 ft3/s, which occurred on October 24, 2018, and had an overall average daily streamflow of 3.5 ft3/s (U.S. Geological Survey, 2022a). Daily mean streamflow at the North Fork streamgage for period 2, ranged from 0.1 ft3/s, which occurred on June 25, 2018, to 45 ft3/s, which occurred on October 24, 2018 (U.S. Geological Survey, 2022b). Daily mean streamflow at the South Fork streamgage for period 2 ranged from 0.03 ft3/s, which occurred on June 1 and 12, 2018, to 8.2 ft3/s, which occurred on October 24, 2018 (U.S. Geological Survey, 2022c). Daily mean streamflow at the Eagle Creek and North Fork streamgages was less than 2.0 ft3/s for 208 and 238 days during period 2, respectively (U.S. Geological Survey, 2022a, b). Daily mean streamflow was less than 1.0 ft3/s for 221 days at the South Fork streamgage (U.S. Geological Survey, 2022c).
Two distinct high-flow events for which peak instantaneous streamflow exceeded 50 ft3/s occurred at the Eagle Creek streamgage during period 2. The two high-flow events had peak instantaneous streamflows of 140 and 59 ft3/s, which occurred on October 24, 2018, and January 6, 2019, respectively (U.S. Geological Survey, 2022a) (fig. 6B). The high-flow event that produced the peak on October 24, 2018, was less flashy than the high-flow event that produced the peak on January 6, 2019. The peak on October 24, 2018, was preceded by a peak flow of 110 ft3/s that occurred 9 hours after the start of the event, at which time streamflow slightly receded, and was followed by a secondary peak of 140 ft3/s 18 hours after the start of the event. The event on January 6, 2019, reached peak streamflow 9 hours after the start of the event. Streamflow during this event remained greater than 50 ft3/s for 30 minutes, whereas streamflow following the October 24, 2018, event remained greater than 50.0 ft3/s for 11 hours (U.S. Geological Survey, 2022a).
There was only one distinct high-flow event at the North Fork streamgage during period 2. The high-flow event had a peak instantaneous streamflow of 73 ft3/s, which occurred on October 24, 2018 (U.S. Geological Survey, 2022b) (fig. 6B). Like the peak at the Eagle Creek streamgage, the peak at the North Fork streamgage on October 24, 2018, was not reached until about 14 hours after the high-flow event began (U.S. Geological Survey, 2022a, b). However, unlike the streamflow during the event that produced the peak at the Eagle Creek streamgage on October 24, 2018, which remained greater than 50 ft3/s for about 11 hours in total, the streamflow during the event that produced the peak at the North Fork streamgage on October 24, 2018, remained greater than 50 ft3/s for only about 5 hours in total (U.S. Geological Survey, 2022a, b). There were no high-flow events at the South Fork streamgage during period 2, with the highest streamflow of 13 ft3/s occurring on January 6, 2019 (U.S. Geological Survey, 2022c) (fig. 6B).
Period 3—June 20, 2019, to June 10, 2020
Daily mean streamflow at the Eagle Creek streamgage for the period starting on last day of the 2019 survey and ending on the last day of the 2020 survey (Graziano and Chavarria, 2022b) ranged from 0.04 ft3/s, which occurred on July 5, 2019, to 44 ft3/s, which occurred on November 29, 2019, and had an overall average daily streamflow of 2.9 ft3/s (U.S. Geological Survey, 2022a). At the North Fork streamgage, daily mean streamflow ranged from 0.1 ft3/s, which occurred on July 18, 2019, and June 20, 2019, to 20 ft3/s, which occurred on November 29, 2019 (the same day as the maximum daily mean streamflow at the Eagle Creek streamgage) (U.S. Geological Survey, 2022a, b). Daily mean streamflow at the South Fork streamgage ranged from 0.1 ft3/s, which occurred on October 31, 2019, to 8.6 ft3/s, which occurred on November 29, 2019 (U.S. Geological Survey, 2022c). Daily mean streamflow at the Eagle Creek and North Fork streamgages was less than 2.0 ft3/s for 251 and 258 days during period 3, respectively (U.S. Geological Survey, 2022a, b). Daily mean streamflow was less than 1.0 ft3/s for 275 at South Fork streamgage during the same period (U.S. Geological Survey, 2022c)
There was only one distinct high-flow event during which peak instantaneous streamflow exceeded 50 ft3/s at the Eagle Creek streamgage during the period from June 20, 2019, to June 10, 2020. The high-flow event had a peak instantaneous streamflow of 75 ft3/s, which occurred on November 29, 2019 (U.S. Geological Survey, 2022a). The high-flow event that produced the peak on November 29, 2019, was not a flashy event. Specifically, the peak on November 29, 2019, was reached about 35 hours after the start of the event (U.S. Geological Survey, 2022a). Also, streamflow during the event that produced the peak on November 29, 2019, remained greater than 50 ft3/s for about 11 hours (U.S. Geological Survey, 2022a) (fig. 6C).
There were no distinct high-flow events at the North Fork streamgage during period 3. The highest-flow event had a peak instantaneous streamflow of 29 ft3/s, which occurred on November 29, 2019, the same day as the Eagle Creek high-flow event (U.S. Geological Survey, 2022b) (fig. 6C). There were no high-flow events at the South Fork streamgage during the period, with the highest instantaneous streamflow of 12 ft3/s occurring on November 29, 2019 (U.S. Geological Survey, 2022c) (fig. 6C).
Period 4—June 10, 2020, to May 20, 2021
Daily mean streamflow at the Eagle Creek streamgage for the period starting on the last day of the 2020 survey and ending on the last day of the 2021 survey ranged from 0 ft3/s, which occurred between December 30, 2020, and January 4, 2021, between January 20 and January 28, 2021, and between April 11 and May 20, 2021, to 2.4 ft3/s, which occurred on December 21, 2020, and had an overall average daily streamflow of 0.2 ft3/s (U.S. Geological Survey, 2022a). For 19 days (January 5–19 and 22–26, 2021), Eagle Creek streamgage streamflow was not measurable because of ice interference. At the North Fork streamgage, daily mean streamflow ranged from 0.1 ft3/s, which occurred on December 25, 2020, and January 3 and 4, 2021, to 2.3 ft3/s, which occurred on July 26, 2020 (U.S. Geological Survey, 2022b). Daily mean streamflow at the South Fork streamgage ranged from 0.0 ft3/s, which occurred during May 14–19, 2021, to 1.7 ft3/s, which occurred on September 10, 2020 (U.S. Geological Survey, 2022c). Daily mean streamflow at Eagle Creek and North Fork streamgages was less than 2.0 ft3/s for 324 and 344 days during period 4, respectively (U.S. Geological Survey, 2022a, b). Daily mean streamflow was less than 1.0 ft3/s for 343 days at the South Fork streamgage during the same period (U.S. Geological Survey, 2022c)
There were no high-flow events during which peak instantaneous streamflow exceeded 50 ft3/s at the Eagle Creek streamgage during period 4. The highest-flow event had a peak instantaneous streamflow of 9.2 ft3/s, which occurred on September 10, 2020 (U.S. Geological Survey, 2022a). The high-flow event that produced the peak on September 10, 2020, was an extremely flashy high-flow event. Specifically, the peak on September 10, 2020, was reached about 3 hours after the start of the hydrograph’s rising limb (U.S. Geological Survey, 2022a). Also, streamflow during the event that produced the peak on September 10, 2020, returned to base flow levels approximately 14 hours after peak streamflow (U.S. Geological Survey, 2022a) (fig. 6D).
There was no distinct high-flow event at the North Fork streamgage during period 4. The highest-flow event had a peak instantaneous streamflow of 3.7 ft3/s, which occurred on September 10, 2020 (U.S. Geological Survey, 2022b) (fig. 6D). The September 10, 2020, North Fork streamgage high-flow event was extremely flashy and peaked 45 minutes earlier than the peak at the Eagle Creek streamgage (U.S. Geological Survey, 2022b). There were no high-flow events at the South Fork streamgage during the period, with the highest instantaneous streamflow of 7.6 ft3/s occurring on September 10, 2020 (U.S. Geological Survey, 2022c) (fig. 6D).
Geomorphic Survey of North Fork Eagle Creek From 2017 to 2021
The results of the geomorphic surveys, presented in the following sections, have been derived from field notes, field photographs, and the associated data releases (Graziano, 2018, 2020a; Graziano and Chavarria, 2022a; Nichols and Chavarria 2023). The data releases contain the full set of survey points and include their unique identifiers, locations (as horizontal coordinates), elevations (for cross-section points and the deepest points of selected pools), “distance from left bank” values (for cross-section points), classifications (for woody debris accumulations), residual depths (for pools), descriptions, and location sources. Also included are indications of whether water was present or absent at each point at the time it was surveyed. The results of the 2017–19 geomorphic surveys are published in Graziano (2019, 2020b) and in Graziano and Chavarria (2022b), and their results are discussed and evaluated later in this report. Because of the horizontal and vertical datum differences discussed in the “Methods” section, the 2017–18 survey results were modified for this report where the channel-profile and cross-section results of those two previous surveys are compared.
Channel Profile
A channel profile of the study reach, moving upstream from cross section 14 to 1, was developed on the basis of the cross-section thalweg points surveyed in 2017–21 with the 2017, 2018, 2020, and 2021 thalweg points being corrected to NAVD 88 (fig. 7; table 3). Over the five surveys, there was very little change in stream gradient, with each survey period having an approximate 268.7 ±0.2 ft of fall over the 9,185-ft (1.74-mi)-long study reach. The average gradient (that is, the mean of the gradients between cross sections) for the entire study reach between the five surveys ranged from 163 to 166 ft/mi, whereas the total gradient (that is, the gradient between cross sections 1 and 14) ranged from 154 to 155 ft/mi (Graziano, 2019, 2020b; Graziano and Chavarria, 2022b).
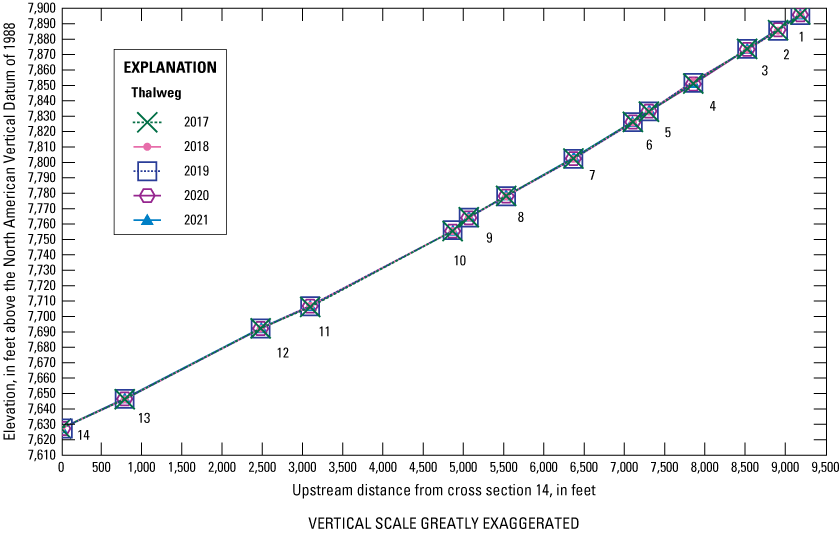
Channel profile from cross section 14 to cross section 1 of the study reach on North Fork Eagle Creek, Eagle Creek Basin, south-central New Mexico, 2017–21.
Table 3.
Channel profile data from cross sections along the study reach on North Fork Eagle Creek, Eagle Creek Basin, south-central New Mexico, 2017–21.[Data from Graziano (2018, 2020a), Graziano and Chavarria (2022a), and Nichols and Chavarria (2023). Distances are based on the study reach trace in figure 4 and are rounded to the nearest 5 feet; 2017, 2018, 2020, and 2021 elevation data have been corrected to the NAVD 88 on the basis of the differences between the (1) 2017, 2018, 2020, and 2021 cross-section reference mark elevations and the (2) 2019 cross-section reference mark elevations. Stream gradients were calculated on a cross-section to cross-section basis and were assigned to the upstream cross section (for example, the stream gradient assigned to cross section 1 is for the river reach between cross sections 1 and 2). ft, foot; NAVD 88, North American Vertical Datum of 1988; ft/mi, foot per mile, –, not applicable]
Calculations of stream gradient for each reach segment from 2017 to 2021 demonstrate that the reach segment with the smallest gradient was between cross sections 11 and 12, with annual gradients of 119, 127, 124, 125, and 124 ft/mi for 2017–21. The reach segment with the greatest gradient was calculated between cross sections 9 and 10, with annual gradients of 235, 230, 214, 225, and 232 ft/mi for 2017–21 (table 3).
The four cross sections with lower gradients (XS10, XS11, XS13, XS14) measured during the surveys tended to remain relatively stable over the years. Whereas the three cross sections with steeper gradients (XS1, XS5, XS9) had larger changes to their survey-to-survey gradients, with a maximum change in gradient of 16 ft/mi between the 2017 and 2018 surveys at cross section 5, a maximum change of −16 ft/mi between the 2018 and 2019 surveys at cross section 9, a maximum change of 11 ft/mi between the 2019 and 2020 surveys at cross section 9, and a maximum change of 7 ft/mi between the 2020 and 2021 surveys at cross section 9. However, these differences between the stream gradient results from 2017 and 2021 may be more attributable to the coarseness of the channel bed material at the thalweg, shifts in thalweg locations, interpretation of thalweg location, and the limited accuracies of the survey readings than to actual physical changes to the stream gradient. During the 5-year study period, there was little to no overall change in stream gradients, with the average year-to-year change in section gradients being within ±3 ft/mi across the entire study reach.
Cross-Section Plots and Characteristics From 2017 to 2021
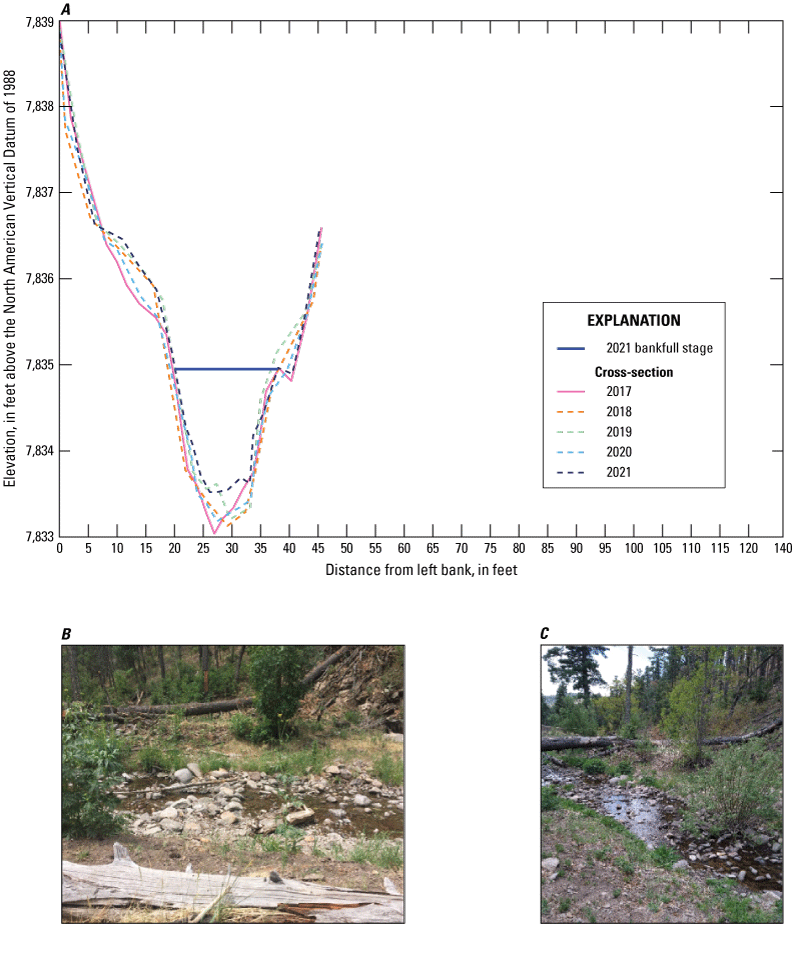
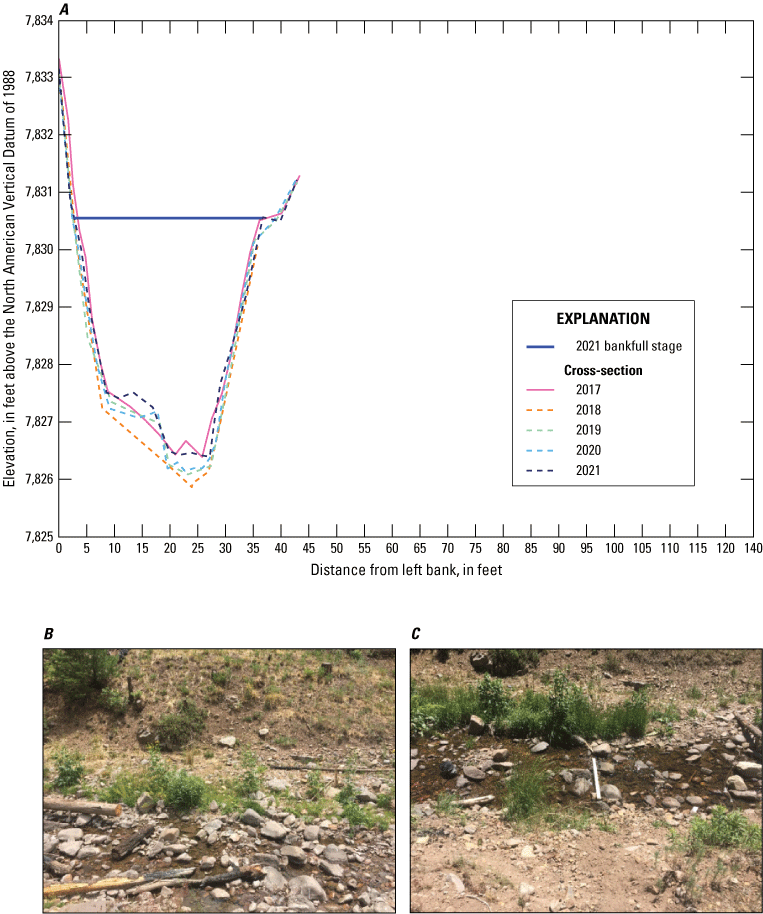
Cross-section plots for the surveys (figs. 8–21)—created from the cross-section data published in the Graziano (2018, 2020a) and Graziano and Chavarria (2022a) data releases—and cross-section characteristics across all surveys (table 4) indicated that channel geometries varied throughout the study reach. For example, cross sections 8, 10, 11, and 14 had substantial variability in their cross-section channel area over the study period, with areas ranging from 34 to 116 square feet (ft2), 111 to 162 ft2, 111 to 225 ft2, and 180 to 347 ft2, respectively (table 4). In contrast, cross sections 2, 5, 6, and 12 were relatively stable over the study period, ranging from 13 to 15 ft2, 14 to 20 ft2, and 13 to 15 ft2, 86 to 94 ft2, and 16 to 24 ft2, respectively (table 4).
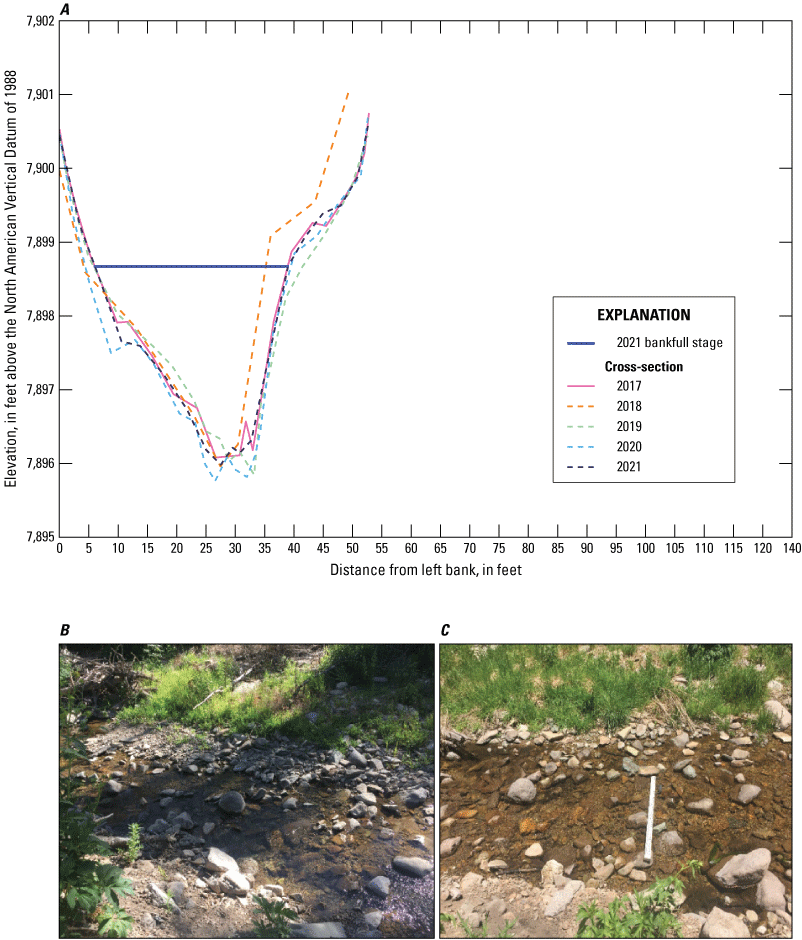
A, North Fork Eagle Creek, channel cross section 1, B, 2018 view looking at left bank from right bank, and C, 2020 view looking at left bank from right bank.
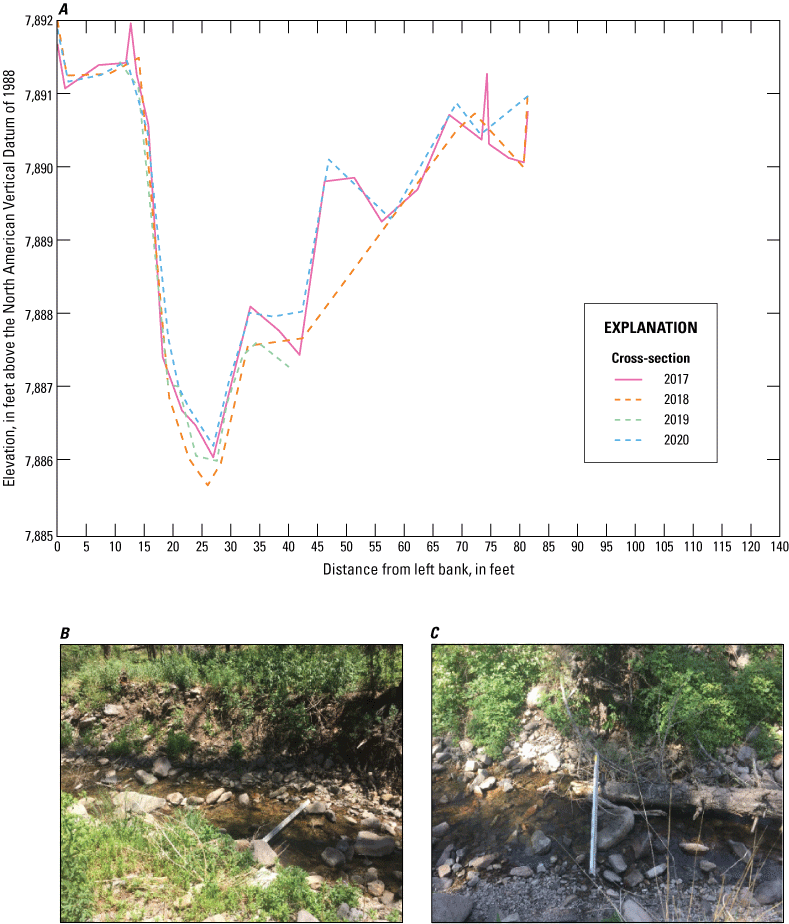
A, North Fork Eagle Creek, channel cross section 2, B, 2018 view looking at left bank from right bank, and C, 2020 view looking at left bank from right bank.
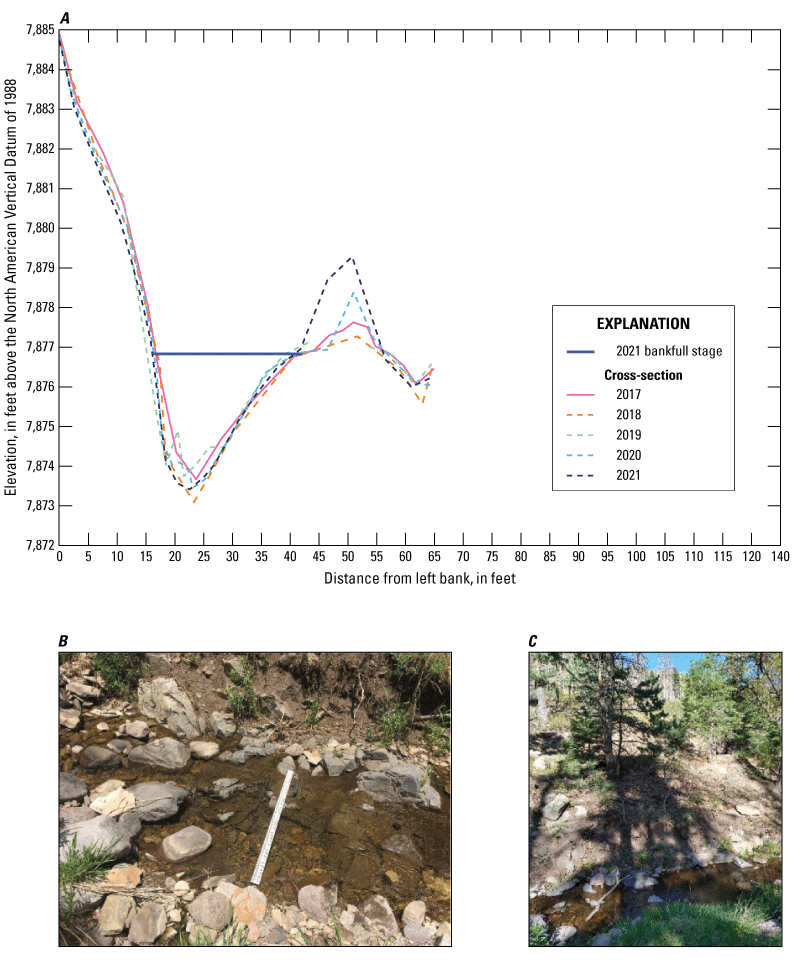
A, North Fork Eagle Creek, channel cross section 3, B, 2018 view looking at left bank from right bank, and C, 2021 view looking at left bank from right bank.
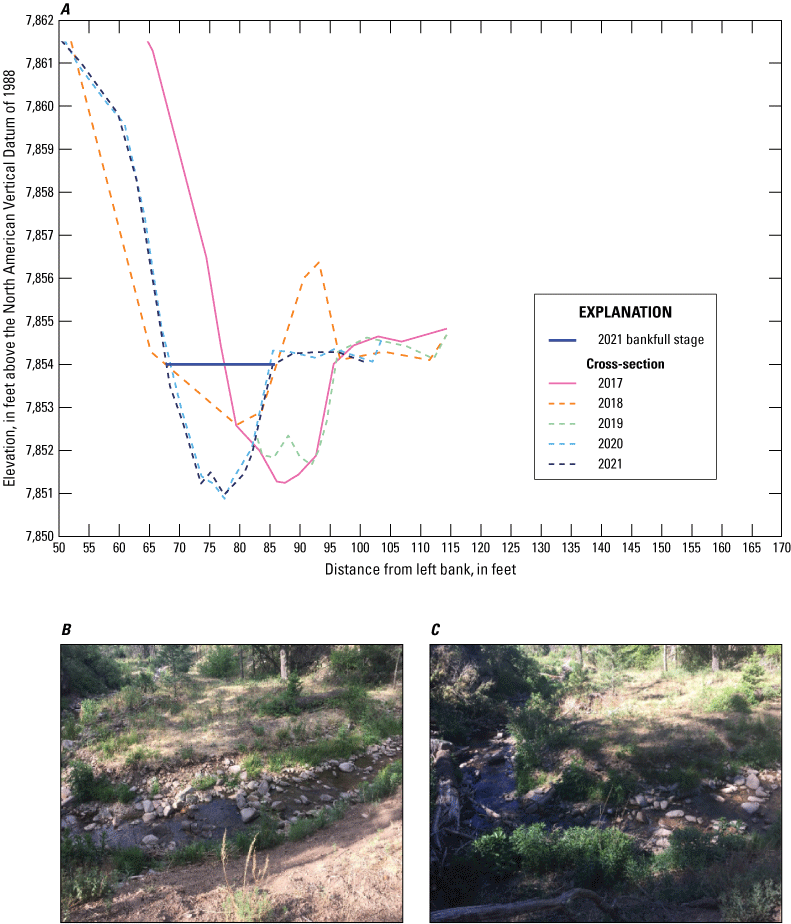
A, North Fork Eagle Creek, channel cross section 4, B, 2018 view looking at right bank from left bank, and C, 2020 view looking at right bank from left bank.
A, North Fork Eagle Creek, channel cross section 5, B, 2018 view looking at right bank from left bank, and C, 2021 view looking at right bank from left bank.
A, North Fork Eagle Creek, channel cross section 6, B, 2018 view looking at left bank from right bank, and C, 2020 view looking at left bank from right bank.
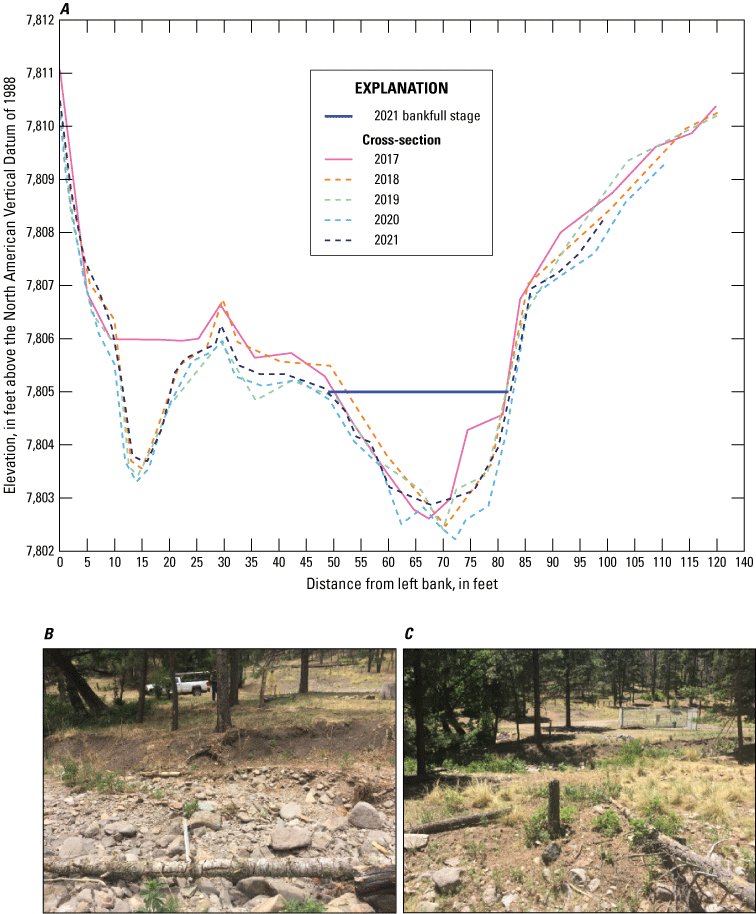
A, North Fork Eagle Creek, channel cross section 7, B, 2018 view looking at right bank from thalweg, and C, 2020 view looking at right bank from left bank.
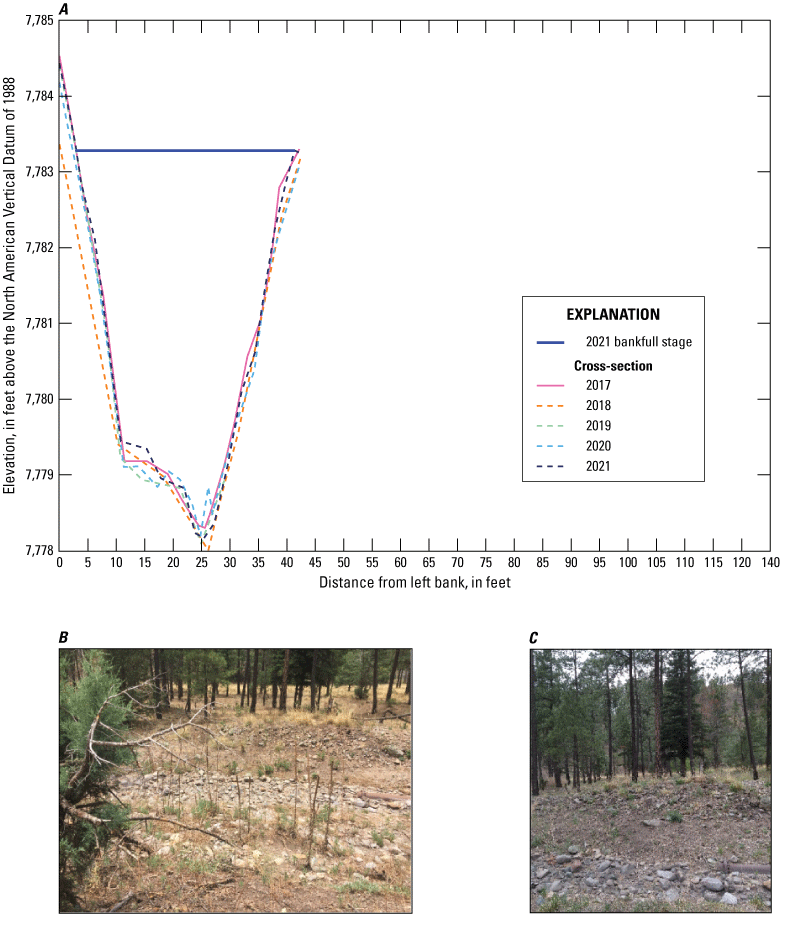
A, North Fork Eagle Creek, channel cross section 8, B, 2018 view looking at right bank from left bank, and C, 2021 view looking at right bank from left bank.
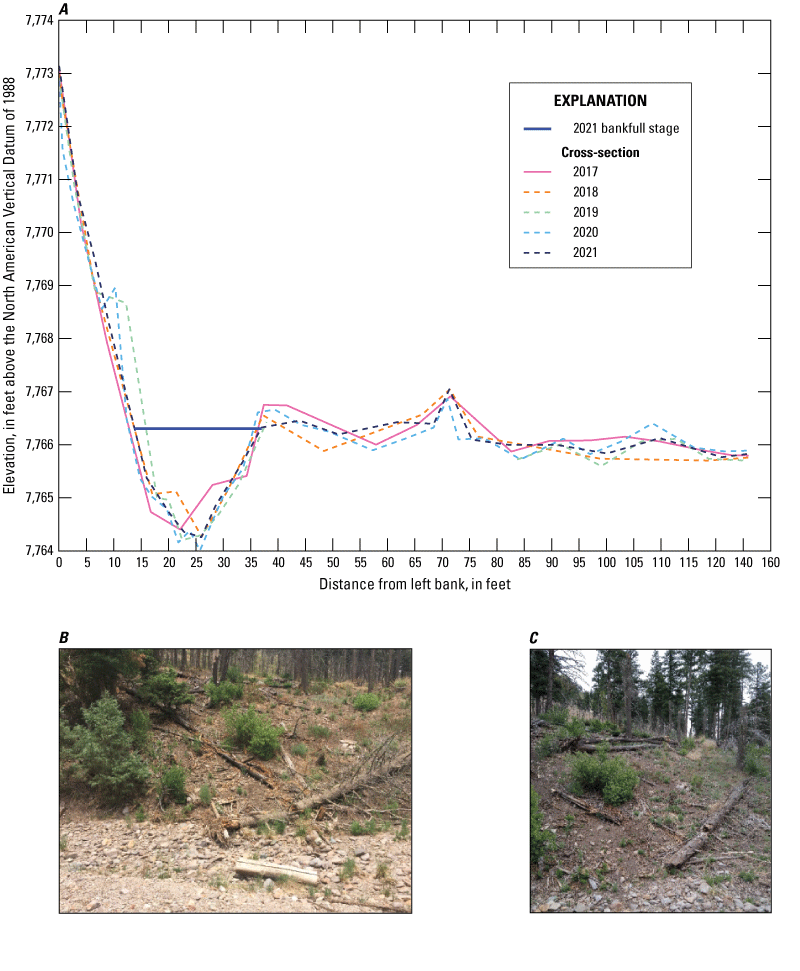
A, North Fork Eagle Creek, channel cross section 9, B, 2018 view looking at left bank from right bank, and C, 2021 view looking at left bank from right bank.
A, North Fork Eagle Creek, channel cross section 10, B, 2018 view looking at right bank from left bank, and C, 2021 view looking at right bank from thalweg.
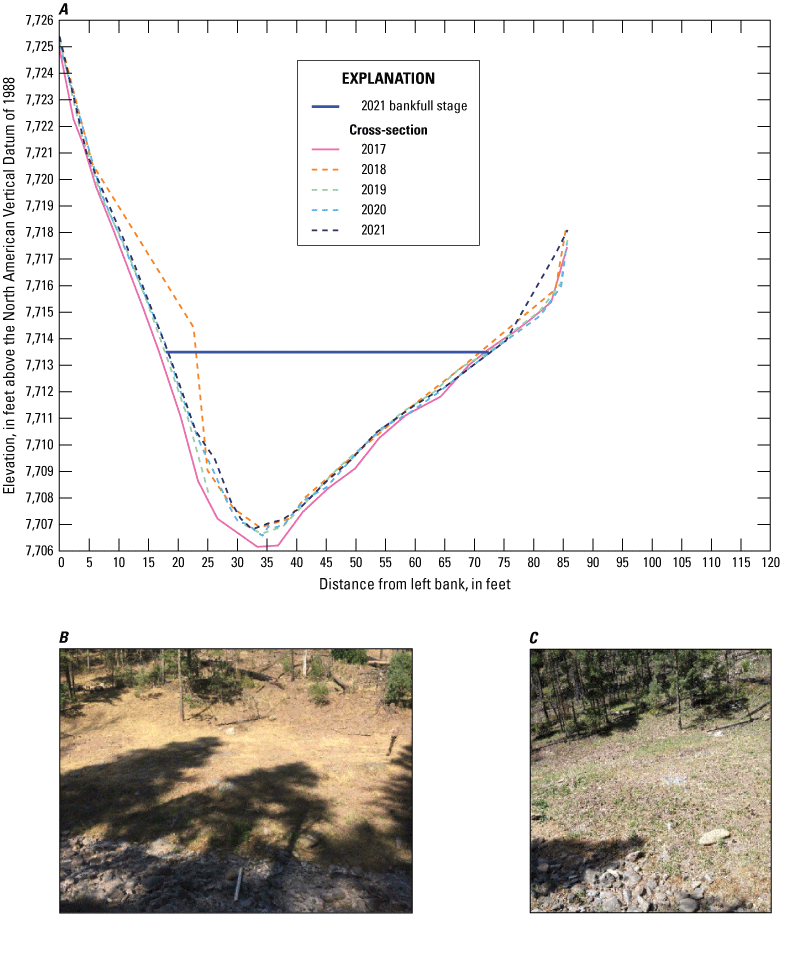
A, North Fork Eagle Creek, channel cross section 11, B, 2018 view looking at right bank from left bank, and C, 2021 view looking at right bank from left bank.
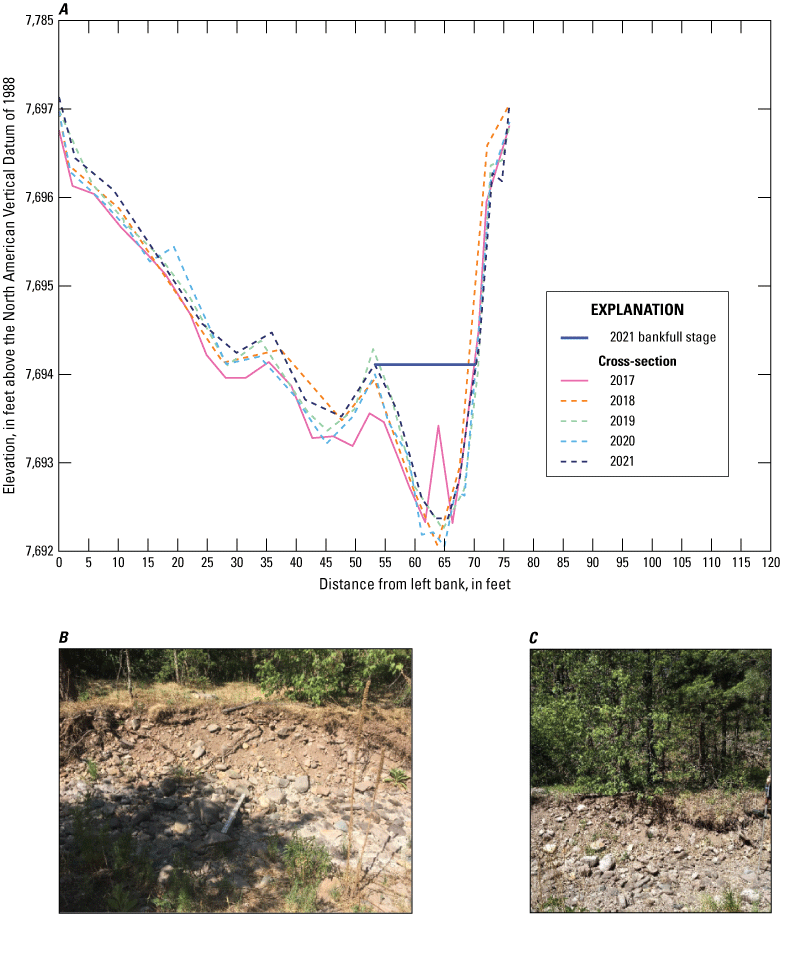
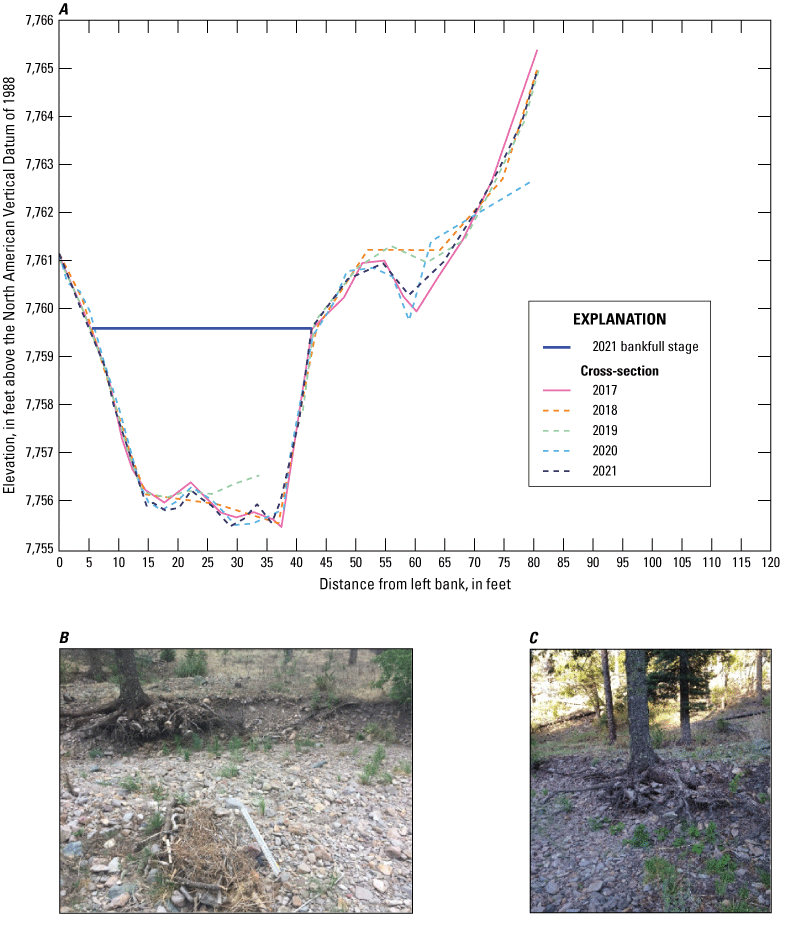
A, North Fork Eagle Creek, channel cross section 12, B, 2018 view looking at right bank from left bank, and C, 2021 view looking at right bank from left bank.
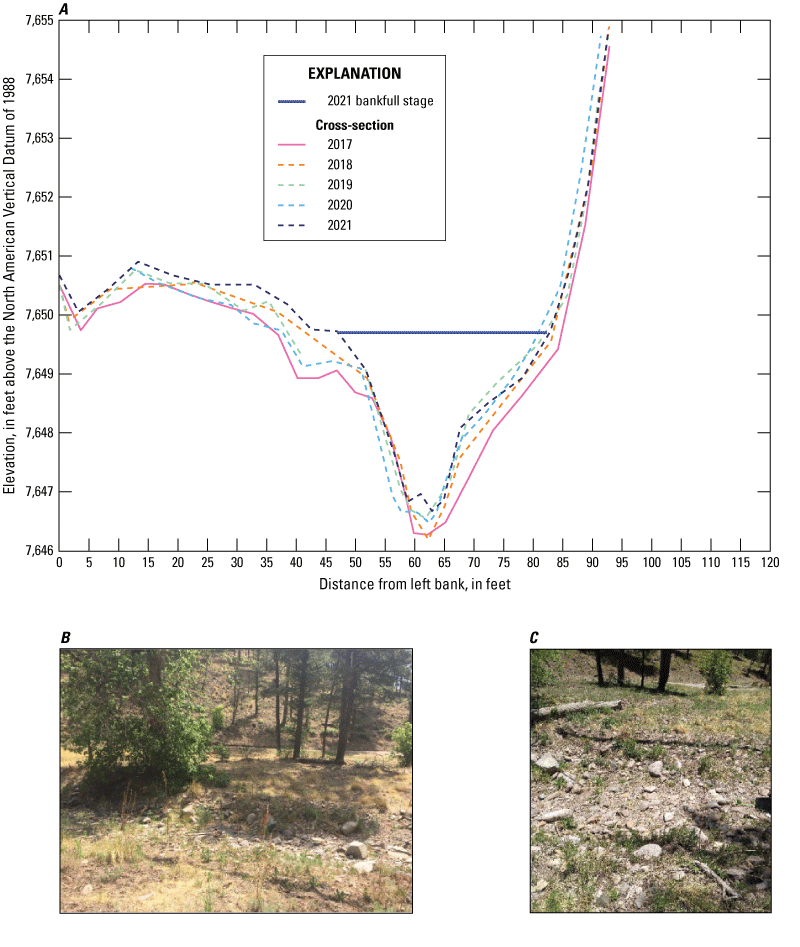
A, North Fork Eagle Creek, channel cross section 13, B, 2018 view looking at left bank from right bank, and C, 2021 view looking at left bank from thalweg.
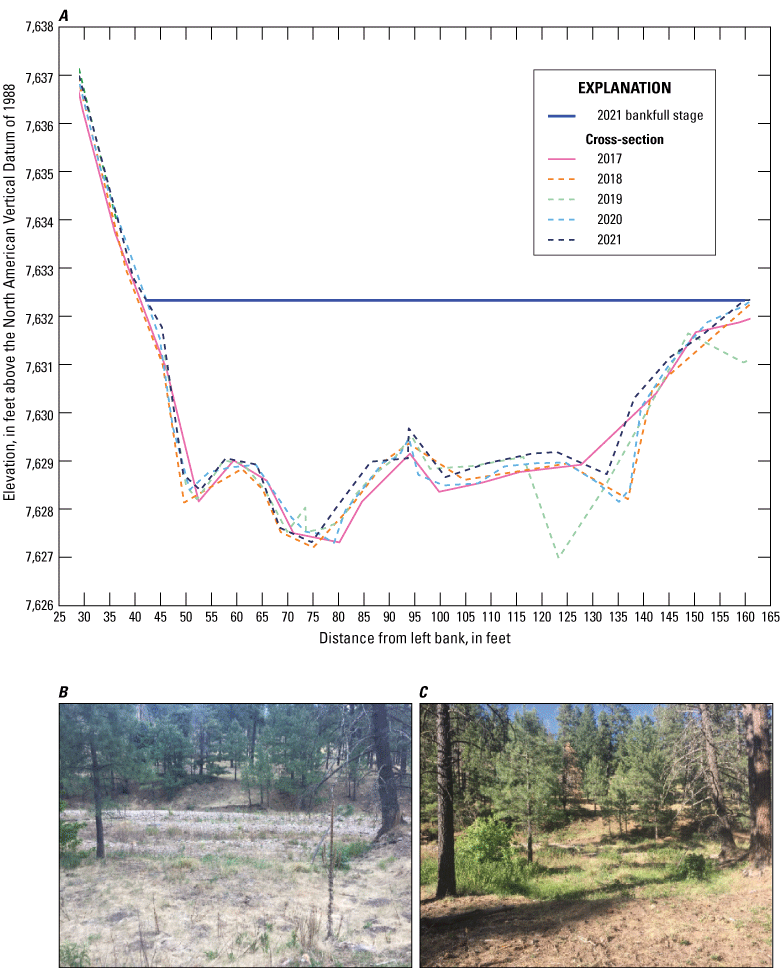
A, North Fork Eagle Creek, channel cross section 14, B, 2018 view looking at left bank from right bank, and C, 2020 view looking at left bank from right bank.
Table 4.
Range of cross-section characteristics for 2017–21 surveys of the study reach on North Fork Eagle Creek, Eagle Creek Basin, south-central New Mexico.[Data from Graziano (2018, 2020a), Graziano and Chavarria (2022a), and Nichols and Chavarria (2023). ft, foot; ft2, square foot]
| Cross-section number (fig. 4) | Bankfull stage (ft) |
Maximum depth at bankfull stage (ft) |
Cross-section main channel width (ft) |
Cross-section main channel area (ft2) |
Left bank height (ft) |
Left bank slope (dimensionless) |
Right bank height (ft) |
Right bank slope (dimensionless) |
|---|---|---|---|---|---|---|---|---|
| 1 | 7,896–7,899 | 2.7–3.1 | 33–36 | 50–64 | 1.9–3.1 | 0.1–0.1 | 2.4–3.0 | 0.3–0.5 |
| 2 | 7,887–7,888 | 1.4–3.2 | 11–28 | 13–15 | 1.7–5.3 | 0.3–1.3 | 1.4–1.8 | 0.3–0.5 |
| 3 | 7,874–7,877 | 2.4–3.6 | 17–26 | 21–33 | 1.7–2.8 | 0.8–2.2 | 1.9–3.5 | 0.2–0.3 |
| 4 | 7,851–7,854 | 1.5–3.5 | 16–19 | 16–38 | 1.4–8.2 | 0.1–1.4 | 1.2–3.0 | 0.4–0.7 |
| 5 | 7,832–7,835 | 1.4–1.7 | 14–19 | 14–20 | 0.8–2.1 | 0.3–0.5 | 0.9–1.5 | 0.2–0.7 |
| 6 | 7,828–7,830 | 4.0–4.2 | 31–34 | 86–94 | 2.8–4.1 | 0.2–0.6 | 3.9–4.2 | 0.3–0.5 |
| 7 | 7,803–7,806 | 2.2–3.0 | 31–37 | 41–58 | 1.9–3.0 | 0.1–0.2 | 1.4–3.8 | 0.2–0.5 |
| 8 | 7,778–7,783 | 2.3–5.1 | 24–39 | 34–116 | 1.4–3.8 | 0.4–0.6 | 2.3–4.9 | 0.3–0.3 |
| 9 | 7,763–7,767 | 1.4–2.6 | 21–24 | 16–38 | 1.1–4.2 | 0.4–0.7 | 0.4–2.6 | 0.1–0.2 |
| 10 | 7,757–7,761 | 3.7–5.3 | 37–47 | 111–162 | 3.4–4.4 | 0.4–0.4 | 4.1–5.0 | 0.5–0.8 |
| 11 | 7,711–7,714 | 5.0–7.6 | 38–57 | 111–225 | 3.9–6.8 | 0.5–1.0 | 4.9–7.9 | 0.2–0.2 |
| 12 | 7,694–7,694 | 1.6–2.0 | 15–32 | 16–24 | 0.7–1.9 | 0.2–0.7 | 1.0–3.5 | 0.4–0.8 |
| 13 | 7,648–7,650 | 2.3–3.0 | 24–36 | 31–51 | 2.3–2.9 | 0.2–0.4 | 1.4–2.2 | 0.1–0.2 |
| 14 | 7,631–7,632 | 3.3–5.0 | 94–120 | 180–347 | 2.3–3.6 | 0.4–0.7 | 2.3–3.7 | 0.1–0.5 |
The differences in the cross-section characteristics values between the survey years can be attributed to poor quality survey points in cross sections 2, 4, 8, 10, 11, and 14 (Graziano and Chavarria, 2022b). Cross section 2 had to be removed from the 2021 data because of poor data quality, which led to a large number of unusable elevation values. As noted in Graziano (2020a), many of the cross-section characteristics from the 2017 survey are not directly comparable to the post-2017 cross-section characteristics, because for cross sections 2, 3, 8, 9, 11, 12, and 14, the bankfull stages were largely redefined in later surveys (primarily on the basis of better-quality bank observations rather than physical changes to the cross sections). Therefore, instead of solely relying on comparing cross-section characteristics derived from bankfull stage to evaluate changes to the cross sections from 2017 to 2021, the cross-section plots were directly compared (figs. 8–21).
Comparisons of the cross-section plots, as well as references to field and aerial photographs, from 2017 through 2021 indicate that cross sections 4, 7, 11, 12, and 13 experienced the greatest overall topographic change caused by fluvial processes during the four periods of study (figs. 11, 14, 18, 19, 20). Specifically, cross section 4 experienced a decrease in its left bank elevation of a much as 7 ft during period 1, with a shift in thalweg position of approximately 8 ft to the left (fig. 11). However, during the 2018 survey, three of the left bank cross-section points had poor accuracy ranging from ±0.8 to ±3.3 ft; thus, the magnitude of change to cross section 4 during period 1 might not be as large as the results indicate (Graziano, 2020b). Cross section 7 experienced a substantial decrease in channel elevation 7–28 ft from the left bank during period 1 that resulted in an approximate elevation decrease of 2.5–3 ft (Graziano, 2020b) (fig. 14). Cross section 11 experienced a channel elevation increase of 0.6–0.9 ft during period 1, excluding the single high elevation point measured in 2018, with the largest change occurring in the thalweg of the cross section (fig. 18). Lastly, cross sections 12 and 13 both experienced a gradual increase in channel elevations from 2017 to 2021 that ranged from 0.5 to 1.0 ft, occurring predominately on the left bank of both cross sections (fig. 19, 20).
Woody Debris
The 2017 survey identified 58 distinct accumulations of woody debris identified in the study reach, with 17 identified as debris deposits, 25 identified as potential debris jams, and 16 identified as active debris jams (Graziano, 2019). During the 2018 survey, 112 distinct accumulations of woody debris were identified in the study reach, with 39 identified as debris deposits, 16 identified as potential debris jams, and 57 identified as active debris jams (Graziano, 2020b). During the 2019 survey, 164 distinct accumulations of woody debris were identified in the study reach, with 49 identified as debris deposits, 19 identified as potential debris jams, 96 identified as active debris jams (Graziano and Chavarria, 2022b). During the 2020 and 2021 surveys, 173 and 188 distinct accumulations of woody debris were identified in the study reach, respectively (fig. 22A, B; table 5). During the 2020 and 2021 surveys, 32 and 76 woody debris accumulations were identified as debris deposits, 23 and 24 were identified as potential debris jams, and 118 and 88 were identified as active debris jams, respectively (table 5).
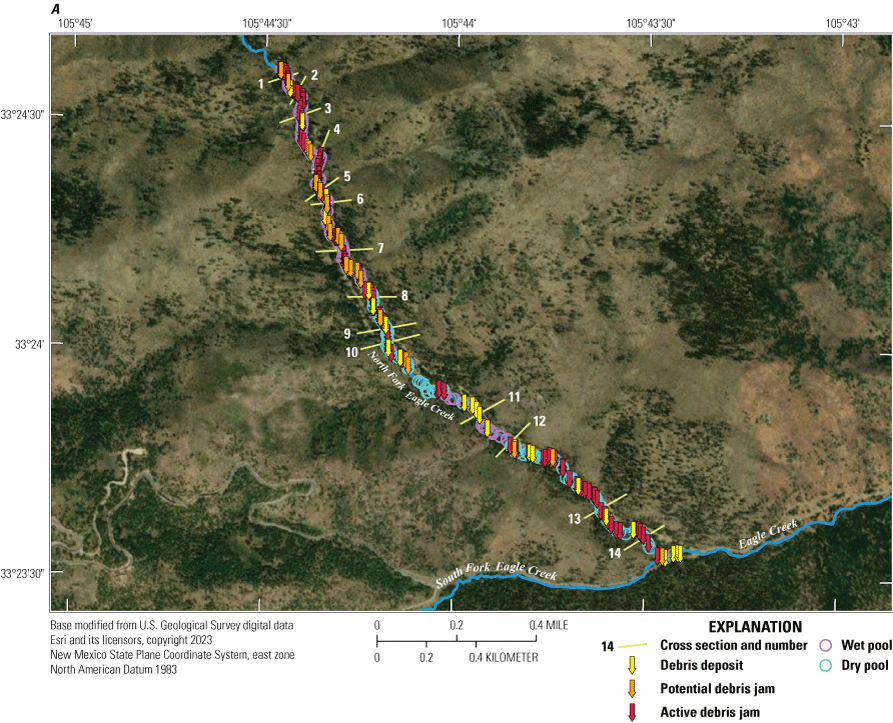
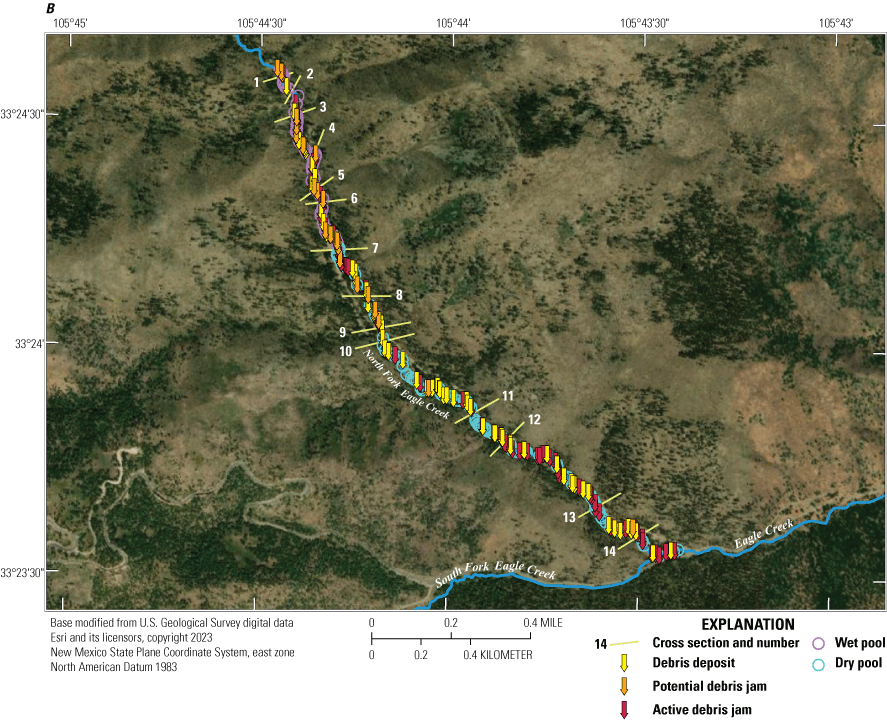
Study reach on North Fork Eagle Creek with locations of woody debris accumulations and pools relative to the locations of cross sections in the Eagle Creek Basin, south-central New Mexico, during the 2020 and 2021 surveys. Cross-section trace lengths are exaggerated for presentation purposes. A, 2020 study reach. B, 2021 study reach.
Table 5.
Locations, classifications, and average rates of woody debris accumulations identified in the study reach on North Fork Eagle Creek, Eagle Creek Basin, south-central New Mexico.[Data from Graziano (2018, 2020a), Graziano and Chavarria (2022a), and Nichols and Chavarria (2023).Reach lengths are based on the study reach trace in figure 4 and are rounded to the nearest 5 feet. Average rates were calculated for each reach as total number of woody debris accumulations per 1,000 feet. ft, foot; XS, cross section; US, upstream subreach; DS, downstream subreach; RC, first road crossing; EC, Eagle Creek streamgage]
Two subreaches were categorized to quantify the spatial distribution of woody debris accumulations and pools, with an upstream subreach (0.85 mi in length), defined as the reach segment between the first road crossing (located about 165 ft upstream from cross section 1) and cross section 10, and a downstream subreach (1.04 mi in length), defined as the reach segment between cross section 10 and the Eagle Creek streamgage. The results indicate that during the five surveys, 64, 60, 63, 65, and 51 percent of the total woody debris accumulations were identified within the upstream subreach. In contrast, 36, 40, 37, 35 and 49 percent of the total woody debris accumulations were identified in the downstream subreach (table 5).
Of the total woody debris accumulations identified in the 2019–21 surveys, 67 (41 percent), 48 (28 percent), and 52 (28 percent) were certain to have also been present during the previous survey (Graziano and Chavarria, 2022b). However, some of these preexisting woody debris accumulations had undergone observable changes in size, composition, and structure, although all had retained some woody debris by which they could be recognized, such as their key members or nearby geomorphic benchmarks. During the 2021 survey, for example, eight woody debris accumulations identified from the 2020 survey had undergone enough physical change and decomposition to warrant their reclassification from active jams to debris deposits.
Example photographs of different woody debris accumulations identified during the 2020 and 2021 surveys are presented in figure 23. Figure 23A shows an example of an active debris jam, identified during the 2020 survey, that consists of a large log and multiple smaller woody debris accumulations blocking the stream channel, allowing for an upstream pool to form. Figure 23B shows an example of a potential debris jam identified in 2020 consisting of a large log spanning the channel without causing any jamming; this feature may deteriorate from biodegradation into an active jam blocking streamflow in the future. Figure 23C shows an example of an active debris jam identified in 2021 that consists of a medium diameter log located in the dry subreach of the study area. Figure 23D shows an example of a debris deposit identified in 2021, consisting of medium sized logs and small pieces of woody debris resting on the side of the stream channel that were not actively blocking any streamflow under normal flow conditions.
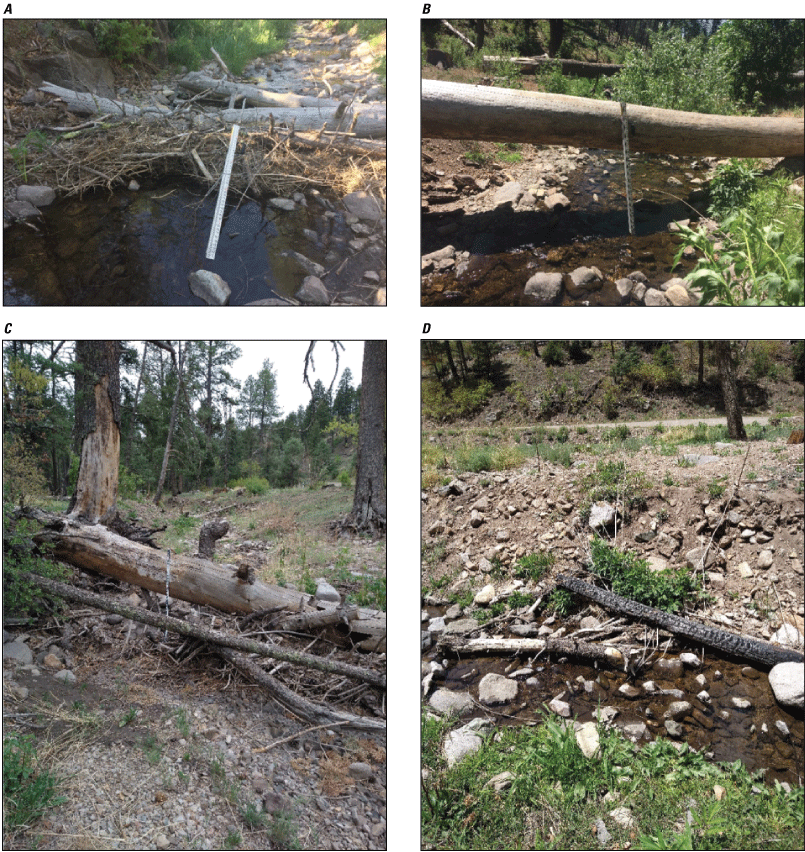
Examples of woody debris accumulations identified in the study reach on North Fork Eagle Creek, Eagle Creek Basin, south-central New Mexico, between the 2020 and 2021 surveys. A, An active debris jam identified in 2020; B, a potential debris jam identified in 2020; C, an active debris jam identified in 2021; and D, a debris deposit identified in 2021. All photographs are oriented downstream. For scale, a survey rod 4.46 feet in length (with graduation at feet, tenths of feet, and hundredths of feet) was included in each photograph.
Pools
As mentioned in Graziano (2020b), the methods for identifying pools were adjusted after the 2017 survey, and pool identification during 2019–21 followed the methods used in the 2018 survey. Thus, a direct comparison between pools surveyed during 2018–21 can be made, but only general comparisons can be made between 2017 pool data and subsequent survey data.
During the 2018 survey, 71 pools were identified in the study reach, with 42 pools identified in the dry section of the study reach and 29 identified in the wet section (Graziano, 2020b). During the 2019 survey, 230 pools were identified in the study reach, with 101 pools identified in the dry section of the study reach and 129 identified in the wet section (Graziano and Chavarria, 2022b). During the 2020 survey, 230 pools were identified in the study reach, with 112 pools identified in the dry section of the study reach and 118 identified in the wet section (fig. 22A; table 6). During the 2021 survey, 210 pools were identified in the study reach, with 133 pools identified in the dry section of the study reach and 77 identified in the wet section (fig. 22B; table 6).
Table 6.
Locations, dry or wet indications, and average number of pools identified per 1,000 feet in the study reach on North Fork Eagle Creek, Eagle Creek Basin, south-central New Mexico.[Data from Graziano (2018, 2020a), Graziano and Chavarria (2022a), and Nichols and Chavarria (2023). Reach lengths are based on the study reach trace in figure 4 and are rounded to the nearest 5 feet. Average number of pools were calculated for each reach as total number of pools per 1,000 feet. ft, foot; <, less than; >, greater than; XS, cross section; US, upstream subreach; DS, downstream subreach; RC, first road crossing; EC, Eagle Creek streamgage; --, indicates data that were not collected during the 2017 survey]
During the 2017–21 surveys, the upstream subreach pool count totaled 8, 39, 116, 107, and 97, respectively, whereas the downstream subreach pool count totaled 6, 32, 114, 123, and 113, respectively. The percentages of pools located in the upstream subreach during the five surveys were 57, 54, 50, 47, and 46 percent, respectively. From 2018 to 2021, the average number of pools per 1,000 ft over the entire study reach ranged from 7 observed during the 2018 survey to 23 observed during the 2019 and 2020 surveys (table 6).
Changes in pool structure were determined by comparing the locations and photographs of pools among the 2018–21 surveys. The 2019 survey results indicated that 54 pools were present in both 2018 and 2019, and at least 17 pools present in 2018 were not in 2019 (Graziano and Chavarria, 2022b). The 2020 survey results indicated that 53 pools were present in both 2019 and 2020 and at least 177 pools present in 2019 were not in 2020. Lastly, the 2021 survey results indicated that 31 pools were present in both 2020 and 2021 and at least 170 pools present in 2020 were not in 2021. Pools identified during a given survey that were not identified during the following survey likely filled in or physically changed in some other way that prevented them from being identified as pools.
For the 2018–21 surveys, the maximum number of pools identified between neighboring cross sections in the upstream subreach was 12, 32, 24, and 25, respectively, all between cross sections 3 and 4 (Graziano, 2020b; Graziano and Chavarria, 2022b). In the downstream subreach, the maximum number of pools identified between neighboring cross sections in 2018 was 14, between cross sections 10 and 11 (Graziano, 2020b). During the 2019 and 2020 surveys, the maximum number of pools identified between neighboring cross sections in the downstream subreach was 44 and 49, respectively, between cross sections 12 and 13 (Graziano and Chavarria, 2022b). Lastly, during the 2021 survey, the maximum number of pools identified between neighboring cross sections in the downstream subreach was 40, between cross sections 10 and 11.
Example photographs presented in figure 24 depict various characteristics of pools identified in the study reach during the 2020 and 2021 surveys. Figure 24A depicts a wet pool identified during the 2020 survey that was formed by an active jam, consisting of large woody debris, that expanded the full width of the stream channel. Figure 24B depicts a dry pool identified during the 2020 survey that formed by small boulders on the right bank and covers approximately half of the stream channel. Figure 24C depicts a wet pool identified during the 2021 survey that was formed by an active jam consisting of large boulders. Figure 24D depicts a dry pool identified during the 2021 survey that was formed by an active jam, consisting of medium sized rocks and woody debris, that expanded the full width of the stream channel.
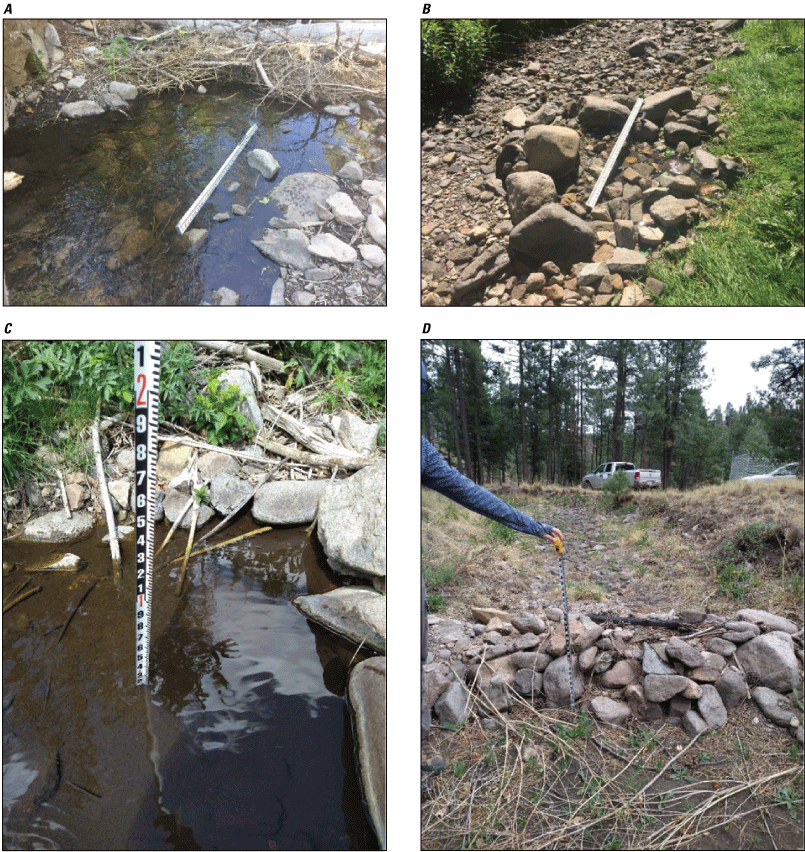
Examples of pools identified in the study reach on North Fork Eagle Creek, Eagle Creek Basin, south-central New Mexico, 2020 and 2021. A, A wet pool identified in 2020; B, a dry pool identified in 2020; C, a wet pool identified in 2021; and D, a dry pool identified in 2021. All photographs were taken facing downstream. For scale, a survey rod that is 4.46 feet in length (with graduation at a foot, tenths of a foot, and hundredths of a foot) or a tape measure (with graduation at a foot, tenths of a foot, and two hundredths of a foot) was included in each photograph. Figure parts C and D depict the methodology used to measure pool residual depths during both flowing and dry conditions.
Other Features of Geomorphic Significance
During the 2018–21 surveys, 4 road crossings, 4 flood deposits, and 2 tributary confluences were identified (fig. 4). During periods when streamflow is higher than during the 2017–21 surveys, other tributaries probably contribute streamflow to the study reach. During the 2018 survey, 4 channel bifurcations and 7 fine-sediment accumulations were identified (Graziano, 2020b). During the 2019 survey, 13 channel bifurcations and 30 fine-sediment accumulations were identified (Graziano and Chavarria, 2022b). During the 2020 and 2021 surveys, 14 and 16 channel bifurcations and 35 and 8 fine-sediment accumulations were identified, respectively.
Example photographs presented in figure 25 depict characteristics of channel bifurcations and fine-sediment accumulations identified in the study reach during the 2020 and 2021 surveys. Figure 25A depicts a fine-sediment accumulation that was collocated with dense bank vegetation, which may have slowed water enough for sediment to settle during high flows. Figure 25B depicts a channel bifurcation that was about 50 ft in length along the channel reach and had no woody debris present. This bifurcation was also identified in 2020 and had dense vegetation and some woody debris consisting of large logs.
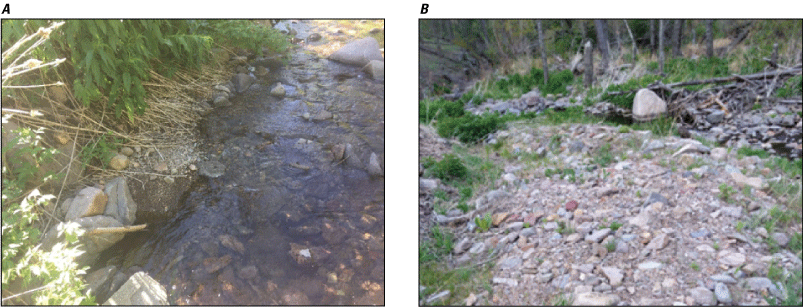
Examples of fine-sediment accumulations and channel bifurcations identified in the study reach on North Fork Eagle Creek, Eagle Creek Basin, south-central New Mexico, 2020 and 2021. All photographs are oriented downstream. A, A fine-sediment accumulation located at the base of the left bank during the 2020 survey; B, a channel bifurcation, which was located on the left bank of the channel and was about 50 feet long during the 2021 survey.
Discussion
The 2012 Little Bear Fire caused substantial vegetation loss in the North Fork Eagle Creek Basin. The loss of vegetation and other potential fire effects were expected to cause hydrologic responses that included reduced infiltration and increased overland runoff, temporary increases in “flashy” responses to rainfall and snowmelt, increased sediment and debris yields, and changes to vegetation from flooding (USDA Forest Service, 2016). The results from the five geomorphic surveys of North Fork Eagle Creek, presented in this report and in Graziano (2019, 2020b) and in Graziano and Chavarria (2022b), have been used to assess some of these expected hydrologic responses, to monitor geomorphic change to North Fork Eagle Creek, and to provide baseline data for future geomorphic monitoring of North Fork Eagle Creek. In this section, these expected hydrologic responses and their geomorphic implications are discussed. Further, on the basis of data collected thus far, the hypotheses made in Graziano (2019, 2020b) and in Graziano and Chavarria (2022b), about the potential for future geomorphic change to North Fork Eagle Creek are assessed.
In Graziano (2019, 2020b) and in Graziano and Chavarria (2022b), the expected hydrologic responses of reduced infiltration, increased overland runoff, and “flashy” responses to rainfall and snowmelt were assessed by using the peak annual streamflow records from the North Fork and Eagle Creek streamgages. Although only 5 years of data were collected after the Little Bear Fire (additionally, only 5 years of streamflow data were collected before the Little Bear Fire at the North Fork streamgage), the peak annual streamflow records examined in Graziano (2019) indicate a flashy response to rainfall and snowmelt in some instances. Graziano (2019) found that peak annual streamflows of relatively high magnitude (greater than 50 ft3/s) had a 2-year recurrence interval and most commonly occurred during the North American monsoon season (both before and after the Little Bear Fire), indicating that most peak annual streamflows had been caused by rainfall rather than snowmelt; therefore, it was hypothesized in Graziano (2019) that, if observable geomorphic change occurs in the study reach during the 5 years planned for the study, there is a strong possibility that it will have been caused by rainfall during the months of the North American monsoon season (July, August, and September).
The streamflow records from the period between the 2020 and 2021 surveys (period 4) partially support the aforementioned hypothesis, because the highest peak streamflow event at the Eagle Creek streamgage (with a peak streamflow less than 50 ft3/s) occurred during the late North American monsoon season in September. Unlike period 4, the highest peak streamflow within the study reach (with peak streamflows greater than 50 ft3/s) between the 2017 and 2018 surveys (period 1), 2018 and 2019 surveys (period 2), and 2019 and 2020 surveys (period 3) occurred in the months of February, October, and November, respectively (fig. 6A–D). In addition, streamflow of lower magnitude (less than 50 ft3/s) occurred from February through March and had presumably been caused by snowmelt runoff, but the magnitude of streamflow likely only contributed to minor geomorphic changes observed in the reach during the 5 years of the survey.
From 2012 to 2017, the average daily streamflow was 2.33 ft3/s and nine distinct high flow events (greater than 50 ft3/s) occurred at Eagle Creek, with the maximum streamflow of 166 ft3/s occurring on July 14, 2014. The maximum streamflow at Eagle Creek was 120 ft3/s in period 1, 140 ft3/s in period 2, 75 ft3/s in period 3, and 9.2 ft3/s in period 4, with exceedance probabilities of 0.19, 0.03, 0.27, and 25 percent, respectively, when computed from mean daily streamflow values from January 1, 1992, to May 20, 2021 (fig. 26). Average daily streamflow at Eagle Creek between the five surveys was 1.8, 3.5, 2.9, and 0.2 ft3/s, with those periods having 15, 28, 0, and 50 days, respectively, of zero recorded streamflow. During the 2018 and 2021 surveys, the last cross section with flowing surface water was cross section 7, whereas during the 2019 and 2020 surveys, surface water flowed past cross section 8. During the majority of the study period, the cumulative streamflow at both North Fork Eagle Creek and South Fork Eagle Creek was less than what was recorded at the Eagle Creek streamgage, with 91, 66, 73, and 90 percent of the days recorded from periods 1–4, respectively. This is evidence that, for the majority of the study period, portions of the water flowing by the North Fork streamgage were likely being lost to aquifer recharge, alluvium saturation, or evapotranspiration in the reach of North Fork Eagle Creek located below the North Fork streamgage (Graziano,2019, 2020b). During high flow events, the greater streamflow observed at the Eagle Creek streamgage than the cumulative streamflow at the North Fork and South Fork Eagle Creek streamgages is considered to be the result of tributary inflows into North Fork Eagle Creek (below the North Fork streamgage),
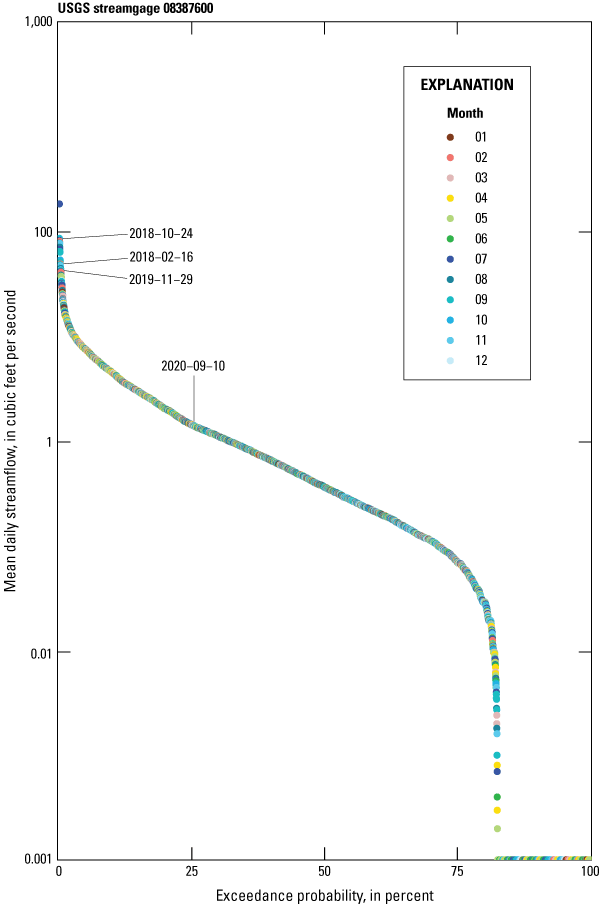
Mean daily streamflow flow duration curve of Eagle Creek streamgage from January 1, 1992, to May 20, 2021 (USGS site 08387600) (U.S. Geological Survey, 2022a), created using the total-period method (Dunne and Leopold, 1978). The maximum streamflow values observed between each survey period are annotated in the plot with the respective date the high streamflow event occurred. To identify seasonal patterns within the streamflow record, each daily mean streamflow value is color coded by the month in which the value was observed.
Annual monitoring of geomorphic changes began with the 2017 geomorphic survey of North Fork Eagle Creek and continued with an annual frequency until 2021, forming 4 temporal periods between the five surveys. During the study period, changes were monitored through repeat surveys of selected cross sections of the study reach of North Fork Eagle Creek. Physical changes were identified in only 3 of the 14 cross sections that were surveyed in 2017 and 2018, and only 4 of the 14 cross sections that were surveyed in 2019, with the most substantial changes appearing to have been caused by channel erosion (Graziano and Chavarria, 2022b); however, for all other cross sections, topographic changes were difficult to discern because the changes seen in the cross-section plots were likely attributable to variation in surveyed values from the roughness of the topography impacting survey rod placement, vegetative growth on the banks of the channel and in the channel, and RTK GNSS accuracy than to physical changes to the cross-section topographies. For example, in the 2019 survey report (Graziano and Chavarria, 2022b) it was stated that topography roughness was likely the largest source of change for cross sections 4, 9, 13, and 14, because of vegetation in the channel, or because the channel bed at those cross sections was partially composed of boulders, some of which were greater than 1 ft in diameter and could affect the placement of the survey rod, ultimately impacting survey data.
Despite surveying difficulties, the cross sections that have most likely undergone geomorphic change where elevations differed by greater than half a foot for at least a quarter of the cross section from 2017 to 2021 were cross sections 4, 7, 11, 12, and 13 (figs. 11, 14, 18, 19, 20). Between 2017 and 2021, cross sections 4 and 7 experienced lowering of channel elevations by erosion. Specifically, cross section 4 is located on a 90-degree meander within the study reach, and the cross-sectional profile shows the thalweg incising to the left of the channel, forming a cut bank because of bank instability. Cross section 7 experienced substantial erosion on the left bank, resulting in the formation of a side channel and a point bar from 2018 to 2021, with the majority of the erosion occurring during period 1. The incision of the left bank of cross section 7 likely occurred during the three high flow events that exceeded 50.0 ft3/s between the two surveys, with each event having an exceedance probability less than 0.1, making them relatively rare for the Eagle Creek watershed.
Unlike cross sections 4 and 7, cross sections 11–13 experienced deposition that raised overall channel elevations from 2017 to 2018. The cross section 11 thalweg experienced a maximum elevation increase of 0.9 ft, with the majority of the deposition occurring between the 2017 and 2018 surveys. The left bank of cross section 12 experienced a maximum increase of 0.4 ft in surface elevation, with the majority of the deposition occurring between the 2017 and 2018 surveys and between the 2020 and 2021 surveys. The left and right banks of cross section 13 experienced a maximum increase in surface elevation of 0.8 ft, with the majority of the deposition occurring between the 2020 and 2021 surveys for the left bank and between the 2018 and 2019 surveys for the right bank. Deposition within cross sections 11–13 may have resulted from their low stream gradients that ranged from 124 to 143 ft/mi, less frequent high flow events during periods 3 and 4, and a possible increase in streambed vegetation cover, determined from field observations made and photographs taken during the period of study. Although measurable changes occurred to cross-section profiles, it is difficult to conclude whether they were in response to post-wildfire or anthropogenic disturbances to the Eagle Creek watershed.
Channel profiles between the 2017 and 2021 surveys indicate little to no substantial change in thalweg elevations or stream gradients during the 5 years of surveying. The three cross sections that experienced the highest total change in thalweg elevations were 11, 5, and 13 with cumulative changes of 0.6, 0.5, and 0.4 ft, respectively. Cross sections 1, 6, 8, 9, 10, 12, and 14 experienced a total elevation change of less than ±0.2 ft. The 2021 survey had the greatest change to thalweg elevations across the study reach, with a cumulative change of 2.5 ft. The three cross sections that experienced the greatest change in stream gradients were 5, 1, and 4 with average changes of 3, 3, and 2 ft/mi, respectively. Cross sections 3, 6, 7, 8, 9, 10, 12, and 13 experienced an average gradient change of less than ±1 ft/mi. The 2019 survey had the greatest change to stream gradients across the study reach, with an average change of −2 ft/mi. Because multiple high flow events occurred during the study period and channel gradients remained relatively stable, it can be concluded that any long-term changes to stream gradients caused by the Little Bear Fire occurred prior to this study.
From 2017 to 2021, woody debris accumulations were annually monitored through the surveying of woody debris accumulations in the channel of the study reach. Between the 2017 and 2018 surveys, it was found that high flows (greater than 50 ft3/s) that occurred between surveys were able to mobilize woody debris in the channel, and although some woody debris accumulations identified in 2018 may have been overlooked in 2017, the total number of woody debris accumulations in the channel increased between the two surveys (Graziano, 2020b). Between the 2018 and 2019 surveys, there were more instances of moderate flows (greater than 2 ft3/s) at the North Fork and Eagle Creek streamgages than between the 2017 and 2018 surveys and more woody debris accumulations found as a result (Graziano and Chavarria, 2022b). The increase in year-to-year woody debris accumulations would continue, with the 2020 and 2021 surveys having the highest number of woody debris accumulations identified, totaling 173 and 188, respectively. In contrast, the year with the minimum number of woody debris accumulations identified was 2017 with 58, followed by 2018 with 112, and 2019 with 164 total woody debris accumulations identified. The overall increase in woody debris accumulations may partly be due to the temporal lag between when a wildfire occurs and when damaged trees fall, allowing them to become mobilized in the stream channel (Catry and others, 2010; Angers and others, 2011). Compounding the increase in woody debris accumulations is the lack of high flow events during periods 3 and 4, which could limit the physical mechanism needed to mobilize anchored debris accumulations out of the study reach. This explanation is further validated by field photographs, which show woody debris with visible burn damage that likely originated from the Little Bear Fire burn scar (fig. 23D).
The woody debris accumulation totals from 2017 to 2021 varied considerably, with the most substantial change being an increase of 54 woody debris accumulations occurring between the 2017 to 2018 surveys; however, some general similarities were found in the spatial distribution of woody debris accumulations. The distribution of woody debris within the study reach remained relatively constant for the 2017–20 surveys, with the upstream subreach (that is, between the first road crossing and cross section 10) having 64, 60, 63, and 64 percent of the total number of woody debris accumulations. Unlike the previous surveys, the 2021 survey had a redistribution of woody debris accumulations that shifted them to the downstream subreach, lowering the upstream subreach debris accumulation to 51 percent. Also, the ratio of debris deposits to active jams would remain relatively constant between the 2018 and 2020 surveys, but during the 2021 survey the ratio of debris deposits to active jams increased.
During the 2017 geomorphic survey, 14 pools were identified in the study reach (Graziano, 2019); however, because the methods of pool identification were refined after the 2017 survey, direct comparisons between the 2017 and subsequent surveys are not possible. The 2018 geomorphic survey identified 71 pools in the study reach (Graziano, 2020b), whereas the 2019 survey identified 228 pools (Graziano and Chavarria, 2022b), the 2020 survey identified 230 pools, and the 2021 survey identified 210 pools. Pools identified during a given survey that were not identified during the following survey likely filled in or physically changed in some other way that prevented them from being identified as pools (Graziano and Chavarria, 2022b).
In Graziano (2019), it was hypothesized that the identified pools would likely remain in place, with the same general size and structure, unless flow events of a particularly high magnitude occurred. Between June 19, 2017, and May 20, 2021, four high-flow events (greater than 50 ft3/s) occurred in the study reach, which generally coincided with an increase in pool counts in the following survey. For example, the 2019 survey had the largest increase in the number of pools, and the highest flow event during the study period occurred during period 2. In contrast, the only survey that had a decrease in the number of pools was 2021, which also coincides with the only period between two surveys where streamflow did not exceed 50 ft3/s. The increase in pool counts could further be contributed to by the increase in active jams, which create a backwater and are often collocated with pools. Comparisons across the entire study period also indicate a general increase in the number of pools within the study reach, with a total increase of 139 pools from 2018 to 2021.
Unless major flooding occurs, both the location and number of road crossings and flood deposits are expected to remain the same for the foreseeable future. Additionally, the two identified tributary confluences are expected to remain at the same locations. However, more tributary confluences may be identified, because tributary confluence identification was not rigorous and was entirely based either on the presence of water in the tributary or on the presence of engineered structures. An examination of field photographs suggests that the reason for the decrease in channel bifurcations or fine-sediment accumulations during the 2018 survey was likely due to such features not being rigorously identified, and it is likely that not all of the channel bifurcations or fine-sediment accumulations in the study reach were cataloged previously (Graziano and Chavarria, 2022b). In addition, channel bifurcations in dry sections of the channel, especially those in the larger flood deposits, could be difficult to identify, primarily because there was not always a clear path that streamflow would follow, and in the larger flood deposits, some sections of the channel appeared to be braided and separated into more than two distributaries instead of bifurcated into only two distinct channels. The identification of fine-sediment accumulations was also affected by the local stream characteristics but in different ways. Specifically, fine-sediment accumulations were only observed in dry sections of the study reach and may have been overlooked in both flood deposits and areas where water was present (Graziano, 2020b; Graziano and Chavarria, 2022b).
Summary
About one-quarter of the water supply for the Village of Ruidoso, New Mexico, is from groundwater pumped from wells located along North Fork Eagle Creek in the National Forest System lands of the Lincoln National Forest near Alto, N. Mex. Because of potential effects of groundwater pumping on surface-water hydrology in the North Fork Eagle Creek Basin and the effects of the 2012 Little Bear Fire, which resulted in substantial loss of vegetation in the basin, the U.S. Department of Agriculture Forest Service, Lincoln National Forest, has required monitoring of a portion of North Fork Eagle Creek for short-term geomorphic change as part of the permitting decision that allows for the continued pumping of the production wells. The objective of this study is to address the geomorphic monitoring requirements of the permitting decision by conducting annual geomorphic surveys of North Fork Eagle Creek along the stream reach between the North Fork Eagle Creek near Alto, N. Mex., streamgage (U.S. Geological Survey [USGS] site 08387550) and the Eagle Creek below South Fork near Alto, N. Mex., streamgage (USGS site 08387600). The monitoring of short-term geomorphic change in the stream reach began in June 2017 with surveys of selected cross sections and surveys of all woody debris accumulations and pools identified in the channel. In June 2018, 2019, 2020, and May 2021, the monitoring of short-term geomorphic change continued with four more geomorphic surveys of the stream reach (with some modification to the monitoring methods).
The five surveys were conducted by the USGS, in cooperation with the Village of Ruidoso. The results of the 2017–19 geomorphic surveys were summarized and interpreted in previous USGS open-file reports, and the data were published in the associated data releases of those reports. In this report, the results of all five geomorphic survey are summarized, interpreted, and compared to each other. The data from the 2020 and 2021 geomorphic surveys are published in the associated data release for this report.
The study reach used for the five surveys was 1.89 miles long, beginning about 260 feet (ft) upstream from the North Fork Eagle Creek near Alto, N. Mex., streamgage and ending at the Eagle Creek below South Fork near Alto, N. Mex., streamgage. Large sections of the study reach are characterized by intermittent streamflow, and where streamflow is normally continuous (including at the upper and lower portions of the study reach, near the streamgages), the streamflow typically remains less than 2 cubic feet per second (ft3/s) throughout the year except during seasonal high flows. Such flows most often result from rainfall during the North American monsoon months of July to September, from early winter precipitation events in November to January, or from snowmelt runoff in March to May. During the study period spanning the 2017–21 surveys, high-flow events resulting from both rainfall during the North American monsoon season and snowmelt runoff during the winter to early spring occurred in the study reach, and those high-flow events appeared to have caused some minor and localized geomorphic changes in the study reach, with a general increase in the number of pools and woody debris accumulations. However, stream gradients and the majority of channel cross sections remained relatively static over the study period.
For the 2017 geomorphic survey of North Fork Eagle Creek, cross sections were established and surveyed at 14 locations along the study reach, and in the following surveys, those same 14 cross sections were resurveyed. Comparisons of the cross-section survey results suggest that minor observable geomorphic changes had occurred in cross sections 7, 11, 12, and 13. These minor observable geomorphic changes included erosion or deposition of surface materials by about 1–2 ft in some parts of the affected cross sections. Cross section 4 did experience substantial geomorphic change greater than 2 ft during the study period in the form of a loss of 5–8 ft in left bank elevations forming a cut bank. Thalweg elevations at each cross section were used to derive stream gradients for each survey. There was little change to the average stream gradient within the study reach, with an overall difference of 2 feet per mile from 2017 to 2021. Small survey-to-survey differences in average stream gradient could be attributed to localized erosion and deposition occurring within the study reach, but it may also be attributed to channel bed roughness and real-time kinematic global navigation satellite system measurement accuracy.
To further assess geomorphic changes within the study reach, other features, including woody debris accumulations and pools, were surveyed from 2017 to 2021. Over the five surveys there was a general year-to-year increase in the number of debris accumulations and pools identified within the study reach. The increase in debris accumulations may partly be due to (1) the temporal lag between when a fire occurs and when woody vegetations falls, allowing it to become mobilized in the stream channel and (2) the high flow events that occurred between 2017 and 2019, four of which exceeded 50 ft3/s and were able to mobilize woody debris from the surrounding watershed and deposit it into the study reach. The increase in woody debris accumulations in the stream channel would also increase the number of active jams causing backwatering and allowing for temporary pools to form. Because the magnitude and frequency of high flow events decreased from 2019 to 2021, with only one event exceeding 50 ft3/s, there were limited physical mechanisms to remobilize anchored woody debris accumulations, allowing them to remain within the study reach. Field photographs reinforce this by illustrating that some woody debris accumulations identified during surveys consisted of burned material that likely originated from the Little Bear Fire. Other than generating localized pools from active jamming, most woody debris accumulations identified did not appear to have substantially influenced geomorphic change in the locations where they were found.
Although it cannot be said that the geomorphic changes observed during the study period were directly caused by post-wildfire or anthropogenic disturbances to the watershed; some generalizations about possible geomorphic change occurring within the study reach can be made. During the study period, five high-flow events exceeded 50 ft3/s within Eagle Creek, with one event having the seventh highest recorded peak flow since 1991. Both cross-section and channel profiles showed localized erosion and deposition occurring within the study reach, but overall, the study reach geomorphology was relatively static through the study period. There was a continuous increase in woody debris accumulations from year to year, but besides creating localized pools, there were no indications woody debris accumulations caused substantial geomorphic change. Because the study period encompassed historically high flow events and the overall cross-section and channel profiles remained stable, any long-term change to the North Fork Eagle Creek’s channel profile caused by the Little Bear Fire would have likely occurred prior to the survey and was not quantified in this study. Because of an increase in wildfire severity and frequency within the mountainous regions of the Southwest and their impact on adjacent fluvial systems, continued geomorphic studies performed in the Lincoln National Forest may provide valuable information on watershed resiliency and recovery post-wildfire. Such studies would allow for the establishment of geomorphic baselines that could be used to quantify pre- to post-wildfire stream geomorphology with increased certainty.
References Cited
Abbe, T.B., and Montgomery, D.R., 1996, Large woody debris jams, channel hydraulics and habitat formation in large rivers: Regulated Rivers, v. 12, nos. 2–3, p. 201–221, accessed April 19, 2018, at https://doi.org/10.1002/(SICI)1099-1646(199603)12:2/3<201:AID-RRR390>3.0.CO;2-A.
Benson, M.A., and Dalrymple, T., 1967, General field and office procedures for indirect measurements: U.S. Geological Survey Techniques of Water-Resources Investigations, book 3, chap. Al, 30 p., accessed August 8, 2018, at https://doi.org/10.3133/twri03A1.
Bradley, D.N., 2012, Slope-area computation program graphical user interface 1.0—A preprocessing and post processing tool for estimating peak flood discharge using the slope-area method: U.S. Geological Survey Fact Sheet 2012–3112, 4 p., accessed July 26, 2018, at https://pubs.usgs.gov/fs/2012/3112.
Buffington, J.M., Lisle, T.E., Woodsmith, R.D., and Hilton, S., 2002, Controls on the size and occurrence of pools in coarse‐grained forest rivers: River Research and Applications, v. 18, no. 6, p. 507–531, accessed May 4, 2018, at https://doi.org/10.1002/rra.693.
Dalrymple, T., and Benson, M.A., 1968, Measurement of peak discharge by the slope-area method: U.S. Geological Survey Techniques of Water-Resources Investigations, book 3, chap. A2, 12 p., accessed August 8, 2018, at https://doi.org/10.3133/twri03A2.
Esri, 2009, World imagery (December 12, 2009): Esri ArcGIS website, accessed June 16, 2022, at https://www.arcgis.com/home/item.html?id=10df2279f9684e4a9f6a7f08febac2a9.
Fulford, J.M., 1994, User’s guide to SAC, a computer program for computing discharge by slope-area method: U.S. Geological Survey Open-File Report 94–360, 31 p., accessed July 26, 2018, at https://doi.org/10.3133/ofr94360.
Graziano, A.P., 2018, Data supporting the 2017 geomorphic survey of North Fork Eagle Creek, New Mexico: U.S. Geological Survey data release, accessed August 29, 2019, at https://doi.org/10.5066/F7PR7TX3.
Graziano, A.P., 2019, Geomorphic survey of North Fork Eagle Creek, New Mexico, 2017: U.S. Geological Survey Open-File Report 2018–1187, 28 p., accessed March 15, 2022, at https://doi.org/10.3133/ofr20181187.
Graziano, A.P., 2020a, Data supporting the 2018 geomorphic survey of North Fork Eagle Creek, New Mexico: U.S. Geological Survey data release, accessed March 15, 2022, at https://doi.org/10.5066/P94ZQHKU.
Graziano, A.P., 2020b, Geomorphic survey of North Fork Eagle Creek, New Mexico, 2018: U.S. Geological Survey Open-File Report 2020–1121, 37 p., accessed March 15, 2022, at https://doi.org/10.3133/ofr20201121.
Graziano, A.P., and Chavarria, S.B., 2022a, Data supporting the 2019 geomorphic survey of North Fork Eagle Creek, New Mexico: U.S. Geological Survey data release, https://doi.org/10.5066/P97ALYNZ.
Graziano, A.P., and Chavarria, S.B., 2022b, Geomorphic survey of North Fork Eagle Creek, New Mexico, 2019: U.S. Geological Survey Open-File Report 2022–1041, 36 p., accessed July 10, 2022, at https://doi.org/10.3133/ofr20221041.
Gurnell, A.M., Piegay, H., Swanson, F.J., and Gregory, S.V., 2002, Large wood and fluvial processes: Freshwater Biology, v. 47, no. 4, p. 601–619, accessed April 21, 2020, at https://doi.org/10.1046/j.1365-2427.2002.00916.x.
Heimann, D.C., 2017, Assessment of an in-channel redistribution technique for large woody debris management in Locust Creek, Linn County, Missouri: U.S. Geological Survey Scientific Investigations Report 2017–5120, 25 p., accessed April 19, 2018, at https://doi.org/10.3133/sir20175120.
International River Interface Cooperative, 2022, iRIC—Slope Area Computation Solver: International River Interface Cooperative web page, accessed February 20, 2022, at https://i-ric.org/en/solvers/sac/.
Johnson, P.A., and Heil, T.M., 1996, Uncertainty in estimating bankfull conditions: Journal of the American Water Resources Association, v. 32, no. 6, p. 1283–1291, accessed July 26, 2018, at https://doi.org/10.1111/j.1752-1688.1996.tb03497.x.
Lisle, T.E., 1982, Effects of aggradation and degradation on riffle pool morphology in natural gravel channels, northwestern California: Water Resources Research, v. 18, no. 6, p. 1643–1651, accessed August 8, 2018, at https://doi.org/10.1029/WR018i006p01643.
Lisle, T.E., 1987, Using “residual depths” to monitor pool depths independently of discharge: Berkeley, Calif., U.S. Department of Agriculture, Pacific Southwest Forest and Range Experiment Station Research Note PSW–394, 4 p., accessed April 19, 2018, at https://doi.org/10.2737/PSW-RN-394.
Madej, M.A., and Ozaki, V., 1996, Channel response to sediment wave propagation and movement, Redwood Creek, California, USA: Earth Surface Processes and Landforms, v. 21, no. 10, p. 911–927, accessed May 4, 2018, at https://doi.org/10.1002/(SICI)1096-9837(199610)21:10<911:AID-ESP621>3.0.CO;2-1.
Matherne, A.M., Myers, N.C., and McCoy, K.J., 2010, Hydrology of Eagle Creek Basin and effects of groundwater pumping on discharge, 1969–2009 (revised November 2011): U.S. Geological Survey Scientific Investigations Report 2010–5205, 73 p., accessed August 25, 2017, at https://doi.org/10.3133/sir20105205.
Montgomery, D.R., Buffington, J.M., Smith, R., Schmidt, K., and Pess, G., 1995, Pool spacing in forest channels: Water Resources Research, v. 31, no. 4, p. 1097–1105, accessed August 8, 2018, at https://doi.org/10.1029/94WR03285.
Nakamura, F., and Swanson, F.J., 1993, Effects of coarse woody debris on morphology and sediment storage of 0a mountain stream system in western Oregon: Earth Surface Processes and Landforms, v. 18, no. 1, p. 43–61, accessed May 2, 2018, at https://doi.org/10.1002/esp.3290180104.
National Geodetic Survey, 2020, OPUS—Online Positioning User Service: National Geodetic Survey web page, accessed September 9, 2020, at https://geodesy.noaa.gov/OPUS/.
Nichols, J.N., and Chavarria, S.B., 2023, Data supporting the 2020 and 2021 geomorphic surveys of North Fork Eagle Creek, New Mexico: U.S. Geological Survey data release, https://doi.org/10.5066/P9BGPRN9.
Parrett, C., and Johnson, D.R., 2004, Methods for estimating flood frequency in Montana based on data through water year 1998: U.S. Department of the Interior, U.S. Geological Survey Water-Resources Investigations Report 2003–4308, 101 p., accessed February 10, 2023, at https://doi.org/10.3133/wri034308.
RStudio Team, 2022, RStudio—Integrated development environment for R: Boston, Mass., RStudio, PBC, website, accessed March 20, 2022, at https://www.rstudio.com/.
Rydlund, P.H., Jr., and Densmore, B.K., 2012, Methods of practice and guidelines for using survey-grade global navigation satellite systems (GNSS) to establish vertical datum in the United States Geological Survey: U.S. Geological Survey Techniques and Methods, book 11, chap. D1, 102 p., 4 app., accessed September 7, 2017, at https://doi.org/10.3133/tm11D1.
Tillery, A.C., and Matherne, A.M., 2013, Postwildfire debris-flow hazard assessment of the area burned by the 2012 Little Bear Fire, south-central New Mexico: U.S. Geological Survey Open-File Report 2013–1108, 15 p., 3 pls. [Also available at https://pubs.usgs.gov/of/2013/1108/.]
U.S. Department of Agriculture [USDA] Forest Service, 2015, Final environmental impact statement, North Fork Eagle Creek wells special use authorization: U.S. Department of Agriculture Forest Service, 574 p., accessed April 19, 2018, at https://www.fs.usda.gov/project/?project=9603.
U.S. Department of Agriculture [USDA] Forest Service, 2016, Record of decision, North Fork Eagle Creek wells special use authorization: U.S. Department of Agriculture Forest Service, 28 p., accessed July 18, 2018, at https://www.fs.usda.gov/project/?project=9603.
U.S. Department of Agriculture [USDA] Forest Service, Little Bear Fire Burned Area Emergency Response [BAER] Team, 2012, Little Bear Fire burn severity derived from June 18, 2012 Burned Area Reflectance Classifications [BARC]: U.S. Department of Agriculture [USDA] Forest Service online database, accessed March 27, 2020, at https://fsapps.nwcg.gov/afm/baer/download.php?year=2012.
U.S. Geological Survey, 2022a, USGS 08387600 Eagle Creek below South Fork near Alto, NM, in USGS water data for the Nation: U.S. Geological Survey National Water Information System database, accessed March 15, 2022, at https://doi.org/10.5066/F7P55KJN. [Site information directly accessible at https://waterdata.usgs.gov/nm/nwis/inv0entory/?site_no=08387600.]
U.S. Geological Survey, 2022b, USGS 08387550 North Fork Eagle Creek near Alto, NM, in USGS water data for the Nation: U.S. Geological Survey National Water Information System database, accessed March 15, 2022, at https://doi.org/10.5066/F7P55KJN. [Site information directly accessible at https://waterdata.usgs.gov/nm/nwis/inventory/?site_no=08387550.]
U.S. Geological Survey, 2022c, USGS 08387575 South Fork Eagle Creek near Alto, NM, in USGS water data for the Nation: U.S. Geological Survey National Water Information System database, accessed March 15, 2022, at https://doi.org/10.5066/F7P55KJN. [Site information directly accessible at https://waterdata.usgs.gov/nm/nwis/inventory/?site_no=08387575.]
Wallace, J.B., Webster, J.R., and Meyer, J.L., 1995, Influence of log additions on physical and biotic characteristics of a mountain stream: Canadian Journal of Fisheries and Aquatic Sciences, v. 52, no. 10, p. 2120–2137, accessed May 4, 2018, at https://doi.org/10.1139/f95-805.
Conversion Factors
U.S. customary units to International System of Units
Datum
Vertical coordinate information is referenced to the North American Vertical Datum of 1988 (NAVD 88) and to the National Geodetic Vertical Datum of 1929 (NGVD 29).
Horizontal coordinate information is referenced to the North American Datum of 1983 (NAD 83).
For more information about this publication, contact:
Director, New Mexico Water Science Center
U.S. Geological Survey
6700 Edith Blvd. NE
Albuquerque, NM 87113
For additional information, visit
https://www.usgs.gov/centers/nm-water
Publishing support provided by
Lafayette Publishing Service Center
Disclaimers
Any use of trade, firm, or product names is for descriptive purposes only and does not imply endorsement by the U.S. Government.
Although this information product, for the most part, is in the public domain, it also may contain copyrighted materials as noted in the text. Permission to reproduce copyrighted items must be secured from the copyright owner.
Suggested Citation
Nichols, J.R., Chavarria, S.B., and Graziano, A.P., 2023, Assessment of post-wildfire geomorphic change in the North Fork Eagle Creek stream channel, New Mexico, 2017–21: U.S. Geological Survey Scientific Investigations Report 2023–5116, 48 p., https://doi.org/10.3133/sir20235116.
ISSN: 2328-0328 (online)
Study Area
| Publication type | Report |
|---|---|
| Publication Subtype | USGS Numbered Series |
| Title | Assessment of post-wildfire geomorphic change in the North Fork Eagle Creek stream channel, New Mexico, 2017–21 |
| Series title | Scientific Investigations Report |
| Series number | 2023-5116 |
| DOI | 10.3133/sir20235116 |
| Publication Date | November 14, 2023 |
| Year Published | 2023 |
| Language | English |
| Publisher | U.S. Geological Survey |
| Publisher location | Reston, VA |
| Contributing office(s) | New Mexico Water Science Center |
| Description | Report: vi, 48 p.; Data Release |
| Country | United States |
| State | New Mexico |
| Other Geospatial | North Fork Eagle Creek Stream Channel |
| Online Only (Y/N) | Y |