Prediction of the Probability of Elevated Nitrate Concentrations at Groundwater Depths Used for Drinking-Water Supply in the Puget Sound Basin, Washington, 2004–19
Links
- Document: Report (16 MB pdf) , HTML , XML
- Data Release: USGS Data Release - Index of vulnerability for elevated nitrates in groundwater in the Puget Sound Basin, Washington, 2000–2019
- Download citation as: RIS | Dublin Core
Abstract
The Puget Sound basin encompasses the 13,700-square-mile area that drains to the Puget Sound and the adjacent marine waters of Washington State. Well more than 4 million people live within the basin, with numbers continuing to increase, who rely on the basin’s natural resources including groundwater. The Puget Sound Partnership was created by a Washington State statute to implement a science-based recovery of the Puget Sound to help address impacts to these resources. As part of the recovery, the Partnership developed the Puget Sound Vital Signs as measures of ecosystem health that guide the assessment of progress toward Puget Sound recovery goals. The Puget Sound Partnership Leadership Council adopted a Drinking Water Vital Sign associated with human health and quality of life, recognizing certain indicators as integral to the sustainability of Puget Sound recovery efforts. One such Vital Sign indicator was the vulnerability of groundwater throughout the aquifers of the Puget Sound basin to elevated nitrate concentrations as defined by the probability of exceeding 2 milligrams/liter (mg/L) at a specific location and well depth. The U.S. Geological Survey (USGS) led the effort to characterize groundwater vulnerability. For this study, groundwater vulnerability refers to a probability with which a contaminant applied at or near the land surface can migrate to the aquifer of interest for a given set of land-use practices. Nitrate concentration data were selected for evaluation because elevated nitrate concentrations are typically caused by anthropogenic activities and have been associated with deleterious impacts on human health.
To identify groundwater vulnerability to elevated nitrate concentrations, logistic regression was used to relate anthropogenic (human associated) and natural variables to the occurrence of elevated nitrate concentrations in untreated groundwater from large public water supply system wells found within the Washington State Department of Health Sentry database. Variables that were analyzed included well depth, soil hydraulic conductivity, precipitation, population density, fertilizer application amounts, and land-use types. Statistically significant models that predicted the probabilities of groundwater nitrate concentrations greater than 2 mg/L based on the predictor variables were created for the time periods 2000–04, 2005–09, 2010–14, and 2015–19. For all time periods, well depth and a measure of the abundance of urban and agricultural land over or near the well consistently helped explain the vulnerability of the well to elevated nitrate concentrations defined as a probability of exceeding 2 mg/L of nitrate. Precipitation and (or) soil hydraulic conductivity were also important predictor variables in the models.
The models for each time period were used to create maps of groundwater vulnerability at 150- and 300-foot depths throughout the Puget Sound basin. As expected, the most vulnerable locations were associated with shallower well depths and increased agriculture and urban land cover. Across all four time periods, groundwater vulnerability throughout the Puget Sound was low, with probabilities of exceeding 2 mg/L concentrations of nitrate at depths at 150 and 300 feet were typically less than 50 percent. Results also found a slight decrease in probabilities of elevated nitrate concentrations throughout the basin over time. More specifically, additional statistical tests found that groundwater with probabilities of less than about 60 percent declined from 2000 to 2019 and represented more than 75 percent of the modeled Puget Sound basin aquifer. Wells with greater than 60 percent probability increased over the same time period but represented only about 25 percent of the aquifer. The maps and statistical analysis presented in the study provide valuable and informative evaluation of the vulnerability of groundwater in the Puget Sound basin to elevated nitrate concentrations. The probability maps do not represent measured nitrate concentrations in groundwater, but rather they present the probability that nitrate concentrations exceed 2 mg/L. The models and predictions from this study are a viable indicator for the Puget Sound Partnership’s Healthy Human Population—Drinking Water Vital Sign. The logistic regression modeling approach presented here benefits water managers by allowing them to assess temporal trends in a range of probabilities, explore vulnerability changes as new regional land cover and anthropogenic data are generated, and distinguish vulnerabilities at different depths within the aquifer.
Introduction
The Puget Sound basin encompasses the 13,700-square-mile area that drains to the Puget Sound and the adjacent marine waters of Washington State, which are home to numerous species of fresh and marine organisms. More than 4 million people live within the basin, with numbers continuing to increase, who rely on the basin’s ecosystem. As populations and anthropogenic activities within the basin have increased, the wellbeing of several aquatic organisms and ecosystem processes have been impacted (Puget Sound Info, 2022). The Puget Sound Partnership was created by a Washington State statute (Washington State Legislature, 2007) to implement a science-based recovery of the Puget Sound to help address these impacts. As part of the recovery, the Partnership developed the Puget Sound Vital Signs as measures of ecosystem health that guide the assessment of progress toward Puget Sound recovery goals (Puget Sound Partnership, 2020). Each of these components is represented by one or more indicators of the condition of the Puget Sound.
In 2015, the Puget Sound Partnership Leadership Council adopted a Drinking Water Vital Sign associated with human health and quality of life, recognizing these characteristics as integral to the sustainability of Puget Sound recovery efforts. Recommendations for two complimentary drinking-water indicators were developed by a Puget Sound Partnership led team in 2019 and adopted by the Science Panel and Leadership Council in May 2019. Both indicators are focused on drinking-water quality and include:
-
1. metrics characterizing direct measurements of nitrate concentrations in source waters supplied to Group A (more than 15 connection or more than 25 people) and Group B (less than 15 connections and less than 25 people) public water supply systems that serve most of the population in Puget Sound, and
-
2. vulnerability for elevated nitrate concentrations in groundwater throughout the Puget Sound aquifer systems, which is relevant to source-water quality over the range of domestic wells to Group A municipal systems.
The U.S. Geological Survey (USGS) led the development of the second indicator as described in this report.
For this study, groundwater vulnerability refers to the relative ease with which a contaminant applied at or near the land surface can migrate to the aquifer of interest for a given set of land-use practices. Nitrate concentration data were selected for evaluation because elevated nitrate concentrations are typically caused by anthropogenic activities (for example, cropland fertilization, lawn and garden fertilization in urbanized areas, domestic on-site sewage disposal; Williamson and others, 1998; Ebbert and others, 2000), excess nitrate concentrations can impact drinking water and human health (Winter and others, 1999; Tesoriero and others, 2013; Ward and others, 2018; Stayner and others, 2021), and nitrate concentration data are relatively common compared to the frequency of analysis for other constituents commonly associated with anthropogenic activities, such as pesticides or volatile organic compounds. For example, the Washington State Department of Health (WDOH) requires that public water supply systems regularly measure nitrate concentrations. Thus, as a widespread contaminant, nitrate concentrations are an important indicator of environments that are susceptible to contamination. However, such testing is only required by WDOH for relatively large (Group A—more than 15 connections or more than 25 people) public water supply systems and, as a result, citizens and public health officials have only limited information about the potential exposure to elevated nitrate concentrations for people whose primary drinking-water sources are small systems or domestic wells. To assist the Partnership, the USGS developed a series of temporally based maps that show groundwater vulnerability to elevated nitrate concentrations. These maps and the associated models used to create them provide a regional scale understanding of groundwater vulnerability to anthropogenic contamination, and how that vulnerability has changed over time with changes in land use and other variables. The results of the project will also inform decisions on how best and how frequently to report on this indicator of groundwater vulnerability as defined as the probability of exceeding specific nitrate concentrations at specific well depths throughout the Puget Sound basin in future years.
Background
Groundwater vulnerability maps are designed to estimate the potential for contamination of groundwater in a geographic area based on anthropogenic and hydrogeologic factors. Multiple definitions exist for “groundwater vulnerability” depending on the research objectives. For this study, we use the definition from the National Research Council (1993), which states that groundwater vulnerability to contamination is “...the tendency or likelihood for contaminants to reach a specified position in the groundwater system after introduction at some location above the uppermost aquifer.” The National Research Council (1993) refined the definition on the basis of whether the assessment was contaminant specific, defined as “specific vulnerability,” or for any contamination in general, “intrinsic vulnerability.”
Three previous studies (Tesoriero and Voss, 1997; Frans, 2000, 2008) estimated groundwater vulnerability to elevated nitrate concentrations in various locations within the State of Washington. Tesoriero and Voss (1997) developed a logistic regression model to estimate the probability of nitrate concentration contamination exceeding 3 milligrams per liter (mg/L) in the Puget Sound basin lowlands. Well depth, surficial geology, and land use (forest, urban, and agriculture) were all identified as significant predictors of elevated nitrates. In Frans (2000), logistic regression models were developed to estimate the probability of nitrate concentration contamination exceeding 3 and 10 mg/L for Grant, Franklin, and Adams Counties in eastern Washington. In those models, well casing depth, fertilizer application amounts, and the mean soil hydrologic group were identified as significantly related variables. The most recent vulnerability study done by Frans (2008), found well depth, average annual precipitation, agricultural land use, population density, and soil drainage were all significant factors in explaining groundwater vulnerability throughout the State. Similar vulnerability studies have also been completed at the national scale (Nolan and others, 2002; Nolan and Hitt, 2006).
Purpose and Scope
The purpose of this report is to describe the refinement and implementation of an existing method for characterizing the vulnerability of groundwater at depths used for drinking-water supply in the Puget Sound basin to elevated nitrate concentrations. Although previous studies have examined groundwater vulnerability in Washington, only one was completed in the Puget Sound basin (Tesoriero and Voss, 1997) and that was more than 20 years ago. This report presents the results of an analysis relating anthropogenic and natural factors to the occurrence of elevated nitrate concentrations in groundwater of in the Puget Sound basin over multiple time periods: 2000–04, 2005–09, 2010–14, and 2015–19. The probability of elevated nitrate concentrations at a particular location and time period was estimated using a logistic regression approach. The logistic regression models generated for each time period were entered into a geographic information system (GIS) to produce maps that display the probability of elevated nitrate concentrations throughout the Puget Sound basin. In this report, nitrate concentration refers to the concentration of nitrate plus nitrite measured as nitrogen (NO3+NO2−N), and the term elevated nitrate concentrations refers to those concentrations that exceed 2 mg/L ((NO3+NO2−N).
Description of Study Area
The Puget Sound basin contains a varied landscape that ranges from more urbanized and agricultural areas in the lowlands and alluvial valley foothills adjacent to the Puget Sound and forested areas in the rolling hills and steep mountains surrounding the lowlands (fig. 1). The mild rainy marine climate, densely forested slopes, volcanic peaks, migrating salmon, and islands and shores of Puget Sound are all defining features of the basin, as are the cities and farms and expanses of forest. The rivers and streams in the basin drain from many separate watersheds directly into Puget Sound. Although each of these watersheds is unique, and the quality of water in the streams is influenced to varying degrees by a range of environmental factors, the watersheds share many common characteristics, and the range of water-quality conditions are similar and comparable. The natural and human factors that have a large-scale or regional influence on water quality in the Puget Sound basin define the basin's environmental setting. Mountainous and forested lands can be found to the east and the west of the basin, with the Puget Sound basin lowlands located within the middle of the basin.
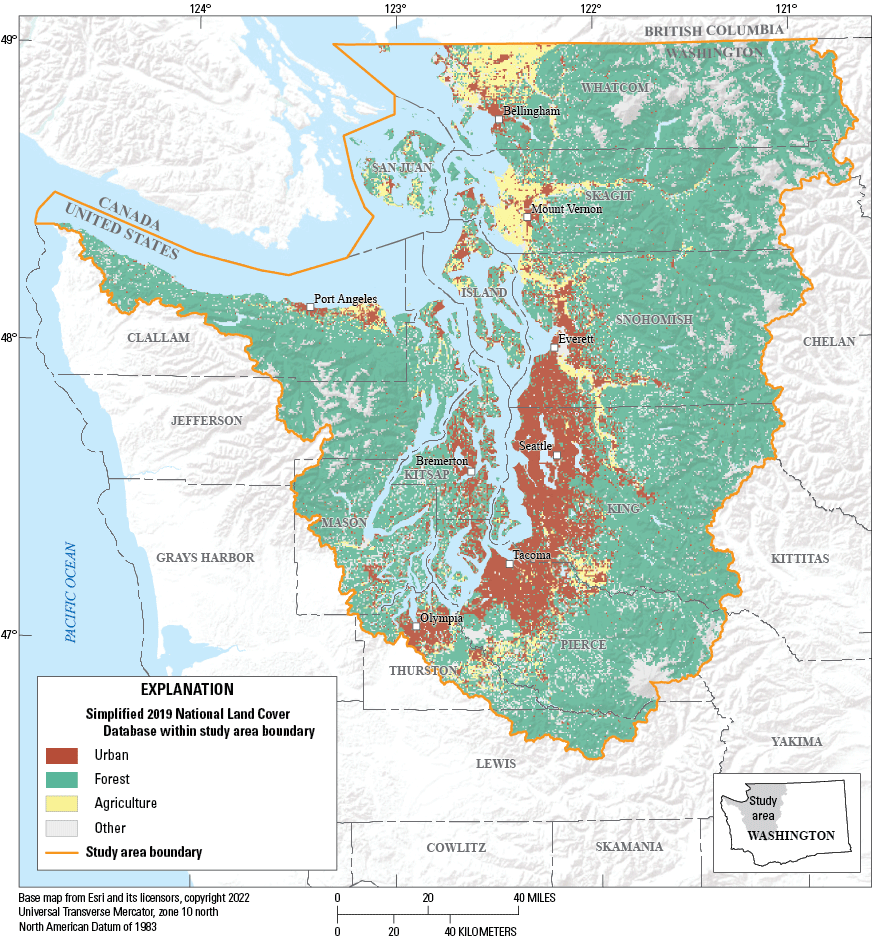
Study area and associated land cover, Puget Sound basin, Washington.
The Puget Sound Regional Aquifer System, contained largely within the Puget Sound lowland and the upper reaches of the adjacent alluvial valleys, is composed primarily of unconsolidated sediments that can be locally more than 3,000 feet (ft) thick. Coarse-grained outwash and alluvial deposits have significant water-bearing capacity and form the major aquifers in the Puget Sound basin (Frans, 2008). Most domestic and large-capacity public supply wells are screened in these units that can extend up stream in the floodplains of larger river systems in the Puget Sound basin. Fine-grained interglacial, lacustrine and till deposits are layered between the coarse-grained deposits and serve as confining and semi-confining units. A more detailed description of the hydrogeology of the Puget Sound can be found in Staubitz and others (1997).
Methods of Investigation
Similar to the previous USGS vulnerability assessments (Tesoriero and Voss, 1997; Frans, 2000, 2008), maps showing the probability of elevated nitrate concentrations in groundwater at multiple depths selected by the authors to represent the relationship between depth and vulnerability to elevated nitrate concentrations during specific time periods in the Puget Sound basin were developed in several steps:
-
1. Relevant anthropogenic, climatic, hydrogeologic, and historical nitrate-concentration data in Group A wells within the Puget Sound basin were compiled.
-
2. Nitrate concentrations in groundwater data were overlaid with land cover and other anthropogenic and hydrogeologic data using a GIS to produce a dataset in which each Group A well with a measured nitrate concentration was attributed with values of these variables within four time periods: 2000–04, 2005–09, 2010–14, and 2015–19. These data were then downloaded to a statistical software package for analysis.
-
3. A range of empirical models (logistic regression) designed to predict the probability of elevated nitrate concentrations (those exceeding a threshold of 2 mg/L) in groundwater were developed based on the available nitrate concentrations in Group A wells, and the well depth, land cover, anthropogenic, and hydrogeologic variables for each of the four time periods.
-
4. The empirical models that best estimated the probability of elevated nitrate concentrations in groundwater were identified and validated.
-
5. Those empirical models were entered into the GIS, and probability maps for the entire Puget Sound basin were constructed.
-
6. The predicted probabilities of exceeding the nitrate concentration threshold were graphically and statistically evaluated to identify potential indicators of change in vulnerability.
Description of Logistic Regression
Logistic regression was selected for this analysis because it quantifies the relation between a variable of interest (response variable) and one or more variables that affect the variable of interest (explanatory variables). This is conceptually similar to multiple linear regression. However, the response variable in logistic regression is transformed into a binary response (yes or no) variable. This makes logistic regression an excellent tool for modeling aquifer vulnerability to nitrate contamination because logistic regression can quantify the probability that nitrate concentrations will exceed a specified concentration.
In this study, logistic regression models were used to determine the probability of exceedance of 2 mg/L of nitrite plus nitrate concentrations (as N) in groundwater (the response variable) across the Puget Sound basin for four time-bins: 2000–04, 2005–09, 2010–14, and 2015–20. To create the logistic models, existing nitrate concentration data were converted to a binary response variable by assigning measured nitrate concentrations into two groups: those greater than or equal to 2 mg/L (exceedances) and those less than 2 mg/L (non-exceedances). The threshold of 2 mg/L was selected because nitrate concentrations that exceed 2 mg/L generally are the result of anthropogenic effects (Nolan and others, 1998).
The logistic regression models take the form of
whereP
the probability of an exceedance;
e
the base of the natural logarithm;
I
the intercept,
X
a set of explanatory variables such as land use, soil permeability, or well depth; and
b
the slope for each of the explanatory variables so that b(X) = [b1(land use) + b2(soil permeability + b3(well depth) +…..] (Hosmer and Lemeshow, 1989; Helsel and others, 2020).
When the probability of an exceedance is plotted versus an explanatory variable, the result is an S-shaped curve with the probability being bounded by 0 on the lower end and 1 on the upper end. The open-source R statistical software was used to determine (calibrate) values of I and b that best fit the data using a stepwise least-squares algorithm (R Core Team, 2019).
Logistic regression calculates several statistical parameters that determine the predictive success of the model. The log-likelihood ratio measures the success of the model as a whole by comparing measured with estimated values (Hosmer and Lemeshow, 1989); specifically, it tests whether model coefficients of the entire model are significantly different from zero. The most significant model is the one with the highest log-likelihood ratio, accounting for the number of explanatory variables (degrees of freedom) used in the model. The log-likelihood ratio can be approximated by a chi-squared distribution, and the computed p-value reflects the degree of certainty (significance level) that model coefficients as a whole are different from zero. A p-value of 0.05 indicates a significance level of 95 percent. As a p-value gets smaller, the likelihood that the model coefficients are different than zero increases. McFadden’s rho-squared is a transformation of the log-likelihood statistic and is intended to mimic the coefficient of determination (R2) metric of linear regression. Rho-squared is always from 0 to 1; a rho-squared closer to 1 corresponds to a better fit. Rho-squared tends to be smaller than R2, so a small number does not necessarily imply a poor fit. Values from 0.2 to 0.4 are generally interpreted to indicate good results (SPSS, Inc., 2000). The accuracy of a logistic regression model can also be calculated by dividing the total number of correctly predicted observations by the total number of observations. The resulting value (prediction efficiency) is a fraction from 0 to 1 with large values indicating greater accuracy or efficiency. Additional information regarding these statistical measures is available in Hosmer and Lemeshow (1989), Helsel and others (2020), and Nolan and Clark (1997).
For individual explanatory variables, the p-value for the Wald z-statistic is reported. This statistic can be approximated by a chi-squared distribution and is used to indicate whether individual model coefficients are significantly different from zero. For this study, individual coefficients were considered statistically significant if the p-value of the Wald z-statistic was less than or equal to 0.05. The p-value for the Wald z-statistic can be considered similar to the p-value for the slope of a line in linear regression. In linear regression, the slope of the line is considered statistically different from a horizontal line (with a slope of zero) if the p-value is less than 0.05. Similarly, the regression coefficients are considered statistically different from zero if the p-values are less than 0.05.
Multicollinearity is the result of strong correlation between explanatory variables and is a major concern for multivariate logistic regression models. Multicollinearity may result in incorrect signs and magnitudes of regression coefficients, thereby leading to incorrect conclusions about relations between explanatory and response variables. Pearson correlation coefficients were examined between explanatory variables to assess the multicollinearity in the models. A strong correlation between two variables was indicated if the correlation coefficient was greater than 0.7. In these cases, one of the correlated variables was excluded from the model calibration datasets and a new model was generated.
Compilation of Nitrate Concentration Data into a Response Variable
The binary response variable of nitrate concentrations exceeding or not exceeding 2 mg/L was computed from data archived in the WDOH Sentry public-water supply system database (Washington State Department of Health, 2020). The dataset provided to us by WDOH contained more than 16,500 nitrate concentration analyses from more than 2,900 pre-treatment samples collected for Group A wells from 2000 through 2019, along with selected metadata about the wells. Well depths ranged from very shallow wells and springs to a maximum depth of 1,600 ft. The median well depth was 200 ft, and the 25th and 75th percentile well depths were 133 and 303 ft, respectively. Because nitrate concentrations and land-use characteristics would be expected to have changed over time, the dataset was divided into four time periods: 2000–04, 2005–09, 2010–14, and 2015–19. The number of wells in each time period ranged from 868 in the 2005–09 time period to 1,815 in the 2010–14 time period and were evenly distributed throughout the study area for each time period. More than 70 percent of the wells were represented by more than one period. For each unique well, multiple samples were possible within each of the four time periods. If multiple results for a well were available within a time period, an average nitrate concentration was calculated and converted into the binary response form (exceeding 2 mg/L or not). The locations of the wells within the final dataset for each time period are shown in figure 2.
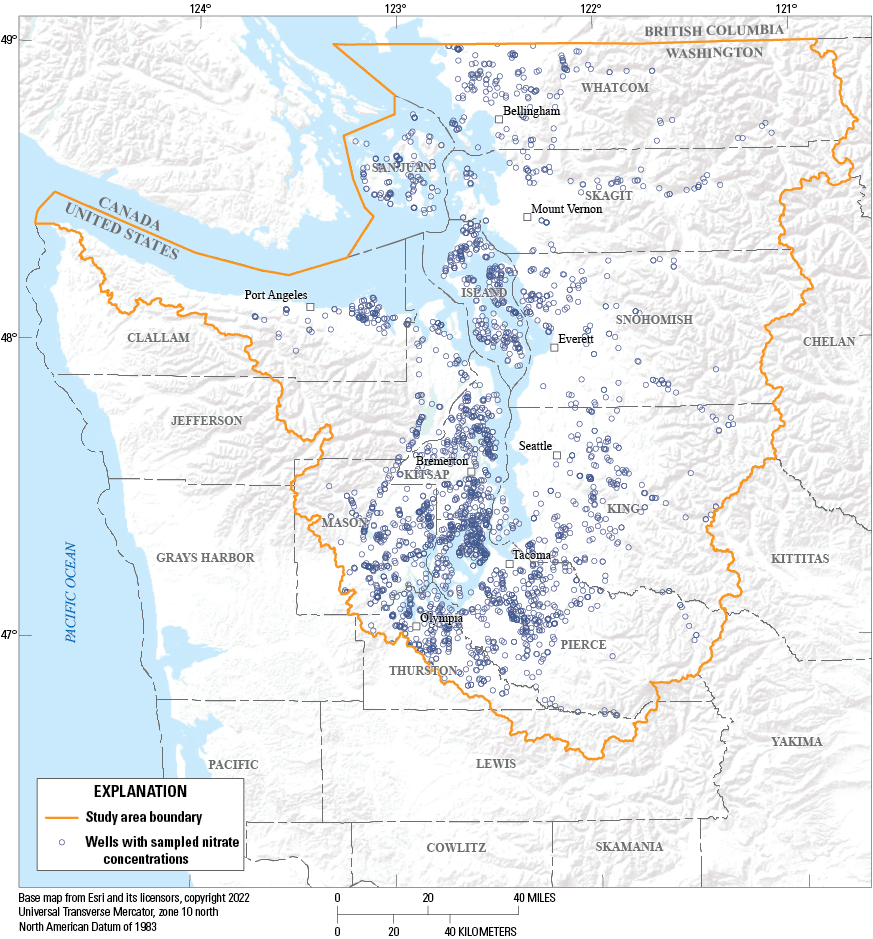
Location of large public water supply system (Group A) wells used to develop logistic regression vulnerability models, Puget Sound basin, Washington.
Compilation of Anthropogenic and Hydrogeologic Data into Explanatory Variables
For each well and time period with a binary response variable, a series of explanatory variables were identified or calculated and were similar to those used by Tesoriero and Voss (1997) and Frans (2000, 2008; table 1).
-
• Well depth was identified within the WDOH database for each well and was checked for consistency across all four time periods.
-
• Average annual precipitation for each well was calculated for each of the four time periods using data from the PRISM database at a 4-kilometer resolution (PRISM Climate Group, 2020).
-
• Average population density for each well was calculated as the median of the average population densities for each of the four time periods as obtained from the Washington State Office of Financial Management Small Area Estimate Program (Washington State Office of Financial management, 2020).
-
• Saturated hydraulic conductivity (Ksat) for each well was determined from a USGS developed data coverage derived from U.S. Department of Agriculture’s Soil Survey Geographic Database (SSURGO) variables (Wieczorek, 2014).
-
• Land cover for each well was determined for 500-, 1,000-, 2,000-, 3,000-, and 4,000-meter (m) buffers surrounding the well. The percentages of land-cover types within each of the specified buffers were calculated for each of the four time periods based on National Land Cover Database (NLCD) land coverages (Multi-Resolution Land Characteristics Consortium [MRLC], 2020). These buffer sizes were selected based on previous modeling efforts (Tesoriero and Voss, 1997; Frans, 2000, 2008). NLCD land cover data from 2001, 2006, 2011, and 2016 were used for time periods 2000–04, 2005–09, 2010–14, and 2015–19, respectively. Urban, agriculture, forest, and wetland cover types were evaluated. Urban land cover was composed of NLCD categories 21, 22, 23, and 24. Agriculture land cover was composed of NLCD categories 81 and 82. Forest land cover was composed of NLCD categories 41, 42, and 43. Wetland land cover was composed of NLCD categories 90 and 95. A stepwise logistic regression modeling approach was used to identify the most statistically significant explanatory land-cover type and buffer size for each of the four time period models.
-
• Average nitrogen fertilizer application amount in kilograms was obtained from county-level data contained within Gronberg and Spahr (2012). The most recent (2006) data were used. For buffers of 500, 1,000, 2,000, 3,000, and 4,000 m around each well, land cover was reclassified as either farm, non-farm, or water. The area within each of the buffers identified as farm was multiplied by the nitrogen fertilizer application rate for the county in which the well was located. A similar calculation was used for the non-farm area. These two values were added together to create the average nitrogen fertilizer application amount for each well within each of the potential buffer areas.
Table 1.
Sources of data used to develop logistic regression models, Puget Sound basin, Washington.| Variable | Source of data |
|---|---|
| Well depth (feet) | Washington State Department of Health Sentry Public Water Supply System Database, https://www.doh.wa.gov/DataandStatisticalReports/EnvironmentalHealth/DrinkingWaterSystemData/SentryInternet |
| Average annual precipitation at the well location (inches) | Spatial Climate Analysis Service, Oregon State University, PRISM Climate Group, United States Annual Total Precipitation, 2000–2018 (4 kilometers), https://prism.oregonstate.edu/ |
| Average population density at the well location (people/square kilometer) | Washington State Office of Financial Management, Forecasting and Research Division and U.S. Department of Commerce, U.S. Census Bureau, Geography Division, OFM 2000–2020 Small Area Estimates Program (SAEP) Population and Housing Estimates for 2010 Census Block Groups, https://ofm.wa.gov/washington-data-research/population-demographics/population-estimates/small-area-estimates-program |
| Saturated hydraulic conductivity (Ksat; centimeters/day) | Area- and Depth-Weighted Averages of Selected U.S. Department of Agriculture’s Soil Survey Geographic Database (SSURGO) Variables for the Conterminous United States and District of Columbia, https://water.usgs.gov/lookup/getspatial?ds866_ssurgo_variables |
| Land cover | National Land Cover Database (NLCD) Land Cover Conterminous United States, https://www.mrlc.gov |
| Average nitrogen fertilizer application |
County-Level Estimates of Nitrogen and Phosphorus from Commercial Fertilizer for the Conterminous United States, 1987–2006, https://doi.org/10.3133/sir20125207. |
The final datasets used for model development included the following information for each well and time period: binary nitrate concentration measure (0 for a mean nitrate concentration less than 2 mg/L for the time period or 1 for a mean nitrate concentration greater than or equal to 2 mg/L for the time period) and well depth, saturated hydraulic conductivity, average annual precipitation, average population density, average nitrogen fertilizer application, and multiple land-cover measures. Once the four model development/calibration datasets were created, 10 percent of the sites within each time period were randomly removed to create four validation datasets. The final data used within this analysis can be found at Wright, E.E. and others (2023).
Analytical Approaches for Evaluating Trends in Predicted Probabilities
In addition to logistic regression used to create the vulnerability models, additional graphical and statistical tools were used to further explore the predicted probabilities of exceeding 2 mg/L nitrate concentrations across two different potential well depths and across the four time periods to assess the validity of the models as well as the trends in the probabilities over time. For example, traditional linear regression approaches were used to further evaluate models as well as validate them. Nonparametric Kruskal-Wallis tests were used to test for significant differences between predicted probabilities by time periods, and quantile regression was used to look for trends in the predicted probabilities of exceeding 2 mg/L within different quantiles or percentiles of the prediction from the models. Quantile regression is similar to linear regression but is used most often when the assumptions required by traditional regression, such as homoscedasticity, independence or normality, are not met (Koenker and Hallock, 2001). Quantile regression analyses were performed with the “quantreg” routine within the R statistical package.
Logistic Regression Model Results
Using the stepwise logistic regression modeling procedures described in section, “Methods of Investigation,” separate models were developed to estimate the probability that groundwater would exceed 2 mg/L within each of the four specified time periods. The stepwise modeling procedure tested all possible combinations of the explanatory variables and, for each time period, the most significant model was selected based on the log-likelihood ratio, McFadden’s rho-squared, the p-values for each variable included in the models, and the prediction efficiency of each model. For each model, the correlations between explanatory variables were examined to ensure that no unacceptable multicollinearity existed, which is a required assumption associated with a statistically valid logistic regression model.
Statistically significant models were found for each time period (table 2). For all of the models, the McFadden’s rho-squared values were greater than or equal to (≥) 0.20. Rho-squared values tend to be smaller than R2 values often used to evaluate linear regression results, so values from 0.2 to 0.4 are generally interpreted to indicate good results (SPSS, Inc., 2000). Of additional value in evaluating the models are the highly significant p-values that were all less than (<) 0.0001, indicating that all of the included explanatory values were significant. Prediction efficiencies were also very high for each model, ranging from 88.1 to 90.1 percent.
Table 2.
Statistical results from models that estimate the probability of nitrate concentrations exceeding 2 milligrams per liter in groundwater in the Puget Sound basin, Washington, for the time periods 2000–04, 2005–09, 2010–14, and 2015–19.[<, less than]
The significant explanatory variables within each of the models were similar for all four time periods. For example, well depth and the percent of agricultural land cover within a 4,000-m buffer around a well were consistently highly significant in each model as shown by their very low p-values (table 3). For all models, one of the measures of urban land cover around the well (percent within either a 500- or a 1,000-m buffer) was significant. The consistent significance of well depth, percent agricultural land cover within 4,000 m of a well, and percent urban land cover within 500–1,000 m of a well across all four time-period models suggests that these explanatory variables have been consistent controlling factors of groundwater vulnerability to elevated nitrate concentrations over time. Saturated hydraulic conductivity was a significant explanatory variable in all except the 2005–09 model, whereas average annual precipitation was a significant explanatory variable only in that 2005–09 model. Together those results suggest that an explanatory variable that characterizes the ability of nitrates applied to the land surface to be transported through the soil to the wells is an important variable. The percent wetland within 500 m of a well and percent forest cover within 4,000 m of a well was significant in only one of the four time periods.
Table 3.
Regression coefficients and individual statistical probability values (p-values) of independent variable for the logistic regression models for each of the time periods that were significantly related with nitrate concentrations greater than 2 milligrams per liter in groundwater in the Puget Sound basin, Washington.[<, less than; NS, not significant]
In addition to the significance levels of the test statistics, the positive and negative signs of the model coefficients are also extremely insightful (table 3). For example, well depth coefficients were all negative, indicating that as depth increases, the probability of elevated nitrate concentration decreases. A reduced probability of elevated nitrate concentrations in groundwater is to be expected with increasing well depths and has been documented in previous modeling efforts (Tesoriero and Voss, 1997; Frans, 2000, 2008). The significant model coefficients for well depth are consistently negative across all time periods. While significant for all time periods, the well depth model coefficients are decreasing over time which may indicate a delayed response of deeper groundwater to nitrate application or changes in denitrification potentials in overlying soils (Tesoriero and others, 2013). The coefficients for the percent agricultural cover and the percent urban cover in the well buffers were consistently positive, indicating that increases in these land covers coincide with increased probabilities of elevated nitrate concentrations. Positive coefficients for the saturated hydraulic conductivity variable suggest that greater soil permeability coincides with greater probability of elevated nitrate concentrations. Finally, the few significant wetland and forest land cover explanatory variables had consistently negative coefficients, reflecting the likely lower loading of nutrients to these land covers as well as the expected increase in processing and uptake of nutrients in those land covers. The magnitudes of all coefficients were the same among models for all four time periods, suggesting that the influence of these explanatory variables on groundwater vulnerability has been consistent over time. In addition to the consistency of explanatory variables over time, the significant variables identified in this study were similar to those found in previous studies using a similar approach (Tesoriero and Voss, 1997; Frans, 2000, 2008).
Evaluation of Model Performance
To further evaluate the performance of the models presented in table 3, a series of comparisons between the measured and predicted probabilities of elevated nitrate concentrations for wells included in the model calibration datasets were performed using linear regression (fig 3). Wells from the model development datasets for each of the four time periods were sorted from low to high predicted probabilities of elevated nitrate concentrations as calculated using their reported well depths and the models presented in table 3. After sorting the data by predicted probabilities, wells were equally distributed between 10-percent quantiles of probability. A mean predicted probability was calculated for each decile and plotted against the observed probability for the decile (fig. 3). For all time-period models, the differences between measured and predicted probabilities of elevated nitrate concentrations were very small as indicated by the high adjusted R2 values and the close fit to the 1:1 line. The strongest relation was observed in the 2015–19 model, which had an R2 value of 0.99.
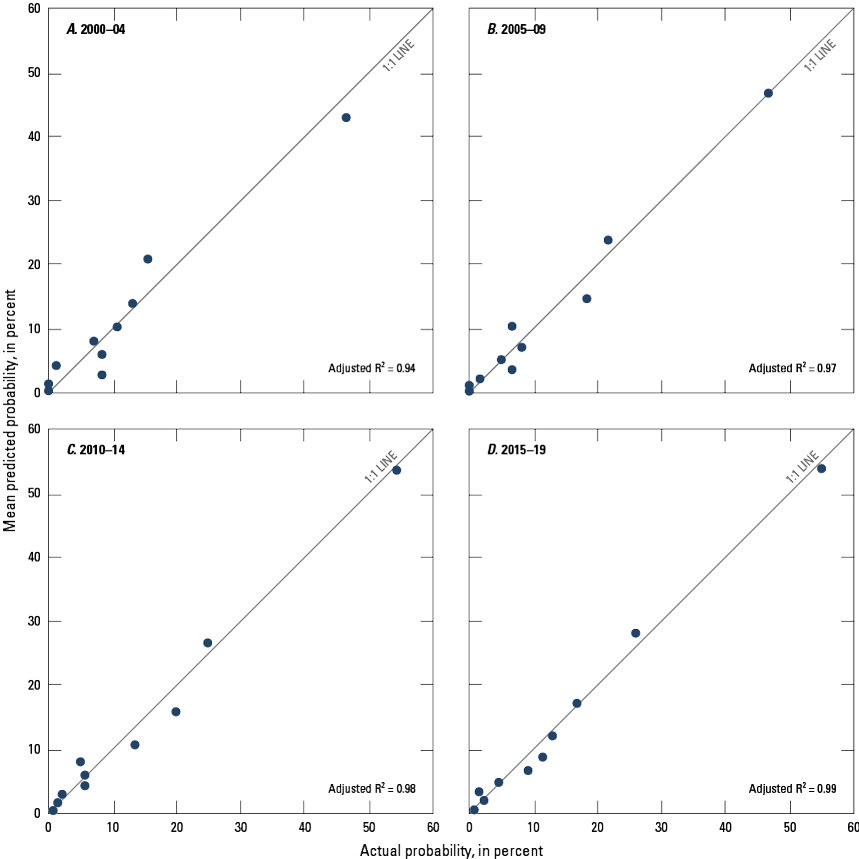
Actual probability of measured nitrate concentrations greater than 2 milligrams per liter (mg/L) compared to the mean predicted of nitrate concentrations greater than 2 mg/L in the calibration dataset for Puget Sound basin, Washington, during (A) 2000–04, (B) 2005–09, (C) 2010–14, and (D) 2015–19.
To validate the models for each of the four time periods, the predicted probabilities of elevated nitrate concentrations for wells in the validation datasets were computed and compared to the observed probabilities using the same approach as described for the model calibration datasets presented in figure 3. As with the calibration data, the differences between predicted and observed probabilities of elevated nitrate concentrations in the validation data were generally small (fig. 4). For example, predicted values averaged 0.6 and 1.7 percent less than observed probabilities for 2000–04 and 2015–19 validation data, respectively. For 2005–09 and 2010–14 data, predicted probabilities averaged 1.7 and 2.1 percent greater than observed values, respectively.
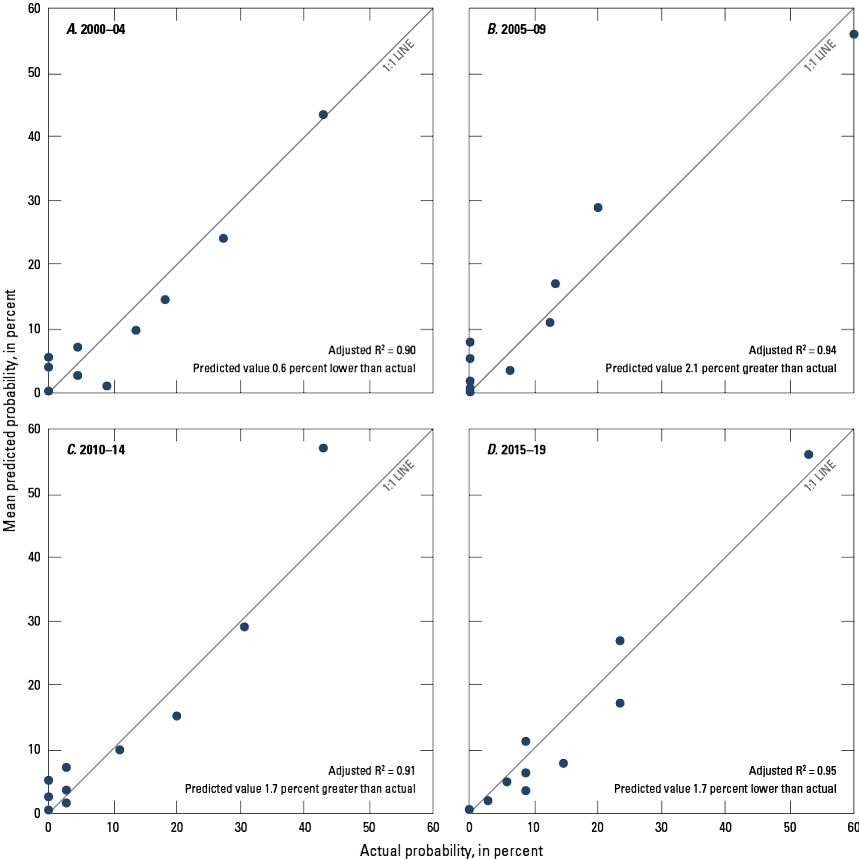
Probability of measured nitrate concentrations greater than 2 milligrams per liter (mg/L) compared to the mean predicted probability of nitrate concentrations greater than 2 mg/L in the validation dataset for Puget Sound basin, Washington, during (A) 2000–04, (B) 2005–09, (C) 2010–14, (D) and 2015–19. R2, coefficient of determination.
Probability of Elevated Nitrate Concentrations in Groundwater of the Puget Sound Basin
The logistic regression models presented in table 3 were used to create maps showing the probability of finding elevated nitrate concentrations in groundwater throughout the Puget Sound basin during each of the four time periods (figs. 5, 6). To generate the maps, a 500 × 500-m grid was constructed that covered the entire Puget Sound basin. A hypothetical well was assigned to the center of each grid cell resulting in 171,538 such wells within the basin. For each hypothetical well and each of the four time-periods, the significant explanatory variables included in each of the time specific models were calculated using GIS and other data and attributed to each hypothetical well. For each of the 171,538 hypothetical wells, the significant explanatory variables included in each of the time specific models was used to calculate the probability of finding elevated nitrate concentrations and assigned to the 500 × 500-m grid for the hypothetical well. It should be noted that explanatory variables used in each of the time-specific models were not constrained to the 500 × 500-m grid but were allowed to use GIS explanatory data as defined in each of the models (that is, percentage of agricultural land cover within 4,000 m of well). For some of the explanatory variables, data were not available for the entire area of interest; areas with missing data were typically located within the national parks, wilderness areas, and higher-elevation forested areas with limited groundwater resources. Selected other hypothetical well locations also had missing explanatory data, such as average annual precipitation. Probabilities of elevated nitrate concentrations were not estimated in those areas with missing data. Other smaller, dispersed areas were missing saturated hydraulic conductivity data, but spatial kriging methods within ArcInfo (Krivoruchko and Gribov, 2019) were used to extrapolate saturated hydraulic conductivity for those areas from nearby data.
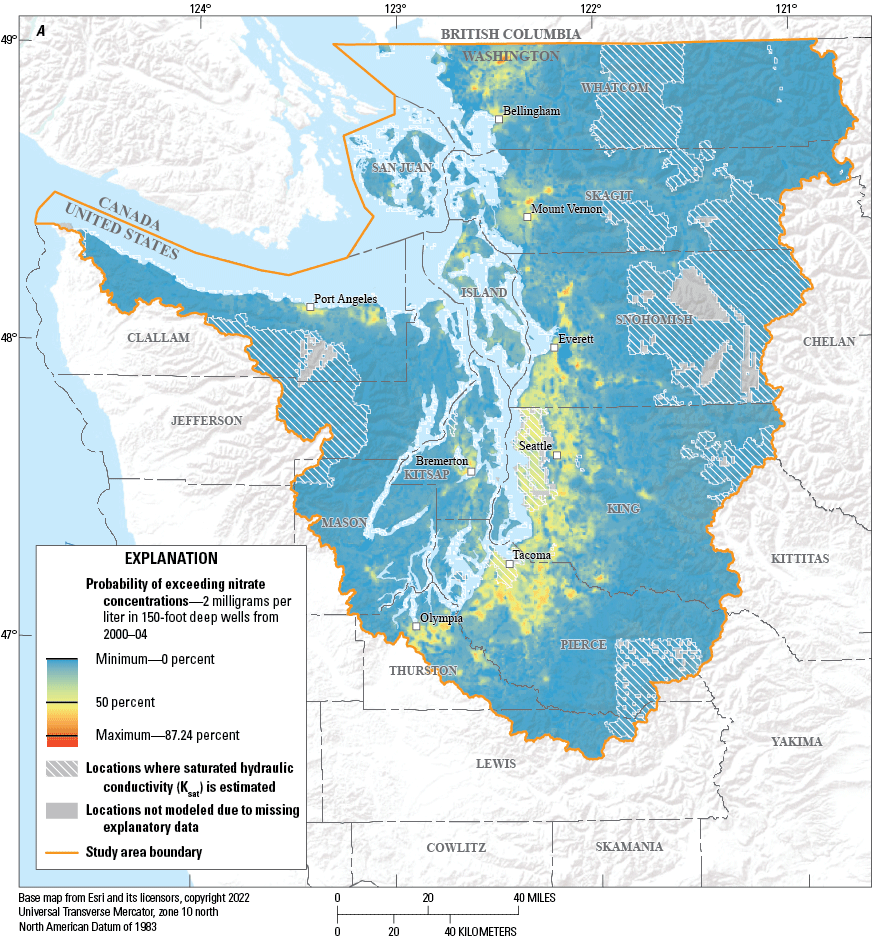
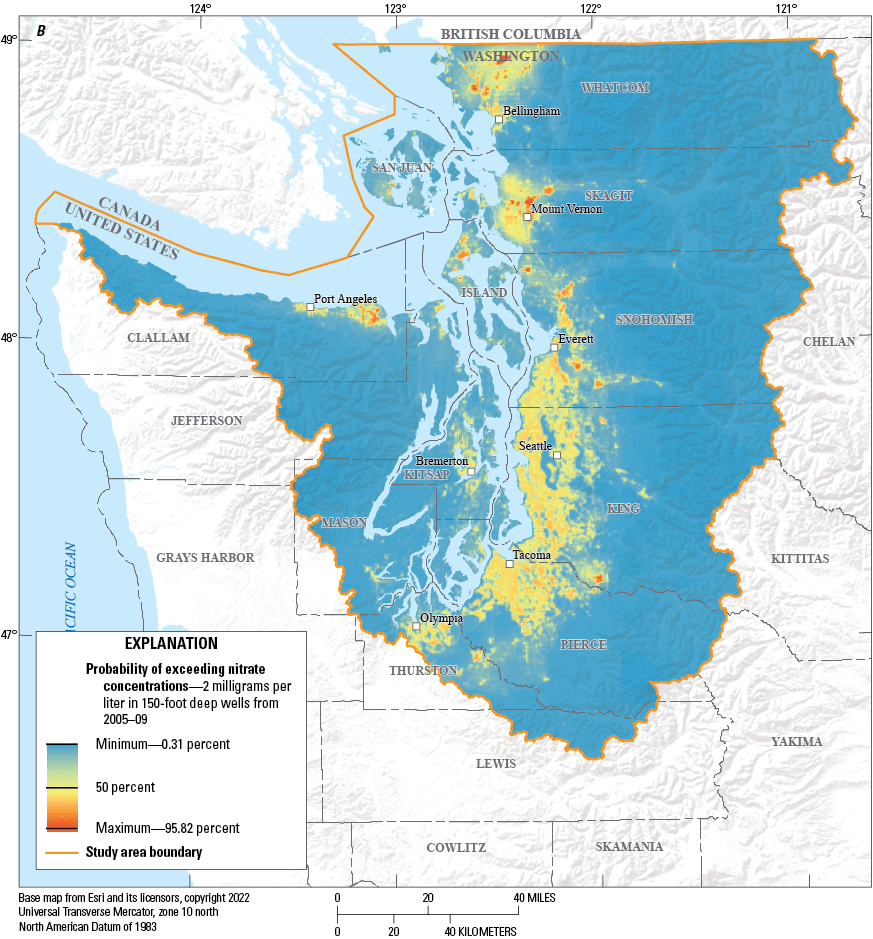

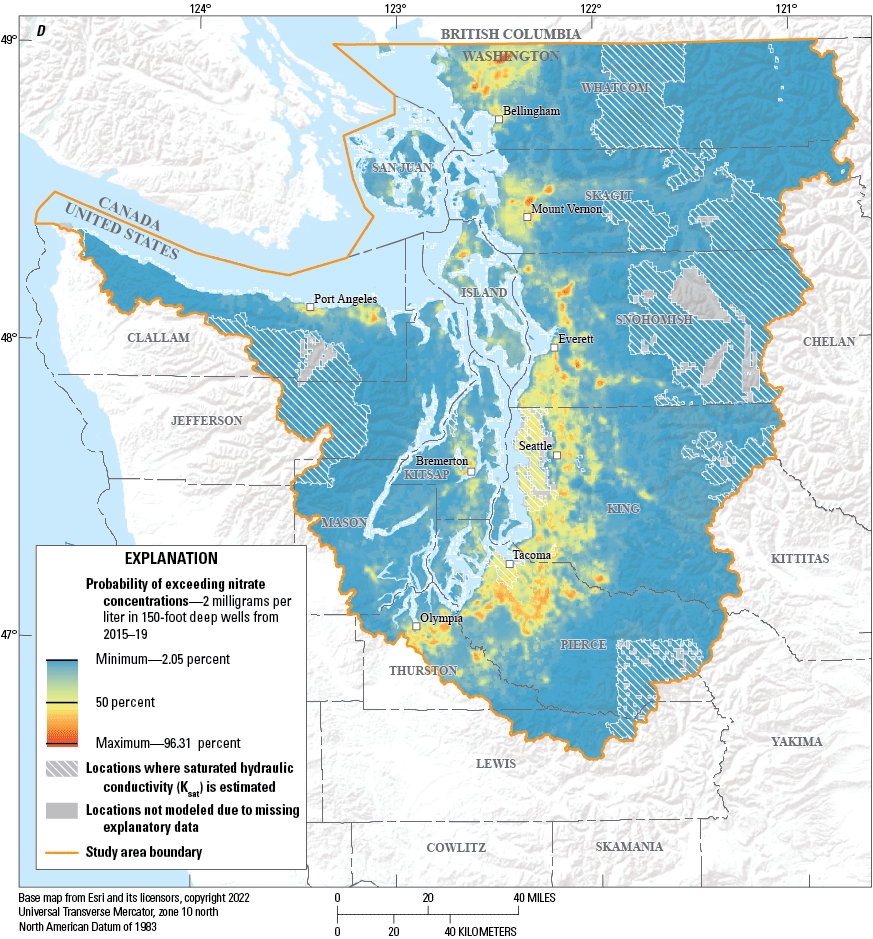
Probability of exceeding nitrate concentrations of 2 milligrams per liter in 150-foot-deep wells, in Puget Sound basin, Washington, during (A) 2000–04, (B) 2005–09, (C) 2010–14, (D) and 2015–19.
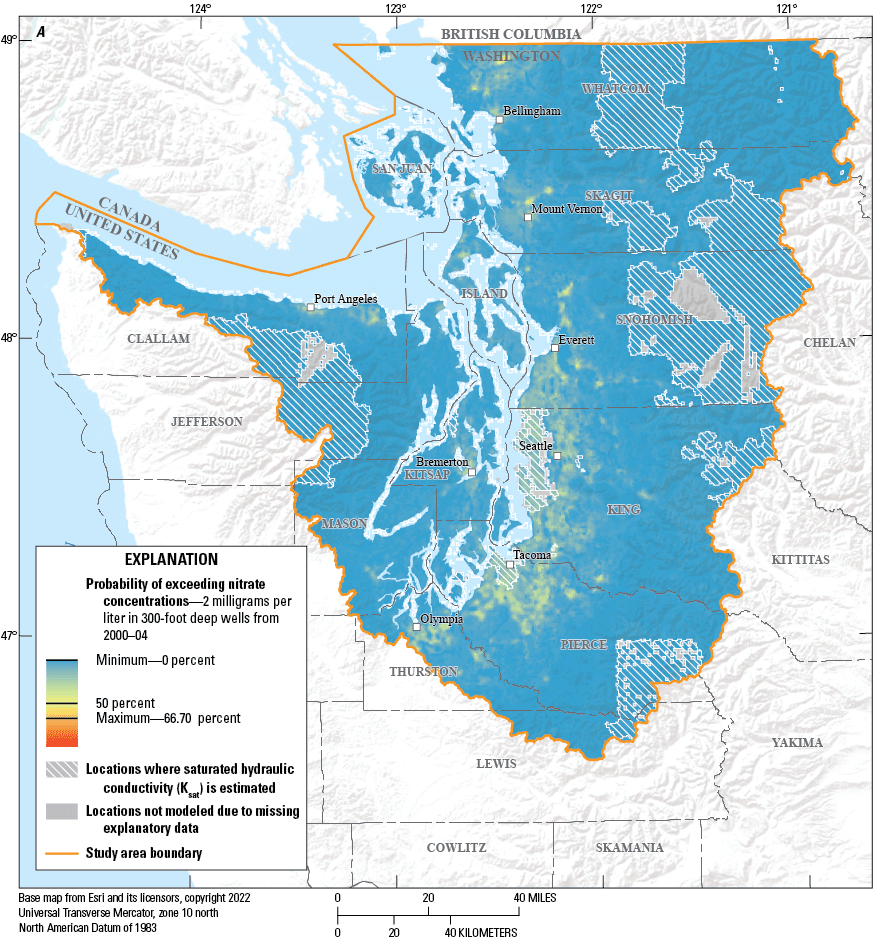
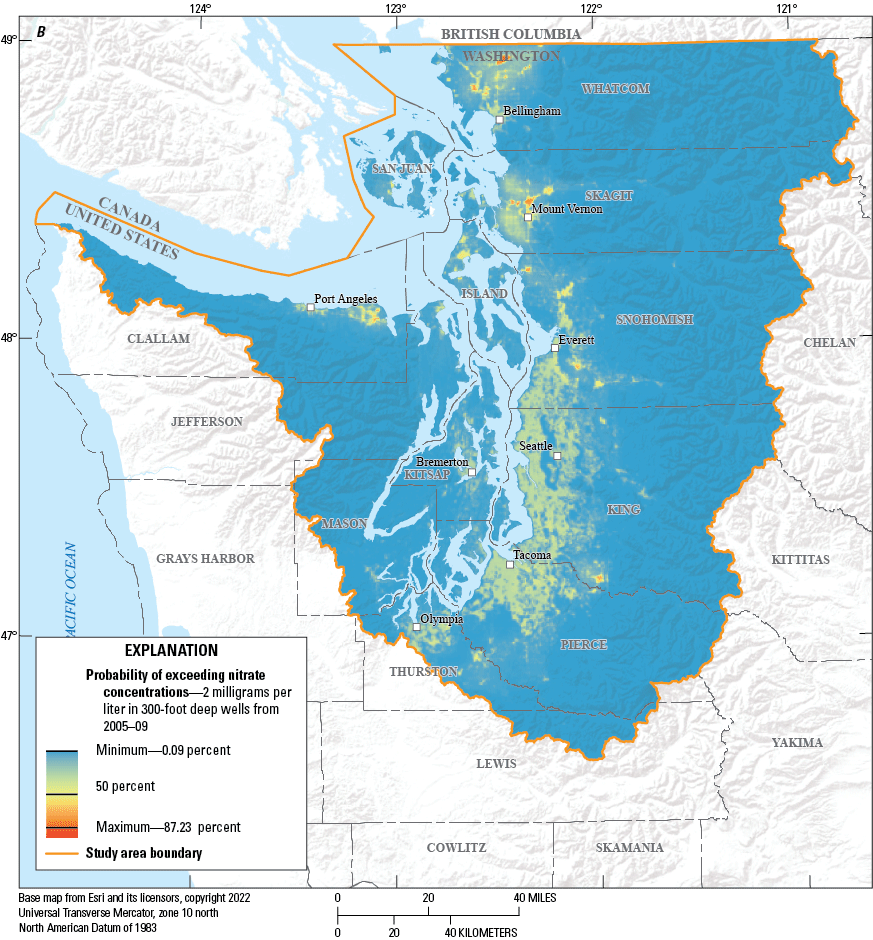
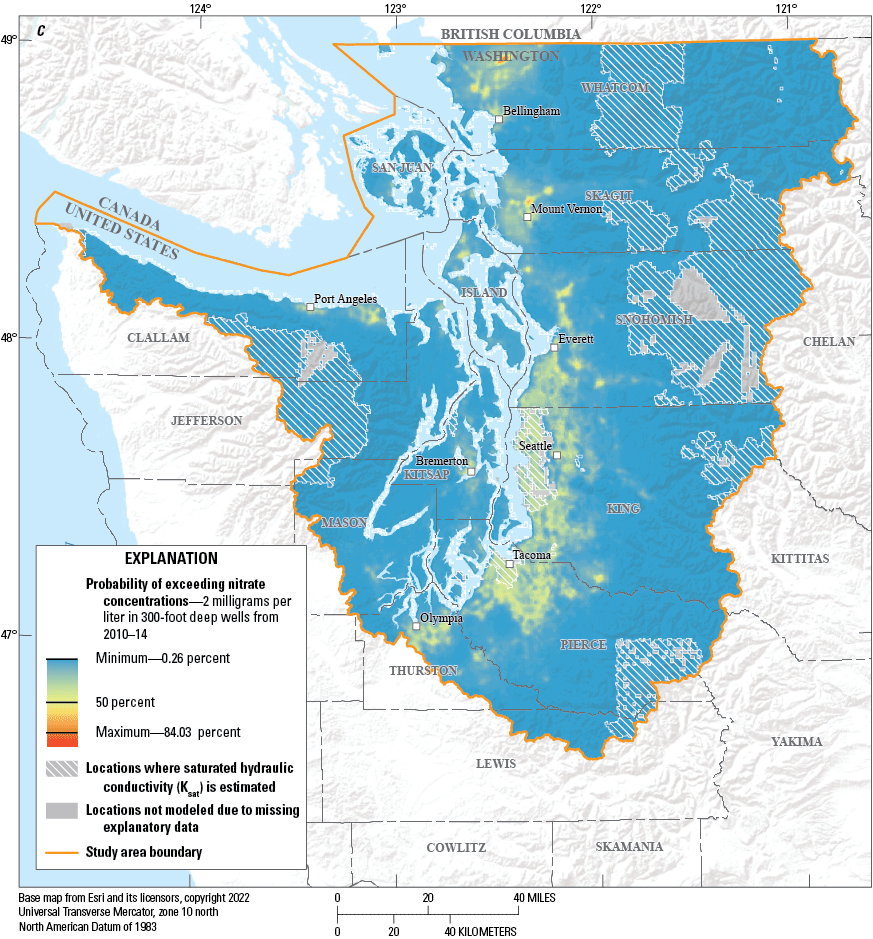
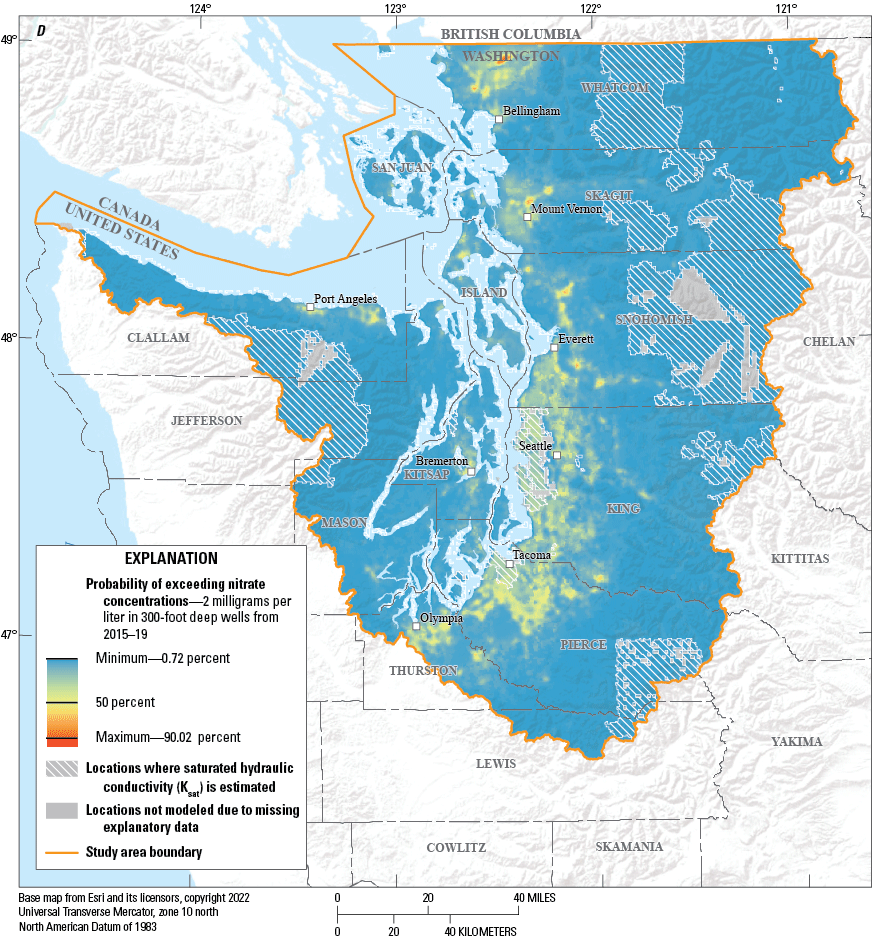
Probability of exceeding nitrate concentrations of 2 milligrams per liter in 300-foot-deep wells, in Puget Sound basin, Washington, during (A) 2000–04, (B) 2005–09, (C) 2010–14, (D) and 2015–19.
Maps of estimated probabilities of nitrate concentrations exceeding 2 mg/L generated from hypothetical wells located at 150 and 300 ft in each of the 171,538 grid cells were produced for well depths of 150 and 300 ft for each of the four time periods, resulting in the set of eight maps (figs. 5. 6). The data used to generate these maps can be found in Wright and others (2023). The selection of the 150- and 300-foot (ft) depth were selected based on previous work (Tesoriero and Voss, 1997; Frans, 2000, 2008) and were representative of the range of well depths in the datasets used to create the models. For both the 150- and 300-ft depths, the highest probabilities of elevated nitrate concentrations are most common in the areas of high urban and agricultural activity. Whereas the geographic areas with elevated probabilities of nitrate were similar for both depths, the probabilities were lower at the 300-ft depth. The highest probabilities of elevated nitrate concentrations beneath the urban and agricultural areas at the 150-ft depth ranged from 87 percent in 2000–04 to 96 percent in 2015–19. At 300 ft deep, the highest probabilities ranged from 67 percent in 2000–04 to 90 percent in 2015–19. Conversely, regions with little agriculture or urban land use had lower probability of elevated nitrate concentrations. These types of maps could be generated for any depth of interest, with probabilities of elevated nitrate concentrations expected to decrease with increasing well depth at any individual location.
Modeled probabilities of elevated nitrate concentrations at both the 150- and 300-ft depths were less than 10 percent for more than 75 percent of the modeled area of the Puget Sound basin across all time periods (fig. 7). However, there were several locations with relatively high probabilities and other locations with differences in probabilities among time periods. A nonparametric Kruskal-Wallis test was performed for both the 150- and 300-ft depths to compare differences between modeled probabilities for each of the four time periods. These tests found significant differences between time periods (table 4). At the 150-ft level, mean probabilities for the first three time periods were comparable, but probabilities for the 2015–19 period were higher. A similar result was found at the 300-ft level.
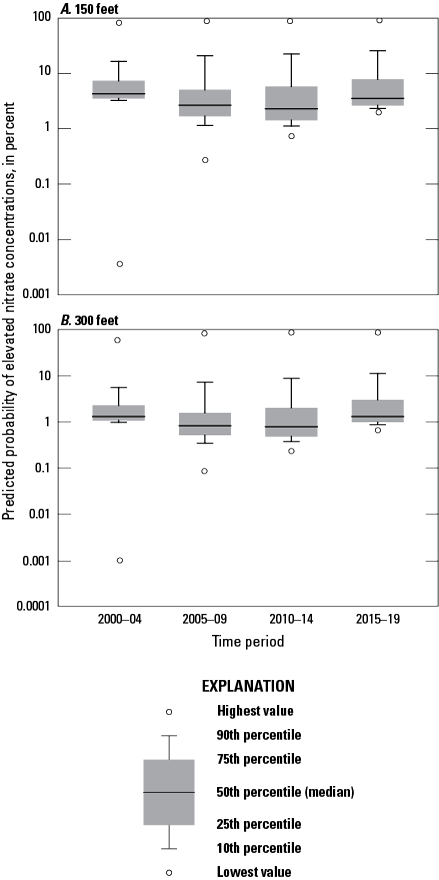
Distribution of predicted probabilities of elevated nitrate concentrations at the (A) 150- and (B) 300-foot depths throughout the Puget Sound basin, Washington, by time periods 2000–04, 2005–09, 2010–14, and 2015–19.
Table 4.
Mean probabilities of exceeding 2 milligrams per liter (mg/L) nitrate in hypothetical wells by depth and year categories and nonparametric significance test results examining differences, by depth, in Puget Sound basin, Washington, between time periods 2000–04, 2005–09, 2010–14, and 2015–19.Although most modeled probabilities were less than 50 percent, values greater than this level may be of greater interest to water purveyors, regulators, and land managers. Figure 8 summarizes the subset of modeled probabilities that are equal to or greater than 50 percent for each time period at the 150- and 300-ft depths. The probabilities of elevated nitrate concentrations were less than 70 percent for more than 75 percent of this subset of samples for every time period at both the 150- and 300-ft depths. Similar to the nonparametric Kruskal-Wallis test done on all of the modeled results, mean values for the subset of probabilities equal to or greater than 50 percent were significantly different with time at both well depths (table 5). Unlike the mean probabilities for all of the modeled results, mean values for this subset of probabilities for the most recent three time periods were similar, and the mean value for the 2000–04 time period was lower at both the 150- and 300-ft depths. It is important to restate that these results are for a small subset of wells with precited probabilities equal to or greater than 50 percent and do not represent results of the Puget Sound basin as a whole, but rather select locations that may be of greater interest to water purveyors, regulators, and land managers.
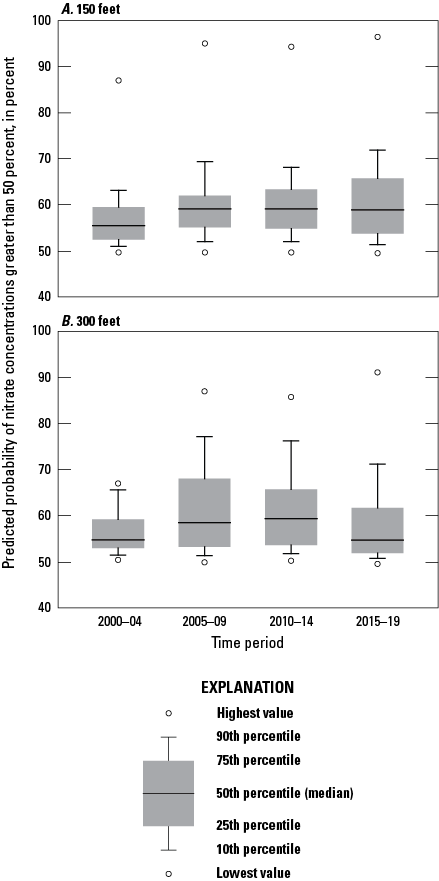
For the subset of predicted probabilities of elevated nitrate concentrations that are greater than 50 percent, distributions of predicted probabilities at the (A) 150- and (B) 300-foot depths throughout the Puget Sound basin, Washington, by time periods 2000–04, 2005–09, 2010–14, and 2015–19.
Table 5.
For the subset of probabilities of hypothetical wells exceeding 2 milligrams per liter (mg/L) nitrate that are greater than 50 percent, mean probability by depth and year categories and nonparametric significance tests results examining difference, by depth, in Puget Sound basin, Washington, between year categories 2000–04, 2005–09, 2010–14, and 2015–19.Temporal Changes in the Probability of Elevated Nitrate Concentrations
Comparing modeled probabilities across the time periods, particularly probabilities greater than 50 percent, provides insight into changes (trends) in groundwater vulnerability at the scale of the Puget Sound basin, although it does not provide insight into changes at specific locations. To examine changes more explicitly in the probability of elevated nitrate concentrations at specific locations over time, a series of change maps was generated (figs. 9, 10). To create these maps, each hypothetical well location with a predicted probability of elevated nitrate concentrations equal to or greater than 50 percent was identified for each model time period, and the modeled probability at that location was compared across adjacent time periods. For all the pairwise comparisons, the probability of elevated nitrate concentrations had to be at least 50 percent or greater for at least one of the two time periods. These comparisons were done separately for wells at the 150- and 300-ft depths. The change maps generated for 150-ft-deep wells (fig. 9) showed inconsistent changes over time. For example, the changes from 2000–04 to 2005–09 were mostly increased probabilities of elevated nitrate concentrations (fig. 9A), changes from 2005–09 to 2010–14 were mostly decreased probabilities (fig. 9B), and changes from 2010–14 to 2015–19 included a more even mixture of increased and decreased probabilities (fig. 9C). In contrast, at the 300-ft depth, probabilities of elevated nitrate concentrations generally increased between all the time periods (fig. 10A-C). The difference in responses between the 150- and 300-ft wells suggests that the probability of elevated nitrate concentrations in shallower wells is more dynamic than it is in deeper wells. The reduced fluctuation of nitrate concentration in the deeper wells is likely given increased mixing, dispersion, denitrification, and (or) other processes. The general increase in the probability of detecting elevated nitrates at the 300-ft depths over time suggests that the deeper wells are receiving a consistently greater fraction of groundwater affected by anthropogenic nitrate loads and suggests that a time delayed front of anthropogenically impacted waters are migrating to the 300-ft depths across a broad area. Previous studies have seen similar processes occur (Levy and others, 2021).
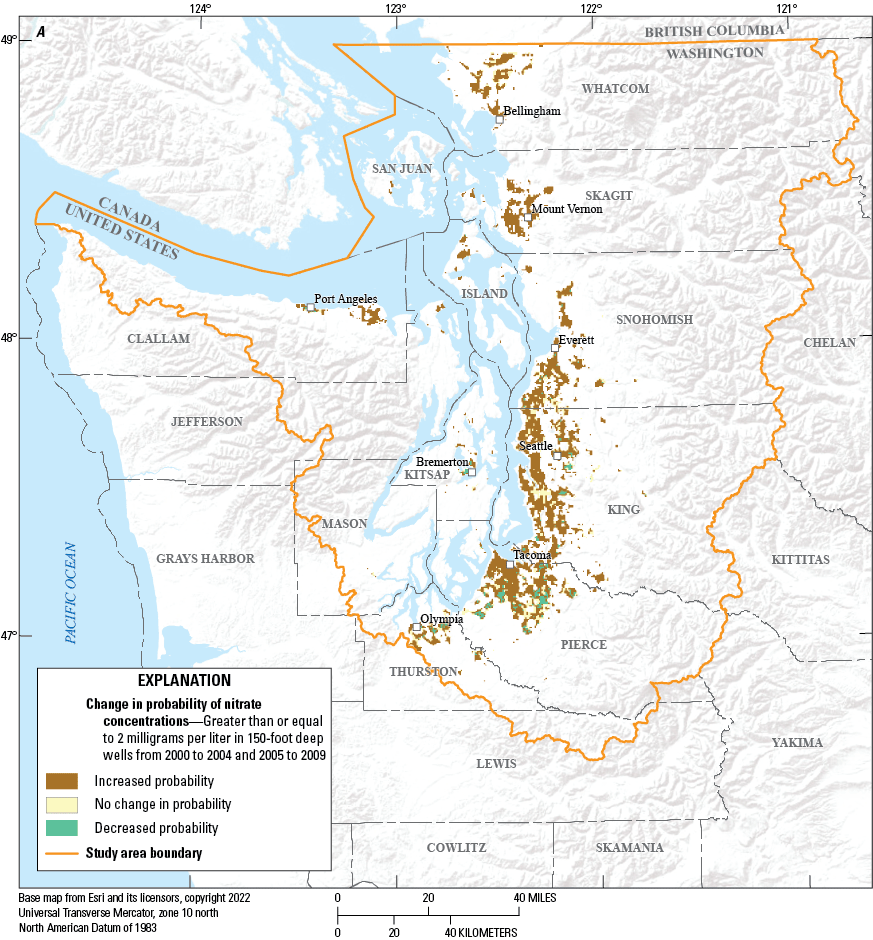
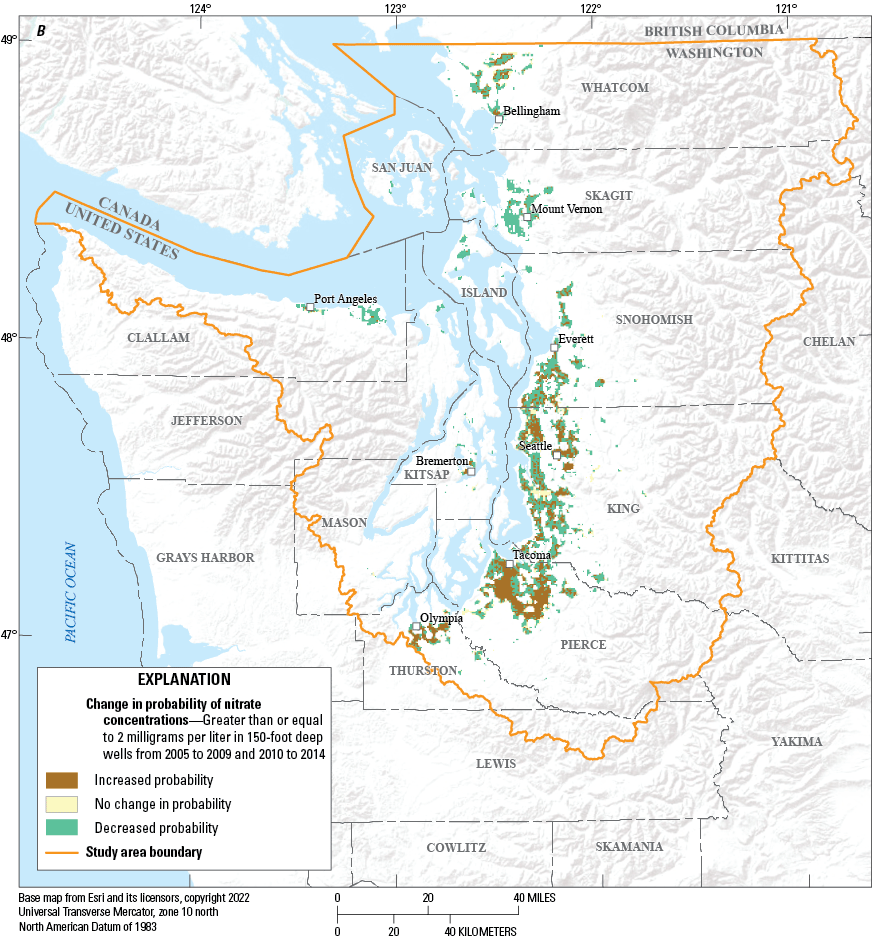
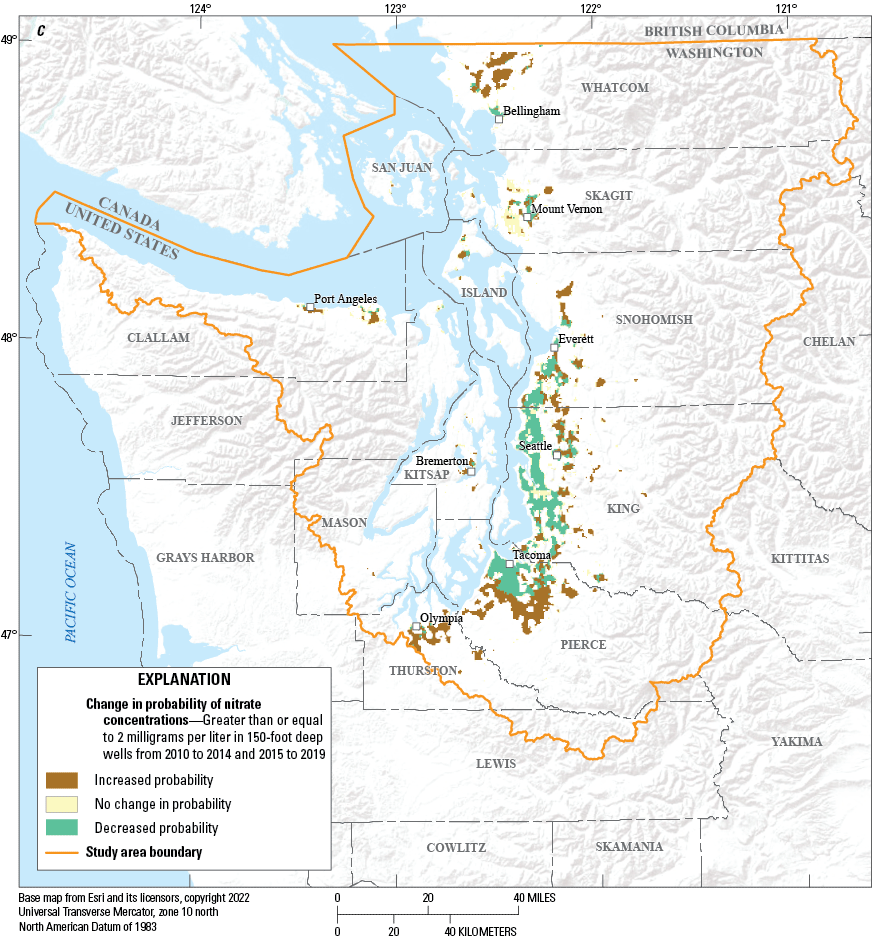
Direction of change in the probability of exceeding 2 milligrams per liter of nitrate for those 150-foot-deep wells, in Puget Sound basin, Washington, with a probability greater than or equal to 50 percent for at least one of the two time periods from (A) 2000–04 to 2005–09, (B) 2005–09 to 2010–14, and (C) 2010–14 to 2015–19.
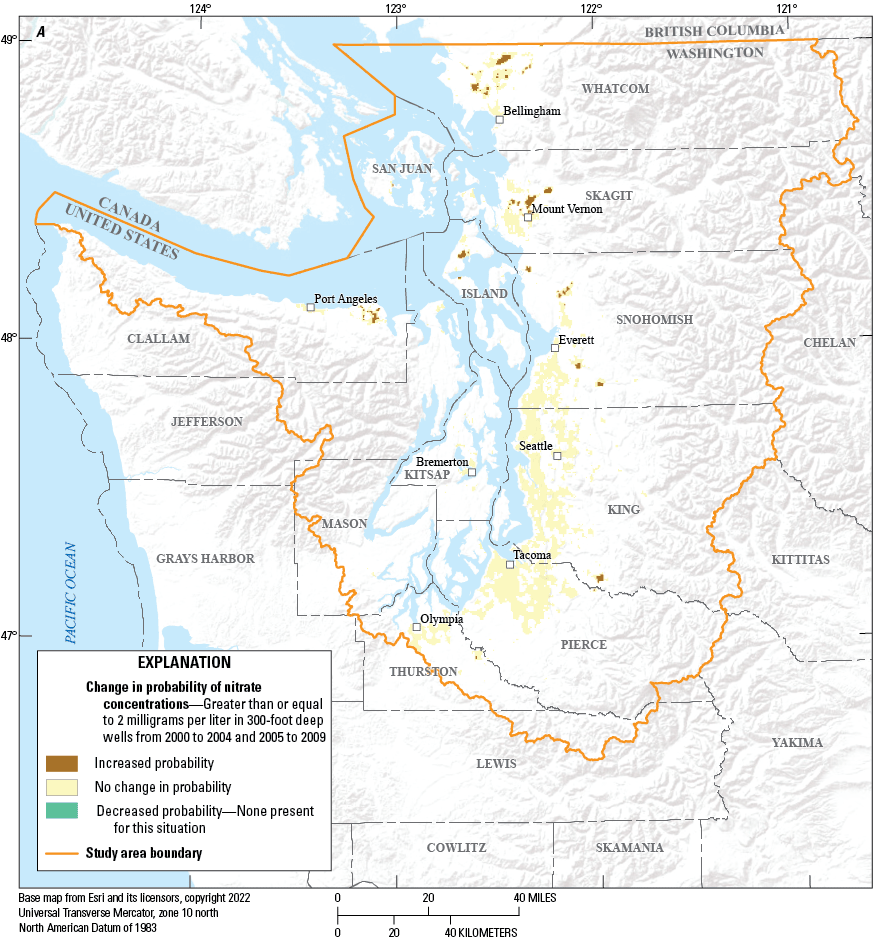
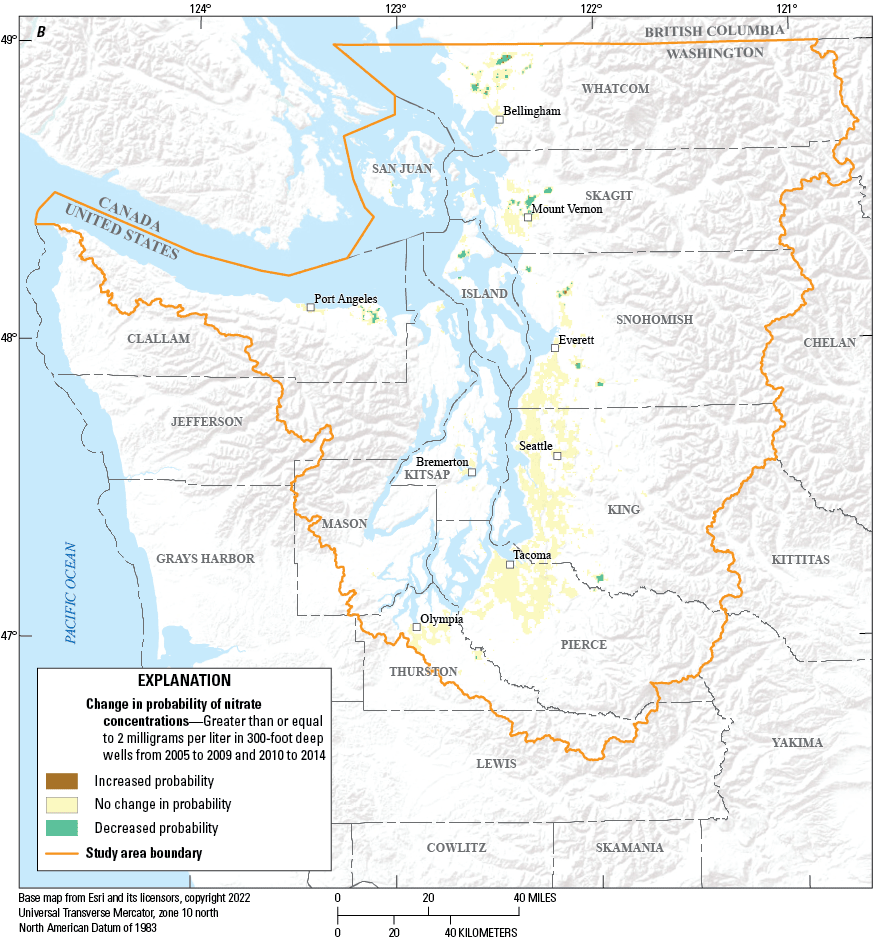
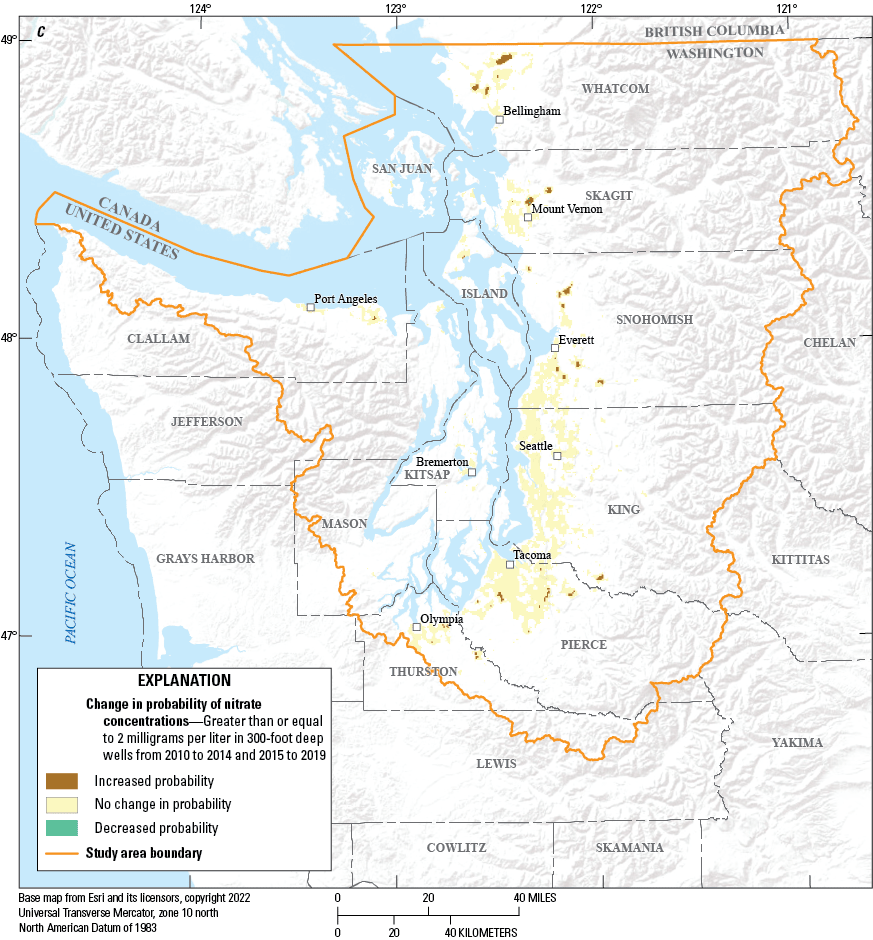
Direction of change in the probability of exceeding 2 milligrams per liter of nitrate for those 300-foot-deep wells, in Puget Sound basin, Washington, with a probability greater than or equal to 50 percent for at least one of the two time periods from (A) 2000–04 to 2005–09, (B) 2005–09 to 2010–14, and (C) 2010–14 to 2015–19.
Although the boxplots in figures 7 and 8 show course temporal changes in the modeled probabilities across the four time periods, they represent the distributions of probabilities across very large and relatively noisy datasets. To examine temporal trends in the data in greater detail, predicted probabilities within each time period at 150- and 300-ft depths were sorted from low to high and assigned to one of ten quantiles, each quantile with 10 percent of the values. The distributions of predicted probabilities within each of those ten quantiles were plotted for each of the four time periods for 150-ft and 300-ft-deep wells. The distribution patterns for 150-ft wells in quantiles 1–6 (figs. 11, 12) show low probabilities of elevated nitrate concentrations, generally less than 5 percent. These distributions for quantiles 1–6 were consistent across time periods in that median probabilities within the 2000–04 and 2015–19 time periods were higher than median probabilities in the intervening 2005–09 and 2010–14 periods. The distribution patterns for 150-ft wells in quantiles 7–10 showed increasingly higher probabilities of elevated nitrate concentrations, with probabilities that generally exceeded 20 percent in the uppermost 10th quantile (fig. 12). Compared with patterns for the lower quantiles, the differences in distributions shifted across the time periods in the higher quantiles, particularly in the 9th and 10th quantiles, where median probabilities for the 2000–04 time period were the lowest and gradually increased in the subsequent time periods. Very similar patterns were found in the predicted probabilities for the hypothetical 300-ft-deep wells (figs. 13, 14).
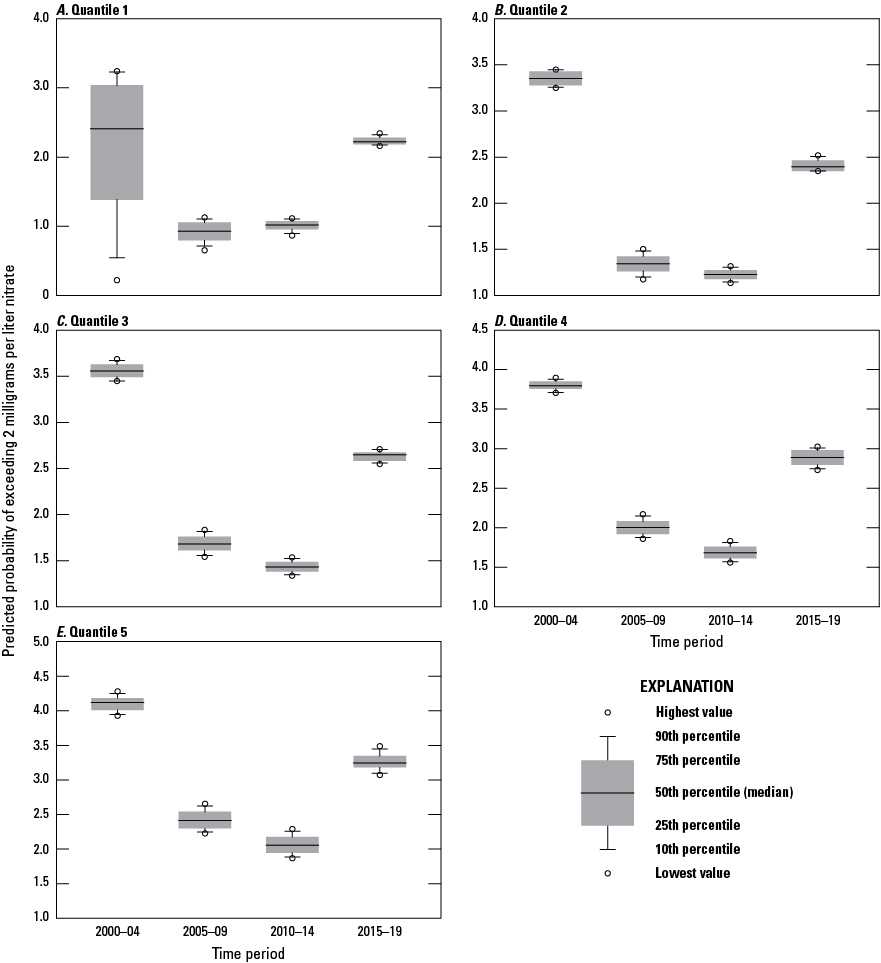
Distributions of predicted probabilities of exceeding nitrate concentrations of 2 milligrams per liter for quantiles 1–5 by year for 150-foot-deep wells (A–E), in Puget Sound basin, Washington, during 2000–04, 2005–09, 2010–14, and 2015–19.
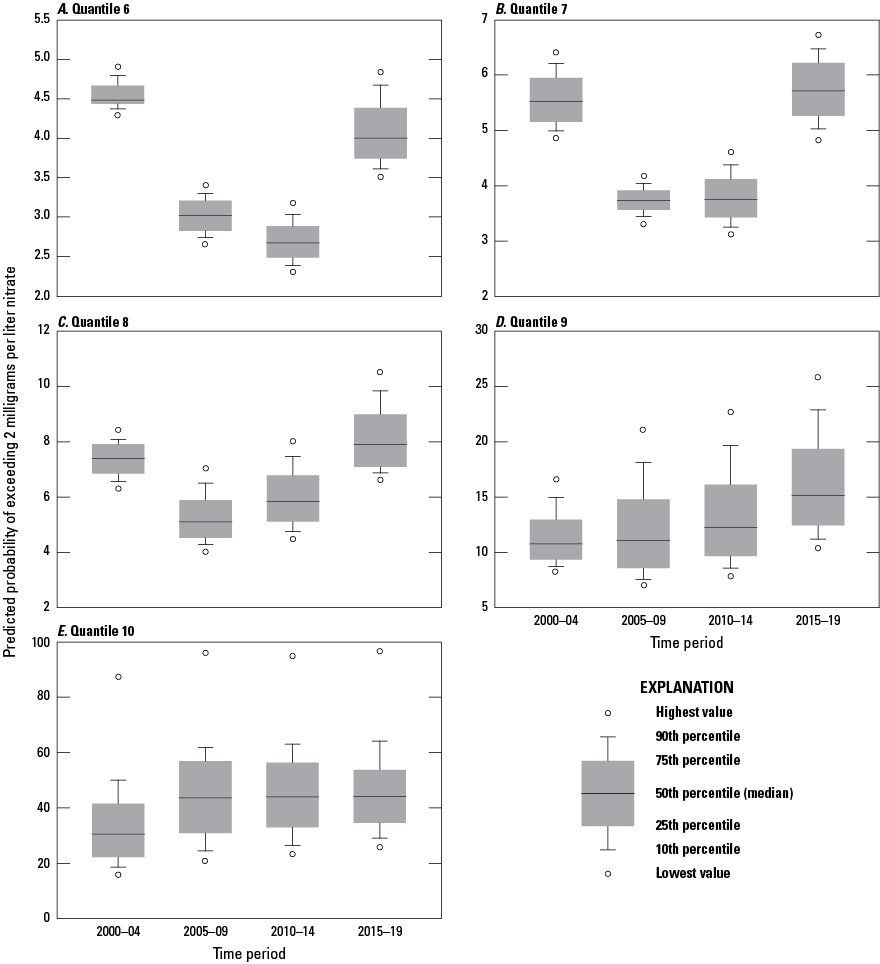
Distributions of predicted probabilities of exceeding nitrate concentrations of 2 milligrams per liter for quantiles 6–10 by year for 150-foot-deep wells (A–E), in Puget Sound basin, Washington, during 2000–04, 2005–09, 2010–14, and 2015–19.
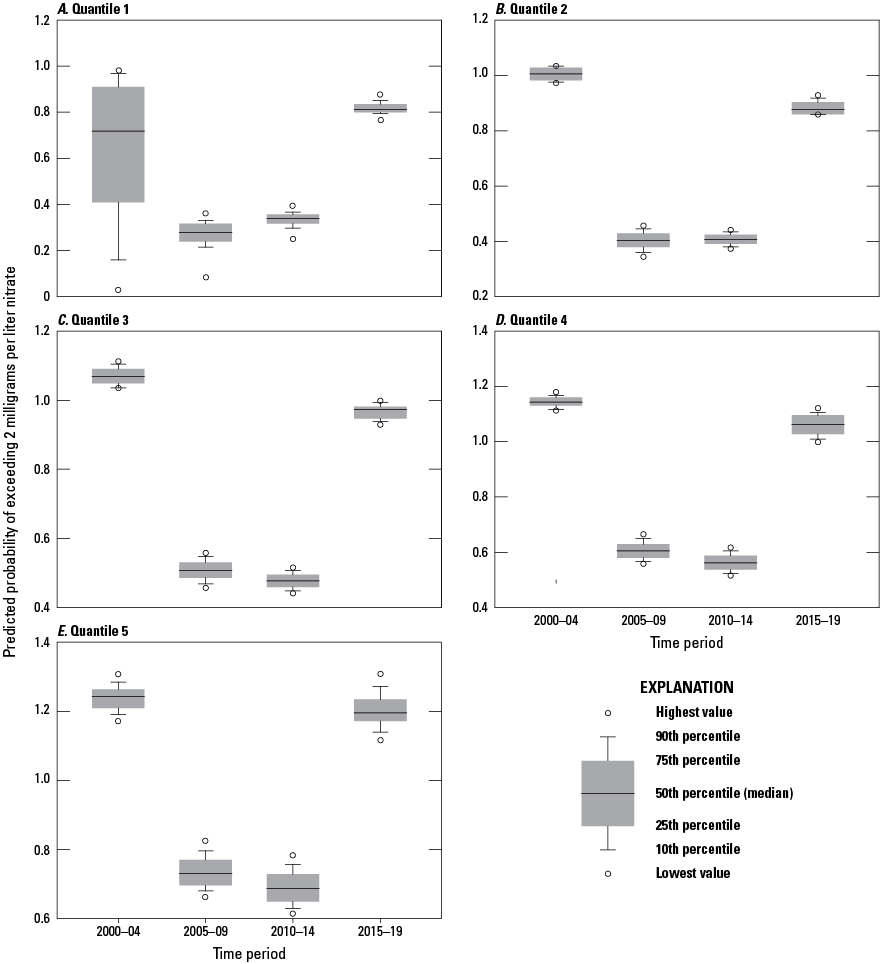
Distributions of predicted probabilities of exceeding nitrate concentrations of 2 milligrams per liter for quantiles 1–5 by year for 300-foot-deep wells (A–E), in Puget Sound basin, Washington, during 2000–04, 2005–09, 2010–14, and 2015–19.
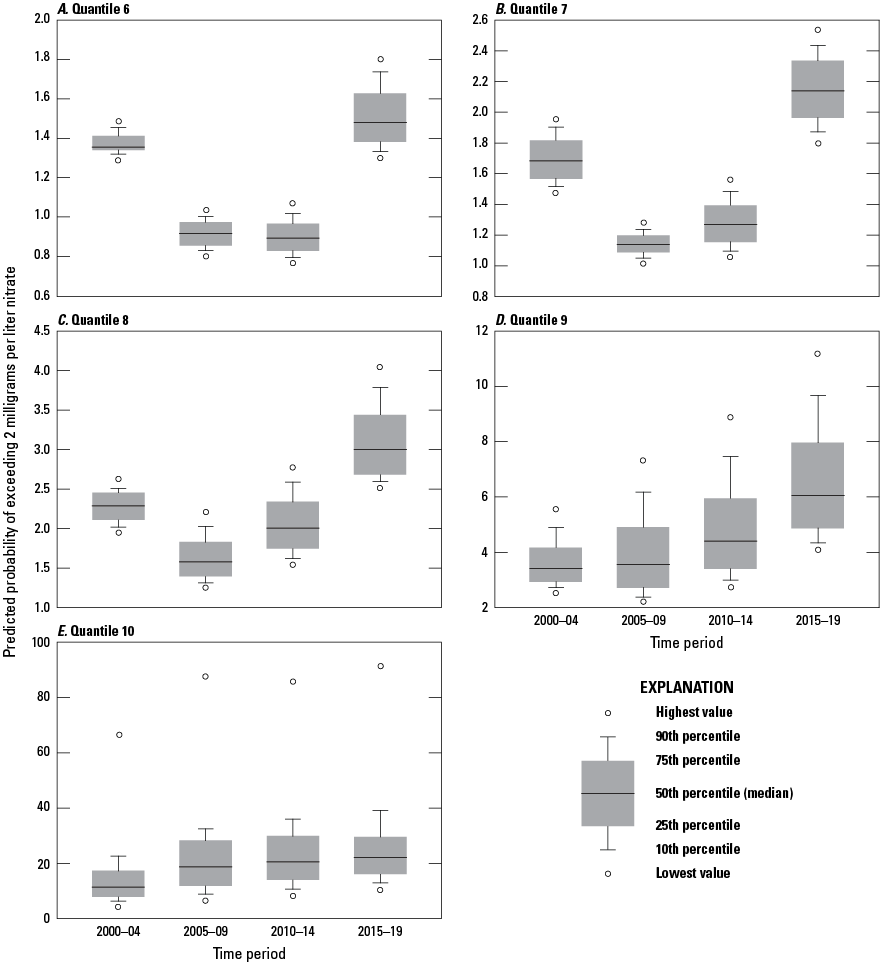
Distributions of predicted probabilities of exceeding nitrate concentrations of 2 milligrams per liter for quantiles 6 through 10 by year for 300-foot-deep wells (A–E), in Puget Sound basin, Washington, during 2000–04, 2005–09, 2010–14, and 2015–19.
The patterns observed in figures 11 and 12 indicate that, at both the 150- and 300-ft well depths, changes in the probabilities of finding elevated nitrate concentrations in groundwater over the past two decades have been inconsistent across time periods and across ranges of predicted probability. This analysis shows that the highest probabilities of finding elevated nitrate concentrations seem to have generally increased over the four time periods, whereas the more moderate probabilities (represented by the 4th–6th quantiles in figures 11 and 12) seem to have generally decreased over at least the first three same time periods. The highest probabilities for finding elevated nitrate concentrations on these quantile plots are nearly all less than 10 percent for the first 8 quantiles, and less than 25 percent for the 9th quantile, further indicating how much of the Puget Sound basin area has relatively low predicted probabilities of elevated nitrate concentrations. Only in the 10th quantile do probabilities become consistently greater than greater than 25 percent, which may be the probabilities of most interest to water-quality managers.
An additional quantitative method to examine these temporal trends across the range of predicted probabilities is with quantile regression, as described in section, “Analytical Approaches for Evaluating Trends in Predicted Probabilities.” Although quantile regression has many similarities to traditional regression, it does not have the same restrictive assumption regarding uniform variation and thus allows one to examine relationships between variables outside the mean of the data. For this analysis, the independent variables were the four time periods, and the dependent variable was the predicted probability of elevated nitrate concentrations in 150- and 300-ft-deep wells. Quantile regressions were examined for the lower 5th quantile through the 95th quantile of probabilities by 5 percent increments. A simple way of thinking about this analysis is that a correlation line between the independent variable (time period) and the dependent variable (probability of elevated nitrate concentrations) is calculated for each of the 19 defined quantiles. Like simple linear regression, intercept and slope coefficients are generated. For this analysis, the slope coefficient is of most interest because it indicates of the rate of change in the probabilities of elevated nitrate concentrations over time for various ranges of the predicted probabilities.
The slope coefficients for these analyses (table 6) for all 19 quantiles for 150- and 300-ft-deep wells were all statistically significant at the p <0.0001 level. A positive slope value indicates an increasing trend in the probability of elevated nitrate concentrations over the four time periods, whereas a negative slope indicates a decreasing trend. For both well depths, the largest increasing trends (largest positive slope values) were found in the highest quantiles, which are associated with the highest predicted probabilities for elevated nitrate concentrations. These results indicate that the higher probabilities of elevated nitrate concentrations (quantiles 70–95 percent) have been increasing from 2000 to 2019. Such increases in nitrates for those wells with high probabilities may be due to continued anthropogenic sources of nitrates in the modeled areas around the wells and (or) a lag in the delivery of excess nitrate to these wells. When presented graphically (fig. 15), the increase in slope values is obvious. These analyses indicated that over the time periods examined, the abundance of wells with moderate probabilities of elevated nitrate concentrations (about 30–60 percent) has declined, whereas the abundance of wells with higher probabilities (greater than [>] 70 percent) has increased. Although the abundance of hypothetical wells with high probabilities of elevated nitrate concentrations seems to have increased over time, most of the hypothetical wells (30–60 percent quantiles) have small decreases in probabilities of elevated nitrate concentrations.
Table 6.
Slope coefficients from quantile regression analyses for predicted probabilities of nitrate concentrations exceeding 2 milligrams per liter at 150- and 300-foot hypothetical wells across four time periods from 2000 to 2019.[Each slope coefficient was significant at the p= <0.00001 level. <, less than; %, percent]

Quantile regression slope estimates by quantile for 150- and 300-foot-deep wells. Slope coefficients were estimated from the quantile regression of the probability of exceeding nitrate concentrations of 2 milligrams per liter across four time periods from 2000 to 2019. A positive slope value indicates an increasing trend in the probability of elevated nitrate concentrations over the four time periods, whereas a negative slope indicates a decreasing trend.
Summary
To help develop a Drinking Water Vital Sign for the Puget Sound Partnership, existing data from large public water supply system (Group A) wells contained within the Washington State Department of Health (WDOH) Sentry database were used to create temporal groundwater vulnerability models and maps to spatially and temporally characterize the vulnerability of groundwater to elevated nitrate concentrations, defined as exceeding 2 milligrams per liter (mg/L). Statistically significant logistic regression models were created for four time periods: 2000–04, 2005–09, 2010–14 and 2015–19. In addition to the nitrate concentrations and well depth information for the Group A wells contained within the Sentry database, publicly available land cover, soil characteristics, and precipitation data were also used in the statistical model development.
The significant explanatory variables within each of the models were similar for all four time periods. For example, well depth and the percent of agricultural land cover within a 4,000-meter buffer around a well were consistently highly significant in each model. For all models, one of the measures of urban land cover around the well was significant. The consistent significance of well depth and percent agricultural and urban land cover around the well across all four time-period models suggests that these explanatory variables have been consistent controlling factors of groundwater vulnerability over time. Saturated hydraulic conductivity was also a significant explanatory variable in all except the 2005–09 model, whereas average annual precipitation was a significant explanatory variable only in that 2005–09 model. Together these results suggest that an explanatory variable that characterizes the ability of nitrates applied to the land surface to be transported through the soil to the wells or a dilution effect are important predictors of groundwater vulnerability to nitrates. The positive or negative signs of the model coefficients for each of the statistically significant variables in the models were appropriate and easily explained by our mechanistic understanding of hydrologic principles. For example, well depth coefficients were all negative, indicating that as depth increases, the probability of elevated nitrate concentration decreases. A significant negative coefficient for average annual precipitation in the 2005–09 model suggests that increasing mean annual precipitation during this time reduced the probability of finding elevated nitrate in a well perhaps due to dilution or a flushing effect that removed anthropogenic sources of nitrate from the area around a well. Future modeling efforts may want to consider adding an explanatory variable that measures the intensity and timing of precipitation to better reflect the mechanisms by which precipitation might recuse or enhance the probability of elevated nitrates in a well. In addition to appropriate and explainable signs for each of the model parameter estimates, the magnitudes of all coefficients were all similar, suggesting that the influence of these explanatory variables on groundwater vulnerability has been consistent over time.
Applying the logistic regression vulnerability models developed for each time period to hypothetical wells of 150- and 300-feet (ft) depth throughout the Puget Sound generated vulnerability maps that produced the highest probabilities of elevated nitrate concentrations in aquifers in the areas of high urban and (or) agricultural activity. Although geographic locations of elevated probabilities of nitrate concentrations were consistent at both the 150- and 300-ft depths, the probabilities were lower at the 300-ft depths. Regions with little agriculture or urban land use had lower probabilities of elevated nitrate concentrations. Modeled probabilities of elevated nitrate concentrations at both the 150- and 300-ft depths were less than 10 percent for more than 75 percent of the modeled area of the Puget Sound basin across all time periods. However, there were several locations with relatively high probabilities and differences in probabilities between time periods.
Although most modeled probabilities throughout the Puget Sound basin were less than 50 percent, values greater than this level may be of greater interest to water purveyors, regulators, and land managers. Comparing modeled probabilities across the time periods, particularly probabilities greater than 50 percent, provides insight into changes (trends) in groundwater vulnerability at the scale of the Puget Sound basin. To examine changes in the probability of elevated nitrate concentration at specific locations over time, a series of change maps was generated. The change maps generated for 150-ft-deep wells showed inconsistent changes over time. For example, the changes during 2000–04 and 2005–09 were mostly increased probabilities of elevated nitrate concentrations, changes during 2005–09 and 2010–14 were mostly decreased probabilities, and changes during 2010–14 and 2015–19 included a mixture of increased and decreased probabilities. In contrast, at the 300-ft depths, probabilities of elevated nitrate concentrations generally increased between all of the periods. The difference in responses between the 150- and 300-ft wells suggest that the probability of elevated nitrate concentrations in shallower wells is more dynamic than it is in deeper wells. That is not unexpected in that deeper wells are known to respond to land surface changes more slowly and may not be as representative of current anthropogenic changes.
To examine temporal trends in the data in greater detail, predicted probabilities within each time period at 150- and 300-ft depths were sorted from low to high and assigned to quantiles. When the sorted data were placed into one of 10 quantiles with each quantile representing 10 percent of the data, the predicted probabilities within the first 6 quantiles for 150-ft wells showed low probabilities of elevated nitrate concentrations, generally less than 5 percent. The distribution patterns in quantiles 7–10 showed increasingly higher probabilities of elevated nitrate concentrations, with probabilities that generally exceeded 20 percent in the uppermost 10th quantile. Very similar patterns were found in the predicted probabilities for the hypothetical 300-ft-deep wells.
For the predicted probabilities at the 150- and 300-ft well depths, changes in the probabilities of finding elevated nitrate concentrations in groundwater over the past 2 decades have been inconsistent across time periods and across ranges of predicted probability. The modeling results show that the highest probabilities of finding elevated nitrate concentrations seem to have generally increased over the four time periods, whereas the more moderate probabilities (represented by the 4th–6th quantiles in figures 11 and 12) seem to have generally decreased over at least the first three same time periods. The highest probabilities for finding elevated nitrate concentrations at most wells are less than 10 percent demonstrating how much of the Puget Sound basin area has relatively low predicted probabilities of elevated nitrate concentrations.
Quantile regression was used to further examine temporal trends in predicted probabilities of elevated nitrate concentrations. For this analysis, the independent variables were the four time periods, and the dependent variable was the predicted probability of elevated nitrate concentrations in 150- and 300-ft-deep wells. Quantile regressions results were examined for the lower 5th quantile through the 95th quantile of probabilities by 5-percent increments. This analysis resulted in 19 slope and significance estimates for each quantile. The slope coefficient is of most interest because it is an indication of the rate of change in the probabilities of elevated nitrate concentrations over time for various ranges of the predicted probabilities. A positive slope value indicates an increasing trend in the probability of elevated nitrate concentrations over the four time periods, whereas a negative slope indicates a decreasing trend.
For both 150- and 300-ft well depths, the largest increasing trends (largest positive slope values) were found in the highest quantiles, which are associated with the highest predicted probabilities for elevated nitrate concentrations. These results indicate that wells with predicted higher probabilities of elevated nitrate concentrations have increased during 2000–19. Such increases in nitrates for those wells with high probabilities may be due to continued anthropogenic sources of nitrates in the areas around the wells and (or) a lag in the delivery of excess nitrate to these wells. For most of the modeled wells that had moderate probabilities of elevated nitrate concentrations, a slight but significant decline in the probability was observed over the time period examined.
The maps and statistical analysis presented in this study provide valuable and informative evaluation of the vulnerability of groundwater in the Puget Sound basin to elevated nitrate concentrations and effectively meet the goals of the study. Nevertheless, as addressed in previous vulnerability mapping exercises, limitations exist and should be noted. The probability maps do not represent measured nitrate concentrations of groundwater, but rather they present the probability that nitrate concentrations exceed 2 mg/L. The probability estimates have inherent uncertainty due to potential errors in the WDOH nitrate concentration data contained within the Sentry database and numerous GIS-based explanatory variables. Errors also arise from the formulation of the logistic regression models and their associated coefficient estimates. As noted in Frans (2008), higher resolution data for all the explanatory variables, particularly for saturated hydraulic conductivity and nitrate application data, would reduce the model error and improve predictions. Additional and (or) alternative explanatory variables not included in the modeling effort could also improve the predictions. The maps and predicted probability analyses in this report are intended for regional scale use and have limitations for use at the field scale given the scale of the explanatory variables. Many unaccounted-for field-scale complexities affect the concentration of nitrate in groundwater and in water produced by a given well. For example, the models do not account for point sources of nitrate or the observed flow pathways that water follows from the land surface to a shallow or deep well screen. Although a particular well may be installed in a region with an estimated high probability of elevated nitrate concentration, the well may in fact yield water with low nitrate concentration due to complexities that cannot be represented in regional-scale models such as those developed in this study.
Although there are always limitations to a statistical model, the models and predictions from this study are a viable indicator for the Puget Sound Partnership’s Healthy Human Population – Drinking Water Vital Sign. One benefit of the logistic regression modeling approach presented here is that the modeling framework can be implemented rapidly as new regional land-cover, anthropogenic data and climatic data are generated (land cover, population density, precipitation, etc.). Significant explanatory variables for each of the models from the four time periods were similar in both the type of variable (for example, percent agriculture within 4,000 meters of a well) and the magnitude of the model coefficients, indicating that future estimates of groundwater vulnerability can be estimated from a narrow suite of explanatory variables, facilitating comparisons among model predictions over time. For this study only two groundwater vulnerability depths were considered, but the current models and potential future models can be used to examine multiple depths, further enhancing the use of this model framework as a Vital Sign indicator. An additional benefit of the logistic regression approach for evaluating groundwater vulnerability is the ability to examine different vulnerability probabilities from the model output to assess temporal trends. This report presents several graphical and empirical approaches for examining the ranges and trends in the probabilities of exceeding nitrate concentrations greater than 2 mg/L in groundwater in the Puget Sound basin.
References Cited
Gronberg, J.M., and Spahr, N.E., 2012, County-level estimates of nitrogen and phosphorus from commercial fertilizer for the conterminous United States, 1987–2006: U.S. Geological Survey Scientific Investigation Report 2012–5207, 20 p., accessed February 5, 2020, at https://doi.org/10.3133/sir20125207.
Multi-Resolution Land Characteristics Consortium [MRLC], 2020, National Land Cover Database (NLCD): Multi-Resolution Land Characteristics Consortium database, accessed January 25, 2020, at https://www.mrlc.gov.
National Research Council, 1993, Ground water vulnerability assessment, contamination potential under conditions of uncertainty: Washington, D.C., National Academy Press, 210 p., accessed December 5, 2007, at https://books.nap.edu/openbook.php?isbn=0309047994.
Nolan, B.T., Hitt, K.J., and Ruddy, B.C., 2002, Probability of nitrate contamination of recently recharged groundwaters in the conterminous United States: Environmental Science & Technology, v. 36, no. 10, p. 2138–2145, accessed March 15, 2007, at https://doi.org/10.1021/es0113854.
PRISM Climate Group, 2020, Recent years: Oregon State University, Prism Climate Group database, accessed January 5, 2020, at https://prism.oregonstate.edu/recent.
Puget Sound Info, 2022, Vital Signs Measures of ecosystem health and progress toward Puget Sound recovery goals: Puget Sound Info Web page, accessed June 12, 2022, at https://vitalsigns.pugetsoundinfo.wa.gov.
Puget Sound Partnership, 2020, Puget Sound vital signs: Puget Sound Partnership web page, accessed April 20, 2021, at https://www.psp.wa.gov/evaluating-vital-signs.php.
R Core Team, 2019, R—A language and environment for statistical computing: Vienna, Austria, R Foundation for Statistical Computing, accessed June 12, 2019, at https://www.r-project.org.
Staubitz, W.W., Bortleson, G.C., Semans, S.D., Tesoriero, A.J., and Black, R.W., 1997, Water-quality assessment of the Puget Sound basin, Washington—Environmental setting and its implications for water quality and aquatic biota: U.S. Geological Survey, Water-Resources Investigations Report 97–4013, 76 p.
Stayner, L.T., Schullehner, J., Semark, B.D., Jensen, A.S., Trabjerg, B.B., Pedersen, M., Olsen, J., Hansen, B., Ward, M.H., Jones, R.R., Coffman, V.R., Pedersen, C.B., and Sigsgaard, T., 2021, Exposure to nitrate from drinking water and the risk of childhood cancer in Denmark: Environment International, v. 155, p. 106613.
Washington State Department of Health, 2020, Sentry Public Water Supply System database, accessed January 26, 2020, at https://www.doh.wa.gov/DataandStatisticalReports/EnvironmentalHealth/DrinkingWaterSystemData/SentryInternet.
Washington State Legislature, 2007, Puget Sound water quality protection, chap. 90.71 of Revised Code of Washington, accessed February 22, 2020, at https://app.leg.wa.gov/rcw/default.aspx?cite=90.71.
Washington State Office of Financial Management, 2020, OFM 2000–2020 SAEP population and housing estimates for 2010 census block groups: Forecasting and Research Division and U.S. Department of Commerce, U.S. Census Bureau, Geography Division, accessed February 3, 2020, at https://ofm.wa.gov/washington-data-research/population-demographics/population-estimates/small-area-estimates-program.
Wieczorek, M.E., 2014, USGS area- and depth-weighted averages of selected SSURGO variables for the conterminous United States and District of Columbia: U.S. Geological Survey web page, accessed January 25, 2020, at https://water.usgs.gov/GIS/metadata/usgswrd/XML/ds866_ssurgo_variables.xml.
Winter, T.C., Harvey, J.W., Franke, O.L., and Alley, W.M., 1999. Ground water and surface water—A single resource: U.S. Geological Survey Circular 1139, accessed July 14, 2021, at https://pubs.usgs.gov/circ/1998/1139/report.pdf.
Wright, E.E. Bright, V.A.L., Black, R.W., and Headman, A.O., 2023. Index of vulnerability for elevated nitrates in groundwater in the Puget Sound Basin, Washington, 2000–2019: U.S. Geological Survey Data Release, https://doi.org/10.5066/P9TOWGYM.
Conversion Factors
U.S. customary units to International System of Units
International System of Units to U.S. customary units
For information about the research in this report, contact
Director, Washington Water Science Center
U.S. Geological Survey
934 Broadway, Suite 300
Tacoma, Washington 98402
https://www.usgs.gov/centers/washington-water-science-center
Manuscript approved on October 17, 2023
Publishing support provided by the U.S. Geological Survey
Science Publishing Network, Tacoma Publishing Service Center
Edited by Jeff Suwak and Vanessa Ball
Layout and design by Luis Menoyo
Disclaimers
Any use of trade, firm, or product names is for descriptive purposes only and does not imply endorsement by the U.S. Government.
Although this information product, for the most part, is in the public domain, it also may contain copyrighted materials as noted in the text. Permission to reproduce copyrighted items must be secured from the copyright owner.
Suggested Citation
Black, R.W., Wright, E.E., Bright, V.A.L., and Headman, A.O., 2023, Prediction of the probability of elevated nitrate concentrations at groundwater depths used for drinking-water supply in the Puget Sound basin, Washington, 2004–19: U.S. Geological Survey Scientific Investigations Report 2023–5117, 40 p., https://doi.org/10.3133/sir20235117.
ISSN: 2328-0328 (online)
Study Area
| Publication type | Report |
|---|---|
| Publication Subtype | USGS Numbered Series |
| Title | Prediction of the probability of elevated nitrate concentrations at groundwater depths used for drinking-water supply in the Puget Sound basin, Washington, 2004–19 |
| Series title | Scientific Investigations Report |
| Series number | 2023-5117 |
| DOI | 10.3133/sir20235117 |
| Publication Date | December 28, 2023 |
| Year Published | 2023 |
| Language | English |
| Publisher | U.S. Geological Survey |
| Publisher location | Reston, VA |
| Contributing office(s) | Washington Water Science Center |
| Description | Report: vi, 40 p.; Data Release |
| Country | United States |
| State | Washington |
| Other Geospatial | Puget Sound basin |
| Online Only (Y/N) | Y |


