

Hydrology and Water Quality of a Dune-and-Swale Wetland Adjacent to the Grand Calumet River, Indiana, 2019–22
Links
- Document: Report (3.28 MB pdf) , HTML , XML
- Dataset: USGS National Water Information System database - USGS water data for the nation
- NGMDB Index Page: National Geologic Map Database Index Page (html)
- Download citation as: RIS | Dublin Core
Acknowledgments
The authors would like to acknowledge assistance from Emily Stork and Tom Swinford, of the Indiana Department of Natural Resources, for helping the authors to understand the historical land use and restoration activities at the Clark and Pine Nature Preserve and the Pine Station Nature Preserve. This study also acknowledges Alex Riddle and Harvie Pollard of the U.S. Geological Survey Ohio-Kentucky-Indiana Water Science Center for assistance with field work and the installation of monitoring wells. Charles Hart, Katie Owens, and Amy Story of the Ohio-Kentucky-Indiana Water Science Center are acknowledged for assistance with continuous water-level and water-quality records work. Funding for this study was provided by the Indiana Department of Natural Resources and the U.S. Geological Survey Urban Waters Federal Partnership.
Abstract
Adverse ecological and water-quality effects associated with industrial land-use changes are common for littoral wetlands connected to river mouth ecosystems in the Grand Calumet River-Indiana Harbor Canal Area of Concern. These effects can be exacerbated by recent high Lake Michigan water levels that are problematic for wetland restoration. Wetlands in the adjacent Clark and Pine Nature Preserve and Pine Station Nature Preserve are intended to mitigate wetland destruction in the area of concern by restoring residual dune-and-swale wetlands and preserving habitat for endangered and threatened plant species. Physical hydrology and water-quality monitoring of restored wetland cells at the preserves were initiated during 2019 to evaluate changes after wetland restoration efforts in 2015 and near record-low water levels in early 2013. Lake Michigan water levels rose steadily between late 2013 and 2018 to record-high water levels in 2019 and 2020. In this report, precipitation, evapotranspiration, and groundwater and surface-water levels are analyzed to better understand wetland inundation controls and flow directions in restored northern dune-and-swale wetland settings relative to the Grand Calumet River. Continuous specific conductance data and discrete water-quality samples were collected and analyzed to provide a synoptic view of water quality for the restored wetlands.
High Lake Michigan water levels affected Grand Calumet River stage and shallow groundwater elevations in the study area after the onset of peak lake levels in June 2019, that persisted through summer 2020, before finally receding in September 2020. Grand Calumet River stage peaked soon after lake levels in July 2019, whereas groundwater elevations in the study area peaked in October 2019. Specific conductance values in closed-basin wetland cells in the western and central parts of the nature preserves indicated a dilution trend and contrasted those of interconnected wetland cells along an eastern corridor, where alterations to wetland cells were more pronounced. Monitoring results indicate that varying seasonal wetland inundation trends with low stands in autumn have returned after high water table conditions owing to high water levels on Lake Michigan. Wetland water balance results during the study period indicated that the wetland ecosystem partially moderated flooding during high lake levels through summer evapotranspiration.
Introduction
Restored wetland ecosystems provide many benefits, such as reduced downstream flooding, improved water quality, increased biodiversity, increased wildlife habitat, and greater carbon sequestration (Cowdery and others, 2019). Wetland restoration efforts aim to restore hydrologic and ecological functions, but achieving these goals is challenging where industrial development has substantially altered the surrounding landscape and hydrologic conditions. Land-use changes substantially alter wetland vegetation, and hydrochemical alterations can promote the dominance of plant species with poor habitat value (Larson and others, 2013). The Grand Calumet River-Indiana Harbor Canal Area of Concern in northwestern Indiana was established under the Great Lakes Water Quality Agreement of 1987 (International Joint Commission, 1987) to prioritize the area for restoration because of water-quality and ecosystem impairments. In addition to past anthropogenic effects, Great Lakes river mouths and adjacent wetlands represent a complex natural continuum between river- and lake-dominated hydrologic settings requiring careful consideration of cyclical mixing dynamics for effective restoration efforts (Mazur and others, 2019).
The Clark and Pine Nature Preserve and the adjacent Pine Station Nature Preserve (referred to collectively as “the preserves” in this report; fig. 1) were established as part of wetland restoration activities by trustee agencies in the natural resource damage assessment in the Grand Calumet River-Indiana Harbor Canal Area of Concern. These wetlands are intended to mitigate damage to other wetlands in the area of concern by restoring residual dune-and-swale wetlands and preserving several State endangered and threatened plant and animal species. The preserves are a restored dune-and-swale wetland complex between Lake Michigan and the Grand Calumet River (fig. 1) and are surrounded by industry in Gary, Indiana (Kay and others, 1997). The preserves encompass 320 acres, and the corresponding habitat hosts substantial plant biodiversity and a large assemblage of endangered plant and animal species (Indiana Heritage Data Center, 2021). At least 24 rare plants, including Arctostaphylos uva-ursi (bearberry), several varieties of Orchidaceae (orchid), Buchnera americana (blue heart), and Betula papyrifera (paper birch); and 12 rare animals, including Ambystoma laterale (blue-spotted salamander) and Acris blanchardi (cricket frog), are within the preserves (Indiana Heritage Data Center, 2021). Hydroperiods (periods when wetland soils are inundated with water) are key controls on the viability of plant communities in restored wetlands. Considering the emerging effects of increasing extreme precipitation and temperature events on hydrologic regimes, restored wetland ecosystems have varying resilience to shifting water budgets depending on their design features and landscape position relative to groundwater flow patterns (Cassatt and Wilcox, 2020).
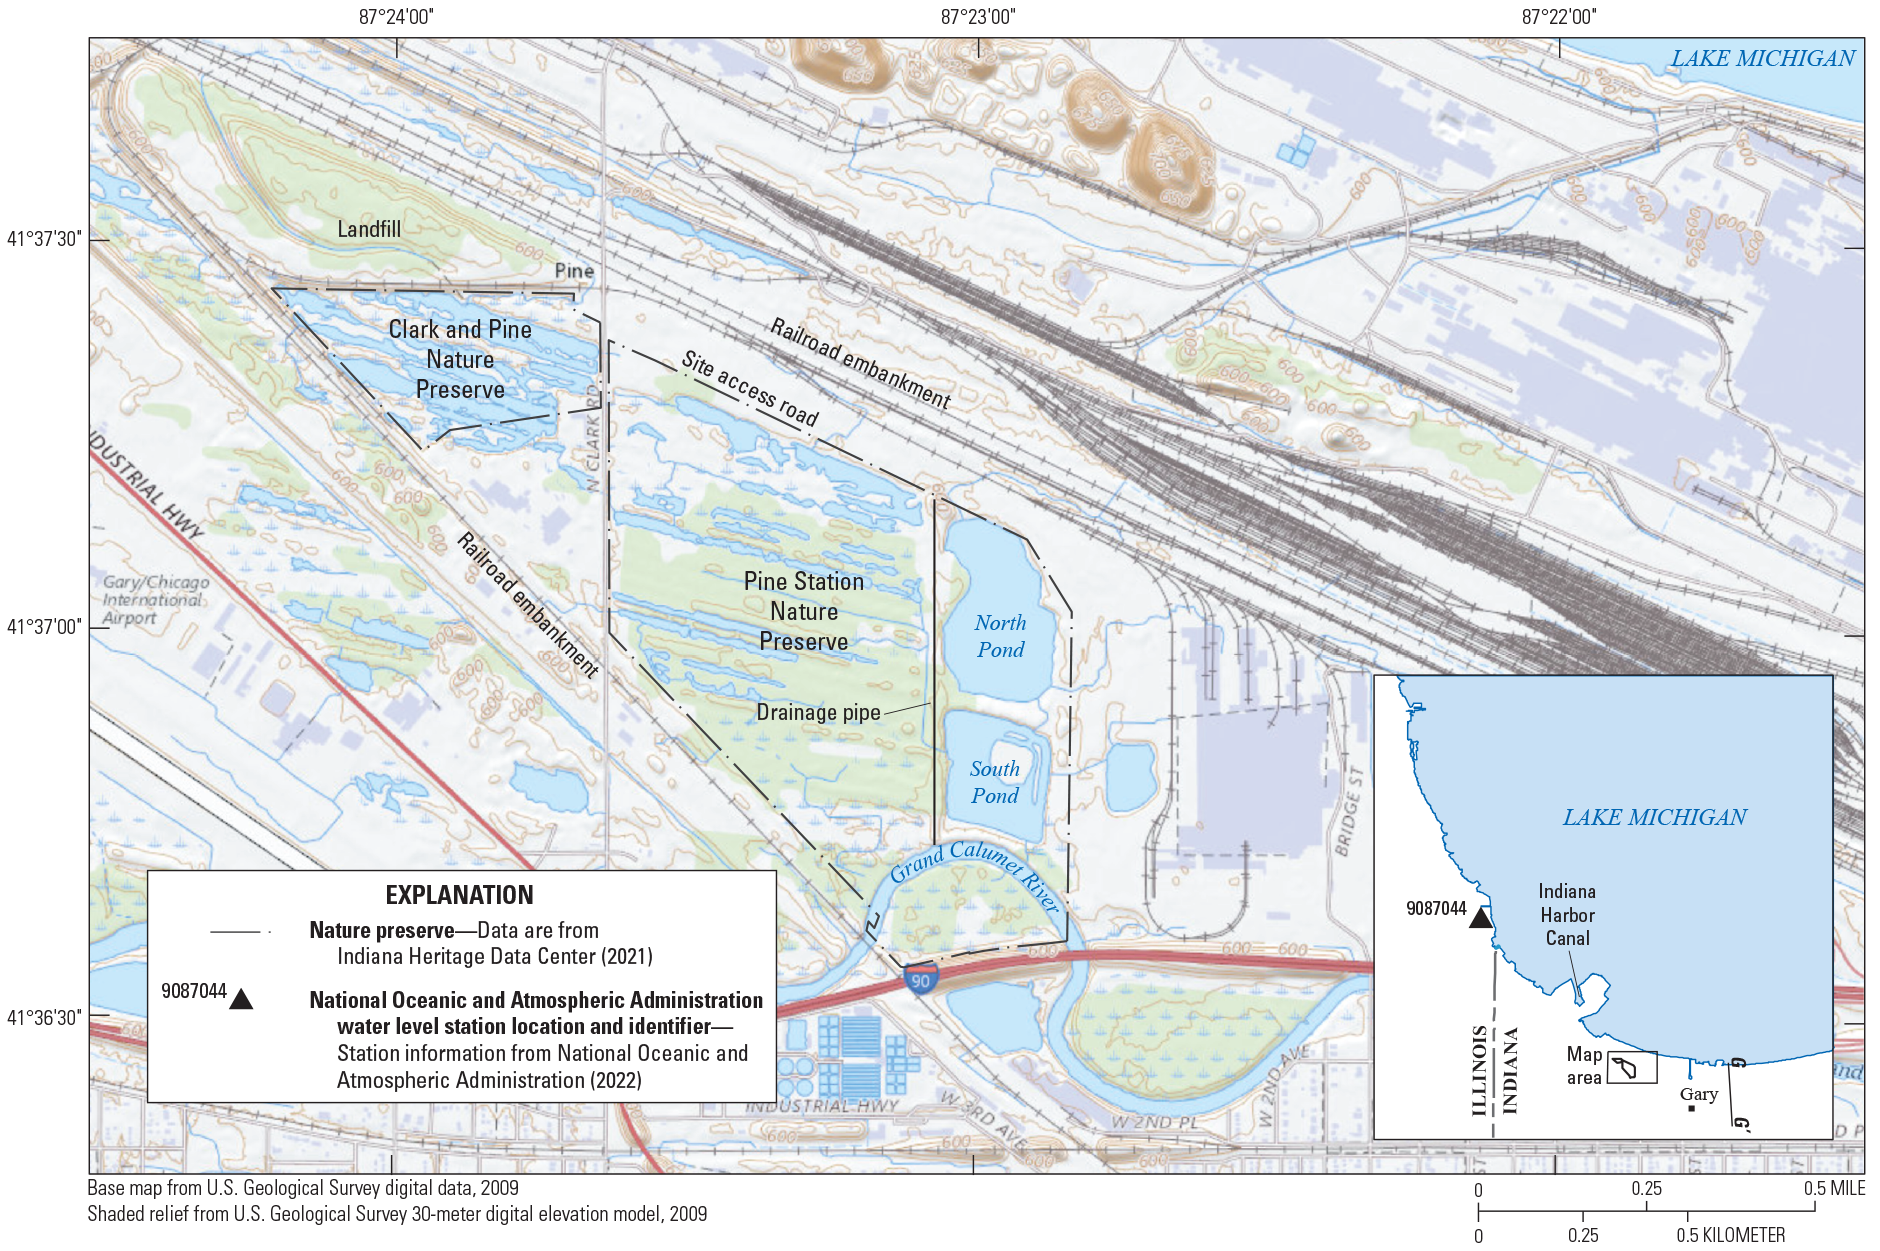
Map showing Clark and Pine Nature Preserve and Pine Station Nature Preserve study area in the Grand Calumet River-Indiana Harbor Canal Area of Concern near Gary, Indiana.
After record-low water levels in early 2013 (about 576 feet [ft]), water levels in Lake Michigan (fig. 2) and other Great Lakes rose steadily between late 2013 and 2018 to near record-high levels (about 582 ft; Gronewold and Rood, 2019). Researchers monitoring Lake Ontario wetland ecosystems between 2009 and 2019 documented a loss of ecosystem diversity with a decrease in meadow marsh, shrub, and upland vegetation guilds and an increase in Typha latifolia (cattail) coverage at higher wetland cell elevations in 2019 (Smith and others, 2021). Future climate simulations predict increasing winter and spring precipitation through the end of the century for Chicago and the Great Lakes regions (Hayhoe and others, 2010), highlighting the need for water-level monitoring and assessment of wetland ecosystems adjacent to Lake Michigan.
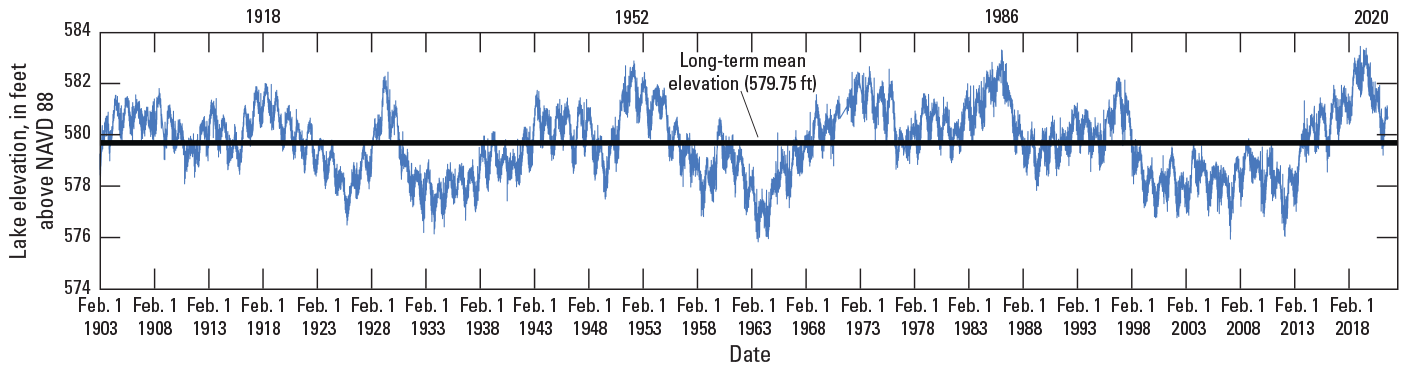
Graph showing daily mean water levels in Lake Michigan measured at the National Oceanic and Atmospheric Administration water level observation station CMTI2 (9087044) at the Calumet Harbor, Illinois. The bold black line is the long-term mean lake elevation (579.75 ft). Station location shown on figure 1.
Purpose and Scope
This report summarizes the physical hydrology and water-quality characteristics of restored wetland cells at the preserves that were monitored between 2019 and 2022. One priority is to understand how precipitation patterns and groundwater or surface-water interactions affect wetland hydroperiods. Groundwater and surface-water levels are analyzed to better understand hydraulic gradients and flow directions in restored northern dune-and-swale wetland settings adjacent to the Grand Calumet River. In addition to quantifying wetland inundation patterns that control wetland habitat and plant species diversity (Keddy and Reznicek, 1986), postreclamation (2019–22) continuous specific conductance data and discrete water-quality results throughout the project area provide a synoptic view of water quality at the restored wetlands. This U.S. Geological Survey (USGS) study addresses high-priority issues including providing data to quantify changes in water quantity relative to areas with native and restored ecosystems and identifying hydrologic characteristics that relate to transitions between ecosystem states.
Hydrologic Setting
Wetlands at the preserves are dune-and-swale wetland complexes (also known as ridge and swale) in the embayments of the Great Lakes and are composed of a series of beach ridges separated by narrow swales (Albert and others, 2005). Swales (depressions) containing the northernmost wetland cells of the preserves are approximately 1 mile (mi) south of the Lake Michigan shoreline (fig. 1). According to Albert and others (2005), dune-and-swale complexes adjacent to Lake Michigan vary in their degree of hydrologic connection to the lake with some maintaining connection for thousands of feet inland. The preserves are part of the Calumet lacustrine plain of northwestern Indiana where substantial drainage alterations of the Grand Calumet River were done to support development during the late 19th and early 20th centuries, including diverting the Grand Calumet River several hundred feet to the south when Gary Harbor was dug in 1906 (Kay and others, 1997).
Shedlock and others (1993, 1994) studied the hydrogeology of the Great Marsh region east of the preserves and demonstrated that wetland surface waters are usually derived from local subsurface flow systems (fig. 3). The local flow regimes are recharged through the dune complexes and discharged by seepage into wetlands and streams (fig. 3), such as the Grand Calumet River, with additional water loss owing to evapotranspiration. These natural flow patterns are locally affected for some swale wetland cells in the preserves that have been widened in places by previous sand mining operations (see fig. 4, northern cells in Pine Station Nature Preserve). Also, the naturally undulating dune-and-swale topography has been leveled by historical sand mining in the vicinity of monitoring well P14 (Emily Stork, Indiana Department of Natural Resources, written commun., 2021). Furthermore, the natural closed-basin configuration of swale wetland cells is altered where sand mining and drainage alterations have crosscut dunes such as the north-south trending wetland cell and low-lying area in the vicinity of monitoring wells P4 and P5 (mapped water body not shown in fig. 4).
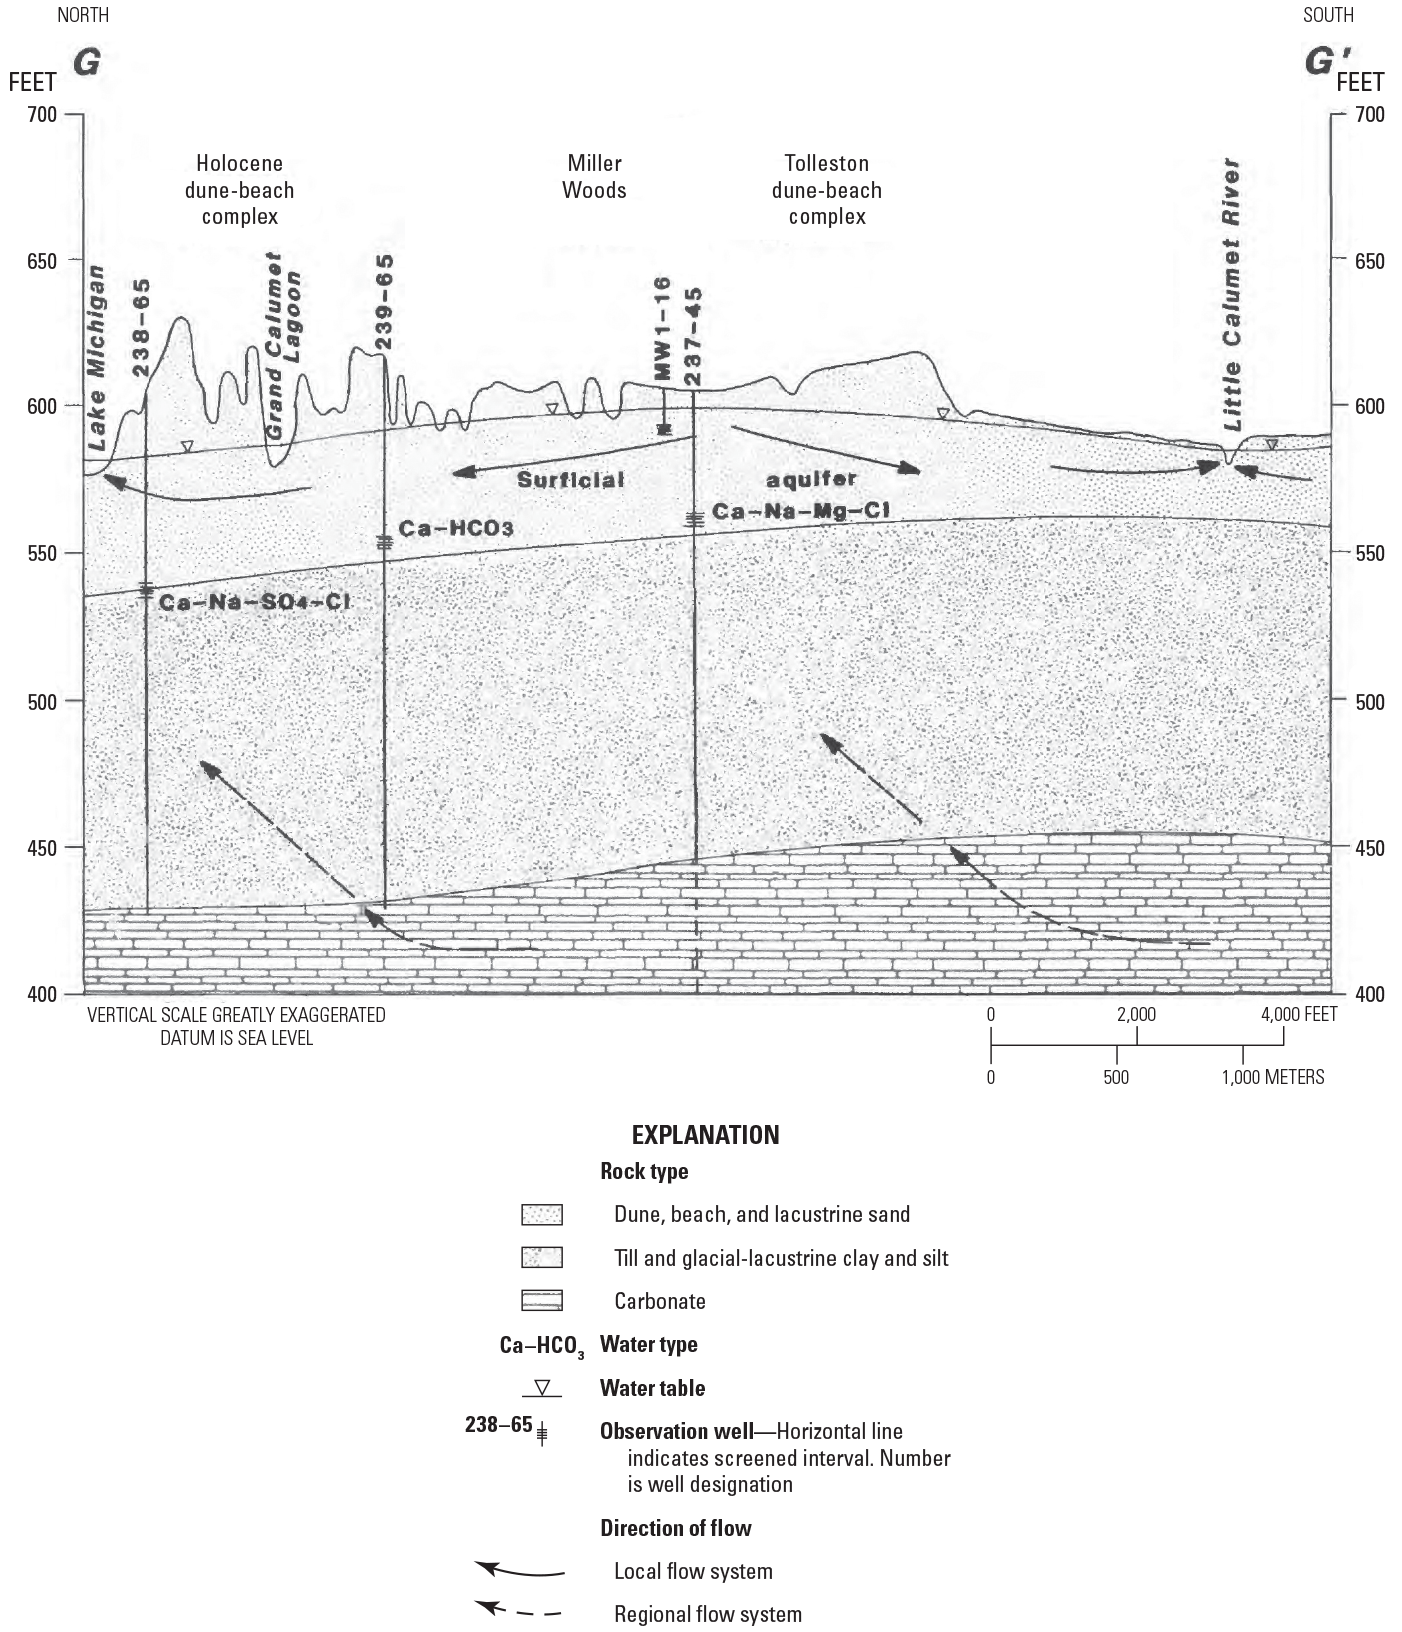
Hydrogeologic cross section showing groundwater flow paths approximately 5 miles east of the Clark and Pine Nature Preserve and Pine Station Nature Preserve study area near Gary, Indiana. Modified from Shedlock and others, 1994. Location of cross section shown on figure 1. Ca, calcium; Na, sodium; SO4, sulfate; Cl, chloride; Ca-HCO3, calcium bicarbonate; Mg, magnesium.
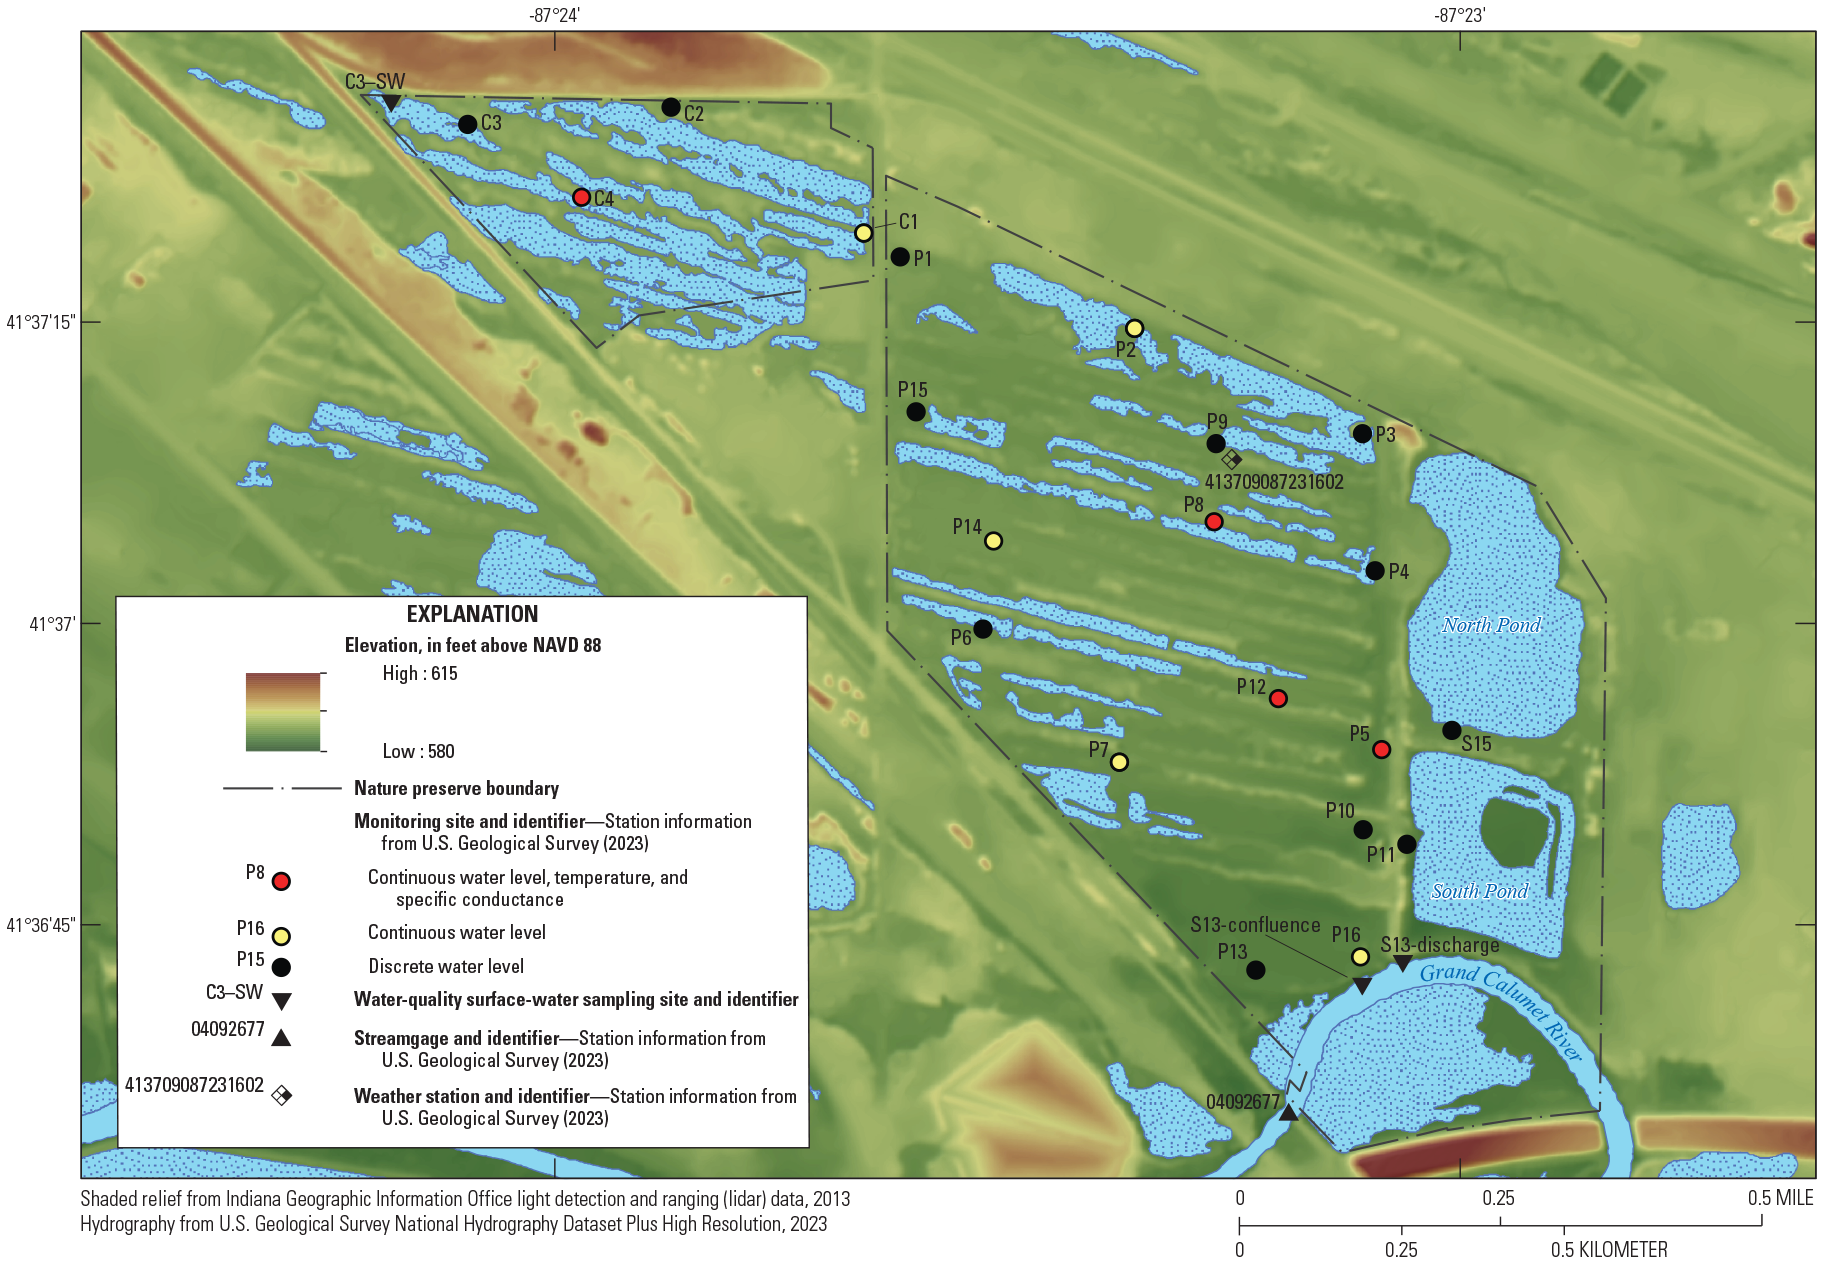
Topographic light detection and ranging (lidar) image showing water-level and water-quality monitoring sites at the Clark and Pine Nature Preserve and the Pine Station Nature Preserve near Gary, Indiana.
The dunes and swales at the preserves were originally formed 3,200 to 4,500 years ago when Lake Michigan was more than 13 ft higher than today and receding from Tolleston Beach (Argyilan and others, 2014). The higher elevation dune ridges at the preserves mark previous intermittent reaches of the Lake Michigan shoreline. Lake Michigan water levels fluctuate with a periodicity of about 33 years and an even greater pronounced rise in water levels with a periodicity of about 160 years (Baedke and Thompson, 2000). Based on geologic observations, the recent 2019 and 2020 increase in Lake Michigan water levels likely mark a recurrence of the approximate 33-year lake cycle (last rise in water level was in 1986; fig. 2).
Description of Study Area
In addition to the effects of artificial drainage and sand aggregate mining, railroad embankments and industrial facilities adjacent to the preserves have affected the hydrology and water quality. Based on metals concentrations of sediments at the preserves (Sparks, 2019) and previous work to characterize fill materials in the region (Kay and others, 1997), fly ash and steel slag were used as fill material for roadways (including the preserves’ access road) and railroad embankments along the northern and southwestern borders of the nature preserves. Also, atmospheric deposition of particulate matter emitted from surrounding industrial sources is a source of metals input (Sweet and others, 1998). Surrounding industrial facilities, including three U.S. Environmental Protection Agency (EPA) Superfund sites (U.S. Environmental Protection Agency, 2022b) within 0.25 mi of the preserves are potential sources of groundwater contamination.
Before the Indiana Department of Natural Resources acquired the preserves in 1993, the site had a history of industrial uses that were summarized in a written communication from the Indiana Department of Natural Resources Grand Calumet regional ecologist (Emily Stork, Indiana Department of Natural Resources, written commun., 2020). The preserves were primarily used for sand mining operations between the 1950s and 1980s (fig. 1). Within the preserves, approximately 47 acres represent a mostly undisturbed dune-and-swale hydrogeologic setting (see wetland cells in the vicinity of monitoring wells C1, C3, and C4; fig. 4). The natural dune ridges and swales vary in height or depth, width, and slope, producing variable soil moisture conditions that support a highly diverse continuum of natural communities. The remaining dunes and swales were altered by the sand mining industry from the 1950s to the 1980s, scraping away dunes down to the water table (Emily Stork, Indiana Department of Natural Resources, written commun., 2021). These large, linear features are now expansive, flat stretches of swales more uniform in width and depth than the previous formations and are referred to as scrapes.
The sand scrapes created an unintended benefit for many of the unique and endangered species that thrive in the preserves. In some places, the scrapes provided a larger habitat for emergent plant species tolerant to changes between dry conditions and inundation (Emily Stork, Indiana Department of Natural Resources, written commun., 2021). The native plants that assembled there created a community consistent with those in pannes (calcareous intradunal ponds; Hiebert and others, 1986). Contrasting wet and dry periods have naturally excluded invasive plant species that do not tolerate these divergent soil conditions. The undisturbed swales are home to the most diverse native species and have proven exceptionally resilient to the pressures of invasive species, such as Phragmites australis (common reed) and Rhamnus frangula (glossy buckthorn).
At the onset of this study, the resilience of these swales and their corresponding habitat was threatened by unintended consequences resulting from renovation of a brick storm sewer. In the 1930s, the brick-lined drainage pipe was installed by the steel industries to the north through the Pine Station Nature Preserve to discharge directly into the Grand Calumet River (Sparks, 2019). Along the eastern edge of the Pine Station Nature Preserve, the south-flowing drainage pipe likely drained the wetlands toward the Grand Calumet River (fig. 1) before the 2015 restoration. During the postreclamation period, the river is the primary drainage capturing surface water (runoff) and groundwater discharge from the wetlands. Since restoration work made the drainage pipe (fig. 1) impermeable, water levels at the Pine Station Nature Preserve have risen to levels not previously observed by current nature preserve staff (Emily Stork, Indiana Department of Natural Resources, oral commun., 2021). Wetland water levels may stabilize and remain high, thereby adversely affecting wetland inundation patterns that control wetland habitat and plant species diversity (Keddy and Reznicek, 1986).
Methods
The water budget of restored wetlands at the preserves was quantified with continuous (one reading every 15 minutes) and discrete (monthly) monitoring of water-budget components including precipitation (rainfall), evapotranspiration, and water-level elevations at surface-water and groundwater monitoring locations. Wetland water quality was evaluated using continuous specific conductivity and water temperature measurements as well as discrete (one-time) sampling for major ions, trace elements, nutrients, and volatile organic compounds (VOCs). All data collected as part of this study, including physical hydrologic data and water-quality data, are published in the National Water Information System (U.S. Geological Survey, 2023). Station numbers or names in table 1 can be used to find data in the National Water Information System.
Table 1.
Monitoring sites installed at Clark and Pine Nature Preserve and Pine Station Nature Preserve near Gary, Indiana, for water years 2020–22.[Data are from U.S. Geological Survey (2023). ft, foot; bls, below land surface; NP, nature preserve; IN, Indiana; WL, water level; N, nutrient; MI, major ion; TE, trace element; VOC, volatile organic compound; SpC, specific conductance; T, temperature; Met, meteorological; NA, not applicable]
Monitoring Sites
Nineteen monitoring wells were installed and developed using a surge block, in August 2019, with screen intervals crossing the hyporheic zone of the dunes and swales throughout the preserves (table 1). An additional monitoring well (P16, USGS well 413644087230601) was installed in September 2020 to provide data near where the wetlands can directly interact with the Grand Calumet River depending on the river’s stage (fig. 4; table 1). Monitoring wells were constructed using 2-inch (in.) diameter galvanized steel pipe connected to stainless steel well points with 3-ft 80-mesh well screens. The well assemblies were manually driven into the ground until refusal, which typically was less than 12 ft below land surface. The wells were generally positioned along the periphery of inundated areas so that the screened intervals would represent the hyporheic zones of wetland cells within scrapes and swales. Monitoring wells were redeveloped using a bailer in August 2020 and May 2021.
In addition to monitoring wells, surface-water monitoring included three water-quality sampling sites established during an August 2020 sampling event (C3–SW, S13–Confluence, S13–Discharge; table 1). A staff gage (S15) was installed in the North Pond in September 2020 for measuring pond water levels. Meteorological monitoring was initiated in September 2019 with the installation of a weather station near monitoring well P9 (fig. 4).
Monitoring Water-Level Elevations and Water Quality
Monthly discrete and 15-minute continuous groundwater levels were measured from September 2019 through June 2021. Nine monitoring wells were equipped with pressure transducers to automate the collection of depth-to-water data, and four of these wells were also equipped with specific conductivity and temperature sensors (table 1). Two of the nine pressure transducers were added in October 2020 to initiate continuous monitoring at monitoring wells P7 and P16 (fig. 4; table 1). Continuous water-level data were recorded using atmospherically vented pressure transducers and following standard procedures described by Freeman and others (2004). Monthly groundwater-level measurements were collected at discrete data-type wells (table 1) by manually measuring depth-to-water using a calibrated electronic measuring tape and following procedures outlined by Cunningham and Schalk (2011). Water-level measurements from 12 additional wells adjacent to the study area (app. 1) were collected during autumn 2019 and 2020 and used for potentiometric surface mapping.
Continuous specific conductance and water temperature were recorded at monitoring wells C4, P5, P8, and P12 (fig. 4; table 1) to quantify seasonal patterns of dissolved ions in shallow groundwater. In Situ Aqua Troll 200 Data Logger pressure transducers, with internally logged water level, water temperature, and specific conductance sensors, were checked quarterly with 500 and 1,000 microsiemens per centimeters at 25 degrees Celsius (µS/cm) potassium chloride (KCl) standards. Sensors were recalibrated if calibration checks indicated sensor measurement differences greater than 3 percent or 5 µS/cm (whichever is greater) from the standards (U.S. Geological Survey, 2019). In Situ Aqua Troll 200 Data Logger thermistors (site sensors) were factory calibrated prior to deployment. Periodic temperature checks of the site sensors were conducted using one or more field monitor sensor(s) that was verified against a National Institute of Standards and Technology traceable thermistor. Temperature checks using the field monitor sensor(s) indicated that the site sensor temperature readings were stable and within the USGS criterion of 0.2 degree Celsius (Wilde, 1998).
Monthly surface-water levels were measured at a staff gage (S15; fig. 4) that was installed in the North Pond to record and compare fluctuations relative to adjacent wetland cells. A monitoring well (P11; fig. 4) was installed along the western bank of the South Pond to record and compare monthly water-level fluctuations of the South Pond relative to the North Pond, adjacent wetland cells (in the vicinity of P5 and P10; fig. 4), and the Grand Calumet River to the south. Grand Calumet River stage and discharge were monitored using the USGS streamgage Grand Calumet River at Industrial Highway at Gary, Ind. (station 04092677; fig. 4) with a gage height record from October 1991 to September 2022. The S13–Discharge sampling site is at the lined discharge pipe. The S13–Confluence sampling site is where runoff flows into the Grand Calumet River from a small channel at the wetland-river boundary. The C3–SW sampling site is in the wetland cell in the northwest corner of the study area, near monitoring well C3.
Rainfall and Evapotranspiration Monitoring
A weather station (fig. 4; table 1) equipped with a pyranometer (incoming solar radiation), anemometer (wind speed), tipping bucket rain gauge (rainfall), thermometer, and relative humidity sensor, was installed to continuously monitor each parameter every 15 minutes. Reference evapotranspiration (ET0) is calculated using a daily time step for meteorological variables (air temperature, relative humidity, wind speed, and solar radiation) following the method described by Allen and others (1998).
Discrete Water-Quality Sampling
Discrete water-quality samples were collected from 15 monitoring wells (fig. 4; table 1) and at three of the surface-water monitoring sites in August 2020 (fig. 4; table 1). Field parameters were measured, and water-quality samples were analyzed for major ions, trace elements, and nutrients. A subset (10) of water-quality samples was analyzed for volatile organic compounds. Samples were collected following the methods described in the USGS “National Field Manual for the Collection of Water-Quality Data” (U.S. Geological Survey, variously dated). The sampling was conducted using a Fultz submersible pump, with the pump intake placed within the screened interval of the wells. The pump discharge tubing was attached to a flow-through chamber with a YSI multiparameter sonde for measuring pH, specific conductance, water temperature, and dissolved oxygen during sampling. Turbidity was measured using a Hach field turbidity meter. To ensure samples were representative of the aquifer, three well volumes of water were purged by pumping from the well at a rate of less than 0.15 gallon per minute, and a water sample was collected after stabilization of the field parameters.
Alkalinity of the groundwater samples was determined by collecting a filtered sample and conducting a titration in the field using the inflection-point method (Rounds, 1998). Three surface-water samples were collected and analyzed for major ions, trace elements, nutrients, and VOC. A peristaltic pump was used to collect field samples with the tubing intake placed in the surface water about 2 inches from the wetland cell bottom (at C3–SW) or streambed (at S13–Confluence) and about 1 ft into the discharge from S13–Discharge. Field parameters were measured with the multiparameter sonde by placing the sonde directly in the surface water feature and allowing the meter readings to equilibrate. Water-quality samples were analyzed by the USGS National Water Quality Laboratory in Denver, Colorado. Major ions, nutrients, and trace elements were analyzed using the methods described in Fishman and Friedman (1989), Fishman (1993), and Garbarino and others (2006). Volatile organic compound samples were analyzed at the USGS National Water Quality Laboratory by purge and trap gas chromatography with quadrupole mass-spectrometric detection (Connor and others, 1998).
Results
Grand Calumet River and Lake Michigan Water Levels
As shown in figure 2, Lake Michigan approached an all-time-high water level above 582.5 ft at Calumet Harbor, Ill., (National Oceanic and Atmospheric Administration, 2022 [NOAA] station 9087044; location shown in fig. 1;) in 2019–20 for the period of record, and high water levels are also indicated by lake-stage measurements at the nearby Chicago Lock monitoring site (USGS station 04087440; not shown). Monthly average lake levels were above 582.25 ft between May and August 2020. The Grand Calumet River generally flows west toward the Indiana Harbor Canal from the USGS streamgage Grand Calumet River at Industrial Highway at Gary, Ind. (station 04092677; fig. 4) along the southern edge of the study area. However, the high water levels on Lake Michigan coincided with the Grand Calumet River stage starting in October 2019, and this coincidental relation endured with a near-zero gradient until May 2020 and again from October 2020 until April 2021 (fig. 5). During these “coupling phases” (fig. 5), the gradient between the USGS streamgage at Gary, Ind. (04092677) and the NOAA lake-stage monitoring site at Calumet Harbor, Ill. (9087044; National Oceanic and Atmospheric Administration, 2022) was less than (<) 0.25 ft for a sustained period (more than [>] 1 month).
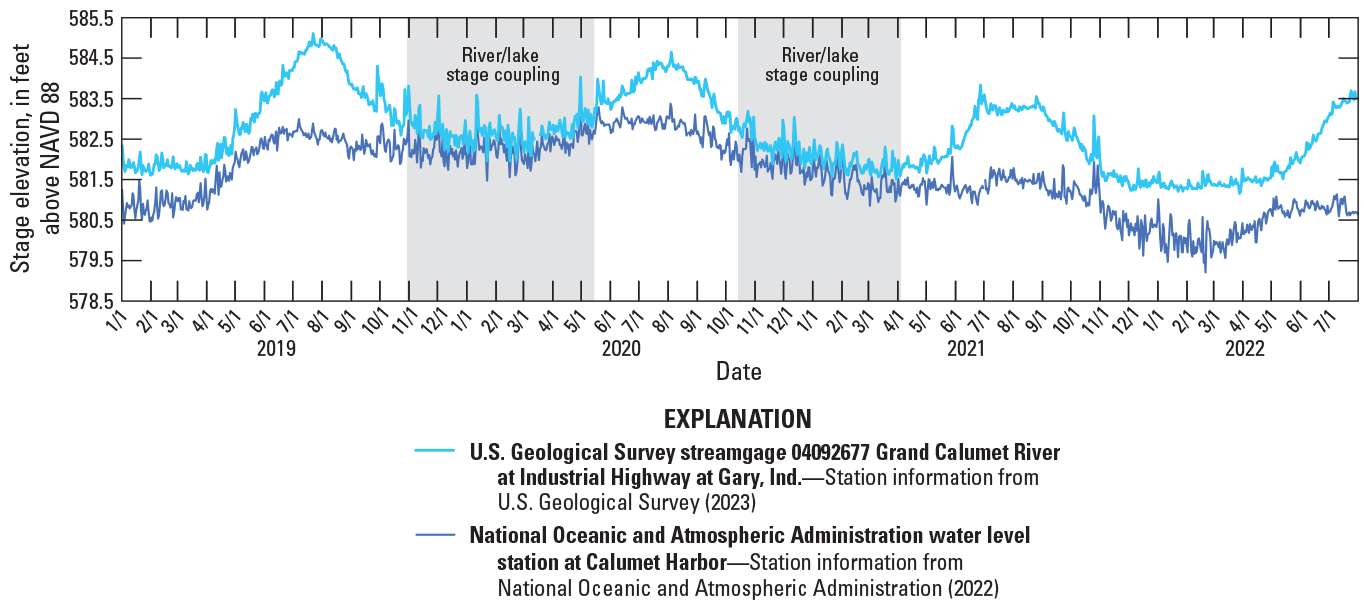
Graph showing daily mean stage at Grand Calumet River at Industrial Highway at Gary, Indiana (U.S. Geological Survey streamgage 04092677) and daily mean Lake Michigan water levels measured at the National Oceanic and Atmospheric Administration Calumet Harbor, Illinois (station 9087044), for calendar years 2019–22. NAVD 88, North American Vertical Datum of 1988.
Wetland Groundwater Levels
Groundwater-elevation trends along the eastern edge of the Pine Station Nature Preserve (fig. 6) are generally consistent with water-level patterns observed throughout the study area. Water levels were low in early autumn 2019 (mean water level for wells P3, P4, P5, P10, and P11 was 586.2 ft in September 2019) when monitoring was initiated but rose markedly in November 2019 (mean water level for wells P3, P4, P5, P10, and P11 was 587.7 ft in November 2019) and remained high until late summer 2020 (mean water level for wells P3, P4, P5, P10, and P11 was 587.2 ft in July and August 2020). This period of heightened groundwater levels coincides with high water levels on Lake Michigan and the Grand Calumet River shown in figure 5, but lagged the lake and river increases by 4 to 5 months.
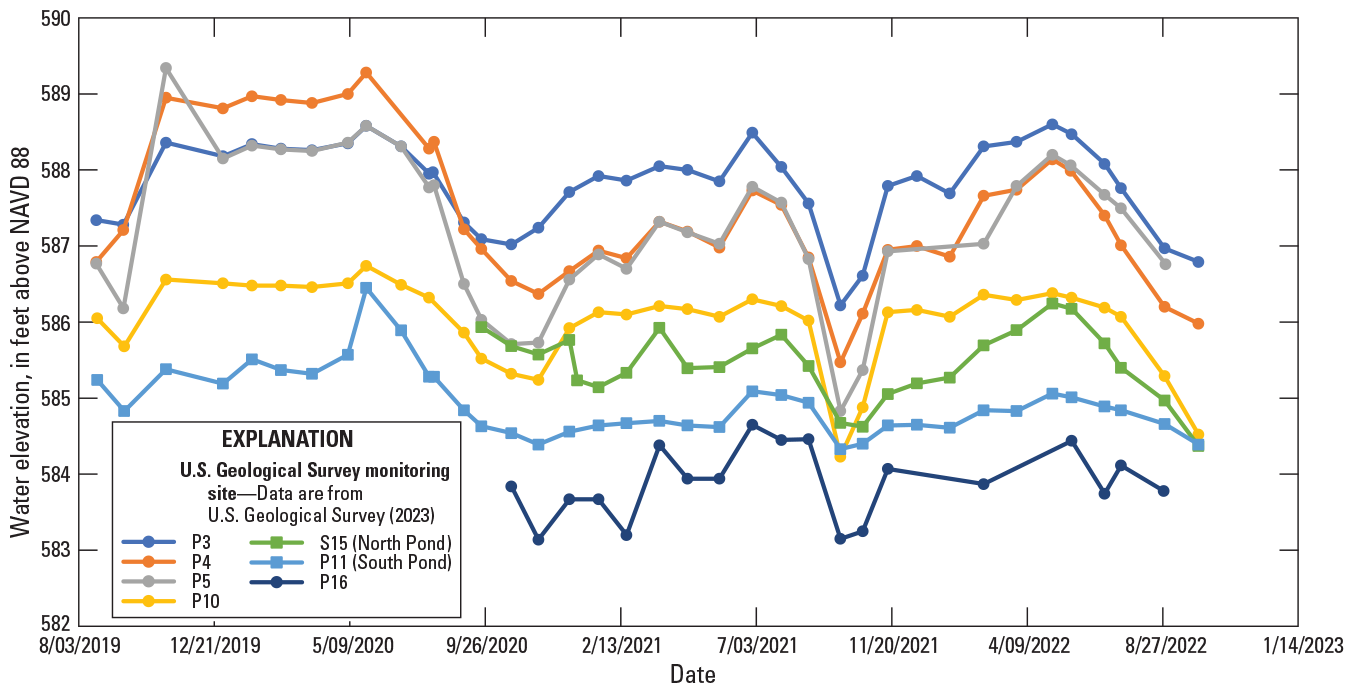
Groundwater hydrographs for five monitoring wells along the eastern edge of the study area plotted with North and South Pond water levels at Pine Station Nature Preserve near Gary, Indiana. The hydrographs are derived from monthly discrete water levels. The North Pond staff gage (S15) and monitoring well P16 near the bank of the Grand Calumet River were installed in September 2020, approximately 1 year after monitoring was initiated at other sites. NAVD 88, North American Vertical Datum of 1988.
The shallow groundwater divide, between water that flows north into Lake Michigan and water that flows south into the Grand Calumet River, is generally indicated by potentiometric contours shown in figure 7 that delineate shallow aquifer water-level elevations in the vicinity of the preserves. The transient nature of the divide during the high lake and river stand is indicated by monitoring wells P3 and P4 water-level trends in figure 6 that inverted in September 2020 (P4 water level fell below P3 water level and remained below it for the duration of the study). Furthermore, a change in hydraulic gradients is indicated by the shifting groundwater divide between autumn 2019 and autumn 2020 (fig. 7). Seasons are divided based on the months of December to February (winter), March to May (spring), June to September (summer), and October to November (autumn). The highest groundwater elevations are consistently recorded near monitoring well C2 (fig. 7) along the northern edge of the Clark and Pine Nature Preserve. The topographic high near monitoring well C2 is a groundwater recharge area. Water entering the groundwater flow system here typically flows perpendicular to potentiometric contours toward the Grand Calumet River to the south (fig. 7).
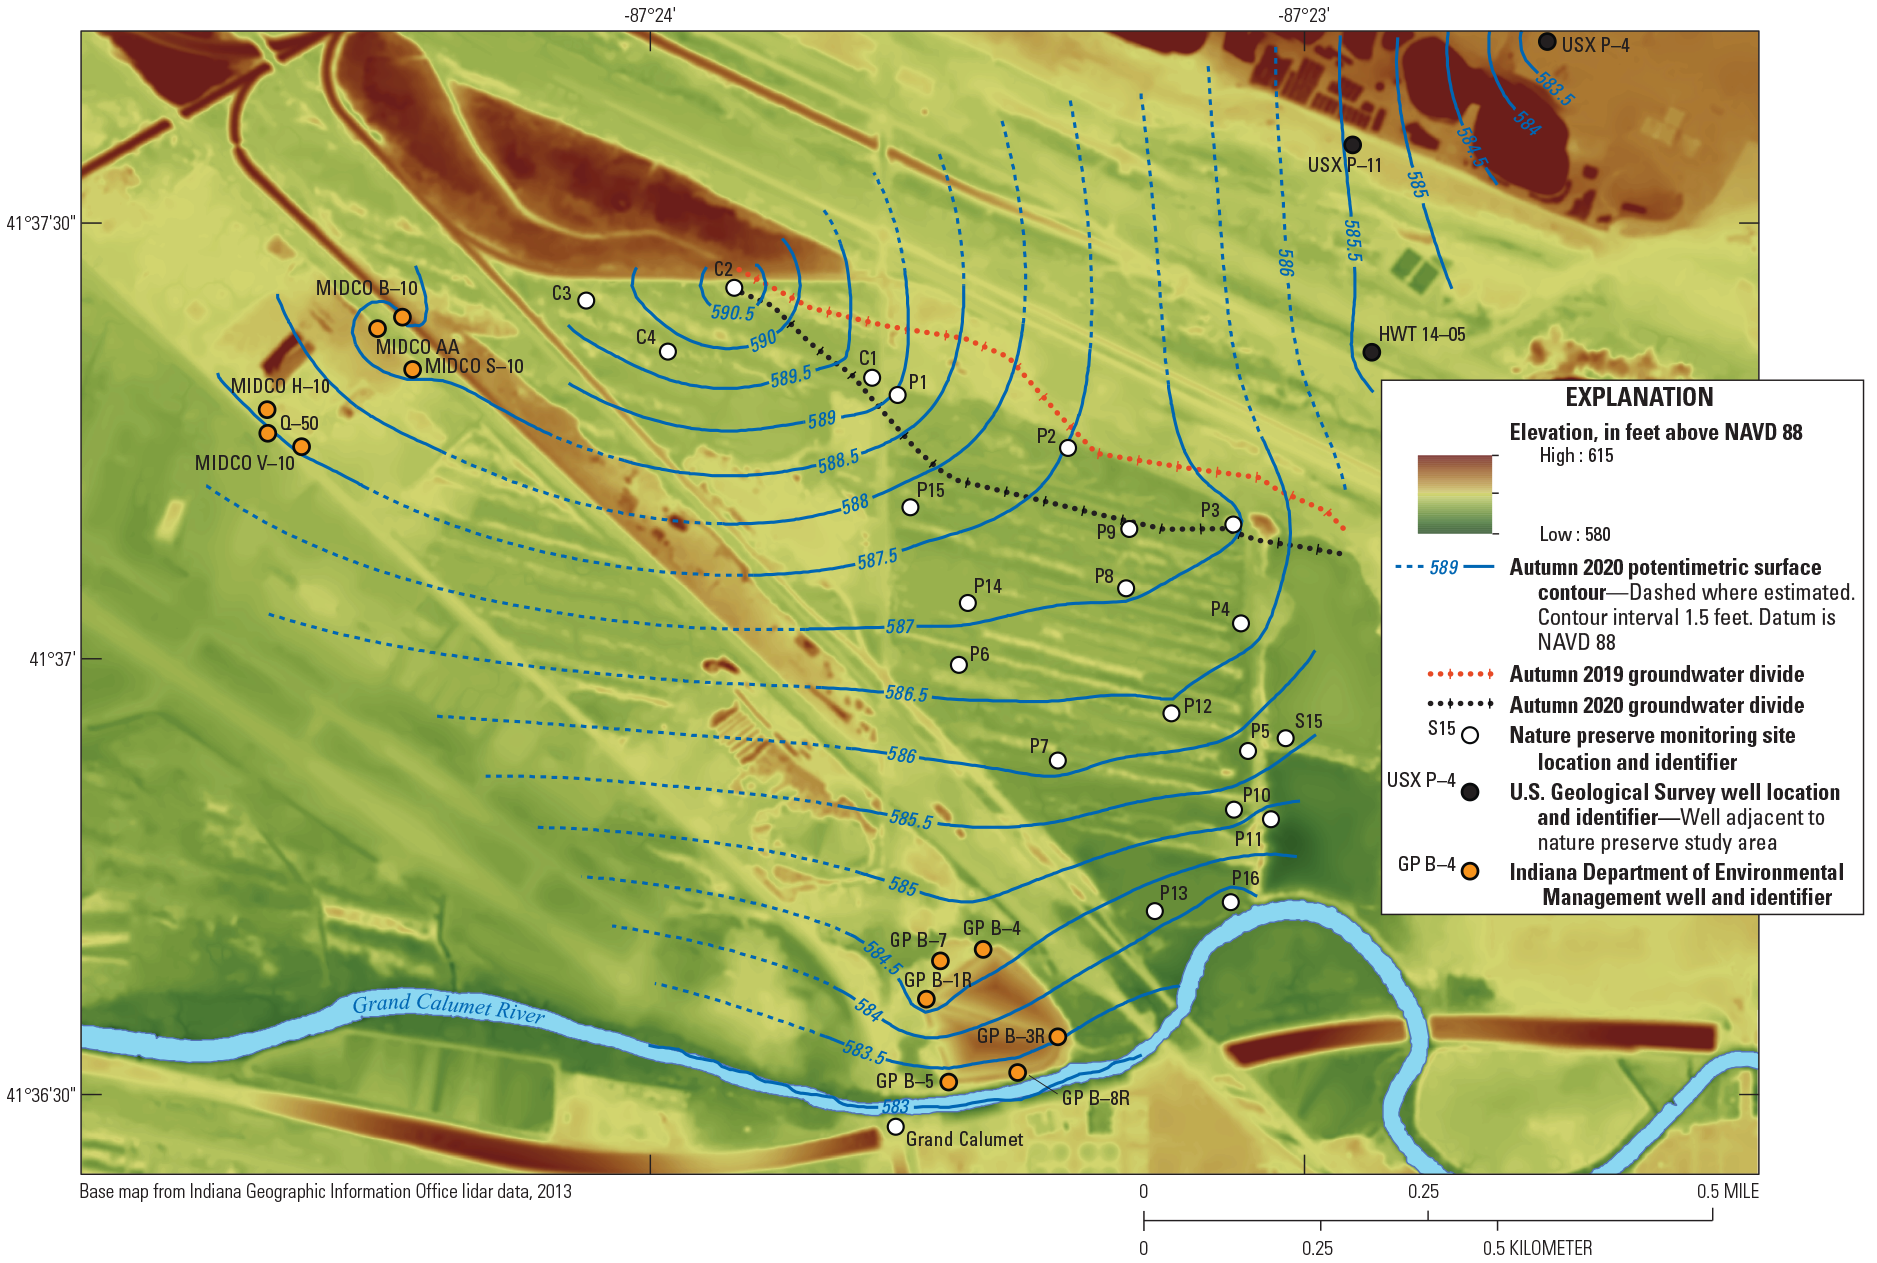
Map showing potentiometric contours at the Clark and Pine Nature Preserve and the Pine Station Nature Preserve near Gary, Indiana. NAVD 88, North American Vertical Datum of 1988.
Rainfall and Evapotranspiration
Measured rainfall and calculated ET0 indicated that hydrologic conditions were partially driven by meteorological patterns at the preserves during the study period (September 2019–June 2022). Rainfall trends were compared with 30-year normal precipitation data (1991–2020) from a nearby weather station (not shown) at Indiana Dunes National Park (National Oceanic and Atmospheric Administration, 2021; Station ID USC00124244). Even though water year 2020 (October 1, 2019–September 30, 2020) had near-normal precipitation (39.16 inches per year) based on 30-year normal precipitation, the distribution pattern included an abnormally wet spring (16.27 in.) followed by below-average rainfall in the summer (table 2). Dry conditions persisted into water year 2021 (October 1, 2020–September 30, 2021) with below-average precipitation during the autumn, winter, and spring seasons (table 2). Calculated ET0 exceeded rainfall for water year 2021 by 7 in. (table 2), indicating a net loss of water from the study area owing to meteorological conditions. With rainfall exceeding ET0 by only 1.4 in. during water year 2022, it is likely that ET0-driven water loss plays an important role in lowering shallow groundwater and wetland water levels throughout the region during periods when wetlands are affected by high water levels in the Grand Calumet River and Lake Michigan.
Table 2.
Primary water budget components at Pine Station Nature Preserve near Gary, Indiana, for water years 2020–22.[Data are from U.S. Geological Survey (2023). Evapotranspiration calculated following the daily time step approach described by Allen and others (1998) using wind speed, air temperature, relative humidity, and solar radiation data collected at the site weather station. ET0, reference evapotranspiration; in., inch]
Specific Conductance
Solute concentrations in closed-basin wetlands are often affected by evaporation and dilution effects (LaBaugh and others, 2016), and specific conductance trends at three of four monitoring wells (fig. 8) indicate these effects at preserve wetland cells (higher specific conductance values indicate more ions in water). Groundwater levels are generally inversely related to specific conductance at monitoring wells P8 (September 22 to November 22, 2020; fig. 8B), P12 (September 22 to November 22, 2020; fig. 8C) and C4 (August 22 to October 22, 2021; fig. 8D) suggesting that solute concentration increases when water levels are low. Groundwater in wetland cells monitored by these wells is typically diluted during high water levels, resulting in lower specific conductance values (fig. 8B–D).
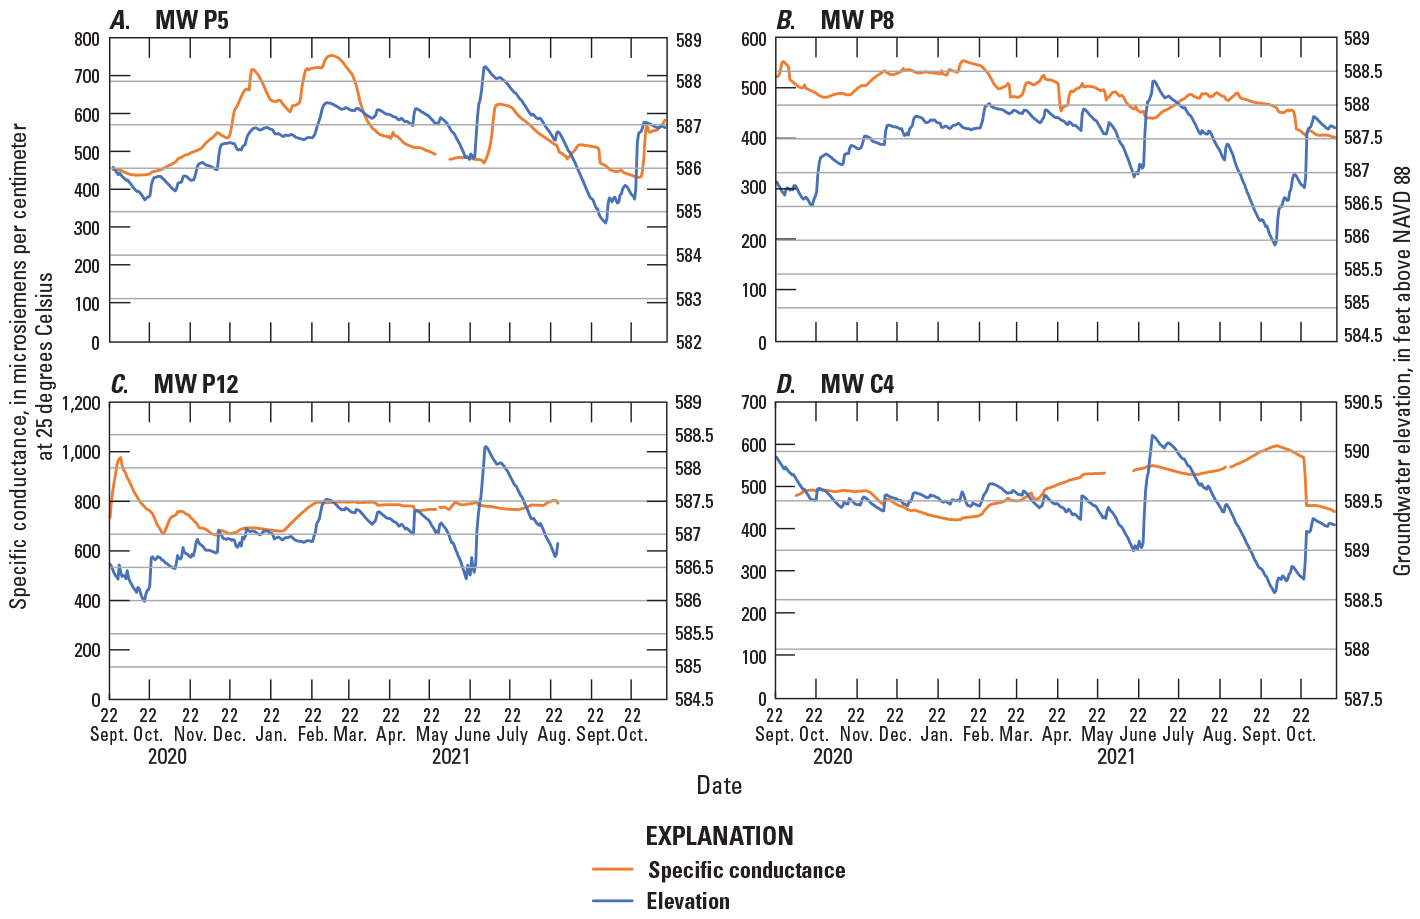
Graphs showing continuous specific conductance and groundwater elevation in monitoring wells A, MW P5, B, MW P8, C, MW P12, and D, MW C4 at Clark and Pine Nature Preserve and Pine Station Nature Preserve near Gary, Indiana. NAVD 88, North American Vertical Datum of 1988.
Alternatively, the specific conductance data closely follow water level patterns at monitoring well P5 (fig. 8A); increases in groundwater elevation in March 2021 and July 2021 coincide with increases in specific conductance. This suggests that there is a more active flow regime along the eastern edge of the preserves, and that the connected wetland cells are diluted following wet periods that bring water high in solutes into the eastern basin where connected wetland cells are present. For example, groundwater level, water temperature, and specific conductance data collected at monitoring well P5 leading up to and following an October 2021 rainstorm (fig. 9) provide a detailed “snapshot” of coupled groundwater/surface-water dynamics and water quality. The increase in water level following the late-October precipitation is accompanied by a decrease in water temperature (indicating cool meteoric water recharging the shallow aquifer) and accompanying increase in specific conductance (about 140 µS/cm), indicating increasing solute concentrations in surface water and groundwater flowing north-to-south in the vicinity of monitoring well P5.
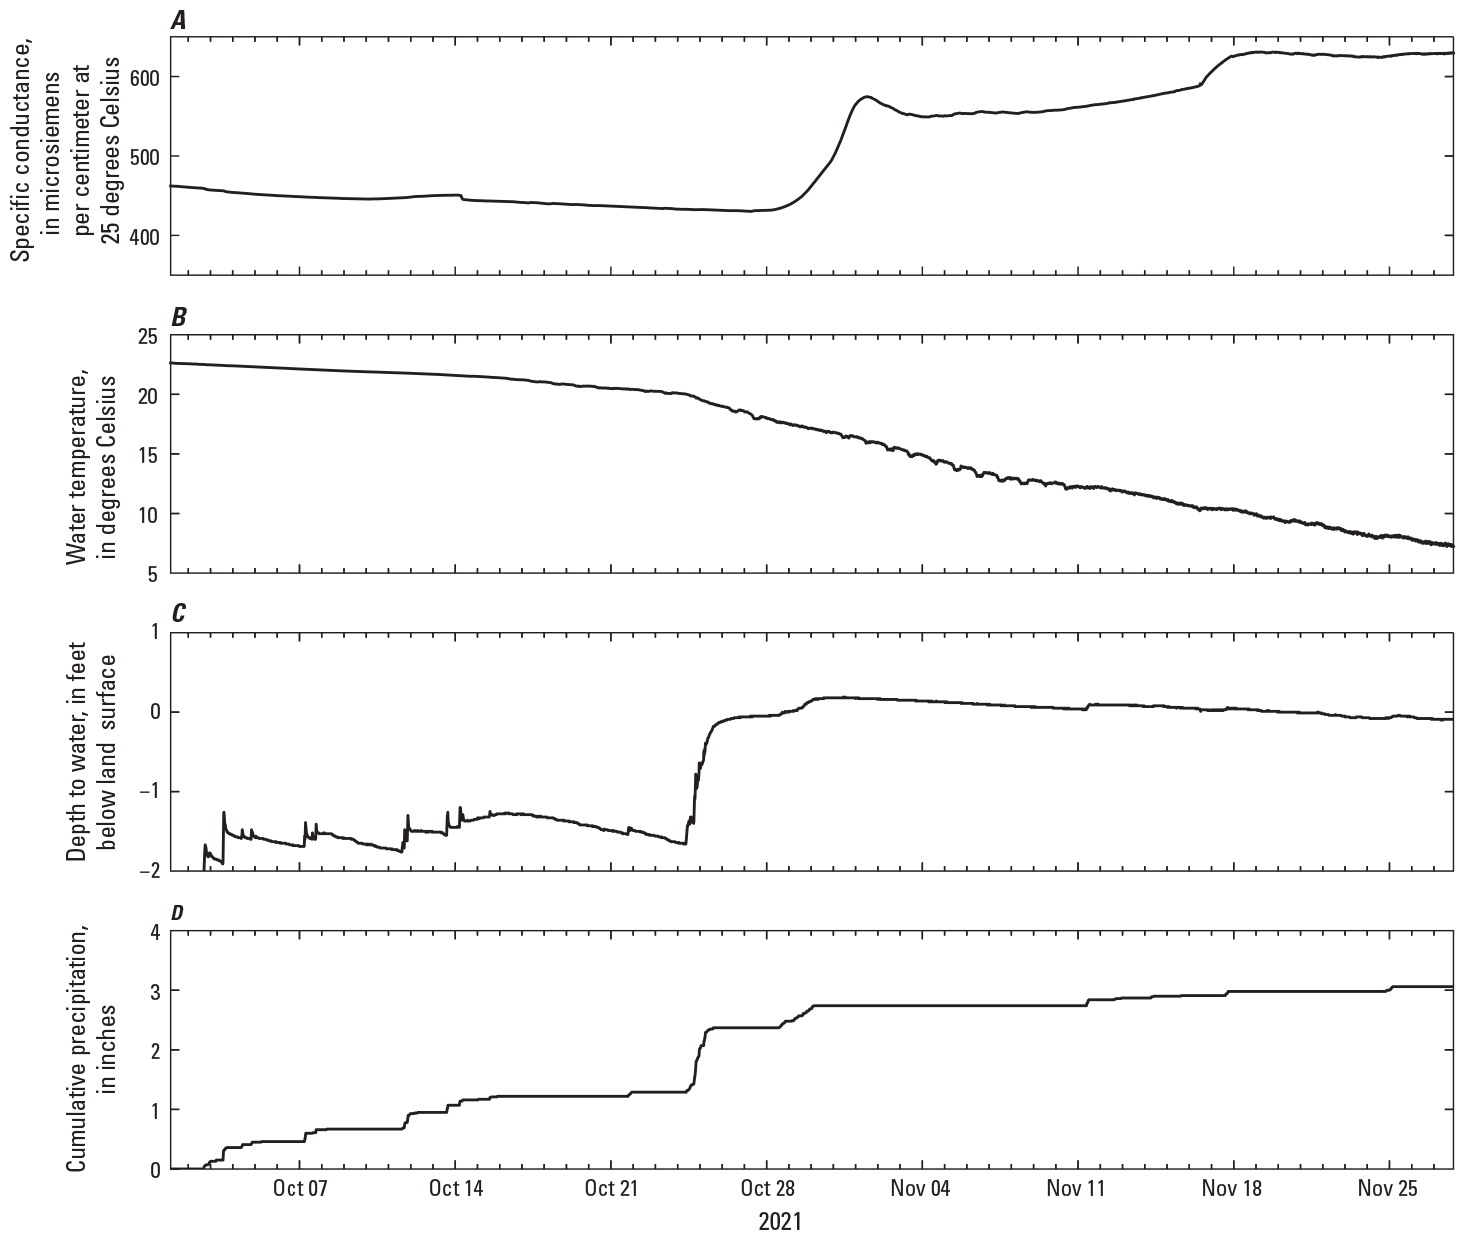
Graphs of continuous A, specific conductance, B, water temperature, and C, depth to groundwater at U.S. Geological Survey well MW P5 leading up to and following D, a rainstorm in late October 2021 at the Clark and Pine Nature Preserve and the Pine Station Nature Preserve near Gary, Indiana.
A statistical analysis of continuous specific conductance and water-level data was conducted to quantitatively assess trends for these parameters. The Spearman’s rank correlation coefficient is used because it does not assume normal distribution of data and is suitable to assess linear and nonlinear relations between variables (Haque and others, 2018). For monitoring well P5, the Spearman’s rank correlation coefficient is 0.63 (p<0.001) indicating a positive trend between water level and specific conductance. Alternatively, for monitoring well C4, the Spearman’s rank correlation coefficient is −0.30 (p<0.001) suggesting an inverse relation between water level and specific conductance (when water level increases, specific conductance decreases), consistent with dilution effects associated with rising water levels.
Discrete Water-Quality Sampling
Major Ions and Nutrients
Ions in groundwater at the preserves primarily consist of calcium and magnesium as the major cations and bicarbonate as the major anion (fig. 10; table 3), indicating sources from interactions with the bedrock limestone and dolomite aquifers, consistent with a previous study of shallow groundwater adjacent to southwestern Lake Michigan (Cherkauer and Zvibleman, 1981). These results contrast data from a study in the vicinity of Cowles Bog, approximately 15 mi east of the study area, that indicated shallow groundwater high in sulfate anions (including dilute calcium sulfate) for shallow dune and intradunal wetland aquifers (Shedlock and others, 1993).
Table 3.
Major ions and dissolved solids in water-quality samples collected in August 2020 at Clark and Pine Nature Preserve and Pine Station Nature Preserve near Gary, Indiana.[mg/L, milligram per liter; CaCO3, calcium carbonate; NA, not applicable; NS, not sampled; E, estimated]
| U.S. Geological Survey site field identifier (see table 1) | Calcium (mg/L) | Magnesium (mg/L) | Sodium (mg/L) | Potassium (mg/L) | Chloride (mg/L) | Bromide (mg/L) | Chloride-to-bromide ratio | Sulfate (mg/L) | Fluoride (mg/L) | Field alkalinity (mg/L as CaCO3) | Dissolved solids (mg/L) |
| C1 | 76.6 | 20.5 | 3.70 | 3.58 | 3.06 | 0.030 | 102 | 0.05 | 0.34 | 324 | 329 |
| C2 | 77.2 | 30.8 | 4.47 | 3.11 | 7.13 | 0.035 | 204 | 3.98 | 0.43 | 195 | 204 |
| C3–SW | 51.6 | 13.3 | 1.86 | 1.41 | 2.82 | 0.017 | 166 | 0.50 | 0.36 | NA | 193 |
| C4 | 51.1 | 20.7 | 2.61 | 4.53 | 1.60 | 0.014 | 114 | 2.94 | 0.48 | 300 | 227 |
| P1 | 73.9 | 25.0 | 3.52 | 5.14 | 3.35 | 0.014 | 239 | 0.04 | 0.35 | 306 | 319 |
| P2 | 90.2 | 23.1 | 18.3 | 23.8 | 18.9 | 0.058 | 326 | 6.21 | 0.67 | 331 | 421 |
| P3 | 64.6 | 24.1 | NA | 27.6 | 19.8 | E0.049 | 404 | 0.12 | 0.79 | 326 | 397 |
| P4 | 64.8 | 23.9 | 12.2 | 10.5 | 10.8 | E0.023 | 470 | 7.77 | 0.55 | 281 | 323 |
| P5 | 53.3 | 19.1 | 7.78 | 9.39 | 7.41 | E0.031 | 239 | 0.07 | 0.61 | 230 | 287 |
| P6 | 104 | 38.4 | 13.1 | 5.38 | 17.2 | 0.063 | 273 | 0.11 | 1.08 | 473 | 536 |
| P7 | 41.4 | 14.7 | 8.11 | 7.01 | 5.58 | 0.029 | 192 | 0.05 | 0.50 | 189 | 217 |
| P8 | 69.6 | 33.9 | 10.3 | 3.43 | 6.77 | E0.033 | 205 | 0.04 | 1.00 | 318 | 340 |
| P9 | NS | NS | NS | NS | NS | NS | NS | NS | NS | NS | NS |
| P10 | 63.5 | 16.1 | 10.1 | 3.48 | 9.06 | E0.034 | 266 | 1.28 | 0.88 | 226 | 266 |
| P11 | 67.9 | 15.1 | 8.60 | 5.11 | 11.0 | 0.026 | 423 | 29.3 | 0.84 | 222 | 297 |
| P12 | NS | NS | NS | NS | NS | NS | NS | NS | NS | NS | NS |
| P13 | 85.5 | 22.4 | 9.41 | 3.61 | 10.5 | E0.037 | 284 | 0.66 | 0.68 | NA | 369 |
| P14 | 96.1 | 22.3 | 6.21 | 8.14 | 8.66 | E0.068 | 127 | 0.07 | 0.64 | 399 | 459 |
| P15 | NS | NS | NS | NS | NS | NS | NS | NS | NS | NS | NS |
| P16 | NS | NS | NS | NS | NS | NS | NS | NS | NS | NS | NS |
| S13–Confluence | 43.0 | 13.8 | 16.5 | 2.67 | 28.0 | 0.077 | 364 | 38.7 | 0.42 | NA | 225 |
| S13–Discharge | 80.2 | 11.2 | 35.4 | 2.39 | 84.6 | 0.041 | 2,060 | 117 | 0.17 | NA | 406 |
| Laboratory detection limits | 0.022 | 0.01 | 0.40 | 0.30 | 0.02 | 0.01 | NA | 0.02 | 0.01 | NA | NA |
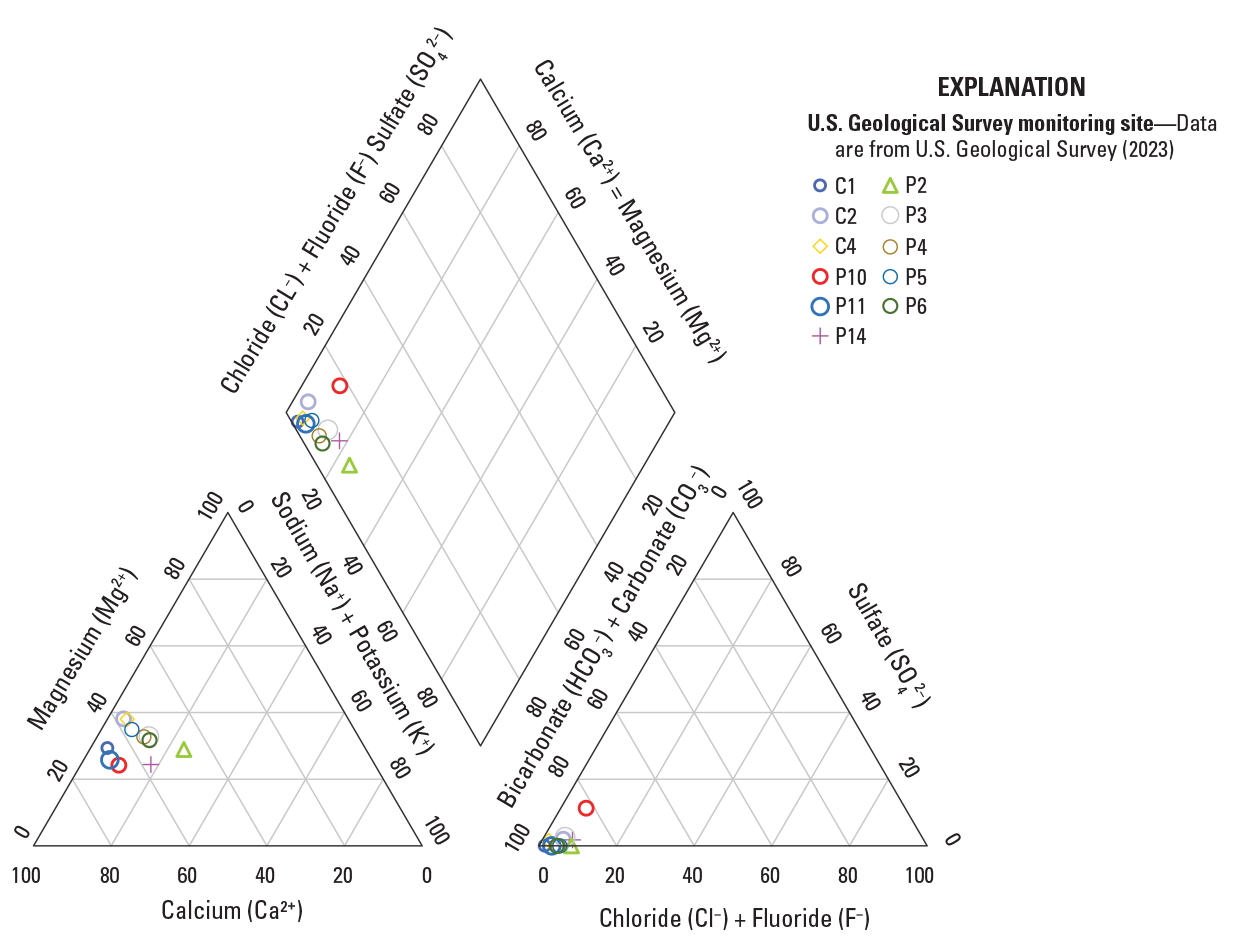
Piper diagram of major ions detected in groundwater samples collected in August 2020 at the Clark and Pine Nature Preserve and Pine Station Nature Preserve near Gary, Indiana.
Chloride concentrations in monitoring wells were generally below 10 milligrams per liter (mg/L), but concentrations were greater than 10 mg/L at wells P2, P3, P4, P6, P11, and P13 (table 3). Road salt (deicers) may be applied along Clark Road but not along the access road. Other sources of chloride beyond deicers are water softener effluent, wastewater effluent, livestock runoff, landfills, agricultural chemicals, and ancient brines (Panno and others, 2006). The source of chloride can be determined through a chloride-to-bromide (Cl:Br) ratio analysis. Chloride and bromide are conservative in groundwater and transport through the aquifer with limited interaction, transformation, or attenuation with aquifer materials (Panno and others, 2006; Davis and others, 1998). Sources of bromide can be from septic tanks, deicers, agricultural chemicals, industrial solvents, and gasoline additives, but concentrations are typically 40 to 80,000 times less than chloride concentrations; thus, small changes elicit large variations in the ratios of chloride to bromide (Davis and others, 1998). The end members and source mixing curves were developed from the northern glacial aquifer by Panno and others (2005) and Mullaney and others (2009). The Cl:Br ratio for each sample location was plotted along the mixing curves to evaluate potential sources (fig. 11). The proximity of the Cl:Br ratio plotted near or on a mixing-curve line indicates a possibility that the end member is a potential source of the chloride. The results indicate that the preserve samples are predominately interacting with dilute groundwater. The sample plots for the S13–Discharge monitoring site between the animal waste and halite curves indicate a different source of water compared with other sampling locations throughout the preserves.
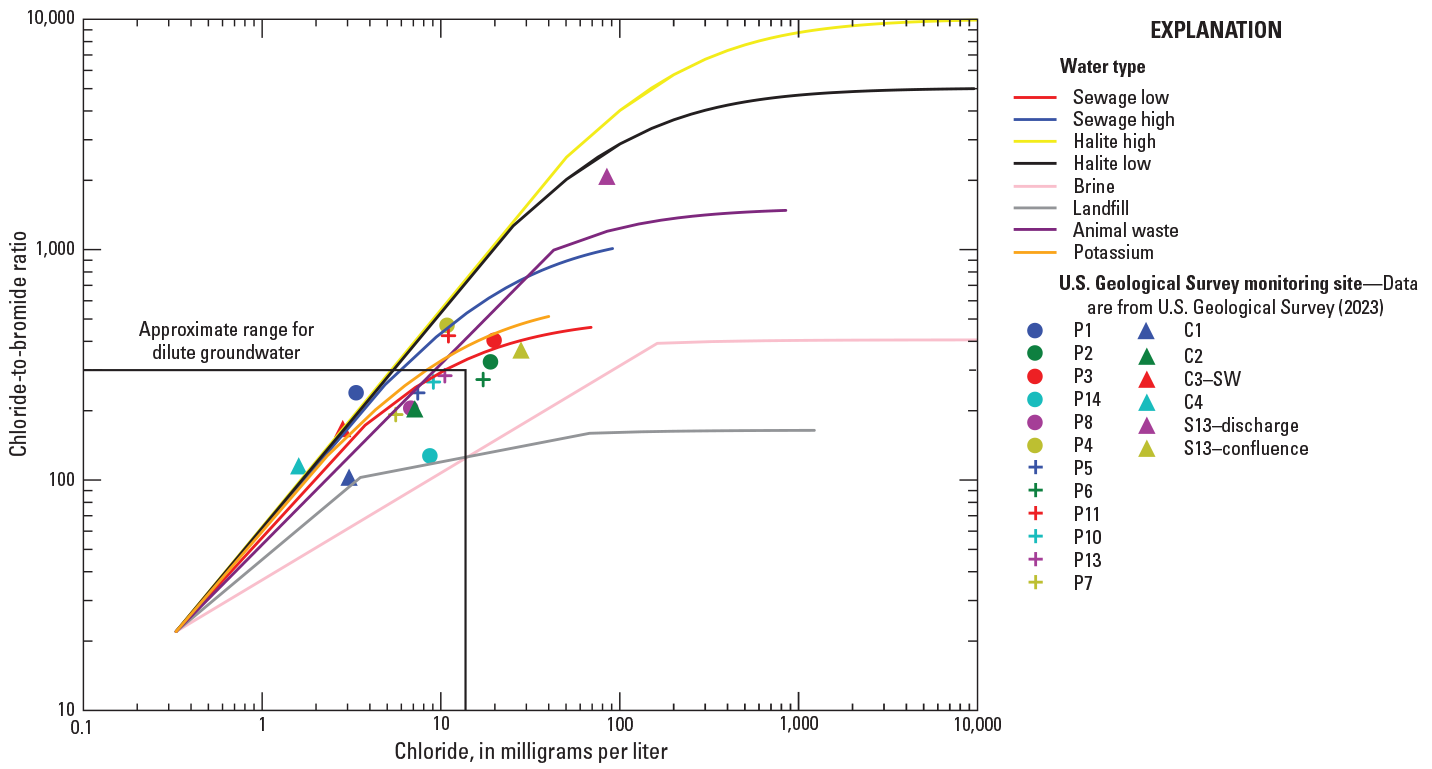
Graph showing the relation of chloride-to-bromide ratios to chloride concentrations, with mixing curves representing sources of chloride, for samples collected in August 2020 at Clark and Pine Nature Preserve and Pine Station Nature Preserve near Gary, Indiana.
Nutrient concentrations in samples collected at the preserves in August 2020 are generally low, and data for nitrogen species (table 4) indicate reducing conditions in shallow groundwater. Phosphorus, measured as orthophosphate in milligrams per liter, is less than 0.10 mg/L in all well samples. The pH of samples is near neutral (6.5 to 7.6 and does not appear to influence nutrient concentrations). Dissolved oxygen in all wells is less than or equal to 1 mg/L, a further indication of reducing conditions favorable for ammonia as the dominant nitrogen compound. Groundwater concentrations of nitrate (nitrate plus nitrite) are at or below the detection limit (0.04 mg/L) in all wells, and surface-water concentrations are less than 1 mg/L. Concentrations of nitrite in groundwater are less than 0.01 mg/L in all samples. Nitrite concentrations are highest in surface-water samples from the steel discharge pipe (well S13–Discharge, 0.123 mg/L) and Grand Calumet River confluence (well S13–Confluence, 0.036 mg/L). Ammonia as nitrogen is the dominant nitrogen species with the highest concentrations at wells P14 (3.38 mg/L) and P6 (3.83 mg/L) in the west-central part of the study area (fig. 4). According to Kay and others (1997), slag deposits produced from manufacturing iron and steel are commonly used as fill in the area surrounding the preserves and are a potential source of elevated ammonia concentrations.
Table 4.
Nutrient, pH, and dissolved oxygen concentrations in water-quality samples collected in August 2020 at Clark and Pine Nature Preserve and Pine Station Nature Preserve near Gary, Indiana.[mg/L, milligram per liter; N, nitrogen; P, phosphorus; <, less than; NA, not available; NS, not sampled; —, not applicable]
| U.S. Geological Survey site field identifier (see table 1) | Ammonia (mg/L as N) | Nitrite (mg/L as N) | Nitrate plus nitrite (mg/L as N) | Orthophosphate (mg/L as P) | pH | Dissolved oxygen (mg/L) |
|---|---|---|---|---|---|---|
| C1 | 0.15 | 0.001 | <0.04 | <0.004 | 6.8 | 0.30 |
| C2 | 0.06 | <0.001 | <0.04 | 0.004 | 7.6 | 1.0 |
| C3–SW | <0.01 | <0.001 | 0.04 | <0.004 | NA | NA |
| C4 | 0.14 | <0.001 | <0.04 | <0.004 | 7.5 | 0.70 |
| P1 | 0.24 | 0.002 | <0.04 | <0.004 | 7.2 | 0.30 |
| P2 | 0.03 | 0.002 | <0.04 | 0.004 | 6.8 | 0.30 |
| P3 | 0.69 | 0.001 | <0.04 | 0.019 | 7.1 | 0.30 |
| P4 | 0.74 | 0.002 | <0.04 | 0.043 | 7.0 | 0.30 |
| P5 | 0.70 | 0.002 | <0.04 | <0.004 | 7.2 | 0.30 |
| P6 | 3.83 | <0.001 | <0.04 | 0.007 | 6.6 | 0.30 |
| P7 | 0.33 | 0.002 | <0.04 | 0.037 | 7.5 | 0.80 |
| P8 | 0.89 | 0.001 | <0.04 | 0.023 | 7.1 | 0.30 |
| P9 | NS | NS | NS | NS | NS | NS |
| P10 | 0.19 | 0.001 | <0.04 | 0.012 | 7.0 | 0.60 |
| P11 | 0.19 | 0.002 | <0.04 | 0.009 | 7.4 | 0.70 |
| P12 | NS | NS | NS | NS | NS | NS |
| P13 | 0.21 | 0.003 | <0.04 | 0.005 | 7.0 | 0.80 |
| P14 | 3.38 | 0.007 | <0.04 | 0.005 | 6.5 | 0.30 |
| P15 | NS | NS | NS | NS | NS | NS |
| P16 | NS | NS | NS | NS | NS | NS |
| S13–Confluence | 0.23 | 0.036 | 0.32 | <0.004 | 7.6 | 8.7 |
| S13–Discharge | 0.11 | 0.123 | 0.25 | <0.004 | 7.5 | 6.5 |
| Laboratory detection limits | 0.01 | 0.001 | 0.04 | 0.004 | — | — |
Trace Elements
Iron and manganese concentrations in groundwater samples are elevated at several of the well locations (fig. 12; table 5) indicating that these trace elements are being retained in wetland cells, supporting the water filtration function of wetlands in the study area. Iron exceeds the EPA drinking water secondary maximum contaminant level (SMCL; U.S. Environmental Protection Agency, 2018) of 300 micrograms per liter (µg/L) for all the groundwater samples, ranging from 962 µg/L (well C2) to 32,800 µg/L (well P6). None of the surface-water samples (wells C3–SW, S13–Confluence, S13–Discharge) exceed the EPA drinking water SMCL for iron, or the chronic aquatic life criteria for iron (1,000 µg/L; U.S. Environmental Protection Agency, 2022a). Forty percent (6 of 15) of groundwater samples exceed the USGS health-based screening level of 4,000 µg/L for iron (Norman and others, 2018; U.S. Geological Survey, 2022). Manganese concentrations range from 132 µg/L (well C2) to 1,490 µg/L (well P14) in groundwater samples, exceeding the USGS health-based screening level of 300 µg/L in 67 percent of groundwater samples (10 of 15). The EPA has not established aquatic life criteria for manganese. None of the sites sampled in this study are used as a source for potable drinking water.
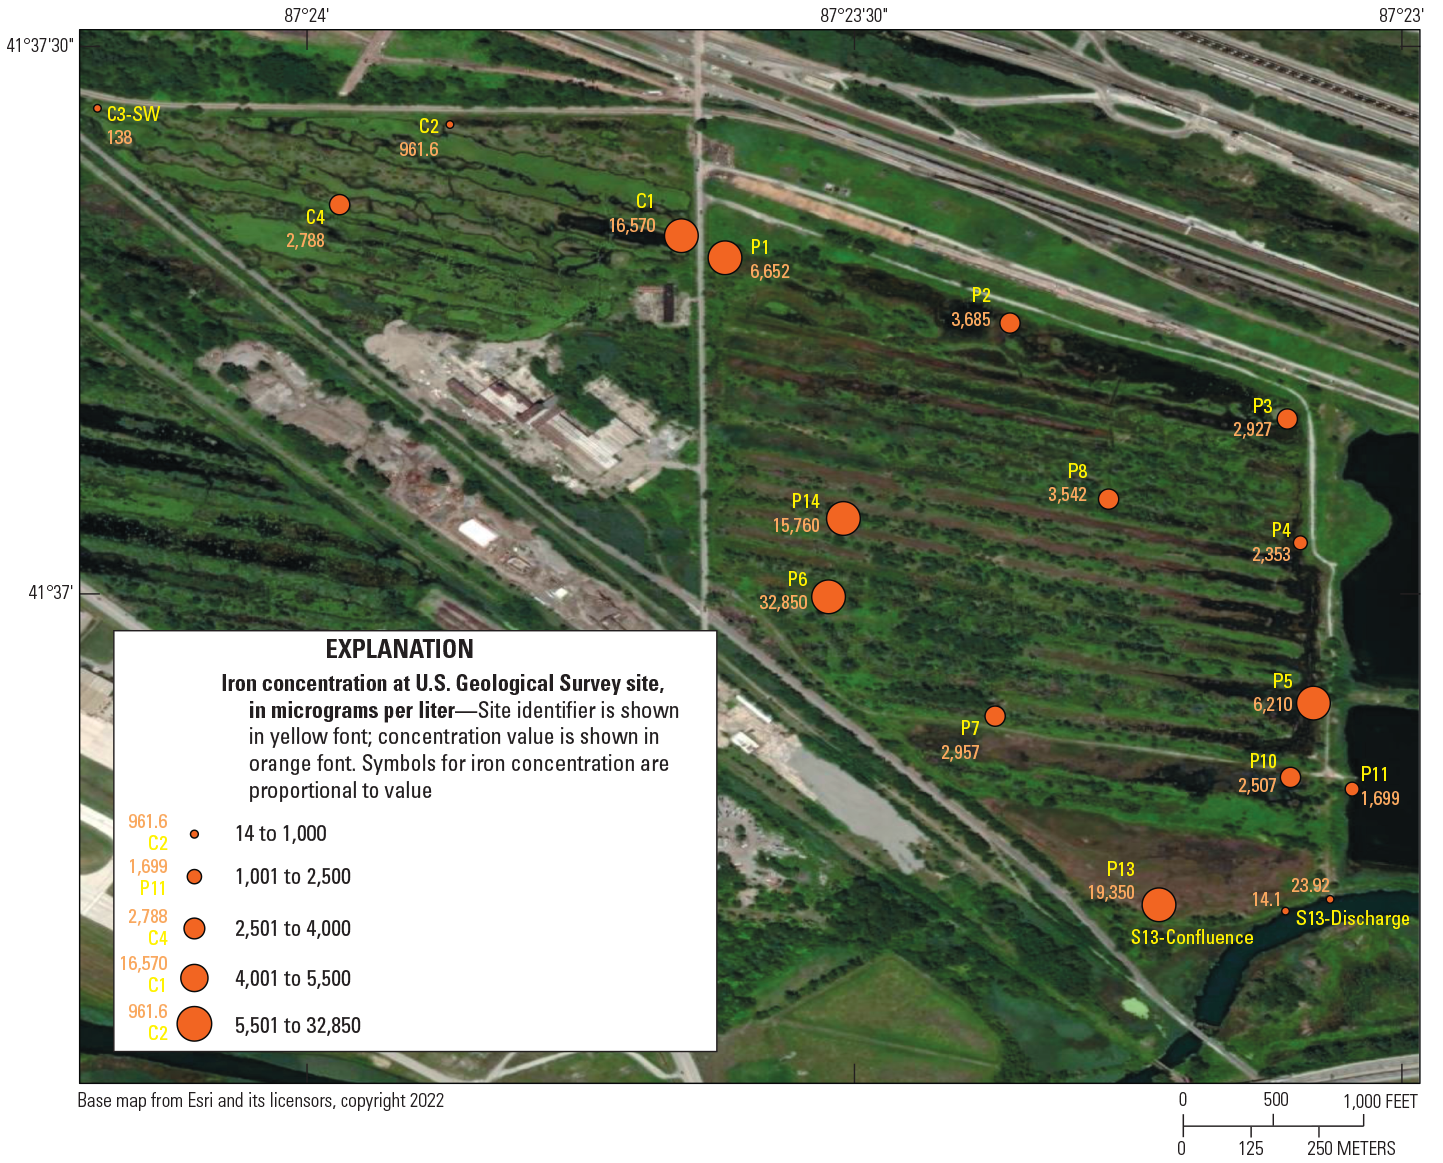
Map showing iron concentrations in groundwater and surface-water samples collected in August 2020 at the Clark and Pine Nature Preserve and Pine Station Nature Preserve near Gary, Indiana.
Table 5.
Concentrations of selected trace elements in water-quality samples collected in August 2020 at Clark and Pine Nature Preserve and Pine Station Nature Preserve near Gary, Indiana.[µg/L, microgram per liter; <, less than; NS, not sampled]
| U.S. Geological Survey site field identifier (see table 1) | Arsenic (µg/L) | Barium (µg/L) | Boron (µg/L) | Iron (µg/L) | Lead1 (µg/L) | Manganese (µg/L) | Molybdenum (µg/L) | Strontium (µg/L) | Zinc (µg/L) | Aluminum (µg/L) | Lithium (µg/L) |
|---|---|---|---|---|---|---|---|---|---|---|---|
| C1 | 26.6 | 50.2 | 267 | 16,600 | <0.12 | 1,310 | 2.12 | 127 | 503 | <3.0 | 9.60 |
| C2 | 4.00 | 14.4 | 204 | 962 | 0.17 | 132 | 1.94 | 71.9 | 462 | <3.0 | 3.76 |
| C3–SW | 0.86 | 27.4 | 159 | 138 | 0.05 | 52.7 | 0.67 | 90.8 | 2.1 | 4.0 | 8.31 |
| C4 | 16.5 | 30 | 66.0 | 2,790 | 0.04 | 141 | 11.4 | 78.4 | 519 | <3.0 | 5.29 |
| P1 | 15.3 | 149 | 216 | 6,650 | <0.16 | 313 | 0.83 | 125 | 713 | <3.0 | 16.1 |
| P2 | 4.00 | 61.8 | 4,690 | 3,680 | <0.14 | 148 | 15.5 | 574 | 567 | <21.0 | 65.2 |
| P3 | 4.30 | 45.3 | 3,950 | 2,930 | 0.08 | 432 | 12.3 | 377 | 223 | <9.0 | 32.6 |
| P4 | 5.70 | 121 | 1,660 | 2,350 | 0.10 | 576 | 2.37 | 168 | 292 | <3.0 | 15.6 |
| P5 | 25.6 | 79.5 | 987 | 6,210 | 0.12 | 483 | 10.8 | 166 | 1,360 | <45.0 | 23.1 |
| P6 | 59.6 | 134 | 263 | 32,800 | 0.09 | 1,250 | 0.94 | 153 | 7,460 | <15.0 | 9.22 |
| P7 | 7.00 | 35.9 | 1,250 | 2,960 | 0.11 | 229 | 6.50 | 83.2 | 1,010 | <36.0 | 10.9 |
| P8 | 24.1 | 21.4 | 193 | 3,540 | 0.30 | 326 | 5.37 | 99 | 1,750 | 3.0 | 6.31 |
| P9 | NS | NS | NS | NS | NS | NS | NS | NS | NS | NS | NS |
| P10 | 10.7 | 15.6 | 668 | 2,510 | 0.02 | 255 | 11.8 | 91.7 | 667 | <3.0 | 5.96 |
| P11 | 6.20 | 34.4 | 990 | 1,700 | 0.16 | 479 | 7.85 | 288 | 2,400 | <15.0 | 7.30 |
| P12 | NS | NS | NS | NS | NS | NS | NS | NS | NS | NS | NS |
| P13 | 18.9 | 60.3 | 619 | 19,400 | 0.02 | 1,070 | 0.67 | 107 | 7,030 | <3.0 | 3.54 |
| P14 | 5.10 | 90.3 | 99.0 | 15,800 | 0.16 | 1,490 | 1.22 | 109 | 29,400 | 21.0 | 4.75 |
| P15 | NS | NS | NS | NS | NS | NS | NS | NS | NS | NS | NS |
| P16 | NS | NS | NS | NS | NS | NS | NS | NS | NS | NS | NS |
| S13–Confluence | 1.20 | 23.4 | 56.0 | 14.1 | 0.07 | 9.24 | 14.9 | 125 | <2.00 | 27.0 | 9.79 |
| S13–Discharge | 1.30 | 18.3 | 82.0 | 23.9 | <0.12 | 9.14 | 4.80 | 144 | <12.0 | 24.0 | 12.6 |
| Laboratory detection limits | 0.10 | 0.10 | 2.00 | 10.0 | 0.02 | 0.20 | 0.05 | 0.40 | 2.00 | 3.0 | 0.15 |
Zinc concentrations are also elevated in many of the monitoring wells with elevated iron and manganese (table 5). Zinc ranges from 223 µg/L (well P3) to 29,400 µg/L (well P14) in the groundwater wells, and from less than detection limits to 2.1 µg/L in surface-water samples. Zinc does not have an established maximum contaminant level (MCL), but it does have a USGS noncancer health-based screening level of 2,000 µg/L that was exceeded at four monitoring wells (P6, P11, P13 and P14; Norman and others, 2018). The one detection of zinc in a surface-water sample is well below the acute and chronic aquatic life criteria of 120 µg/L (criteria include an adjustment for hardness; U.S. Environmental Protection Agency, 2022a).
Aluminum ranges from <3.0 to 21.0 µg/L in groundwater samples and from 4.0 to 27.0 µg/L in surface-water samples (table 5). Aluminum is detected at elevated concentrations at P14 (fig. 4; table 5) but may be sourced from historical activities near the site or naturally occurring in minerals associated with dune sands.
Arsenic concentrations range from 0.86 to 59.6 µg/L with a median of 7 µg/L (table 5) for all monitoring sites and exceed the EPA drinking water MCL of 10 µg/L in 53 percent of groundwater samples (8 of 15). The distribution appears somewhat sporadic and may be associated with higher iron concentrations (table 5) because arsenic bonds readily to iron (Guo and others, 2013). Arsenic occurs naturally but can also be anthropogenic and result from agricultural chemicals, metal alloys, glass industries, and coal-burning power plants (Han and others, 2003).
Boron concentrations range from 56 to 4,690 µg/L (table 5) with a median of 263 µg/L and are generally higher in monitoring wells (P2, P3, P4, P5, P11; fig. 4) along the access road separating the North and South Ponds from the Pine Station Nature Preserve wetland cells (fig. 4). Boron is commonly found in coal combustion residue leachate (Naylor and others, 2012), in construction and demolition debris (Xu and others, 2020), and may be leaching from the coal fly ash and other materials that were used to build the access road. Other sources of boron are from manufacturing of glass, ceramics, fertilizers, and detergents (Paternoster, 2019), which may be in this heavily industrialized part of Gary. As a conservative geochemical element, boron transports readily through surface water and groundwater without substantial interaction with biota, evaporation, volatilization, oxidation-reduction reactions, mineral precipitation, or dissolution (Buszka and others, 2007). High boron concentrations are measured at monitoring wells P7 (1,250 µg/L) and P13 (619 µg/L), which are away (0.25 to 0.5 mi) from the access road (fig. 1), indicating that there may be additional sources along the western part of the Pine Station Nature Preserve.
Groundwater concentrations of lithium (table 5) are also higher along the access road at wells P2 (65.2 µg/L) and P3 (32.6 µg/L). This is consistent with previous research noting the occurrence of high-lithium-content fly ash (Hu and others, 2018), but lithium is also used in ceramic, glass, and alloy production (Lindsey and others, 2021). Lithium is toxic to some plants and aquatic organisms at 60 to 100 µg/L (Hem, 1985; Kszos and Stewart, 2003).
Volatile Organic Compounds
Discrete water-quality samples were analyzed for a total of 84 VOCs, and 20 of these VOCs were detected at least once at 7 monitoring wells and 3 surface-water locations (table 6). The surface-water samples had a higher occurrence of VOCs than the groundwater samples. The S13–Confluence site had the highest number of detections at 11 detections; the S13–Discharge pipe site had 9 detections; and the C3–SW site (fig. 4) had 6 detections. The C3–SW sampling site is in the northwest corner of the Clark and Pine Nature Preserve and is downgradient from an elevated landfill north of the study area (fig. 7). All concentrations were below regulatory and nonregulatory water-quality benchmarks. No VOC compound was detected at more than three sites, but bromodichloromethane, trichloromethane, acetone, and methyl ethyl ketone were detected at all three surface-water sampling sites (table 6).
Table 6.
Detected volatile organic compounds in water-quality samples collected August 2020 at Clark and Pine Nature Preserve and Pine Station Nature Preserve near Gary, Indiana.[µg/L, microgram per liter; E, estimated; <, less than]
Quality Assurance
Quality-assurance and quality-control samples were collected to evaluate and control bias in the analytical results. One equipment blank and one replicate were collected during the August 2020 water-quality sample collection in accordance with the USGS “National Field Manual for the Collection of Water-Quality Data” (U.S. Geological Survey, variously dated). The equipment blank and replicate samples were analyzed for major ions, trace elements, and volatile organic compounds. Barium (2.10 µg/L), calcium (0.042 mg/L), lead (0.04 µg/L), strontium (1.83 µg/L), and zinc (3 µg/L) had detections in the equipment blank, but concentrations were generally below the concentrations detected in the environmental samples, except for lead. Therefore, the results for these compounds are included in the results section, and lead results are qualified as estimated. Copper was detected in the equipment blank at a concentration of 17.5 µg/L.
Three VOC concentrations (1,2,4-trimethylbenzene, ethylbenzene, and m-xylene plus p-xylene) were detected in the equipment blank but were below their reporting limits of 0.016 µg/L, 0.018 µg/L, and 0.08 µg/L, respectively. Trichloroethylene was detected in the equipment blank at a concentration of 0.041 µg/L, which is above the environmental sample concentration (less than 0.025 µg/L). Detections of these compounds in environmental samples are not presented in the results section. For the replicate results, the relative percent difference, calculated as the difference in the environmental and replicate concentration divided by the mean of the two concentrations, was less than 10 percent for all except for three constituents. Ammonia as nitrogen, nitrite as nitrogen, and selenium had replicate differences greater than 10 percent, and some compounds were detected in either the environmental sample or the replicate, but not both (isopropylbenzene, 1,3,5-trimethylbenzene, copper, and nickel). Detections in either the sample or the replicate, but not both, were still considered as potential detections and are included in the data analyses (except for copper) and interpretations because the concentrations were generally low and within the detection limits of the laboratory analytical methods (Foreman and others, 2021).
Groundwater-Flow Patterns and Interactions with Surface-Water Features
The potentiometric contours in figure 7 indicate that there is a groundwater divide and recharge area along the northern part of the Clark and Pine Nature Preserve and the Pine Station Nature Preserve, with groundwater in the shallow dune complex aquifer flowing south toward a discharge area adjacent to the Grand Calumet River (groundwater flow north of the recharge area is toward Lake Michigan). This shallow water-table configuration and flow is likely part of a local (<1 mi from recharge to discharge zone) flow regime (Tóth, 1963; Wilcox and others, 2020), whereas the predominant calcium-magnesium-bicarbonate groundwater chemistry (fig. 10; table 3) suggests that a more regional (>3 mi from recharge to discharge zone) flow path from the south is discharging in the vicinity of the preserves consistent with a conceptual model of the groundwater-flow systems presented by Shedlock and others (1994). In contrast to shallow groundwater (upper 10 ft. of saturated thickness of the surficial aquifer) east of the preserves, groundwater in the vicinity of the preserves has lower sulfate and higher magnesium concentrations suggesting that water-to-rock interactions of groundwater and dolomite bedrock are more prevalent than what Shedlock and others (1994) reported for a study area east of Gary. The occurrence of calcium-magnesium-bicarbonate water chemistry and mixed local or regional groundwater flow (Wilcox and others, 2020) indicates unique hydrologic conditions at the preserves. Hence, the study area could represent unique growing conditions for wetland plant communities that prefer lower sulfate concentrations when compared with eastern counterparts along the Indiana Dunes National Park (Shedlock and others, 1994).
Water Quality and Wetland Ecosystem Functions
The predominant presence of ammonia as nitrogen (table 4), coupled with high iron concentrations (fig. 12; table 5), indicates that reducing conditions are prevalent and that iron reduction by bacteria may be a dominant biogeochemical process in the wetlands at the preserves. Wetlands can represent sources of methane (CH4) where persistent high water tables limit the occurrence of oxidized iron [Fe(III)], and bacteria revert to reduction of carbon dioxide as an energy source when water temperatures are sufficiently warm (Jerman and others, 2009). This highlights the importance of low water-table conditions when emergent plants are in wetland cells and iron-rich wetland substrates that are submerged during hydroperiods and exposed to air and oxygenated meteoric water during rainstorms.
Although chloride (7.41 mg/L) and sodium (7.78 mg/L) concentrations were low during the August 2020 water-quality sampling, specific conductance trends at monitoring well P5 (figs. 8A and 9) suggest that surface water and shallow groundwater are transporting runoff byproducts along the eastern corridor or the north-south oriented wetland cell. Future wetland restoration efforts may entail diverting flow from the eastern wetland cell into the South Pond. Water-level elevations during the monitoring period (fig. 6) indicate that a persistent gradient exists to facilitate flow into the South Pond from the vicinity of monitoring well P5.
Summary
Adverse ecological and water-quality effects associated with industrial land-use changes are common for littoral wetlands connected to river mouth ecosystems in the Grand Calumet River-Indiana Harbor Canal Area of Concern. These effects can be exacerbated by recent high Lake Michigan water levels that are problematic for wetland restoration. Wetlands in the adjacent Clark and Pine Nature Preserve and Pine Station Nature Preserve are intended to mitigate wetland destruction in the area of concern by restoring residual dune-and-swale wetlands and preserving habitat for endangered and threatened plant species. Physical hydrology and water-quality monitoring of restored wetland cells at the preserves were initiated during 2019 to evaluate changes after wetland restoration efforts in 2015 and near record-low water levels in early 2013. Lake Michigan water levels rose steadily between late 2013 and 2018 to record-high water levels in 2019 and 2020.
High water levels on Lake Michigan influenced Grand Calumet River stage and shallow groundwater elevations at the preserves after the onset of peak lake levels (approximately 582.5 ft) in June 2019 that persisted through summer 2020. Grand Calumet River stage peaked soon after lake level at approximately 585 ft in July 2019, whereas groundwater elevations in the study area peaked in October 2019. Lake levels remained high before they began to recede in September 2020. Dry conditions at the preserves during summer 2020 persisted into water year 2021 and likely led to groundwater levels receding from their highest elevations in June 2020 before the lowering of Lake Michigan levels. This indicates that wetland water balance, especially during summer months when evapotranspiration is high, plays an important role in mediating the effects of high lake levels in the region.
The water-quality dynamics of closed-basin wetland cells in western and central preserve locations contrasts with the connected wetland cells of the eastern basin. Lithium concentrations in wells along the eastern basin (P3, P4, P5) are all above 15 micrograms per liter, whereas concentrations in western (C2, C3, C4) and central (P6, P8, P14) shallow groundwater are all less than 10 micrograms per liter. Along the northern and eastern perimeter of the wetlands, high concentrations of boron and lithium indicate that there may be leaching from fly ash used to build the access road and the railroad embankment to the north. Hence, restoration approaches that divert shallow groundwater inflow may also be warranted to trap or incorporate toxic metals in wetland cells to prevent migration of these metals into the Grand Calumet River and other surface-water features and groundwater aquifers.
Hydrologic data collected from water years 2020 to 2022 indicate that the preserve wetlands serve essential functions related to water storage and water-quality benefits within the Grand Calumet River-Indiana Harbor Canal area of concern. The coupled occurrence of reduced nitrogen and high iron concentrations indicates that biogeochemical processes at the preserves favor iron reduction and mobilization with sustained high water levels, whereas iron oxidation occurs under variable water-table configurations and wetland hydroperiod phases. Previous work indicated that this is an important dynamic because persistently inundated wetlands can lead to conditions that favor methanogenesis and methane release. However, hydrologic monitoring from this study indicates that variable wetland hydroperiods have returned following high water-table conditions that ensued after record-high water levels in Lake Michigan in 2019–20. This is important for supporting water quality and diverse plant ecosystems.
References Cited
Albert, D.A., Wilcox, D.A., Ingram, J.W., and Thompson, T.A., 2005, Hydrogeomorphic classification for Great Lakes coastal wetlands: Journal of Great Lakes Research, v. 31, supplement 1, p. 129–146, accessed January 26, 2021, at https://doi.org/10.1016/S0380-1330(05)70294-X.
Allen, R.G., Pereira, L.S., Raes, D., and Smith, M., 1998, Crop evapotranspiration—Guidelines for computing crop water requirements: Food and Agriculture Organization of the United Nations Irrigation and Drainage Paper 56, 327 p., accessed June 23, 2022, at https://www.fao.org/3/X0490E/x0490e00.htm.
Argyilan, E.P., Lepper, K., and Thompson, T.A., 2014, Late Holocene coastal development along the southern shore of Lake Michigan determined by strategic dating of stabilized parabolic dunes and wetlands of the Tolleston Beach, in Fisher, T.G., and Hansen, E.C., eds., Coastline and dune evolution along the Great Lakes: Geological Society of America Special Paper 508, p. 31–46. [Also available at https://doi.org/10.1130/2014.2508(03).]
Baedke, S.J., and Thompson, T.A., 2000, A 4,700-year record of lake level and isostasy for Lake Michigan: Journal of Great Lakes Research, v. 26, no. 4, p. 416–426. [Also available at https://doi.org/10.1016/S0380-1330(00)70705-2.]
Buszka, P.M., Fitzpatrick, J., Watson, L.R., and Kay, R.T., 2007, Evaluation of ground-water and boron sources by use of boron stable-isotope ratios, tritium, and selected water-chemistry constituents near Beverly Shores, northwestern Indiana, 2004: U.S. Geological Survey Scientific Investigations Report 2007–5166, 46 p., accessed June 23, 2022, at https://doi.org/10.3133/sir20075166.
Cassatt, M.S., and Wilcox, D.A., 2020, Potential effects of climate change on NRCS wetland restoration easements—An ecohydrological assessment: Ecohydrology, v. 13, no. 2, paper e2183, 19 p., accessed July 12, 2022, at https://doi.org/10.1002/eco.2183.
Cherkauer, D.S., and Zvibleman, B., 1981, Hydraulic connection between Lake Michigan and a shallow ground‐water aquifer: Ground Water, v. 19, no. 4, p. 376–381. [Also available at https://doi.org/10.1111/j.1745-6584.1981.tb03483.x.]
Connor, B.F., Rose, D.L., Noriega, M.C., Murtaugh, L.K., and Abney, S.R., 1998, Methods of analysis by the U.S. Geological Survey National Water Quality Laboratory—Determination of 86 volatile organic compounds in water by gas chromatography, including detections less than reporting limits: U.S. Geological Survey Open-File Report 97–829, 78 p. [Also available at https://doi.org/10.3133/ofr97829.]
Cowdery, T.K., Christenson, C.A., and Ziegeweid, J.R., 2019, The hydrologic benefits of wetland and prairie restoration in western Minnesota—Lessons learned at the Glacial Ridge National Wildlife Refuge, 2002–15: U.S. Geological Survey Scientific Investigations Report 2019–5041, 81 p., accessed January 26, 2021, at https://doi.org/10.3133/sir20195041.
Cunningham, W.L., and Schalk, C.W., comps., 2011, Groundwater technical procedures of the U.S. Geological Survey: U.S. Geological Survey Techniques and Methods book 1, chap A1, 151 p., accessed July 23, 2022, at https://doi.org/10.3133/tm1A1.
Davis, S.N., Whittemore, D.O., and Fabryka‐Martin, J., 1998, Uses of chloride/bromide ratios in studies of potable water: Groundwater, v. 36, no. 2, p. 338–350. [Also available at https://doi.org/10.1111/j.1745-6584.1998.tb01099.x.]
Fishman, M.J., and Friedman, L.C., 1989, Methods for determination of inorganic substances in water and fluvial sediments: U.S. Geological Survey Techniques of Water-Resources Investigations, book 5, chap. A1, 545 p. [Also available at https://doi.org/10.3133/twri05A1.]
Fishman, M.J., ed., 1993, Methods of analysis by the U.S. Geological Survey National Water Quality Laboratory—Determination of inorganic and organic constituents in water and fluvial sediments: U.S. Geological Survey Open-File Report, 93–125, 217 p. [Also available at https://doi.org/10.3133/ofr93125.]
Foreman, W.T., Williams, T.L., Furlong, E.T., Hemmerle, D.M., Stetson, S.J., Jha, V.K., Noriega, M.C., Decess, J.A., Reed-Parker, C., and Sandstrom, M.W., 2021, Comparison of detection limits estimated using single-and multi-concentration spike-based and blank-based procedures: Talanta, v. 228, paper 122139, 15 p., accessed September 12, 2023, at https://doi.org/10.1016/j.talanta.2021.122139.
Freeman, L.A., Carpenter, M.C., Rosenberry, D.O., Rousseau, J.P., Unger, R., and McLean, J.S., 2004, Use of submersible pressure transducers in water-resources investigations: U.S. Geological Survey Techniques of Water-Resources Investigations, book 8, chap. A3, 52 p. [Also available at https://doi.org/10.3133/twri08A3.]
Garbarino, J.R., Kanagy, L.K., and Cree, M.E., 2006, Determination of elements in natural-water, biota, sediment, and soil samples using collision/reaction cell inductively coupled plasma-mass spectrometry: U.S. Geological Survey Techniques and Methods, book 5, chapter 1, section B, 88 p. [Also available at https://doi.org/10.3133/tm5B1.]
Gronewold, A.D., and Rood, R.B., 2019, Recent water level changes across Earth’s largest lake system and implications for future variability: Journal of Great Lakes Research, v. 45, no. 1, p. 1–3. [Also available at https://doi.org/10.1016/j.jglr.2018.10.012.]
Guo, H., Liu, C., Lu, H., Wanty, R.B., Wang, J., and Zhou, Y., 2013, Pathways of coupled arsenic and iron cycling in high arsenic groundwater of the Hetao basin, Inner Mongolia, China—An iron isotope approach: Geochimica et Cosmochimica Acta, v. 112, p. 130–145. [Also available at https://doi.org/10.1016/j.gca.2013.02.031.]
Han, F.X., Su, Y., Monts, D.L., Plodinec, M.J., Banin, A., and Triplett, G.E., 2003, Assessment of global industrial-age anthropogenic arsenic contamination: Naturwissenschaften, v. 90, no. 9, p. 395–401. [Also available at https://doi.org/10.1007/s00114-003-0451-2.]
Haque, A., Ali, G., and Badiou, P., 2018, Hydrological dynamics of prairie pothole wetlands—Dominant processes and landscape controls under contrasted conditions: Hydrological Processes, v. 32, no. 15, p. 2405–2422. [Also available at https://doi.org/10.1002/hyp.13173.]
Hayhoe, K., VanDorn, J., Croley, T., II, Schlegal, N., and Wuebbles, D., 2010, Regional climate change projections for Chicago and the US Great Lakes: Journal of Great Lakes Research, v. 36, supplement 2, p. 7–21. [Also available at https://doi.org/10.1016/j.jglr.2010.03.012.]
Hem, J.D., 1985, Study and interpretation of the chemical characteristics of natural water (3d ed.): U.S. Geological Survey Water Supply Paper 2254, 263 p., 3 pls. [Also available at https://doi.org/10.3133/wsp2254.]
Hiebert, R.D., Wilcox, D.A., and Pavlovic, N.B., 1986, Vegetation patterns in and among pannes (calcareous intradunal ponds) at the Indiana Dunes National Lakeshore, Indiana: American Midland Naturalist, v. 116, no. 2, p. 276–281. [Also available at https://doi.org/10.2307/2425735.]
Hu, P., Hou, X., Zhang, J., Li, S., Wu, H., Damø, A.J., Li, H., Wu, Q., and Xi, X., 2018, Distribution and occurrence of lithium in high-alumina-coal fly ash: International Journal of Coal Geology, v. 189, p. 27–34. [Also available at https://doi.org/10.1016/j.coal.2018.02.011.]
Indiana Heritage Data Center, 2021, Federal and state endangered, threatened, and rare species inventory: Indiana Department of Natural Resources data, accessed June 23, 2022, at https://www.in.gov/dnr/nature-preserves/heritage-data-center/about-inhdc/.
International Joint Commission, 1987, Revised Great Lakes water quality agreement of 1978—As amended by protocol signed November 18, 1987: International Joint Commission United States and Canada, 64 p. [Also available at https://ijc.org/sites/default/files/ID702.pdf.]
Jerman, V., Metje, M., Mandić-Mulec, I., and Frenzel, P., 2009, Wetland restoration and methanogenesis—The activity of microbial populations and competition for substrates at different temperatures: Biogeosciences, v. 6, no. 6, p. 1127–1138. [Also available at https://doi.org/10.5194/bg-6-1127-2009.]
Kay, R.T., Greeman, T.K., Duwelius, R.F., King, R.B., Nazimek, J.E., and Petrovski, D.M., 1997, Characterization of fill deposits in the Calumet region of northwestern Indiana and northeastern Illinois: U.S. Geological Survey Water-Resources Investigations Report 96–4126, 36 p., 3 pls. [Also available at https://doi.org/10.3133/wri964126.]
Keddy, P.A., and Reznicek, A.A., 1986, Great Lakes vegetation dynamics—The role of fluctuating water levels and buried seeds: Journal of Great Lakes Research, v. 12, no. 1, p. 25–36. [Also available at https://doi.org/10.1016/S0380-1330(86)71697-3.]
Kszos, L.A., and Stewart, A.J., 2003, Review of lithium in the aquatic environment—Distribution in the United States, toxicity and case example of groundwater contamination: Ecotoxicology, v. 12, no. 5, p. 439–447. [Also available at https://doi.org/10.1023/A:1026112507664.]
LaBaugh, J.W., Mushet, D.M., Rosenberry, D.O., Euliss, N.H., Jr., Goldhaber, M.B., Mills, C.T., and Nelson, R.D., 2016, Changes in pond water levels and surface extent due to climate variability alter solute sources to closed-basin prairie-pothole wetland ponds, 1979 to 2012: Wetlands, v. 36, supplement 2, p. 343–355. [Also available at https://doi.org/10.1007/s13157-016-0808-x.]
Larson, J.H., Trebitz, A.S., Steinman, A.D., Wiley, M.J., Mazur, M.C., Pebbles, V., Braun, H.A., and Seelbach, P.W., 2013, Great Lakes rivermouth ecosystems—Scientific synthesis and management implications: Journal of Great Lakes Research, v. 39, no. 3, p. 513–524, accessed February 8, 2021, at https://doi.org/10.1016/j.jglr.2013.06.002.
Lindsey, B.D., Belitz, K., Cravotta, C.A., III, Toccalino, P.L., and Dubrovsky, N.M., 2021, Lithium in groundwater used for drinking-water supply in the United States: Science of the Total Environment, v. 767, paper 144691, 15 p., accessed June 27, 2022, at https://doi.org/10.1016/j.scitotenv.2020.144691.
Mazur, M.L.C., Schaeffer, J., Granneman, J.E., Goldstrohm, N., Fitzpatrick, F.A., Larson, J.H., Reneau, P.C., Kowalski, K.P., and Seelbach, P.W., 2019, Seasonal patterns in hydrochemical mixing in three Great Lakes rivermouth ecosystems: Journal of Great Lakes Research, v. 45, no. 3, p. 651–663. [Also available at https://doi.org/10.1016/j.jglr.2019.03.009.]
Mullaney, J.R., Lorenz, D.L., and Arntson, A.D., 2009, Chloride in groundwater and surface water in areas underlain by the glacial aquifer system, northern United States: U.S Geological Survey Scientific Investigations Report 2009–5086, 41 p., accessed December 2022, at https://doi.org/10.3133/sir20095086.
National Oceanic and Atmospheric Administration, 2021, U.S. climate normals: National Oceanic and Atmospheric Administration data, accessed July 23, 2022, at https://www.ncei.noaa.gov/products/land-based-station/us-climate-normals.
National Oceanic and Atmospheric Administration, 2022, Station CMTI2—9087044—Calumet Harbor, IL: National Oceanic and Atmospheric Administration National Data Buoy Center data, accessed June 15, 2023, at https://www.ndbc.noaa.gov/station_page.php?station=cmti2.
Naylor, S., Branam, T.D., and Olyphant, G.A., 2012, Physico-chemical assessment of a fixated flue-gas desulfurization sludge cap emplaced along with other coal-combustion residues to abate acid mine drainage: Journal of Contaminant Hydrology, v. 132, p. 37–47. [Also available at https://doi.org/10.1016/j.jconhyd.2012.01.012.]
Norman, J.E., Toccalino, P.L., and Morman, S.A., 2018, Health-based screening levels for evaluating water-quality data (2d ed.): U.S. Geological Survey web page, accessed July 24, 2022, at https://doi.org/10.5066/F71C1TWP.
Panno, S.V., Hackley, K.C., Hwang, H.H., Greenberg, S., Krapac, I.G., Landsberger, S., and O’Kelly, D.J., 2005, Database for the characterization and identification of the sources of sodium and chloride in natural waters of Illinois: Illinois State Geological Survey Open-File Report 2005–1, 15 p., accessed July 11, 2023, at https://www.ideals.illinois.edu/items/56031.
Panno, S.V., Hackley, K.C., Hwang, H.H., Greenberg, S., Krapac, I.G., Landsberger, S., and O’Kelly, D.J., 2006, Characterization and identification of Na-Cl sources in ground water: Ground Water, v. 44, no. 2, p. 176–187. [Also available at https://doi.org/10.1111/j.1745-6584.2005.00127.x.]
Paternoster, M., 2019, Boron isotopes in the Mount Vulture groundwaters (southern Italy)—Constraints for the assessment of natural and anthropogenic contaminant sources: Hindawi Geofluids, article 9107636, 10 p., accessed December 9, 2022, at https://doi.org/10.1155/2019/9107636.
Rounds, S.A., 1998, Alkalinity and acid neutralizing capacity (ver. 4.0, September 2012), sec. 6.6 of Field measurements: U.S. Geological Survey Techniques of Water-Resources Investigations, book 9, chap. A6, 45 p., accessed June 22, 2022, at https://doi.org/10.3133/twri09A6.6.
Shedlock, R.J., Cohen, D.A., Imbrigiotta, T.E., and Thompson, T.A., 1994, Hydrogeology and hydrochemistry of dunes and wetlands along the southern shore of Lake Michigan, Indiana: U.S. Geological Survey Open-File Report 92–139, 85 p., accessed January 26, 2021, at https://doi.org/10.3133/ofr92139.
Shedlock, R.J., Wilcox, D.A., Thompson, T.A., and Cohen, D.A., 1993, Interactions between ground water and wetlands, southern shore of Lake Michigan, USA: Journal of Hydrology, v. 141, nos. 1–4, p. 127–155, accessed January 26, 2021, at https://doi.org/10.1016/0022-1694(93)90047-D.
Smith, I.M., Fiorino, G.E., Grabas, G.P., and Wilcox, D.A., 2021, Wetland vegetation response to record-high Lake Ontario water levels: Journal of Great Lakes Research, v. 47, no. 1, p. 160–167, accessed June 21, 2022, at https://doi.org/10.1016/j.jglr.2020.10.013.
Sweet, C.W., Weiss, A., and Vermette, S.J., 1998, Atmospheric deposition of trace metals at three sites near the Great Lakes: Water, Air, and Soil Pollution, v. 103, no. 1, p. 423–439. [Also available at https://doi.org/10.1023/A:1004905832617.]
Tóth, J., 1963, A theoretical analysis of groundwater flow in small drainage basins: Journal of Geophysical Research, v. 68, no. 16, p. 4795–4812. [Also available at https://doi.org/10.1029/JZ068i016p04795.]
U.S. Environmental Protection Agency, 2018, 2018 edition of the drinking water standards and health advisories tables: U.S. Environmental Protection Agency 822–F–18–001, 12 p., accessed March, 25, 2022, at https://www.epa.gov/system/files/documents/2022-01/dwtable2018.pdf.
U.S. Environmental Protection Agency, 2022a, National recommended water-quality criteria—Aquatic life criteria table: U.S. Environmental Protection Agency web page, accessed July 26, 2022, at https://www.epa.gov/wqc/national-recommended-water-quality-criteria-aquatic-life-criteria-table.
U.S. Environmental Protection Agency, 2022b, Superfund program, advanced search—For national priorities list and non-NPL sites: U.S. Environmental Protection Agency data, accessed July 26, 2022, at https://www.epa.gov/superfund/search-superfund-sites-where-you-live#advanced.
U.S. Geological Survey, [variously dated], National field manual for the collection of water-quality data: U.S. Geological Survey Techniques of Water-Resources Investigations, book 9, chaps. A1–A10, [variously paged]. [Also available at https://doi.org/10.3133/twri09.]
U.S. Geological Survey, 2019, Specific conductance: U.S. Geological Survey Techniques and Methods, book 9, chap. A6.3, 15 p., accessed June 23, 2022, at https://doi.org/10.3133/tm9A6.3. [Supersedes USGS Techniques of Water-Resources Investigations, book 9, chap. A6.3, version 1.2.]
U.S. Geological Survey, 2022, Health-based screening levels for evaluating water-quality data (2d ed.): U.S. Geological Survey data release, accessed June 23, 2022, at https://doi.org/10.5066/F71C1TWP.
U.S. Geological Survey, 2023, USGS water data for the nation: U.S. Geological Survey National Water Information System database, accessed January 23, 2023, at https://doi.org/10.5066/F7P55KJN.
Wilcox, D.A., Carlson Mazur, M.L., and Thompson, T.A., 2020, Groundwater controls on wetland vegetation of a ridge-and-swale chronosequence in a Lake Michigan embayment: Wetlands, v. 40, no. 6, p. 2425–2442. [Also available at https://doi.org/10.1007/s13157-020-01336-y.]
Wilde, F.D., 1998, Temperature (ver. 2, March 2006), sec. 6.1 of Field measurements: U.S. Geological Survey Techniques of Water-Resources Investigations, book 9, chap. 6, 22 p., accessed June 21, 2022, at https://doi.org/10.3133/twri09A6.1.
Xu, R., Gale, S.A., Kim, H., Lott, R., Spreadbury, C.J., Laux, S., and Townsend, T.G., 2020, Boron as a contaminant at construction and demolition (C&D) debris landfills: Waste Management, v. 109, no. 1, p. 85–93. [Also available at https://doi.org/10.1016/j.wasman.2020.04.051.]
Appendix 1. Groundwater-Elevation Data at the Clark and Pine Nature Preserve and the Pine Station Nature Preserve Near Gary, Indiana, in Fall 2019 and 2020
Table 1.1.
Groundwater-elevation data for the Clark and Pine Nature Preserve and the Pine Station Nature Preserve near Gary, Indiana, for autumn 2019 and 2020. These data[Data are from Rambol U.S. Corp (2020) and Tetra Tech, Inc. (2021), which are sourced from publicly available reports submitted to the Indiana Department of Environmental Management. NA, not available]
References Cited
Rambol U.S. Corp., 2020, 2019 annual ground water monitoring report—Midco I and II sites, Gary, Indiana: U.S. Environmental Protection Agency, 185 p., accessed September 13, 2023, at https://ecm.idem.in.gov/cs/idcplg?IdcService=GET_FILE&dID=83021464&dDocName=83021268.
Tetra Tech, Inc., 2021, 2021 semi-annual groundwater monitoring report: Georgia Pacific LLC Closed Process Residual Lagoons Permit 45–UP–03, 126 p., accessed September 13, 2023, at https://ecm.idem.in.gov/cs/idcplg?IdcService=GET_FILE&dID=83170549&dDocName=83171354.
Conversion Factors
Datums
Vertical coordinate information is referenced to the North American Vertical Datum of 1988 (NAVD 88).
Horizontal coordinate information is referenced to the North American Datum of 1983 (NAD 83).
Elevation, as used in this report, refers to distance above the vertical datum.
Supplemental Information
Specific conductance is given in microsiemens per centimeter at 25 degrees Celsius (µS/cm at 25 °C).
Concentrations of chemical constituents in water are given in either milligrams per liter (mg/L) or micrograms per liter (µg/L).
A water year is the period from October 1 to September 30 and is designated by the year in which it ends.
For more information, contact
Director, Ohio-Kentucky-Indiana Water Science Center
U.S. Geological Survey
6460 Busch Blvd, Suite 100
Columbus, OH 43229
or visit our website at
https://www.usgs.gov/centers/oki-water
Publishing support provided by the Baltimore, Pembroke, and Reston Publishing Service Centers
Disclaimers
Any use of trade, firm, or product names is for descriptive purposes only and does not imply endorsement by the U.S. Government.
Although this information product, for the most part, is in the public domain, it also may contain copyrighted materials as noted in the text. Permission to reproduce copyrighted items must be secured from the copyright owner.
Suggested Citation
Naylor, S., and Gahala, A.M., 2024, Hydrology and water quality of a dune-and-swale wetland adjacent to the Grand Calumet River, Indiana, 2019–22: U.S. Geological Survey Scientific Investigations Report 2023–5122, 29 p., https://doi.org/10.3133/sir20235122.
ISSN: 2328-0328 (online)
Study Area
| Publication type | Report |
|---|---|
| Publication Subtype | USGS Numbered Series |
| Title | Hydrology and water quality of a dune-and-swale wetland adjacent to the Grand Calumet River, Indiana, 2019–22 |
| Series title | Scientific Investigations Report |
| Series number | 2023-5122 |
| DOI | 10.3133/sir20235122 |
| Publication Date | February 05, 2024 |
| Year Published | 2024 |
| Language | English |
| Publisher | U.S. Geological Survey |
| Publisher location | Reston, VA |
| Contributing office(s) | Ohio-Kentucky-Indiana Water Science Center |
| Description | Report: vii, 29 p.; Dataset |
| Country | United States |
| State | Indiana |
| Other Geospatial | Grand Calumet River-Indiana Harbor Canal Area of Concern |
| Online Only (Y/N) | Y |
| Additional Online Files (Y/N) | N |