

Hydrologic Analysis of an Earthen Embankment Dam in Southern Westchester County, New York
Links
- Document: Report (8.76 MB pdf) , HTML , XML
- Dataset: USGS National Water Information System database - USGS water data for the Nation
- Data Release: USGS data release - Data and analytical type-curve match for selected hydraulic tests at an earthen dam site in southern Westchester County, New York
- NGMDB Index Page: National Geologic Map Database Index Page (html)
- Download citation as: RIS | Dublin Core
Acknowledgments
The authors thank Richard Zunino, Wilfredo Melendez, George Schmidt, and Masud Ahmed of the New York City Department of Environmental Protection for their technical assistance and logistical support. The authors also thank the reservoir operations and engineering staff for information and site access during this study. Reservoir maintenance and operation data and hydraulic data from the south connecting conduit shutdown and dewatering were also provided by the New York City Department of Environmental Protection. The authors also wish to thank William Kappel, Amy Gahala, and Douglas Burns of the USGS for their technical recommendations.
Abstract
In 2001, the New York City Department of Environmental Protection installed 25 wells on the southern embankment of the Hillview Reservoir in Westchester County in an unsuccessful attempt to locate the source of a large seep (seep A) that began flowing continuously in 1999. In 2005, the U.S. Geological Survey began a cooperative study with the NYCDEP to characterize the hydrology of the local groundwater system and identify potential sources of seep A and other seeps on the embankment.
At least two groundwater-flow zones—one shallow and the other deep—overlie the bedrock at the Hillview Reservoir in southern Westchester County, New York. Analyses of slug tests of wells drilled into the southern embankment of the reservoir were used to determine the three-dimensional distribution of hydraulic conductivity of the embankment materials. The wells with the minimum and maximum hydraulic conductivity values are in the deep saturated zone on the southern embankment, where hydraulic conductivity ranges from 0.0012 to 2 feet per day. Hydraulic conductivity ranges from 0.0026 to 1 foot per day in the shallow saturated zone and from 0.021 to 0.27 foot per day in the toe of the embankment. A hydraulic conductivity of 0.016 foot per day was determined for one toe well partially screened in the crystalline-bedrock aquifer. In 2005, the U.S. Geological Survey began a cooperative study with New York City Department of Environmental Protection to characterize the local groundwater-flow system and identify potential sources of seeps on the southern embankment of the Hillview Reservoir in southern Westchester County, New York.
Long-term hydrologic data indicated that water levels trended downward in 29 of 41 sites, including the reservoir basin that was monitored during the 12-year study period; data from a National Weather Service precipitation gage at Central Park indicated annual precipitation also trended downward during the same 12-year period. Of the seven wells in which water levels trended upward during the study, two of the wells are on the west side of the southern embankment, proximal to a major water supply conduit, whereas the five remaining wells are screened in the toe. These data indicate an increasing hydrostatic pressure within the deep system and the toe of the dam, which could result in future seeps on the southern embankment near these wells.
Results of 11 suspended-sediment samples collected from seeps along the southern embankment at 234.1- and 221.6-feet elevation, and another drainage outflow point between 2007 and 2015 indicate a poor correlation between suspended-sediment concentration and discharge. From the flowing seep at 234.1 feet, suspended-sediment concentrations ranged from 1 milligram per liter at a flow of 2.6 gallons per minute (that is, 1 milligram per 0.26 gallons) during March 2008 to 16 milligrams per liter at 12 gallons per minute during July 2014. At about 12 gallons per minute discharge, suspended-sediment concentration from samples collected at that seep during different sampling events, ranged from 3 to 16 milligrams per liter. From the seep at 221.6 feet elevation, the suspended sediment concentration was 2 milligrams per liter at a discharge of 3.4 gallons per minute and 2 milligrams per liter at a discharge of 1.1 gallons per minute. Only one sample was collected at the drainage outflow point, for which the suspended sediment concentration was 2 milligrams per liter at a discharge of 2.4 gallons per minute.
Anomalously high-water levels were recorded in deep-system wells between June 5, 2013, and January 14, 2014. The period for the increase and the decrease back to more typical water-level elevations occurred rapidly during a 13-hour period in each instance. The sudden and rapid changes, in addition to the spatial distribution of magnitude of water-level response indicate that leaky water infrastructure was the source of recharge to the affected wells.
A major water supply conduit was drained for repairs between July 7 and 10, 2010. The seeps indicated an immediate response and a substantial hydraulic connection to the water supply conduit. Approximately 10.5 hours after the water supply conduit was drained, flow from a seep on the southern embankment decreased from about 20 gallons per minute to less than 1 gallon per minute. This seep is located at about the same elevation and within the vicinity of the water supply conduit. A travel-time of about 10.5 hours from the source to the seep at 234.1 feet elevation was estimated from the dewatering timeline. During the 3-month shutdown of the water supply conduit, the previously flowing seeps remained dry until precipitation resulted in discharge of about 0.7 gallon per minute at the higher elevation seep, indicating a minor contribution from precipitation to the total seepage discharge. Discharge from the seeps resumed almost immediately coincident with the refilling of the water supply conduit, supporting the hydraulic connection observations during the drainage stage. In addition, during the refilling of the water supply conduit on September 21, 2010, a new seep (I) was observed on the southern embankment. Discharge from this new seep remained relatively constant until it became inaccessible under construction stone from subsequent embankment repairs by the New York City Department of Environmental Protection. Precipitation after the refilling stage of the shutdown seemed to have induced a rise in water levels in the toe wells and an increase in discharge from the seep at 234.1 feet elevation. The post shutdown discharge was less than 12 gallons per minute, compared to a discharge of about 20 gallons per minute before the repairs. The lower discharge rate measured during the period of historically higher discharge rates for the fall season indicates that the repair of the major water supply conduit may have contributed to a reduced discharge from the seeps. There were no definitive responses to the shutdown in any of the wells near the major water supply conduit.
The more transmissive deep system of the southern embankment near the major water supply conduit and its associated infrastructure seems to be the preferential flow path for leaking infrastructure. The wells screened in this system showed a response during the deep system anomaly and have some of the highest hydraulic conductivities of the tested wells. All the seeps are in the elevation range of the deep system from approximately the crystalline bedrock surface around 200 feet elevation to the contact between the deep and shallow saturated zones of the reservoir at about 250 feet elevation.
Introduction
The Hillview Reservoir in southern Westchester County, New York (fig. 1), which was constructed between 1913 and 1916, contains more than 900 million gallons of water for New York City (NYC). Ninety percent of the City’s water supply passes through the Hillview Reservoir facility via the Kensico Reservoir, which in turn is fed by the Delaware and Catskill aqueducts in upstate New York. Currently (2023), Hillview is the final chlorination site before water is distributed to NYC through three water tunnels at the southern end of the reservoir. Although the elevation of water in the reservoir basins varies throughout the day because of water use, the average elevation is about 293 feet (ft).
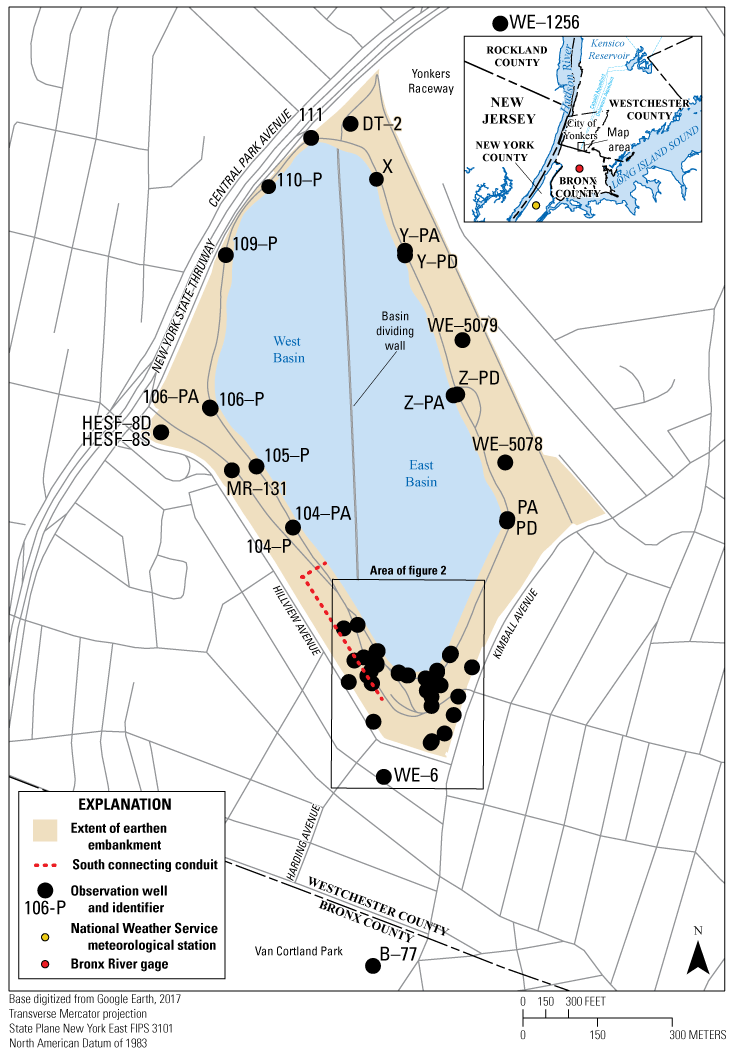
The location of the Hillview Reservoir study area and selected observation wells, Westchester County, New York.
An earthen embankment that impounds the reservoir consists of low-permeability glacial clays that were excavated from the site and built up on a veneer of low-permeability glacial deposits that in turn overlie crystalline bedrock. Construction and maintenance projects near water infrastructure such as the downtake chambers, control chamber, south connecting conduit, and the basin dividing wall (fig. 1; downtake chambers and control chamber are not shown) may have modified hydraulic properties within the embankment. During a slope inspection in 1999, the New York City Department of Environmental Protection (NYCDEP) discovered a seep (seep A; fig. 2) on the southwestern slope of the embankment. The seep flowed continuously from 1999 to 2007 and prompted the NYCDEP to install 25 wells in 2001 at the southern end of the reservoir (which increased the total number of wells in the earthen embankment to 57) in an unsuccessful attempt to locate the source of the seep.
In 2005, the U.S. Geological Survey (USGS), in cooperation with the NYCDEP, began a study to characterize the local groundwater-flow system and identify potential sources of seeps on the southern embankment of the Hillview Reservoir.
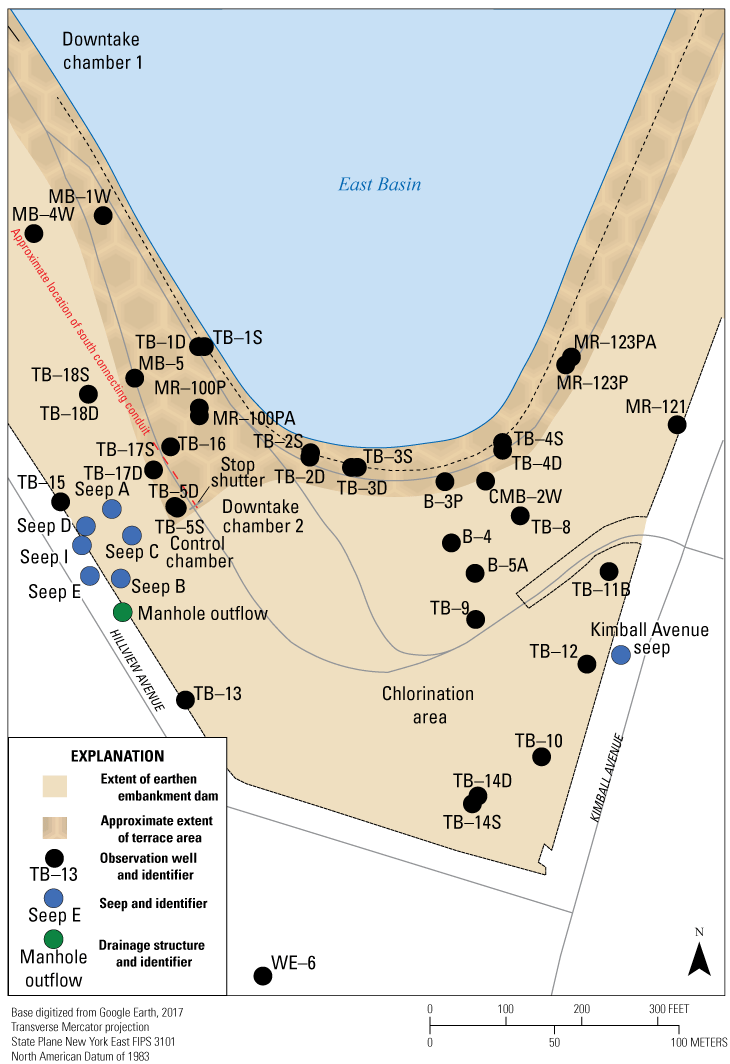
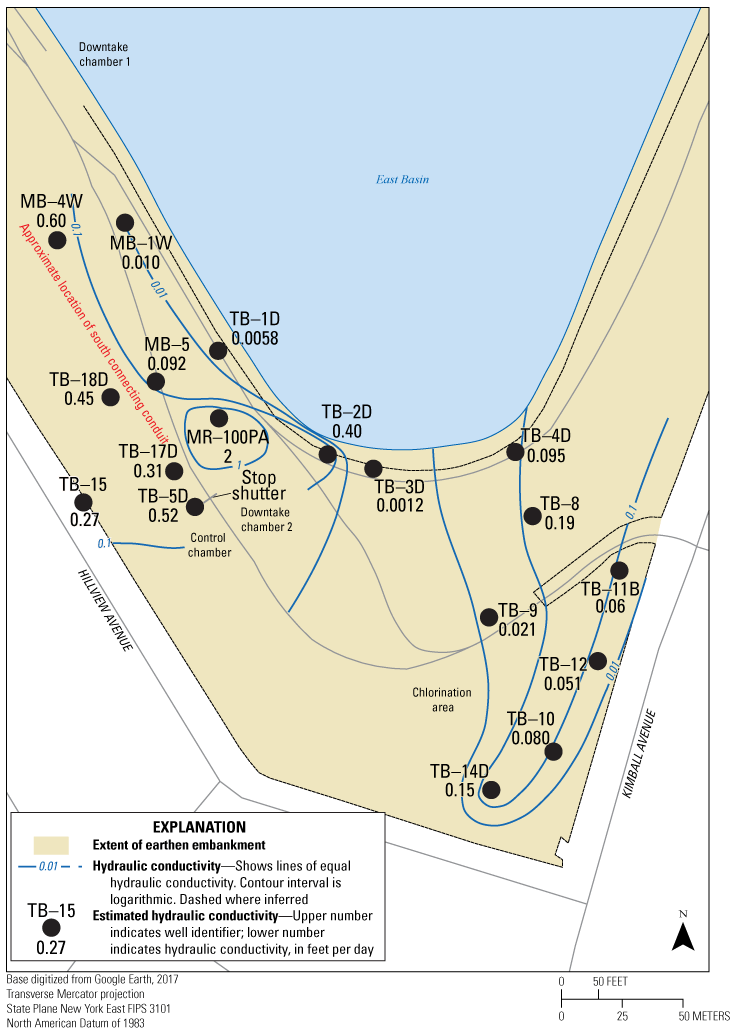
The location of wells, seeps, and manhole outflow on the southern embankment at the Hillview Reservoir, Westchester County, New York.
Purpose and Scope
This report provides the final analyses of findings from an earlier series of reports that included a preliminary geophysical and hydrologic assessment of the southern part of the earthen embankment dam site (Chu and others, 2013), and subsequent companion reports on water levels (Noll and Chu, 2018), water quality (Chu and Noll, 2017), land-surface elevation changes (Noll and Chu, 2017), and slug test analyses (Capurso and others, 2019; Noll and others, 2019). More specifically, this report presents analyses of slug-test data, suspended-sediment concentration data, and long-term hydrologic trends; and hydrologic data from the 2010 shutdown of the south-connecting conduit (fig. 1). The effects of the proximity to certain infrastructure were also analyzed to help determine the source of the seeps on the southern embankment of Hillview Reservoir.
Study Area
The Hillview Reservoir in southern Westchester County in the City of Yonkers was put into service in 1917 when the first water tunnel to NYC was completed. The reservoir is concrete-lined, has a surface area of about 90 acres, maintains a hydrostatic head of about 293 feet (ft) on the NYC water-supply distribution system, and is about equally divided into the East Basin and West Basin by a concrete wall (figs. 1 and 2; Malcolm Pirnie, Inc., and TAMS Consultants, Inc., 2002). The reservoir facility is bounded to the north and west by the New York State Thruway, to the north and east by the Yonkers Raceway and a residential neighborhood, to the south and east by a residential neighborhood along Kimball Avenue, and to the south and west by residential neighborhoods and a business district along Hillview Avenue.
Hydrogeologic Setting
The area surrounding Hillview Reservoir consists of artificial fill (modified glacial clays), alluvial and colluvial deposits of Holocene age, and till deposits of Pleistocene age (Cadwell, 1989); the till is underlain by crystalline bedrock. The bedrock is fractured and permeable where transmissive fractures or faults exist; in the absence of fractures, the bedrock forms a relatively impermeable base to the groundwater-flow system (Chu and others, 2013).
The earthen embankment consists of spoils from water-tunnel borings and reworked Pleistocene materials emplaced on a layer of Pleistocene till overlying bedrock. The groundwater levels within the embankment are strongly affected by recharge from precipitation and water-level fluctuations in the reservoir basins. The basin water levels fluctuate daily due to a cyclic water demand. This demand produces a diurnal load on the surrounding embankment and local groundwater-flow system.
The topography in southern Westchester County consists of a series of northeast-trending ridges and valleys. The ridges generally are underlain by gneiss and granite (Asselstine and Grossman, 1955; Baskerville, 1982), and the valleys are underlain by Inwood Marble. Hillview Reservoir is on a ridge underlain by the Yonkers or Fordham Gneiss. Depth to bedrock in the southern part of Westchester County ranges from less than 1 ft to 125 ft below land surface. The bedrock contains many fractures, some of which are transmissive. The gneiss is considered a poor-to-moderate groundwater producer, whereas the marble is the most productive bedrock in the county (Asselstine and Grossman, 1955). The thickness of the till overlying bedrock was estimated to be between 45 and 70 ft (Malcolm Pirnie, Inc., and TAMS Consultants, Inc., 2002); however, records of wells installed along the lower-lying and northern areas of the reservoir reveal depths to bedrock of about 20 ft, indicating the till in this area is considerably thinner or absent (Asselstine and Grossman, 1955).
At least two groundwater-flow zones—one shallow and the other deep—are present at the study area. Wells completed in the shallow saturated zone have the highest water-level elevations, are only slightly affected by the daily fluctuations in the water levels in the reservoir basins and seem to respond to substantial precipitation-induced recharge. In contrast, wells completed in the deep saturated zone have lower water-level elevations, are highly affected by the daily fluctuations in the water levels in the reservoir basins, and only slightly respond to precipitation-induced recharge (Chu and others, 2013). The hydrogeology of these saturated zones was delineated in an original engineering design drawing of Hillview Reservoir, which indicated highly impermeable and compacted material in the shallow saturated zone (“special impervious embankment”) adjacent to the reworked but uncompacted embankment material (“ordinary embankment”) comprising the slopes, both overlying the deep saturated zone (NYCDEP, 1909; fig. 3). The deep saturated zone consists of glacial till with a thin basal layer of coarse sediments that lie upon granitic bedrock. The contact between the deep and shallow saturated zones is the original land surface beneath the embankment. This contact dips to the south from approximately 270 feet elevation at the reservoir, to 240 feet elevation at the limit of the toe of the embankment (fig. 3).
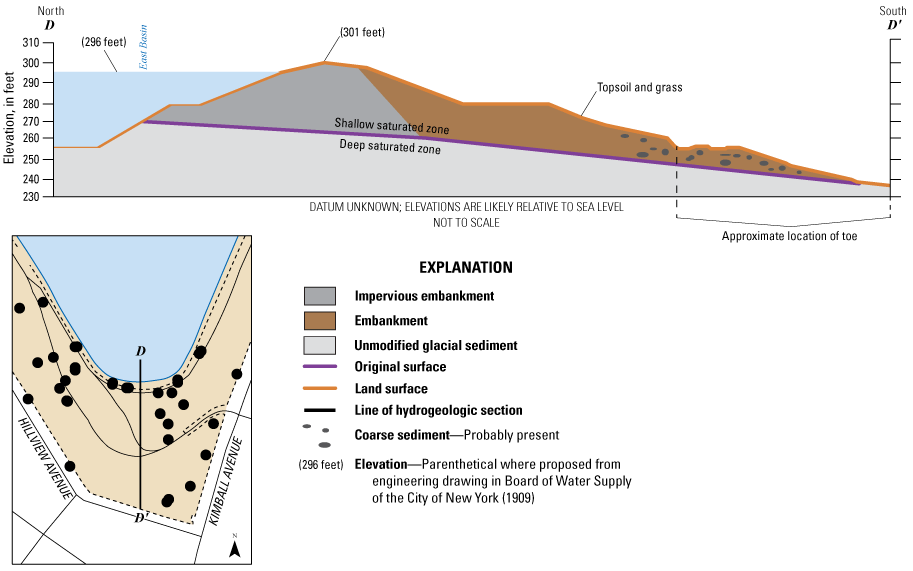
Cross section (D-D′) of an original engineering drawing of Hillview Reservoir, Westchester County, New York, 1909. Inset map shows location of D-D′.
The deep and shallow saturated zones coalesce into a single groundwater-flow system at the toe of the embankment. The toe area consists of reworked, coarser material that lies upon the unmodified glacial till. In general, the coarser, surficial material identified as “rock-fill and earth embankment” in original construction drawings was excavated from the area now occupied by the reservoir, and placed on top of the glacial till near the toe of the dam during reservoir construction (NYCDEP, 1929).
Methods of Investigation
Water-level measurements were made in 50 groundwater wells, the East Basin of the reservoir, and at four seeps from the embankment to monitor hydrologic conditions and connections (tables 1 and 2). Water-displacement aquifer tests, known as slug tests, were run on 25 wells to determine the hydraulic conductivity of the embankment materials. Samples of outflow from the seeps were analyzed for the concentration and size distribution of suspended sediment.
Table 1.
Site information for groundwater wells at the Hillview Reservoir, Westchester County, New York, 2006 and 2015.[NYSDEC, New York State Department of Environmental Conservation; ID, identifier; USGS, U.S. Geological Survey; ft, foot; NGVD 29, National Geodetic Vertical Datum of 1929; BLS, below land surface;—, no data]
| Local well name (figs. 1 and 2) | NYSDEC well ID | USGS site ID | Measuring-point elevation (ft NGVD 29) | Land-surface elevation (ft NGVD 29) | Well depth (ft BLS) | Sounded depth (ft BLS) | Screen depth (ft BLS) | Saturated zone screened | Water-quality sample year |
|---|---|---|---|---|---|---|---|---|---|
| B–77 | B77 | 405408073520901 | 189.35 | 190.00 | 21 | 20.7 | 16–21 | — | — |
| TB–1S | WE5051 | 405428073520901 | 302.01 | 300.69 | 40 | 41.8 | 30–40 | Shallow | 2006, 2015 |
| TB–1D | WE5062 | 405428073520902 | 302.37 | 300.49 | 122 | 72.05 | 60–70 | Deep | 2006, 2015 |
| TB–2S | WE5058 | 405428073520302 | 300.23 | 299.73 | 41 | 38.45 | 30–40 | Shallow | — |
| TB–2D | WE5072 | 405427073520802 | 300.23 | 300.16 | 71 | 67.45 | 60–70 | Deep | 2006, 2015 |
| TB–3S | WE5032 | 405426073520701 | 300 | 300.28 | 41 | 39.5 | 30–40 | Shallow | — |
| TB–3D | WE5057 | 405426073520702 | 300.2 | 300.29 | 71 | 62.2 | 60–70 | Deep | 2015 |
| TB–4S | WE5039 | 405427073520401 | 302.79 | 300.29 | — | 43.3 | — | Shallow | 2015 |
| TB–4D | WE5045 | 405427073520402 | 302.46 | 300.05 | 103 | 73.1 | 60–70 | Deep | 2015 |
| TB–5S | WE5024 | 405426073521002 | 300.92 | 299.17 | 51 | 50.9 | 30–40 | Shallow | 2006, 2015 |
| TB–5D | WE5071 | 405426073521004 | 301.13 | 299.03 | 77 | 76.15 | 66–76 | Deep | 2006, 2015 |
| TB–8 | WE5040 | 405425073524001 | 276.87 | 275.14 | 42 | 42.1 | 29–39 | Deep | 2015 |
| TB–9 | WE5043 | 405424073520501 | 268.63 | 269.03 | 41 | 42.2 | 30–40 | Toe | 2015 |
| TB–10 | WE5050 | 405423073520401 | 245.44 | 243.39 | 41 | 42.35 | 20–40 | Toe | 2012, 2015 |
| TB–11B | WE5048 | 405425073520201 | 255.85 | 253.46 | 31 | 31.7 | 20–30 | Toe | 2015 |
| TB–12 | WE5035 | 405424073520301 | 249.27 | 247.11 | 52 | 32.1 | 20–30 | Toe | 2006, 2015 |
| TB–13 | WE5033 | 405423073521001 | 220.66 | 217.97 | 31 | 32.4 | 10–30 | Toe/bedrock | 2015 |
| TB–14S | WE5028 | 405422073520501 | 241.45 | 238.9 | 48 | — | 20–30 | Toe | — |
| TB–14D | WE5041 | 405422073520502 | 242.97 | 240.54 | 50 | 50.9 | 29–49 | Toe | 2015 |
| TB–15 | WE5046 | 405426073521201 | 229.77 | 227.95 | 33 | 30.17 | 12–32 | Toe | 2006, 2015 |
| TB–16 | WE5027 | 405427073521001 | 299.33 | 299.75 | 49 | 48.75 | — | — | — |
| TB–17S | WE5022 | 405426073521001 | 299 | 297.32 | 40 | 39.9 | 30–40 | Shallow | 2006, 2015 |
| TB–17D | WE5063 | 405426073521003 | 299.2 | 297.37 | 80 | 79.75 | 70–80 | Deep | 2006, 2015 |
| TB–18S | WE5056 | 405427073521102 | 277.99 | 275.32 | 27 | 26.8 | — | Shallow | 2006 |
| TB–18D | WE5049 | 405427073521101 | 278.02 | 275.43 | 60 | 63.55 | 50–60 | Deep | 2006, 2015 |
| MB–1W | WE5065 | 405430073521101 | 300.38 | 300.55 | 107 | 77 | 60–80 | Deep | — |
| MB–4W | WE5069 | 405429073521201 | 288.31 | 286.82 | 103 | 61.5 | 50–60 | Deep | 2015 |
| MB–5 | WE5070 | 405427073521103 | 299.31 | 299.67 | 105 | 75.25 | 60–80 | Deep | 2015 |
| MR–100P | WE5042 | 405427073520901 | 300.71 | 299.02 | — | 39.45 | — | Shallow | 2015 |
| MR–100PA | WE5066 | 405427073520902 | 300.88 | 298.96 | — | 61.35 | — | Deep | 2015 |
| MR–121 | WE5067 | 405427073520102 | 265.19 | 262.33 | — | 20.5 | — | Shallow | 2015 |
| MR–123P | WE5068 | 405427073520801 | 302.49 | 299.73 | — | 38.9 | — | Deep | 2015 |
| MR–123PA | WE5031 | 405428073520301 | 302.06 | 299.35 | — | 19.6 | — | Shallow | — |
| MR–131 | WE5074 | 405439073522101 | 273.2 | 270.6 | 33 | 32.55 | — | — | — |
| B–3P | WE5026 | 405426073520501 | 299.79 | 300.53 | — | 22.55 | — | Shallow | 2006, 2015 |
| B–4 | WE5060 | 405425073520502 | 283.81 | 282.15 | — | 35.67 | — | Shallow | 2015 |
| B–5A | WE5055 | 405425073520501 | 279.45 | 277.35 | — | 35.45 | — | Shallow | 2015 |
| HESF–8S | WE5037 | 405442073522801 | 243.88 | 241.78 | 10 | 10.7 | 5–10 | Shallow | — |
| HESF–8D | WE5029 | 405442073522701 | 244.15 | 241.81 | 19 | 19.3 | 14–19 | Deep | — |
| CMB–2W | WE5064 | 405426073520502 | 301.03 | 299 | — | 35.4 | — | Shallow | 2015 |
| 104–P | WE5059 | 405436073521702 | 301.72 | 300 | — | 41.3 | — | — | — |
| 104–PA | WE5047 | 405436073521701 | 302.98 | 300 | — | 20.7 | — | — | — |
| 105–P | WE5053 | 405440073522001 | 302.65 | 300.7 | — | 42.65 | — | — | 2015 |
| 106–P | WE5061 | 405444073522301 | 301.2 | 298.9 | — | 42.4 | — | — | — |
| 106–PA | WE5054 | 405444073522401 | 301.33 | 296.6 | — | 42.62 | — | — | — |
| 109–P | WE5073 | 405454073522201 | 303.1 | 300.1 | — | 34.75 | — | — | 2015 |
| 110–P | WE5034 | 405458073521901 | 303.4 | 302.1 | — | 32.65 | — | — | — |
| 111 | — | — | — | — | — | — | — | — | — |
| X | WE5021 | 405458073520901 | 302.1 | 299.9 | — | 38.35 | — | — | — |
| Y–PA | WE5030 | 405454073520701 | 302.63 | 300 | — | 21.14 | — | — | — |
| Y–PD | WE5044 | 405454073520702 | 302.45 | 300 | — | 42.4 | — | — | — |
| Z–PA | WE5036 | 405445073520201 | 302.75 | 300.4 | — | 19.86 | — | — | — |
| Z–PD | WE5052 | 405445073520202 | 302.06 | 299.4 | — | 46.12 | — | — | — |
| PA | WE5038 | 405432073515801 | 303.17 | 300.3 | — | 22.05 | — | — | — |
| PD | WE5023 | 405436073515801 | 302.76 | 300.2 | — | 42.3 | — | — | — |
| DT–2 | WE5025 | 405502073521101 | 300.9 | 298.92 | — | 44.8 | — | — | 2015 |
| WE–6 | WE6 | 405420073520901 | — | — | — | — | — | — | 2012 |
| WE–1256 | WE1256 | 405508073515801 | — | 250 | 500 | — | — | — | — |
| WE–5078 | WE5078 | 405441073515701 | 290.6 | 287.6 | 124 | 124.2 | — | — | 2015 |
| WE–5079 | WE5079 | 405449073520001 | 277.58 | 274.6 | 91 | 91.15 | — | — | 2015 |
Table 2.
Site information for the East Basin, seeps, and manhole outflow at the Hillview Reservoir, Westchester County, New York, 2006 and 2015.[USGS, U.S. Geological Survey; ID, identifier; ft, foot; NGVD 29, National Geodetic Vertical Datum of 1929; —, no data]
| Local site name (fig. 2) | Station name | USGS site ID | Land-surface elevation (ft above NGVD 29) |
|---|---|---|---|
| East Basin | Downtake chamber 1 | 405432073521001 | — |
| Seep A | Hillview Reservoir hillside seep A near Yonkers, New York | 405426073521101 | 255.3 |
| Seep B | Hillview Reservoir hillside seep B near Yonkers, New York | 405425073520901 | 234.1 |
| Seep C | Hillview Reservoir hillside seep C near Yonkers, New York | 405426073521005 | 259.8 |
| Seep D | Hillview Reservoir hillside seep D near Yonkers, New York | 405426073521006 | 234.6 |
| Seep E1 | Hillview Reservoir hillside seep E near Yonkers, New York | 405425073521101 | 221.6 |
| Seep I | Hillview Reservoir hillside seep I near Yonkers, New York | 405426073521007 | 227.0 |
| Kimball Avenue seep | Kimball Avenue seep | 405425073520101 | — |
| Manhole outflow | Manhole outflow near stone wall | 405425073521102 | — |
Hydrologic Measurements
Discrete and continuous groundwater levels were collected at 50 wells from April 2005 through November 2016 (Noll and Chu, 2018) and available through the USGS National Water Information System (USGS, 2016). Water-level data were not collected from eight sites (wells TB–3S, TB–14S, MB–1W, 106–PA, 110–P, 111, X, and PA) in the earthen embankment because these wells were decommissioned, damaged, or destroyed before the beginning of the study (figs. 1 and 2; table 1). Water-level records are incomplete for wells HESF–8D, HESF–8S, MR–131, Y–PA, and 104–P because they were destroyed during various construction projects at the reservoir during the study. To supplement the existing monitoring network, wells MR–123P, MR–123PA, PD, and Y–PD were repaired during the study so that water levels could be measured. In 2011, a control well (B–77) was drilled by the U.S. Geological Survey about 0.5 mi. south of the reservoir in Van Cortland Park, Bronx County, to assess regional hydrologic conditions near Hillview Reservoir (fig. 1). This well, in addition to the 49 existing wells within the reservoir, comprised the 50-well groundwater-monitoring network at the site.
Water-level elevations in all 50 wells were calculated from depth-to-water measurements collected with an electric water-level tape or a chalked steel tape (Cunningham and Schalk, 2011; Noll and Chu, 2018). Throughout the study, the USGS measured groundwater levels monthly except when site access was limited or denied for legal or safety concerns. Vented submersible pressure transducers were installed in 28 of the 50 wells and programmed to record water levels and water temperature every 60 minutes. Of the 28 instrumented wells, 23 were in the southern embankment area (fig. 2).
Continuous measurements of water stage were collected from June 1 to November 1, 2010, with a submersible pressure transducer and datalogger installed at a Parshall flume at seep B. The datalogger was programmed to record water stage in the flume’s stilling well every 15 to 60 minutes depending on project requirements. A standard rating equation for the flume was used to convert water stage to discharge. Flume discharge values calculated from recorded stage data were checked against manual volumetric measurements of instantaneous discharge made with a calibrated bucket and stopwatch (Turnipseed and Sauer, 2010) during periodic field inspections and sample collections. Erroneous data from the effects of biofouling, freeze-thaw cycles in the stilling well, overland discharge into the stilling well during storms, and sedimentation were removed from the time-series data record before the rating equation was applied. Instantaneous discharge associated with samples collected at seeps C, E, I, and the manhole outflow were determined in the same manner as at Seep B. Continuous and/or instantaneous measurements of discharge from seeps that flowed during the study (B, C, E, and I) are available through the USGS National Water Information System (USGS, 2016).
Slug Tests
Water-displacement aquifer tests, commonly known as “slug tests,” were run in 25 wells in June 2012 to estimate the hydraulic conductivity of the water-bearing units within the earthen embankment (table 3). The water in the well was displaced by a solid object, called a mechanical slug, and the water-level recovery was measured as a function of time. When a slug is quickly inserted in the well below the static water level, the water level rapidly rises, then, as water escapes the well through the screen into the aquifer because of the increased hydraulic head, the water level falls back toward the original static water level (also called a falling-head or slug-in test; Noll and others, 2019). When a slug is rapidly removed from below the water surface, the water surface rapidly falls, then, as water comes in through the screen from the surrounding aquifer material, the water level rises toward the original static water level (also called a rising-head or slug-out test).
Hydraulic conductivity, which is a measure of the capacity of sediments opposite the screened interval to transmit water, was estimated on the basis of the rate of recovery of the water level in the well. The ratio of the change in water level to the initial change in water level after the insertion of the slug was plotted log-linearly as a function of time. A line was fit to the data, and by using the well construction information and aquifer characteristics, an estimate of hydraulic conductivity was determined from the slope of the fitted line (Bouwer and Rice, 1976). The methods used to collect data in the slug tests run in the wells in the embankment are described in Noll and others (2019).
Table 3.
Hydraulic conductivity of aquifer materials in selected wells at the Hillview Reservoir Westchester County, New York.[ft/d, foot per day; ft, foot; NGVD 29, National Geodetic Vertical Datum of 1929; —, no data; Data from Capurso and others, 2019]
| Local well name (fig. 2) | Hydraulic conductivity (ft/d) | Well-screen elevation1 (ft above NGVD 29) | Saturated zone screened |
|---|---|---|---|
| B–772 | 0.040 | 171 | — |
| TB–1S | 0.0065 | 267 | Shallow |
| TB–1D | 0.0058 | 237 | Deep |
| TB–2S3 | 0.0098 | 265 | Shallow |
| TB–2D | 0.40 | 235 | Deep |
| TB–3D | 0.0012 | 235 | Deep |
| TB–4S4 | 51 | 265 | Shallow |
| TB–4D | 0.095 | 237 | Deep |
| TB–5S | 0.0027 | 266 | Shallow |
| TB–5D | 0.52 | 230 | Deep |
| TB–8 | 0.19 | 243 | Deep |
| TB–9 | 0.021 | 234 | Toe |
| TB–10 | 0.080 | 215 | Toe |
| TB–11B | 0.063 | 231 | Toe |
| TB–12 | 0.051 | 224 | Toe |
| TB–13 | 0.016 | 201 | Toe/bedrock6 |
| TB–14D4 | 0.15 | 204 | Toe |
| TB–15 | 0.27 | 208 | Toe |
| TB–17S | 0.0026 | 264 | Shallow |
| TB–17D | 0.31 | 224 | Deep |
| TB–18S | 50.02 | 256 | Shallow |
| TB–18D | 0.45 | 223 | Deep |
| MB–1W1 | 0.010 | 230 | Deep |
| MB–4W | 0.60 | 233 | Deep |
| MB–5 | 0.092 | 229 | Deep |
| MR–100P | 50.03 | 267 | Shallow |
| MR–100PA4 | 52 | 245 | Deep |
| MR–121 | 50.03 | 250 | Shallow |
| B–3P | 50.02 | 283 | Shallow |
| B–4 | 50.01 | 254 | Shallow |
| B–5A | 50.02 | 249 | Shallow |
| CMB–2W | 50.2 | 271 | Shallow |
| 105–P | 50.007 | 266 | — |
| 106–P | 50.002 | 264 | — |
| 109–P4 | 51 | 274 | — |
| Z–PA | 50.008 | 289 | — |
| Z–PD | 50.006 | 261 | — |
| DT–2 | 51 | 262 | — |
Well-screen elevation is the midpoint of the screened interval. Screen elevations were estimated for wells with no construction information.
Slug-out test data were analyzed for well TB–2S because erroneous data were indicated for the slug-in test on August 22, 2007.
Collection of Suspended-Sediment Samples
From 2007 to 2015, a total of 11 water samples and 11 sequential replicate samples were selected for analysis; at seep B (8 samples), at seep E from the stone wall drainage openings (2 samples), and the manhole outflow (1 sample) to determine the suspended sediment concentration (SSC) and percentage of fine-grained material (silt and clay) in suspension for a range of measured discharges (fig. 2; table 4). At seep B, six samples were collected between July 2014 and August 2015, one was collected in March 2008, and one was collected when the seepage was first observed in September 2007 (table 4). Water samples were collected from seeps B and E and from the manhole outflow (fig. 2) and analyzed to determine the instantaneous concentration and particle-size distribution of suspended sediment (table 4). Grab samples were collected from the outflow of the seeps and the manhole using procedures described by Edwards and Glysson (1999). The samples were shipped to the USGS Kentucky Water Science Center Sediment Laboratory for analysis.
Table 4.
Properties of suspended sediment samples collected at the Hillview Reservoir, Westchester County, New York.[Samples collected by grab method. Dates and times are given in month/day/year hour:minute. gal/min, gallon per minute; <, less than; mm, millimeter; mg/L, milligram per liter; —, no data; Data from USGS, 2016]
A total of 18 samples (9 primary, 9 replicates) were analyzed for suspended-sediment concentration (SSC) and percentage of sediment grain size finer than 0.0632 millimeter (the silt and clay fraction). Particle-size distribution was analyzed for 12 of the 18 samples collected from seep B using a sand-fine separation technique described by Guy (1969) and Shreve and Downs (2005).
Hydrology of the Embankment
Two groundwater-flow zones—one shallow and the other deep—that overlie the bedrock at the reservoir have been identified and defined in previous studies (NYCDEP, 1909; Malcolm Pirnie, Inc., and TAMS Consultants, Inc., 2002; Chu and others, 2013). The shallow saturated zone was created from local glacial deposits during the construction of the reservoir and modified to form a compact, low permeability embankment for reservoir water retention. The deep saturated zone consists of unmodified glacial sediments (primarily glacial till) with a thin basal layer of coarse sediments that lie upon granitic bedrock (fig. 3). The toe of the embankment is a confluence zone where the deep and shallow saturated zones coalesce to form one unit.
Slug-Test Analysis
In total, 38 wells were slug tested between 2007 and 2012. Tests were run at 25 wells in the Hillview Reservoir embankment and in one well (B–77) in northern Bronx County during June 2012 to determine the hydraulic conductivity of the sediments surrounding well screens (figs. 1 and 2; table 3). Data from these 26 tests, along with data from 12 additional slug tests that were run in wells surrounding the reservoir during August 2007, were analyzed using the Bouwer and Rice (1976) method with AQTESOLV slug test analysis software. The saturated thickness of the water-bearing units within the embankment ranged from 14 to 96 ft at wells TB–14D and TB–1S, respectively. Because the earthen embankment consists of relatively homogeneous material (modified and unmodified glacial clays), a vertical anisotropy value of 1 was assumed for the slug-test analysis.
Analysis of the data for a slug test of monitoring well B–77 (fig. 1) indicated a hydraulic conductivity of 0.040 foot per day (ft/d), assuming an anisotropy of 1 and saturated thickness of 8 ft. This value is consistent with the typical range of hydraulic conductivities for glacial till reported in Freeze and Cherry on page 151 (1979). Well B–77 was tested to compare the hydraulic conductivity of the local, undisturbed glacial till to the modified till that comprises sections of the embankment material at the Hillview Reservoir. Hydraulic conductivities at six wells (TB–2D, TB–4S, TB–5D, TB–18D, MB–4W, and MR–100PA) on the southern embankment were about two orders of magnitude higher than that at B–77. Wells 109–P near the northwest part of the reservoir and DT–2, which is the northernmost well adjacent to the reservoir, were also about two orders of magnitude higher than that at B–77.
For the 37 wells within the Hillview Reservoir embankment, hydraulic conductivity values ranged from 0.0012 ft/d at well TB–3D (southern end of the East Basin) to 2 ft/d at well MR–100PA (southwestern side of the East Basin). The mean hydraulic conductivity for the wells within the embankment was 0.03 ft/d with a standard deviation of 0.4 ft/d. The midpoint of well-screen elevations ranged from about 201 ft at well TB–13 (bedrock well at the toe of the southwest side embankment of the East Basin) to 289 ft at well Z–PA (eastern side of the East Basin). The midpoint well-screen elevation was estimated for wells with no construction records (table 3).
Hydraulic Conductivity of the Shallow Saturated Zone
The shallow saturated zone at the southern embankment of the Hillview Reservoir is defined as the uppermost 45 ft of the embankment materials below the crest of the reservoir embankment (Chu and others, 2013). The easternmost extent of the shallow saturated zone is near well MR–121, about 450 ft northeast of the chlorination area, and the westernmost extent is near wells TB–18S and TB–15, about 200 ft northwest and west, respectively, of downtake chamber 2 (fig. 4). The shallow saturated zone is bounded to the north by the East Basin and to the south by the toe of the southern embankment, where the deep and shallow saturated zones coalesce. Slug-test data from 18 wells screened in the shallow saturated zone were analyzed to determine the three-dimensional distribution of hydraulic conductivity of the sediments that comprise the southern embankment. The hydraulic conductivity of the shallow water-bearing unit ranged from 0.0026 to 1 ft/d at wells TB–17S (just north of the control chamber) and TB–4S (at the southern end of the East Basin), respectively (fig. 4; table 3); the average value was 0.1 ft/d, and the standard deviation was 0.3 ft/d.
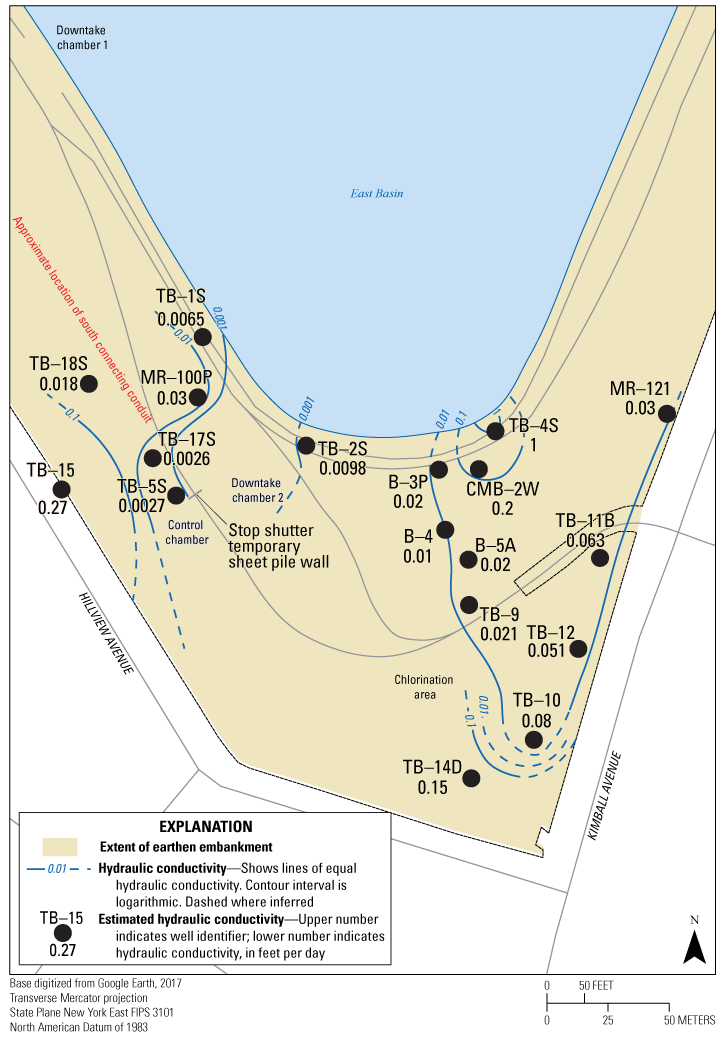
The distribution of hydraulic conductivity estimated from slug-test results of wells screened in the shallow saturated zone on the southern embankment at the Hillview Reservoir, Westchester County, New York. Hydraulic conductivity values are listed in table 3.
The two highest hydraulic conductivities measured in the shallow system, 0.2 ft/day and 1 ft/day, were on the east side of the southern embankment, at wells CMB–2W and TB–4S, respectively, which have well-screen elevations of about 268 ft (fig. 4; table 3). These findings are consistent with the slug-test analysis from 2007 published by Chu and others (2013), which indicates increased hydraulic conductivity of the shallow saturated zone near the edge of the southernmost extent of the East Basin and east of well B–3P. The lowest hydraulic conductivity values in the shallow saturated zone were noted north of the control chamber and downtake chamber 2. Wells in this area are screened (table 1) in the compacted and clay-rich zone identified using surface-geophysical techniques (shear-wave velocity and 2-D resistivity surveys) and subsequently mapped by Chu and others (2013). The surface of the compacted and clay-rich zone—defined by relatively high shear-wave velocity and low electrical resistivity—ranges in elevation from below 250 ft at TB–1S near the southwestern edge of the East Basin to 285 ft elevation near well MR–100P. This compacted and clay-rich zone was identified in an original engineering drawing of Hillview Reservoir as “special impervious embankment” with a sloping surface elevation between about 260 and 300 ft (fig. 3; NYCDEP, 1909).
There is a gradient from lower to higher permeability sediments to the south, east, and northeast of a line of equal hydraulic conductivity of 0.01 ft/d defined by the results of slug tests at wells B–3P, B–4, B–5A, and TB–9 (fig. 4). To the south of these wells, hydraulic conductivity increases to 0.08 ft/d at TB–10 to greater than 0.1 ft/d at TB–14D at the southern end of the earthen embankment. Farther east, less permeable material is present near well MR–121, where hydraulic conductivity is about 0.03 ft/d. Shallow system hydraulic conductivity on the western side of the southern embankment generally increases from east to west, where values less than 0.01 ft/d were measured at wells TB–5S and TB–17S near downtake chamber 2 and at TB–1S about 20 ft from the edge of the East Basin (fig. 4). Compared to the west side of the southern embankment, the hydraulic conductivity of the sediments on the east side are spatially variable and vary with depth. The standard deviation of the west-side sediments is 0.009 ft/d, which indicates less variability as compared to the east side of the shallow saturated zone and the reservoir-wide standard deviation of 0.4 ft/d. The lack of variability and low values of hydraulic conductivity indicate that the shallow embankment material beneath the terrace area (top of embankment dam) on the west side of the southern embankment is more homogeneous and clay-rich, and potentially more compact, than the sediments on the east side and the earthen embankment. The median hydraulic conductivity of the shallow-system sediments on the west side of the southern embankment is 0.008 ft/d, which is about 3 times less than the median value at the 37 wells around the reservoir, and about 2.5 times less than the median value at the six wells on the east side of the southern embankment.
Slug-test results from six wells (TB–9, TB–10, TB–11B, TB–12, TB–14D, and TB–15) in the southern embankment were used to determine the spatial distribution of hydraulic conductivity in the embankment toe. These wells are screened in a single water-bearing unit near the toe of the southern embankment, along Hillview Avenue on the west and south side and Kimball Avenue on the east side, where the shallow and deep saturated zones converge. Hydraulic conductivity of the sediments that comprise embankment material near the toe of the earthen dam ranged from 0.021 to 0.27 ft/d, at wells TB–9 and TB–15, respectively. The hydraulic conductivity at the six tested wells had a median value of 0.07 ft/d and a standard deviation of 0.1 ft/d. Elevations of the mid-point of the screens in these wells range from about 204 to 234 ft, at wells TB–14D and TB–9, respectively. Well TB–13 was not included in the characterization of the toe as it has a 20-ft screen that spans the contact between the crystalline-bedrock aquifer and the unconsolidated toe zone (table 1); analysis of the continuous-record hydrograph for well TB–13 indicates that the water table is below the top of bedrock (Noll and Chu, 2018). The elevation of the mid-point of the well-screen for well TB–13 is about 201 ft.
Hydraulic Conductivity of Deep Saturated Zone
The surface of the deep saturated zone within the southern embankment is about 50 ft below the crest of the embankment or 250 ft elevation, and its base is defined by the relatively impermeable bedrock surface beneath Hillview Reservoir. Drilling logs indicate the bedrock surface elevation ranges from about 180 ft, at well TB–1D (southwest side of the East Basin), to 230 ft at well CMB–2W (southeast side of the East Basin). In general, the easternmost extent of the deep saturated zone is near wells TB–4D and TB–8, about 300 ft north of the chlorination area, and to the west near wells MB–1W and MB–4W, about 150 ft south of downtake chamber 1 (fig. 5). Like the shallow saturated zone, the deep saturated zone is generally bounded to the north by the East Basin and to the south by the toe of the southern embankment, where the deep and shallow saturated zones converge into a single groundwater-flow system. It is not known if the deep (or shallow) saturated zones extend beyond the indicated geographic limits. In total, 12 wells on the southern embankment are screened in the deep saturated zone, where hydraulic conductivities ranged from 0.0012 to 2 ft/d at wells TB–3D and MR–100PA (both on the southwestern side of the East Basin), respectively. The hydraulic conductivities at the 12 wells had a median value of 0.25 ft/d and a standard deviation of 0.6 ft/d.
The distribution of hydraulic conductivity estimated from slug-test results of wells screened in the deep saturated zone on the southern embankment at the Hillview Reservoir, Westchester County, New York. Hydraulic conductivity values are listed in table 3.
Five of the six highest hydraulic conductivities in the deep zone were on the west side of the southern embankment and are within an area of about 18,000 square feet on the terrace area adjacent to downtake chamber 2, the control chamber, and the south connecting conduit (fig. 5). Well-screen elevations for the four wells range from about 223 ft at TB–18D to 245 ft at MR–100PA. The relatively higher hydraulic conductivity of the sediments in the deep zone indicates a transition from the lower permeability sediments (in the shallow zone) that were mapped by Chu and others (2013) to higher permeability sediments below 240 ft elevation. The higher permeability unit may extend northwest to well MB–4W (near downtake chamber 1), which had the second highest hydraulic conductivity value of 0.60 ft/d and a screen elevation of 233 ft, and southwest to the toe of the southern embankment near well TB–15 with a value of 0.27 ft/d, which is screened near 208 ft elevation (fig. 5; table 2).
The highest conductivity in the embankment materials indicated by the slug tests, 2 ft/d, was at well MR–100PA. Because of the high hydraulic conductivity indicated by the initial “slug-in” test, data from a “slug-out” test were also analyzed to verify the results of the first test. Both tests yielded the same result: water levels in the well MR–100PA recovered within 4 minutes, indicating a hydraulic conductivity of 2 ft/d. Qualitative observations during water-quality sampling, which requires purging three casing volumes of water from the well using an open-top bailer for low-permeability formations, indicated a rapid recovery of water levels in well MR–100PA relative to that in other sampled wells. A hydraulic conductivity of the order 100 ft/d is consistent with the hypothesis that the deep saturated zone beneath the terrace area on the west side of the southern embankment consists of relatively permeable sediments.
A lateral transition from higher to lower hydraulic conductivities occurs along a northeast trending line, orthogonal to the edge of the East Basin, defined by wells TB–18D (0.45 ft/d), MB–5 (0.092 ft/d), and TB–1D (0.0058 ft/d) on the western part of the southern embankment (fig. 5). Closer to downtake chamber 1, wells MB–4W (0.60 ft/d) and MB–1W (0.010 ft/d) define a similar transition from higher to lower hydraulic conductivities. These findings correspond with a published cross section of the west side southern embankment that indicates a transition from relatively permeable sediments near the toe of the embankment to highly impermeable (possibly highly compacted) sediments near the East Basin (NYCDEP, 1909; Malcolm Pirnie, Inc., and TAMS Consultants, Inc., 2002).
A steep lateral transition from higher to lower hydraulic conductivity occurs between wells TB–2D (0.40 ft/d) and TB–3D (0.0012 ft/d) that are both screened at about 235 ft elevation and are about 65 ft apart along the edge of the southernmost extent of the East Basin. A shear-wave velocity profile published by Chu and others (2013) for this same area at around 240 ft elevation (60 ft below the crest of the dam) is consistent with the observed transition. The spatial extent of the lateral transition to the south cannot be determined because of the lack of well information in that area.
The standard deviation of the measured hydraulic conductivities (0.6 ft/d) in the deep saturated zone on the southern embankment indicates the permeability of the water-bearing unit is highly variable compared to that in the shallow system (0.3 ft/d) and the reservoir-embankment materials in general (0.4 ft/d). The relatively high variability of permeability of the sediments, combined with 5 of the 10 highest values of hydraulic conductivity measured at wells within the embankment, indicate that the deep saturated zone near wells TB–2D, TB–5D, TB–17D, TB–18D, and MR–100PA may have a higher capacity to transmit water than the shallow saturated zone above and other deep saturated zone sediments adjacent to this area. In fact, the median hydraulic conductivity at these 5 deep system wells is 0.45 ft/d, which is about 45 times higher than that at the counterpart wells screened in the shallow system (0.01 ft/d), and about 5 times higher than at the adjacent deep-system wells (0.09 ft/d). Cross sections from the original engineering design of the southern embankment indicate unmodified sediments (possibly glacial till) below an elevation of about 250 ft (fig. 3; NYCDEP, 1909; Malcolm Pirnie, Inc., and TAMS Consultants, Inc., 2002). A driller’s log from well WE–1256, north of the reservoir at Yonkers Raceway (fig. 1), indicated that the sediments from 250 to 210 ft elevation were mostly clay, with a basal layer (about 10 ft thick) of coarser sediments (sand and gravel) that lie on top of granitic-type bedrock at an elevation of about 210 ft. The hydraulic conductivity of the sediments near wells TB–2D, TB–5D, TB–17D, TB–18D, and MR–100PA were on the order 100 and 10−1 ft/d, which is within the upper limit of published values for glacial till and within the lower limit for silty sands (Freeze and Cherry, 1979; p. 151). The naturally occurring (unmodified) sediments near these wells may have a sandier component compared to those at well WE–1256 or may have been subsequently modified by discharge from leaky water infrastructure, construction, or both. Pressurized water from a leaky south connecting conduit (or other damaged water infrastructure) may preferentially flow through the relatively permeable, unmodified sediments in the west side of the deep saturated zone—instead of the relatively impermeable sediments above and the impervious bedrock below—to the seeps that are expressed on the surface of the southern embankment downslope from the control chamber (fig. 2). The bottom of the modified “special impervious embankment,” and the bottom of the south connecting conduit are at approximate elevations of 260 ft and 262 ft, respectively. The seeps, at elevations ranging from 221.6 to 259.8 ft (table 2), are all below the bottom of the south connecting conduit and the bottom of the special impervious layer, within the unmodified glacial sediments that comprise the deep saturated zone (fig. 3).
Little is known about the permeability of the deep-system sediments on the east side of the southern embankment except near wells TB–4D and TB–8, which are screened at about 240 ft elevation, and had hydraulic conductivity values of 0.095 and 0.19 ft/d, respectively. These wells are screened about 30 ft below the shallow saturated zone wells (TB–4S and CMB–2W), and hydraulic conductivity values are about an order of magnitude lower (figs. 4 and 5).
Long-Term Hydrologic Trends
Water levels from 42 sites (41 monitoring wells and the East Basin gage) were analyzed to determine the effects of local and regional recharge on the Hillview Reservoir groundwater-flow system from 2005 to 2016 (figs. 1 and 2; table 5). Discrete measurements were made at episodic intervals for 20 of the 42 sites; discrete and continuous-record data were collected at the remaining 22 sites (Noll and Chu, 2018). The data were loaded into a commercially available statistical computing and graphics software (R, ver. 4.0.4; R Core Team, 2021). Discrete measurements were merged with continuous-record data to fill gaps (missing values) in the continuous record; remaining missing values in the merged dataset were imputed using a seasonal Kalman Filter (Kalman, 1960). The data were aggregated into monthly mean elevation values. A “Seasonal and Trend decomposition using Loess” (Cleveland and others, 1990) was performed on the time-series data for the 42 sites. Decomposition is a filtering procedure for breaking a time-series into trend-cycle, seasonal, and remainder components, as shown for well TB–15 in figure 6. A trend-cycle window of 13 months was used to perform the decomposition.
Table 5.
Trends in water levels at selected sites within and adjacent to Hillview Reservoir, Westchester County, New York, 2005–16.[NA, not applicable]
| Site name (figs. 1 and 2) | Site type | Sign of the slope1 | Trend |
|---|---|---|---|
| MB–5 | Groundwater | NA | Not significant |
| B–3P | Groundwater | NA | Not significant |
| TB–18S | Groundwater | NA | Not significant |
| TB–1S | Groundwater | NA | Not significant |
| Y–PA | Groundwater | NA | Not significant |
| Z–PD | Groundwater | NA | Not significant |
| TB–10 | Groundwater | Positive | Upward |
| TB–12 | Groundwater | Positive | Upward |
| TB–14D | Groundwater | Positive | Upward |
| TB–15 | Groundwater | Positive | Upward |
| TB–17D | Groundwater | Positive | Upward |
| TB–5D | Groundwater | Positive | Upward |
| 104–PA | Groundwater | Negative | Downward |
| 105–P | Groundwater | Negative | Downward |
| 106–P | Groundwater | Negative | Downward |
| 109–P | Groundwater | Negative | Downward |
| B–4 | Groundwater | Negative | Downward |
| B–5A | Groundwater | Negative | Downward |
| B–77 | Groundwater | Negative | Downward |
| CMB–2W | Groundwater | Negative | Downward |
| DT–2 | Groundwater | Negative | Downward |
| MB–4W | Groundwater | Negative | Downward |
| MR–100P | Groundwater | Negative | Downward |
| MR–100PA | Groundwater | Negative | Downward |
| MR–121 | Groundwater | Negative | Downward |
| TB–11B | Groundwater | Negative | Downward |
| TB–13 | Groundwater | Negative | Downward |
| TB–17S | Groundwater | Negative | Downward |
| TB–18D | Groundwater | Negative | Downward |
| TB–1D | Groundwater | Negative | Downward |
| TB–2D | Groundwater | Negative | Downward |
| TB–2S | Groundwater | Negative | Downward |
| TB–3D | Groundwater | Negative | Downward |
| TB–4D | Groundwater | Negative | Downward |
| TB–4S | Groundwater | Negative | Downward |
| TB–5S | Groundwater | Negative | Downward |
| TB–8 | Groundwater | Negative | Downward |
| TB–9 | Groundwater | Positive | Upward |
| WE–5078 | Groundwater | Negative | Downward |
| WE–5079 | Groundwater | Negative | Downward |
| Z–PA | Groundwater | Negative | Downward |
| East Basin | Surface water | Negative | Downward |
A positive sign for the slope of the regression line indicates values were increasing over time; a negative slope indicates values were decreasing. Regression line shown only in figure 6 for visualization purposes.
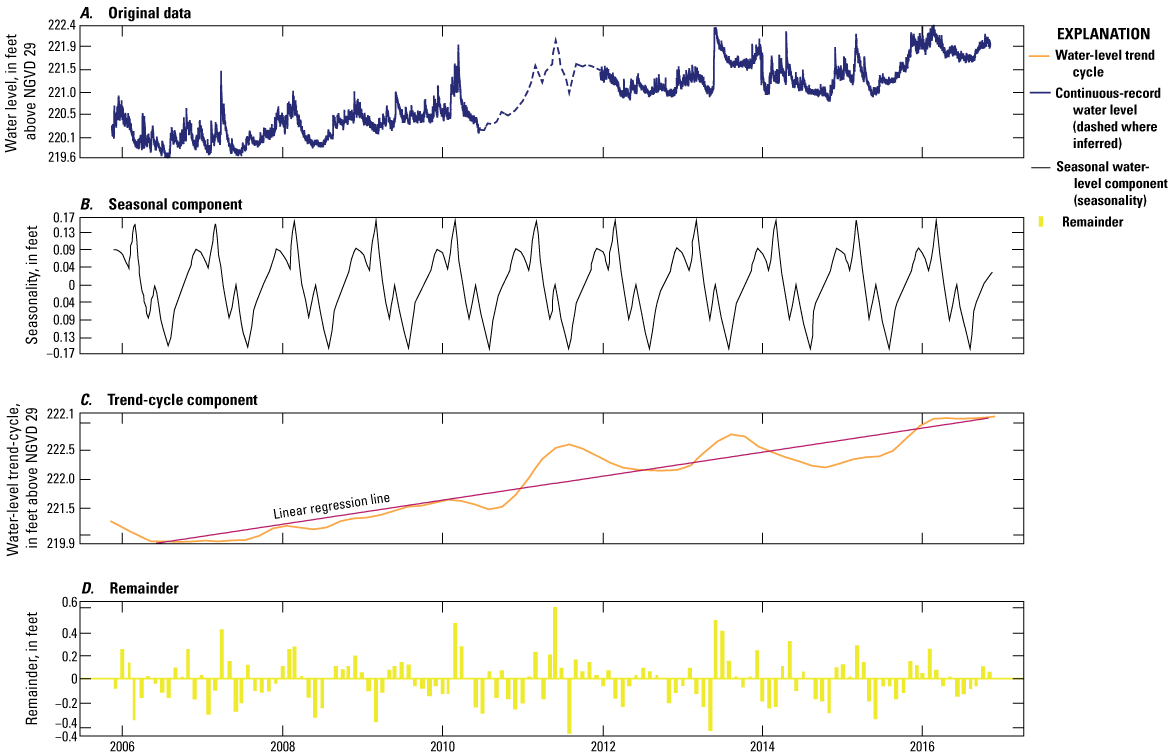
The results of a seasonal trend decomposition of water levels at well TB–15. A is the original monthly data (with gaps filled); B is the seasonal component; C is the overall trend after seasonal effects have been removed; and D is the remainder, which is the portion of the data that cannot be explained by either seasonality or long-term trend.
The trend-cycle component of the decomposed time series for each site was tested for presence of a monotonic trend using the rank-based non-parametric Mann-Kendall statistical test, which is commonly used for environmental time series (Helsel and others, 2020). Unlike parametric tests, Mann-Kendall does not require assumptions regarding the distribution or variance of the data. The Mann-Kendall test statistic is computed from the ranks and sequences of the time series, and has been shown to be approximately normally distributed (Wang and others, 2020). The null hypothesis of the test is that realizations are independent and identically distributed, and do not exhibit a monotonic trend. At the 0.05 significance level, the null hypothesis of no monotonic trend was rejected at 36 of the 42 sites. For visualization purposes, a linear regression line (shown only in fig. 6) was fit to the trend-cycle data for the 36 sites. The trends at seven of the 42 sites (wells) had a positive slope, which indicates that water levels increased during the study period (figs. 7 and 8; table 5). Two of the seven wells (TB-5D and TB-17D) are screened in the deep system and the remaining five wells (TB–9, TB–10, TB–12, TB–14D, and TB–15) are screened in the toe system. All seven wells are on the southern embankment of the Hillview Reservoir (fig. 8). The null hypothesis was accepted (p-value>0.05) at 6 (TB–1S, TB–18S, MB–5, B–3P, Y–PA, and Z–PD) of the 42 sites indicating no significant trend in the data.
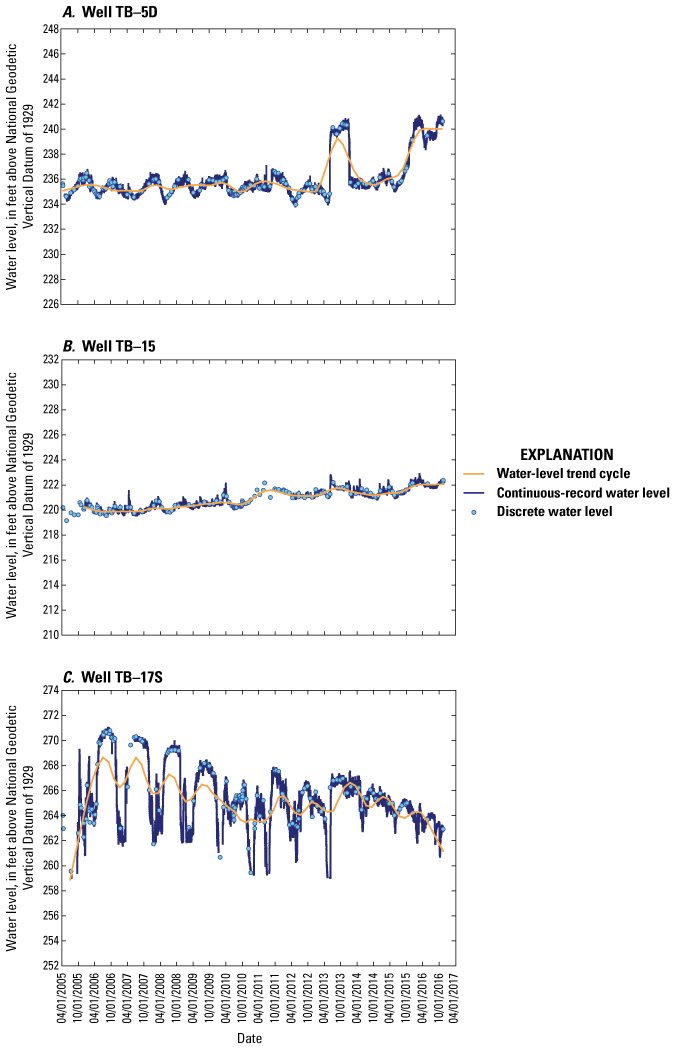
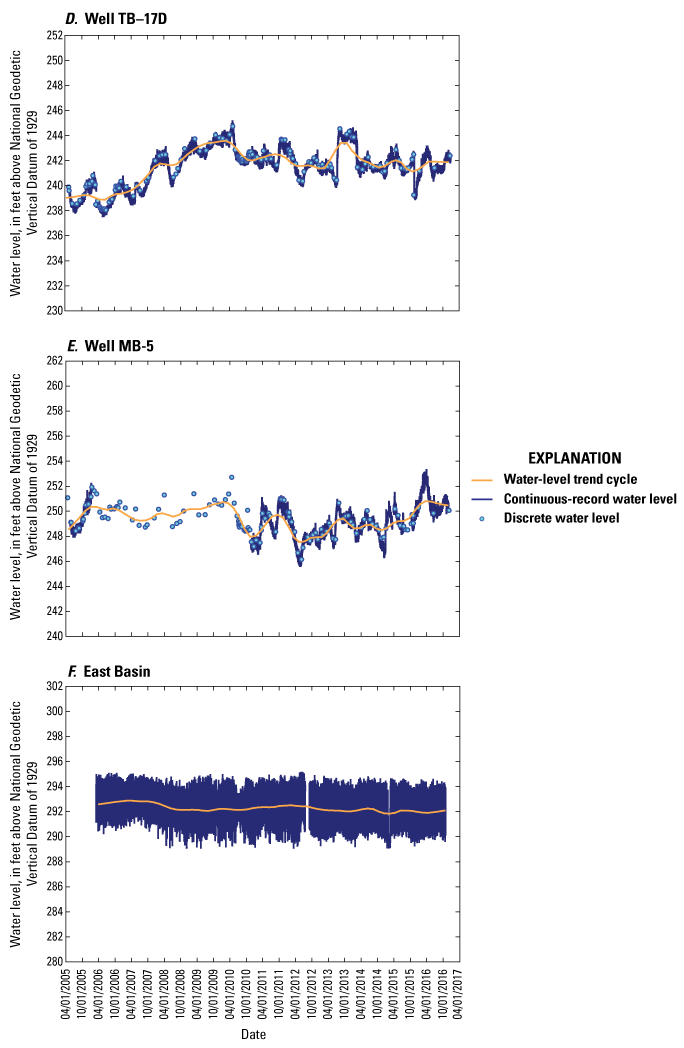
Water levels and trends at selected wells on the embankment, and the East Basin of Hillview Reservoir, Westchester County, New York, 2005–16. A, well TB–5D; B, well TB–15; C, well TB–17S; D, well TB–17D; E, well MB–5; and F, East Basin.
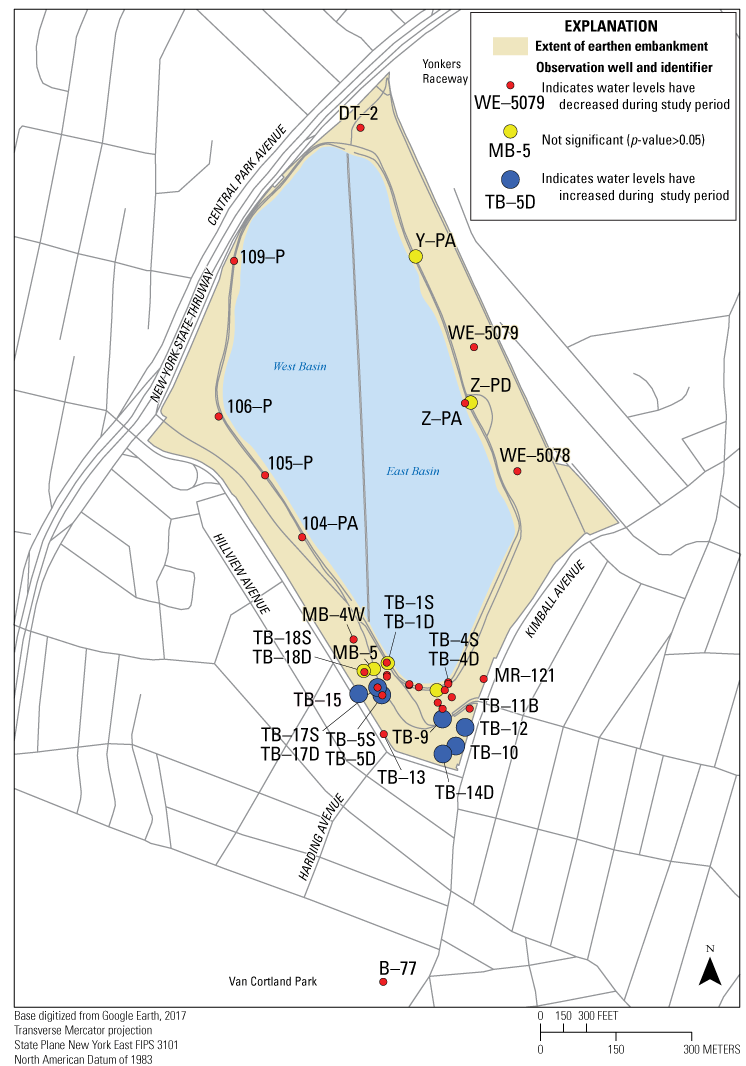
The spatial distribution of water-level trends for selected sites, Hillview Reservoir, Westchester County, New York, 2005–16.
Regional Hydrologic Conditions
One of the primary sources of recharge to the shallow and deep saturated zones at Hillview Reservoir is precipitation (Chu and others, 2013). Annual precipitation data from the National Weather Service meteorological station at Central Park, New York, and hydrologic information from the National Integrated Drought Information System (NIDIS) were compiled and analyzed to help characterize regional hydrologic conditions during the study period from 2005 to 2016. Stage data from the East Basin gage also were analyzed to determine the effect of the basin water level on the local groundwater-flow system.
Historical Drought Conditions in Westchester County
The Standardized Precipitation Index (SPI) is used to characterize meteorological drought for the contiguous United States (National Oceanic and Atmospheric Administration [NOAA], 2021). The SPI is the number of standard deviations that observed cumulative precipitation deviates from the climatological average since 1895. A 9-month SPI value was used to characterize regional hydrologic conditions in Westchester County, New York, from 2005 to 2016.
In general, regional meteorological conditions were abnormally wet from April 2005 to May 2012, and abnormally dry from May 2012 to November 2016. Superimposed on these general, overall conditions for the entire period, however, were shorter, intermittent periods of either dry or wet conditions. Periods of moderate to severe drought lasting from one to several months occurred intermittently from August 2005 to August 2016, and drought was extreme from September through November 2016. The short dry periods were interspersed with short periods of moderately to severely wet conditions as well as short periods categorized as being extremely wet.
Central Park Precipitation Gage
Annual precipitation data from the NWS meteorological station at Central Park, New York (fig. 1), from 2005 to 2016 were examined to assess the effect of precipitation to recharge of the local groundwater-flow system at the Hillview Reservoir. The annual average precipitation for the 148-year period of record for the Central Park gage, which has operated continuously since 1869 is 45.28 inches. Annual precipitation for the 12-year period of record from 2005 to 2016 was 55.97, 59.89, 61.67, 53.61, 53.62, 49.37, 72.81, 38.51, 46.32, 53.79, 40.97, and 42.17 inches per year, respectively. The average annual precipitation during the 12-year period 2005-2016 was 52.39 inches, which is about 16 percent higher than the 148-year average. During the last 5 years of the study, from 2012 to 2016, average annual precipitation averaged 44.36 inches, which is about 2 percent lower than the 148-year average and 15 percent lower than the 12-year average for the study. These data seem to correlate with the meteorological conditions indicated by the NIDIS (NOAA, 2021) and indicate a downward trend in annual precipitation during the study period.
Local Groundwater Levels
If the seasonal effects on water-level fluctuations are removed (“deseasonalized”), the trends in water levels in 28 of the 41 wells, and the East Basin were downward during the study period (figs. 7 and 8; table 5). The spatial distribution of these wells generally indicates an overall decrease of water levels in the shallow and deep aquifers around the reservoir during the period of record (fig. 8). On the east and west side of the southern embankment, water levels declined in 8 deep wells (TB–1D, TB–2D, TB–3D, TB–4D, TB–8, TB–18D, MB–4W, and MR–100PA), and in all 12 of the shallow wells. During the 12-year period of record, water levels also declined in TB–11B screened in the toe of the southern embankment; and in TB–13, in which the screen extends from the bottom of the toe system into the top of the underlying bedrock. Wells for which water-level records for the study period were incomplete were omitted from the analysis, except for monitoring well B–77, about 0.5 mi. south of the reservoir in Van Cortland Park, Bronx County (fig. 8; table 5). This well was drilled by the USGS in 2011 as a control well to assess regional hydrologic conditions near Hillview Reservoir. Water levels in this well have been decreasing since 2011.
East Basin at the Hillview Reservoir
Water levels in the East Basin of the Hillview Reservoir (405432073521001) have been periodically monitored by the USGS since April 2006 with a vented submersible pressure transducer and data-logging device. Water-level data are corrected for instrument drift during site inspections by comparing the measured stage value from the pressure transducer to the stage value from NYCDEP East Basin gage at downtake chamber 1 (fig. 2). The gage is maintained by NYCDEP Reservoir Operations and is within downtake chamber 1.
Water-level changes in the East Basin are characterized by diurnal fluctuations that correspond to the water usage of NYC’s approximately 9 million residents that require about 1 billion gallons of potable water each day (NYCDEP, 2017). Hillview Reservoir functions as a balancing reservoir that controls the hydraulic pressure in the NYC water-supply distribution system. East Basin water-level elevation is kept within a specific range by Reservoir Operations but may be adjusted based on experience from historical user demand (for example, during halftime of a major sporting event) or changes in upstream conditions like anticipated precipitation events and system shutdowns.
The water-level elevation in the East Basin fluctuates daily between about 295 and 290 ft; the highest levels typically occur in the morning, around 06:00 a.m., and the lowest levels occur around midnight. Although the NYCDEP tries to maintain an average head of about 293 ft, a downward trend in water levels in the East Basin from 2006 to 2016 is evident, indicated by the negative slope of the linear regression equation (figs. 7 and 8; table 5). The East Basin is hydraulically connected to the local groundwater-flow system within Hillview Reservoir, and on the basis of water-level monitoring during the study period is considered a source of recharge for the deep saturated zone, and to a lesser extent, the shallow saturated zones within the southern embankment (Chu and others, 2013).
The trends in water levels in seven wells (TB–5D, TB–9, TB–10, TB–12, TB–14D, TB–15, and TB–17D), which are on the southern embankment of the reservoir, have positive slopes, which indicate increasing levels; trend analysis for well MB–5, however, was inconclusive (fig. 8; table 5). All seven wells are near the water-conveying infrastructure and historical or active seeps. Of the seven wells, two of the wells (TB–5D and TB–17D) are deep wells on the west side of the southern embankment, upslope of seeps A, B, C, D, E, I, and the manhole outflow (fig. 2), and screened in the deep saturated zone that consists of glacial till (NYCDEP, 1909; Malcolm Pirnie, Inc., and TAMS Consultants, Inc., 2002). The five remaining wells (TB–9, TB–10, TB–12, TB–14D, and TB–15) in which water-level trends are upward are screened in the toe of the southern embankment, where the deep and shallow saturated zones converge. Toe wells TB–9, TB–10, TB–12, and TB–14D are on the east side of the southern embankment near an intermittent seep at Kimball Avenue, whereas toe well TB–15 is near the seeps on the west side of the southern embankment. In 2012, reservoir operations staff determined that the source of the Kimball Avenue seep was a nearby leaking water main. These data indicate a gradual increase of hydraulic pressure at discrete locations at the toe of the earthen embankment and within the deep saturated zone. This trend in water levels at these seven wells is counter to trends of annual precipitation at Central Park and East Basin water elevation from 2005 to 2016. Additionally, the SPI generally indicates abnormally dry conditions in the region from May 2012 to November 2016; and episodic moderate to severe drought conditions occurred during 25 of the last 41 months of the study period, from November 2012 to November 2016 (NOAA, 2021). Considering these local and regional hydrologic conditions during the study period, it is counterintuitive to expect long-term recharge in any of the wells at Hillview Reservoir unless an unknown water source exists.
Sediment-Discharge Relation on the Southern Embankment
From 2007 to 2015, a total of 11 water samples and 11 sequential replicate samples were selected for analysis; at seep B (8 samples), at seep E from the stone wall drainage openings (2 samples), and the manhole outflow (1 sample) to determine the SSC and percentage of fine-grained material (silt and clay) in suspension for a range of measured discharges (fig. 2; table 4). At seep B, six samples were collected between July 2014 and August 2015, one was collected in March 2008, and one was collected when the seepage was first observed in September 2007 (table 4). SSC ranged from 1 milligram per liter (mg/L) at a flow of 2.6 gallons per minute (gal/min) in the sample collected in March 2008 to 16 mg/L at 12 gal/min in a sample collected in July 2014. In the 3 samples (and sequential replicates) collected from seep B at discharges of about 12 gal/min, however, SSC ranged from 3 to 16 mg/L, which indicates a poor correlation between SSC and discharge. Regression of the SSC concentrations of the 8 samples (and replicates) collected at seep B against discharge yields an R2 of 0.29. The 6 samples (including replicates) from seep E and the manhole outflow have concentrations of SSC relative to discharge similar to those in the lowest concentration samples collected from seep B. Given the low correlation coefficient between SSC and discharge at seep B, other factors such as seasonality, upstream channel geometry (described below), and stochastic processes may influence the SSC inflow from the seeps. Analysis of the sequential replicate samples indicated good agreement with the corresponding primary sample.
In the 6 samples (3 primary and 3 replicates) collected at discharges of 12 gal/min from seep B in July, August, and September 2014, the fine-particle fraction ranged from 27 to 100 percent (table 4). The concentration of fines, in milligrams per liter, was derived by multiplying SSC by the percentage of fines in decimal form. The concentration of suspended fine-grained particles ranged from 1 to 7 mg/L. Regression of the concentrations of fine-grained particles in the 8 samples against discharge yields an R2 of 0.01. In a sample collected from seep B at an estimated discharge of about 20 gal/min in September 2007, the suspended-fines concentration was 2 mg/L; in the sequential replicate sample collected about 1 hour later at approximately the same discharge, the concentration of fines was 5 mg/L. These findings indicate there is no correlation between the concentration of suspended fine-grained material (clay and silt size) and discharge from seep B.
The sand-fraction concentration in water samples collected at the seeps also was regressed against discharge. The R2 was 0.18, which indicates a weak correlation between suspended-sand particles and discharge from seep B similar to that for total concentration of sediment in the same samples. These regressions likely suffer from the small dataset available for analysis; the collection of additional samples at a range of discharge throughout the year may improve our understanding of the relation between SSC in the seep outflow and discharge.
Many factors affect the availability of sediment for transport, like the geometry (depth and width) of the stream channel; the velocity, energy gradient, temperature, and turbulence of the flowing water; and the cohesiveness of the particles that comprise the banks, beds, and upstream channel (Colby, 1964). There are also temporal variables to consider, such as seasonality and variability of sediment transport during storms and low-flow events (Porterfield, 1972). Because of the episodic flow from seep B, analyses of SSC concentration in the water are available for only 16 samples (8 primary and 8 replicates) collected from 2007 to 2015 (table 4), which may not adequately account for the many complex variables that affect the movement of sediment in flowing water (Guy and Norman, 1970; Porterfield, 1972). Because of the small sample size and the temporal sampling bias towards a 13-month period between July 2014 and August 2015, it is difficult to define a consistent or reliable relation between SSC and water discharge at seep B. For surrogate suspended-sediment models, a recommended minimum of 36 suspended-sediment samples is generally considered adequate for developing and validating a model with one explanatory variable, for example, streamflow (or seep discharge). This number is based on the mid-range of sample sizes recommended in the literature (Green, 1991; Harrell, 2001; Babyak, 2004) with an additional 20 percent increase to allow for an adequate cross- validation analysis to assess predictive capability of the model. The collection and analysis of additional samples for their suspended sediment would be required to account for the numerous variables that affect the movement of sediment in flowing water and to adequately calibrate a surrogate suspended-sediment model for estimating total load.
Water samples were collected from two points at the base of the stone retaining wall along the east side of Hillview Avenue at the toe of the southern embankment on September 29, 2015. The points are about 1-square-foot drainage openings at the bottom of wall. Water that flows from these structures is considered seep E for this report (fig. 2; table 4). SSC in the samples was 2 mg/L at a discharge of 3.4 gal/min collected at the first point and 2 mg/L at a discharge of 1.1 gal/min at the second point. The two sample sets (four samples) averaged 84 percent suspended silt-and clay-sized particles.
One water-sample was collected from a 4-inch steel outflow pipe (manhole outflow; table 2) in a drainage manhole at the toe of the southern embankment on December 10, 2015 (fig. 2; table 4). At a discharge of 2.4 gal/min, SSC for this sample was 2 mg/L and was composed entirely of silt-and clay-sized particles.
Unidentified Source of Recharge to the Deep Saturated Zone
During a monthly site inspection in July 2013, a record high water level of 240.12 ft was measured at monitoring well TB–5D, which was about 5 ft higher than the water level of 234.83 ft measured in the previous month (June 2013). Inspection of the recorded hydrograph for TB–5D indicated anomalously high-water levels in the well over a 7-month period beginning suddenly around June 5, 2013, and ending suddenly around January 14, 2014 (fig. 9A). During this period, continuously recorded water levels (hourly measurements by a submerged pressure transducer) in well TB–5D averaged about 239.9 ft, which is 3.9 ft greater than the level for the 11.5-year period of record average (236.0 ft); additionally, six of the seven highest discrete historical water levels during the 11-year period of record (2005 to 2016) were measured during the same 7-month period, June 2013 to January 2014. Although not as large an increase as at TB–5D, five other wells also exhibited a similar water-level anomaly during this same period: three of these wells (TB–17D, TB–18D, and MB–5) were completed in the deep saturated zone; the other two (TB–15 and TB–13) were in the toe of the embankment (TB–13 is screened in the toe and bedrock; fig. 9B–F).
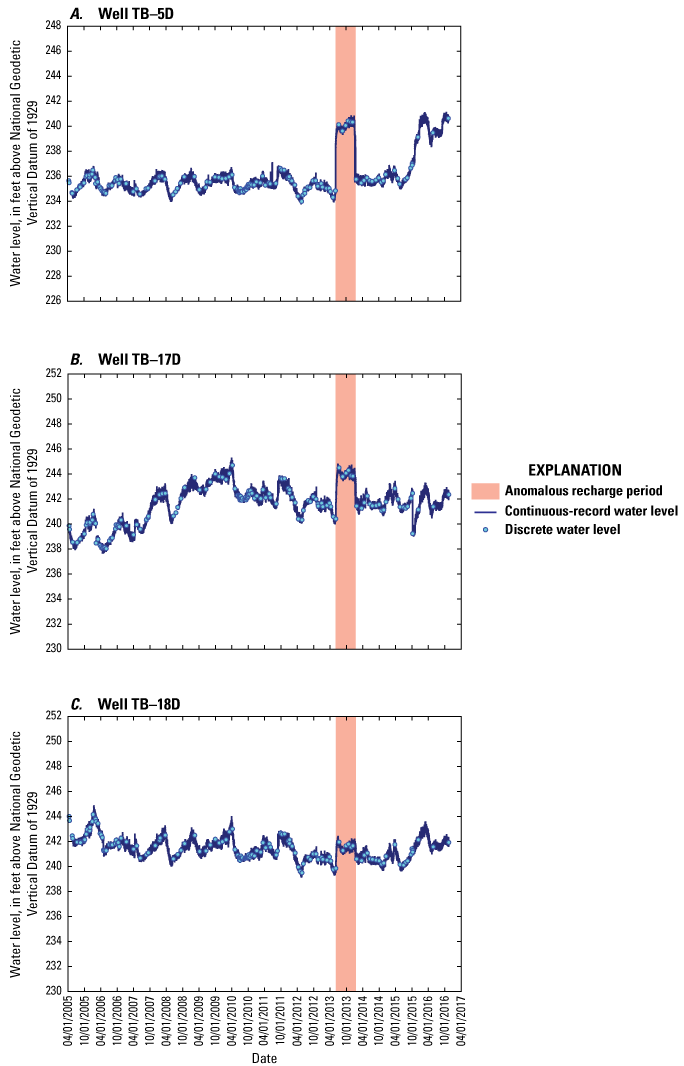
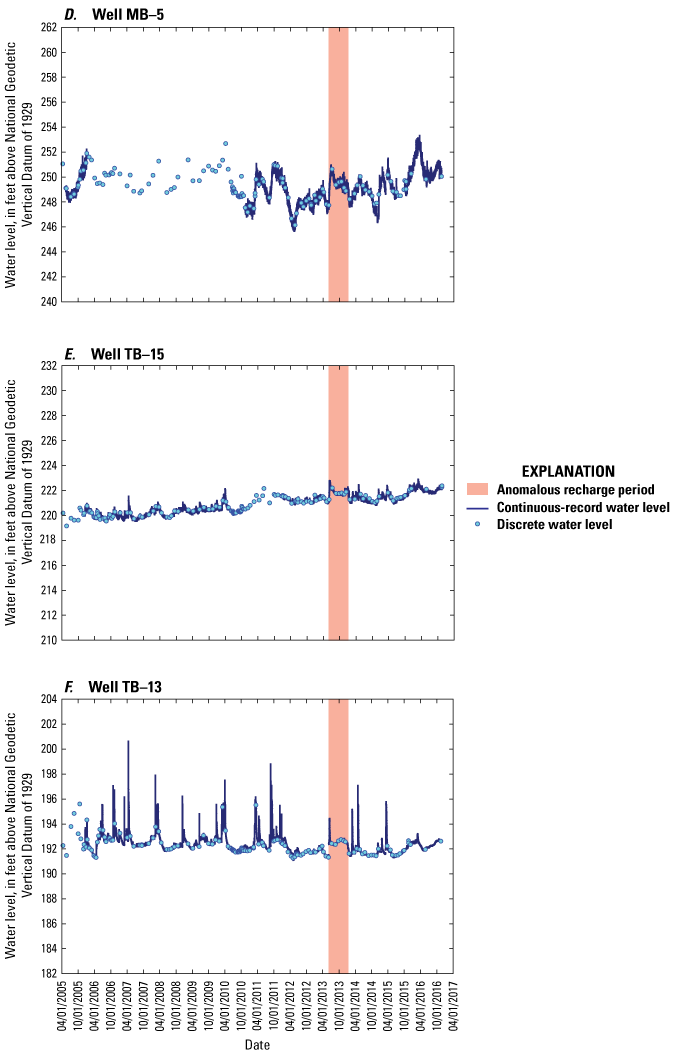
Period of record water-level hydrographs for wells potentially affected by an anomalous recharge event from June 2013 to January 2014 in the deep saturated zone within the southern embankment and bedrock at the Hillview Reservoir, Westchester County, New York. A, well TB–5D; B, well TB–17D; C, well TB–18D; D, well MB–5; E, well TB–15; and F, TB–13.
In addition to the extended, 7-month period of elevated water levels, the anomalous water-level condition in well TB–5D also was characterized by a rapid change in water levels during a relatively short period in June 2013. During a 13-hour period, from 11 a.m. Eastern Standard Time (EST) on June 5 to 12 a.m. (EST) on June 6, the water level in well TB–5D increased by 2.50 ft, from 234.76 ft to 237.37 ft, which is equivalent to an average rate of change of 0.19 foot per hour (ft/h) (table 6). This rate of change in the water level was about 238 times greater than the mean average rate-of-change for all 13-hour periods (about 0.0008 ft/h) in the 11.5-year period of record for well TB–5D.
Table 6.
Rate-of-change in water level over a 13-hour period in June 2013 and time delay of change onset in wells that were affected by an anomalous recharge event in the deep saturated zone of the southern embankment at the Hillview Reservoir, Westchester County, New York.[Rate of change calculated for period from 11 a.m. June 5 to 12 a.m. (midnight) June 6. NGVD 29, National Geodetic Vertical Datum of 1929]
| Local well name (figs. 1 and 2) | Average rate-of-change following onset of event, in feet per hour | Time delay of onset relative to TB–5D, in hours | Well-screen elevation1, in feet above NGVD 29 | Saturated zone, screened |
|---|---|---|---|---|
| TB–5D | 0.19 | — | 230 | Deep |
| TB–15 | 0.04 | 1 | 208 | Toe |
| TB–17D | 0.07 | 5 | 224 | Deep |
| TB–18D | 0.04 | 5 | 223 | Deep |
| MB–5 | 0.03 | 12 | 229 | Deep |
Water levels continued to increase after 1 a.m. EST on June 6 but were omitted from the rate-of-change calculation because about 4.5-inches precipitation fell on the site from June 6 to 8 that may have affected recharge to the deep saturated zone. The rate of rise in water level in well TB–5D on June 5 and 6, 2013, that was triggered by an anomalous recharge event, was nearly four times greater than the maximum rate of rise (0.05 ft/hr) following a 7.5-inch record rainfall at the site on April 15, 2007.
Analysis of the hydrograph for well TB–5D indicates a rapid decrease in water levels on January 13–14, 2014 (fig. 9A) and an approximate return to pre-recharge event levels. The average rate-of-change during a 13-hour period of decreasing water levels, from 8 p.m. on January 13, 2014, to 9 a.m. EST on January 14, 2014, was 0.15 ft/h, as water levels in the well decreased from 238.86 to 236.88 ft. This average rate-of-change (0.15 ft/h) was about 188 times greater than the mean average rate-of-change for all 13-hour periods (about 0.0008 ft/h) in the 11.5-year period of continuous water-level record for well TB–5D. A 0.5-inch rainfall on January 14, however, may have decreased the rate at which water levels declined.
Continuous-record hydrographs for other wells completed in the shallow and deep saturated zones and in the toe of the southern embankment at Hillview Reservoir were examined to identify any similar water-level changes and to better understand the changes measured at well TB–5D. Hydrographs for the deep zone wells showed a similar but increasingly muted (decrease in magnitude) and delayed response in water-level changes with increasing distance from well TB–5D, indicating a hydraulic connection among these wells and a spatially distributed response to the anomalous recharge event (fig. 9B-D and fig. 10).
Apparent delay time was quantified for each well by identifying the greatest average rate-of-change in water level for any 13-hour period near the onset of the anomalous recharge at well TB–5D—which was 0.07, 0.04, and 0.03 ft/h for wells TB–17D, TB–18D, and MB–5, respectively (table 6). The time difference between the onset of the anomalous water-level changes in TB–5D and the onset of the greatest average rate of change for the subject well was then calculated. An apparent delayed response of rapidly increasing water levels was indicated for deep wells TB–17D, TB–18D, and MB–5, which seemed to respond about 5, 5, and 12 hours, respectively, after 11 a.m. EST on June 5.
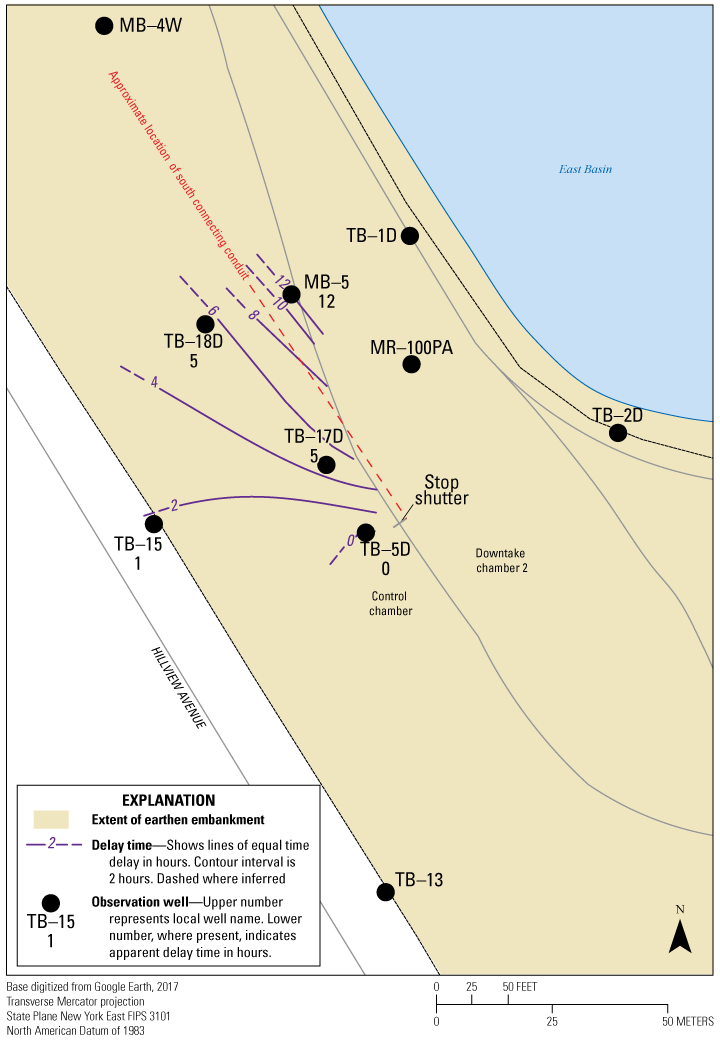
The apparent time delay in increases in water levels in wells completed in the deep saturated zone within the southern embankment at the Hillview Reservoir, Westchester County, New York, June 2013–January 2014. Time delay and rate-of-change values are listed in table 6.
The June 5 increase in water level in well TB–15, which is screened in the toe of the southern embankment at an elevation of 208 ft (table 6) directly above the impermeable bedrock surface, indicates that the effect of the anomalous recharge is not only spatially variable but also varies with depth. The greatest average rate-of-change in the water level at well TB–15 around the onset of the increase in levels at well TB–5D was 0.04 ft/h, and the apparent delay time at well TB–15 was 1 hour (fig. 10; table 6). It is suspected that well TB–13 (toe/bedrock screen zone) also was affected by the anomalous recharge; however, because water levels in well TB–13 respond nearly instantaneously to precipitation events with large and variable oscillations, interpretation of the hydrograph was inconclusive. Although the distance between TB–5D and TB–17D is substantially greater than the distance between TB–5D and TB–15, the travel time between the latter (1 h) is about a factor of 5 less than the travel time between TB–5D to TB–17D (5 h). These data indicate a potentially strong hydraulic connection between the area around the south connecting conduit at the stop shutter (a sheet pile retaining wall) and the toe of the southern embankment.
The apparent delay time for increases in water levels in wells TB–1D, TB–2D, and MR–100PA also is uncertain because the average water-level rate-of-change in these wells is influenced by diurnal fluctuations in water levels in the East Basin. Wells TB–1D and TB–2D display a rapid increase in water levels around June 5, 2013, that are sustained until a rapid decrease in water levels around January 14, 2014, which may indicate an influence from the anomalous recharge event. The hydrograph (not shown) for well MR–100PA indicated a rapid increase in water levels around June 5; however, this condition was sustained through April 2014 and cannot be conclusively attributed to the recharge event that affected the other wells. Hydrographs from deep well MB–4W and the shallow wells (not shown) did not indicate an influence from the anomalous recharge event. Together, these observations indicate the rapid increase observed in water levels is attributable to the south connecting conduit or other leaky water infrastructure proximal to well TB–5D. No operations changes were indicated by the NYCDEP to explain this period of elevated water levels in well TB–5D.
Hydrologic Response to Shutdown of the South Connecting Conduit
In the summer of 2010, the south connecting conduit between downtake chamber 1 and downtake chamber 2 was shut down and drained for repairs (figs. 1 and 2). The conduit was taken out of service on June 23 and put back into service on September 30. During an inspection just before the shutdown, a seep was observed at the embankment surface above a 90-degree elbow in the conduit about 150 feet southwest of the downtake chamber 1 building.
Although the shutdown was implemented in stages during a 2-week period, a definitive response at seeps B and C, downslope from the control chamber, occurred during the dewatering stage of the shutdown process (fig. 2), after a sheet-pile (stop shutter; fig. 10) was installed between the south connecting conduit and downtake chamber 2 near the TB–5 well pair. All the seeps were near the south connecting conduit’s stop shutter at elevations that ranged from about 260 to 221 ft, which are all below the 263 ft bottom elevation of the south connecting conduit. Seep B was the only flowing seep that could be instrumented, and thus, the only seep for which a continuous record of flow during the shutdown is available. The hydrograph for seep B delineates an almost immediate response to the drainage of the south connecting conduit, indicating a substantial hydraulic connection (fig. 11A). During the full dewatering of the south connecting conduit between July 7 and 10, 2010, discharge from seep B decreased sharply from a maximum of about 20 gal/min to 0.2 gal/min. During a period of about 10.5 hours after the conduit became completely drained, discharge from seep B decreased to 0.2 gal/min, indicating less than a half-day travel time from the apparent source to the seep under depressurized conditions in the conduit. Seep B remained virtually dry for the remainder of the shutdown period until refilling of the conduit began on September 21, 2010, except for a response to three precipitation events that were each greater than 1 inch (totaling 3.8 inches) during late August 2010. Flow at the seep in response to these precipitation events indicates a minor contribution from precipitation to total seepage discharge. The delay between the precipitation events and the beginning of flow in seep B was about 2 to 4 days, assuming little or no contribution from other infrastructure in the embankment. The only volumetric measurement of the seep during the precipitation-induced response indicated a flow of about 0.7 gal/min on August 31, 2010.
Discharge from seep B increased sharply during a period of about 34 hours of refilling (fig. 11A) of the south connecting conduit. With the stop shutter in place near downtake chamber 2, discharge from the seep increased to about 25 gal/min (the higher initial rate was likely because of a build-up of hydraulic head in the south connecting conduit before the stop shutter was removed), where it remained for about 1 week, then decreased sharply to about 15 gal/min during several hours after the removal of the stop shutter at downtake chamber 2 on September 29, 2010. Four more precipitation events, however, each greater than 1 inch (including one event greater than 2 inches) on September 27, September 30, October 1, and October 11, 2010, seem to have contributed to the discharge at the seep (fig. 11A).
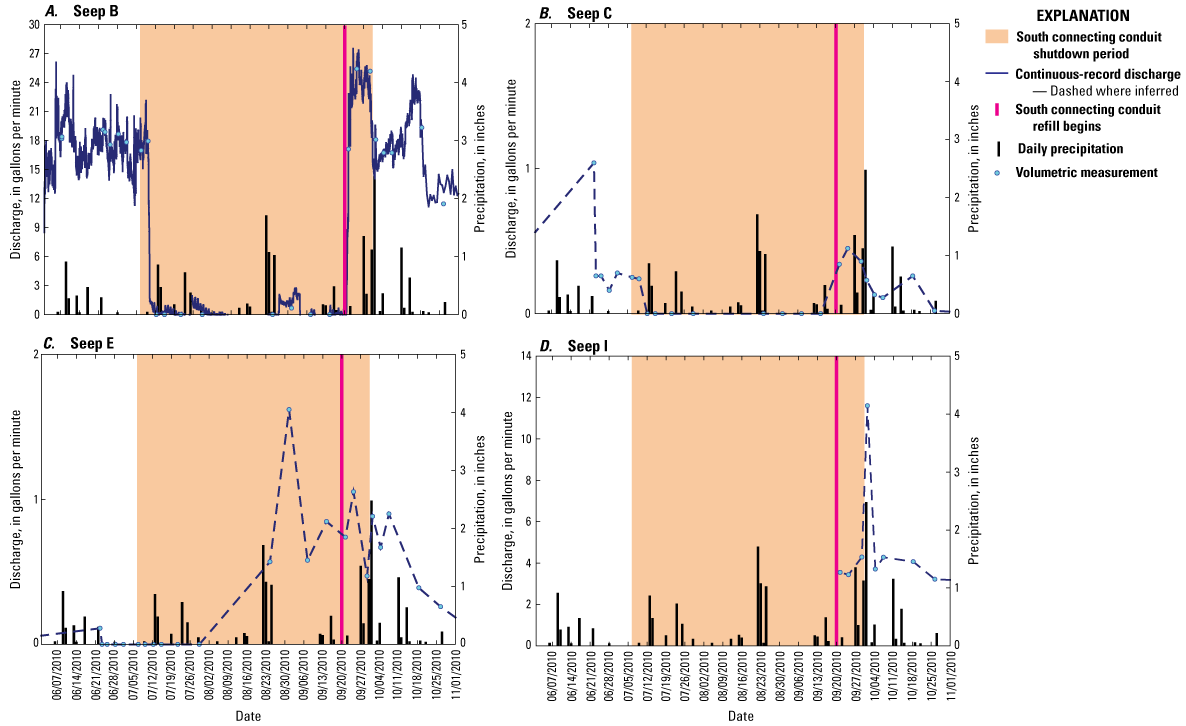
The relation of discharge at seeps on the southern embankment of Hillview Reservoir to the shutdown and refilling of the south connecting conduit in 2010. Location of seeps and the approximate location of the south connecting conduit are shown in figure 2. A, seep B; B, seep C; C, seep E; and D, seep I.
The hydrograph for seep B indicates a decrease in discharge beginning around mid-October 2010 to a rate lower than before the shutdown and repairs to the conduit. The post-shutdown discharge was less than 12 gal/min compared with about 20 gal/min before the repairs. In addition to a reduction in discharge, the timing of the highest annual flows apparently shifted from late summer and early fall to the late spring and early summer (not shown). Assuming equivalent flow through the south connecting conduit before and after the repair, the reduced discharge and shift in seasonality are likely explained due to the repair. Although the hydrograph for seep C (fig. 11B) is comprised of only discrete manual discharge measurements, the response of this seep to the shutdown appears to parallel that of seep B, although on a smaller scale. Measured discharge at seep C was never much greater than 1 gal/min. Although the wall area of seep E (fig. 11C) at the toe of the embankment was wet, it did not have sufficient discharge to measure during the early part of the shutdown. However, two of the precipitation events that apparently induced discharge at seep B also may have resulted in discharge at seep E during the shutdown. Seep E was the only seep that appears to have responded to precipitation alone. Seep I (fig. 11D) was dry until the south connecting conduit was refilled at the end of the shutdown, at which time it began flowing at 3.6 gal/min on September 21, 2010.
Except for TB–17S, water levels in the shallow wells on the southern embankment near the south connecting conduit were declining before the shutdown of the south connecting conduit (fig. 12). Hydrographs of the shallow wells during the shutdown indicate a decline in water levels that ranged from just more than 1 ft at wells MB–5 and CMB–2W (not shown) to more than 2.5 ft at well TB–18S, which went dry (Noll and Chu, 2018). For most shallow wells, the general trend of water levels before and during the shutdown was downward as shown in the hydrographs for wells TB–1S, TB–18S, and MR–100P (fig. 12). Water levels in well TB–17S, however, showed a different pattern during the shutdown (fig. 12B). Water levels at this well increased a little more than 1 ft during the early part of the shutdown and remained around the same level until after the shutdown, when the water level in well TB–17S increased again by about 1 ft. Well MR–100P was the only shallow well besides well TB–17S that showed a rise in water levels that did not seem to be a response to precipitation after the shutdown (fig. 12D).
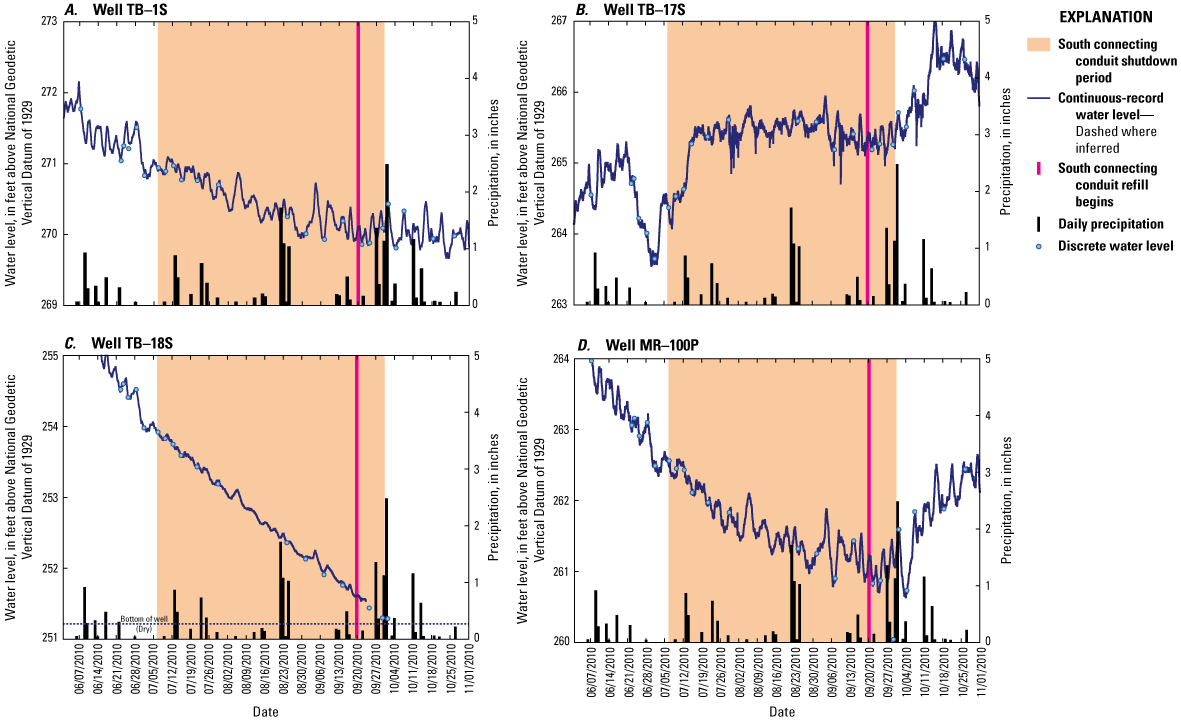
The relation of water levels in wells on the southern embankment of Hillview Reservoir to the shutdown and refilling of the south connecting conduit in 2010. Location of wells and the approximate location of the south connecting conduit are shown in figure 2. A, well TB–1S; B, well TB–17S; C, well TB–18S; and D, well MR–100P.
Hydrographs for the deep wells on the southern embankment near the south connecting conduit indicate little net change in water level (about 1 to 2 ft) over the shutdown period and show limited (if any) response to precipitation events and do not provide conclusive evidence of shutdown influence on water levels (fig. 13). Distance from the East Basin and depth of the wells affected the magnitude of the diurnal reservoir effects on the water levels (Chu and others, 2013).
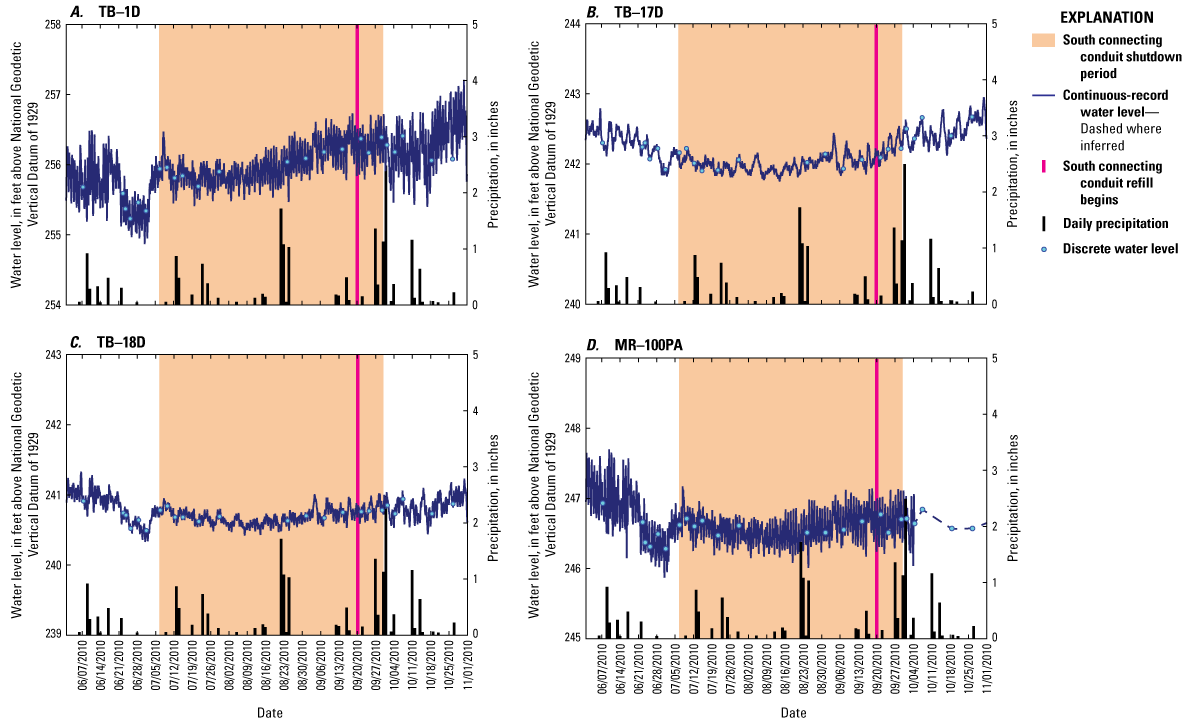
The relation of water levels in wells on the southern embankment of Hillview Reservoir to the shutdown and refilling of the south connecting conduit in 2010. Location of wells and the approximate location of the south connecting conduit are shown in figure 2. A, well TB–1D; B, well TB–17D; C, well TB–18D; and D, well MR–100PA.
Water levels in the toe wells on the southern embankment near the south connecting conduit were dropping before the shutdown and a large precipitation event coincided with the end of the shutdown of the south connecting conduit, making it impossible to determine if there was any influence in the water levels in the wells. The wells on the toe of the southern embankment had the largest range of observed water-level (fig. 14). The largest range of about 8 ft was indicated on the hydrograph of well TB–12, and the smallest range of less than 1 ft, was in wells TB–13 (toe/bedrock) and TB–15. The water-level in the wells at the toe ranged from about 2 to 8 ft or greater on the eastern toe of the southern embankment (TB–9, TB–10, TB–11B, TB–12, and TB–14D; only maximum and minimum shown in fig. 14) to less than 1 ft on the western toe of the southern embankment (TB–13 and TB–15; fig. 14). The water levels in the wells on the toe of the embankment also responded to precipitation, and like the ranges in overall water levels, the responses were greater in the wells on the eastern toe of the southern embankment.
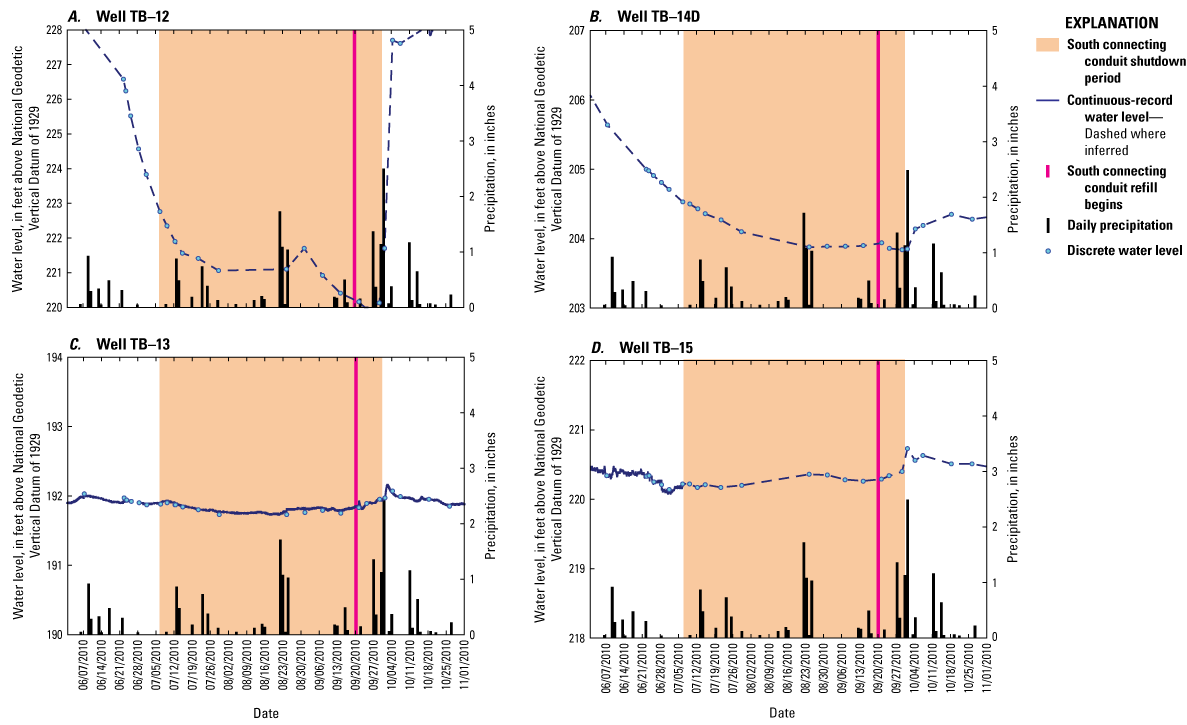
The relation of water levels in wells on the southern embankment of Hillview Reservoir to the shutdown and refilling of the south connecting conduit in 2010. Location of wells and the approximate location of the south connecting conduit are shown in figure 2. A, well TB–12; B, well TB–14D; C, well TB–13; and D, well TB–15.
Conclusions
The effects of the shutdown and dewatering of the south connecting conduit during the summer and early fall 2010 revealed a hydraulic connection between the conduit and the seeps when seeps B and C stopped flowing within hours after dewatering of the conduit was complete. Seep E from the wall also stopped except for a trickle that was too small to be measured. The seeps remained dry for the duration of the shutdown except for a response to three precipitation events that were each greater than 1 inch. The flow caused by precipitation was substantially less than that caused by precipitation events of similar magnitude before the shutdown, indicating that most of the flow from the seeps is a result of leaking infrastructure. Flows at the seeps also were continuous for extended stretches of time, even during relatively dry periods, supporting the hypothesis of a leaking infrastructure. After repair and refilling of the south connecting conduit, flow at seep B initially resumed to about 25 gal/min before the stop shutter was removed, but subsequently decreased to less than 12 gal/min when the shutter was removed, compared to about 20 gal/min before the repairs. The higher initial rate was likely because of a build-up of hydraulic head in the south connecting conduit before the stop shutter was removed. Historically, flows from seep B are highest in the late summer and early fall. A change in the seasonal pattern of flow post-repair further indicates a change due to the repair and a hydraulic connection between seep flow and the south connecting conduit. During the refilling of the south connecting conduit beginning on September 21, 2010, a new seep (I) was observed on the southern embankment along Hillview Avenue. Discharge from this seep was 3.6 gal/min, and the flow from this seep remained relatively constant until it was buried under construction stone during subsequent embankment repairs by the NYCDEP. The onset of this new seep may indicate the repair of the south connecting conduit was only partially effective.
The more transmissive deep saturated zone of the southern embankment of the reservoir near the south connecting conduit and its associated infrastructure seems to be the preferential flow path for leaking infrastructure. The wells screened in this zone showed a response during the recharge anomaly and the materials in which these wells are completed have some of the highest hydraulic conductivities of the tested wells. All seeps are in the elevation range of the deep zone from approximately the crystalline bedrock surface around 200 ft elevation to the contact between the deep and shallow saturated zones of the reservoir at about 250 ft elevation. Contrary to the downward trend of hydraulic head at 29 other wells around the reservoir embankment and in the East Basin, hydrographs from seven monitoring wells indicated upward trends in hydraulic head during the 12 years of record. Two of the seven wells (TB–5D and TB–17D) are on the west side of the southern embankment, proximal to the south connecting conduit (bottom at about 263 ft elevation), while the five remaining wells (TB–9, TB–10, TB–12, TB–14D, and TB–15) that showed an upward trend in water levels during this study are screened in the toe of the embankment. This indicates an increasing hydrostatic pressure within the toe, which could result in future seeps on the southern embankment near these wells.
The anomalously high water levels recorded in wells completed in the deep saturated zone and at the toe of the embankment near the south connecting conduit between June 5, 2013 and January 14, 2014 support the findings of the analysis of the 2010 shutdown of the conduit because of the proximity of the affected wells to the conduit, and the local nature of the anomaly (that is, the anomaly was not observed at all deep zone and toe wells). The period for the increase and the decrease back to pre-anomaly water level elevations indicate human influence as they occurred rapidly during a 13-hour period in each instance.
Long-term water levels in the study area trended downward during the 12-year study period, except for seven wells near the seep locations on the western and eastern parts of the southern embankment. Water levels in these seven wells, which are screened in the deep and toe systems, trended upward during the study period, indicating an increase in hydrostatic pressure near certain buried infrastructure on the southern embankment. Even though the seeps on the hillslope were filled in and regraded so there was no longer any observable discharge, without a reduction in hydrostatic pressure the resurgence of seeps may occur in the future near these two areas.
Summary
In 2001, the New York City Department of Environmental Protection (NYCDEP) installed 25 wells on the southern embankment of the Hillview Reservoir in Westchester County in an unsuccessful attempt to locate the source of a large seep (seep A) that began flowing continuously in 1999. In 2005, the U.S. Geological Survey began a cooperative study with the NYCDEP to characterize the hydrology of the local groundwater system and identify potential sources of seep A and other seeps on the embankment.
The earthen embankment is made up of low-permeability glacial clays that were excavated from the site and rest on a veneer of low-permeability glacial deposits that overlie crystalline bedrock. At least two groundwater-flow zones—one shallow and the other deep—overlie the bedrock at the reservoir. Wells completed in the shallow saturated zone have the highest water levels, are only slightly affected by diurnal changes in reservoir level, and seem to respond to substantial precipitation recharge. In contrast, wells completed in the deep saturated zone have lower water-level elevations, are highly affected by the diurnal changes in reservoir level, and respond only slightly to precipitation-induced recharge.
Hydraulic conductivity.—Hydraulic conductivity values determined by water-displacement aquifer (or “slug”) tests in wells at the reservoir ranged from 2 feet per day (ft/d) at well MR–100PA to 0.0012 ft/d at well TB–3D. The hydraulic conductivity of the shallow saturated zone ranged from 1 ft/d at well TB–4S to 0.0027 ft/d at well TB–17S, and the hydraulic conductivity in the deep saturated zone on the southern embankment ranged from 2 ft/d at well MR–100PA to 0.0012 ft/d at well TB–3D. Hydraulic conductivity at the toe of the earthen dam ranged from 0.27 to 0.021 ft/d at wells TB–15 and TB–9, respectively. A hydraulic conductivity of 0.016 ft/d was determined for well TB–13, which is partially screened in the crystalline-bedrock aquifer at an approximate elevation of 200 feet. Five of the six highest hydraulic conductivities in the deep saturated zone were on the west side of the southern embankment at wells MR–100PA, TB–5D, TB–2D, TB–18D, and TB–17D, and are within the terrace area and slope proximal to the south connecting conduit. The highest hydraulic conductivity values measured within the reservoir at wells TB–2D, TB–5D, TB–17D, TB–18D, and MR–100PA indicate that the deep saturated zone near the south connecting conduit may have a higher capacity to transmit water than the shallow saturated zone above.
Long-term hydrologic trends.—Although the 12-year average annual precipitation (52.36 inches) was 16 percent greater than the 148-year average, annual precipitation trended downwards during that 12-year study period. The Standardized Precipitation Index (SPI) generally indicates abnormally dry conditions from May 2012 to November 2016; and episodic moderate to severe drought conditions dominated during the last 4 years of the study period. Water levels in the East Basin trended downward from 2006 to 2016 as well. Of the seven wells in which water levels trended upward, two of the wells (TB–5D and TB–17D) are on the west side of the southern embankment, proximal to the south connecting conduit, whereas the five remaining wells (TB–9, TB–10, TB–12, TB–14D, and TB–15) in which water levels trended upward during this study are screened in the toe. The upward trend in these wells despite declining trends in precipitation and East Basin elevation, indicates an unexplained increase in hydrostatic pressure in the deep saturated zone and the toe of the earthen embankment. Leaking infrastructure within the embankment is the likely source for the rise in water levels and may explain the periodic nature of the seeps.
Sediment-discharge relation.—Water samples collected at seeps and the outflow from a manhole cover on the embankment were analyzed to determine the concentration, and size-distribution of suspended-sediment particles in the outflow. Suspended-sediment concentration ranged from 1 milligram per liter (mg/L) at a discharge of 2.6 gallons per minute (gal/min) to 16 mg/L at 12 gal/min; however, at 12 gal/min discharge, suspended-sediment concentration ranged from 3 to 16 mg/L. Samples were also collected during discharges of less than 5 gal/min, in which suspended-sediment concentration varied from 1 to 5 mg/L.
From two sampling points along seep E (the stone wall drainage openings), suspended-sediment concentration was 2 mg/L at a discharge of 3.4 gal/min at the first measuring point and 2 mg/L for a discharge of 1.1 gal/min at the second measuring point. The manhole outflow had a suspended-sediment concentration of 2 mg/L of silt-and clay-sized particles at a discharge of 2.4 gal/min.
Unidentified source of recharge to the deep saturated zone.—From June 5, 2013 to January 14, 2014, the hydrograph for well TB–5D indicated an anomalous water-level condition characterized by a rapid increase (0.19 foot per hour [ft/h]) in water levels during a 13-hour period. A rapid decrease (0.15 foot per hour) in water levels during a 13-hour period on January 13–14, 2014, indicated the end of this anomalous period. This signal in the hydrograph was also observed in nearby wells with a notable lag in timing. The proximity of the south connecting conduit to the affected wells indicates both a potential source and a hydraulic connection between the wells.
Hydrologic response to shutdown of south connecting conduit.—The shutdown and draining of the south connecting conduit between downtake chambers 1 and 2 occurred during a 2-week period, and the conduit remained shut down from June 23 to September 30, 2010. During the full drainage of the conduit between July 7 and 10, 2010, the response of the monitored seeps indicated a hydraulic connection between the conduit and the seeps. A travel time of about 10.5 hours from the source to seep B was estimated based on the timeline of the conduit shutdown provided by NYCDEP. Except for a response to three precipitation events that were each greater than 1 inch (totaling 3.8 inches), the seeps remained dry between the draining and refilling of the south connecting conduit.
A discharge measurement made during the precipitation-induced response of seep B was about 0.7 gal/min, indicating a minor contribution from precipitation to the total seepage discharge. The precipitation events took between 2 to 4 days to cause discharge at the seeps. During the refilling of the south connecting conduit in September 2010, discharge from seep B increased sharply over about 34 hours to more than 20 gal/min. After the refilling of the conduit, and then removal of the stop shutter (which is used to stop water flow in a conduit) near downtake chamber 2, discharge from seep B first increased to about 25 gal/min before the stop shutter was removed, to about 15 gal/min after the stop shutter was removed. Assuming equivalent flow through the south connecting conduit before and after the repair, the post-shutdown discharge was less than 12 gal/min, compared with a maximum of about 20 gal/min before the repairs, indicating that the repairs likely helped to reduce groundwater flow to the seeps. The response at seep C to the shutdown parallels that of seep B on a much smaller scale. Except for well TB–17S, water levels in the shallow saturated zone were declining before and during the south connecting conduit shutdown. Water levels in TB–17S had an unexplained increase of a little more than 1 foot during the early part of the shutdown and remained elevated for the duration of the shutdown. There were no definitive responses in water levels in the deep wells to the shutdown. Because water levels were declining in the toe wells before the shutdown, a clear response to the dewatering stage of the shutdown was not observed. Precipitation after the refilling stage of the shutdown seemed to induce a rise in water levels in the toe wells. Overall, there were no definitive responses to the shutdown in any of the wells near the south connecting conduit.
References Cited
Baskerville, C.A., 1982, Adoption of the name Hutchinson River Group and its subdivisions in Bronx and Westchester Counties, southeastern New York, in Stratigraphic notes, 1980–1982, chap. H of Contributions to stratigraphy: U.S. Geological Survey Bulletin 1529–H, p. H1–H10. [Also available at https://doi.org/10.3133/b1529H.]
Bouwer, H., and Rice, R.C., 1976, A slug test for determining hydraulic conductivity of unconfined aquifers with completely or partially penetrating wells: Water Resources Research, v. 12, no. 3, p. 423–428. [Also available at https://doi.org/10.1029/WR012i003p00423.]
Capurso, W.D., Chu, J.J., Chu, S.A., and Noll, M.L., 2019, Data and analytical type-curve match for selected hydraulic tests at an earthen dam site in southern Westchester County, New York: U.S. Geological Survey data release, accessed June 21, 2021, at https://doi.org/10.5066/P9J404KW.
Chu, A., and Noll, M.L., 2017, Water-quality data from an earthen dam site in southern Westchester County, New York, 2015: U.S. Geological Survey Data Series 1057, 83 p. [Also available at https://doi.org/10.3133/ds1057.]
Chu, A., Stumm, F., Joesten, P.K., and Noll, M.L., 2013, Geophysical and hydrologic analysis of an earthen dam site in southern Westchester County, New York: U.S. Geological Survey Scientific Investigations Report 2012–5247, 64 p. [Also available at https://doi.org/10.3133/sir20125247.]
Cleveland, R., Cleveland, W., McRae, J., and Terpenning, E., 1990, STL—A seasonal-trend decomposition procedure based on loess: Journal of Official Statistics, v. 6, no. 1, p. 3–73, accessed January 20, 2021, at https://www.wessa.net/download/stl.pdf.
Colby, B.R., 1964, Discharge of sands and mean-velocity relationships in sand-bed streams: U.S. Geological Survey Professional Paper 462–A, 47 p. [Also available at https://doi.org/10.3133/pp462A.]
Cunningham, W.L., and Schalk, C.W., 2011, Groundwater technical procedures of the U.S. Geological Survey: U.S. Geological Survey Techniques and Methods, book 1, chap. A1, 154 p. [Also available at https://doi.org/10.3133/tm1A1.]
Edwards, T.E., and Glysson, G.D., 1999, Field methods for measurement of fluvial sediment: U.S. Geological Survey Techniques of Water-Resources Investigations Report, book 3, chap. C2, 89 p. [Also available at https://doi.org/10.3133/twri03C2.]
Green, S.B., 1991, How many subjects does it take to do a regression analysis: Multivariate Behavioral Research, v. 26, no. 3, p. 499–510, accessed June 23, 2021, at https://doi.org/10.1207/s15327906mbr2603_7.
Guy, H.P., 1969, Laboratory theory and methods for sediment analysis: U.S. Geological Survey Techniques of Water-Resources Investigations, book 5, chap. C1, [variously paged]. [Also available at https://pubs.usgs.gov/twri/twri5c1/.]
Guy, H.P., and Norman, V.W., 1970, Field methods for fluvial sediment measurements: U.S. Geological Survey Techniques Water-Resources Investigations, book 3, chap. C2, 59 p. [Also available at https://doi.org/10.3133/twri03C2_1970.]
Harrell, F.E., Jr., 2001, Regression modeling strategies-with applications to linear models, logistic regression, and survival analysis: New York, Springer, 568 p. [Also available at https://doi.org/10.1007/978-1-4757-3462-1.]
Helsel, D.R., Hirsch, R.M., Ryberg, K.R., Archfield, S.A., and Gilroy, E.J., 2020, Statistical methods in water resources: U.S. Geological Survey Techniques and Methods, book 4, chap. A3, 458 p. [Also available at https://doi.org/10.3133/tm4a3.] [Supersedes USGS Techniques of Water-Resources Investigations, book 4, chap. A3, version 1.1.]
Kalman, R., 1960, A new approach to linear filtering and prediction problems: Journal of Basic Engineering, v. 82, no. 1, p. 35–45, accessed June 11, 2021, at https://doi.org/10.1115/1.3662552.
National Oceanic and Atmospheric Administration [NOAA], 2021, National integrated drought information system: National Oceanic and Atmospheric Administration web page, accessed February 3, 2021, at https://www.drought.gov/.
New York City Department of Environmental Protection [NYCDEP], 2017, Drinking water: New York City Department of Environmental Protection web page, accessed June 30, 2017, at https://www1.nyc.gov/html/dep/html/drinking_water/index.shtml.
Noll, M.L., and Chu, A., 2017, Detecting temporal change in land-surface altitude using robotic land-surveying techniques and geographic information system applications at an earthen dam site in southern Westchester County, New York: U.S. Geological Survey Open-File Report 2017–1028, 15 p. [Also available at https://doi.org/10.3133/ofr20171028.]
Noll, M.L., and Chu, A., 2018, Groundwater-level data from an earthen dam site in southern Westchester County, New York: U.S. Geological Survey Data Series 1075, 35 p. [Also available at https://doi.org/10.3133/ds1075.]
Noll, M.L., Chu, A., and Capurso, W.D., 2019, Slug-test analysis of selected wells at an earthen dam site in southern Westchester County, New York: U.S. Geological Survey Open-File Report 2019–1102, 14 p. [Also available at https://doi.org/10.3133/ofr20191102.]
Porterfield, G., 1972, Computation of fluvial sediment discharge: U.S. Geological Survey Techniques of Water-Resources Investigations, book 3, chap. C3, 66 p. [Also available at https://pubs.usgs.gov/twri/twri3-c3/.]
R Core Team, 2021, R—A language and environment for statistical computing: Vienna, Austria, R Foundation for Statistical Computing, accessed February 2021 at https://www.R-project.org.
Shreve, E.A., and Downs, A.C., 2005, Quality-assurance plan for the analysis of fluvial sediment by the U.S. Geological Survey Kentucky Water Science Center Sediment Laboratory: U.S. Geological Survey Open-File Report 2005–1230, 28 p. [Also available at https://doi.org/10.3133/ofr20051230.]
Turnipseed, D.P., and Sauer, V.B., 2010, Discharge measurements at gaging stations: U.S. Geological Survey Techniques and Methods, book 3, chap. A8, 87 p. [Also available at https://doi.org/10.3133/tm3A8.]
U.S. Geological Survey [USGS], 2016, USGS water data for the Nation: U.S. Geological Survey National Water Information System database, accessed July 6, 2023, at https://doi.org/10.5066/F7P55KJN.
Wang, F., Shao, W., Yu, H., Kan, G., He, X., Zhang, D., Ren, M., and Wang, G., 2020, Re-evaluation of the power of the Mann-Kendall test for detecting monotonic trends in hydrometeorological time series: Frontiers in Earth Science (Lausanne), v. 8, p. 14, accessed June 21, 2021, at https://doi.org/10.3389/feart.2020.00014.
Conversion Factors
U.S. customary units to International System of Units
Datum
Vertical coordinate information is referenced to the National Geodetic Vertical Datum of 1929 (NGVD 29).
Horizontal coordinate information is referenced to the North American Datum of 1983 (NAD 83).
Elevation, as used in this report, refers to distance above the vertical datum.
Supplemental Information
A slug test is a water-displacement aquifer test used to estimate the capacity of the aquifer materials surrounding the screen zone of a well to transmit water.
For more information about this publication, contact:
dc_ny@usgs.gov, USGS New York Water Science Center
425 Jordan Road
Troy, NY 12180–8349
For additional information, visit:
https://www.usgs.gov/centers/ny-water
Publishing support provided by the
Pembroke and Rolla Publishing Service Centers
Disclaimers
Any use of trade, firm, or product names is for descriptive purposes only and does not imply endorsement by the U.S. Government.
Although this information product, for the most part, is in the public domain, it also may contain copyrighted materials as noted in the text. Permission to reproduce copyrighted items must be secured from the copyright owner.
Suggested Citation
Chu, A., Noll, M.L., Capurso, W.D., and Welk, R.J., 2023, Hydrologic analysis of an earthen embankment dam in southern Westchester County, New York: U.S. Geological Survey Scientific Investigations Report 2023–5123, 41 p., https://doi.org/10.3133/sir20235123.
ISSN: 2328-0328 (online)
Study Area
| Publication type | Report |
|---|---|
| Publication Subtype | USGS Numbered Series |
| Title | Hydrologic analysis of an earthen embankment dam in southern Westchester County, New York |
| Series title | Scientific Investigations Report |
| Series number | 2023-5123 |
| DOI | 10.3133/sir20235123 |
| Publication Date | February 07, 2024 |
| Year Published | 2024 |
| Language | English |
| Publisher | U.S. Geological Survey |
| Publisher location | Reston, VA |
| Contributing office(s) | New York Water Science Center |
| Description | Report: vii, 41 p.; Data Release; Dataset |
| Country | United States |
| State | New York |
| County | Westchester County |
| Other Geospatial | Hillview Reservoir |
| Online Only (Y/N) | Y |
| Additional Online Files (Y/N) | N |