

Spatial Distribution of API Gravity and Gas/Oil Ratios for Petroleum Accumulations in Upper Cretaceous Strata of the San Miguel, Olmos, and Escondido Formations of the South Texas Maverick Basin—Implications for Petroleum Migration and Charge History
Links
- Document: Report (2.88 MB pdf) , HTML , XML
- NGMDB Index Page: National Geologic Map Database Index Page (html)
- Download citation as: RIS | Dublin Core
Abstract
The Maverick Basin of south Texas is currently undergoing active exploration and production of gas and oil from tight sandstone reservoirs. The most productive tight sandstones in the basin are in the Upper Cretaceous San Miguel, Olmos, and Escondido Formations. These units are second only to the Eagle Ford Shale in terms of cumulative production volumes. The structural history of the Maverick Basin, from rifting to subsidence to exhumation, has had a profound effect on the characteristics of these reservoirs and the petroleum resources contained therein. This U.S. Geological Survey review of the production history of these strata reflects a recent shift from conventional production to horizontal drilling (unconventional) that exploits low permeability reservoirs in previously overlooked areas of existing oil and gas fields in southern Texas, typically outside of established field boundaries.
To investigate the physical properties of the Maverick Basin hydrocarbon accumulations, this case study compiled American Petroleum Institute (API) gravity measurements and calculated cumulative gas/oil ratios (GOR) for thousands of producing wells from the San Miguel, Olmos, and Escondido Formations. Maps were generated from the compiled well production data to show the spatial heterogeneity of API gravity and GOR values for the three formations within the Maverick Basin and immediately outside the basin to the northeast. Within the Maverick Basin, the spatial patterns of API gravity values indicate lighter oils downdip towards the southern basin edge. GOR values indicative of wet and dry gases within the basin are seen interspersed, with values that correspond to black and heavy oils. Differences in the spatial patterns of the petroleum properties within the Maverick Basin are interpreted as effects of Eocene basin inversion caused by Laramide orogenic deformation, and the resulting reservoir exhumation of basin strata. East of the Maverick Basin, spatial distributions of API gravity and GOR values show progressively heavier oils updip to the northwest, grading to dry gases downdip to the southeast, which correlates to the oil and gas windows of the underlying Eagle Ford Shale.
Correlation of API gravity and GOR values from the San Miguel, Olmos, and Escondido Formations with thermal maturity data from the Eagle Ford Shale suggests that the Eagle Ford Shale is the petroleum source, and that petroleum migration was approximately vertical for areas to the east of the Maverick Basin. The discontinuity of API gravity and GOR properties within the Maverick Basin implies a complex petroleum charge history, possibly involving the remigration of petroleum and the addition of petroleum from other source intervals in Mexico, to the southwest. Depressurization of exhumed, overpressured reservoirs of the San Miguel, Olmos, and Escondido Formations can explain the intermittent occurrence of gas production throughout the southern Maverick Basin by exsolution of gas from formation brines and the resulting dry gas flushing of hydrocarbon-charged reservoirs. The introduction of dry gas through flushing can, in turn, explain why the patterns of API gravity and GOR values are so dissimilar in the Maverick Basin. This process has implications for possible future production of unconventional resources from undiscovered tight-gas reservoirs in strata of the San Miguel, Olmos, and Escondido Formations, and a different approach to petroleum exploration may be needed in the Maverick Basin relative to exploration techniques applied in other basins within the northern Gulf of Mexico.
Introduction
Current petroleum production in onshore areas of the conterminous United States is predominantly from unconventional reservoirs that are developed through hydraulic fracturing of horizontally drilled wells. Although much of this production is focused on self-sourced shale or carbonate reservoirs, tight sandstone reservoirs represent another important target for petroleum production. The U.S. Energy Information Administration (2021) indicates several main tight natural gas sandstone reservoir units are located within the Texas Gulf Coast region. Upper Cretaceous strata of the south Texas Rio Grande embayment, especially the Campanian San Miguel and Maastrichtian Olmos and Escondido Formations, are sites of natural gas production from low permeability reservoirs and represent compelling targets for future study and exploration for unconventional tight formation hydrocarbon resources.
In this case study, the authors consider the evolution of the Maverick Basin petroleum system with the objective of gaining insight into tight natural gas systems. Much of the groundwork for this study regarding south Texas regional geology was founded by Ewing (1987, 2003) and Goldhammer and Johnson (2001). Additionally, detailed reservoir characterizations of the San Miguel Formation by Weise (1980) and the Olmos Formation by Tyler and Ambrose (1986), along with resource assessments and reviews of sandstones of the Taylor and Navarro Groups in the Maverick Basin by Condon and Dyman (2006) and Ewing (2009), were helpful for this study. Following a review of the structural evolution, subsidence, regional geology, and historical petroleum production of the south Texas Rio Grande embayment, including the Maverick Basin, the authors discuss basin response to Laramide tectonism in the Eocene and subsequent erosion of the Maverick Basin on the physical properties of the petroleum.
Maps showing the spatial patterns of American Petroleum Institute (API) gravity and gas/oil ratio (GOR) values for the San Miguel, Olmos, and Escondido Formations display the effect that Laramide folding and exhumation of Upper Cretaceous reservoirs had on petroleum properties. GOR spatial patterns of the San Miguel, Olmos, and Escondido Formations in the Maverick Basin are more heterogeneous when compared to values outside of the basin as a result of uplift and erosion of the basin in the Eocene. This Eocene basin inversion altered existing reservoir geometries and led to the remigration of initial hydrocarbon accumulations, which has implications for petroleum sourcing, petroleum migration and remigration, gas exsolution and gas flushing, exploration strategies, and future potential for unconventional tight-gas reservoirs in the Maverick Basin.
Geologic Setting
Structural History, Subsidence, and Inversion
The Mesozoic structural history of the Maverick Basin is complex, involving continental to regional scale tectonic influences. Prior to the breakup and opening of the Gulf of Mexico in the Middle Jurassic (Fitz-Díaz and others, 2018), Late Triassic to Early Jurassic rifting created extensional grabens that later facilitated the formation of the Maverick Basin (Alexander, 2014). By the Early Cretaceous, the Maverick Basin had become a major depocenter in the western Gulf of Mexico (Rose, 1986, 2016; Condon and Dyman, 2006; Sasser, 2016). The following is a synthesis of the structural evolution of the western Gulf of Mexico Basin as it relates to the south Texas Rio Grande embayment, especially in the area of the Maverick Basin (fig. 1).
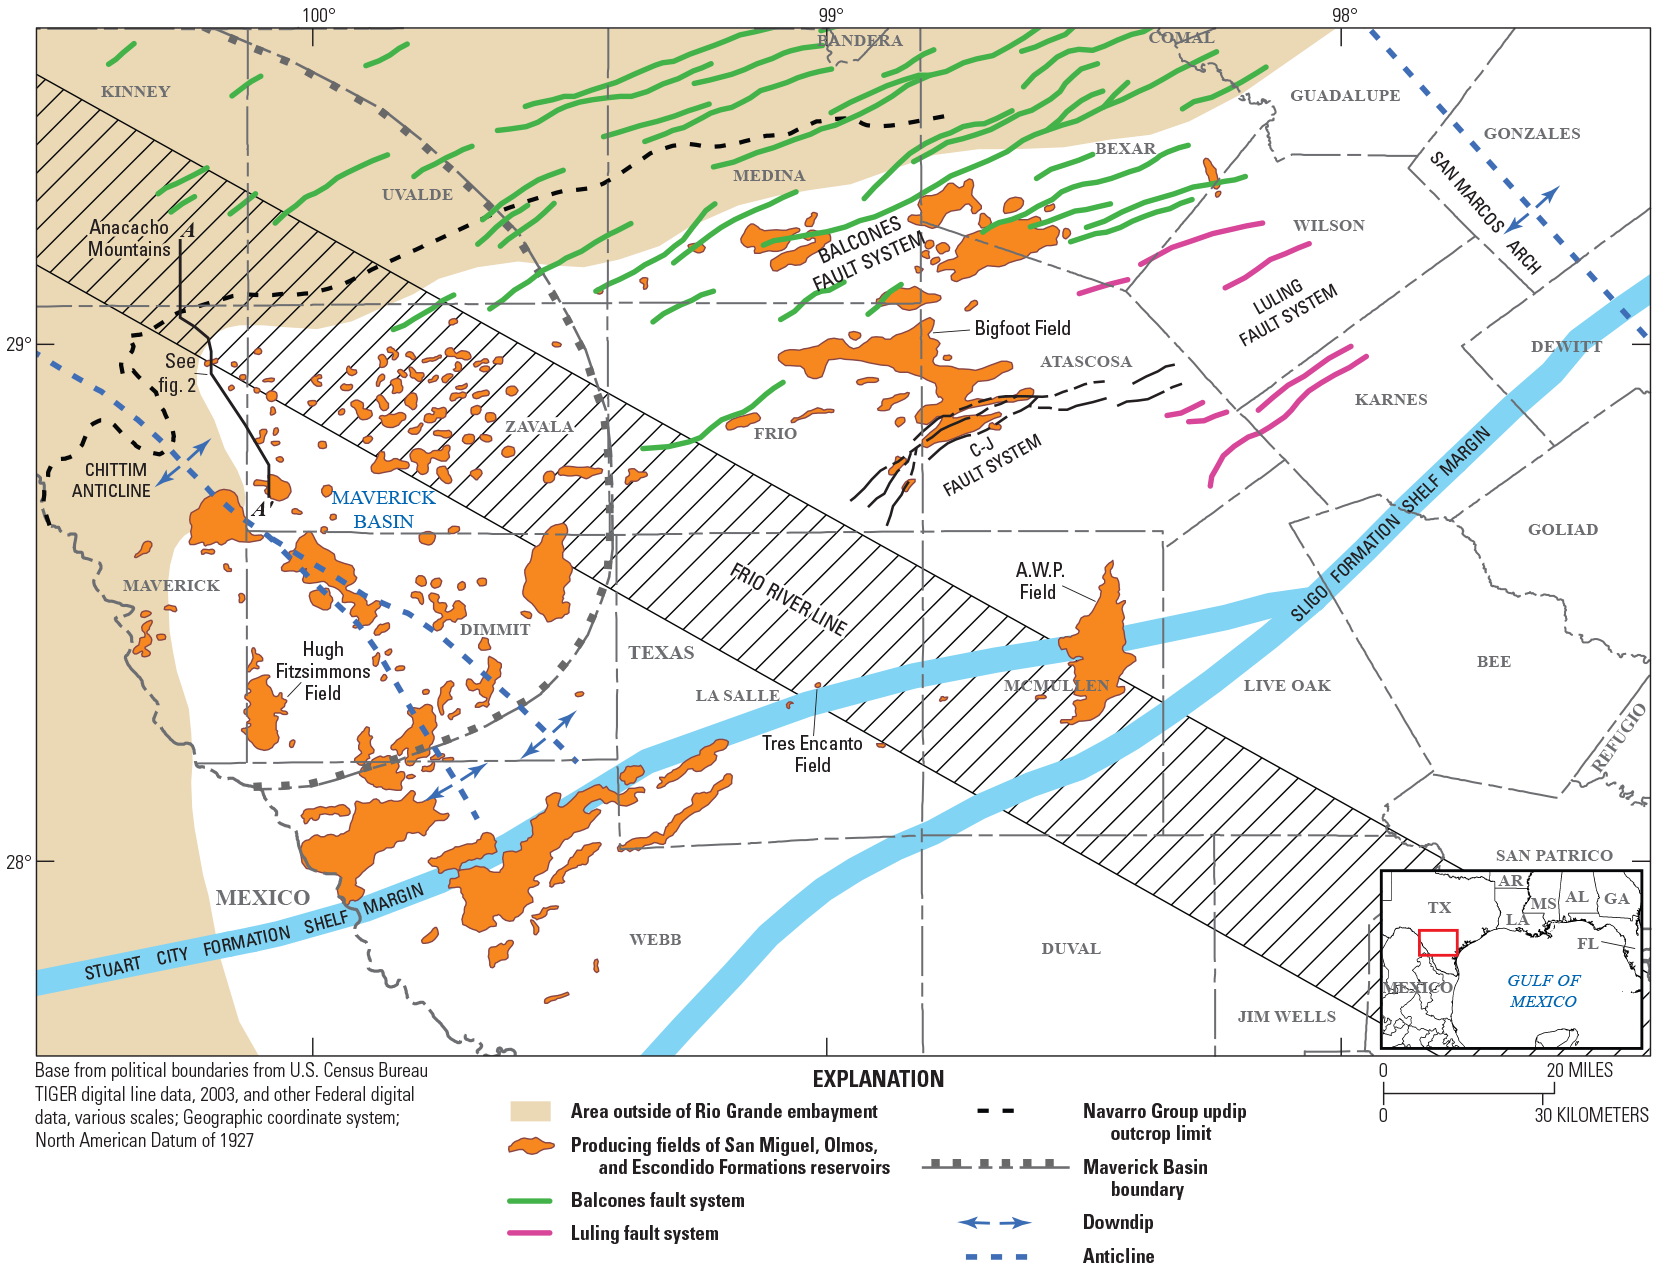
Regional map of southern Texas and part of Mexico showing locations of main geologic elements. Geologic elements include: the Rio Grande embayment as defined by the updip limit of basal Paleogene strata; Maverick Basin; updip outcrop limit of the Navarro Group strata; producing fields of San Miguel, Olmos, and Escondido Formations reservoirs; Chittim Anticline, San Marcos arch; Frio River Line; Lower Cretaceous (Stuart City Formation; Sligo Formation) shelf-margin strata; and major fault systems, including the Balcones (green), Luling (magenta), and Charlotte-Jourdanton (C-J) (black) fault systems; modified from Weise (1980), Ewing (1987), Condon and Dyman (2006), Galloway (2008), Alaniz and others (2016), and Geomap (2016). Location of cross section A–A’ for figure 2 is indicated.
In the Middle Triassic, prior to the opening of the Gulf of Mexico Basin, crustal elements around south Texas and northeastern Mexico are thought to have consisted of Gondwanan crust of unknown age, or a series of crustal blocks that accreted at about 300 million years ago (mega-annum, Ma) as a result of the Marathon-Ouachita orogen to the north and northwest (Ewing, 2003). After the cessation of the Marathon-Ouachita orogeny, back-arc rifting in central Mexico began at the start of the Late Triassic (about 236 Ma) because of continued shallow subduction of the paleo-Pacific plate along the western margin of Mexico (Goldhammer and Johnson, 2001; Fitz-Díaz and others, 2018; Lawton and others, 2018; Martini and Ortega-Gutiérrez, 2018; Snedden and Galloway, 2019). By the end of the Late Triassic (200 Ma), initial rifting had begun, which led to the opening of the Gulf of Mexico Basin and the breakup of Pangea (Pindell, 1985; Winterer, 1991; Adatte and others, 1996). Rifting of the Gulf of Mexico was initiated when the Maya block (present-day Yucatán peninsula), which had been joined to the North American plate, began to rotate counterclockwise and move southeast away from the area of the Gulf of Mexico (Goldhammer and Johnson, 2001). At this time, left-lateral shear zones in northeastern Mexico created en-echelon rift basins that trend northwest-southeast through northeastern Mexico and south Texas (Ewing, 1987, 2003; Salvador, 1991). The Maverick Basin in south Texas lies directly above one of these rift basins, the Chittim Rift, which is a Triassic extensional half-graben located near the western end of the Tethys that was filled during the Late Triassic to Middle Jurassic with redbeds (Ewing, 2003). The existence of a pre-Jurassic half-graben rift basin is inferred from deep well penetrations that reportedly encountered Lower Jurassic strata (Scott, 2004; Alexander, 2014) as well as from seismic interpretations showing a highly reflective, syn-extensional stratal package at the base of the basin, but below the acoustic basement (Scott, 2004; Alexander, 2014; Sasser, 2016).
Rifting of the Gulf of Mexico, along with Late Triassic to Early Jurassic rollback of a subducting paleo-Pacific plate in western Mexico, led to crustal extension in Mexico and south Texas throughout the Jurassic (Goldhammer and Johnson, 2001; Pindell and Kennan, 2009; Fitz-Díaz and others, 2018). In the Middle Jurassic, widespread deposition of the Louann Salt began in the shallow Tethys Sea shortly after the start of seafloor spreading in the Gulf of Mexico (Snedden and Galloway, 2019; Pindell and others, 2021). The Maverick Basin contains Jurassic salt beds and some allochthonous salt features near the southern margin, but these had little effect on the overall structural evolution of the basin because most of the Maverick Basin is located updip of the Louann Salt (Ewing, 1991).
Seafloor spreading within the Gulf of Mexico ended at the start of the Early Cretaceous, at about 138 Ma (Snedden and Galloway, 2019). Subsequent transgression and subsidence led to a Maverick Basin paleo-depocenter in the Albian (about 113 Ma) on a restricted shelf behind the reef complex of the Stuart City Formation (Rose, 1972; Ewing, 1991). The Rio Grande embayment that encompasses much of south Texas, including the Maverick Basin, experienced continuous sedimentation throughout the Cretaceous (Ewing, 1991), with Cretaceous deposition occurring unconformably on top of Triassic to Jurassic redbeds of the Chittim Rift (Evans and Zoerb, 1984; Ewing, 2010; Sasser, 2016). Regional subsurface correlations show that the entire stratal package from the Albian through the latest Cretaceous thickens towards the center of the Maverick Basin, indicating that pre-Cenozoic subsidence was continuous (Ewing, 1991; Scott, 2004; Rose, 2016). Upper Cretaceous strata are observed thickening towards the basin center, including the San Miguel, Olmos, and Escondido Formations, and the Upper Cretaceous source rocks of the Eagle Ford Shale (fig. 2; Condon and Dyman, 2006; Ewing, 2009).
The Frio River Line is a northwest-to-southeast–trending zone between structural provinces, where east of the Frio River Line, normal faults are the dominant hydrocarbon trapping mechanism, and to the west of the Frio River Line in the Maverick Basin, stratigraphic pinchouts are the majority of hydrocarbon traps (Ewing, 1987). The Frio River Line is an important structural feature within the basin that may have persisted since the Paleozoic, acting as a hinge line between the Lower Cretaceous Maverick Basin depocenter and the relatively slowly subsiding San Marcos arch to the northeast (fig. 1; Ewing, 2003, 2009; Rose, 2016). The Maverick Basin appears to be related to a network of basins that extends southward into northeastern Mexico that each experienced persistent, differential subsidence throughout the Cretaceous (Fitz-Díaz and others, 2018).
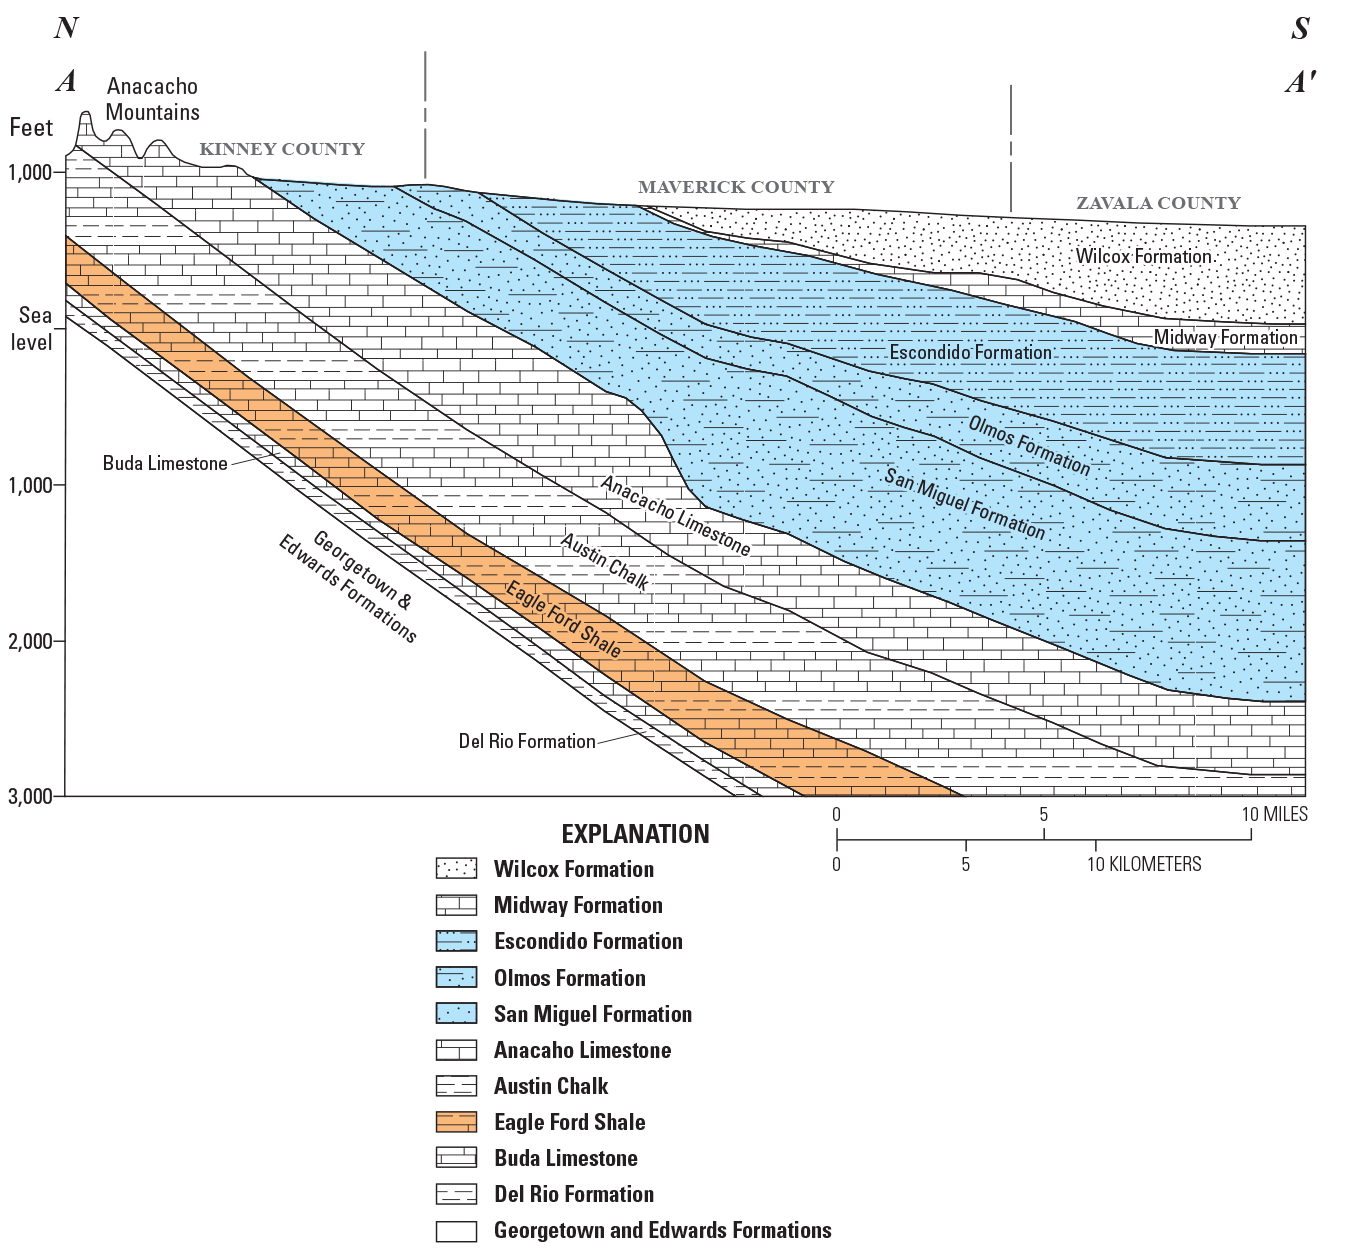
North to south regional cross section of outcrop and subsurface strata in Kinney County, Texas, to western Zavala County, Texas, closer to the Maverick Basin depocenter. Cross section is modified from Condon and Dyman (2006) and Ewing (2009). Location of cross section is shown on figure 1.
The Late Cretaceous (about 70 to 60 Ma) marked the beginning of Laramide compression in western and central Mexico due to a change to shallower subduction of the Farallon plate under western Mexico (Fitz-Díaz and others, 2018). The propagation of compression northeastward across Mexico to the western Gulf of Mexico is seen in the difference in timing of inversion of the Mexican foreland in the Late Cretaceous, and in later inversion of the basins in northeast Mexico and south Texas in the early to middle Paleogene (Scott, 2004). This propagation of compressional forces led to the eastward migration of magmatic intrusions with syntectonic intrusions of the Mexican foreland having more mafic chemistries, and post-tectonic intrusions near the western margin of the Gulf of Mexico Basin having more granitic chemistries (Fitz-Díaz and others, 2018).
The inversion of the Maverick Basin represents the youngest and easternmost extent of Laramide orogenic deformation in the western Gulf of Mexico with gentle Laramide folding in the Eocene terminating at the Frio River Line (Ewing, 1987, 1991; Scott, 2004). The entire stratigraphic section within the Maverick Basin of late Eocene age (about 40 Ma) and older is deformed by the southwest-plunging Chittim Anticline, making the basin unique within the U.S. portion of the Gulf Coast, where large-scale deformation is otherwise absent (fig. 1; Scott, 2004; Stoeser and others, 2005). Thermal maturity data from the Upper Cretaceous Eagle Ford Shale and Paleocene–Eocene Indio Formation suggest that there is an erosional unconformity or change in the regional heat flow present between the two units (Hackley and others, 2012), which could constrain the initiation of Laramide deformation. Seismic lines across the Chittim anticline show a steeply dipping northeastern flank, which suggests that it represents an inversion of an older, Jurassic extensional structure where the ancestral high-angle normal fault of the Chittim Rift was reactivated as a reverse fault (Alexander, 2014; Sasser, 2016; Fitz-Díaz and others, 2018). Laramide compression and uplift in the Eocene resulted in erosion on the order of 3 to 4 miles (Ewing, 2003) in the La Popa Basin of Mexico, southwest of the Maverick Basin, and as much as 1.5 to 2 miles of erosion is believed to have occurred in the central Maverick Basin. From the early Miocene, the Frio River Line separated the inverted Maverick Basin from the Balcones and Luling fault zones of the peripheral graben system to the north and east that possibly formed from the reactivation of Ouachita thrusts in the late Oligocene to early Miocene or from uplift caused by sediment loading (Ewing, 1986, 1991, 2005; Rose, 2016).
Regional Stratigraphy
The stratigraphy of the Maverick Basin is reasonably well known from numerous well data within the basin, along with detailed outcrop studies (fig. 3; Lozo and Smith, 1964; Bebout and Loucks, 1974; Kauffmann, 1977; Rose, 1986, 2016; Condon and Dyman, 2006). During the late Kimmeridgian (Late Jurassic) through late Berriasian (Early Cretaceous), sediment deposition in the western Gulf of Mexico was controlled by an extensive transgression that resulted in the deposition of fine-grained sediments of the Haynesville Formation on flooded carbonate ramps, followed by highstand deposition of terrigenous coarse-grained clastics of the Cotton Valley Group (Salvador, 1987; Goldhammer and others, 1991; Goldhammer and Johnson, 2001). Parts of the Texas gulf coast, particularly the East Texas Basin, received a smaller influx of terrigenous sediments during the Kimmeridgian, leading to the deposition of oolitic and pelletal grainstones and packstones of the Gilmer Limestone (Salvador, 1991). In the area of the Maverick Basin in southern Texas, subaerially exposed strata to the north provided a source for the nonmarine and marginal-marine sands and siltstones of the Cotton Valley Group that were deposited in the southern half of the basin (fig. 3; Goldhammer and Johnson, 2001). Southeast of the Maverick Basin, the sandy, marginal-marine clastics of the Cotton Valley Group grade into the fine-grained marine clastics of the Bossier Shale (Goldhammer and Johnson, 2001).
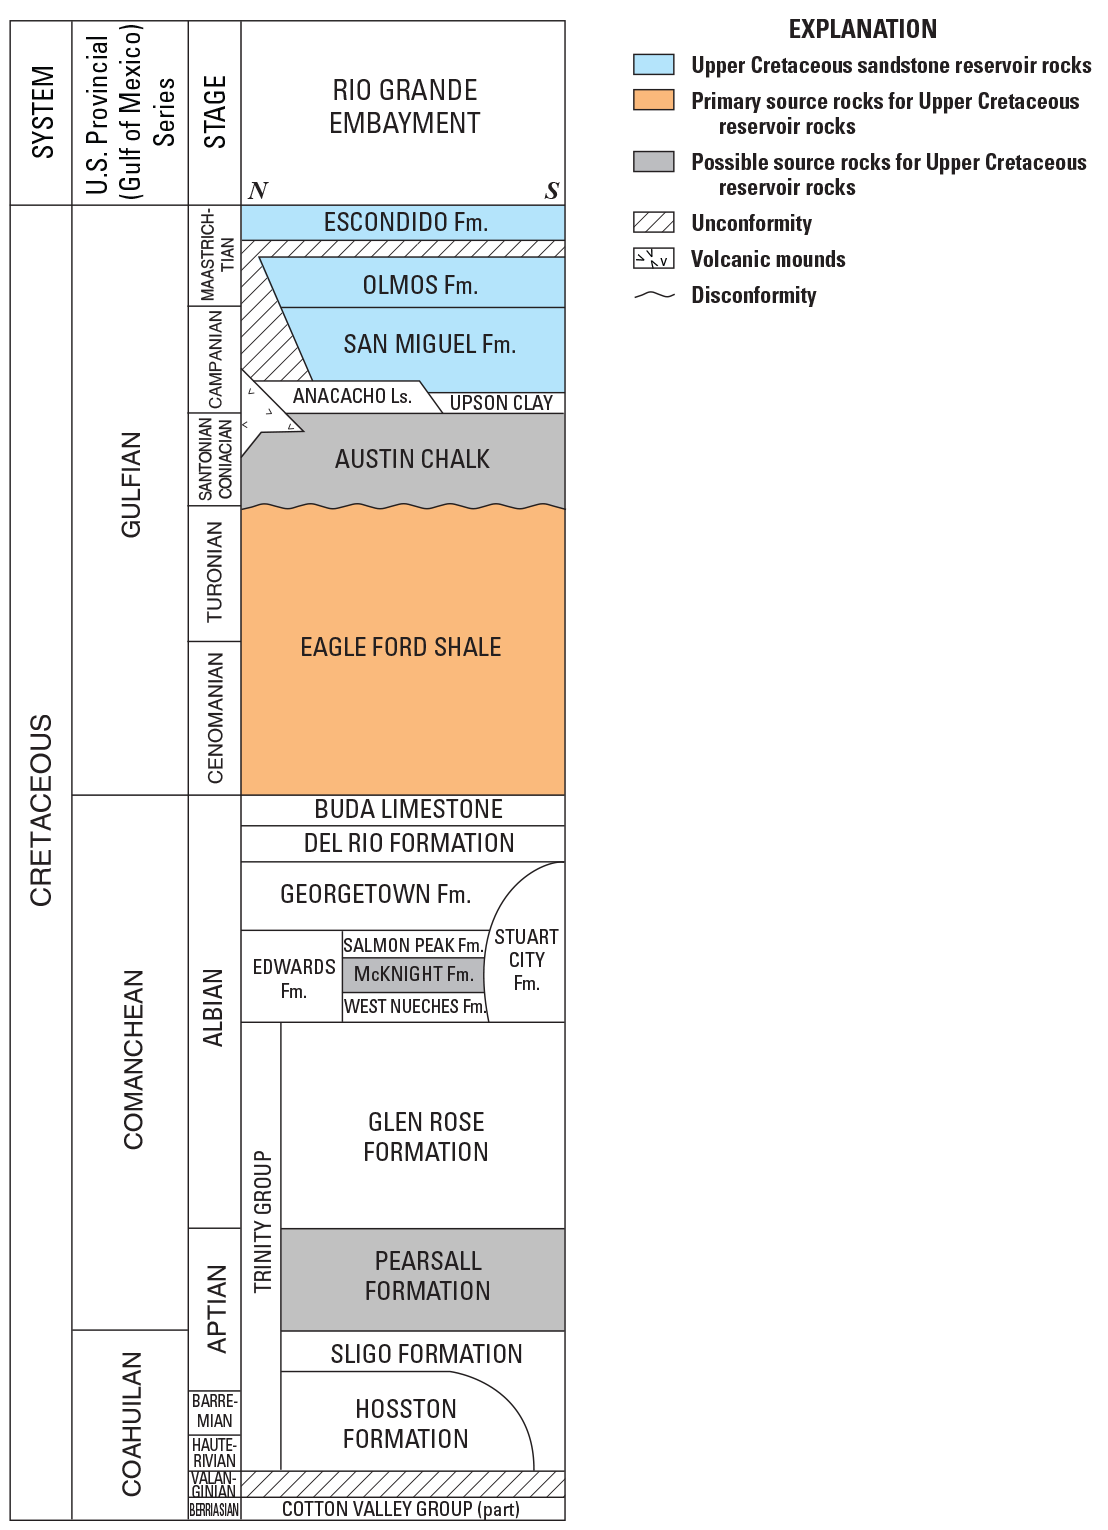
Generalized stratigraphic chart for Cretaceous units of the Rio Grande embayment of southern Texas. Stratigraphic chart is modified from Condon and Dyman (2006); Fm, Formation.
The Valanginian (Early Cretaceous, about 140 to 133 Ma) was marked by subaerial erosion of shelfal Cotton Valley Group strata, followed by deposition of coarse-grained, marginal-marine to shallow-marine sediments of the Hosston Formation in the Hauterivian (Todd and Mitchum, 1977; Salvador, 1987; Goldhammer and others, 1991; Goldhammer and Johnson, 2001). Thick sequences of fluvial-deltaic, shoreface, and shallow-marine clastics of the Hosston Formation were deposited throughout the southern Maverick Basin (fig. 3). These sequences change facies into marine shales and siltstones in the southernmost portion of the Maverick Basin in Dimmit and southern Maverick Counties (Goldhammer and others, 1991; Goldhammer and Johnson, 2001).
Beginning in the Barremian and continuing through the middle Aptian, a Gulf of Mexico-wide marine inundation led to the deposition of carbonates of the Sligo Formation onto a reef-rimmed, low-angle shelf margin (Goldhammer and Johnson, 2001). Updip, nonmarine to shallow-marine clastics of the Hosston Formation interfinger with carbonates of the Sligo Formation (Goldhammer and Johnson, 2001). Within the Maverick Basin, clastics of the Hosston Formation on the flanks of subaerially exposed land in the northeast grade basinward into shallow-marine facies of the Sligo Formation, including restricted peritidal carbonate facies, muddy lagoonal carbonates, and open-marine limestones at the southeastern edge of the basin (fig. 3; Bebout, 1977; Winker and Buffler, 1988; Goldhammer and Johnson, 2001). Marine transgression in the late Aptian resulted in flooding of the carbonate shelf of the Sligo Formation and deposition of deep marine shales and fine-grained clastics of the Pearsall Formation, sourced from the north and west (fig. 3; Loucks, 1977; McFarlan and Menes, 1991). In the late Aptian, the dominant facies in the Maverick Basin are deep-marine calcareous shales and siltstones that interfinger with shallow-marine clastics along the updip edge of the basin, and outer-ramp lime mudstone and shale along the downdip edge (Goldhammer and Johnson, 2001).
An extensive carbonate system covered the eastern Gulf of Mexico Basin during the Albian. This shallow, open-marine carbonate shelf overstepped most of the exposed land updip in south-central Texas (McFarlan, 1977; Goldhammer and Johnson, 2001). Updip, in north-central Texas, clastic facies of the Washita Group interfinger basinward with open-marine carbonate facies of the Glen Rose, Edwards, and Georgetown Formations (Goldhammer and Johnson, 2001). In southern Texas, the reef complex of the Stuart City Formation that rimmed the shelf margin separated the updip carbonate shelf complex of the Glen Rose, Edwards, and Georgetown Formations from the downdip pelagic mudstones and wackestones of the Atascosa Group (fig. 3; Wilson, 1975; Ross, 1981, Goldhammer and Johnson, 2001). The Devils River Formation is composed of carbonate ramp and ramp margin deposits in the form of skeletal grainstones and rudist bioherms that rimmed the northern and eastern flanks of the Maverick Basin in the middle Albian (Bebout and Loucks, 1974; Zahm and others, 1995). The Devils River Formation, along with the reefs of the Stuart City Formation that flanked the basin to the south, created a restricted marine environment in the basin interior in which the marine sabkha and supratidal carbonates of the McKnight Formation, an equivalent of the Ferry Lake Anhydrite east of the San Marcos arch, were deposited (Goldhammer and Johnson, 2001; Snedden and Galloway, 2019). Throughout the middle Albian, the Maverick Basin transitioned from a shallow, restricted platform to a pelagic, open-shelf environment, resulting in the deposition of cyclic platform-derived grains and laminated shales of the Salmon Peak Formation, which is time-equivalent to the late Lower Cretaceous Edwards Formation (Zahm and others, 1995; Rose, 2016). By the early Late Cretaceous, continued transgression led to the deposition of deep-marine calcareous mudstones and shales of the Del Rio Formation over platform carbonates of the Georgetown Formation, followed by deposition of the extensive, pelagic Buda Limestone (fig. 3; Rose, 2016; Goldhammer and Johnson, 2001).
The Cenomanian–Turonian Eagle Ford Shale conformably overlies the Buda Limestone in the Gulf of Mexico Basin in southern Texas and was deposited during a transgressive flooding event that ultimately connected the Western Interior Seaway with the Gulf of Mexico (fig. 3; McFarlan and Menes, 1991; Goldhammer and Johnson, 2001). Deposition of the Eagle Ford Shale was followed in the Late Cretaceous by the deposition of the Austin Chalk, a thick, laterally extensive sequence of open-marine micrite (fig. 3; Tyler and Ambrose, 1986). Within the Maverick Basin, the Eagle Ford Shale reaches a thickness of over 500 feet, while the Austin Chalk can reach thicknesses exceeding 1,000 feet (Rose, 2016). In early Cenomanian time, pinnacle carbonate buildups of the Buda Limestone downdip and adjacent to the southern rim of the Maverick Basin temporarily outpaced transgression and deposition of fine-grained clastics of the Eagle Ford Shale before being inundated (Goldhammer and Johnson, 2001).
During the Campanian to Maastrichtian, sandstones of the San Miguel Formation and the Navarro Group, which comprises both the Olmos and Escondido Formations, were deposited as rapid progradational fluvial-deltaic sequences during a series of marine transgressive–regressive cycles and were sourced from exposed highlands to the north and northwest (Tyler and Ambrose, 1986; Condon and Dyman, 2006; Galloway, 2008; Ewing, 2009). During this time, the Maverick Basin was a major depocenter for clastic sediments in contrast to the rest of the Western Gulf Province (Condon and Dyman, 2006). Campanian strata in the Maverick Basin are composed of shallow-marine carbonates of the Anacacho Limestone updip and terrigenous shelf mudstones of the Upson Clay downdip in the basin (Tyler and Ambrose, 1986), overlain by wave-dominated deltaic sands and shales of the San Miguel Formation (fig. 3; Lewis, 1977; Weise, 1980). Maastrichtian strata in the Maverick Basin consist of deltaic, strand-plain, coastal plain, fluvial and coal deposits of the Olmos Formation, and wave-dominated deltaic sequences and shales of the Escondido Formation (fig. 3; Tyler and Ambrose, 1986). Escondido Formation strata are separated from Olmos Formation strata in southern Texas by a regional unconformity (Tyler and Ambrose, 1986), which is informally referred to as the Bigfoot Unconformity by Ewing (2009). Strata of the Anacacho Limestone, along with the San Miguel, Olmos, and Escondido Formations, outcrop in northwestern Maverick County through southern Uvalde County in Texas, and dip southeast in the subsurface through the southern half of the Maverick Basin, beyond which their maximum thickness reaches 3,500 feet in the area between the reef complex of the Stuart City Formation and the present-day Texas coastline (Cook and Bally, 1975).
Petroleum Production
The southern extent of U.S. oil and gas production from the Eagle Ford Shale and overlying units, the youngest of which are the Upper Cretaceous San Miguel, Olmos, and Escondido Formations, lies within the Maverick Basin. In southern Texas, oil and gas production from reservoirs of the San Miguel, Olmos, and Escondido Formations has been nearly continuous over the last century, with commercial production from the sandstones of the Olmos and San Miguel Formations underway by the mid-1920s and late 1940s, respectively (Lewis, 1977; Tyler and Ambrose, 1986). Mid-1920s gas production from reef complexes of the Glen Rose Formation in the Maverick Basin has also been documented (Scott, 2004). Numerous oil and gas fields currently produce from the San Miguel, Olmos, and Escondido Formations across the southern Maverick Basin, within Maverick, Zavala, Dimmit, and northern Webb Counties (fig. 1; Geomap, 2016). Aside from horizontal well production from the Eagle Ford Shale, Campanian–Maastrichtian tight sandstone reservoirs account for most of the recent well development activity within the Maverick Basin and surrounding area through both vertical and horizontal drilling (IHS Markit, 2021).
In Maverick, Zavala, Dimmit, Webb, Frio, La Salle, Atascosa, and McMullen Counties, there are over 5,300 wells completed in reservoirs of the San Miguel Formation that have produced approximately 500 billion cubic feet of gas (BCFG) and 160 million barrels of oil (MMBO) (IHS Markit, 2021). About 3 percent of all wells producing from the San Miguel Formation in this area are horizontal (IHS Markit, 2021). However, approximately 77 percent of completions in the San Miguel Formation in the last decade have been horizontal wells, accounting for about 89 percent of gas production and 95 percent of oil production (IHS Markit, 2021). The largest increase in horizontal drilling activity in the San Miguel Formation over the past decade has been in the Hugh Fitzsimmons Field in southwestern Dimmit and southern Maverick Counties (IHS Markit, 2021). The Hugh Fitzsimmons Field is the site of large historical production volumes of hydrocarbons, with approximately 30 BCFG and 2.7 MMBO produced from vertically drilled conventional reservoirs of the San Miguel Formation (IHS Markit, 2021). The recent expansion of oil producing horizontal wells in the Hugh Fitzsimmons Field suggests the potential for conventional, tight formation resources between areas of established well production in the San Miguel Formation elsewhere in the southern Maverick Basin.
Across the same counties, there are over 8,100 wells completed in reservoirs of the Olmos Formation that have cumulatively produced approximately 2.7 trillion cubic feet of gas and 130 MMBO since the beginning of recorded production (IHS Markit, 2021). In the last decade, approximately 71 percent of wells completed in reservoirs of the Olmos Formation were horizontal, which yielded about 96 percent of gas production and 81 percent of oil production in the same time frame (IHS Markit, 2021). In the case of reservoirs of the Olmos Formation, horizontal drilling over the past decade has resulted in nearly one third of the total gas produced since recorded production (IHS Markit, 2021). Most of the recent horizontal drilling activity in reservoirs of the Olmos Formation has been in the Bigfoot Field in Frio and Atascosa Counties, the A.W.P. Field in McMullen County, and some of the larger downdip fields in Webb County. To date, approximately 7 percent of all wells producing from Olmos Formation are horizontal (IHS Markit, 2021). The increase in gas production from horizontal drilling in these fields could indicate that a large amount of conventional, tight formation gas resources has yet to be produced from reservoirs of the Olmos Formation, particularly downdip towards the southern basin edge.
In the same eight counties, there are over 600 producing wells in reservoirs of the Escondido Formation that have produced approximately 103 BCFG and 6.4 MMBO (IHS Markit, 2021). Within reservoirs of the Escondido Formation, approximately 4 percent of all wells are horizontal (IHS Markit, 2021). In the last decade, approximately 49 percent of wells producing from the Escondido Formation were horizontal and contributed about 98 percent of gas production and 93 percent of oil production for this unit (IHS Markit, 2021). Over the past decade, the majority of horizontal drilling activity in reservoirs of the Escondido Formation has been in the Tres Encanto Field in La Salle County, an area that has experienced heavy development of the Eagle Ford Shale during this time.
Methods for API gravity and Gas/Oil Ratio (GOR) Mapping
Drill stem test and production data current through December 2018 were compiled for wells producing from the San Miguel, Olmos, and Escondido Formations in the study area using information from the IHS Markit proprietary well database of U.S. onshore petroleum production (IHS Markit, 2018). Within the study area, 16,710 wells tested these strata, of which 69 percent were found to have associated oil and condensate API gravity measurements, representing a robust dataset for the purpose of observing regional API gravity trends. Drill stem test data were sorted based on reported oil and condensate API gravity measurements, and null values were eliminated. The data were then plotted spatially to perform spot checks for reasonable formation depths and to evaluate perforation depths for outlier values.
In the IHS Markit production database (IHS Markit, 2018), there are 8,990 wells with recorded production from sandstone reservoirs of the San Miguel, Olmos, and Escondido Formations within the study area. Of these known producing wells, 80 percent were found to have adequate production data for the calculation of cumulative GOR values from reported hydrocarbon liquid and gas production in the IHS Markit well database. Production data for the wells were sorted based on the most recently reported cumulative produced volumes of both hydrocarbon resources. Individual wells that did not report cumulative production data over the life of the well for both hydrocarbon liquids and gases were eliminated from the dataset. GOR values were then calculated after converting the reported gas unit MCFG (million cubic feet of gas) to scf (standard cubic feet). The final GOR values were plotted spatially to perform formation depth spot-checks and to evaluate the validity of outlier GOR values.
Oil and condensate API gravity and GOR data were compiled separately for each of the San Miguel, Olmos, and Escondido Formations. A summary of compiled data from the three formations is shown in table 1. The API gravity dataset for the San Miguel Formation consists of 2,798 single-well values ranging from 0.80° to 73°, and the GOR dataset for the San Miguel Formation consists of 645 single-well values ranging from 0.45 to 1.14 x 10⁹ scf per barrel of crude oil (bbl). The oil and condensate API gravity dataset for the Olmos Formation consists of 7,654 single-well values, ranging from 0.51° to 95°, and the GOR dataset consists of 5,835 single-well values ranging from 0.18 to 7.54 x 10⁸ scf/bbl. The oil and condensate API gravity dataset for the Escondido Formation consists of 1,137 single-well values ranging from 1.0° to 90°, and the GOR dataset consists of 720 single-well values ranging from 0.38 to 1.31 x 10⁸ scf/bbl. API gravity and cumulative GOR values were then plotted spatially for the three formations and average values for each plot were calculated across a grid of one-mile cells. The resulting maps (figs. 4, 5, and 6) show the spatial trends of API gravity and GOR values for each formation across the study area.
Table 1.
Summary table of compiled American Petroleum Institute gravity and gas/oil ratio data from the Upper Cretaceous San Miguel, Olmos, and Escondido Formations. Data compiled from IHS Markit (2018).[API, American Petroleum Institute; GOR, gas/oil ratio; scf, standard cubic feet; bbl, barrel of crude oil]
Resulting Spatial Patterns of Petroleum Properties
API Gravity
Maps of API gravity data for the Upper Cretaceous San Miguel, Olmos, and Escondido Formations show clear trends of lower (heavier) API gravity values, which correspond to heavy crude and black oils updip to the north and northwest, grading to higher (lighter) API gravity values that correspond to light crude, along with wet and dry gases downdip to the south and southeast of the Maverick Basin (fig. 4). Average API gravity values were calculated across a grid of one-mile cells and plotted to identify spatial trends for each reservoir formation. For the San Miguel and Olmos Formations this pattern appears to exist to the east and south regardless of whether production is within the Maverick Basin or outside of the basin (fig. 4A and 4B). In the case of the Olmos Formation, light crude (volatile) oils are observed slightly further downdip in the Maverick Basin, towards the basin edge relative to what is observed outside of the basin. There are too few API gravity data points available for the Escondido Formation to draw conclusions about spatial patterns within the Maverick Basin, but the few that exist show the same general trend as those of the San Miguel and Olmos Formations (fig. 4C).
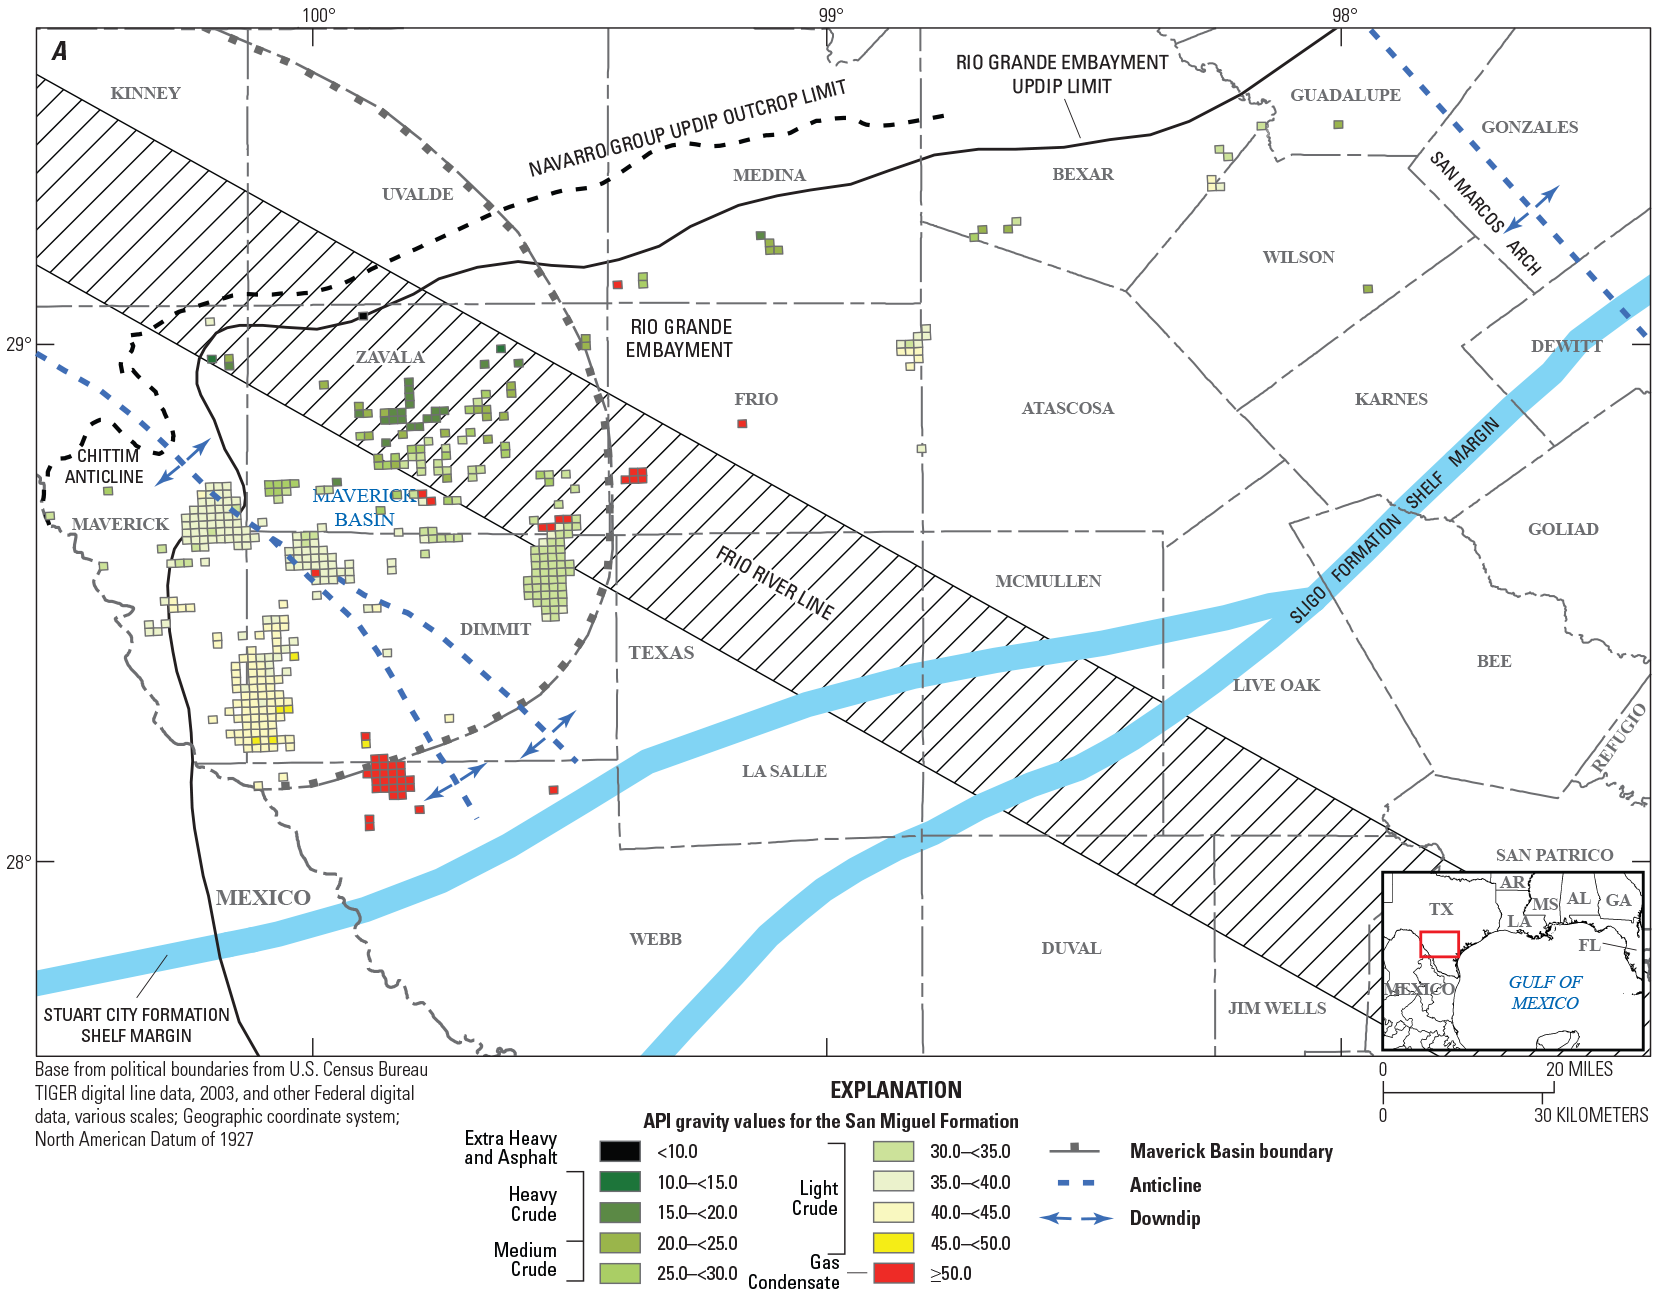
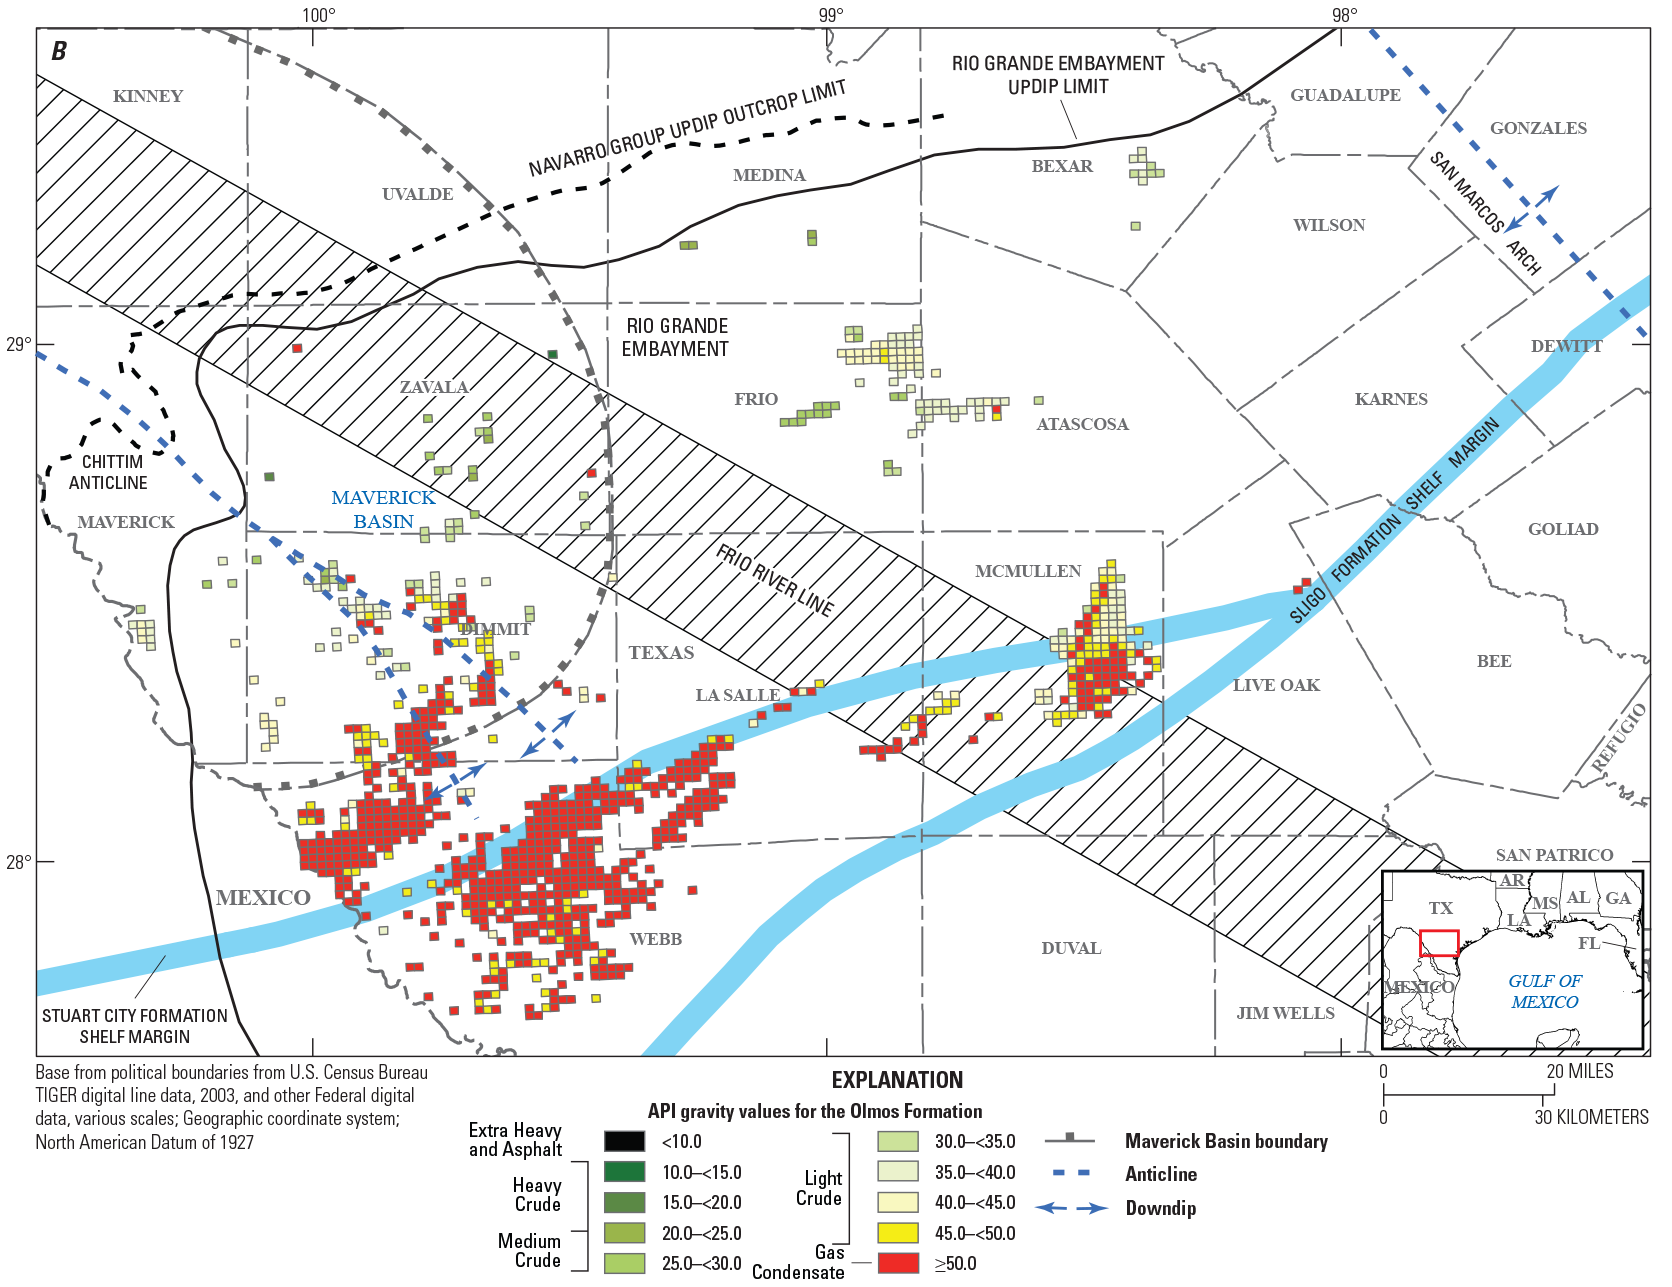
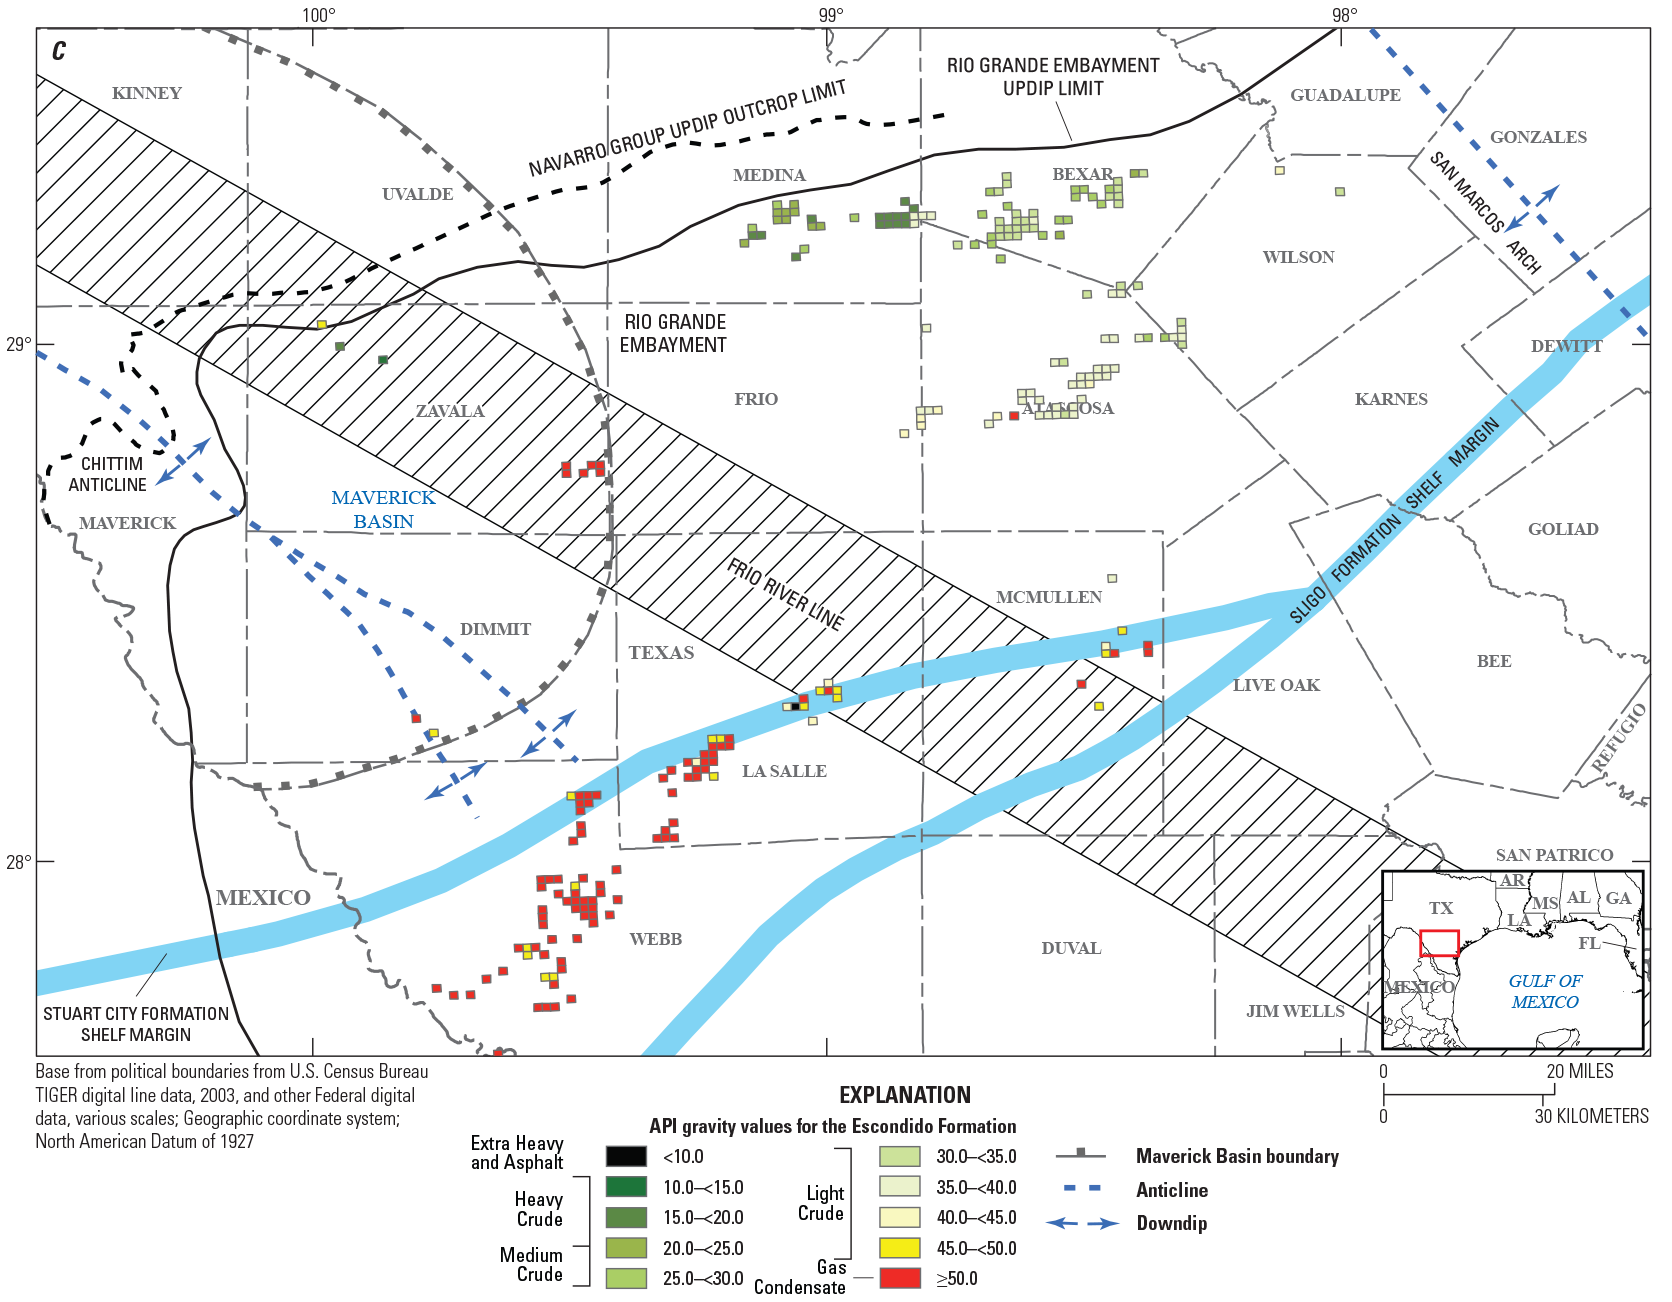
Maps of American Petroleum Institute (API) gravity data for the A, San Miguel, B, Olmos, and C, Escondido Formations in southern Texas. Average values are in degrees and calculated within a grid of 1-mile cells using data from IHS Markit (2018).
Gas/Oil Ratio (GOR)
Average cumulative GOR values were calculated across a grid of one-mile cells and plotted to show the spatial trends for each reservoir formation. Maps of GOR values for the San Miguel, Olmos, and Escondido Formations outside of the Maverick Basin are distributed in a clear pattern with smaller ratio values (heavy and black oils) updip to the north and northwest and larger ratio values (wet and dry gases) downdip to the south and southeast (fig. 5). However, the distribution of GOR values from the San Miguel and Olmos Formations within the Maverick Basin are much more inconsistent, where ratios indicative of heavy and black oil production can be found interspersed with ratios indicative of dry gas production (fig. 5A and 5B). Due to limited production data from the Escondido Formation within the basin, it is challenging to draw conclusions about spatial patterns of GOR values within the Maverick Basin (fig. 5C).
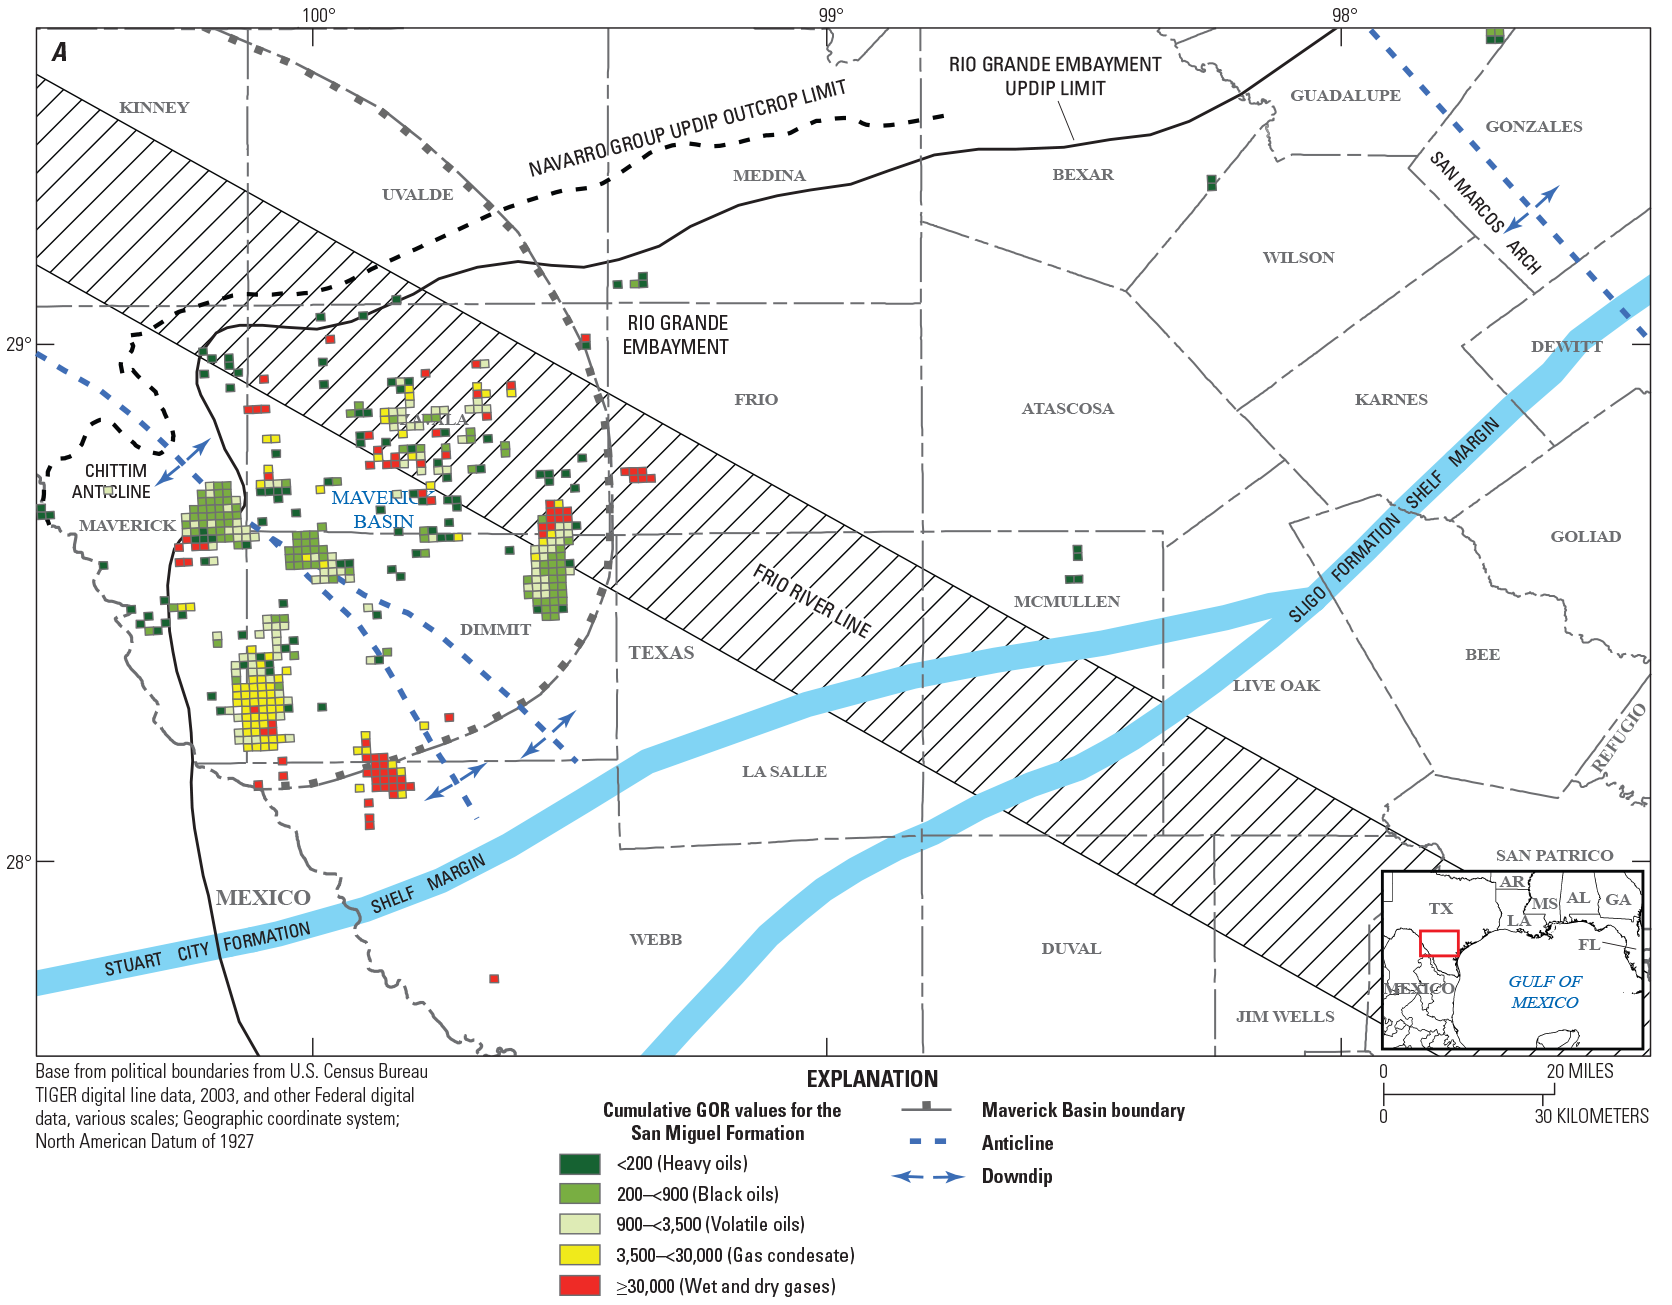
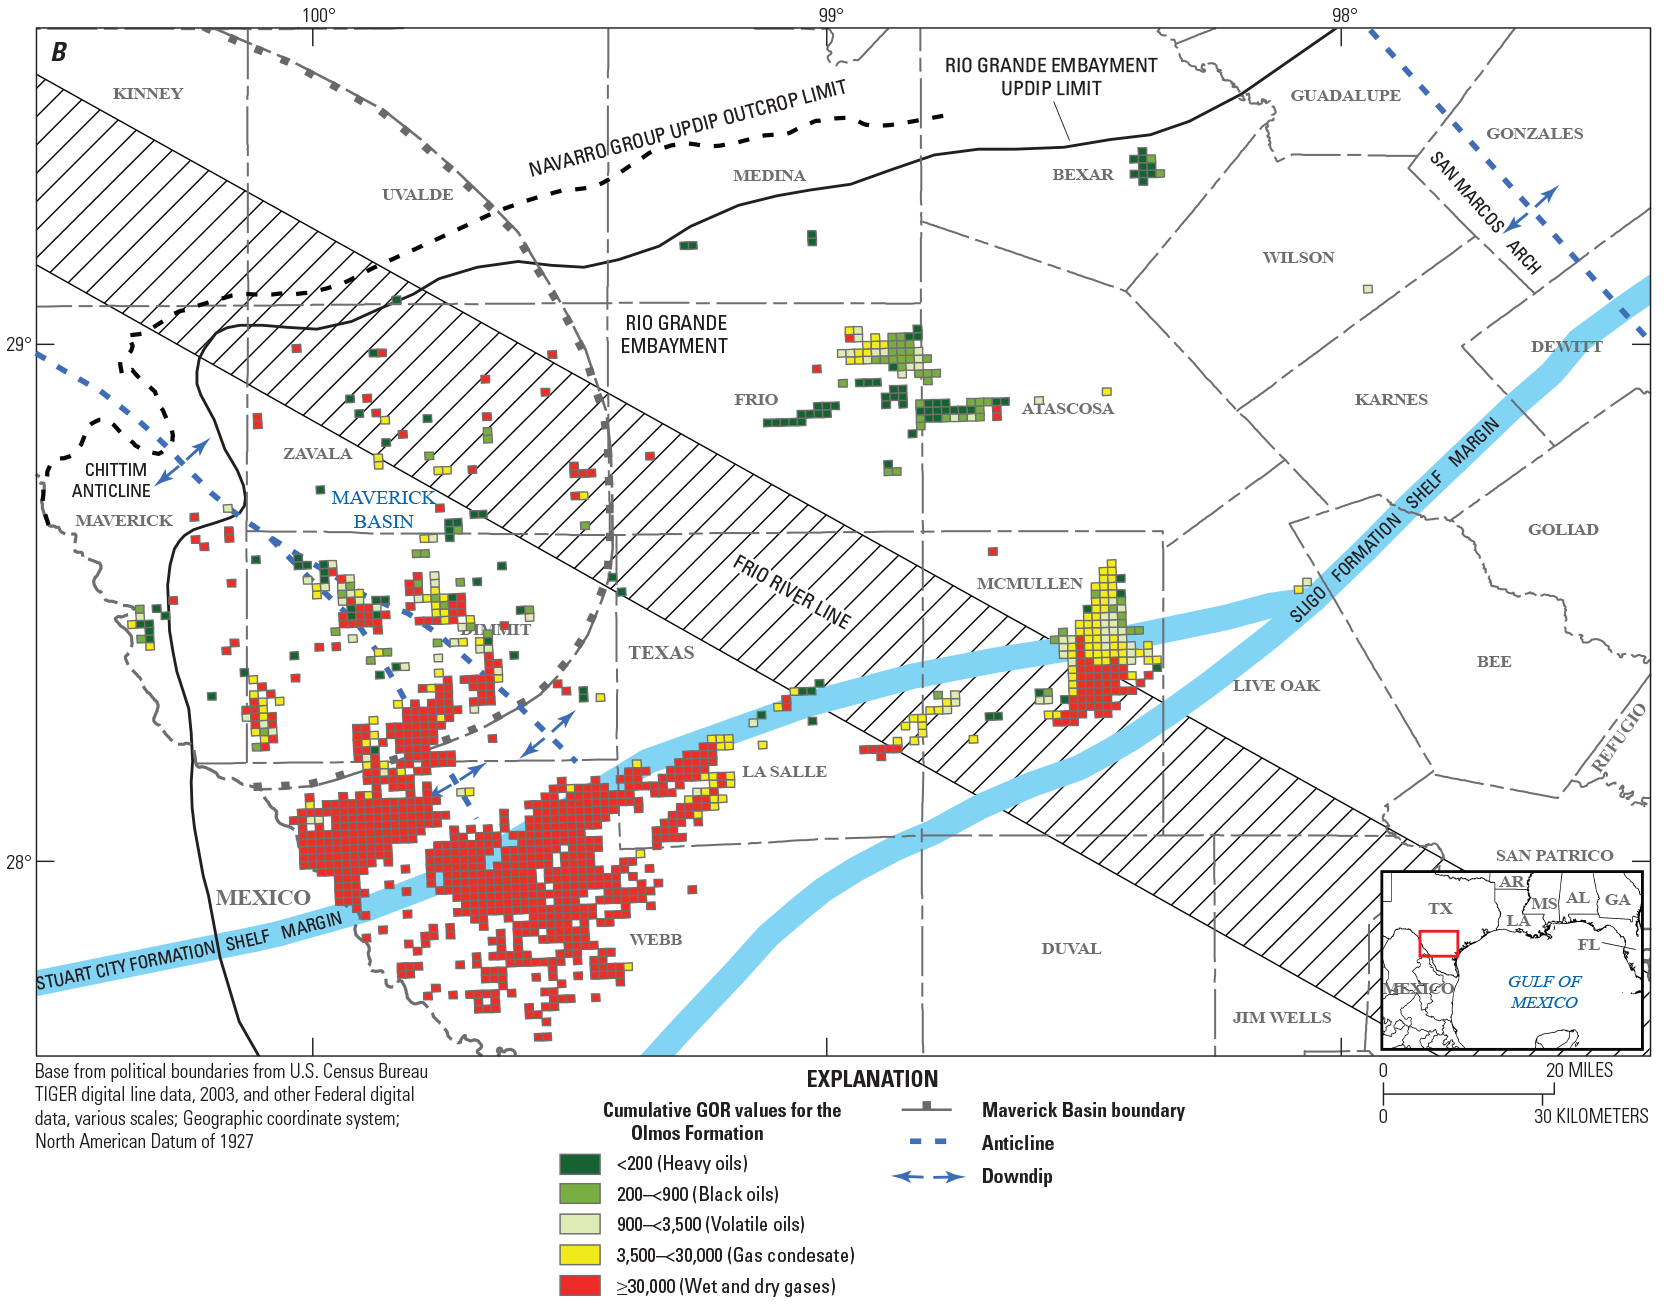
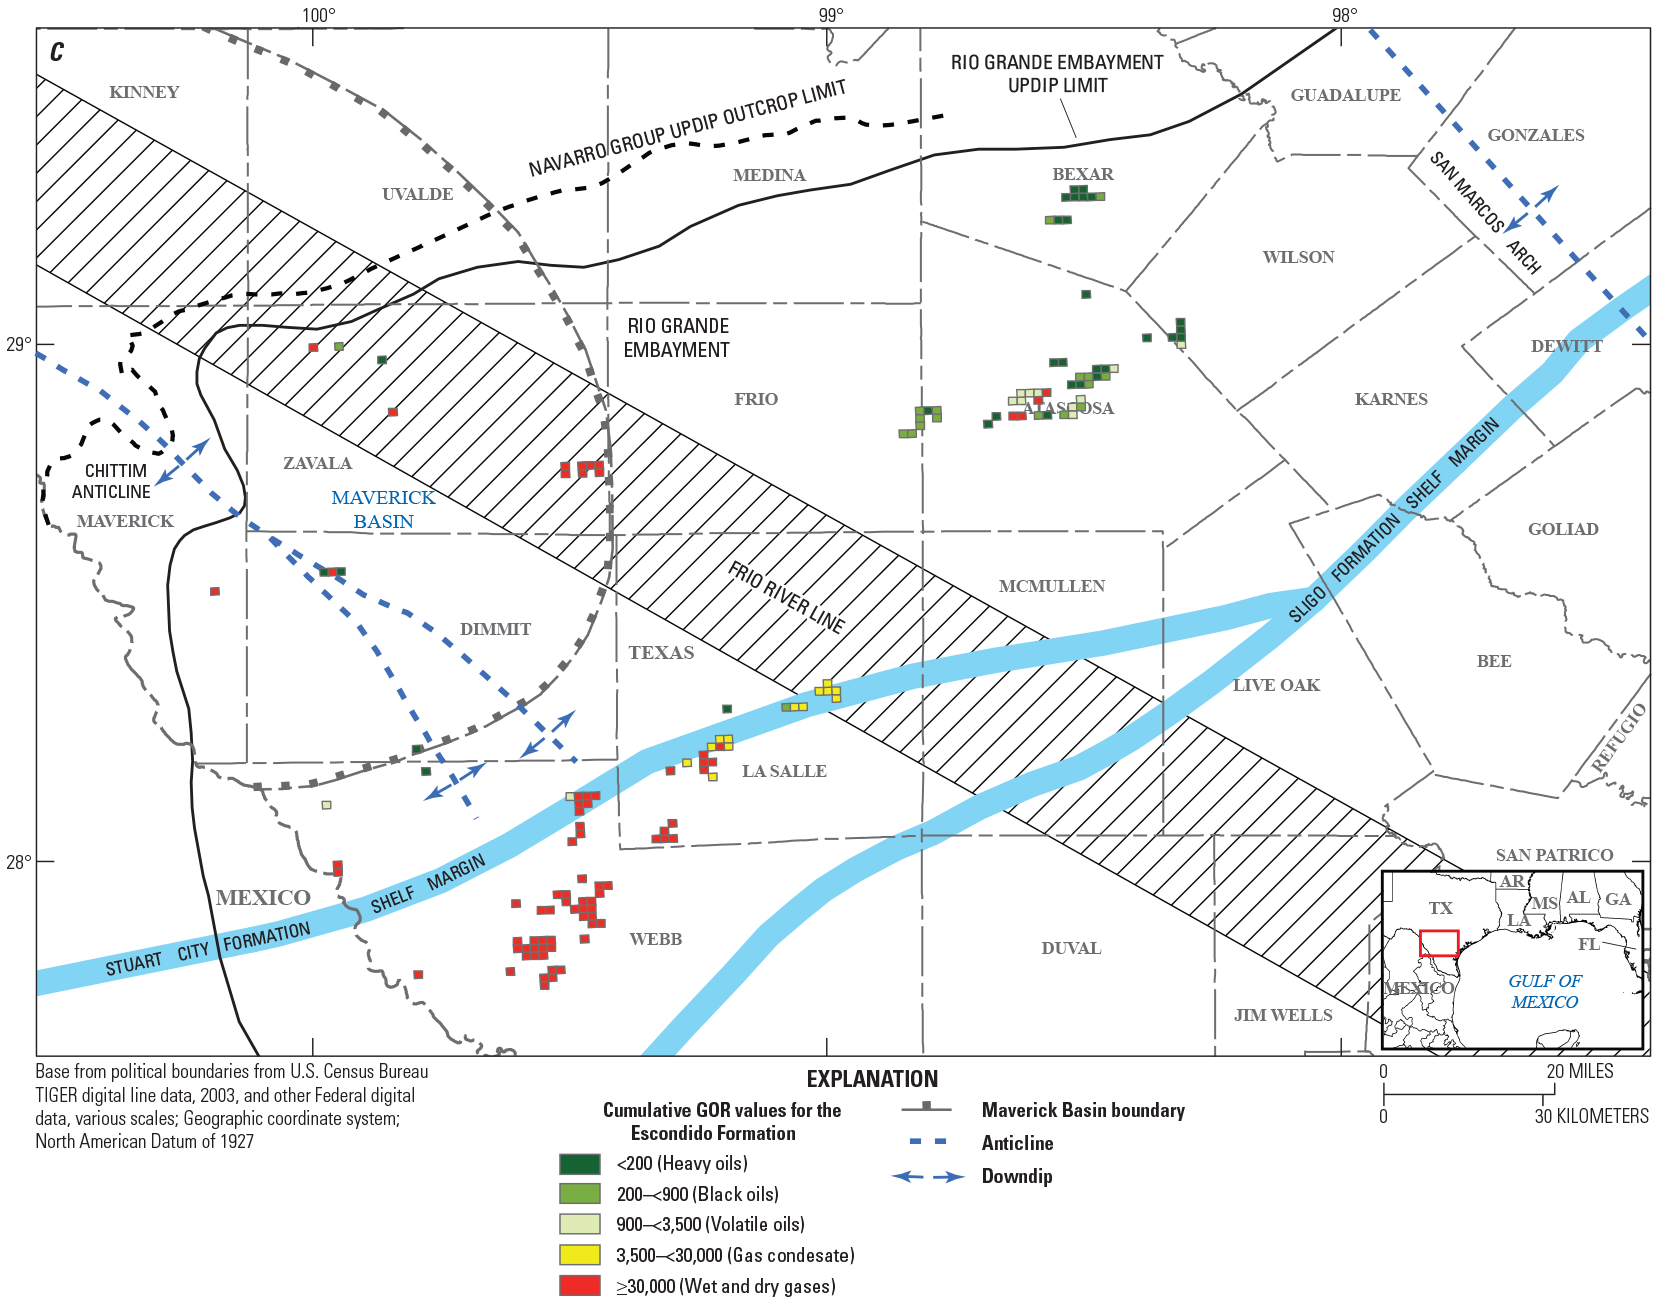
Maps of gas/oil ratios (GOR) in standard cubic feet per barrel of crude oil for A, San Miguel, B, Olmos, and C, Escondido Formations. Average values are in standard cubic feet per barrel of crude oil and calculated within a grid of 1-mile cells using data from IHS Markit (2018).
Discussion
Probable Petroleum Sources for the San Miguel, Olmos, and Escondido Formations in Southern Texas
Hydrocarbon accumulations in reservoirs that are Cretaceous through Neogene in age that are updip of the Lower Cretaceous shelf margin in southern Texas are likely sourced from undifferentiated Cretaceous strata tied to fractured Lower Cretaceous black shale according to a basin-scale hydrocarbon geochemistry study of the Gulf of Mexico by Hood and others (2002). Additional geochemical and petrographic studies have identified the Jurassic Smackover Formation, the Lower Cretaceous Pearsall and McKnight Formations, and the Upper Cretaceous Eagle Ford Shale as major source rock intervals within the Maverick Basin (Rose, 1986; Condon and Dyman, 2006; Hackley, 2012). Marl facies of the Eagle Ford Shale have been identified as the source of oil for some reservoirs of the San Miguel Formation in Maverick and Dimmit Counties based on multivariant statistical classification from biomarker and carbon isotope data (Zumberge and others, 2016). The observed pattern of API gravity and GOR values for reservoirs of the San Miguel, Olmos, and Escondido Formations suggests the possibility of distinct sourcing and migration histories between areas outside of the Maverick Basin and within the basin.
Considering the spatial distribution of API gravity and GOR values from this study for the San Miguel, Olmos, and Escondido Formations in southern Texas outside of the Maverick Basin, the likely source of the petroleum accumulations in Upper Cretaceous reservoirs is the Eagle Ford Shale. The API gravity and GOR value patterns (figs. 4, 5) are consistent with the near vertical, slightly updip migration of petroleum, based on the thermal maturity gradient of the Eagle Ford Shale (Alaniz and others, 2016). The distribution of API gravity values outside the Maverick Basin shows that light oil (30° API to 40° API) accumulations are generally near the vitrinite reflectance (%Ro) contour of 0.6%Ro (early oil window) for the Eagle Ford Shale and gas (>50° API) accumulations plot near the 1.5%Ro contour (early to middle gas window) of the vitrinite reflectance (fig. 6A). Similarly, the distribution of GOR values outside the Maverick Basin shows that intermediate oils of 200 to 900 scf/bbl generally plot between vitrinite reflectance contours 0.6 to 0.8%Ro (middle oil window) for the Eagle Ford Shale and gas of greater than 30,000 scf/bbl plot between the 1.2 to 1.5%Ro contours (early to middle gas window) (fig. 6B), which appears consistent with the Eagle Ford Shale as a source. While contributions from deeper source rock intervals cannot be ruled out, an Eagle Ford Shale-sourced petroleum charge in Campanian–Maastrichtian reservoirs east of the Frio River Line is consistent with the spatial correlation between maturity data of the Eagle Ford Shale from Alaniz and others (2016) and the observed petroleum properties from the San Miguel, Olmos, and Escondido Formations in this study.
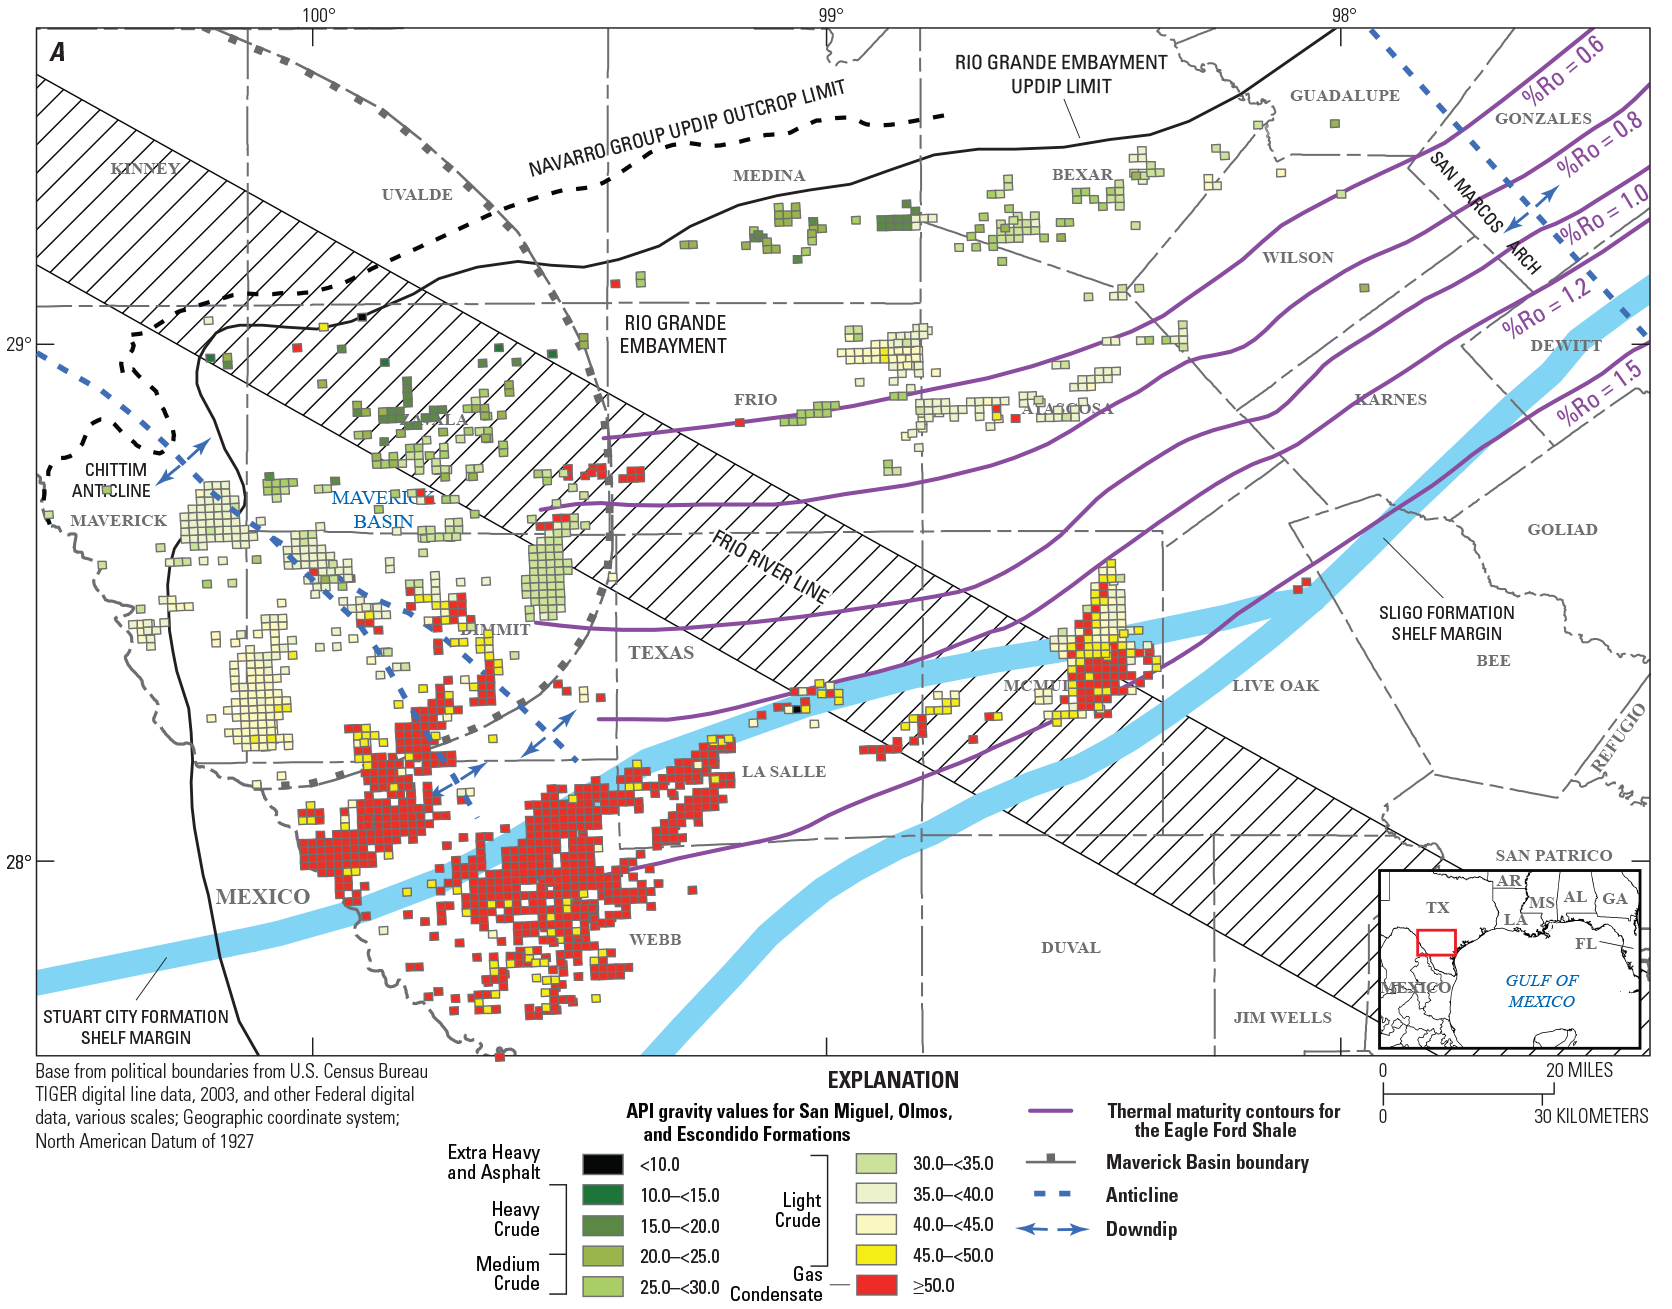
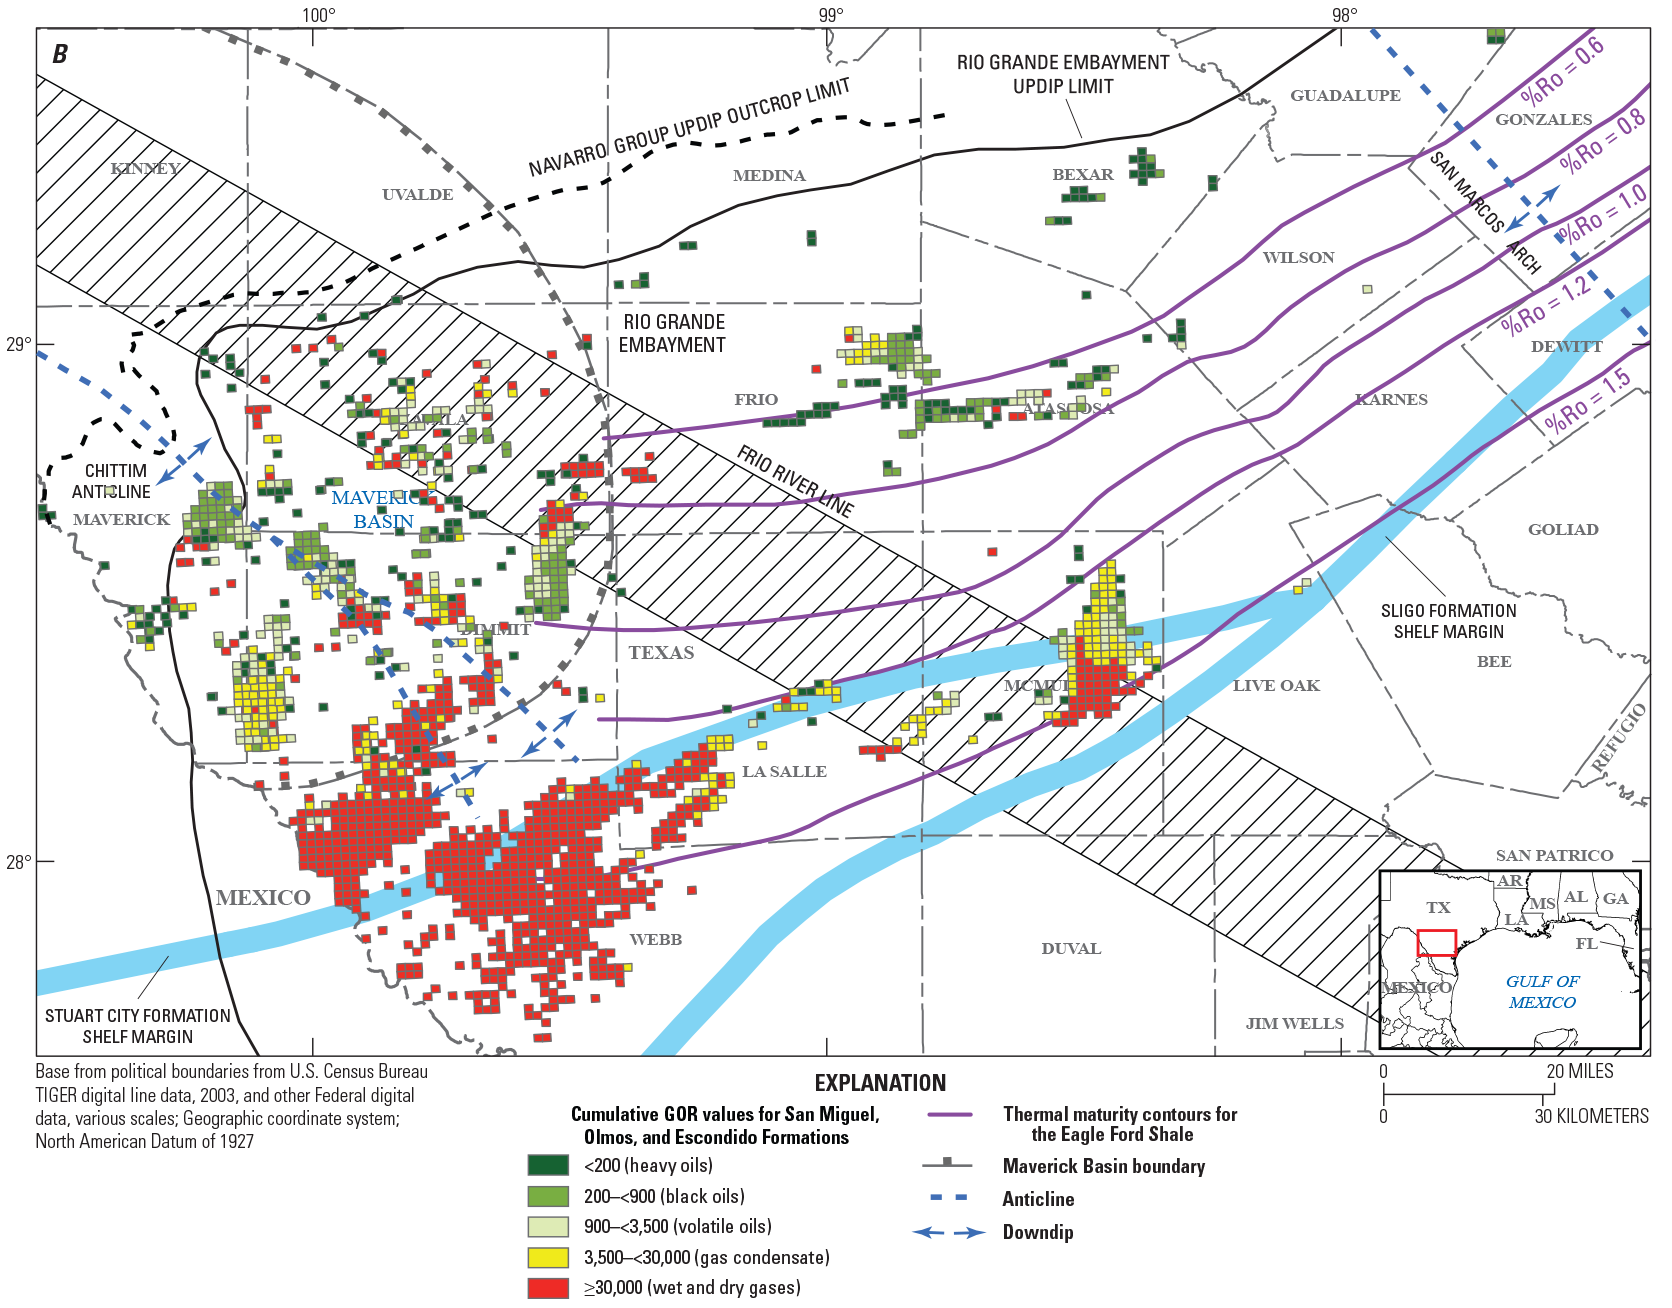
Maps of A, American Petroleum Institute (API) gravity and B, gas/oil ratio (GOR) values of the combined San Miguel, Olmos, and Escondido Formations with thermal maturity contours of the Eagle Ford Shale. Average API (degrees) and GOR (standard cubic feet per barrel of crude oil) data are based on information from IHS Markit, (2018). Thermal maturity contours are from Alaniz and others (2016). %Ro, vitrinite reflectance.
West of the Frio River Line within the Maverick Basin, however, vertical petroleum migration from source rocks of the Eagle Ford Shale may not account for the observed pattern of GOR values (fig. 5). API gravity values within the Maverick Basin show a zone of light oil (35° to 45° API) accumulations straddling the Chittim Anticline, near the downdip edge of the Maverick Basin that plots downdip of the extrapolated 1.0%Ro contour of the Eagle Ford Shale from Alaniz and others (2016) (fig. 6A). GOR values within the Maverick Basin show a heterogeneous spatial variation ranging from heavy oils to wet and dry gases, occurring from updip of the extrapolated 0.6%Ro contour to downdip of the extrapolated 1.2%Ro contour of the Eagle Ford Shale (fig. 6B). The inconsistency between spatial patterns of API gravity and GOR values suggests that the history of petroleum generation and migration for Campanian–Maastrichtian sandstone reservoirs is different within the Maverick Basin as compared to outside the basin, with petroleum generation and expulsion occurring prior to or during the Eocene with basin uplift, erosion, and petroleum remigration during the early to middle Eocene. Uncertainty concerning the timing of oil and gas generation from the Eagle Ford Shale in the Maverick Basin adds further complexity to the lack of spatial trends for GOR values of the San Miguel, Olmos, and Escondido Formations. One-dimensional burial-history curves using hydrous-pyrolysis kinetic parameters from Turonian source rocks in the central U.S. Gulf Coast constrain the start and end of oil generation to have been between 49–7 Ma and 31 Ma to present day, respectively, and the start and end of gas generation to have been between 28–12 Ma and 22 Ma to present day, respectively (Lewan, 2002). Petroleum remigration patterns in the western Maverick Basin are further complicated by the possibility of multiple petroleum sources, including source strata in the Mexican cordilleran foreland to the southwest (Ewing 2003).
Effects of Exhumation on Reservoir Petroleum Properties and Implications for Unconventional Gas Accumulation
API gravity and GOR spatial patterns of the San Miguel, Olmos, and Escondido Formations suggest that the petroleum properties of the reservoirs within the Maverick Basin may have been altered by Eocene uplift and erosion. Subsurface geopressure in the Maverick Basin is among the highest of anywhere in the northern Gulf of Mexico Basin (Burke and others, 2013). The Eocene inversion of the Maverick Basin can at least partially explain the observed overpressure, with the presence of unconventional gas resources such as the Eagle Ford Shale within the basin likely contributing to overpressure as well. The exhumation of Campanian and Maastrichtian strata positioned the pressurized reservoirs closer to the surface, which may have initiated depressurization that continues to the present. The process of reservoir exhumation and depressurization can lead to gas exsolution from formation brines, gas expansion, and remigration of hydrocarbons (Doré and others, 2002; Parnell, 2002). Bulk isotope compositions for gas of the Eagle Ford Shale in the Maverick Basin provide additional evidence of uplift and erosion of the basin, and elevated carbon stable isotopic measurements values for ethane and propane hydrocarbons suggest associated gas expulsion events (Zhao and others, 2020). In the case of reservoirs of the San Miguel, Olmos, and Escondido Formations within the Maverick Basin, gas exsolution and expansion from brines and additional charge of light hydrocarbons from the underlying Eagle Ford Shale, in combination with tectonically modified hydrocarbon catchment areas, are possible factors contributing to the remobilization of pre-Eocene accumulations. However, detailed carbon stable isotope analyses from producing Upper Cretaceous strata in the Maverick Basin could help to provide further clarity for the history of uplift-induced petroleum remobilization.
Gas exsolution from formation brines has the potential to produce substantial quantities of natural gas (Doré and others, 2002), and with continuous reservoir depressurization, gas dissolved in brines can take the form of unconventional accumulations that lack distinct oil-water contacts. Gas flushing from exsolution could also account for the prolific gas production versus oil from Campanian–Maastrichtian low-permeability reservoirs in the Maverick Basin, and is a compelling idea for the future resource growth potential of the basin with continued horizontal drilling. Two basins where this idea has been applied are the Western Canada Basin (Doré and Jensen, 1996) and the West Siberia Basin of Russia (Cramer and others, 1999). GOR values within the Maverick Basin are heterogeneous, with occurrences of heavy oil occurring far downdip juxtaposed with wet and dry gas production, while API gravity values in the same area show a more predictable heavy updip to light downdip trend (figs. 4, 5). These patterns could be indicative of large volumes of exsolved gas from brines with no associated liquid hydrocarbons flushing exhumed reservoirs of the San Miguel, Olmos, and Escondido Formations, and, in the process, causing remigration of oil accumulations, although it remains uncertain without geochemical analyses. Biogenic gas generation from microbial degradation of exhumed oil accumulations could be at least a partial source of the large dry gas accumulations. Dry gas accumulations can result from the mixing of thermogenic gas and biogenic gas as observed in the Sacramento Basin (Jenden and Kaplan, 1989) and the Michigan Basin (Martini and others, 1996; Stolper and others, 2015). A biogenic component for dry gases in Upper Cretaceous reservoirs in the Maverick Basin cannot be identified, however, without detailed isotopic and compositional analyses.
The unpredictable spatial distribution of sampled GOR values within the Maverick Basin gives credence to the idea that Eocene Laramide deformation west of the Frio River Line has altered the generation, migration, and trapping history of hydrocarbon accumulations within the basin. Gas exsolution and accumulation in stratigraphic traps that were tectonically tilted in the Eocene is a plausible interpretation for the GOR patterns, considering the predictable API gravity patterns across the region. The possibility of continuous gas generation from exhumed reservoirs and the uncertainty about the source rocks for Upper Cretaceous reservoirs in the Maverick Basin suggests that the characteristics of undiscovered gas accumulations in the basin may be fundamentally different from those of gas accumulations outside of the basin. Novel exploration models could be employed across the Maverick Basin that consider the effects of gas exsolution, differences in expected trap types, and likelihood of unpredictable patterns of regional petroleum migration and basin-wide petroleum remigration. These factors also are a consideration when developing exploration models for Upper Cretaceous undiscovered petroleum resources in the Maverick Basin. Detailed geophysical surveys can play a critical role in identifying trap geometries and potential petroleum migration pathways.
Summary
This case study examines the evolution of the Maverick Basin petroleum system in southern Texas, with a focus on Upper Cretaceous tight natural gas systems. The purpose of this study is to observe the effects of Laramide tectonism in the Eocene and subsequent erosion of the Maverick Basin on physical petroleum properties, such as American Petroleum Institute (API) gravity and gas/oil ratio (GOR) values. Proprietary drill stem test and production data were compiled for producing wells of the Upper Cretaceous San Miguel, Olmos, and Escondido Formations in the study area, using information from the IHS Markit well database. Over 11,500 drill stem tests were sorted based on reported oil and condensate API gravity measurements, and null values were eliminated. Production data for over 7,000 wells were sorted based on cumulative produced volumes of hydrocarbon resources, and GOR values were calculated after converting million cubic feet of gas to standard cubic feet. Oil and condensate API gravity and GOR data were compiled for each of the San Miguel, Olmos, and Escondido Formations. API gravity and cumulative GOR values were then plotted spatially for each formation and average values were calculated across a grid of one-mile cells.
Campanian to Maastrichtian tight sandstone reservoirs east of the Maverick Basin are likely to have been sourced primarily by the underlying Eagle Ford Shale based on spatial patterns of cumulative GOR values and vitrinite reflectance contours of the Eagle Ford Shale. The spatial pattern of GOR values for sandstone reservoirs of the San Miguel, Olmos, and Escondido Formations within the Maverick Basin is much more inconsistent compared to the pattern outside the basin due to Eocene uplift and erosion that altered reservoir geometries and initiated remigration of hydrocarbons after initial generation, migration, and accumulation. Upper Cretaceous tight sandstone reservoirs in the western Maverick Basin may have been partially charged by source strata to the southwest in Mexico, in addition to local intervals of the Eagle Ford Shale.
Inversion and exhumation of reservoirs of the San Miguel, Olmos, and Escondido Formations in the Eocene resulted in overpressured, low-permeability sandstone reservoirs close to the surface that were likely subjected to gas exsolution, gas expansion, and remigration of hydrocarbons through displacement. Heterogeneous GOR values in contrast to updip–downdip-trending API gravity values in the Maverick Basin may be indicative of large-scale exsolved gas flushing of reservoirs from post-exhumation reservoir depressurization. Prolific gas exsolution can also create unconventional tight gas accumulations that could prompt the need for novel exploration and production strategies for operations involving Upper Cretaceous tight sandstone reservoirs in the Maverick Basin.
Acknowledgments
This report has benefitted from thorough reviews from Sean T. Brennan and John W. Counts of the U.S. Geological Survey (USGS). The authors would also like to thank the members of the USGS Gulf Coast Petroleum Systems Project for numerous helpful comments and reviews of early manuscript versions.
References Cited
Adatte, T., Stinnesbeck, W., and Keller, G., 1996, Lithostratigraphic and mineralogic correlations of near K/T boundary clastic sediments in northeastern Mexico—implications for origin and nature of deposition, in Ryder, G., Fastovsky, D.E., and Gartner, S., eds., The Cretaceous–Tertiary Event and other catastrophes in Earth history: Geological Society of America Special Paper 307, p. 211–226, accessed June 9, 2023, at https://doi.org/10.1130/0-8137-2307-8.211.
Alaniz, R., Garrison, R., Harbor, R., Keenan, S., and Pieprzica, C., 2016, Delineation of an oil window—An integrated approach, in Breyer, J.A., ed., The Eagle Ford Shale—A renaissance in U.S. oil production: American Association of Petroleum Geologists Memoir 110, p. 187–212, accessed April 3, 2019, at https://doi.org/10.1306/13541965M1103661.
Alexander, M., 2014, A new look at Maverick Basin basement tectonics: Transactions—Gulf Coast Association of Geological Societies, v. 64, p. 33–40. [Also available at https://archives.datapages.com/data/gcags/data/064/064001/33_gcags640033.htm.]
Bebout, D.G., 1977, Sligo and Hosston depositional patterns, subsurface of south Texas, in Bebout, D.G., and Loucks, R.G., eds., Cretaceous carbonates of Texas and Mexico—Applications to subsurface exploration: University of Texas at Austin, Bureau of Economic Geology, Report of Investigations 89, p. 79–96.
Burke, L.A., Kinney, S.A., Dubiel, R.F., and Pitman, J.K., 2013, Regional maps of subsurface geopressure gradients of the onshore and offshore Gulf of Mexico basin: U.S. Geological Survey Open-File Report 2013–1058, 3 sheets, accessed May 10, 2021, at https://pubs.usgs.gov/of/2013/1058/.
Condon, S.M., and Dyman, T.S., 2006, 2003 geologic assessment of undiscovered conventional oil and gas resources in the Upper Cretaceous Navarro and Taylor Groups, Western Gulf Province, Texas, chap. 2 of U.S. Geological Survey Western Gulf Province Assessment Team, Petroleum systems and geologic assessment of undiscovered oil and gas, Navarro and Taylor Groups, Western Gulf Province, Texas: U.S. Geological Survey Digital Data Series DDS–69–H, 42 p., accessed July 9, 2018, at https://doi.org/10.3133/ds69H2.
Cramer, B., Poelchau, H.S., Gerling, P., Lopatin, N.V., and Littke, R., 1999, Methane released from groundwater—The source of natural gas accumulations in northern West Siberia: Marine and Petroleum Geology, v. 16, no. 3, p. 225–244, accessed May 24, 2023, at https://doi.org/10.1016/S0264-8172(98)00085-3.
Doré, A.G., Corcoran, D.V., and Scotchman, I.C., 2002, Prediction of the hydrocarbon system in exhumed basins, and application to the NW European margin, in Doré, A.G., Cartwright, J.A., Stoker, M.S., Turner, J.P., and White, N., eds., Exhumation of the North Atlantic margin—Timing, mechanisms and implications for petroleum exploration: Geological Society of London Special Publications 196, p. 401–429, accessed January 28, 2021, at https://doi.org/10.1144/GSL.SP.2002.196.01.21.
Doré, A.G., and Jensen, L.N., 1996, The impact of late Cenozoic uplift and erosion on hydrocarbon exploration—Offshore Norway and some other uplifted basins: Global and Planetary Change, v. 12, nos. 1–4, p. 415–436, accessed May 20, 2023, at https://doi.org/10.1016/0921-8181(95)00031-3.
Evans, S.L., and Zoerb, R.M., 1984, Possible relationships between deep structure and shallow fault patterns, northwest Maverick Basin, Val Verde County, Texas, in Smith, C.I., ed., Stratigraphy and structure of the Maverick Basin and Devils River Trend, Lower Cretaceous, southwest Texas—A field guide and related papers, published by the San Antonio Geological Society for the annual meeting of the American Association of Petroleum Geologists and the Society of Economic Paleontologists and Mineralogists, San Antonio, Texas—May, 1984—South Texas Geological Society Special Publication: Arlington, Tex., University of Texas at Arlington, p. 94–98. [Also available at https://archives.datapages.com/data/south-texas-geosoc-specpubs/data/009/009001/94_stb-sp0090094.htm.]
Ewing, T.E., 1986, Balcones volcanoes in south Texas—Exploration methods and examples, in Stapp, W.L., ed., Contributions to the Geology of South Texas, 1986: San Antonio, Tex., South Texas Geological Society, p. 368–379. [Also available at https://archives.datapages.com/data/south-texas-geosoc-specpubs/data/010/010001/368_stb-sp0100368.htm.]
Ewing, T.E., 1987, The Frio River Line in south Texas—Transition from Cordilleran to Northern Gulf tectonic regimes: Transactions—Gulf Coast Association of Geological Societies, v. 37, p. 87–94. [Also available at https://archives.datapages.com/data/gcags/data/037/037001/0087.htm.]
Ewing, T., 1991, Structural framework, in Salvador, A., ed., The Gulf of Mexico Basin, v. J of The geology of North America: Boulder, Colo., Geological Society of America, p. 31–52. [Also available at https://doi.org/10.1130/DNAG-GNA-J.]
Ewing, T.E., 2003, Review of the tectonic history of the lower Rio Grande border region, south Texas and Mexico, and implications for hydrocarbon exploration, in Rosen, N.C., ed., Structure and stratigraphy of south Texas and northeast Mexico—Applications to exploration—Papers presented at a Gulf Coast Section of the Society of Economic Paleontologists and Mineralogists Foundation and South Texas Geological Society seminar, San Antonio, April 11 & 12, 2004: San Antonio, Tex., South Texas Geological Society, p. 7–21.
Ewing, T.E., 2005, Phanerozoic development of the Llano uplift: South Texas Geological Society Bulletin, v. 45, no. 9, p. 15–25, accessed October 19, 2019, at https://archives.datapages.com/data/south-texas-geosoc-bulletins/data/045/045009/15_stb450015.htm.
Ewing, T.E., 2009, Southwest Texas heavy oil province—A review: AAPG Search and Discovery, article 80133, 20 p., accessed October 19, 2019, at https://www.searchanddiscovery.com/pdfz/documents/2011/80133ewing/ndx_ewing.pdf.html
Ewing, T.E., 2010, Pre-Pearsall geology and exploration plays in south Texas: Transactions—Gulf Coast Association of Geological Societies, v. 60, p. 241–260, accessed October 19, 2019, at https://archives.datapages.com/data/gcags_pdf/2010/Papers/ewing.htm.
Fitz-Díaz, E., Lawton, T.F., Juárez-Arriaga, E., and Chávez-Cabello, G., 2018, The Cretaceous-Paleogene Mexican orogen—Structure, basin development, magmatism and tectonics: Earth-Science Reviews, v. 183, p. 56–84, accessed September 20, 2020, at https://doi.org/10.1016/j.earscirev.2017.03.002.
Galloway, W.E., 2008, Depositional evolution of the Gulf of Mexico sedimentary basin, chap. 15 of Miall, A.D., ed., The sedimentary basins of the United States and Canada, v. 5 of Hsü, K.J., ed., Sedimentary basins of the world: Amsterdam, Elsevier, p. 505–549, accessed August 25, 2018, at https://doi.org/10.1016/S1874-5997(08)00015-4.
Goldhammer, R.K., and Johnson, C.A., 2001, Middle Jurassic–Upper Cretaceous paleogeographic evolution and sequence-stratigraphic framework of the northwest Gulf of Mexico rim, in Bartolini, C., Buffler, R.T., and Cantú-Chapa, A., eds., The western Gulf of Mexico Basin—Tectonics, sedimentary basins, and petroleum systems: American Association of Petroleum Geologists Memoir 75, p. 45–81, accessed October 2, 2018, at https://doi.org/10.1306/M75768C3.
Goldhammer, R.K., Lehmann, P.J., Todd, R.G., Wilson, J.L., Ward, W.C., and Johnson, C.R., 1991, Sequence stratigraphy and cyclostratigraphy of the Mesozoic of the Sierra Madre Oriental, northeast Mexico, a field guidebook—Gulf Coast Section, Society of Economic Paleontologists and Mineralogists, 85 p.
Hackley, P.C., 2012, Geological and geochemical characterization of the Lower Cretaceous Pearsall Formation, Maverick Basin, south Texas—A future shale gas resource?: AAPG Bulletin, v. 96, no. 8, p. 1449–1482, accessed March 2, 2020, at https://doi.org/10.1306/11221111071.
Hackley, P.C., Warwick, P.D., Hook, R.W., Alimi, H., Mastalerz, M., and Swanson, S.M., 2012, Organic geochemistry and petrology of subsurface Paleocene–Eocene Wilcox and Claiborne Group coal beds, Zavala County, Maverick Basin, Texas, USA: Organic Geochemistry, v. 46, p. 137–153, accessed May 18, 2023, at https://doi.org/10.1016/j.orggeochem.2012.02.008.
Hood, K.C., Wenger, L.M., Gross, O.P., and Harrison, S.C., 2002, Hydrocarbon systems analysis of the northern Gulf of Mexico—Delineation of hydrocarbon migration pathways using seeps and seismic imaging, in Schumacher, D., and LeSchack, L.A., eds., Surface exploration case histories—Applications of geochemistry, magnetics, and remote sensing: American Association of Petroleum Geologists Studies in Geology 48, p. 25–40, accessed September 15, 2019, at https://doi.org/10.1306/St48794C2.
IHS Markit, 2018, PI/Dwights PLUS U.S. Production Data: Englewood, Colo., IHS Markit web page, accessed December 2018, at https://ihsmarkit.com/index.html. [Includes data current as of December 31, 2018.]
IHS Markit, 2021, PI/Dwights PLUS U.S. Production Data: Englewood, Colo., IHS Markit web page, accessed December 2021, at https://ihsmarkit.com/index.html. [Includes data current as of May 31, 2021.]
Jenden, P.D., and Kaplan, I.R., 1989, Origin of natural gas in Sacramento Basin, California: AAPG Bulletin, v. 73, no. 4, p. 431–453, accessed June 3, 2023, at https://doi.org/10.1306/44B49FC9-170A-11D7-8645000102C1865D.
Kauffmann, E.G., 1977, Geological and biological overview—Western Interior Cretaceous basin: The Mountain Geologist, v. 14, nos. 3–4, p. 75–99, accessed April 20, 2022, at https://archives.datapages.com/data/rmag/mg/1977/kauffman.htm.
Lawton, T.F., Ruiz Urueña, J.E., Solari, L.A., Tarango Terrazas, C., Juárez-Arriaga, E., and Ortega-Obregón, C., 2018, Provenance of Upper Triassic–Middle Jurassic strata of the Plomosas uplift, east-central Chihuahua, Mexico, and possible sedimentologic connections with Colorado Plateau depositional systems, in Ingersoll, R.V., Lawton, T.F., and Graham, S.A., eds., Tectonics, sedimentary basins, and provenance—A celebration of the career of William R. Dickinson: Geological Society of America Special Paper 540, p. 481–507, accessed December 15, 2020, at https://doi.org/10.1130/2018.2540(22).
Lewan, M.D., 2002, New insights on timing of oil and gas generation in the central Gulf Coast Interior Zone based on hydrous-pyrolysis kinetic parameters: Transactions—Gulf Coast Association of Geological Societies, v. 52, p. 607–620, accessed June 2, 2023, at https://archives.datapages.com/data/gcags/data/052/052001/0607.htm.
Lewis, J.O., 1977, Stratigraphy and entrapment of hydrocarbons in the San Miguel sands of southwest Texas: Transactions—Gulf Coast Association of Geological Societies, v. 27, p. 90–98, accessed March 16, 2019, at https://archives.datapages.com/data/gcags/data/027/027001/0090.htm.
Loucks, R.G., 1977, Porosity development and distribution in shoal-water carbonate complexes—subsurface Pearsall, in Bebout, D.G., and Loucks, R.G., eds., Cretaceous carbonates of Texas and Mexico—Applications to subsurface exploration: University of Texas at Austin, Bureau of Economic Geology, Report of Investigations 89, p. 97–126.
Lozo, F.E., and Smith, C.I., 1964, Revision of Comanche Cretaceous stratigraphic nomenclature, southern Edwards Plateau, southwest Texas: Transactions—Gulf Coast Association of Geological Societies, v. 14, p. 285–307, accessed July 14, 2021, at https://archives.datapages.com/data/gcags/data/014/014001/0285.htm.
Martini, A.M., Budai, J.M., Walter, L.M., and Schoell, M., 1996, Microbial generation of economic accumulations of methane within a shallow organic-rich shale: Nature, v. 383, p. 155–158. [Also available at http://dx.doi.org/10.1038/383155a0.]
Martini, M., and Ortega-Gutiérrez, F., 2018, Tectono-stratigraphic evolution of eastern Mexico during the break-up of Pangea—A review: Earth-Science Reviews, v. 183, p. 38–55, accessed February 27, 2020, at https://doi.org/10.1016/j.earscirev.2016.06.013.
McFarlan, E., Jr., 1977, Lower Cretaceous sedimentary facies and sea level changes, U.S. Gulf Coast, in Bebout, D.G., and Loucks, R.G., eds., Cretaceous carbonates of Texas and Mexico—Applications to subsurface exploration: University of Texas at Austin, Bureau of Economic Geology, Report of Investigations 89, p. 5–11.
McFarlan, E., Jr., and Menes, L.S., 1991, Lower Cretaceous, in Salvador, A., ed., The Gulf of Mexico Basin, v. J of The geology of North America: Boulder, Colo., Geological Society of America, p. 181–204. [Also available at https://pubs.geoscienceworld.org/gsa/books/book/913/The-Gulf-of-Mexico-Basin.]
Parnell, J., 2002, Diagenesis and fluid flow in response to uplift and exhumation, in Doré, A.G., Cartwright, J.A., Stoker, M.S., Turner, J.P., and White, N., eds., Exhumation of the north Atlantic margin—Timing, mechanisms and implications for petroleum exploration: Geological Society of London Special Publications 196, p. 433–446, accessed June 8, 2022, at https://doi.org/10.1144/GSL.SP.2002.196.01.23.
Pindell, J.L., 1985, Alleghenian reconstruction and subsequent evolution of the Gulf of Mexico, Bahamas, and Proto-Caribbean: Tectonics, v. 4, no. 1, p. 1–39, accessed June 6, 2023, at https://doi.org/10.1029/TC004i001p00001.
Pindell, J.L., and Kennan, L., 2009, Tectonic evolution of the Gulf of Mexico, Caribbean and northern South America in the mantle reference frame: an update, in James, K.H., Lorente, M.A., and Pindell, J.L., eds., The origin and evolution of the Caribbean Plate: Geological Society of London Special Publications 328, p. 1–55, accessed June 6, 2023, at https://doi.org/10.1144/sp328.1.
Pindell, J., Webber, B., Hale-Erlich, W., Cossey, S., Bitter, M., Molina Garza, R., Graham, R., and Erlich, R.N., 2021, Strontium isotope dating of evaporites and the breakup of the Gulf of Mexico and Proto-Caribbean Seaway, in Martens, U.C., and Molina Garza, R.S., eds., Southern and Central Mexico: Basement framework, tectonic evolution, and provenance of Mesozoic–Cenozoic basins: Geological Society of America Special Paper 546, p. 309–329, accessed June 6, 2023, at https://doi.org/10.1130/2020.2546(12).
Rose, P.R., 1972, Edwards Group, surface and subsurface, central Texas: The University of Texas at Austin, Bureau of Economic Geology, Report of Investigations 74, 198 p., accessed April 10, 2019, at https://repositories.lib.utexas.edu/handle/2152/77971.
Rose, P.R., 1986, Oil and gas occurrence in Lower Cretaceous rocks, Maverick Basin area, southwest Texas, in Stapp, W.L., ed., Contributions to the Geology of South Texas, 1986: San Antonio, Tex., South Texas Geological Society, p. 408–421, accessed April 21, 2019, at https://archives.datapages.com/data/south-texas-geosoc-specpubs/data/010/010001/408_stb-sp0100408.htm.
Rose, P.R., 2016, Late Cretaceous and Tertiary burial history, central Texas: Gulf Coast Association of Geological Societies Journal, v. 5, p. 141–179, accessed May 12, 2020, at https://archives.datapages.com/data/gcags-journal/data/005/005001/pdfs/141.htm.
Salvador, A., 1987, Late Triassic–Jurassic paleogeography and origin of Gulf of Mexico Basin: AAPG Bulletin, v. 71, no. 4, p. 419–451, accessed November 20, 2019, at https://doi.org/10.1306/94886EC5-1704-11D7-8645000102C1865D.
Salvador, A., 1991, Triassic−Jurassic, in Salvador, A., ed., The Gulf of Mexico Basin, v. J of The geology of North America: Boulder, Colo., Geological Society of America, p. 131–180. [Also available at https://pubs.geoscienceworld.org/gsa/books/book/913/The-Gulf-of-Mexico-Basin.]
Sasser, M.S., Jr., 2016, Structural style and tectonic evolution of the northern Maverick basin: College Station, Tex., Texas A&M University, Master's thesis, 93 p., accessed January 28, 2021, at https://oaktrust.library.tamu.edu/handle/1969.1/156800.
Scott, R.J., 2004, The Maverick Basin—New technology—New success: Transactions—Gulf Coast Association of Geological Societies, v. 54, p. 603–620, accessed September 13, 2020, at https://archives.datapages.com/data/gcags/data/054/054001/603.htm.
Snedden, J., and Galloway, W., 2019, The Gulf of Mexico sedimentary basin—Depositional evolution and petroleum applications: Cambridge, Cambridge University Press, 291 p. [Also available at https://doi.org/10.1017/9781108292795.]
Stoeser, D.B., Shock, N., Green, G.N., Dumonceaux, G.M., and Heran, W.D., 2005, Geologic map database of Texas: U.S. Geological Survey Data Series 170, 7 p., includes ArcInfo and metadata for Digital Map of Texas database, accessed March 5, 2018, at https://doi.org/10.3133/ds170.
Stolper, D.A., Martini, A.M., Clog, M., Douglas, P.M., Shusta, S.S., Valentine, D.L., Sessions, A.L., and Eiler, J.M., 2015, Distinguishing and understanding thermogenic and biogenic sources of methane using multiply substituted isotopologues: Geochimica et Cosmochimica Acta, v. 161, p. 219–247, accessed June 16, 2023, at https://doi.org/10.1016/j.gca.2015.04.015.
Todd, R.G., and Mitchum, R.M., Jr., 1977, Seismic stratigraphy and global changes of sea level, part 8—Identification of Upper Triassic, Jurassic, and Lower Cretaceous seismic sequences in Gulf of Mexico and offshore west Africa, in Payton, C.E., ed., Seismic stratigraphy—Applications to hydrocarbon exploration: American Association of Petroleum Geologists Memoir 26, p. 145–163, accessed December 6, 2019, at https://doi.org/10.1306/M26490C10.
Tyler, N., and Ambrose, W.A., 1986, Depositional systems and oil and gas plays in the Cretaceous Olmos Formation, south Texas: University of Texas at Austin, Bureau of Economic Geology, Report of Investigations 152, 42 p., accessed February 7, 2019, at https://www.researchgate.net/publication/236481477_Depositional_systems_and_oil_and_gas_plays_in_the_Cretaceous_Olmos_Formation_South_Texas.
U.S. Energy Information Administration, 2021, Natural gas explained—Where our natural gas comes from: U.S. Energy Information Administration web page, accessed January 25, 2021, at https://www.eia.gov/energyexplained/natural-gas/where-our-natural-gas-comes-from.php.
Weise, B.R., 1980, Wave-dominated delta systems of the Upper Cretaceous San Miguel Formation, Maverick Basin, south Texas: The University of Texas at Austin, Bureau of Economic Geology, Report of Investigations 107, 39 p., accessed August 12, 2019, at https://repositories.lib.utexas.edu/handle/2152/20430.
Wilson, J.L., 1975, Carbonate facies in geologic history: New York, Springer-Verlag, 471 p., accessed May 8, 2019, at https://doi.org/10.1007/978-1-4612-6383-8.
Winker, C.D., and Buffler, R.T., 1988, Paleogeographic evolution of early deep-water Gulf of Mexico and margins, Jurassic to Middle Cretaceous (Comanchean): AAPG Bulletin, v. 72, no. 3, p. 318–346, accessed October 12, 2019, at https://doi.org/10.1306/703C8C22-1707-11D7-8645000102C1865D.
Winterer, E.L., 1991, The Tethyan Pacific during Late Jurassic and Cretaceous times: Palaeogeography, Palaeoclimatology, Palaeoecology, v. 87, nos. 1–4, p. 253–265, accessed June 13, 2023, at https://doi.org/10.1016/0031-0182(91)90138-H.
Zahm, L.C., Kerans, C., and Wilson, J.L., 1995, Cyclostratigraphic and ichnofacies analysis of the upper Albian Salmon Peak Formation, Maverick: Transactions—Gulf Coast Association of Geological Societies, v. 45, p. 595–604, accessed July 9, 2020, at https://archives.datapages.com/data/gcags/data/045/045001/0595.htm.
Zhao, H., Liu, C., Larson, T.E., McGovern, G.P., and Horita, J., 2020, Bulk and position-specific isotope geochemistry of natural gases from the Late Cretaceous Eagle Ford Shale, south Texas: Marine and Petroleum Geology, v. 122, article 104659, 11 p., accessed January 21, 2020, at https://doi.org/10.1016/j.marpetgeo.2020.104659.
Zumberge, J., Illich, H., and Waite, L., 2016, Petroleum geochemistry of the Cenomanian–Turonian Eagle Ford oils of south Texas, in Breyer, J.A., ed., The Eagle Ford Shale—A renaissance in U.S. oil production: American Association of Petroleum Geologists Memoir 110, p. 135–165, accessed June 13, 2023, at https://doi.org/10.1306/13541960M110449.
Disclaimers
Any use of trade, firm, or product names is for descriptive purposes only and does not imply endorsement by the U.S. Government.
Although this information product, for the most part, is in the public domain, it also may contain copyrighted materials as noted in the text. Permission to reproduce copyrighted items must be secured from the copyright owner.
Suggested Citation
Doolan, C.A., Craddock, W.H., Buursink, M.L., Hatcherian, J.J., and Cahan, S.M., 2024, Spatial distribution of API gravity and gas/oil ratios for petroleum accumulations in Upper Cretaceous strata of the San Miguel, Olmos, and Escondido Formations of the south Texas Maverick Basin—Implications for petroleum migration and charge history: U.S. Geological Survey Scientific Investigations Report 2023–5124, 24 p., https://doi.org/10.3133/sir20235124.
ISSN: 2328-0328 (online)
Study Area
| Publication type | Report |
|---|---|
| Publication Subtype | USGS Numbered Series |
| Title | Spatial distribution of API gravity and gas/oil ratios for petroleum accumulations in Upper Cretaceous strata of the San Miguel, Olmos, and Escondido Formations of the south Texas Maverick Basin—Implications for petroleum migration and charge history |
| Series title | Scientific Investigations Report |
| Series number | 2023-5124 |
| DOI | 10.3133/sir20235124 |
| Publication Date | March 26, 2024 |
| Year Published | 2024 |
| Language | English |
| Publisher | U.S. Geological Survey |
| Publisher location | Reston, VA |
| Contributing office(s) | Eastern Energy Resources Science Center, Geology, Energy & Minerals Science Center |
| Description | iv, 24 p. |
| Country | United States |
| State | Texas |
| Other Geospatial | Maverick Basin |
| Online Only (Y/N) | Y |
| Additional Online Files (Y/N) | N |