

Flood of October 31 to November 3, 2019, in the East Canada Creek, West Canada Creek, and Sacandaga River Basins in Central New York
Links
- Document: Report (10.9 MB pdf) , HTML , XML
- Data Release: USGS data release - Flood-frequency data for six selected streamgages following the central New York flood of October 31–November 3, 2019
- NGMDB Index Page: National Geologic Map Database Index Page (html)
- Download citation as: RIS | Dublin Core
Acknowledgments
Thanks are extended to the New York State Department of Conservation for their cooperation with the U.S. Geological Survey in completion of this study. The authors would like to acknowledge the Community Collaborative Rain, Hail & Snow Network; the National Oceanic and Atmospheric Administration, including the National Weather Service; the New York State Mesonet; and the Northeast Regional Climate Center for providing data included in this report.
Thanks are also extended to all the U.S. Geological Survey hydrologists and hydrologic technicians who made tireless efforts during and after the floods in collecting and analyzing the data for this report. The authors would also like to acknowledge Thomas P. Suro, Jeffrey T. Cordova, and Gardner C. Bent of the U.S. Geological Survey for their detailed technical reviews of the report and Lana Henry, Emerson Dyas, and Anna Glover for their thorough editorial review of the report.
Abstract
Between October 31 and November 3, 2019, historic flooding in localized areas of the Mohawk Valley and southern Adirondack region in central New York State resulted in one fatality and an estimated $33 million in damages. Flooding resulted from high-intensity, hyperlocal rainfall in the region within a 24-hour period between October 31 and November 1, 2019, at the end of a much wetter than average October. In that 24-hour period, rainfall amounts largely ranged from 2 to 5 inches in the most heavily affected parts of the region, but a maximum rainfall amount for the region of 7 inches was recorded in Speculator, New York. This rainfall total for a 24-hour period for this location is estimated to have between a 200- and 500-year recurrence interval. The most severe flooding to result from the rainfall was mainly in the Sacandaga River basin, which is within the upper Hudson River basin, and in the East and West Canada Creek basins, which are within the Mohawk River basin.
Streamflow, stage, and reservoir elevation data, collected by the U.S. Geological Survey, are documented in this report. Flooding resulted in new peak streamflow records at five of six U.S. Geological Survey streamgages in the region that have periods of record of at least 20 years, including at three streamgages that have been in operation for about 100 years. At the sixth streamgage, this flooding resulted in the second highest peak streamflow in its 71-year period of record. For all six streamgages, estimates of flood magnitudes for selected annual exceedance probabilities were updated using the peak streamflows from the flooding. Additionally, the annual exceedance probabilities for the six respective peak streamflows were all estimated to be less than 1 percent (greater than a 100-year recurrence interval). At three of those six streamgages, however, previous annual peak streamflows of comparable magnitudes (within 10 percent) have also happened within the past 20 years.
Introduction
There was historic flooding in localized areas of the Mohawk Valley and southern Adirondack region in central New York State between October 31 and November 3, 2019 (fig. 1). The floods resulted in at least one fatality (Masters, 2019) and caused an estimated $33 million in damages to public infrastructure; 18 homes were destroyed, and 135 homes sustained major damage (New York State Governor’s Office, 2019a). Because of extensive damages, New York State Governor Andrew Cuomo declared a state of emergency for Cayuga, Chautauqua, Cortland, Dutchess, Erie, Essex, Hamilton, Herkimer, Jefferson, Montgomery, Oneida, Saratoga, and Warren Counties on November 1, 2019 (New York State Governor’s Office, 2019b).
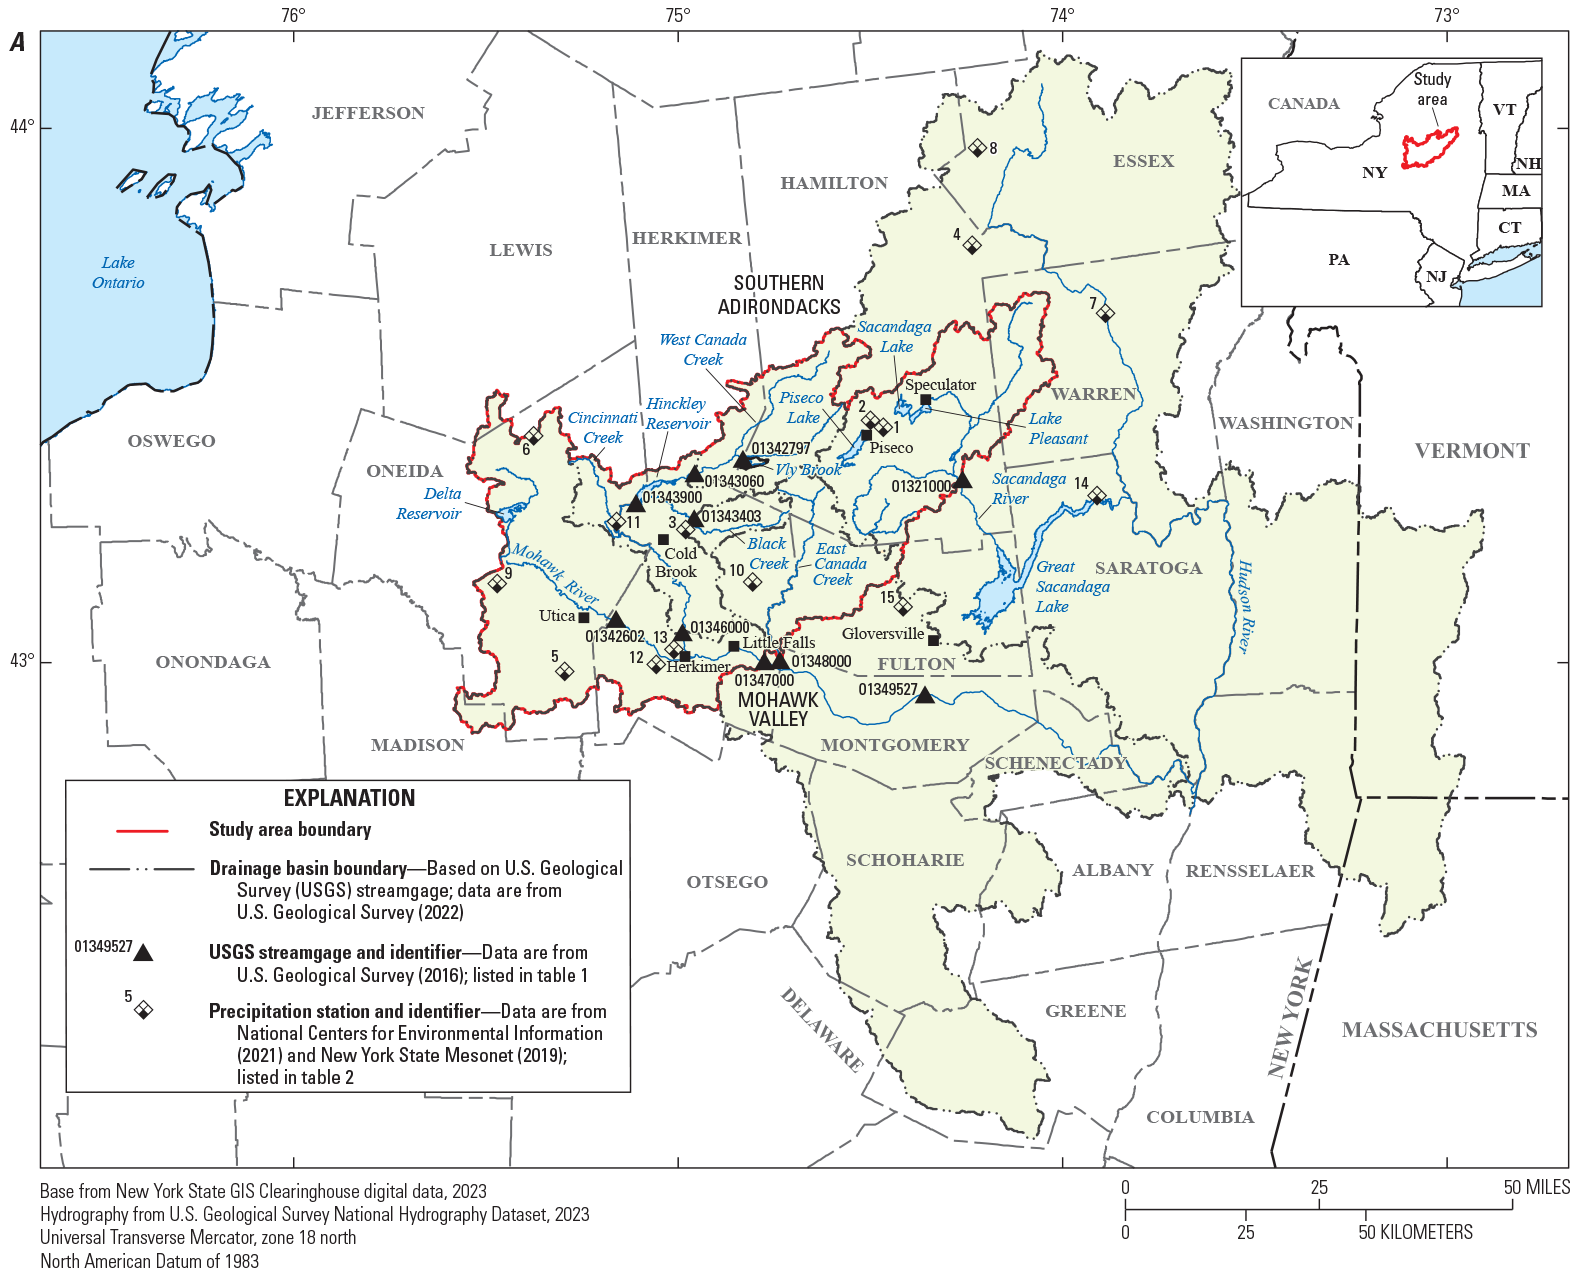
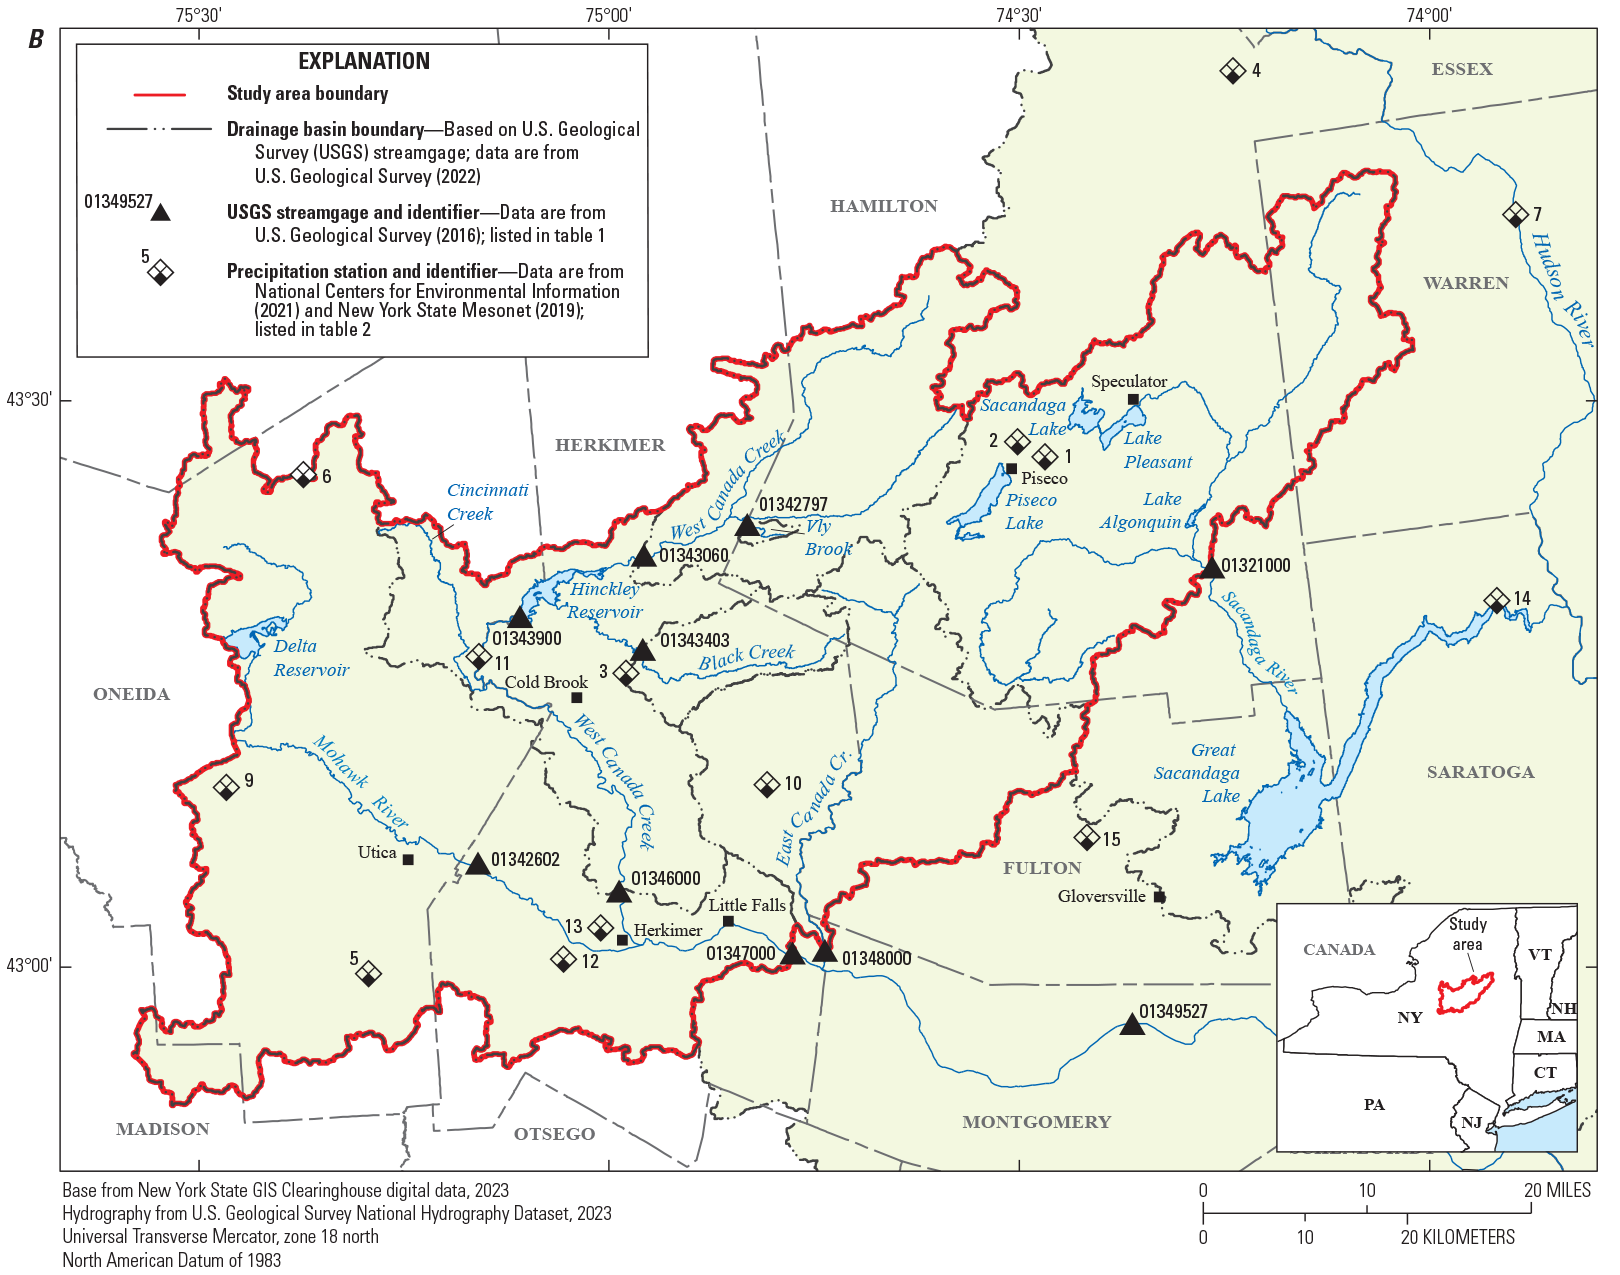
Maps showing the location of the study area, streamgages, reservoir elevation station, and precipitation stations in New York State. A, Greater Mohawk and Hudson River basins and B, Mohawk Valley and southern Adirondack Mountain region.
The flooding resulted from high-intensity, hyperlocal rainfall in the region within a 24-hour period between October 31 and November 1, 2019, at the end of a much wetter than average October. In that 24-hour period, the largest concentration of heavy rainfall (totals ranging from 2 to 5 inches [in.]) and the highest rainfall totals (ranging from 5 to 7 in.) for the region were recorded in parts of Hamilton and Herkimer Counties (National Weather Service, 2019a, c, e). The Sacandaga River basin (in the upper Hudson River basin) and the East and West Canada Creek basins (in the Mohawk River basin) experienced the most severe flooding compared with other gaged river basins in the Mohawk Valley and southern Adirondack region.
The Mohawk Valley and southern Adirondack region have experienced major floods in the past. Early examples include a flood on the Mohawk River on October 8, 1903, which was similar to the flood of October 31 to November 3, 2019, in that it was caused by a rainstorm that produced more than 5 in. of rain within a 24-hour period (Scheller and others, 2008), and a widespread flood from March 23 to March 27, 1913, that resulted from heavy rainfall over the central and eastern United States (Silver Jackets, 2013). Additionally, from September 21 to 22, 1938, a tropical hurricane that brought heavy winds and torrential downpours to the region caused flooding in the Mohawk Valley, and the overflow of local creeks led to widespread damage (Scheller and others, 2008).
More recently, on January 19 and 20, 1996, air temperatures reached abnormal highs above 60 degrees Fahrenheit (°F) in parts of the Mohawk Valley, and these high temperatures, in combination with heavy rainfall, led to rapid snowmelt and rainfall driven floods, which caused widespread damage and resulted in 10 fatalities statewide, including 3 fatalities in the eastern Mohawk Valley (Lumia, 1998; Scheller and others, 2008). The Mohawk Valley was also affected by major flooding from the storm of June 26–29, 2006, which resulted from a stalled frontal system that caused tropical moisture to be funneled northward into New York, New Jersey, and Pennsylvania (Suro and others, 2009).
The Mohawk Valley and southern Adirondack region also experienced major floods in the 10 years before the flood of October 31 to November 3, 2019. For example, 2011 was an unusually wet year for New York State, and three major floods (in late April, late August, and early September) resulted in record streamflows and widespread damage throughout the State (Lumia and others, 2014). On June 28, 2013, heavy rainfall caused flooding in the Mohawk Valley, which damaged homes, destroyed infrastructure, and resulted in multiple road closures (Munger, 2013). Heavy rainfall resulting from showers and thunderstorms also affected the Mohawk Valley between June 30 and July 2, 2017 (National Weather Service, 2017a, b). Rainfall in Utica, N.Y., measured 4 in. (National Weather Service, 2017b), and floodwaters from the storm forced road closures in the region, caused damage to homes and infrastructure, and led to the declaration of a state of emergency in the village of Herkimer (Thompson, 2017).
Purpose and Scope
The U.S. Geological Survey (USGS) initiated this study in cooperation with the New York State Department of Environmental Conservation to document the historic flood of October 31 to November 3, 2019, characterize the extreme nature of the flood, and support future flood-mitigation strategies. Information about the flood that is documented in this report, includes rainfall, streamflow, and reservoir elevation data from the Mohawk Valley and southern Adirondack region of New York State (fig. 1), as well as peak stage and streamflow data from nine USGS streamgages and peak reservoir elevation data from one USGS reservoir elevation station in the region. Six of the nine USGS streamgages had records of at least 10 annual peak streamflows, and for those streamgages, flood frequency was analyzed. The updated flood-frequency statistics for those six selected USGS streamgages are published in Graziano and others (2024) and analyzed in this report. Peak of record streamflows were recorded at five of the six selected USGS streamgages, and three of those streamgages have periods of record of around 100 years.
Study Area
The streamflow and reservoir-elevation data presented in this report are from a total of 10 USGS gaging stations (9 streamgages and 1 reservoir elevation station) in the Mohawk River and Sacandaga River basins in the Mohawk Valley and southern Adirondack region in New York State (fig. 1; table 1). The Mohawk River is the largest tributary to the Hudson River and has a total drainage area of 3,460 square miles (mi2). Major tributaries to the Mohawk River include East and West Canada Creeks, which were severely affected by the flood of October 31 to November 3, 2019, and are a major focus of this report. East and West Canada Creeks drain large areas of the Mohawk Valley and southern Adirondack Mountains into the Mohawk River from the north (fig. 1). The Sacandaga River is part of the upper Hudson River basin and drains eastern parts of the southern Adirondack Mountains. The major flooding of October 31 to November 3, 2019, was in the upper Sacandaga River basin, upstream from Great Sacandaga Lake. Land-surface elevations in the study area range from about 3,600 feet (ft) in the southern Adirondack Mountains to about 300 ft in the Mohawk Valley. Land cover in the southern Adirondack Mountains is primarily undeveloped forest (Dewitz, 2023). Land cover in the Mohawk Valley is generally a mix of forest, agriculture, and urban.
Table 1.
Peak stage and streamflow, from the flood of October 31 to November 3, 2019, at selected streamgages in the Mohawk Valley and southern Adirondack region of New York State.[Station and streamflow data are from U.S. Geological Survey (2016); National Weather Service flood stage data are from National Weather Service (2019a). The period of record is given in water years, which is the period from October 1 to September 30 and is identified by the year in which the period ends. Number of annual peak streamflows in record used for rank comparison includes the 2020 water year peak associated with the flood of October 31 to November 3, 2019. USGS, U.S. Geological Survey; mi2, square mile; ft, foot; ft3/s, cubic foot per second; (ft3/s)/mi2, cubic foot per second per square mile; e, estimated; NA, not applicable; —, data not available]
Previous peak streamflow and associated peak stage from nonrecording gage at site 300 ft upstream at same vertical datum. Maximum stage is 13.32 ft from the March 1, 1955, ice jam. Flood stage data are from National Weather Service (2019f).
Reservoir formed by earth and concrete dam; storage began March 1914. Crest of ogee spillway is at elevation 1,223.64 ft above the North American Vertical Datum of 1988 (NAVD 88) and 1,225.0 ft above Barge Canal Datum (BCD). Flood stage data are from National Weather Service (2019g).
Since March 1914, streamflow regulated by Hinckley Reservoir, 31 miles upstream from station. Flood stage data are from National Weather Service (2019h).
Streamflow affected by diversions and regulation, including by Hinckley Reservoir (since March 1914), 46 miles upstream from station. Flood stage data are from National Weather Service (2019d).
Six of the nine streamgages in the study area were selected for flood-frequency analysis, and five of those six selected streamgages are in the Mohawk River basin. Those five streamgages are Vly Brook near Morehouseville, N.Y. (01342797), West Canada Creek near Wilmurt, N.Y. (01343060), West Canada Creek at Kast Bridge, N.Y. (01346000), Mohawk River near Little Falls, N.Y. (01347000), and East Canada Creek at East Creek, N.Y. (01348000; fig. 1; table 1). Drainage areas for those streamgages range from 3.28 mi2 (Vly Brook) to 1,342 mi2 (Little Falls; table 1). Streamflow in West Canada Creek is regulated by the Hinckley Reservoir, which is upstream from two of the six selected streamgages in the Mohawk River basin (Kast Bridge and Little Falls; fig. 1). The sixth streamgage selected for flood-frequency analysis, Sacandaga River near Hope, N.Y. (01321000), is in the Sacandaga River basin above Great Sacandaga Lake, has a drainage area of 491 mi2 (table 1), and streamflow is not considered to be substantially affected by regulation. With the exception of the Vly Brook streamgage, streamflow data were continuously recorded at 15-minute intervals at all the streamgages included in this report. At the Vly Brook streamgage, only the annual peak streamflows were recorded by using a crest-stage gage.
The other four stations from which data are presented in this report are the Mohawk River near Utica, N.Y. (01342602), Black Creek near Gray, N.Y. (01343403), and Mohawk River above State Highway 30A at Fonda, N.Y. (01349527) streamgages, and the Hinckley Reservoir at Hinckley, N.Y. (01343900) reservoir elevation station (fig. 1; table 1). These stations are in the Mohawk River basin and were also affected by the flood of October 31 to November 3, 2019. However, the three streamgages (Utica, Black Creek, and Fonda) have periods of record of less than 10 years and were therefore not included in the flood-frequency analyses.
Antecedent Conditions
Before the flood of October 31 to November 3, 2019, New York State had experienced an unusually wet October. The National Oceanic and Atmospheric Administration (NOAA) reported October 2019 precipitation as “much above average”, and on a scale from 1 to 125, where 1 is the driest October on record and 125 is the wettest October on record (for New York State for the period of record from 1895 to 2019), October 2019 ranked as number 119 (fig. 2; National Centers for Environmental Information, 2019). For the Mohawk Valley and southern Adirondack region of New York State, precipitation in October 2019 mainly ranged from 200 to 300 percent of normal (fig. 3; National Weather Service, 2019a).
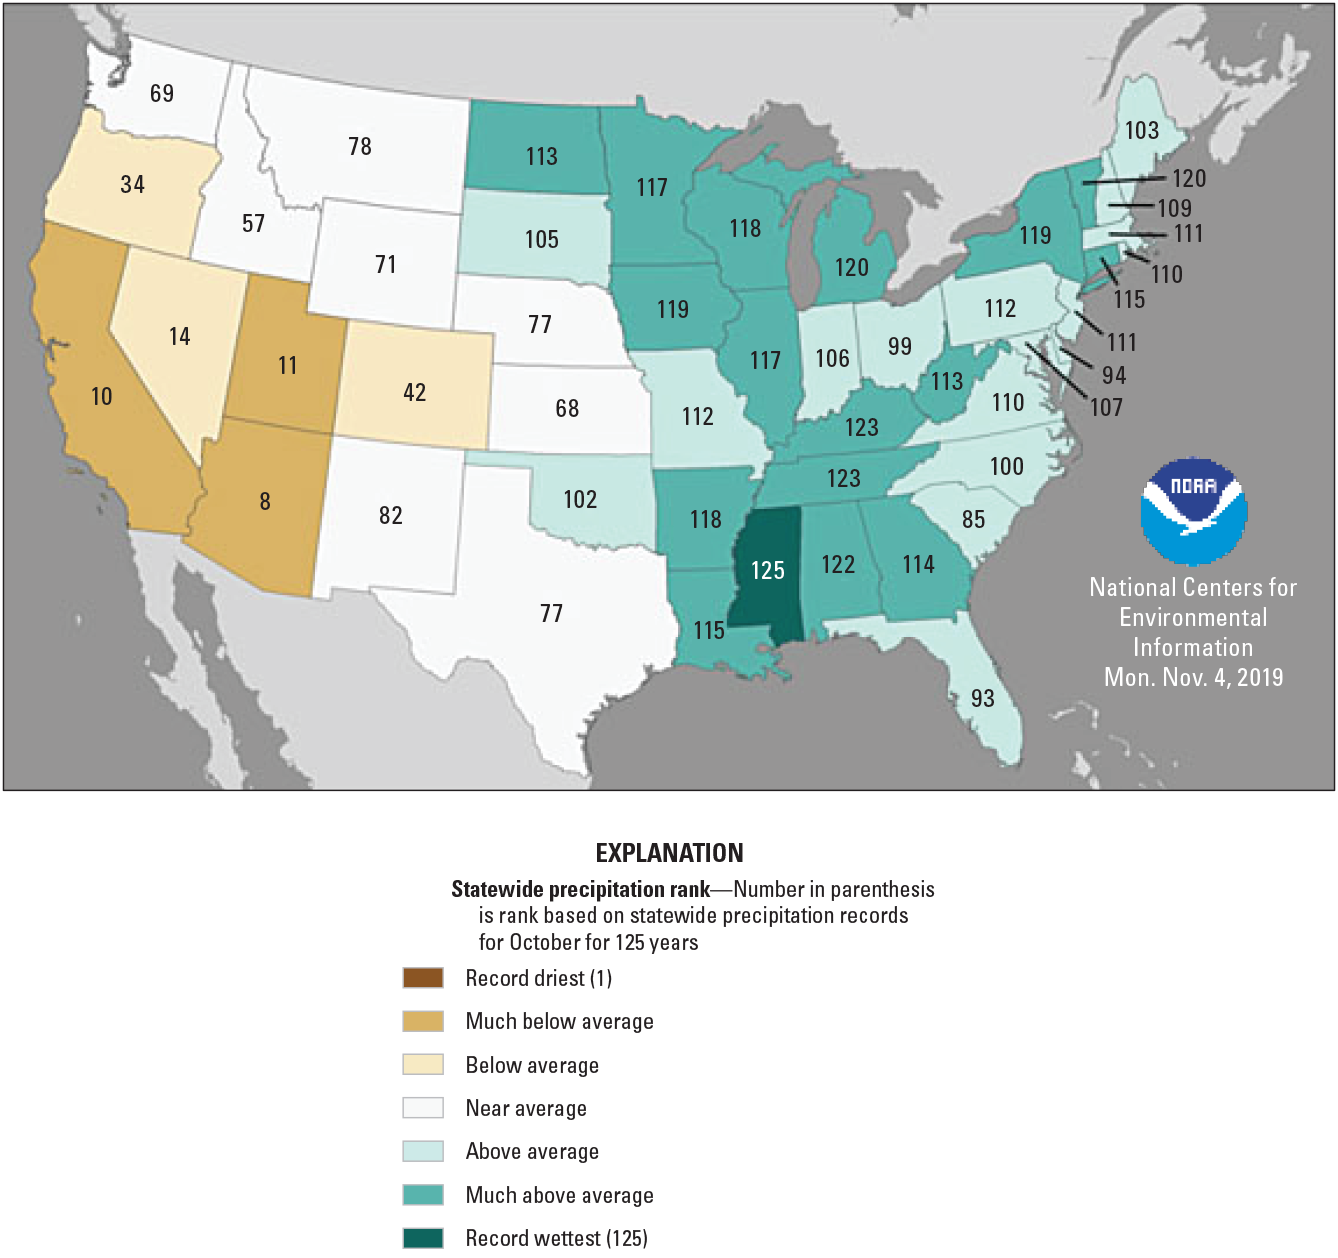
Screen capture of map showing statewide precipitation ranks for October 2019 for the United States; from National Centers for Environmental Information (2019). New York State October 2019 precipitation is ranked 119th out of the past 125 years (1895–2019) and is categorized as “much above average”.
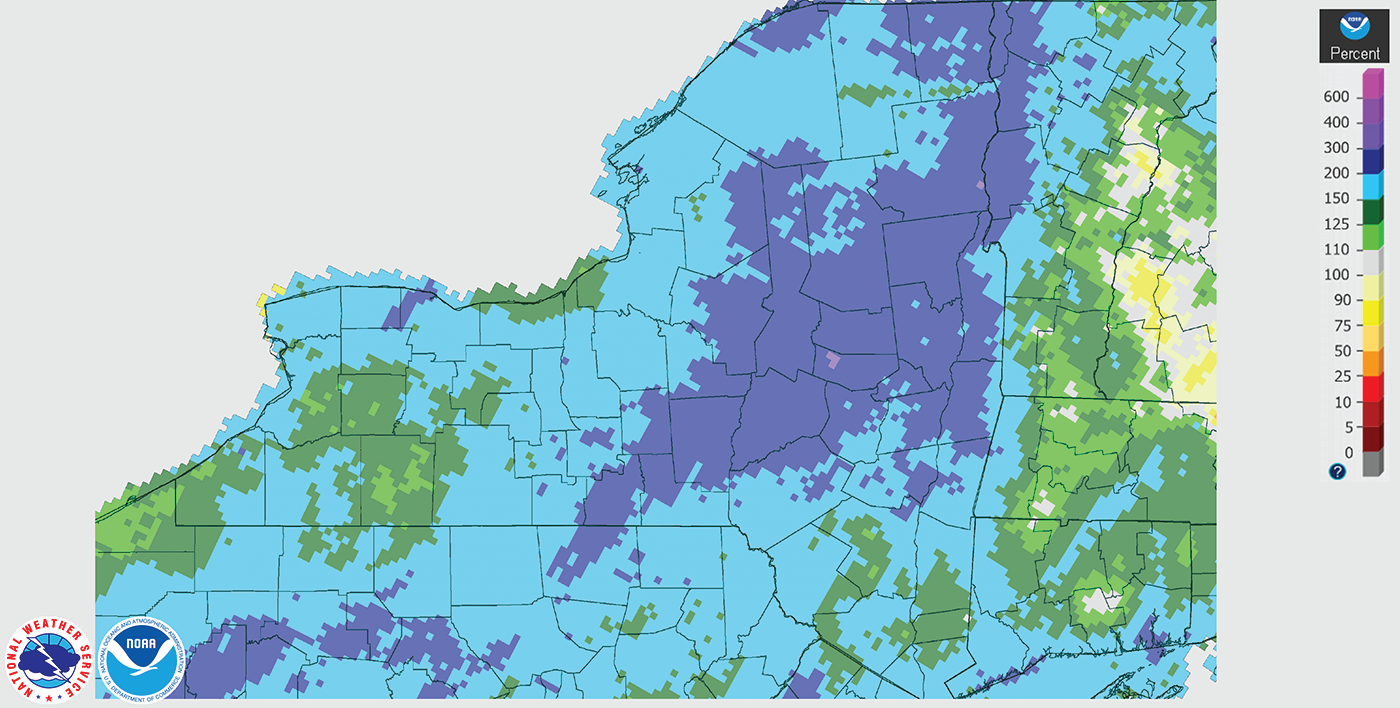
Screen capture of map showing October 2019 monthly percent of normal precipitation for New York State, based on 30-year normals from 1981 to 2010; from National Weather Service (2019a).
The much above average precipitation in October 2019 caused streamflows in the study area to be greater than the 75th percentile daily mean streamflow at the five streamgages shown in figure 4, for most of the period from October 15, 2019, to the beginning of the storm on October 31, 2019. Additionally, on October 17, 2019, rainfall produced the highest daily mean streamflow ever recorded at each of the five streamgages for that date. The above average streamflow conditions and much above average precipitation during October 2019 indicated that soil moisture in the study area was likely above average as well. Therefore, conditions in the study area before the rainfall of October 31 to November 1, 2019, likely contributed to the high streamflows during the storm.
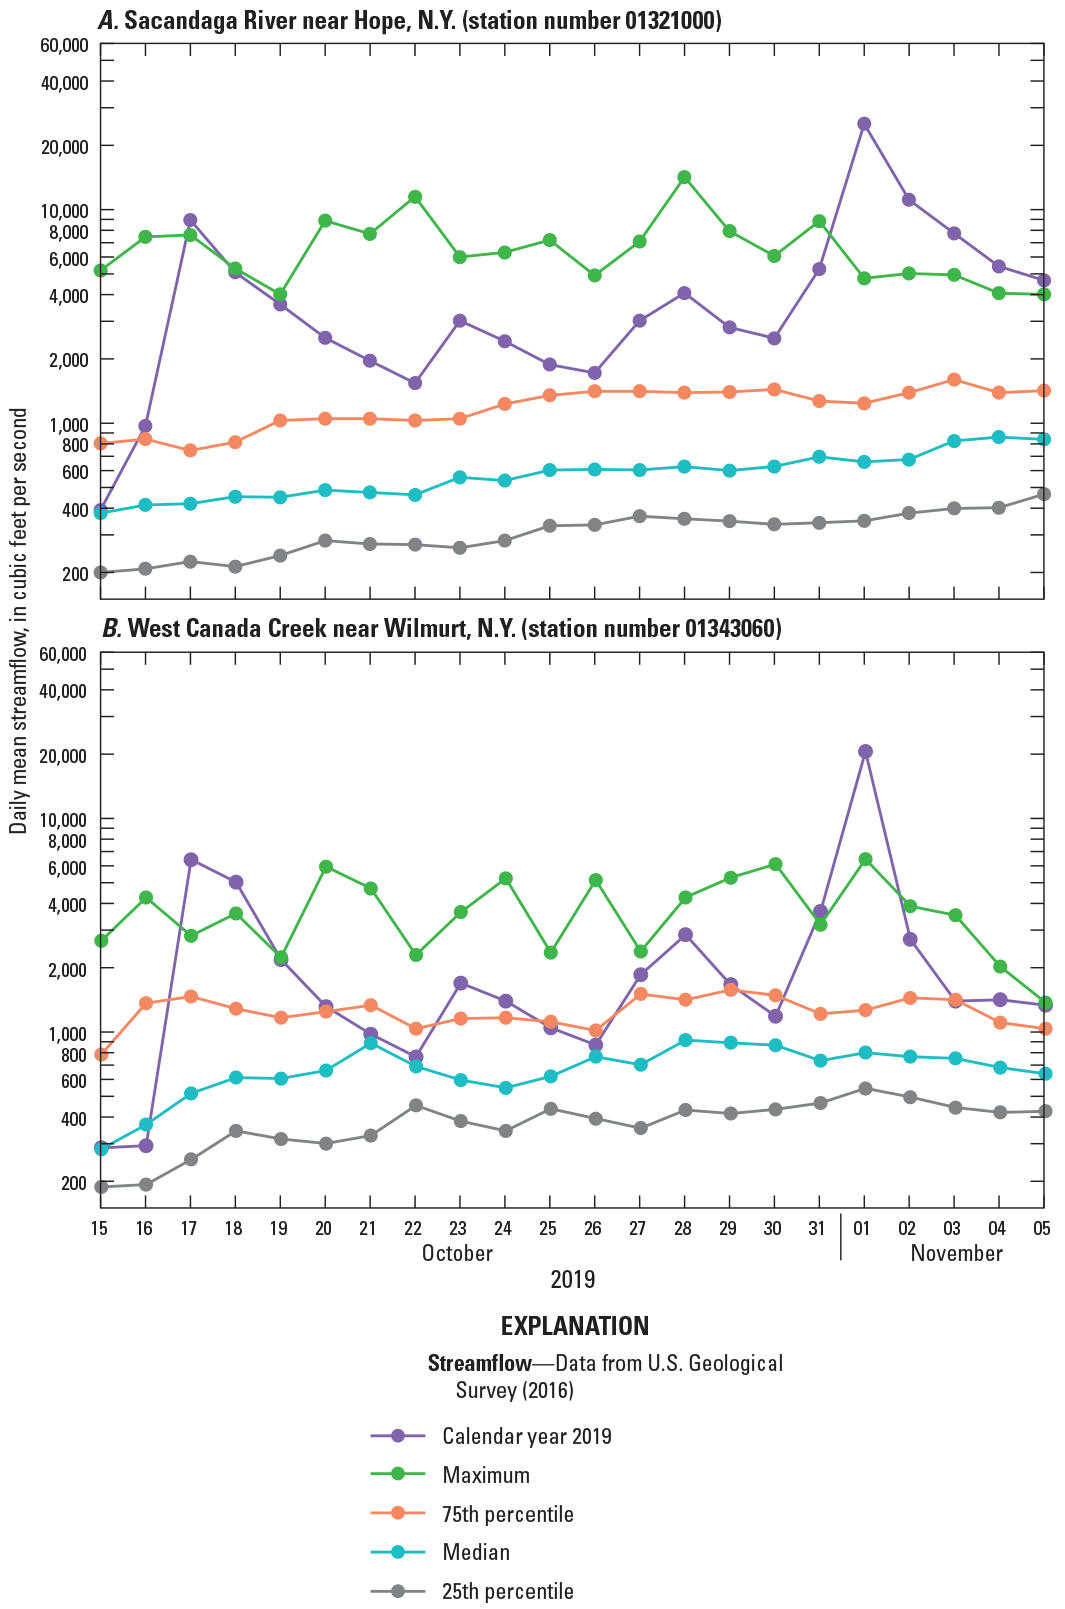
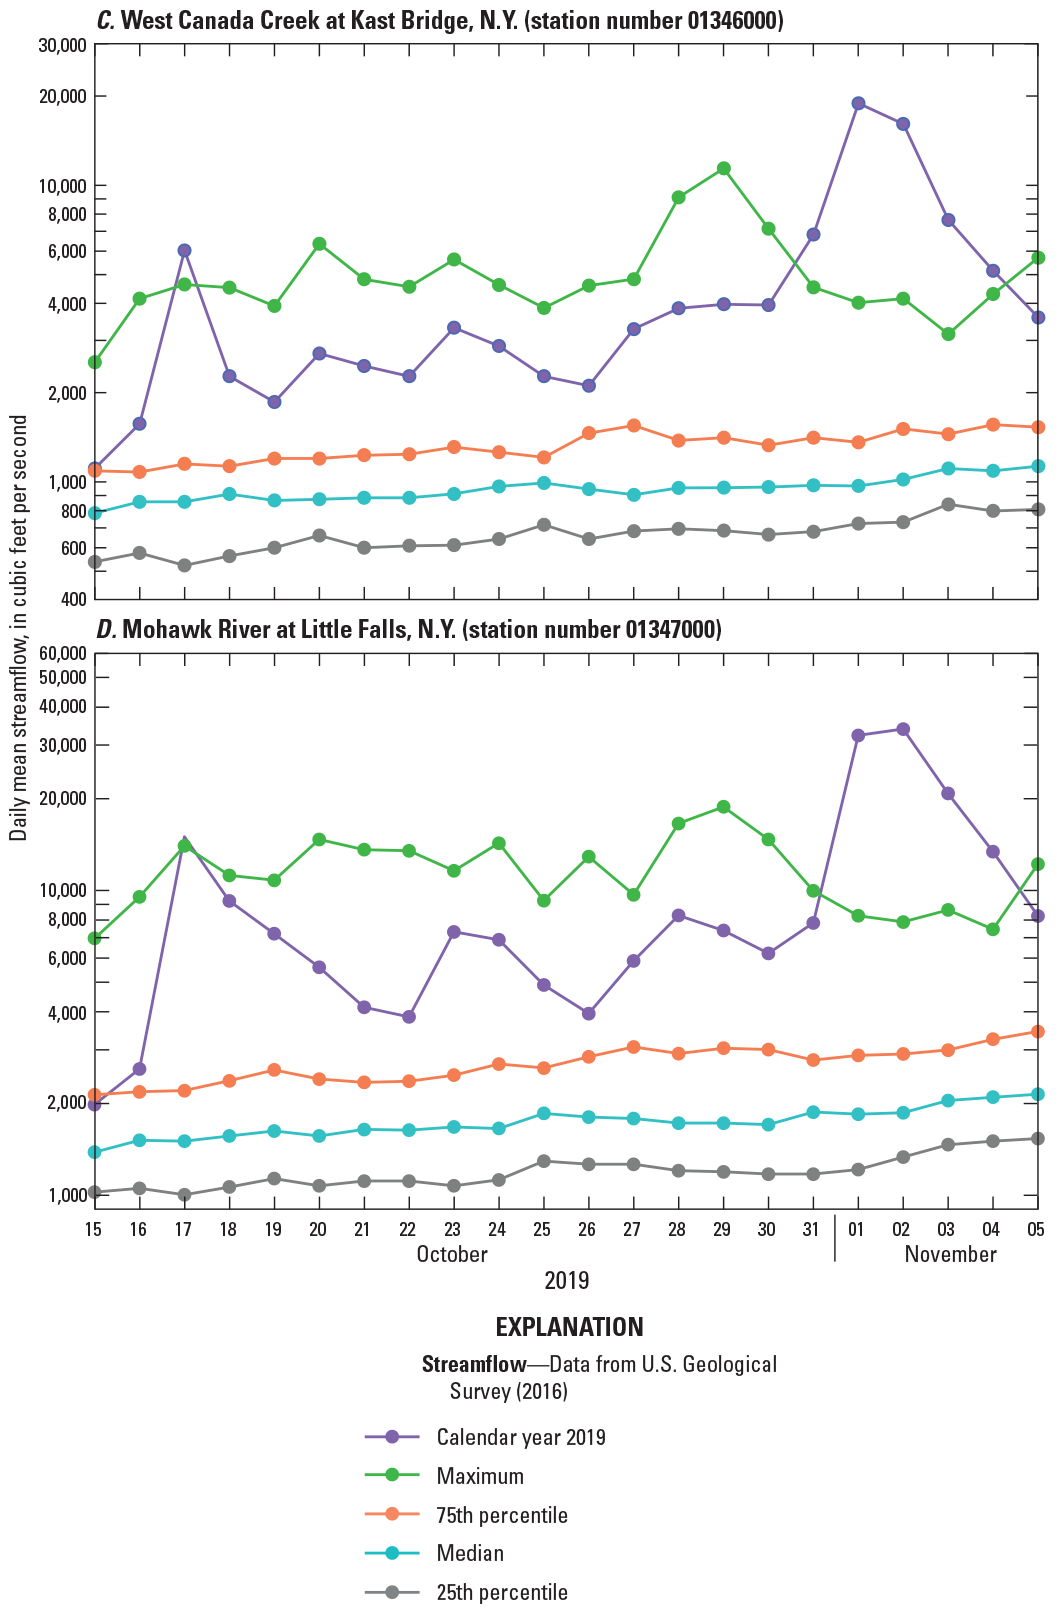
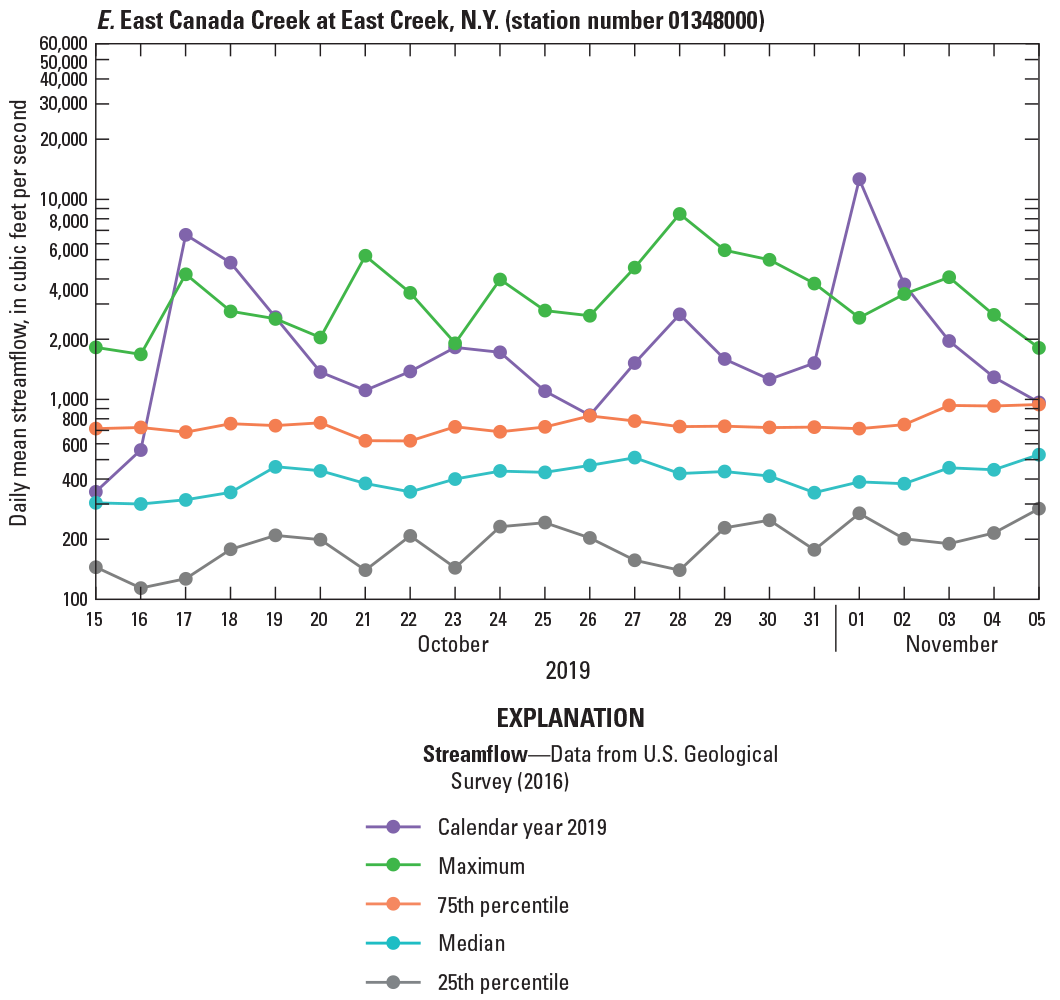
Graphs showing daily mean streamflow from October 15 to November 5, 2019, and daily statistics from the period of record before calendar year 2019, for five U.S. Geological Survey streamgages in the Mohawk Valley and southern Adirondack region in central New York. A, Sacandaga River near Hope, New York (01321000); B, West Canada Creek near Wilmurt, N.Y. (01343060); C, West Canada Creek at Kast Bridge, N.Y. (01346000); D, Mohawk River near Little Falls, N.Y. (01347000); and E, East Canada Creek at East Creek, N.Y. (01348000).
Precipitation
On October 31, 2019, moisture and warm air temperatures (highs above 60 to 70 °F) were brought north into New York State by a strengthening low-pressure system moving from Ohio to Lake Ontario (National Weather Service, 2019e). At the same time, a cold front moved across New York State, and the conditions resulted in strong winds and heavy rain for the Mohawk Valley and southern Adirondack region between October 31 and November 1, 2019. Most of the rain fell in the region within a 24-hour period between 8:00 a.m. eastern standard time (EST) October 31 and 8:00 a.m. EST November 1, 2019. In that 24-hour period, the largest concentration of heavy rainfall (totals ranging from 2 to 5 in.) and the highest rainfall totals (ranging from 5 to 7 in.) for the region were recorded in parts of the Sacandaga River basin and the East and West Canada Creek basins in Hamilton and Herkimer Counties (figs. 1 and 5; table 2; National Weather Service, 2019c, e).
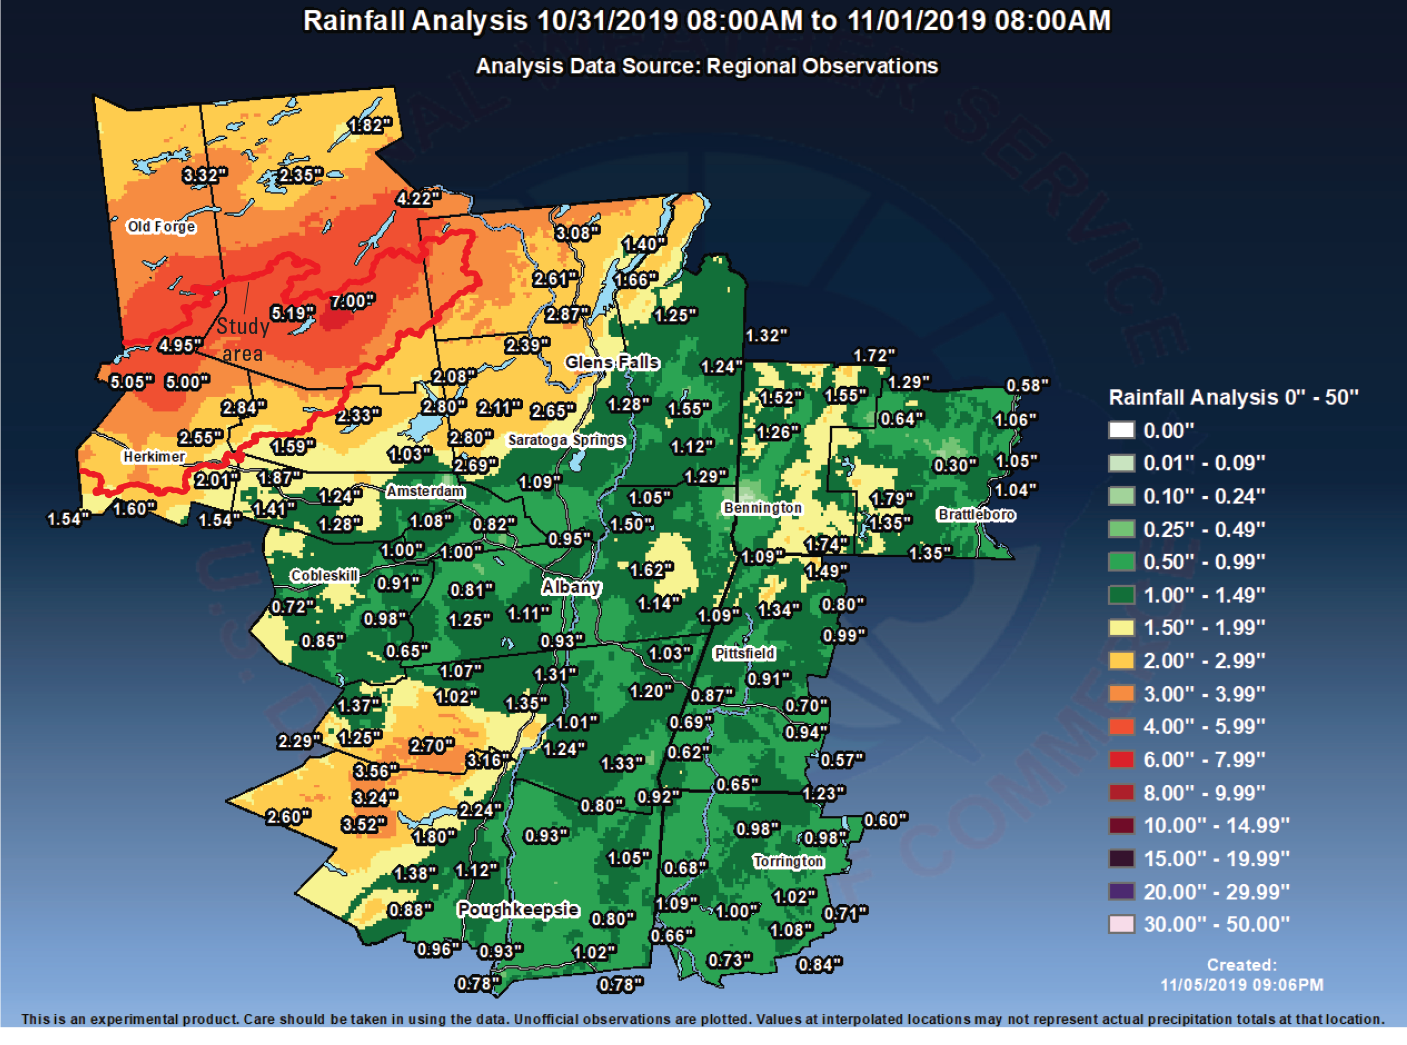
Modified screen capture of map showing rainfall totals for the 24-hour period between October 31, 2019, 8:00 a.m. eastern standard time and November 1, 2019, 8:00 a.m. eastern standard time from precipitation stations in the National Weather Service Albany, New York, region; from National Weather Service (2019e). The screen capture was modified by superimposing the boundary (solid red line) for the part of the study area shown on the map.
Table 2.
Rainfall totals for the 24-hour period between 8:00 a.m. eastern standard time October 31, 2019, and 8:00 a.m. eastern standard time November 1, 2019, from selected precipitation stations in and around the Mohawk Valley and southern Adirondack region in central New York.[Data are from National Weather Service (2019a), Northeast Regional Climate Center (2021b); Colorado Climate Center (2023); and New York State Mesonet (2019), and the 24-hour recurrence intervals for each location are from Northeast Regional Climate Center (2021a)]
| Station identification number (fig. 1) |
Precipitation station name | New York county | 24-hour rainfall total, in inches1 | 24-hour rainfall recurrence interval, in years |
|---|---|---|---|---|
| 1 | Speculator 10.0 SSW | Hamilton | 7.00 | 200–500 |
| 2 | Piseco | Hamilton | 5.19 | 50–100 |
| 3 | Cold Brook | Herkimer | 5.05 | 25–50 |
| 4 | Indian Lake | Hamilton | 4.22 | 25–50 |
| 5 | Sauquoit 1.6 WSW | Oneida | 4.19 | 25–50 |
| 6 | Boonville 4 SSW | Oneida | 3.98 | 10–25 |
| 7 | North Creek 5 SE | Warren | 3.03 | 5–10 |
| 8 | Newcomb | Essex | 2.94 | 5–10 |
| 9 | Westmoreland 4N | Oneida | 2.92 | 2–5 |
| 10 | Salisbury Center 1.8 NW | Herkimer | 2.84 | 2–5 |
| 11 | Trenton Falls | Oneida | 2.80 | 2–5 |
| 12 | Ilion 0.7 WSW | Herkimer | 2.55 | 2–5 |
| 13 | Herkimer | Herkimer | 2.51 | 2–5 |
| 14 | Conklingville Dam | Saratoga | 2.39 | 1–2 |
| 15 | Gloversville 7NW (Peck Lake) | Fulton | 2.33 | 1–2 |
The highest recorded rainfall total for the period between the morning of October 31 and the morning of November 1, 2019, was 7.00 in., which was recorded at a Community Collaborative Rain, Hail & Snow Network precipitation station in Speculator, N.Y. (station 1) in Hamilton County (fig. 1; table 2; National Weather Service, 2019e). The rainfall total of 7.00 in. for a 24-hour period for this location is estimated to have between a 200- and 500-year recurrence interval or between a 0.5- and 0.2-percent chance of happening or being exceeded in any given year (tables 2 and 3; Northeast Regional Climate Center, 2021a).
At most of the other precipitation stations in the affected parts of the Mohawk Valley, southern Adirondack, and surrounding regions, the rainfall totals recorded on November 1, 2019, were between 2 and 5 in., with estimated 24-hour recurrence intervals ranging from 1 year to 50 years for their respective locations (table 2). The wide range in the rainfall totals and 24-hour recurrence intervals demonstrated how localized the rainfall was. For example, there was a substantial difference in rainfall totals recorded in Speculator (7.00 in., station 1) and Gloversville (2.33 in., station 15), even though the Gloversville precipitation station is only about 23 miles (mi) south of the Speculator station (figs. 1 and 5). Because of how localized the rainfall was and because of the limited number of precipitation stations in the study area, it is therefore possible that the maximum rainfall value of the storm was not recorded.
Evaluation of rainfall intensity on a less than 24-hour basis is difficult in the study area because of the limited number of continuously recording precipitation stations. In figure 6, cumulative hourly rainfall data from New York State Mesonet precipitation stations in Hamilton and Herkimer Counties are shown for the 12-hour period from October 31, 2019, at 2:00 p.m. EST to November 1, 2019, at 2:00 a.m. EST (New York State Mesonet, 2019; Brotzge and others, 2020). At the peak of the storm in Cold Brook (station 3; fig. 1), from 6:00 p.m. EST to 9:00 p.m. EST, a total of 3.43 in. fell in 3 hours (fig. 6). This total of 3.43 in. is about 68 percent of the 5.05 in. 24-hour rainfall total reported for Cold Brook (table 2; National Weather Service, 2019e), which was one of the highest rainfall totals reported for the storm. Additionally, based on extreme precipitation estimates for Cold Brook (Northeast Regional Climate Center, 2021a), 3.43 in. falling in 3 hours is estimated to have between a 50- and 100-year recurrence interval. For comparison, the 5.05 in. 24-hour rainfall total from Cold Brook is estimated to have between a 25- and 50-year recurrence interval (table 2). This indicates that, in some of the most heavily affected areas, the rainfall intensity at the peak of the storm may have an even less frequent recurrence interval than the 24-hour rainfall recurrence interval.
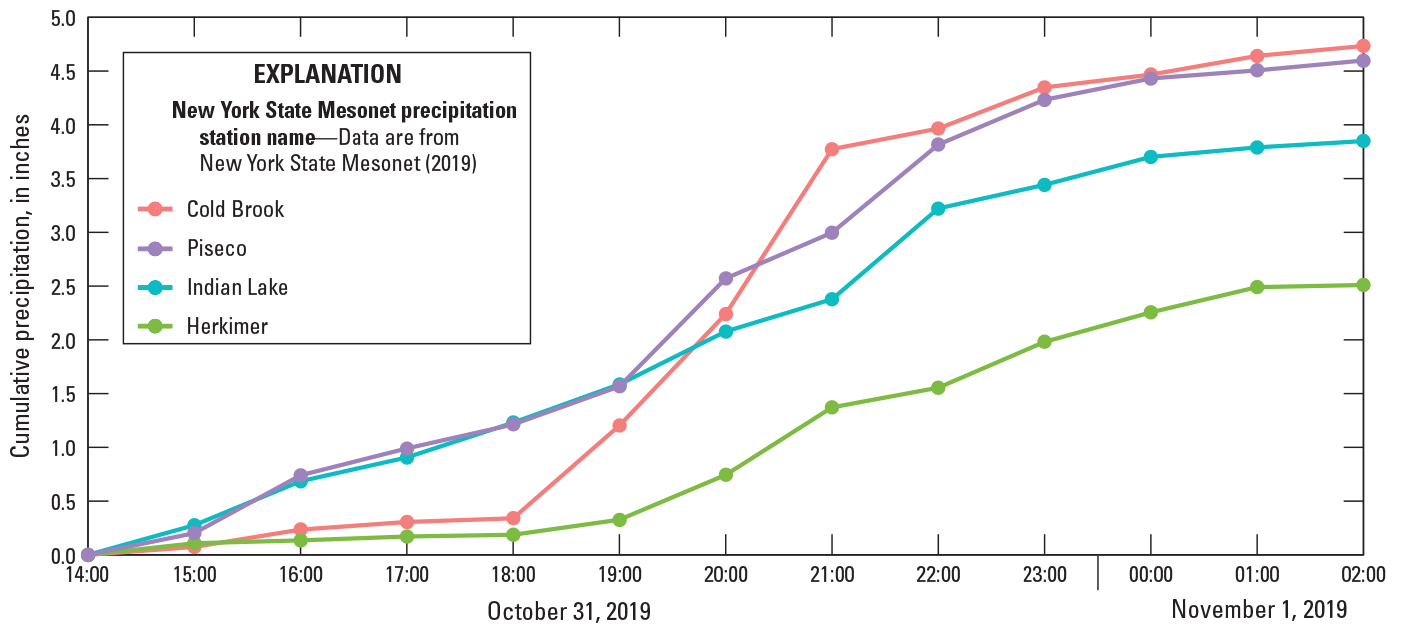
Graph showing cumulative hourly precipitation recorded between October 31, 2019, at 2:00 p.m. eastern standard time and November 1, 2019, at 2:00 a.m. eastern standard time at New York State Mesonet precipitation stations in Hamilton and Herkimer Counties, New York; data are from New York State Mesonet (2019).
However, at the precipitation station in Piseco (station 2), which is only about 2 mi from the station in Speculator (station 1) where the highest 24-hour rainfall total of 7.00 in. was recorded (fig. 1; table 2), from 7:00 p.m. EST to 10:00 p.m. EST, a total of 2.25 in. fell in 3 hours (fig. 6; New York State Mesonet, 2019). Based on extreme precipitation estimates for Piseco (Northeast Regional Climate Center, 2021a), 2.25 in. falling in 3 hours is estimated to have between a 10- and 25-year recurrence interval. For comparison, the 5.19 in. 24-hour rainfall total from Piseco is estimated to have between a 50- and 100-year recurrence interval (table 2).
Methods
For the purposes of this report, streamflow data refer to both stage (or gage height) and volumetric streamflow (streamflow). These data are collected systematically at streamgages. The streamflow data used in this report are from USGS streamgages and are publicly available through the National Water Information System (U.S. Geological Survey, 2016). USGS streamgages operate autonomously by collecting data at some frequency (typically either 5 or 15 minutes) dependent on drainage basin size and concomitant flashiness of the stream. The typical streamgages automatically make observations of stage data. The stage data are collected by using a variety of methods, including float, submersible pressure transducer, nonsubmersible pressure transducer, and noncontact radar (Sauer and Turnipseed, 2010). Additionally, at continuously recording USGS streamgages, automatic observations of annual peak stage must be verified with peak stage measurements from independent sources, such as crest-stage gages, maximum-stage float-tape clips, or high-water marks identified in the vicinity of the gage (U.S. Geological Survey, 2014). USGS streamgages for which only annual peak stage and streamflow data are published are typically operated with crest-stage gages that are periodically visited to check for high-water marks.
Although stage data are important, streamflow is often more important for purposes such as flood forecasting, flood-frequency analysis, flood mitigation planning, determining water-quality loads, low-flow statistical analysis, drought monitoring, and water-supply monitoring. Computation of streamflow from stage data at a streamgage requires periodic measurements of streamflow over a wide range of stage for the construction of a relation that is used to convert the stage data to streamflow data. In most cases, the relation is a simple stage-discharge (streamflow) rating curve (rating curve; fig. 7). Physical observations of stream velocity and depth across the stream channel are made onsite directly to measure streamflow (fig. 8; Turnipseed and Sauer, 2010). After development of the rating curve, continued periodic measurements of streamflow about every 6 to 8 weeks are required at various stages as well as selected high and low flows to validate the rating curve. The rating curve allows for the determination of the streamflow from the stage data when direct streamflow measurements are not possible.
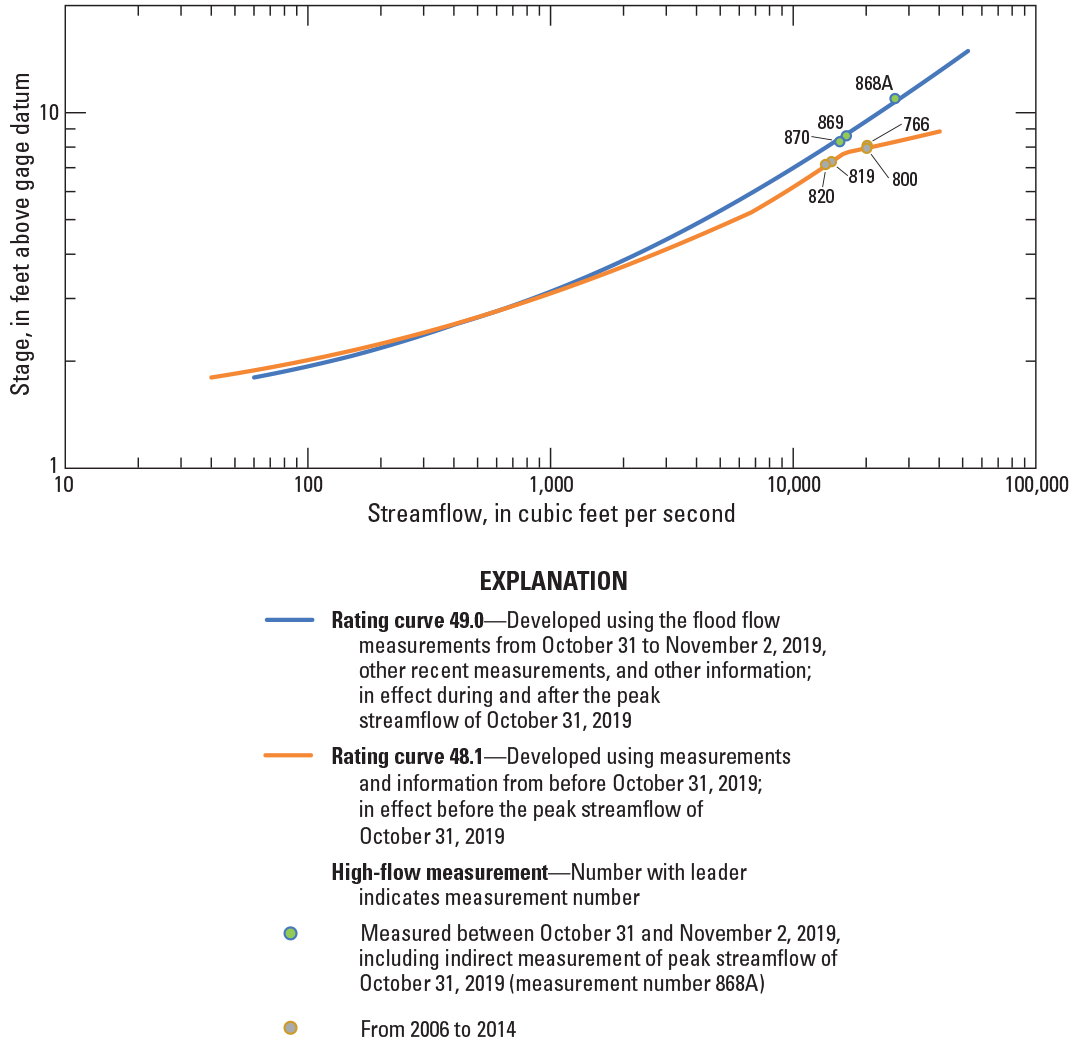
Graph showing stage-discharge rating curves for the West Canada Creek at Kast Bridge, New York (01346000) U.S. Geological Survey streamgage from before and after the flood of October 31 to November 3, 2019.
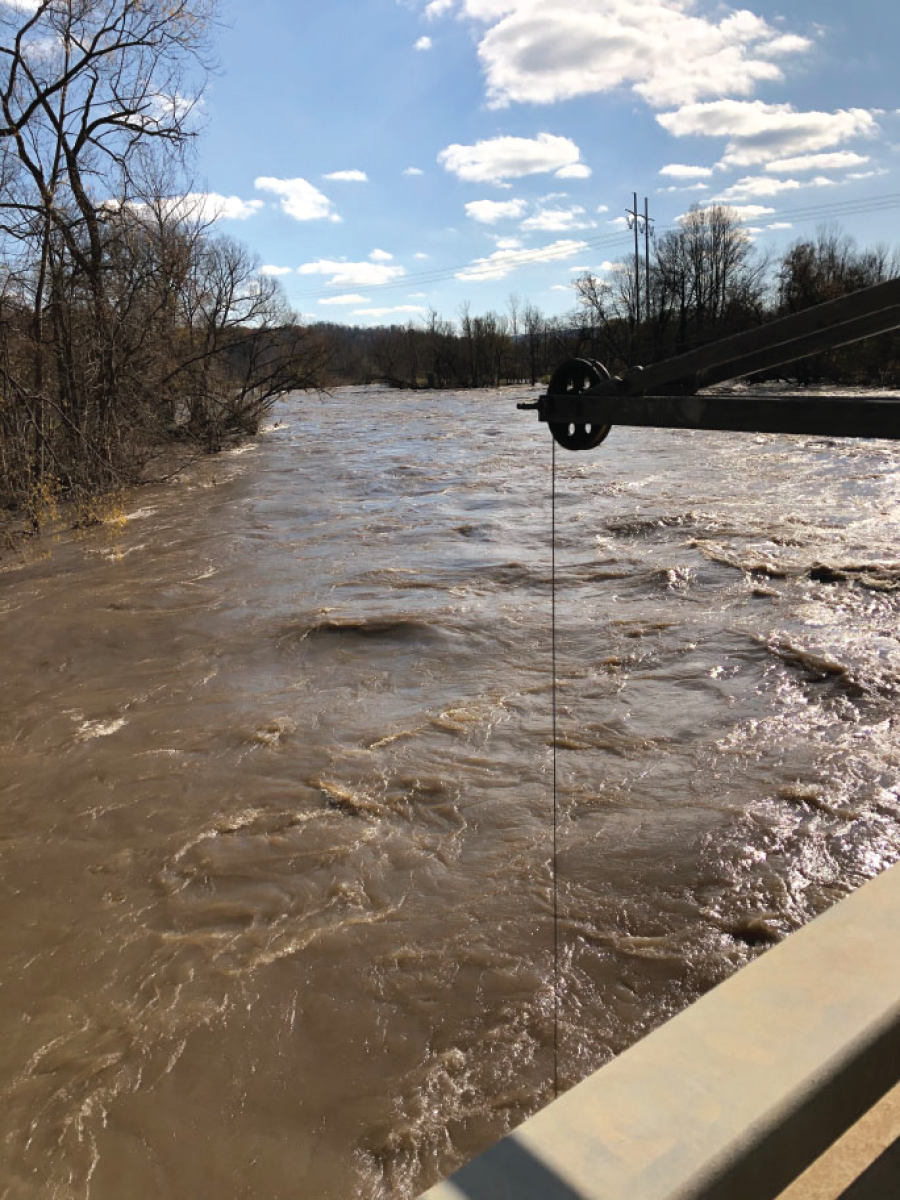
Photograph of flood flow at the West Canada Creek at Kast Bridge, New York (01346000) U.S. Geological Survey streamgage. The flood flow is being measured by using a mechanical current meter suspended with a bridge crane on November 2, 2019. Photograph by Kenneth McGrath, U.S. Geological Survey.
In some cases, direct measurements of streamflow during a flood are not possible or practicable. In such instances, indirect measurement methods (slope-area, contracted-opening, flow-over-dam, or flow-through-culvert) are used to compute peak streamflow for that particular flood (Benson and Dalrymple, 1967). In the indirect measurement methods, water-surface profiles, which are determined by high-water marks and channel geometry, are used in hydraulic equations that are based on the principles of conservation of energy, conservation of momentum, and continuity. The high-water marks and channel geometry are determined by field survey following selected peak flow events where a physical streamflow measurement was not possible nor practicable (fig. 9). The USGS assigns accuracy estimates with specified uncertainties to each indirect measurement based on the hydraulic and channel geometry conditions found at each field site (Benson and Dalrymple, 1967; Hulsing, 1967; Matthai, 1967; Bodhaine, 1968; Dalrymple and Benson, 1968). At the Kast Bridge streamgage, both indirect and direct measurements of streamflow from the flood of October 31 to November 3, 2019, were made and used in the development of a new rating curve (fig. 7).
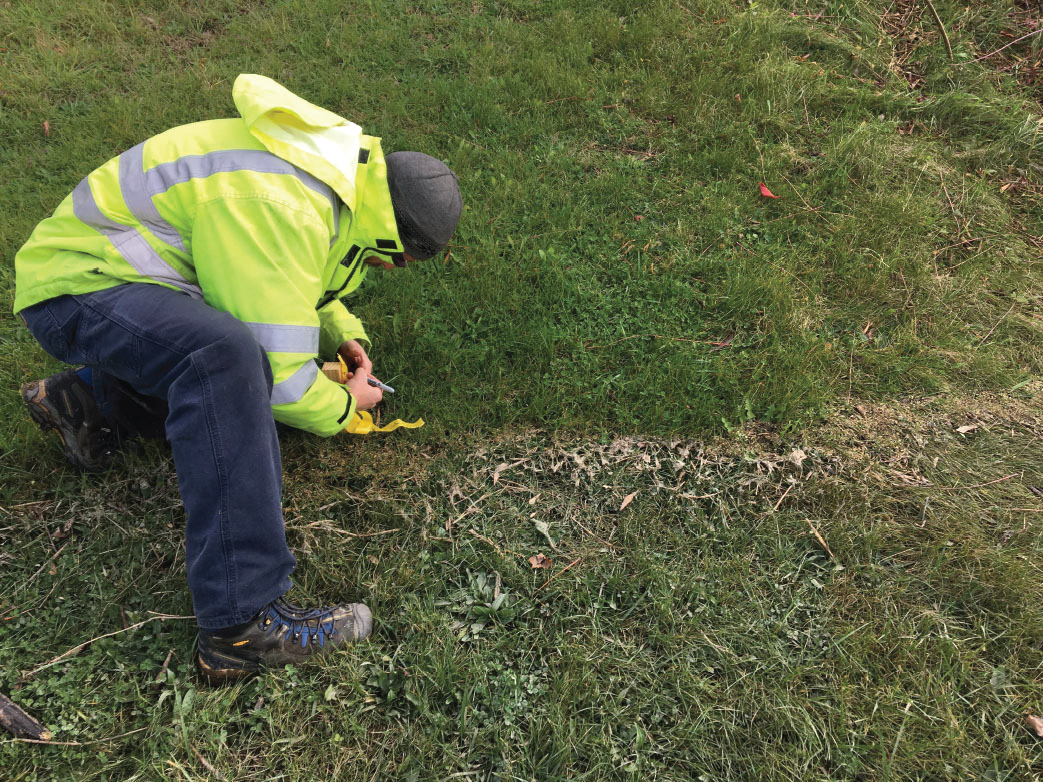
Photograph of a hydrologist flagging a high-water debris line at the Mohawk River above State Highway 30A at Fonda, New York (01349527) U.S. Geological Survey streamgage on November 2, 2019; photograph by Alton Anderson, U.S. Geological Survey.
The probability of a flood flow for a given location equaling or exceeding a certain magnitude in any given year is referred to as annual exceedance probability (AEP). AEP flood flows are commonly used by engineers, water-resource managers, and other professionals that need to prepare for or respond to floods. AEP flood flows are estimated through flood-frequency analyses of annual peak streamflow records and are typically provided as percentage chances or annual recurrence intervals. For example, a flood flow with a 1 percent AEP has a recurrence interval of 100 years and may be referred to as a “100-year flood” (table 3), but notably, the recurrence interval of 100 years and the phrase “100-year flood” only refer to a long-term average. Neither the term “recurrence interval” nor the phrase “100-year flood” imply that every 100 years there will be one flood that equals or exceeds the given magnitude (Holmes and Dinicola, 2010).
For the six USGS streamgages selected for flood-frequency analysis, estimates of flood magnitudes for selected AEPs were computed by fitting the log-Pearson type III (LPIII) distribution to annual peak streamflow data using version 7.4 of the USGS software package PeakFQ (Flynn and others, 2006; Veilleux and others, 2014). Version 7.4 of PeakFQ uses the Bulletin 17C guidelines (England and others, 2018) for flood-frequency analysis of streamflow records. The Bulletin 17C guidelines are the latest Federal guidelines for flood-frequency analysis and update the guidelines provided in Bulletin 17B (Interagency Advisory Committee on Water Data, 1982). As recommended in Bulletin 17C, the expected moments algorithm, as well as the multiple Grubbs-Beck test, were also used in the estimation of flood magnitudes for selected AEPs (England and others, 2018). Additionally, stationarity in the annual peak streamflow records was assumed after visual inspection of the records indicated no clear trends.
For the four streamgages selected for flood-frequency analysis that measure unregulated annual peak streamflows (Sacandaga River, Vly Brook, Wilmurt, and East Canada Creek; table 1), the LPIII results were also weighted by using regional regression estimates of flood magnitudes for the selected AEPs for the locations of the streamgages (Lumia and others, 2006). The regional regression estimates were obtained by using the StreamStats web application (U.S. Geological Survey, 2019), and the methods that were used for computing weighted LPIII estimates of flood magnitudes for AEPs are provided in Lumia and others (2006). For the two regulated streamgages selected for flood-frequency analysis (Kast Bridge and Little Falls), the LPIII results were not weighted using regional regression estimates because regional regression equations are only appropriate for rural and unregulated settings. Additionally, estimates of flood magnitudes for selected AEPs were only made for streamgages with periods of record of at least 10 years and were only computed up to a 0.2 percent chance (or 500-year recurrence interval; table 3), based on the guidelines in Bulletin 17C (England and others, 2018). Estimated AEPs for the observed peak streamflows from October 31 to November 2, 2019, were interpolated based on the relevant AEP flood magnitude estimates and percentages computed for each streamgage and guidance in USGS Office of Surface Water Technical Memorandum 2013.01 (U.S. Geological Survey, 2012).
Peak Streamflows and Stages
Peak streamflow and stage from the flood of October 31 to November 3, 2019, for the six streamgages selected for flood-frequency analysis, plus the Utica, Black Creek, and Fonda streamgages are listed in table 1. Peak elevation from the Hinckley Reservoir station, and the ranks of the 2019 peak streamflows for the periods of record of the streamgages are also presented in table 1. Rank comparisons were made on the basis of peak streamflow only because events such as ice jams can produce peak stages that are higher than the stages associated with peak streamflows. Five of the six streamgages selected for flood-frequency analysis had peaks of record for streamflow, and the East Canada Creek streamgage had the number two ranked peak streamflow for the period of record (table 1). The Utica, Black Creek, and Fonda streamgages also had peaks of record for streamflows, but their respective periods of record are less than 10 years.
The flood peaks for the nine streamgages and one reservoir elevation station (table 1) were between October 31 and November 2, 2019, though flooding continued into November 3, 2019. The relative timing of the peaks is dependent on a variety of factors, including drainage area size and location; localized timing, intensity, and distribution of rainfall; presence or absence of major regulation; and basin and land-use characteristics. Typically, the peak flows of larger drainage basins happen later than those of smaller drainage basins because it takes more time for runoff to drain larger basins. This characteristic of timing of peak flows can generally be observed in comparison of the peak streamflows from the three Mohawk River streamgages (Utica, Little Falls, and Fonda), which peaked in the afternoon on November 1, 2019, or in the morning on November 2, 2019, to the peak streamflows of the other six streamgages, which all peaked within hours of each other late on October 31, 2019, or early in the morning on November 1, 2019 (fig. 10).
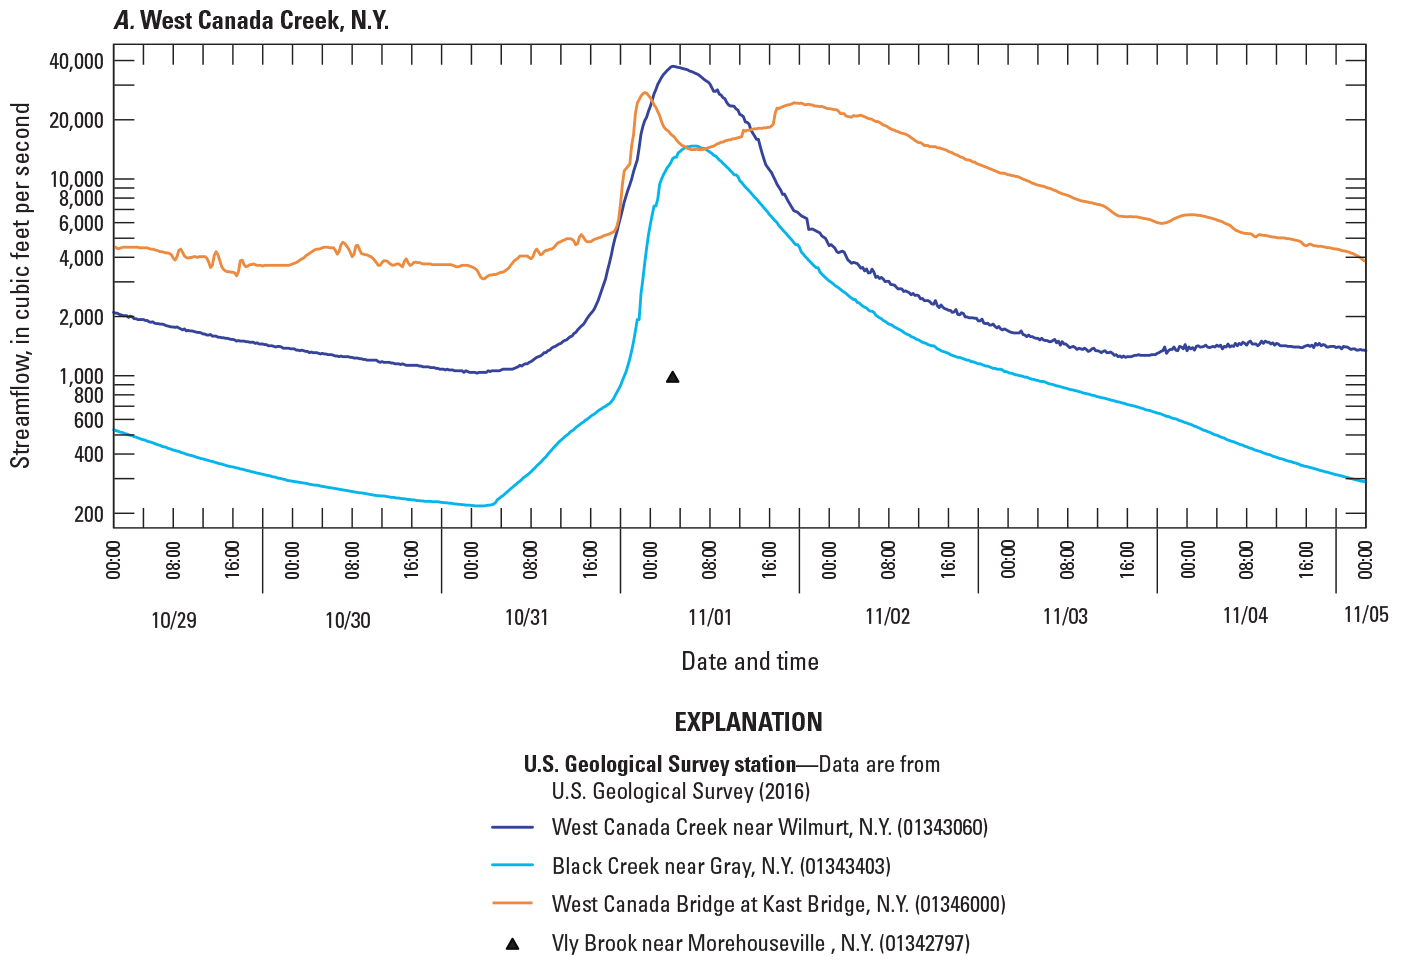
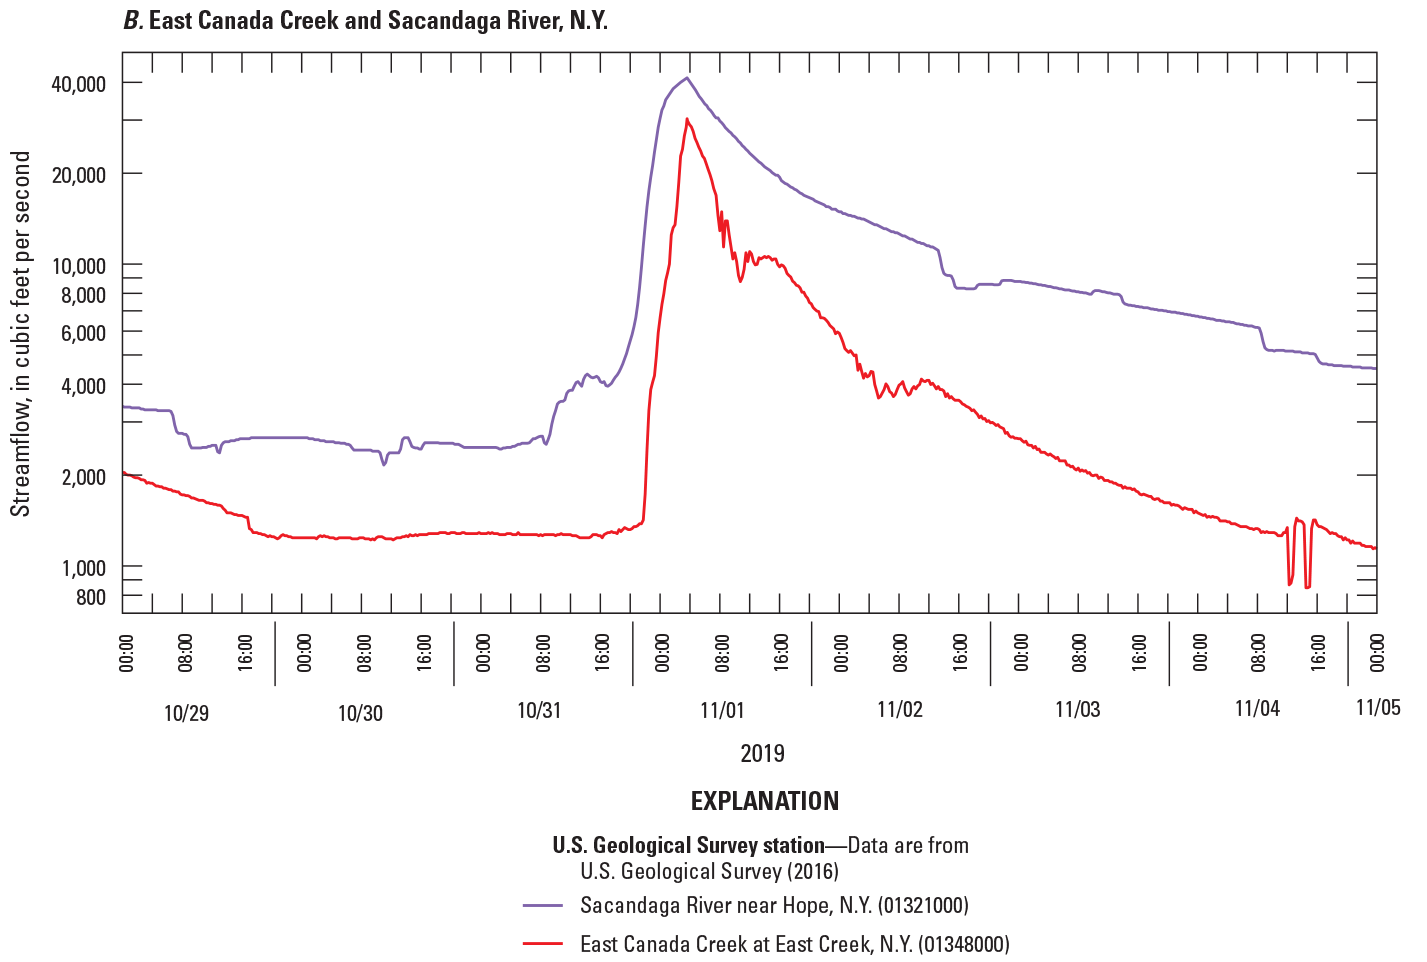
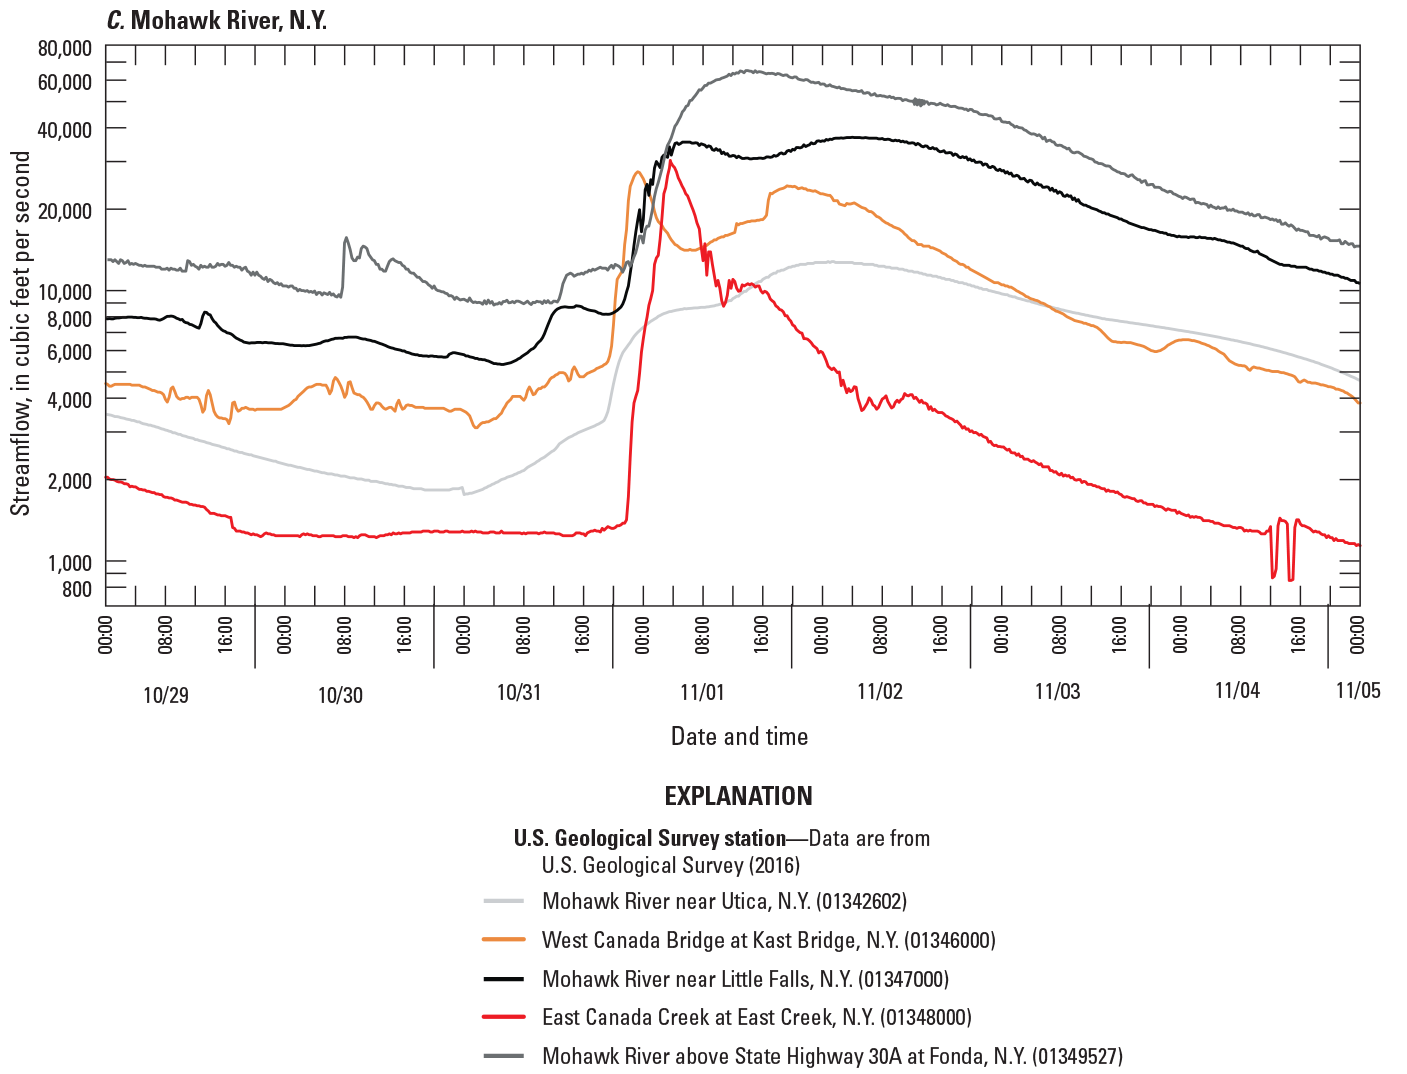
Graphs showing streamflow at U.S. Geological Survey streamgages in the Mohawk Valley and southern Adirondack region in central New York from October 29, 2019, at 12:00 a.m. eastern standard time, to November 5, 2019, at 12:00 a.m. eastern standard time. A, West Canada Creek, B, East Canada Creek and Sacandaga River, and C, Mohawk River basin streamgages. The Vly Brook near Morehouseville, New York (01342797) streamgage has only an annual peak streamflow. The West Canada Creek at Kast Bridge, N.Y. (01346000) and East Canada Creek at East Creek, N.Y. (01348000) streamflows are replotted from parts A and B in part C.
However, the Kast Bridge streamgage notably has the third largest drainage area (560 mi2) of the nine streamgages, including one of the Mohawk River streamgages (specifically, Utica, which has a drainage area of 553 mi2), and was the first of all nine streamgages to reach its peak streamflow, late on October 31, 2019 (fig. 10; table 1). The hydrograph from the Kast Bridge streamgage also shows two separate and distinct peak streamflows (double peak) late on October 31 and late on November 1. The likely factors that contributed to the double peak at the Kast Bridge streamgage are described in detail in the following section.
Flooding in West Canada Creek Basin
At the Kast Bridge streamgage, the first peak streamflow of 27,500 ft3/s was recorded at 11:15 p.m. EST on October 31, 2019 (fig. 10A; table 1). Streamflow then receded to 14,100 ft3/s and remained at about that level from 5:30 a.m. to 7:00 a.m. EST on November 1, 2019, before rising to a second peak streamflow of 24,400 ft3/s at 7:15 p.m. EST on November 1, 2019 (fig. 10A). A similar, but less distinct, double peak was seen in the streamflow record from the Little Falls streamgage (01347000; fig. 10C), which is 14.8 mi downstream from the Kast Bridge streamgage and 2.2 mi upstream from the confluence with East Canada Creek (fig. 1). The first peak streamflow at the Little Falls streamgage was 35,400 ft3/s, and it happened between 5:15 a.m. and 6:15 a.m. EST on November 1, 2019 (fig. 10C). Streamflow then receded to 30,700 ft3/s and remained at that level from 2:15 p.m. to 2:30 p.m. EST on November 1, 2019, before rising to a second, and larger, peak streamflow of 36,900 ft3/s at 4:00 a.m. EST on November 2, 2019 (fig. 10C; table 1).
The double peaks recorded at the Kast Bridge and Little Falls streamgages can largely be explained by the path of the storm, the timing of the peak streamflows at the Wilmurt and Black Creek streamgages, and changes in reservoir elevation at the Hinckley Reservoir, which regulates West Canada Creek streamflow about 31 mi upstream from the Kast Bridge streamgage (fig. 1). The Wilmurt streamgage, which is 3 mi upstream from the Hinckley Reservoir and accounts for 238 mi2 of the 372 mi2 area that drains into the Hinckley Reservoir, did not reach its single peak streamflow of 37,400 ft3/s until 3:00 a.m. EST on November 1, 2019 (fig. 10A; table 1). Because the single peak streamflow at the Wilmurt streamgage was about 4 hours after the first peak streamflow at the Kast Bridge streamgage, streamflow from the West Canada Creek basin upstream from the Hinckley Reservoir likely contributed more to the second peak streamflows at the Kast Bridge and Little Falls streamgages than to the first peak streamflows.
There are, however, other tributaries that drain into West Canada Creek and the Hinckley Reservoir downstream from the Wilmurt streamgage that could have contributed substantial streamflows to both the first and second peak streamflows. The largest of those tributaries is Black Creek, which has a total drainage area of 99.5 mi2 (fig. 1) and accounts for 74 percent of the 134 mi2 area that drains into the Hinckley Reservoir below the Wilmurt streamgage. The Black Creek streamgage is about 11 mi upstream from the Hinckley Reservoir and has a drainage area of 60.9 mi2 (fig. 1; table 1). However, the Black Creek streamgage did not reach its estimated peak streamflow of 14,700 ft3/s (table 1) until 5:30 a.m. EST on November 1, 2019 (fig. 10A).
Additionally, reservoir elevation at the Hinckley Reservoir station did not exceed the spillway elevation of about 1,223.64 ft (relative to the North American Vertical Datum of 1988 [NAVD 88]; 1,225.0 ft relative to the New York State Barge Canal Datum [BCD]) until 10:45 p.m. EST on October 31, 2019, just 30 minutes before the time of the first peak streamflow at the Kast Bridge streamgage (at 11:15 p.m. EST on October 31, 2019; fig. 11). Reservoir elevation at the Hinckley Reservoir station also continued to rise in the morning and early afternoon of November 1, 2019, until it reached a peak of 1,230.13 ft (NAVD 88; 1,231.49 ft BCD) at 2:30 p.m. EST before it began to recede. Therefore, the magnitude and timing of the peak streamflows at the Wilmurt and Black Creek streamgages, and the reservoir elevation at the Hinckley Reservoir on November 1, 2019, indicate that the streamflow from West Canada Creek and other tributaries upstream from the Hinckley Reservoir (such as Black Creek) likely had a greater effect on the magnitude and timing of the second peak streamflows at the Kast Bridge and Little Falls streamgages than on the first peak streamflows at those streamgages.
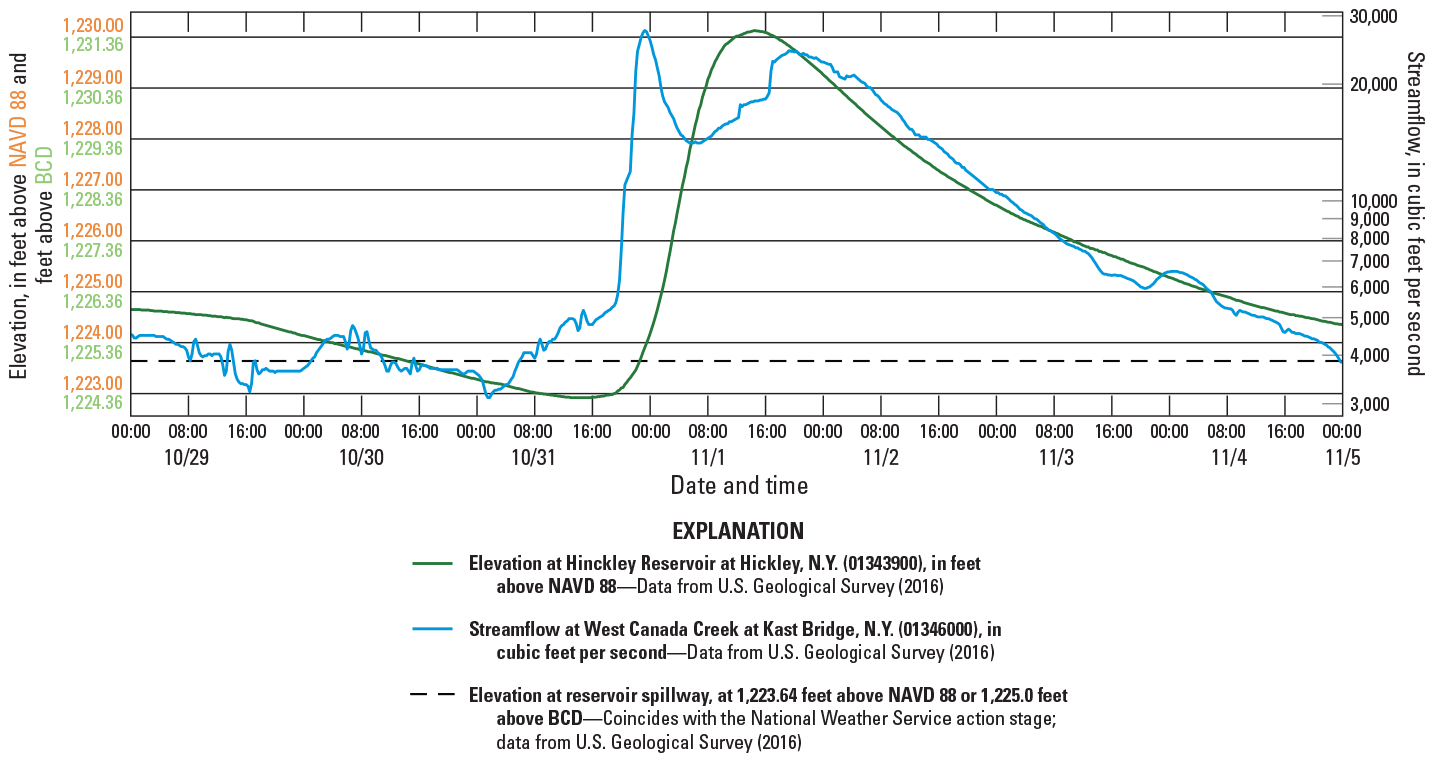
Graph showing streamflow at the West Canada Creek at Kast Bridge, New York (01346000) U.S. Geological Survey streamgage and reservoir elevation at the Hinckley Reservoir at Hinckley, N.Y. (01343900) U.S. Geological Survey reservoir elevation station from October 29, 2019, at 12:00 a.m. eastern standard time to November 5, 2019, at 12:00 a.m. eastern standard time. NAVD 88, North American Vertical Datum of 1988; BCD, New York State Barge Canal Datum.
The timing and magnitude of the first peak streamflows at the Kast Bridge and Little Falls streamgages, therefore, were likely to have been affected more by inflow to West Canada Creek from ungaged and unregulated tributaries downstream from the Hinckley Reservoir and upstream from the Kast Bridge streamgage (drainage area of 188 mi2 out of the total Kast Bridge drainage area of 560 mi2) than by inflow to West Canada Creek upstream from the Hinckley Reservoir. The largest of these tributaries, Cincinnati Creek (fig. 1), likely contributed a substantial part of the streamflow to the first peaks at the two streamgages. Cincinnati Creek flows into West Canada Creek 7.3 mi downstream from the Hinckley Reservoir and drains an area of 48.5 mi2 in the northwestern corner of the West Canada Creek basin. Because the storm moved across the region from the southwest, the Cincinnati Creek basin was possibly one of the earliest areas of the West Canada Creek basin to receive substantial rainfall from the storm.
Flood Stages and Flood Duration
Of the nine USGS streamgages in the study area, the National Weather Service (NWS) has established flood stages for three (fig. 12; table 1): Sacandaga River, Kast Bridge, and Little Falls. The NWS has also established flood stages for the Hinckley Reservoir station (fig. 13; table 1). The established flood stages include action stage, minor flood stage (also referred to as the “flood stage”), moderate flood stage, major flood stage, and other locally meaningful flood stages. Generally, the NWS defines the action stage as the water level at which action is taken in preparation of flooding, and the minor flood stage as the water level at which overbank flooding starts, but at which minimal to no property damage is expected (National Weather Service, 2019b). However, beginning at the minor flood stage, public safety may be threatened by adverse conditions, such as roads flooding. The moderate flood stage is generally defined as the water level at which some roads and structures become inundated by flood waters and at which some people need to be evacuated to higher elevations. The major flood stage is generally defined as the water level at which inundation of roads and structures becomes extensive and more widespread evacuations of people to higher elevations are necessary.
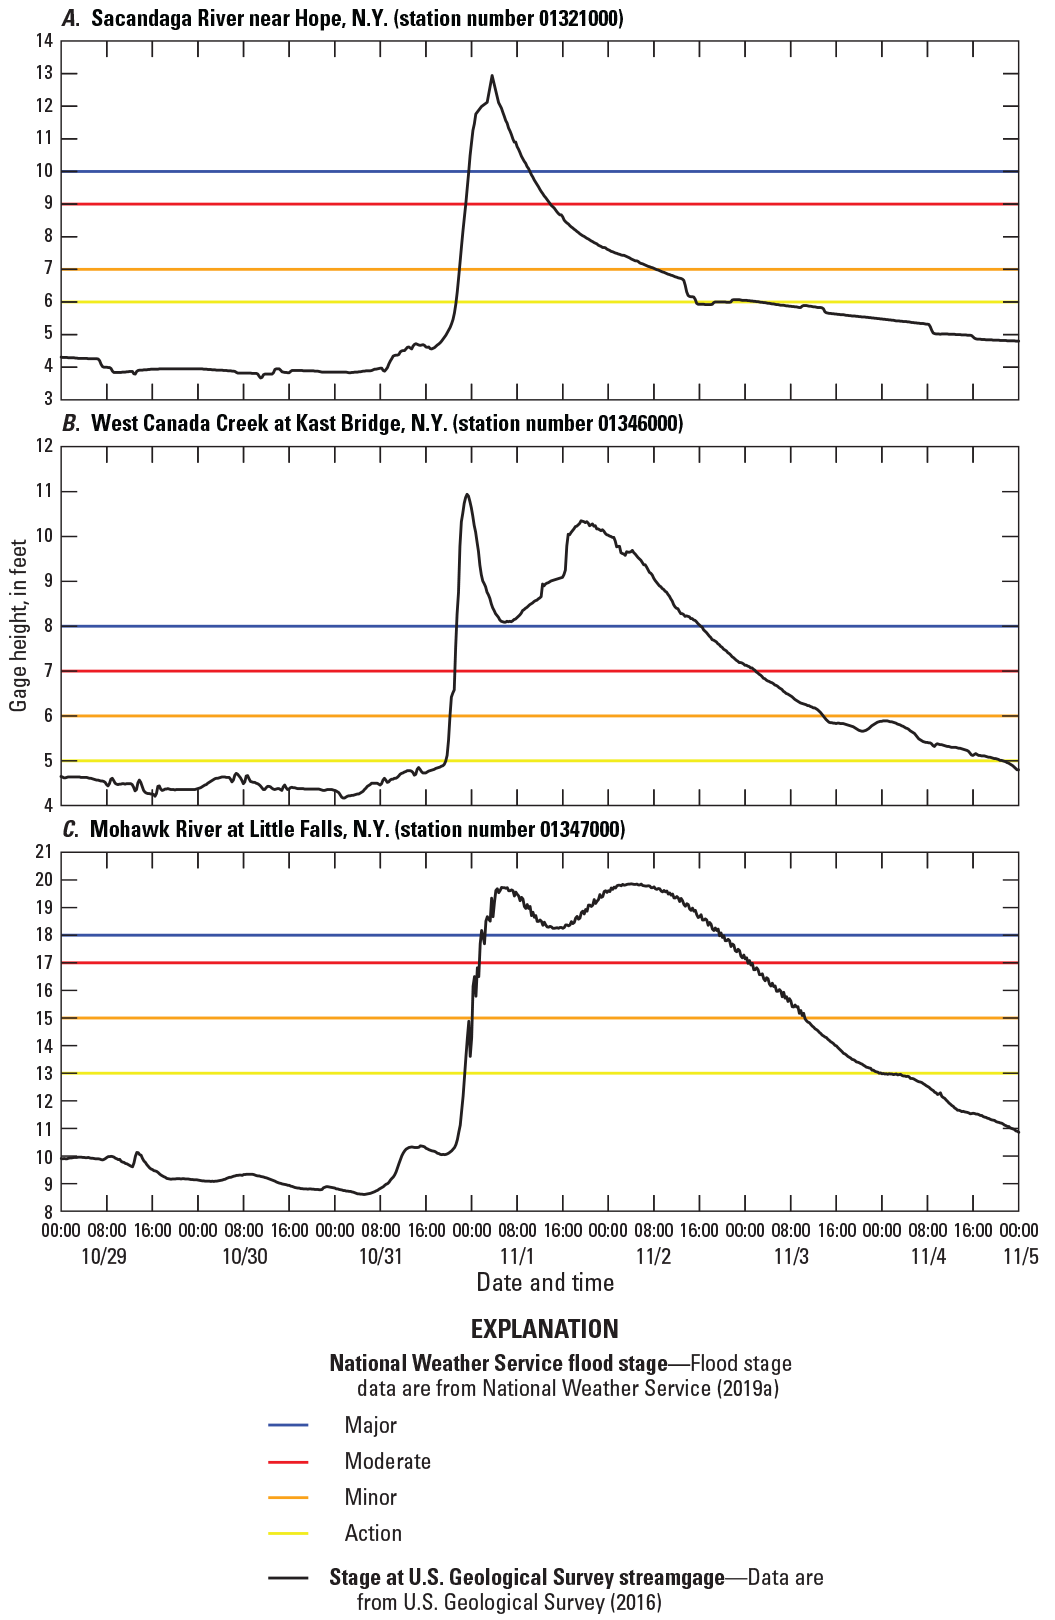
Graphs showing stage from October 29, 2019, at 12:00 a.m. eastern standard time to November 5, 2019, at 12:00 a.m. eastern standard time at U.S. Geological Survey streamgages in the Mohawk Valley and southern Adirondack region in central New York where the National Weather Service has established flood stages. A, Sacandaga River near Hope, N.Y. (01321000), B, West Canada Creek at Kast Bridge, N.Y. (01346000), and C, Mohawk River near Little Falls, N.Y. (01347000).
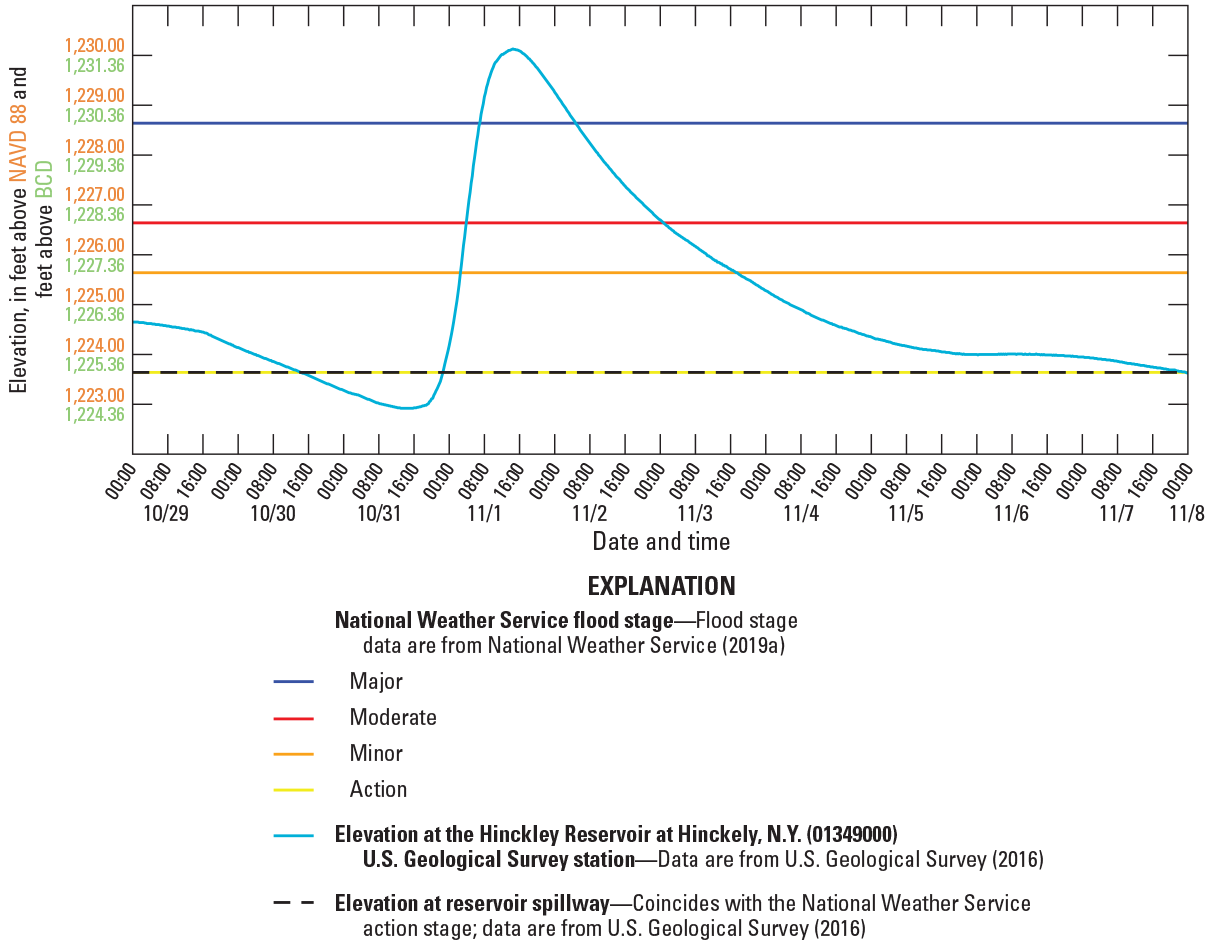
Graph showing reservoir elevation at the Hinckley Reservoir at Hinckley, New York (01343900) U.S. Geological Survey station, plotted with the spillway elevation and the National Weather Service flood stages, from October 29, 2019, at 12:00 a.m. eastern standard time to November 8, 2019, at 12:00 a.m. eastern standard time. NAVD 88, North American Vertical Datum of 1988; BCD, New York State Barge Canal Datum.
At the Sacandaga River streamgage, the NWS minor flood stage was equaled or exceeded for about 34.5 hours and the NWS major flood stage was equaled or exceeded for about 10.75 hours (fig. 12A). At the Kast Bridge streamgage, the NWS minor flood stage was equaled or exceeded for about 65.5 hours and the NWS major flood stage was equaled or exceeded for about 42.75 hours (fig. 12B). At the Little Falls streamgage, the NWS minor flood stage was equaled or exceeded for about 58.25 hours and the NWS major flood stage was equaled or exceeded for about 42 hours (fig. 12C).
At the Hinckley Reservoir station, the NWS minor flood stage was equaled or exceeded for about 63 hours and the NWS major flood stage was equaled or exceeded for about 21.75 hours (fig. 13). Additionally, the reservoir elevation equaled or exceeded the spillway elevation (which is also the NWS action stage) for about 7 days, from October 31, 2019, to November 7, 2019. These flood periods at the Hinckley Reservoir, in addition to those at the three streamgages with established NWS flood stages, indicated that there was active flooding in the study area for upwards of 2.5 days (beginning on October 31, 2019). However, many of the river and stream basins with drainage areas less than 491 mi2 (the drainage area of the Sacandaga River streamgage) likely stopped flooding in less than about 1.5 days, and the most severe flooding everywhere in the study area had likely subsided by the end of the day on November 2, 2019.
Flood Magnitudes for Selected Annual Exceedance Probabilities
Estimates of flood magnitudes for selected AEPs (80, 67, 50, 20, 10, 4, 2, 1, 0.5, and 0.2 percent) were computed by using annual peak streamflow records, updated with the peak streamflows from the flood of October 31 to November 3, 2019, from the six streamgages selected for flood-frequency analysis in the Mohawk Valley and southern Adirondack region (table 4). The flood-frequency estimates listed in table 4 are also available in the companion data release for this report (Graziano and others, 2024) along with the annual peak streamflow records and PeakFQ specification and output files used for computing the estimates. An example flood-frequency curve for the annual peak streamflows at the Kast Bridge streamgage is shown in figure 14. These AEP estimates supersede those published by Wall and others (2014), which analyzed peak flows through water year 2011.
Table 4.
Estimates of flood magnitudes for selected annual exceedance probabilities at selected U.S. Geological Survey streamgages in the Mohawk Valley and southern Adirondack region of New York State.[Data are from Graziano and others, 2024. Streamgage data are from U.S. Geological Survey (2016). For unregulated streamgages, estimates of flood magnitudes for selected annual exceedance probabilities (AEPs) from three different types of flood-frequency analysis are presented: log-Pearson type III (LPIII), regional regression equations, and weighted LPIII (Lumia and others, 2006). Only LPIII estimates are presented for regulated streamgages. The number of annual peak streamflows used in LPIII analyses includes the 2020 water year peak associated with the flood of October 31 to November 3, 2019, and may include peaks from outside the period of record of the streamgage or exclude peaks from inside the period of the record of the streamgage. USGS, U.S. Geological Survey; ft3/s, cubic foot per second]
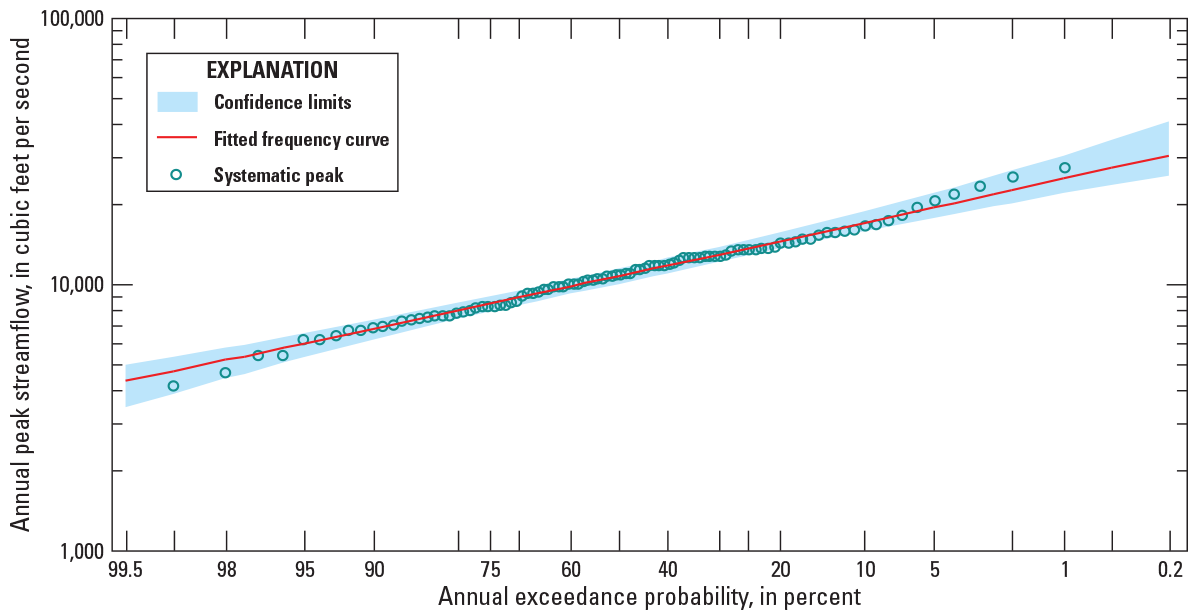
Graph showing flood-frequency curve and 95 percent confidence limits for the annual peak streamflows at the West Canada Creek at Kast Bridge, New York (01346000) U.S. Geological Survey streamgage.
For the four streamgages that measure unregulated annual peak streamflows (Sacandaga River, Vly Brook, Wilmurt, and East Canada Creek), estimates of flood magnitudes for selected AEPs from three different types of flood-frequency analysis: weighted LPIII, LPIII, and regional regression equations (Lumia and others, 2006) are listed in table 4. Additionally, for the Sacandaga River streamgage, computation of the LPIII estimates of flood magnitudes for selected AEPs included the use of a skewness coefficient (or skew) calculated from the weighted average of the station and regional skews (weighted skew). Station skew is a measure of the asymmetry of the distribution of annual peak streamflows for a given streamgage. Station skew can be sensitive to extreme events, particularly for streamgages with modest record length (Griffis and Stedinger, 2007, 2009). Therefore, where appropriate, Bulletin 17C recommends using a weighted skew computed from the station skew and the regional skew to reduce the sensitivity of the station skew to extreme events (England and others, 2018). The regional skew used for the Sacandaga River streamgage was 0.32, which is a regional skew that has recently been estimated for the part of New York where the study area is located, as well as for other parts of eastern New York and Pennsylvania (Veilleux and Wagner, 2021).
For the other three streamgages that measure unregulated annual peak streamflows (Vly Brook, Wilmurt, and East Canada Creek), only their respective station skews were used for the computation of the LPIII flood magnitude estimates. This was largely because the station skews for the three streamgages (which ranged from 1.012 to 1.143; Graziano and others, 2024) differed from the regional skew of 0.32 by more than 0.5, and the flood magnitude estimates for the selected AEPs (particularly, the 1 to 0.2 percent AEPs) for the three streamgages were considered to be more reasonable when calculated using station skew only, instead of weighted skew. Bulletin 17C guidelines indicate that careful examination of the data and flood-producing characteristics should be made when regional and station skews differ by more than 0.5, and that possibly greater weight may be given to the station skew when there are large deviations between regional and station skews, depending on record length and other factors (England and others, 2018, p. 25–26). The record lengths, historic peak information, station skews, geographic locations, estimated AEPs for the largest observed peak streamflows (computed from both station skew only and weighted skew), and characteristics of the flood of October 31 to November 3, 2019, were among the factors considered when making the decision to use station skew only, instead of weighted skew, for estimating the flood magnitudes for selected AEPs for the three streamgages.
For the two streamgages that measure regulated annual peak streamflows (Kast Bridge and Little Falls), only the estimates of flood magnitudes for selected AEPs from LPIII analysis are presented, and only their respective station skews were used in the flood-frequency analyses. Guidelines in Bulletin 17C that recommend use of a weighted skew are not considered to be applicable to drainage basins that are appreciably altered by reservoir regulation (England and others, 2018).
For the flood-frequency analyses of the Sacandaga River, Vly Brook, and Wilmurt streamgages, all the annual peak streamflows in their respective periods of record were used (table 4). For the flood-frequency analysis of the Wilmurt streamgage, a record extension was also performed, and a total of 54 annual peak streamflows, including all 20 of those in its period of record, were used. The 34 peaks used to extend the Wilmurt streamgage record were estimated using all the annual peak streamflow records from the discontinued West Canada Creek at Nobleboro, N.Y. (01342800) streamgage, which is 6.1 mi upstream from the Wilmurt streamgage, has a drainage area of 193 mi2 (drainage area of the Wilmurt streamgage is 238 mi2), and has a period of record that includes 34 annual peak streamflows recorded from October 1945 to May 2000 (not including every year). The 34 estimated peaks used to extend the Wilmurt record for the flood-frequency analysis were computed by (1) calculating the ratio of the Wilmurt streamgage drainage area to the Nobleboro streamgage drainage area; (2) separately adjusting that ratio for each of the 34 peaks by using log-linear interpolated exponents computed by using the regression equation exponents for region 1 from Lumia and others (2006, table 3) for the flood recurrence intervals that bracketed each peak (the flood recurrence intervals determined to bracket each peak were based on the weighted LPIII AEP flood magnitudes for the Nobleboro streamgage in Wall and others [2014]); and (3) multiplying each of the 34 peaks from the Nobleboro streamgage with its corresponding adjusted drainage area ratio. The ratio of the Wilmurt streamgage drainage area (238 mi2) to the Nobleboro streamgage drainage area (193 mi2) is about 1.23; the adjusted drainage area ratios used to estimate each of the Wilmurt streamgage record extension peaks (to effectively transfer all the peaks from the record for the Nobleboro streamgage to the record for the Wilmurt streamgage) ranged from about 1.18 to 1.20.
For the Kast Bridge streamgage, all the peaks in the record were used except for the first peak in the record, from water year 1913. This peak streamflow was the only peak in the record from before the streamflow at the streamgage started being regulated by the Hinckley Reservoir in 1914. For the Little Falls streamgage, all the peaks in the record were used except for the earliest four peaks in the record, from water years 1901, 1902, 1904, and 1913. These peaks are historic peak streamflows that were recorded before the USGS began systematic streamgaging at the station and are also from before West Canada Creek (which provides a substantial part of streamflow to the Mohawk River about 11 mi upstream from the Little Falls streamgage; fig. 1) was regulated by the Hinckley Reservoir. For the East Canada Creek streamgage, all the peaks in the record were used except for the first peak in the record, from water year 1946. This peak was a historic peak streamflow that was recorded before the USGS began systematic streamgaging at the station. Additionally, this peak streamflow was from a dam failure, which is considered to be a unique, nonrecurring event for the station. Ultimately, none of the annual peak streamflows excluded from the AEP computations are considered to be representative of future flood risk at the streamgages.
Annual Exceedance Probabilities for the Flood of October 31 to November 3, 2019
Estimated AEPs for the peak streamflows from the flood of October 31 to November 3, 2019, at the six streamgages selected for flood-frequency analysis are listed in table 5. The estimated AEPs were calculated by log-linear interpolation (equation 1 in U.S. Geological Survey, 2012) between the relevant AEP flood magnitude estimates and percentages that were computed for each streamgage (table 4). To calculate estimated AEPs for the four streamgages that measure unregulated annual peak streamflows, the weighted LPIII estimates in table 4 were used, and to calculate estimated AEPs for the two streamgages that measure regulated annual peak streamflows, only the LPIII estimates in table 4 were used.
Table 5.
Estimated annual exceedance probabilities for the peak streamflows from the flood of October 31 to November 3, 2019, at selected U.S. Geological Survey streamgages in the Mohawk Valley and southern Adirondack region of New York State.[For unregulated streamgages, annual exceedance probability (AEP) estimates were calculated using the weighted log-Pearson type III (LPIII) estimates listed in table 4. For regulated streamgages, AEP estimates were calculated using only the LPIII estimates listed in table 4. The rank of peak streamflow is both the rank of the peak streamflow in the record of the streamgage and the rank of the peak streamflow among the annual peak streamflows used in AEP analyses. The number of annual peak streamflows used in AEP analyses includes the 2020 water year peak associated with the flood of October 31 to November 3, 2019, and may include peaks from outside the period of record of the streamgage or exclude peaks from inside the period of the record of the streamgage. USGS, U.S. Geological Survey; ft, foot; ft3/s, cubic foot per second; <, less than]
Table 5 also includes 66.7 percent confidence intervals for the AEP estimates, which were computed using the nonparametric methods described in U.S. Geological Survey (2012). The 66.7 percent confidence intervals for the AEP estimates demonstrate the high degree of uncertainty in estimating AEPs for specific floods, particularly for sites with short periods of record. For example, at the Vly Brook streamgage, an estimated AEP of 0.6 percent was calculated for the peak streamflow of 969 ft3/s from November 1, 2019, but because there are only 28 peak streamflows in the record, the 66.7 percent confidence interval for the true AEP of the largest flood in a 28-year record extends from 0.7 to 6.2 percent. Additionally, because observed peak streamflows were not used in the computation of their respective confidence intervals, the estimated AEPs for the observed peak streamflows could fall outside of the confidence intervals, such as at the Vly Brook streamgage.
However, although the estimated AEP of 0.6 percent for the peak streamflow at the Vly Brook streamgage was less than the confidence interval of 0.7 to 6.2 percent, it was actually higher than the estimated AEPs computed for the other three streamgages that measured unregulated annual peak streamflows (Sacandaga River, Wilmurt, and East Canada Creek), and greater numbers of annual peak streamflows were used in the AEP analyses of those streamgages (table 5). For those three streamgages, the estimated AEPs for the peak streamflows from November 1, 2019, ranged from less than 0.2 percent (Wilmurt) to 0.4 percent (East Canada Creek), and the numbers of annual peak streamflows that were used in the AEP analyses ranged from 54 (Wilmurt) to 109 (Sacandaga River).
The East Canada Creek streamgage was the only streamgage of the six streamgages selected for flood-frequency analysis where the peak streamflow from the flood of October 31 to November 3, 2019 (30,300 ft3/s), was ranked as the second highest in its period of record (a peak streamflow of 31,500 ft3/s was previously recorded on June 28, 2006; table 1). This indicates that within 15 years in the East Canada Creek basin, there have been two floods with AEPs estimated to be 0.4 percent or less. However, the 66.7 percent confidence interval for the AEP of the second highest annual peak streamflow in a 70-year record is calculated to be 1.0 to 4.5 percent (table 5).
The estimated AEPs for the two streamgages that measure regulated annual peak streamflows (Kast Bridge and Little Falls) compared well with each other. For the Kast Bridge streamgage, 100 annual peak streamflows were used in the AEP analyses, and the estimated AEP for the peak streamflow of 27,500 ft3/s from October 31, 2019, was 0.5 percent (table 5). For the Little Falls streamgage, 93 annual peak streamflows were used in the AEP analyses, and the estimated AEP for the peak streamflow of 36,900 ft3/s from November 2, 2019, was also 0.5 percent.
Comparison to Past Floods
The peak of record streamflows, before the flood of October 31 to November 3, 2019, for the six streamgages selected for flood-frequency analysis are listed under previous maximum in table 1 and shown in figure 15. Of the previous peak streamflows recorded at the six streamgages, only the peak streamflow of 31,500 ft3/s from June 28, 2006, at the East Canada Creek streamgage, was still a peak of record streamflow after the flood of October 31 to November 3, 2019 (fig. 15F; table 1). The peak streamflow of 30,300 ft3/s from November 1, 2019, was about 4 percent lower than the peak of record streamflow (31,500 ft3/s) for the East Canada Creek streamgage. The previous peak of record streamflow of 35,000 ft3/s from the Little Falls streamgage was also on June 28, 2006 (fig. 15E; table 1), and this peak streamflow was about 5 percent lower than the peak streamflow of 36,900 ft3/s from November 2, 2019. These peak streamflows from June 28, 2006, at the East Canada Creek and Little Falls streamgages, were caused by the flood of June 26–29, 2006, which resulted from a stalled frontal system that caused tropical moisture to be funneled northward into New York, New Jersey, and Pennsylvania (Suro and others, 2009). The flood of June 26–29, 2006, affected the Mohawk, Delaware, and Susquehanna River basins in New York State, and also resulted in the fourth highest annual peak streamflows recorded at the Sacandaga River (fig. 15A) and Vly Brook streamgages (fig. 15B); the third highest peak recorded at the Wilmurt streamgage (not including estimated peaks from record extension; fig. 15C); and the fifth highest peak recorded at the Kast Bridge streamgage (fig. 15D).
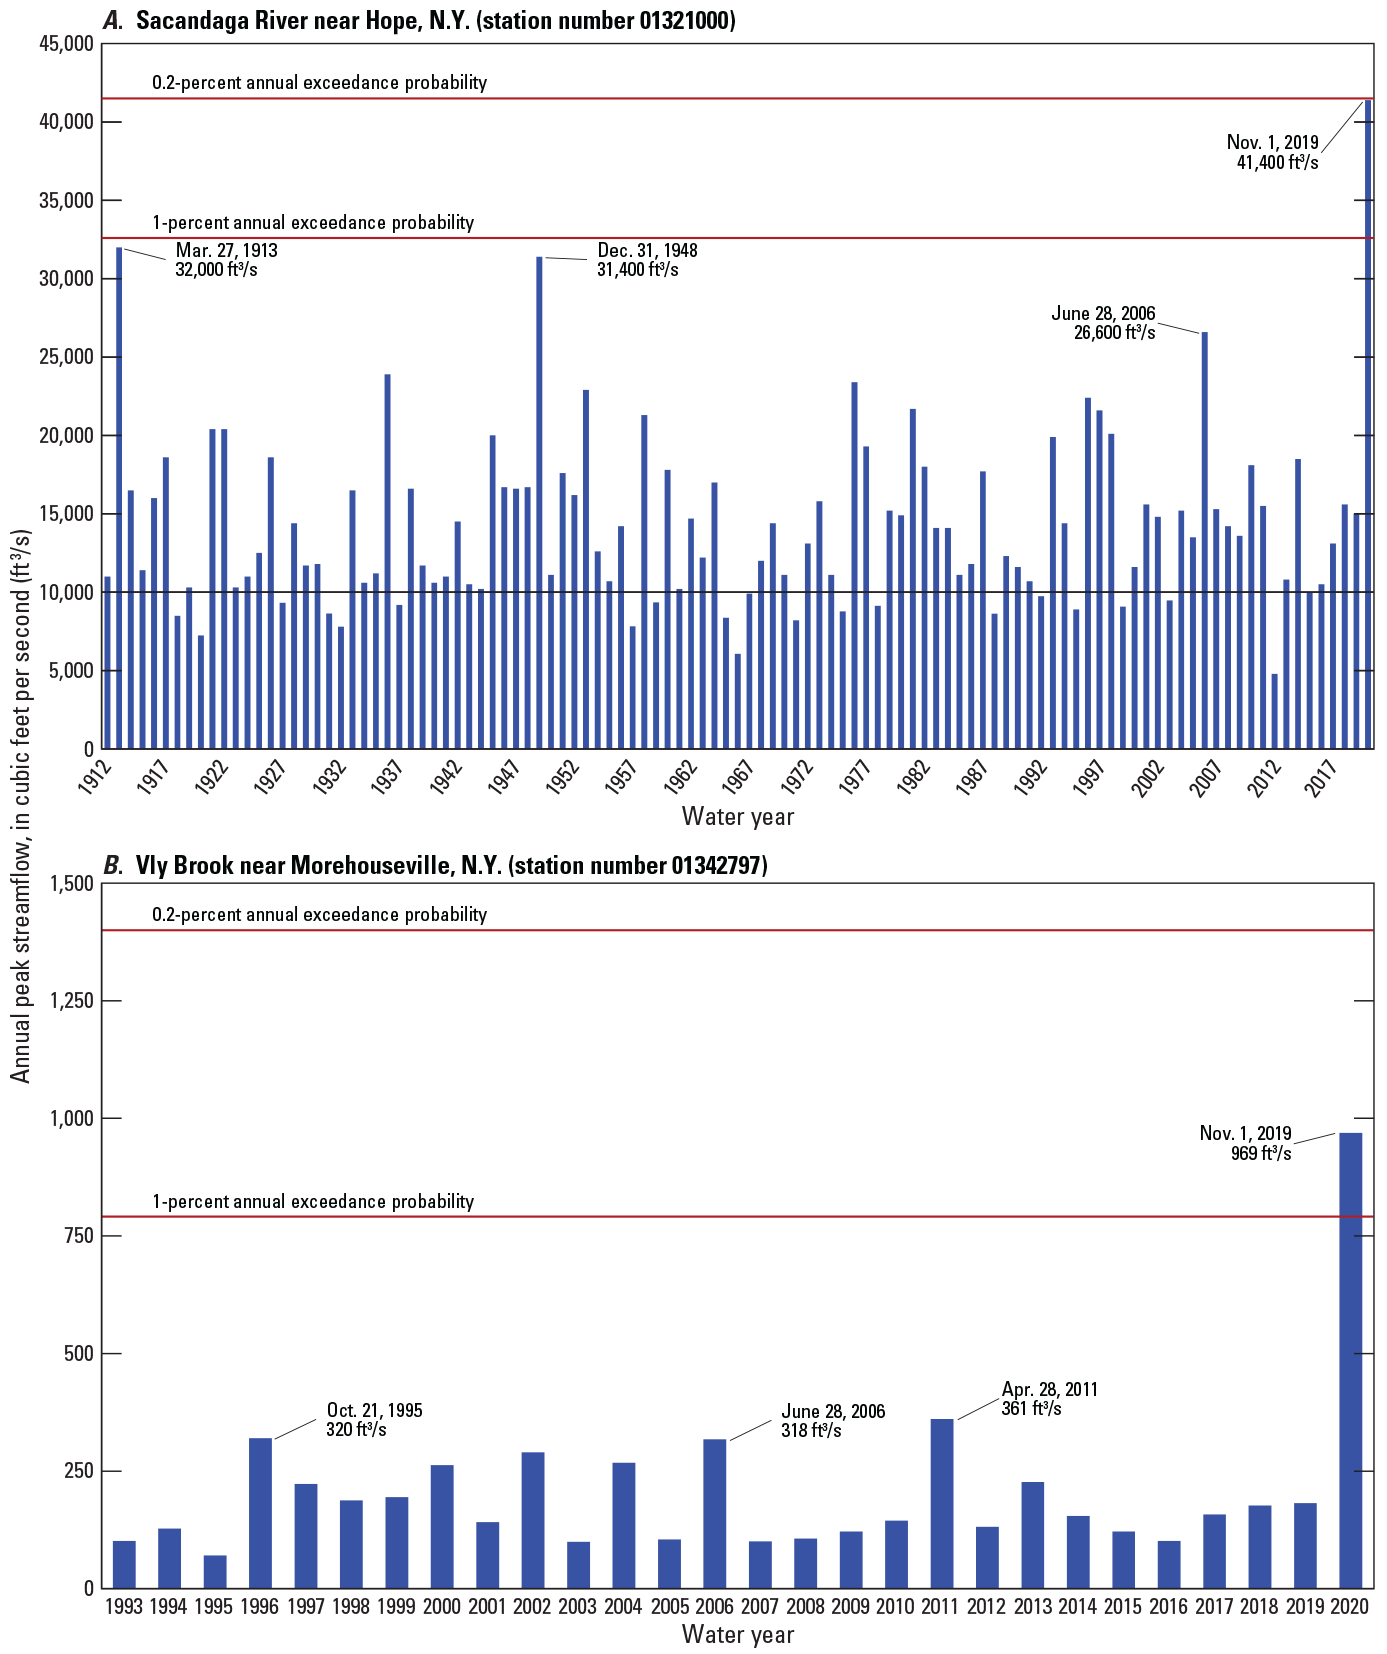
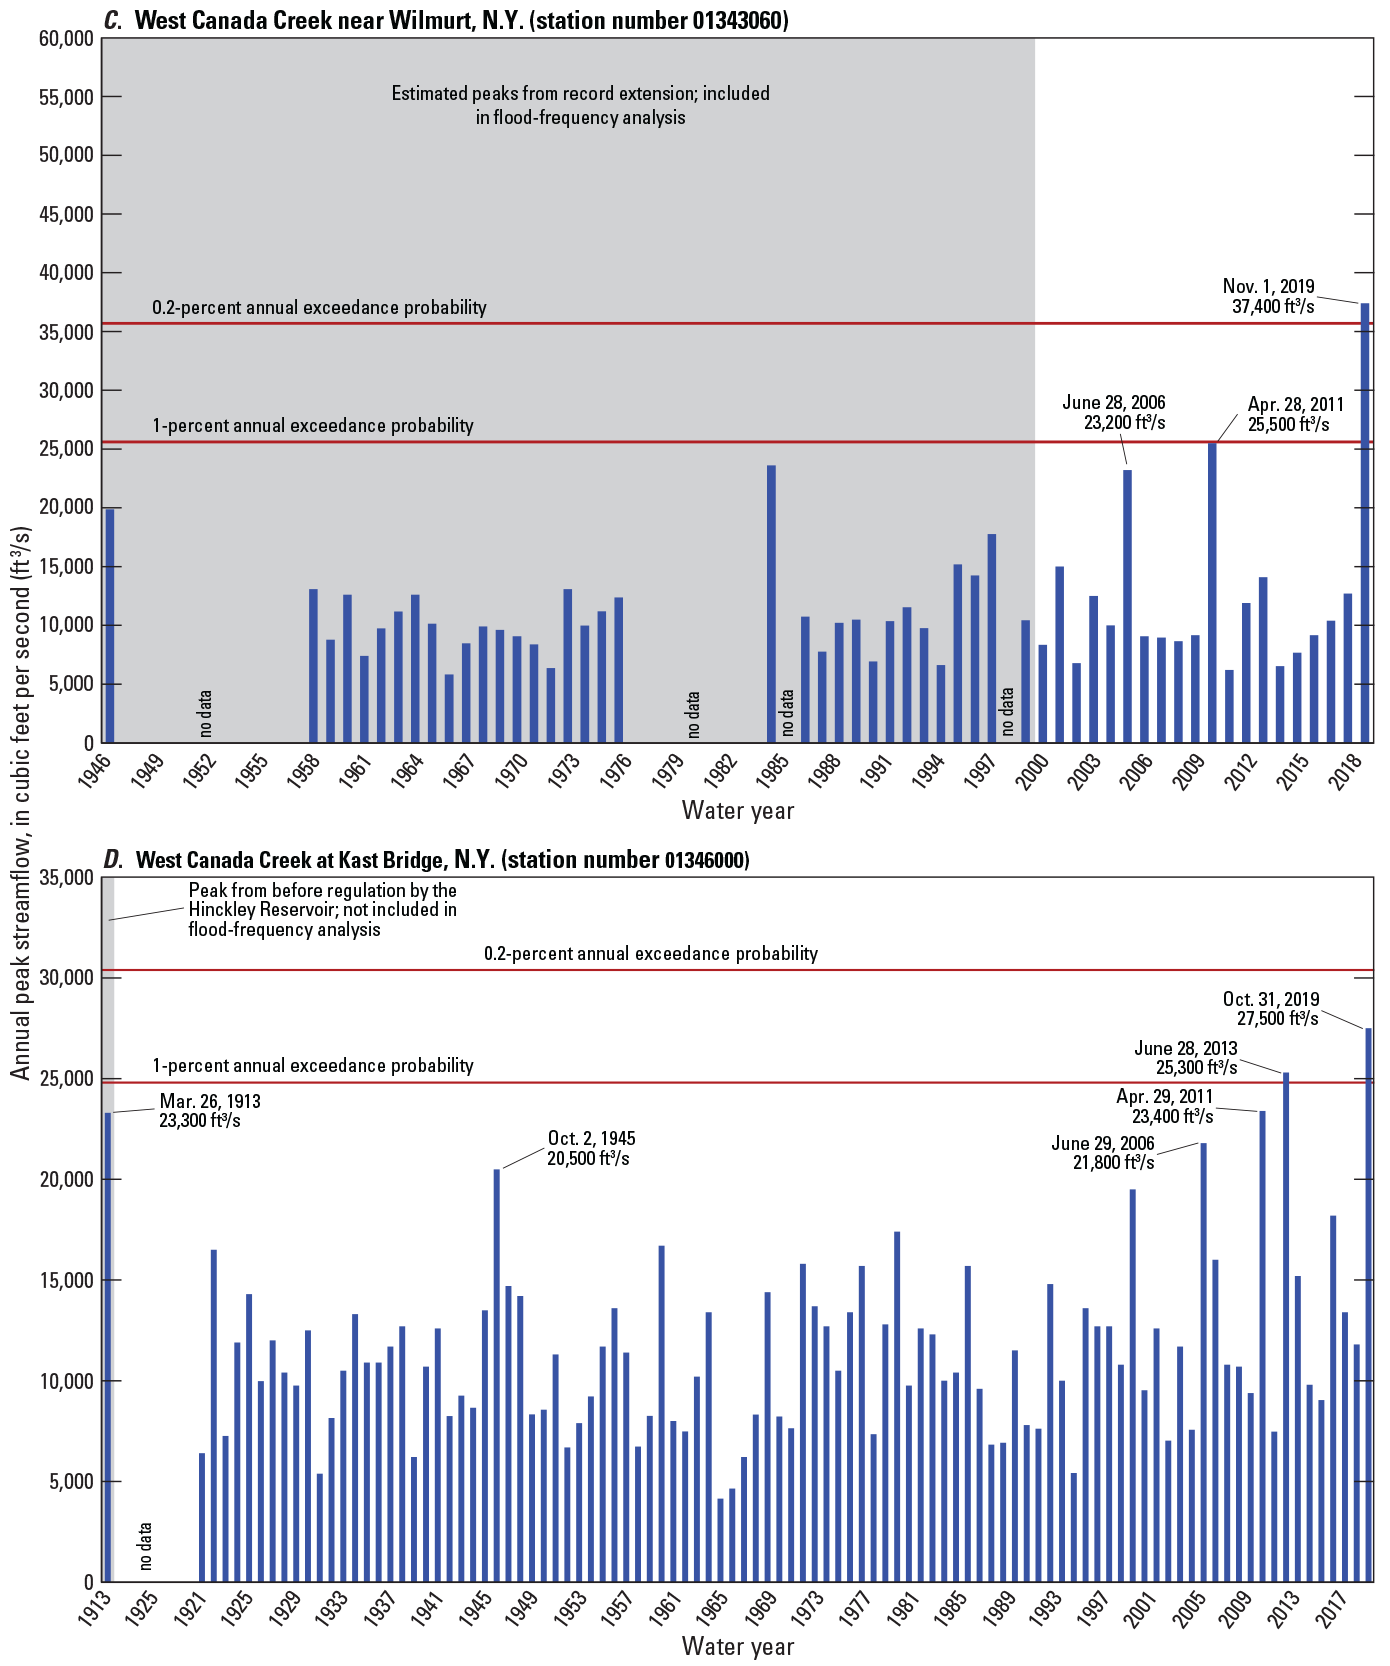
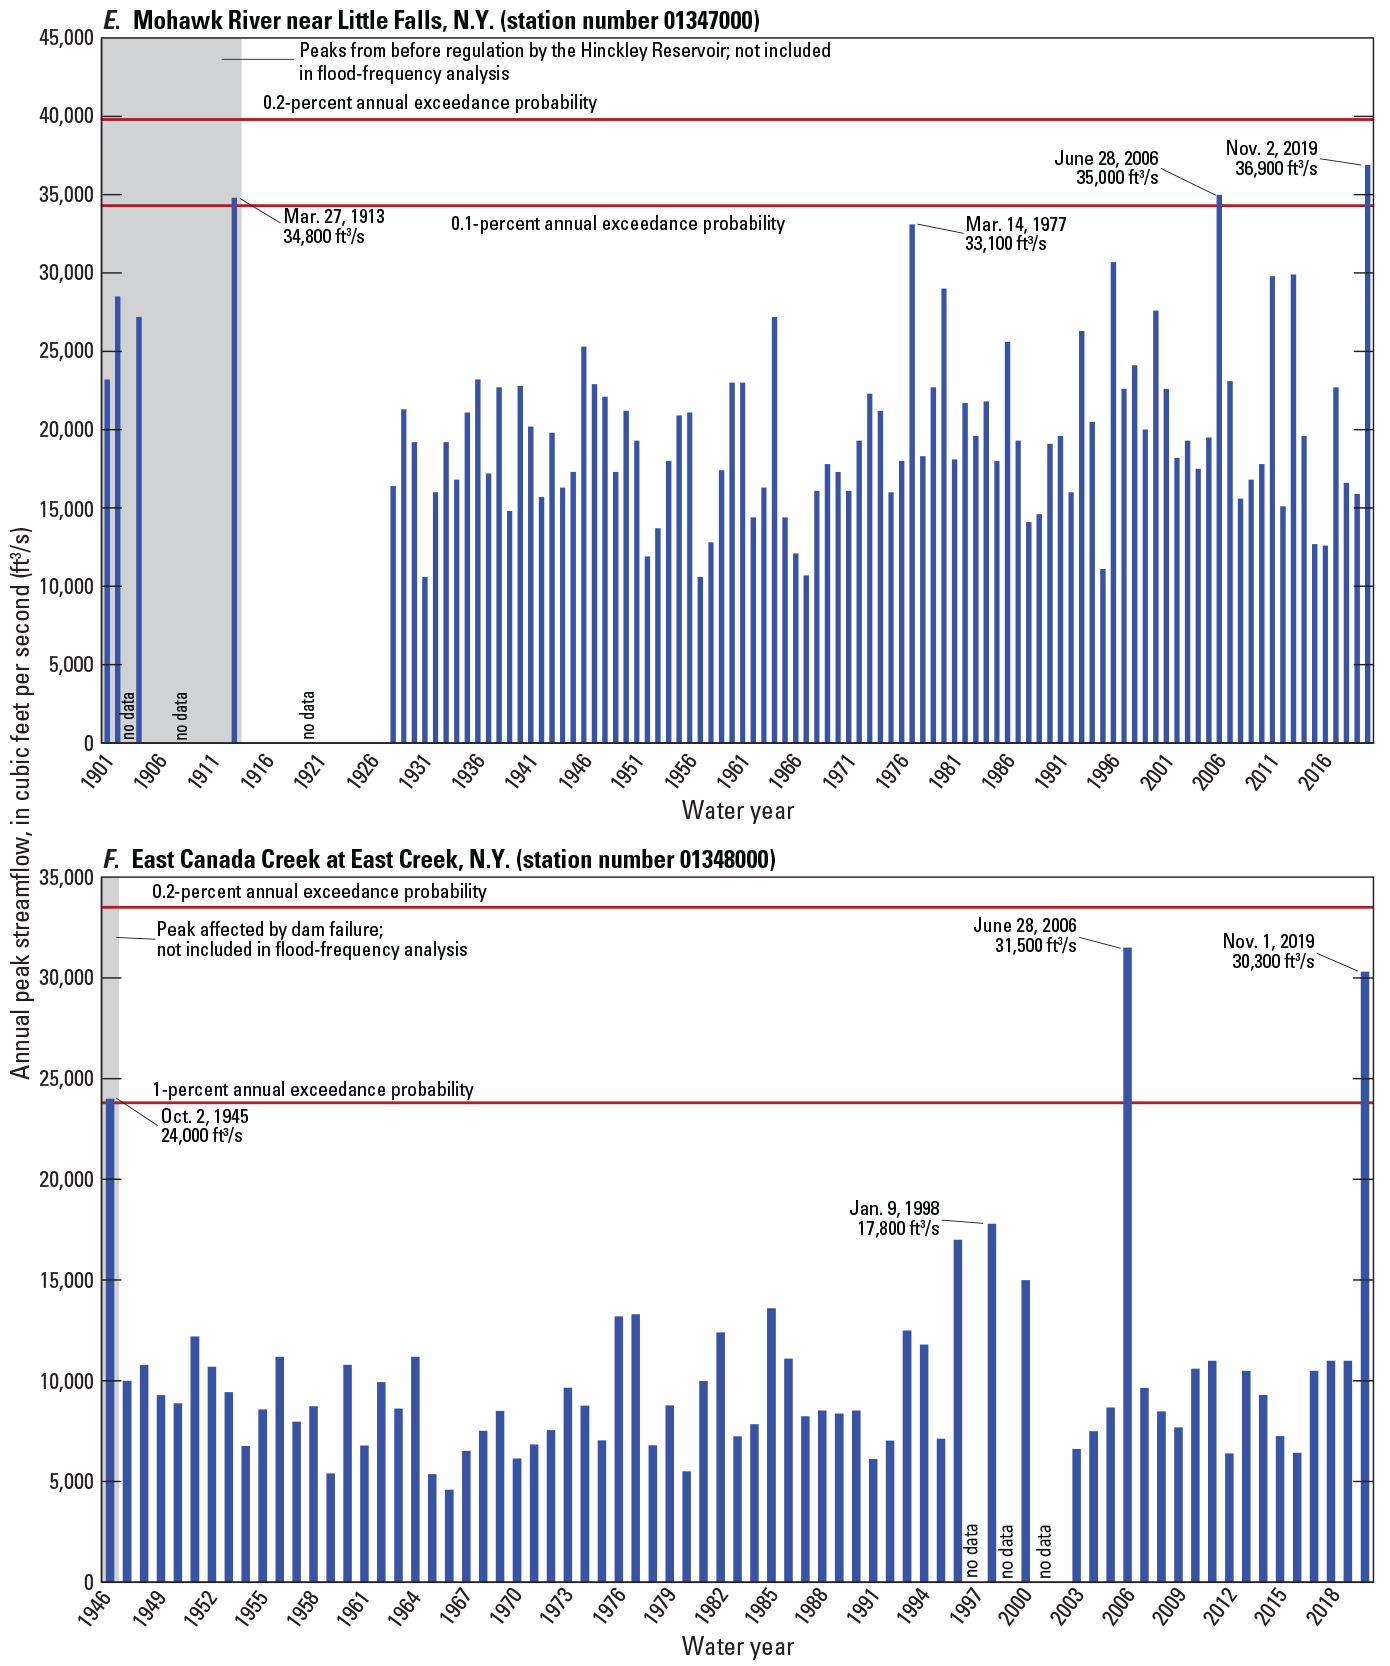
Graphs showing annual peak streamflows for the periods of record and estimates of flood magnitudes for the 1 and 0.2 percent annual exceedance probabilities at selected U.S. Geological Survey streamgages in the Mohawk Valley and southern Adirondack regions of New York State. A, Sacandaga River near Hope, New York (01321000), B, Vly Brook near Morehouseville, N.Y. (01342797), C, West Canada Creek near Wilmurt, N.Y. (01343060), D, West Canada Creek at Kast Bridge, N.Y. (01346000), E, Mohawk River near Little Falls, N.Y. (01347000), and F, East Canada Creek at East Creek, N.Y. (01348000).
The previous peak of record streamflow at the Sacandaga River streamgage (32,000 ft3/s on March 27, 1913) was about 23 percent lower than the peak streamflow from November 1, 2019 (41,400 ft3/s; fig. 15A; table 1). The peak streamflow from March 27, 1913, was caused by a widespread flood that resulted from heavy rain that fell from March 23 to March 27, 1913, over the central and eastern United States (Silver Jackets, 2013). The 1913 flood also caused the third highest annual peak streamflow recorded at the Little Falls streamgage (fig. 15E) and fourth highest peak recorded at the Kast Bridge streamgage (fig. 15D). The annual peak streamflows from water year 1913 were not used for the flood-frequency analyses of the data from the Little Falls or the Kast Bridge streamgages because they happened before streamflow was regulated by the Hinckley Reservoir and are not considered to be representative of future flood risk at those streamgages. The 1913 flood happened before annual peak streamflow records at the Vly Brook, Wilmurt, and East Canada Creek streamgages begin.
The previous peaks of record streamflows at the Vly Brook and Wilmurt streamgages were on April 28, 2011 (fig. 15B, C; table 1). At the Vly Brook streamgage, the previous peak of record streamflow (361 ft3/s) was about 63 percent lower than the peak streamflow from November 1, 2019 (969 ft3/s), and at the Wilmurt streamgage, the previous peak of record streamflow (25,500 ft3/s) was about 32 percent lower than the peak streamflow from November 1, 2019 (37,400 ft3/s). The previous annual peak streamflows at these streamgages resulted from record spring precipitation and heavy rainfall in late April 2011 combined with above-average temperatures and a melting snowpack in and around the Adirondack Mountains (Lumia and others, 2014). The April 2011 flood also resulted in the third highest annual peak streamflow recorded at the Kast Bridge streamgage (fig. 15D), and the water year 2011 annual peak streamflow at the Sacandaga River streamgage (U.S. Geological Survey, 2016), though this peak did not rank in the top 10 of annual peak streamflows for the Sacandaga River streamgage (fig. 15A). At the Little Falls and East Canada Creek streamgages, the water year 2011 peak was on September 8, 2011 (fig. 15E, F; U.S. Geological Survey, 2016), and resulted from heavy rains that stemmed from remnants of Tropical Storm Lee and fell on a region that was already rain-soaked from Tropical Storm Irene on August 28 and 29, 2011 (Lumia and others, 2014). Water year 2011 was an unusually wet year for New York State, with record streamflows, which resulted from three major floods (late April, late August, and early September), at streamgages throughout the State (Lumia and others, 2014).
The previous peak of record streamflow at the Kast Bridge streamgage (25,300 ft3/s on June 28, 2013) was about 8 percent lower than the peak streamflow from October 31, 2019 (27,500 ft3/s; fig. 15D; table 1). The previous peak of record streamflow for the site was the result of localized flash flooding caused by heavy overnight rainfall in the already saturated Mohawk Valley and western Adirondack region (National Weather Service, undated). The flash floods of June 28, 2013, also caused the sixth highest annual peak streamflow recorded at the Little Falls streamgage (fig. 15E). The annual peak streamflow for water year 2013 at the East Canada Creek streamgage was also on June 28, 2013, but it did not rank in the top 10 annual peak streamflows for the site (fig. 15F; U.S. Geological Survey, 2016). At the Sacandaga River, Vly Brook, and Wilmurt streamgages, the water year 2013 annual peak streamflows were on April 20, 2013 (U.S. Geological Survey, 2016).
Summary
Between October 31 and November 3, 2019, historic flooding in localized areas of the Mohawk Valley and southern Adirondack region in central New York State resulted in one fatality and an estimated $33 million in damages. Flooding resulted from high-intensity, hyperlocal rainfall in the region within a 24-hour period between October 31 and November 1, 2019, at the end of a much wetter than average October. In that 24-hour period, rainfall amounts largely ranged from 2 to 5 inches in the most heavily affected parts of the region, but a maximum rainfall amount for the region of 7 inches was recorded in Speculator, New York. This rainfall total in a 24-hour period is considered to have between a 200- and 500-year recurrence interval. In the area with the highest rainfall total, much of the 24-hour total fell within a 3-hour period beginning at about 6:00 p.m. eastern standard time on October 31, 2019. The most severe flooding to result from the rainfall was mainly in the Sacandaga River basin, which is within the upper Hudson River basin, and the East and West Canada Creek basins, which are within the Mohawk River basin.
Streamflow, stage, and reservoir-elevation data collected by the U.S. Geological Survey are documented in this report. Flooding resulted in new peak streamflow records at five of six U.S. Geological Survey streamgages in the region that have periods of record of at least 20 years, including at three streamgages that have been in operation for about 100 years. At the sixth streamgage, this flooding resulted in the second highest peak streamflow in its 71-year period of record. During the flood, peak streamflows happened from October 31 to November 2, 2019. However, National Weather Service flood stages (or minor flood stages) at some of the streamgages were still being exceeded on November 3, 2019.
In West Canada Creek, downstream from the Hinckley Reservoir, there was a distinct double peak of streamflow during the 2019 flood that was recorded at two streamgages. The first peak of the double peak was likely caused by inflows to West Canada Creek from ungaged and unregulated tributaries downstream from the Hinckley Reservoir, such as Cincinnati Creek. The second peak of the double peak, which happened about a day after the first peak, likely resulted from regulated streamflow that had passed through the Hinckley Reservoir from upstream. At the other streamgages in the region, including those upstream from the Hinckley Reservoir, single peak streamflows were recorded during the flood.
Estimates of flood magnitudes for selected annual exceedance probabilities were updated at six selected streamgages with at least 10 years of record based on the peak streamflows from October 31 to November 2, 2019. At all six of those streamgages, the respective peak streamflows from October 31 to November 2, 2019, had estimated annual exceedance probabilities of less than 1 percent (greater than a 100-year recurrence interval). Though, at three of those six streamgages, previous annual peak streamflows of comparable magnitudes (within 10 percent) have also happened within the past 20 years.
References Cited
Benson, M.A., and Dalrymple, T., 1967, General field and office procedures for indirect discharge measurements: U.S. Geological Survey Techniques of Water-Resources Investigations, book 3, chap. A1, 30 p. [Also available at https://doi.org/10.3133/twri03A1.]
Bodhaine, G.L., 1968, Measurement of peak discharge at culverts by indirect methods: U.S. Geological Survey Techniques of Water-Resources Investigations, book 3, chap. A3, 60 p. [Also available at https://doi.org/10.3133/twri03A3.]
Brotzge, J.A., Wang, J., Thorncroft, C.D., Joseph, E., Bain, N., Bassill, N., Farruggio, N., Freedman, J.M., Hemker, K., Jr., Johnston, D., Kane, E., McKim, S., Miller, S.D., Minder, J.R., Naple, P., Perez, S., Schwab, J.J., Schwab, M.J., and Sicker, J., 2020, A technical overview of the New York state mesonet standard network: Journal of Atmospheric and Oceanic Technology, v. 37, no. 10, p. 1827–1845, accessed September 21, 2023, at https://doi.org/10.1175/JTECH-D-19-0220.1.
Colorado Climate Center, 2023, Community collaborative rain, hail & snow network: Colorado Climate Center database, accessed September 27, 2023, at https://www.cocorahs.org/.
Dalrymple, T., and Benson, M.A., 1968, Measurement of peak discharge by the slope-area method: U.S. Geological Survey Techniques of Water-Resources Investigations, book 3, chap. A2, 12 p. [Also available at https://doi.org/10.3133/twri03A2.]
Dewitz, J., 2023, National land cover database (NLCD) 2021 products: U.S. Geological Survey data release, accessed August 31, 2023, at https://doi.org/10.5066/P9JZ7AO3.
England, J.F., Jr., Cohn, T.A., Faber, B.A., Stedinger, J.R., Thomas, W.O., Jr., Veilleux, A.G., Kiang, J.E., and Mason, R.R., Jr., 2018, Guidelines for determining flood flow frequency—Bulletin 17C (ver. 1.1, May 2019) : U.S. Geological Survey Techniques and Methods, book 4, chap. B5, 148 p., accessed July 23, 2023, at https://doi.org/10.3133/tm4B5.
Flynn, K.M., Kirby, W.H., and Hummel, P.R., 2006, User’s manual for program PeakFQ, annual flood-frequency analysis using Bulletin 17B guidelines: U.S. Geological Survey Techniques and Methods, book 4, chap. B4, 42 p. [Also available at https://doi.org/10.3133/tm4B4.]
Graziano, A.P., Gazoorian, C.L., Smith, T.L., and Lilienthal, A.G., III, 2024, Flood-frequency data for six selected streamgages following the central New York flood of October 31–November 3, 2019: U.S. Geological Survey data release, https://doi.org/10.5066/P9SCOJ7M.
Griffis, V.W., and Stedinger, J.R., 2007, Evolution of flood frequency analysis with Bulletin 17: Journal of Hydrologic Engineering, v. 12, no. 3, p. 283–297, accessed April 30, 2021, at https://doi.org/10.1061/(ASCE)1084-0699(2007)12:3(283).
Griffis, V.W., and Stedinger, J.R., 2009, Log-Pearson type 3 distribution and its application in flood frequency analysis. III—Sample skew and weighted skew estimators: Journal of Hydrologic Engineering, v. 14, no. 2, p. 121–130, accessed April 30, 2021, at https://doi.org/10.1061/(ASCE)1084-0699(2009)14:2(121).
Holmes, R.R., Jr., and Dinicola, K., 2010, 100-year flood—It’s all about chance: U.S. Geological Survey General Information Product 106, 1 p. [Also available at https://doi.org/10.3133/gip106.]
Hulsing, H., 1967, Measurement of peak discharge at dams by indirect methods: U.S. Geological Survey Techniques of Water-Resources Investigations, book 3, chap. A5, 29 p. [Also available at https://doi.org/10.3133/twri03A5.]
Lumia, R., 1998, Flood of January 19–20, 1996 in New York State: U.S. Geological Survey Water-Resources Investigations Report 97–4252, 61 p., accessed June 23, 2021, at https://doi.org/10.3133/wri974252.
Lumia, R., Firda, G.D., and Smith, T.L., 2014, Floods of 2011 in New York: U.S. Geological Survey Scientific Investigations Report 2014–5058, 235 p., accessed May 4, 2021, at https://doi.org/10.3133/sir20145058.
Lumia, R., Freehafer, D.A., and Smith, M.J., 2006, Magnitude and frequency of floods in New York: U.S. Geological Survey Scientific Investigations Report 2006–5112, 152 p., accessed September 22, 2021, at https://doi.org/10.3133/sir20065112.
Masters, E., 2019, Floodwaters blamed for death of area priest: Times Union, November 1, accessed April 20, 2021, at https://www.timesunion.com/news/article/Local-priest-dies-in-Herkimer-County-flooding-14802860.php.
Matthai, H.F., 1967, Measurement of peak discharge at width contractions by indirect methods: U.S. Geological Survey Techniques of Water-Resources Investigations, book 3, chap. A4, 44 p. [Also available at https://doi.org/10.3133/twri03A4.]
Munger, E., 2013, Flood—More than 100 seek shelter in Fort Plain: The Daily Gazette, June 28, accessed April 21, 2021, at https://dailygazette.com/2013/06/28/more-100-seek-shelter-fort-plain/.
National Centers for Environmental Information, 2019, National temperature and precipitation maps: National Oceanic and Atmospheric Administration database, accessed April 21, 2021, at https://www.ncei.noaa.gov/temp-and-precip/us-maps/.
National Centers for Environmental Information, 2021, Global historical climatology network daily (GHCNd): National Oceanic and Atmospheric Administration database, accessed June 3, 2021, at https://www.ncei.noaa.gov/products/land-based-station/global-historical-climatology-network-daily.
National Weather Service, 2017a, Flooding and severe thunderstorms July 1 [Albany, N.Y., Weather Forecast Office]: National Oceanic and Atmospheric Administration data, accessed April 21, 2021, at https://www.weather.gov/aly/FloodSevere1Jul2017.
National Weather Service, 2017b, Flooding July 01, 2017 [Binghamton, N.Y., Weather Forecast Office]: National Oceanic and Atmospheric Administration data, accessed April 21, 2021, at https://www.weather.gov/bgm/pastFloodJuly012017.
National Weather Service, 2019a, Advanced hydrologic prediction service: National Oceanic and Atmospheric Administration database, accessed April 21, 2021, at https://water.weather.gov/ahps/.
National Weather Service, 2019b, Definitions and general terminology (rev. November 26, 2019): National Oceanic and Atmospheric Administration National Weather Service Manual 10–950, 5 p., accessed May 14, 2021, at https://www.nws.noaa.gov/directives/sym/pd01009050curr.pdf.
National Weather Service, 2019c, Flooding/severe storms October 31, 2019 [Binghamton, N.Y., Weather Forecast Office]: National Oceanic and Atmospheric Administration data, accessed April 21, 2021, at https://www.weather.gov/bgm/pastFloodOctober312019.
National Weather Service, 2019d, Mohawk River at Little Falls: National Oceanic and Atmospheric Agency Advanced Hydrologic Prediction Service database, accessed April 21, 2021, at https://water.weather.gov/ahps2/hydrograph.php?wfo=aly&gage=ltln6.
National Weather Service, 2019e, October 31–November 1, 2019, record flooding and high winds [Albany, N.Y., Weather Forecast Office]: National Oceanic and Atmospheric Administration data, accessed April 20, 2021, at https://www.weather.gov/aly/Halloween2019Storm.
National Weather Service, 2019f, Sacandaga River at Hope: National Oceanic and Atmospheric Agency Advanced Hydrologic Prediction Service database, accessed April 21, 2021, at https://water.weather.gov/ahps2/hydrograph.php?wfo=aly&gage=hopn6.
National Weather Service, 2019g, West Canada Creek at Hinckley Dam: National Oceanic and Atmospheric Agency Advanced Hydrologic Prediction Service database, accessed April 21, 2021, at https://water.weather.gov/ahps2/hydrograph.php?wfo=aly&gage=hikn6.
National Weather Service, 2019h, West Canada Creek at Kast Bridge: National Oceanic and Atmospheric Agency Advanced Hydrologic Prediction Service database, accessed April 21, 2021, at https://water.weather.gov/ahps2/hydrograph.php?wfo=aly&gage=kasn6.
National Weather Service, [undated], Major floods [Albany, N.Y., Weather Forecast Office]: National Oceanic and Atmospheric Administration data, accessed May 4, 2021, at https://www.weather.gov/aly/MajorFloods.
New York State Governor’s Office, 2019a, Governor Cuomo calls on federal government to grant disaster declaration for devastating October 31 storm: New York State Governor’s Office press release, November 27, 21 p., accessed April 20, 2021, at https://www.governor.ny.gov/news/governor-cuomo-calls-federal-government-grant-disaster-declaration-devastating-october-31-storm. [Also available at https://www.governor.ny.gov/sites/default/files/atoms/files/MajorDisasterDeclarationRequest_103119SevereWeatherEvent.pdf.]
New York State Governor’s Office, 2019b, Governor Cuomo declares state of emergency in 13 counties as heavy rains and high winds cause flooding and power outages: New York State Governor’s Office press release, November 1, 2019, accessed April 20, 2021, at https://www.governor.ny.gov/news/governor-cuomo-declares-state-emergency-13-counties-heavy-rains-and-high-winds-cause-flooding.
New York State Mesonet, 2019, Welcome to New York state mesonet: State University of New York University at Albany database, accessed April 28, 2021, at https://www2.nysmesonet.org/.
Northeast Regional Climate Center, 2021a, Extreme precipitation in New York & New England—An interactive web tool for extreme precipitation analysis: National Oceanic and Atmospheric Administration Northeast Regional Climate Center website, accessed April 22, 2021, at http://precip.eas.cornell.edu/.
Northeast Regional Climate Center, 2021b, Northeast RCC CLIMOD 2: National Oceanic and Atmospheric Administration Northeast Regional Climate Center database, accessed April 22, 2021, at http://climod2.nrcc.cornell.edu/.
Sauer, V.B., and Turnipseed, D.P., 2010, Stage measurement at gaging stations: U.S. Geological Survey Techniques and Methods, book 3, chap. A7, 45 p., accessed November 19, 2021, at https://doi.org/10.3133/tm3A7.
Scheller, M., Luey, K., and Garver, J.I., 2008, Major floods on the Mohawk River (NY)—1832–2000 (ver. 1.2, March 2008): Union College web page, accessed April 20, 2021, at https://minerva.union.edu/garverj/mohawk/170_yr.html.
Silver Jackets, 2013, The rivers, in The great flood of 1913—100 years later: National Oceanic and Atmospheric Administration Midwestern Regional Climate Center web page, accessed May 4, 2021, at https://mrcc.illinois.edu/1913Flood/storms_wx/rivers.shtml.
Suro, T.P., Firda, G.D., and Szabo, C.O., 2009, Flood of June 26–29, 2006, Mohawk, Delaware, and Susquehanna River basins, New York: U.S. Geological Survey Open-File Report 2009–1063, 354 p., accessed May 4, 2021, at https://doi.org/10.3133/ofr20091063.
Thompson, D., 2017, Heavy rain causes flooding, headaches in Herkimer County: Times Telegram, July 4, 2017, accessed April 21, 2021, at https://www.timestelegram.com/news/20170704/heavy-rain-causes-flooding-headaches-in-herkimer-county.
Turnipseed, D.P., and Sauer, V.B., 2010, Discharge measurements at gaging stations: U.S. Geological Survey Techniques and Methods, book 3, chap. A8, 87 p. [Also available at https://doi.org/10.3133/tm3A8.]
U.S. Geological Survey, 2012, Computation of annual exceedance probability (AEP) for characterization of observed flood peaks: U.S. Geological Survey Office of Surface Water Technical Memorandum 2013.01, 7 p., accessed April 29, 2021, at https://water.usgs.gov/admin/memo/SW/sw13.01.pdf.
U.S. Geological Survey, 2014, Requirements for the collection, validation, and input of peak-stage verification data at U.S. Geological Survey streamgages: U.S. Geological Survey Office of Surface Water Technical Memorandum 2014.06, accessed September 22, 2021, at https://water.usgs.gov/water-resources/memos/memo.php?id=505.
U.S. Geological Survey, 2016, USGS water data for the nation: U.S. Geological Survey National Water Information System database, accessed August 29, 2023, at https://doi.org/10.5066/F7P55KJN.
U.S. Geological Survey, 2019, StreamStats: U.S. Geological Survey map viewer, accessed August 29, 2023, at https://streamstats.usgs.gov/ss/.
U.S. Geological Survey, 2022, Watershed boundary dataset: U.S. Geological Survey National Hydrography website, accessed August 29, 2023, at https://nhd.usgs.gov/wbd.html.
Veilleux, A.G., and Wagner D.M., 2021, Methods for estimating regional skewness of annual peak flows in parts of eastern New York and Pennsylvania, based on data through water year 2013: U.S. Geological Survey Scientific Investigations Report 2021–5015, 38 p., accessed September 24, 2021, at https://doi.org/10.3133/sir20215015.
Veilleux, A.G., Cohn, T.A., Flynn, K.M., Mason, R.R., Jr., and Hummel, P.R., 2014, Estimating magnitude and frequency of floods using the PeakFQ 7.0 program: U.S. Geological Survey Fact Sheet 2013–3108, 2 p., accessed August 31, 2023, at https://doi.org/10.3133/fs20133108.
Wall, G.R., Murray, P.M., Lumia, R., and Suro, T.P., 2014, Maximum known stages and discharges of New York streams and their annual exceedance probabilities through September 2011: U.S. Geological Survey Scientific Investigations Report 2014–5084, 16 p., accessed April 30, 2021, at https://doi.org/10.3133/sir20145084.
Conversion Factors
U.S. customary units to International System of Units
Temperature in degrees Fahrenheit (°F) may be converted to degrees Celsius (°C) as follows: °C = (°F – 32) / 1.8.
Datum
Vertical coordinate information is referenced to the North American Vertical Datum of 1988 (NAVD 88), except in some cases where referenced to the New York State Barge Canal Datum (BCD).
Horizontal coordinate information is referenced to the North American Datum of 1983 (NAD 83).
Elevation, as used in this report, refers to distance above the vertical datum.
Supplemental Information
A water year is the period from October 1 to September 30 and is designated by the year in which it ends.
For more information, contact
Director, New York Water Science Center
U.S. Geological Survey
425 Jordan Road
Troy, NY 12180–8349
or visit our website at
https://www.usgs.gov/centers/ny-water
Publishing support provided by the Pembroke and Reston Publishing Service Centers
Disclaimers
Any use of trade, firm, or product names is for descriptive purposes only and does not imply endorsement by the U.S. Government.
Although this information product, for the most part, is in the public domain, it also may contain copyrighted materials as noted in the text. Permission to reproduce copyrighted items must be secured from the copyright owner.
Suggested Citation
Graziano, A.P., Gazoorian, C.L., Smith, T.L., and Lilienthal, A.G., III, 2024, Flood of October 31 to November 3, 2019, in the East Canada Creek, West Canada Creek, and Sacandaga River basins in central New York: U.S. Geological Survey Scientific Investigations Report 2023–5126, 37 p., https://doi.org/10.3133/sir20235126.
ISSN: 2328-0328 (online)
Study Area
| Publication type | Report |
|---|---|
| Publication Subtype | USGS Numbered Series |
| Title | Flood of October 31 to November 3, 2019, in the East Canada Creek, West Canada Creek, and Sacandaga River basins in central New York |
| Series title | Scientific Investigations Report |
| Series number | 2023-5126 |
| DOI | 10.3133/sir20235126 |
| Publication Date | January 17, 2024 |
| Year Published | 2024 |
| Language | English |
| Publisher | U.S. Geological Survey |
| Publisher location | Reston, VA |
| Contributing office(s) | New York Water Science Center |
| Description | Report: vii, 37 p.; Data Release |
| Country | United States |
| State | New York |
| Other Geospatial | East Canada Creek basin, West Canada Creek basin, Sacandaga River basin |
| Online Only (Y/N) | Y |
| Additional Online Files (Y/N) | N |