

An Update of Hydrologic Conditions and Distribution of Selected Constituents in Water, Eastern Snake River Aquifer and Perched Groundwater Zones, Idaho National Laboratory, Idaho, Emphasis 2019–21
Prepared in cooperation with the U.S. Department of Energy
Links
- Document: Report (6.2 MB pdf) , HTML , XML
- Data Releases:
- USGS data release - Datasets for the U.S. Geological Survey—Idaho National Laboratory groundwater and surface-water monitoring networks (v1.1)
- USGS data release - inldata---Collection of datasets for the U.S. Geological Survey-Idaho National Laboratory Aquifer Monitoring Networks, v1.1
- NGMDB Index Page: National Geologic Map Database Index Page (html)
- Download citation as: RIS | Dublin Core
Abstract
Since 1952, wastewater discharged to infiltration ponds (also called “percolation ponds”) and disposal wells at the Idaho National Laboratory (INL) has affected water quality in the eastern Snake River Plain (ESRP) aquifer and perched groundwater zones underlying the INL. The U.S. Geological Survey (USGS), in cooperation with the U.S. Department of Energy (DOE), maintains groundwater-monitoring networks at the INL to determine hydrologic trends and to delineate the movement of radiochemical and chemical wastes in both the aquifer and perched groundwater zones. This report presents an analysis of water-level and water-quality data collected from the ESRP aquifer and perched groundwater wells from the USGS groundwater monitoring networks during 2019–21.
From March–May 2018 to March–May 2021, water levels in wells completed in the ESRP aquifer increased in the northern part of the INL and decreased in the southwestern part. Water-level increases ranged from 0.02 to 1.04 feet in the northern part and decreases ranged from 0.03 to 2.94 feet in the southwestern part of the INL.
Detectable concentrations of radiochemical constituents in water samples from wells in the ESRP aquifer at the INL generally decreased or remained constant during 2019–21. Decreases in concentrations were attributed to radioactive decay, changes in waste-disposal methods, and dilution from recharge and underflow.
In 2021, tritium was detected above reporting levels in water samples collected from 46 of 105 aquifer wells and ranged from 150±50 to 4,280±150 picocuries per liter (pCi/L). Tritium concentrations from eight wells completed in deep perched groundwater near the Advanced Test Reactor Complex (ATRC) generally were greater than or equal to the reporting level during at least one sampling event during 2019–21, and concentrations ranged from 160±50 to 2,097±107 pCi/L. Concentrations of strontium-90 in water from 12 of 45 aquifer wells sampled in 2021 exceeded the reporting level, and concentrations ranged from 2.5±0.7 to 299±6 pCi/L. During 2021, concentrations of strontium-90 from five wells completed in deep perched groundwater at the ATRC equaled or exceeded the reporting levels, and concentrations ranged from 3±0.9 pCi/L to 27.8±1.3 pCi/L. Concentrations of cesium-137 were less than the reporting level in all but one aquifer well, and concentrations of plutonium-238, plutonium-239, -240 (undivided), and americium-241 were less than the reporting level in water samples from all aquifer wells sampled during this study period.
Dissolved chromium concentrations in water samples from 64 ESRP aquifer wells ranged from less than (<) 0.5 to 76.4 micrograms per liter (µg/L). During 2019–21, dissolved chromium was detected in water from wells completed in deep perched groundwater above the ESRP aquifer at the ATRC, and concentrations ranged from <1 to 82.1 µg/L.
In 2021, concentrations of dissolved sodium in water from most ESRP aquifer wells in the southern part of the INL were greater than the western tributary groundwater background concentration of 8.3 milligrams per liter (mg/L). During 2021, dissolved sodium concentrations in water from 15 wells completed in deep perched groundwater ranged from 11.7 to 122.5 mg/L. Variations in sodium concentrations in aquifer wells and perched groundwater zones are attributed to either migration of remnant water from the former chemical-waste ponds or disposal volume and composition variability in percolation ponds installed in 2008.
In 2021, concentrations of chloride in most water samples from ESRP aquifer wells south of the Idaho Nuclear Technology and Engineering Center (INTEC) and at the Central Facilities Area (CFA) exceeded background concentrations. Chloride concentrations in water from wells south of the INTEC have generally decreased because of discontinued chloride disposal to the legacy percolation ponds since 2002 when the discharge of wastewater was discontinued. During 2019–21, dissolved chloride concentrations in deep perched groundwater above the ESRP aquifer from 18 wells at the ATRC ranged from 8.15 to 231 mg/L.
In 2021, sulfate concentrations in water samples from ESRP aquifer wells in the south-central part of the INL that exceeded the background concentration of sulfate, ranged from 21 to 141 mg/L. The greater-than-background concentrations in water from these wells are attributed to sulfate disposal at the ATRC infiltration ponds or the legacy INTEC percolation ponds. In 2021, sulfate concentrations in water samples from aquifer wells near the Radioactive Waste Management Complex (RWMC) were mostly greater than background concentrations. The maximum dissolved sulfate concentration in shallow perched groundwater near the ATRC was 575 mg/L in 2021. During 2021, dissolved sulfate concentrations in water from wells completed in deep perched groundwater near the cold waste ponds at the ATRC ranged from 22.3 to 519 mg/L.
In 2021, concentrations of nitrate in water from most ESRP aquifer wells at and near the INTEC exceeded the western tributary groundwater background concentration of 0.655 mg/L. Concentrations of nitrate in aquifer wells southwest of INTEC and farther away from the influence of disposal areas and the Big Lost River, in intermittent source of surface water recharge to the aquifer, show a general decrease in nitrate concentration over time. Two aquifer wells south of INTEC show increasing trends that could result from wastewater beneath the INTEC tank farm being mobilized to the aquifer.
During 2019–21, water samples from several ESRP aquifer wells were collected and analyzed for volatile organic compounds (VOCs). Twelve VOCs were detected, and 1–4 VOCs were detected in water samples from 10 wells. The most frequently detected VOCs include carbon tetrachloride (tetrachloromethane), trichloromethane, tetrachloroethene, 1,1,1-trichloroethane, and trichloroethene. In 2019–21, concentrations for all VOCs were less than their respective maximum contaminant levels (MCLs) for drinking water, except carbon tetrachloride in one well, trichloroethene in two wells, and vinyl chloride in one well.
During 2019–21, variability and bias were evaluated from 34 replicate and 14 blank quality-assurance samples. Results from replicate analyses were investigated to evaluate sample variability. Constituents with acceptable reproducibility were major ions, trace elements, nutrients, and VOCs. All radiochemical constituents including gross alpha- and beta- radioactivity, strontium-90, cesium-137, and tritium, had acceptable reproducibility. Bias from sample contamination was evaluated from equipment, field, and source-solution blanks. Chloride and sulfate were detected slightly above their respective method detection limits in equipment and field blanks, but at concentrations well below the co-collected sample for that well. These chloride and sulfate detections in the field and equipment blanks were inconsequential because they weren’t detected above the analysis-specific variability for those constituents as determined by replicate sample result evaluation. None of the detections of nutrients and trace inorganic constituents were high enough to indicate environmental sample or analytical procedure bias.
Introduction
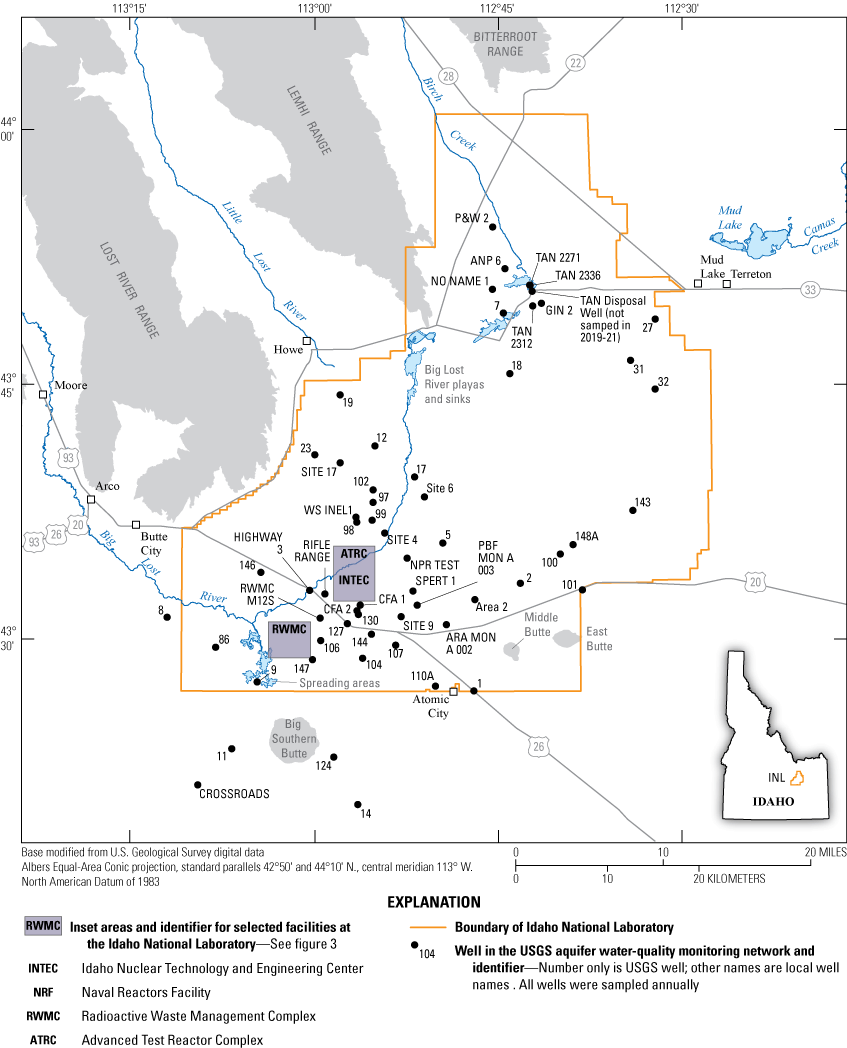
The Idaho National Laboratory (INL), operated by the U.S. Department of Energy (DOE), encompasses approximately 890 square miles of the eastern Snake River Plain (ESRP) in southeastern Idaho (fig. 1). The INL was established in 1949 to develop atomic energy, conduct nuclear safety research, and carry out defense program research. Currently, the INL is developing advanced energy concepts and novel energy solutions to ensure the future security of the nation’s energy resources and technologies. Wastewater disposal sites at the Test Area North (TAN), the Naval Reactors Facility (NRF), the Advanced Test Reactor Complex (ATRC), and the Idaho Nuclear Technology and Engineering Center (INTEC) (fig. 1) have contributed radiochemical- and chemical-waste contaminants to the ESRP aquifer since 1952 (Bartholomay, 2022). The ESRP aquifer is an important source of drinking water for 300,000 people in southern Idaho (Department of Environmental Quality, 2021). These INL sites incorporated various wastewater disposal methods, including lined evaporation ponds, unlined percolation (infiltration) ponds and ditches, drain fields, and injection wells. Solid and liquid waste materials buried in shallow pits and trenches in the Subsurface Disposal Area (SDA) at the Radioactive Waste Management Complex (RWMC) also have contributed contaminants to the groundwater.
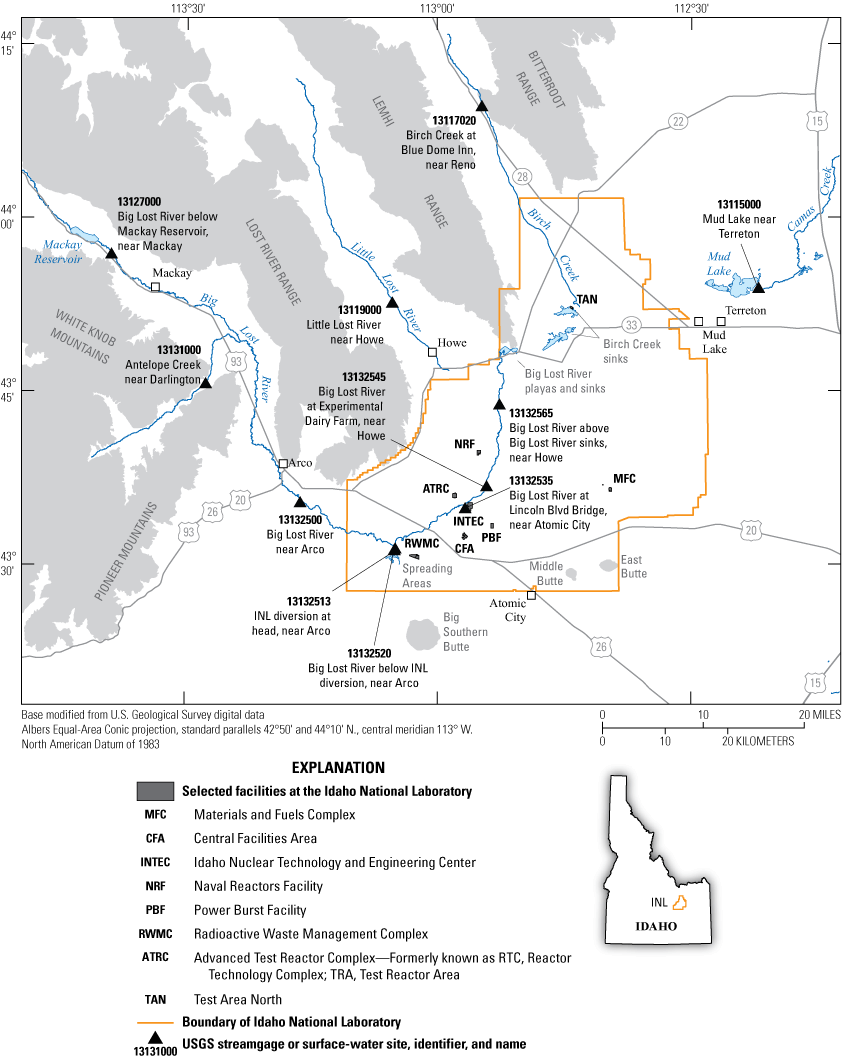
Location of the Idaho National Laboratory (INL), surface-water streamgages, and selected facilities, eastern Snake River Plain (ESRP), southeastern Idaho. Additional site information can be found in U.S. Geological Survey (2023, https://doi.org/10.5066/F7P55KJN).
Wastewater disposal has resulted in the detection of several waste constituents in the ESRP aquifer underlying the INL. Disposal of wastewater to infiltration ponds and infiltration of surface water at waste-burial sites has resulted in the formation of perched groundwater in basalts and in sedimentary interbeds that overlie the ESRP aquifer (Cecil and others, 1991). Perched groundwater is an integral part of the pathway for waste-constituent migration to the aquifer.
The DOE requires information about the mobility of radiochemical- and chemical-waste constituents in both the ESRP aquifer and in perched groundwater above the aquifer in order to assess the effect of INL facility operations on water quality and to aid in remediation activities. Waste-constituent mobility is determined, in part, by (1) the rate and direction of groundwater flow, (2) the locations, quantities, and methods of waste disposal, (3) waste-constituent chemistry, and (4) the geochemical processes taking place in the aquifer. This study was conducted by the U.S. Geological Survey (USGS) in cooperation with the DOE Idaho Operations Office.
Purpose and Scope
In 1949, the U.S. Atomic Energy Commission, which later became the DOE, requested that the USGS describe the water resources of the area now known as the INL. The purpose of the resulting study was to characterize these resources before the development of nuclear-reactor testing facilities. Since that time, the USGS has maintained water-level and water-quality monitoring networks at the INL to determine hydrologic trends and to delineate the movement of radiochemical and chemical wastes in both the ESRP aquifer and in perched groundwater.
This report presents an analysis of water-level and water-quality data collected from wells in the USGS groundwater monitoring networks during 2019–21 as part of ongoing hydrogeologic investigations conducted by the USGS at the INL. This report describes the distribution and concentration of selected radiochemical and chemical constituents in the ESRP aquifer and perched groundwater at the INL, and the changes in the regional water levels from 2019 through 2021. This report also summarizes the history of waste disposal at the ATRC (formerly known as the Test Reactor Area [TRA]), INTEC (formerly known as the Idaho Chemical Processing Plant [ICPP]), RWMC, TAN, NRF, and the Central Facilities Area (CFA).
Previous Investigations
A series of reports describing the INL discuss hydrologic conditions and the distribution of selected wastewater constituents in groundwater and perched groundwater. Table 1 summarizes the investigation periods and selected previous investigations on the geology, hydrology, and water characteristics at and near the INL. Numerous previous investigations on the hydrology and geology at the INL have been conducted by INL contractors, State agencies, and the USGS. A list of all the reports published by the USGS on project work completed at the INL can be found in Fisher (2022, https://rconnect.usgs.gov/inlpo/inlpubs/).
Table 1.
Summary of selected previous investigations on geology, hydrology, and characteristics of groundwater and perched groundwater, Idaho National Laboratory, Idaho, 1961–2021.[Summary: NA, not applicable; NRTS, National Reactor Testing Station; RWMC, Radioactive Waste Management Complex; INEL, Idaho National Engineering Laboratory; INEEL, Idaho National Engineering and Environmental Laboratory; INL, Idaho National Laboratory; ATRC, Advanced Test Reactor Complex; RTC, Reactor Testing Complex; ICPP, Idaho Chemical Processing Plant; INTEC, Idaho Nuclear Technology and Engineering Center]
| Reference | Investigation period | Summary | |
|---|---|---|---|
| Jones (1961) | NA | Hydrology of waste disposal at the NRTS | |
| Olmsted (1962) | NA | Chemical and physical character of groundwater at the NRTS | |
| Morris and others (1963, 1964, 1965) | NA | Hydrology of waste disposal at the NRTS | |
| Barraclough and others (1967a) | 1965 | Hydrology of the NRTS | |
| Barraclough and others (1967b) | 1966 | Hydrology of the NRTS | |
| Nace and others (1975) | NA | Generalized geologic framework of the NRTS | |
| Robertson and others (1974) | NA | Effects of waste disposal on the geochemistry of groundwater at the NRTS | |
| Barraclough and others (1976) | NA | Hydrology of the solid waste burial ground (now the RWMC) | |
| Barraclough and Jensen (1976) | 1971–73 | Hydrologic data for the Idaho INEL | |
| Barraclough and others (1981) | 1974–78 | Hydrologic conditions for the INEL | |
| Lewis and Jensen (1985) | 1979–81 | Hydrologic conditions for the INEL | |
| Pittman and others (1988) | 1982–85 | Hydrologic conditions for the INEL | |
| Orr and Cecil (1991) | 1986–88 | Hydrologic conditions and distribution of selected chemical constituents in water at the INEL | |
| Bartholomay and others (1995) | 1989–91 | Hydrologic conditions and distribution of selected radiochemical and chemical constituents in water, INEL | |
| Bartholomay and others (1997) | 1992–95 | Hydrologic conditions and distribution of selected radiochemical and chemical constituents in water, INEL | |
| Bartholomay and others (2000) | 1996–98 | Hydrologic conditions and distribution of selected constituents in water, INEEL | |
| Davis (2006a) | 1999–2001 | Hydrologic conditions and distribution of selected radiochemical and chemical constituents in water, INL | |
| Ackerman and others (2006) | NA | Conceptual model of groundwater flow in the eastern Snake River Plain aquifer, INL, with implications for contaminant transport | |
| Davis (2008) | 2002–05 | Hydrologic conditions and distribution of selected radiochemical and chemical constituents in groundwater and perched groundwater, INL | |
| Bartholomay and Twining (2010) | 2006–08 | Vertical distribution of selected constituents in water from wells equipped with Westbay packer sampling systems, INL | |
| Davis and others (2013) | 2009–11 | Hydrologic conditions and distribution of selected radiochemical and chemical constituents in groundwater and perched groundwater, INL, Idaho | |
| Bartholomay and others (2015) | 2009–13 | Vertical distribution of selected constituents in water from wells equipped with Westbay packer sampling systems | |
| Davis and others (2015) | 1981–2012 | Water quality trends for wells influenced by wastewater disposal at the INL | |
| Bartholomay and Twining (2015) | 1949–2014 | Hydrologic influences on water level changes in groundwater wells at the INL, Idaho | |
| Bartholomay and others (2017a) | 2012–15 | Hydrologic conditions and distribution of selected radiochemical and chemical constituents in groundwater and perched groundwater, INL, Idaho | |
| Rattray (2018) | NA | Geochemistry of groundwater eastern Snake River Plain aquifer, INL | |
| Rattray (2019) | NA | Evaluation of chemical and hydrologic processes in the eastern Snake River Plain aquifer based on geochemical modeling | |
| Twining and Maimer (2019) | 2017–18 | Transmissivity and geophysical data for selected wells located at and near the Idaho National Laboratory, Idaho, 2017–18 | |
| Bartholomay and others (2020) | 2016–18 | Hydrologic conditions and distribution of selected radiochemical and chemical constituents in groundwater and perched groundwater, INL, Idaho | |
| Fisher and others (2021) | 1989–21 | Optimization of the INL water-quality aquifer monitoring network | |
| Barraclough and others (1967a) | 1965 | Extent of perched groundwater and distribution of selected wastewater constituents in perched groundwater at the ATRC | |
| Barraclough and others (1967b) | 1966 | Extent of perched groundwater and distribution of selected wastewater constituents in perched groundwater at the ATRC | |
| Robertson and others (1974) | NA | Analysis of perched groundwater and conditions related to the disposal of wastewater to the subsurface at the INEL | |
| Barraclough and Jensen (1976) | NA | Extent of perched groundwater and distribution of selected wastewater constituents in perched groundwater at the ATRC | |
| Robertson (1977) | NA | Numerical model simulating flow and transport of chemical and radionuclide constituents through perched water at the ATRC | |
| Barraclough and others (1981) | 1974–78 | Hydrologic conditions for the INEL, Idaho | |
| Lewis and Jensen (1985) | 1979–81 | Hydrologic conditions for the INEL, Idaho | |
| Pittman and others (1988) | 1982–85 | Hydrologic conditions for the INEL, Idaho | |
| Hull (1989) | NA | Conceptual model that described migration pathways for wastewater and constituents from the radioactive-waste infiltration ponds at the ATRC | |
| Anderson and Lewis (1989) | NA | Correlation of drill cores and geophysical logs to describe a sequence of basalt flows and sedimentary interbeds in the unsaturated zones underlying the RWMC | |
| Anderson (1991) | NA | Correlation of drill cores and geophysical logs to describe a sequence of basalt flows and sedimentary interbeds in the unsaturated zones underlying the RTC and INTEC | |
| Ackerman (1991) | NA | Analyzed data from 43 aquifer tests conducted in 22 wells to estimate transmissivity of basalts and sedimentary interbeds containing perched groundwater beneath the ATRC and INTEC | |
| Cecil and others (1991) | 1986–88 | Mechanisms for formation of perched water at the ATRC, ICPP, and RWMC, INEL, Idaho; distribution of chemical and radiochemical constituents in perched water at the ATRC, ICPP and RWMC | |
| Tucker and Orr (1998) | NA | Hydrologic conditions and distribution of selected radiochemical and chemical constituents in perched groundwater, INEL | |
| Bartholomay (1998) | 1992–95 | Hydrologic conditions and distribution of selected radiochemical and chemical constituents in perched groundwater, INEL | |
| Orr (1999) | NA | Transient numerical simulation to evaluate a conceptual model of flow through perched water beneath wastewater infiltration ponds at the ATRC | |
| Bartholomay and Tucker (2000) | 1996–98 | Hydrologic conditions and distribution of selected radiochemical and chemical constituents in perched groundwater, INEEL | |
| Davis (2006a) | 1999–2001 | Hydrologic conditions and distribution of selected radiochemical and chemical constituents in perched groundwater, INL | |
| Davis (2008) | 2002–05 | Hydrologic conditions and distribution of selected radiochemical and chemical constituents in groundwater and perched groundwater, INL | |
| Davis (2010) | 2006–08 | Hydrologic conditions and distribution of selected radiochemical and chemical constituents in groundwater and perched groundwater, INL | |
| Davis and others (2013) | 2009–11 | Hydrologic conditions and distribution of selected radiochemical and chemical constituents in groundwater and perched groundwater, INL | |
| Davis and others (2015) | 1981–12 | Water quality trends for wells influenced by wastewater disposal at the INL | |
| Bartholomay and others (2017a) | 2012–15 | Hydrologic conditions and distribution of selected radiochemical and chemical constituents in groundwater and perched groundwater, INL | |
| Bartholomay and others (2020) | 2016–18 | Hydrologic conditions and distribution of selected radiochemical and chemical constituents in groundwater and perched groundwater, INL | |
Groundwater Monitoring Networks
The USGS maintains groundwater monitoring networks at the INL to characterize the occurrence, movement, and quality of water, and to delineate waste-constituent plumes in the ESRP aquifer and perched groundwater zones. Periodic water-level and water-quality data are obtained from these networks at different frequencies. Site location information from these monitoring networks are available at U.S. Geological Survey (2023, https://doi.org/10.5066/F7P55KJN). Water quality data from these monitoring networks are available at Fisher and others (2024, https://doi.org/10.5066/P9UWRYR4).
Water-Level Monitoring Network
The USGS ESRP aquifer water-level monitoring network was designed to determine hydraulic-gradient changes that affect the rate and direction of groundwater and waste-constituent movement in the ESRP aquifer, to identify sources of recharge to the aquifer, and to measure the effects of recharge. A continuous monitoring transducer was installed at Site 17 in 2020 to provide additional high-frequency water-level information in the west-central part of the INL. New monitoring wells (TAN-2336, USGS 148, USGS 148A, and USGS 149) were completed during 2019–2021 and were added to the water-level monitoring program in locations needing additional water-level information (Twining and others, 2021a, 2023). As of December 2021, water levels were monitored in 175 ESRP aquifer wells. Five of these wells have two or more piezometers in them to measure different levels of the aquifer. Water levels were measured annually in 49 wells, semiannually in 44 wells, triannually in 3 wells, quarterly in 54 wells, monthly in 15 wells, and continuously in 10 aquifer wells. Figures 2–3 show the locations of aquifer wells and the frequency of water-level measurements as of December 2021.
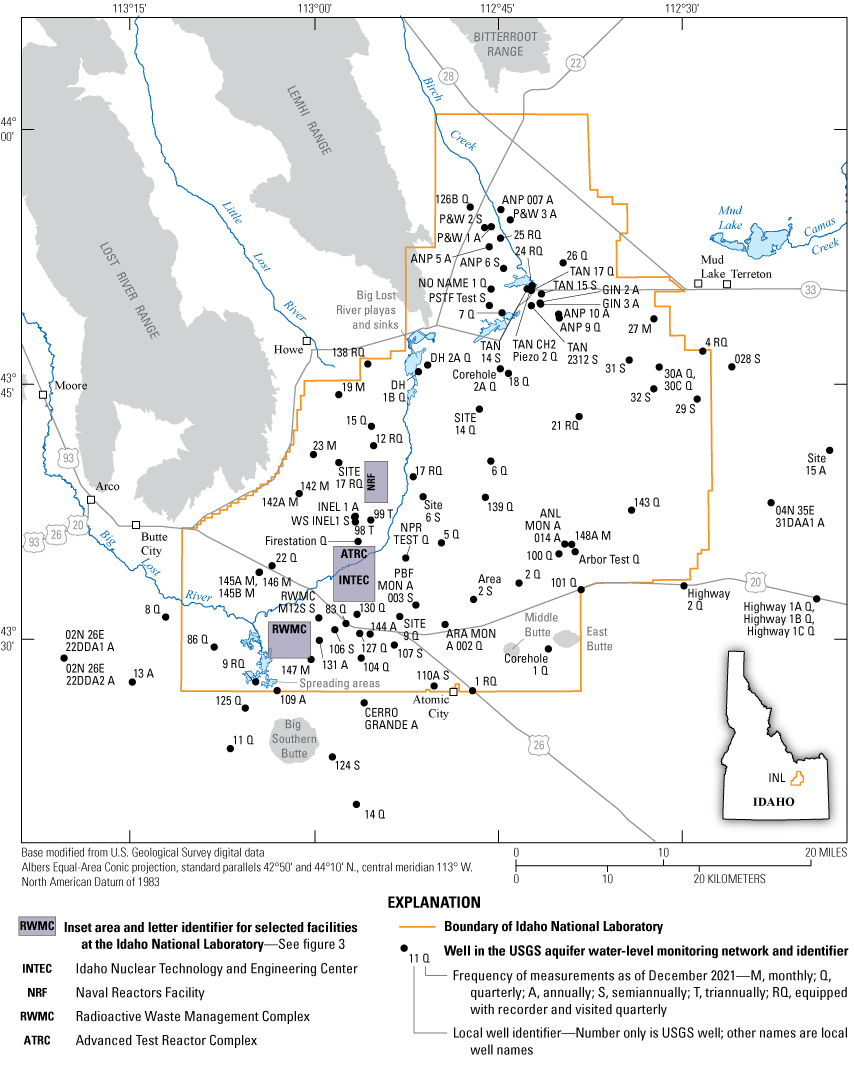
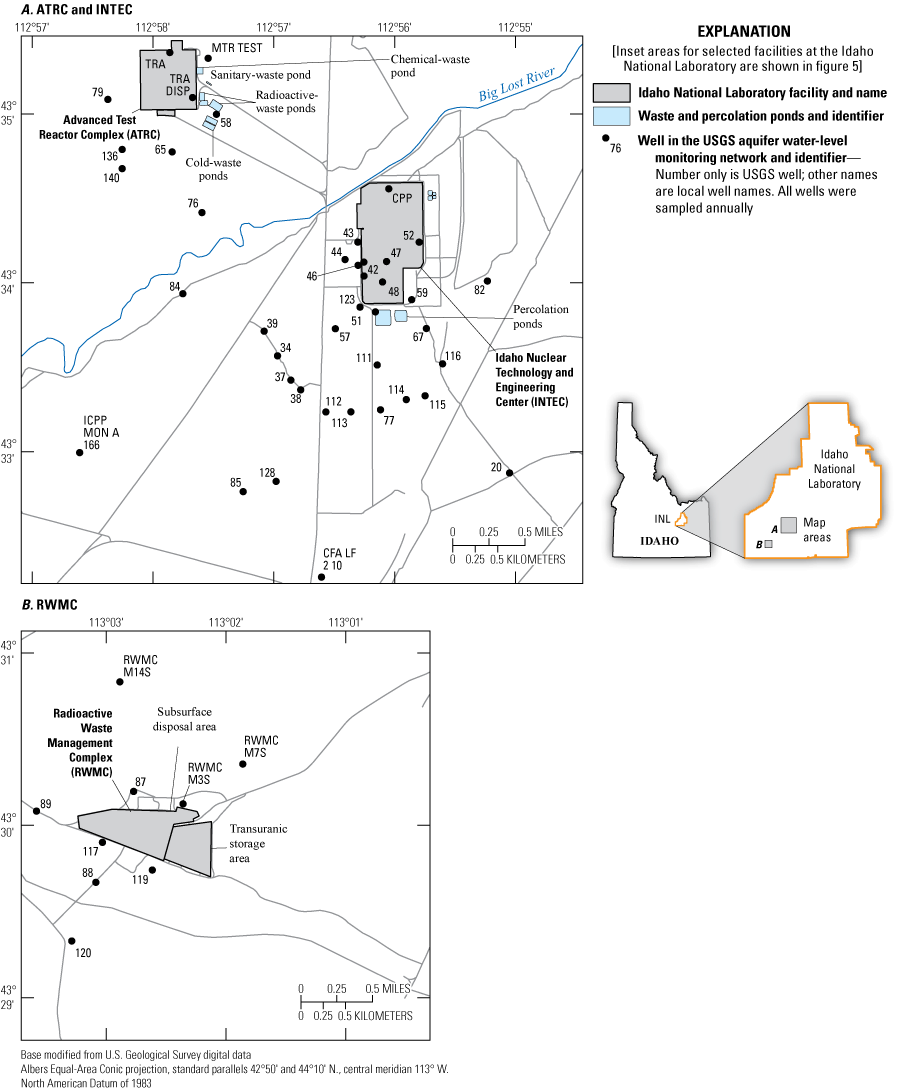
Locations of wells in the U.S. Geological Survey (USGS) aquifer water-level monitoring network at and near the Idaho National Laboratory (INL), Idaho, and the frequency of water-level measurements, as of December 2021. Additional site information can be found in U.S. Geological Survey (2023, https://doi.org/10.5066/F7P55KJN).
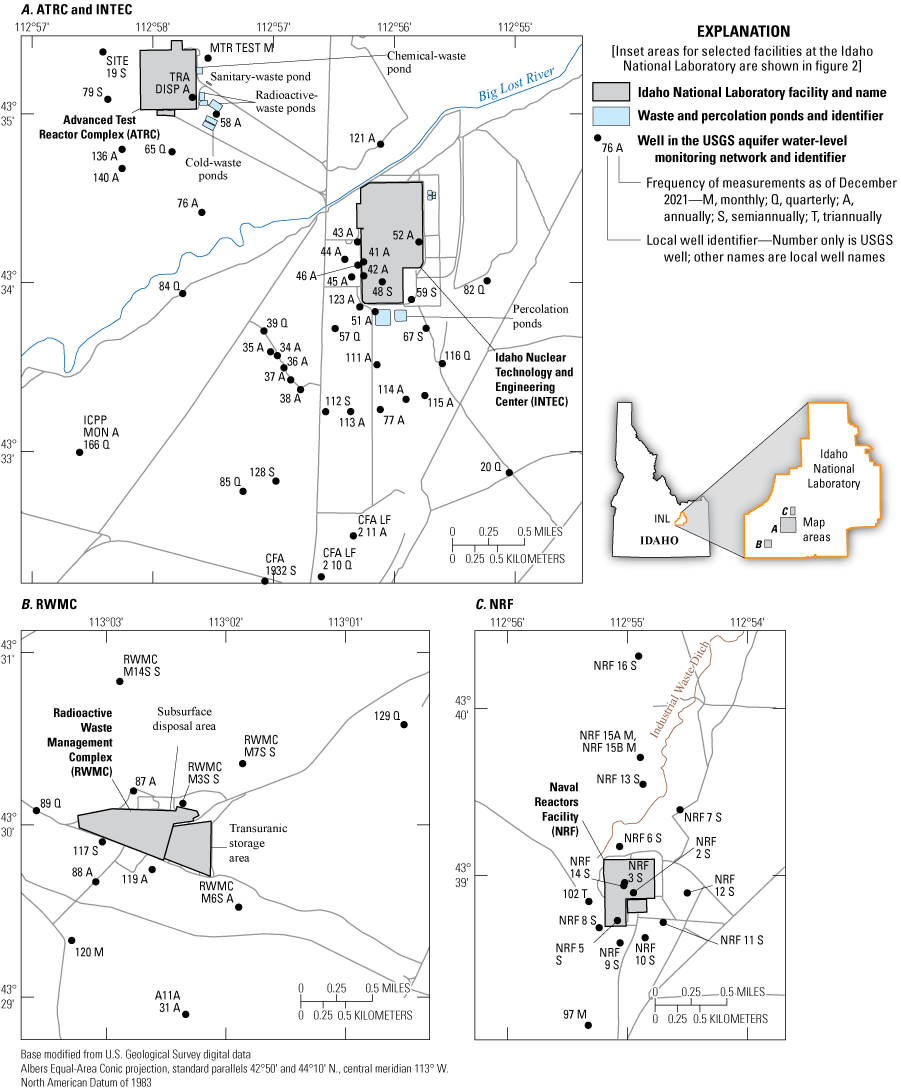
Locations of wells in the U.S. Geological Survey (USGS) aquifer water-level monitoring network at the Advanced Test Reactor Complex, Idaho Nuclear Technology and Engineering Center, Radioactive Waste Management Complex, and Naval Reactors Facility, Idaho National Laboratory, Idaho, and the frequency of water-level measurements, as of December 2021. Additional site information can be found in U.S. Geological Survey (2023, https://doi.org/10.5066/F7P55KJN).
The USGS perched groundwater-level monitoring network was designed to estimate the extent and volume of perched groundwater in storage. Perched groundwater occurs beneath some of the facilities at the INL due to the differences in vertical hydraulic conductivity between basalt layers and sedimentary interbeds, which provide a mechanism for the development of zones that are able to hold water for extended periods of time (Cecil and others, 1991, p. 17). Perching mechanisms are attributed to either contrasting hydraulic properties between sedimentary interbeds and basalts or between low-permeability basalt-flow interiors and overlying fractured basalt. Due to this behavior, there are localized shallow and deep perched groundwater zones at the INL. Shallow perched groundwater is water perched in surficial sediment deposits, and deep perched groundwater is water perched at a greater depth.
As of December 2021, water levels in 29 wells completed in the shallow and deep perched zones (fig. 4) were monitored. At the ATRC, the network included 9 wells to monitor shallow (<64 feet [ft] bls) perched groundwater levels and 20 wells to monitor deep perched groundwater levels. Southwest of the INTEC, the network included one well (ICPP-MON-V-200) to monitor perched groundwater levels around the new INTEC percolation pond. Perched groundwater at the RWMC was measured in well USGS 92 when water was available in the borehole. Well locations and frequency of water-level measurements as of December 2021 are shown in figure 4.
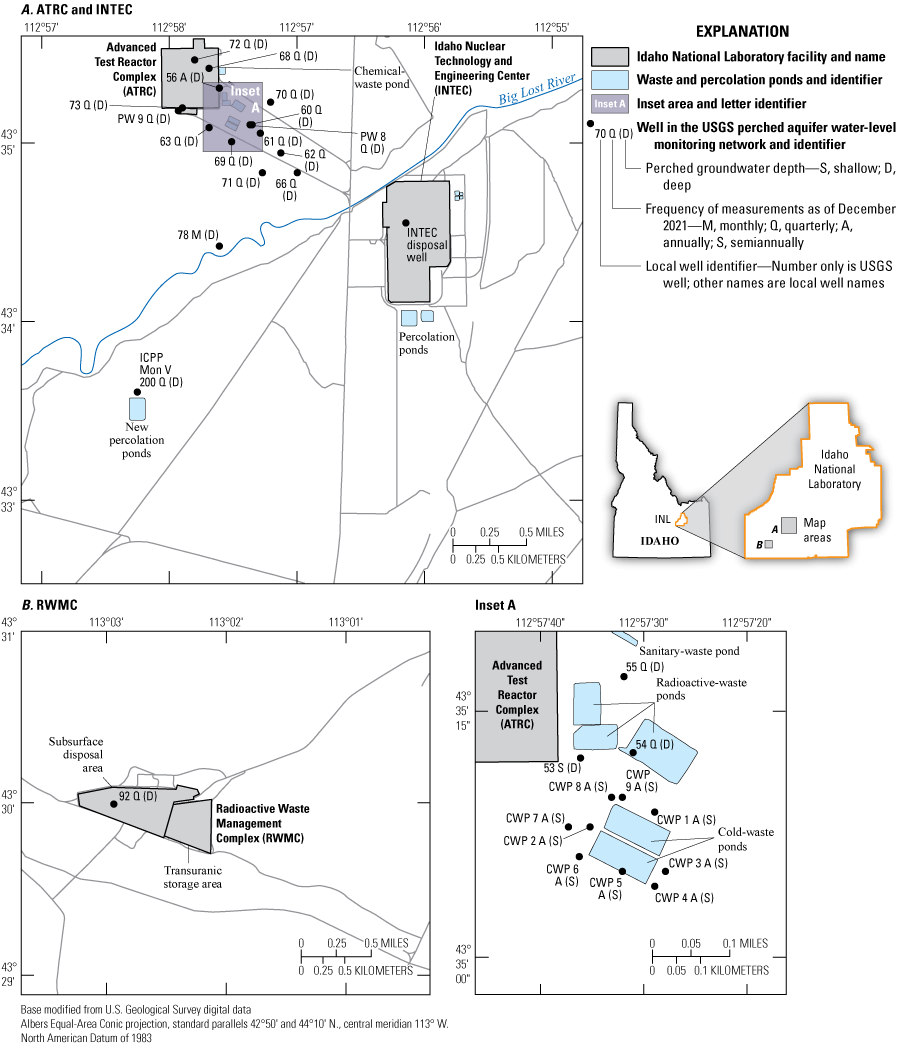
Map showing the location of wells in the U.S. Geological Survey (USGS) perched groundwater-level monitoring network at the Advanced Test Reactor Complex, Idaho Nuclear Technology and Engineering Center, and Radioactive Waste Management Complex, Idaho National Laboratory, Idaho, and the frequency of water-level measurements, as of December 2021. Additional site information can be found in U.S. Geological Survey (2023, https://doi.org/10.5066/F7P55KJN).
Water-Quality Monitoring Network
The radiochemical and chemical character of groundwater and perched groundwater in the ESRP aquifer was determined from analyses of water samples collected as part of a comprehensive sampling program to identify contaminant concentrations and to define patterns of waste migration in the aquifer and perched groundwater zones. Water samples were collected annually and analyzed to identify trends in water quality from wells that penetrate the aquifer (or perched zones) at various depths and with differing well completions (open hole or screened). Numerous water samples were collected from both aquifer and perched groundwater wells near areas of detailed studies, such as the ATRC, INTEC, RWMC, TAN, and CFA (see fig. 2). Water samples from NRF and the multilevel monitoring systems (MLMS) were collected and analyzed as part of separate studies. Water-quality results from all of these locations are available at Fisher and others (2024).
The type and depth of groundwater-quality sampling generally depends on the information needed in a specific area. Water samples were routinely collected and analyzed for some combination of concentrations of tritium, strontium-90, cesium-137, plutonium-238, plutonium-239, -240 (undivided), americium-241, gross alpha- and beta-particle radioactivity, chromium, sodium, chloride, sulfate, nutrients including nitrite plus nitrate (as nitrogen [N]), nitrite (as N), orthophosphate (as phosphorus), ammonia (as N), volatile organic compounds (VOCs), and field measurements of specific conductance, pH, and temperature. Additionally, as was adopted in 1994 (Sehlke and Bickford, 1993), water samples from several wells were analyzed for fluoride and an extended suite of trace elements.
When a new well is drilled by the USGS at the INL, samples are collected and analyzed for all constituents previously listed, in addition to a full suite of cations and anions, and carbon, deuterium, oxygen, and uranium isotopes. A schedule listing the constituents that are typically analyzed is provided in a report by Bartholomay and others (2014, app. A; 2021, app. A). The locations and types of wells and the water sample collection method in the aquifer water-quality monitoring network as of December 2021 are shown in figures 5 and 6 and in tables 2 and 3. Wells USGS 148, 148A, 149, and well TAN 2336 (Twining and others, 2021, 2023) were completed during 2019–21 for water quality monitoring. Well locations in the USGS water-quality monitoring network for perched groundwater beneath INL facilities as of December 2021 are shown in figure 7. All wells were scheduled to be sampled annually, but occasional pump problems or dry wells prevented some samples from being collected as scheduled.
Locations of wells in the U.S. Geological Survey (USGS) aquifer water-quality monitoring network at and near the Idaho National Laboratory (INL), Idaho, December 2021. Additional site information can be found in U.S. Geological Survey (2023, https://dx.doi.org/10.5066/F7P55KJN).
Locations of wells in the U.S. Geological Survey (USGS) aquifer water-quality monitoring network at the Advanced Test Reactor Complex, Idaho Nuclear Technology and Engineering Center, and Radioactive Waste Management Complex, Idaho National Laboratory, Idaho, December 2021. Additional site information can be found in U.S. Geological Survey (2023, https://dx.doi.org/10.5066/F7P55KJN).
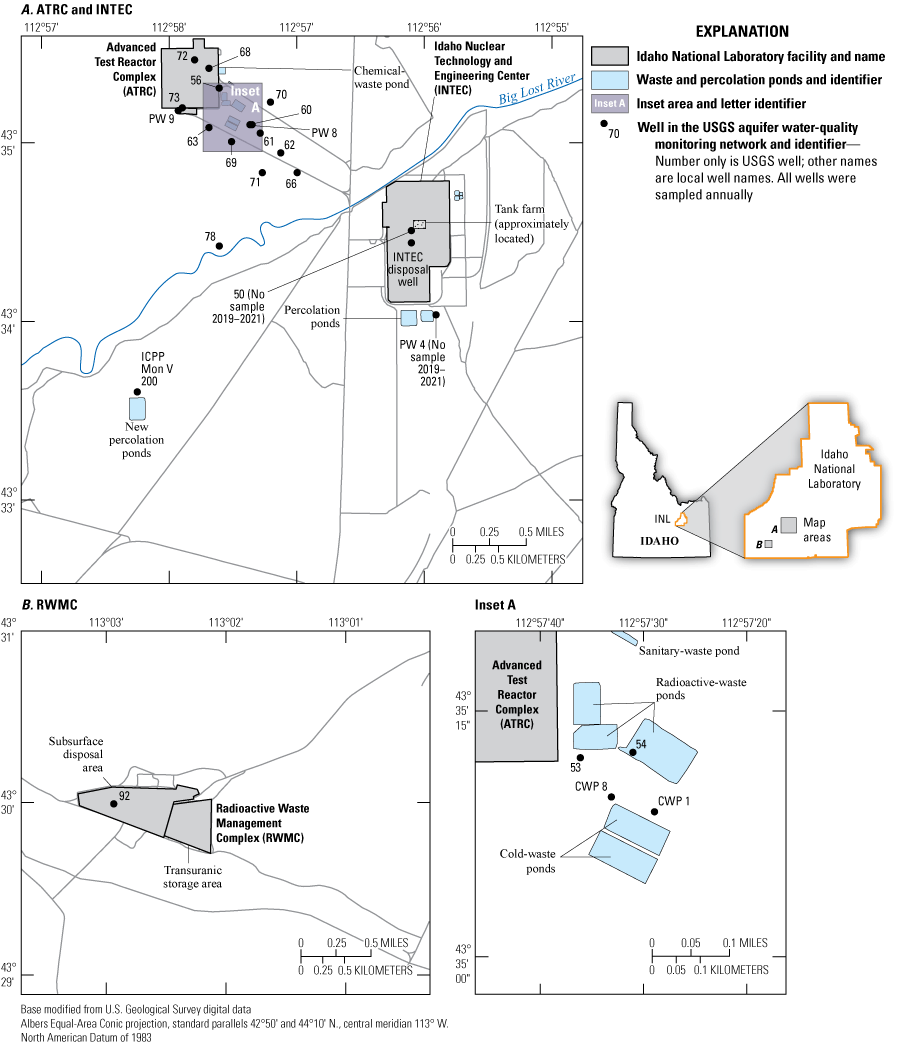
Locations of wells in the U.S. Geological Survey (USGS) perched groundwater-quality monitoring network at the Advanced Test Reactor Complex, Idaho Nuclear Technology and Engineering Center, and Radioactive Waste Management Complex, Idaho National Laboratory, Idaho, as of December 2021. Additional site information can be found in U.S. Geological Survey (2023, https://dx.doi.org/10.5066/F7P55KJN).
Table 2.
Diameter and depth of wells in the U.S. Geological Survey (USGS) aquifer water-quality monitoring network and water sample-collection methods, eastern Snake River Plain aquifer, Idaho National Laboratory, Idaho, as of December 2021.[Additional site information can be found in U.S. Geological Survey (2023, https://dx.doi.org/10.5066/F7P55KJN). All wells are sampled annually. Well name: Well locations are shown in figures 5 and 6. All samples collected via dedicated pump except Highway 3, which is collected via tap.]
Table 3.
Diameter and depth of wells in the U.S. Geological Survey (USGS) perched groundwater-quality monitoring network and water sample-collection method at the Advanced Test Reactor Complex, Idaho Nuclear Technology and Engineering Center, and Radioactive Waste Management Complex, Idaho National Laboratory, Idaho, as of December 2021.[Additional site information is in U.S. Geological Survey (2023, https://dx.doi.org/10.5066/F7P55KJN). All wells are sampled annually. Well name: Well locations are shown in figure 7. Sample-collection method: Bail, sampled using a bailer; Pump, sampled from a pumping well; Tap, sampled from a faucet]
Waste-Disposal Sites at the Idaho National Laboratory
Wastewater disposal at INL facilities (fig. 1) has been the principal source of radiochemical- and chemical-waste constituents in water from the ESRP aquifer and in perched groundwater zones at and near the INL. In the past, wastewater disposal sites included infiltration ponds (percolation ponds) and ditches, evaporation ponds, drain fields, and disposal wells. As of 2021, wastewater was being discharged to infiltration ponds, evaporation ponds, and ditches at the INL; and the effluent was sampled and analyzed by the INL contractor for radionuclides and various other constituents prior to discharge. Solid and liquid wastes buried at the RWMC (fig. 1) continue to be sources of some constituents in groundwater.
Contractors at each INL facility collected and reported concentrations of radioactive- and chemical-waste-disposal data from 1976 to 1998 (French and others, 1999a, 1999b); however, prior to 1976 and since 1999, no comparable published annual compilations of radioactive- and chemical-waste disposal data are available. Highlights of the waste disposal history at INL facilities are summarized in the following sections of this report; a more comprehensive summary of waste disposal at the INL from 1952 through 1998 can be found in Bartholomay and others (2000).
Advanced Test Reactor Complex
Since 1952, low-level radioactive, chemical, and sanitary wastewater has discharged to infiltration and lined evaporation ponds located east of the ATRC (fig. 3). From 1952 to 1964, wastewater from the nonradioactive cooling-tower was discharged to radioactive-waste infiltration ponds. From 1964 to March 1982, it discharged to the ESRP aquifer through a 1,267-foot-deep disposal well (TRA DISP, fig. 3). Finally, from 1982 to 2021, it discharged into two cold-waste infiltration ponds. A more complete summary of potential groundwater contamination sources at the ATRC is found in U.S. Department of Energy (2021a).
In 1976, the DOE contractor at the ATRC began a three-phase program to reduce radioactivity in wastewater. The first phase was during 1976–80, and the second phase was during 1981–87. The contractor finished the final phase of the program in 1993. In August 1993, the radioactive-waste infiltration ponds at the ATRC were replaced with lined evaporation ponds. The evaporation ponds were designed to prevent radioactive wastewater from entering the aquifer.
During 1961–79, less than 25 percent of the radioactivity in discharged wastewater was attributed to tritium; most other radioactivity consisted of radionuclides with half-lives of several weeks, as well as small amounts of strontium-90, cesium-137, and cobalt-60 (Barraclough and others, 1981). In 1980, about 50 percent of radioactivity was attributed to tritium, and during 1981–93 more than 90 percent was attributed to tritium (Bartholomay and others, 1997, fig. 6). Overall, approximately 8,920 curies (Ci) of tritium were discharged to the radioactive-waste infiltration ponds between 1952 and 1993.
A chemical-waste infiltration pond was used for the disposal of chemical wastewater from an ion-exchange system at the ATRC (fig. 3) from 1962 to 1999. The average annual discharge to this pond was about 17.5 million gallons (Mgal) during 1962–98. Sulfate and sodium hydrate were the predominant constituents in the chemical wastewater (Bartholomay and others, 2000). In 1999, the chemical-waste infiltration pond was closed and covered with a protective cap (S.M. Stoller Corporation, 2002a).
The TRA disposal well (TRA DISP, fig. 3) has been used as an observation well since 1982. Prior to 1964, well USGS 53 (fig. 4) was also used intermittently to discharge wastewater into the perched groundwater system (U.S. Department of Energy, 2011) and has been used as an observation well since 1964.
Large quantities of chromate-contaminated wastewater were injected directly into the ESRP aquifer or infiltrated through the unsaturated zone beneath the radioactive-waste infiltration ponds at the ATRC (fig. 3). Between 1952 and 1972, an estimated 17,790 pounds (lb) of chromium was discharged to the radioactive-waste infiltration ponds and 31,131 lb of chromium was discharged to the TRA disposal well. Other contaminants discharged at the ATRC such as those associated with sanitary sewage in the sanitary waste pond (fig. 3) included nitrate, phosphate, and chloride (U.S. Department of Energy, 2021a).
Idaho Nuclear Technology and Engineering Center
From 1952 to February 1984, the INTEC discharged most low-level radioactive, chemical, and sanitary wastewater into the ESRP aquifer through a 600-ft-deep disposal well located at the facility (INTEC disposal well, fig. 4). Two percolation ponds (also called “infiltration ponds”) were used for wastewater disposal from 1984 through August 25, 2002 (fig. 4). The first pond was completed in February 1984, and the second pond was completed in October 1985. On August 26, 2002, the legacy percolation ponds were taken out of service, and the wastewater was discharged to the “new” percolation ponds about 2 miles (mi) southwest of INTEC (fig. 4). The new percolation ponds were designed to be a rapid infiltration system, and each pond can accommodate as much as 3 million gallons (Mgal) each day of continuous discharge (S.M. Stoller Corporation, 2004).
Tritium has accounted for most of the radioactivity in wastewater discharged to the disposal well and legacy percolation ponds at the INTEC (Davis, 2008, fig. 9). During 1953–2000, about 21,135 Ci of tritium was discharged at the INTEC (Mann and Cecil, 1990; Davis, 2008). Other radionuclides discharged at INTEC included strontium-90, cesium-137, iodine-129, plutonium isotopes, uranium isotopes, neptunium-237, americium-241, and technetium-99 (U.S. Department of Energy, 2021a). In 1972, about 18,100 Ci of strontium-90, 19,100 Ci of cesium-137, and 18,600 gallons (gal) of sodium-bearing waste were released to the soil at the INTEC tank farm during a failed transfer between two underground storage tanks (fig. 7) (Cahn and others, 2006). This accounts for about 88 percent (approximately 15,900 Ci) of the source of strontium-90 to groundwater at the INTEC tank farm (fig. 7). Three other locations at the INTEC tank farm are the source of the remaining 12 percent of strontium-90 (Cahn and others, 2006).
Historically, chloride, fluoride, nitrate, sodium, and sulfate were the predominant chemical constituents in wastewater discharged at the INTEC (Pittman and others, 1988; Orr and Cecil, 1991; Bartholomay and others, 1995, 1997, 2000). Mercury also has been listed as a constituent that potentially could affect groundwater quality near INTEC (U.S. Department of Energy, 2021a).
Naval Reactors Facility
Wastewater at the NRF is discharged to a 1.65-mi-long industrial-waste ditch and a series of sewage ponds (fig. 3). The waste ditch was first used in 1953 to dispose of non-radioactive, non-sewage industrial wastewater. Chloride, sulfate, and sodium have been the predominant chemical constituents in wastewater discharged to the ditch throughout its history of operation (Lewis and Jensen, 1985; Pittman and others, 1988; Orr and Cecil, 1991; Bartholomay and others, 1995, 1997, 2000).
Radioactive Waste Management Complex
Solid and liquid radioactive- and chemical wastes have been buried in trenches and pits at the Subsurface Disposal Area (SDA) at the RWMC (fig. 3) since 1952. These include transuranic wastes, other radiochemical and inorganic chemical constituents, and organic compounds. The transuranic wastes were buried in trenches until 1970 and stored above ground at the RWMC after 1970. Only low-level mixed waste has been buried at the RWMC since 1970; before then, little or no sediment was retained between the excavation bottoms and the underlying basalt. Since 1970, a layer of sediment has been retained in excavations to inhibit the downward migration of waste constituents.
About 17,100 Ci of plutonium-238, 64,900 Ci of plutonium-239, 17,100 Ci of plutonium-240, and 183,000 Ci of americium-241 were buried in the SDA during 1952–99 (Holdren and others, 2002, table 4-1). An estimated 88,400 gal of organic waste was buried before 1970 (Mann and Knobel, 1987, p. 1). These buried organic wastes included about 24,400 gals of carbon tetrachloride; 39,000 gals of lubricating oil; and about 25,000 gals of other organic compounds, including trichloroethane, trichloroethylene, perchloroethylene, toluene, and benzene.
Test Area North
From 1953 to 1972, low-level radioactive, chemical, organic, and sanitary wastewater was discharged at TAN (fig. 1) into the ESRP aquifer through a 310-ft-deep disposal well (TAN Disposal Well, fig. 5). In 1972, the disposal well was replaced by a 35-acre infiltration pond. Records are not available to indicate the amount of radioactivity in wastewater discharged at TAN before 1959. During 1959–93, about 61 Ci of radioactivity in wastewater was discharged to the disposal well and infiltration pond. It is estimated that as little as 350 gals to as much as 35,000 gals of trichloroethene (TCE) were disposed of in the disposal well (U.S. Department of Energy, 2021a). Based on information available through 1998, radioactive wastewater has not been discharged at TAN since 1993 (Bartholomay and others, 2000). The principal contaminants at TAN from the use of the disposal well include several volatile organic compounds (including TCE, tetrachloroethene, cis-dichloroethene, trans-1,2-dichloroethene, and vinyl chloride) and several radionuclides (strontium-90, cesium-137, tritium, and uranium-234) (U.S. Department of Energy, 2021a).
Chemical wastewater containing predominantly chloride and sodium was discharged to the infiltration pond at the Technical Support Facility (TSF) near TAN during 1971–2007. Some low-level radioactive waste containing approximately 0.039 Ci of strontium-90 also was released to the pond during 1972–85 (U.S. Department of Energy, 2021a). A closure plan for the pond was submitted to the Idaho Department of Environmental Quality (IDEQ) in November 2007, and wastewater discharge to the pond ceased on November 29, 2007. All activities proposed in the plan were completed by February 2008 (S.M. Stoller Corporation, 2009).
Central Facilities Area
About 65 Ci of radioactivity in about 1,500 Mgal of wastewater was discharged to the sewage-plant tile drain field at the CFA (fig. 1) during 1952–93. Most radioactive wastes discharged to this drain field were from aquifer water pumped from well CFA 1 (fig. 5), which obtains water from within the INTEC contaminant plume in the ESRP aquifer. Most radioactivity in wastewater discharged at the CFA was attributed to tritium.
Chloride and sodium were the predominant chemical constituents in wastewater at the CFA (Lewis and Jensen, 1985; Pittman and others, 1988; Orr and Cecil, 1991; Bartholomay and others, 1995, 1997, 2000). Nitrate in the southern part of the CFA has been attributed to wastewater disposal at the former CFA mercury pond (U.S. Department of Energy, 2011).
Hydrologic Conditions
The ESRP aquifer is one of the most productive aquifers in the United States (U.S. Geological Survey, 1985, p. 193). The aquifer consists of a thick sequence of basalts and sedimentary interbeds filling a large, arcuate, structural basin in southeastern Idaho (fig. 1). Recharge to the ESRP aquifer is primarily from infiltration of applied irrigation water, infiltration of streamflow, groundwater inflow from adjoining mountain drainage basins, and infiltration of precipitation (Ackerman and others, 2006).
Surface Water
The Big Lost River drains more than 1,400 square miles of mountainous area that includes parts of the Lost River Range and the Pioneer and White Knob Mountains west of the INL (fig. 1). Surface water infiltrates to the ESRP aquifer from the Big Lost River channel and at sinks and playas at its terminus (fig. 1). Since 1965, streamflow from the Big Lost River in excess of about 300 cubic feet per second (ft3/s) is diverted to spreading areas, where it rapidly infiltrates, in the southwestern part of the INL in order to prevent potential flooding at INL facilities (Bennett, 1990, p. 15). Other surface drainages that provide recharge to the ESRP aquifer at the INL include Birch Creek, the Little Lost River, and Camas Creek (fig. 1).
Antelope Creek near Darlington, Idaho (13131000) is a tributary to the Big Lost River, joining the main channel just west of the INL, and shows yearly seasonal fluctuations in discharge (U.S. Geological Survey, 2023). For the study time period, there were increasing discharge periods during the spring in 2019 and 2020, however the discharge signal was muted during the 2021 spring runoff season. This decrease in water availability in 2021 impacted the overall streamflow of the Big Lost River.
The average streamflow recorded at USGS streamgage 13127000 (Big Lost River below Mackay Reservoir near Mackay, Idaho; fig. 1) for complete water years (a water year starts October 1 and end September 30 of any given year) 1905–2021 was 300 ft3/s (fig. 8) (U.S. Geological Survey, 2023). Streamflow at streamgages downstream from streamgage 13127000 (fig. 1) for water years 2019–21 is shown in table 4 and figure 8. Most of the flow between Mackay Reservoir and Arco, Idaho, is diverted for irrigation and groundwater recharge; therefore, flow only reaches the INL during wet years or when heavy rainfall or rapid snowmelt warrant brief periods of high discharge out of Mackay Reservoir.
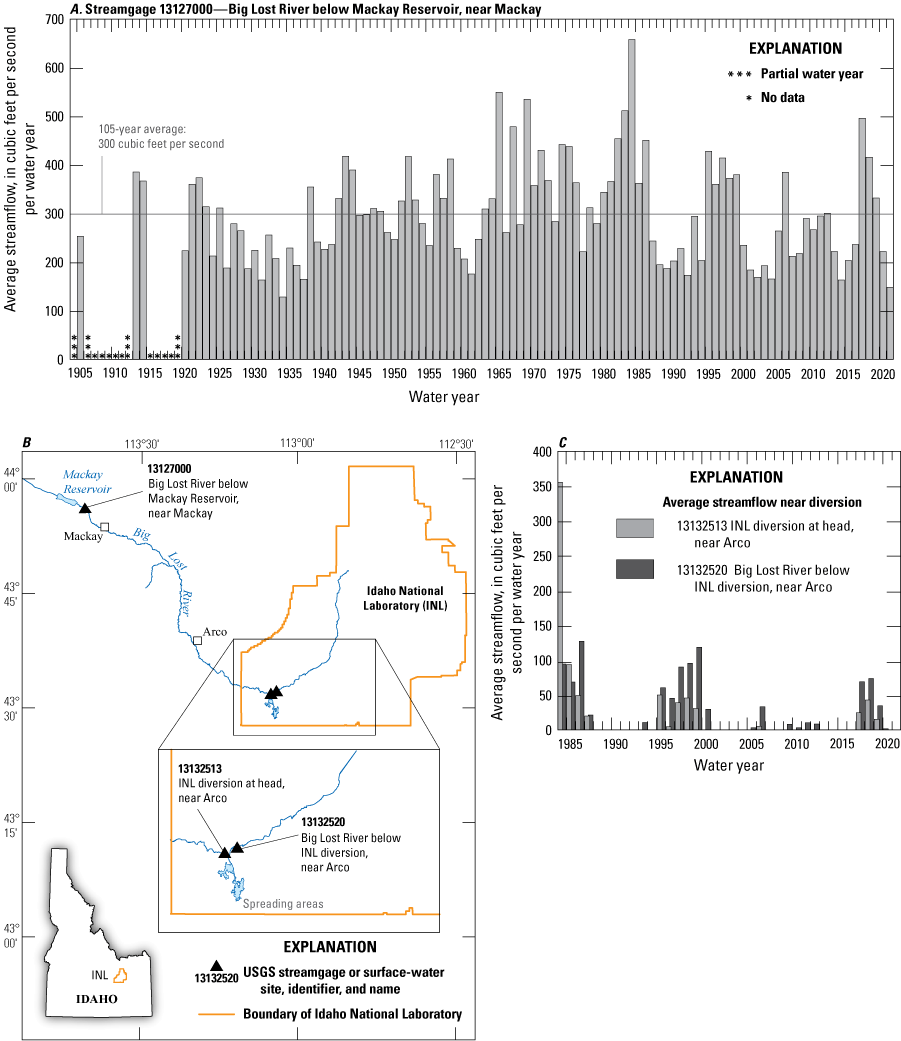
Graphs showing average streamflow (A, C) and map showing streamgage locations (B), Big Lost River, Idaho.
Table 4.
Average annual streamflow at U.S. Geological Survey (USGS) streamgage stations along the Big Lost River, Idaho, water years 2019–21.[Additional site information can be found in U.S. Geological Survey (2023, https://dx.doi.org/10.5066/F7P55KJN). USGS streamgage number and name: Station locations are shown in figure 1. Streamflow: Data are from USGS National Water Information System (U.S. Geological Survey, 2023, https://dx.doi.org/10.5066/F7P55KJN). Abbreviations: ft3/s, cubic feet per second; WY, water year; INL, Idaho National Laboratory; Blvd., boulevard]
Recharge to the ESRP aquifer downstream from Arco, Idaho (fig. 1), is substantial during wet years because of streamflow infiltration from the Big Lost River channel, diversion areas, sinks, and playas. For example, infiltration losses at various discharges measured during 1951–85 ranged from 1 cubic foot per second per mile in the river channel to 28 cubic feet per second per mile in the sinks (Bennett, 1990, p. 24–26). Bennett (1990) considered streamflow losses to evapotranspiration minor as compared to infiltration losses. However, infiltration can be zero in years when there is little or no flow in the Big Lost River channel at or downstream from streamgage 13132500 (fig. 1), as was the case during water years 2002–04 (Davis, 2008, table 4); 2008 (Davis, 2010, table 4); 2013–15 (Bartholomay and others, 2017a, table 4); 2016 (Bartholomay and others, 2020, table 4); and 2021 (table 4).
Groundwater
Water in the ESRP aquifer primarily moves through interflow and fracture zones in the basalt. A large proportion of groundwater moves through the upper 200–800 ft of basaltic rocks (Mann, 1986, p. 21). Twining and Maimer (2019) estimated transmissivity for the upper part of the aquifer to be 2.0–540,000 ft2/d. Anderson and others (1999) reported a range of hydraulic conductivity at the INL of 0.01–32,000 ft/d. The hydraulic conductivity of rocks underlying the aquifer varies from 0.002 to 0.03 ft/d (Mann, 1986, p. 21). The effective base of the ESRP aquifer was measured in different wells from about 815 to 1,710 ft below land surface in the western half of the INL (Anderson and others, 1996, table 3). Wells in the eastern half of the INL do not penetrate the base of the aquifer, so the effective base of the aquifer has only been estimated from surface-based electrical-resistivity surveys (Ackerman and others, 2010, fig. 6).
The depth to water below land surface in wells completed in the ESRP aquifer ranges from about 286 ft in the northern part of the INL to more than 990 ft in the southeastern part. During March–May 2021, the mean altitude of the water table was about 4,560 ft in the northern part of the INL and about 4,420 ft in the southwestern part (fig. 9). Water flowed south and southwestward beneath the INL (fig. 9) at an average hydraulic gradient of about 4 ft/mi, consistent with previous hydraulic gradient estimates (Twining and Maimer, 2019).
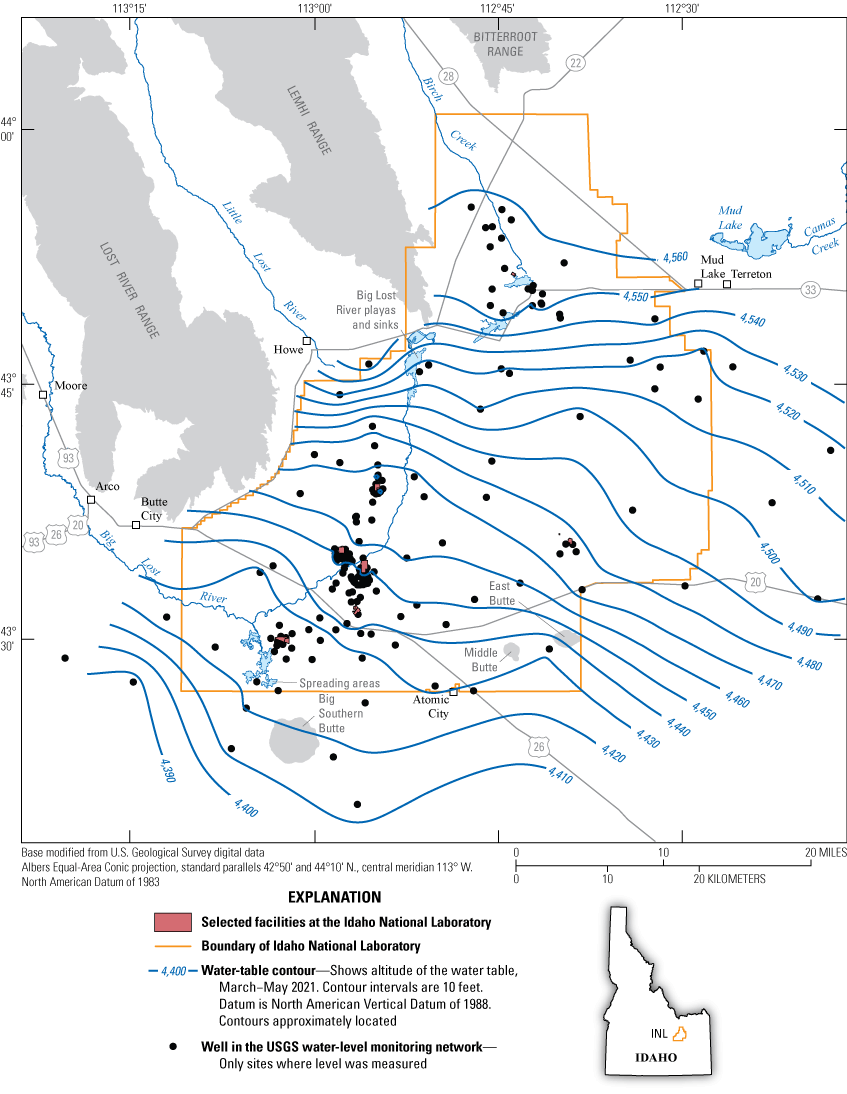
Altitudes of the water table in the eastern Snake River Plain (ESRP) aquifer at and near the Idaho National Laboratory (INL), Idaho, March–May 2021. Data used for development of the ESRP water table can be found at Fisher and others (2024).
Water levels in wells generally increased from 0.02 ft to more than 1.04 ft in the northern part of the INL from March–May 2018 (Bartholomay and others, 2020) to March–May 2021 (fig. 10). In the central and eastern parts of the INL, water levels rose slightly in some wells and declined slightly in others (fig. 10). In the southwestern part of the INL, water levels generally decreased by about 0.03 to more than 2.94 ft between March–May 2018 and March–May 2021. During March–May 2018 to March–May 2019 the water levels increased in the majority of wells. Since then, the water levels have decreased. Half the groundwater well water levels increased during March–May 2019 through March–May 2020. The majority of water levels decreased during March–May 2020 through March–May 2021.
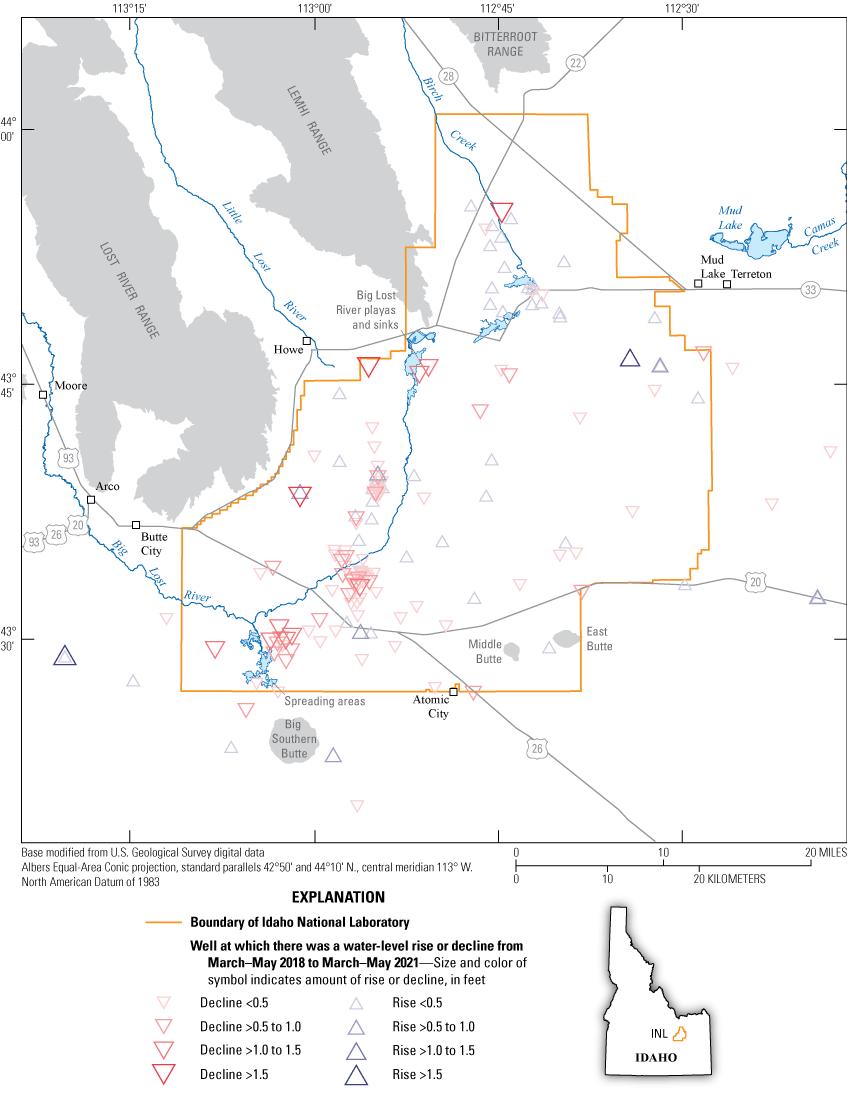
Generalized rise or decline in groundwater levels in the eastern Snake River Plain aquifer at and near Idaho National Laboratory (INL), Idaho, March–May 2019 to March–May 2021. Data used for groundwater level changes can be found at Fisher and others (2024).
Water levels monitored in wells USGS 12, 17, 23 (fig. 2), and USGS 20 (fig. 3) show long-term water-level changes in the ESRP aquifer in the central part of the INL in response to the infiltration of streamflow (fig. 11). Long-term water-level fluctuations were about 20 ft in well USGS 20, 30 ft in well USGS 17, 35 ft in well USGS 23, and 40 ft in well USGS 12. Water levels in all of these wells, except USGS 17, increased slightly (approximately 0.1 ft) during 2019–21.
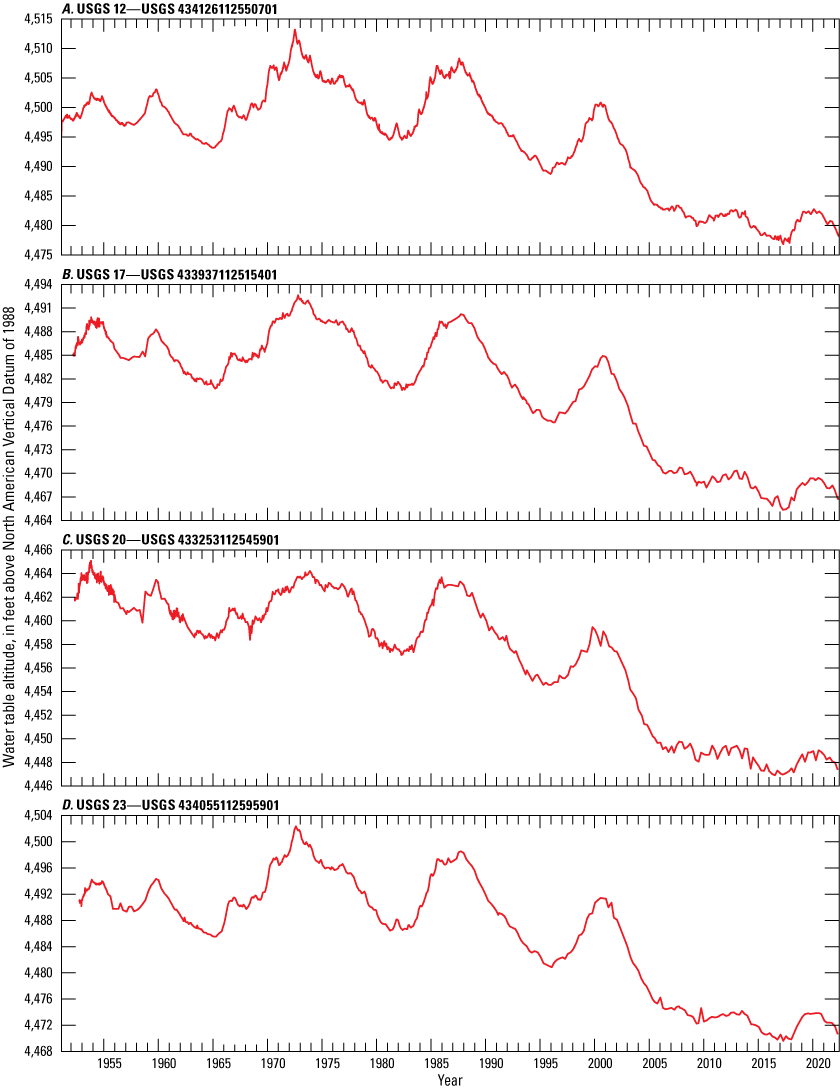
Water levels in four U.S. Geological Survey (USGS) wells 12, 17, 20, and 23, in the central part of the Idaho National Laboratory (INL), Idaho 1950–2021. Site locations for wells 12, 17, and 23 are shown in figure 2; location for well 20 is shown in figure 3. Water level information can be found in U.S. Geological Survey (2023, https://dx.doi.org/10.5066/F7P55KJN).
Groundwater moves southwestward from the INL and discharges to springs along the Snake River near Twin Falls, Idaho, about 100 miles southwest of the INL. Annual discharge from the springs estimated by methods given by Kjelstrom (1995, table 6) was estimated to be approximately 5,047 ft3/s for the water year 2021, a slight increase from the estimate of 4,909 ft3/s for the water year 2018. This estimation was calculated using data from the U.S. Geological Survey National Water Information System (NWIS) at https://dx.doi.org/10.5066/F7P55KJN (U.S. Geological Survey, 2023) and the Idaho Department of Water Resources database at https://research.idwr.idaho.gov/apps/hydrologic/aquainfo (Idaho Department of Water Resources, 2023). Historically, the discharge to these springs has ranged from 3,832 ft3/s (1902) to 6,820 ft3/s (1951) (Nace and others, 1958; Kjelstrom, 1995).
Perched Groundwater
Disposal of wastewater to infiltration ponds and infiltration of surface water at waste-burial sites at the INL has resulted in the formation of perched groundwater in both basalts and in sedimentary interbeds that overlie the ESRP aquifer (Cecil and others, 1991). Perched groundwater has formed in a complex sequence of basalt flow and sedimentary interbeds beneath the ATRC, the INTEC, and the RWMC. Perched groundwater also has been detected beneath infiltration ponds and ditches at other facilities at the INL in the past but is not monitored by the USGS.
Anderson and Lewis (1989) and Anderson (1991) correlated geophysical logs to describe the stratigraphic sequences in which perched groundwater has formed at the ATRC, the INTEC, and the RWMC. Although the subsurface stratigraphy, geohydrologic characteristics, and waste disposal practices at each of these areas differ, the features controlling the formation of perched groundwater at these sites are similar (Cecil and others, 1991). Sedimentary interbeds in the subsurface may have smaller vertical hydraulic conductivities than overlying basalt flows, and alteration between basalt flows may contribute to reduced vertical hydraulic conductivity in the interflow rubble zones (Perkins and Winfield, 2007). Dense, unfractured basalt flows may have a decreased vertical hydraulic conductivity and may inhibit downward flow, and sedimentary or chemical precipitating from water and infilling fractures in basalt may reduce vertical hydraulic conductivity by limiting the interconnectivity of fractures, thereby reducing the water-transmitting capability of the basalts (Cecil and others, 1991). Any combination of these factors may disrupt the downward vertical movement of water and contribute to the formation of perched groundwater zones.
At the ATRC, deep and shallow perched groundwater zones have formed in response to the disposal of wastewater to infiltration ponds (Tucker and Orr, 1998). South of the INTEC, perched groundwater zones formed previously in response to wastewater disposal to the legacy percolation ponds but have since dried after the ponds were taken out of use in 2002 (fig. 4). Perched groundwater also has been detected in other areas at the INTEC and may be attributed to leaking pipelines, leach fields, damaged casing in the upper part of the INTEC disposal well, other infiltration ponds, or landscape irrigation (Tucker and Orr, 1998). Recharge from the Big Lost River also is a potential source of some perched water in the northern part of the INTEC. Perched groundwater also is present beneath the new percolation ponds (fig. 4) that were put into service during 2002. Perched groundwater beneath the RWMC formed from infiltration of snowmelt and rain and from recharge from the Big Lost River and INL spreading areas. This perched groundwater contains constituents leached from buried radioactive and organic-chemical wastes. Perched groundwater beneath wastewater infiltration ponds and buried waste is an integral part of the pathway for waste-constituent migration to the ESRP aquifer. The extent of perched groundwater is affected by waste-disposal practices.
From March–May 2018 (Bartholomay and others, 2020) to March–May 2021, water levels in most perched groundwater wells around the ATRC declined. Water-level declines ranged from 0.07 ft in well CWP 9 to 37.06 in well USGS 78 (fig. 12). Water-level declines may be attributed to variable recharge from ponds still in use, the repair of water leaks around the ATRC, or decreasing recharge from the Big Lost River. Water levels rose 2.49 ft in well USGS 71 and 2.26 ft in USGS 72. Rises also occurred in the perched zone near the new INTEC infiltration pond (ICPP-MON-V-200, 1.25ft) (fig. 12). Similarly, the water level rises observed in wells (USGS 71, USGS 72 and ICPP-MON-V-200) may be attributed to variable recharge from ponds in use or possible water leaks around the ATRC. During March–May 2021 water levels from groundwater wells completed in shallow perched zones declined near the cold-waste ponds (fig. 12), again probably due to variability in the amount of wastewater discharged to the ponds.
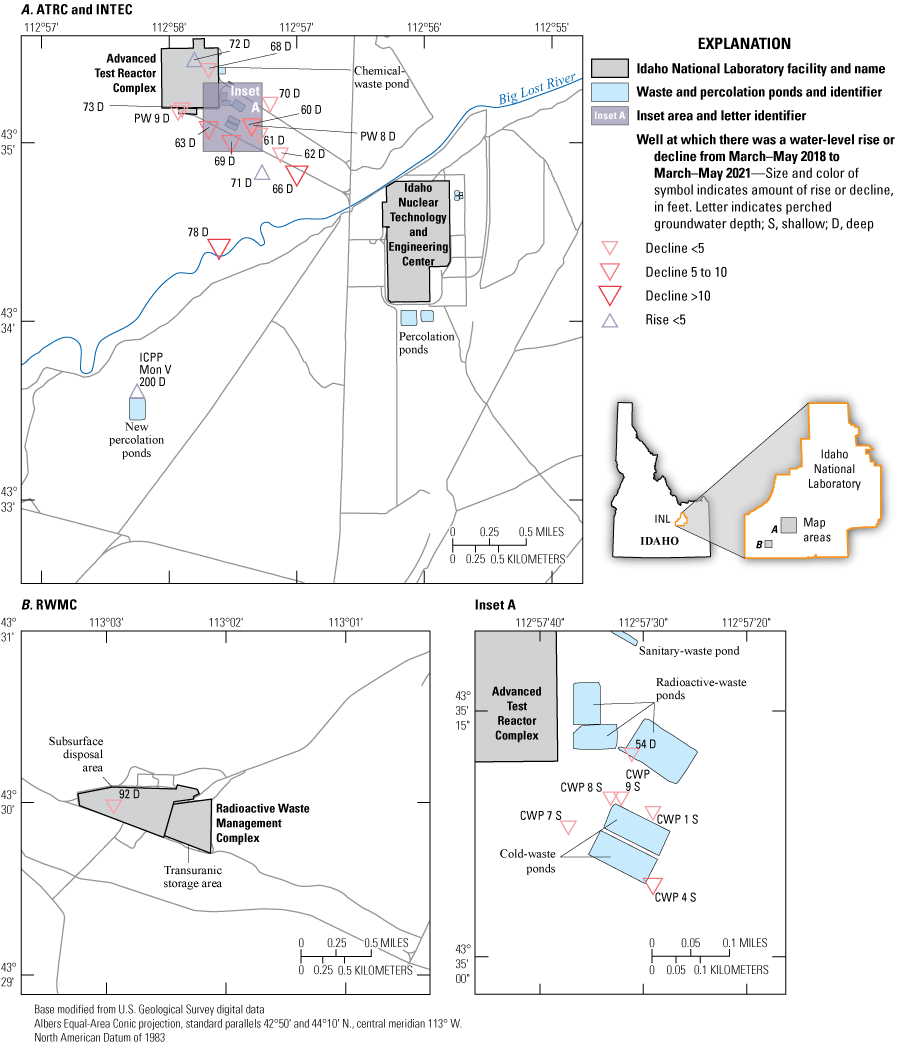
Generalized rise or decline in perched groundwater levels at and near Idaho National Laboratory (INL), Idaho, March–May 2018 to March–May 2021. Data used for groundwater level changes can be found at Fisher and others (2024).
Methods and Quality Assurance of Water Sample Analyses
Water samples were analyzed for radiochemical constituents at the DOE Radiological and Environmental Sciences Laboratory (RESL) in Idaho Falls, Idaho, and chemical constituents at the USGS National Water Quality Laboratory (NWQL) in Lakewood, Colorado. Until 2008, water samples analyzed by the RESL were entered into the USGS NWIS database (U.S. Geological Survey, 2023) with an uncertainty of 2s, where s is the sample standard deviation. Beginning in 2008 because of a USGS policy change, data were entered into the NWIS database with an uncertainty of 1s. Analytical uncertainties in this report are reported as 1s for consistency with conventions used in previous USGS reports.
Methods used to sample and analyze selected constituents generally follow USGS guidelines (Stevens and others, 1975; Wood, 1976; Claassen, 1982; Goerlitz and Brown, 1984; Wershaw and others, 1987; Fishman and Friedman, 1989; Faires, 1993; Fishman, 1993; Foreman and others, 2021; Rose and others, 2016; U.S. Geological Survey, variously dated). Water samples were collected according to a quality-assurance plan for water-quality activities performed by personnel at the USGS INL Project Office. The plan was finalized in 1989 and revised in 1992, 1996 (Mann, 1996), 2003 (Bartholomay and others, 2003), 2008 (Knobel and others, 2008), 2014 (Bartholomay and others, 2014), and 2021 (Bartholomay and others, 2021).
Field processing of water samples differed depending on the constituents for which analyses were requested. Water samples analyzed by the NWQL were placed in containers and preserved in accordance with laboratory requirements specified by Timme (1995) and Bartholomay and others (2014, app. A; 2021, app. A). Containers and preservatives used for this study were supplied by the NWQL and were processed using a rigorous quality-control procedure (Pritt, 1989, p. 75; U.S. Geological Survey, variously dated) to minimize sample contamination. The process for water samples requiring filtration consisted of filtering the water through a disposable 0.45-µm filter cartridge that had been pre-rinsed with at least 2 liters of deionized water. Water samples analyzed by the RESL were placed in containers and were preserved in accordance with laboratory requirements specified by Bodnar and Percival (1997) and Bartholomay and others (2014, app. A; 2021, app. A).
Guidelines for Interpreting Results of Radiochemical Analyses
Concentrations of radionuclides are reported with an estimated sample standard deviation (s), which is obtained by propagating sources of analytical uncertainty in measurements and depends on analytical methods and instrumentation. The following guidelines for interpreting analytical results are based on an extension of a method proposed by Currie (1984).
In the analysis of a particular radionuclide, laboratory measurements are made on a prepared sample and a prepared blank. Instrument signals for the sample and the blank vary randomly within analytical sessions and day-to-day. Therefore, it is essential to distinguish between two key aspects of the probability of detection: (1) the instrument signal for the sample must be greater than the signal observed for the blank before a decision can be made that the radionuclide was detected, and (2) an estimation must be made of the minimum radionuclide concentration that will yield a sufficiently large observed signal before a correct decision can be made for detection or nondetection of the radionuclide. The first aspect is a qualitative decision based on an observed signal and a definite criterion for detection based on instrument background, signal intensity, and prepared sample concentration. The second aspect is an estimation of the detection capabilities of a given measurement process and analyte during a given analytical session.
In the laboratory, instrument signals must exceed a critical level of 1.6s before the qualitative decision can be made as to whether the radionuclide was detected. Using the 1.6s critical level, there is about a 95-percent probability that the correct conclusion—not detected—will be made for samples not containing the radionuclide. Given a large number of water samples, as many as 5 percent of the water samples with measured concentrations greater than or equal to 1.6s, concluded as detected, might not contain the radionuclide. These measurements are referred to as false positives and are errors of the first kind in hypothesis testing.
Once the critical level of 1.6s has been defined, the minimum detectable concentration may be determined. The critical level and minimum detectable concentrations are based on counting statistics alone and do not include systematic or random errors inherent in laboratory procedures. The values 1.6s and 3s vary slightly with background or blank counts, with the number of gross counts for individual analyses, and for different radionuclides.
For actual concentrations equal to or greater than 3s, there is a 95-percent or higher probability that the radionuclide was detected in a water sample. In a large number of water samples, the conclusion—not detected—will be made in 5 percent of the water samples that contain actual concentrations at the minimum detectable concentration of 3s. These measurements are referred to as “false negatives” and are errors of the second kind in hypothesis testing.
Actual radionuclide concentrations between 1.6s and 3s are associated with larger errors of the second kind. That is, there is a greater-than-5-percent probability of false negative results for water samples with actual concentrations between 1.6s and 3s. Although the radionuclide may be detected, such detections may not be considered reliable; at the 1.6s threshold, the probability of a false negative is about 50 percent. In this report, radionuclide concentrations less than 3s are considered to be less than a “reporting level.” Using this defined reporting level, 3s, will aid the reader to interpret analytical results and give the reference to interpret the concentrations of radioactivity, which may or may not have been detected in measured samples.
Guidelines for Interpreting Results of Chemical Analyses
Concentrations of inorganic and organic constituents are reported with reference to reporting limits determined using detection and quantitation calculation (DQCALC) software and are reported as method detection limits (MDLs) from DQCALC (DLDQC) for inorganic constituents and minimum reporting levels (MRLs) for organic constituents. The MRL is the smallest measured constituent concentration that can be reliably reported using a specific analytical method (Foreman and others, 2021). The DLDQC is one of four new reporting-level codes adopted by the NWQL to replace the long-term method detection limit (LT-MDL; U.S. Geological Survey, 2015). The DLDQC is described as the lowest concentration that, with 90-percent confidence, will be exceeded no more than 1 percent of the time when a blank sample is measured less than or equal to 1 percent false positive risk (U.S. Geological Survey, 2015, p. 11). DQCALC is a software package used to compute a method detection estimate (Standard Practice D7510-10; American Society for Testing and Materials International, 2010). See U.S. Geological Survey (2015) for a more detailed explanation of the DQCALC procedures. Foreman and others (2021) provide details about the approach used by the USGS regarding detection levels and reporting levels. For most of the inorganic and organic constituents in this report, reported concentrations generally are greater than their associated reporting levels (MDLs or MRLs), and some are reported as “less than” (<), as applicable.
Evaluation of Quality-Assurance Studies
Investigations to determine variability and bias for individual constituents were summarized by Wegner (1989), Williams (1996, 1997), and Rattray (2012, 2014). Additional quality-assurance (QA) studies by USGS INL Project Office personnel include:
-
• An evaluation of field sampling and preservation methods for strontium-90 (Cecil and others, 1989);
-
• A study comparing pump types used for sampling VOCs (Knobel and Mann, 1993);
-
• An analysis of tritium and strontium-90 concentrations in water from wells after purging different borehole volumes (Bartholomay, 1993);
-
• An analysis of the effects of various preservation types on nutrient concentrations (Bartholomay and Williams, 1996);
-
• An analysis of two analytical methods to determine gross alpha- and beta-particle activity (Bartholomay and others, 1999);
-
• An evaluation of well-purging effects on water-quality results (Knobel, 2006);
-
• An evaluation of 2009–11, 2012-15, and 2015-18 QA data for routine sampling (Davis and others, 2013; Bartholomay and others, 2017a; Bartholomay and others, 2020);
-
• An evaluation of the 2006–08, 2009–13, and 2013-18 multilevel monitoring system (MLMS) QA data (Bartholomay and Twining, 2010; Bartholomay and others, 2015; Twining and others, 2021b).
-
• Evaluation of preservation methods for selected volatile organic compounds in groundwater (Treinen and Bartholomay, 2022).
During 2019–21, variability and bias were evaluated from up to 34 replicate pairs (environmental sample and replicate, collected sequentially) and up to 14 blank quality control samples (tables 5–6). Constituents analyzed from these samples included the constituents identified in the section, “Water-Quality Monitoring Network.”
Table 5.
Number of replicate pairs and blanks collected for individual constituents, Idaho National Laboratory, Idaho, 2019–21.[Data are available at Fisher and others (2024, https://doi.org/10.5066/P9UWRYR4). Constituent: Ag, silver; Al, aluminum; As, arsenic; Ba, barium; Be, beryllium; Cd, cadmium; Co, cobalt; Cr, chromium; Cu, Copper; Hg, mercury; Mn, manganese; Mo, molybdenum; Ni, nickel; Pb, lead; RESL, Radiological and Environmental Sciences Laboratory; Sb, antimony; Se, selenium; Tl, thallium; U, uranium; Zn, zinc; VOCs, volatile organic compounds]
Table 6.
Constituents, ranges of concentrations, number of replicates with calculated mean standard deviations (SD), and percentage relative standard deviations (RSD) from samples collected at the Idaho National Laboratory, Idaho, 1989–2021 and 2019–2021.[Data are available at Fisher and others (2024, https://doi.org/10.5066/P9UWRYR4); The current study evaluation are replicate data collected between 2019 and 2021; the replicate data collected between 1989 and 2021 are provided for comparison. The replicate pairs used in calculating the SD and Mean RSD included only those detected above the minimum reporting level for organic constituents, above the method detection limits for inorganic constituents, or above the reporting level for radiochemical analyses (3s) (Fisher and others, 2021). Abbreviations: SD, standard deviation; RSD, relative standard deviations; ND, no data; mg/L, milligrams per liter; μg/L, micrograms per liter; f, filtered; pCi/L, picocuries per liter; N, nitrogen; <, less than; ≥, greater than or equal to; ∞, infinity; —, not calculated]
Variability
Results from replicate analyses were investigated to evaluate sample variability (or random measurement error quantified as standard deviation). Replicates consisted of two samples: an environmental sample and a replicate sample, collected sequentially during a single sampling event from the same location. Replicates were submitted blindly to the analytical laboratories, ensuring that the laboratories did not know the source of the water or that the samples were replicates.
Sample variability was evaluated by assessing the reproducibility and reliability of individual constituents (Rattray, 2012, 2014). Reproducibility (the closeness of agreement between individual measurements) was calculated as normalized absolute difference (NAD) for radiochemical constituents (measurements that are reported with analytical uncertainties) and relative standard deviation (RSD) for inorganic and organic constituents (measurements that do not include analytical uncertainties from the laboratory; defined as the ratio, in percent, of standard deviation to mean concentration; Mueller and others, 2015). Reliability (assessment of the error associated with a measurement) was calculated as the mean RSD for each constituent. Equations for calculating the NAD, SD, and mean RSD are presented in Rattray (2012, 2014) and Fisher and others (2021).
Reproducibility
Following Rattray (2012, p.10), reproducibility of constituent measurements was considered acceptable if:
-
• The NAD was less than or equal to 1.96;
-
• The relative percentage difference was less than 20 percent (this corresponds to a RSD, reported here, of less than 14 percent);
-
• Both measurements were less than the reporting level for that analysis; or
-
• One measurement was below reporting levels, or estimated, and the other measurement was within one detection limit of the larger of the estimated value or the reporting level, or the measurements were within one detection limit of each other. For results reported using the MRL as the reporting level, the detection limit was approximated as one-half of the MRL. For results reported using the DLDQC as the reporting level, the detection limit is the DLDQC value.
If the percentage of replicates with acceptable reproducibility for a constituent was greater than or equal to 90 percent, the reproducibility for that constituent was considered acceptable for 2019–21.
Major constituent groups with acceptable reproducibility, where each replicate pair was evaluated, and the NAD or RSD were calculated, were major ions (100 percent), nutrients (98 percent), trace elements (100 percent), and VOCs (100 percent). The radiochemical constituents, strontium-90 and tritium, and gross beta-particle activity had acceptable reproducibility, calculated as NAD (100 percent). Plutonium (Pu-238 and Pu-239+240, undivided) replicates were not evaluated as there were no sample-replicate pairs that exceeded the reporting level of 3s.
Reliability
Reliability and RSDs are generally a function of concentration (or activity), where reliability increases and RSDs decrease with increasing concentration. Mean RSDs were calculated for samples using a two-range variability model to evaluate reliability by calculating the standard deviation (SD) depending on analyte concentration (Mueller and others, 2015; Fisher and others, 2021). For this analysis, the methods and corresponding R analytical package ObsNetQW (Fisher, 2021b; R Core Team, 2023), described in Fisher and others (2021), was used to calculate the variability models, ranges of concentrations and corresponding RSD (if applicable) for the time period of this study (2019–21), as compared to long term variability between 1989 and 2021 (table 6). While we can compare the SD and RSD values for the different time periods, the variability models and concentration ranges for each period could be different.
Reliability was evaluated by calculating mean RSDs for discrete concentration ranges for each constituent (table 6). Standard deviations, needed to calculate mean RSDs, were calculated for radiochemical constituents if at least one concentration from a replicate sample pair equaled or exceeded the reporting level of 3s. Mean RSDs between 2019 and 2021 were less than or equal to 14 percent for all constituents and concentration ranges except for strontium-90 (42 percent) and gross beta-particle radioactivity (25 percent). The high mean RSDs and low reliability for these constituents resulted from concentrations that were near their respective reporting levels. The overall lower mean RSDs for quality control samples indicate that the associated environmental sample results have high reliability. The mean RSDs for this study period in table 6 are similar to the mean RSDs determined from replicate samples from 1989 to 2021 (Fisher and others, 2021), which indicates a consistency in reliability over time, allowing us to evaluate a smaller replicate-pair dataset for this study time period compared to the long-term replicate-pair dataset.
Bias
Bias from sample contamination was evaluated from source-solution, equipment, and field blanks (table 5). Other sources of bias associated with field samples, such as matrix interference and sample degradation, were not evaluated. The NWQL and RESL evaluate laboratory bias (including sample contamination, matrix interference, and sample degradation) with analysis of blank samples and standard reference materials. Equipment and field blanks were collected at field sites, and deionized water source-solution blanks were collected at the USGS Idaho Water Science Center, Idaho Falls Field Office. The equipment, field, and source-solution blanks were collected as described by Bartholomay and others (2021).
Equipment blanks were collected to identify the bias of environmental samples due to inadequate cleaning of stainless-steel sampling pipes that are reused at each sample site. Inadequate cleaning of sampling pipes may cause cross-contamination between sample sites. Equipment blanks also assess bias from sources other than the sampling pipes, such as field collection and processing, sample storage and shipping, and laboratory processing and analysis. Therefore, field and source-solution blanks were collected to determine whether the bias identified in equipment blanks may be from sources other than the sampling pipes. Field blanks were collected to identify all potential sources of bias in the equipment blanks except for bias from the sampling pipes. Source-solution blanks were collected to identify bias in the deionized water source solution. These samples were collected from the sample preparation area at the USGS Idaho Water Science Center, Idaho Falls Field Office.
Bias was evaluated by measuring numerous radiochemical, inorganic, and organic constituents in source-solution (n = 2), equipment (n = 6), and field (n = 6), and blanks (table 5) during this study. All radiochemical constituents measured in blank samples were less than the reporting level of 3s. All constituents measured in blank samples were less than or equal to the MDL for inorganic and the MRL for organic constituents except for the following blanks:
-
• A field blank and an equipment blank collected in 2019 had detections of nitrate (field and equipment) and sulfate and chloride (equipment only) above the detection limit, but below 2 SD (two times the estimated analytical variability, represented as standard deviations, determined at various concentration ranges for replicates collected between 2019 and 2021, see table 6).
-
• An equipment blank collected in 2020 had detections of calcium, magnesium, lead, chloride, silica, nickel, and copper, greater than their respective MDLs, but all were below 2 SD, except sulfate, nickel, and copper, which were detected slightly above 2 SD.
-
• One field blank and one source-solution blank collected in 2021 had detections of chloride and sulfate above the detection limit, but below 2 SD.
Detections of chloride, sulfate, and nitrate in the field and equipment blanks were inconsequential because they were within this study’s threshold for sample variability. The detections in the 2020 equipment blank that were above 2 SD for select trace constituents were not high enough to indicate environmental sample bias.
Selected Physical Properties of Water and Radiochemical and Chemical Constituents in the Eastern Snake River Plain Aquifer
Physical properties of water measured during sampling events included specific conductance, temperature, and pH. Radiochemical and chemical constituents analyzed in groundwater samples collected from wells at or near the INL during 2019–21 included tritium; strontium-90; cesium-137; plutonium-238, -239, and -240 (undivided); americium-241; gross alpha- and beta-particle radioactivity; chromium and other trace elements; sodium; chloride; sulfate; nitrate (as N); fluoride; and VOCs. All data for the physical and chemical parameters collected for aquifer samples can be found in the associated data release (Fisher and others, 2024). Beginning in 1989, all USGS samples collected at the INL were sent to the same laboratories with consistently required and applied QA, enabling long-term trend analyses (Fisher, 2021).
Spatial and Temporal Constituent Concentration Evaluation Approach
The areal distribution of selected constituents was created using a kriging interpolation method used by Fisher and others (2021) and the ObsNetQW package in the R programming language (Fisher, 2021b; R Core Team, 2023). Quantile kriging was applied to averaged concentrations from water samples collected during April and/or October 2021, with both negative (from radiochemical analyses) and nondetect values (less than the method detection limit (MDL) for inorganic constituents) set equal to zero.
Kriging analysis results are presented for each analyzed constituent, including specific conductance (fig. 13), tritium (fig. 15), Sr-90 (fig. 17), chloride (fig. 20). Kriging estimates of constituent concentrations are predicted at points on an evenly spaced grid with a spacing of 10 meters in the active part of the interpolation grid. The same interpolation was applied to all kriging estimations with an interpolation domain that is defined within the figure extent.
The kriging analysis results in a predicted average concentration value for each cell on the grid. Contour lines of the prediction grid were created and overlain on the measured data. The contours are spaced at 10 microsiemens per centimeter (μS/cm) for specific conductance, 500 picocuries per liter (pCi/L) for tritium, 1 pCi/L for Sr-90, and 20 milligrams per liter (mg/L) for chloride.
Kriging predictions are evaluated by graphing a sample variogram, which estimates the spatial correlation of a constituent concentration—that is, the concentration variance by lag distance, in miles. Estimates of variance between values of predicted constituent concentration separated by varying lag distances are allocated into lag bins unique to each constituent and averaged within each bin (Fisher, 2021). The lag-bin settings were 20 meters (m) for specific conductance and chloride, 7 m for Sr-90, and 6 m for tritium. The lag bins vary due to multiple plume sources from facilities coalescing.
The sample variance is compared with the theoretical (predicted) variance to determine the spatial correlation between concentration and distance, quantified using the cross-validated coefficient of determination (R2) value for each constituent. The variogram model fitted to the sample variogram is drawn as an estimated curve and shows variance initially increasing with lag but later leveling off for longer lags in distance. Equations behind this method are described in detail in Fisher and others (2021).
The variograms for each constituent show good correlation, or model fits, for specific conductance (R2 = 0.86), chloride (R2 = 0.86), and tritium (R2 = 0.92). The model fit for Sr-90 (R2 = 0.73) showed higher amounts of variability in variance and less correlation overall (fig. 14). The kriging interpolation method, applied to select constituents in our study area for samples collected during 2021, and corresponding variograms suggest that this method of interpretation is appropriate for estimating areal concentration distributions.
A survival regression model created by Fisher and others (2021) was used to analyze temporal observations of constituent concentrations in each well from 1989 to 2021 and are presented in many figures of this report. This regression method determines whether the long-term data exhibit a monotonic trend (increasing or decreasing) or are non-monotonic (no trend). The regression method is able to account for censored data, or non-detections. Data are represented as ‘Type-1’ either as an exact detection, or a nondetection with a range of uncertainty, depending on the analyte. Using this approach, if a monotonic trend is established, the data are represented with an interval of uncertainty around the fitted survival regression model, representing the 95 percent confidence interval. The data presented in this report can be found using the site numbers listed in tables 2–3 (Fisher and others, 2024).
Specific Conductance, Temperature, and pH
Specific conductance is a measure of the electrical conductivity of water and is proportional to the quantities of dissolved chemical constituents in water. Dissolved chemical constituents such as chloride, sodium, and sulfate in wastewater discharged to disposal wells and infiltration ponds at INL facilities generally have caused the specific conductance of groundwater to increase over time (Davis and others, 2015).
In 2021, the specific conductance of water from 105 wells that sample the ESRP aquifer ranged from 251 to 2,070 µS/cm; the highest value was in the water from well TAN 2336 located near the TAN Disposal well (table 5). Specific conductance also was high in NRF 6 (1,660 µS/cm), which is located near the NRF industrial waste ditch near the NRF (fig. 3, inset C). Field-specific conductance measurements for groundwater collected in 2021 are presented in figure 13.
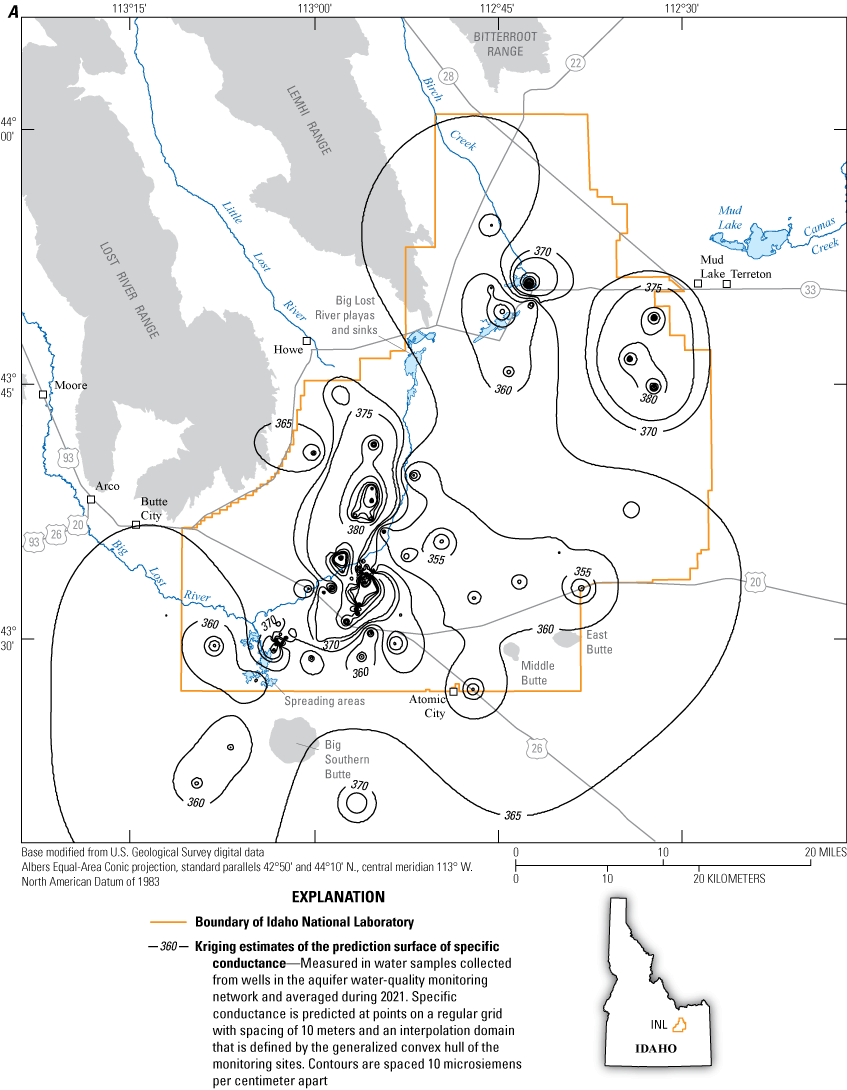
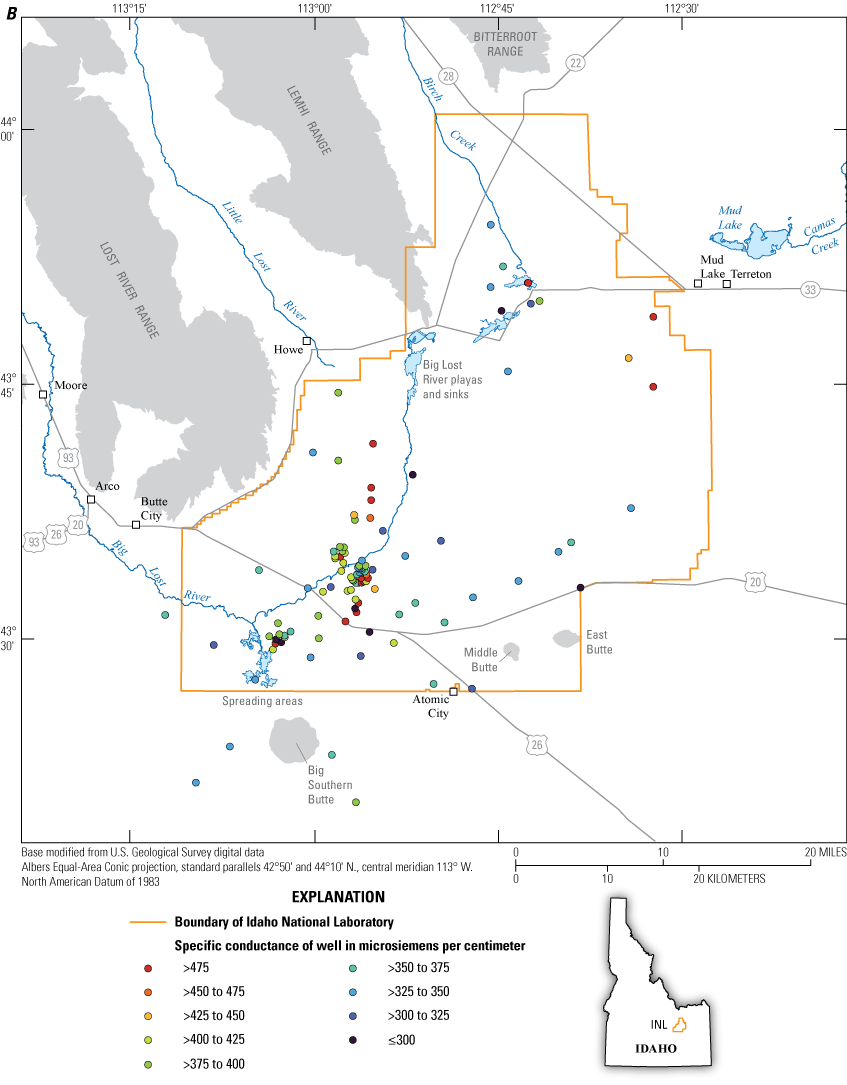
(A) Kriging estimates of the prediction surface of specific conductance concentrations of water overlain on the empirical concentrations and (B) areal distribution of specific conductance concentrations from wells at and near the Idaho National Laboratory (INL), Idaho, 2021. Data used for kriging estimates can be found in Fisher and others (2024).
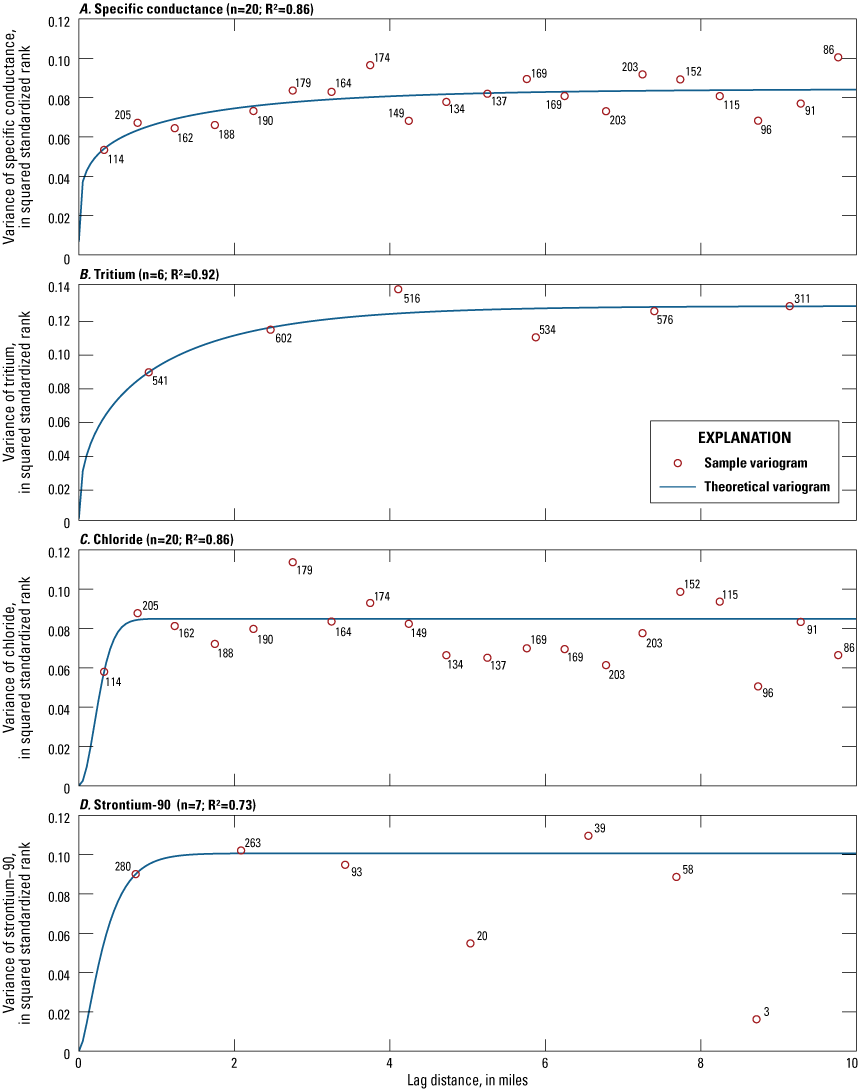
Variogram analysis of specific conductance (A), tritium (B), strontium-90 (C), and chloride (D) transformed into standardized rank space for wells at the Idaho National Laboratory (INL), 2021. Data used for kriging estimates can be found in Fisher and others (2024).
The background-specific conductance of water in the ESRP aquifer was 300–325 µS/cm in the INTEC area in 1962 (Robertson and others, 1974, p. 159). A plume of increased specific conductance originated from the INTEC disposal well and legacy percolation ponds (fig. 7) and extended downgradient of the INTEC to the CFA (fig. 13). The specific conductance of water from several wells in this plume increased from about 500 µS/cm in 1985 (Pittman and others, 1988, p. 64) to more than 1,000 µS/cm in 1998 (Bartholomay and others, 2000, p. 37) and has decreased since then to a mean value of 389 µS/cm in 2021 (fig. 13).
The specific conductance of water from several wells at the ATRC exceeded 400 µS/cm in 2021 (fig. 13). The maximum specific conductance measurement was from well USGS 65 (fig. 6), downgradient of the infiltration ponds at the ATRC. Well USGS 65 had a measurement of 560 µS/cm in April 2021, which decreased from 604 µS/cm in April 2018.
At the CFA, the specific conductance of water from well CFA 1 decreased slightly from 582 µS/cm in 2019 to 554 µS/cm in April 2021. The largest specific conductance measurement in wells near the CFA was in well USGS 130 at 826 µS/cm, which remained similar to the measurement of 822 µS/cm in 2018.
Near the RWMC, the maximum specific conductance measured was in the water from well USGS 88, at 658 µS/cm in October 2021, higher than the measurement of 619 µS/cm in October 2018. Water from most other aquifer wells near the RWMC had measurements of about 250–400 µS/cm (fig. 13).
Water temperature of 105 wells measured in 2021 ranged from 9.9 degrees Celsius (°C) in well USGS 86 located west of RWMC to 21.2 °C in well USGS 146 located north of RWMC (fig. 2). The median water temperature was 12.9 °C. In 2021, the pH for the 105 measured wells ranged from 7.0 in well CFA 2 to 9.2 in well USGS 119, with a median of 7.9. Water temperature and pH measurements were similar to what they have been in the past for the ESRP aquifer (Bartholomay and others, 2020).
Tritium
In the ESRP aquifer, a tritium plume developed from the discharge of wastewater at the INL since the 1950s. Tritium has a half-life of 12.3 years (Walker and others, 1989, p. 20). The maximum contaminant level (MCL) for tritium is 20,000 picocuries per liter (pCi/L) (U.S. Environmental Protection Agency, 2022). About 31,810 Ci of tritium (Davis, 2006a) was discharged to injection wells and legacy percolation ponds at the INL from 1952 through 2000; no records are available from 2000 onwards. The primary sources of tritium in the aquifer have been the injection of wastewater through the disposal well at the INTEC and the discharge of wastewater to percolation ponds at the INTEC and ATRC (fig. 4). Routine use of the disposal well at the INTEC ended in February 1984; subsequently, radioactive wastewater was discharged at INTEC to the legacy percolation ponds until 1993 when the discharge of low- and intermediate-level radioactive waste solutions ceased with the installation of the Liquid Effluent Treatment and Disposal Facility (U.S. Department of Energy, 2021a). Radioactive wastewater was discharged to the radioactive-waste ponds at the ATRC until 1993; since then, tritium at the ATRC has been discharged to lined evaporation ponds, which should prevent migration to the aquifer.
Concentrations of tritium in water samples collected in 2021 from 46 of 105 ESRP aquifer wells were greater than or equal to the reporting level (3s) and ranged from 150±50 to 4,280±150 picocuries per liter (pCi/L). In 2021, the tritium plume extended south-southwestward in the general direction of groundwater flow (fig. 15). Since 1997, tritium concentrations in water samples collected by the USGS from the ESRP aquifer have not exceeded the MCL.
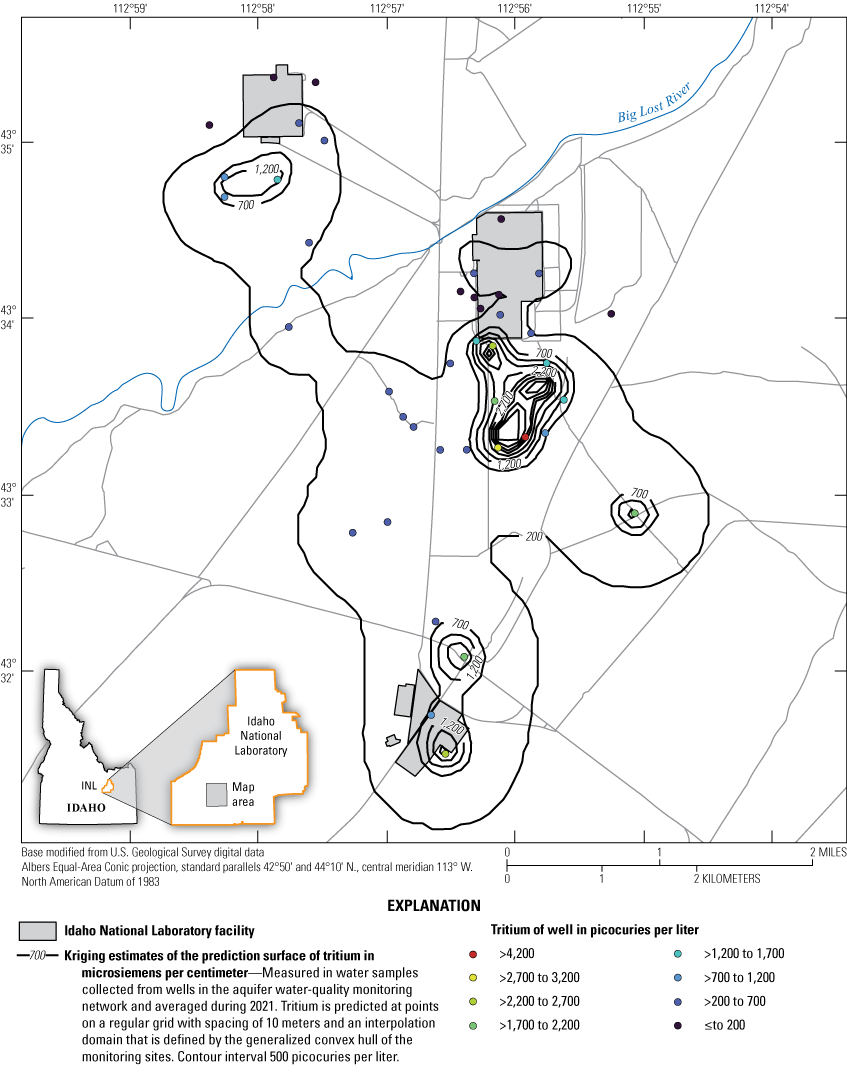
Kriging estimates of the prediction surface of tritium in water overlain on the empirical concentrations from wells at and near the Idaho National Laboratory, Idaho, 2021. Data used for kriging estimates can be found in Fisher and others (2024).
Long-term radioactive-decay and an overall decrease in tritium disposal rates since the 1960s (Davis, 2008) contributed to decreased concentrations of tritium in water from all wells at the INL during 2019–21. Tritium concentrations in water from several wells at and south-southwest of the INTEC decreased during 2019–21 (fig. 16). The greatest decrease in tritium concentrations in wells south of the INTEC disposal well was in well USGS 114, which decreased from 5,100±190 pCi/L in October 2018 to 4,280±150 pCi/L in October 2021 (fig. 16). Concentrations of tritium in well CFA 1 (figs. 5–16) at the CFA decreased from 2,730±90 pCi/L in April 2018 to 2,050±110 pCi/L in April 2021. The overall decrease in tritium concentrations in water from wells at and south-southwest of the INTEC likely resulted from discontinued discharge of tritium in wastewater since the early 1990s, along with dilution, dispersion, and radioactive decay.
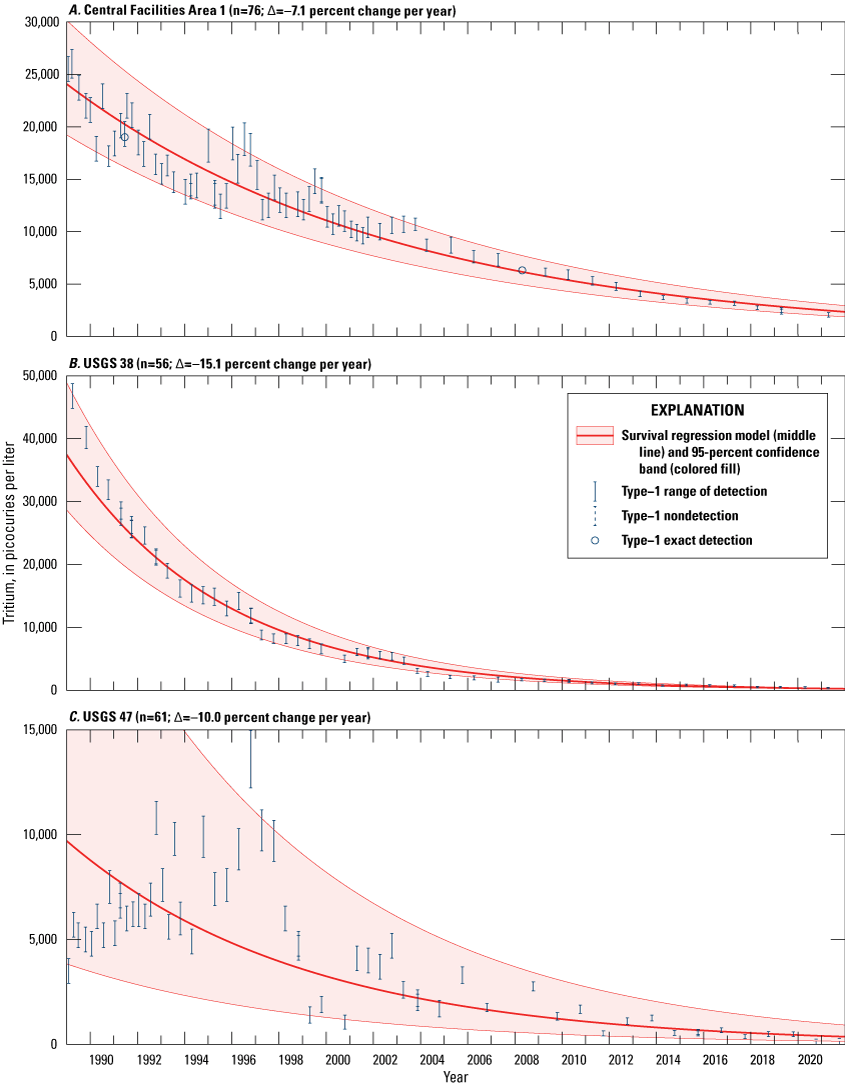
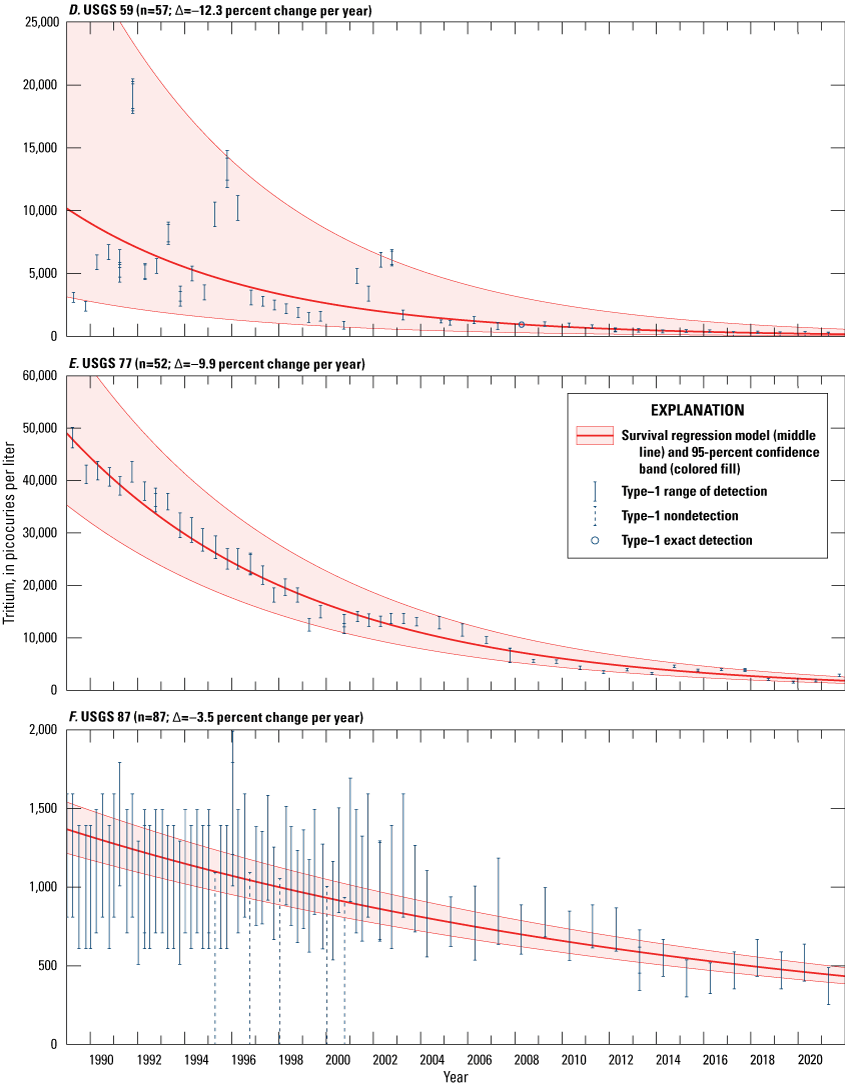
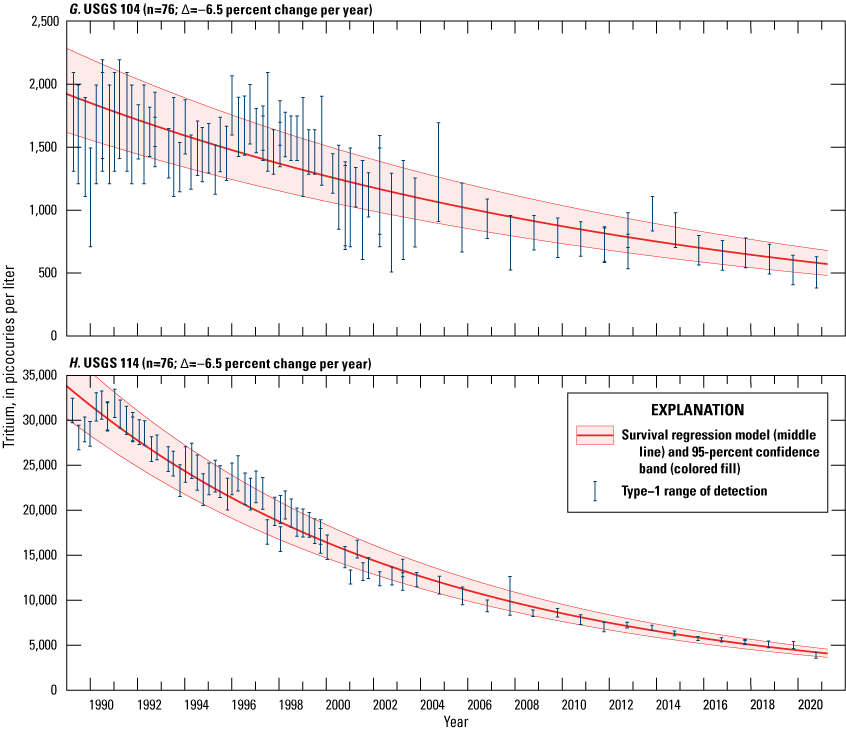
Survival regression models with measurements of tritium concentrations in water from eight wells at and near the Central Facilities Areas, Idaho Nuclear Technology and Engineering Center, and Radioactive Waste Management Complex, 1989–2021. Locations of wells are shown in figures 5 and 6. n, number of observations; ∆, long-term monotonic trend in percentage changes in concentration per year. Data for survival regression estimation can be found in Fisher and others (2024).
Tritium concentrations in water from well USGS 59, near the old INTEC percolation ponds (figs. 6–16), have decreased since 1980, but they were unusually high in October 1983, 1985, 1991, 1995, and 2002–03 (Davis, 2008). The higher concentrations in 1983 and 1985 correspond with higher annual discharge rates of tritium; however, annual discharge of tritium was low in 1991 and 1995 (Davis, 2008; fig. 9). In 1986, perched groundwater was detected outside the casing in well USGS 59. Following modifications to the well to prevent seepage of water into the well, a video log showed that some water from the perched groundwater zone was still seeping into the well. The higher tritium concentrations in 1991, 1995, and 2002–03 probably resulted from seepage from a perched groundwater zone. The high concentrations also correspond with the use of the old eastern percolation pond and with the disposal of tritium to the ponds. The low concentrations in water from well USGS 59 in 1989, 1993, 1994, and 1996–2000 correspond to years in which little or no tritium was discharged to the legacy percolation ponds (Davis, 2008; fig. 9). The steadily decreasing concentrations since 2003 (fig. 16), which started after the ponds were taken out of service and the perched zone dried up, support the hypothesis that leakage from the percolation ponds attributed to changes in this well’s historical concentrations. The relative stability in tritium concentrations in wells USGS 38, 47, 59, 77, and 114 from 2001 to 2004 (fig. 16), could have resulted from the disposal of 0.03 Ci of tritium (S.M. Stoller Corporation, 2002b) to the legacy INTEC percolation ponds and from the lack of dilution by groundwater recharge because of no streamflow in the Big Lost River during 2001–4 (Davis, 2008). The general decrease in concentrations from 2004 to 2021 (fig. 16) occurred after the legacy percolation ponds were taken out of service and replaced with the new percolation ponds about 2 miles southwest of the INTEC.
A water-quality trend report examining data through 2012 (Davis and others, 2015) showed that one well near the RWMC (USGS 87) had an increasing trend of tritium concentrations, which was attributed to water from the upgradient disposal practices. The additional data collected through 2021 indicate a statistically significant decreasing trend (fig. 16), indicating peak tritium values have moved past this well.
In addition to the wells listed in the previous paragraph, two wells that were discontinued from the sample program in 2012 (well USGS 83, which penetrates about 250 ft of the ESRP aquifer; and well EBR 1, which penetrates about 490 ft of the aquifer) also historically showed tritium concentrations less than the reporting level (Fisher and others, 2021, app. 7). Mann and Cecil (1990, p. 18) speculated that tritium was not present in wells USGS 83 and EBR 1 because of dilution from deeper water. Rattray (2018) determined that the water sampled from wells EBR 1 and USGS 83, 89, 117, and 119 were all very old Big Lost River water and (or) Little Lost River Valley water. Rattray (2018) also reported that several of these wells had very low hydraulic conductivities and that the low conductivities probably limit current areas of recharge from influencing the water in the wells. Bartholomay and others (2017b) analyzed wastewater influence in relation to the basalt flows and similarly noted that the wells not influenced by wastewater had low conductivities, although they all were completed in mostly the same two- or three-flow units.
Prior to 1999, concentrations of tritium in water from wells near the southern boundary of the INL (USGS 1, 103, 105, 108, 109, 110A) varied between exceeding and not exceeding the reporting levels (Pittman and others, 1988; Mann and Cecil, 1990; Bartholomay and others, 1997, 2000). During 1999–2005, concentrations of tritium in water from these wells and all wells sampled south of the INL boundary were less than the reporting level (Davis, 2008). During 2006–15, some of the wells with MLMS showed concentrations in some zones greater than the reporting level (Bartholomay and others, 2017a, p. 37), whereas all other wells along the southern boundary and south of the INL had concentrations less than the reporting level.
Strontium-90
A strontium-90 plume developed in the ESRP aquifer from wastewater disposal at the INL. Strontium-90 has a half-life of 29.1 years (Walker and others, 1989, p. 29). The MCL for strontium-90 in drinking water is 8 pCi/L (U.S. Environmental Protection Agency, 2022).
During 1952–98, about 24 Ci of strontium-90 was in wastewater that was injected directly into the aquifer through the disposal well and was discharged to the legacy percolation ponds at the INTEC (Bartholomay and others, 2000). During 1962–63, more than 33 Ci of strontium-90 in wastewater was discharged into a pit at the INTEC (Robertson and others, 1974, p. 117). In 1972, about 18,100 Ci of strontium-90 was leaked at the INTEC tank farm (fig. 7; Cahn and others, 2006). During 1952–1998, about 93 Ci of strontium-90 also was discharged to radioactive-waste infiltration and evaporation ponds at the ATRC (U.S. Department of Energy, 2021a). During 2000, 0.21 Ci of strontium-90/yttrium-90 was discharged at the ATRC (S.M. Stoller Corporation, 2002b, table 6-2). Data are not available for strontium-90 discharged at either the INTEC or the ATRC during 2001–21.
During April or October 2021, water from 45 aquifer wells was sampled for strontium-90 throughout the INL. Concentrations of strontium-90 in water from 12 aquifer wells exceeded the reporting level (3s). Concentrations of strontium-90 ranged from 2.5±0.7 pCi/L in water from well USGS 52 to 299±6 pCi/L in water from well TAN 2271. Well TAN 2336 also had an elevated strontium-90 value measured above the reporting level at 218±6 pCi/L (Fisher and others, 2024). Well TAN 2271 and TAN 2336 are located near the TAN Disposal Well (fig. 5), where strontium-90 was disposed.
The largest 2021 strontium-90 concentration near the INTEC was in well USGS 47 at 13.9±1 pCi/L, which is lower than the 2018 concentration of 14.6±0.9 pCi/L. The area of the strontium-90 plume near the INTEC extended south-southwestward in the general direction of groundwater flow (fig. 17). In 2018, concentrations of strontium-90 in four wells in the INTEC area exceeded the MCL of 8 pCi/L for drinking water. Similarly, in 2021, four wells had concentrations that were equal to or exceeded the MCL. The concentrations of strontium-90 in water from most wells near and southwest of the INTEC have fluctuated and generally exceeded the reporting level (3s) since 1980; however, most wells have shown an overall decrease in strontium-90 concentrations (fig. 18). Strontium-90 concentrations in most wells have been decreasing (Fisher and others, 2021, app. 7), likely because of factors including radioactive decay, diffusion, dispersion, discontinued disposal, and dilution from natural recharge.
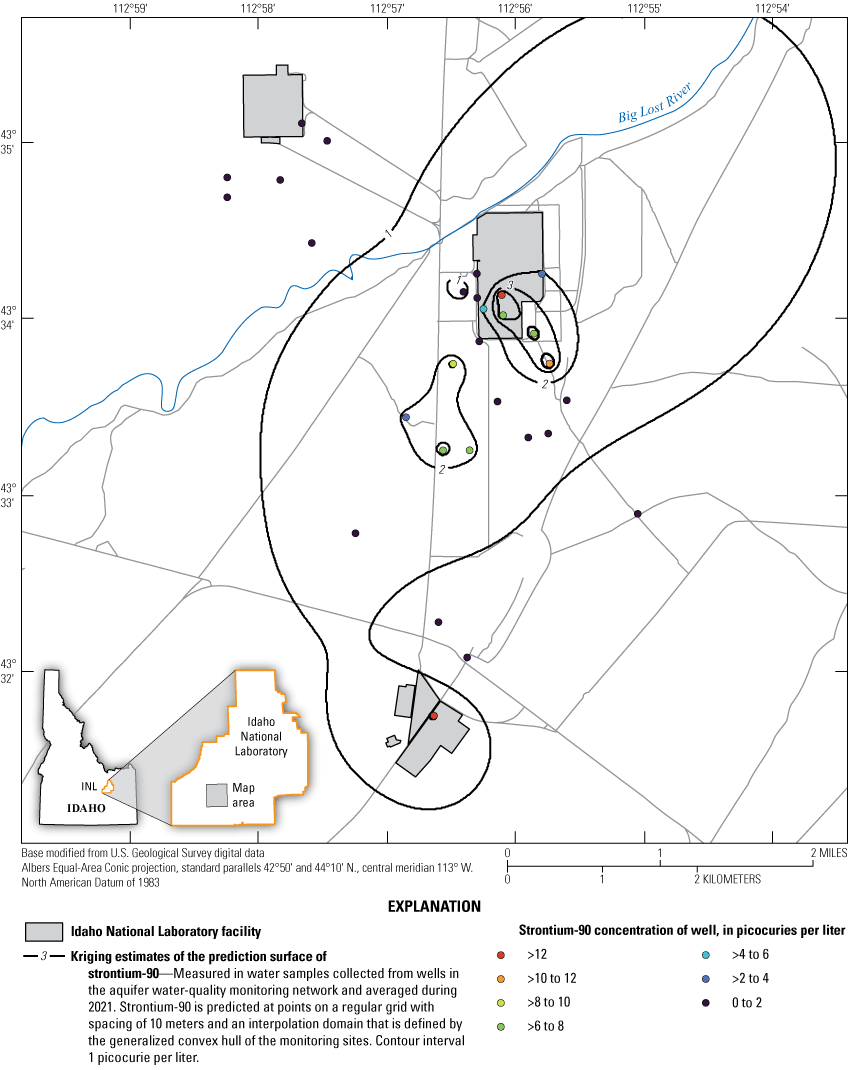
Kriging estimates of the prediction surface of strontium-90 in water overlain on the empirical concentrations from wells at and near the Advanced Test Reactor Complex (ATRC), Idaho Nuclear Technology and Engineering Center (INTEC), and Central Facilities Area (CFA), Idaho National Laboratory (INL), Idaho, 2021. Data used for kriging estimates can be found in Fisher and others (2024).
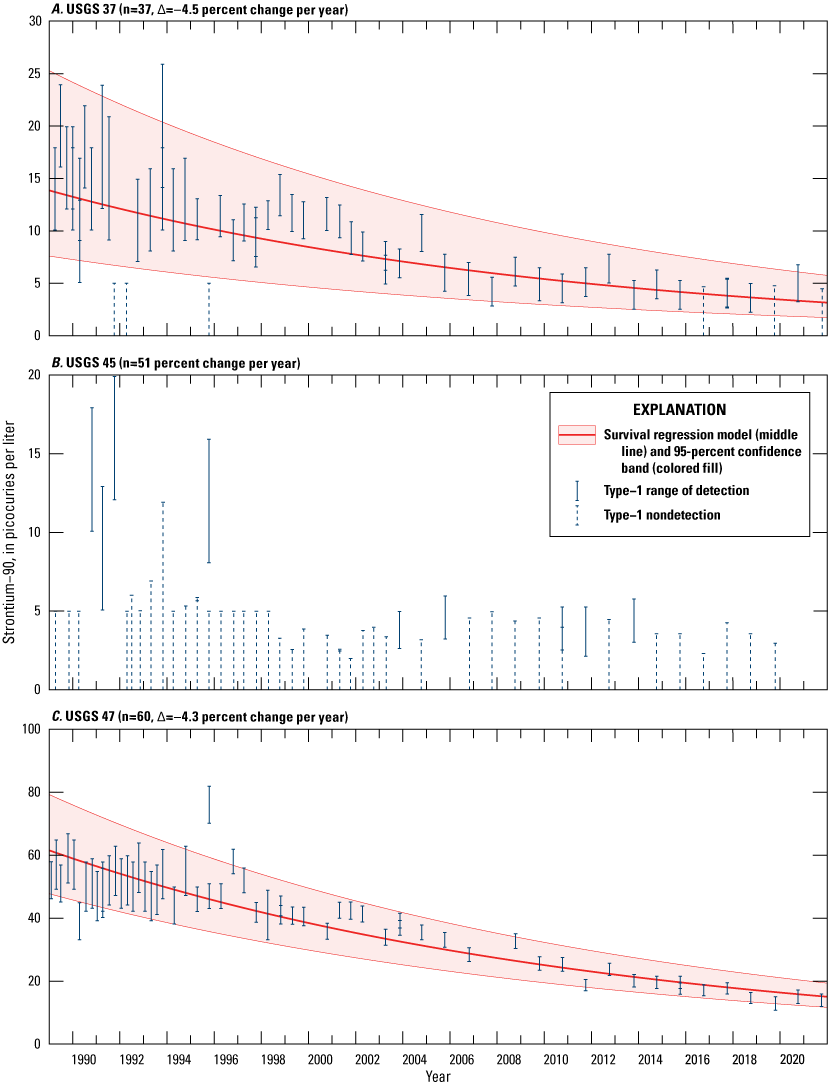
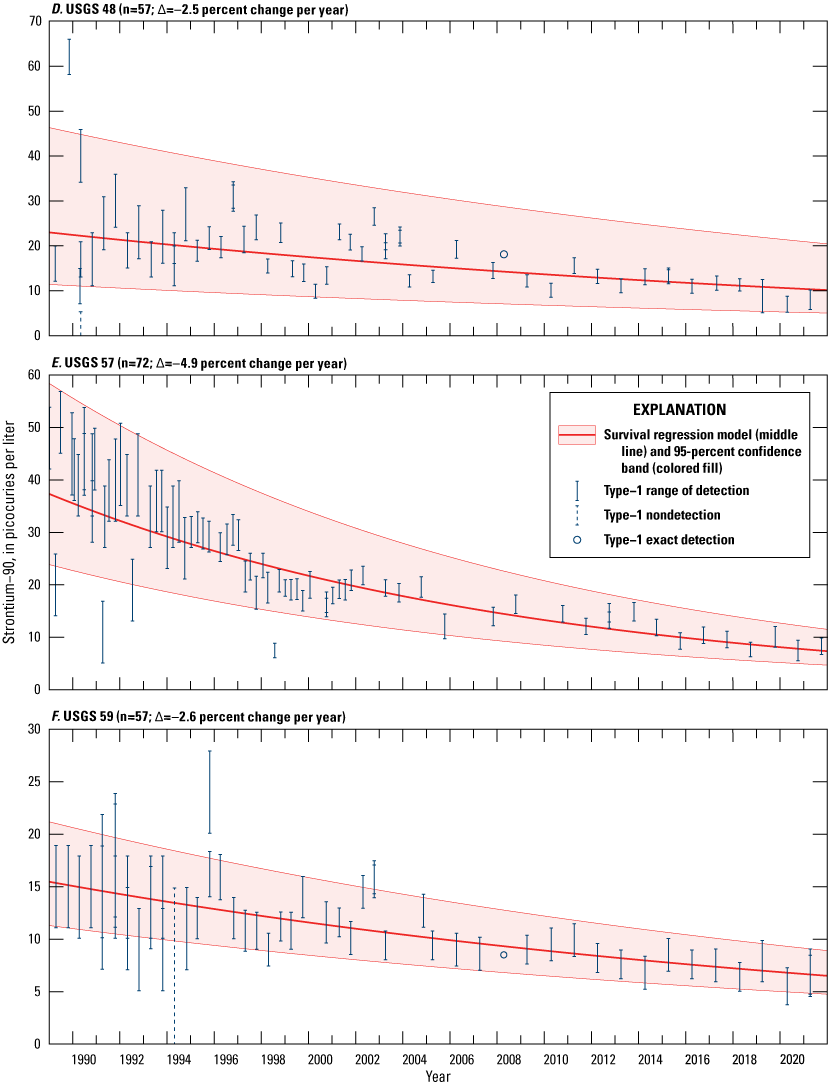
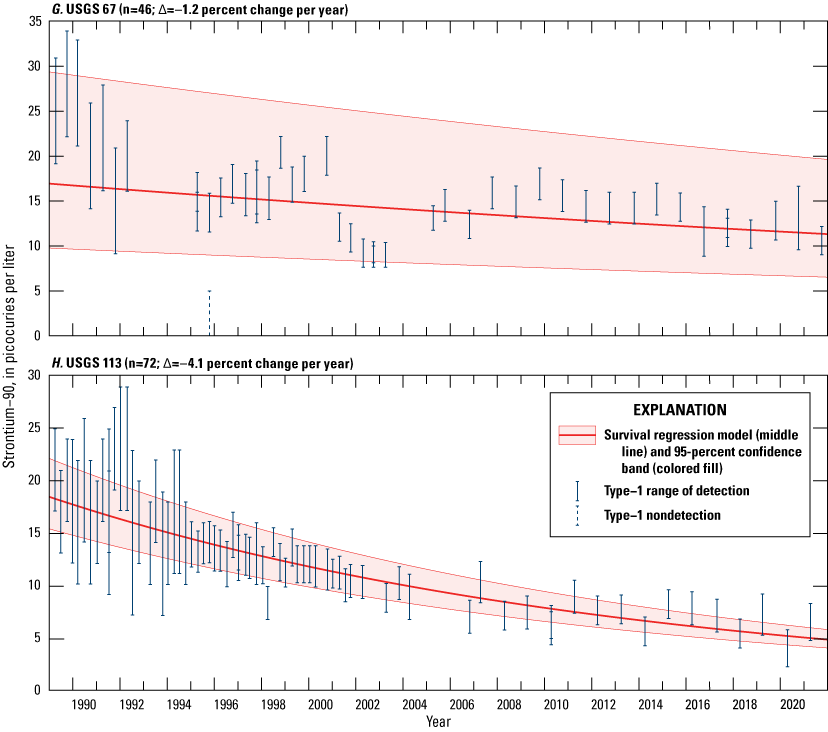
Survival regression models with measurements of strontium-90 concentrations in water from eight wells at and near the Idaho Nuclear Technology and Engineering Center, Idaho, 1989–2021. Locations of wells are shown in figure 6. n, number of observations; ∆, long-term monotonic trend in percentage changes in concentration per year. Data for survival regression estimation can be found in Fisher and others (2024).
Strontium-90 has not been detected in the ESRP aquifer beneath the ATRC partly because of the exclusive use of waste-disposal ponds and lined evaporation ponds rather than the disposal well for radioactive-wastewater disposal at that facility. Sorption processes in sediments in the unsaturated zone beneath the radioactive waste-disposal pond have minimized or prevented strontium-90 migration to the aquifer at the ATRC. Additionally, the stratigraphy beneath the ATRC includes more sedimentary interbeds than the stratigraphy beneath the INTEC (Anderson, 1991, p. 22–28).
Cesium-137
From 1952 to 2000, about 138 Ci of cesium-137 in wastewater was discharged to the ATRC radioactive-waste infiltration and lined evaporation ponds, and about 23 Ci was discharged to the INTEC disposal well and percolation ponds. In 1972, an additional 19,100 Ci of cesium-137 leaked at the INTEC tank farm (fig. 7; Cahn and others, 2006). Concentrations as high as 2,150 pCi/L have been measured in groundwater at TAN (Jolley, 2007). The half-life of cesium-137 is 30.17 years (Walker and others, 1989, p. 34). Cesium-137 is analyzed by gamma analyses (a technique that can also measure detections of cobalt-60 and chromium-51).
During 2019–21, water from 35 aquifer wells was sampled and analyzed for cesium-137. All sample results for Cs-137 were less than the reporting level (3s) (Fisher and others, 2024). The absence of significant concentrations of cesium-137 probably resulted from the discontinuation of wastewater discharge to the INTEC disposal well and ATRC radioactive waste infiltration ponds and sorption processes in the unsaturated and perched groundwater zones.
Plutonium
In 1974, the USGS began monitoring plutonium-238, -239, and -240 (undivided) in wells to track wastewater discharged to the ESRP aquifer through the disposal well at the INTEC (fig. 6). During 1974–2000, about 0.26 Ci of plutonium in wastewater was discharged to the disposal well and percolation ponds at the INTEC (Davis, 2008). About 17,100 Ci of plutonium-238, 64,900 Ci of plutonium-239, and 17,100 Ci of plutonium-240 were buried in the SDA during 1952–99 (Holdren and others, 2002, table 4-1).
Before 1974, alpha radioactivity from the disintegration of plutonium was not separable from the monitored, undifferentiated alpha radioactivity. The half-lives of plutonium-238, -239, and -240 are 87.7, 24,100, and 6,560 years, respectively (Walker and others, 1989, p. 46). Because of radioactive wastewater discharged to the disposal well at the INTEC, concentrations of plutonium isotopes in some water samples from wells USGS 40 and 47 near the INTEC (fig. 6) exceeded the reporting levels through January 1987 (Orr and Cecil, 1991, p. 37). Concentrations in water samples collected from these wells since 1987 have been less than the reporting level of 3s. During 2019–21, concentrations of plutonium-238, -239, and -240 (undivided) in water from all 12 aquifer wells sampled were less than the reporting level.
Americium-241
Americium-241 is a decay product of plutonium-241. Plutonium isotopes were in wastewater discharged to the ESRP aquifer at the INL and are in buried waste at the RWMC. The half-life of americium-241 is 432.7 years (Walker and others, 1989, p. 46).
Concentrations of americium-241 in some water samples collected from September 1972 to July 1982 from wells USGS 87, 88, 89, and 90 at the RWMC and in water samples collected through 1988 from the TAN Disposal Well exceeded reporting levels (Orr and Cecil, 1991, p. 38–39). During 1992–95, concentrations of americium-241 in water samples from two wells were equal to reporting levels. On October 2, 1992, the concentration in water from well USGS 37 was 0.09±0.03 pCi/L, and on April 20, 1993, the concentration in water from well USGS 120 was 0.06±0.02 pCi/L (Bartholomay and others, 1997). The concentration in one water sample collected on April 12, 2001, from the RWMC Production Well (RWMC PROD) was 0.003±0.001 pCi/L, equal to the reporting level (Davis, 2008). During 2019–21, concentrations in water from all of the 12 aquifer wells sampled were less than the reporting level.
Gross Alpha- and Beta-Particle Radioactivity
Gross alpha- and beta-particle radioactivity is a measure of the total radioactivity given off as alpha and beta particles during the radioactive decay process. Gross alpha and beta measurements are used to screen for radioactivity in the aquifer as a possible indicator of groundwater contamination. Water samples collected during 2019–21 were analyzed for gross alpha- and gross beta-particle radioactivity by the RESL. In 2008, the RESL increased the sensitivity of the gross alpha- and gross beta- particle radioactivity and changed the radionuclide reported for gross alpha-particle radioactivity from plutonium-239 to thorium-230, and for gross beta-particle radioactivity from cesium-137 to strontium-90/yttrium-90. The minimum detectable activity decreased from about 1.6 to 1.5 pCi/L for gross alpha-particle radioactivity and from about 6.4 to 3.4 pCi/L for gross beta-particle radioactivity, allowing for increased detectable concentrations (Bartholomay and Twining, 2010).
During 2019–21, water from 49 aquifer wells was sampled and analyzed for gross alpha-particle radioactivity. Seven wells (Highway 3, TAN 2271, TAN 2336, 107, 127, 14, and 77) had gross alpha-particle radioactivity equal to or greater than the reporting level (3s) and ranged from 6±2 to 125±7 pCi/L . TAN 2271 had concentrations greater than the reporting level in all time periods ranging from 61±14 (2021) to 125±27 (2020). Concentrations of gross alpha-particle radioactivity in water from all other wells sampled and analyzed in 2021 were less than the reporting level.
During 2019–21, concentrations of gross beta-particle radioactivity in water from 49 wells were measured. Of these wells, all wells had at least one detection that was above the reporting level in this time period and ranged from 2.1±0.7 pCi/L to 716±40 pCi/L in well TAN 2271 (2019). Measured gross beta particle radioactivity in TAN 2271 decreased from 716±40 in 2019 to 596±33 pCi/L in 2021. TAN 2336 had a gross beta-particle radioactivity measurement of 453±26 pCi/L in 2021.
Chromium
From 1952 to 1972, an estimated 17,790 lb of chromium was discharged to the radioactive-waste infiltration ponds, and 31,131 lb of chromium was discharged to the TRA disposal well (U.S. Department of Energy, 2021a). In October 1972, chromium used as a corrosion inhibitor in cooling-tower operations was replaced by a polyphosphate. No disposal of chromium to the subsurface at the ATRC was reported after 1972.
During 1971–83, about 265 lb of chromium in wastewater were discharged to the disposal well at the INTEC, and 720 lb of chromate was discharged at the Power Burst Facility (PBF; fig. 1; Cassidy, 1984, p. 3). About 130 lb of chromium were discharged to the old INTEC percolation ponds during 1992–98 (Bartholomay and others, 2000).
Background concentrations of dissolved chromium in the ESRP aquifer in the eastern regional and western tributary groundwater were 3 and 4 micrograms per liter (µg/L), respectively (Bartholomay and Hall, 2016). In April 2009, the dissolved chromium concentration in water from one well, USGS 65, south of ATRC (fig. 6), was equal to the MCL of 100 µg/L (U.S. Environmental Protection Agency, 2022) for chromium in public drinking water supplies. Concentrations in water samples from 64 wells sampled in 2021 ranged from <0.5 to 76.4 µg/L. In April 2021, the concentration of dissolved chromium in water from USGS 65 remained similar to the concentration from 2018 (76 µg/L) at 76.4 µg/L, still below the MCL.
Sodium
During 1989–98, an estimated average annual 1.3 million pound per year (lb/yr) of sodium in wastewater was discharged at the INL (Bartholomay and others, 1995, 1997, 2000). During 1996–98, about 708,000 lb/yr of sodium were discharged to the INTEC percolation ponds, about 58,000 lb/yr were discharged to the ATRC chemical-waste infiltration pond, about 524,000 lb/yr were discharged to the NRF industrial-waste ditch, and about 5,000 lb/yr were discharged at the CFA (Bartholomay and others, 2000). The background concentration of dissolved sodium in water from western tributary groundwater is about 8.3 milligrams per liter (mg/L) in the western part of the INL and about 14.8 mg/L in the eastern regional groundwater (Bartholomay and Hall, 2016). In 2021, concentrations in water from most wells in the southwestern part of the INL were greater than 8.3 mg/L.
Concentrations of dissolved sodium in water from wells near the INTEC generally were variable in the 1980s and 1990s because of variable discharge to the disposal well and infiltration ponds south of the INTEC (figs. 7–19). Since 2002, when the infiltration ponds were taken out of service, dissolved sodium concentrations mostly have decreased (Davis and others, 2015, app. D; Fisher and others, 2021). However, during 1999–2021, high concentrations of dissolved sodium were detected the water from select wells at or near the INTEC (figs. 6–19). During 2021, the highest dissolved sodium concentration in water samples from aquifer wells near the INTEC was 30.4 mg/L in a water sample from well USGS 51 (fig. 6), a slight increase from 2018 (24.7 mg/L). Concentrations of dissolved sodium in water from other wells south of the INTEC during 2019–21 generally also were greater than or equal to sodium concentrations detected during 2016–18 (fig. 19).
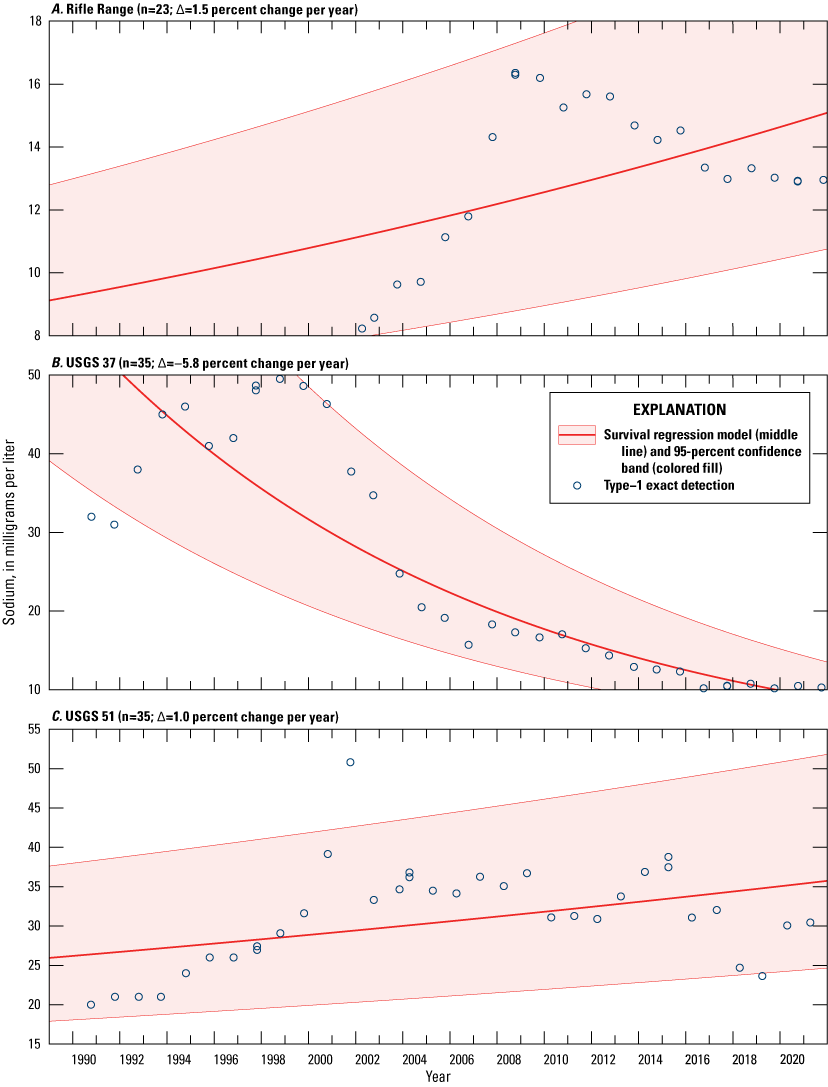
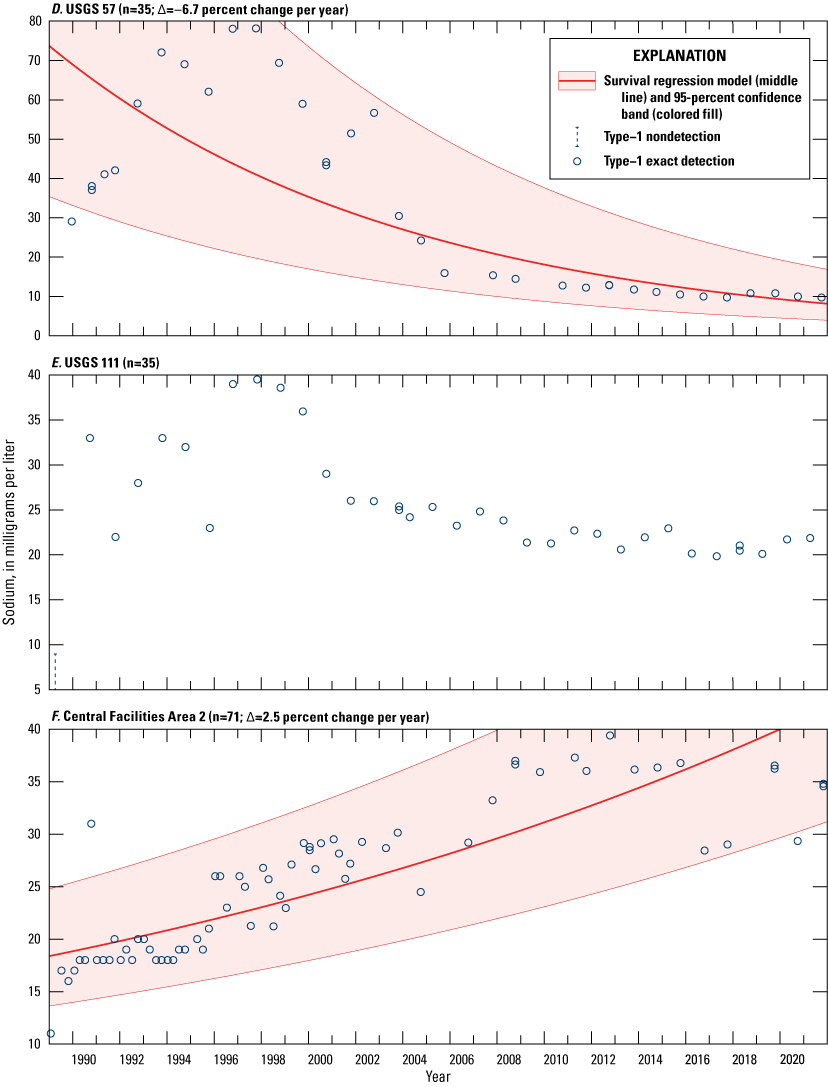
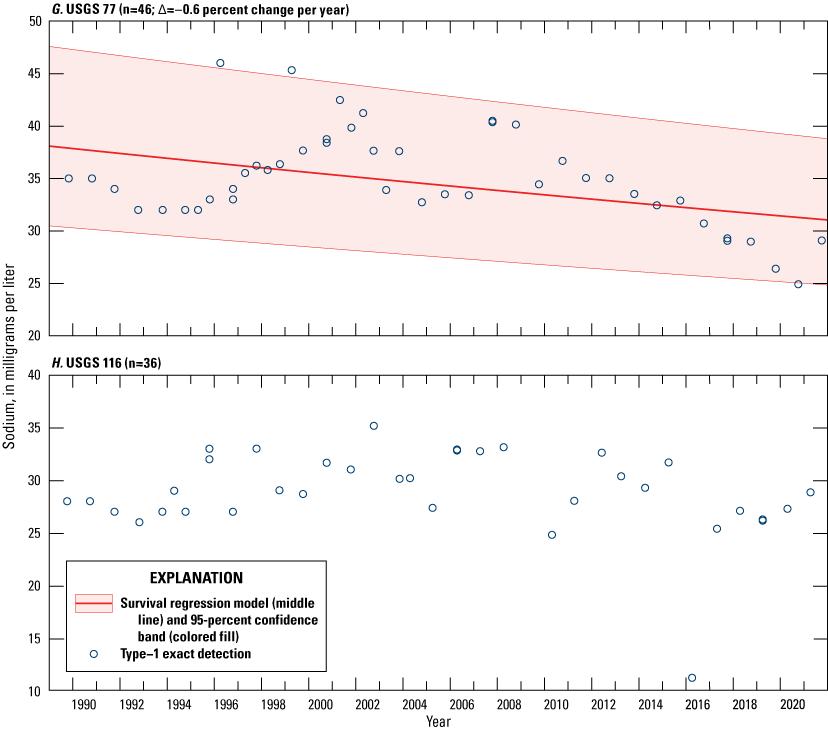
Survival regression models with measurements of dissolved sodium concentrations in water from eight wells at and near the Idaho Nuclear Technology and Engineering Center, the Advanced Test Reactor Complex, and Central Facilities Area, Idaho National Laboratory, Idaho, 1989–2021. Location of wells is shown in figures 5 and 6. n, number of observations; ∆, long-term monotonic trend in percentage changes in concentration per year. Data for survival regression estimation are at Fisher and others (2024).
Davis and others (2015, figs. 21–22) found increasing trends in several wells downgradient of the INTEC near and south of the CFA through 2012 and later updated in Fisher and others (2021, app. 7). The increasing trends were attributed to the movement of the high-concentration water discharged during the 1970s–1990s at the INTEC, finally reaching these wells which resulted in increasing concentration trends (Davis and others, 2015).
Installation and use of the new percolation ponds 2 mi southwest of the INTEC have contributed to increased concentrations of sodium in the Rifle Range well (fig. 19). In 1988, the concentration of sodium in this well was near background concentrations at about 8.3 mg/L defined by Bartholomay and Hall (2016). After the new percolation ponds were put into service in 2002, concentrations of sodium at the Rifle Range well increased steadily until 2008 to a concentration of 16 mg/L; since 2008, concentrations of sodium have decreased (fig. 19), probably due to more consistent rates of discharge of sodium to the new percolation ponds.
In October 2021, the sodium concentration in water from well USGS 88 (fig. 6), near the RWMC, was 52.9 mg/L, slightly greater than the 46.8 mg/L concentration in 2018. In April 2021, the sodium concentration in water from well MTR Test at the ATRC near the chemical-waste pond (fig. 6) was 10.5 mg/L, significantly less than the highest concentration detected in that well of 42 mg/L in 1998. Concentrations of sodium in this well have remained fairly constant in the 9–13 mg/L range since about 2002 (Fisher and others, 2021, app. 7). Sodium-concentration decreases at the MTR Test well may result from the discontinued use of the chemical-waste pond in 1999 (Davis and others, 2015).
The largest concentrations observed in wells near TAN in 2021 were in TAN 2336 at 337.1 mg/L and TAN 2271 at 112.5 mg/L. These wells are located near the TAN Disposal Well, where wastewater with elevated sodium was discharged in the past.
Chloride
Wastewater containing chloride has been discharged to infiltration ponds at the INL. The background chloride concentration in water in the western part of the western tributary groundwater at the INL is about 12 mg/L (Bartholomay and Hall, 2016), the background dissolved chloride concentration near the INTEC is about 10 mg/L, and the background chloride concentration near the CFA is about 20 mg/L (Robertson and others, 1974, p. 150). The secondary MCL for total chloride in drinking water is 250 mg/L (U.S. Environmental Protection Agency, 2022). In 2021, concentrations of dissolved chloride in most water samples from wells south of the INTEC and at the CFA (figs. 20–21) were greater than the background of 10 mg/L but were less than the secondary MCL.
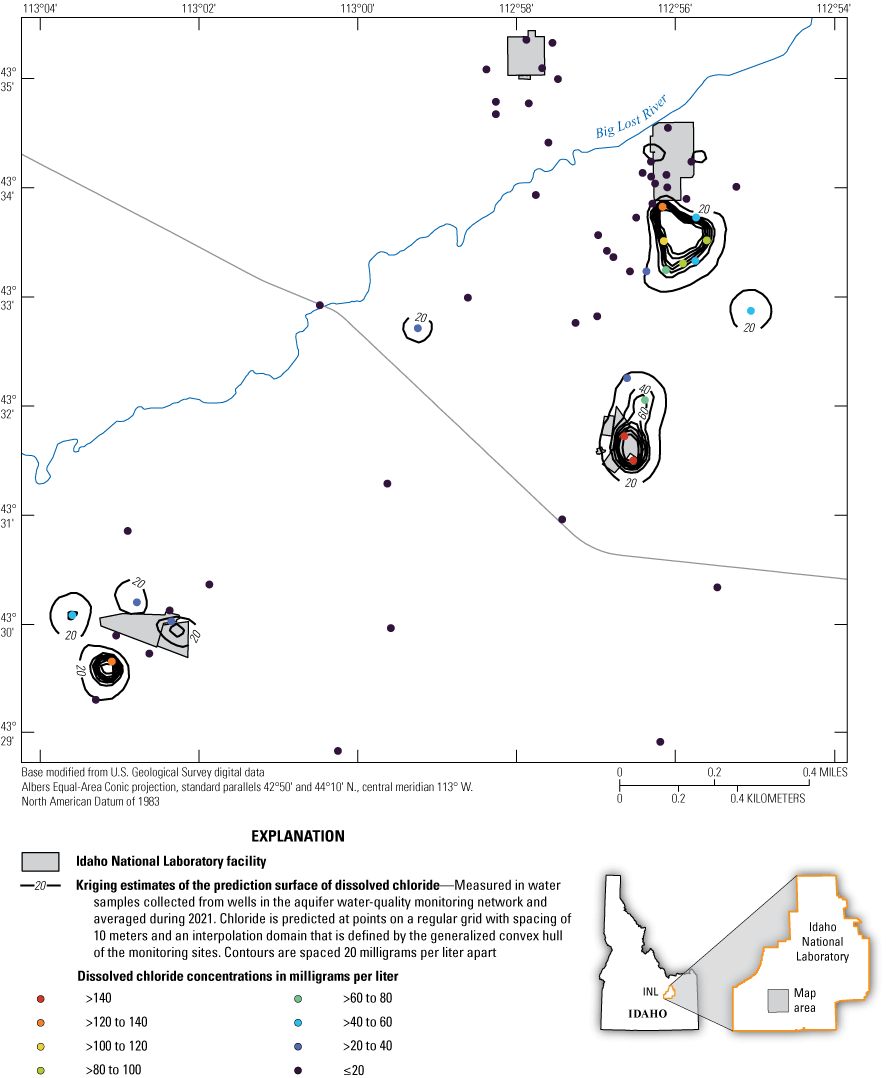
Kriging estimates of the prediction surface of chloride in water overlain on the empirical concentrations from wells at and near the Idaho National Laboratory, Idaho, 2021. Data used for kriging estimates can be found in Fisher and others (2024).
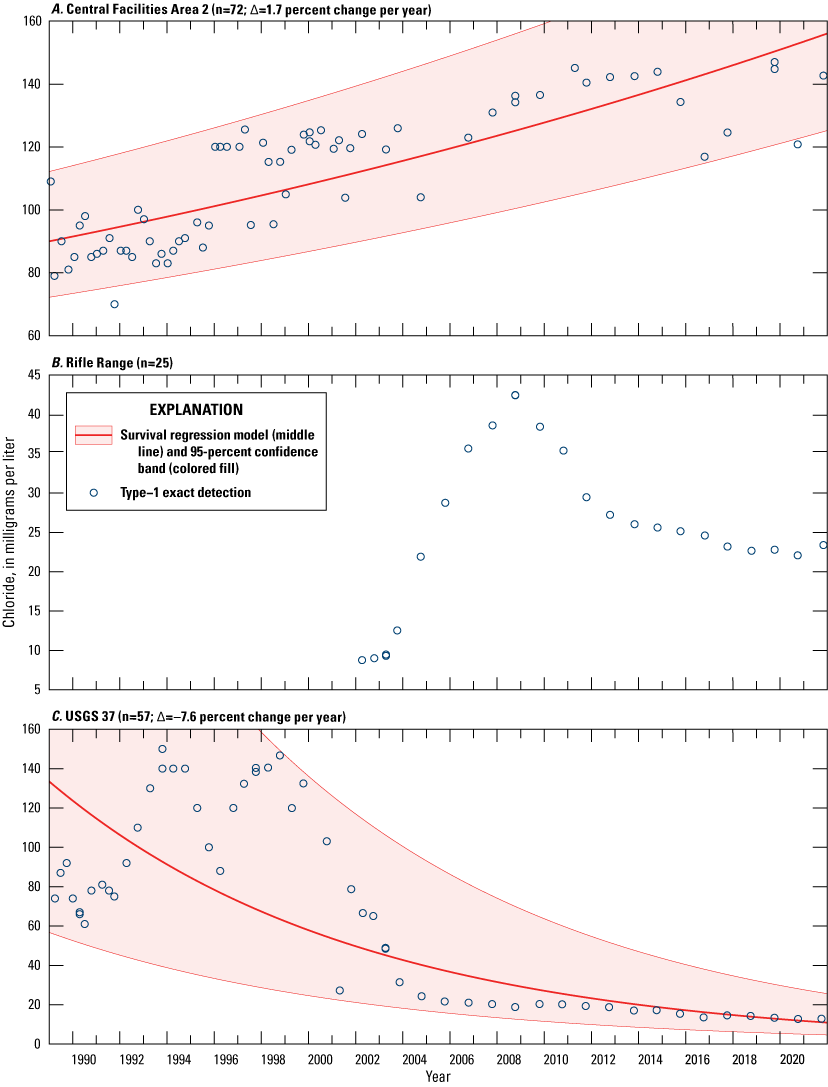
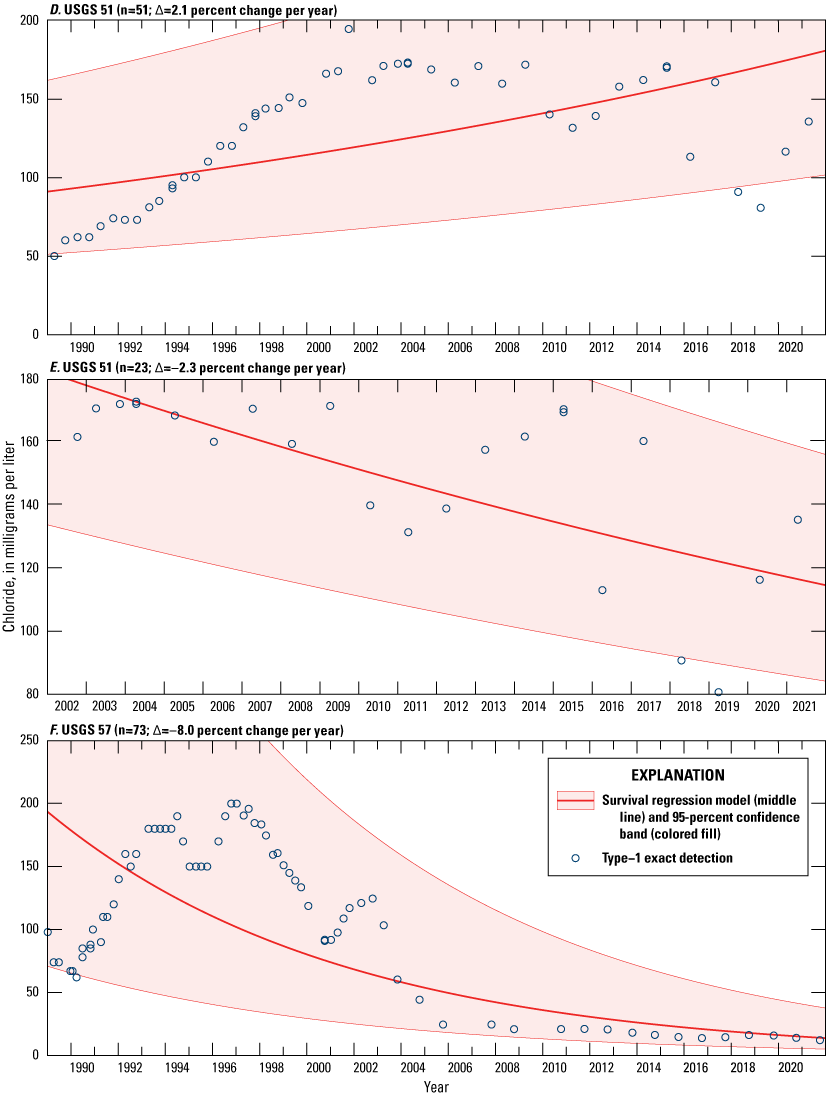
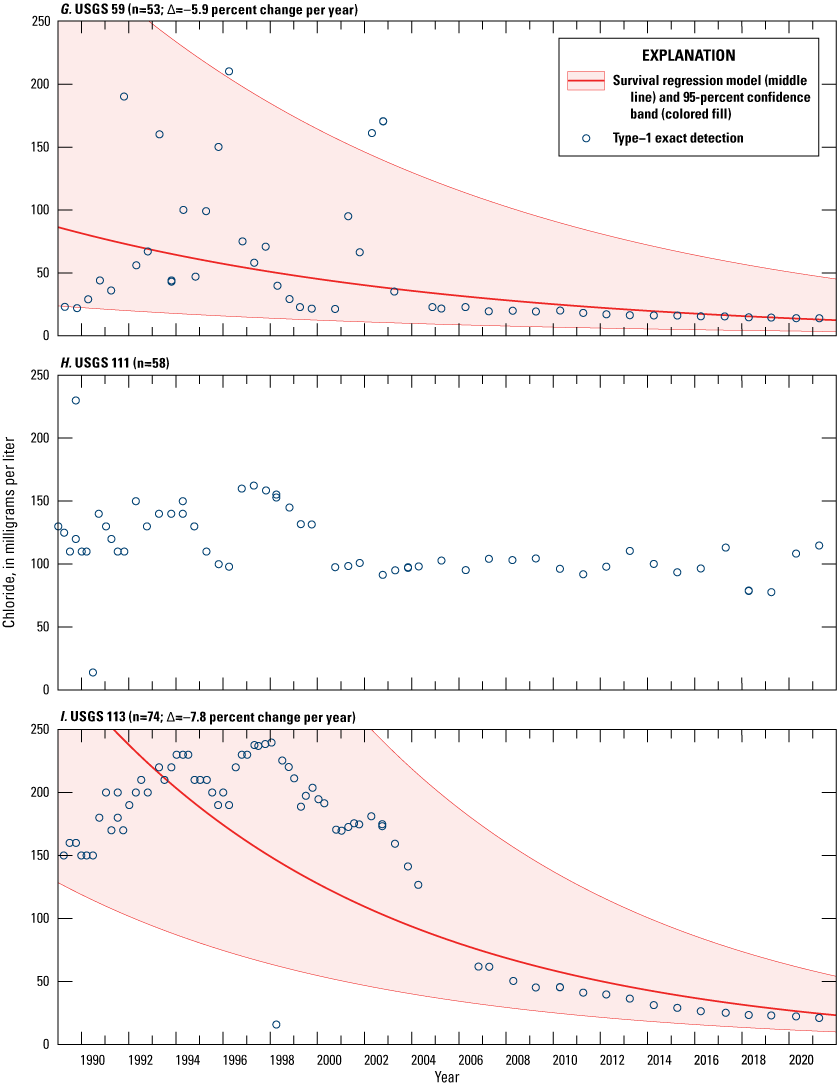
Survival regression models with measurements of dissolved chloride concentrations in water from nine wells at and near the Idaho Nuclear Technology and Engineering Center, Idaho National Laboratory, Idaho, 1989–2021. Locations of wells are shown in figures 5–6. n, number of observations; ∆, long-term monotonic trend in percentage changes in concentration per year. Data for survival regression estimation can be found in Fisher and others (2024).
Concentrations of dissolved chloride in water from wells near the INTEC generally were variable in the 1980s and 1990s because of variable discharge to the disposal well and infiltration ponds south of the INTEC (figs. 6, 21). Since 2002, when the infiltration ponds were taken out of service, chloride concentrations mostly have decreased except at select wells southeast of the INTEC (fig. 21).
During 2021, the highest chloride concentration in water samples from aquifer wells near the INTEC was 135.4 mg/L in a water sample from well USGS 51 (fig. 6), an increase from 2018 (90.7 mg/L). This well is located at the legacy infiltration ponds and was one of the few that showed an increasing concentration trend near the INTEC since the 1989 (fig. 21). However, since the infiltration ponds were discontinued in 2002, there has been a decreasing trend in USGS 51(fig. 21f). The long-term variable concentrations at USGS 51 are most likely from the remobilization of remnant unsaturated zone water that migrates to the aquifer during the wetter climate periods when surface water makes it on site. Concentrations of chloride in water from other wells south and southwest of the INTEC during 2019–21 generally were less than or equal to chloride concentrations detected during 2016–18 and generally showed decreasing trends (fig. 21).
Chloride concentrations in the Rifle Range well (figs. 5, 21) increased from 9 mg/L in October 2002 to 42 mg/L in 2008 and decreased to 23.4 mg/L in October 2021. This well is downgradient of the new INTEC percolation ponds, so the changes in concentrations probably are due to variable rates of chloride discharge to the ponds.
The chloride concentration in water from well CFA 2 at the CFA decreased slightly from 144.7 mg/L in October 2019 to 142.6 mg/L in October 2021; however, the overall trend for concentrations from 1989 to 2021 was an increasing one (fig. 21a). Chloride concentrations in other wells in the CFA ranged from 10.9 to 150.2 mg/L in 2021. The elevated chloride concentrations at the CFA are attributed to past disposal at the INTEC, and the increasing trend in CFA 2 probably is representative of a period of increased wastewater disposal at the INTEC during some previous timeframe (U.S. Department of Energy, 2021a).
In April 2021, the 18.8-mg/L chloride concentration in water from well USGS 65 south of the ATRC (fig. 6) was consistent with concentrations in water from all other wells completed in the ESRP aquifer at or near the ATRC, which were near background concentrations and ranged from 10 to 18.8 mg/L during 2021, similar to concentrations during the 2016–18 reporting period (Bartholomay and others, 2020).
During 2021, chloride concentrations in water from wells USGS 88 and 89 at the RWMC were 120 and 42.4 mg/L, respectively, slightly lower than concentrations during the 2016–18 reporting period. Concentrations of chloride in all other wells near the RWMC ranged from 6.1 to 26.7 mg/L.
The largest concentration in wells near TAN observed in 2021 was 107.6 mg/L in well TAN 2336. The elevated chloride concentration at TAN 2336 was likely due to its proximity to TAN Disposal Well, which was used to dispose of inorganic, organic, and radiochemical waste (U.S. Department of Energy, 2021a; Twining and others, 2023).
Sulfate
Sulfate in wastewater has been previously discharged to percolation (infiltration) ponds at the INTEC and ATRC and to the NRF industrial-waste ditch (Bartholomay and others, 2000). Because of the sulfate disposal history at the various facilities, water-sample collection for dissolved sulfate analyses at several wells was added to the USGS water-quality monitoring network in 1995. The background concentration of sulfate in the ESRP aquifer in the western part of the INL (western tributary groundwater) is about 21 mg/L (Bartholomay and Hall, 2016). The secondary MCL for sulfate in drinking water is 250 mg/L (U.S. Environmental Protection Agency, 2022).
In 2021, sulfate concentrations in most of the water samples from wells in the western part of the INL were consistent with the background concentration for western tributary groundwater. However, some wells had concentrations higher than the background, including USGS 130, which had a concentration of 54.4 mg/L (fig. 6). The sulfate concentration in well USGS 65, south of the ATRC, was 141.1 mg/L in 2021, which is higher than the background concentrations defined for both the western tributary and eastern regional groundwater sources (Bartholomay and Hall, 2016). During 2021, concentrations were 43.7, 38.2, and 32.2 mg/L in water from wells USGS 34, 37, and 38, respectively, southwest of the INTEC. Fisher and others (2021, app. 7) indicated increasing trends in these and several other wells southwest of the INTEC from 1989 to 2018. The increasing concentrations may be due to decreased dilution from less overall surface water availability and infiltration at INL. The greater-than-background concentrations in water from these wells probably resulted from legacy sulfate disposal at the ATRC infiltration ponds or the legacy INTEC percolation ponds.
In April or October 2021, sulfate concentrations in water samples from most wells around and near the RWMC (fig. 6) were greater than the western tributary and eastern regional groundwater background concentrations of approximately 21 mg/L and were highest in well USGS 88 at 48.1 mg/L. Long-term sulfate concentration data from 1989 through 2018 from USGS 77 and USGS 120 showed no trend, while USGS 88 had a decreasing trend and USGS 119 showed an increasing trend (Fisher and others, 2021, app. 7). The sulfate concentrations in water from these wells that were greater than the upper background level could have resulted from the well construction techniques (see Pittman and others, 1988, p. 57–61) and (or) waste disposal at the RWMC or the ATRC.
Nitrate (As Nitrogen)
Wastewater containing nitrate was injected into the ESRP aquifer through the INTEC disposal well from 1952 to February 1984 and was discharged to the INTEC percolation ponds after February 1984 (Orr and Cecil, 1991). Additionally, nitrate was present in waste leaked at the INTEC tank farm during a transfer from one tank to another in 1972 (Cahn and others, 2006). Concentrations of nitrate (as N) in groundwater not affected by wastewater disposal from INL facilities are less than the background concentrations of about 0.655 mg/L for western tributary groundwater and about 1 mg/L for eastern regional groundwater (Bartholomay and Hall, 2016).
Concentrations of dissolved nitrate in this report are reported as nitrogen (N) in mg/L. Until the 2006–08 reporting period for publications in this series, nitrate was reported as nitrate (NO3-). To convert concentrations as N to concentrations as NO3-, the nitrate (as N) concentration should be multiplied by 4.4266 (Hem, 1989, table 8) so that concentrations reported here can be compared with those given in previous reporting-period publications. Historical nitrite analyses indicate that almost all nitrite concentrations are less than the laboratory MDL for analyses at the INL, so concentrations of nitrite plus nitrate are referred to as (dissolved) nitrate in this report.
All nitrate concentrations measured in 2021 were less than the 10-mg/L MCL for drinking water (U.S. Environmental Protection Agency, 2022). Nitrate concentrations at the INL near the INTEC have mostly decreased in response to reduced disposal rates and to the transition in 1984 from the injection of wastewater to the INTEC disposal well to discharge to the legacy percolation ponds (Fisher, 2021, app. 7). Although concentrations generally have decreased, concentrations in several of the wells have shown variable increasing and decreasing trends over time. The variable trends may have resulted from periodic dilution by recharge from the Big Lost River and differences in discharge rates to the legacy percolation ponds from 1984 to 2002. The two exceptions to decreasing trends near INTEC are wells USGS 20 and USGS 67, which both show increasing nitrate concentration trends between 1989 and 2021 (fig. 22). The continued increasing trends could be due to the mobilization of nitrate beneath the INTEC tank farm, as both wells are downgradient of the INTEC tank farm and nitrate was present in the reported 1972 leak (Cahn and others, 2006; U.S. Department of Energy, 2021a). There is evidence of increased nitrate in groundwater occurring after periods of above-average precipitation, such as the late 1990s, when recharge from surface water sources like the Big Lost River, presumably mobilized these constituents below the tank farm. Relatively low concentrations occurred in the early to mid-2000s when dryer conditions, or below-average precipitation, and presumably less opportunity for surface recharge to mobilize constituents in the subsurface and move them to the aquifer (fig. 22).
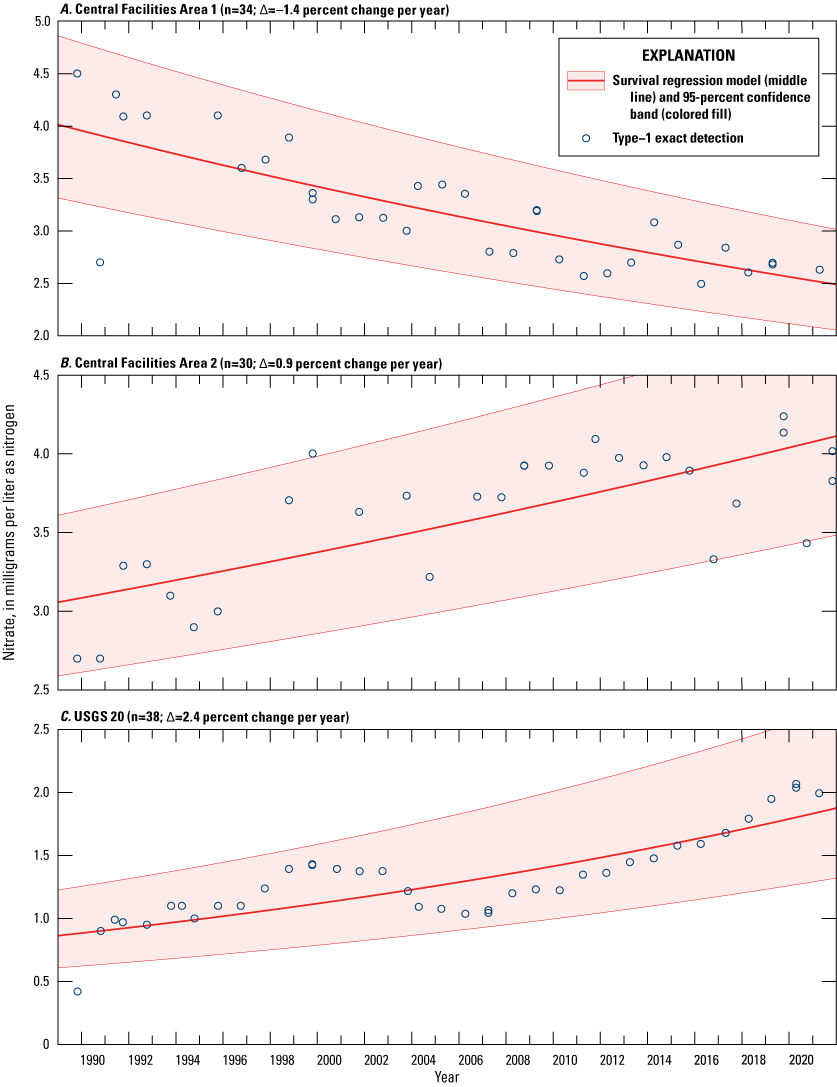
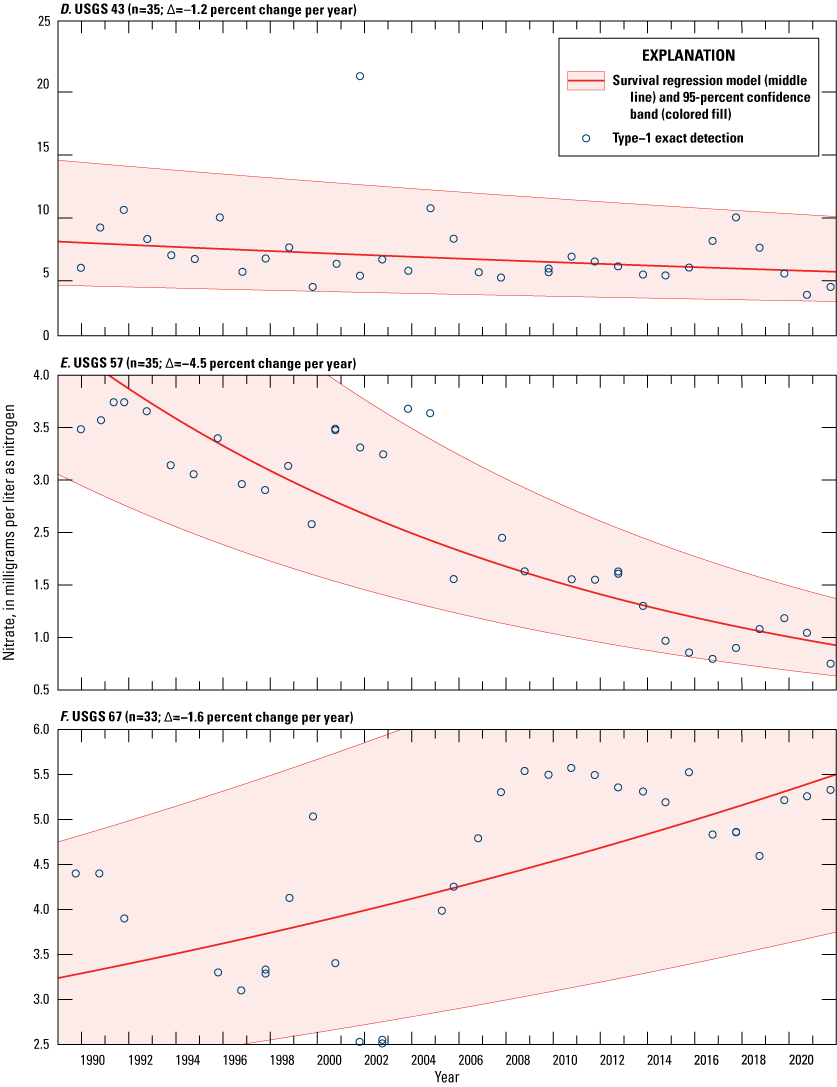
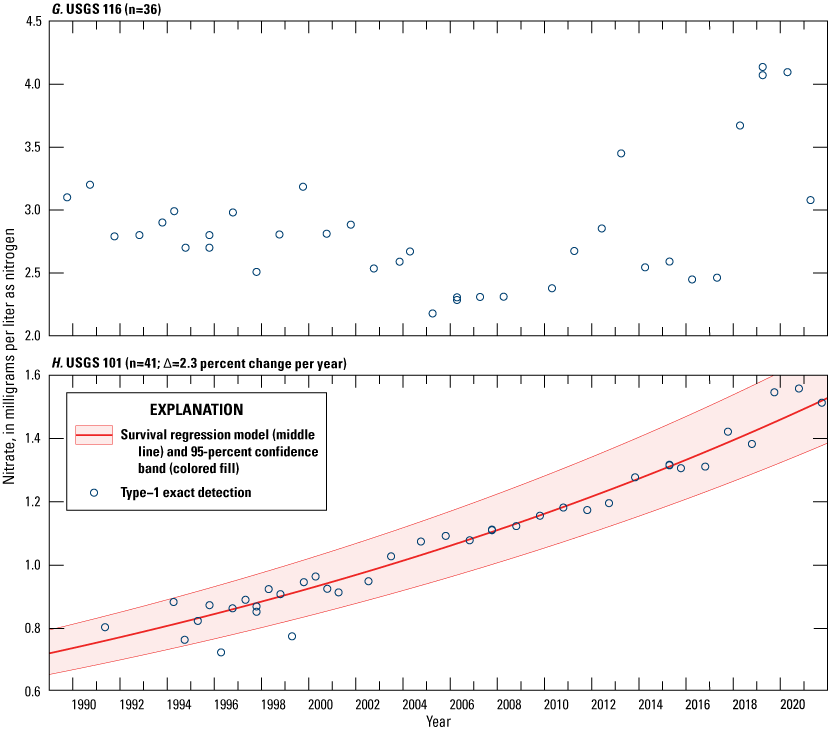
Survival regression models with measurements of nitrate (as nitrogen) in water from eight wells at and near the Idaho Nuclear Technology and Engineering Center and Central Facilities Area, Idaho National Laboratory, Idaho, 1989–2021. Data for survival regression estimation can be found in Fisher and others (2024).
In April or October 2021, concentrations of nitrate in water from most wells at and near the INTEC exceeded the background concentration of 0.655 mg/L. Concentrations ranged from 0.556 mg/L in well NPR Test to 5.33 mg/L in well USGS 67. The concentration of nitrate measured in water at USGS 43 was 3.88 mg/L in 2021. USGS 43 historically has had some of the highest nitrate concentrations, likely because of its location near the INTEC disposal well. It also has periodically had high concentrations that are not correlated to recharge influxes from the Big Lost River, which can remobilize latent nitrate (for example, in 2001 and 2004; fig. 22). The nitrate concentration in 2017 was 9.41 mg/L when flow occurred in the river, so it is not clear what may cause the occasional rise in concentrations during periods with no surface recharge. Between 2019 and 2021, the concentration of nitrate at USGS 43 decreased below the recent high measured in 2017. A statistically significant decreasing trend has persisted at that well between 1989 and 2021 (fig. 22).
Concentrations of nitrate in wells south of the INTEC and farther away from the influence of disposal areas and the Big Lost River (wells CFA 1, USGS 77, 111, 113, and 114 [figs. 5–6]) show much less temporal variability and generally decreasing in nitrate concentration trends through time (Fisher, 2021, app. 7). In the southern part of the CFA, well CFA-2 shows an increasing nitrate concentration trend from 1989 to 2021 (fig. 22). Nitrate concentrations of samples collected in 2021 from well CFA-2 and USGS 130 in the southern part of the CFA were 4.02 and 3.42 mg/L, respectively, and these concentrations are higher than for other wells upgradient and downgradient of the CFA between 2019 and 2021. Nitrate contamination south of the CFA has been attributed to contamination from the legacy CFA mercury pond south of the facility (U.S. Department of Energy, 2011), and increased nitrate in these wells possibly could be due to migration of nitrate in the unsaturated zone from the old CFA pond.
Historically, nitrate concentrations in water from wells near the RWMC have been near or have slightly exceeded the mountain tributary recharge background concentration of about 0.655 mg/L (Bartholomay and Hall, 2016) in most wells. In 1998, nitrate concentrations in water samples from wells USGS 88 and 89 near the RWMC (fig. 6) exceeded the background concentration at 1.6 and 2.0 mg/L, respectively (Bartholomay and others, 2000). Concentrations in wells USGS 88 decreased from 1.41 to 0.95 mg/L between 2019 and 2021, with an overall decreasing concentration trend historically. Well USGS 89 shows an overall decreasing trend (Fisher and others, 2021, app. 7), however nitrate concentrations increase slightly from 1.57 to 1.64 mg/L between 2019 and 2021. In 2021, near the ATRC, the concentration of nitrate in water from several wells was equal to or greater than the background concentration of 0.655 mg/L, with the highest concentration of 1.39 mg/L in well USGS 65.
Nitrate concentrations in several wells in the eastern part of the INL were greater than the background concentration of about 1 mg/L for eastern regional groundwater recharge. The trends for many of these wells also were increasing and the increasing trends were attributed to agricultural and other anthropogenic influences upgradient of the INL (Bartholomay and others, 2012, p. 26). An example of the increasing trend in this part of the INL is shown in figure 22 for USGS 101.
Fluoride
The USGS began analyzing water samples collected near the INTEC for fluoride in 1994 because fluoride in wastewater was being discharged to the legacy percolation ponds. During April or October 2021, water samples from five wells (CPP 1, USGS 34, 38, 77, and 128; fig. 6) were analyzed for dissolved fluoride. Concentrations ranged from 0.18 to 0.225 mg/L. These concentrations were near the median of dissolved fluoride concentration from the ESRP aquifer for the western mountain tributary water reported by Bartholomay and Hall (2016), which indicates that wastewater disposal has not had an appreciable impact on fluoride concentrations in the ESRP aquifer. Additionally, fluoride was collected from two new wells, USGS 148A (2019) and TAN 2336 (2021), with concentrations of 0.703 and 0.611 mg/L, respectively, which were more consistent with regional groundwater concentrations of fluoride (mean of 0.486 mg/L) at the INL (Bartholomay and Hall, 2016, app. B).
Trace Elements
As part of the INL groundwater monitoring program adopted in 1994 and several special sampling programs, water samples from 10 wells were collected and analyzed for various trace elements during 2019–21 (Fisher and others, 2024). These trace elements included dissolved concentrations of aluminum, antimony, arsenic, barium, beryllium, boron, cadmium, cobalt, copper, iron, lead, lithium, manganese, mercury, molybdenum, nickel, selenium, silver, strontium (stable), thallium, tungsten, uranium, vanadium, and zinc. Several of these trace elements (boron, lithium, strontium, tungsten, and vanadium) were only collected when new wells (USGS 148A and TAN 2336) were drilled and a comprehensive analytical suite was collected for water chemistry characterization (Bartholomay and others, 2021). A summary of background concentrations of selected constituents in ESRP aquifer water samples is presented in Knobel and others (1992, p. 52). A detailed evaluation of background concentrations of trace-element constituents in groundwater, defined as geographical areas, recharge sources, and regional groundwater contributions, are provided in Rattray (2018, fig. 27). Bartholomay and others (2000, p. 32–34) reported estimated disposal amounts of various trace elements in wastewater through 1998 (table 7). Beginning in 1998, the NWQL began implementing new reporting procedures based on long-term method detection levels (LT-MDLs) for some analytical methods (Foreman and others, 2021). This change in LRLs (as opposed to MRLs) for some trace elements accounts for concentrations of some elements detected during 1999–2021, although historically the concentrations were less than the MRL. A summary of past disposal data, disposal periods, and trace-element concentration ranges in water samples analyzed during 2019–21 by the USGS is shown in table 7.
Table 7.
Trace elements disposed-of during various periods, number of wells sampled, and range of concentrations detected in water, Idaho National Laboratory (INL), Idaho, 2019–21.[Data are available at Fisher and others (2024, https://doi.org/10.5066/P9UWRYR4). Because the amounts of each constituent in wastewater discharged from INL facilities have not been compiled annually from monitoring data since 1998, no amounts are available for 1999–2021. Approximate amount disposed of, disposal period, and disposal facility from Bartholomay and others (2000) and French and others (1999a). Range of concentrations: Data are available at U.S. Geological Survey (2023, https://dx.doi.org/10.5066/F7P55KJN). Abbreviations and symbol: lb, pound; NR, none recorded; INL, Idaho National Laboratory; INTEC, Idaho Nuclear Technology and Engineering Center; μg/L, microgram per liter. <, less than.]
Volatile Organic Compounds
Volatile organic compounds (VOCs) are present in water from the ESRP aquifer because of waste-disposal practices at the INL. From 1987 to 2021, water samples from many wells completed in the ESRP aquifer at and near the INL were analyzed for VOCs for various water-quality studies (Mann and Knobel, 1987; Mann, 1990; Liszewski and Mann, 1992; Greene and Tucker, 1998; Bartholomay and others, 2000; Davis, 2006a, 2008, 2010; Davis and others, 2013; Maimer and Bartholomay, 2016; Bartholomay and others, 2017a, Bartholomay and others, 2020; Fisher and others, 2021; and Treinen and Bartholomay, 2022). Analyses from these studies indicated that from 1 to 19 VOCs in water samples from several wells exceeded their minimum reporting levels during those years. The primary VOCs detected during 1987–2021 included carbon tetrachloride (tetrachloromethane); 1,1-dichloroethane; 1,1,1-trichloroethane; trichloroethene; tetrachloroethene; chloroform (trichloromethane); toluene; and vinyl chloride.
During 2019–21, water samples from 29 wells were collected and analyzed for VOCs. Twelve different VOCs were detected (table 8) in the wells sampled. Water samples collected from 10 wells during 2019–21 each contained at least one and as many as four of the different VOCs measured. Table 8 shows the VOCs and concentrations detected in the 10 different wells. The primary VOCs detected during 2019–21 included carbon tetrachloride, trichloromethane, tetrachloroethene, 1,1,1-trichloroethane, and trichloroethene. Concentrations for all VOCs except carbon tetrachloride in RWMC PROD; trichloroethene in two wells near TAN (GIN 2 and TAN 2336); and vinyl chloride in TAN 2336 were less than their respective MCLs for drinking water (U.S. Environmental Protection Agency, 2022; table 8).
Table 8.
Concentrations of volatile organic compounds in aquifer wells at the Idaho National Laboratory (INL), Idaho, 2019–21.[Analyses completed by the USGS National Water Quality Laboratory. Data are available at Fisher and others (2024, https://doi.org/10.5066/P9UWRYR4). Date sampled format is month-day-year. Well No.: More information on wells available in tables 2–3. Abbreviations: D-methane, Dichlorodifluoromethane; USGS, U.S. Geological Survey; ND, nondetection]
Historically, concentrations of VOCs in water samples from several wells at and near the RWMC exceeded the minimum reporting levels (Bartholomay and others, 2020). In December 2021, five VOCs were detective above their respective MRLs at well RWMC PROD; however, none of these detections were above their MCLs (U.S. Environmental Protection Agency, 2022). The VOCs and concentrations detected in December 2021 were 4.71 µg/L of carbon tetrachloride (tetrachloromethane), 1.62 µg/L of trichloromethane (chloroform), 0.296 µg/L tetrachloroethene, 0.232 µg/L 1,1,1-trichloroethane, and 2.93 µg/L trichloroethene (table 8). All of these values are lower than previous report results between 2015 and 2018 (Bartholomay and others, 2020). The same five VOCs were detected above their respective MRLs in RWMC M7S and USGS 87 between 2019 and 2021 (table 8).
A graph of carbon tetrachloride concentrations in water from well RWMC PROD (fig. 23) indicates that concentration increased over time from about 1 µg/L in 1987 to 11.6 µg/L in 2008. More recent data since 2005 show a statistically significant decreasing trend, indicating that concentrations probably have reached their highest level and should continue to decrease in the future (fig. 23). The more recent decreasing VOC concentrations are attributed to engineering and abatement practices at the RWMC that are actively removing the volatile organic gases from the unsaturated zone (U.S. Department of Energy, 2022b).
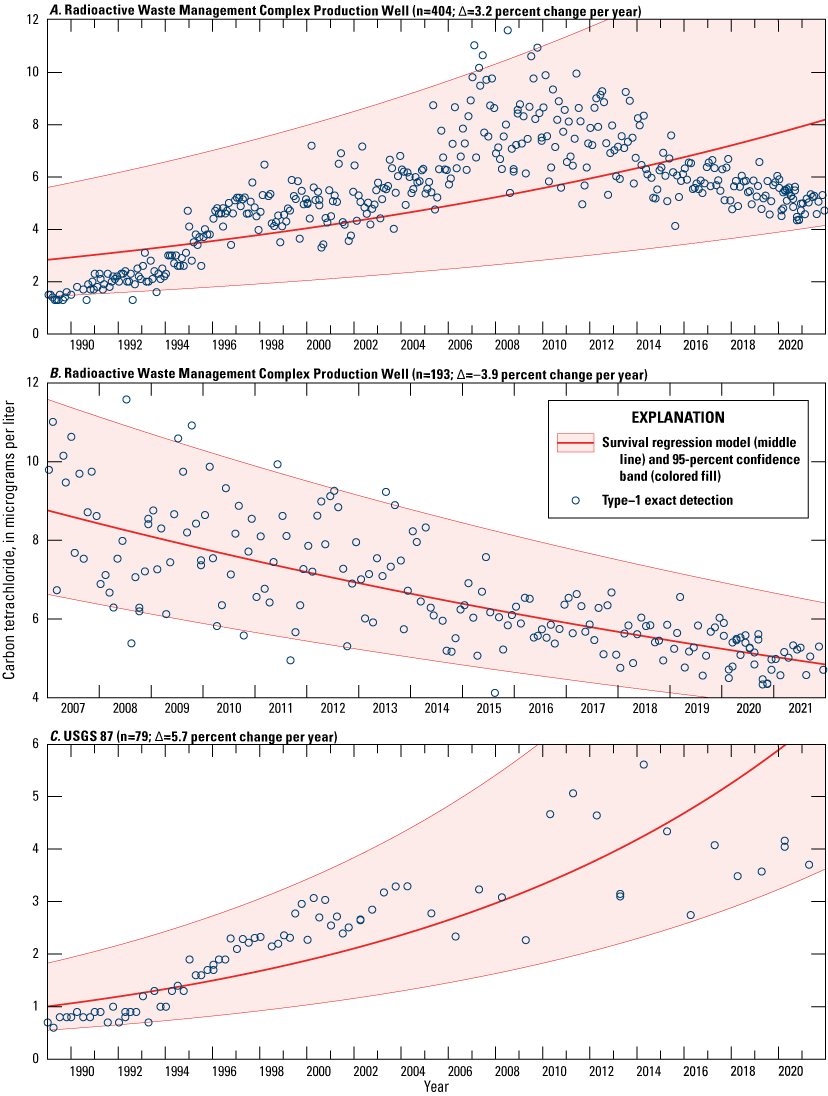
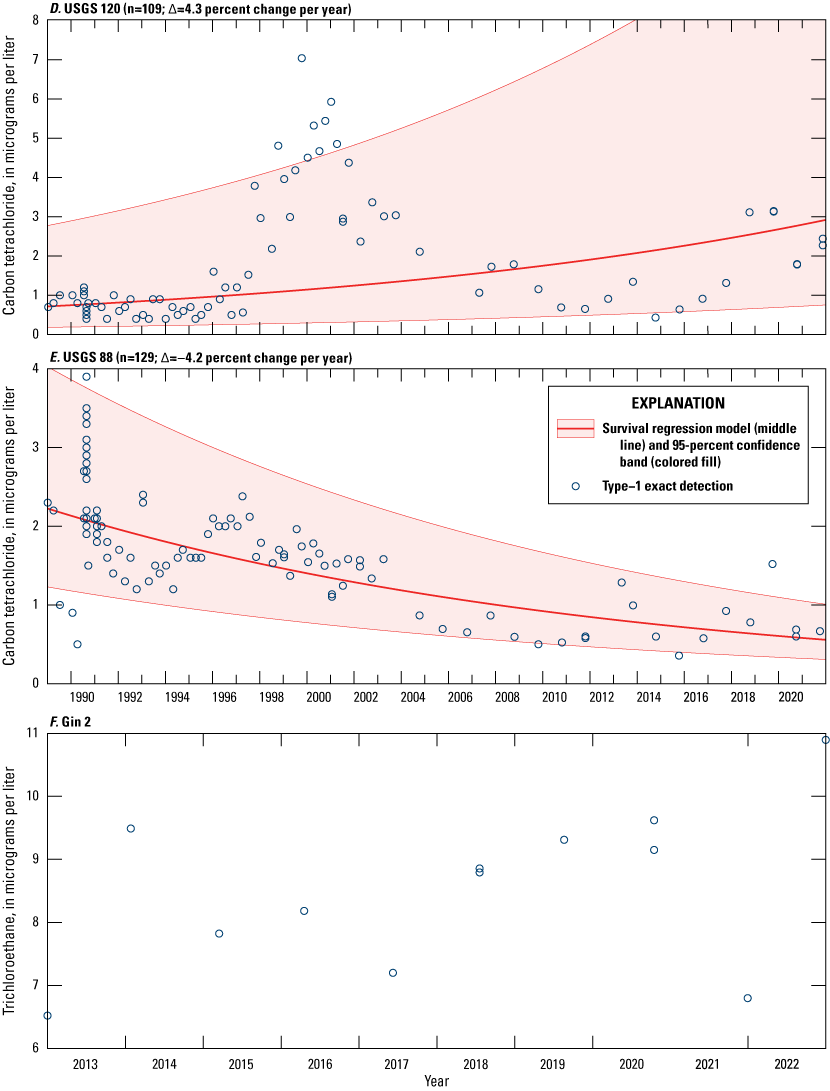
Survival regression models with measurements of carbon tetrachloride concentrations in water from the Radioactive Waste Management Complex (RWMC) Production Well (RWMC PROD) and wells USGS 87, 120, and 88, and trichloroethene in water from Test Area north (TAN) at GIN-2, Idaho National Laboratory, Idaho, 1989–2021. Data for survival regression estimation can be found in Fisher and others (2024).
During 2019–21, water from well USGS 87, just north of the RWMC (fig. 6), had detectable concentrations of carbon tetrachloride that were less than the MCL, though concentrations exceeded the MCL of 5 µg/L during previous monitoring periods in 2011 and in 2014. Concentrations of carbon tetrachloride in this well have increased with time from less than 1 µg/L in 1989 to 5.62 µg/L in April 2014 (fig. 23). During 2019–21, carbon tetrachloride (tetrachloromethane), trichloromethane, and trichloroethene were detected in wells USGS 88 and 120 south of the RWMC (fig. 6; table 9). Trend information for well USGS 88 indicated that these constituents were decreasing over time, but in well USGS 120 the trends show an overall increase over time (Fisher and others, 2021, app. 7). Concentrations of VOCs showed marked increases in the late 1990s in USGS 120 when water was released to the INL spreading areas (fig. 8) followed by a decreasing trend. Carbon tetrachloride data from well USGS 120 for 2018 and 2019 show a concentration (fig. 23) that is consistent with the idea that when water from the spreading areas infiltrates the aquifer, it moves organics in the unsaturated zone to the aquifer, thereby increasing concentrations in groundwater (Rousseau and others, 2005).
During 2021, sampling began in well TAN 2336 (Twining and others, 2023). Trichloroethene is present at concentrations greater than the MCL (5 µg/L; U.S. Environmental Protection Agency, 2022) in several wells in the TAN area, and remediation by the INL cleanup project site contractor is occurring to reduce the occurrence of VOCs in groundwater (Twining and others, 2016). In 2021, trichloroethene concentrations measured at the INL were highest at TAN 2336, at 18.74 µg/L. Trichloroethene concentrations exceeded the MCL in all samples collected from well GIN 2 during 2019–21, but concentrations in samples collected from well TAN 2271 were above the MCL in 2019 and 2020, but below the MCL in 2021 (table 8). Variable trichloroethene concentrations measured in samples collected from well TAN 2271 since August 2015 (table 8; Bartholomay and others, 2020, table 9) may be attributable to sampling at a different well depths with a larger volume pump for the very first sample (Twining and others, 2016) and a smaller-volume pump during subsequent sampling events after 2015. The ongoing bioremediation at TAN includes injecting amendment solutions to make conditions favorable for biodegradation of VOCs, most recently in August 2021, could explain the variable response we see in VOC concentrations in wells at TAN including GIN 2 (fig. 23) and TAN 2271 (U.S. Department of Energy, 2023).
Selected Radiochemical and Chemical Constituents in Perched Groundwater at the Advanced Test Reactor Complex, Idaho Nuclear Technology and Engineering Center, and Radioactive Waste Management Complex
Selected Radiochemical and Chemical Constituents in Perched GroundwaterDisposal of wastewater to infiltration ponds and ditches, lined evaporation ponds, and drain fields, as well as infiltration of surface water at waste-burial pits, resulted in the formation of perched groundwater in basalts and in sedimentary interbeds that overlie the ESRP aquifer (Cecil and others, 1991) beneath the ATRC, the INTEC, and the RWMC. Wastewater-disposal sites at these INL facilities are the primary sources of radiochemical and chemical constituents in perched groundwater at the INL. During 2019–21, wastewater was discharged to infiltration and lined-evaporation ponds. Bartholomay and others (2000) provides a comprehensive summary of waste disposal at the INL through 1998, but little disposal information is available since 1998. The following discussion focuses on perched well groundwater monitoring between 2019 and 2021, including shallow and deep perched groundwater zones located at select facilities. All physical and chemical parameter data collected for perched groundwater samples can be found in the associated data release (Fisher and others, 2024).
Advanced Test Reactor Complex
Bodies of shallow and deep perched groundwater formed at the ATRC in response to wastewater disposal into radioactive-, chemical-, cold-, and sanitary-waste ponds (Tucker and Orr, 1998; fig. 6). Radiochemical and chemical constituents in wastewater migrate to the ESRP aquifer through perched groundwater beneath these wastewater infiltration ponds. The extent of perched groundwater is affected by these waste-disposal practices. Selected radiochemical and inorganic chemical constituents in wastewater have been monitored in shallow and deep perched groundwater since the early 1960s.
Water samples from two wells (CWP 1, and CWP 8) completed in shallow perched groundwater near the ATRC (fig. 7) routinely were collected and analyzed for selected radiochemical and chemical constituents during 2019–21. Water samples were also collected from 14 wells (PW 8, PW 9, USGS 54, 60–63, 66, 68–73) that were completed in deep perched groundwater beneath the ATRC. Sampling was discontinued at some perched groundwater wells during the 2002–05 reporting period because of the lack of water in the wells (Davis, 2008, fig. 21; Bartholomay, 2022, p. 13) or because of management decisions based on the optimization of the water quality sampling network (Fisher and others, 2021; Bartholomay 2022, table 3).
The selection of radiochemical and chemical constituents for analyses was based on the waste-disposal history at the ATRC. Selected radiochemical constituents were tritium, strontium-90, and gamma analyses (which may yield detections of cesium-137, cobalt-60, or chromium-51); chemical constituents were dissolved chromium, sodium, chloride, and sulfate.
Tritium
Wells CWP 1 and CWP 8 (fig. 4) are used to monitor shallow perched groundwater around the cold-waste ponds at the ATRC. During 2019–21, tritium concentrations in water samples collected from the wells CWP were less than the reporting level (table 9).
Table 9.
Concentrations of tritium, strontium-90, and cesium-137 in perched groundwater from selected wells, Advanced Test Reactor Complex (ATRC), Idaho National Laboratory (INL), Idaho, 2019–21. Data for survival regression estimation can be found in Fisher and others (2024).[Data are available at Fisher and others (2024, https://doi.org/10.5066/P9UWRYR4). Analyses completed by the Department of Energy's Radiological and Environmental Sciences Laboratory (RESL). Analytical uncertainties are reported as the sample standard deviation (s). Concentrations equal to or greater than three-times the sample standard deviation (3s) are considered to be greater than the reporting level and are bold. Well No.: Locations of wells are shown in figure 7. Date sampled: Date format is month-day-year. Abbreviations: pCi/L, picocurie per liter; SP, well completed in shallow perched groundwater; NR, analysis not requested; DP, well completed in deep perched groundwater; NS, not enough water for sample; USGS, U.S. Geological Survey. Symbol: ±, plus or minus]
Concentrations of tritium in deep perched groundwater near the ATRC during April or October 2021 are shown in figure 24. Concentrations of tritium in wells near the ATRC in 2021 were less than historical measurements. Tritium concentrations continued to decrease during the 2019–21 reporting period in all wells and showed long-term decreasing trends in most wells around the ATRC (Davis and others, 2015, fig. 13). The decrease in tritium concentrations in water from wells near the ATRC likely results from changes in wastewater disposal practices dating back to the early 1990s when evaporation ponds began to be used in place of infiltration ponds, as well as radioactive decay and dispersion. In some cases, the change in disposal practices also may have led to a decrease in the amount of perched groundwater available to sample.
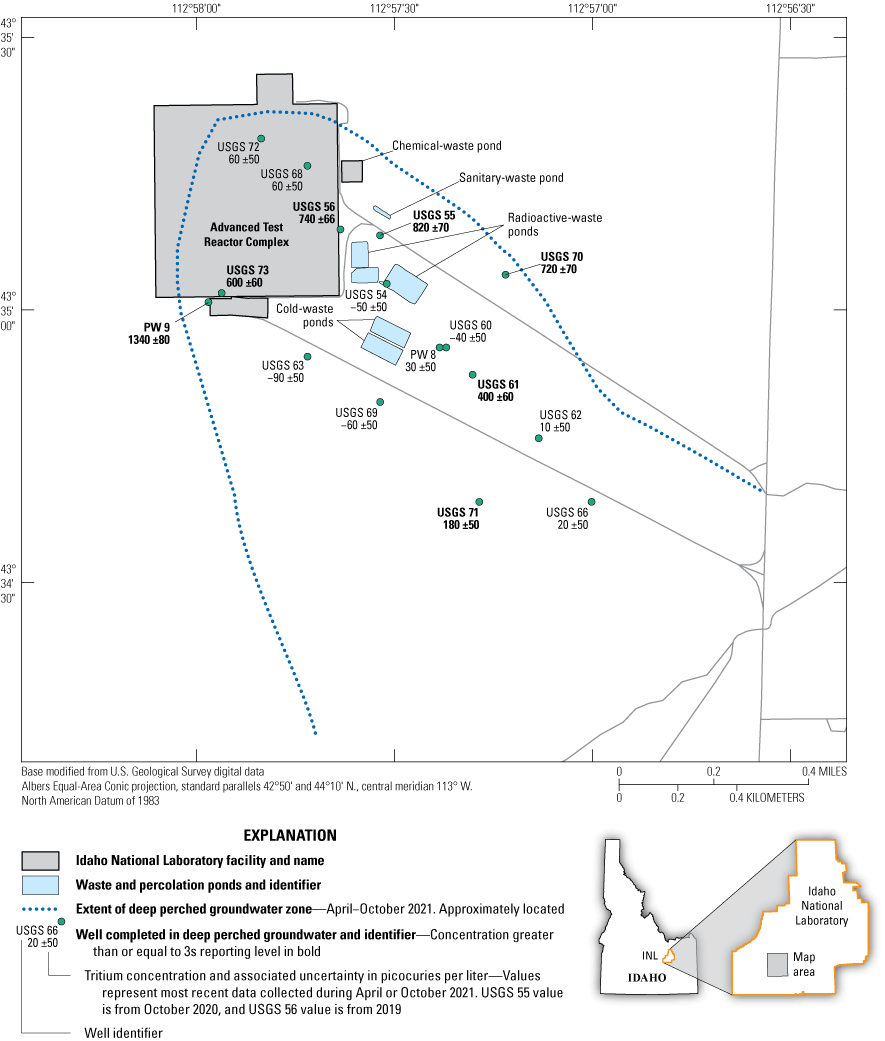
Tritium concentrations from wells completed in deep perched groundwater, Advanced Test Reactor Complex, Idaho National Laboratory, Idaho, 2021. Data can be found in Fisher and others (2024).
Tritium concentrations in water from eight wells completed in deep perched groundwater (PW 9 and USGS 55, 56, 61, 68, 70, 71, and 73) near the ATRC generally were greater than or equal to the reporting level (3s) during at least one sampling event during 2019–21 (table 9). Tritium concentrations in water from the other wells (PW 8; and USGS 54, 60, 62, 63, and 66) were less than the reporting level during 2019–21 (table 9). USGS 53 was dry during all the sample periods, and USGS 56 was dry during all but the 2019 sampling period. Tritium concentrations equal to or greater than the reporting level ranged from 160±50 pCi/L in water from well USGS 68 in 2019 to 2,097±107 pCi/L in water from well PW 9 in 2019 (table 9). Well PW 9 had a concentration of 1,340±80 pCi/L in October 2021, a decrease from the October 2018 concentration of 2,030±100 pCi/L. Water samples collected in October 2021 from well USGS 73 had a tritium concentration of 600±60 pCi/L, the same concentration from April 2018, 600±60 pCi/L. Generally, concentrations of tritium in these two wells have decreased significantly since October 1993, when concentrations were 296,000±10,000 pCi/L in water from well USGS 73 and 193,000±6,000 pCi/L from well PW 9 (Davis and others, 2015). Historically, high tritium concentrations in water from wells USGS 73 and PW 9 indicated that the chemistry of perched groundwater west of the ATRC was affected by radioactive-waste infiltration pond disposal. Discontinuation of wastewater discharge to the radioactive-waste infiltration ponds and the subsequent use of lined evaporation ponds, together with the radioactive decay process, are the likely cause for the decreased tritium concentrations observed in this area from 1993 to 2021.
Tritium concentrations have fluctuated substantially in USGS 55 (located between the evaporation ponds and the radioactive-waste ponds [table 9]) during this study sampling period, with a high concentration of 1330±90 pCi/L in 2019 and a lower concentration of 820±70 pCi/L in 2020. Tritium concentrations between 2019 and 2021 are markedly lower than the highest concentration of 12,900±200 pCi/L (Bartholomay and others, 2020), measured during 2016–18. Fluctuating tritium concentrations were also noted in Davis (2008, table 10; 2010, table 7), Davis and others (2013, table 9), and Bartholomay and others (2020, table 10). These fluctuations may indicate that remnant radioactive-waste pond wastewater is still present between the land surface and the perched groundwater zone, or that there is leakage coming from the evaporation ponds or piping to the ponds. Bartholomay and others (2017; fig. 24) evaluated possible leakage, by plotting tritium concentrations with water levels in this well. The higher concentrations mostly occurred right after a period when water levels were low, so it was concluded that when water levels rise, tritium becomes more diluted with fresh water which reduces the concentration level.
Several factors affected the distribution of tritium in perched groundwater at the ATRC, including the proximity of wells to the legacy radioactive-waste infiltration ponds, depth of water below the ponds, variations in tritium disposal rate, and radioactive decay. Since 1982, tritium concentrations also have been affected by dilution from the cold-waste ponds. Replacement of the radioactive-waste infiltration ponds with the lined evaporation ponds in 1993 contributed to decreases in tritium concentrations in perched groundwater and declines in perched groundwater in some wells. Infiltration from the Big Lost River, when it has had flow, may have contributed to diluted tritium concentrations in perched groundwater southeast of the ATRC, although a direct connection has never been documented.
Strontium-90
Wells CWP 1 and CWP 8 (table 4), completed in shallow perched groundwater at the ATRC, were sampled for strontium-90 during 2019–21. Concentrations were less than the reporting level (3s) from all of the collected samples (table 9).
During at least one 2019–21 sampling event, concentrations of strontium-90 were greater than or equal to the reporting level (3s) in water from wells PW 8, USGS 54, 55, 68, and 70, completed in deep perched groundwater at the ATRC (table 9). Concentrations equal to or greater than the reporting level (3s) ranged from 3±0.9 pCi/L (2019) in well PW-8 to 27.8±1.3 pCi/L (2019) in well USGS 55. The distribution of strontium-90 concentrations in perched groundwater from these wells during 2019–21 is attributed to exchange reactions between strontium-90 in solution and sediments beneath the radioactive-waste infiltration ponds. Well USGS 54 has consistently shown a decreasing Sr-90 concentration over time. Well USGS 55 showed an increasing trend until about 2006 when concentrations started to decrease (Davis and others, 2015, app. C). Both these wells are near the legacy chemical-waste ponds that were taken out of service in 1999, and high sodium concentrations in remnant water from the legacy chemical-waste ponds still may be periodically exchanging with sediments in the unsaturated zone and mobilizing strontium-90 (Bunde and others, 1997).
Although strontium-90 has been detected in water from shallow and deep perched groundwater at the ATRC, it has not been detected in the ESRP aquifer beneath the ATRC. This may be because of the exclusive use of waste-disposal ponds and lined evaporation ponds rather than the injection of the waste directly into the aquifer (Bartholomay and others, 1997, p. 30). The absence of detectable concentrations in the aquifer indicates that strontium-90 in solution is likely removed by sorption and (or) exchange reactions in the unsaturated zone. Studies of strontium distribution coefficients for samples of surficial sediment, sedimentary interbeds, and sediment-filled fractures in basalts at the INL (Bunde and others, 1997; Liszewski and others, 1997, 1998; Pace and others, 1999) support this theory.
Gamma Spectrometry
Water samples are routinely analyzed by gamma spectrometry, which provided concentrations of cesium-137, chromium-51, and cobalt-60. Water samples from wells completed in both shallow and deep perched groundwater at and near the ATRC did not yield concentrations of cesium-137 greater than the reporting level (3s) during 1997–2011 (Davis and others, 2013). However, in April 2012, cesium-137 concentrations in wells USGS 68 and 70 were equal to the reporting level (Bartholomay and others, 2020, table 8). Concentrations in all samples collected during 2019–21 were less than the reporting level for cesium-137 (Bartholomay and others, 2021; table 9). Water from wells at and near the ATRC has not had concentrations greater than the reporting level of chromium-51 since 1995 or cobalt-60 since 1998 (Davis, 2010).
Chromium
In October 1972, chromium used as a corrosion inhibitor in cooling-tower operations was replaced by a polyphosphate. No disposal of chromium to the subsurface at the ATRC was reported after 1972 (Bartholomay and Tucker, 2000). The presence of dissolved chromium in water from wells completed in perched groundwater represents chromium in cooling-tower blowdown water that was discharged to the radioactive-waste infiltration ponds before 1965 when disposal practices changed to injection of water to the disposal well; concentrations in the perched groundwater zone are expected to continue decreasing in the future.
Historically, dissolved chromium concentrations in shallow perched groundwater at the ATRC have been very low (less than or slightly greater than the MDL) because of the lack of chromium in wastewater disposed to the cold-waste ponds. Over the past decade, several wells completed in shallow perched groundwater were not sampled because they were dry and were removed from the USGS sampling program. During 2019–21, two shallow perched groundwater wells (CWP 1 and 8) were sampled for chromium. Chromium was detected in well CWP 8 in April 2021 at 2.6 µg/L but was not detected above the reporting limit of 0.6 µg/L in 2019 and 2020. Chromium results for CWP 1 increased from 4.0 µg/L to 9.8 µg/L between 2019 and 2021 (table 10).
Table 10.
Concentrations of selected dissolved ions in perched groundwater from selected wells, Advanced Test Reactor Complex, Idaho National Laboratory, Idaho, 2019–21. Data can be found in Fisher and others (2024).[Data are available at Fisher and others (2024, https://doi.org/10.5066/P9UWRYR4). Well name: Locations of wells are shown in figure 4. Analyses completed by the USGS National Water Quality Laboratory. Abbreviations: DP, well completed in deep perched water; SP, well completed in shallow perched water; NR, analysis not requested; NS, not enough water for a sample; μg/L, microgram per liter; mg/L, milligram per liter; USGS, U.S. Geological Survey. Symbol: <, less than respective reporting level]
Dissolved chromium was detected above the reporting limit in water from all the wells sampled for chromium and completed in deep perched groundwater at the ATRC during 2019–21 when that analyte was requested, and sufficient water was available except CWP 8 in 2019 and 2020 (table 10). The highest concentrations during 2021 were in the water from wells north and west of the radioactive-waste infiltration ponds, wells PW 9 (34.3 µg/L) and USGS 72 (34.6 µg/L; table 10; fig. 25). During 2021, detectable concentrations of dissolved chromium in wells completed in deep perched groundwater near the ATRC ranged from 5.0 µg/L in well USGS 54 to 34.6 µg/L in well USGS 73. The maximum dissolved chromium concentration of 82.1 µg/L in well PW 9 in September 2020 represented an increase from 26.8 µg/L in October 2018 (Bartholomay and others, 2020, table 11). The long-term dissolved chromium concentration in PW 9 has been variable but is decreasing overall from a maximum dissolved chromium concentration observed in 1994 (fig. 26). Most other perched wells around the ATRC also show decreasing trends (Davis and others, 2015, app. D).
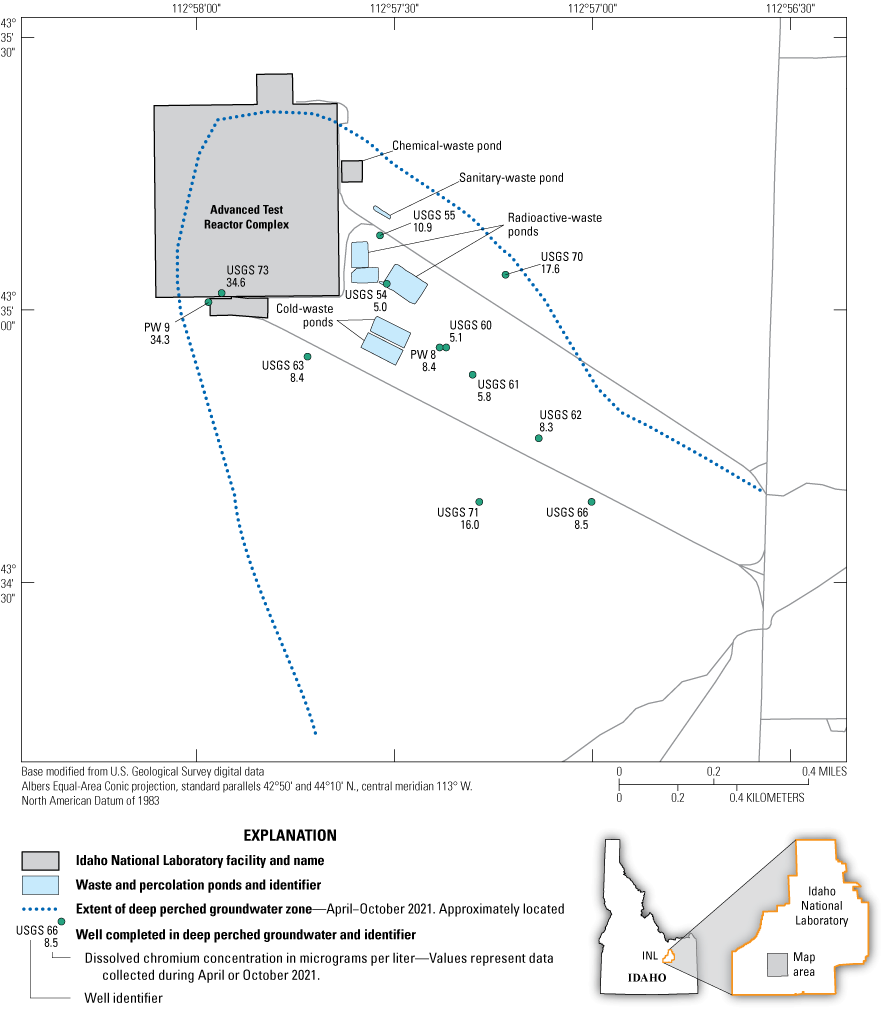
Dissolved chromium in water from wells completed in deep perched groundwater, Advanced Test Reactor Complex, Idaho National Laboratory, Idaho, 2021. Data can be found in Fisher and others (2024).
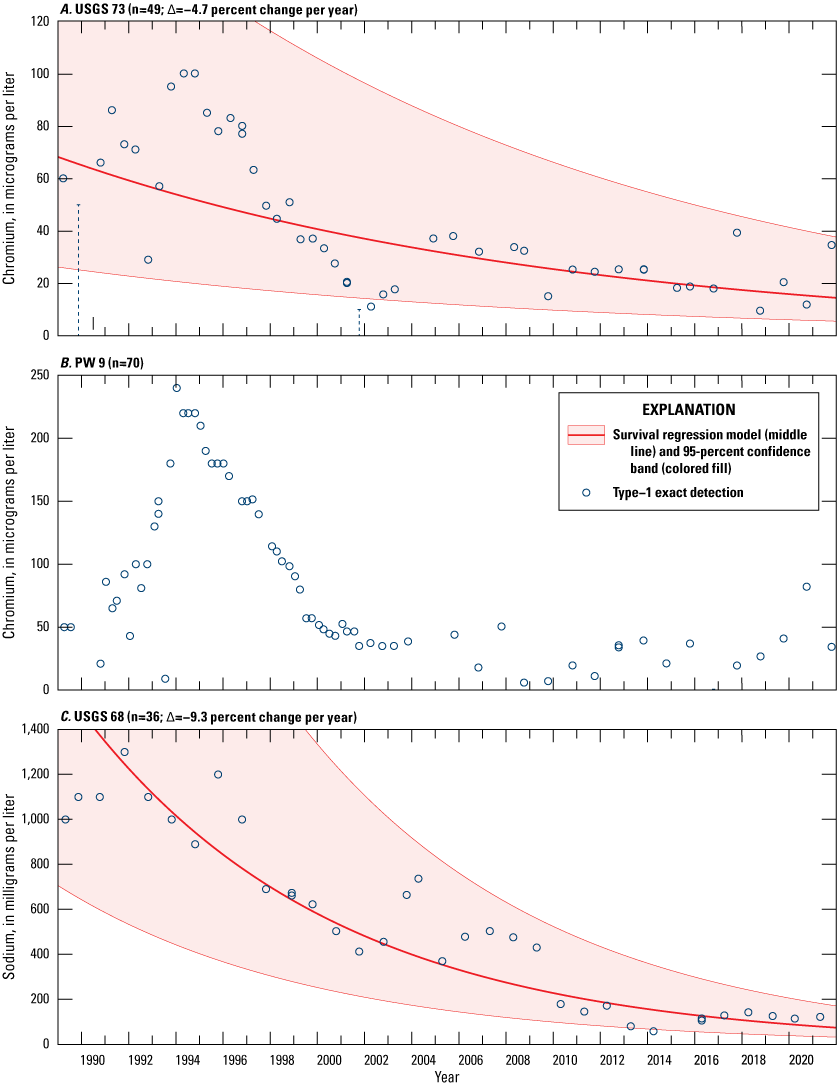
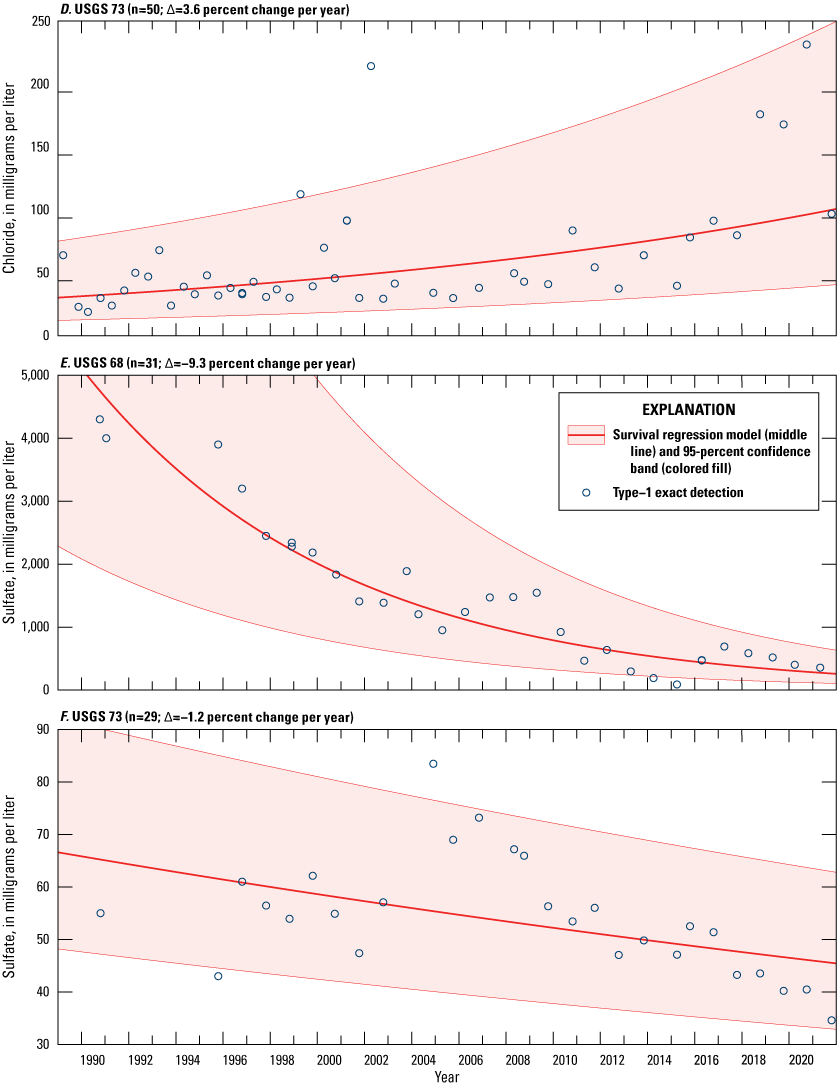
Survival regression models with measurements of chromium concentrations in water from wells USGS 73 (A) and PW 9 (B); sodium concentrations in water from well USGS 68 (C); chloride concentrations in water from wells USGS 73 (D); and sulfate concentrations in water from wells USGS 68 (E) and 73 (F); Idaho National Laboratory (INL), Idaho, 1989–2021. n, number of observations; ∆, long-term monotonic trend in percentage changes in concentration per year. Data for survival regression estimation can be found in Fisher and others (2024).
Sodium
Dissolved sodium was not sampled in shallow perched groundwater at the ATRC during this study (table 10). During April or October 2021, dissolved sodium concentrations in water from 15 wells completed in deep perched groundwater were analyzed and ranged from 11.7 to 122.5 mg/L in well USGS 68 (table 10). The dissolved sodium concentration in well USGS 68 decreased from 143 mg/L in April 2018 (Bartholomay and others, 2020, table 11). Sodium concentrations in this well have varied through time, but overall show a decreasing trend (fig. 26c; Davis and others, 2015, fig. 23). Concentration variability in well USGS 68 likely results from water movement through the unsaturated zone from the chemical-waste pond. Pond closure in 1999 likely is responsible for overall lower concentrations, although concentrations in the past 3 years have increased from the low in 2015 (fig. 26).
Chloride
Concentrations of dissolved chloride varied in most wells during 2019–21 (table 10). During April 2021, dissolved chloride concentrations in shallow perched groundwater ranged from 8.1 mg/L in well CWP 8 to 42.2 mg/L in well CWP 1 (table 10). Dissolved chloride concentrations in deep perched groundwater during April or October 2021 ranged from 10.9 mg/L in well USGS 54 to 99.1 mg/L in well ICPP-MON-V-200. High concentrations of chloride were observed in water from deeper perched groundwater wells in the western part of the perched groundwater zone at the ATRC, and both USGS 73 (fig. 26) and PW 9 have shown increasing trends over time (Davis and others, 2015, fig. 19). The increasing concentrations may result from the movement of remnant water through the unsaturated zone beneath the chemical-waste pond or variable high pulses of chloride that have moved from the cold-waste ponds during years of above-average precipitation and resulting in recharge from surface water.
Sulfate
The maximum dissolved sulfate concentration in shallow perched groundwater at the ATRC was 575 mg/L in well CWP 1 in April 2021 (table 10). Concentrations of dissolved sulfate in this well varied greatly and ranged from 46.8 to 575 mg/L during 2019–2021. During 2016–2018, the sulfate concentrations ranged from 44.4 to 211 mg/L (Bartholomay and others, 2020, table 11). The variable concentrations result from changes in the amount of sulfate disposal to the cold-waste ponds.
During 2019–21, concentrations of dissolved sulfate in water from wells completed in deep perched groundwater at the ATRC near the cold-waste ponds (USGS 54, 55, 60, 61, 62, 63, 66, 69, 70, and 71; and PW 8) ranged from 22.3 mg/L in well USGS 72 (2020) to 519 mg/L in well USGS 68 (2019; table 10; fig. 27). These elevated sulfate concentrations indicate that water in these wells was also affected by discharge into the cold-waste ponds. During 2009–11, the largest concentration of dissolved sulfate measured in deep perched groundwater was 1,546 mg/L in well USGS 68 (Davis and others, 2013, table 10), located west of the chemical-waste pond (fig. 7). The dissolved sulfate concentration in this well decreased to 89.8 mg/L by April 2015 but increased to 586 mg/L in 2018 (Bartholomay and others, 2020, table 11). Overall, this well shows a decreasing trend that can be attributed to the discontinued use of the chemical-waste pond in 1999 (fig. 26). The more recent concentration variability may indicate that remnant pockets of perched water still are moving to the deeper perched water zone or that variable discharge is being introduced to the cold waste ponds.
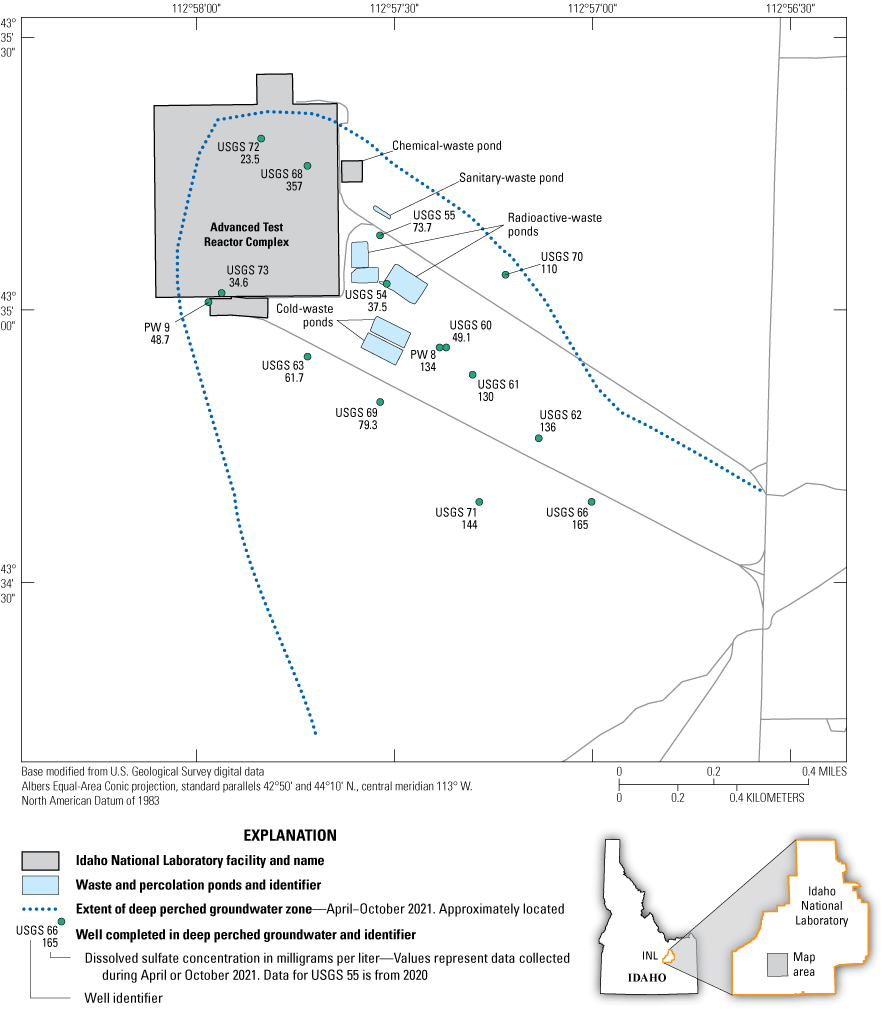
Dissolved sulfate concentrations from wells completed in deep perched groundwater, Advanced Test Reactor Complex, Idaho National Laboratory, Idaho, April or October 2021. Data can be found in Fisher and others (2024).
Idaho Nuclear Technology and Engineering Center
Two percolation ponds were constructed south of the INTEC in 1984 and 1985 to replace the INTEC disposal well (fig. 7). Wastewater infiltrating from these ponds formed perched groundwater in the basalt and sedimentary interbeds above the ESRP aquifer in the southern part of the INTEC. Those legacy percolation ponds were taken out of service when new percolation ponds, located about 2 mi southwest of the INTEC (fig. 4), went into use in August 2002 (U.S. Department of Energy, 2021a). The USGS continued to monitor water from wells in the perched groundwater zone near the legacy percolation ponds until the last well (PW 4; fig. 7) went dry in 2008. Deeper perched groundwater near the center of the INTEC was monitored by collecting samples from well USGS 50 (fig. 7) until the well was abandoned in 2009. Davis (2010) provided the final analyses of data collected from the USGS perched groundwater monitoring around the INTEC. Perched groundwater that has been detected in other areas at the INTEC may be attributed to leaking wastewater pipelines, leach fields, damaged casing in the upper part of the disposal well, leakage from the Tank Farm pits, other infiltration ponds, flow from the Big Lost River, precipitation recharge, or landscape irrigation (Tucker and Orr, 1998; Mirus and others, 2011). Information on water-quality monitoring of perched groundwater wells in other areas of the INTEC done by INL contractors is documented in annual groundwater-monitoring reports (U.S. Department of Energy, 2022a).
Starting in April 2010, the USGS began monitoring perched groundwater in well ICPP-MON-V-200 (fig. 4), about 2 mi southwest of the INTEC, to gain a general understanding of water chemistry from percolation ponds installed in 2002 to better understand what effects the ponds may have on water quality in the ESRP aquifer. Comparison of water chemistry from wells ICPP-MON-V-200 and CPP 1 (an ESRP aquifer production well at the INTEC used to represent water quality before wastewater constituents were added; [Knobel and others, 1999]) indicated that wastewater discharged to the new percolation ponds had higher concentrations of dissolved chloride, sodium, and nitrate relative to CPP 1 (Davis and others, 2013). During 2019–21, concentrations of dissolved chloride, sodium, and nitrate in ICPP-MON-V-200 ranged from 72.9 to 99.1 mg/L; 41.4 to 57.6 mg/L; and 1.1 to 1.3 mg/L, respectively. The concentration ranges for chloride and sodium were higher than for previous years of sample collection with a sharp increase beginning in 2018. Chloride, sodium, and nitrate concentrations were all markedly higher than results from well CPP 1 during the same time period. The wastewater disposed of in the former percolation ponds contained sodium and chloride form water softening brines used at INTEC. Former contributions to the unsaturated vadose zone are likely contributing latent sodium and chloride to the perched groundwater (U.S. Department of Energy, 2021b). These increases in dissolved inorganic constituents in the water from Well ICPP-Mon-V-200 could result from surface water recharge from the high-water year in 2017 that may have caused the mobilization of constituents in the unsaturated zone.
Radioactive Waste Management Complex
Perched groundwater beneath the RWMC is hosted in sedimentary interbeds and basalts and can be attributed primarily to local snowmelt and rain infiltration and to recharge from the Big Lost River and the INL spreading areas. This perched groundwater contains constituents leached from buried radioactive and organic-chemical wastes. Liquid and solid waste materials buried at the RWMC (fig. 1) also are sources of some constituents in perched groundwater. Perched groundwater beneath buried waste can be an integral pathway for waste-constituent migration to the ESRP aquifer. The perched groundwater at the RWMC is affected by these waste-disposal practices and the subsequent mobilization and migration of water through these zones.
Well USGS 92 (fig. 4) is in the SDA at the RWMC and is completed in a sedimentary interbed (Anderson and Lewis, 1989, p. 29) at a depth of 214 ft below land surface. Perched groundwater in this well has moved through overlying sediments and basalt and contains waste constituents leached from radiochemical and organic-chemical wastes buried in the SDA.
During 2019–21, tritium concentrations in water samples from well USGS 92 (table 11) did not exceed the reporting level of 3s. Tritium concentrations in water from well USGS 92 have varied through time and do not show a monotonic trend (Davis and others, 2015, app. C). The last sampling event where the tritium concentration in USGS 92 was observed above the reporting level was in 2014 (230 ± 50 pCi/L). The data presented in this report can be found using the site numbers listed in tables 2–3 in Fisher and others (2024).
Table 11.
Concentrations of tritium, dissolved chloride, strontium-90, cesium-137, and selected transuranic elements, and dissolved chloride in perched groundwater from well USGS 92, Radioactive Waste Management Complex (RWMC), Idaho National Laboratory (INL), Idaho, 2019–21.[Data are available at Fisher and others (2024, https://doi.org/10.5066/P9UWRYR4). Location of well is shown in figure 7. Analyses completed by the Department of Energy's Radiological and Environmental Sciences Laboratory and the USGS National Water Quality Laboratory. Analyses for radionuclides, analytical uncertainties are reported as 1 standard deviation. Well name: Abbreviations: pCi/L, picocurie per liter; mg/L, milligram per liter; USGS, U.S. Geological Survey. Symbol: ±, plus or minus]
Historically, the concentration of americium-241 in water from well USGS 92 was greater than the reporting level in October 1992, and the concentration of plutonium-238 was greater than the reporting level in November 1994 (Bartholomay, 1998). Since the 1990s, concentrations of these constituents—as well as strontium-90, cesium-137, and plutonium-239 and 240 (undivided) —have been less than reporting levels. An exception to this is that in April 2016, a reportable concentration of americium-241 was detected at a concentration of 0.13 ±0.02 pCi/L; however, a resample collected in November of 2016 indicated a concentration less than the reporting level (Bartholomay and others, 2020, table 12). During 2019–21, there were no detections of strontium-90, cesium-137, or plutonium-239 and 240 (undivided) above the reporting levels (table 11).
During 2019–21, chloride concentrations at well USGS 92 ranged from 97.5 to 101.6 mg/L (table 11), which are consistent with the range of concentrations observed between 2016 and 2018 (93.4–102 mg/L; Bartholomay and others, 2020, table 12). Recent re-evaluation of the chloride trend in USGS 92 shows a statistically significant increasing trend over time between 1989 and 2021 (fig. 28). The increasing chloride concentrations may result from mobilization from infiltration of recharge water from the Big Lost River when above-average precipitation causes water to be diverted to the spreading areas near USGS 92.
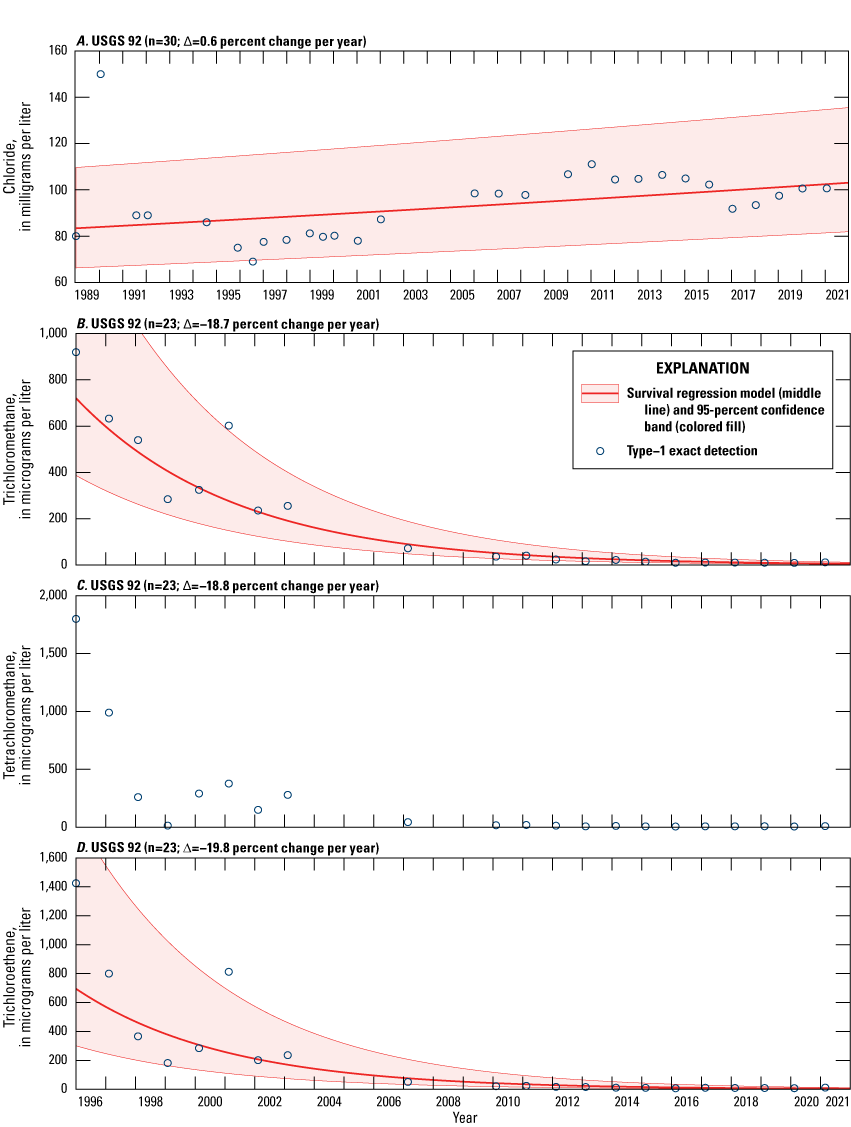
Time series graphs showing survival regression models with measurements of chloride (A), trichloromethane (B), tetrachloromethane (C), and trichloroethene (D) concentrations in water from well USGS 92 at Idaho National Laboratory, Idaho, 1989–2021. Data for survival regression estimation can be found in Fisher and others (2024).
In 1987, nine VOCs were detected in water from well USGS 92 (Mann and Knobel, 1987, p. 16–17). Since then, between 6 and 18 different VOCs have been detected during various sampling periods (Fisher and others, 2024). Long-term VOC sample results for USGS 92 from 1996 to 2021 show that the detections were up to three orders of magnitude above their respective MCLs (fig. 28) for Trichloromethane (Chloroform), Tetrachloromethane (Carbon Tetrachloride), and Trichloroethene, with concentrations approaching or exceeding 1,000 µg/L. These three VOCs had significant decreasing trends between 1996 and 2006 followed by relatively constant concentrations, ranging from above the minimum reporting level to slightly above their respective MCLs, through 2021.
The concentrations of eight VOCs detected at USGS 92 from April 2019 to 2021 are shown in table 12. All VOCs detected in April 2019–21 had been detected previously in this well. Additionally, VOC concentrations detected above the respective minimum reporting levels (MRLs) in 2021 were substantially higher than those measured in 2016–18 (table 12; Bartholomay and others, 2020, table 13). Of the eight VOCs detected above their respective MRLs, four of these were detected above their MCLs (Tetrachloromethane, Tetrachloroethene 1,2-dichloropropane, and Trichloroethene; U.S. Environmental Protection Agency, 2022). The lower VOC concentrations measured in the previous study time period, 2016–18, may result from VOC removal from the subsurface at the SDA by vapor vacuum extraction processes used by the INL contractor from 1996 to 2020 (U.S. Department of Energy, 2022b). When this remedial activity ended in 2020, an increase in several VOCs is observed in samples collected from USGS 92 (table 12), potentially due to the latent release of VOCs stored in the subsurface and migration to the perched groundwater zone under the RWMC (U.S. Department of Energy, 2022b).
While VOC concentrations declined in 2019 and 2020 at USGS 92, the VOC concentrations in table 12 increased in 2021. A tracer study done by Nimmo and others (2002) indicated water present in the spreading areas does migrate to USGS 92, though no water was diverted to the spreading areas during our study period. The data presented in this report can be found in the USGS NWIS using the site numbers listed in tables 2–3 (Fisher and others, 2024).
Table 12.
Concentrations of selected volatile organic compounds in perched groundwater from well USGS 92, Radioactive Waste Management Complex, Idaho National Laboratory, Idaho, 2019–21.[Data are available in Fisher and others (2024, https://doi.org/10.5066/P9UWRYR4). Location of well USGS 92 is shown in figure 7. Analyses were completed by the U.S. Geological Survey National Water Quality Laboratory using an analytical method that conforms to U.S. Environmental Protection Agency Method 524.2. Names in parentheses are alternate compound names. Abbreviations: NWIS, National Water Information System; µg/L, microgram per liter; ND, nondetection]
Summary
Radiochemical and chemical wastewater discharged since 1952 to legacy infiltration ponds and disposal wells at the Idaho National Laboratory (INL) has affected water quality in both the eastern Snake River Plain (ESRP) aquifer and in perched groundwater zones at the INL. The U.S. Geological Survey (USGS), in cooperation with the U.S. Department of Energy (DOE), maintains ESRP aquifer and perched groundwater monitoring networks at the INL to determine hydrologic trends and to delineate the movement of radiochemical and chemical wastes in both the ESRP aquifer and in perched groundwater zones.
Water in the ESRP aquifer primarily moves through fractures and interflow zones in basalt, generally flows southwestward, and eventually discharges at springs along the Snake River near Twin Falls, Idaho, about 100 miles southwest of the INL. The estimated discharge from the springs was approximately 5,047 ft3/s for water year 2021. The aquifer is recharged primarily from infiltration of irrigation water, infiltration of streamflow, groundwater inflow from adjoining mountain drainage basins, and infiltration of precipitation.
During March–May 2021, the altitude of the water table of the ESRP aquifer was about 4,560 feet (ft) in the northern part of the INL and about 4,420 ft in the southwestern part. Water flowed south and southwestward beneath the INL at an average hydraulic gradient of about 4 ft per mile.
Water levels in ESRP aquifer wells increased from about 0.02 to more than 1.04 ft in the northern part of the INL from March–May 2018 to March–May 2021. In the central and eastern parts of the INL, water levels increased slightly in some wells and decreased slightly in others during March to May 2018 and March to May 2021. In the southwestern part of the INL, water levels generally decreased by about 0.03 to more than 2.94 ft during March to May 2018 and March to May 2021.
Disposal of wastewater to infiltration ponds and infiltration of surface water at the Advanced Test Reactor Complex (ATRC) and Idaho Nuclear Technology and Engineering Center (INTEC) resulted in the formation of perched groundwater both in basalts and in sedimentary interbeds that overlie the ESRP aquifer. Perched groundwater beneath the Radioactive Waste Management Complex (RWMC) formed from infiltration of snowmelt and rain and recharge from the Big Lost River and INL spreading areas. The perched groundwater beneath the RWMC contains constituents leached from buried radioactive and organic-chemical wastes. Overall, perched groundwater is an integral pathway for waste-constituent migration to the ESRP aquifer.
A tritium plume developed in the ESRP aquifer from the discharge of wastewater at the INL since the 1950s. Concentrations of tritium in water samples collected in 2021 from 46 of 104 aquifer wells were greater than or equal to the reporting level (3s) and ranged from 150±50 to 4,280±150 picocuries per liter (pCi/L). The tritium plume extended south-southwestward in the general direction of groundwater flow. In 2021, concentrations of tritium in water samples generally decreased from 2016 to 2018, continuing to show decreasing trends, and all concentrations were less than the U.S. Environmental Protection Agency (EPA) maximum contaminant level (MCL) of 20,000 pCi/L.
Tritium concentrations in water from 8 wells completed in deep perched groundwater near the ATRC generally were greater than or equal to the reporting level during at least one sampling event during 2019–21, and concentrations ranged from 160±50 to 2,097±107 pCi/L.
During 2021, concentrations of strontium-90 in ESRP aquifer water from 12 of 45 aquifer wells exceeded the reporting level. Concentrations that exceeded the reporting level in the aquifer wells ranged from 2.5±0.7 to 13.9±1 pCi/L in wells near the INTEC; the largest concentration in 2021 was 299±6 pCi/L in a well at Test Area North (TAN). The area of the strontium-90 plume near the INTEC extended south-southwestward in the general direction of groundwater flow, and all wells were showing decreasing concentrations. Strontium-90 has not been detected in the ESRP aquifer beneath the ATRC partly because of the exclusive use of waste-disposal ponds and lined evaporation ponds rather than the disposal well for radioactive-wastewater disposal at that facility. Sorption processes in sediments in the unsaturated zone beneath the radioactive waste-disposal pond probably minimized or prevented strontium-90 migration to the aquifer at the ATRC.
During at least one 2019–21 sampling event, concentrations of strontium-90 in water from five wells completed in deep perched groundwater at the ATRC equaled or exceeded the reporting level, and concentrations ranged from 3±0.9 pCi/L to 27.8±1.3 pCi/L.
During 2019–21, water from 35 ESRP aquifer wells were sampled and analyzed for cesium-137. All concentrations were less than the reporting level during this time period. During 2019–21, concentrations of plutonium-238, -239, and -240 (undivided) in water from all 12 aquifer wells sampled were less than their reporting levels.
Gross alpha and beta measurements are used to screen for radioactivity in the ESRP aquifer as a possible indicator of groundwater contamination. During 2019–21, water from 49 ESRP aquifer wells were sampled and analyzed for gross alpha- and beta-particle radioactivity. Concentrations of gross alpha-particle radioactivity measured above the reporting level in seven wells ranged from 6±2 to 125±27 pCi/L. During 2019–21, concentrations of gross beta-particle radioactivity in water from 49 of the ESRP wells equaled or exceeded reporting level in at least one of the sampling periods and ranged from 2.1±0.7 to 716±40 pCi/L.
In April 2009, the dissolved chromium concentration in water from one ESRP aquifer well, USGS 65, south of ATRC, equaled the MCL of 100 micrograms per liter (µg/L). In April 2021, the concentration of chromium in water from that well had decreased to 76.4 µg/L, less than the MCL. Concentrations in water samples from 64 other wells sampled ranged from less than 0.5 to 76.4 µg/L. During 2019–21, dissolved chromium was detected in water from all perched wells, and concentrations ranged from 2.58 to 34.6 µg/L.
In 2021, concentrations of dissolved sodium in water from most ESRP aquifer wells in the southern part of the INL were greater than the background concentration of 8.3 milligrams per liter (mg/L). During 2021, the highest sodium concentration in water samples from aquifer wells near the INTEC was 30.4 mg/L in a water sample from well USGS 51. After the new percolation ponds were put into service in 2002 southwest of the INTEC, concentrations of sodium in water samples from the Rifle Range well increased steadily until 2008, after which the concentrations generally began decreasing.
During 2021, dissolved sodium concentrations in water from 15 wells completed in deep perched groundwater ranged from 11.7 to 122.5 mg/L. The highest concentration was in the water from well USGS 68. The concentration decreased from 143 mg/L in April 2018 to 122.5 mg/L in 2021, and the decrease is attributed to remnant water from the former chemical-waste ponds migrating away from the well.
In 2021, concentrations of dissolved chloride in most water samples from ESRP aquifer wells closest to the INTEC and the Central Facilities Area (CFA) exceeded background concentrations. Trends in chloride concentrations in water from wells downgradient of the legacy percolation ponds at the INTEC generally decreased because of discontinued disposal. After the new percolation ponds were put into service in 2002 southwest of the INTEC, concentrations of chloride increased steadily in water samples from the Rifle Range well until 2008, when the concentrations began decreasing.
During 2021, dissolved chloride concentrations in deep perched at the ATRC ranged from 8.1 to 42.2 mg/L. Chloride in this deep perched groundwater zone at the ATRC was highest in wells in the western part. The higher concentrations in the western part of this zone may result from the movement of remnant water through the unsaturated zone from the chemical-waste pond that closed in 1999 or the movement of water from the cold-waste ponds.
In 2021, sulfate concentrations in water samples from ESRP aquifer wells in the south-central part of the INL that exceeded the background concentration of sulfate ranged from 21 to 141 mg/L. The greater-than-background concentrations in water from these wells probably resulted from sulfate disposal at the ATRC infiltration ponds or the legacy INTEC percolation ponds. In 2021, sulfate concentrations in water samples from wells near the RWMC mostly were greater than background concentrations and could have resulted from well construction techniques and (or) waste disposal at the RWMC or the ATRC.
The maximum dissolved sulfate concentration in shallow perched groundwater near the ATRC was 575 mg/L in well CWP 1 in April 2021. During 2021, dissolved sulfate concentrations in water from wells completed in deep perched groundwater near the cold-waste ponds at the ATRC ranged from 22.3 to 519 mg/L; the largest concentration of sulfate was in well USGS 68 at 519 mg/L.
In 2021, concentrations of dissolved nitrate (as N) in water from most ESRP aquifer wells at and near the INTEC exceeded the background concentration of 0.655 mg/L. Concentrations ranged from 0.556 to 5.33 mg/L. Nitrate concentrations at the INL near the INTEC mostly have decreased in response to reduced disposal rates and to the transition in 1984 from the injection of wastewater to the INTEC disposal well to discharge to the legacy percolation ponds. The two exceptions to decreasing or no-trend were wells USGS 20 and 67, which showed variable decreases and increases but overall have been increasing. The cause of the increases could be due to the mobilization of nitrate beneath the INTEC tank farm, as both wells are downgradient of the INTEC tank farm.
In the southern part of the CFA, nitrate concentrations in water from ESRP aquifer well CFA-2 indicate an increasing trend. Nitrate concentrations of samples collected in 2021 from well CFA-2 and USGS 130 in the southern part of the CFA were 4.02 and 3.42 mg/L, respectively, and these concentrations are higher than for other wells upgradient and downgradient of the CFA. Nitrate contamination south of the CFA has been attributed to contamination from the legacy CFA mercury pond south of the facility, and the elevated nitrate in these wells possibly could be due to the movement of nitrate in the unsaturated zone from the old CFA pond.
Nitrate concentrations in several ESRP aquifer wells in the eastern part of the INL were greater than the background concentration of about 1 mg/L for eastern regional groundwater recharge. The concentration trends for many of these wells also were increasing and the increasing trends were attributed to agricultural and other anthropogenic influences upgradient of the INL.
During 2021, water samples from five ESRP aquifer wells near the INTEC were analyzed for fluoride, and concentrations ranged from 0.18 to 0.225 mg/L. These concentrations were in the range of background concentrations of fluoride in the ESRP aquifer for the western part of the INL, which indicates that wastewater disposal has not had an appreciable effect on fluoride concentrations in the ESRP aquifer near the INTEC.
During 2019–21, water samples from 29 ESRP aquifer wells were collected and analyzed for volatile organic compounds (VOCs). Twelve different VOCs were detected. Water samples collected from 10 wells during 2019–21 each contained at least 1 and as many as 4 of the different VOCs detected. The primary VOCs detected included carbon tetrachloride, trichloromethane, tetrachloroethene, 1,1,1-trichloroethane, and trichloroethene. Concentrations were less than the MCL for drinking water for all VOCs except for carbon tetrachloride in one well near the RWMC, and trichloroethene in two wells near TAN, and vinyl chloride in one well near TAN.
During 2019–21, eight VOCs were detected in perched aquifer water from well USGS 92 near the RWMC. All VOC concentrations were substantially higher than those measured during 2016–18. Of the eight VOCs detected above their respective minimum reporting limits, four of these were detected above their respective MCLs (Tetrachloromethane, Tetrachloroethene 1,2-dichloropropane, and Trichloroethene).
During 2019–21, variability and bias were evaluated from 34 replicate and 14 blank quality-assurance samples. Results from replicate analyses were investigated to evaluate sample variability. Constituents with acceptable reproducibility were major ions, trace elements, nutrients, and VOCs. All radiochemical constituents had acceptable reliability except for gross alpha- and beta-particle radioactivity. The gross alpha- and beta-particle radioactivity samples that did not meet reproducibility criteria had very low concentrations. Bias from sample contamination was evaluated and found to be satisfactory, from equipment, field, and source-solution blanks.
Sulfate and chloride were detected at concentrations that were slightly more than their respective method detection limits (MDLs) in field and equipment blanks, and various trace elements were detected at concentrations that were slightly more than their respective MDLs in an equipment blank. None of the detections of nutrients or trace inorganic constituents were high enough to indicate environmental sample bias.
References Cited
Ackerman, D.J., 1991, Transmissivity of perched aquifers at the Idaho National Engineering Laboratory, Idaho: U.S. Geological Survey Water-Resources Investigations Report 91-4114 (DOE/ID-22099), 27 p. [Also available at https://doi.org/10.3133/wri914114.]
Ackerman, D.J., Rattray, G.W., Rousseau, J.P., Davis, L.C., and Orr, B.R., 2006, A conceptual model of ground-water flow in the eastern Snake River Plain aquifer at the Idaho National Laboratory and vicinity with implications for contaminant transport: U.S. Geological Survey Scientific Investigations Report 2006–5122 ((DOE/ID-22198), 62 p. [Also available at https://doi.org/10.3133/sir20065122.]
Ackerman, D.J., Rousseau, J.P., Rattray, G.W., and Fisher, J.C., 2010, Steady-state and transient models of groundwater flow and advective transport, eastern Snake River Plain aquifer, Idaho National Laboratory and vicinity, Idaho: U.S. Geological Survey Scientific Investigations Report 2010-5123 (DOE/ID-22209), 220 p. [Also available at https://pubs.usgs.gov/sir/2010/5123/.]
American Society for Testing and Materials International, 2010, Standard practice for performing detection and quantitation estimation and data assessment utilizing DQCALC software, based on ASTM practices D6091 and 20 D6512 of Committee D19 on water: American Society for Testing and Materials International, ASTM D7510-10, 2 p. [Also available at https://www.astm.org/Standards/D7510.htm.]
Anderson, S.R., 1991, Stratigraphy of the unsaturated zone and uppermost part of the Snake River Plain aquifer at the Idaho Chemical Processing Plant and Test Reactors Area: U.S. Geological Survey Water-Resources Investigations Report 91–4010: Idaho, Idaho National Engineering Laboratory (DOE/ID-22095), 71 p. [Also available at https://doi.org/10.3133/wri914010.]
Anderson, S.R., Ackerman, D.J., Liszewski, M.J., and Freiburger, R.M., 1996, Stratigraphic data for wells at and near the Idaho National Engineering Laboratory, Idaho: U.S. Geological Survey Open-File Report 96–248 (DOE/ID-22127), 27 p., 1 diskette. [Also available at https://doi.org/10.3133/ofr96248.]
Anderson, S.R., Kuntz, M.A., and Davis, L.C., 1999, Geologic controls of hydraulic conductivity in the Snake River Plain aquifer at and near the Idaho National Engineering and Environmental Laboratory, Idaho: U.S. Geological Survey Water-Resources Investigations Report 99–4033 (DOE/ID-22155), 38 p. [Also available at https://doi.org/10.3133/wri994033.]
Anderson, S.R., and Lewis, B.D., 1989, Stratigraphy of the unsaturated zone at the radioactive waste management complex: U.S. Geological Survey Water-Resources Investigations Report 89–4065 (DOE/ID-22080), 54 p. [Also available at https://doi.org/10.3133/wri894065.]
Barraclough, J.T., and Jensen, R.G., 1976, Hydrologic data for the Idaho National Engineering Laboratory site, Idaho, 1971 to 1973: U.S. Geological Survey Open-File Report 75–318 (IDO-22055), 52 p. [Also available at https://doi.org/10.3133/ofr75318.]
Barraclough, J.T., Lewis, B.D., and Jensen, R.G., 1981, Hydrologic conditions at the Idaho National Engineering Laboratory, Idaho, emphasis 1974–1978: U.S. Geological Survey Water-Resources Investigations Open-File Report 81–526 (IDO-22060), 116 p. [Also available at https://doi.org/10.3133/ofr81526.]
Barraclough, J.T., Robertson, J.B., Janzer, V.J., and Saindon, L., Gl., 1976, Hydrology of the solid waste burial ground as related to the potential migration of radionuclides, Idaho National Engineering Laboratory: U.S. Geological Survey Open-File Report 76–471 (IDO-22056), 183 p. [Also available at https://doi.org/10.3133/ofr76471.]
Barraclough, J.T., Teasdale, W.E., Robertson, J.B., and Jensen, R.G., 1967b, Hydrology of the National Reactor Testing Station, Idaho, 1966: U.S. Geological Survey Open-File Report 67–12, 95 p. [Also available at https://doi.org/10.3133/ofr6712.]
Bartholomay, R.C., 1993, Concentrations of tritium and strontium-90 in water from selected wells at the Idaho National Engineering Laboratory after purging one, two, and three borehole volumes: U.S. Geological Survey Water-Resources Investigations Report 93–4201 (DOE/ID-22111), 21 p. [Also available at https://doi.org/10.3133/wri934201.]
Bartholomay, R.C., 1998, Distribution of selected radiochemical and chemical constituents in water from perched ground-water zones, Idaho National Engineering Laboratory, Idaho, 1992–95: U.S. Geological Survey Water-Resources Investigations Report 98–4026 (DOE/ID-22145), 59 p. [Also available at https://doi.org/10.3133/wri984026.]
Bartholomay, R.C., 2022, Historical development of the U.S. Geological Survey hydrological monitoring and investigative programs at the Idaho National Laboratory, Idaho, 2002–2020: U.S. Geological Survey Open-File Report 2022-1027 (DOE/ID-22256), 54 p. [Also available at https://doi.org/10.3133/ofr20221027.]
Bartholomay, R.C., and Hall, L.F., 2016, Evaluation of background concentrations of selected chemical and radiochemical constituents in water from the eastern Snake River Plain aquifer at and near the Idaho National Laboratory, Idaho: U.S. Geological Survey Scientific Investigations Report 2016–5056 (DOE/ID-22237), 19 p. [Also available at https://doi.org/10.3133/sir20165056.]
Bartholomay, R.C., and Tucker, B.J., 2000, Distribution of selected radiochemical and chemical constituents in perched ground water, Idaho National Engineering and Environmental Laboratory, Idaho, 1996–98: U.S. Geological Survey Water-Resources Investigations Report 2000–4222 (DOE/ID–22168), 51 p. [Also available at https://doi.org/10.3133/wri004222.]
Bartholomay, R.C., and Twining, B.V., 2010, Chemical constituents in groundwater from multiple zones in the eastern Snake River Plain aquifer at the Idaho National Laboratory, Idaho, 2005–08: U.S. Geological Survey Scientific Investigations Report 2010–5116 5116 (DOE/ID 22211), 81 p. [Also available at https://doi.org/10.3133/sir20105116.]
Bartholomay, R.C., and Twining, B.V., 2015, Hydrologic influences on water-level changes in the eastern Snake River Plain aquifer at and near the Idaho National Laboratory, Idaho, 1949–2014: U.S. Geological Survey Scientific Investigations Report 2015–5085 (DOE/ID-22236), 36 p. [Also available at https://doi.org/10.3133/sir20155085.]
Bartholomay, R.C., and Williams, L.M., 1996, Evaluation of preservation methods for selected nutrients in ground water at the Idaho National Engineering Laboratory, Idaho: U.S. Geological Survey Water-Resources Investigations Report 96–4260 (DOE/ID-22131), 16 p. [Also available at https://doi.org/10.3133/wri964260.]
Bartholomay, R.C., Davis, L.C., Fisher, J.C., Tucker, B.J., and Raben, F.A., 2012, Water-quality characteristics and trends for selected sites at and near the Idaho National Laboratory, Idaho, 1949–2009: U.S. Geological Survey Scientific Investigations Report 2012–5169 (DOE/ID 22219), 68 p. [Also available at https://pubs.usgs.gov/sir/2012/5169/.]
Bartholomay, R.C., Hill, G.H., and Randolph, R.B., 1999, Statistical comparison of gross alpha- and gross beta-particle activity in water analyzed using two different laboratory methods, in Rocky Mountain Conference on Analytical Chemistry, 41st, Denver, Colorado, 1999, Proceedings: Denver, Colorado, Rocky Mountain Conference on Analytical Chemistry, Final program and abstracts, p. 132.
Bartholomay, R.C., Hodges, M.K.V., and Champion, D.E., 2017b, Correlation between basalt flows and radiochemical and chemical constituents in selected wells in the southwestern part of the Idaho National Laboratory, Idaho: U.S. Geological Survey Scientific Investigations Report 2017–5148 (DOE/ID-22245), 39 p. [Also available at https://doi.org/10.3133/sir20175148.]
Bartholomay, R.C., Hopkins, C.B., and Maimer, N.V., 2015, Chemical constituents in groundwater from multiple zones in the eastern Snake River Plain aquifer, Idaho National Laboratory, Idaho, 2009–13: U.S. Geological Survey Scientific Investigations Report 2015–5002 (DOE/ID-22232), 110 p. [Also available at http://dx.doi.org/10.3133/sir20155002.]
Bartholomay, R.C., Knobel, L.L., and Rousseau, J.P., 2003, Field methods and quality assurance plan for quality-of-water activities, U.S. Geological Survey, Idaho National Engineering and Engineering Laboratory, Idaho: U.S. Geological Survey Open-File Report 2003–42 (DOE/ID-22182), 45 p. [Also available at https://doi.org/10.3133/ofr0342.]
Bartholomay, R.C., Maimer, N.V., and Wehnke, A.J., 2014, Field methods and quality-assurance plan for water-quality activities and water level measurements, U.S. Geological Survey, Idaho National Laboratory, Idaho: U.S. Geological Survey Open-File Report 2014–1146 (DOE/ID-22230), 66 p. [Also available at https://dx.doi.org/10.3133/ofr20141146.]
Bartholomay, R.C., Maimer, N.V., Rattray, G.W., and Fisher, J.C., 2017a, An update of hydrologic conditions and distribution of selected constituents in water, eastern Snake River Plain aquifer and perched groundwater zones, Idaho National Laboratory Idaho, emphasis 2012–15: U.S. Geological Survey Scientific Investigations Report 2017–5021 (DOE/ID-22242), 87 p. [Also available at https://doi.org/10.3133/sir20175021.]
Bartholomay, R.C., Maimer, N.V., Rattray, G.W., and Fisher, J.C., 2020, An update of hydrologic conditions and distribution of selected constituents in water, Eastern Snake River Plain Aquifer and perched groundwater zones, Idaho National Laboratory, Idaho, emphasis 2016–18: U.S. Geological Survey Scientific Investigations Report 2019-5149 (DOE/ID-22251), 82 p. [Also available at https://doi.org/10.3133/sir20195149.]
Bartholomay, R.C., Maimer, N.V., Wehnke, A.J., and Helmuth, S.L., 2021, Field methods, quality-assurance, and data management plan for water-quality activities and water-level measurements: U.S. Geological Survey Open-File Report 2021–1004, 76 p. [Also available at https://doi.org/10.3133/ofr20211004.]
Bartholomay, R.C., Orr, B.R., Liszewski, M.J., and Jensen, R.G., 1995, Hydrologic conditions and distribution of selected radiochemical and chemical constituents in water, Snake River Plain aquifer, Idaho National Engineering Laboratory, Idaho, 1989 through 1991: U.S. Geological Survey Water-Resources Investigations Report 95–4175 (DOE/ID-22123), 47 p. [Also available at https://doi.org/10.3133/wri954175.]
Bartholomay, R.C., Tucker, B.J., Ackerman, D.J., and Liszewski, M.J., 1997, Hydrologic conditions and distribution of selected radiochemical and chemical constituents in water, Snake River Plain aquifer, Idaho National Engineering Laboratory, Idaho, 1992 through 1995: U.S. Geological Survey Water-Resources Investigations Report 97–4086 (DOE/ID-22137), 57 p. [Also available at https://doi.org/10.3133/wri974086.]
Bartholomay, R.C., Tucker, B.J., Davis, L.C., and Green, M.R., 2000, Hydrologic conditions and distribution of selected constituents in water, Snake River Plain aquifer, Idaho National Engineering and Environmental Laboratory, Idaho, 1996 through 1998: U.S. Geological Survey Water-Resources Investigations Report 2000–4192 (DOE/ID-22167), 52 p. [Also available at https://doi.org/10.3133/wri004192.]
Bennett, C.M., 1990, Streamflow losses and ground-water level changes along the Big Lost River at the Idaho National Engineering Laboratory, Idaho: U.S. Geological Survey Water-Resources Investigations Report 90–4067 (DOE/ID-22091), 49 p. [Also available at https://doi.org/10.3133/wri904067.]
Bunde, R.L., Rosentreter, J.J., and Liszewski, M.J., 1997, Rate of strontium sorption and the effects of variable aqueous concentrations of sodium and potassium on strontium distribution coefficients of a surficial sediment at the Idaho National Engineering Laboratory, Idaho—Berlin: Environmental Geology, v. 34, no. 2–3, p. 135–142.
Cecil, L.D., Knobel, L.L., Wegner, S.J., and Moore, L.L., 1989, Evaluation of field sampling and preservation methods for strontium-90 in ground water at the Idaho National Engineering Laboratory: U.S. Geological Survey Water-Resources Investigations Report 89–4146 (DOE/ID-22083), 24 p. [Also available at https://doi.org/10.3133/wri894146.]
Cecil, L.D., Orr, B.R., Norton, T., and Anderson, S.R., 1991, Formation of perched ground-water zones and concentrations of selected chemical constituents in water, Idaho National Engineering Laboratory, Idaho, 1986–88: U.S. Geological Survey Water-Resources Investigations Report 91–4166 (DOE/ID-22100), 53 p. [Also available at https://doi.org/10.3133/wri914166.]
Claassen, H.C., 1982, Guidelines and techniques for obtaining water samples that accurately represent the water chemistry of an aquifer: U.S. Geological Survey Open-File Report 82–1024, 49 p. [Also available at https://doi.org/10.3133/ofr821024.]
Davis, L.C., 2006a, An update of hydrologic conditions and distribution of selected constituents in water, Snake River Plain aquifer, emphasis 1999–2001: U.S. Geological Survey Scientific Investigations Report 2006–5088 (DOE/ID-22197), 48 p. [Also available at https://doi.org/10.3133/sir20065088.]
Davis, L.C., 2006b, An update of the distribution of selected radiochemical and chemical constituents in perched ground water, Idaho National Laboratory, Idaho, emphasis 1999–2001: U.S. Geological Survey Scientific Investigations Report 2006–5236 5236 (DOE/ID-22199), 48 p. [Also available at https://doi.org/10.3133/sir20065236.]
Davis, L.C., 2008, An update of hydrologic conditions and distribution of selected constituents in water, Snake River Plain aquifer and perched-water zones, emphasis 2002–05: U.S. Geological Survey Scientific Investigations Report 2008–5089 (DOE/ID-22203), 74 p. [Also available at https://doi.org/10.3133/sir20085089.]
Davis, L.C., 2010, An update of hydrologic conditions and distribution of selected constituents in water, Snake River Plain aquifer and perched groundwater zones, Idaho National Laboratory, Idaho, emphasis 2006–08: U.S. Geological Survey Scientific Investigations Report 2010–5197 (DOE/ID-22212), 80 p. [Also available at https://doi.org/10.3133/sir20105197.]
Davis, L.C., Bartholomay, R.C., and Rattray, G.W., 2013, An update of hydrologic conditions and distribution of selected constituents in water, eastern Snake River Plain aquifer and perched groundwater zones, Idaho National Laboratory, Idaho, emphasis 2009–11: U.S. Geological Survey Scientific Investigations Report 2013–5214 (DOE/ID-22226), 90 p. [Also available at https://doi.org/10.3133/sir20135214.]
Davis, L.C., Bartholomay, R.C., Fisher, J.C., and Maimer, N.V., 2015, Water-quality characteristics and trends for selected wells possibly influenced by wastewater disposal at the Idaho National Laboratory, Idaho, 1981–2012: U.S. Geological Survey Scientific Investigations Report 2015–5003 (DOE/ID-22233), 110 p. [Also available at https://doi.org/10.3133/sir20155003.]
Department of Environmental Quality, 2021, Idaho National Laboratory Oversight Program annual report. Department of Environmental Quality, 60 p. [Also available at https://www2.deq.idaho.gov/admin/LEIA/api/document/download/18459.]
Faires, L.M., 1993, Methods of analysis by the U.S. Geological Survey National Water Quality Laboratory—Determinations of metals in water by inductively coupled plasma-mass spectrometry: U.S. Geological Survey Open-File Report 92–634, 28 p. [Also available at https://doi.org/10.3133/ofr92634.]
Fisher, J.C., 2022, inlpubs—Bibliographic information for the U.S. Geological Survey Idaho National Laboratory Project Office: U.S. Geological Survey software release, R package. [Also available at https://doi.org/10.5066/P9I3GWWU.]
Fisher, J.C., 2021b, ObsNetQW—Assessment of a water-quality aquifer monitoring network: U.S. Geological Survey software release, R package. [Also available at https://doi.org/10.5066/P9X71CSU.]
Fisher, J.C., Bartholomay, R.C., Rattray, G.W., and Maimer, N.V., 2021, Optimization of the Idaho National Laboratory water-quality aquifer monitoring network, southeastern Idaho: U.S. Geological Survey Scientific Investigations Report 2021–5031 (DOE/ID-22252), 63 p. [Also available at https://doi.org/10.3133/sir20215031.]
Fisher, J.C., 2021, ObsNetQW—Assessment of a water-quality aquifer monitoring network: U.S. Geological Survey software release. [Also available at https://doi.org/10.5066/P9X71CSU.]
Fishman, M.J., ed., 1993, Methods of analysis by the U.S. Geological Survey National Water Quality Laboratory—Determination of inorganic and organic constituents in water and fluvial sediments: U.S. Geological Survey Open-File Report, 217 p. [Also available at https://doi.org/10.3133/ofr93125.]
Fishman, M.J., and Friedman, L.C., eds., 1989, Methods for determination of inorganic substances in water and fluvial sediments: U.S. Geological Survey Techniques of Water-Resources Investigations, book 5, chap. A1, 545 p. [Also available at https://pubs.usgs.gov/twri/twri5-a1/.]
Foreman, W.T., Williams, T.L., Furlong, E.T., Hemmerle, D.M., Stetson, S.J., Jha, V.K., Noriega, M.C., Decess, J.A., Reed-Parker, C., and Sandstrom, M.W., 2021, Comparison of detection limits estimated using single- and multi-concentration spike-based and blank-based procedures: Talanta, v. 228, p. 1. [Also available at https://doi.org/10.1016/j.talanta.2021.122139.]
French, D.L., Tallman, R.E., and Taylor, K.A., 1999a, Idaho National Engineering and Environmental Laboratory nonradiological waste management information for 1998 and record-to-date: U.S. Department of Energy, Waste Management Programs Division, Idaho Operations Office Publication (DOE/ID–10057) [variously paged].
Goerlitz, D.F., and Brown, E., 1984, Methods for analysis of organic substances in water: U.S. Geological Survey Techniques of Water-Resources Investigations, book 5, chap. A3, 40 p. [Also available at https://pubs.usgs.gov/twri/05a03/report.pdf.]
Greene, M.J., and Tucker, B.J., 1998, Purgeable organic compounds in water at or near the Idaho National Engineering Laboratory, Idaho, 1992–95: U.S. Geological Survey Open-File Report 98–51 (DOE/ID-22146), 21 p. [Also available at https://doi.org/10.3133/ofr9851.]
Holdren, K.J., Becker, B.H., Hampton, N.L., Koeppen, L.D., Magnuson, S.O., Meyer, T.J., Olson, G.L., and Sondrup, A.J., 2002, Ancillary basis for risk analysis of the Subsurface Disposal Area: Idaho National Engineering and Environmental Laboratory, U.S. Department of Energy, Idaho Operations Office, INEEL/EXT-02-01125 [variously paged].
Idaho Department of Water Resources, 2023, Idaho Department of Water Resources Aqua Info database webpage, accessed January 20, 2022, at https://research.idwr.idaho.gov/apps/hydrologic/aquainfo.
Jolley, W.L., Five-year review of CERCLA response actions at the Idaho National Laboratory: Idaho National Laboratory, DOE/NE-ID-11201. [Also available at https://doi.org/10.2172/908802.]
Kjelstrom, L.C., 1995, Methods to estimate annual mean spring discharge to the Snake River between Milner Dam and King Hill, Idaho: U.S. Geological Survey Water-Resources Investigations Report 95–4055, 9 p. [Also available at https://doi.org/10.3133/wri954055.]
Knobel, L.L., 2006, Evaluation of well-purging effects on water-quality results for samples collected from the eastern Snake River Plain aquifer underlying the Idaho National Laboratory, Idaho: U.S. Geological Survey Scientific Investigations Report 2006–5232 (DOE/ID-22200), 52 p. [Also available at https://pubs.er.usgs.gov/publication/sir20065232.]
Knobel, L.L., and Mann, L.J., 1993, Sampling for purgeable organic compounds using positive-displacement piston and centrifugal submersible pumps—A comparative study: Ground Water Monitoring and Remediation, v. 13, no. 2, p. 142–148. [Also available at https://doi.org/10.1111/j.1745-6592.1993.tb00446.x.]
Knobel, L.L., Bartholomay, R.C., Tucker, B.J., Williams, L.M., and Cecil, L.D., 1999, Chemical constituents in ground water from 39 selected sites with an evaluation of quality assurance data, Idaho National Engineering and Environmental Laboratory and vicinity, Idaho: U.S. Geological Survey Open-File Report 99–246 (DOE/ID-22159), 58 p. [Also available at https://pubs.er.usgs.gov/publication/ofr99246.]
Knobel, L.L., Orr, B.R., and Cecil, L.D., 1992, Summary of background concentrations of selected radiochemical and chemical constituents in groundwater from the Snake River Plain aquifer, Idaho—Estimated from an analysis of previously published data: Journal of the Idaho Academy of Science, v. 28, no. 1, p. 48–61.
Knobel, L.L., Tucker, B.J., and Rousseau, J.P., 2008, Field methods and quality-assurance plan for quality-of-water activities, U.S. Geological Survey, Idaho National Laboratory, Idaho: U.S. Geological Survey Open-File Report 2008–1165 (DOE/ID-22206), 36 p. [Also available at https://pubs.er.usgs.gov/publication/ofr20081165.]
Lewis, B.D., and Jensen, R.G., 1985, Hydrologic conditions at the Idaho National Engineering Laboratory, Idaho, 1979–1981 update: U.S. Geological Survey Hydrologic Investigations Atlas HA-674, 2 plates. [Also available at https://doi.org/10.3133/ha674.]
Liszewski, M.J., and Mann, L.J., 1992, Purgeable organic compounds in ground water at the Idaho National Engineering Laboratory, Idaho, 1990 and 1991: U.S. Geological Survey Open-File Report 92–174 (DOE/ID-22104), 19 p. [Also available at https://doi.org/10.3133/ofr92174.]
Liszewski, M.J., Rosentreter, J.J., and Miller, K.E., 1997, Strontium distribution coefficients of surficial sediment samples from the Idaho National Engineering Laboratory, Idaho: U.S. Geological Survey Water-Resources Investigative Report 97–4044 (DOE/ID-22140), 33 p. [Also available at https://doi.org/10.3133/wri974044.]
Liszewski, M.J., Rosentreter, J.J., Miller, K.E., and Bartholomay, R.C., 1998, Strontium distribution coefficients of surficial and sedimentary interbed samples from the Idaho National Engineering and Environmental Laboratory, Idaho: U.S. Geological Survey Water-Resources Investigative Report 98–4073 (DOE/ID-22149), 55 p. [Also available at https://doi.org/10.3133/wri984073.]
Maimer, N.V., and Bartholomay, R.C., 2016, Purgeable organic compounds at or near the Idaho Nuclear Technology and Engineering Center, Idaho National Laboratory, Idaho, 2015: U.S. Geological Survey Open-File Report 2016–1083 (DOE/ID 22238), 17 p. [Also available at https://doi.org/10.3133/ofr20161083.]
Mann, L.J., 1986, Hydraulic properties of rock units and chemical quality of water for INEL-1—A 10,365-foot deep test hole drilled at the Idaho National Engineering Laboratory, Idaho: U.S. Geological Survey Water-Resources Investigations Report (DOE/ID-22070), 23 p. [Also available at https://doi.org/10.3133/wri864020.]
Mann, L.J., 1990, Purgeable organic compounds in ground water at the Idaho National Engineering Laboratory, Idaho—1988 and 1989: U.S. Geological Survey Open-File Report 90–367 (DOE/ID-22089), 17 p. [Also available at https://doi.org/10.3133/ofr90367.]
Mann, L.J., 1996, Quality-assurance plan and field methods for quality-of-water activities, U.S. Geological Survey, Idaho National Engineering Laboratory, Idaho: U.S. Geological Survey Open-File Report 96–615 (DOE/ID-22132), 37 p. [Also available at https://doi.org/10.3133/ofr96615.]
Mann, L.J., and Cecil, L.D., 1990, Tritium in ground water at the Idaho National Engineering Laboratory, Idaho: U.S. Geological Survey Water-Resources Investigations Report 90–4090 (DOE/ID-22090), 35 p. [Also available at https://doi.org/10.3133/wri904090.]
Mann, L.J., and Knobel, L.L., 1987, Purgeable organic compounds in ground water at the Idaho National Engineering Laboratory, Idaho: U.S. Geological Survey Open-File Report 87–766 (DOE/ID-22074), 23 p. [Also available at https://doi.org/10.3133/ofr87766.]
Mirus, B.B., Perkins, K.S., and Nimmo, J.R., 2011, Assessing controls on perched saturated zones beneath the Idaho Nuclear Technology and Engineering Center, Idaho: U.S. Geological Survey Scientific Investigations Report 2011–5222 (DOE/ID-22216), 20 p. [Also available at https://pubs.usgs.gov/sir/2011/5222/.]
Morris, D.A., Barraclough, J.T., Hogenson, G.M., Shuter, E., Teasdale, W.E., Ralston, D.A., and Jensen, R.G., 1964, Hydrology of subsurface waste disposal, National Reactor Testing Station, Idaho—Annual progress report, 1963: U.S. Atomic Energy Commission, Idaho Operations Office Publication, IDO-22046-USGS, 97 p.
Mueller, D.K., Schertz, T.L., Martin, J.D., and Sandstrom, M.W., 2015, Design, analysis, and interpretation of field quality-control data for water-sampling projects: U.S. Geological Survey Techniques and Methods, book 4, chap. C4, 54 p. [Also available at https://doi.org/10.3133/tm4C4.]
Nace, R.L., McQueen, I.S., and Van't Hul, Arthur, 1958, Records of springs in the Snake River valley, Jerome and Gooding Counties, Idaho, 1899–1947: U.S. Geological Survey Water-Supply Paper 1463, 62 p., accessed on June 15, 2023, at https://pubs.usgs.gov/wsp/1463/report.pdf.
Nace, R.L., Voegeli, P.T., Jones, J.R., and Deutsch, M., 1975, Generalized geologic framework of the National Reactor Testing Station, Idaho: U.S. Geological Survey Professional Paper 725-B, 48 p. [Also available at https://doi.org/10.3133/pp725B.]
Nimmo, J.R., Perkins, K.S., Rose, P.E., Rousseau, J.P., Orr, B.R., Twining, B.V., and Anderson, S.R., 2002, Kilometer scale rapid transport of naphthalene sulfonate tracer in the unsaturated zone at the Idaho National Engineering and Environmental Laboratory: Vadose Zone Journal, v. 1, no. 1, p. 89–101. [Also available at https://doi.org/10.2136/vzj2002.8900.]
Orr, B.R., 1999, A transient numerical simulation of perched ground-water flow at the Test Reactor Area, Idaho National Engineering and Environmental Laboratory, Idaho, 1952–94: U.S. Geological Survey Water-Resources Investigations Report 99–4277 (DOE/ID-22162), 54 p. [Also available at https://doi.org/10.3133/wri994277.]
Orr, B.R., and Cecil, L.D., 1991, Hydrologic conditions and distribution of selected chemical constituents in water, Snake River Plain aquifer, Idaho National Engineering Laboratory, Idaho, 1986 to 1988: U.S. Geological Survey Water-Resources Investigations Report 91–4047 (DOE/ID-22096), 56 p. [Also available at https://doi.org/10.3133/wri914047.]
Pace, M.N., Rosentreter, J.J., and Bartholomay, R.C., 1999, Strontium distribution coefficients of basalt and sediment infill samples from the Idaho National Engineering and Environmental Laboratory, Idaho: U.S. Geological Survey Water-Resources Investigations Report 99–4145 (DOE/ID-22158), 56 p. [Also available at https://doi.org/10.3133/wri994145.]
Perkins, K.S., and Winfield, K.A., 2007, Property-transfer modeling to estimate unsaturated hydraulic conductivity of deep sediments at the Idaho National Laboratory, Idaho: U.S. Geological Survey Scientific Investigations Report 2007–5093 (DOE/ID-22202), 22 p. [Also available at https://doi.org/10.3133/sir20075093.]
Pittman, J.R., Jensen, R.G., and Fischer, P.R., 1988, Hydrologic conditions at the Idaho National Engineering Laboratory, 1982 to 1985: U.S. Geological Survey Water-Resources Investigations Report 89–4008 (DOE/ID-22078), 73 p. [Also available at https://doi.org/10.3133/wri894008.]
Pritt, J.W., 1989, Quality assurance of sample containers and preservatives at the U.S. Geological Survey National Water Quality Laboratory, in Pederson, G.L., and Smith, M.M., compilers, U.S. Geological Survey second national symposium on water quality—Abstracts of the technical sessions, Orlando, Florida, November 12–17, 1989: U.S. Geological Survey Open-File Report 89–409, p. 75. [Also available at https://doi.org/10.3133/ofr89409.]
R Core Team, 2023, R—A language and environment for statistical computing: Vienna, Austria, R Foundation for Statistical Computing, accessed on January 10, 2023, at https://www.r-project.org/.
Rattray, G.W., 2012, Evaluation of quality-control data collected by the U.S. Geological Survey for routine water-quality activities at the Idaho National Laboratory, Idaho, 1996–2001: U.S. Geological Survey Scientific Investigations Report 2012–5270 (DOE/ID-22222), 74 p. [Also available at https://doi.org/10.3133/sir20125270.]
Rattray, G.W., 2014, Evaluation of quality-control data collected by the U.S. Geological Survey for routine water-quality activities at the Idaho National Laboratory and vicinity, southeastern Idaho, 2002–08: USGS Scientific Investigations Report 2014–5027 (DOE/ID-22228), 66 p. [Also available at https://doi.org/10.3133/sir20145027.]
Rattray, G.W., 2018, Geochemistry of groundwater in the eastern Snake River Plain aquifer, Idaho National Laboratory and vicinity, eastern Idaho: U.S. Geological Survey Professional Paper 1837-A (DOE/ID-22246), 198 p. [Also available at https://doi.org/10.3133/pp1837A.]
Rattray, G.W., 2019, Evaluation of chemical and hydrologic processes in the eastern Snake River Plain aquifer based on results from geochemical modeling, Idaho National Laboratory, eastern Idaho: U.S. Geological Survey Professional Paper 1837–B (DOE/ID–22248), 85 p. [Also available at https://doi.org/10.3133/pp1837B.]
Robertson, J.B., Schoen, R., and Barraclough, J.T., 1974, The influence of liquid waste disposal on the geochemistry of water at the National Reactor Testing Station, Idaho, 1952–1970: U.S. Geological Survey Open-File Report 73–238, 231 p. [Also available at https://doi.org/10.3133/ofr73238.]
Rose, D.L., Sandstrom, M.W., and Murtagh, L.K., 2016, Determination of heat purgeable and ambient purgeable volatile organic compounds in water by gas chromatography/mass spectrometry: U.S. Geological Survey Techniques and Methods, book 5, chap. B12, 61 p., accessed August 11, 2021, at https://doi.org/10.3133/tm5B12.
Rousseau, J.P., Landa, E.R., Nimmo, J.R., Cecil, L.D., Knobel, L.L., Glynn, P.D., Kwicklis, E.M., Curtis, G.P., Stollenwerk, K.G., Anderson, S.R., Bartholomay, R.C., Bossong, C.R., and Orr, B.R., 2005, Review of the transport of selected radionuclides in the interim risk assessment for the Radioactive Waste Management Complex, Waste Area Group 7 Operable Unit 7-13/14, Idaho National Engineering and Environmental Laboratory, Idaho: U.S. Geological Survey Scientific Investigations Report 2005-5026 (DOE/ID-22192), variously paged. [Also available at https://doi.org/10.3133/sir20055026.]
Treinen, K.C., and Bartholomay, R.C., 2022, Evaluation of sample preservation methods for analysis of selected volatile organic compounds in groundwater at the Idaho National Laboratory, Idaho: U.S. Geological Survey Scientific Investigations Report 2022-5076 (DOE/ID-22257), 17 p. [Also available at https://doi.org/10.3133/sir20225076.]
Tucker, B.J., and Orr, B.R., 1998, Distribution of selected radiochemical and chemical constituents in perched ground water, Idaho National Engineering Laboratory, Idaho, 1989–91: U.S. Geological Survey Water-Resources Investigations Report 98–4028 (DOE/ID-22144), 62 p. [Also available at https://doi.org/10.3133/wri984028.]
Twining, B.V., and Maimer, N.V., 2019, Transmissivity and geophysical data for selected wells located at and near the Idaho National Laboratory, Idaho, 2017–18: U.S. Geological Survey Scientific Investigations Report 2019–5134 (DOE/ID–22249), 30 p. plus appendixes. [Also available at https://doi.org/10.3133/sir20195134.]
Twining, B.V., Bartholomay, R.C., and Hodges, M.K.V., 2016, Completion summary for boreholes TAN 2271 and TAN 2272 at Test Area North, Idaho National Laboratory, Idaho: U.S. Geological Survey Scientific Investigations Report 2016–5088 (DOE/ID-22239), 37 p. plus appendixes. [Also available at https://doi.org/10.3133/sir20165088.]
Twining, B.V., Maimer, N.V., Bartholomay, R.C., and Packer, B.W., 2021a, Completion summary for boreholes USGS 148, 148A, and 149 at the Materials and Fuels Complex, Idaho National Laboratory, Idaho: U.S. Geological Survey Scientific Investigations Report 2021–5131 (DOE/ID-22255), 38 p. [Available at https://doi.org/10.3133/sir20215131.]
Twining, B.V., Bartholomay, R.C., Fisher, J.C., and Anderson, C., 2021b, Multilevel groundwater monitoring of hydraulic head, water temperature, and chemical constituents in the eastern Snake River Plain aquifer, Idaho National Laboratory, Idaho, 2014–18: U.S. Geological Survey Scientific Investigations Report 2021-5002, 82 p. [Also available at https://doi.org/10.3133/sir20215002.]
Twining, B.V., Treinen, K.C., and Trcka, A.R., 2023, Completion summary for Borehole TAN-2336 at Test Area North, Idaho National Laboratory, Idaho: U.S. Geological Survey Scientific Investigations Report 2023–5020 (DOE/ID-22255), 33 p. plus appendixes. [Also available at https://doi.org/10.3133/sir20235020.]
U.S. Environmental Protection Agency, 2022, Part141—National Primary Drinking Water Regulations: Washington, D.C., Code of Federal Regulations 40, Office of the Federal Register, National Archives and Records Administration, 40 CFR Part 141, accessed July 1, 2022, https://www.ecfr.gov/current/title-40/ chapter-I/subchapter-D/part-141.
U.S. Geological Survey, variously dated, National field manual for the collection of water-quality data: U.S. Geological Survey Techniques of Water-Resources Investigations Report, book 9, chaps. A1–A9 [variously paged]. [Also available at https://water.usgs.gov/owq/FieldManual/.]
U.S. Geological Survey, 2015, Changes to National Water Quality Laboratory (NWQL) procedures used to establish and verify laboratory detection and reporting limits: National Water Quality Laboratory Technical Memorandum 15.02. [Also available at http://wwwnwql.cr.usgs.gov/rapi-notes/15-14_NWQL_TM_15-02_(DQCALC).pdf.]
U.S. Geological Survey, 2023, National Water Information System: U.S. Geological Survey web page, accessed February 1, 2023, at https://doi.org/10.5066/F7P55KJN.
Wegner, S.J., 1989, Selected quality assurance data for water samples collected by the U.S. Geological Survey, Idaho National Engineering Laboratory Idaho, 1980 to 1988: U.S. Geological Survey Water-Resources Investigations Report 89–4168 (DOE/ID-22085), 91 p. [Also available at https://doi.org/10.3133/wri894168.]
Williams, L.M., 1996, Evaluation of quality assurance/quality control data collected by the U.S. Geological Survey for water-quality activities at the Idaho National Engineering Laboratory, Idaho, 1989 through 1993: U.S. Geological Survey Water-Resources Investigations Report 96–4148 (DOE/ID-22129), 116 p. [Also available at https://doi.org/10.3133/wri964148.]
Williams, L.M., 1997, Evaluation of quality assurance/quality control data collected by the U.S. Geological Survey for water-quality activities at the Idaho National Engineering Laboratory, Idaho, 1994 through 1995: U.S. Geological Survey Water-Resources Investigations Report 97–4058 (DOE/ID-22136), 87 p. [Also available at https://doi.org/10.3133/wri974058.]
Conversion Factors
U.S. customary units to International System of Units
Temperature in degrees Celsius (°C) may be converted to degrees Fahrenheit (°F) as:
°F = (1.8 × °C) + 32.
Datums
Vertical coordinate information is referenced to the North American Vertical Datum of 1988 (NAVD 88).
Horizontal coordinate information is referenced to the North American Datum of 1983 (NAD 83).
Altitude, as used in this report, refers to distance above the vertical datum.
Supplemental Information
Specific conductance is given in microsiemens per centimeter at 25 degrees Celsius (µS/cm at 25 °C).
Concentrations of chemical constituents in water are given in milligrams per liter (mg/L) or micrograms per liter (µg/L).
Activities for radioactive constituents in water are given in picocuries per liter (pCi/L).
Abbreviations
ATRC
Advanced Test Reactor Complex
CFA
Central Facilities Area
Ci
curie
DLDQC
detection limits from DQCALC
DOE
U.S. Department of Energy
DQCALC
detection and quantitation calculation
EPA
U.S. Environmental Protection Agency
ESRP
eastern Snake River Plain
ICPP
Idaho Chemical Processing Plant
INEEL
Idaho National Engineering and Environmental Laboratory (1997–2005)
INEL
Idaho National Engineering Laboratory (1974–97)
INL
Idaho National Laboratory (current)
INTEC
Idaho Nuclear Technology and Engineering Center
LRL
laboratory reporting level
LT-MDL
long-term method detection limit
MCL
maximum contaminant level
MDL
method detection limit
MFC
Materials and Fuels Complex
mg/L
milligrams per liter
Mgal
million gallons
MLMS
multilevel monitoring system
MRL
minimum reporting level
N
nitrogen
NAD
normalized absolute difference
NRF
Naval Reactors Facility
NRTS
National Reactor Testing Station (1949–74)
NWIS
National Water Information System
NWQL
National Water Quality Laboratory (USGS)
PBF
Power Burst Facility
pCi/L
picocuries per liter
QA
quality assurance
QC
quality control
RESL
Radiological and Environmental Sciences Laboratory (DOE)
RSD
relative standard deviation
RTC
Reactor Testing Complex
RWMC PROD
RWMC production well
RWMC
Radioactive Waste Management Complex
s
sample standard deviation
SDA
Subsurface Disposal Area
TAN
Test Area North
TCE
trichloroethylene
TRA
Test Reactor Area
TRA DISP
Test Reactor Area disposal well
TSF
Technical Support Facility
USGS
U.S. Geological Survey
VOC
volatile organic compound
For information about the research in this report, contact
Director, Idaho Water Science Center
U.S. Geological Survey
230 Collins Rd
Boise, Idaho 83702-4520
https://www.usgs.gov/centers/id-water
Manuscript approved on February 14, 2023
Publishing support provided by the U.S. Geological Survey
Science Publishing Network, Tacoma Publishing Service Center
Edited by Jeff Suwak
Illustration by Teresa Lewis
Design and layout by Yanis Xavier Castillo
Disclaimers
Any use of trade, firm, or product names is for descriptive purposes only and does not imply endorsement by the U.S. Government.
Although this information product, for the most part, is in the public domain, it also may contain copyrighted materials as noted in the text. Permission to reproduce copyrighted items must be secured from the copyright owner.
Suggested Citation
Treinen, K.C., Trcka, A.R., and Fisher, J.C., 2024, An update of hydrologic conditions and distribution of selected constituents in water, eastern Snake River aquifer and perched groundwater zones, Idaho National Laboratory, Idaho, emphasis 2019–21: U.S. Geological Survey Scientific Investigations Report 2023–5128 (DOE/ID-22261), 96 p., https://doi.org/10.3133/sir20235128.
ISSN: 2328-0328 (online)
Study Area
| Publication type | Report |
|---|---|
| Publication Subtype | USGS Numbered Series |
| Title | An update of hydrologic conditions and distribution of selected constituents in water, eastern Snake River aquifer and perched groundwater zones, Idaho National Laboratory, Idaho, emphasis 2019–21 |
| Series title | Scientific Investigations Report |
| Series number | 2023-5128 |
| DOI | 10.3133/sir20235128 |
| Publication Date | February 06, 2024 |
| Year Published | 2024 |
| Language | English |
| Publisher | U.S. Geological Survey |
| Publisher location | Reston, VA |
| Contributing office(s) | Idaho Water Science Center |
| Description | Report: xii, 96 p.; 2 Data Releases |
| Country | United States |
| State | Idaho |
| Other Geospatial | Idaho National Laboratory |
| Online Only (Y/N) | Y |