

Assessment of Per- and Polyfluoroalkyl Substances in Water Resources of New Mexico, 2020–21
Links
- Document: Report (8.74 MB pdf) , HTML , XML
- Additional Report Pieces:
- Appendix Table 1.1 (csv) —Groundwater chemistry data for samples collected by the U.S. Geological Survey from across New Mexico during 2020–21.
- Appendix Table 1.2 (csv) —Groundwater quality control chemistry data for samples collected by the U.S. Geological Survey from across New Mexico during 2020–21.
- Appendix Table 1.3 (csv) —Surface-water chemistry data for samples collected by the U.S. Geological Survey from across New Mexico during 2020–21.
- Appendix Table 1.4 (csv) —Surface-water quality control chemistry data for samples collected by the U.S. Geological Survey from across New Mexico during 2020–21.
- Appendix Table 1.1 (xlsx) —Groundwater chemistry data for samples collected by the U.S. Geological Survey from across New Mexico during 2020–21.
- Appendix Table 1.2 (xlsx) —Groundwater quality control chemistry data for samples collected by the U.S. Geological Survey from across New Mexico during 2020–21.
- Appendix Table 1.3 (xlsx) —Surface-water chemistry data for samples collected by the U.S. Geological Survey from across New Mexico during 2020–21.
- Appendix Table 1.4 (xlsx) —Surface-water quality control chemistry data for samples collected by the U.S. Geological Survey from across New Mexico during 2020–21.
- Dataset: USGS water data for the Nation —USGS National Water Information System database
- Version History: Version History (txt)
- NGMDB Index Page: National Geologic Map Database Index Page (html)
- Download citation as: RIS | Dublin Core
Acknowledgments
The authors would like to thank the New Mexico Environment Department, in particular Jill Turner, Lena Schlichting, and Andy Jochems, for their assistance and support of this project. Additional thanks to the numerous private entities who allowed U.S. Geological Survey (USGS) to sample at their facilities across the State of New Mexico.
The authors would like to acknowledge those who helped collect and analyze samples during the COVID-19 pandemic and its associated challenges. USGS staff at the USGS Integrated Water Chemistry Assessment Laboratory, including David Roth and Paul Bliznik, are much appreciated for their dedication to making multiple analyses and assuring high data quality. Many additional thanks to the numerous staff at the USGS who participated in the collection of these samples, including Robert Henrion, Joseph Beman, Edyth Hermosillo, Alanna Jornigan, Elaiya Jurney, Natalia Montero, Harold Nelson, Brittany Mora, Heather Cornell, Steve Hannes, Rachel Mixon, and Scott Green.
Abstract
Per- and polyfluoroalkyl substances (PFAS) have been detected in public and private drinking-water wells, springs, and surface waters in New Mexico; however, the presence and distribution of PFAS in water resources across the State are not well characterized. From August 2020 to October 2021, the U.S. Geological Survey, in cooperation with the New Mexico Environment Department, collected water-quality samples from groundwater and surface-water sites throughout New Mexico. One hundred and seventeen groundwater wells were sampled from unconfined water-table aquifers for PFAS and a geochemical suite including major ions, trace elements, nutrients, dissolved organic carbon (DOC), stable isotopes of oxygen and hydrogen, tritium, and carbon-14 to provide context for groundwater age and geochemical evolution. Eighteen surface-water samples were analyzed for PFAS, and select samples were analyzed for wastewater tracers, major ions, trace elements, and DOC. Blanks and replicates indicated low bias and variability for PFAS, wastewater tracers, and geochemical compounds.
Twenty-seven of the 117 groundwater sites had PFAS concentrations reported above the detection level, and there were no exceedances of the 2016 U.S. Environmental Protection Agency health advisory of 70 nanograms per liter (ng/L) perfluorooctanoic acid plus perfluorooctane sulfonic acid. Twenty-two sites were resampled and showed similar signatures, excluding some springs. Total PFAS concentrations ranged from 0.91 to 80.3 ng/L. The most frequently detected PFAS at groundwater sites were perfluorobutanesulfonic acid (PFBS; 11 sites), perfluoropentanoic acid (10 sites), and perfluorohexanoic acid (9 sites). Correlations were found between certain PFAS compounds that suggest similar sources. PFAS were also correlated with tritium, DOC, and nitrate, which indicated that a presence of anthropogenic compounds could in turn indicate a likelihood of PFAS occurrence. In addition, a cluster analysis showed that varying geochemical processes and sources of anthropogenic compounds likely contribute to the PFAS signature of each groundwater sample.
Surface-water samples showed variable total PFAS concentrations ranging from 1.0 to 155.4 ng/L. Sites downstream from urban areas showed numerous PFAS detections. Some undeveloped areas where minimal PFAS detections would be expected had PFAS detections. Correlations between PFAS were found that suggested similar sources. Perfluoropentanoic acid and PFBS were the most frequently detected PFAS, and PFBS had the highest single concentration of 93 ng/L.
Results of the study provide an overview of PFAS occurrences in the water resources of New Mexico along with geochemical context and are used to identify areas for further scientific investigations that could further characterize PFAS occurrences in New Mexico.
Introduction
In New Mexico, water resources are scarce and can be particularly vulnerable to input from anthropogenic compounds (Langman and O’Nolan, 2005; Bexfield and others, 2011; Shephard and others, 2019; Flickinger and Shephard, 2022). Water quality is a function of local geology and climate as well as discharges from urban and agricultural regions. Drinking water in the State is obtained from both surface-water and groundwater sources.
Per- and polyfluoroalkyl substances (PFAS) are anthropogenic chemicals that have been widely used for the past 70 years (Lindstrom and others, 2011). PFAS are present in a number of consumer products and industrial applications, such as in firefighting foams, cookware, paper products, and coatings for textiles, and have been found in a variety of water resources throughout the United States (Boone and others, 2019). This class of compounds comprises thousands of chemicals, including perfluoro sulfonic acids, such as perfluorooctane sulfonic acid (PFOS), and perfluorocarboxylic acids, such as perfluorooctanoic acid (PFOA; Wang and others, 2017). As the use of these chemicals has grown, so has their ubiquity in the environment because of their highly persistent nature (Lindstrom and others, 2011). PFOA and PFOS have been investigated by the U.S. Environmental Protection Agency (EPA) and are considered harmful to human health and the environment (EPA, 2020). In 2016, the EPA established a health advisory limit of 70 nanograms per liter (ng/L) for PFOA and PFOS (EPA, 2022a). After this study was completed, in June 2022, the EPA issued a draft report with revised health advisory limits for PFOA and PFOS to 0.004 and 0.02 ng/L, respectively, and the EPA added health advisory limits for hexafluoropropylene oxide dimer acid and its ammonium salt (referred to as “GenX”) to 10 ng/L and perfluorobutanesulfonic acid (PFBS) to 2,000 ng/L (EPA, 2022a). Point sources, such as firefighting training areas, industrial facilities, and wastewater treatment plants, have been found to contribute PFAS into the water cycle, including as components of runoff and groundwater infiltration (Hu and others, 2016). At 25 drinking water plants across the United States, Boone and others (2019) analyzed paired samples from sources (untreated) and after treatment for 17 PFAS with reporting levels ranging from 0.032 to 0.56 ng/L, and detectable PFAS were found in all samples. Six PFAS were listed in drinking water in the EPA’s Third Unregulated Contaminant Monitoring Rule (EPA, 2022d). According to Crone and others (2019), 4 percent of water systems where samples were collected at entry points to the distribution system reported at least one detectable PFAS, where reporting levels ranged from 10 to 90 ng/L, and 1.3 percent of water systems reported results above the 2016 health advisory limits. There is evidence that exposure may lead to human reproductive and developmental problems as well as adverse liver, kidney, and immunological effects (EPA, 2020).
PFAS have been detected in public and private drinking water, springs, and surface waters in New Mexico (New Mexico Environment Department [NMED], 2020; Intellus New Mexico, 2020). More than 1,700 industry facility sites may be handling PFAS in New Mexico, according to the EPA Enforcement and Compliance History Online database (EPA, 2022b). There are known or suspected PFAS detections across the State, including those at Air Force bases, armories, a missile range, and an aviation support facility (EPA, 2022b). The NMED has investigated known PFAS concentrations at and around Cannon Air Force Base (Curry County) and Holloman Air Force Base (Otero County). The NMED, in conjunction with the New Mexico Department of Health and the U.S. Air Force, conducted sampling at the bases from 2016 through 2019. Twenty-one PFAS were analyzed using EPA Method 537 and 537 M. At Cannon Air Force Base, the highest total PFAS concentration was 56,504 ng/L in a Cannon Air Force Base monitoring well. At Holloman Air Force Base, the highest total PFAS concentration was 2,454,500 ng/L in a Holloman Air Force Base monitoring well (NMED, 2020). The NMED Department of Energy Oversight Bureau samples surface water and groundwater PFAS at Los Alamos National Laboratory and in 2019 the maximum concentration for an individual PFAS compound was 16.5 ng/L of PFOS (Intellus New Mexico, 2020). Although these areas in New Mexico are known to be affected by PFAS, the presence and distribution of PFAS in water resources across the State of New Mexico are not well characterized. The U.S. Geological Survey (USGS) assessed the presence of PFAS in surface-water and groundwater resources throughout New Mexico. The presence of PFAS was assessed in samples from representative locations, including urban, agricultural, and natural landscapes. Geochemical, isotopic, and wastewater tracer analytes were also assessed to better understand the groundwater evolution (chemical changes as water moves through the subsurface), which provides information regarding travel time of groundwater, mixing from different sources, recharge elevation, water rock interaction, and the potential surface-water sources. The results of this study will help to establish baseline PFAS occurrence in the water resources of New Mexico, provide geochemical context for groundwater and surface-water evolution related to understanding the presence or absence of PFAS compounds in those waters, and inform sampling efforts focused in areas where environmental PFAS detections are found.
Purpose and Scope
This report documents the assessment of per- and polyfluoroalkyl substances in water resources of New Mexico during 2020–21. Surface-water samples were collected from every major river in the State, and groundwater samples were collected from larger urban areas and less developed counties. The extent of PFAS concentrations is discussed, as well as the other associated geochemical data that were collected, for both groundwater and surface-water locations across the State of New Mexico.
Description of Study Area
The study area encompasses large areas of the State of New Mexico. Climate is described below, as well as surface-water hydrology, by watershed, and groundwater hydrology, by aquifer.
Climate
The topography of New Mexico ranges from high elevation forested mountains to lower elevation deserts. Except in the mountainous regions, the climate is primarily arid to semiarid. Average annual precipitation across New Mexico for 1980–2010 ranged from 6 inches in lower elevation areas of northwestern and southern New Mexico to 52 inches in higher elevation areas of northern New Mexico (New Mexico Office of the State Engineer/Interstate Stream Commission, 2018). Precipitation as snowfall in the winter months is a substantial source of surface-water and aquifer recharge and drives most of the streamflow in the Rio Grande in the northern portion of the State. Summer thunderstorms, known as monsoons, are also a highly variable source of precipitation and drive streamflow in the southern part of the State (Moeser and others, 2021).
Groundwater Hydrogeologic Setting
Groundwater sampling locations (117 groundwater well sites) were selected in populated areas across the State, which were also located in unconfined surficial aquifers (fig. 1, table 1). The majority of these wells supply public water systems. Because the majority of these wells were part of public water systems, it should be noted that the wells were sampled prior to any water treatment. Additionally, to provide a comprehensive assessment of PFAS in sources of water to those public water systems, springs and surface-water diversions within those systems were also sampled for the same constituents as the groundwater samples (table 1). Diversions, as defined by USGS, are locations where water is withdrawn or diverted from a surface-water body. For example, a diversion could be a point where water is diverted from a river into a water system or a point where water is withdrawn from a reservoir (USGS, 2022b). Diversions, while technically representing surface water, were analyzed for groundwater constituents because they were part of public supplies that consisted mostly of groundwater and (or) springs (table 1). However, the analytical results for surface-water diversion samples are not included with groundwater analytical results because they do not represent groundwater due to the diversions being derived from surface-water inputs. Springs are considered representative of groundwater chemistry because each is a location where groundwater emerges at land surface at the spring locations. Major aquifers or aquifer systems that were sampled included the Rio Grande aquifer system (39 groundwater wells and 3 surface-water diversions), the High Plains aquifer (52 groundwater wells), the Colorado Plateaus aquifers (5 groundwater wells), and the Roswell Basin aquifer system (4 groundwater wells; fig. 1). Forty-four sites are located in other surficial aquifers; of these, 24 are springs and 17 are wells.
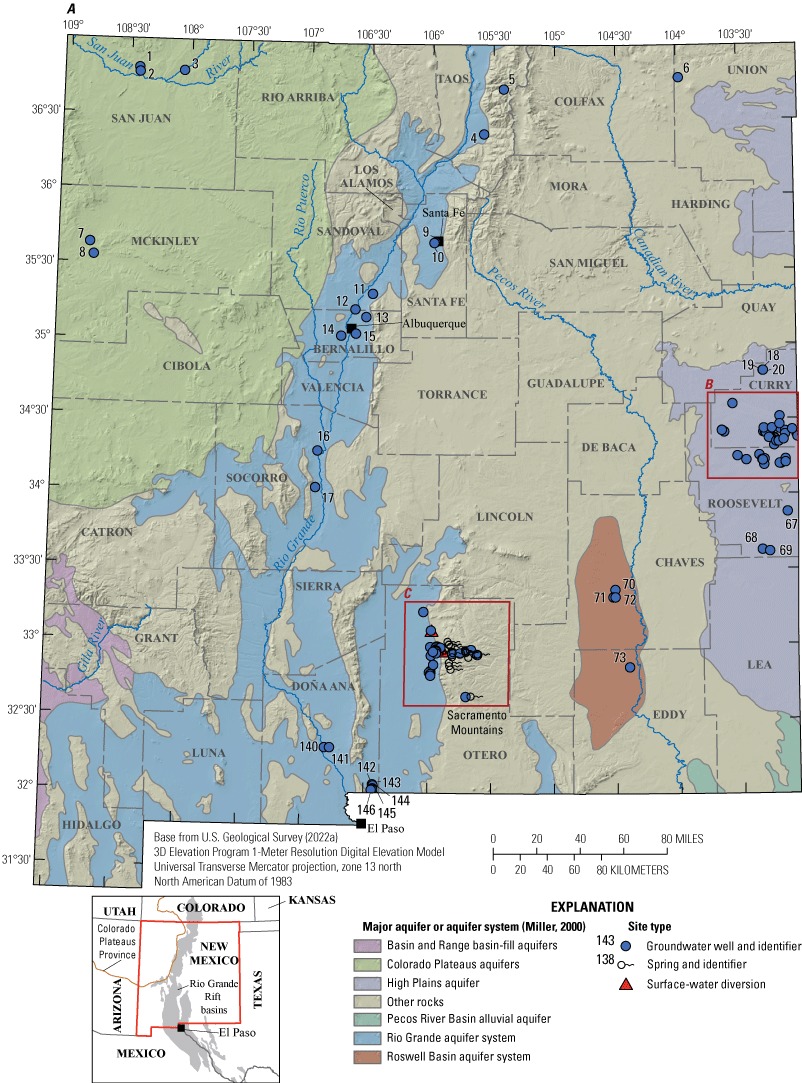
Per- and polyfluoroalkyl substances groundwater well, spring, and surface-water diversion sampling locations and major aquifers or aquifer systems A, across New Mexico, B, in parts of Curry and Roosevelt Counties, C, in part of Otero County, and D, in a high-mountain system in Otero County.
Table 1.
Groundwater wells, springs, and surface-water diversions sampled for per- and polyfluoroalkyl substances (PFAS), with applicable well and aquifer information.[USGS, U.S. Geological Survey. Site type: GW, groundwater; FA-DV, diversion; SP, spring. Aquifer name: CPA, Colorado Plateaus aquifers; RGAS, Rio Grande aquifer system; NA, not applicable or available; RBAS, Roswell Basin aquifer system; HPA, High Plains aquifer. Rock type, unit, or formation: OR (PCS), other rocks (Pictured Cliffs Sandstone); OR (NTED), other rocks (Naha and Tsegi eolian deposits); OR (A), other rocks (alluvium); USG, unconsolidated sand and gravel aquifers; OR (TIRISC), other rocks (Tertiary intrusive rocks of intermediate to silicic composition); OR (BTLNV), other rocks (basaltic tephra and lavas near vents); SA, sandstone aquifers; CRA, carbonate-rock aquifers; OR (AF), other rocks (Abo Formation); OR (BF), other rocks (Bursum Formation of Madera Group); OR (YF), other rocks (Yeso Formation); OR (SAF), other rocks (San Andres Limestone)]
The Rio Grande aquifer system (fig. 1) is a 70,000-square-mile (mi2) area of interconnected basin-fill deposits in southern Colorado, New Mexico, and western Texas (Robson and Banta, 1995). The Rio Grande headwaters are located in southern Colorado, from which it flows southward through New Mexico from deep canyons north of Santa Fe, through broad basins and valleys, to the Texas State line. The Rio Grande rift is the primary geologic feature of the system, and the aquifer ranges in thickness from about 20,000 feet (ft) near Albuquerque, N. Mex., to 2,000 ft near El Paso, Texas. The Quaternary and Tertiary Santa Fe Group is the principal hydrologic member of the system and consists primarily of gravel, sand, and interbedded clays, and lesser amounts of lava flows, tuffs, and breccias. Recharge is primarily from precipitation in mountainous areas, seepage from the Rio Grande and its tributaries, as well as from irrigation conveyance structures and return flow (Houston and others, 2021). Jurgens and others (2022) characterized the age distribution for groundwater in 21 principal aquifers across the United States, including the Rio Grande aquifer system, and determined that if the principal aquifer contained modern water (1953 or newer), the aquifer could be susceptible to land-surface contamination. Jurgens and others (2022) found that the Rio Grande aquifer system had approximately 15 percent modern water and may be less susceptible to land-surface contamination.
The High Plains aquifer occupies a 174,000-mi2 area that extends across parts of several States, including eastern New Mexico (fig. 1). The aquifer primarily consists of unconsolidated gravel, sand, and silt, and the Ogallala Formation is the principal hydrologic unit. The Miocene and early Pliocene Ogallala Formation was deposited by streams and therefore consists of deposits of variable thickness that range from 0 to 500 ft in buried paleochannels (Robson and Banta, 1995). Recharge to the High Plains aquifer is primarily from precipitation infiltration, irrigation water infiltration, or seepage from surface water. Jurgens and others (2022) determined that the High Plains aquifer contained approximately 30 percent modern water.
The Colorado Plateaus aquifers encompass 110,000 mi2, including northwestern New Mexico (fig. 1). Four principal aquifers compose the system, with the two in New Mexico being the Mesaverde aquifer and the Dakota-Glen Canyon aquifer system (Robson and Banta, 1995). Study sites 1, 2, and 3 are in the Farmington area along the San Juan and Animas Rivers and vary in hydrogeologic setting. Site 1 (well depth, 145 ft) and site 2 (well depth, 40 ft) are not located in the Mesaverde aquifer according to Stewart (2018) and are in smaller, less productive aquifers. Site 1 is completed in the Pictured Cliffs Sandstone, and site 2 is completed in Naha and Tsegi eolian deposits (Stewart, 2018). The site 3 well is shallow and completed at 23 ft in alluvium rather than in one of the principal aquifers. Wells at sites 7 and 8 are around 2,000 ft deep, and they are likely completed in the Dakota-Glen Canyon aquifer system, which is composed of several sandstone and conglomerate water-yielding units (Robson and Banta, 1995). Recharge to these aquifers has been identified along outcrops forming structural boundaries, as water enters the groundwater system through these outcrops. Recharge also enters from stream-channel loss as streams cross the outcrops (Craigg, 2001). Newer studies have shown that there are some anthropogenic recharge sources in the basin, such as seepage from irrigation and leaking water and sewer lines (Robertson and others, 2016). Jurgens and others (2022) determined that the Colorado Plateaus aquifers contained approximately 20 percent modern water.
The Roswell Basin aquifer system occupies a 12,000-mi2 area in southeastern New Mexico (fig. 1) and is composed of an alluvial aquifer and an underlying carbonate-rock aquifer. Groundwater is primarily present in the San Andres Limestone and the overlying Queen and Grayburg Formations (Robson and Banta, 1995). The alluvium overlying the carbonate rocks is generally west of the Pecos River and ranges in thickness from 150 to 300 ft. Recharge is mainly from precipitation in the outcrop areas of the San Andres Limestone and the alluvium. Additional recharge occurs from losing streams, as well as through sinkholes and solution fractures (Land and Newton, 2008).
Approximately one-third of the study sites in table 1 did not fall within the aforementioned primary aquifer systems. Although most of these sites are located in southern New Mexico, two sites are located in north central and northeastern New Mexico (fig. 1). Site 5 is a relatively shallow well with a depth of 68 ft and, based on the surficial geology map of New Mexico (Horton, 2017), is located in Tertiary intrusive rock. Site 6, a groundwater well, is 680 ft deep and is located in Quaternary volcanic rocks. In southern New Mexico, most of the sites (including spring sites 98, 109, 113, and 123–138, and groundwater well sites 110–112, 114–119, 121–122, and 139; table 1) are located in the Yeso Formation (a sandstone; Horton, 2017). Sites 96, 97, and 99 (springs) are located in the Abo Formation (a sandstone; Horton, 2017). Site 84 (groundwater well) is located in the Bursum Formation of the Madera Group (shale), and site 120 (groundwater well) is located in the San Andres Limestone (Horton, 2017).
Surface-Water Hydrologic Setting
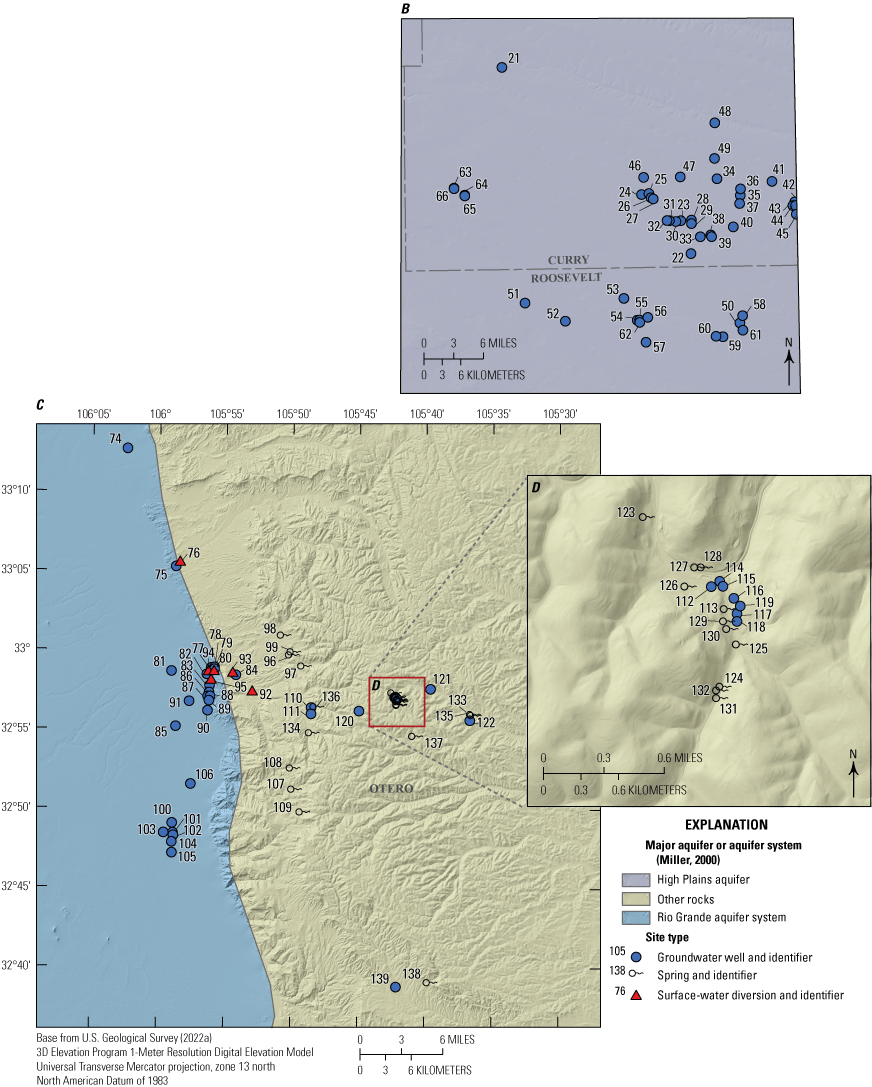
Surface-water samples were collected from 18 established USGS streamgaging sites across New Mexico (fig. 2, table 2). The rivers sampled were the Animas River, San Juan River, Canadian River, Gila River, Rio Grande, Rio Chama, Rio Puerco, and Pecos River. Land cover was evaluated near each surface-water site (fig. 2, table 3) using the near-site watershed method as described in Medalie and others (2020) and in the “Methods” section herein.
Per- and polyfluoroalkyl substances surface-water sampling locations across New Mexico with land cover, rivers, water bodies, and watersheds shown.
Table 2.
Surface-water sites across New Mexico with location information, drainage area, and watershed information.[Horizonal coordinate information is referenced to the North American Datum of 1983. USGS, U.S. Geological Survey; HUC, hydrologic unit code; N. Mex, New Mexico; Tex., Texas]
Table 3.
Land cover percentages within the near-site watershed of a surface-water sampling location, as determined by the methods in Medalie and others (2020).[ID, identifier; USGS, U.S. Geological Survey; N. Mex., New Mexico; Tex., Texas]
The Animas and San Juan Rivers flow through the northwestern portion of the State (fig. 2). Both rivers supply water valuable for municipal, agricultural, cultural, and recreational uses. From its headwaters in southwestern Colorado, the Animas River flows southwest until it eventually joins the San Juan River in Farmington, N. Mex. (EPA, 2022c). The Animas River at Farmington, N. Mex. sampling site (herein referred to as “Animas Farmington”; site number 09364500) is approximately 1.25 miles (mi) upstream from the confluence with the San Juan River. The land cover near this sampling site is 72 percent shrubland and 14 percent developed (fig. 2, table 3). The San Juan River enters New Mexico through Navajo Lake, a reservoir used for flood control; water supply for irrigation, domestic, and industrial use; water storage; hydropower; and recreational purposes (EPA, 2022c). San Juan River near Archuleta, N. Mex. (herein referred to as “San Juan Archuleta”; site number 09355500), one of the two sampling sites on the San Juan River, is approximately 6 mi downstream from Navajo Lake (fig. 2). This site is surrounded by 62 percent shrubland and approximately 27 percent forested land. From Navajo Lake, the San Juan River flows through agricultural land in the Colorado Plateau until it reaches Farmington, N. Mex., and is joined by the Animas River at the Animas Farmington site. Below the confluence with the Animas River, the San Juan River flows westward, where it provides irrigation water for agricultural communities, past Fruitland, N. Mex., at San Juan near Fruitland, N. Mex., sampling site (herein referred to as “San Juan Fruitland”; site number 09367540). The land cover near this site is 86 percent shrubland. The San Juan River then continues through northwestern New Mexico, flowing past two coal-fired power plants and through a sandstone canyon where it leaves New Mexico (EPA, 2022c). The sampling locations in the San Juan and Animas rivers were sampled seven to nine times throughout the project (table 2).
The headwaters of the Canadian River flow southeast through northeastern New Mexico and the river continues to flow eastward until it leaves the State (Oklahoma History Center, 2022). In downstream order, the three locations sampled along the Canadian River are: Canadian River near Sanchez, N. Mex. (herein referred to as “Canadian Sanchez”; site number 07221500); Canadian River below Conchas Dam (herein referred to as “Canadian Conchas”; site number 07224500); and Canadian River at Logan, N. Mex. (herein referred to as “Canadian Logan”; site number 07227000) (fig. 2). The Canadian River sites were only sampled one or two times throughout the project (table 2), and all three sites are dominated by shrubland land cover with little to no developed land (table 3).
The Gila River near Gila, N. Mex., sampling site (herein referred to as “Gila”; site number 09430500) is in the Upper Gila watershed in southwestern New Mexico (fig. 2). Much of the 5,532 mi of water courses in the Upper Gila watershed are intermittent streams that occasionally flow in the summer after thunderstorms (Natural Resources Conservation Service, 2022). Gila had a mean annual streamflow of about 156 cubic feet per second for 1927–2011 (Natural Resources Conservation Service, 2022). The Gila River was only sampled twice during the study (table 2), and the land cover near this site consists of approximately 73 percent forested land and 27 percent shrubland/grassland (table 3).
The headwaters of the Rio Grande are in southwestern Colorado, and six sites were sampled along the Rio Grande as it flows south through New Mexico (fig. 2). In downstream order, the sampled sites are Rio Grande below Taos Junction Bridge near Taos, N. Mex. (herein referred to as “Rio Grande Taos”; site number 08276500); Rio Grande above Buckman Diversion near White Rock, N. Mex. (herein referred to as “Rio Grande Buckman”; site number 08313150); Rio Grande at Alameda Bridge at Alameda, N. Mex. (herein referred to as “Rio Grande Alameda”; site number 08329918); Rio Grande at Valle de Oro, N. Mex. (herein referred to as “Rio Grande Valle de Oro”; site number 08330830); Rio Grande Floodway at San Marcial, N. Mex. (herein referred to as “Rio Grande Floodway”; site number 08358400), and Rio Grande at El Paso, Tex. (herein referred to as “Rio Grande El Paso”; site number 08364000). Depending on the location, these sites were sampled between 2 (Rio Grande Taos) and 13 (Rio Grande Valle de Oro) times (table 2), and the sampling frequency was variable and coordinated with other USGS activity in the study area. From northern New Mexico, the Rio Grande flows southward to the most upstream sampling site, Rio Grande Taos. This site is surrounded by about 75 percent shrubland/grassland land cover and 22 percent forested land cover (table 3). The Rio Grande continues from the Upper Rio Grande watershed to the confluence with the Rio Chama, which is the largest tributary to the Rio Grande (Natural Resources Conservation Service, 2022). The Rio Chama below Abiquiu Dam, N. Mex., sampling site (herein referred to as “Rio Chama Abiquiu”; site number 08287000) is surrounded by about 70 percent shrubland/grassland, 26 percent forested land, and 4 percent open water. Downstream from the confluence of the Rio Grande and the Rio Chama near Santa Fe, N. Mex., is the sampling site Rio Grande Buckman. The site is surrounded by 84 percent shrubland/grassland and by about 10 percent forested land. Just downstream from this site, water is pumped from the Rio Grande to a treatment plant to serve the City of Santa Fe and surrounding communities (Buckman Direct Diversion, 2015).
Samples were collected at the northern edge of New Mexico’s largest municipality, Albuquerque, at Rio Grande Alameda, and near the southern boundary of the urban area at Rio Grande Valle de Oro. Within the Middle Rio Grande Basin as well as this reach within Albuquerque, the inner valley of the Rio Grande has a system of riverside drains and irrigation canals and ditches. The irrigation canals and ditches are primarily used during irrigation season (typically mid-March through October), when water from the river is diverted by the Middle Rio Grande Conservancy District for delivery to irrigated fields (Bartolino and Cole, 2002). The riverside drains extend parallel to both sides of the river and were constructed to capture lateral groundwater flow from the river. This helps to stabilize the groundwater table to avoid waterlogging of soils near the river. These riverside drains, which also receive flow from interior drains extending across the valley to intercept seepage from canals and irrigated fields, eventually flow back to the Rio Grande (Bartolino and Cole, 2002).
Rio Grande Alameda is represented by about 80 percent shrubland/grassland and 9 percent developed land (table 3). Downstream from this sampling location, the Albuquerque Bernalillo County Water Utility Authority operates facilities constructed as part of the San Juan-Chama Drinking Water Project to provide a percentage of Albuquerque’s drinking water. The diverted water has been imported via a tunnel from tributaries of the San Juan River in the Colorado River Basin into reservoirs along the Rio Chama, which flow into the Rio Grande (Albuquerque Bernalillo County Water Utility Authority, 2022). A raw-water pump station diverts water from the Rio Grande to a treatment plant to provide drinking water for Albuquerque residents. After use, unconsumed water is directed to the wastewater treatment plant (WWTP; Albuquerque Bernalillo County Water Utility Authority, 2021). The Albuquerque WWTP is the largest treatment facility in New Mexico and discharges into the Rio Grande. Downstream from the Albuquerque WWTP is a large arroyo (132-mi2 drainage area), which flows into the Rio Grande from the east. The arroyo serves as the primary channel for snowmelt and stormwater from areas east of Albuquerque (City of Albuquerque Parks and Recreation Department Open Space Division, 2014). Several major stormwater diversions also contribute large amounts of stormflow to the Rio Grande from major residential and commercial areas.
Rio Grande Valle de Oro is approximately 3 mi downstream from the Albuquerque WWTP. Near Rio Grande Valle de Oro, the surrounding land cover consists of about 49 percent shrubland/grassland and 40 percent developed land (table 3). Farther downstream from this site, the Rio Grande is joined by the Rio Puerco (fig. 2). The Rio Puerco watershed (table 2) of west central New Mexico includes approximately 4,834 mi of water courses that usually flow intermittently in the summer after storms. The Rio Puerco contributes a very small percentage of the Rio Grande’s flow; however, it contributes over half of the total sediment load that enters the Elephant Butte Reservoir (Natural Resources Conservation Service, 2022). The Rio Puerco near Bernardo, N. Mex. sampling site (herein referred to as “Rio Puerco Bernardo”; site number 08353000) is surrounded by 87 percent shrubland/grassland and 13 percent barren land.
Rio Grande Floodway is located about 30 mi upstream from the Elephant Butte Reservoir (fig. 2), and the surrounding land cover is composed almost exclusively of shrubland/grassland (table 3). Rio Grande El Paso is the most downstream sampling location on the Rio Grande and is more than 100 mi south of Elephant Butte Reservoir, across the New Mexico border in El Paso, Tex. Land use near this site is composed of 49 percent shrubland/grassland and almost 40 percent developed land.
The headwaters of the Pecos River are in northern New Mexico, and the river flows southward through the eastern portion of the State until it reaches the Rio Grande south of the New Mexico border (Bureau of Reclamation, 2021). Three sites were sampled along the Pecos River (fig. 2). The most upstream site is Pecos River near Puerto de Luna, N. Mex. (herein referred to as “Pecos Puerto de Luna”; site number 08383500) in the Pecos Headwaters watershed. The Pecos River flows southeast to the Upper Pecos-Long Arroyo watershed where the Pecos River near Artesia, N. Mex. sampling site (herein referred to as “Pecos Artesia”; site number 08396500) is located. The next site downstream is Pecos River at Red Bluff, N. Mex. (herein referred to as “Pecos Red Bluff”; site number 08407500) in the Upper Pecos-Black watershed. All three sites have dominantly shrubland/grassland land cover (table 3).
Potential Per- and Polyfluoroalkyl Substance Sources
PFAS originate from a variety of sources and are used in many industrial and consumer applications. Glüge and others (2020) identified more than 1,400 PFAS compounds and more than 200 uses of those compounds. PFAS are used in industries ranging from oil and gas extraction to electroplating to textile production. There are many other uses for PFAS, including firefighting foams, cookware, adhesives, paper, and packaging. These materials end up in landfills and landfill leachate, as well as at WWTPs (Ahrens and others, 2009; Busch and others, 2010).
The input of PFAS from WWTPs is of particular interest for surface water, as PFAS are present in both WWTP influent and effluent across the country (Lenka and others, 2021). Rice and Westerhoff (2017) evaluated the dilution factor—defined as the ratio of streamflow to treated wastewater—for the contiguous United States. Several segments of the rivers in New Mexico, including large segments of the Rio Grande, Pecos, Canadian, and San Juan Rivers, had dilution factors less than 10 and even less than the lowest classification of 2, which indicates a larger fraction of wastewater in the river.
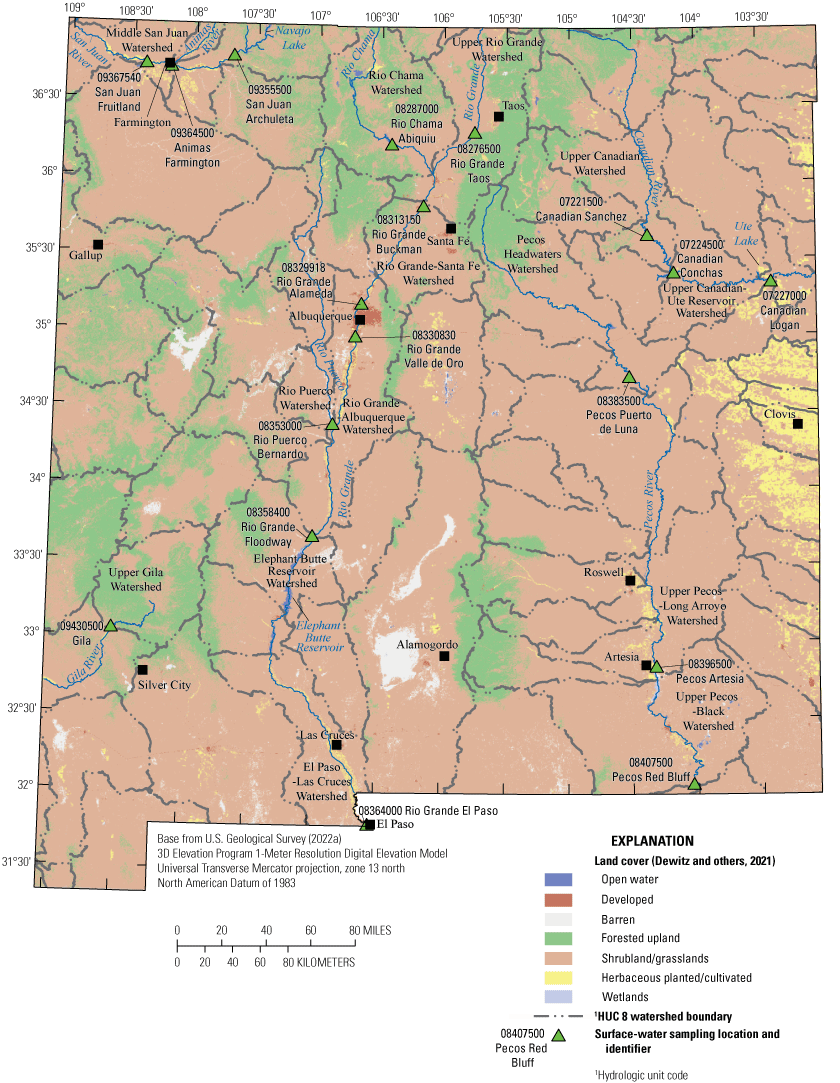
Several National Pollutant Discharge Elimination System (NPDES) permitted discharges exist within the near-site watersheds of, and upstream from, the surface-water sites (fig. 3, table 4). NPDES permits specify limits on what can be discharged to ensure that the discharge does not impair water quality or human health, and a permit can include multiple discharge locations, also known as outfalls (EPA, 2022e). San Juan Archuleta is downstream from a utility NPDES permitted discharge. A domestic NPDES permitted discharge is upstream from San Juan Fruitland. Upstream from Pecos Artesia is a WWTP. On the Rio Grande, there are several NPDES permitted discharges. Rio Grande Taos is downstream from a WWTP with an NPDES permitted discharge. Upstream from Rio Grande Buckman, there are seven Federal NPDES permitted discharges in addition to two municipal outfalls and one private domestic NPDES permitted discharge. Upstream from Rio Grande Alameda, three WWTPs have NPDES permitted discharges. Upstream from Rio Grande Valle de Oro, the State’s largest WWTP discharges into the Rio Grande. Above Rio Grande El Paso, there are two WWTPs and two utility NPDES permitted discharges. Additionally, there are multiple permitted discharges upstream from the sites beyond the near-site watershed and those types and quantities are shown in table 5. PFAS are very persistent and resistant to degradation, and permitted discharges upstream could be relevant to PFAS occurrence at a site.
National Pollutant Discharge Elimination System permitting program discharge locations across New Mexico (New Mexico Water Data, 2022).
Table 4.
National Pollutant Discharge Elimination System discharges within the near-site watershed area of study sites (New Mexico Water Data, 2022).[USGS, U.S. Geological Survey; N. Mex., New Mexico; Tex., Texas]
Table 5.
National Pollutant Discharge Elimination System discharges upstream from the study sites and if relevant, downstream from the nearest upstream site (New Mexico Water Data, 2022).[USGS, U.S. Geological Survey; N. Mex., New Mexico; Tex., Texas; R, river]
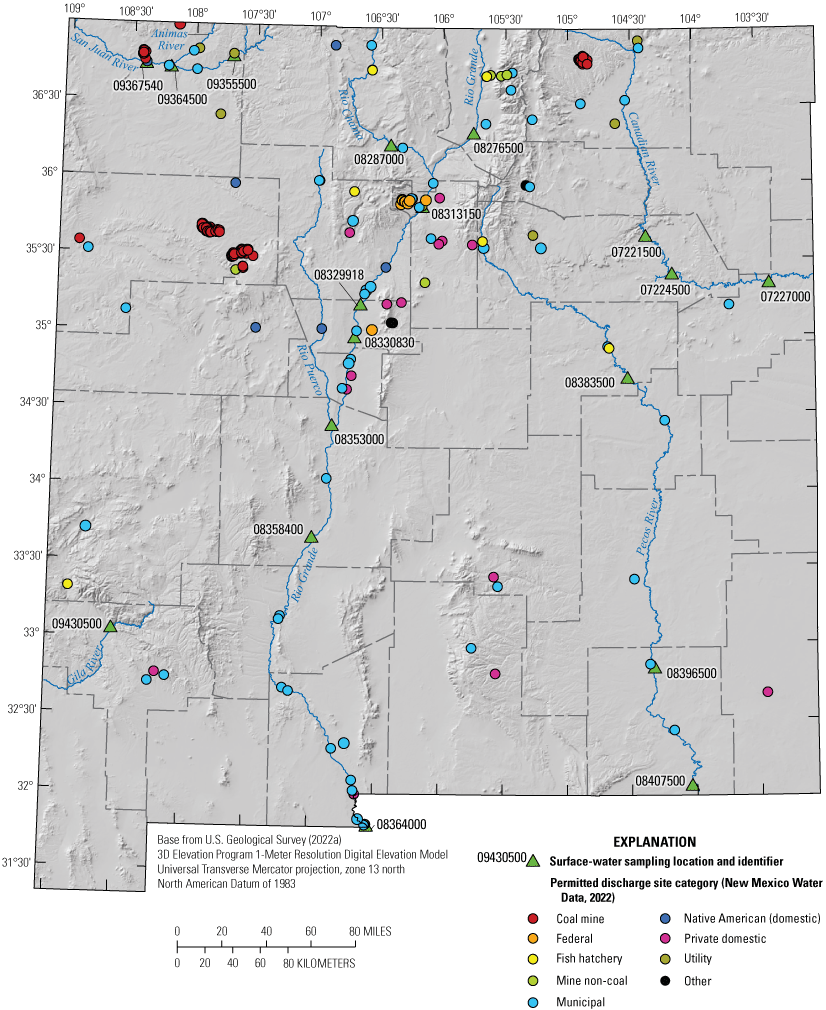
The EPA Enforcement and Compliance History Online database has compiled national PFAS datasets that can be used to evaluate PFAS in communities, including occurrence, testing, and reporting (EPA, 2022b). The datasets include PFAS manufacturers, Federal sites, facilities in industries that may be handling PFAS (for example, airports and fire training sites), NPDES discharges that are monitored for PFAS, and superfund sites with PFAS detections. From these datasets, facilities in industries that may be handling PFAS were mapped for New Mexico and selected areas of neighboring States (fig. 4). A summary of the facilities within the near-site watersheds of the surface-water sites is provided in table 6. No facilities were within 3,000 ft, which exceeds the default radius of 1,000 ft used by the NMED for wellhead protection plans (A. Jochems, NMED, written commun, 2023) of groundwater wells, springs, or diversions.
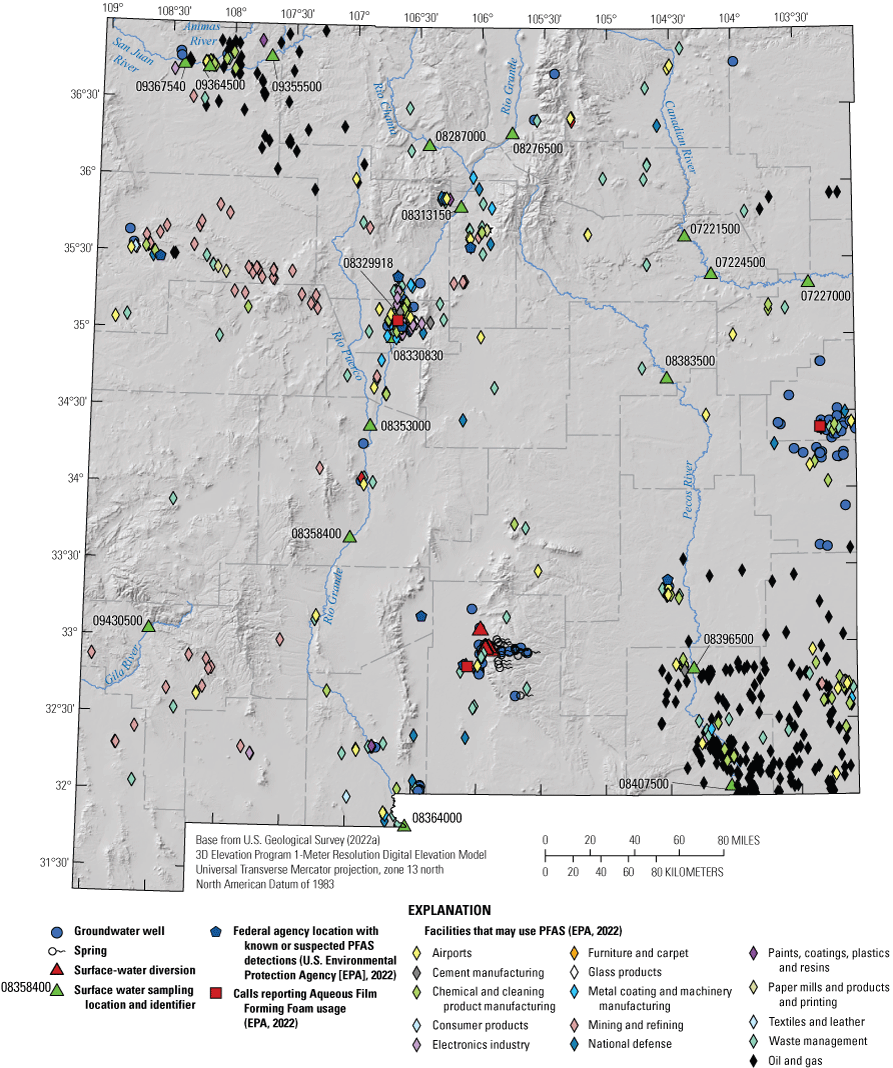
Locations of facilities that may use per- and polyfluoroalkyl substances (PFAS) across New Mexico (U.S. Environmental Protection Agency [EPA], 2022b).
Table 6.
Number and type of facilities potentially handling per- and polyfluoroalkyl substances (PFAS) within the near-site watershed of surface-water sites (U.S. Environmental Protection Agency [EPA], 2022b).[USGS, U.S. Geological Survey; N. Mex., New Mexico; Tex., Texas]
Methods
From August 2020 to October 2021, samples were collected across the State at the locations shown in figures 1 and 2. These locations were selected to cover urban, agricultural, and undeveloped areas encompassing a spectrum of anthropogenic activities. At the request of the NMED and the State legislature, this study increased focus in Curry and Otero Counties, both of which have known PFAS releases (EPA, 2022b). However, those releases were not targeted by this study. This section describes field methods for collection and analyses of water samples. Additionally, quality-control samples and data-analysis methods are discussed. Water-quality and streamflow data for sampled sites are publicly available from the USGS National Water Information System (USGS, 2022b) using the site identification numbers in tables 1 and 2. Water-quality data also are available in appendix 1, tables 1.1–1.4.
Field Methods
For most analytes, the methods described in this section for collecting groundwater and surface-water samples are documented in the USGS National Field Manual for the Collection of Water-Quality Data (USGS, variously dated). However, the USGS field manual does not currently (2022) include the methods described here for the collection of water samples for PFAS analysis because USGS standard methods have not yet been published.
Groundwater
Water samples were collected from 117 wells and 24 springs by following standard USGS protocols (USGS, variously dated) (table 1). Several sites that had detections of PFAS were resampled, and the sampling frequency at each site is indicated in table 1. Sites were resampled, when possible, if there was a PFAS detection or they were resampled to meet objectives for additional sampling in Curry and Otero Counties. Seasonal variation was not evaluated. Before water samples were collected, field properties including pH, water temperature, specific conductance, and dissolved oxygen were measured in a flow-through cell during well purging at each sampling site. All wells were pumped using dedicated pumps installed within each well by the owner, who reported discharge. Water level, casing dimensions, and pumping rate were used to calculate the purge volume and the time required to purge three casing volumes and allow field parameters to stabilize prior to sample collection. Spring discharge could not be measured because of the spring infrastructure and access. Groundwater samples were collected from a raw-water tap before any treatment by the system owner. Water samples were collected using C-flex tubing connected in line with the groundwater raw-water tap or pumped with a peristaltic pump from the spring orifice and filtered (0.45-micrometer pore size) for major cations, trace elements, alkalinity, nutrients, dissolved organic carbon (DOC), and radiocarbon. The major cations, trace element, and DOC samples were preserved to less than pH 2. Tritium, stable isotopes of water (δ18O and δ2H), and PFAS were collected as unfiltered samples directly from the raw-water tap or directly from the spring. PFAS samples were collected directly into high density polyethylene sample bottles by USGS staff who wore nitrile gloves over elbow length polyethylene gloves during sampling. Sampling at seventeen sites—sites 21, 22, 28, 29, 31–35, 38–40, 47, 49, 52, 57, and 69—only included PFAS and stable isotopes. Nonwaterproof labels were affixed to the bottles and annotated using a writing implement other than permanent marker, which was prohibited.
Surface Water
Eighteen surface-water locations were sampled across the State (table 2), as well as six surface-water diversions. The rivers were sampled during stable flow, and stormflow events were avoided. Additionally, the frequency of sampling was dependent on the location. Some surface-water sites were sampled while sampling for other projects to minimize travel time and most efficiently use available resources. Although some sites were sampled more frequently than others, seasonality could not be captured or evaluated during this study. Before water samples were collected at a river cross section, field properties including pH, water temperature, specific conductance, and dissolved oxygen were measured from five points along the cross section at the sampling location and the median value was used, with the exception of pH, which was measured in still water from the churn. Surface-water samples were collected by using equal width increment sampling or with dip sampling for average velocities less than 1.5 feet per second, following standard USGS protocols (USGS, variously dated). A polycarbonate sample bottle and polyoxymethylene nozzle were used by USGS staff to collect each PFAS surface-water sample while wearing elbow length polyethylene gloves and nitrile gloves over the polyethylene gloves. Surface-water samples from the cross section for PFAS were then composited into a polycarbonate churn (equipment was cleaned with Liquinox, tap water, 5 percent hydrochloric acid, deionized water, methanol, and PFAS-free blank water), while wearing elbow length polyethylene gloves and nitrile gloves over the polyethylene gloves. A separate sample for wastewater tracers was collected using Teflon equipment (cleaned with Liquinox, tap water, 5 percent hydrochloric acid, deionized water, methanol, and organic-free blank water) at selected surface-water sites after processing of the sample collected using the polycarbonate equipment. Water samples were collected using C-flex tubing and filtered (0.45-micrometer pore size) for major cations, trace elements, and alkalinity. The major cation, trace element, and DOC samples were preserved to less than pH 2. DOC samples were collected directly from the centroid of the surface-water cross section because the churns used for sampling had both been rinsed with methanol. DOC samples were filtered in the laboratory. Wastewater tracers were collected as raw, unfiltered samples from the Teflon churn. PFAS were collected as raw, unfiltered samples from the polycarbonate churn directly into high density polyethylene sample bottles by USGS staff wearing elbow length polyethylene gloves and nitrile gloves over the polyethylene gloves. Nonwaterproof labels were affixed to the bottles and annotated using a writing implement other than permanent marker, as recommended by guidance for minimizing PFAS contamination during sample collection (Interstate Technology Regulatory Council, 2023).
Quality-Control Sample Collection
Quality-control samples consisted of replicate and blank samples collected using the same procedures to collect the environmental samples (USGS, variously dated). Field blanks for groundwater sites and certified PFAS-free water were poured directly into the PFAS sample bottles. Field blanks for surface-water sites were collected as described in the National Field Manual (USGS, variously dated). Field blanks were collected at several different sites and processed by different field personnel. Inorganic blanks at surface-water sites were not collected because of the use of a different type of blank water (inorganic-free blank water) that would negate the PFAS-cleaning procedures. Certified inorganic-free blank water was used for major ions, trace elements, nutrients, and DOC. Certified organic-free blank water was used for wastewater tracers, and certified organic and PFAS-free water was used for PFAS. Replicates were collected using the methods outlined in the National Field Manual (USGS, variously dated), concurrently for surface water and sequentially for groundwater. Replicate locations were chosen randomly, as it was unknown whether PFAS would be present at a given site. When possible, however, replicates were added during subsequent sampling events at sites where detections were found. Quality-control sample data are provided in appendix 1, tables 1.2 and 1.4.
Analytical Methods
Twenty-eight PFAS compounds (table 7) were analyzed in both groundwater and surface-water samples at SGS North America in Orlando, Florida, using a modified EPA 537.1 method (EPA, 2018). With this method, a sample is fortified with surrogates and passed through a solid phase extraction cartridge to extract the analytes. The compounds are then extracted from the cartridge using methanol. The extract is then concentrated and adjusted to a 1-milliliter volume, and a 10-microliter volume is analyzed using liquid chromatography with tandem mass spectrometry. The analytes are separated and identified by comparing mass spectra and retention times to reference spectra and retention times of calibration standards. Analyte concentrations are determined using internal standards (EPA, 2018). This method included 11 perfluoroalkylcarboxylic acids, 7 perfluoroalkyl sulfonatic acids, 1 perfluorooctanesulfonamide, 2 perfluorooctane sulfonamidoacetic acids, 3 fluorotelomer sulfonates, and 4 next generation PFAS. The method detection level for each analyte varies with each laboratory run, which could vary if there was matrix interference, and the laboratory reported results above the laboratory detection level. The laboratory estimated concentrations that were below the reporting level (table 7) but above the detection level when the compound met criteria indicating its presence. Results below the detection level were reported as less than the reporting level.
Table 7.
Per- and polyfluoroalkyl substances analyzed by modified U.S. Environmental Protection Agency 537.1 method (EPA, 2018) and the analyte abbreviations.[Laboratory reporting levels are given in nanograms per liter]
Groundwater and Otero County Surface-Water Diversion
Water samples (including surface-water diversion samples) were analyzed for major cations, trace elements, and nutrients by the USGS National Water Quality Laboratory in Denver, Colorado. Analytical methods from the National Water Quality Laboratory included inductively coupled plasma-mass spectrometry to determine arsenic concentration (Garbarino and others, 2006). Inductively coupled plasma atomic emission spectrometry was used to analyze for cations (calcium, iron, magnesium, manganese, potassium, and sodium) (Fishman, 1993). Anions (chloride, fluoride, and sulfate) were analyzed by ion chromatography, and silicon dioxide (SiO2) was analyzed by discrete analyzer colorimetry (Fishman and Friedman, 1989). Nitrate (NO3) plus nitrite (NO2) was analyzed by colorimetry (Patton and Kryskalla, 2011).
Stable isotope ratios of oxygen (δ18O) and hydrogen (δ2H) of water were measured at the USGS Reston Stable Isotope Laboratory in Reston, Virginia. Standardization is based on international reference materials, Vienna Standard Mean Ocean Water, and Standard Light Antarctic Precipitation. Reston Stable Isotope Laboratory samples were analyzed using mass spectrometry following methods by Révész and Coplen (2008a, b). The two sigma uncertainties are 0.2 parts per thousand (per mil) for oxygen and 2 per mil for hydrogen isotopic ratios reported relative to Vienna Standard Mean Ocean Water.
The University of Miami Tritium Laboratory in Miami, Florida, measured tritium in samples using the electrolytic enrichment and gas-counting method, with a reporting limit of 0.3 picocuries per liter (pCi/L; Östlund, 1987). Carbon-14 (14C) and δ13C (normalized ratio of carbon-13 and carbon-12) were analyzed by the National Ocean Sciences Accelerator Mass Spectrometry at the Woods Hole Oceanographic Institution, Massachusetts (Stuiver and Polach, 1977). 14C was reported as absolute percent modern carbon and δ13C as per mil Vienna Pee Dee Belemnite.
Surface Water
Surface-water samples were analyzed for organic chemicals (wastewater tracer compounds) at the USGS Integrated Water Chemistry Assessment Laboratory in Boulder, Colo. DOC and aqueous inorganic chemicals (trace elements, rare earth elements, and major cations and anions) were measured by the USGS Analytical Trace Element Chemistry Common Services Laboratory in Boulder, Colo. Neutral organic wastewater tracer compounds were extracted by continuous liquid-liquid extraction and measured by gas chromatography-tandem mass spectrometry in multiple monitoring mode following methods by Barber and others (2000), with quantified compound values reported above the reporting level. Surrogate standards were added prior to extraction and workup procedures, and isotopically labeled internal standards were added to the extract immediately prior to analysis. DOC samples were analyzed by platinum catalyzed persulfate/ultraviolet light oxidation with infrared detection, and ultraviolet light absorbance at 254 nanometers was measured in a 1-centimeter quartz cell (Weishaar and others, 2003). Major anions were measured by ion chromatography with conductivity detection using a Dionex Model ICS3000 ion chromatograph with suppressed conductivity detection, an IonPac AS18 analytical column with an IonPac AG18 guard column, and a 28-millimolar (mM) potassium hydroxide mobile phase (Pfaff, 1993). Metals and major cations were measured by inductively coupled plasma-optical emission spectrometry (Garbarino and Taylor, 1979). Trace elements and rare earth elements were measured by inductively coupled plasma-mass spectrometry (Garbarino and Taylor, 1996). Individual samples were analyzed in triplicate and the reporting level was determined for each batch sample run.
Surface-Water Surrogate Standard and Internal Standard Spikes
To provide robust quality assurance for wastewater tracer analysis over the gas chromatography-tandem mass spectrometry method, different surrogate standard and internal standard compounds were used. Eight surrogate standards were spiked into the sample matrix before any extraction and workup procedures in the laboratory to provide information on how much of the compound was extracted and how much was lost by any cleanup procedures. Percentage recoveries of these surrogate standards were then used to estimate and control for matrix effects and sample workup effects on targeted wastewater tracer compounds that are chemically similar. The percent recovery observed for surrogate standard spikes added to each environmental sample are available in appendix 1, table 1.4. Additionally, a mixture of six deuterated internal standards (EPA 8270 Semivolatile Internal Standard Mix) was added to each worked-up extract immediately before injection into the gas chromatography-tandem mass spectrometer to monitor and control for injection problems or drift in instrument performance.
Data Analysis
Methods for data analysis are described below to address calculations, land cover assessment, and statistical analysis.
Total Per- and Polyfluoroalkyl Substances Concentrations
The total PFAS concentration was calculated for each site listed in this report, and any individual PFAS concentrations of the 28 compounds were reported below the laboratory reporting level, with a “<” were treated as “0” values when calculating the total PFAS concentration. Additionally, when the average PFAS concentration was plotted on figures, if there were no detections of PFAS in the whole sample, the value was considered “0” when calculating the average.
Land Cover Assessment
The surface-water sites selected for this study were located at established USGS streamgaging sites. Therefore, the sites were often not at the downstream end of a watershed, and selecting a way to evaluate surrounding land cover needed to be more specific than evaluating land cover across the entire watershed a given site was located in. The surrounding land cover at surface-water sites (table 3) was determined using the methods outlined in Medalie and others (2020), which showed that glyphosate detections were correlated to near-site watershed land use more strongly than land use within the whole watershed. A 15-kilometer buffer was created around each surface-water site and then clipped to the upstream watershed using ArcGIS Pro (Esri, 2023). The most recently available land cover data (Dewitz and others, 2021) were used to determine distribution within the buffer. The land cover in each near-site watershed was then used to evaluate associations between PFAS detections and land cover. The sites were categorized into a near-site land cover category on the basis of the percentage of developed (includes a range of developed areas mixed with grass cover with some constructed materials to areas that are composed entirely of impervious surfaces), agricultural (includes pasture, hay, and cultivated crops), and undeveloped land cover (includes forests, shrublands, grasslands, open water, wetlands, and barren land) (Dewitz and others, 2021). The categories were defined with the following criteria: (1) developed, near-site watershed contained greater than 30 percent developed land cover; (2) mixed, near-site watershed contained greater than 10 percent mixed land cover (developed plus agricultural ranged from 10 to 29.9 percent); and (3) undeveloped, near-site watershed contained greater than 90 percent undeveloped land cover (table 3). The medians of total PFAS concentration were calculated by land cover category, and total PFAS concentrations for which concentrations of the 28 compounds were not detected were treated as “0” values. Additionally, when calculating the medians, the sites were put into two groups: sites that were sampled more than five times and sites that were sampled less than five times (table 2). Land cover was not evaluated for groundwater locations because of the complex flow paths of groundwater and the difficulty of delineating relevant areas contributing recharge.
Per- and Polyfluoroalkyl Substances Flux Calculations
Instantaneous loading rates, also known as flux, for PFAS in surface water were calculated using an approach of multiplying concentration times streamflow (Meals and others, 2013),
whereK
is the unit conversion factor 2.4468×10⁻³ when calculating a daily loading flux in grams per day (g/d), which accounts for conversions of cubic feet to milliliters (1 cubic foot equals 28,316.8 milliliters), nanograms to grams (1×10⁹ nanograms equals 1 gram), and seconds to days (86,400 seconds equals 1 day);
Q
is instantaneous streamflow, in cubic feet per second; and
C
is concentration, in nanograms per liter.
Statistical Analysis
To help with interpretation of major- and trace-element concentrations, this large dataset was analyzed using Spearman’s rank-order correlation, defined as the assessment of the increasing or decreasing relationship between the rank of each data point to assess monotonic relationships in the data. Next, principal components analysis was used to determine relationships between multiple analytes. Principal components analysis is a method of reducing the number of attributes (variables) of a large dataset while preserving both statistical information (in the form of variability) and meaningful properties of the original dataset (Jolliffe and Cadima, 2016). For the principal component analysis, new uncorrelated variables were created by solving an eigenvalue/eigenvector problem using R (version 4.2.3; R Core Team, 2023) that successively maximizes variance. Eigenvectors determine the directions of the principal component feature space, and eigenvalues determine the magnitude of the eigenvectors. The eigenvectors that correspond to the largest eigenvalues (the principal components) were then plotted as arrows overlain on the principal component analysis graph to show a reconstruction of the variance of the original data to reveal important geochemical analytes that separate the sample data into different areas of the principal component analysis graph.
Nonmetric multidimensional scaling (NMDS) is an alternative to the principal components analysis biplot described above (Helsel and others, 2020), which employs distances measured between ranks of the sample data. The NMDS method reduces the complex data structure (many samples and many elements) to represent the pairwise dissimilarity between objects in a low-dimensional space (Clarke and others, 2014, p. 5–6). The “uscore” function for R (version 4.2.3; R Core Team, 2023) from Helsel (2016) was used to compute Uscores of the data, utilizing default values to calculate the ranks of the scores (Helsel, 2012, 2016). Uscores are defined as the ranks of the sample data with lowest values having the lowest numerical rank. NMDS was performed on the uscores to compare dissimilarities within the dataset using metaMDS from the vegan package in R (Oksanen and others, 2016), utilizing Euclidean distance, where zerodist = “add” and autotransform = “false” (Helsel, 2012). Euclidean distance refers to the length of line segment between two points calculated using the Pythagorean theorem. NMDS stress values are calculated with the “metaMDS” function and reflect how well the ordination summarizes the observed distances among the samples. Values less than or equal to (≤) 0.1 are considered fair with good ordination and no real prospect of misleading interpretation; values ≤0.05 indicate good fit, and values greater than or equal to (≥) 0.2 are deemed suspect (Clarke and others, 2014, p. 5–6).
A cluster analysis was used to identify similar groups of samples by evaluating minimum differences within groups and maximum differences among groups using the “hclust” function with Euclidian distance matrix for the elements used in the NMDS analysis. A cluster analysis is defined as an analysis to assess which data points are more similar to each other, thus belonging to a group, than they are to data points in a separate group. The Calinski criterion (a measure of the variance between clusters) was applied with the “cascadeKM” function of the vegan package in R (Oksanen and others, 2016) to determine the number of clusters that maximizes the difference between clusters while minimizing the differences within clusters. The analytes used in the NMDS analysis were evaluated for correlation by calculating Kendall’s tau (a measure of the relationships between ranked data) using the “cenken” function from the NADA package in R (Lee, 2017).
Interpretation of Age Tracers
Age tracers are isotopes of elements associated with water that provide information on the timing for the recharge water to enter the subsurface then undergo subsequent decay, mixing, and water-rock interactions that provide an indication of the length of time the water has been in the subsurface (also referred to as the “age” of the water). 14C values, reported by National Ocean Sciences Accelerator Mass Spectrometry as absolute percent modern carbon, were denormalized using equation 5 of Plummer and others (2012) to percent modern carbon (pmc). This study did not have enough groundwater samples along a flow path from recharge to sampling location to perform detailed geochemical modeling, so NetpathXL (a spreadsheet interface to program Netpath) was used to compute corrected groundwater ages using model 11 “Revised F&G solid ex” (Parkhurst and Charlton, 2008; Han and Plummer, 2013). Groundwater age was computed using 14C values of 0 pmc for carbonate rock and 100 pmc for soil CO2, assuming δ13C values of 0 per mil for carbonate and −11.5 and −21.4 per mil for soil CO2 (Plummer and others, 2012).
The concentration of tritium in precipitation varies spatially, and in the contiguous United States, the concentration is generally lowest in the southwest region including New Mexico (Michel and others, 2018). Categorical classification groups for groundwater age were determined for the sites sampled for this study by using the measured tritium and the tritium precipitation data from Michel and others (2018) and the methods described in Lindsey and others (2019).
Normalization of Rare Earth Elements
Rare earth elements (REEs) typically follow a pattern of concentration change between elements, but some artificial processes can cause some of the REEs to be greater or less than what they would be in the natural pattern, and these differences are considered to be anomalous when the magnitude of the variation is high. Since the studies of Bau and Dulski (1996) and Bau and others (2006), a positive gadolinium (Gd) anomaly, which is related to the use of Gd-based contrast agents in magnetic resonance imaging (MRI), is now considered worldwide to be a distinctive signature of water inputs from wastewater treatment plants in areas with MRI facilities. For this study, aqueous concentrations of REEs were normalized to the North American shale composite (Gromet and others, 1984; Piper and Bau, 2013). Background concentrations of Gd (Gdbackground) from geogenic sources were interpolated from a third order polynomial regression fitted to the REE distribution from lanthanum (La) through ytterbium (Yb) at each site. The background concentrations were compared with the sample concentrations to identify samples with a Gd anomaly, which is ratio of the sample Gd to the background Gd greater than 1.
Quality-Control Data Interpretation
Quality-control samples consisted of replicate and blank samples collected using the same procedures as the environmental samples (USGS, variously dated). Laboratory quality-control samples were also analyzed with the PFAS environmental samples and were within acceptable limits for data presented in this report. There were no laboratory blank detections, and spike recoveries and duplicate comparisons were within acceptable ranges for EPA Method 537 and 537.1 modified PFAS analytical methods (data not shown).
Groundwater and Surface-Water Blanks
Twenty-three groundwater field blanks were performed for groundwater sampling, including 8 inorganic field blanks and 15 PFAS field blanks. The constituents detected in inorganic groundwater field blank samples are in table 8. A suggested concentration of influence for contamination was calculated by multiplying the maximum blank concentration by 10. The percentage of environmental samples with concentrations below this threshold represents the portion of samples for which concentrations may represent at least a 10-percent contribution from contamination bias. The samples below this threshold are, therefore, most likely to be impacted by high bias resulting from contamination sources in the field or laboratory.
Table 8.
Blank sample data for major ions and trace elements in groundwater samples.[<, less than; mg/L, milligram per liter; µg/L, microgram per liter]
Nineteen surface-water field blanks were collected, including 12 PFAS field blanks, and 4 wastewater tracer and DOC field blanks (table 9). Only one PFAS field blank had a detection. PFOS was detected below the reporting level but above the detection level at 1.1 ng/L at Rio Grande El Paso on August 25, 2020. Major ion and trace element blanks were not collected because the inorganic blank water is not certified as being free of PFAS, rendering it incompatible with passing through the sampling equipment prior to collecting PFAS samples. No DOC was detected in the surface-water blanks.
Table 9.
Blank sample data for wastewater tracers in surface water.[Dates are shown as month, day, year. Times shown in 24-hour format. Values are reported in micrograms per liter. env, environmental sample; blank, blank sample; <, less than; NA, not available]
Five wastewater tracer compounds were present above the method detection level in the field blanks (4-t-OP2EO, 4-t-OP3EO, 5-methyl-1H-benzotriazole, 2,6-di-tert-butyl-1,4-benzoquinone, and cholesterol) (table 9). The aforementioned compounds were also present in the corresponding lab blank, with the exception of 5-methyl-1H-benzotriazole. Thus, study reporting levels (SRLs) were established for these five compounds: 4-t-OP2EO (SRL of 0.176 microgram per liter [µg/L]), 4-t-OP3EO (SRL of 0.191 µg/L), cholesterol (SRL of 1.36 µg/L), 2,6-di-tert-butyl-1,4-benzoquinone (SRL of 4.58 µg/L), and 5-methyl-1H-benzotriazole (SRL of 0.398 µg/L), with the new SRL raised to be equal to two times the highest concentration found in blank samples. Only cholesterol (Rio Chama Abiquiu, February 22, 2021, and Pecos Artesia, June 10, 2021), 2,6-di-tert-butyl-1,4-benzoquinone (Pecos Artesia, June 21, 2020), and 5-methyl-1H-benzotriazole (Rio Chama Abiquiu, August 13, 2020) had environmental sample values greater than the SRL.
Groundwater Replicates
Eighteen replicates of the full analytical suite, including major ions, trace elements, nutrients, DOC, stable isotopes, groundwater age dating (reduced to 11 14C and 17 tritium samples), and PFAS, were collected for this study. Four additional replicates included only PFAS, and one replicate had both stable isotopes and PFAS.
Variability in analyte concentration was calculated for replicate pairs using the bias-corrected log-log regression model (Mueller and others, 2015), which is based on the approximately linear relation of logarithms of standard deviation and mean concentration of replicate pairs. This linear relation can be expressed as
wherelogSD
is the logarithm of replicate standard deviation;
B0
is the intercept of the regression line, estimated by least squares;
B1
is the slope of the regression line, estimated by least squares; and
logC
is the logarithm of mean replicate concentration.
Standard deviation residuals from equation 2 are then transformed back to their original units. The mean of the transformed standard deviation residuals is the bias-correction factor, which is multiplied by the estimated standard deviations of the replicates for each analyte to express the modeled standard deviation (SDM):
Equations of variability in concentration for analytes with 10 or more replicate pairs having detections are shown in table 10. Some analytes had a majority of values that were censored, and their variability could not be quantified.
Table 10.
Summary of data and results for replicate groundwater samples used in estimating variability in concentration.[The variability equation solution gives the modeled standard deviation value based on equation 3. Replicate pairs with at least one sample having a result less than the laboratory detection level were not included in the calculation of variability equations. mg/L, milligram per liter; C, mean replicate concentration; ^, 10 raised to the power of the value in the bracket equation following the symbol; µg/L, microgram per liter]
A confidence interval indicating the uncertainty for a measured concentration can be calculated with the following equation (Mueller and others, 2015):
whereCL, CU
are the lower and upper limits of concentration for the 100(1–α/2)-percent confidence interval;
Z
is the percentage point of the standard normal curve that contains an area of 100(1–α/2) percent;
α
is the probability that the confidence interval does not include the true concentration; and
SD
is the standard deviation of the measured concentration, independently estimated from replicate variability, as determined for this study using the bias-corrected log-log regression model described above.
PFAS concentrations were below the laboratory detection level for the majority of 22 replicate pairs collected. Six samples had detections for a selected group of PFAS in both replicate samples (table 11). Because there were few replicate pairs, relative percent difference (RPD) was used to evaluate the replicate pairs (Mueller and others, 2015). RPD is calculated using the following equation:
The RPDs for replicate pairs for PFAS in groundwater are shown in table 11 and did not exceed 20.7 percent, which was determined to be acceptable for this study.Table 11.
Replicate pairs with per- and polyfluoroalkyl substances detections and associated variability in groundwater samples.[Dates shown as month, day, year. Time shown in 24-hour format. Values are reported in nanograms per liter. Values in italics represent estimated concentrations greater than the laboratory detection level and less than the laboratory reporting level in effect at the time of sample analysis. Env, environmental sample; Rep, replicate sample; RPD, relative percent difference; NC, not calculated]
Surface-Water Replicates
The variability for some PFAS concentrations was higher in four surface-water replicates compared with groundwater replicates, which may reflect higher variability in the surface-water matrix than in groundwater. PFAS values were all less than the detection level for one other surface-water replicate (appendix 1, table 1.4) and variability was not able to be quantified. PFBS, perfluorodecanoic acid (PFDA), PFOS, and PFPeA were found to have RPDs greater than 20 percent in at least one replicate pair (table 12). Three of these replicate pairs with high variability had concentrations below the laboratory reporting level and above the laboratory detection level, which are known to be associated with higher analytical variability. However, given that two of four of these pairs with high variability are between results that were below the reporting level, they are actually consistent in both reporting below the reporting level. This replicate variability indicates that for surface-water sampling, low level detections have higher variability, and the higher level detections have less variability.
Table 12.
Replicate sample data and associated variability in concentration for per- and polyfluoroalkyl substances in surface-water samples for replicates with quantified values of per- and polyfluoroalkyl substances.[Dates shown as month, day, year. Time shown in 24-hour format. Values are reported in nanograms per liter. Values in italics represent estimated concentrations greater than the laboratory detection level and less than the laboratory reporting level in effect at the time of sample analysis. Env, environmental sample; Rep, replicate sample; RPD, relative percent difference; NC, not calculated; --, below the laboratory detection level; <, less than]
Four surface-water replicate samples were collected for wastewater tracers and three of these also included DOC, trace elements, and REEs (tables 13 and 14). Cholesterol, coprostanol, 2,6-di-tert-butyl-1,4-benzoquinone, and 5-methyl-1H-benzotriazole all had RPDs of greater than 20 percent in at least one replicate pair (table 13). The RPDs for concentrations of wastewater tracer compounds in replicate samples ranged from 2.6 to 25.6 percent for all compounds, except for 5-methyl-1H-benzotriazole (37.2 percent) and 2,6-di-tert-butyl-1,4-benzoquinone (46.7–162.7 percent, with an average RPD of 108 percent). These high variabilities between replicate results were not observed at concentrations near the reporting level, below which values are more highly variable, except for coprostanol, whose reporting level was 0.10 µg/L. Concentrations measured for 2,6-di-tert-butyl-1,4-benzoquinone are qualified as being estimated values with high uncertainty because of this high variability observed in replicate samples and the occurrence in blank samples. Additionally, although high RPDs were observed for 5-methyl-1H-benzotriazole and 2,6-di-tert-butyl-1,4-benzoquinone, these compounds were not reported in the environmental samples after censoring with the SRL.
Table 13.
Replicate sample data and associated variability in concentration for wastewater tracers in surface-water samples.[Dates shown as month, day, year. Time shown in 24-hour format. Values are reported in micrograms per liter. Env, environmental sample; Rep, replicate sample; RPD, relative percent difference; <, less than; NC, not calculated]
Table 14.
Replicate sample data and associated variability in concentration for trace elements, rare earth elements, and dissolved organic carbon in surface-water samples.[Dates shown as month, day, year. Time shown in 24-hour format. Env, environmental sample; Rep, replicate sample; RPD, relative percent difference; µg/L, microgram per liter; <, less than; NC, not calculated; mg/L, milligram per liter; NA, not available]
Trace element RPDs are reported in table 14 and ranged from less than 1.0 to 88.5 percent and most detections were less than 1.0 µg/L. For elements that had higher concentrations (in the tens to hundreds, such as barium, boron, bromine, calcium, lithium, magnesium, sodium, strontium, sulfur, uranium, and vanadium), RPDs were largely less than 20 percent, except for aluminum, boron, iron, and silica which had RPDs exceeding 20 percent for at least one replicate. The RPD for DOC replicates was 1.4 and 13.3 percent.
Surface-Water Surrogate Recovery
Surrogates are artificial compounds similar to target analytes added to a sample prior to analysis to assess how much of the compound is detected versus what was added to understand the performance of the method. Surrogate performance was associated with wastewater tracer analysis for each sample. Surrogate recoveries for wastewater tracer analysis are generally considered to be acceptable, as determined by the analytical laboratory (Furlong and others, 2008), if within 30–150 percent. Table 15 and table 1.3 in appendix 1 list the surrogate recovery performance for surface-water environmental samples. Some samples had low surrogate recovery values, especially for compounds associated with d21 2,6-di-tert-butyl-4-methylphenol surrogate, and only one sample from Pecos Artesia from September 2020 had a surrogate recovery greater than 150 percent (table 15). Wastewater tracer results may underrepresent true concentrations for samples with low surrogate recovery performance.
Table 15.
Surrogate recovery data associated with wastewater tracer data from surface-water sample collected at Pecos Artesia in September 2020.[%, percent]
Aqueous Chemistry
Groundwater and surface-water chemistry are discussed separately given the differences in analytes and in the sources and evolutionary paths of the water.
Groundwater
This discussion of groundwater chemistry, including samples from springs, addresses PFAS results first, followed by results for general chemistry, major ions and trace elements, dissolved organic carbon, nutrients, stable isotopes, and groundwater age tracers (all results are provided in appendix 1, table 1.1, and in U.S. Geological Survey [2022b]). The public water supply systems from across New Mexico that are represented in this dataset include systems located in large urban areas, as well as systems in rural and agricultural areas. Focused sampling occurred in Curry and Otero Counties, where almost all public water supply sources were sampled.
Per- and Polyfluoroalkyl Substances
The majority of the groundwater samples from 141 groundwater sampling sites in this study did not have any detections of PFAS (fig. 5); that is, concentrations were reported by the laboratory as being below the laboratory detection level. Twenty-seven sites had PFAS detected at one or more sampling events. Fourteen sites only had one PFAS present above the laboratory detection level (table 16), 7 sites had two PFAS detected, and 7 other sites had more than two PFAS detected. Some sites were resampled if PFAS were detected. If a site was resampled, a “.1” was added to the report identification number to indicate the first sampling event and a “.2” for the second sampling event, and so on (table 16). Total PFAS concentrations ranged from 0.91 (site 136) to 80.3 ng/L (site 44, second sampling). The most frequently detected PFAS at groundwater sites were PFBS (11 sites), PFPeA (10 sites), and PFHxA (9 sites). The High Plains aquifer had a higher sample density compared to other aquifers in the study, representing 51 of the total groundwater sites, and had detections at 13 of the sites.
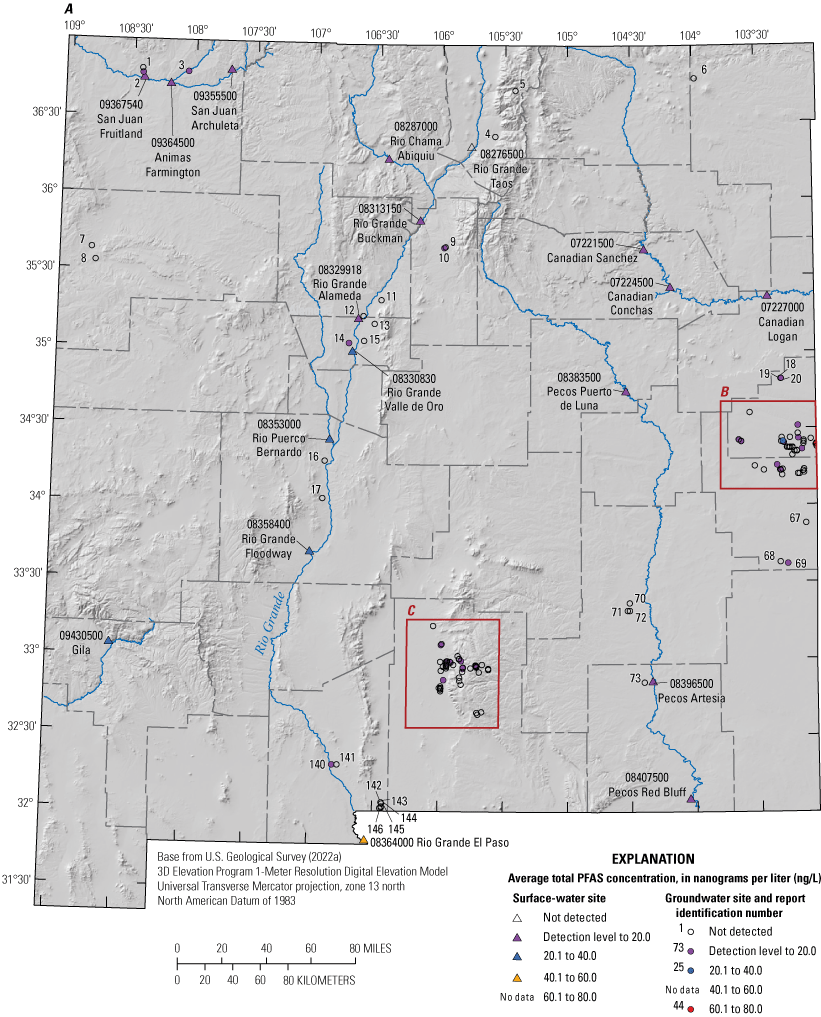
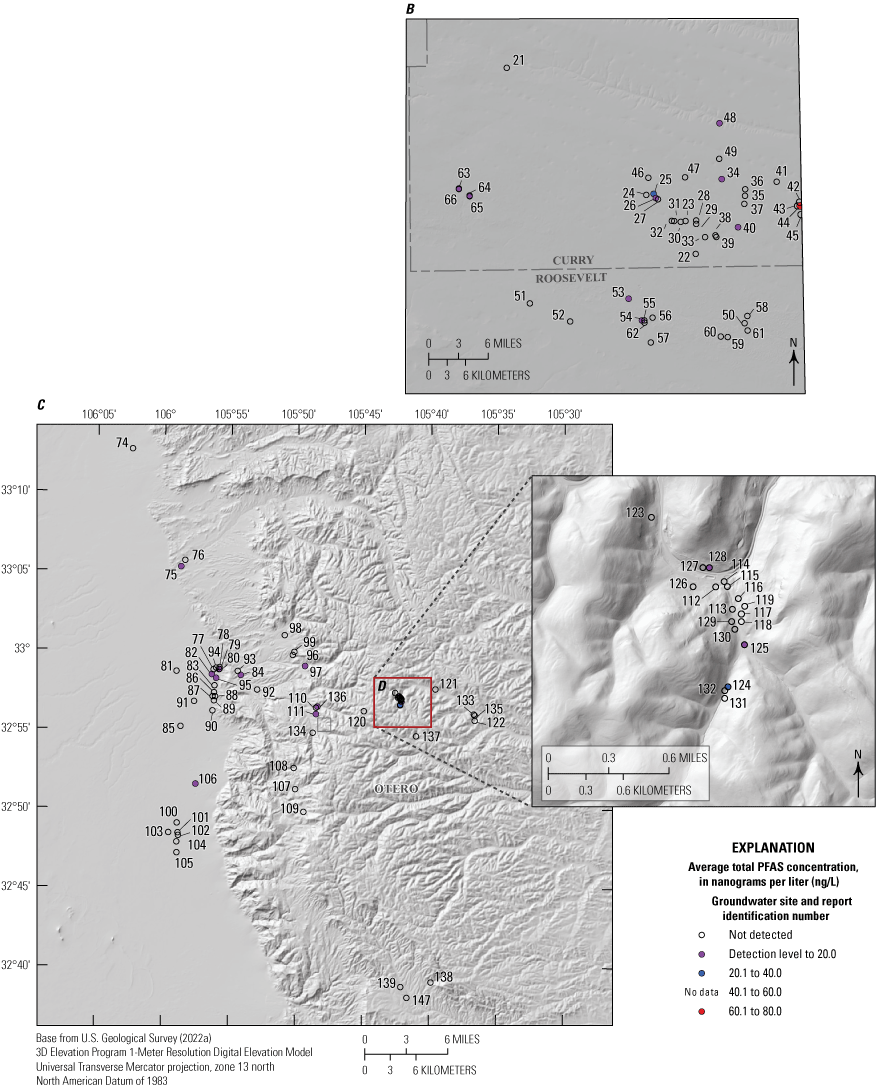
Average total per- and polyfluoroalkyl substance (PFAS) concentrations from groundwater and surface-water sampling locations across New Mexico with A, a large-scale map of parts of Curry and Roosevelt Counties, B, a large-scale map of part of Otero County, and C, a large-scale map of a high-mountain system in Otero County.
Table 16.
Per- and polyfluoroalkyl substance concentrations from groundwater samples with concentrations above the laboratory detection level, including repeat sampling after detection.[Values are reported in nanograms per liter. Values in italics represent estimated concentrations greater than the laboratory detection level and less than the laboratory reporting level in effect at the time of sample analysis. --, below the laboratory detection level]
Some sites were sampled more than once over the course of the study. Generally, any detected PFAS and reported concentrations were similar over time at a given site. The signature of the PFAS detected (PFBA, PFPeA, PFHxA, and PFBS) was consistent over time for site 44 (figs. 1 and 5), which was sampled three times between December 2020 and June 2021 (fig. 6A). Variability in the PFAS concentrations over time was within the 12-percent variability from replicate samples in this study. Site 18 had two compounds—PFPeA and PFHxA—detected during each of three sampling events between September 2020 and October 2021 (fig. 6B). Three separate sites in a similar geographic area within Curry County—sites 25, 26, and 64—had multiple PFAS detected, with PFBS and perfluorohexanesulfonic acid (PFHxS) present at all three and perfluorobutanoic acid (PFBA), PFPeA, PFHxA, perfluoropentanesulfonic acid (PFPeS), and PFOS present at one or more of the sites in January and October 2021 (fig. 6C,D).
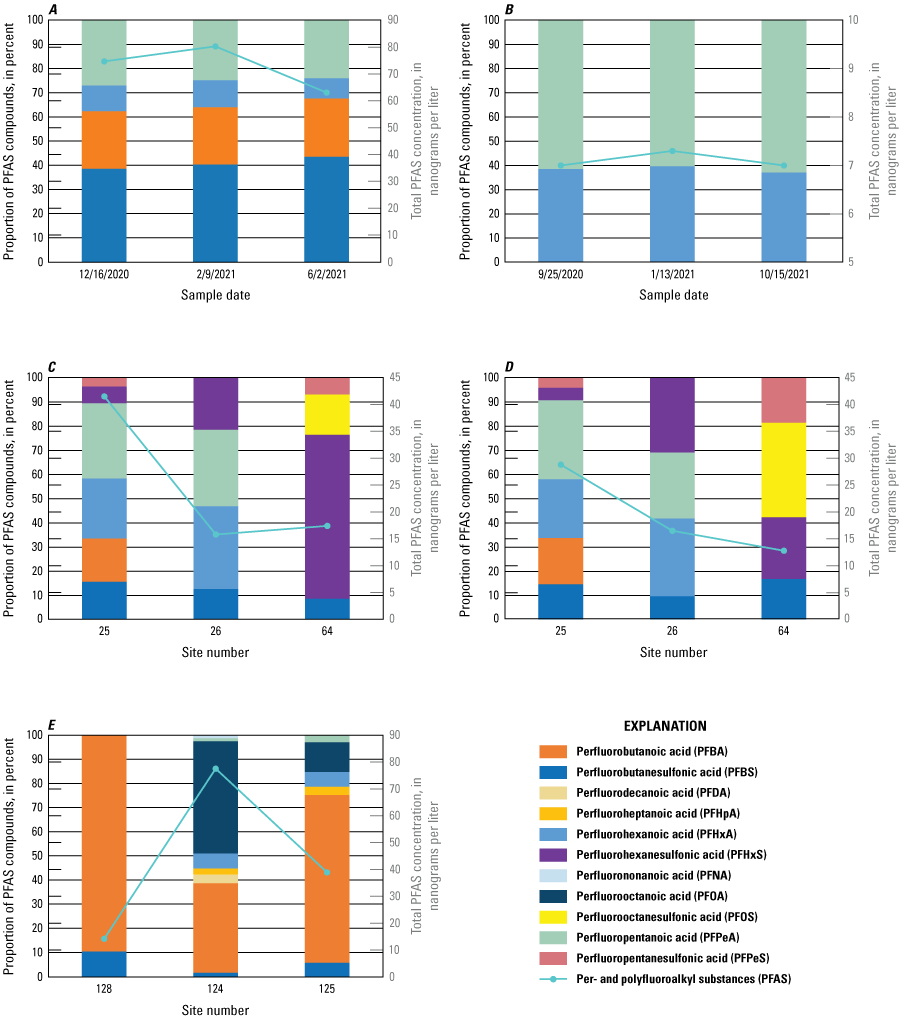
For per- and polyfluoroalkyl substances (PFAS) with detectable concentrations, total concentrations and proportions of total concentrations contributed by individual PFAS for A, three groundwater samples collected from site 44 in Curry County between December 2020 and June 2021; B, three groundwater samples collected from site 18 in Curry County between September 2020 and October 2021; C, groundwater samples collected from sites 25, 26, and 64 in Curry County during January 2021; D, groundwater samples collected from sites 25, 26, and 64 in Curry County during October 2021; and E, samples collected from springs at sites 124, 125, and 128 in Otero County during April 2021.
Three springs in a similar geographic area of Otero County—sites 124, 125, and 128 (figs. 1D and 5D, table 16)—were sampled in April 2021 and had similar concentrations of PFBA and PFBS (fig. 6E). Two of the springs also had detections of PFHxA, PFPeA, perfluoroheptanoic acid (PFHpA), and PFOA. In addition, spring 124 had detections of perfluorononanoic acid (PFNA) and PFDA (fig. 6E). These three springs were resampled in October 2021 and no PFAS detections were reported by the laboratory for these later samples, despite laboratory detection levels being similar during both time periods. The flow at the sites was greater during the October 2021 sampling, which could reflect contributions of discharge from different groundwater flow paths during this time and (or) dilution of any PFAS that were present at concentrations below laboratory detection levels.
Field Properties
The field properties water temperature, pH, specific conductance, and dissolved oxygen concentration were measured onsite prior to collection of water-quality samples. Groundwater temperature ranged from 5.0 to 32.9 degrees Celsius (°C) and varied on the basis of the location and depth of the groundwater sampled. Field pH values were circumneutral and ranged from 6.7 to 8.8. Specific conductance ranged from 274 to 52,700 microsiemens per centimeter at 25 degrees Celsius (µS/cm at 25 °C). The majority of samples had dissolved-oxygen concentrations greater than 3 milligrams per liter (mg/L), with some sites having concentrations less than 0.5 mg/L, suggesting suboxic or anoxic conditions (sites 7, 8, 12, 15, 16, 140, and 141) (Jurgens and others, 2009).
Water-Quality Standards
Water-chemistry results were compared with EPA maximum contaminant levels (MCL), secondary maximum contaminant levels (SMCL), and health advisories (EPA, 2022a, 2023) (table 17). In 2016, the EPA established a health advisory limit of 70 ng/L for PFOA and PFOS (EPA, 2022a), and after this study was completed, in June 2022, the EPA issued draft health advisory limits for PFOA and PFOS to 0.004 and 0.02 ng/L, respectively. The draft health advisory also set limits of GenX to 10 ng/L and PFBS to 2,000 ng/L (EPA, 2022a). No groundwater sites exceeded the 2016 health advisory limit. The 2022 draft health advisory limits for PFOS and PFOA are below the analytical method detection level (EPA, 2018). A total of seven sites had samples that exceeded an MCL. Two sites (51 and 53) exceeded the MCL for nitrate as nitrogen (10 mg/L), with the maximum concentration being 23.9 mg/L at site 53. The arsenic MCL (10 µg/L) was exceeded at four sites (13, 14, 15, and 17), with the maximum concentration being 41.7 µg/L at site 13. The uranium MCL (30 µg/L) was exceeded at two sites (2 and 53), with the maximum concentration being 214 µg/L at site 2.
Table 17.
U.S. Environmental Protection Agency water-quality standards for drinking water (from EPA, 2023).[MCL, maximum contaminant level; SMCL, secondary maximum contaminant level; µg/L, microgram per liter; NA, not applicable; mg/L, milligram per liter]
Among SMCLs, the total dissolved solids (TDS) SMCL (500 mg/L, defined by the EPA as being for TDS) was exceeded at 59 sites, with the maximum value of dissolved solids (dried at 180 °C) being 58,100 mg/L at site 2. Sulfate had the second most SMCL (250 mg/L) exceedances (41 sites), with a maximum concentration of 33,800 mg/L at site 2. The chloride SMCL of 250 mg/L was exceeded at 24 sites, with a maximum chloride concentration of 5,730 at site 2. No sites exceeded the MCL (4 mg/L) for fluoride; however, 20 sites exceeded the SMCL (2 mg/L), with a maximum fluoride concentration of 2.97 mg/L at site 43. The iron and manganese SMCLs (300 and 50 µg/L, respectively) were exceeded at three and four sites, respectively, with maximum concentrations of iron (1,010 µg/L) and manganese (459 µg/L) at site 12. The SMCL for pH is a range from 6.5 to 8.5, and pH exceeded 8.5 at four sites (7, 8, 14, and 42), with a maximum value of 8.8 at site 7.
Major Ions
Major ions such as calcium, magnesium, sodium, potassium, chloride, sulfate, and bicarbonate dissolve into water as a result of water-rock interactions and also enter into the groundwater through recharge. Major-ion proportions can be represented by a Piper diagram that shows the relative proportions of cations and anions, with sample locations within the plotting regions indicating the dominant ion types (Hem, 1992). Water type can be assessed from the Piper diagram first by the location of the water sample on the lower triangles, where if a sample plots above 60 percent of a given ion on the triangle sides, then it would be predominantly that ion water type, and if it plots lower than 60 percent for any of the ions it is considered a mixture of water types. The left triangle represents positively charged cations and the right triangle represents negatively charged anions. The large central diamond shows the water samples projected up from their respective locations on the triangles to combine the cation and anion water types. Water type varies throughout the State (fig. 7) and is driven primarily by the rock types and associated minerals present along groundwater flow paths. Therefore, water type tends to be relatively consistent within local geographic areas with the same underlying geology, although water type can evolve along a flow path. Figure 7A includes sites located across New Mexico, except in Curry, Roosevelt, or Otero County (fig. 7B, C); sites in figure 7A are discussed next, mostly in order from north to south.
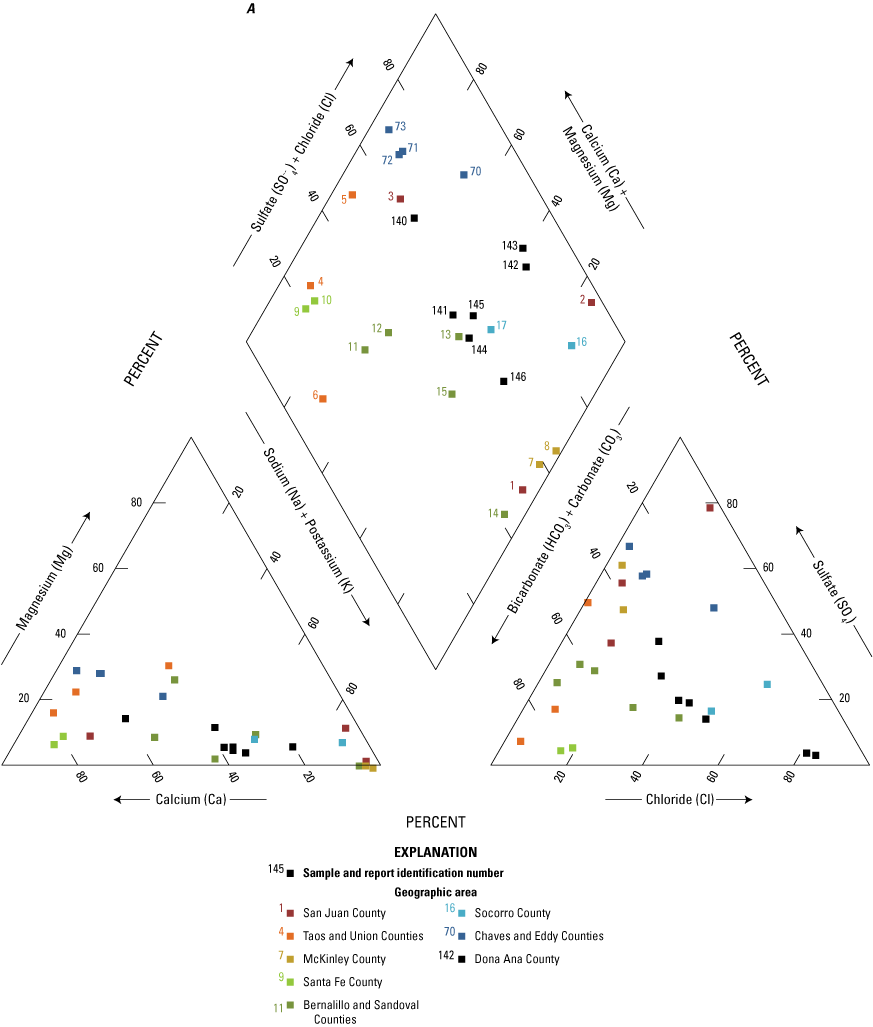
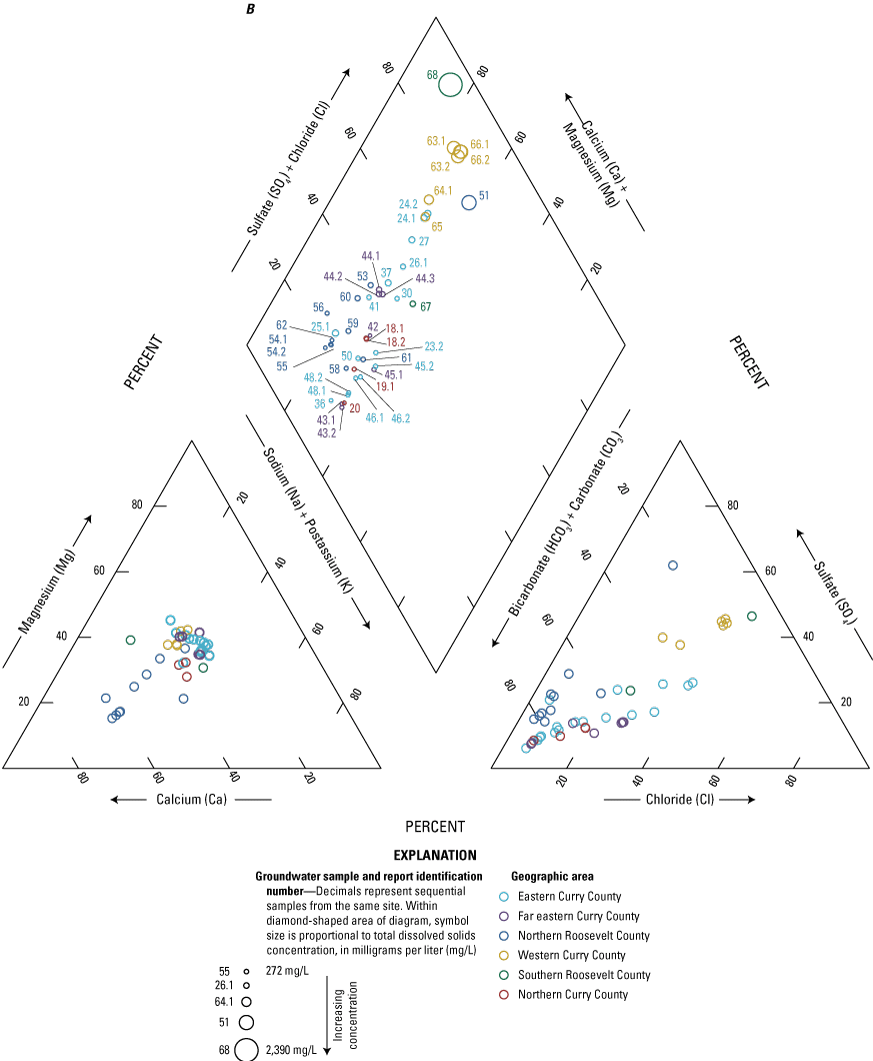
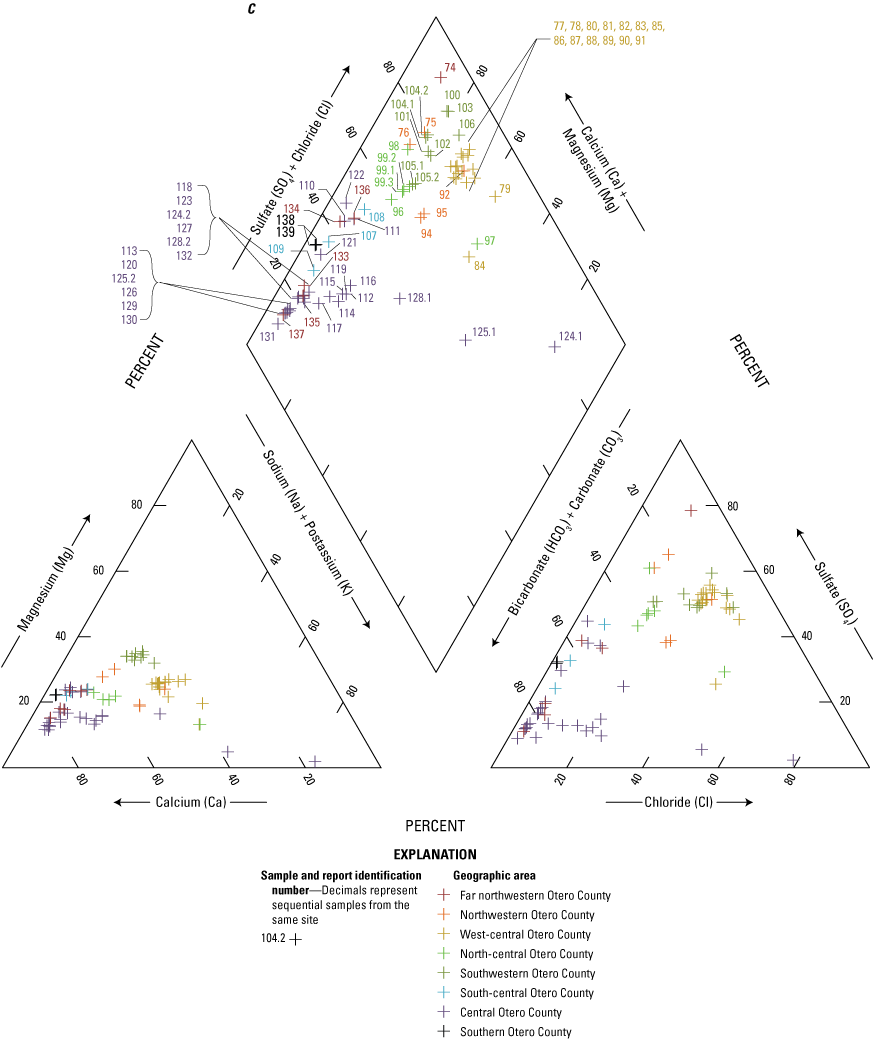
Piper diagrams showing the major-ion proportions of groundwaters and springs collected across A, New Mexico, B, Curry and Roosevelt Counties, and C, Otero County.
Drinking water in San Juan County is primarily sourced from surface water, so only one public supply well was available to be sampled and two observation wells in the County were also sampled. Sites 1 and 2 are located near a coal deposit and had sodium as the dominant cation; sulfate was the dominant anion for site 2, whereas the anions at site 1 were dominated by a mixture of bicarbonate and sulfate. Site 3 is located near the Animas River and had calcium-bicarbonate-sulfate type water. Groundwater sites 4 and 5 in Taos County had calcium as the dominant cation; site 4 had bicarbonate as the dominant anion, whereas site 5 had a mixture of bicarbonate and sulfate anions. Site 6 in Union County is screened in a young volcanic aquifer and had mixed cation and bicarbonate type water. Two sites in McKinley County (7 and 8) had sodium-bicarbonate-sulfate water, which is likely to represent old water that has undergone cation exchange (Beisner and Jones, 2020).
Groundwater from counties near central New Mexico (Bernalillo, Sandoval, and Santa Fe) generally had calcium and bicarbonate as dominant ions, but with some anomalies. Two sites (9 and 10) in Santa Fe County had calcium-bicarbonate type water. Sites 11 and 12 in Sandoval County had calcium-sodium-bicarbonate type waters. Sites 13, 14, and 15 in Bernalillo County had a mixture of calcium and sodium as the dominant cations and have bicarbonate as the dominant anion, with some chloride influence. Plummer and others (2012) found that groundwater in the Albuquerque area was generally sodium-bicarbonate type west of the Rio Grande and calcium-bicarbonate type east of the Rio Grande, with a narrow north-south trend of mixed-ion water type that may be related to faults parallel to the mountain front in the vicinity of site 13 in this study. South of the aforementioned Counties, two sites (16 and 17) in Socorro County had sodium-chloride type water and may represent interaction with deep basin groundwater or geothermal fluids (Anderholm, 1987). Sites 70–73 in Chaves and Eddy Counties had generally similar calcium-sulfate water types, although site 70 had more influence from sodium and chloride.
In Doña Ana County, site 140 had calcium-mixed anion water type, and site 141 had a higher proportion of sodium. Site 141 had results more similar to other groundwater sampled farther south in Doña Ana County at sites 144, 145, and 146 (with a higher proportion of sodium). Sites 142 and 143 in Doña Ana County had sodium-chloride type waters.
Groundwater sampling sites provide dense spatial coverage of parts of Curry and Roosevelt Counties in the High Plains aquifer and of Otero County in south-central New Mexico. Water samples were placed into groups on the basis of their geographic location within each county, which for Curry and Roosevelt Counties were divided up into even north and south, then east and west halves and sometimes given a designation of far (cardinal direction) for areas with high sample density. For Otero County, similar geographic areas were designated with additional subareas including central areas within the cardinal direction designations for areas with high sample density. Water types for samples collected in Curry and Roosevelt Counties ranged from calcium-bicarbonate to mixed cation-mixed anion, with one sample categorized as mixed cation-sulfate type (fig. 7B). Analytical results for samples collected in Curry and Roosevelt Counties by Langman and Ellis (2010a, b) suggest groundwater from the Ogallala Formation of the High Plains aquifer typically was a mixed cation-bicarbonate type, with groundwater present in the center of paleochannels having a higher proportion of bicarbonate and upland samples having a higher proportion of sulfate. The Dockum Group underlies the Ogallala Formation and generally had a sodium-chloride type water (Langman and Ellis, 2010a, b); however, groundwater from the Dockum Group was not sampled in this study, and there were no sodium-chloride type waters from samples in Curry and Roosevelt Counties in this study. Groundwater with higher TDS had a higher proportion of sulfate, with site 68 having the highest value (fig. 7B). Site 68 is located at the southern end of Roosevelt County and may represent an upland or other distinct water source compared with the other samples collected in Curry and Roosevelt Counties for this study (fig. 1).
Groundwater samples were collected from sites in the Sacramento Mountains on the east side of Otero County, as well as within the basin-fill sediments west of the mountain block (fig. 1). Generally, samples from the mountain-block area were collected from springs or shallow wells completed in bedrock and had a calcium-bicarbonate water type (fig. 8A). Samples collected from the mountain block had lower TDS (598 mg/L average) compared with wells screened in the basin-fill sediments west of the mountain block, which had generally higher TDS (1,552 mg/L average) and were more of a mixed cation-sulfate to mixed cation-mixed anion water type. There was one brackish water well in the northern area of Otero County (site 74) that had calcium-sulfate type water. The dominant geologic units of the Sacramento Mountains are the Permian San Andres Limestone (primarily limestone with some dolomite) and the Yeso Formation (sandstone, limestone, dolomite, and gypsum units).
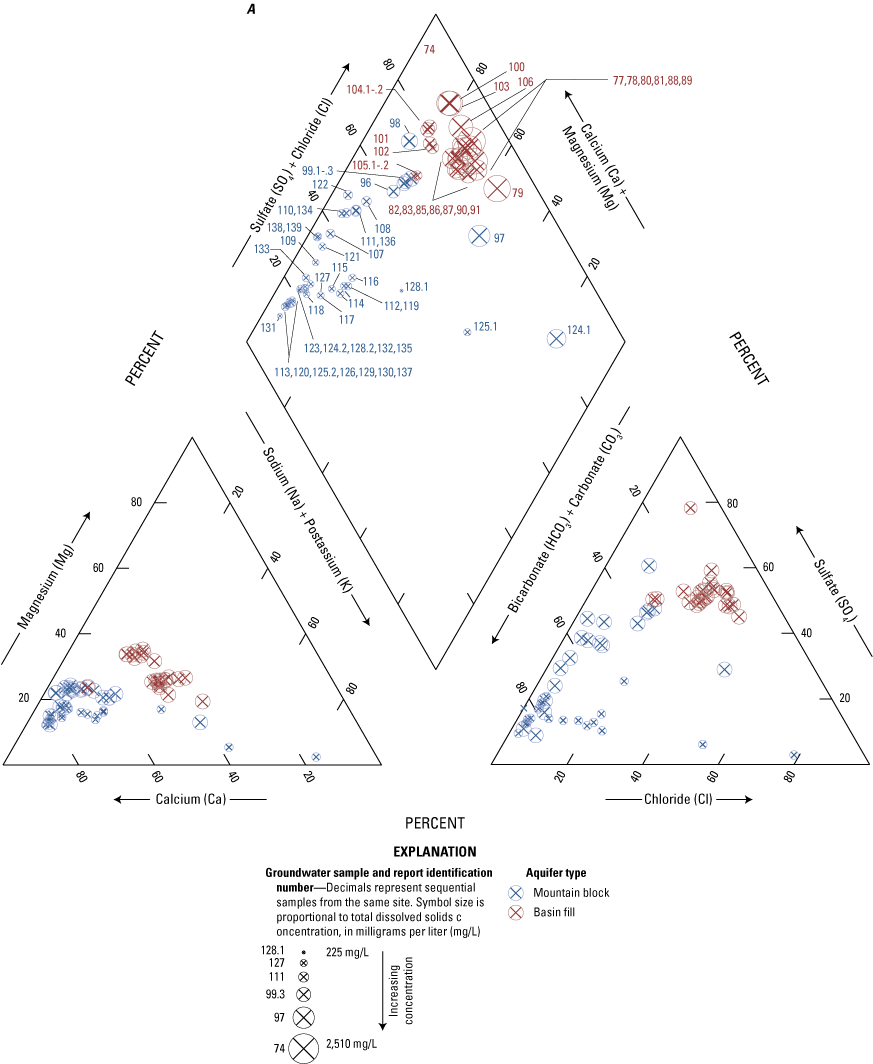
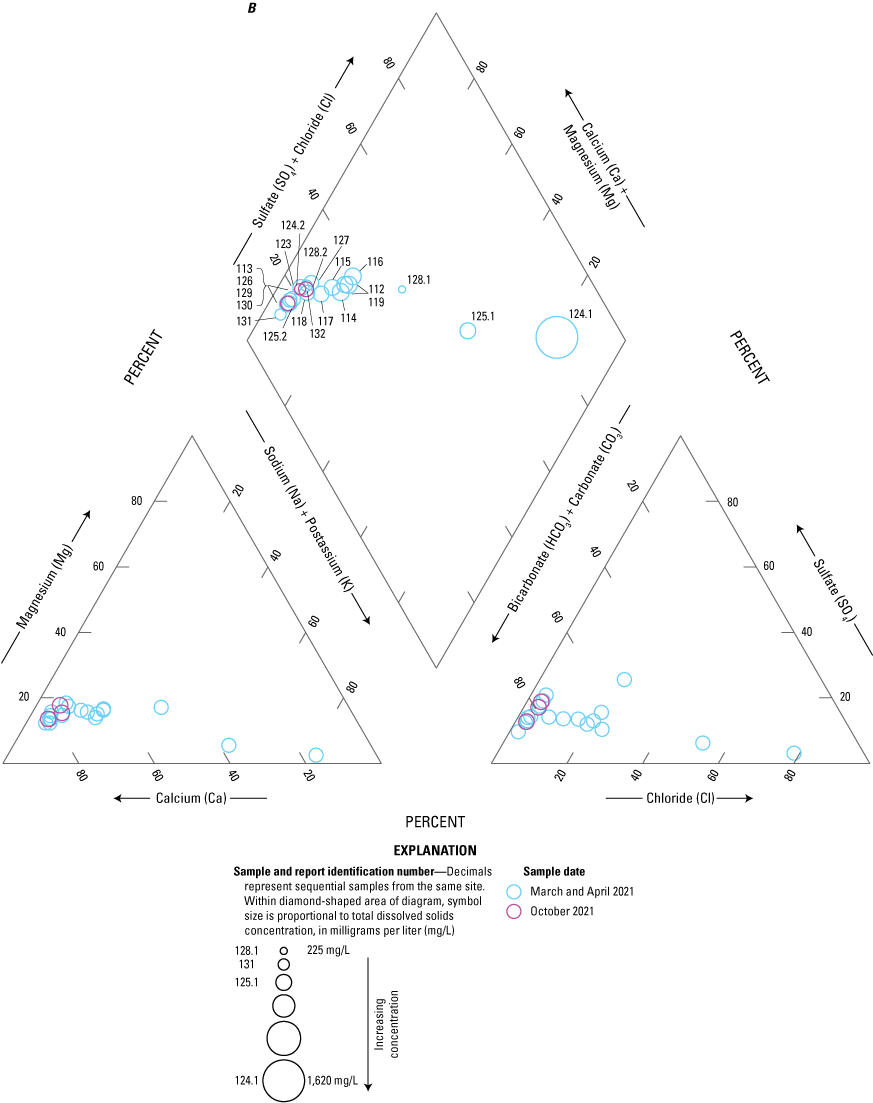
Piper diagrams showing the major-ion proportion of groundwaters and springs collected in Otero County A, divided into mountain block and basin-fill aquifers, and B, for an area in the mountain block showing temporal variability.
Sites 124, 125, and 128 had samples collected in April 2021 (samples ending with “.1”), and October 2021 (samples ending with “.2”) (table 16). For the April 2021 samples, the water types differed among all three sites, with site 124 having a sodium-chloride type water. On the Piper diagram, the April 2021 sample from site 124 plots farthest from the compositions of groundwater from other sites in that area (112–119, 123, 126, 127, 129–132), with the April sample from site 128 plotting closest to those sample compositions (fig. 8). The October 2021 samples for sites 124, 125, and 128 were more similar to the general group of samples in that area, which have calcium-bicarbonate type waters.
Dissolved Organic Carbon
DOC was detected at low concentrations in 95 percent of the groundwater samples. Three sites had DOC above the highest blank concentration threshold of 3.63 mg/L: site 2 (21.9 mg/L), site 124 (April 2021, 8.83 mg/L), and site 99 (5.06 mg/L).
Nutrients
Nitrate, nitrite, ammonia, and orthophosphate were measured in groundwater samples. Ammonia was only detected at nine sites and ranged from 0.02 to 0.92 mg/L. Orthophosphate as phosphorus was detected in most groundwater sites and ranged from 0.004 to 0.066 mg/L at the 98 sites where it was detected.
Nitrate as nitrogen was less than the laboratory detection level at five sites, with detections ranging in concentration from 0.06 to 23.9 mg/L (site 53). Occurrence of nitrate concentrations greater than 5.0 mg/L as nitrogen may be due to the presence of human-related sources of nitrogen on the land surface, transport to the aquifer by natural and human-related recharge mechanisms, and (or) persistence in the aquifer as a result of favorable geochemical conditions for nitrate (Bexfield and others, 2011). Wells where nitrate as nitrogen was detected above 5 mg/L were located in the High Plains aquifer in Curry and Roosevelt Counties and were screened/completed either no more than 400 ft deep (sites 18, 25, 26, 37, 44, and 53) or were of unknown well depth (sites 27, 51, and 68). Two of these sites (51 and 53) exceeded the MCL of 10 mg/L.
Stable Isotopes
Stable isotopes of oxygen and hydrogen of the water molecule were measured for groundwater samples from this study. The ratio of the two stable isotopes gives an indication of recharge elevation, seasonality, and evaporation (Craig, 1961; Rozanski and others, 1993). The statewide sampling represents water from different regions and aquifers; samples within a region and aquifer can be compared with each other to understand local differences in recharge sources.
Stable isotopic ratios for samples collected across New Mexico ranged from −15.2 to −5.81 for δ18O and from −121 to −40.6 per mil for δ2H (fig. 9). Depleted (more negative) values generally represent higher elevation and (or) winter recharge, whereas enriched (less negative) values generally represent lower elevation and (or) summer recharge (Kendall and others, 1995). The most depleted values are located at sites in the northern part of the State (sites 1–8), as well as at sites near the Rio Grande (sites 11–15) (figs. 1 and 9A). The most enriched values, which also indicate an evaporative signature (Kendall and others, 1995), are located in the south-central (sites 70–147) and eastern (sites 18–69) parts of New Mexico (figs. 1 and 9).
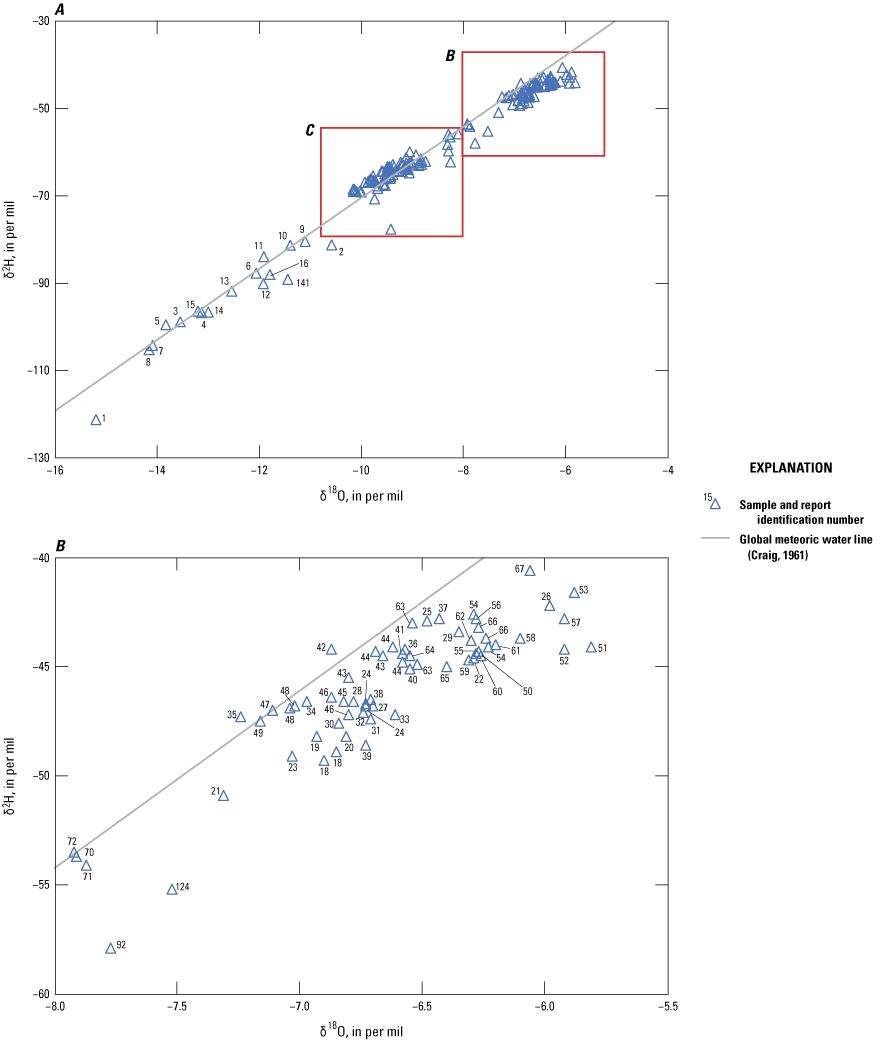
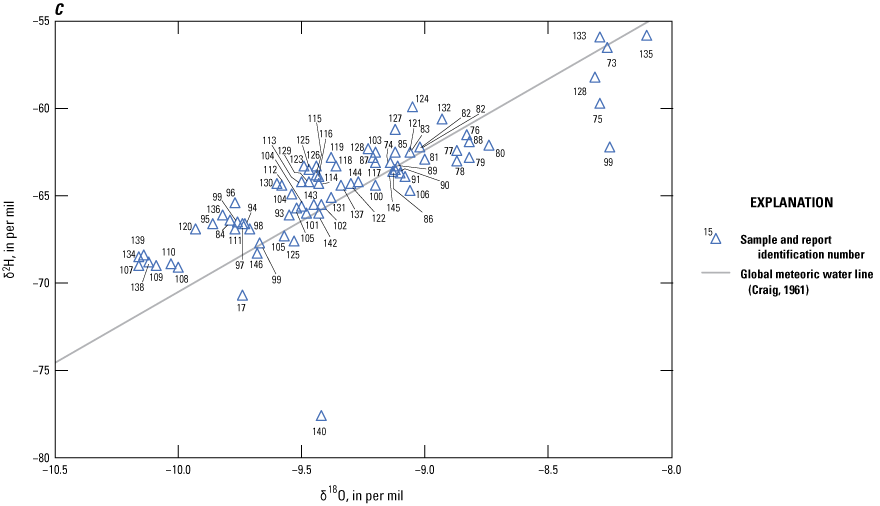
A, Stable isotopic ratios of oxygen and hydrogen in groundwaters and springs collected across New Mexico. Inset graphs, B–C, represent focused areas of the graph for more detail.
Three groundwater samples from Albuquerque, the largest urban area of New Mexico (sites 13–15, fig. 1), have some of the most depleted isotopic values from the study (fig. 9A). Plummer and others (2012) conducted a detailed geochemical analysis of water in the Middle Rio Grande Basin in the 1990s, which included site 13 and wells within the same well field as sites 14 and 15. Generally, the most depleted stable isotopic values in Albuquerque were located in the center of the basin, attributed to recharge from the Rio Grande, which is sourced largely from precipitation at higher elevations in the mountains of southern Colorado and northern New Mexico; more enriched isotopic values were located closer to the mountain front. Sites 14 and 15 are located in the central area of the basin, and samples from these sites were more depleted than the sample from site 13, which is located at a higher elevation to the east towards the mountain front. Isotopic signatures at sites 14 and 15 were similar to those of samples collected in 1997 from Plummer and others (2012), being within 0.2 and 0.5 per mil for δ18O and δ2H, respectively. The site 13 value was more depleted compared to the 1997 value, differing by 0.74 and 5.9 per mil for δ18O and δ2H, respectively, and suggesting a change in the source of water for that well that may warrant further investigation.
Springs 124, 125, and 128 had PFAS detected in samples collected in April 2021 (table 16), and they plot to the right of the meteoric water line, suggesting an evaporative stable isotopic signature at that time (fig. 10). The springs were resampled in October 2021, when they did not have any PFAS detected and had stable isotopic signatures similar to those of other springs and wells sampled in the area during the April 2021 sampling event (sites 112–128; fig. 10). The samples with PFAS detections may indicate concentration in evaporated water that is localized and not representative of other groundwater in the area. The flow at springs 124, 125, and 128 was higher in October 2021 than in April 2021.
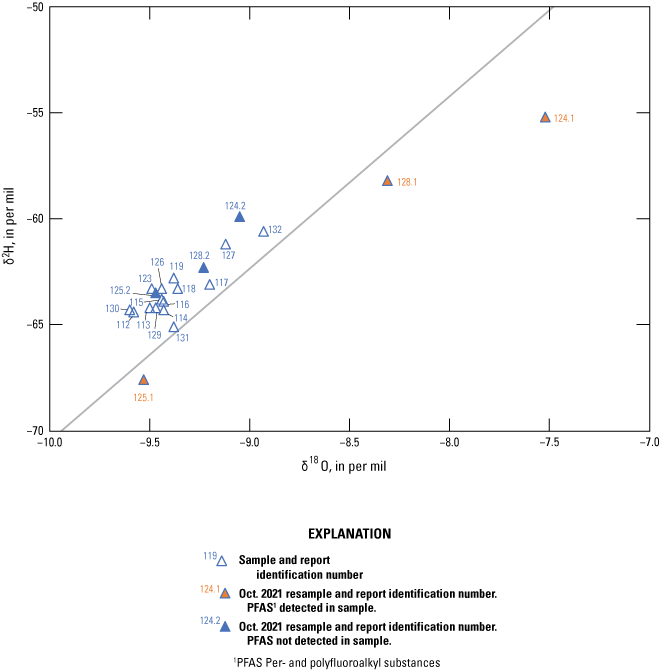
Stable isotopic ratios of oxygen and hydrogen for groundwater and spring samples from a focused area in Otero County. The solid line represents the global meteoric water line (Craig, 1961).
Groundwater Age
Groundwater ages discussed in this section, based on radiocarbon and tritium concentrations, represent an approximation of the length of time since precipitation entered the subsurface and interacted with carbonate minerals in the aquifer matrix.
Radiocarbon (14C) can be used to estimate the length of time since groundwater moved through the subsurface into the saturated part of an aquifer. The carbon species in the water sample are used to interpret the interaction with young carbon from gases in the soil zone, old carbon present as carbonate minerals in the aquifer matrix, and from interaction with organic carbon within the aquifer matrix such as oil and gas deposits. Some of the carbon species interactions occur in an open system condition while the water is moving through the unsaturated zone in contact with soil gas. Once the water enters the saturated zone, then carbon species interact under closed system conditions, and interactions in both open and closed systems influence the carbon species of the water.
The δ13C ratio varies as the water interacts with carbon sources in the soil zone during recharge and continues to do so as the water interacts with older solid carbonate sources in unconsolidated and bedrock materials (Han and Plummer, 2016). The δ13C ratio used for the soil and solid carbonate sources can influence the calculation of groundwater age. Solid carbonate δ13C values generally vary over a few per mil, whereas soil gas δ13C values vary over a larger range depending on the type of plant respiring CO2 into the soil zone. Knowledge of the plant community or direct measurement of soil gas δ13C during groundwater recharge is needed to constrain the groundwater age calculation. Often with older groundwater, soil gas δ13C is assumed because the groundwater recharged prior to human measurement of soil gas in the recharge area. Table 18 presents a range of possible groundwater ages based on different soil gas values for waters that plot in a region below 14C of 50 pmc and below the zero-age area on figure 11 that indicates radiocarbon decay, where minimum is the younger age and maximum is the older age based on the given soil gas value.
Table 18.
Results of tritium and carbon isotope analyses.[Data are available from the National Water Information System (U.S. Geological Survey [USGS], 2022b). Dates are shown as month, day, year. 14C, carbon-14; δ13C, normalized ratio of carbon-13 and carbon-12; pmc, percent modern carbon; pM, absolute modern carbon; per mil, per thousand; BP, before present; pCi/L, picocurie per liter; R, result is below the sample-specific critical level; NA, not available; *, radiocarbon sample broken by the lab]
| Report identification number | Sample date | Denormalized 14C (pmc) | Normalized 14C (pM) | δ13C (per mil) | Minimum corrected age (δ13C soil gas −21.4 per mil) (years BP) | Maximum corrected age (δ13C soil gas −11.5 per mil) (years BP) | Tritium concentration (pCi/L) | Tritium age category (Lindsey and others, 2019) |
|---|---|---|---|---|---|---|---|---|
| 1 | 12/02/20 | 0.76 | 0.74 | −7.36 | 30,883 | 35,894 | 0.04 R | Premodern |
| 2 | 11/19/20 | 87.50 | 85.49 | −9.40 | NA | NA | 6.11 | Modern |
| 3 | 10/28/20 | 84.24 | 83.11 | −14.23 | NA | NA | 16.72 | Modern |
| 4 | 08/10/21 | 97.94 | 96.42 | −13.14 | NA | NA | 11.28 | Modern |
| 5 | 08/10/21 | 80.90 | 79.11 | −9.77 | NA | NA | 16.82 | Modern |
| 6 | 08/11/20 | 72.36 | 70.39 | −7.27 | NA | NA | 0.0 R | Premodern |
| 7 | 04/26/21 | 0.98 | 0.96 | −12.67 | 33,694 | 39,406 | 0.01 R | Premodern |
| 8 | 04/26/21 | 2.70 | 2.66 | −13.38 | 25,728 | 31,259 | 0.00 R | Premodern |
| 9 | 09/15/20 | 80.44 | 78.99 | −11.92 | NA | NA | 4.09 | Mixed |
| 10 | 09/15/20 | 71.27 | 69.95 | −11.67 | NA | NA | 2.33 | Mixed |
| 11 | 09/11/20 | 10.20 | 9.92 | −7.34 | 9,247 | 14,503 | 0.58 R | Premodern |
| 12 | 09/29/20 | 98.10 | 96.36 | −12.08 | NA | NA | 10.01 | Modern |
| 13* | 02/09/21 | NA | NA | NA | NA | NA | 0.00 R | Premodern |
| 14* | 02/09/21 | NA | NA | NA | NA | NA | 0.63 R | Premodern |
| 15 | 09/25/20 | 16.52 | 16.12 | −8.64 | 6,926 | 11,736 | 0.19 R | Premodern |
| 16 | 09/28/20 | 1.01 | 0.98 | −4.67 | 23,428 | 29,050 | 0.15 R | Premodern |
| 17 | 09/28/20 | 42.37 | 41.33 | −8.59 | NA | 4,162 | 0.15 R | Premodern |
| 18.1 | 09/25/20 | 67.84 | 65.70 | −5.03 | NA | NA | 0.22 | Premodern |
| 18.2 | 01/13/21 | 67.73 | 65.61 | −5.10 | NA | NA | 0.38 | Mixed |
| 19.1 | 01/13/21 | 68.20 | 66.04 | −4.91 | NA | NA | 0.02 R | Premodern |
| 20 | 01/13/21 | 68.56 | 66.46 | −5.47 | NA | NA | 0.20 | Premodern |
| 24.2 | 05/12/21 | 66.42 | 64.24 | −4.31 | NA | NA | 2.05 | Mixed |
| 25.1 | 01/12/21 | 95.90 | 94.10 | −11.49 | NA | NA | 7.88 | Modern |
| 26.1 | 01/12/21 | 61.93 | 59.90 | −4.31 | NA | NA | 3.50 | Modern |
| 27 | 05/18/21 | 67.46 | 65.34 | −5.01 | NA | NA | 2.15 | Mixed |
| 30 | 05/18/21 | 62.22 | 60.22 | −4.66 | NA | NA | 0.29 | Premodern |
| 37 | 12/16/20 | 68.89 | 66.91 | −6.46 | NA | NA | 3.35 | Modern |
| 41 | 11/17/20 | 60.59 | 58.67 | −4.97 | NA | NA | 1.05 | Mixed |
| 43 | 12/16/20 | 55.04 | 53.33 | −5.25 | NA | NA | 0.2 R | Premodern |
| 44.1 | 12/16/20 | 50.98 | 49.51 | −6.48 | NA | 64 | 2.38 | Mixed |
| 45.1* | 02/09/21 | NA | NA | NA | NA | NA | 0.14 R | Premodern |
| 45.2 | 06/02/21 | 51.84 | 50.41 | −4.38 | NA | NA | NA | NA |
| 46.2 | 05/12/21 | 66.38 | 64.18 | −4.16 | NA | NA | 0.11 R | Premodern |
| 48.1 | 09/09/20 | 54.06 | 52.38 | −5.25 | NA | NA | 0.02 R | Premodern |
| 50 | 11/18/20 | 73.58 | 71.30 | −5.31 | NA | NA | 0.00 R | Premodern |
| 51 | 05/18/21 | 78.85 | 76.52 | −5.98 | NA | NA | 4.8 | Modern |
| 53 | 08/25/20 | 87.59 | 84.82 | −4.99 | NA | NA | 3.53 | Modern |
| 54.1 | 08/26/20 | 84.36 | 82.03 | −7.03 | NA | NA | 1.06 | Mixed |
| 55 | 11/17/20 | 82.15 | 79.94 | −7.42 | NA | NA | 0.18 R | Premodern |
| 56 | 12/15/20 | 80.15 | 78.07 | −7.89 | NA | NA | 0.73 | Mixed |
| 58 | 08/26/20 | 79.45 | 77.07 | −5.85 | NA | NA | 0.08 R | Premodern |
| 59 | 05/11/21 | 77.18 | 74.86 | −5.72 | NA | NA | 0.4 | Mixed |
| 60 | 11/18/20 | 77.30 | 74.93 | −5.48 | NA | NA | 0.14 R | Premodern |
| 61 | 05/11/21 | 74.21 | 71.85 | −4.84 | NA | NA | 0.16 R | Premodern |
| 62 | 05/11/21 | 84.01 | 81.67 | −6.86 | NA | NA | 0.91 | Mixed |
| 63.1 | 08/25/20 | 96.52 | 93.16 | −3.37 | NA | NA | 2.71 | Mixed |
| 64.1 | 01/14/21 | 84.97 | 82.36 | −5.42 | NA | NA | 3.68 | Modern |
| 65 | 01/14/21 | 81.67 | 78.96 | −4.13 | NA | NA | 1.42 | Mixed |
| 66.1 | 12/15/20 | 96.32 | 93.11 | −4.12 | NA | NA | 4.33 | Modern |
| 67 | 09/08/20 | 50.70 | 49.10 | −5.02 | NA | NA | 0.88 | Mixed |
| 68 | 06/09/21 | 91.82 | 89.16 | −6.30 | NA | NA | 1.03 | Mixed |
| 70 | 10/28/20 | 47.20 | 45.97 | −7.89 | NA | 2,425 | 1.57 | Mixed |
| 71 | 10/28/20 | 49.03 | 47.76 | −7.97 | NA | 2,216 | 1.14 | Mixed |
| 72 | 10/28/20 | 47.19 | 45.97 | −7.97 | NA | 2,550 | 0.92 | Mixed |
| 73 | 08/18/21 | 34.6 | 33.64 | −6.88 | NA | 3,711 | 0.58 | Mixed |
| 74* | 02/09/21 | NA | NA | NA | NA | NA | 0.05 R | Premodern |
| 75 | 01/26/21 | 80.75 | 78.41 | −6.32 | NA | NA | 1.83 | Mixed |
| 76 | 01/26/21 | 78.28 | 76.05 | −6.54 | NA | NA | 1.70 | Mixed |
| 77 | 12/30/20 | 89.80 | 87.71 | −9.27 | NA | NA | 3.56 | Modern |
| 78 | 12/30/20 | 87.41 | 85.47 | −9.79 | NA | NA | 3.23 | Mixed |
| 79 | 12/30/20 | 57.66 | 56.15 | −7.81 | NA | NA | 2.49 | Mixed |
| 80 | 12/29/20 | 83.11 | 81.23 | −9.61 | NA | NA | 2.71 | Mixed |
| 81 | 01/27/21 | 73.94 | 72.11 | −8.44 | NA | NA | 0.70 | Mixed |
| 82.1 | 09/17/20 | 66.62 | 64.95 | −8.37 | NA | NA | 1.58 | Mixed |
| 83 | 01/27/21 | 26.80 | 26.00 | −5.86 | NA | 4,328 | 0.93 | Mixed |
| 84 | 04/30/21 | 64.73 | 63.22 | −9.15 | NA | NA | 3.20 | Modern |
| 85* | 02/11/21 | NA | NA | NA | NA | NA | 0.89 | Mixed |
| 86 | 01/27/21 | 45.19 | 43.95 | −7.13 | NA | 1,826 | 2.71 | Mixed |
| 87* | 02/09/21 | NA | NA | NA | NA | NA | 0.25 | Premodern |
| 88 | 01/27/21 | 49.45 | 48.11 | −7.29 | NA | 1,268 | 0.68 | Mixed |
| 89 | 01/27/21 | 3.65 | 3.53 | −3.96 | 10,699 | 16,280 | 0.35 | Mixed |
| 90 | 05/25/21 | 33.73 | 32.76 | −6.36 | NA | 3,270 | 0.22 | Premodern |
| 91 | 05/27/21 | 78.5 | 76.7 | −9.36 | NA | NA | 0.89 | Mixed |
| 94 | 12/30/20 | 74.89 | 73.05 | −8.64 | NA | NA | 3.45 | Modern |
| 96 | 04/29/21 | 67.83 | 66.26 | −9.26 | NA | NA | 2.86 | Mixed |
| 97 | 04/30/21 | 63.57 | 62.11 | −9.34 | NA | NA | 3.11 | Mixed |
| 98 | 04/30/21 | 54.01 | 52.62 | −7.97 | NA | NA | 1.21 | Mixed |
| 99.1 | 04/29/21 | 73.86 | 72.31 | −10.37 | NA | NA | 2.76 | Mixed |
| 99.2 | 04/29/21 | 83.15 | 81.38 | −10.19 | NA | NA | 7.02 | Modern |
| 99.3 | 04/29/21 | 73.73 | 72.20 | −10.49 | NA | NA | 2.53 | Mixed |
| 100 | 11/05/20 | 19.42 | 18.88 | −6.95 | 3,316 | 8,555 | 0.21 | Premodern |
| 101 | 12/22/20 | 10.92 | 10.58 | −5.28 | 5,543 | 10,793 | 0.18 R | Premodern |
| 102 | 08/17/21 | 22.28 | 21.63 | −6.09 | 676 | 6,137 | 0.04 R | Premodern |
| 103 | 11/05/20 | 16.08 | 15.63 | −6.86 | 4,852 | 10,035 | 0.10 R | Premodern |
| 104.1 | 09/17/20 | 27.24 | 26.44 | −6.15 | NA | 4,673 | 0.33 R | Premodern |
| 104.2 | 04/15/21 | 27.63 | 26.82 | −6.20 | NA | 4,605 | 0.07 R | Premodern |
| 105.1 | 09/18/20 | 15.39 | 14.90 | −4.91 | 2,040 | 7,266 | 0.26 R | Premodern |
| 105.2 | 04/15/21 | 15.60 | 15.11 | −4.97 | 2,011 | 7,256 | 0.04 R | Premodern |
| 106 | 08/16/21 | 12.71 | 12.35 | −6.61 | 6,246 | 11,605 | 0.16 R | Premodern |
| 107 | 05/26/21 | 76.28 | 74.74 | −10.74 | NA | NA | 4.12 | Modern |
| 108 | 05/25/21 | 69.3 | 67.71 | −9.34 | NA | NA | 2.88 | Mixed |
| 109 | 05/25/21 | 80.38 | 78.59 | −9.73 | NA | NA | 4.02 | Modern |
| 110 | 12/29/20 | 65.44 | 63.92 | −9.32 | NA | NA | 3.40 | Modern |
| 111 | 12/29/20 | 85.45 | 83.99 | −12.37 | NA | NA | 3.82 | Modern |
| 112 | 03/30/21 | 83.64 | 82.04 | −11.33 | NA | NA | 6.66 | Modern |
| 113 | 04/14/21 | 90.75 | 89.02 | −11.32 | NA | NA | 7.22 | Modern |
| 114 | 03/30/21 | 87.64 | 85.96 | −11.30 | NA | NA | 7.39 | Modern |
| 115 | 03/30/21 | 89.84 | 88.27 | −12.15 | NA | NA | 6.53 | Modern |
| 116 | 03/30/21 | 85.47 | 83.81 | −11.15 | NA | NA | 6.41 | Modern |
| 117 | 03/31/21 | 87.31 | 85.56 | −10.82 | NA | NA | 6.35 | Modern |
| 118 | 03/31/21 | 82.26 | 80.56 | −10.50 | NA | NA | 4.20 | Modern |
| 119 | 04/01/21 | 88.44 | 86.76 | −11.36 | NA | NA | 6.14 | Modern |
| 120 | 04/28/21 | 82.68 | 81.01 | −10.79 | NA | NA | 6.87 | Modern |
| 121 | 01/27/21 | 65.32 | 63.80 | −9.18 | NA | NA | 2.95 | Mixed |
| 122 | 01/26/21 | 58.23 | 56.84 | −8.90 | NA | NA | 3.18 | Mixed |
| 123 | 04/14/21 | 87.89 | 86.03 | −10.28 | NA | NA | 6.08 | Modern |
| 124.1 | 04/13/21 | 103.66 | 100.88 | −7.39 | NA | NA | 14.59 | Modern |
| 125.1 | 04/14/21 | 101.63 | 99.13 | −8.54 | NA | NA | 17.56 | Modern |
| 126 | 04/16/21 | 86.26 | 84.39 | −10.00 | NA | NA | 5.56 | Modern |
| 127 | 04/14/21 | 97.12 | 95.07 | −10.32 | NA | NA | 7.26 | Modern |
| 128.1 | 04/14/21 | 101.34 | 98.47 | −6.65 | NA | NA | 11.94 | Modern |
| 129 | 03/31/21 | 86.55 | 84.73 | −10.36 | NA | NA | 6.53 | Modern |
| 130 | 04/01/21 | 85.82 | 84.01 | −10.32 | NA | NA | 6.50 | Modern |
| 131 | 04/13/21 | 103.17 | 101.22 | −11.41 | NA | NA | 9.34 | Modern |
| 132 | 04/13/21 | 103.58 | 101.44 | −10.55 | NA | NA | 8.70 | Modern |
| 133 | 01/27/21 | 90.94 | 89.11 | −10.81 | NA | NA | 5.33 | Modern |
| 134 | 01/28/21 | 65.71 | 64.18 | −9.20 | NA | NA | 3.61 | Modern |
| 135 | 01/27/21 | 94.56 | 92.61 | −10.55 | NA | NA | 5.39 | Modern |
| 136 | 01/28/21 | 81.71 | 80.16 | −11.40 | NA | NA | 3.48 | Modern |
| 137 | 04/16/21 | 79.50 | 77.76 | −9.93 | NA | NA | 5.20 | Modern |
| 138 | 04/28/21 | 70.76 | 69.11 | −9.20 | NA | NA | 5.60 | Modern |
| 139 | 04/27/21 | 71.14 | 69.48 | −9.19 | NA | NA | 4.86 | Modern |
| 140 | 09/29/20 | 96.86 | 94.74 | −9.95 | NA | NA | 11.47 | Modern |
| 141 | 09/29/20 | 57.47 | 56.10 | −8.99 | NA | NA | 0.06 R | Premodern |
| 142 | 01/14/21 | 7.19 | 7.02 | −9.21 | 14,173 | 19,690 | 0.00 R | Premodern |
| 143 | 01/13/21 | 7.45 | 7.27 | −9.08 | 13,748 | 19,249 | 0.26 | Premodern |
| 144 | 01/14/21 | 20.72 | 20.23 | −9.07 | 5,289 | 10,720 | 0.14 R | Premodern |
| 145 | 01/13/21 | 10.86 | 10.60 | −8.71 | 10,253 | 15,700 | 0.12 R | Premodern |
| 146 | 01/13/21 | 12.24 | 11.93 | −8.16 | 8,578 | 14,138 | 0.21 R | Premodern |
| 147 | 04/27/21 | 78.01 | 74.81 | −10.17 | NA | NA | 4.68 | Modern |
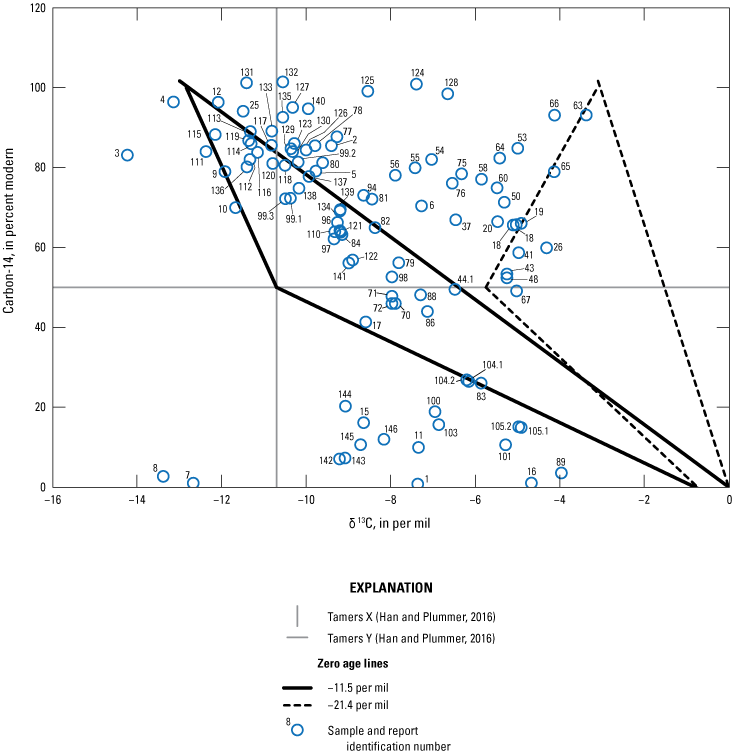
Carbon isotopic values for groundwater and spring samples collected throughout New Mexico.
The majority of groundwater samples had 14C values greater than 50 pmc, which precludes the groundwater age from being quantified because of radiocarbon decay (fig. 11; Han and others, 2012). For the samples with 14C values less than 50 pmc that also plot below the zero-age area line, the groundwater has undergone radiocarbon decay and an age can be estimated using the revised Fontes and Garnier solid exchange equations (Han and Plummer, 2013). Soil gas and solid carbonate 14C and δ13C values are used to calculate the zero-age lines on figure 11. For samples that plot between the zero-age lines, radiocarbon age cannot be quantified and may be explained by geochemical reaction with no radiocarbon decay. Samples that plot above the zero-age area are likely mixtures containing some old and young recharged water. The intersection of Tamers X (δ13C) and Y (14C) represent the starting isotopic composition of the exchange process (Han and Plummer, 2016).
Groundwater age estimates vary on the basis of the δ13C of the soil gas used in the revised Fontes and Garnier solid exchange equations, and a range of possible soil gas values (–11.5 to –21.4 per mil; Plummer and others, 2012) was used to represent the possible range of groundwater age, which could be refined for areas if soil gas in recharge areas is measured. Some sites only had a quantifiable groundwater age when using −11.5 per mil for the δ13C of soil gas, including sites 44, 70, 71, 72, 73, 83, 90, 86, 88, and 104, which are located in Curry, Chavez, Eddy, and Otero Counties. Additional investigation of the groundwater flow paths to these wells could help inform what factors influence radiocarbon interaction and establish a reasonable δ13C soil gas for the water recharging those aquifer systems. Some of the sites (1, 7, 8, 11, 15, 16, 89, 101, 103, 106, 142, 143, 144, 145, and 146) had groundwater age estimates greater than 10,000 years before present. Site 44 had detections of PFAS and only sample 44.1 had a low groundwater age estimate (64 years before present) when using −11.5 per mil for soil gas. Site 106 is located on a golf course and had a detection of PFOA, while also having low tritium below the laboratory reporting level and an old groundwater age (table 18). Irrigation using groundwater with an old radiocarbon age that reinfiltrated into the subsurface is a possible explanation for the presence of PFOA in old water at the site. The other groundwater sites from this study with quantifiable radiocarbon groundwater age had PFAS below the laboratory detection level.
Two groundwater samples from the Colorado Plateaus aquifers in McKinley County (sites 7 and 8) had the most depleted δ13C values from the dataset (−12.67 and −13.38 per mil, respectively) and low 14C (0.96 and 2.66 pmc, respectively) (fig. 11). The estimated groundwater ages for these samples ranged from 25,728 to 39,406 years before present (table 18). Other groundwater studies in the area have similarly low δ13C, suggesting interaction with fossil organic matter (Han and others, 2012), potentially related to naturally occurring hydrocarbon deposits (Dam, 1995).
Tritium is a useful indicator of water recharged following the aboveground nuclear testing of the 1950s (Lindsey and others, 2019). Semiannual (February and August) tritium concentrations from 1953 to 2012 for quadrangles covering the majority of New Mexico (latitude 31 through 35 degrees north and longitude −100 through −110 degrees west) from Michel and others (2018) and Jurgens (2018) are shown on figure 12. The premodern threshold for New Mexico is 0.35 pCi/L, which was determined as part of this study by assuming that the average of the 2008–12 precipitation data represents a background value for the area and then decaying that concentration from 1952 to the sample year for this study, which was primarily 2021, with a few samples collected in late 2020. The modern threshold was determined by finding the minimum post bomb-pulse tritium value decayed to 2021 for the aforementioned tritium data from precipitation. Modern thresholds determined for the two latitude-longitude quadrangles containing the most samples from the study were slightly different at 3.19 for latitude 33 to 35, longitude −100 to −105 (which includes sites 18–69, 74−76, and 98) and 3.30 pCi/L for latitude 31 to 33, longitude −105 to −110 (which includes sites 77−97, and 99−146) (fig. 12). Other quadrangles contained less samples and had similar modern thresholds including: 2.11 pCi/L for latitude 31 to 33, longitude −100 to −105 (including sites 70−73), 3.78 pCi/L for latitude 33 to 35, longitude −105 to −110 (including sites 16 and 17), 3.70 pCi/L for latitude 35 to 37, longitude −100 to −105 (including site 6), and 4.58 pCi/L for latitude 35 to 37, longitude −105 to −110 (including sites 1–5 and 7–15).
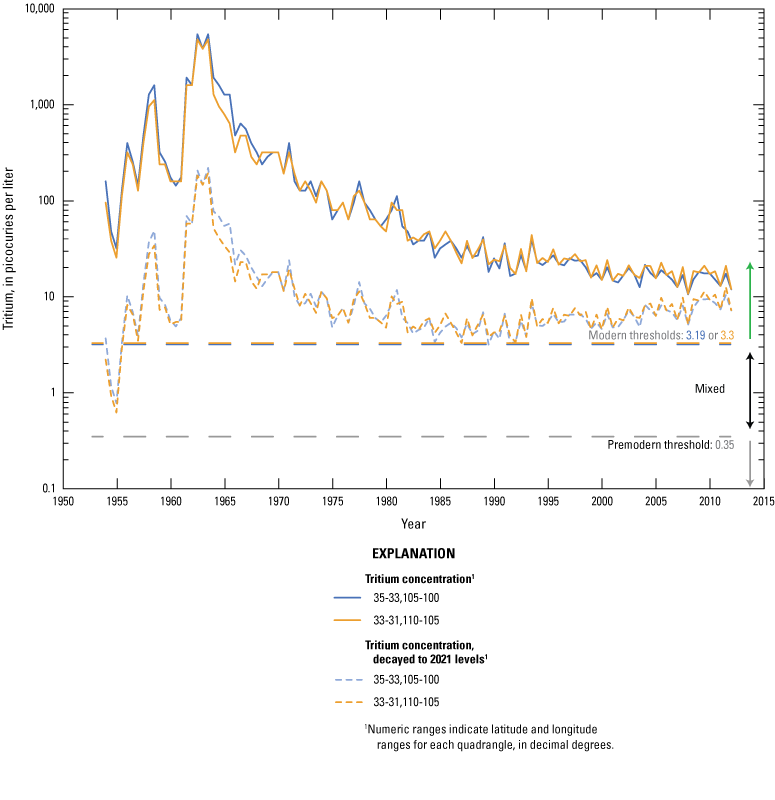
Tritium concentrations for precipitation interpolated by Michel and others (2018) and Jurgens (2018) for two latitude and longitude quadrangles in New Mexico.
Tritium from this study ranged from less than the laboratory sample specific critical level to 17.56 pCi/L. The majority of the samples were above the laboratory sample specific critical level and ranged from 0.2 to 17.56 pCi/L. There were 41 samples in the premodern category (including one sample from site 11 that had an elevated censoring level of 0.58 pCi/L), 40 samples in the mixed category, and 48 samples in the modern category (table 18 and appendix 1).
Surface-Water Diversions
Surface-water diversions within public water systems were also sampled to provide a comprehensive assessment of PFAS in sources of water to those public water systems (table 1). The PFAS detections are reported in table 19. Only three of six of the diversion sites had PFAS detected, and the detections of PFHxS and PFOS were all below the reporting level.
Table 19.
Per- and polyfluoroalkyl substance concentrations from surface-water diversion samples with values above the laboratory detection level, including repeat sampling after detection.[Values are reported in nanograms per liter. Values in italics represent estimated concentrations greater than the laboratory detection level and less than the laboratory reporting level in effect at the time of sample analysis. --, below the laboratory detection level]
Surface Water
This discussion of surface-water chemistry addresses PFAS results first, followed by results for general chemistry, wastewater chemistry, DOC, and major and trace elements.
Per- and Polyfluoroalkyl Substances
Several large rivers of New Mexico were sampled at multiple locations. Of the 18 surface-water locations, only 1 did not have any PFAS detected (Rio Grande Taos, sampled only twice). In sites that were sampled more than five times (table 2), Pecos Puerto de Luna had the fewest detections, with only one of seven sampling events having detections above the detection level. Rio Grande Valle de Oro and Rio Grande El Paso had detections at every sampling event. PFPeA was the most frequently detected PFAS across all sites and events (57 instances, ranging from 1.0 to 29 ng/L), and PFBS was the second most frequently detected PFAS (53 instances, ranging from 1.0 to 93 ng/L). Total PFAS concentrations ranged from 1.0 to 155.4 ng/L at Rio Grande Valle de Oro, which had the greatest single concentration of a PFAS, with 93 ng/L of PFBS.
The Rio Grande was sampled at five locations spanning the State of New Mexico from north to south (fig. 5) and results are discussed here from upstream to downstream order. The most upstream site, Rio Grande Taos, had no PFAS detected in either of its two sampling events. The next downstream site was Rio Grande Buckman, which had low-level detections of one or more of the following: PFPeA, PFBS, and 6:2 fluorotelomer sulfonate (6:2FTS) for samples collected between August 2020 and February 2021, with total PFAS concentrations ranging from 1 to 4.7 ng/L; three samples (collected in March, August, and September 2021) had no PFAS detected (fig. 13A). Rio Grande Alameda had no detections in one sample and low-level detections of PFBA, PFPeA, PFHxA, PFOA, and PFBS in nine other samples, with one to five compounds detected in any of those nine individual samples and total PFAS ranging from 1.1 to 8.2 ng/L (fig. 13B). The next downstream site was Rio Grande Valle de Oro, which is immediately downstream from Albuquerque, the largest urban area in New Mexico. Compared with upstream sites, this site had much higher concentrations of PFAS that were highly variable, with totals ranging from 8.7 to 155.4 ng/L and detections of PFBA, PFPeA, PFHxA, PFHpA, PFOA, PFNA, PFDA, PFBS, PFHxS, PFOS, and (or) PFOSA (fig. 13C). Rio Grande Floodway was sampled in August of 2020 and 2021 and had elevated concentrations (15.8 and 29.7 ng/L total PFAS) compared with the average surface-water sample concentrations throughout the State and had detections of multiple PFAS: PFBA, PFPeA, PFHxA, PFHpA, PFOA, PFBS, PFHxS, and PFOS. Rio Grande El Paso consistently had some of the highest PFAS concentrations in surface-water samples from this study (ranging from 13 to 86.1 ng/L total PFAS) (fig. 13D). No releases of water from Elephant Butte Reservoir to the Rio Grande occurred between October 3, 2020, and May 18, 2021, as shown by USGS streamgage 0861000 Rio Grande below Elephant Butte Dam, N. Mex. (USGS, 2022b). The total PFAS concentration (ranging from 38.1 to 85.5 ng/L) for Rio Grande El Paso was highest for samples collected during this period—between October 15, 2020, and May 14, 2021—and 6:2FTS and PFPeS were present only during this time (fig. 13D). PFHpA was present in the water samples from this time period and in two more samples collected in July and August 2021 after releases from Elephant Butte Reservoir had resumed (fig. 13D). Other compounds found at Rio Grande El Paso were PFBA, PFPeA, PFHxA, PFOA, PFBS, PFHxS, and PFOS.
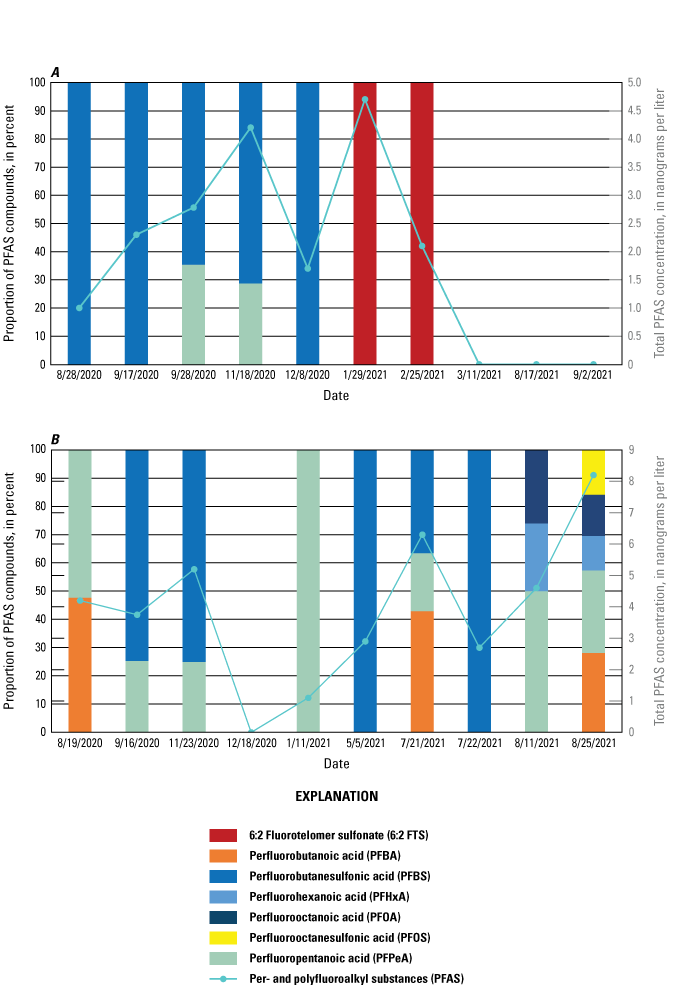
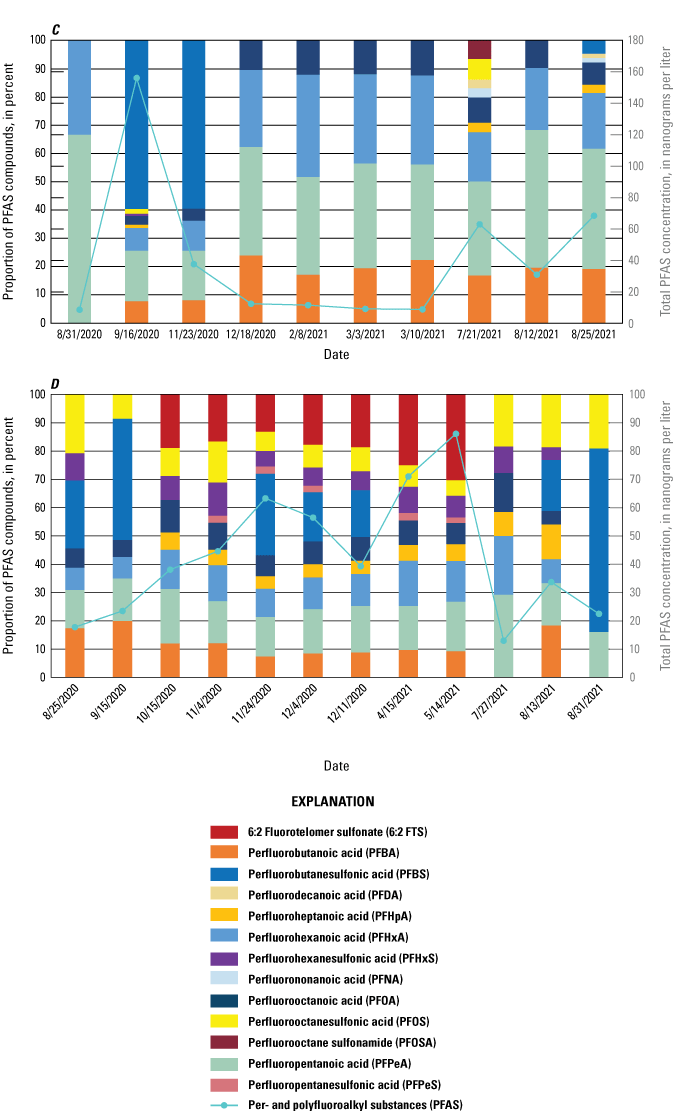
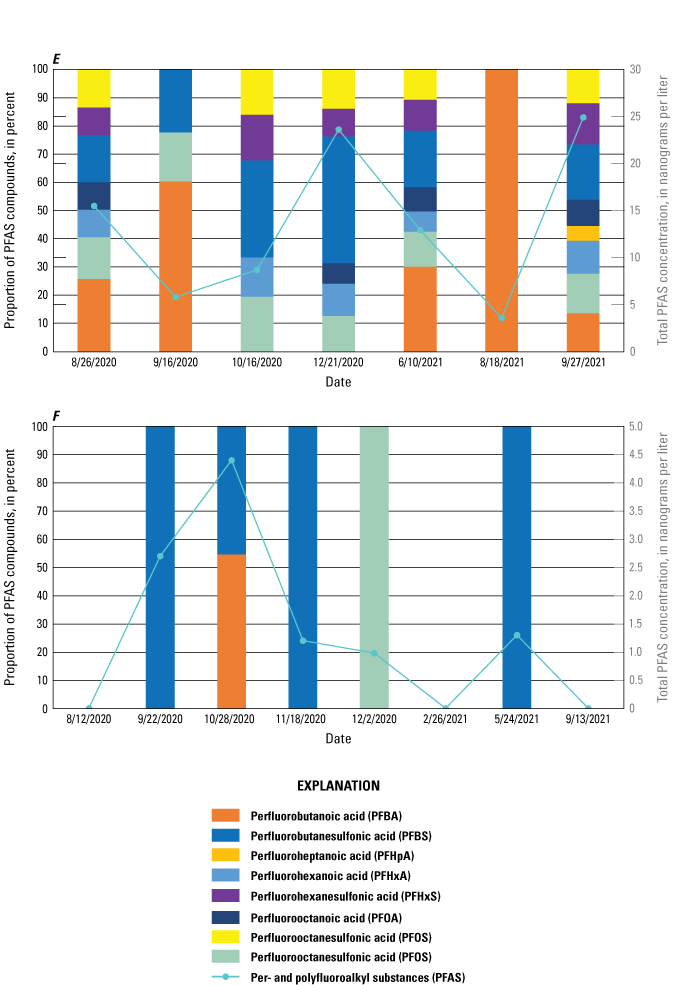
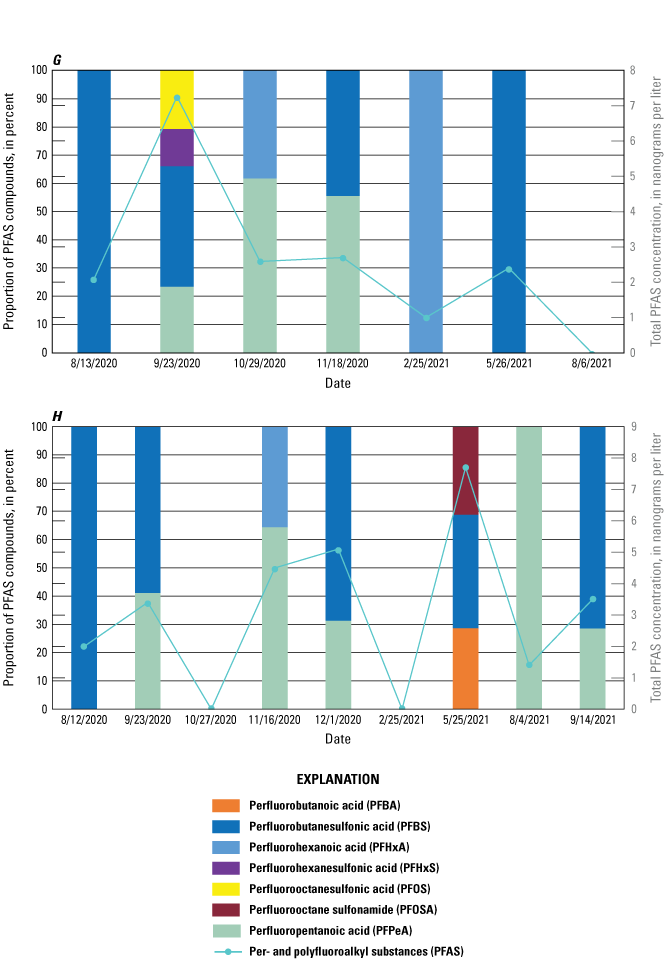
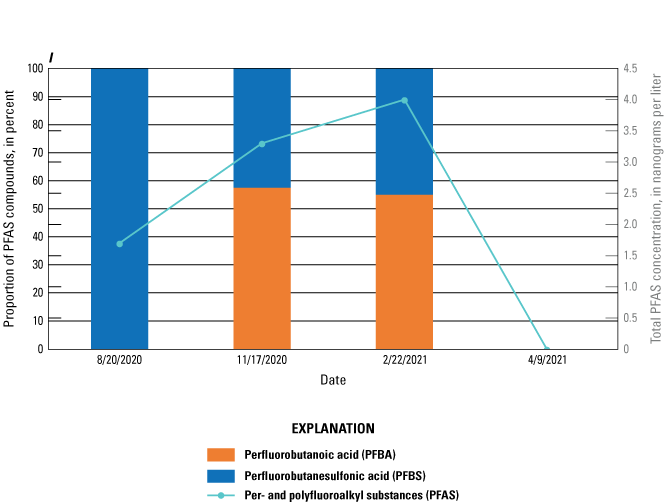
For per- and polyfluoroalkyl substances (PFAS) with detectable concentrations, total concentrations, and proportions of total concentrations contributed by individual PFAS for A, Rio Grande above Buckman Diversion near White Rock, New Mexico; B, Rio Grande at Alameda Bridge at Alameda, N. Mex.; C, Rio Grande at Valle de Oro, N. Mex.; D, Rio Grande at El Paso, Texas; E, Pecos River near Artesia, N. Mex.; F, San Juan River near Archuleta, N. Mex.; G, Animas River at Farmington, N. Mex.; H, San Juan River near Fruitland, N. Mex.; and I, Rio Chama below Abiquiu Dam, N. Mex.
The second longest river sampled was the Pecos River, and samples collected there showed a similar progressive increase in PFAS downstream as observed in the Rio Grande samples. Pecos Puerto de Luna generally had no PFAS detections, with only one of seven sampling events having a detection greater than the detection level with 2.8 ng/L total PFAS, including PFOA and PFPeA. Pecos Artesia had higher concentrations and more PFAS than observed upstream at Pecos Puerto de Luna (fig. 13E). Total PFAS concentrations ranged from 3.9 to 24.9 ng/L, with PFBA, PFBS, PFHxA, PFHxS, PFOA, PFOS, and PFPeA detected in four to seven samples and PFHpA detected only in one sample. Pecos Red Bluff was sampled only once in August 2020 and had similar compounds to those found near Artesia, with a total PFAS concentration of 7.5 ng/L, including PFBA, PFHxA, PFHxS, PFOS, and PFPeA.
The San Juan River was sampled near Archuleta, N. Mex. (San Juan Archuleta), and then downstream from Farmington, N. Mex., at San Juan Fruitland, downstream of the confluence of the Animas and San Juan Rivers. San Juan Archuleta PFAS concentrations were below the detection level for three samples but were as much as 4.4 ng/L total PFAS in the other five samples, with only PFBA, PFPeA, and (or) PFBS present (fig. 13F). Animas Farmington had slightly higher PFAS concentrations than upstream sites, with values as much as 7.3 ng/L total PFAS and PFPeA, PFHxA, PFBS, PFHxS, and (or) PFOS present in all but one of seven samples (fig. 13G). San Juan Fruitland was similarly variable, with generally low-level total PFAS (as much as 7.7 ng/L) and PFBA, PFPeA, PFHxA, PFBS, and (or) PFOSA present in all but two of nine samples (fig. 13H).
The Canadian River was sampled at three locations: Canadian Sanchez, Canadian Conchas, and Canadian Logan. The samples collected from Canadian Sanchez and Canadian Conchas in September 2020 had the highest total PFAS concentrations among samples at these sites, with as much as 16.4 ng/L total PFAS at Canadian Sanchez and 10.5 ng/L total PFAS at Canadian Conchas and detections of PFBA, PFBS, and PFOS at both locations; Canadian Sanchez also had a low-level detection of PFPeA, and the Canadian Conchas had a low-level detection of PFHpA. Canadian Logan had lower total PFAS concentrations than upstream sites (ranging from 1 to 4.9 ng/L) and included detections of PFBA, PFBS, and PFOS.
Several sites on smaller rivers throughout the State were sampled only a few times to get a general sense for concentrations and the potential need for more focused sampling. Streamflow at Rio Puerco Bernardo is ephemeral and occurs as a response to precipitation events. Two samples were collected from this site, one in September 2020 and the other in July 2021. Total PFAS concentrations were high at this site (35.7 and 38.6 ng/L) compared with other surface-water sites in the study and comprised PFBA, PFPeA, PFHxA, PFHpA, PFOA, PFNA, PFBS, and (or) PFOS. Streamflow at Rio Puerco Bernardo had a sharp increase in flow, followed by a slower recession during these sampling events. Collecting samples throughout the hydrograph (that is, at several times that reflect changing flow conditions) could enhance understanding of PFAS fluctuation at this site.
Rio Chama Abiquiu was sampled four times throughout the study during different seasons (August and November 2020, and February and April 2021; fig. 13I). Total PFAS concentrations were low at this site (1.7 to 4 ng/L), and quantified detections were all between the detection and reporting levels. The sample from April 9, 2021, had no PFAS detected. PFBS was detected in the other three samples, and PFBA was detected in the samples from November 2020 and February 2021.
Gila River had high total PFAS (53 and 19 ng/L) compared with the other surface-water sites in the study. Only two samples were collected at this site, during September of 2020 and 2021, and more sampling at this site could help to identify the time periods over which elevated concentrations occur and to characterize variability. The sample from September 2020 had PFBA, PFPeA, PFHxA, PFHpA, and PFBS, whereas the sample from September 2021 had only PFBA and PFBS.
Per- and Polyfluoroalkyl Substance Fluxes
The instantaneous PFAS loading rate, or flux, was calculated for each sampling event, as described in the “Methods” section, and results are presented in table 20. These fluxes are only representative of the time they were collected, and they may not be representative of fluxes during previous years or fluxes after the sampling event. Samples were collected during stable flow when possible, and associated streamflow hydrographs are provided in figure 14A–F for reference. Rio Grande Valle de Oro and Rio Grande El Paso had the highest observed fluxes, 37.76 and 65.58 g/d, respectively (fig. 14A, B). These sites also had the highest average load when all fluxes were averaged for each location, with Rio Grande Valle de Oro averaging 16.17 g/d and Rio Grande El Paso averaging 17.13 g/d. San Juan Fruitland, Rio Grande Buckman, and Rio Grande Alameda had elevated averages compared with the average values from surface-water sites in the State (between 2 and 5 g/d; (fig. 14D–F). The rest of the sample locations had average fluxes of less than 2 g/d. Only two samples were collected at the Gila River site, but the site had high fluxes (11.09 and 10.04 g/d) (fig. 14C).
Table 20.
Per- and polyfluoroalkyl substance (PFAS) instantaneous fluxes at surface-water sampling locations with PFAS detections.[Dates shown as month, day, year. USGS, U.S. Geological Survey; ID, identifier; N. Mex., New Mexico; Tex., Texas; R, river; NA, not available]
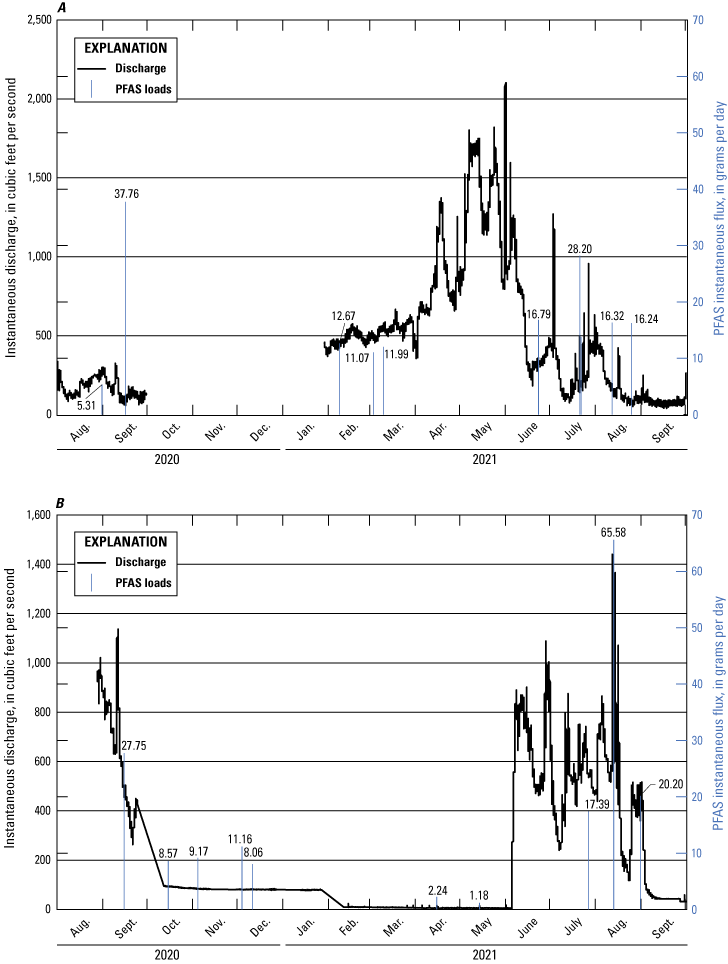
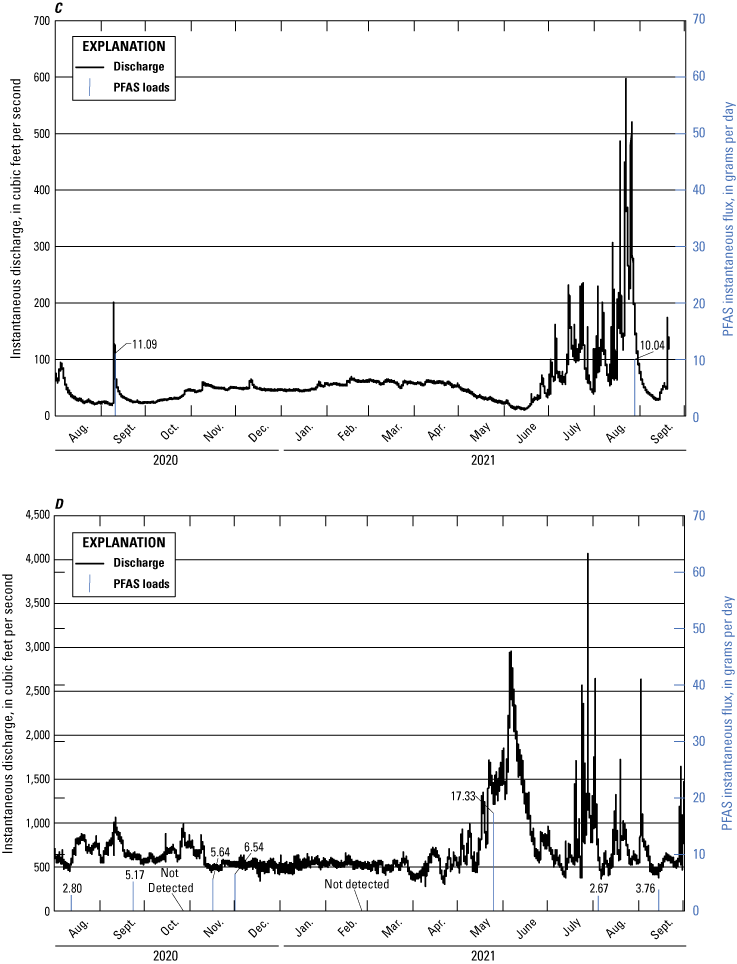
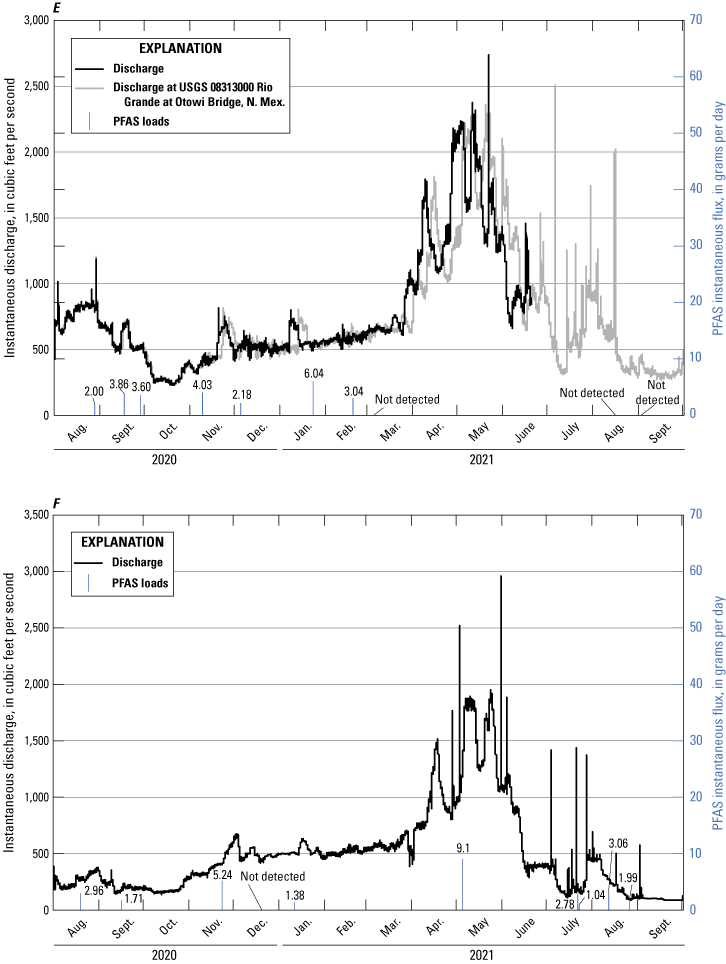
Total per- and polyfluoroalkyl substance (PFAS) instantaneous fluxes at surface-water sampling locations across New Mexico. A, Rio Grande at Valle de Oro, New Mexico; B, Rio Grande at El Paso, Texas; C, Gila River near Gila, N. Mex.; D, San Juan River near Fruitland, N. Mex.; E, Rio Grande above Buckman Diversion near White Rock, N. Mex.; and F, Rio Grande at Alameda Bridge at Alameda, N. Mex.
Per- and Polyfluoroalkyl Substances and Land Cover
Relations between near-site watershed land cover categories (table 3) and total PFAS concentrations were evaluated. Sites sampled frequently (more than five times) with more than 30 percent developed land cover had higher total PFAS concentrations than areas with predominantly mixed or undeveloped land cover, with a median value of 35.2 ng/L. Sites categorized as mixed and sampled frequently had a median total PFAS concentration of 2.7 ng/L, and the undeveloped category for frequently sampled sites had a median of 1.25 ng/L. No developed sites were sampled infrequently (less than five times). Mixed sites sampled infrequently had a median total PFAS concentration of 4.8 ng/L, and undeveloped sites had a median of 4.3 ng/L. The higher median value at undeveloped sites sampled infrequently was due to several outliers for the total PFAS concentration, including Gila River with 53.5 ng/L, Rio Puerco Bernardo with 38.6 and 35.7 ng/L, and Rio Grande Floodway with 29.7 ng/L. Outliers in the undeveloped category for frequently sampled sites included Pecos Artesia with 24.9, 15.5, and 12.9 ng/L. These outliers show that PFAS can be found at sites without any major development, as only one of these sites (Pecos Artesia) is downstream from a NPDES outfall (table 4) or has other direct evidence of potential PFAS sources within the near-site watershed (table 6).
Field Properties
The field properties water temperature, pH, specific conductance, and dissolved oxygen were measured onsite prior to sample collection. Water temperature ranged from 1.5 to 32.7 °C and varied depending on the time of year the sample was collected. Field pH values ranged from 6.9 to 10.0, with the highest pH recorded at San Juan Archuleta. Specific conductance ranged from 213 to 13,200 µS/cm, with the average specific conductance notably higher at Canadian Logan (12,525 µS/cm) than at other sites. Dissolved-oxygen concentrations ranged from 5.0 to 14.8 mg/L, with the highest concentration observed at San Juan Archuleta and the lowest observed at Canadian Conchas Dam.
Wastewater Chemistry
Seven surface-water sites across New Mexico were sampled and analyzed for wastewater tracer compounds to help characterize potential water-quality impacts resulting from nearby anthropogenic activities. The sites sampled were sites that were not visited for other water-quality sampling during the study period: Rio Chama Abiquiu, Rio Grande Buckman, Rio Grande Alameda, Pecos Puerto de Luna, Pecos Artesia, San Juan Archuleta, and Animas Farmington (fig. 15). The 37 synthetic organic chemicals in the wastewater tracer suite originate from multiple anthropogenic sources, including domestic and industrial wastewater discharge and surface runoff from agricultural sources such as livestock and cultivated crops. A list of these wastewater tracers, their constituent class, and their probable environmental source(s) are shown in table 21. Appendix 1, table 1.3, summarizes the surface-water detections and concentrations for wastewater tracer compounds.
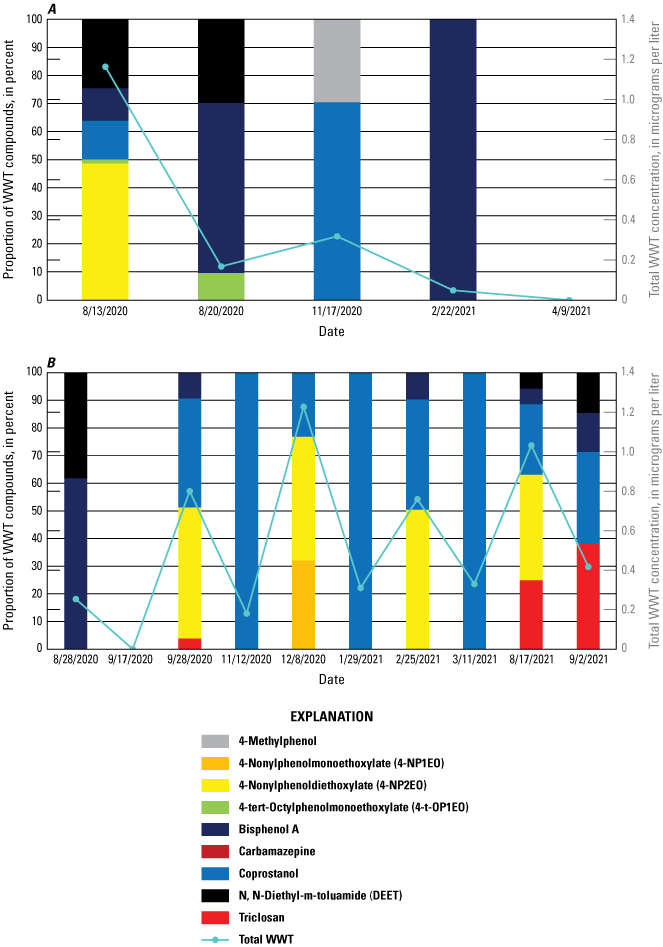
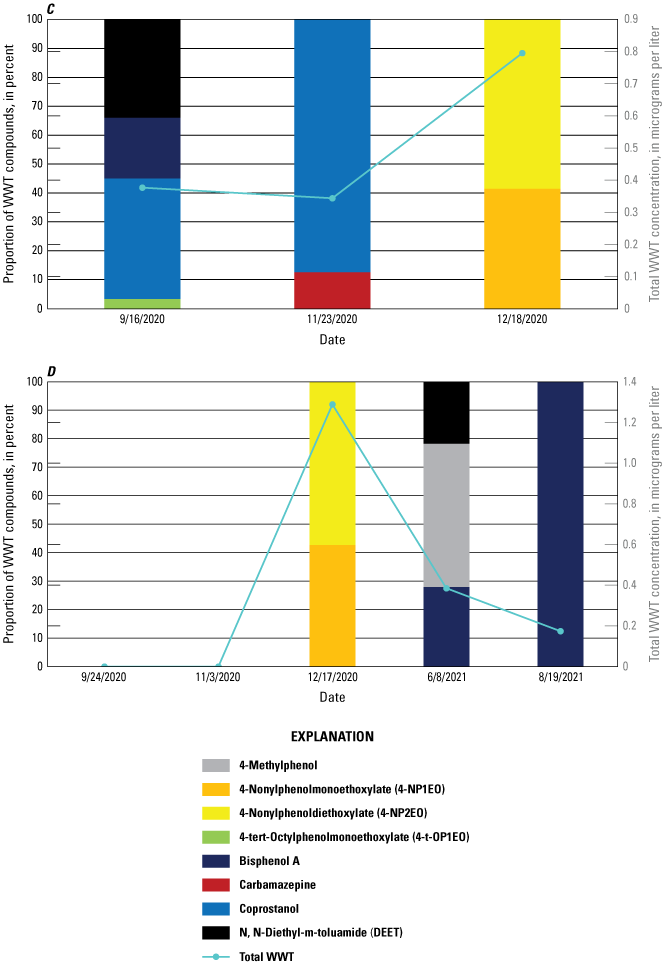
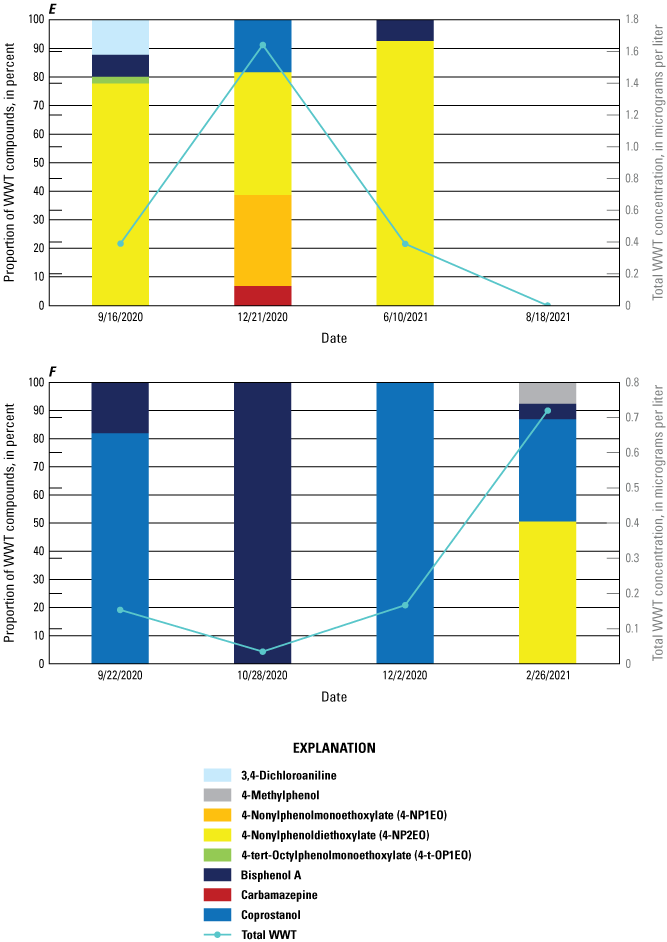
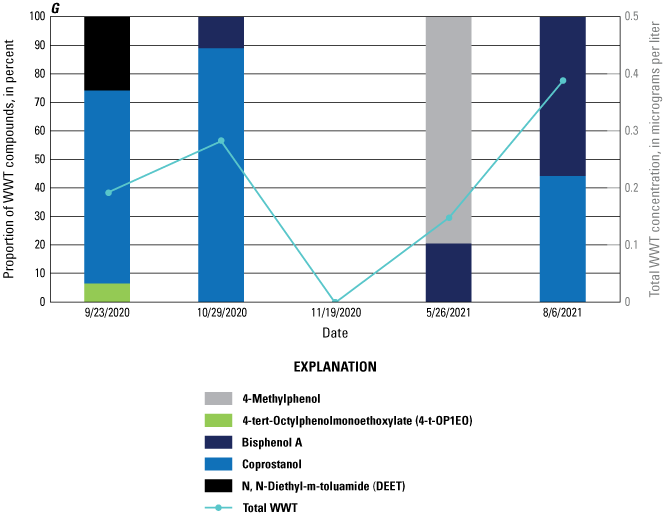
Proportion of wastewater tracer (WWT) compounds and total wastewater compound concentrations in surface-water samples with multiple compound detectable concentrations at A, Rio Chama near Abiquiu Dam, New Mexico; B, Rio Grande above Buckman Diversion near White Rock, N. Mex.; C, Rio Grande at Alameda Bridge at Alameda, N. Mex.; D, Pecos River near Puerto de Luna, N. Mex.; E, Pecos River near Artesia, N. Mex.; F, San Juan River near Archuleta, N. Mex.; and G, Animas River at Farmington, N. Mex.
Table 21.
Summary of wastewater tracer constituents and associated method identification, laboratory, and detection level information.[NA, value not available; aka, also known as]
Rio Grande Alameda had a total wastewater tracer concentration ranging from 0.34 to 0.80 µg/L with the following seven wastewater tracer compounds present, the most of any site: bisphenol A, carbamazepine, coprostanol, N,N-diethyl-meta-toluamide (DEET), 4-NP1EO, 4-NP2EO, and 4-t-OP1EO (fig. 15C). Rio Chama Abiquiu had a total wastewater tracer concentration ranging from not detected to 1.16 µg/L with six compounds present, including bisphenol A, DEET, 4-methylphenol, 4-NP2EO, and 4-t-OP1EO (fig. 15A). Rio Grande Buckman had a total wastewater concentration ranging from not detected to 1.23 µg/L, with six compounds present, namely bisphenol A, coprostanol, DEET, triclosan, 4-NP1EO, and 4-NP2EO (fig. 15B). Pecos Artesia had a total wastewater tracer concentration ranging from not detected to 1.64 µg/L (fig. 15E), which was the highest total wastewater concentration observed, and had seven compounds present, namely bisphenol A, carbamazepine, coprostanol, 3,4-Dichloroaniline, 4-NP1EO, 4-NP2EO, and 4-t-OP1EO. Pecos Puerto de Luna, Animas Farmington, and San Juan Archuleta all had five or fewer compounds detected (fig. 15D, F, G).
The higher overall concentrations and greater numbers of detections at some sites (Rio Grande Buckman, Rio Grande Alameda, and Pecos Artesia) might be associated with the relatively higher densities of urban infrastructure nearby, such as waste management facilities, airports, and other industrial manufacturing shown in table 6. All sites show some temporal variation in concentrations measured.
Dissolved Organic Carbon
DOC was detected at low concentrations in the majority of surface-water samples, with an average concentration of 1.84 mg/L. The highest DOC concentration was 3.4 mg/L at Rio Chama Abiquiu, which averaged 2.7 mg/L from five sampling events. Pecos River Artesia and Pecos Puerto de Luna had lower DOC concentrations compared to the rest of the sites.
Major and Trace Elements
The same seven surface-water sites analyzed for wastewater tracers were also sampled and analyzed for major/minor elements, trace elements, and REEs. Principal components analysis was conducted to characterize chemical composition of surface-water sites using Spearman-ranked trace-element data, which reduced dimensionality. The principal components analysis (fig. 16) separates the samples relative to five predominant analyte groups characterized by higher levels of (1) specific conductance, certain major/minor elements (calcium [Ca], boron [B], and lithium [Li]), and the ratio of Gd measured in the sample to background Gd (Gd/Gdbackground); (2) trace elements (iron [Fe], copper [Cu], and lead [Pb]) and REEs (lanthanum [La] and sum of REEs); (3) uranium (U) and potassium (K); (4) molybdenum (Mo) and cadmium (Cd); and (5) arsenic (As), vanadium (V), and silicon dioxide (SiO2), as depicted in figure 16B. The first principal component accounted for 44 percent of the dataset variability and was driven by differences in characteristics between water groups 1 and 2, and the second principal component represented 20 percent of the variability.
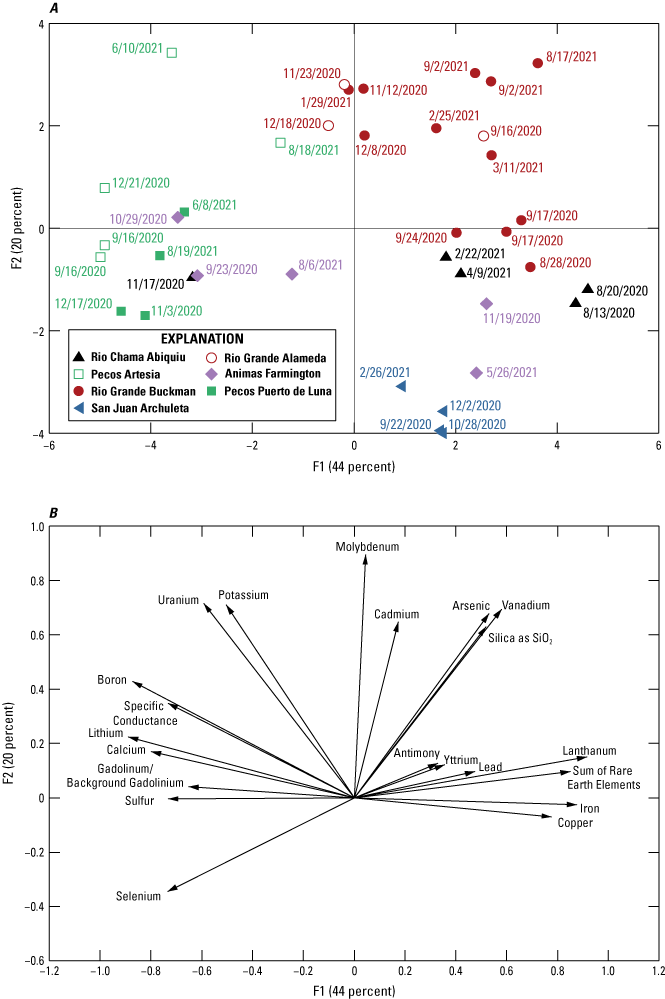
Principal components analysis of Spearman-ranked trace-element data. A, Surface-water samples plotted relative to their position on the principal component axes, where the different symbols are used for each location and the sampling date is next to the symbol, and B, plot of the magnitude and direction of chemical analytes that influence separation of surface-water samples along principal components.
Chemical compositions for samples from Pecos Puerto de Luna and Pecos Artesia plot in locations on figure 16A that indicate relatively high conductivity and major-element concentrations (water group 1). Samples from Pecos Artesia are additionally characterized by relatively high concentrations of U and K (water group 3).
Samples from Rio Grande Alameda and Rio Grande Buckman generally included relatively high concentrations of As, Cd, Mo, SiO2, and V (similar to water groups 4 and 5). However, samples collected at Rio Grande Buckman from August 28, 2020, to September 24, 2020, plotted near samples from the Rio Chama Abiquiu (fig. 16A), which are characterized by relatively high concentrations of trace elements and REEs (water group 2).
Samples collected from Animas Farmington on certain dates plotted with the high conductivity waters (water group 1: sampling dates October 29, 2020, September 23, 2020, and August 6, 2021) and samples collected on other dates plotted much closer to the waters with relatively high trace-element and REE concentrations (water group 2: sampling dates November 19, 2020, and May 26, 2021). San Juan Archuleta differed from other study sites along the second principal component axis (fig. 16A).
REEs were normalized to the North American shale composite (Gromet and others, 1984; Piper and Bau, 2013) to understand anomalous values, and these ratios are plotted in figure 17. A Gd anomaly related to wastewater will tend toward greater peak height, in contrast to other nearby REEs. A positive Gd anomaly is observed in figure 17H for Animas Farmington on September 23, 2020, and October 29, 2020, whereas Gd enrichment is not observed for the later sampling dates of November 19, 2020, May 26, 2021, and August 6, 2021. This anomaly at Animas Farmington may suggest a wastewater signature because of the presence of three wastewater treatment facilities nearby. The drop in Gd enrichment after October 2020 could be due to lower frequency of MRI screenings during this time resulting either from medical services restrictions during the COVID-19 pandemic, changes in local hospital waste policies, WWTP upgrades, or dilution by additional sources of water to the river system. A positive Gd anomaly was also observed at Pecos Artesia only for the December 21, 2020, sample (fig. 17F), which corresponded with higher wastewater tracer detections, including carbamazepine, and may suggest a higher proportion of wastewater present at that site during that sampling event. Slight peaks in Gd may be present for the Rio Grande Alameda samples from November and December 2020 (fig. 17D) but were not observed at San Juan Archuleta or Rio Grande Buckman (fig. 17B, G).
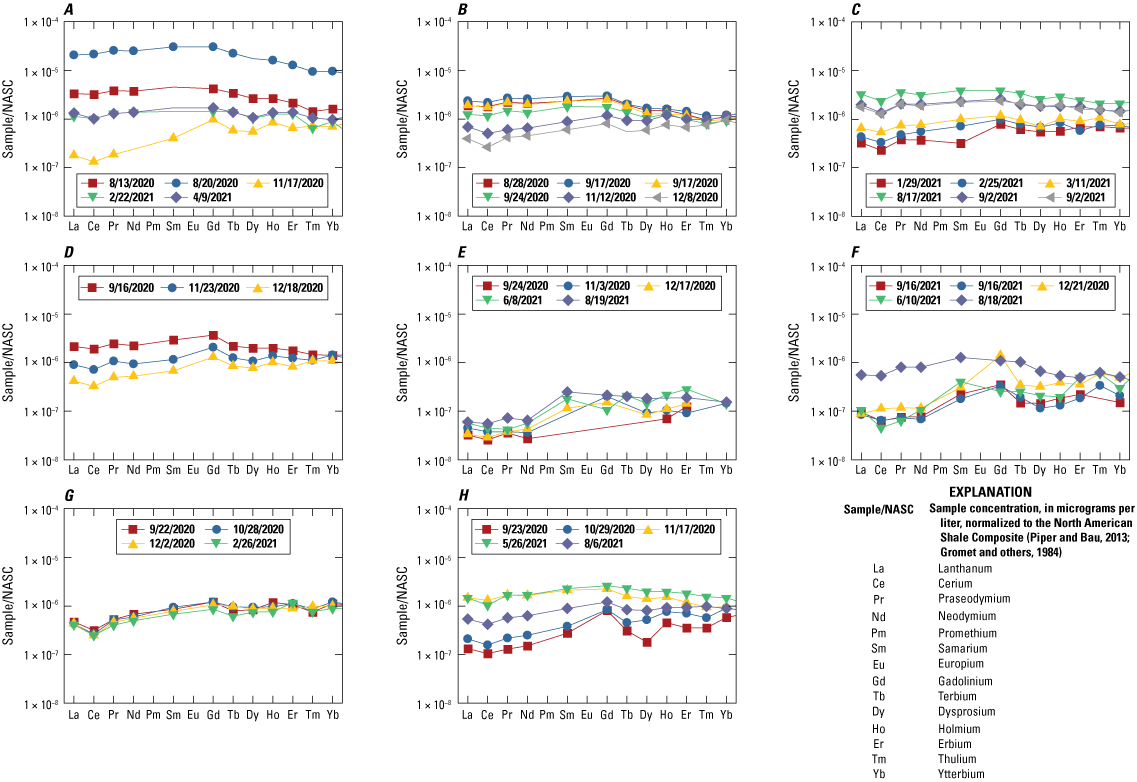
Observed rare earth element concentrations normalized to the North American shale composite (NASC) (Gromet and others, 1984; Piper and Bau, 2013) show gadolinium anomalies for surface-water samples from A, Rio Chama near Abiquiu Dam, New Mexico; B, Rio Grande above Buckman Diversion near White Rock, N. Mex. (2020 samples only); C, Rio Grande above Buckman Diversion near White Rock, N. Mex. (2021 samples only); D, Rio Grande at Alameda Bridge at Alameda, N. Mex.; E, Pecos River near Puerto de Luna, N. Mex.; F, Pecos River near Artesia, N. Mex.; G, San Juan River near Archuleta, N. Mex.; and H, Animas River at Farmington, N. Mex.
Although an enrichment in Gd was observed at some of the other site locations, there was an enrichment in other REEs for the same samples, which could indicate that some Gd anomalies are from natural contributions rather than anthropogenic wastewater contributions. This natural geochemical contribution may explain the slight Gd enrichments observed in Gd/Gdbackground values for samples from Pecos Puerto de Luna on November 3, 2020 (fig. 17E), Pecos Artesia on September 16, 2021 (fig. 17F), and Rio Chama Abiquiu on November 17, 2020 (fig. 17A). Multivariate Statistical Relations Between PFAS and Geochemical Indicators
Multivariate statistics can provide a helpful analysis of factors contributing to water evolution and to the occurrence of anthropogenic compounds. NMDS and cluster analyses were performed separately for groundwater and surface-water samples.
Groundwater
Multivariate analysis was conducted for 15 groundwater sites that had PFAS above the laboratory reporting level. Dissimilarity between samples was assessed using NMDS for tritium, DOC, and certain PFAS (PFBS, PFBA, 6:2FTS, PFHxA, PFOA, and PFPeA). Some sites had low-level detections of other PFAS (PFDA, PFHpA, PFHxS, PFNA, PFOS, and PFPeS) that were close to laboratory detection levels and did not show differentiation compared with censored values. The NMDS analysis of groundwater samples resulted in two convergent solutions with a stress of 0.065 (fig. 18). NMDS stress values ≤0.1 are considered fair, values ≤0.05 indicate good fit, and values ≥ 0.2 are deemed suspect, suggesting a fair to good fit for the groundwater samples (Buttigieg and Ramette, 2014). Separation between samples along the first NMDS axis (NMDS1 in fig. 18) was driven by differences in tritium, DOC, and nitrate. PFHxA, PFBS, and PFPeA show some similarity and are correlated with each other (fig. 19), whereas PFBA separates samples on the secondary NMDS axis (NMDS2 in fig. 18) and is significantly correlated (p value of 0.02) only with tritium. Two samples (48 and 82.1) had only 6:2FTS detections and plotted separately from the other samples. The sample from site 106 had a detection only of PFOA, along with elevated nitrate and low tritium and DOC. Two sites (18 and 44) were sampled more than once and show similarity between the samples compared with other sites. A cluster analysis was also run on the same analytes that were included in the NMDS, with the highest Calinski criterion of 11.2 at eight groups, indicating that there are eight distinct groups (as indicated by the colors of sample numbers on figure 20). The large number of distinct groups identified within a small sample set suggests that widely varying geochemical processes and sources of anthropogenic compounds contribute to the PFAS signature of each groundwater sample. Therefore, tritium, DOC, and nitrate alone may not be representative proxies for assessing PFAS on a statewide scale across New Mexico, although they could be relevant on a local scale.
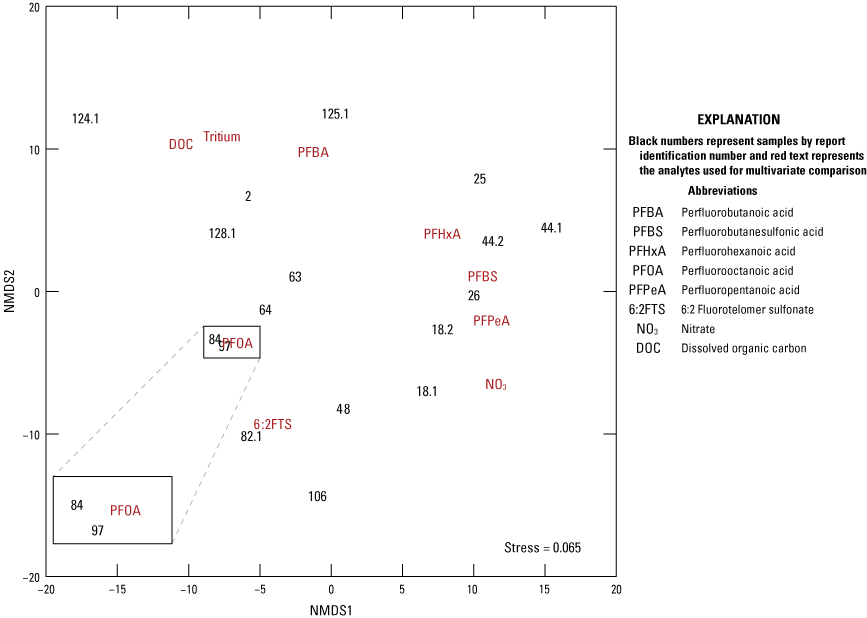
Nonmetric multidimensional scaling (NMDS) plot for groundwater samples with per- and polyfluoroalkyl substances detections. Dashed lines show closeup view of area with close data points.
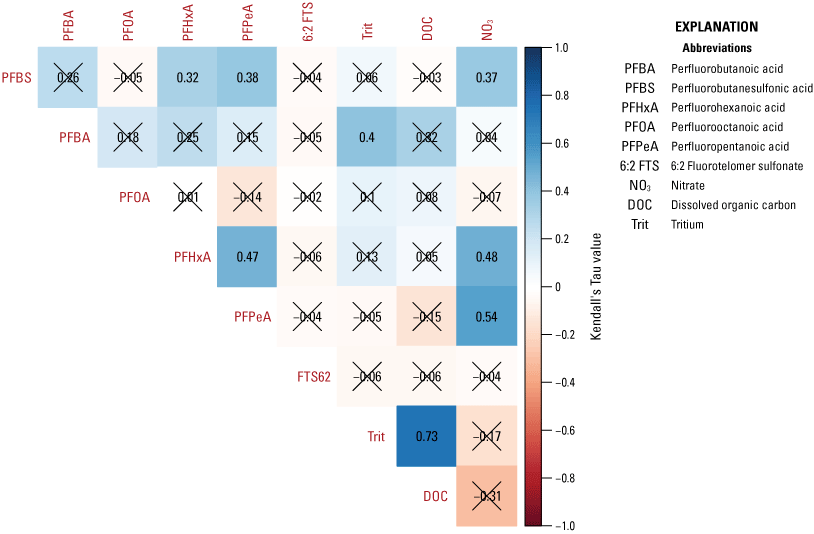
Correlation matrix for groundwater samples with per- and polyfluoroalkyl substances detections including the Kendall’s tau value for elemental pairs, where values with an X are not statistically significant with p greater than 0.05.
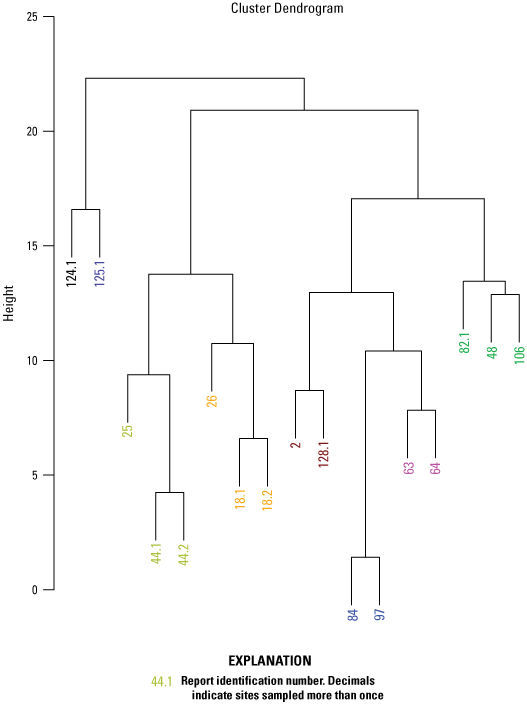
Cluster analysis for groundwater samples with per- and polyfluoroalkyl substances detections where colors distinguish different statistical groupings of the samples.
PFAS Occurrence and Geochemical Indicators in Groundwater
The correlation of some PFAS with tritium suggests that the contribution of groundwater recharge occurring after 1952 is important to understand PFAS occurrence in the groundwater sampled for this study. Groundwater samples with detections of PFAS generally had tritium values in the mixed and modern category, ranging from 1.06 to 17.56 pCi/L, suggesting that these groundwater sites yielded samples containing a component of water that fell as precipitation after 1952. Groundwater recharge occurring during the modern period may be more likely to interact with and mobilize anthropogenic compounds present at the surface that become incorporated into the water as it moves through the subsurface, ultimately becoming part of the groundwater (Böhlke and Denver, 1995; Manning and others, 2005; McMahon, 2012). Five sites with detections of PFAS (sites 14, 18, 19, 48, and 106) had premodern values of tritium (fig. 21). One possible explanation for samples of premodern water having PFAS detections is that PFAS are present in a contribution from anthropogenic infrastructure, such as septic system or wastewater treatment plant effluent, where the water was originally derived from pumping of premodern groundwater; because the tritium is part of the water molecule, more tritium would not be acquired from contact with the modern atmosphere (Kuroda and others, 2014).
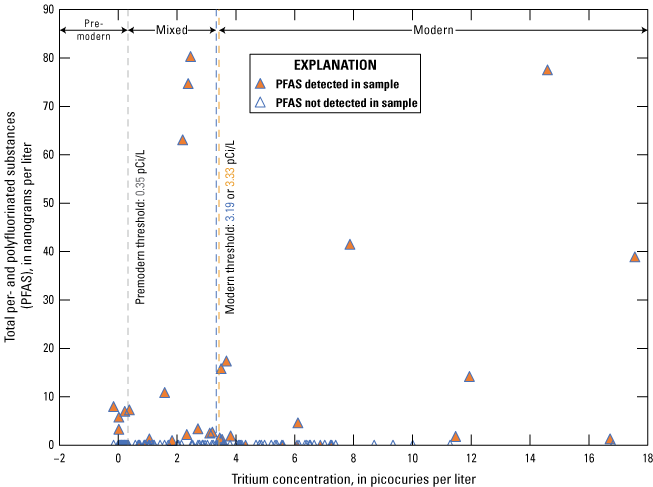
Tritium versus total per- and polyfluoroalkyl substances (PFAS) concentration.
Tritium concentrations can help to explain differences in PFAS occurrence in groundwater from nearby wells. Two wells (43 and 44), located within 0.5 mi of each other and completed at similar depths in the High Plains aquifer, showed differences in tritium concentration (below the sample-specific critical levels of 0.2 and 2.38 pCi/L, respectively) and in corresponding groundwater age category. Site 44 was sampled three times and had some of the highest total PFAS concentrations observed during this study, ranging from 63.1 to 80.3 ng/L, whereas site 43 was sampled twice and had no PFAS detections. The tritium concentration at site 44 suggests a contribution of modern water is present that may be related to the PFAS detections.
Sites 124, 125, and 128 had PFAS detections in samples collected in April 2021 (samples ending with “.1”), but not in samples from October 2021 (samples ending with “.2”) (table 16). Sites 124 and 125 had elevated specific conductance (2,670 and 961 µS/cm) and pH values (8.1 and 7.8) compared with nearby groundwater sites. Sites 112–127, excluding 124 and 125, had specific conductance ranging from 469 to 894 µS/cm. In contrast, site 128 had lower specific conductance (372 µS/cm).
For the April 2021 samples, the water types differed among all three sites (124, 125, 128) compared to the compositions of groundwater from other sites in that area (112–119, 123, 126, 127, 129–132) (fig. 8A). The October 2021 samples for sites 124, 125, and 128 were more similar to the general group of samples in that area, which have calcium-bicarbonate type waters.
Springs 124, 125, and 128 had an evaporative stable isotopic signature during the April 2021 sampling event (fig. 10). When the springs were resampled in October 2021 and flow was higher, they did not have any PFAS detected and had stable isotopic signatures similar to those of other springs and wells in the area during the April sampling event (sites 112–128). The samples with PFAS detections may indicate concentration in evaporated water that is localized and not representative of other groundwater in the area.
Springs 124, 125, and 128 had PFAS detected in samples collected in April 2021 and had higher tritium concentrations (11.94–17.56 pCi/L) than nearby springs and wells (sites 112–128; 4.2–9.34 pCi/L). The samples with PFAS detections and elevated tritium may represent evaporated water or other seasonal contributions of modern water that are localized and not representative of other groundwater in the area.
Two other sites located near each other (140 and 141) had a large difference in tritium, as well as a difference in stable isotopes, suggesting that the source of water to each site was different. Site 140 is located closer to the Rio Grande and had a higher TDS value (675 mg/L), a more enriched and evaporated stable isotopic signature (−77.6 and −9.42 per mil for δ2H and δ18O, respectively), a tritium concentration of 11.5 pCi/L, and a higher 14C concentration of 94.7 pmc; site 141 had a lower TDS value (473 mg/L), lighter stable isotopes (−89.1 and −11.4 per mil for δ2H and δ18O, respectively), a tritium concentration below the sample-specific critical level (analogous to the laboratory reporting level) of 0.06 pCi/L, and a lower 14C concentration of 56.1 pmc. Site 141 had results more similar to other groundwater sampled farther south in Doña Ana County at sites 144, 145, and 146 (which all had a higher proportion of sodium). There was a low-level PFOS detection at site 140, and the presence of modern evaporated water may suggest that the component of younger water (possibly recharge from the Rio Grande) is susceptible to anthropogenic compounds.
Surface Water
Multivariate analysis was conducted for 61 surface-water samples that had PFAS concentrations above the laboratory reporting level. Other analytes associated with PFAS samples were not collected for all surface-water samples, so they were not added to the multivariate analysis presented here. Dissimilarity between samples was assessed using NMDS for certain PFAS (PFBS, PFBA, 6:2FTS, PFHxA, PFOA, PFOS, and PFPeA). Some sites had low-level detections of other PFAS (PFDA, PFHpA, PFHxS, PFNA, PFOSA, and PFPeS) that were close to laboratory reporting levels and did not show differentiation compared with censored values. The NMDS analysis of surface-water samples resulted in two convergent solutions with a stress of 0.10 (fig. 22), suggesting a fair fit (Buttigieg and Ramette, 2014). Separation between samples along the first NMDS axis (NMDS1 in fig. 22) was driven by differences between PFHxA, PFOA, PFOS, PFBA, and PFPeA compared with 6:2 FTS (which is not correlated with the other PFAS) (figs. 22 and 23), whereas PFBS separates samples on the first and secondary NMDS axes and is not correlated with other PFAS.
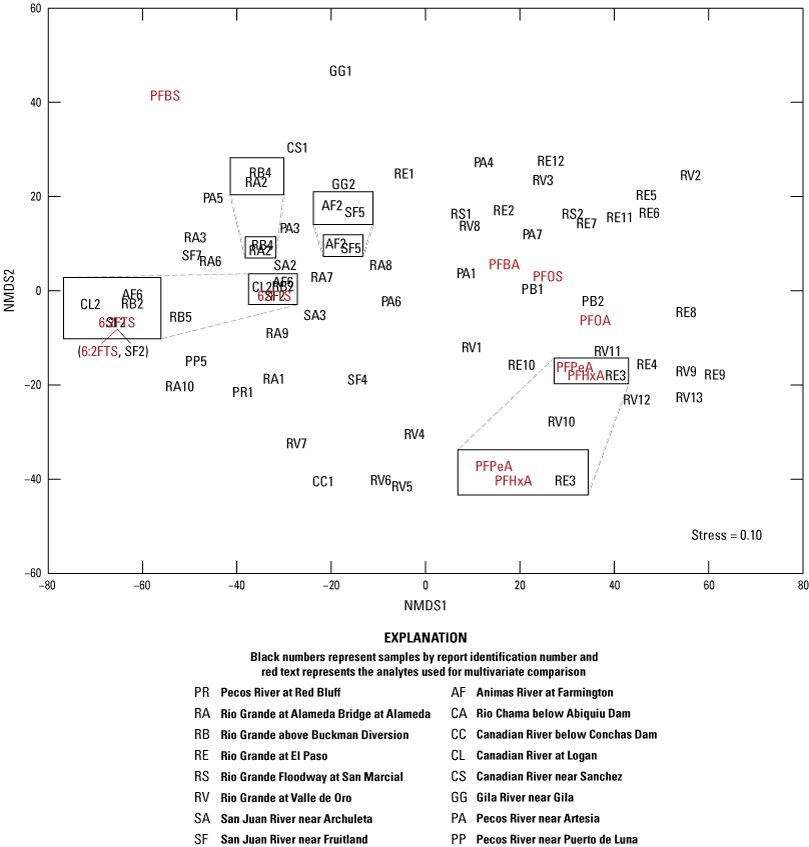
Nonmetric multidimensional scaling (NMDS) plot for surface-water samples with per- and polyfluoroalkyl substances detections.
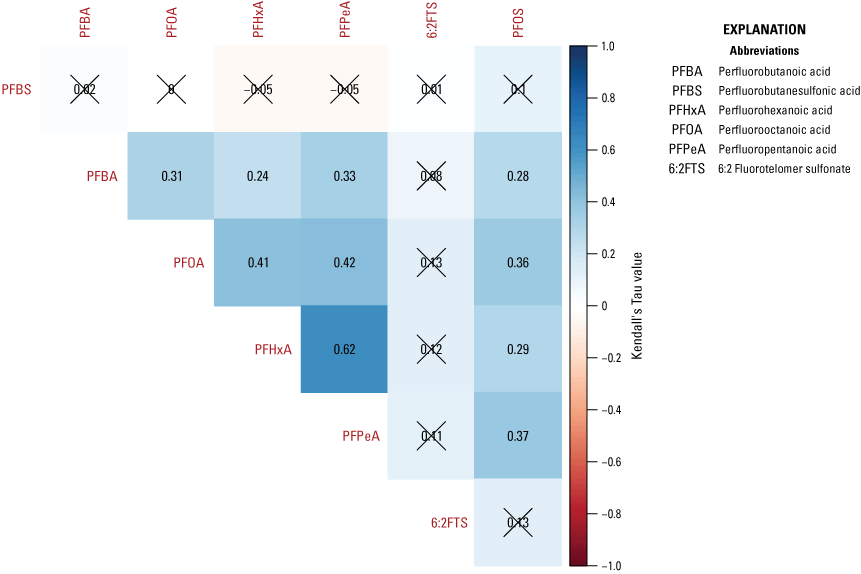
Correlation matrix for surface-water samples with per and polyfluoroalkyl substances detections including the Kendall’s tau value for elemental pairs, where values with an X are not statistically significant with p greater than 0.05.
A cluster analysis was also run on the same analytes that were included in the NMDS, with the Calinski criterion indicating there are two distinct groups. The cluster analysis included a large number of samples, and the visual representation of these data was too crowded to display in a figure, so the results are discussed in this section without a figure to reference. The conclusion that PFAS results form two distinct groups in surface-water samples across the State suggests that there may be similar PFAS sources contributing to each distinct group of samples. One group includes samples with multiple detections of different PFAS (Rio Grande Valle de Oro, Rio Puerco Bernardo, Rio Grande Floodway and Rio Grande El Paso, some samples from Pecos Artesia, and some samples from Animas Farmington), and the other group includes samples with low-level PFAS below the laboratory reporting level or no detections of PFAS (all samples from Canadian Sanchez, Canadian Conchas, Canadian Logan, Rio Chama Abiquiu, Rio Grande Buckman, Rio Grande Alameda; samples from December 2020 and February and March 2021 at Rio Grande Valle de Oro, Pecos Puerto de Luna; some samples from October 2020 and June and August 2021 at Pecos Artesia, Pecos Red Bluff, San Juan Archuleta; and some samples from Animas Farmington, San Juan Fruitland, and Gila).
Limitations of a Statewide Assessment
The statewide scale of this study was designed to locate surface waters and groundwater with occurrence of PFAS to inform subsequent investigations into potential sources of these PFAS and allow for more focused sampling in areas where PFAS are present in drinking water. The existing study design made it difficult to perform statistically rigorous multivariate analyses or create correlational plots to definitively characterize geochemical characteristics of the sampled surface waters in relation to PFAS occurrence at this time, and particularly to characterize any relations between detections of wastewater tracers and PFAS. Wastewater tracers and geogenic/anthropogenic trace and REE concentrations could be used to better characterize sources of discharge into surface waters and to improve correlation analysis by (1) collecting PFAS, wastewater tracer, and trace and REE samples consistently from individual sites during single sampling events, and across multiple sites during similar time periods; (2) timing seasonal sampling events systematically to better capture low-flow and high-flow hydrologic events; and (3) choosing site locations that are above and below nearby urban development or facilities with potential PFAS use.
Summary
Per- and polyfluoroalkyl substances (PFAS) have previously been detected in public and private drinking-water wells, springs, and surface waters in New Mexico; however, the presence and distribution of PFAS in water resources across the State has not been well characterized. The U.S. Geological Survey, in cooperation with the New Mexico Environment Department, began collecting water-quality samples from groundwater and surface-water sites throughout New Mexico in August 2020. Sample locations were selected to cover a large spatial area, including urban areas and rural areas. Groundwater wells, springs, and surface-water sites (at established streamgaging locations) were sampled from August 2020 through October 2021.
Groundwater samples were collected from unconfined water-table aquifers at 117 groundwater well locations and 24 springs, and surface-water samples were collected from 6 surface-water diversions and 18 streamgaging locations, which were primarily sampled during stable flows and not after storm events. All samples were analyzed for PFAS and field parameters. Groundwater samples also were analyzed for an extensive geochemical suite (major ions, trace elements, nutrients, dissolved organic carbon [DOC], stable isotopes of oxygen and hydrogen, tritium, and carbon-14, and selected surface-water samples were analyzed for major ions, trace elements, DOC, and wastewater tracers. Blanks and replicates were collected to assess bias and variability in the results for PFAS, wastewater tracers, and geochemical compounds (including major ions, trace elements, nutrients, and DOC).
The majority of the groundwater samples from this study did not have any detections of PFAS. (Concentrations were reported by the laboratory as being below the laboratory detection level.) Over the course of the study, 22 sites were sampled more than once, and 3 sites were sampled as many as three times. At 30 sites, PFAS was detected during one or more sampling events. Total PFAS concentrations ranged from 0.91 nanograms per liter (ng/L) at site 136 to 80.3 ng/L at site 44 (second sampling). There were no exceedances of the 2016 U.S. Environmental Protection Agency health advisory of 70 ng/L for perfluorooctanoic acid (PFOA) plus perfluorooctane sulfonic acid (PFOS). The most frequently detected PFAS at groundwater sites were perfluorobutanesulfonic acid (PFBS; 11 sites), perfluoropentanoic acid (PFPeA; 10 sites), and perfluorohexanoic acid (PFHxA; 9 sites). The High Plains aquifer had the most detections, totaling 13 sites. Excluding the springs, the PFAS signature did not change substantially between initial sampling and resampling at each site.
PFAS detections were quite variable within and between surface-water systems. Some sites were located in undeveloped areas that were expected to represent reference sites with low to no PFAS detections, but some of those sites had intermittent PFAS detections. Other sites, particularly those located downstream from urban areas, had numerous PFAS detections. PFPeA was the most frequently detected PFAS across all sites and events (57 instances, ranging from 1.0 to 29 ng/L), and PFBS was the second most frequently detected PFAS (53 instances, ranging from 1.0 to 93 ng/L). Total PFAS concentrations ranged from 1.0 to 155.4 ng/L at Rio Grande Valle de Oro, which had the greatest single concentration of an individual PFAS with 93 ng/L of PFBS.
Statistical analysis of selected analytes from the groundwater results indicated that some PFAS were associated with each other (PFHxA, PFBS, and PFPeA), suggesting similar sources and that some PFAS compounds were also correlated with tritium, DOC, and nitrate, which indicated that the presence of anthropogenic compounds could indicate a likely presence of PFAS. However, a cluster analysis identified several groups, and suggested that varying geochemical processes and sources of anthropogenic compounds contribute to the PFAS signature of each individual groundwater sample. Therefore, tritium, DOC, and nitrate alone may not be representative proxies for assessing PFAS on a statewide scale across New Mexico, although they could be relevant on a local scale. In surface-water samples, PFHxA, PFOA, PFOS, perfluorobutanoic acid (PFBA), and PFPeA were correlated with each other, suggesting similar sources contribute these PFAS compounds to surface-water sites in this study.
Results of this study have helped to establish baseline PFAS occurrence in the water resources of New Mexico, provide geochemical context for groundwater and surface-water evolution, and elucidate knowledge gaps that could help refine sampling efforts in areas where PFAS are known to be present in the environment.
References Cited
Ahrens, L., Felizeter, S., Sturm, R., Xie, Z., and Ebinghaus, R., 2009, Polyfluorinated compounds in waste water treatment plant effluents and surface waters along the River Elbe, Germany: Marine Pollution Bulletin, v. 58, no. 9, p. 1326–1333, accessed March 29, 2022, at https://doi.org/10.1016/j.marpolbul.2009.04.028.
Albuquerque Bernalillo County Water Utility Authority, 2021, Albuquerque’s drinking water system: Albuquerque Bernalillo County Water Utility Authority web page, accessed February 4, 2022, at https://www.abcwua.org/education-education-el_wsd_2/.
Albuquerque Bernalillo County Water Utility Authority, 2022, San Juan-Chama Project: Albuquerque Bernalillo County Water Utility Authority web page, accessed September 28, 2022, at https://www.abcwua.org/your-drinking-water-san-juan-chama-project/.
Anderholm, S.K., 1987, Hydrogeology of the Socorro and La Jencia Basins, Socorro County, New Mexico: U.S. Geological Survey Water-Resources Investigations Report 84–4342, 62 p., accessed April 8, 2022, at https://pubs.usgs.gov/wri/1984/4342/report.pdf.
Barber, L.B., Brown, G.K., and Zaugg, S.D., 2000, Potential endocrine disrupting organic chemicals in treated municipal wastewater and river water, in Keith, L.H., Jones-Lepp, T.L., and Needham, L.L., eds., Analysis of environmental endocrine disruptors: Washington D.C., American Chemical Society Symposium Series 747, p. 97–123.
Bartolino, J.R., and Cole, J.C., 2002, Ground-water resources of the Middle Rio Grande Basin, New Mexico: U.S. Geological Survey Circular 1222, 132 p., accessed November 28, 2021, at https://doi.org/10.3133/cir1222.
Beisner, K.R., and Jones, C.J.R., 2020, Geochemical assessment of groundwater in the Big Chino subbasin, Arizona, 2011–18: U.S. Geological Survey Scientific Investigations Report 2020–5094, 49 p., accessed September 29, 2022, at https://doi.org/10.3133/sir20205094.
Bexfield, L.M., Thiros, S.A., Anning, D.W., Huntington, J.M., and McKinney, T.S., 2011, Effects of natural and human factors on groundwater quality of basin-fill aquifers in the southwestern United States—Conceptual models for selected contaminants: U.S. Geological Survey Scientific Investigations Report 2011–5020, 90 p., accessed September 29, 2022, at https://pubs.usgs.gov/sir/2011/5020/.
Böhlke, J.K., and Denver, J.M., 1995, Combined use of groundwater dating, chemical, and isotopic analyses to resolve the history and fate of nitrate contamination in two agricultural watersheds, Atlantic Coastal Plain, Maryland: Water Resources Research, v. 31, no. 9, p. 2319–2339, accessed April 28, 2022, at https://doi.org/10.1029/95WR01584.
Boone, J.S., Vigo, C., Boone, T., Byrne, C., Ferrario, J., Benson, R., Donohue, J., Simmons, J.E., Kolpin, D.W., Furlong, E.T., and Glassmeyer, S.T., 2019, Per- and polyfluoroalkyl substances in source and treated drinking waters of the United States: Science of the Total Environment, v. 653, p. 359–369, accessed August 4, 2021, at https://doi.org/10.1016/j.scitotenv.2018.10.245.
Buckman Direct Diversion, 2015, How the BDD works: Buckman Direct Diversion Project web page, accessed December 10, 2021, at https://bddproject.org/about-the-bdd/how-the-bdd-works/.
Bureau of Reclamation, 2021, Pecos River Basin—New Mexico: Bureau of Reclamation web page, accessed February 8, 2022, at https://www.usbr.gov/watersmart/bsp/docs/finalreport/Pecos/PRNMB-final-9-20-2021.pdf.
Busch, J., Ahrens, L., Sturm, R., and Ebinghaus, R., 2010, Polyfluoroalkyl compounds in landfill leachates: Environmental Pollution, v. 158, no. 5, p. 1467–1471, accessed March 29, 2022, at https://doi.org/10.1016/j.envpol.2009.12.031.
City of Albuquerque Parks and Recreation Department Open Space Division, 2014, Resource Management Plan for Tijeras Arroyo Biological Zone: City of Albuquerque web page, accessed December 13, 2021, at https://www.cabq.gov/parksandrecreation/documents/r-82-resource-mgmt-plan-for-tijeras-arroyo-final.pdf.
Craig, H., 1961, Isotopic variations in meteoric waters: Science, v. 133, no. 3465, p. 1702–1703, accessed September 24, 2022, at https://doi.org/10.1126/science.133.3465.1702.
Crone, B.C., Speth, T.F., Wahman, D.G., Smith, S.J., Abulikemu, G., Kleiner, E.J., and Pressman, J.G., 2019, Occurrence of per-and polyfluoroalkyl substances (PFAS) in source water and their treatment in drinking water: Critical Reviews in Environmental Science and Technology, v. 49, no. 24, p. 2359–2396, accessed April 14, 2022, at https://doi.org/10.1080/10643389.2019.1614848.
Dewitz, J., and U.S. Geological Survey, 2021, National Land Cover Database (NLCD) 2019 products (ver. 2.0, June 2021): U.S. Geological Survey data release, accessed November 8, 2021, at https://doi.org/10.5066/P9KZCM54.
Esri, 2023, ArcGIS Pro 3.1.1: Redlands, Calif., Environmental Systems Research Institute software release, accessed February 1, 2023, at https://community.esri.com/t5/arcgis-pro-documents/arcgis-pro-3-1-patch-1-is-now-available/ta-p/1276363.
Fishman, M.J., ed., 1993, Methods of analysis by the U.S. Geological Survey National Water Quality Laboratory—Determination of inorganic and organic constituents in water and fluvial sediments: U.S. Geological Survey Open File Report 93–125, 217 p., accessed September 22, 2022, at https://doi.org/10.3133/ofr93125.
Fishman, M.J., and Friedman, L.C., 1989, Methods for determination of inorganic substances in water and fluvial sediments: U.S. Geological Survey Techniques of Water-Resources Investigations, book 5, chap. A1, 545 p., accessed September 22, 2022, at https://doi.org/10.3133/twri05A1.
Flickinger, A.K., and Shephard, Z.M., 2022, Water-quality trends in surface waters of the Jemez River and Middle Rio Grande Basin from Cochiti to Albuquerque, New Mexico, 2004–19: U.S. Geological Survey Scientific Investigations Report 2022–5062, 33 p., accessed September 29, 2022, at https://doi.org/10.3133/sir20225062.
Furlong, E.T., Werner, S.L., Anderson, B.D., and Cahill, J.D., 2008, Determination of human-health pharmaceuticals in filtered water by chemically modified styrene-divinylbenzene resin-based solid-phase extraction and high-performance liquid chromatography/mass spectrometry: U.S. Geological Survey Techniques and Methods, book 5, chap. B5, 56 p.
Garbarino, J.R., Kanagy, L.K., and Cree, M.E., 2006, Determination of elements in natural-water, biota, sediment, and soil samples using collision/reaction cell inductively coupled plasma–mass spectrometry: U.S. Geological Survey Techniques and Methods, book 5, chap. B1, 88 p., accessed September 22, 2022, at https://pubs.usgs.gov/tm/2006/tm5b1/.
Glüge, J., Scheringer, M., Cousins, I.T., DeWitt, J.C., Goldenman, G., Herzke, D., Lohmann, R., Ng, C.A., Trier, X., and Wang, Z., 2020, An overview of the uses of per- and polyfluoroalkyl substances (PFAS): Environmental Science, Processes & Impacts, v. 22, p. 2345–2373, accessed March 29, 2022, at https://doi.org/10.1039/D0EM00291G.
Gromet, L.P., Haskin, L.A., Korotev, R.L., and Dymek, R.F., 1984, The “North American shale composite”—Its compilation, major and trace element characteristics: Geochimica et Cosmochimica Acta, v. 48, no. 12, p. 2469–2482, accessed July 13, 2022, at https://doi.org/10.1016/0016-7037(84)90298-9.
Han, L.-F., and Plummer, L.N., 2013, Revision of Fontes & Garnier’s model for the initial 14C content of dissolved inorganic carbon used in groundwater dating: Chemical Geology, v. 351, p. 105–114, accessed November 16, 2021, at https://doi.org/10.1016/j.chemgeo.2013.05.011.
Han, L.-F., and Plummer, L.N., 2016, A review of single sample-based models and other approaches for radiocarbon dating of dissolved inorganic carbon in groundwater: Earth-Science Reviews, v. 152, p. 119–142, accessed November 16, 2021, at https://doi.org/10.1016/j.earscirev.2015.11.004.
Han, L.-F., Plummer, L.N., and Aggarwal, P., 2012, A graphical method to evaluate predominant geochemical processes occurring in groundwater systems for radiocarbon dating: Chemical Geology, v. 318–319, p. 88–112, accessed November 16, 2021, at https://doi.org/10.1016/j.chemgeo.2012.05.004.
Helsel, D.R., 2016, Calculating uscores in R: Practical Stats web page, accessed January 9, 2017, at https://www.practicalstats.com/nada/downloads_files/.
Helsel, D.R., Hirsch, R.M., Ryberg, K.R., Archfield, S.A., and Gilroy, E.J., 2020, Statistical methods in water resources: U.S. Geological Survey Techniques and Methods, book 4, chap. A3, 458 p., accessed February 25, 2022, at https://doi.org/10.3133/tm4a3. [Supersedes USGS Techniques of Water-Resources Investigations, book 4, chap. A3, version 1.1.]
Horton, J.D., 2017, The State Geologic Map Compilation (SGMC) geodatabase of the conterminous United States (ver. 1.1, August 2017): U.S. Geological Survey data release, accessed November 4, 2021, at https://doi.org/10.5066/F7WH2N65.
Houston, N.A., Thomas, J.V., Foster, L.K., Pedraza, D.E., and Welborn, T.L., 2021, Hydrogeologic framework and groundwater characterization in selected alluvial basins in the upper Rio Grande basin, Colorado, New Mexico, and Texas, United States, and Chihuahua, Mexico, 1980 to 2015: U.S. Geological Survey Scientific Investigations Report 2021–5035, 71 p., accessed May 26, 2023, at https://doi.org/10.3133/sir20215035.
Hu, X.C., Andrews, D.Q., Lindstrom, A.B., Bruton, T.A., Schaider, L.A., Grandjean, P., Lohmann, R., Carignan, C.C., Blum, A., Balan, S.A., Higgins, C.P., and Sunderland, E.M., 2016, Detection of poly- and perfluoroalkyl substances (PFASs) in US drinking water linked to industrial sites, military fire training areas, and wastewater treatment plants: Environmental Science & Technology Letters, v. 3, p. 344–350.
Intellus New Mexico, 2020, Quick search: Intellus New Mexico web page, accessed June 2, 2020, at https://www.intellusnm.com/reporting/quick-search/quick-search.cfm. [Data providers: Los Alamos National Laboratory, NMED DOE Oversight Bureau; Type of data: Analytical results; Type of samples: Water, Type of water: Base Flow, Ground Water, Water; Time period: June 2, 2015, to June 2, 2020; Where: Everywhere in the Los Alamos area; Analytical parameters: Select parameters from at list: Parameter Group: PFAS; Data Columns: default selected fields.]
Interstate Technology Regulatory Council, 2023, PFAS—Per- and polyfluoroalkyl substances—11 Sampling and Analysis: Interstate Technology Regulatory Council web page, accessed February 16, 2023, at https://pfas-1.itrcweb.org/11-sampling-and-analytical-methods/.
Jurgens, B., Faulkner, K., McMahon, P.B., Hunt, A., Casile, G.C., Young, M.B., and Belitz, K., 2022, Over a third of groundwater in USA public-supply aquifers is Anthropocene-age and susceptible to surface contamination: Nature Communications Earth & Environment, v. 3, article 153, 9 p., accessed September 19, 2022, at https://doi.org/10.1038/s43247-022-00473-y.
Jurgens, B.C., 2018, Data for tritium deposition in precipitation in the United States, 1953–2012: U.S. Geological Survey data release, https://doi.org/10.5066/P92CEFXN.
Jurgens, B.C., McMahon, P.B., Chapelle, F.H., and Eberts, S.M., 2009, An Excel workbook for identifying redox processes in ground water: U.S. Geological Survey Open-File Report 2009–1004, 8 p. [Also available at http://pubs.usgs. gov/of/2009/1004.]
Kuroda, K., Murakami, M., Oguma, K., Takada, H., and Takizawa, S., 2014, Investigating sources and pathways of perfluoroalkyl acids (PFAAs) in aquifers in Tokyo using multiple tracers: Science of the Total Environment, v. 488−489, p. 51−60, accessed April 28, 2022, at https://doi.org/10.1016/j.scitotenv.2014.04.066.
Land, L., and Newton, B.T., 2008, Seasonal and long-term variation in hydraulic head in a karstic aquifer—Roswell Artesian Basin, New Mexico: Journal of the American Water Resources Association, v. 44, p. 175–191, accessed September 21, 2022, at https://doi.org/10.1111/j.1752-1688.2007.00146.x.
Langman, J.B., and O’Nolan, E.O., 2005, Streamflow and water-quality trends of the Rio Chama and Rio Grande, northern and central New Mexico, water years 1985 to 2002: U.S. Geological Survey Scientific Investigations Report 2005–5118, 42 p., accessed September 29, 2022, at https://pubs.usgs.gov/sir/2005/5118/.
Lee, L., 2017, Package ‘NADA’—Nondetects and data analysis for environmental data, version 1.6-1: Comprehensive R Archive Network web page, accessed April 26, 2022, at https://cran.r-project.org/web/packages/NADA/NADA.pdf.
Lenka, S.P., Kah, M., and Lokesh, P., 2021, A review of the occurrence, transformation, and removal of poly- and perfluoroalkyl substances (PFAS) in wastewater treatment plants: Water Research, v. 199, article 117187, 22 p., accessed September 21, 2022, at https://doi.org/10.1016/j.watres.2021.117187.
Lindsey, B.D., Jurgens, B.C., and Belitz, K., 2019, Tritium as an indicator of modern, mixed, and premodern groundwater age: U.S. Geological Survey Scientific Investigations Report 2019–5090, 18 p., accessed March 24, 2022, at https://doi.org/10.3133/sir20195090.
Manning, A.H., Solomon, K.D., and Thiros, S.A., 2005, 3H/3He age data in assessing the susceptibility of wells to contamination: Ground Water, v. 43, no. 3, p. 353–367, accessed April 28, 2022, at https://doi.org/10.1111/j.1745-6584.2005.0028.x.
McMahon, P.B., 2012, Use of classes based on redox and groundwater age to characterize the susceptibility of principal aquifers to changes in nitrate concentrations, 1991 to 2010: U.S. Geological Survey Scientific Investigations Report 2012–5220, 41 p., accessed April 28, 2022, at https://doi.org/10.3133/sir20125220.
Meals, D.W., Richards, R.P., and Dressing, S.A., 2013, Pollutant load estimation for water quality monitoring projects—Tech Notes 8, April 2013: U.S. Environmental Protection Agency, prepared by Tetra Tech, Inc., Fairfax, Va., 21 p., accessed September 3, 2019, at https://cran.r-project.org/web/packages/NADA/NADA.pdf.
Medalie, L., Baker, N.T., Shoda, M.E., Stone, W.W., Meyer, M.T., Stets, E.G., and Wilson, M., 2020, Influence of land use and region on glyphosate and aminomethylphosphonic acid in streams in the USA: Science of the Total Environment, v. 707, article 136008, 9 p., accessed February 11, 2022, at https://doi.org/10.1016/j.scitotenv.2019.136008.
Michel, R.L., Jurgens, B.C., and Young, M.B., 2018, Tritium deposition in precipitation in the United States, 1953–2012: U.S. Geological Survey Scientific Investigations Report 2018–5086, 11 p., accessed March 24, 2022, at https://doi.org/10.3133/sir20185086.
Miller, J.A., 2000, Ground water atlas of the United States: U.S. Geological Survey Hydrologic Investigations Atlas HA–730, accessed March 24, 2022, at https://pubs.usgs.gov/ha/ha730/.
Moeser, C.D., Chavarria, S.B., and Wootten, A.M., 2021, Streamflow response to potential changes in climate in the Upper Rio Grande Basin: U.S. Geological Survey Scientific Investigations Report 2021–5138, 41 p., accessed April 21, 2022, at https://doi.org/10.3133/sir20215138.
Mueller, D.K., Schertz, T.L., Martin, J.D., and Sandstrom, M.W., 2015, Design, analysis, and interpretation of field quality-control data for water-sampling projects: U.S. Geological Survey Techniques and Methods, book 4, chap. C4, 54 p., accessed April 21, 2022, at https://doi.org/10.3133/tm4C4.
Natural Resources Conservation Service, 2022, Rapid watersheds assessments: Natural Resources Conservation Service web page, accessed December 10, 2021, at https://www.nrcs.usda.gov/wps/portal/nrcs/main/nm/technical/dma/rwa/.
New Mexico Environment Department, 2020, PFAS data: New Mexico Environment Department web page, accessed June 2, 2020, at https://www.env.nm.gov/pfas/data/.
New Mexico Office of the State Engineer/Interstate Stream Commission, 2018, New Mexico State Water Plan part II—Technical report: New Mexico Office of the State Engineer, prepared by the New Mexico Interstate Stream Commission, 126 p., accessed April 27, 2022, at https://www.ose.state.nm.us/Planning/SWP/2018/3-2018_SWP_Part_II_Technical_Report_plusAppendixes.pdf.
New Mexico Water Data, 2022, NPDES permits: New Mexico Water Data web page, accessed January 24, 2022, at https://catalog.newmexicowaterdata.org/en_AU/dataset/new-mexico-npdes-permits.
Oklahoma History Center, 2022, The encyclopedia of Oklahoma history and culture: Oklahoma Historical Society web page, accessed April 12, 2022, at https://www.okhistory.org/publications/enc/entry.php?entry=CA039.
Oksanen, J., Blanchet, F.G., Friendly, M., Kindt, R., Legendre, P., McGlinn, D., Minchin, P.R., O’Hara, R.B., Simpson, G.L., Solymos, P., Henry, M., Stevens, H., Szoecs, E., and Wagner, H., 2016, Package ‘vegan’—Community ecology package (ver. 2.4–1): Comprehensive R Archive Network web page, accessed December 12, 2016, at https://cran.r- project.org/web/packages/vegan/index.html.
Parkhurst, D.L., and Charlton, S.R., 2008, NetpathXL—An Excel interface to the program NETPATH: U.S. Geological Survey Techniques and Methods, book 6, chap. A26, 11 p., accessed September 22, 2022, at https://doi.org/10.3133/tm6A26.
Patton, C.J., and Kryskalla, J.R., 2011, Colorimetric determination of nitrate plus nitrite in water by enzymatic reduction, automated discrete analyzer methods: U.S. Geological Survey Techniques and Methods, book 5, chap. B8, 34 p., accessed September 22, 2022, at https://doi.org/10.3133/tm5B8.
Piper, D.Z., and Bau, M., 2013, Normalized rare earth elements in water, sediments, and wine—Identifying sources and environmental redox conditions: American Journal of Analytical Chemistry, v. 4, no. 10, p. 69–83, accessed July 13, 2022, at https://doi.org/10.4236/ajac.2013.410A1009.
Plummer, L.N., Bexfield, L.M., Anderholm, S.K., Sanford, W.E., and Busenberg, E., 2012, Geochemical characterization of ground-water flow in the Santa Fe group aquifer system, Middle Rio Grande Basin, New Mexico (ver. 1.2): U.S. Geological Survey Water-Resources Investigations Report 03–4131, 395 p. [Also available at https://doi.org/10.3133/wri034131.]
R Core Team, 2023, R—A language and environment for statistical computing, version 4.2.3:Vienna, Austria, R Foundation for Statistical Computing software release, accessed October 4, 2023, at https://www.R-project.org/.
Révész, K., and Coplen, T.B., 2008a, Determination of the δ2H/1H, of water—RSIL lab code 1574: U.S. Geological Survey Techniques and Methods, book 10, chap. C1, 27 p., accessed January 13, 2020, at https://doi.org/10.3133/tm10C1.
Révész, K., and Coplen, T.B., 2008b, Determination of the δ18O/16O of water—RSIL lab code 489: U.S. Geological Survey Techniques and Methods, book 10, chap. C2, 28 p., accessed January 13, 2020, at https://doi.org/10.3133/tm10C2.
Rice, J., and Westerhoff, P., 2017, High levels of endocrine pollutants in US streams during low flow due to insufficient wastewater dilution: Nature Geoscience, v. 10, p. 587–591, accessed April 7, 2022, at https://doi.org/10.1038/NGEO2984.
Robson, S.G., and Banta, E.R., 1995, Ground Water Atlas of the United States—Segment 2, Arizona, Colorado, New Mexico, Utah: U.S. Geological Survey Hydrologic Atlas 730–C, 32 p., accessed November 15, 2021, at https://doi.org/10.3133/ha730C.
Rozanski, K., Araguás-Araguás, L., and Gonfiantini, R., 1993, Isotopic patterns in modern global precipitation: Geophysical Monograph, v. 78, p. 1–36, accessed February 27, 2021, at https://doi.org/10.1029/GM078p0001.
Shephard, Z.M., Conn, K.E., Beisner, K.R., Jornigan, A.D., and Bryant, C.F., 2019, Characterization and load estimation of polychlorinated biphenyls (PCBs) from selected Rio Grande tributary stormwater channels in the Albuquerque urbanized area, New Mexico, 2017–18: U.S. Geological Survey Open-File Report 2019–1106, 48 p., accessed September 29, 2022, at https://doi.org/10.3133/of20191106.
Stewart, A.M., 2018, Hydrologic assessment and numerical simulation of groundwater flow, San Juan Mine, San Juan County, New Mexico, 2010–13: U.S. Geological Survey Scientific Investigations Report 2017–5155, 94 p., accessed November 16, 2021, at https://doi.org/10.3133/sir20175155.
Stuiver, M., and Polach, H.A., 1977, Discussion reporting of 14C data: Radiocarbon, v. 19, p. 355–363, accessed September 22, 2022, at https://doi.org/10.1017/S0033822200003672.
U.S. Environmental Protection Agency [EPA], 2018, Method 537.1—Determination of selected per- and polyfluorinated alkyl substances in drinking water by solid phase extraction and liquid chromatography/tandem mass spectrometry (LC/MS/MS): U.S. Environmental Protection Agency web page, 50 p., accessed June 2, 2020, at https://cfpub.epa.gov/si/si_public_record_Report.cfm?dirEntryId=343042&Lab=NERL.
U.S. Environmental Protection Agency [EPA], 2020, Basic information on PFAS—What are PFAS?: U.S. Environmental Protection Agency web page, accessed May 1, 2020, at https://www.epa.gov/pfas/basic-information-pfas#health.
U.S. Environmental Protection Agency [EPA], 2022a, Drinking water health advisories for PFOA and PFOS: U.S. Environmental Protection Agency web page, accessed April 7, 2022, at https://www.epa.gov/ground-water-and-drinking-water/drinking-water-health-advisories-pfoa-and-pfos.
U.S. Environmental Protection Agency [EPA], 2022b, National PFAS datasets: U.S. Environmental Protection Agency web page, accessed March 24, 2022, at https://echo.epa.gov/tools/data-downloads/national-pfas-datasets.
U.S. Environmental Protection Agency [EPA], 2022c, San Juan Watershed Program: U.S. Environmental Protection Agency web page, accessed February 8, 2022, at https://storymaps.arcgis.com/collections/cf0c0658ae114e57a720c0c0c0e1b28b?item=1.
U.S. Environmental Protection Agency [EPA], 2022d, Third unregulated contaminant monitoring rule: U.S. Environmental Protection Agency web page, accessed June 24, 2022, at https://www.epa.gov/dwucmr/third-unregulated-contaminant-monitoring-rule.
U.S. Environmental Protection Agency [EPA], 2022e, NPDES permit basics: U.S. Environmental Protection Agency web page, accessed June 24, 2022, at https://www.epa.gov/npdes/npdes-permit-basics.
U.S. Environmental Protection Agency [EPA], 2023, Drinking water contaminants: U.S. Environmental Protection Agency database, accessed May 24, 2023, at https://www.epa.gov/ground-water-and-drinking-water/national-primarydrinking-water-regulations.
U.S. Geological Survey [USGS], 2022a, 3D Elevation Program 1-meter resolution digital elevation model: U.S. Geological Survey web page, accessed October 23, 2019, at https://www.usgs.gov/the-national-map-data-delivery.
U.S. Geological Survey [USGS], 2022b, USGS water data for the Nation: U.S. Geological Survey National Water Information System database, accessed April 28, 2022, at https://doi.org/10.5066/F7P55KJN.
U.S. Geological Survey [USGS], [variously dated], National field manual for the collection of water-quality data: U.S. Geological Survey Techniques of Water-Resources Investigations, book 9, chaps. A1–A10. [Also available online at http://pubs.water.usgs.gov/twri9A.]
Appendix 1. Water-Quality Data for Groundwater and Surface-Water Samples
Conversion Factors
U.S. customary units to International System of Units
Temperature in degrees Celsius (°C) may be converted to degrees Fahrenheit (°F) as follows:
°F = (1.8 × °C) + 32.
Supplemental Information
Specific conductance is given in microsiemens per centimeter at 25 degrees Celsius (µS/cm at 25 °C).
Concentrations of chemical constituents in water are given in either milligrams per liter (mg/L), micrograms per liter (µg/L), or nanograms per liter (ng/L).
Activities for radioactive constituents in water are given in picocuries per liter (pCi/L).
Results for measurements of stable isotopes of an element (with symbol E) in water, solids, and dissolved constituents commonly are expressed as the relative difference in the ratio of the number of the less abundant isotope (iE) to the number of the more abundant isotope of a sample with respect to a measurement standard.
Abbreviations
DEET
N,N-diethyl-meta-toluamide
DOC
dissolved organic carbon
EPA
U.S. Environmental Protection Agency
MCL
maximum contaminant level
MRI
magnetic resonance imaging
NMDS
nonmetric multidimensional scaling
NMED
New Mexico Environment Department
NPDES
National Pollutant Discharge Elimination System
PFAS
per- and polyfluoroalkyl substances
PFBA
perfluorobutanoic acid
PFBS
perfluorobutanesulfonic acid
PFDA
perfluorodecanoic acid
PFHpA
perfluoroheptanoic acid
PFHxA
perfluorohexanoic acid
PFHxS
perfluorohexanesulfonic acid
PFNA
perfluorononanoic acid
PFOA
perfluorooctanoic acid
PFOS
perfluorooctane sulfonic acid
PFOSA
perfluorooctane sulfonamide
PFPeA
perfluoropentanoic acid
PFPeS
perfluoropentanesulfonic acid
pmc
percent modern carbon
REE
rare earth element
RPD
relative percent difference
SD
standard deviation
SMCL
secondary maximum contaminant level
SRL
study reporting level
TDS
total dissolved solids
USGS
U.S. Geological Survey
WWTP
wastewater treatment plant
For more information about this publication, contact
Director, New Mexico Water Science Center
U.S. Geological Survey
6700 Edith Blvd. NE
Albuquerque, NM 87113
For additional information, visit
https://www.usgs.gov/centers/nm-water
Publishing support provided by
Lafayette Publishing Service Center
Disclaimers
Any use of trade, firm, or product names is for descriptive purposes only and does not imply endorsement by the U.S. Government.
Although this information product, for the most part, is in the public domain, it also may contain copyrighted materials as noted in the text. Permission to reproduce copyrighted items must be secured from the copyright owner.
Suggested Citation
Travis, R.E., Beisner, K.R., Wilkins, K.L., Jasmann, J.R., Keefe, S.H., and Barber, L.B., 2024, Assessment of per- and polyfluoroalkyl substances in water resources of New Mexico, 2020–21 (ver. 1.2, April 2024): U.S. Geological Survey Scientific Investigations Report 2023–5129, 98 p., https://doi.org/10.3133/sir20235129.
ISSN: 2328-0328 (online)
Study Area
| Publication type | Report |
|---|---|
| Publication Subtype | USGS Numbered Series |
| Title | Assessment of per- and polyfluoroalkyl substances in water resources of New Mexico, 2020–21 |
| Series title | Scientific Investigations Report |
| Series number | 2023-5129 |
| DOI | 10.3133/sir20235129 |
| Edition | Version 1.0: January 2024; Version 1.1: March 2024; Version 1.2: April 2024 |
| Publication Date | January 18, 2024 |
| Year Published | 2024 |
| Language | English |
| Publisher | U.S. Geological Survey |
| Publisher location | Reston, VA |
| Contributing office(s) | New Mexico Water Science Center |
| Description | Report: x, 98 p., 4 Appendices; Dataset |
| Country | United States |
| State | New Mexico |
| Online Only (Y/N) | Y |