

Water Resources Inventory of the Las Cienegas National Conservation Area, Southeastern Arizona
Links
- Document: Report (10 MB pdf) , HTML , XML
- Data Release: USGS Data Release - Supplemental groundwater level, spring flow, and streamflow data for the Water Resources Inventory of the Las Cienegas National Conservation Area, Southeastern Arizona
- NGMDB Index Page: National Geologic Map Database Index Page (html)
- Download citation as: RIS | Dublin Core
Acknowledgments
The author extends his appreciation to the Tucson Field Office of the Bureau of Land Management for their cooperation and support of this study.
Abstract
The Las Cienegas National Conservation Area was established by the Las Cienegas National Conservation Area Establishment Act of 1999 (Public Law 106–538) and is managed by the Bureau of Land Management. Located in southeastern Arizona, the conservation area contains more than 45,000 acres of rolling grassland, wetlands, and woodlands surrounded by isolated mountain ranges that are part of the Madrean archipelago. This report describes the surface-water and groundwater resources within, and hydrologically connected to, the conservation area.
Two primary aquifers have been identified within the Las Cienegas National Conservation Area: a Quaternary alluvial aquifer and a Miocene to Pliocene basin-fill aquifer. The Quaternary alluvial aquifer consists of Quaternary saturated stream alluvium along Cienega Creek and its major tributaries. This aquifer provides the water necessary for base flow in the perennial stream reaches that support aquatic life and for wetland and riparian habitat along the stream courses. Wells and piezometers completed in the Quaternary alluvial aquifer show both seasonal and daily water-level fluctuation patterns, as well as responses to flood flows in Cienega Creek. The basin-fill aquifer, in contrast, consists chiefly of Miocene to Pliocene alluvium within a sedimentary basin that is at least 4,800 feet deep. This aquifer is developed for anthropogenic uses more often than the Quaternary alluvial aquifer is developed. Generally, water levels in wells completed in the basin-fill aquifer have gradually declined a few feet between 2011, when measurements began, and 2022, when this report was written. Most water-chemistry samples available from the basin-fill aquifer had either a sodium-bicarbonate or calcium-bicarbonate water type. Previous research has shown that most recharge to the basin-fill aquifer likely comes from mountain-front and mountain-block recharge. Research further shows that this aquifer likely provides most of the recharge to the Quaternary alluvial aquifer. Because no production wells completed in bedrock exist within the conservation area, little is known about the hydraulic properties of the bedrock therein, but usable quantities of water can likely be produced from places where the bedrock has highly developed joint or fracture systems.
During 2006–2021, the average combined length of measured perennial stream reaches within the main part of the Las Cienegas National Conservation Area was 6.35 miles. The average annual base flow of Cienega Creek during 2002–2021, estimated with the Standard Base-Flow Index method using data from a streamgage within the conservation area, was 0.62 cubic feet per second. Monthly mean streamflow measured at this streamgage for the same period ranged from a low of 0.29 cubic feet per second (in June) to a high of 9.8 cubic feet per second (in July). The July average is heavily influenced by a flood that occurred in July 2021; the median July streamflow for 2002–2021 is just 0.84 cubic feet per second. Periods with no daily flow are not uncommon at this gage during late May and June.
Introduction
The Las Cienegas National Conservation Area (LCNCA), located in southeastern Arizona, was established by the Las Cienegas National Conservation Area Establishment Act of 1999 (Public Law 106–538) and is managed by the Bureau of Land Management (BLM). The LCNCA contains more than 45,000 acres of rolling grassland, wetlands, and woodlands surrounded by isolated mountain ranges that rise several thousand feet above the surrounding desert lowland, which are commonly referred to as the Madrean archipelago and also known as sky islands (fig. 1). The Arizona Department of Environmental Quality (ADEQ) designates Cienega Creek as an Outstanding Arizona Water (OAW) over the reach spanning from its confluence with the stream in Gardner Canyon to approximately (~) 28 miles (mi) downstream. This classification system for Arizona surface waters, defined under Arizona Administrative Code A.A.C. R18-11-112, prohibits water-quality degradation of any OAW. Two segments of the creek within the LCNCA have also been proposed for wild and scenic rivers designation.
Hendrickson and Minckley (1985) report the term “ciénega” was used by Hispanic explorers, then by later explorers and settlers, to describe a warm, temperate marshland habitat. They define cienegas as marshland ecosystems that (1) are associated with perennial springs and headwater streams, (2) occur at ~3,300–6,600 feet (ft) above sea level, and (3) are located within semidesert grasslands or Madrean evergreen woodlands (a vegetation macrogroup that contains mixed evergreens and conifers).
This report describes the water resources within, and hydrologically connected to, the LCNCA. No new data were collected as part of this inventory; this work describes water resources using preexisting sources. Although few water-resource studies have been carried out specifically for the LCNCA, many previous studies describe the water resources of the greater region (see the “Previous Investigations” section below).
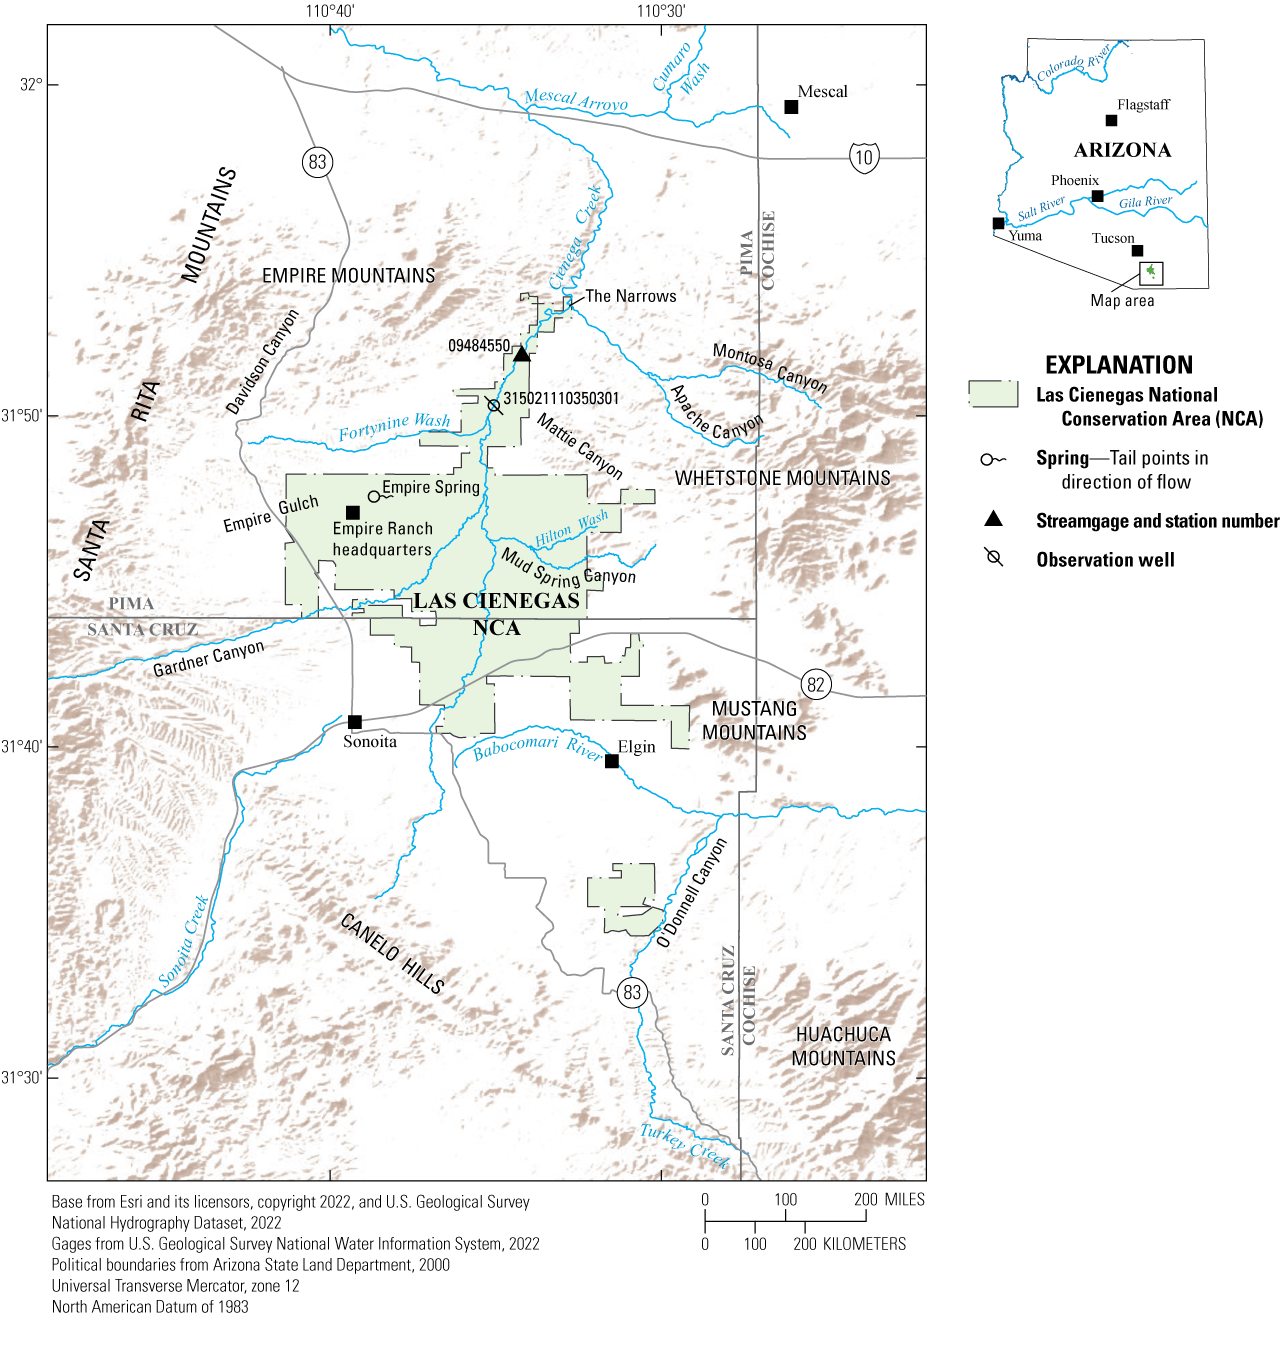
Map of study area in southeastern Arizona.
Purpose and Scope
This report inventories and evaluates existing water-resource data for the LCNCA. Major groundwater aquifers, as well as springs, surface-water bodies, and surface-water flows in the LCNCA are described herein. Although no new data were collected as part of this effort, new analyses of existing data were performed. Hydrologic data used in these analyses are available from the U.S. Geological Survey (USGS) National Water Information System (NWIS) database (https://waterdata.usgs.gov/nwis; U.S. Geological Survey, 2023) and a USGS data release (https://doi.org/10.5066/P9X94P5B; Mason, 2023).
Previous Investigations
Three early investigations designed to assess the feasibility of using groundwater from the study area (prior to the creation of the LCNCA) for possible future development projects provide invaluable information on the hydrogeology of the area. Geraghty and Miller (1970, 1972) produced reports for GAC Properties, Inc., to determine water availability for a proposed development in what they refer to as the “Empire basin” that never came to fruition. The first report (Geraghty and Miller, 1970) described the results of a test-drilling program on the Empire Ranch property, located within the present-day LCNCA boundaries, including recommendations for developing water supplies. During this program, three test wells were drilled at depths ranging from 749 to 845 ft. The report produced lithologic logs and water-chemistry data for all three new wells, pumping-test results for two of the wells, and additional pumping-test results for three preexisting wells in the Empire Ranch area. In addition, Geraghty and Miller (1970) published a preliminary isopach map of alluvial materials for the area. In the second report (Geraghty and Miller, 1972), they summarized the drilling and testing of two new production wells on the Empire Ranch, providing lithologic logs, water-chemistry sample results, and pumping-test results for these wells.
Harshbarger and Associates (1975) extensively studied groundwater development for the Anamax Mining Company in the Empire Ranch area, which is within the LCNCA. They drilled 15 exploration wells, including one pilot production well, that ranged in depth from 1,250 to 2,000 ft. The hydraulic properties of the basin-fill aquifer were estimated through pumping tests conducted on 13 of the wells. In addition, they provided lithologic logs for all 15 wells and water-chemistry data for most of the wells. The Harshbarger and Associates (1975) report also included descriptions of the geologic framework of the groundwater basin, descriptions of hydrologic features in the Empire Ranch area, and a new water-level contour map for the area. This contour map was produced using water levels measured both in wells drilled for their study and in preexisting wells in the Empire Ranch area. By summarizing estimates from other investigators, they hypothesized that “more than 5,000 acre-feet per year of groundwater underflow moves northward from the Empire Ranch” (Harshbarger and Associates, 1975, p. 3).
In 2004, the BLM entered into a cooperative agreement with the Nature Conservancy to evaluate the condition of LCNCA resources and to review existing monitoring protocols. The results were published in a comprehensive report titled “State of the Las Cienegas National Conservation Area,” which consists of three separately published chapters (Gori and Schussman, 2005; Bodner and others, 2007; Bodner and Simms, 2008). The Nature Conservancy published a separate water-use study in 2005 based on an inventory of wells in the Arizona Department of Water Resources (ADWR) well database (Haney, 2005).
The USGS Hydrologic Atlas 663 (Freethey and others, 1986) contains a generalized geologic characterization of principal aquifers in alluvial basins of Arizona and adjacent parts of California and New Mexico, including the alluvial basin the LCNCA resides in. USGS Hydrologic Atlas 664 (Freethey and Anderson, 1986) described the predevelopment hydrologic conditions for these same alluvial basins. Results from the USGS Southwest Alluvial Basins Groundwater Availability and Use Pilot Program, which included Cienega Creek, are presented by Tillman and others (2011).
A series of four USGS Professional Papers described the hydrology of alluvial basins in the Southwest: Anderson and others (1992) discussed the geohydrology and water resources in the basins, Robertson (1991) discussed the geochemistry of groundwater in the basins, Anderson and Freethey (1995) simulated groundwater flow in selected basins, and Anderson (1995) summarized the information in the other three reports. Although these Professional Papers provide a good overview of the geohydrology and geochemistry of Southwest alluvial-basin aquifers, they do not provide specific details about the Cienega Creek basin.
Other non-USGS reports relevant to the study area include Towne and Rodine (2002) and Postillion and others (2015). Towne and Rodine (2002) characterized the regional groundwater-quality conditions in the Cienega Creek basin, including water-quality variations between watersheds and aquifers. Postillion and others (2015) provided extensive hydrologic information to assist in identifying and mitigating possible natural and man-made stressors that may affect the groundwater system in the basin. Additionally, volume 3 of the Arizona Water Atlas (Arizona Department of Water Resources, 2009) reviewed water-supply and demand conditions in southeastern Arizona and provided water-resource information for planning and resource-development purposes.
Many master’s theses related to the hydrology of the LCNCA have been written. Bittson (1976) carried out a detailed gravity survey over ~200 square miles (mi2) to define the subsurface structure and thickness of basin-fill sediments in the Cienega Creek area. Boggs (1980) developed two finite-element models to assess the potential effects of large-scale groundwater development in the Cienega Creek basin. Williams (1996) used two simple evaporation models to investigate the balance between precipitation and evaporation in the Cienega Creek basin. Knight (1996) developed a water budget for the upper Cienega Creek basin to provide quantitative assessments of the different water-exchange processes. Bota (1997) used a modular, three-dimensional finite-difference groundwater flow model (MODFLOW) of the upper Cienega Creek basin to predict the response of the Quaternary and basin-fill aquifers and Cienega Creek to stresses. Huth (1997) used the chemical evolution of groundwater in the upper Cienega Creek basin to show that its surface water and groundwater likely evolved under the same geochemical controls and originated from the same mountain-front recharge sources. Tucci (2018) used isotopes and solute tracers to show that most recharge to groundwater in the western part of the upper Cienega Creek basin occurred prior to 1950. She also identified the source of spring discharge and the elevation of recharge areas. Gray (2018) used water-stable isotopes, solute chemistry, and tritium to investigate the seasonal sources of water in the wetlands, Cienega Creek, and the Quaternary aquifer within the LCNCA.
An extensive series of reports relate to a proposed open-pit mining project, Rosemont Mine, which would be constructed in the northern Santa Rita Mountains within the Cienega Creek basin. The number of mine-related reports is extensive, but some of the most relevant reports regarding the hydrogeology of the study area are described herein. Myers (2007) discussed a conceptual flow model and the water balance for the Rosemont Mine project watershed, which lies in an upgradient subbasin of Davidson Canyon. He estimated the effects of constructing the mine on the hydrology of the site and on the downstream watersheds of Davidson Canyon and Cienega Creek. Later, Myers (2008, 2010) reported on the development of a reconnaissance-level numerical groundwater model of the Davidson Canyon and Cienega Creek watersheds based on his earlier conceptual flow model (Myers, 2007). Montgomery & Associates (2009) summarized the results of well drilling, construction, and testing of 27 hydrogeologic characterization wells and 3 multilevel piezometers in the vicinity of the proposed Rosemont Mine. Montgomery & Associates (2010) described a groundwater-flow model designed to simulate conditions (1) prior to open-pit mine development, (2) during pit dewatering, and (3) for a 1,000-year post-closure period of groundwater-level recovery and potential pit lake development. Myers (2011) reviewed and compared three groundwater models developed to assess hydrologic effects of the potential open-pit mine. Tetra Tech (2010a) described a hydrogeological conceptual model created for Davidson Canyon and possible effects on the hydrology of Davidson Canyon by the proposed mine. A second report by Tetra Tech (2010b) described a regional numeric groundwater model and possible effects of the proposed mining operation on water resources within the model domain.
Description of Study Area
The availability and chemistry of water resources within the LCNCA are directly related to physiography, climate, and geology. Physiography affects the movement of both surface water and groundwater in the area, whereas climate affects the water budget. The complex geologic history of the area has created a valuable groundwater reservoir and influences the movement and chemistry of both surface water and groundwater.
Physiography
The LCNCA in southeastern Arizona is part of the Madrean archipelago, a region that Flesch and Hahn (2005, p. 80) describe as “wooded mountain islands isolated by lowland seas of desertscrub, thornscrub, and grassland.” The Madrean archipelago exists within the larger Basin and Range physiographic province (Fenneman, 1931), which formed during the Tertiary Period when parts of western North America underwent crustal extension. This extension (stretching) of crust was accommodated at shallow depths by the formation of both low-angle normal faults and large, range-bounding, high-angle normal faults. The result of this extension, the Basin and Range Province, extends from the Snake River Plain in Idaho southward through Arizona and into Mexico. This province is characterized by many north–south-trending mountain ranges bounded by Cenozoic sedimentary basins (Spencer and Reynolds, 1989). This mountain-and-basin topography is the surface expression of the normal faulting characteristic of the province.
The LCNCA exists largely within one of these sedimentary basins, known as the Sonoita basin (Trapp and Reynolds, 1995). The Sonoita basin is bounded by the Empire and Santa Rita Mountains to the west, the Whetstone, Mustang, and Huachuca Mountains to the east, and the Canelo Hills to the south (fig. 1). To the north, the Sonoita basin pinches out at a bedrock high (known as “The Narrows”) between the Empire and Whetstone Mountains. Previous water-resource studies commonly refer to the Sonoita basin as the upper Cienega basin or upper Cienega Creek basin. Within the main part of LCNCA, the elevation along Cienega Creek varies from ~4,700 ft above sea level near the town of Sonoita to ~4,100 ft above sea level at the northern end of the conservation area, near the bedrock narrows. The smaller subunit of the LCNCA, which lies west of Fort Huachuca and includes part of O’Donnell Canyon, has an elevation of ~4,800–5,000 ft. The highest mountain peak with drainage into the LCNCA, Mount Wrightson, located west of the conservation area in the Santa Rita Mountains, is more than 9,400 ft above sea level.
Most land within the LCNCA consists of heavily dissected Pliocene to Miocene basin-fill deposits that commonly form high, rounded hills and ridges (Spencer and others, 2010). Cienega Creek, which has both ephemeral and perennial reaches within the LCNCA, is the area’s main surface-water drainage (fig. 1). Important tributaries that also have perennial reaches are those in Empire Gulch and Mattie Canyon. Many other tributary streams and canyons exist within the LCNCA but flow only during precipitation runoff events.
The Landscape Fire and Resource Management Planning Tools (LANDFIRE) program classifies the dominant vegetation types of the LCNCA as “semi-desert grassland,” “warm desert ruderal and planted scrub,” and “warm desert Cienega” (LANDFIRE, 2021). Minor areas are classified as “mixed desert and thornscrub,” “creosotebush-white bursage desert scrub,” “madrean encinal (madrean evergreen oaks),” and “madrean pinyon-juniper woodland” (LANDFIRE, 2021).
Climate
The Köppen climate classification system (Kottek and others, 2006) defines the climate of the LCNCA as “cold semi-arid steppe” (region Bsk). Data from the Parameter-elevation Regressions on Independent Slopes Model (PRISM) Climate Group (2022) indicate that the 30-year mean annual temperatures (1991–2020) in the LCNCA varied, in degrees Fahrenheit (°F), from the high 50s to low 60s, depending on elevation (fig. 2A). However, temperature extremes of ~100 °F in the summer and ~20 °F in the winter can occur (Western Regional Climate Center, 2022). Much of the precipitation occurs during isolated monsoonal thunderstorms in the summer.
Tillman and others (2011) also used PRISM data to estimate mean annual precipitation for alluvial basins of the Southwest, providing estimates for different periods between 1940 and 2006. For the complete period of 1940–2006, they estimated the mean annual precipitation for the Cienega Creek basin to be 19.4 inches (in.). Knight (1996) used available precipitation records from stations within the same region as the LCNCA to estimate a mean annual precipitation of 17.85 in. for just the upper Cienega Creek basin. Annual free-water evaporation appears to greatly exceed precipitation in the LCNCA; Farnsworth and others (1982) estimated that the region has 60 inches per year (in/yr) of evaporation potential (fig. 2B).
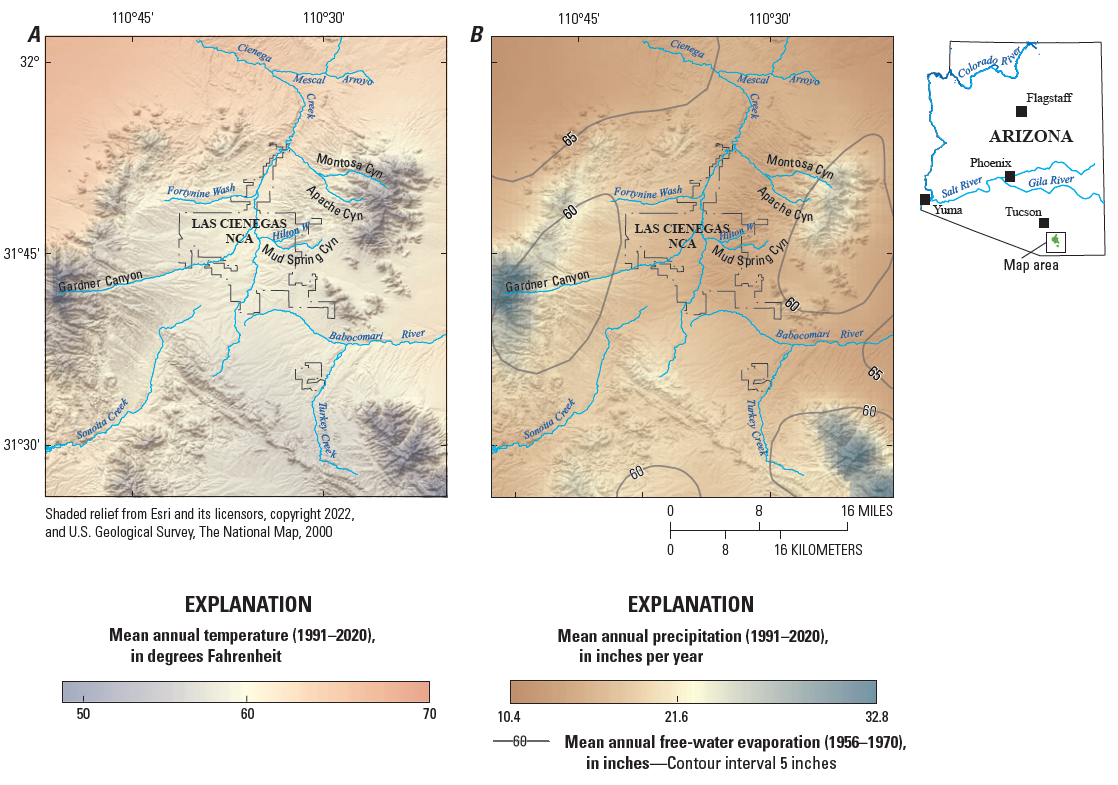
Maps of mean annual temperatures, precipitation, and free-water evaporation around the Las Cienegas National Conservation Area, southeastern Arizona. A, Map showing 30-year (1991–2020) mean annual temperatures (Parameter-elevation Regressions on Independent Slopes Model [PRISM] Climate Group, 2022). B, Map showing mean precipitation (1991–2020) (PRISM Climate Group, 2022) and mean free-water evaporation (Farnsworth and others, 1982).
Geology
The supply, storage, movement, and chemistry of both groundwater and surface-water resources are in part controlled by the geology of a region. In the LCNCA, geology indirectly influences the supply of water by affecting the topography of the landscape and, through the orographic effect, the amount of precipitation that falls. The orographic effect occurs when air cools as it rises over the surrounding mountain ranges, causing water vapor to condense into precipitation. Groundwater and surface water basins, which form naturally through geologic processes, enable the storage and movement of water. Furthermore, the movement of surface water is controlled by topography, which is influenced by geology, and the movement of groundwater occurs through geologic materials. Finally, as groundwater and surface water encounter rocks and sediments, minerals present there alter the water chemistry.
Bedrock and Structural Geology
Exposed bedrock in and around the LCNCA is primarily composed of Cretaceous sedimentary deposits (fig. 3) (Wilson and others, 1960; Drewes, 1971; Finnell, 1971; Peterson, 1990; Spencer and others, 2010; Cook and Ferguson, 2019). During the Jurassic and Cretaceous Periods, this part of southeastern Arizona contained a tectonic rift basin named the Bisbee basin. This rift basin, which at times connected to the ocean, provided depositional accommodation space for Jurassic and Cretaceous sediments eroded from the rift margins and nearby higher ground. The Mogollon Highlands, an ancient mountain range that extended into southeastern Arizona at the time, was likely one sediment source for the Bisbee basin (Dickinson and Lawton, 2001). Many sediments in the Bisbee basin were coarse-grained conglomerates, reflecting proximity to their source areas, but finer grained sediments such as mudstones, sandstones, shales, and limestones also were deposited when lakes existed in the basin or when marine incursions occurred. The Cretaceous rocks of the Bisbee basin visible in the LCNCA were initially flat-lying but are now tilted and broadly folded as part of a southward-plunging syncline. This syncline likely developed during Late Cretaceous and Paleocene Laramide deformation (Spencer and others, 2010). Cretaceous rocks are most visible in the northern part of the LCNCA near The Narrows, where heavily folded beds are nearly vertical in places.
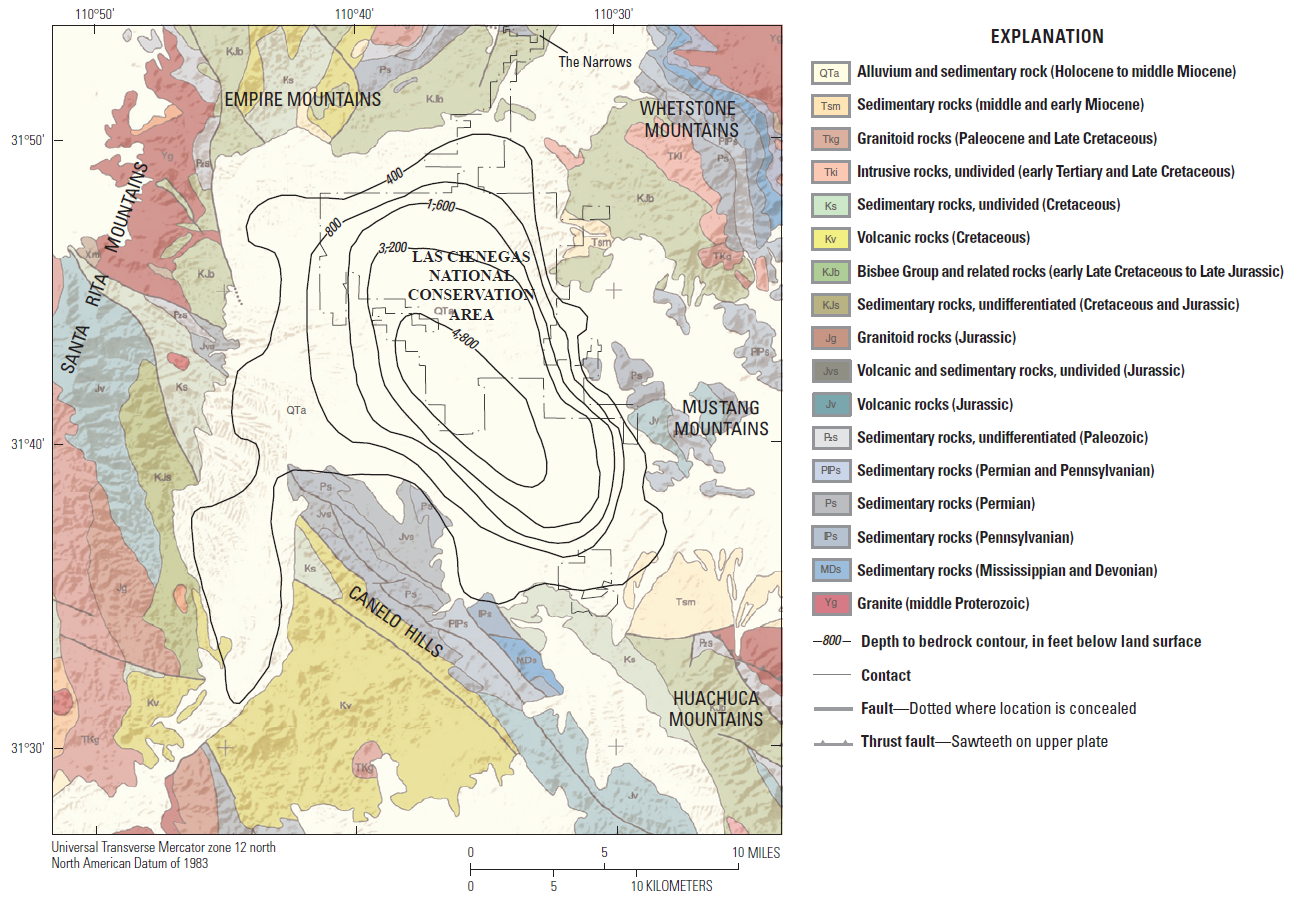
Geologic map of study area surrounding the Las Cienegas National Conservation Area, southeastern Arizona. Geology modified from Peterson and others (2001). Depth-to-bedrock contours for the Sonoita sedimentary basin (Richard and others, 2007) were produced at a smaller map scale (1:1,000,000), so are not precise at this scale (1:250,000) and are shown for illustrative purposes only.
The bedrock was further deformed during the Basin and Range extension, which took place ~15–10 million years ago during the Miocene Epoch. This crustal extension produced large-scale, deep, pervasive fracturing that manifested at the surface as generally north–south-trending faults, which in turn created a series of irregularly shaped and only partially connected basins (Scarborough and Peirce, 1978), one of which is the Sonoita basin. Many of these faults are buried beneath basin-fill sediments that eroded from the surrounding mountain ranges, so only their approximate locations have been mapped (Finnell, 1971; Boggs, 1980; Spencer and others, 2010; Cook and Ferguson, 2019), if they are mapped at all. Figure 3 contains depth-to-bedrock contours, modified from Richard and others (2007), estimating the shape and depth to bedrock of the Sonoita basin surrounding the LCNCA. Because these contours were created at a much smaller map scale than figure 3, their shapes and locations are only approximate.
Basin-Fill Deposits
The Sonoita basin began filling with sediments as the basin was forming and continued to fill from the middle Miocene through the Pliocene (Spencer and others, 2010). The deposits contain moderately consolidated, poorly sorted conglomerate and sandstone, along with lesser amounts of mudstone and siltstone. Later processes have eroded these deposits to form the ridges and valleys that make up much of the topography within the LCNCA (Spencer and others, 2010; Cook and Ferguson, 2019). These deposits also host the primary aquifer within the LCNCA. Harshbarger and Associates (1975) observed indurated sediments of possible Tertiary age in several test borings within the LCNCA; some earlier investigators have interpreted these sediments to possibly be from the Pantano Formation (Bittson, 1976; Boggs, 1980; Knight, 1996; Bota, 1997).
Bittson (1976) mapped the Bouguer gravity anomalies for the Cienega Creek area in detail but did not map the depth-to-bedrock map from these gravity data. He did, however, estimate a depth to bedrock of 5,300 ft for the deepest part of the Sonoita basin. Although the depth-to-bedrock contours by Richard and others (2007), shown in figure 3, are based on less-detailed information than that presented by Bittson (1976), their map shows a depth to bedrock of at least 4,800 ft for the deepest part of the Sonoita basin, aligning well with the estimate of Bittson (1976).
Basin-fill deposits also include Pleistocene and Holocene (Quaternary) alluvial, terrace, colluvial, and fan deposits (Spencer and others, 2010; Cook and Ferguson, 2019). However, their spatial distributions and thicknesses are much smaller than those of the Tertiary deposits.
Water Resources
When discussing the water resources of the LCNCA, the surface-water basin and the groundwater basin must be differentiated. Because the two basins have different areal extents, using the same term for both can be misleading. Many previous groundwater studies referred to the groundwater basin as the “upper Cienega Creek basin,” the “Cienega Creek basin,” or just the “Cienega basin.” To maintain consistency with the nomenclature of recent studies while being more specific, the terms “upper Cienega Creek surface-water basin” and “upper Cienega groundwater basin” are used herein to discuss the water resources of the conservation area.
Measurements of groundwater elevations in wells indicate that the groundwater basin may extend a small distance into the Babocomari River basin, so the surface-water and groundwater divides between these two basins are different. Bota (1997) states that the upper Cienega Creek surface-water basin has an area of 303 mi2 and that the groundwater basin has an area of 323 mi2. Some delineations of the Cienega Creek basin include the upper part of Sonoita Creek (for example, Arizona Department of Water Resources, 2009), whereas others do not. In some previous studies, the Cienega Creek surface-water basin is informally divided into “upper” and “lower” basins using The Narrows as the dividing point, a naming convention that, although useful, can likewise lead to confusion or misunderstandings.
The water resources of the LCNCA consist of groundwater, springs, wetlands, ponds, and ephemeral and perennial streams. These resources are essential for the region and support some of the rarest habitat types in the Southwest, including cottonwood-willow riparian forest, cienega marshland, and sacaton floodplain (Bodner and Simms, 2008). The exceptional perennial surface-water features within the LCNCA rely on a delicate balance between groundwater and surface water, the two of which, though discussed separately herein, are directly connected through the hydrologic cycle and function as one resource. Surface water in streams, ponds, and wetlands provides recharge to groundwater during and after precipitation events, whereas groundwater becomes surface water when the water table intersects the surface in wetlands and perennial streams, or where artesian flow occurs at springs.
Groundwater
The Arizona Department of Water Resources (2009, p. 44) lists “basin fill” and “recent stream alluvium” as the major aquifers in the Cienega Creek basin. Herein, groundwater of the upper Cienega groundwater basin that is associated with Quaternary saturated stream alluvium along Cienega Creek and its major tributaries is referred to as the “Quaternary alluvial aquifer.” In discussions of this aquifer, the distinction of the term “Quaternary” matters because the basin-fill aquifer also contains a large volume of alluvial sediments, but these are much older (Miocene and Pliocene) and in some cases are indurated. Although the basin-fill and Quaternary alluvial aquifers contain similar sedimentary matrices and likely are commonly in hydraulic connection with each other, they are distinct with regard to their locations and their interactions with the surface drainage of the LCNCA. Although the basin-fill aquifer has a much larger volume and aerial extent, the Quaternary alluvial aquifer has an outsized role in providing water for aquatic and riparian habitat within the LCNCA.
No wells produce from bedrock within the LCNCA, so little is known about bedrock hydraulic properties in the area. The bedrock is likely capable of producing usable quantities of water where it has highly developed joint or fracture systems; however, because the basin-fill and Quaternary alluvial aquifers are readily accessible throughout the LCNCA, exploring development of water from bedrock has not been necessary.
Quaternary Alluvial Aquifer
The Quaternary alluvial aquifer consists of Quaternary saturated stream alluvium (Arizona Department of Water Resources, 2009) along Cienega Creek and its major tributaries. The Quaternary alluvial aquifer provides the water necessary both for base flow in the perennial stream reaches that support aquatic life and for wetland and riparian habitat along the stream courses. No detailed measurements exist for the thickness of the Quaternary alluvial aquifer within the LCNCA, but Harshbarger and Associates (1975, p. 7) estimated that floodplain alluvium along Cienega Creek and its major tributaries was “several tens of feet thick.” Towne and Rodine (2002) reported that streambed alluvium along Cienega Creek and its major tributaries has a maximum thickness of 200 ft.
Basin-Fill Aquifer
The basin-fill aquifer, which is much thicker and has a larger aerial extent than the Quaternary alluvial aquifer, is the aquifer most often developed for anthropogenic uses within the upper Cienega groundwater basin. This aquifer underlies most of the LCNCA, except in The Narrows area, where bedrock is at or near the surface. The thickness of the basin-fill aquifer has not been directly measured in the deepest parts of the Sonoita basin because no wells or test holes have been drilled completely through basin-fill sediments in those areas. However, the thickness of the basin-fill sediments within the Sonoita basin has been estimated based on the interpretation of geophysical data, as described in the “Geology” section above. Richard and others (2007) map the depth to bedrock in the central part of the basin as at least 4,800 ft (fig. 3), whereas Bittson (1976) estimated that the maximum depth to bedrock in the basin is around 5,300 ft.
Although several thousand feet of saturated sediments likely occupy the deepest part of the Sonoita basin, not all of the basin sediments may be effective aquifer material. Freethey and others (1986) stated that in alluvial basins of the Southwest, the base of the Tertiary basin-fill sequence typically contains older, consolidated sediments that were deposited before Basin and Range extension began. Because these deposits are commonly less permeable, they may only have minor importance as part of the basin’s basin-fill aquifer. The nature of these sediments that predate Basin and Range deformation is scarce because few test holes penetrate them. For this reason, identifying the base of the basin-fill aquifer in the Sonoita basin is not straightforward.
The most detailed information about the basin-fill aquifer comes from Geraghty and Miller (1970, 1972) and Harshbarger and Associates (1975). Between these three studies, a total of 17 test wells and 3 pilot production wells were drilled in or near the LCNCA at depths of 749–2,000 ft.
In their first publication, Geraghty and Miller (1970) described contacting Cretaceous bedrock in their test boreholes at depths of 370–535 ft. In their second publication (Geraghty and Miller, 1972), they drilled at a location closer to where Gardner Canyon opens into the basin and reached 1,500 ft without encountering consolidated sediments. Harshbarger and Associates (1975, p. 7) estimated that the depth to indurated sediments (reported as possibly Tertiary) ranges from “about 250 to more than 1,500 feet.” They considered the transition to consolidated sediments, which they reported as gradational, to principally be at the base of the basin-fill aquifer; however, they noted that the consolidated sediments could be productive in areas where significant zones of fracturing occur. In their deepest test well (E-14), Harshbarger and Associates (1975) reported unconsolidated or semiconsolidated sediments for the entire 2,000-foot interval of the borehole.
The depths to bedrock described by Geraghty and Miller (1970) for test wells GAC 1 to GAC 3 are hundreds to thousands of feet shallower than the estimated depths to bedrock predicted by Richard and others (2007) using gravity anomalies (fig. 3). The material Geraghty and Miller (1970) described as Cretaceous bedrock may be similar to what Harshbarger and Associates (1975) described as possible Tertiary indurated sediments. Precisely identifying geologic units using only drill cuttings, the technique Geraghty and Miller (1970) used, can be difficult, which could explain the discrepancy.
Harshbarger and Associates (1975) reported that groundwater within the “recent alluvium” is probably unconfined, groundwater within the non-indurated basin-fill deposits is probably quasi-confined by discontinuous clay layers, and groundwater within the indurated sediments is probably confined. From the 13 pumping tests they carried out on wells completed in the basin-fill aquifer, they measured transmissivity values ranging from ~70 to ~6,700 square feet per day (ft2/d) and specific capacities ranging from 0.5 to 7.6 gallons per minute per foot ([gal/min]/ft). Geraghty and Miller (1970, 1972) also carried out pumping tests on wells completed in the basin-fill aquifer and recorded transmissivity values of ~30–1,760 (ft2/d) and specific capacities of 0.3–7.4 [gal/min]/ft.
The estimated depth to bedrock in the Sonoita basin and the estimated thickness of units above the consolidated sediments (~2,000 ft) indicate that the deepest part of the basin could contain ~3,000 ft of consolidated sediments. Because most test wells did not reach the consolidated sediments and those that did only penetrated a short distance into them, not much is known about the hydraulic properties of these deposits.
The artesian nature of the basin-fill aquifer complicates measuring the depth to water-bearing sediments within the basin fill. Geraghty and Miller (1970) reported that the borehole for well GAC 1 initially reached water in the basin fill at a depth of 25 ft, and once the borehole reached a depth of about 700 ft, water flowed from the borehole under artesian pressure. Water also flowed from the borehole for the GAC 2 well once the borehole reached 330 ft. Harshbarger and Associates (1975) did not clearly indicate the depths at which they first reached water while drilling in the basin-fill sediments, but they did report that static water levels for the test wells ranged from 32 to 244 ft below the land surface. These depth-to-water observations and the depth to consolidated sediments measured in boreholes indicate that the basin-fill aquifer may be more than 2,000 ft thick in parts of the Sonoita basin.
Recharge
Recharge to intermontane groundwater basins like the upper Cienega Creek basin varies on the basis of climate and physiography; mechanisms can include direct infiltration of precipitation, mountain-front and mountain-block recharge, groundwater inflow, perennial surface-water inflow, and ephemeral surface-water inflow.
No perennial surface water flows into the upper Cienega Creek basin. Although alluvial aquifers along ephemeral stream reaches commonly receive much of their recharge from surface-water flow during and after precipitation runoff events (Pool, 2005), this may not occur in the upper Cienega groundwater basin. Tucci (2018) reported that much of the Quaternary alluvial aquifer within the upper Cienega Creek basin receives most of its recharge from the Miocene and Pliocene basin-fill aquifer and not from surface-water flow. Tucci (2018) found that groundwater from wells along Gardner Canyon, and water from springs and wells along Empire Gulch and Cienega Creek, had low tritium values, indicating that the majority of recharge for these areas took place before the early 1950s. Tucci (2018) also found that water from springs feeding the cienegas had similar ratios of calcium and sodium cations as groundwater underlying the LCNCA, providing further evidence that the Quaternary alluvial aquifer receives recharge from the basin-fill aquifer.
Groundwater inflow from outside the Cienega Creek basin is unlikely to be a source of recharge for the upper Cienega groundwater basin. Previous studies indicate that groundwater divides encircle the upper Cienega groundwater basin except in The Narrows area, where groundwater flows from the upper Cienega groundwater basin to a groundwater basin below The Narrows. These divides prohibit groundwater inflows from other areas (Bota, 1997; Myers, 2008; Montgomery & Associates, 2010; Tetra Tech, 2010b). Previous studies have concluded that low precipitation and high evapotranspiration rates preclude direct infiltration of precipitation to the groundwater table over most of the upper Cienega groundwater basin (Roudebush, 1996; Williams, 1996; Bota, 1997).
This leaves mountain-front and mountain-block recharge as the main sources of recharge to the upper Cienega groundwater basin. Mountain-front recharge is commonly described as recharge that occurs near the boundary of a mountain range and an adjacent sedimentary basin. Precipitation that falls on this mountain range recharges the sedimentary basin near the mountain front. Mountain-block recharge, in contrast, occurs when precipitation recharges within the mountain range and then flows into the adjacent sedimentary basin as groundwater (Wilson and Guan, 2004). Tucci (2018), who studied the basin-fill aquifer between upper reaches of Cienega Creek and the Santa Rita Mountains, found that groundwater samples contained low tritium values and adjusted radiocarbon ages as old as 27,000 years, indicating that the basin-fill aquifer is dominated by older water that recharged prior to the early 1950s. Stable isotopes of water also measured in samples by Tucci (2018) show that the main source of recharge in this part of the aquifer was likely middle- to high-elevation winter and summer precipitation that fell in the Santa Rita Mountains and entered the basin-fill aquifer as either mountain-front or mountain-block recharge. In addition, Stonestrom and Harrill (2007) summarized previous research suggesting that much of the groundwater in the arid and semiarid Southwest represents paleorecharge that occurred prior to the Holocene, so although a large groundwater resource exists in the study area, that does not mean a present-day recharge source sustains it.
Previous studies have produced many estimates of recharge, but these estimates vary in the extent of the basin they cover. In addition, the descriptions of some estimates are ambiguous, so the exact basin area being represented is unclear for some studies. Table 1 shows estimates of recharge from previous studies in which the estimated area is believed to closely match the area of the upper Cienega groundwater basin. Recharge estimates for these studies vary substantially, ranging from 4,653 acre-feet per year (acre-ft/yr) (Montgomery & Associates, 2010) to 19,530 acre-ft/yr (Kafri and Ben-Asher, 1976).
Table 1.
Estimates of recharge for upper Cienega groundwater basin (Las Cienegas National Conservation Area, southeastern Arizona) from selected previous studies.| Source | Estimated recharge, in acre-feet per year |
|---|---|
| Montgomery & Associates (2010) | 4,653 |
| Myers (2008) | 5,800 |
| Bota (1997) | 15,033 |
| Knight (1996) | 11,944 |
| Boggs (1980) | 10,060 |
| Kafri and Ben-Asher (1976) | 19,530 |
| Geraghty and Miller (1970) | 6,912 |
Discharge
Forms of groundwater discharge from the upper Cienega groundwater basin consist of base flow to Cienega Creek, subflow, discharge to springs and wells, and evapotranspiration from riparian vegetation. Comparing estimates of groundwater discharge from previous studies is difficult because the studies commonly treat or group components of discharge differently. Table 2 shows discharge estimates from selected previous studies ranged from 4,350 to 12,608 acre-ft/yr (values from Montgomery & Associates, 2010, and Knight, 1996, respectively).
Table 2.
Estimates of discharge for upper Cienega groundwater basin (Las Cienegas National Conservation Area, southeastern Arizona) from selected previous studies.[No sources listed estimated discharge to springs. Acre-ft/yr, acre-foot per year; —, no data]
| Source | Estimated discharge from wells, acre-ft/yr |
Estimated discharge to streams, acre-ft/yr |
Estimated groundwater outflow, acre-ft/yr |
Estimated riparian evapo- transpiration, acre-ft/yr |
Total, acre-ft/yr |
|---|---|---|---|---|---|
| Montgomery & Associates (2010) | — | 1,300a | — | 3,050 | 4,350 |
| Myers (2008) | — | — | 500 | 1,200 | 6,000 |
| Bota (1997) | 300 | 1,559 | 7,260 | 2,900 | 12,019 |
| Knight (1996) | 400 | 2,050 | 7,261 | 2,897 | 12,608 |
Base Flow to Cienega Creek
The term base flow refers to groundwater that sustains a stream or river even when no immediate precipitation has occurred. Various techniques, such as hydrograph separation, are available to estimate the base-flow contribution of streamflow (Barlow and others, 2015). A streamgage operated by the USGS on Cienega Creek (streamgage site number 09484550) since October 2001 provides data on the creek base flow (U.S. Geological Survey, 2022a). The gage is located ~2.5 mi south of the north boundary of the LCNCA (fig. 1). The Standard Base-Flow Index (BFI) method, described by Barlow and others (2015), was used to estimate the average base flow at the Cienega Creek streamgage from calendar years 2002 through 2021. Although the BFI method uses a formalized algorithm for identifying the base-flow component of total streamflow, the method is subjective; results are not based on mathematical solutions to groundwater- or overland-flow equations and are considered estimates. An estimate of average annual base flow during 2002–2021 at site 09484550, calculated using the BFI method with USGS Groundwater Toolbox software version 1.3.1 (Barlow and others, 2017), ranged from a low of 0.47 cubic feet per second (ft3/s) in 2005 to a high of 0.81 ft3/s in 2018. The average for 2002–2021 was 0.62 ft3/s (table 3), a considerably lower value than previous estimates of 2 ft3/s and 2.8 ft3/s (by Montgomery & Associates [1985] and Knight [1996], respectively). The estimate by Montgomery & Associates (1985) is based on discrete streamflow measurements made in The Narrows from February 1975 to January 1983, whereas the estimate by Knight (1996) is based on measurements made in The Narrows during the mid-1980s. The lower base-flow value calculated from the 2002–2021 streamflow data could reflect a difference in methodology, the current drought, a decline in groundwater levels supplying base flow, or some other factor. Overall, however, the late 1970s through mid-1980s was a wetter period in Arizona compared to the 2002–2021 period (National Oceanic and Atmospheric Administration, 2022).
Table 3.
Data for streamflow, base flow, precipitation runoff, base-flow percentage (BFP) ratio, and base-flow index (BFI) for calendar years 2002–2021 at U.S. Geological Survey streamgage 09484550 (at Cienega Creek near Sonoita, Arizona).[Values were computed using the USGS Groundwater Toolbox software version 1.3.1 (Barlow and others, 2017) and the Standard Base-Flow Index method described by Barlow and others (2015). BFI is unitless. ft3/s, cubic foot per second]
Groundwater Subflow
The term groundwater subflow refers to groundwater that leaves an aquifer as subsurface flow into adjacent groundwater basins. The main avenue for groundwater subflow from the LCNCA is through The Narrows, a unique area in which groundwater is forced to the surface by the presence of less-permeable bedrock at shallow depths. In addition to the groundwater forced to the surface, some groundwater likely flows through stream alluvium associated with Cienega Creek. Montgomery & Associates (2010) estimated a combined surface-water and groundwater flow rate of 1,300 acre-ft/yr to simulate flow from the upper Cienega groundwater basin to the lower Cienega groundwater basin. Using the MODFLOW groundwater flow model, Bota (1997) estimated subflow of groundwater out of the upper Cienega Creek groundwater basin to be around 7,260 acre-ft/yr. Bota (1997) postulated that some groundwater subflow may move to the northeast toward the San Pedro groundwater basin through a structural trough proposed by Ellett (1994) rather than all discharging to the lower Cienega groundwater basin.
Groundwater Discharge to Springs
ADWR (2009) lists eight major springs (flow greater than 10 gallons per minute [gal/min]) and two minor springs (flow from 1 to 10 gal/min) within the Cienega Creek basin. Of those springs, only Empire Gulch spring is located within the LCNCA (fig. 1). Empire Gulch spring is an informal name for a spring that emerges into the stream channel of Empire Gulch (a rheocrene spring by the classification of Springer and Stevens [2009]). Empire Gulch contains an ephemeral stream that, supported with flow from Empire Gulch spring, becomes perennial for a short reach. Since 2007, the BLM has collected quarterly to monthly flow measurements in Empire Gulch below Empire Gulch spring (Mason, 2023). The location of the measurement site has changed through time; the original site was close to the spring orifice, but workers eventually observed that discharge increases for a distance in the channel downstream from the main spring orifice before decreasing farther downstream. Since 2016, the flow has been measured at two locations: the original location near the spring orifice and a location ~180 ft downstream, at the approximate point where discharge peaks in the small channel emanating from the spring.
Flow measurements collected by the BLM at the Empire Gulch locations are shown in figure 4. More details on these measurements are available in the data release associated with this report (Mason, 2023). From 2007 through 2016, summer and fall measurements collected at the original spring orifice site generally varied from ~10 to ~20 gal/min, whereas winter and spring measurements varied from ~20 to ~30 gal/min. Flows measured at the original site after the April 2017 Sawmill Fire, which burned part of the Empire Gulch watershed, were generally higher compared to pre-fire values: ~20 to ~30 gal/min during summer and fall and 30 to 50 gal/min during winter and spring. Since 2016, flow measured at the downstream site has been ~20–40 gal/min in the summer and fall and ~80–120 gal/min in the winter and spring.
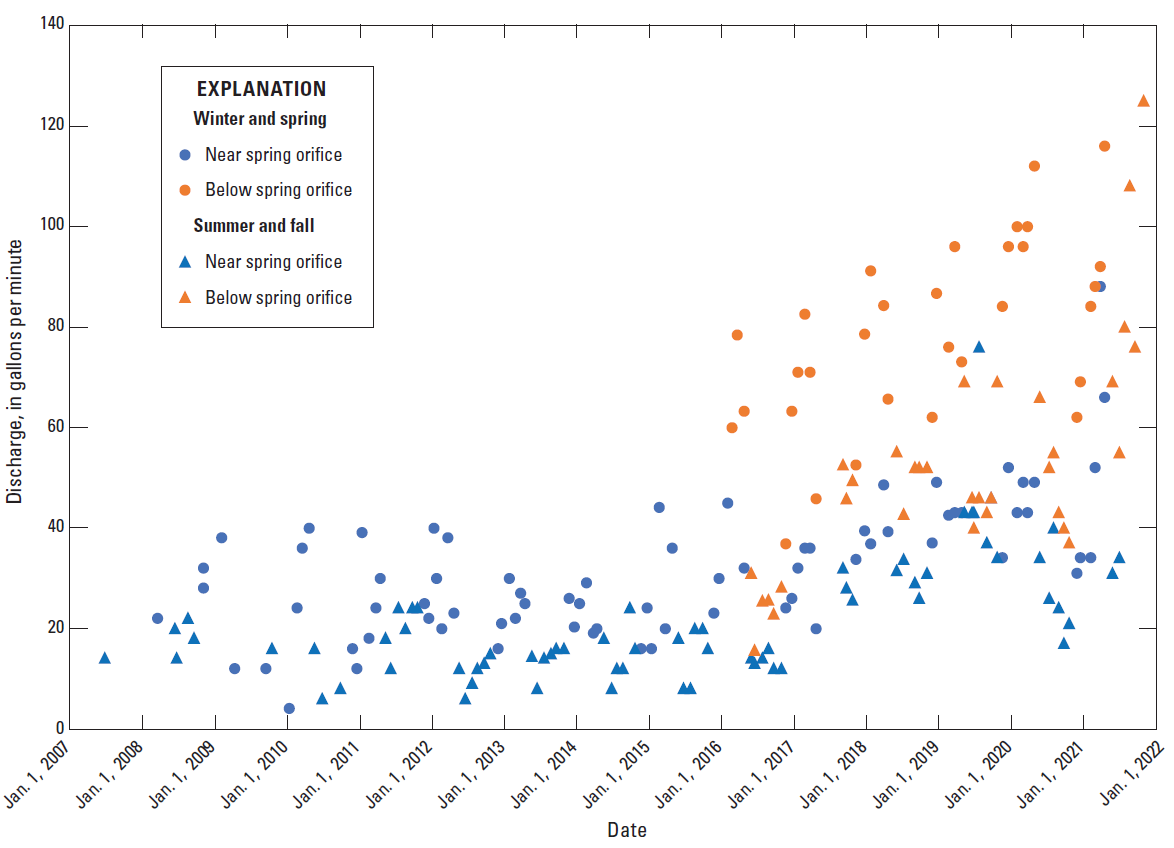
Graph of Empire Gulch flow measurements collected from below Empire Gulch spring by the Bureau of Land Management during 2007–2021 (Mason, 2023), Las Cienegas National Conservation Area, southeastern Arizona.
Spring discharge also sustains two perennial reaches of Cienega Creek, a short reach of a stream in Mattie Canyon, and a short reach of a stream in O’Donnell Canyon (fig. 1). Discharge from most springs within the LCNCA either re-enters the groundwater system through percolation, is used by plants, or is lost to evaporation. The one exception is the lower perennial reach of Cienega Creek, which leaves the LCNCA as surface-water flow. Tucci (2018) concluded the springs supplying water to the cienegas surrounding Cienega Creek in the LCNCA appear to be sustained by the basin-fill aquifer, as indicated by (1) similar sulfate-to-chloride mass ratios in springs and the basin-fill aquifer and (2) the long residence times of water in the aquifer. The perennial reaches of streams in the study area are further described in the “Surface Water” section of this report.
Groundwater Discharge Through Evapotranspiration
The term evapotranspiration refers to the transfer of water from the land surface to the atmosphere through a combination of evaporation and transpiration from plants. In the LCNCA, transpiration of water from phreatophytic plants, such as cottonwood, willow, and mesquite, is likely the most important component of evapotranspiration because the conservation area has no large, open bodies of water that would facilitate direct evaporation. Previous studies have made different estimates of evapotranspiration for the Cienega Creek drainage basin, but only a few estimates were made for just the upper groundwater basin. Myers (2008) estimated the evapotranspiration rate from phreatophytes in the upper Cienega groundwater basin to be ~1,200 acre-ft/yr (table 2). Both Knight (1996) and Bota (1997) estimated the evapotranspiration rate from phreatophytes to be ~2,900 acre-ft/yr (table 2). Montgomery & Associates. Inc. (2010) used a similar estimate of 3,050 acre-ft/yr for the upper Cienega groundwater basin in their groundwater model for the proposed Rosemont Mine (table 2).
Groundwater Discharge to Wells
Previous studies have compiled well information and estimated overall pumpage within the Cienega Creek drainage basin, but information specific to the upper Cienega groundwater basin is incomplete. Furthermore, although wells must be registered with ADWR, actual pumpage data is only collected from a small percentage of wells. For this reason, pumpage estimates classified by the type of water use (for example, domestic or irrigation) are commonly used to estimate total groundwater pumpage. The densest distribution of wells in the upper Cienega groundwater basin is south of the main subunit of the discontinuous LCNCA, in and around the communities of Sonoita and Elgin. In addition to municipal and rural domestic water use, a few vineyards in the Sonoita and Elgin area use groundwater for irrigation. Haney (2005) reported that more than 1,250 wells exist upgradient of the LCNCA within the upper Cienega groundwater basin, and by estimating a per-capita water use of 280 gallons per day and a local estimated population of 900 people, she assessed that domestic water use from groundwater wells upgradient of the LCNCA was ~282 acre-ft/yr. However, Haney (2005) did not estimate pumpage for other water uses such as livestock or irrigation. Knight (1996) estimated that groundwater wells withdraw ~400 acre-ft/yr for all uses in the upper Cienega groundwater basin.
Postillion and others (2015) reported that 2,020 registered wells exist within the Cienega Creek drainage basin (upper and lower basins combined) and estimated that ~4,700 acre-ft/yr of groundwater is pumped from the basin. Tetra Tech (2010b) suggested that annual pumpage for the entire Cienega Creek drainage basin could range from 480 to 2,400 acre-ft/yr, depending on the estimated pumpage of the 1,874 wells registered in the basin (in 2005).
Water Levels
Since 2012, the BLM has systematically collected water levels from wells and piezometers completed in both the Quaternary alluvial aquifer and the basin-fill aquifer (Mason, 2023). In January 2020, the USGS began operating a continuously recording water-level observation well at site number 315021110350301 (D-18-17 26CBA1 [BLM Cienega]) (fig. 1; U.S. Geological Survey, 2022b). Also, from 1982 through 2006, ADWR collected periodic water-level measurements from test well GAC 2 of Geraghty and Miller (1970), located within the LCNCA (USGS site number 314719110383001; U.S. Geological Survey, 2022c).
Quaternary Alluvial Aquifer
The well at site number 315021110350301 is ~25 ft deep and was completed in the Quaternary alluvial aquifer on the floodplain of Cienega Creek. The well site is ~80 ft from the current channel and between the two perennial reaches of the creek (fig. 1). A hydrograph from the well depicts water-level fluctuations from January 2020 through December 2021 (fig. 5A). These water-level data show several hydrological processes, discussed herein in order of their effect on water level (greatest to least). The first, a seasonal pattern, consists of steadily increasing water levels in the winter and spring, when riparian vegetation consumes less water; this water-level and water-use pattern reverses in the summer and fall when vegetation uses more water. The second process, aquifer recharge via runoff infiltrating the stream alluvium, appeared during the summer of 2021, when water-level increases in the well coincided with large stormwater runoff events in Cienega Creek. The third process, which persists from late spring into fall, consists of daily (diurnal) water-level fluctuations tied to the transpiration of riparian vegetation (fig. 5B).
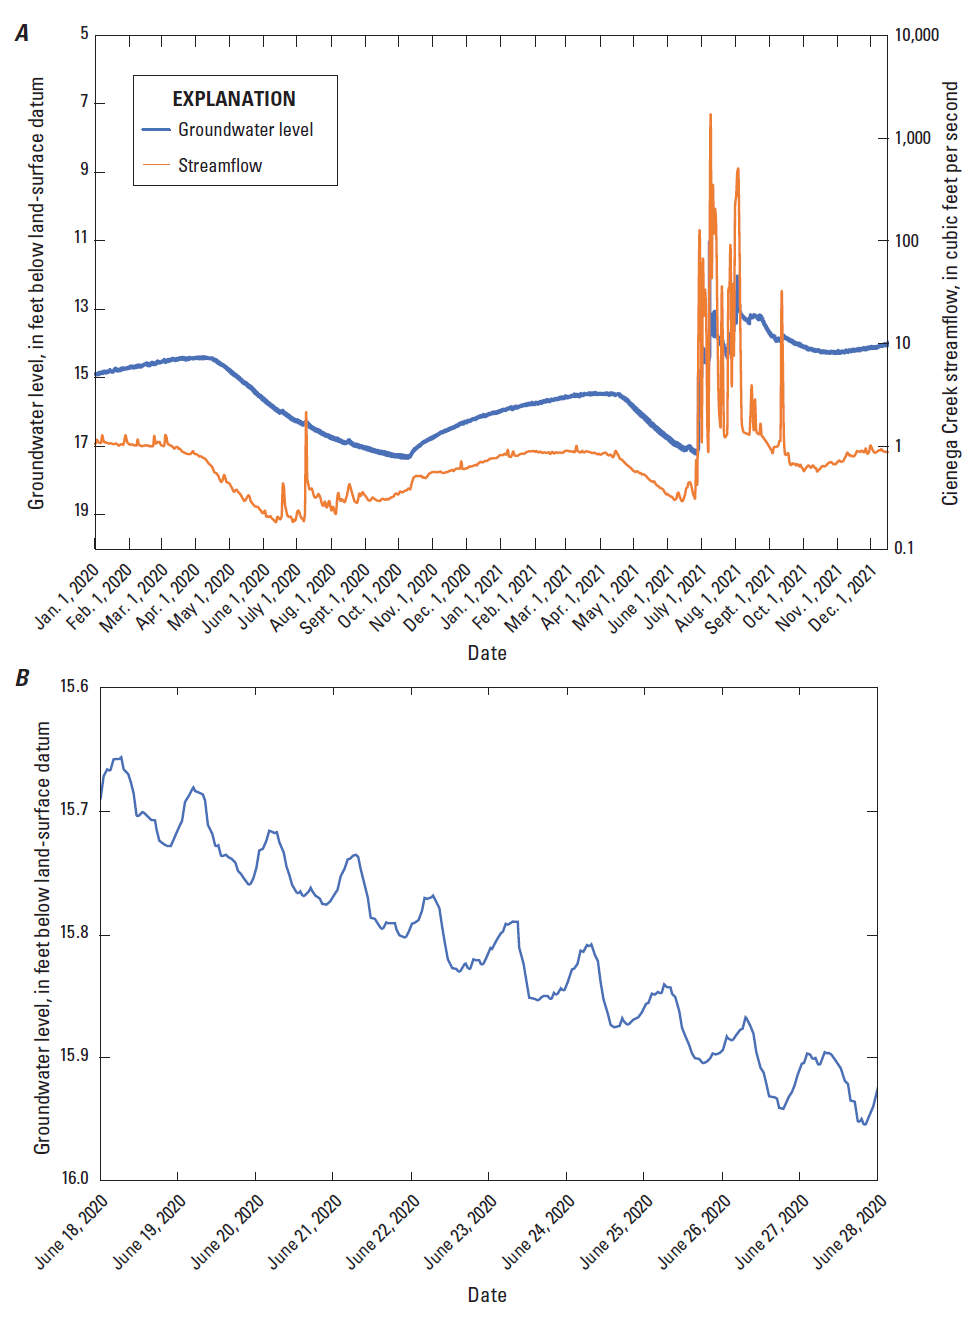
Hydrographs of water levels at well site number 315021110350301 (U.S. Geological Survey, 2022b) and streamflow at streamgage site 09484550 (U.S. Geological Survey, 2022a), in Las Cienegas National Conservation Area, southeastern Arizona. A, Graph from January 2020 to December 2021 showing groundwater levels at site number 315021110350301 (D-18-17 26CBA1 [BLM Cienega]) relative to streamflow at site 09484550 (Cienega Creek near Sonoita, Arizona). B, Graph from June 18 to 28, 2020, showing groundwater levels at site 315021110350301. See figure 1 for site locations.
The BLM has collected water-level data from several piezometers installed in the Quaternary alluvial aquifer within the LCNCA (Mason, 2023). One piezometer (piezometer WP 13), installed in alluvium along the upper perennial flow reach of Cienega Creek, has been monitored continuously with a pressure transducer since 2012. Water-level data from this piezometer show seasonal variation ranging from a low of ~3 ft below the land surface (the Cienega Creek floodplain) during the summer, when evapotranspiration from plants is the highest, to a high near the land surface during the winter, when temperatures and water demand from plants are lower (fig. 6). At times, the water level in piezometer WP 13 rose above the land surface, presumably reflecting surface-water runoff events in Cienega Creek. For example, a flood on Cienega Creek that occurred in late July 2021 appears in the piezometer water-level record at a peak level of −10.2 ft (10.2 ft above the land surface) on July 23, 2021 (fig. 6). The piezometer, submerged by floodwaters, effectively recorded the stream stage during this time. Discrete monthly streamflow measurements, collected by the BLM from Cienega Creek near WP 13 since 2012 (Mason, 2023), are also shown in figure 6.
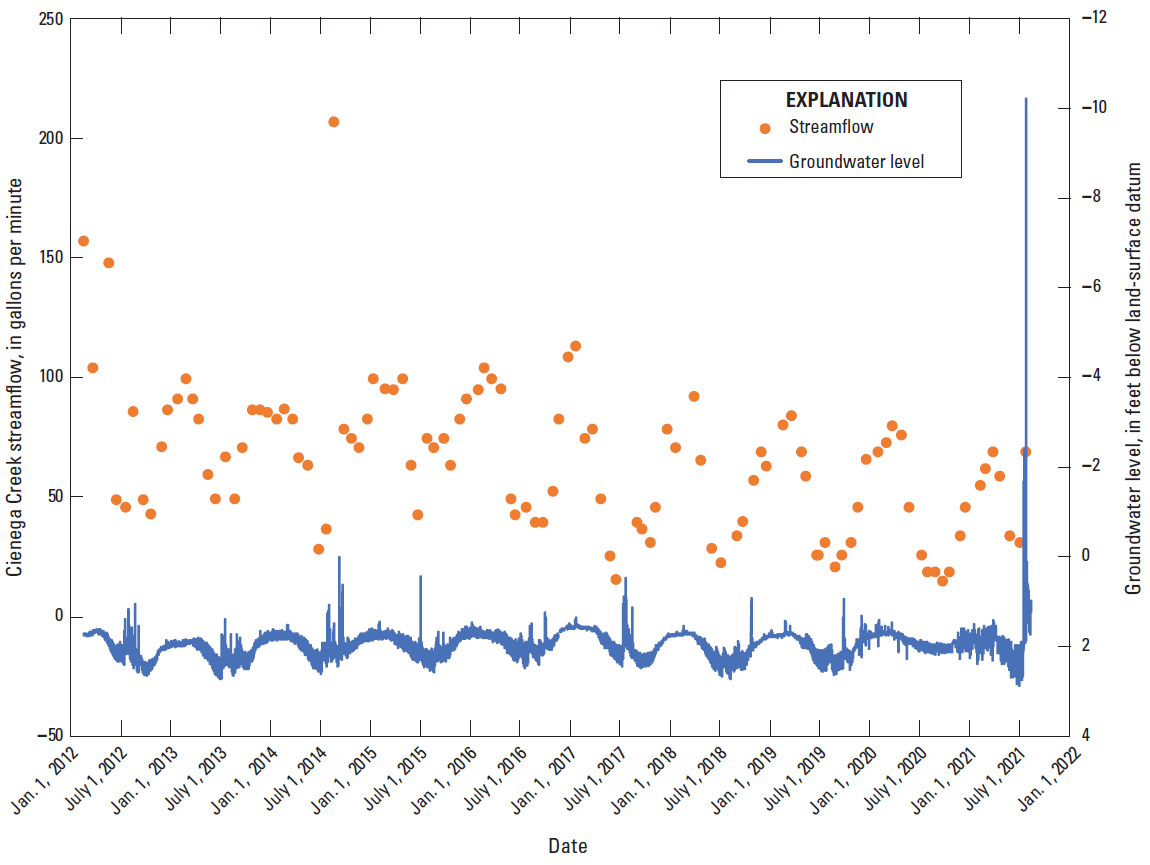
Graph of continuous groundwater levels from February 2012 to August 2021 as recorded on Cienega Creek floodplain along upper perennial reach at Bureau of Land Management (BLM) piezometer WP 13, Las Cienegas National Conservation Area, southeastern Arizona. Monthly discrete streamflow measurements, collected by the BLM from Cienega Creek near WP 13, also are plotted (Mason, 2023).
The tributaries of Cienega Creek that have well-developed floodplains likely have saturated alluvium along their lengths as well. The large perennial spring in Empire Gulch and the perennial stream reach in Mattie Canyon (near the mouth of the canyon) attest to the presence of groundwater along those streams. Water-level data from BLM piezometer WP 9, installed in stream alluvium within Empire Gulch, indicate that the water table there is typically just a few feet below the land surface. Piezometer WP 9 shows the same seasonal pattern that piezometer WP 13 does along Cienega Creek; both patterns are likely related to evapotranspiration (figs. 6, 7). In Gardner Canyon, another piezometer (WP 7; completed in alluvium ~3 mi upstream from the confluence of the Gardner Canyon creek with Cienega Creek) has been monitored continuously by the BLM since 2012; data from WP 7 show that the water table there varied from ~5.3 to ~15.7 ft below the land surface during 2012–2021 (fig. 8). Perennial streamflow in O’Donnell Canyon, part of the smaller subunit of the LCNCA (located ~8 mi southeast of the main subunit; fig. 1), indicates that alluvium there is saturated as well.
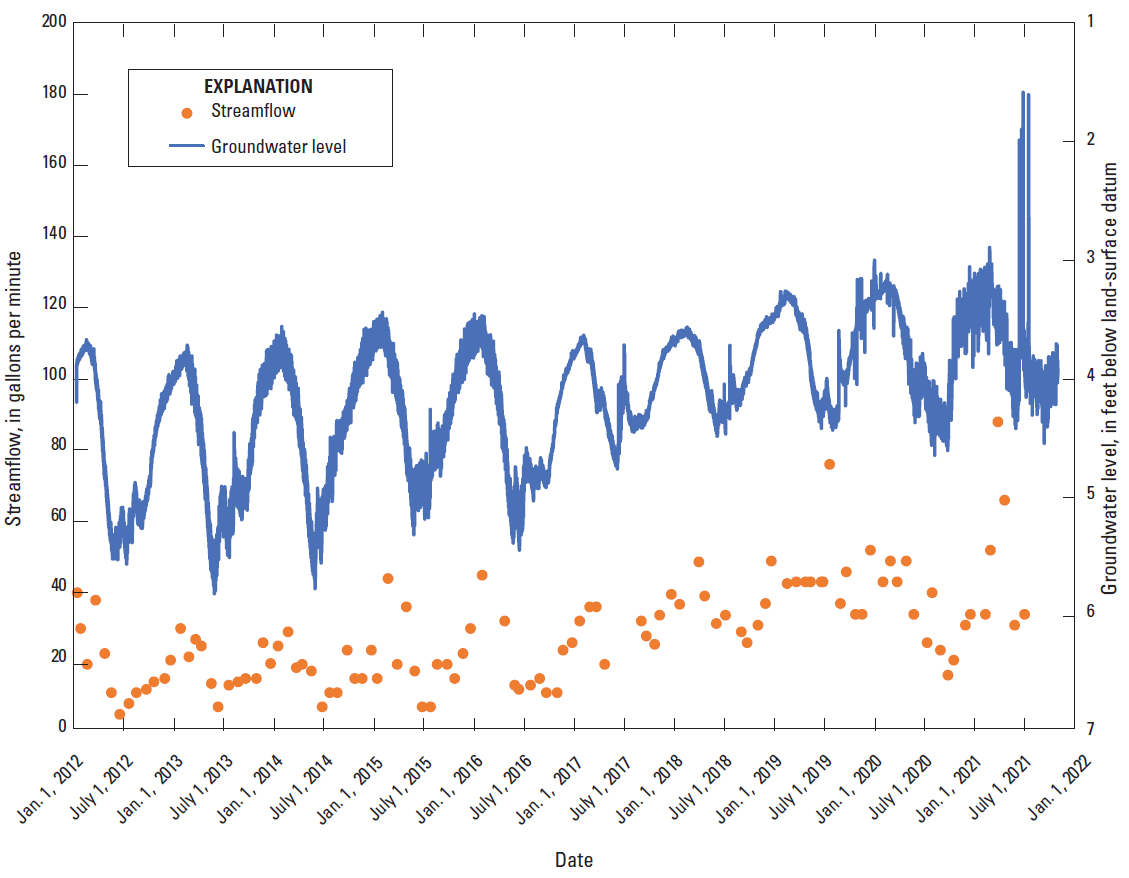
Graph of continuous groundwater levels in Empire Gulch along perennial stream reach during 2012–2021, as recorded by Bureau of Land Management piezometer WP 9 (Mason, 2023), Las Cienegas National Conservation Area, southeastern Arizona. Monthly discrete streamflow measurements, collected below Empire Gulch spring (Mason, 2023), also are plotted.
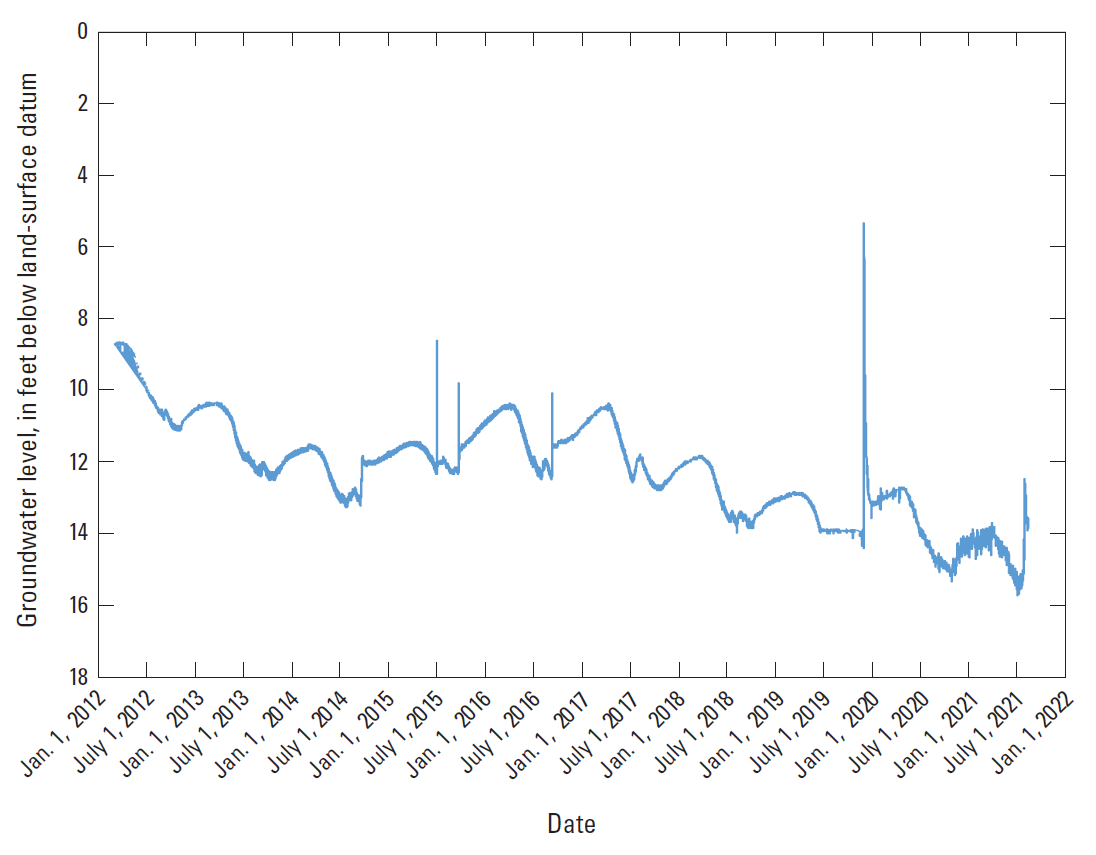
Graph of continuous groundwater levels from March 2012 to August 2021, recorded in Gardner Canyon by Bureau of Land Management piezometer WP 7 (Mason, 2023), Las Cienegas National Conservation Area, southeastern Arizona.
Basin-Fill Aquifer
Since 2011, the BLM has collected monthly or quarterly discrete water-level measurements from several wells completed in the basin-fill aquifer within the LCNCA. Figure 9 shows a water-level hydrograph from the deepest monitored well in the LCNCA, one of the original test wells (E-14) drilled by Harshbarger and Associates (1975). This well is also known as the Davis Pasture well and has the ADWR registration number 55-608618. The well is 2,000 ft deep and is located near the south boundary of the main LCNCA subunit (fig. 1). Harshbarger and Associates (1975) reported the static water level for the well as 142.20 ft below the land surface. A hydrograph for the well shows that water levels measured by the BLM there have steadily and gradually declined by a little more than 3 ft since monthly measurements began in 2011 (measurements were not collected in 2012) (Mason, 2023). Other deep wells (depths greater than 1,000 ft) monitored by the BLM within the LCNCA show similar water-level declines (David Murray, BLM, oral commun., 2021).
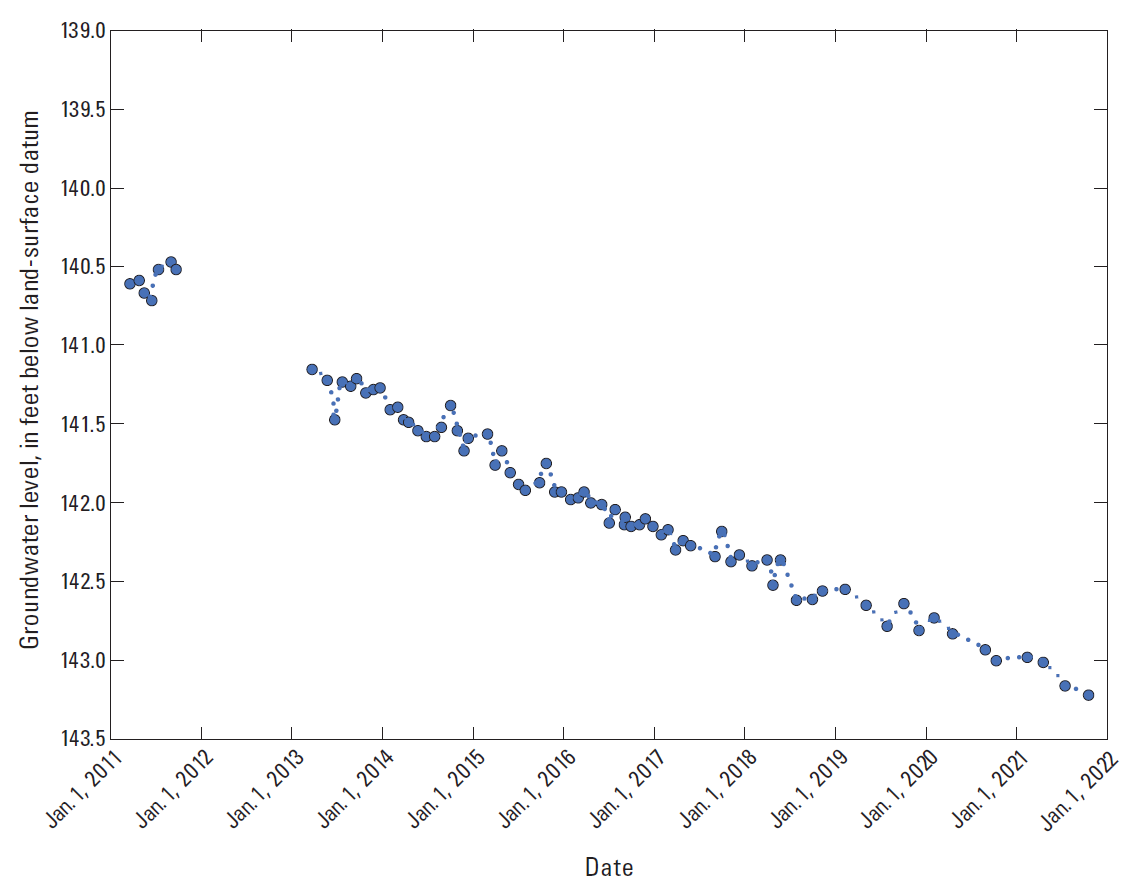
Graph of groundwater-level hydrograph from test well E-14, completed in the basin-fill aquifer, showing discrete water-level measurements collected by the Bureau of Land Management from 2011 through 2021 (Mason, 2023), Las Cienegas National Conservation Area, southeastern Arizona. Blank where no data exists.
From 1982 through 2006, ADWR periodically measured water levels in another deep well completed in the basin-fill aquifer. This well (ADWR no. 55-608628; USGS site number 314719110383001) is one of the original test wells drilled by Geraghty and Miller (1970) (their well GAC 2). The well, which is 845 ft deep and located near the Empire Ranch headquarters (fig. 1), flows under artesian pressure, so its shut-in pressure was measured using a pressure gauge and then converted to hydraulic head above land surface for illustration purposes. A hydrograph for the period of 1982–2006 shows that its hydraulic head did not change substantially, although it did decline slightly overall (fig. 10) (U.S. Geological Survey, 2022c).
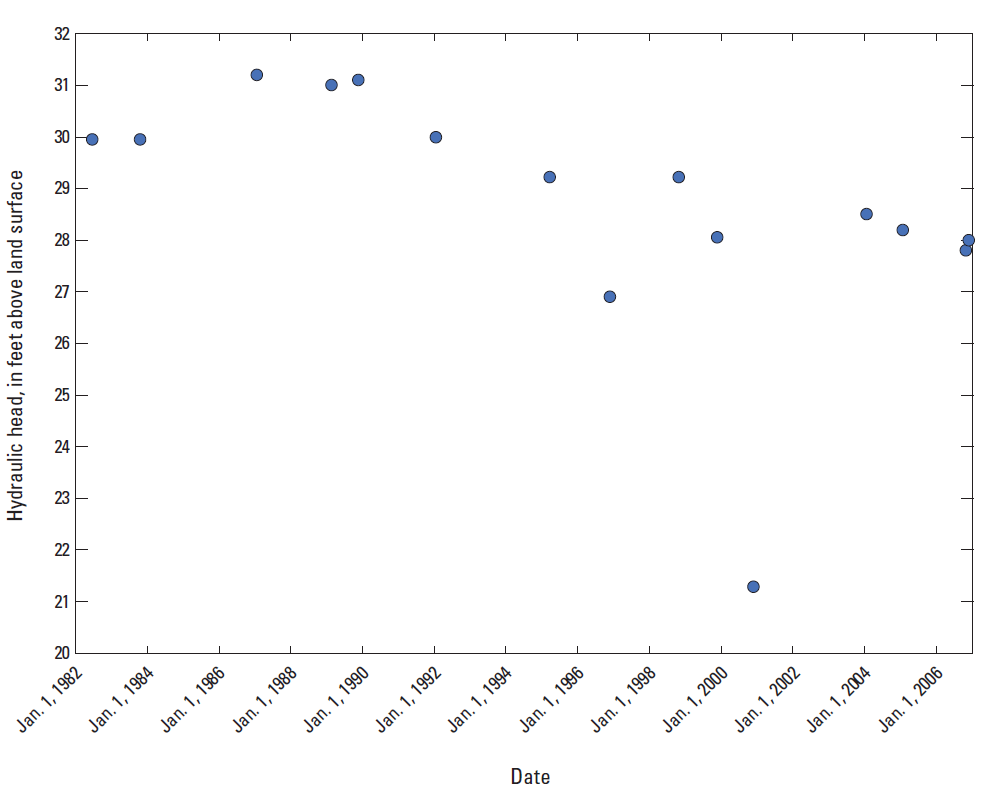
Hydrograph of changes in hydraulic head above land surface for test well GAC 2 (U.S. Geological Survey site number 314719110383001; Arizona Department of Water Resources [ADWR] registration number 55-608628), completed in the basin-fill aquifer, as collected by ADWR from 1982 through 2006 (U.S. Geological Survey, 2022c), Las Cienegas National Conservation Area, southeastern Arizona.
Water Chemistry
Robertson (1991) identified two hydrochemical processes affecting the chemical evolution of groundwater within alluvial basins of the Southwest. The first process involves reactions of meteoric water as it infiltrates the soil zone and percolates through the unsaturated zone to the water table in the recharge area. The second process involves reactions of groundwater as it moves downgradient from the recharge area to discharge areas. Robertson (1991) further stated that the major processes controlling recharge chemistry are the weathering of silicates and the dissolution of carbonate minerals in an acidic environment, whereas reactions downgradient occur in an alkaline environment. Although the weathering of primary silicates continues downgradient, the relative amounts of primary silicates change, so the precipitation of calcium carbonate (and probably of silica) becomes a dominant process influencing the water chemistry.
Natural waters are commonly classified by their major-ion chemistry using the relative concentrations of the most common cations (sodium, calcium, magnesium) and anions (chloride, sulfate, bicarbonate) that occur in natural waters. This classification is typically called the water type. Water type is determined by comparing the relative concentrations in milliequivalents of the cations and anions in water separately. To be classified as a specific water type, there must be a dominant cation and anion each making up more than 50 percent of the total. For example, if calcium makes up more than 50 percent of the cations and bicarbonate makes up more than 50 percent of the anions in the water, it is classified as a calcium-bicarbonate water type (or just calcium-bicarbonate water). If no cations and anions make up more than 50 percent of the total, the water is classified as a mixed water type (Hem, 1985).
The USGS National Water Information System database contains complete major-ion water-chemistry results from four groundwater wells in the LCNCA (table 4). Two of these wells (USGS wells 314849110353901 and 314719110383001) are Geraghty and Miller’s (1970) test wells (GAC 1 and GAC 2, respectively). For all samples, the concentration of total dissolved solids (TDS) was below the U.S. Environmental Protection Agency (EPA) secondary drinking water standard, a secondary maximum contaminant level [SMCL] of 500 milligrams per liter (mg/L) (EPA, 2023); TDS concentrations for the samples ranged from 203 to 220 mg/L. Results from two of the wells (314719110383001 and 314849110353901) indicated a sodium-bicarbonate water type, whereas the water in the remaining two wells (314118110360000 and 314703110383501) indicated a calcium-bicarbonate water type (fig. 11).
Table 4.
Water-chemistry sample results from basin-fill aquifer wells, Las Cienegas National Conservation Area, southeastern Arizona.[Data from the National Water Information System (U.S. Geological Survey, 2023). USGS, U.S. Geological Survey; temp., temperature; spec. cond., specific conductance; °C, degree Celsius; µS/cm, microsiemen per centimeter; mg/L, milligram per liter; µg/L, microgram per liter; TDS, total dissolved solids; N/A, not applicable; <, less than]
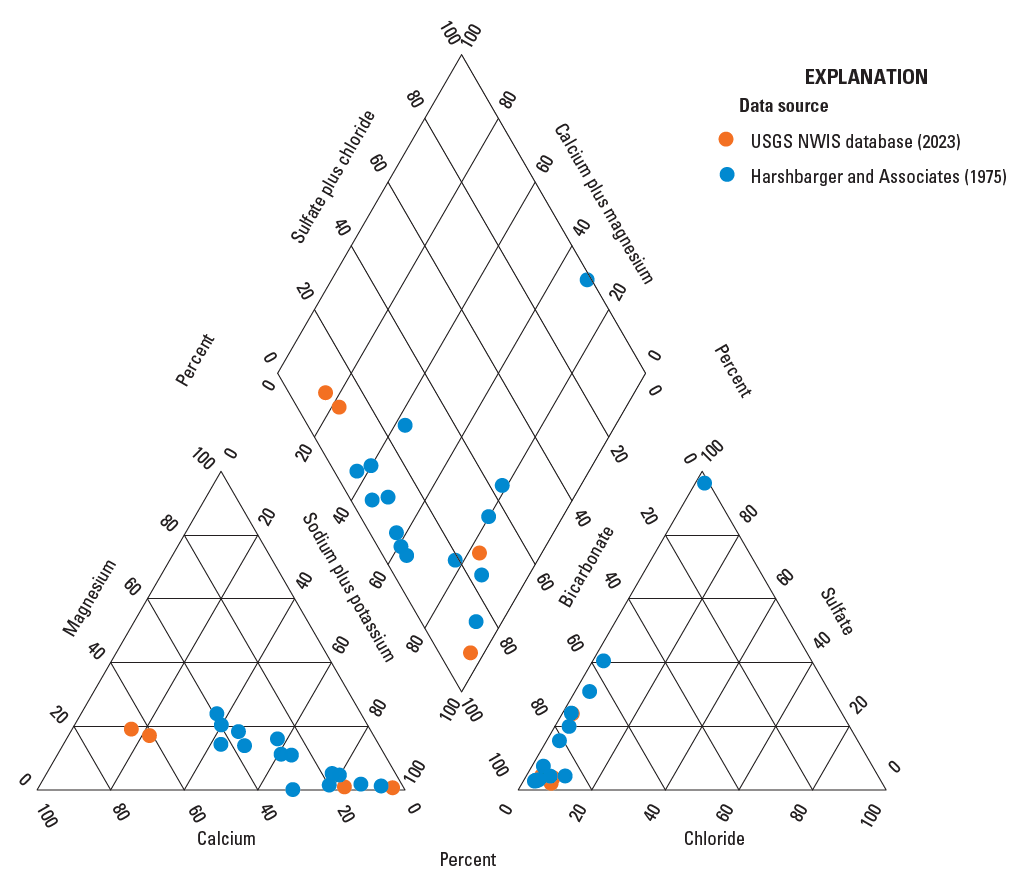
Piper diagram of the relative ionic compositions of basin-fill aquifer water samples from Las Cienegas National Conservation Area, southeastern Arizona. Data from the U.S. Geological Survey (USGS) National Water Information System (NWIS) database (USGS, 2023) and from Harshbarger and Associates (1975).
Of the 14 wells sampled within the upper Cienega groundwater basin by Harshbarger and Associates (1975), all but one had either a sodium-bicarbonate or calcium-bicarbonate water type. The remaining well had a sodium-sulfate water type (fig. 11). Every well they sampled had TDS concentrations below the EPA SMCL, apart from the well with a sodium-sulfate water type, which had a concentration of 977 mg/L. This well penetrated a thick sequence of silt and clay and had a lower transmissivity than the other wells.
Surface Water
Surface-water resources in the LCNCA consist of perennial stream reaches, springs, cienegas, and ponds. Since 2006, the BLM has annually measured the length of perennial reaches of Cienega Creek and its tributaries within the LCNCA (Mason, 2023). Table 5 shows the measured annual length of each reach, along with the maximum, minimum, and average for the full period of 2006–2021. The longest perennial stream flows occur on two separate reaches of Cienega Creek; from 2006 through 2021, the average length for this upper reach was 1.23 mi, whereas the lower reach averaged 3.47 mi (table 5). Figure 12 maps the perennial flow reaches measured by the BLM in 2021 for Cienega Creek and its tributaries, as well as the dry reaches that fall within the BLM’s monitored area. In 2021, the BLM measured 4.84 mi of wet reaches and 11.85 mi of dry reaches (fig. 12).
Table 5.
Perennial stream reach lengths, in miles, measured during annual Bureau of Land Management surveys from 2006 through 2021 for streams in the Las Cienegas National Conservation Area, southeastern Arizona (Mason, 2023).[—, no data]
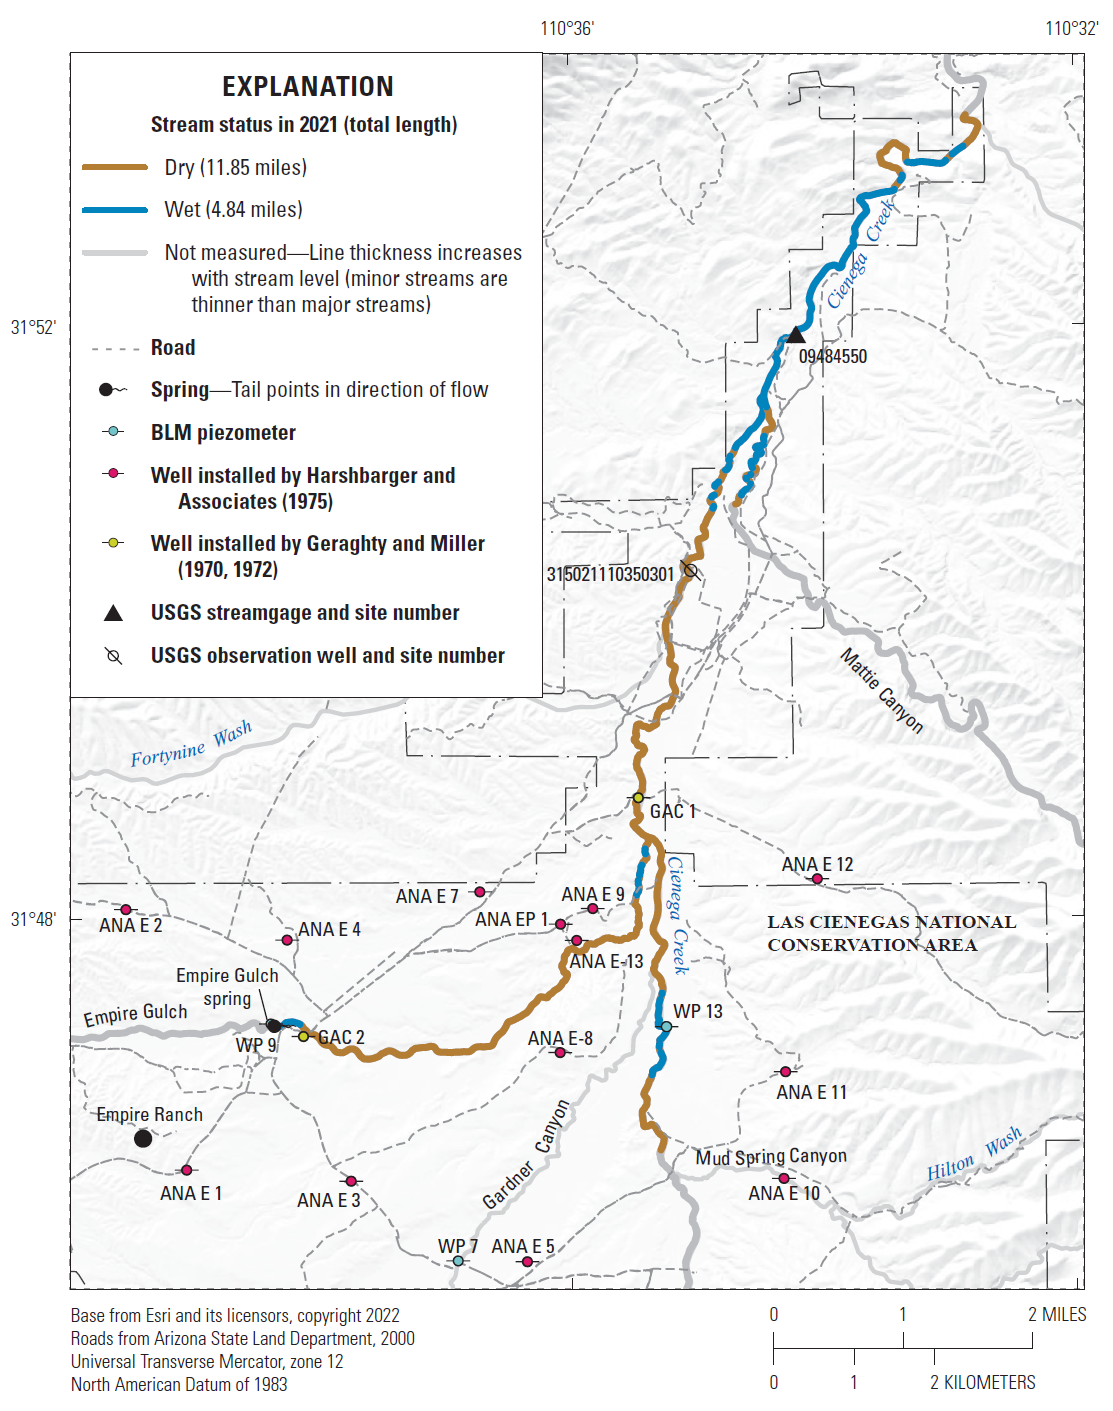
Map of wet and dry stream reaches measured by the Bureau of Land Management (BLM) in 2021 within the Las Cienegas National Conservation Area, southeastern Arizona (Mason, 2023). Locations of BLM piezometers with continuous water-level data and test wells drilled during previous studies also are shown.
Since October 2001, the USGS has operated a streamgage (site number 09484550) on Cienega Creek that provides streamflow data on its lower perennial reach. The streamgage is located in The Narrows, ~2.5 mi upstream from the north boundary of the LCNCA (fig. 1). Cienega Creek drains an area of 198 mi2 above this streamgage.
The monthly mean streamflow measured at the Cienega Creek streamgage for water years 2002–2021 is shown in table 6 and figure 13 (U.S. Geological Survey, 2022a). The USGS defines a water year as the 12-month period spanning October 1 of any given year through September 30 of the following year. The name of the water year is designated by the calendar year in which it ends, meaning that a given water year has associated data for 9 of the 12 months in that year. For example, the year ending on September 30, 2021, is called the “2021” water year. For water years 2002–2021, the lowest mean streamflow was in June (0.29 ft3/s) and the highest in July (9.8 ft3/s) (table 6; fig. 13). The July mean is heavily influenced by the flood that occurred in July 2021; the median July streamflow for water years 2002–2021 is just 0.84 ft3/s. Table 7, which lists the minimum daily mean streamflow for the same water-year period, shows that the streamgage often recorded no flow for parts of late May and June. Table 8 lists the annual peak streamflow for water years 2002–2021; the highest instantaneous streamflow recorded by the gage during this time was 6,710 ft3/s on July 23, 2021. The base flow of Cienega Creek at this site (site 09484550) is discussed in the “Groundwater” section of this report.
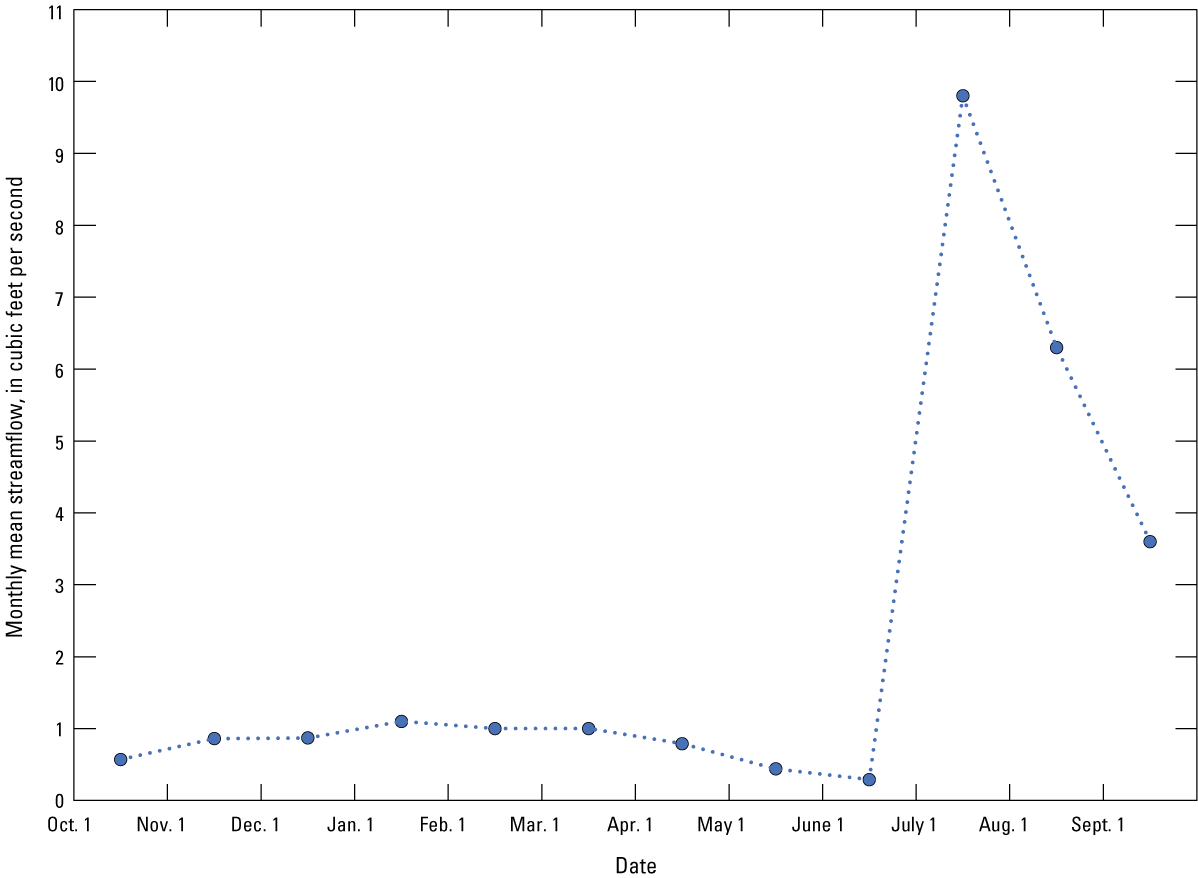
Graph of monthly mean streamflow calculated for water years 2002–2021 at U.S. Geological Survey streamgage 09484550 (Cienega Creek near Sonoita, Arizona; U.S. Geological Survey, 2022a).
Table 6.
Monthly mean streamflow, by year and month, calculated for water years 2002–2021 at U.S. Geological Survey streamgage 09484550 (Cienega Creek near Sonoita, Arizona), Las Cienegas National Conservation Area, southeastern Arizona.[Data from the National Water Information System (U.S. Geological Survey, 2022a). Calculation period is from October 1, 2001, to September 30, 2021. —, no data]
Table 7.
Minimum daily mean streamflow calculated for water years 2002–2021 at U.S. Geological Survey streamgage 09484550 (Cienega Creek near Sonoita, Arizona), Las Cienegas National Conservation Area, southeastern Arizona.[Data from the National Water Information System (U.S. Geological Survey, 2022a). Calculation period is from October 1, 2001, to September 30, 2021. —, no data]
Table 8.
Peak streamflow for water years 2002–2021, as recorded at U.S. Geological Survey streamgage 09484550 (Cienega Creek near Sonoita, Arizona), Las Cienegas National Conservation Area, southeastern Arizona.[Data from the National Water Information System (U.S. Geological Survey, 2022a). Dates shown as month/day/year. ft3/s, cubic foot per second]
Since mid-2006, the BLM has collected quarterly to monthly flow measurements at a site on the upper perennial reach of Cienega Creek near piezometer WP 13 (Mason, 2023). Between 2006 and 2021, the measured flow there ranged from 0.033 ft3/s (15 gal/min) to 0.475 ft3/s (213 gal/min). Higher flows consistently occurred in the fall and winter, whereas lower flows occurring in the spring and summer (fig. 6). During base-flow conditions, surface water in the upper perennial reach of Cienega Creek percolates back into the stream alluvium, on average a little more than 1 mi downstream from where it initially emerges (table 5), leaving an ~4-mi stretch of dry stream between the upper and lower perennial reaches.
Other short perennial reaches within the LCNCA are (1) in Empire Gulch northeast of the Empire Ranch headquarters, (2) at the mouth of Mattie Canyon where it meets Cienega Creek (fig. 12), and (3) in O’Donnell Canyon. These flows are supported by rheocrene springs that emerge within the stream channels. Table 5 and figure 12 show the lengths of the perennial reaches; the reach within Mattie Canyon averaged 0.74 mi in length from 2006 through 2021, whereas the combined length of two measured reaches in Empire Gulch averaged 0.96 mi. The combined wet length of all measured perennial reaches averaged 6.35 mi (not including O’Donnell Canyon).
Cienegas in the LCNCA are marshland communities associated with perennial springs. Hendrickson and Minckley (1985) describe cienegas as perpetuated by permanent, scarcely fluctuating sources of water that are rarely subject to harsh winter conditions. They further explain that cienegas are near enough to headwaters that they face minimal risk of scouring from flooding. Cienegas occur both along perennial reaches of Cienega Creek and the lower reaches of Empire Gulch, as well as at other discrete locations within the LCNCA (fig. 14).
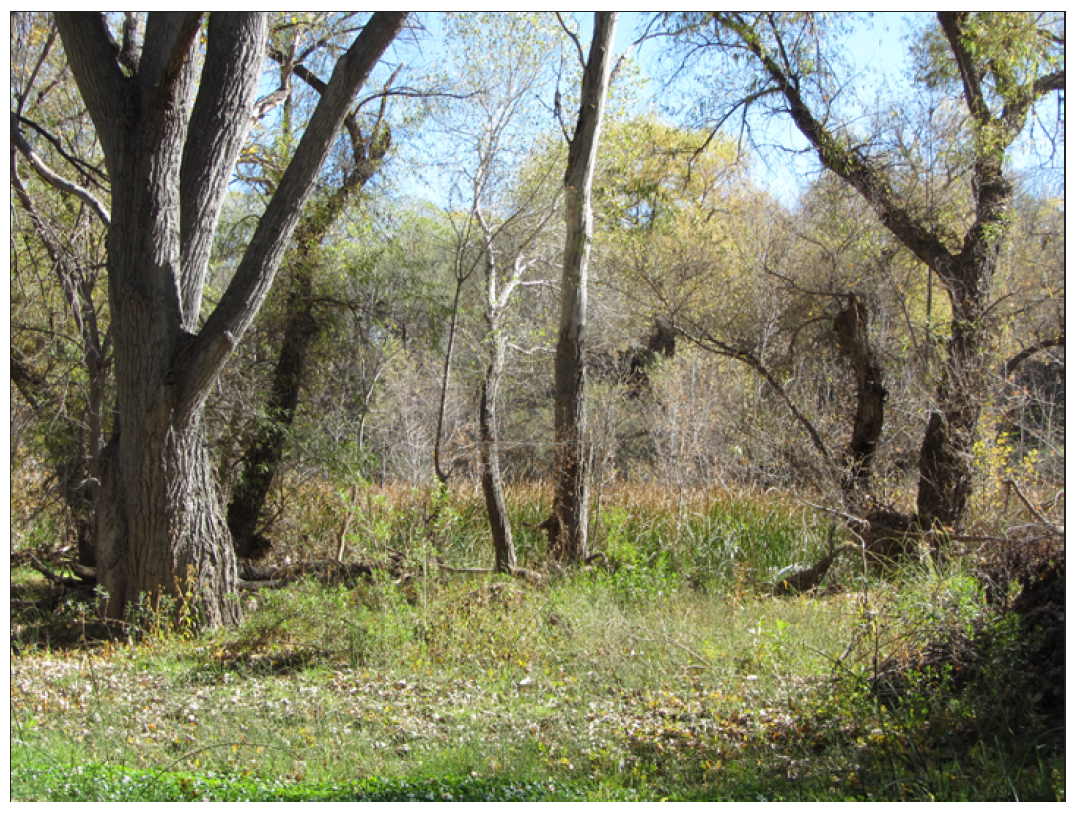
Photograph of cienega near the confluence of Cienega Creek and Mattie Canyon, Las Cienegas National Conservation Area, southeastern Arizona. Photograph by Jon Mason, U.S. Geological Survey, November 2021.
Tucci (2018) concluded that the springs supplying water to the cienegas surrounding Cienega Creek in the LCNCA appear to be sustained by the basin-fill aquifer, as indicated by similar sulfate-to-chloride mass ratios and relatively long residence times. Tucci (2018) also noted that spring and well samples in the LCNCA have similar sulfate-to-chloride mass ratios as groundwater from the nearby Tucson alluvial basin (Gu, 2005).
In addition to perennial stream reaches and cienegas, the LCNCA contains several man-made wetlands and stock ponds. The man-made wetlands were created either by digging pits down to the water table on the Cienega Creek floodplain or by supplying water from artesian wells. The stock ponds are supplied by wells and were created as an alternative source of water for cattle that graze in the LCNCA, since they have been fenced out of the perennial stream reaches and cienegas in the conservation area.
Summary
The U.S. Geological Survey (USGS), in cooperation with the Bureau of Land Management (BLM), inventoried and evaluated existing water resources for the Las Cienegas National Conservation Area (LCNCA), which consist of major groundwater aquifers as well as springs, surface-water bodies, and surface-water flows. The LCNCA lies largely within a sedimentary basin known as the Sonoita basin. The Sonoita basin is bordered by the Empire and Santa Rita Mountains to the west; the Whetstone, Mustang, and Huachuca Mountains to the east; and the Canelo Hills to the south (fig. 1). This area of southeastern Arizona is part of the Basin and Range physiographic province and is considered part of the Madrean archipelago, an area of desert lowland punctuated by isolated mountain ranges or sky islands.
The climate of the LCNCA is considered “cold semi-arid steppe” under the Köppen climate classification system (Kottek and others, 2006) and has average annual temperatures varying, in degrees Fahrenheit (°F), from the high 50s to the low 60s, depending on elevation (Parameter-elevation Regressions on Independent Slopes Model [PRISM] Climate Group, 2022) (fig. 2). Temperature extremes of approximately (~) 100 °F in the summer and ~20 °F in the winter can occur in the area (Western Regional Climate Center, 2022). Total mean annual precipitation for the entire Cienega Creek basin was estimated to be 19.4 inches (in.) (Tillman and others, 2011), whereas 17.85 in. (Knight, 1996) was estimated for the upper basin alone. Much of the precipitation occurs during isolated monsoonal thunderstorms in the summer. Potential evaporation was estimated to be ~60 in. per year (Farnsworth and others, 1982).
The Arizona Department of Water Resources (2009) lists “basin fill” and “recent stream alluvium” as the major aquifers in the Cienega Creek basin, although herein, groundwater associated with recent stream alluvium is referred to as the Quaternary alluvial aquifer. In contrast, little is known about the hydraulic properties of bedrock in the LCNCA because no wells produce from it. Because the basin-fill and Quaternary alluvial aquifers are readily available and sufficiently productive throughout the LCNCA, exploring development of water from the bedrock (most exposures of which are tilted and folded Cretaceous sedimentary deposits) has been unnecessary.
The Quaternary alluvial aquifer consists of Quaternary saturated stream alluvium (Arizona Department of Water Resources, 2009) along Cienega Creek and its major tributaries. This aquifer provides the water necessary for base flow in the perennial stream reaches that support aquatic life and for wetland and riparian habitat along the stream courses. Tucci (2018) reported that much of the Quaternary alluvial aquifer within the upper Cienega groundwater basin receives most of its recharge from the older basin-fill aquifer and not from surface water flow.
The basin-fill aquifer, which is much thicker and has a larger aerial extent than the Quaternary alluvial aquifer, underlies most of the LCNCA. The basin-fill aquifer is part of a sedimentary basin, the Sonoita basin, that is at least 4,800 feet (ft) deep (Richard and others, 2007). However, no researchers have directly studied whether the basin sediments greater than 2,000 ft below the surface can function as an aquifer. Within the upper Cienega groundwater basin, the basin-fill aquifer is more commonly developed for anthropogenic uses than the Quaternary alluvial aquifer. Tucci (2018) found that most recharge to the basin-fill aquifer appears to derive from either mountain-front or mountain-block recharge. The previous studies reviewed for this report estimated a range of total annual groundwater recharge of 4,653 to 19,530 acre-feet per year (acre-ft/yr) (table 1).
Previous studies provide many estimates of groundwater discharge from the upper Cienega groundwater basin, but it is difficult to compare these estimates because the studies treated or grouped the components of discharge differently. The studies reviewed for this report estimated total annual groundwater discharge ranges from 4,350 and 12,608 acre-ft/yr (table 2).
In January 2020, the USGS began operating a continuously recording water-level observation well completed in the Quaternary alluvial aquifer on the floodplain of Cienega Creek. Water levels from this well show both seasonal and daily patterns, as well as responses to flood flows in Cienega Creek. The BLM also collects continuous water-level data from the Quaternary alluvial aquifer using piezometers installed along Cienega Creek, in Empire Gulch, and in Gardner Canyon. The water levels from these piezometers show similar patterns to those from the USGS observation well.
Since 2011, the BLM has collected monthly or quarterly discrete water-level measurements from deep wells (greater than 1,000 ft deep) completed in the basin-fill aquifer within the LCNCA. Water levels in these wells have generally declined a few feet at a gradual rate since measurements began in 2011. Hydraulic head measurements collected by the Arizona Department of Water Resources from an artesian well completed in the basin-fill aquifer did not change substantially between 1982 and 2006, although the hydraulic head declined slightly overall during this period.
This study reviewed 18 water chemistry samples from the basin-fill aquifer, all but one of which had either a sodium-bicarbonate or calcium-bicarbonate water type. The other sample had a sodium-sulfate water type and was the only sample that exceeded the U.S. Environmental Protection Agency secondary maximum contaminant level of 500 milligrams per liter for total dissolved solids concentration.
The largest perennial stream flows within the LCNCA exist on two separate reaches of Cienega Creek, whereas smaller perennial flows exist in Empire Gulch, Mattie Canyon, and O’Donnell Canyon. The Standard Base-Flow Index method, described by Barlow and others (2015), was used to estimate the average base flow in the lower perennial reach of Cienega Creek at a USGS streamgage (site number 09484550) for calendar years 2002–2021. The average annual base-flow estimates for this 20-year period ranged from a low of 0.47 cubic feet per second (ft3/s) in 2005 to a high of 0.81 ft3/s in 2018, with an average for all years of 0.62 ft3/s.
Monthly mean streamflow measured at the Cienega Creek gage for water years 2002–2021 ranged from a low of 0.29 ft3/s in June to a high of 9.8 ft3/s in July. The July average is heavily influenced by a flood that occurred in July 2021; the median July streamflow for the same period is just 0.84 ft3/s. The minimum of daily mean values for the same period shows that the gage commonly recorded no flow for parts of late May and June. The highest instantaneous streamflow recorded by the gage during water years 2002–2021 was 6,710 ft3/s on July 23, 2021.
References Cited
Anderson, T.W., 1995, Summary of the southwest alluvial basins, regional aquifer-system analysis, south-central Arizona and parts of adjacent States: U.S. Geological Survey Professional Paper 1406–A, 33 p., https://doi.org/10.3133/pp1406A.
Anderson, T.W., and Freethey, G.W., 1995, Simulation of ground-water flow in alluvial basins in south-central Arizona and parts of adjacent States: U.S. Geological Survey Professional Paper 1406–D, 78 p., https://doi.org/10.3133/pp1406D.
Anderson, T.W., Freethey, G.W., and Tucci, P., 1992, Geohydrology and water resources of alluvial basins in south-central Arizona and parts of adjacent States: U.S. Geological Survey Professional Paper 1406–B, 67 p., https://doi.org/10.3133/pp1406B.
Arizona Department of Water Resources, 2009, Arizona water atlas—Volume 3, Southeastern Arizona planning area: Phoenix, Arizona, Arizona Department of Water Resources, 598 p., accessed October 13, 2021, at https://prism.lib.asu.edu/items/49256.
Barlow, P.M., Cunningham, W.L., Zhai, T., and Gray, M., 2017, U.S. Geological Survey Groundwater Toolbox version 1.3.1, a graphical and mapping interface for analysis of hydrologic data: U.S. Geological Survey software release, https://doi.org/10.5066/F7R78C9G.
Barlow, P.M., Cunningham, W.L., Zhai, T., and Gray, M., 2015, U.S. Geological Survey Groundwater Toolbox, a graphical and mapping interface for analysis of hydrologic data (version 1.0)—User guide for estimation of base flow, runoff, and groundwater recharge from streamflow data: U.S. Geological Survey Techniques and Methods 3–B10, 27 p., https://doi.org/10.3133/tm3B10.
Bittson, A.G., 1976, Analysis of gravity data from the Cienega Creek area, Pima and Santa Cruz counties, Arizona: Tucson, Arizona, University of Arizona, M.S. thesis, 76 p., accessed December 9, 2021, at https://repository.arizona.edu/handle/10150/566652.
Bodner, G., and Simms, K., 2008, Condition and trend of riparian target species, vegetation and channel geomorphology, pt. 3 of State of the Las Cienegas National Conservation Area: Phoenix, Arizona, The Nature Conservancy in Arizona, 69 p., accessed October 7, 2021, at https://azconservation.org/dl/TNCAZ_LasCienegas_Riparian_Status_and_Trends.pdf.
Bodner, G., Simms, J., and Gori, D., 2007, State of the Las Cienegas National Conservation Area—Gila Topminnow population status and trends 1989-2005: Phoenix, Arizona, The Nature Conservancy in Arizona, 50 p., accessed October 7, 2021, at https://azconservation.org/wp-content/uploads/2021/08/TNCAZ_LasCienegas_Gila_Topminnow_Status.pdf.
Boggs, J.M., 1980, Impact of future ground-water development in Cienega Creek area, Pima, Santa Cruz, and Cochise counties: Tucson, Arizona, University of Arizona, M.S. thesis, 131 p., accessed March 13, 2022, at https://repository.arizona.edu/handle/10150/191698.
Bota, L., 1997, Modeling of groundwater flow and surface/groundwater interaction for upper Cienega Creek basin: Tucson, Arizona, University of Arizona, M.S. thesis, 95 p., accessed March 19, 2022, at https://repository.arizona.edu/handle/10150/626917.
Cook, J.P., and Ferguson, C.A., 2019, Geologic map of Empire Ranch 7.5' Quadrangle, Pima County, Arizona: Arizona Geological Survey Digital Geologic Map 143, 1 sheet, scale 1:24,000, accessed January 6, 2022, at http://repository.azgs.az.gov/uri_gin/azgs/dlio/1922.
Dickinson, W.R., and Lawton, T.F., 2001, Tectonic setting and sandstone petrofacies of the Bisbee basin (USA–Mexico): Journal of South American Earth Sciences, v. 14, no. 5, p. 475–504, https://doi.org/10.1016/S0895-9811(01)00046-3.
Drewes, H., 1971, Mesozoic stratigraphy of the Santa Rita Mountains, southeast of Tucson, Arizona: U.S. Geological Survey Professional Paper 658-C, 81 p., accessed January 4, 2022, at https://doi.org/10.3133/pp658C.
Errol L. Montgomery & Associates, Inc., 2009, Results of phase 2 hydrogeologic investigations and monitoring program, Rosemont project, Pima County, Arizona: Vail, Arizona, Rosemont Copper, prepared by Errol L. Montgomery & Associates, Inc., 45 p., accessed March 13, 2022, at https://www.rosemonteis.us/sites/default/files/technical-reports/012065.pdf.
Farnsworth, R.K., Thompson, E.S., and Peck, E.L., 1982, Evaporation atlas for the contiguous 48 United States: National Oceanographic and Atmospheric Administration Technical Report National Weather Service Series 33, 26 p. [Also available at https://semspub.epa.gov/work/01/554362.pdf].
Finnell, T.L., 1971, Preliminary geologic map of the Empire Mountains quadrangle, Pima County, Arizona: U.S. Geological Survey Open-File Report 71-106, 2 sheets, scale 1:48,000, https://doi.org/10.3133/ofr71106.
Flesch, A.D., and Hahn, L.A., 2005, Distribution of birds and plants at the western and southern edges of the Madrean Sky Islands in Sonora, Mexico, in Gottfried, G.J., Gebow, B.S., Eskew, L.G., and Edminster, C.B., comps., Connecting Mountain Islands and Desert Seas—biodiversity and management of the Madrean Archipelago II: Proceedings RMRS-P-36— United States Forest Service Conference on Research and Resource Management in the Southwestern Deserts, 5th, Tucson, Arizona, May 11–15, 2004, p. 80–87.
Freethey, G.W., and Anderson, T.W., 1986, Predevelopment hydrologic conditions in the alluvial basins of Arizona and adjacent parts of California and New Mexico: U.S. Geological Survey Hydrologic Investigations Atlas 664, 3 sheets, scale 1:500,000, https://doi.org/10.3133/ha664.
Freethey, G.W., Pool, D.R., Anderson, T.W., and Tucci, P., 1986, Description and generalized distribution of aquifer and materials in the alluvial basins of Arizona and adjacent parts of California and New Mexico: U.S. Geological Survey Hydrologic Investigations Atlas 663, 4 sheets, scale 1:500,000, https://doi.org/10.3133/ha663.
Gori, D., and Schussman, H., 2005, State of the Las Cienegas National Conservation Area, part I, condition and trend of the desert grassland and watershed: Phoenix, Arizona, The Nature Conservancy of Arizona, 63 p., accessed October 15, 2021, at https://azconservation.org/dl/TNCAZ_LasCienegas_StateOf_Part_1.pdf.
Gray, E.L., 2018, Using water isotopes and solute chemistry to investigate the hydrology of surface water in the Cienega Creek Watershed: Tucson, Arizona, University of Arizona, M.S. thesis, 87 p., accessed October 7, 2021, at https://repository.arizona.edu/handle/10150/631405.
Gu, A., 2005, Sable isotope geochemistry of sulfate in groundwater of southern Arizona—Implications for groundwater flow, sulfate sources, and environmental significance: Tucson, Arizona, University of Arizona, Ph.D. dissertation, 256 p., accessed October 7, 2021, at https://repository.arizona.edu/handle/10150/191273.
Hendrickson, D.A., and Minckley, W.L., 1985, Ciénegas—Vanishing climax communities of the American southwest: Desert Plants, v. 6, no. 3, p. 131–175, [Also available at http://dx.doi.org/10.26153/tsw/9234].
Huth, H.J., 1997, Hydrogeochemical modeling of western mountain front recharge, upper Cienega Creek sub-basin, Pima County: Tucson, Arizona, University of Arizona, M.S. thesis, 120 p., accessed October 7, 2021, at https://repository.arizona.edu/handle/10150/338761.
Kafri, U., and Ben-Asher, J., 1976, Evaluation of recharge through soils in a mountain region—A case study on the Empire and the Sonoita Basins: Hydrology and Water Resources in Arizona and the Southwest, v. 6, p. 203–213, accessed March 10, 2022, at http://hdl.handle.net/10150/300977.
Knight, E.L., 1996, A water budget and land management recommendations for upper Cienega Creek basin: Tucson, Arizona, University of Arizona, M.S. thesis, 119 p., accessed March 25, 2022, at https://repository.arizona.edu/handle/10150/191300.
Kottek, M., Grieser, J., Beck, C., Rudolf, B., and Rubel, F., 2006: World Map of the Köppen-Geiger climate classification updated: Meteorologische Zeitschrift, v. 15, p. 259–263, accessed March 16, 2023, at http://koeppen-geiger.vu-wien.ac.at/pdf/Paper_2006.pdf.
LANDFIRE, 2021, Existing Vegetation Type layer (version 2.0.0) [dataset]: U.S. Department of the Interior, U.S. Geological Survey, and U.S. Department of Agriculture, accessed February 8, 2024, at https://landfire.gov/viewer.
Mason, J.P., 2023, Supplemental groundwater level, spring flow, and streamflow data for the Water Resources Inventory of the Las Cienegas National Conservation Area, southeastern Arizona: U.S. Geological Survey data release, https://doi.org/10.5066/P9X94P5B.
Montgomery & Associates, 2010, Groundwater flow modeling conducted for simulation of proposed Rosemont pit dewatering and post-closure, volume 1—text and tables, Rosemont project, Pima County, Arizona: Vail, Arizona, Rosemont Copper, prepared by Montgomery & Associates, 123 p., accessed March 9, 2022, at https://www.rosemonteis.us/sites/default/files/technical-reports/013310.pdf.
Myers, T., 2008, Hydrogeology of the Santa Rita Rosemont project site—Numerical groundwater modeling of the conceptual flow model and effects of the construction of the proposed open pit: Tucson, Arizona, Pima County Board of Supervisors, prepared by T. Myers, Reno, Nevada, 55 p., accessed March 14, 2022, at https://www.rosemonteis.us/sites/default/files/references/myers-2008.pdf.
Myers, T., 2010, Updated groundwater modeling report, proposed Rosemont Open Pit mining project: Tucson, Arizona, Pima County and Pima County Regional Flood Control District, prepared by Hydrology and Water Resources, 27 p., accessed December 8, 2021, at https://www.rosemonteis.us/sites/default/files/references/013258.pdf.
National Oceanic and Atmospheric Administration [NOAA], 2022, Climate at a glance statewide time series [database]: NOAA National Centers for Environmental Information, accessed December 15, 2022, at https://www.ncei.noaa.gov/access/monitoring/climate-at-a-glance/statewide/time-series/2/pcp/1/4/1895-2022.
Parameter-elevation Regressions on Independent Slopes Model [PRISM] Climate Group, 2022, PRISM climate data: Corvallis, Oregon, Northwest Alliance for Computational Science and Engineering, Oregon State University, accessed February 3, 2022, at http://prism.oregonstate.edu.
Peterson, J.A., 1990, Preliminary mineral resource assessment of the Tucson and Nogales 1° by 2° quadrangles, Arizona: U.S. Geological Survey Open-File Report 90-276, 1 sheet, scale 1:250,000, accessed January 7, 2022, at https://doi.org/10.3133/ofr90276.
Peterson, J.A., Berquist, J.R., Reynolds, S.J., Page-Nedell, S.S., Oland, G.P., and Hirschberg, D.M., 2001, Geologic map of the Tucson and Nogales quadrangles (Arizona, scale 1:250,000)—A digital database: U.S. Geological Survey Open-File Report 2001–275, 2 plates, 25-p. pamphlet, https://doi.org/10.3133/ofr01275.
Richard, S.M., Shipman, T.C., Greene, L., and Harris, R.C., 2007, Estimated depth to bedrock in Arizona (ver. 1.0, April 2007): Arizona Geological Survey Digital Geologic Map 52, 1 sheet, scale 1:1,000,000, accessed January 5, 2022, at http://repository.azgs.az.gov/sites/default/files/dlio/files/2010/u15/DGM-52Map.pdf.
Robertson, F.N., 1991, Geochemistry of ground water in alluvial basins of Arizona and adjacent parts of Nevada, New Mexico, and California: U.S. Geological Survey Professional Paper 1406–C, 90 p., accessed December 3, 2021, at https://doi.org/10.3133/pp1406C.
Roudebush, E.M., 1996, The influence of bedrock on perennial streamflow in the upper Cienega Creek basin, Pima County, Arizona: Tucson, Arizona, University of Arizona, M.S. thesis, 81 p., accessed December 8, 2021, at https://repository.arizona.edu/handle/10150/626107.
Spencer, J.E., Youberg, A., and Shipman, T.C., 2010, Geologic map of the Spring Water Canyon 7.5' Quadrangle, Pima County, Arizona (ver. 1.0, May 7, 2014): Arizona Geological Survey Digital Geologic Map 79, 1 sheet, scale 1:24,000, accessed January 5, 2022, at https://ngmdb.usgs.gov/Prodesc/proddesc_94472.htm.
Springer, A.E., and Stevens, L.E., 2009, Spheres of discharge of springs: Hydrogeology Journal, v. 17, no. 1, p. 83–93, https://doi.org/10.1007/s10040-008-0341-y.
Stonestrom, D.A., and Harrill, J.R., 2007, Ground-water recharge in the arid and semiarid southwestern United States—Climatic and geologic framework, chap. A of Stonestrom, D.A., Constantz, J., Ferré, T.P.A, and Leake, S.A., eds., Ground-water recharge in the arid and semiarid southwestern United States: U.S. Geological Survey Professional Paper 1703, 27 p., accessed January 25, 2022, at https://doi.org/10.3133/pp1703A.
Tetra Tech, 2010a, Davidson Canyon hydrogeologic conceptual model and assessment of spring impacts: Vail, Arizona, Rosemont Copper, prepared by Tetra Tech, 40 p., accessed December 8, 2021, at https://www.rosemonteis.us/sites/default/files/technical-reports/012941.pdf.
Tetra Tech, 2010b, Regional groundwater flow model, Rosemont Copper project: Vail, Arizona, Rosemont Copper, prepared by Tetra Tech, 118 p., accessed December 8, 2021, at https://www.rosemonteis.us/sites/default/files/technical-reports/013794.pdf.
Tillman, F.D, Cordova, J.T., Leake, S.A., Thomas, B.E., and Callegary, J.B., 2011, Water availability and use pilot—Methods development for a regional assessment of groundwater availability, southwest alluvial basins, Arizona: U.S. Geological Survey Scientific Investigations Report 2011–5071, 118 p., accessed November 9, 2018, at https://doi.org/10.3133/sir20115071.
Towne, D.C., and Rodine, J.A., 2002, Ambient groundwater quality of the Cienega Creek Basin—A 2000 - 2001 baseline study: Arizona Department of Environmental Quality Open File Report 12-02, 46 p., accessed October 7, 2021, at https://legacy.azdeq.gov/environ/water/assessment/download/cienega_creek_ofr.pdf.
Trapp, R.A., and Reynolds, S.J., 1995, Map showing names and outlines of physiographic areas in Arizona used by the Arizona Geological Survey with base map showing township and range only: Arizona Geological Survey Open File Report 95-2b, 1 sheet, scale 1:1,000,000, accessed July 17, 2019 at https://repository.arizona.edu/handle/10150/629812.
Tucci, R.S., 2018, Using isotopes and solute tracers to infer groundwater recharge and flow in the Cienega Creek watershed, SE Arizona: Tucson, Arizona, University of Arizona, M.S. thesis, 75 p., accessed January 29, 2022, at https://repository.arizona.edu/handle/10150/628442.
U.S. Environmental Protection Agency [EPA], 2023, Secondary drinking water standards—Guidance for nuisance chemicals: U.S. Environmental Protection Agency web page, accessed September 13, 2023 at https://www.epa.gov/sdwa/secondary-drinking-water-standards-guidance-nuisance-chemicals.
U.S. Geological Survey, 2022a, USGS 09484550 Cienega Creak near Sonoita, Arizona: U.S. Geological Survey National Water Information System, accessed July 15, 2022, at https://waterdata.usgs.gov/monitoring-location/09484550/#parameterCode=00065&period=P7D.
U.S. Geological Survey, 2022b, USGS 315021110350301 D-18-17 26CBA1 [Blm Cienega]: U.S. Geological Survey National Water Information System, accessed July 15, 2022, at https://waterdata.usgs.gov/monitoring-location/315021110350301/#parameterCode=72019&period=P1Y.
U.S. Geological Survey, 2022c, USGS 314719110383001 D-19-17 17BBD1: U.S. Geological Survey National Water Information System, accessed July 15, 2022, at https://nwis.waterdata.usgs.gov/az/nwis/gwlevels/?site_no=314719110383001.
U.S. Geological Survey, 2023, USGS Water Data for the Nation: U.S. Geological Survey National Water Information System database, https://doi.org/10.5066/F7P55KJN.
Western Regional Climate Center, 2022, RAWS USA climate archive [database]: Empire, Arizona, Western Regional Climate Center, accessed February 3, 2022, at https://raws.dri.edu/cgi-bin/rawMAIN.pl?azAEMP.
Williams, M.D., 1996, Evapotranspiration in southeast Arizona semi-arid watersheds—Walnut Gulch and Cienega Creek: Tucson, Arizona, University of Arizona, M.S. thesis, 183 p., accessed March 25, 2022, at https://repository.arizona.edu/handle/10150/626782.
Wilson, J., and Guan, H., 2004, Mountain-block hydrology and mountain-front recharge, in Hogan, J.F., Phillips, F.M., and Scanlon, B.R., eds., Groundwater recharge in a desert environment—The southwestern United States: American Geophysical Union Water Science and Application, v. 9, p. 113–137, https://doi.org/10.1029/009WSA08.
Wilson, E.D., Moore, R.T., and O’Haire, R.T., 1960, Geologic map of Pima and Santa Cruz Counties, Arizona: Arizona Bureau of Mines and University of Arizona, 1 sheet, scale 1:375,000, accessed January 4, 2022, at https://repository.arizona.edu/handle/10150/629600.
Conversion Factors
U.S. customary units to International System of Units
Temperature in degrees Fahrenheit (°F) may be converted to degrees Celsius (°C) as follows: °C = (°F – 32) / 1.8.
Datums
Vertical coordinate information is referenced to the North American Vertical Datum of 1988 (NAVD 88).
Horizontal coordinate information is referenced to the North American Datum of 1983 (NAD 83).
Abbreviations
ADEQ
Arizona Department of Environmental Quality
ADWR
Arizona Department of Water Resources
BFI
Base-Flow Index
BLM
Bureau of Land Management
EPA
U.S. Environmental Protection Agency
LANDFIRE
Landscape Fire and Resource Management Planning Tools
LCNCA
Las Cienegas National Conservation Area
MODFLOW
modular three-dimensional finite-difference groundwater flow model
NWIS
National Water Information System
OAW
Outstanding Arizona Water
PRISM
Parameter-elevation Regressions on Independent Slopes Model
SMCL
secondary maximum contaminant level
TDS
total dissolved solids
USGS
U.S. Geological Survey
Moffett Field Publishing Service Center, California
Manuscript approved for publication December 4, 2023
Edited by Claire Ashcraft
Layout and design by Cory Hurd
Disclaimers
Any use of trade, firm, or product names is for descriptive purposes only and does not imply endorsement by the U.S. Government.
Although this information product, for the most part, is in the public domain, it also may contain copyrighted materials as noted in the text. Permission to reproduce copyrighted items must be secured from the copyright owner.
Suggested Citation
Mason, J.P., 2024, Water resources inventory of the Las Cienegas National Conservation Area, southeastern Arizona: U.S. Geological Survey Scientific Investigations Report 2023–5131, 31 p., https://doi.org/10.3133/sir20235131.
ISSN: 2328-0328 (online)
Study Area
| Publication type | Report |
|---|---|
| Publication Subtype | USGS Numbered Series |
| Title | Water resources inventory of the Las Cienegas National Conservation Area, southeastern Arizona |
| Series title | Scientific Investigations Report |
| Series number | 2023-5131 |
| DOI | 10.3133/sir20235131 |
| Publication Date | February 29, 2024 |
| Year Published | 2024 |
| Language | English |
| Publisher | U.S. Geological Survey |
| Publisher location | Reston, VA |
| Contributing office(s) | Arizona Water Science Center |
| Description | vii, 31 p. |
| Country | United States |
| State | Arizona |
| Other Geospatial | Las Cienegas National Conservation Area |
| Online Only (Y/N) | Y |