

Estimation and Comparison of 1-Percent Annual Exceedance Probability Flood Flows At Federal Emergency Management Agency Flood Insurance Study Flow Locations Across Pennsylvania
Links
- Document: Report (24.4 MB pdf) , HTML , XML
- Data Release: USGS data release - USGS-derived 1-percent annual exceedance probability flood-flow estimates at flood insurance study locations across Pennsylvania
- NGMDB Index Page: National Geologic Map Database Index Page (html)
- Download citation as: RIS | Dublin Core
Acknowledgments
The authors would like to thank FEMA Region 3 and the Pennsylvania Department of Transportation for their continued partnership and support in providing flood-flow hydrology products for Pennsylvania and its communities. This ongoing partnership facilitates the continual updates necessary to understand temporally dynamic hydrology in the face of ever-evolving land use and climate trends.
Special thanks are given to Jon A. Janowicz, U.S. Geological Survey, New Jersey Water Science Center for his valued input and guidance associated with the technical analyses.
Abstract
Flood-flow estimates were computed at over 5,000 Federal Emergency Management Agency (FEMA) flood insurance study (FIS) flow locations across Pennsylvania for the 1-percent annual exceedance probability flood event (1-percent AEP). Depending on a point of interest’s proximity to a streamgage, weighting techniques may be applied to obtain flood-flow estimates for ungaged flow locations using observed peak-flow data from a nearby streamgage. Following the U.S. Geological Survey’s (USGS) published guidance, stream segments were identified where the drainage-area ratio method could be leveraged. Using updated regional regression equations and recently published flood-flow estimates at USGS streamgage locations following USGS Bulletin 17C guidelines, weighted and transferred flood flows were computed, where appropriate. For locations not applicable for the drainage-area ratio method, regression equations were used to compute flood-flow estimates. These flood-flow estimates were then compared to FEMA FIS 1-percent AEP flood-flow estimates. Percentage-difference values were computed for 3,599 FIS flow locations determined to be suitable for analysis, finding that USGS-derived flood-flow estimates were consistently lower than FEMA FIS flood-flow estimates with a statewide median percentage difference of −10.1 percent. The dataset was normally distributed with a standard deviation of 45.7 percent. Allegheny County was found to have 74 FIS flow locations with percentage-difference values greater than or equal to 67 percent or less than or equal to −67 percent. The flood-flow region in which Allegheny County is contained, Region 2, had a median percentage-difference value of −39 percent. Although removed from the final analysis, flow locations with drainage-area values above the recommended threshold for regression-based estimation (about 1,000 square miles [mi2]) were observed to have consistently higher percentage-difference values; a reminder of the limitations of use for regression-based flood-flow estimates. This report, the comparisons within, and a companion data release are intended to serve as tools to FEMA in assisting with the ongoing assessment of FIS flow locations across Pennsylvania.
Introduction
The Federal Emergency Management Agency (FEMA) performs flood insurance studies (FISs) across the United States to identify flood hazards and mitigate flood risk. A FIS is a comprehensive engineering study utilizing information that includes historic streamflow data, meteorologic data, topographic data, hydrologic and hydraulic data, flood-control works, and land development. FIS results determine flood-hazard information presented in flood maps called flood insurance rate maps which are used to assess a community’s flood risk (https://msc.fema.gov/nfhl). In an ongoing effort to provide communities with up-to-date flood risk information, FEMA performs restudies to incorporate recent events that may have altered a community’s risk (FEMA, 2020). Land-use changes, climate impacts, recent flood events, flood-control projects, urbanization, and updated data analysis are all factors that make flood risks dynamic and may necessitate restudies.
As part of the U.S. Geological Survey’s (USGS) ongoing work, updated regression equations are periodically developed for the estimation of flood frequencies and magnitude at ungaged stream sites (Flippo, 1977; Flippo, 1982; Stuckey and Reed, 2000; Roland and Stuckey, 2008). Beyond assessing flood risk to communities, information regarding the magnitude and frequency of floods is critical to floodplain managers and engineers for designing and building bridges, culverts, and other structures near streams and rivers. In 2019, the USGS, in cooperation with FEMA and the Pennsylvania Department of Transportation (PennDOT) developed updated regression equations to estimate flood flows associated with various annual exceedance probabilities (AEPs) for ungaged streams in Pennsylvania not subject to substantial regulation, diversion, or mining activity (Roland and Stuckey, 2019).
FEMA Region 3 is intending to invest heavily in restudies of large and medium sized rivers in Pennsylvania over the next 10 years to replace FIS information based on outdated hydraulic models and previous regression equations or other hydrologic methods. Thousands of miles of streams and rivers need attention across the State, according to data that are available from FEMA's coordinated needs management strategy (CNMS) (FEMA, 2023). To aid in the prioritization of FEMA’s FIS restudy process, the USGS computed 1-percent AEP flood flows at 5,258 FIS flow locations in Pennsylvania using updated regression equations and methods presented by Roland and Stuckey (2019). To utilize the USGS’s extensive network of streamgages across Pennsylvania, methods were developed to incorporate streamgage data at FIS flow locations within qualifying proximity to a USGS streamgage. One-percent AEP flood-flow estimates for FIS flow locations at or near a streamgage were computed using weighting and transferring techniques suggested by Roland and Stuckey (2019); 1-percent AEP flood-flow estimates for FIS flow locations not at or near a streamgage were computed using the updated regression equations in Roland and Stuckey (2019). The USGS 1-percent AEP flood-flow estimates at each FIS flow location in Pennsylvania were then compared to the FEMA FIS 1-percent AEP flood-flow estimates. Large differences between the datasets can help identify FIS flow locations where FEMA FIS restudies may be necessary. The USGS, in cooperation with FEMA, made the computations, comparisons, and analysis in this report and the companion data release (Weaver and others, 2022).
Purpose and Scope
As FEMA Region 3 periodically assesses the modernity and accuracy of FISs across Pennsylvania, the USGS is periodically analyzing its long-term records (10 to 100 or more years) of streamflow at gaging stations. This was most recently done in 2019 for Pennsylvania (Roland and Stuckey, 2019) using streamflow records through 2015 where flood-flow estimates of various frequencies were computed for 356 streamflow gaging stations not subject to substantial flow regulation, diversion, or mining activity (fig. 1). Methods were presented for the computation of flood flows at locations beyond gaging stations using the updated regression equations developed in Roland and Stuckey (2019) and the use of weighting and transferring algorithms, where applicable. This report presents the USGS-derived 1-percent AEP flood-flow estimates for 5,258 FIS flow locations across Pennsylvania using the updated regional regression equations and methods presented in Roland and Stuckey (2019) and input basin characteristics generated from the Pennsylvania StreamStats (PASS) web tool (Stuckey and Hoffman, 2010). The USGS derived 1-percent AEP flood-flow estimates are then compared to the existing FEMA FIS 1-percent AEP flood-flow estimates to identify FIS flow locations with major differences. These comparisons may serve as a tool to FEMA in assisting with the ongoing assessment of FISs across Pennsylvania. The limitations of this study are also presented with a discussion of potential sources of uncertainty. Results from the comparisons between the USGS derived 1-percent AEP flood-flow values and the FEMA FIS 1-percent AEP flood-flow values may warrant further investigation into these potential sources of uncertainty.
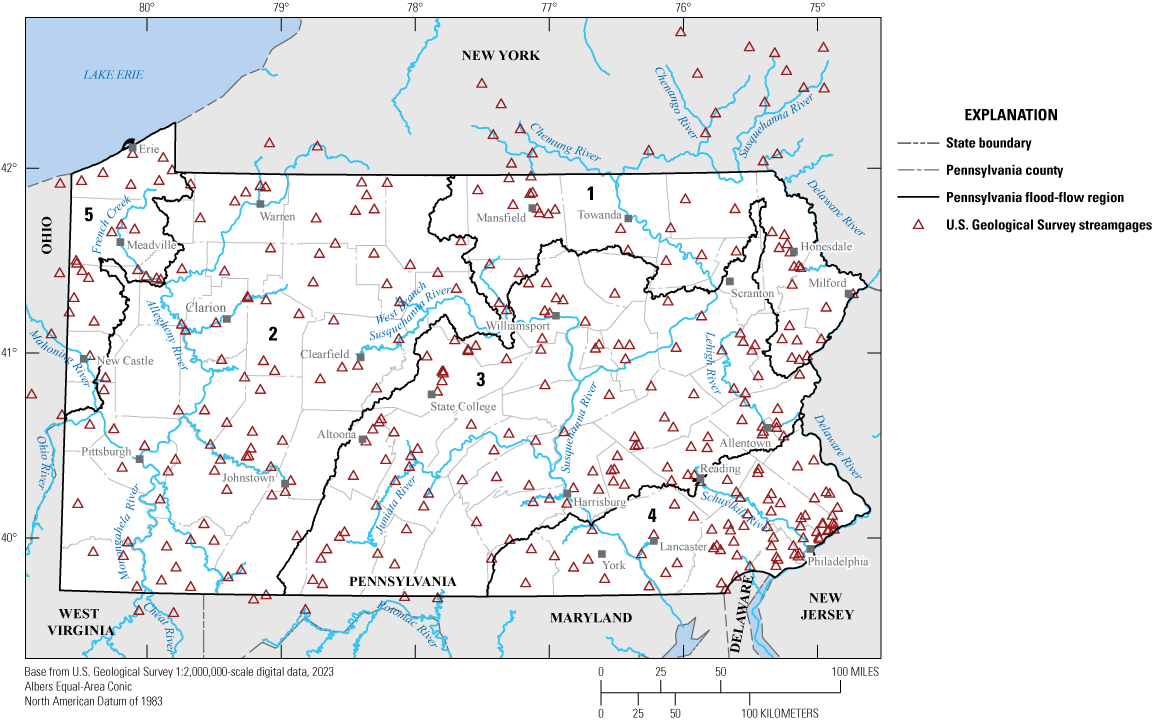
Map showing Pennsylvania flood-flow regions and streamgages used in the development of updated regression equations in Roland and Stuckey (2019).
Previous Studies
The USGS has been developing regression equations for ungaged streams in Pennsylvania for over 50 years to estimate flood flows by using basin characteristics. In Flippo (1977), drainage basin characteristics including drainage area, channel slope, percentage storage, and mean annual excess precipitation were used to estimate flood flows at unregulated sites for various recurrence intervals. Standard errors ranged from 16 to 33 percent for streams greater than 15 square miles (mi2) and greater than 56 percent for drainage areas less than 15 mi2. Flippo (1982) later updated these regression equations with longer periods of record and subsequent peak flows observed at gaged sites. Before the publishing of Flippo’s updated regional regression equations for Pennsylvania, the Hydrology Committee of the Water Resources Council and all participating Federal agencies adopted Log-Pearson Type III methodology for determining flood frequencies (Interagency Advisory Committee on Water Data, 1982). The results from Flippo’s equations (Flippo, 1982) were compared to Log-Pearson Type III frequency distributions of continuous-record streamflow data by Ehlke and Reed (1999). Ehlke and Reed found that about 24 percent of the State showed significant differences between computing methods at the 95 percent confidence level. It was concluded that updates and modifications to Pennsylvania’s regional regression equations were warranted given the results of the comparison and an additional 23 years of peak-flow data had been collected since the regional regression models were developed by Flippo (1982).
In 2000, Stuckey and Reed developed regional regression equations using a weighted multiple linear regression model based on peak-flow data through water year 1997 from 313 streamflow gaging stations with 10 or more years of record and less than 2,000 mi2 of contributing area. The State was divided into 2 regions and 5 flood-flow equations were developed for each region with coefficients of determination (R2) between 0.82 and 0.96. The flood-frequency statistics for the peak-flow data used to develop the models were generated using methods described in USGS Bulletin 17B (Interagency Advisory Committee on Water Data, 1982).
Roland and Stuckey (2008) updated regional regression equations using peak-flow data through 2006 and dividing the State into four flood-flow regions (FFRs). Recent flooding, differences found between FIS and USGS derived flood-flow estimates (Roland and Stuckey, 2007), and advances in geospatially derived basin characteristics were cited as reasons for the 2008 update of regional regression equations. Twenty-four geographic information system derived basin characteristics were considered in the development of the regression equations, using exploratory ordinary least-squares and weighted least-squares regression techniques to relate basin characteristics to observed flood-flow statistics. Drainage area, mean basin elevation, percentage carbonate bedrock, percentage urban area, and percentage storage within the basin were statistically significant at the 95-percent confidence level for one or more of the regression equations. Observed flood-flow statistics computed from guidelines in USGS Bulletin 17B and the significant basin characteristics found using ordinary least-squares and weighted least-squares regression were related with a generalized least-squares regression analysis to obtain final regression equations.
In 2019, Roland and Stuckey divided the State into five FFRs after thorough exploratory analysis using weighted least-squares regression techniques. Following weighted least-squares regression iterations, multiple statistical indicators showed that not only was regionalization needed, but also explanatory basin characteristics needed modifying. The updated regional regression equations were developed using basin characteristics and annual peak-flow data through water year 2015 from 285 streamgages across Pennsylvania and surrounding states with 10 or more years of record. Significant explanatory variables at the 95-percent confidence interval for one or more of the equations were drainage area, percentage carbonate bedrock, percentage storage, mean basin slope, and maximum basin elevation. During the development of the regression equations, updates to the methods in USGS Bulletin 17B were being incorporated in USGS Bulletin 17C (England and others, 2018). The expected moments algorithm (EMA) procedure outlined in USGS Bulletin 17C was used to compute flood-flow values for streamgages included in the study. Roland and Stuckey (2019) present the use of the updated regression equations to estimate flood flows at ungaged sites across Pennsylvania. Roland and Stuckey (2019) also present published methods to obtain a more accurate flood-flow estimate for points of interest near a streamgage, as opposed to solely using the regional regression equation (Ries, 2007). Using the bounds of 0.5 to 1.5 times (50 to 150 percent) of the drainage area at the gaged site, a valid statistical reach (VSR) can be defined (Sloto and others, 2017). If a point of interest is within a streamgage’s VSR, flood-flow estimates can be weighted and transferred using equations 11 and 12 presented in Roland and Stuckey (2019).
Description of Study Area
The Commonwealth of Pennsylvania is in the temperate mid-Atlantic region of the United States. The State is characterized by steep forested hillsides and deep narrow valley bottoms in the Allegheny and Monongahela River Basins in the west, wide glaciated valleys in the north with little relief in the Lake Erie Basin in the northwest, long forested ridges with occasional underlain carbonate rock valleys in the Susquehanna and Potomac River Basins in the center of the State, and gently sloped valleys predominantly underlain by crystalline bedrock in the Delaware River Basin in the southeast. Most locations in Pennsylvania receive between 40 and 50 inches of total precipitation annually, with peak flows often occurring from rain on snow in the spring, and tropical storms in the fall (Frankson and others, 2022).
Due to varying climate, geology, topography, and hydrology the State was divided into five different FFRs (fig. 1) (Roland and Stuckey, 2019). FFR 1 contains the glaciated upper catchments of the Delaware and Susquehanna Rivers, which flow south from New York. FFR 2 consists of the unglaciated high-elevation Allegheny Plateau section stretching from the southwest corner of the State to the northern border with New York. The Monongahela River, Allegheny River, and upper portion of the West Branch Susquehanna River are contained within this region. Much of the Susquehanna River Basin consists of FFR 3, including the Juniata River Basin. FFR 3 is dominated by the Valley and Ridge province that spans from south central Pennsylvania at the Maryland border to the eastern portion of the State. FFR 3 also includes a small portion of the Potomac River Basin near the Maryland border, the entire Lehigh River of the Delaware River Basin, including a portion of the Delaware River along the New Jersey border, and the upper catchments of the Schuylkill River in the southeastern portion of the State. FFR 4 contains the remainder of the Schuylkill River and the lower Susquehanna and Delaware Rivers where they flow through the Piedmont province in southeastern Pennsylvania. FFR 4 is the most densely populated region within the study area, which includes Philadelphia and its suburbs. FFR 5 contains the Erie lakeshore, French Creek, and the Shenango, Mahoning, and Beaver Rivers, which drain a portion of northeastern Ohio. This region is known as the Erie drift plain, which is characterized by gentle slopes, kettle ponds, and abundant wetlands.
Even though FFRs do not extend beyond the borders of Pennsylvania, USGS streamgages within contributing watershed areas outside Pennsylvania’s borders were utilized in the development of the updated regression equations in Roland and Stuckey (2019). Streamgages were used in New York, Ohio, and Maryland. Basin characteristics were computed for all watersheds with contributing areas extending into New York, Ohio, Maryland, New Jersey, and Delaware.
Methodology
A geolocated dataset of 5,258 FIS flow locations (fig. 2) was provided to the USGS by FEMA and included a description of the FIS flow location, the stream name, a FEMA derived drainage area, and 1-percent AEP discharge associated with each FIS flow location. This FEMA supplied data was published in the companion data release to this report (Weaver and others, 2022). Data attribution for the estimation method and year of study was provided but determined to be too incomplete and generalized for detailed analysis. These details are essential when evaluating the validity of flood-flow estimates and are discussed further in the “Limitations and Considerations” section of this report. The objective herein will be to compare FEMA FIS 1-percent AEP flood-flow values with the USGS derived values generated via the methodology presented in this section.
A preferred method used in estimating flood flows is the development of a flood-frequency curve derived from observed peak-flow data. A streamgage with a sufficient period of record must exist for this method to be used. It is cost prohibitive to have streamgages at every point of interest along a stream, whether for an FIS or for aiding decision makers in designing and protecting infrastructure within the floodplain. For this reason, alternative methods are necessary to estimate flood flows at ungaged sites. If a point of interest is located on a gaged stream, but not at the streamgage, the observed peak-flow record may be considered for the estimation of flood flows. Sloto and others (2017) found that a point of interest located within 0.5 to 1.5 times the drainage area of a gaged site on the same stream was suitable for transferring streamflow statistics from the gaged site. Sloto and others (2017) also proposed that a VSR could be delineated from the streamgage location to the end points where the drainage-area ratio limits were reached. Any point of interest that fell on this VSR would be eligible for the transfer of streamflow statistics if no major flow regulation exists between the streamgage and the ungaged point of interest. In this study, FIS flow locations were classified according to their proximity to a streamgage using delineated VSRs of 0.5 to 1.5 times the drainage area. FIS flow locations at the same approximate location as a streamgage site were classified as “Class 1”; FIS flow locations on a VSR were classified as “Class 2”; and any remaining FIS flow locations neither on a VSR nor at a streamgage were classified as “Class 3” (figs. 2 and 3). These classifications dictated how a flood-flow estimate was computed at a point of interest, which is further discussed in the following section.
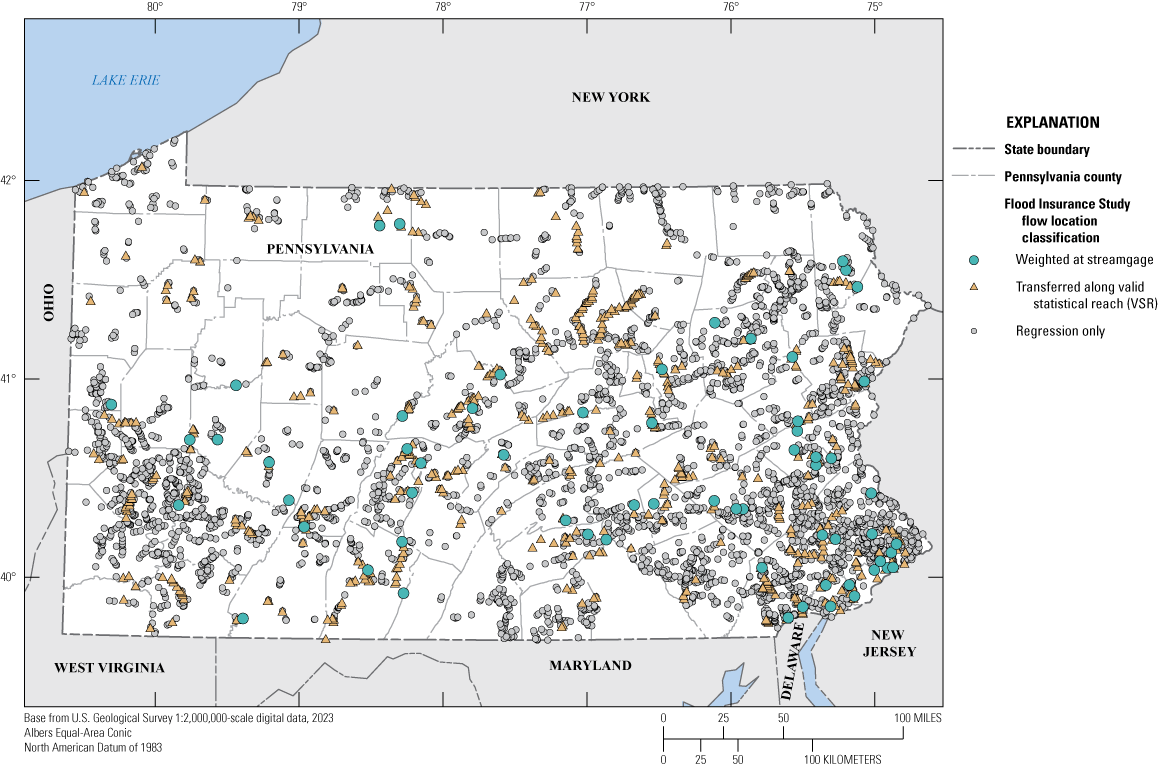
Map showing 5,258 Federal Emergency Management Agency flood insurance study flow locations across Pennsylvania with U.S. Geological Survey estimation methodology classifications [VSR; Valid Statistical Reach].
Classification of Flood Insurance Study Locations
To delineate VSRs, the active and discontinued streamgages used in developing regression equations from Roland and Stuckey (2019, appendix 1) were considered. VSRs were defined in the same manner described by Sloto and others (2017) with the following considerations and modifications:
-
• The standard drainage-area ratio of 0.5 to 1.5 was used to locate the upstream and downstream terminus of a VSR for each streamgage. A query was used to extract each VSR based on the attributes of stream segments provided by the National Hydrography Dataset Plus High Resolution (NHDPlus HR) geospatial dataset (U.S. Geological Survey, 2020). These stream attributes included the total drainage area and the Geographic Names Information System stream name and identification number.
-
• Weighted and transferred flood-flow estimates were not recommended at locations affected by current flow regulation. Streamgages likely to be affected by upstream flow regulation were disregarded and not used for VSR generation. Streamgages were inspected for potential flow regulation using the following resources: 1) a list of streamgages with a post-regulated period of record due to the construction of a dam from Roland and Stuckey (2019, appendix 3); 2) spatially identified water bodies in the study area from the NHDWaterbody feature class provided by the NHDPlus HR dataset; and 3) spatially identified point locations of flow-regulated structures from the U.S. Army Corps of Engineers National Inventory of Dams dataset (U.S. Army Corps of Engineers, 2020).
-
• When moving upstream from a streamgage, a VSR was truncated at the outflow of a large lake or reservoir. Similarly, when moving downstream from a streamgage, a VSR was stopped at or near the inflow to a large lake or reservoir. The NHDWaterbody feature class included with the NHDPlus HR geospatial dataset was used to help identify the extent of bodies of water. It was beyond the scope of the study to determine whether large lakes and reservoirs were substantially controlling streamflow.
-
• A VSR was extended upstream from a streamgage into a tributary, provided that 1) the contributing drainage area of the upstream location on the tributary was within the 0.5 drainage-area ratio of the streamgage, 2) the cubic feet per second per square mile (equal to the mean annual streamflow divided by the drainage area) at the upstream location and the streamgage were not substantially different, and 3) the basin characteristics (that is, percentage carbonate bedrock and percentage urban land cover) of the contributing drainage areas of the upstream location and the streamgage were also comparable. Basin characteristics and flow statistics were retrieved from the PASS web tool (Stuckey and Hoffman, 2010).
To designate an FIS flow location as at a streamgage or Class 1, a geographic information system proximity tool was used to identify FIS flow locations within 500 feet of a streamgage selected for this study. Next, the Geographic Names Information System stream name of the VSR (provided by attributes in the NHDPlus HR dataset) was compared to the FIS flow location description and stream name. After verifying that an FIS location was in reasonable proximity to a streamgage and on the same stream, the FIS flow location was labelled Class 1. Similarly, to designate an FIS flow location as on a VSR or Class 2, all FIS flow locations with proximity to a VSR of 500 feet or less were inspected and compared to the Geographic Names Information System stream name. If the VSR stream segments matched the FIS description and location information, the FIS was labelled as Class 2. All Class 1 locations are also Class 2, however Class 1 methodology utilizing streamgage observations took precedence over Class 2 methods using transferred statistics. All remaining FIS flow locations were deemed Class 3—not on a VSR nor at a streamgage. Because VSRs can overlap, only the stream segment of the VSR with the lowest streamgage variance presented in appendix 2 of Roland and Stuckey (2019) was retained in the overlapping portions, and the associated streamgage was used for weighting and transferring statistics. Figure 3 depicts an example watershed with hypothetical FIS flow locations and classifications based on proximity to a streamgage and its associated VSR.
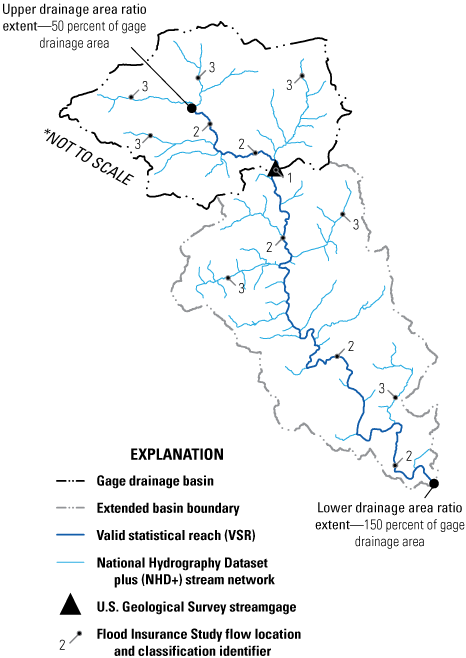
Map showing an example watershed with U.S. Geological Survey streamgage, associated valid statistical reach, and classified flood insurance study flow locations.
U.S. Geological Survey Derived Flood-Flow Estimates
Roland and Stuckey (2019) outlined general guidelines for estimating flood flows. Where observed streamgage data exists, annual peak streamflow data is fit to a Log-Pearson Type III probability distribution curve and a flood-flow estimate is computed using the EMA method following USGS Bulletin 17C guidelines (England and others, 2018). This method is commonly referred to as “at-site”. Using drainage area and select basin characteristics as inputs, regression-based flood-flow estimates can be computed from the updated regional regression equations developed by Roland and Stuckey (2019). This regression-based method can be used at any stream location by using the PASS web tool (https://streamstats.usgs.gov/ss/) to generate the necessary basin characteristics for input. Generally, the regression-based method of flood-flow computation is used anywhere a streamgage is not present given the point of interest and its basin are not subject to the limitations associated with the regression equations (see “Limitations and Considerations” section of this report). Where a point of interest is co-located with a streamgage, the at-site EMA estimate can be used, but the method is best suited for streamgages with periods of record greater than 20 years and a low associated variance. To reduce this uncertainty, a blended or weighted method can be applied. Using the independent variances of the at-site observed EMA estimate and the predicted regression estimate, a weighted flood-flow estimate can be computed as outlined in appendix 9 of USGS Bulletin 17C (England and others, 2018).
Where an FIS flow location was co-located at a streamgage (Class 1), the weighted flood-flow estimate was computed as the 1-percent AEP flood flow for that location (appendixes 2 and 3, Roland and Stuckey, 2019). Even though the EMA estimate may be utilized where there is a sufficient period of record, the lowest associated variance was preferred, thus the weighted estimate was universally used for this report. The associated period of record and variance are reported in Weaver and others (2022). The streamgage associated EMA estimates, regression estimates, weighted estimates, and the respective variances can be found in appendix 2 of Roland and Stuckey (2019). If an FIS flow location was at an ungaged location but on a VSR (Class 2), the corresponding flood-flow estimates were computed by transferring the weighted flood-flow estimate (eqs. 11 and 12, Roland and Stuckey, 2019), known as the weighted and transferred method. As the drainage-area ratio approaches 1.0 (at or near the streamgage), the transferred flood-flow estimate will approach the weighted flood-flow estimate at the streamgage (Ries, 2007; Mastin and others, 2016). For the FIS flow locations remaining that are not located at a streamgage or on a VSR (Class 3), flood-flow estimates were calculated using regional regression equations using unique basin characteristics as inputs. These flow values were obtained from the PASS web tool, which uses the regional equations developed for Pennsylvania by Roland and Stuckey (2019). Classifications, basin characteristics, and associated streamgages (if applicable) are presented for each FIS location in Weaver and others (2022), along with FIS location data used as input to the PASS application.
Comparison of U.S. Geological Survey and Federal Emergency Management Agency Flood Insurance Study 1-Percent Annual Exceedance Probability Flood-Flow Estimates
The USGS derived flood-flow estimations, based on the methodology described in the previous section, were computed at all FIS flow locations that were provided to the USGS by FEMA. FIS flow locations in York County, Pennsylvania, were not included in the FEMA provided dataset because the FISs associated with the 283 flow locations in York County were previously modernized (Weaver and others, 2022). Drainage-area values and 1-percent AEP flood-flow values for 40 FIS flow locations and 9 FIS flow locations, respectively, were missing. In total, 41 FIS flow locations have either a missing value for drainage area or 1-percent AEP. These flow locations were excluded from the analysis.
Before comparing existing FEMA FIS 1-percent AEP flood-flow values with the USGS derived regression-based 1-percent AEP flood-flow values, a quality assurance check was performed by comparing the drainage-area value from the FIS flow location and the drainage-area value computed by the USGS PASS application. This check was done to reasonably assume the location of the flood-flow values was at the same approximate point on a stream. Ensuring the location was at approximately the same point on a stream was especially important where stream confluences exist, as a minor change in location may result in a large difference in flood flows. Because a raster representation of the NHDPlus HR flow network was used by PASS to generate basin characteristics, flood-flow discrepancies can result where FIS flow locations provided by FEMA are not located on (and therefore do not intersect) the NHDPlus HR stream grid. Efforts were made to rectify geolocation issues; however, FIS flow locations were not inspected individually. Errors in the FEMA-provided FIS flow locations dataset, included transcription errors, misnaming, and conflicting geolocation data. For these reasons, FIS flow locations with drainage-area values that differed by greater than 10 percent using equation 1 were also excluded from analysis (fig. 4). This list of flow locations excluded from analysis can be found in Weaver and others (2022) column DA10_Flag with a Y value. Roughly 20 percent (1,027 of 5,258) of FIS flow locations had a drainage-area difference that was greater than 10 percent. Of the 5,258 total FIS flow locations, more than 2,000 points had a drainage-area difference that was less than 1 percent with the middle 50 percent (interquartile range or IQR) of points approximately described by plus or minus (±) 2 percent.
whereis the percentage difference between the PASS generated, USGS derived drainage area and the FEMA FIS drainage area at an FIS flow location,
is the PASS generated, USGS derived drainage area at an FIS flow location, and
is the FEMA FIS drainage area at an FIS flow location.
Flow locations where PASS generated basin characteristics were outside of the basin-characteristic ranges presented in table 5 of Roland and Stuckey (2019) were also excluded from the analysis. These are the ranges of basin-characteristic values that were used in the development of the regional regression equations. The regression equations are not recommended to be used for basins with values outside of these ranges. When the regression equations are applied beyond these ranges they may yield results with greater levels of uncertainty than those presented in table 3 of Roland and Stuckey (2019). With only significant basin characteristics used as variables in each region’s regression equation, not all FIS flow locations where basin characteristics were outside the bounds of the ranges in table 5 of Roland and Stuckey (2019) were removed. FIS flow locations were excluded only when the same basin characteristics used as variables in the FIS flow location’s associated regional regression equation (table 3 of Roland and Stuckey, 2019) were outside of the ranges presented in table 5 of Roland and Stuckey (2019).
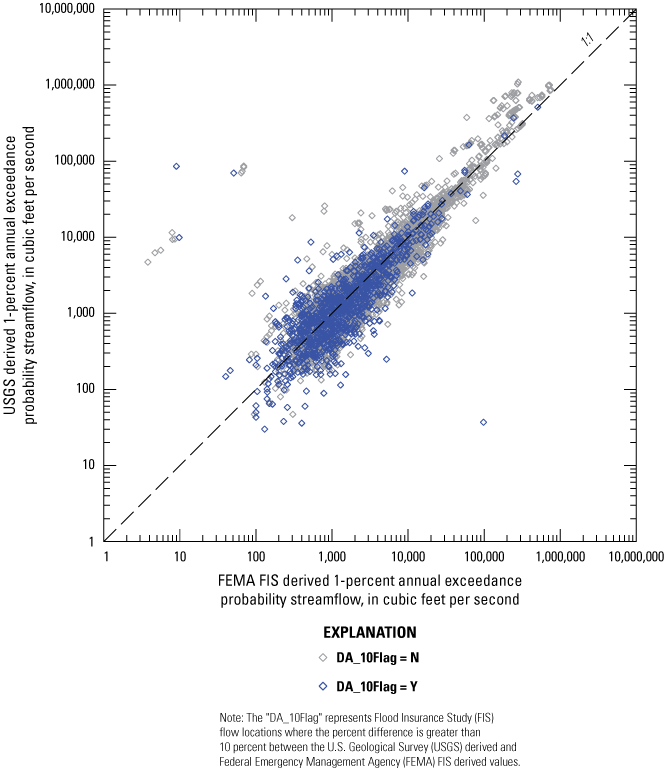
1:1 scatterplot showing U.S. Geological Survey (USGS) derived 1-percent annual exceedance probability flood-flow estimates compared to Federal Emergency Management Agency (FEMA) flood insurance study (FIS) derived 1-percent annual exceedance probability flood-flow estimates. Flood insurance study flow locations where a percentage difference in drainage area is greater than 10 percent are shown in blue.
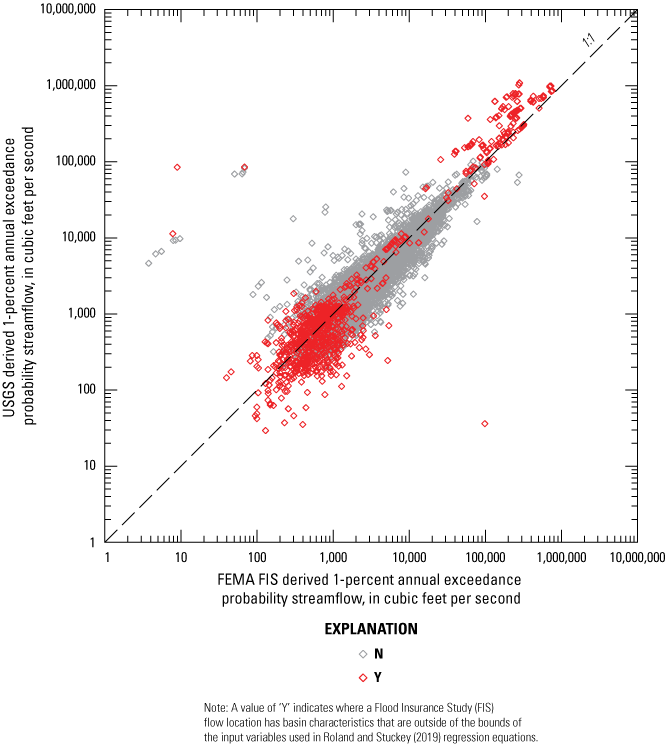
1:1 scatterplot showing U.S. Geological Survey (USGS) derived 1-percent annual exceedance probability flood-flow estimates compared to Federal Emergency Management Agency (FEMA) flood insurance study (FIS) derived 1-percent annual exceedance probability flood-flow estimates. Flood insurance study flow locations where the basin characteristics used as input variables in Roland and Stuckey (2019) regional regression equations are outside of the bounds presented in table 5 of Roland and Stuckey (2019) are shown in red.
The exclusion of FIS flow locations where drainage-area and basin-characteristic values were deemed unsuitable for analysis is visualized in respective 1:1 scatter plots comparing the 1-percent AEP flood flow derived by the USGS using the methods described in this report and the 1-percent AEP flood flow derived by FEMA FISs (figs. 4 and 5). A 1:1 scatter plot with the final FIS flow locations considered for analysis is presented in figure 6. When the FIS flow locations are plotted comparing the 1-percent AEP flood-flow estimates, they tend to align along a 1:1 line where the estimates would be equivalent. The further a point is from the 1:1 line in perpendicular distance, the greater the difference between the estimates. Points above the 1:1 line have USGS derived estimates that are higher than the reported FEMA FIS estimate, and points below the 1:1 line have USGS derived estimates that are lower than the FEMA FIS estimate. An anomalous grouping of points with orders of magnitude difference is immediately apparent above and to the left of the 1:1 line (fig. 6A).
Further inspection of these points revealed that two major groupings existed among them in the Lehigh River and East Branch Perkiomen Creek Basins. In each of these basins, the 1-percent AEP from the FEMA FIS was approximately one thousand times smaller than the USGS derived 1-percent AEP. With the FEMA provided stream location description in these groupings also providing insight into the methodology of the flood-flow estimates generated in the FISs, a potential source for the discrepancy is hypothesized. The FIS flood-flow estimates in the East Branch Perkiomen Creek grouping all appear to be generated from a frequency-streamflow-drainage area curve, whereas the Lehigh River grouping flood-flow estimates were generated from respective local tide gages. In each case, it is possible the flood-flow estimates were being reported in thousand cubic feet per second, a common unit used in flood-flow values. If so, this would cause the FIS flood-flow values to be underreported by a factor of one thousand in comparison to the USGS derived values in cubic feet per second. Figure 6B is a replication of figure 6A, excluding the FIS flow locations where flood-flow values differ by three orders of magnitude. These values were not filtered from the greater subset in further analysis, despite the apparent error. Further analysis of the validity of the FEMA reported FIS flood-flow values was beyond the scope of this study.
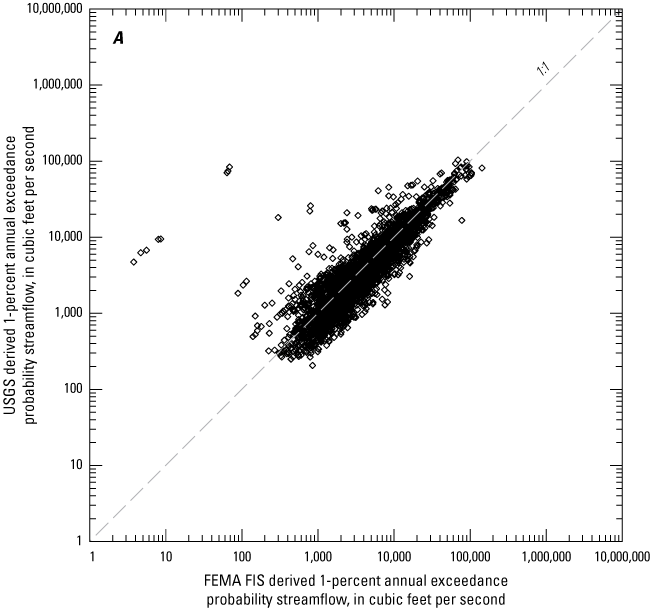

A, 1:1 scatterplot showing U.S. Geological Survey (USGS) derived 1-percent annual exceedance probability flood-flow estimates compared to Federal Emergency Management Agency (FEMA) flood insurance study (FIS) derived 1-percent annual exceedance probability flood-flow estimates. FIS flow locations are excluded where a percentage difference in drainage area is greater than 10 percent or where basin characteristics in Roland and Stuckey (2019) regional regression equations are outside of the bounds presented in table 5 of Roland and Stuckey (2019). B, a zoomed in scatterplot excluding the FIS flow locations where flood-flow values differ by three orders of magnitude.
Though the 1:1 scatter plot directly comparing the 1-percent AEP derived by USGS and the 1-percent AEP from FEMA FISs is useful for visualizing large differences in the two datasets, a metric is needed to compute summary statistics and quantify the distribution of data. Equation 2 was used to transform the values from each dataset into a metric that characterizes the percentage difference from the mean of an FIS pair of flood-flow estimates (FEMA compared to USGS) with a range from −200 percent to +200 percent. Equation 2 is notably different from the common percentage-change metric, which uses a single reference value in the denominator and the difference between two values in the numerator such as
With the limitations of the FEMA FIS estimates and USGS regression-based estimates, it was determined that neither was appropriate to use as a reference value. In addition, percentage change was not appropriate for secondary analysis because it has an open-ended range where the reference value is small and the numerator’s difference is large. To conceptualize the percentage-difference metric, table 1 depicts a hypothetical FIS location with an arbitrary 1-percent AEP flood flow of 1,000 cubic feet per second. A point where the USGS derived estimate is equivalent to the FEMA FIS value will result in a percentage difference of zero. As the difference between the USGS derived estimate and the FEMA FIS flood-flow value becomes very large, for example, the USGS derived estimate nears zero or the FEMA FIS value nears zero; the percentage difference 1-percent AEP approaches −200 percent and +200 percent, respectively. Other percentage difference 1-percent AEP values of note occur where a value is double or half that of the other, ±66.67 percent, and where a value is 1.5 times greater than the other, ±40 percent. Any following reference in this report to a percentage-difference value generated by equation 2 for an FIS flood-flow pair or statistical values generated from a sample of FIS flood-flow pairs will be referred to as “percentage difference 1-percent AEP.”
whereis the percentage difference between the USGS derived 1-percent AEP flood flow and the FEMA FIS 1-percent AEP flood flow at an FIS flow location,
is the USGS derived 1-percent AEP flood flow at an FIS flow location, and
is the FEMA FIS 1-percent AEP flood flow at an FIS flow location.
Table 1.
Various percentage differences in 1-percent annual exceedance probability flood-flow values at a hypothetical flood insurance study (FIS) flow location where the Federal Emergency Management Agency FIS 1-percent annual exceedance probability is 1,000 cubic feet per second.[FEMA, Federal Emergency Management Agency; 1%AEP, 1-percent annual exceedance probability; USGS, U.S. Geological Survey]
To characterize the percentage difference 1-percent AEPs, a boxplot (fig. 7) and histogram (fig. 8) were generated for the 3,599 remaining FIS flow locations after the removal of FIS flow locations where a percentage difference in drainage area is greater than 10 percent or where basin characteristics used as input variables in Roland and Stuckey (2019) regional regression equations are outside of the bounds presented in table 5 of Roland and Stuckey (2019). The statewide median value was −10.1 percent, with the IQR between −39.05 percent and 12.75 percent. Using the 1.5 times interquartile range (1.5*IQR) threshold, 107 upper values were greater than 90.45 percent and 11 lower values were less than −116.75 percent (fig. 7). The histogram in figure 8 shows the distribution is normal, and with a sufficiently large sample size (3,599), the central limit theorem is realized. The distribution is centered over the median with a mean of −9.4 percent and a standard deviation of 45.7 percent. The modal bin of −20 to 0 percentage difference has a count of 744 FIS flow locations. The second largest bin is 0 to +20 percentage difference with 624 FIS flow locations. The distribution appears to have mild positive skew with a large tail of higher positive values and a center that is slightly negative. However, because the mean, median, and mode are well aligned around −10 percent, Pearson’s modal skew coefficient is 0.013 and Pearson’s median skew coefficient is 0.046, suggesting there is little to no positive skew. Although there is a greater count of upper values outside of the 1.5*IQR, the central tendency of the percentage difference in 1-percent AEP flood-flow values is slightly negative (where USGS derived flood-flow values are lower than the FEMA FIS derived flood-flow values).
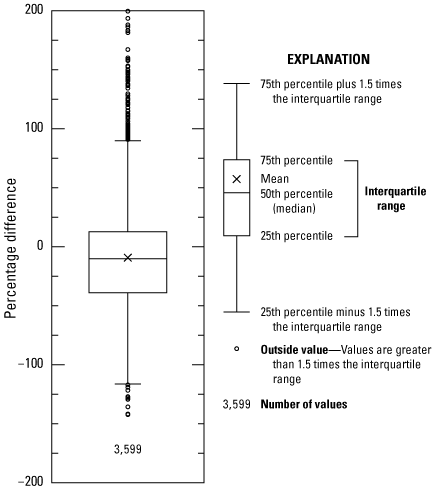
Boxplots showing the percentage difference between U.S. Geological Survey (USGS) derived 1-percent annual exceedance probability (1%AEP) flood-flow estimates and Federal Emergency Management Agency (FEMA) flood insurance study (FIS) 1-percent annual exceedance probability flood-flow values. A positive percentage difference indicates that the USGS value is larger, where a negative percentage difference indicates that the FEMA FIS value is larger.
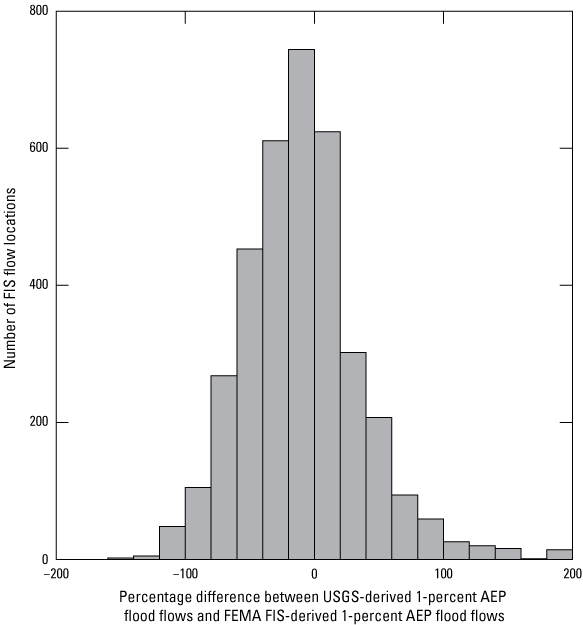
Histogram showing the percentage difference between U.S. Geological Survey (USGS) derived 1-percent annual exceedance probability flood-flow estimates and Federal Emergency Management Agency (FEMA) flood insurance study (FIS) 1-percent annual exceedance probability flood-flow values. A positive percentage difference indicates that the USGS value is larger, where a negative percentage difference indicates that the FEMA FIS value is larger.
The percentage differences between USGS derived 1-percent AEP flood flows and FEMA FIS 1-percent AEP flood flows were also compared spatially at the regional and county level. In table 2, a breakdown is presented of the number of classified FIS flood-flow locations (Class 1, Class 2, Class 3) in their respective FFRs. These unfiltered totals include all FIS flow locations except for those in which a non-zero drainage area or 1-percent AEP flood-flow estimate was not provided in the input dataset. In tables 3 and 4, the total number of FIS flood-flow locations in each unique combination of FFR and classification is provided after independently filtering out FIS flow locations with percentage differences in drainage area greater than 10 percent (table 3) and FIS flow locations with basin characteristics outside the bounds of the input variables used in the regression equations from Roland and Stuckey (2019) (table 4). The final filtered dataset of FIS flow locations is then broken down into each unique combination of FFR and classification with the totals, mean, median, and standard deviation for each combination (table 5) and then summarized by FFR only (table 6). Some notable distinctions within the summary statistics include: all Class 2 groupings have a standard deviation of 30 percent or less (table 5), FFR 2 has the lowest median value in total filtered FIS flow locations (−39 percent; table 6), and FFRs 4 and 5 have positive median values in total filtered FIS flow locations (6.9 percent and 2.5 percent, respectively) (table 6). Percentage values associated with the totals for each filtering step represent the percentage of flow locations remaining from the unfiltered original. Class 1 and Class 2 flow locations were retained at a greater rate than Class 3 with 97 percent, 92 percent, and 65 percent (table 5), respectively. In total, 3,599 flow locations passed the filters leaving 69 percent of the original unfiltered flow locations for analysis. All FFR and classification combinations displayed similar filtration ratios to the statewide ratios (within 10 percent) except for FFR 5. Only 43 percent of FFR 5 flow locations passed both filters, leaving 71 flow locations remaining for analysis (table 6).
Table 2.
Unfiltered Federal Emergency Management Agency flood insurance study flow locations presented by classification and flood-flow region.[Only FIS flow locations were included where a non-zero drainage area and 1-percent annual exceedance probability (1%AEP) flood estimate were provided. All percent values represent the percentage of the unfiltered total for the respective class/region combination. Class 1–near a streamgage; Class 2–on a valid statistical reach (VSR); Class 3–neither near a streamgage nor on a VSR, FIS, flood insurance study, %, percent]
Table 3.
Federal Emergency Management Agency flood insurance study flow locations where percentage difference in drainage area is less than 10 percent presented by classification and flood-flow region includinzg the remaining percentage of the unfiltered total.[Only FIS flow locations were included where a non-zero drainage area and 1-percent annual exceedance probability (1%AEP) flood estimate were provided. These statistics were not presented for flood-flow region 5 Class 1 FIS flow locations due to an insufficient number of inputs. All percent values represent the percentage of the unfiltered total for the respective class/region combination. Class 1–near a streamgage; Class 2–on a valid statistical reach (VSR); Class 3–neither near a streamgage nor on a VSR, %, percent, --, no data]
Table 4.
Federal Emergency Management Agency flood insurance study flow locations where basin characteristics are within the bounds of the input variables used in the regression equations from Roland and Stuckey (2019) presented by classification and flood-flow region including the remaining percentage of the unfiltered total.[Only flood insurance study flow locations were included where a non-zero drainage area and 1-percent annual exceedance probability (1%AEP) flood estimate were provided. These statistics were not presented for flood-flow region 5 Class 1 FIS flow locations due to an insufficient number of inputs. All percent values represent the percentage of the unfiltered total for the respective class/region combination. Class 1–near a streamgage; Class 2–on a valid statistical reach (VSR); Class 3–neither near a streamgage nor on a VSR, %, percent, --, no data, >, greater than]
| Flood-flow region | Basin characteristics within the bounds of the input variables used in the regression equations from Roland and Stuckey (2019) | |||||||
|---|---|---|---|---|---|---|---|---|
| Class 1 | Class 2 | Class 3 | All | |||||
| Total | % of unfiltered* | Total | % of unfiltered* | Total | % of unfiltered* | Total | % of unfiltered* | |
| 1 | 5 | 100 | 73 | 99 | 320 | 70 | 398 | 74 |
| 2 | 15 | 100 | 135 | 99 | 1,026 | 88 | 1,176 | 90 |
| 3 | 31 | 100 | 282 | 100 | 1,335 | 86 | 1,648 | 88 |
| 4 | 21 | 100 | 133 | 100 | 811 | 69 | 965 | 72 |
| 5 | 0 | -- | 9 | 100 | 90 | 58 | 99 | 60 |
| Statewide | 72 | 100 | 632 | >99 | 3,582 | 79 | 4,286 | 82 |
Table 5.
Federal Emergency Management Agency flood insurance study flow locations where criteria are met for percentage difference in drainage area and basin characteristic bounds presented by classification and flood-flow region including mean, median, standard deviation percentage difference, and the remaining percentage of the unfiltered total.[Only FIS flow locations were included where a non-zero drainage area and 1-percent annual exceedance probability (1%AEP) flood estimate were provided. These statistics were not presented for flood-flow region 5 Class 1 FIS flow locations due to an insufficient number of inputs. All percent values represent the percentage of the unfiltered total for the respective class/region combination. Class 1–near a streamgage; Class 2–on a valid statistical reach (VSR); Class 3–neither near a streamgage nor on a VSR, %, percent, --, no data]
Table 6.
Federal Emergency Management Agency flood insurance study flow locations where criteria are met for percentage difference in drainage area and basin characteristic bounds presented by flood-flow region including mean, median, standard deviation percentage difference, and the remaining percentage of the unfiltered total.[Only FIS flow locations were included where a non-zero drainage area and 1-percent annual exceedance probability (1%AEP) flood estimate were provided. All percent values represent the percentage of the filtered total for the respective class/region combination. Class 1–near a streamgage; Class 2–on a valid statistical reach (VSR); Class 3–neither near a streamgage nor on a VSR, FIS, flood insurance study, %, percent]
Table 7 presents the number of FIS flow locations in each classification and summary statistics for 66 of 67 Pennsylvania counties (excludes York County). The mean, median, standard deviation, and total number of flow locations with 1-percent AEP flood-flow differences greater than or equal to 67 percent or less than or equal to −67 percent are presented for each county except Forest and Fulton Counties. Forest and Fulton Counties contained only two FIS flow locations each and therefore statistics (filtered portion of table 7) were not generated for them due to an insufficient sample size. As previously mentioned, York County FIS flow locations were excluded in the supplied dataset and therefore not listed in table 7. The county in which an FIS flow location is located was provided by FEMA. The geolocation of FIS flow locations may conflict with the county provided in the dataset where county boundaries are delineated from stream features. Fifty FIS flow locations were not assigned a county in the dataset provided by FEMA and therefore were not included in the county statistics (county designation shown as not provided in table 7) or maps that incorporate county statistics (figs. 9 and 10). Of the 66 counties reported in table 7, 7 counties had more than 200 FIS flow locations: Montgomery, 302; Chester, 270; Bucks, 256; Allegheny, 245; Berks, 216; Westmoreland, 214; and Lancaster, 203. Philadelphia County had the largest percentage of flow locations that were Class 1 with 5 of 31, or 16 percent. Philadelphia County also had the largest percentage of flow locations that were Class 1 or Class 2 with 20 of 31, or 65 percent. By far more than any other county, nearly two-thirds of the USGS-estimated 1-percent AEP flood flows for Philadelphia County were generated based on observed peak-flow streamgage data, either via weighted flood flows or weighted and transferred flood flows. The median percentage difference 1-percent AEP value for Philadelphia County was −12.2 percent; similar to the state median (−10.1 percent).
Table 7.
County-based summary of flood insurance study flow location classifications with median, mean, and standard deviation percentage differences between U.S. Geological Survey derived 1-percent annual exceedance probability flood-flow estimates and Federal Emergency Management Agency flood insurance study 1-percent annual exceedance probabilities reported for counties with sufficient sample sizes.[Classes: Class 1, flood insurance study flow locations near a streamgage, Class 2, flood insurance study flow locations on a valid statistical reach, Class 3, flood insurance study flow locations not near a streamgage nor on a valid statistical reach. FIS, flood insurance study; ± plus or minus, %, percent]
Table 7.
County-based summary of flood insurance study flow location classifications with median, mean, and standard deviation percentage differences between U.S. Geological Survey derived 1-percent annual exceedance probability flood-flow estimates and Federal Emergency Management Agency flood insurance study 1-percent annual exceedance probabilities reported for counties with sufficient sample sizes.—Continued[Classes: Class 1, flood insurance study flow locations near a streamgage, Class 2, flood insurance study flow locations on a valid statistical reach, Class 3, flood insurance study flow locations not near a streamgage nor on a valid statistical reach. FIS, flood insurance study; ± plus or minus, %, percent]
Filtered FIS flow locations where both the percentage difference drainage area is less than 10 percent and the basin characteristics that are inputs into the regression equations from Roland and Stuckey (2019) are within the suggested bounds.
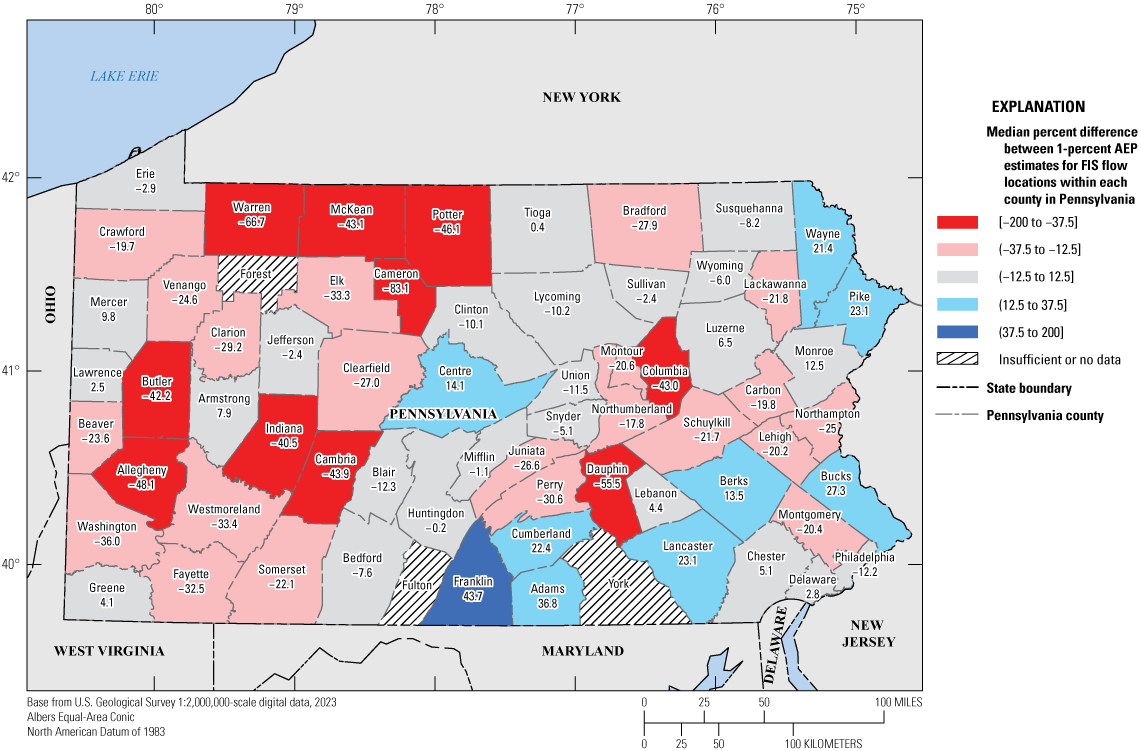
Pennsylvania county map with median percentage differences between U.S. Geological Survey (USGS) derived 1-percent annual exceedance probability flood flows and Federal Emergency Management Agency (FEMA) flood insurance study (FIS) 1-percent annual exceedance probability flood flows reported for counties with sufficient sample sizes. A positive percentage difference indicates that the USGS value is larger, where a negative percentage difference indicates that the FEMA FIS value is larger.
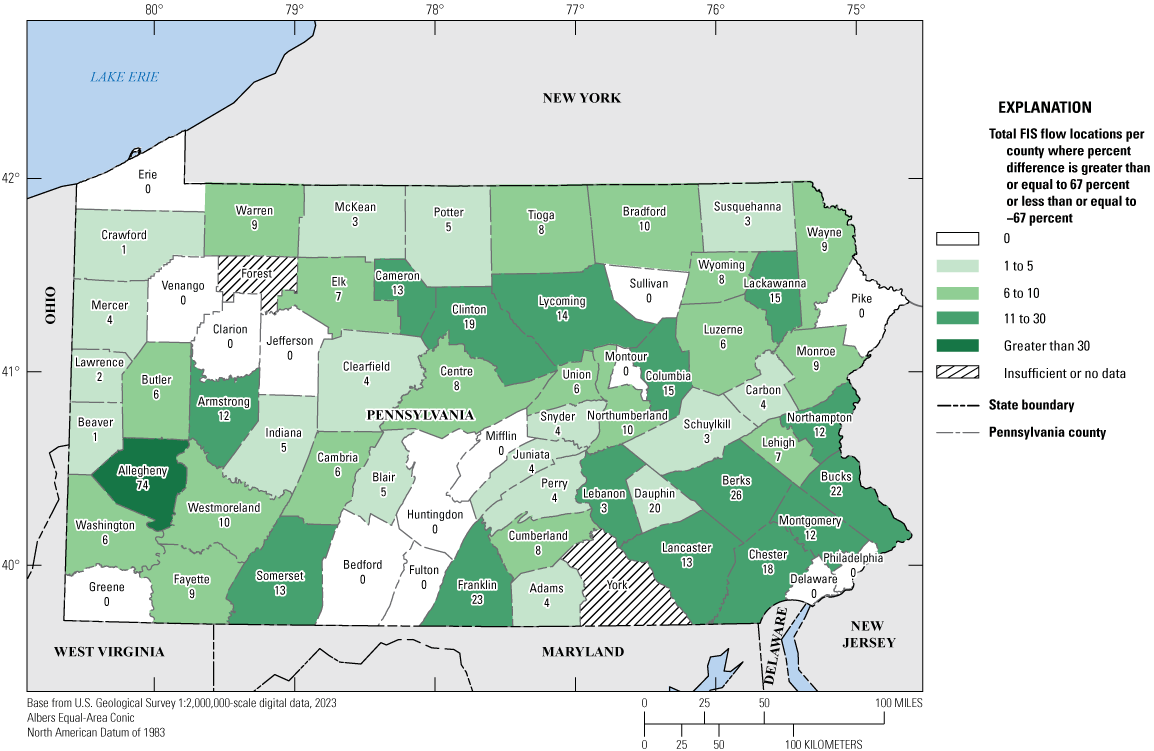
Pennsylvania county map with the total number of flood insurance study flow locations with percentage differences between U.S. Geological Survey derived 1-percent annual exceedance probability flood flows and Federal Emergency Management Agency flood insurance study 1-percent annual exceedance probability flood flows that are greater than or equal to 67 percent or less than or equal to -67 percent (that is, U.S. Geological Survey derived estimate is double or half the Federal Emergency Management Agency flood insurance study flood-flow value).
In addition to the county summary presented in table 7, two county maps are presented to spatially describe the central tendencies and the spread of the percentage differences between FEMA and USGS 1-percent AEP flood flows. Figure 9 shows the counties classified by median percentage difference 1-percent AEP flood-flow value. There are 24 of 67 counties with a median percentage difference 1-percent AEP flood-flow value greater than −12.5 percent and less than or equal to 12.5 percent. Median percentage difference 1-percent AEP flood-flow values less than or equal to −12.5 percent are shown in shades of red, with medians less than or equal to −12.5 percent and greater than −37.5 percent in light red and medians less than or equal to −37.5 percent in dark red. Median percentage difference 1-percent AEP flood-flow values greater than 12.5 percent are shown in shades of blue, with medians greater than 12.5 percent and less than or equal to 37.5 percent in light blue and medians greater than 37.5 percent in dark blue. There are 31 of 67 counties with medians less than or equal to −12.5 percent and 9 of 67 counties with medians greater than 12.5 percent. The 11 counties in the extreme bins include: Cameron, −83.1 percent; Warren, −66.7 percent; Dauphin, −55.5 percent; Allegheny, −48.1 percent; Potter, −46.1 percent; Cambria, −43.9 percent; McKean, −43.1 percent; Columbia, −43.0 percent; Butler, −42.2 percent; Indiana, −40.5 percent; and Franklin, +43.7 percent. Forest, Fulton, and York Counties are depicted as having insufficient or no data (fig. 9).
The spread of the county data is also characterized in a county map displaying the total number of FIS flow locations with percentage difference 1-percent AEP flood-flow values that are less than or equal to −67 percent or greater than or equal to 67 percent (fig. 10). These values represent where the USGS derived estimate is less than or equal to half that of the FEMA FIS value (−67 percent) and where the USGS derived estimate is more than or equal to double that of the FEMA FIS value (+67 percent). This map serves as a tool to quantify the number of FIS flow locations in each county that are farthest from the 1:1 line in figure 6. When assessing each county for differences in 1-percent AEP flood flows, the sign (+ or −) may be of little importance in comparison to the magnitude of the differences. Ultimately, the quantity of flow locations with large magnitude differences may be the greatest motivation for restudy in one county over another. The FIS flow locations quantified in figure 10 are beyond one standard deviation from the mean value where the standard deviation of percentage difference 1-percent AEP flood-flow values was 45.7 percent centered about a mean of −9.4 percent. Allegheny County had the largest number of FIS flow locations (74) with percentage difference values greater than or equal to 67 percent or less than or equal to −67 percent. Berks, Franklin, Bucks, and Dauphin were the only other counties with 20 or more FIS flow locations with percentage difference values greater than or equal to 67 percent or less than or equal to −67 percent. Thirty-one counties had five or less FIS flow locations with percentage difference values greater than or equal to 67 percent or less than or equal to −67 percent with 14 of those counties having zero FIS flow locations with percentage difference values greater than or equal to 67 percent or less than or equal to −67 percent.
Limitations and Considerations
Various methods are used to generate flood-flow estimates for FEMA FISs. Rainfall-runoff models, hydrograph routing, statistical analyses of streamgage peak-flow data, and regional regression equations are all commonly used in flood-frequency analysis. Each of these methods has a preferred application with limitations of use for certain watersheds. Hydrologic processes are complex both spatially and temporally, leaving even the most appropriate flood-flow estimation methods with considerable uncertainty. Ultimately, each method provides a best estimate of flood-flow frequency that when combined with knowledge of the watershed of interest can be a useful tool for engineers, hydrologists, and land managers. In addition to the method of estimation, the time at which the study was conducted is essential to determining the appropriateness of the flood-flow estimation method. Changes in climate, land-use, and subsequent peaks of record may all lead to flood-flow estimates becoming outdated. Because details regarding the flood-flow estimation methods and dates of the FISs were incomplete within the input dataset provided by FEMA, further discussion or analysis of these values is not contained within this report and is beyond the scope of this study.
Regression-based flood-flow estimates are a valuable tool in assessing a watershed’s potential for flooding and have typically been updated every 10 to 15 years in Pennsylvania to incorporate changes in flood frequencies, climate, and land use. However, they do not replace a complete and thorough study of a watershed’s hydrologic and hydraulic responses. Because of this, regression-based flood-flow estimates are ideal for preliminary or investigative use before conducting the more detailed hydrologic and hydraulic study. In addition, regression equations have their limitations of use when the input characteristics approach extrema that are beyond the ranges of the characteristics used in the development of the equations. For this reason, 931 of 5,258 FIS flow locations supplied by FEMA were not included in any analysis contained within this report. Regression-based 1-percent AEP flood-flow estimates were still computed for those flow locations and are contained within the data release associated with this report (Weaver and others, 2022). Various data fields are used in the data release as warning flags where FIS flow location basin characteristics are outside of the range of the basin characteristics of the streamgages used in generating the regression equations in Roland and Stuckey (2019). A basin characteristic flag BC_Flag field exists for each of the potential input variables of the regional regression equations: drainage area or DA_Flag, maximum basin elevation or MBE_Flag, mean basin slope or MBS_Flag, percentage carbonate surface geology or Carb_Flag, and percentage storage or Stor_Flag. Though the FIS flow location’s basin characteristic that is outside of the range of inputs of the streamgages used in the development of the regression equations may not be an input variable for the regression equation of the FFR in which the FIS flow location is contained, the BC_Flag field is still intended to caution the end-user when interpreting these estimates.
Other characteristics that can affect the accuracy of regression-derived flood-flow estimates include regional climate effects, urbanization, flow regulation, and mining. Though changes in regional climate and urbanization can be observed in streamgage annual peak-flow records, the effects on flood flows and stream behavior may not be fully captured if the period of record is not sufficiently long or does not include contemporary observations. Significant trends at the 95-percent confidence interval were found in 13 percent of the unregulated streamgages (46 of 356 total) used in the development of updated flood-flow regression equations. Positive trends were more prevalent in the Delaware River Basin (88 percent of streamgages with significant trends at the 95-percent confidence interval were positive) and Susquehanna River Basins (70 percent), whereas negative trends were more prevalent in the Ohio River Basin (63 percent of streamgages with significant trends at the 95-percent confidence interval were negative) (Roland and Stuckey, 2019).
These 356 Pennsylvania streamgages provide only a small sample of observations across a vast and varied network of streams, yet similarities exist when assessing differences in iterations of regression equations. Percentage differences between the existing FIS estimated flood flows and the updated USGS derived flood-flow estimates also exhibit regional differences. FFR 2 which largely contains the Ohio River Basin had the lowest percentage difference 1-percent AEP median (−39 percent), compared to the next lowest at −7.6 percent and the state median of −10.1 percent. Alternatively, region 4, containing the lower Susquehanna, lower Schuylkill, and lower Delaware River basins had a median percentage difference of +6.9 percent (table 6). FFR 4 contained nine streamgages with significant trends at the 95-percent confidence interval, all of which were positive (Roland and Stuckey, 2019). The coverage of streamgages, and those with significant trends, limits the ability to analyze climatic shifts especially in relation to results from flood-flow estimates that are often not independent of peak streamflow data. Still, the two datasets (FEMA and USGS) provide insight into potential climate trends in Pennsylvania.
Intense localized precipitation events are becoming more frequent with the number of precipitation events greater than or equal to 2 inches increasing over the last 30 years. Pairing the expected increase in magnitude and frequency of storms with observed rising mean temperatures, regional climate factors in Pennsylvania could drive an upward shift in flood frequencies and magnitude (Frankson and others, 2022). Quantifying these climatic effects will require more observation of not only long-term streamflow records but of precipitation patterns as well. Analysis of these observations may help discern which regions within Pennsylvania may be more vulnerable to climatic shifts.
Unique regression equations are commonly developed for watersheds with higher percentages of their basin classified as urban (Sauer and others, 1983; Moglen and Shivers, 2006). This is due to the increased impervious land cover typically associated with urbanization, resulting in a greater magnitude and frequency of flood flows (Konrad, 2003). Though percentage urban land cover was considered in the development of the regional regression equations for Pennsylvania, it was not significant at the 95-percent confidence interval in the final regression equations, and therefore the effects from urbanization on flood flows may not be fully captured (Roland and Stuckey, 2019). The median value of percentage urban land cover for streamgages used as inputs to the regression equation for FFR 4, the region containing Pennsylvania’s most densely populated area: Philadelphia and its suburbs, was 5 percent (Roland and Stuckey, 2019). Considerations should be made when interpreting flood-flow estimates for watersheds where urbanization may be substantially greater than this value.
Watersheds that are highly regulated or have substantial surface mining also may contribute to inaccuracies when using regression-based flood-flow estimates. Unlike effects from urbanization, flow regulation attenuates the magnitude and frequency of flood flows in a watershed. Surface mining effects can be more unpredictable; often depending on the type of mining, whether the disturbances are expansive or concentrated, the size of the watershed of concern relative to the mining operation, and the antecedent conditions at the time of the storm event. For these reasons, watersheds with past or active mining were not excluded from analysis in this report, however, the effects should not be ignored when evaluating flood flows for watersheds of interest. As for regulation, all FIS flow locations were not assessed for the presence of upstream or downstream flood control structures and their potential effects, however, when delineating VSRs, the U.S. Army Corps of Engineers (2020) NID was used to identify where flood control dams were located. If a dam was located on a stream that would affect the magnitude of flood flows, the VSR was truncated appropriately. The result of this would deem an FIS flow location as Class 3 and not Class 2. This prevents transferring a flood-flow estimate from an unregulated streamgage location to a flow location where regulation would likely alter the flow magnitude. Still, without determining which Class 3 flow locations are affected by regulation, a flood-flow is being estimated based on regression equations that were developed from streamgages on unregulated streams. Therefore, Class 3 flow locations should be reviewed for regulation before using the flood-flow estimates contained within the data release associated with this report (Weaver and others, 2022). Additionally, VSRs were not generated for streamgages contained within appendix 3 of Roland and Stuckey (2019) due to their peak flows being substantially affected by upstream regulation. Flow locations downstream of these sites were classified as “Class 3,” however, these locations may be more suitable for transferring a flood flow from the streamgage at the regulated site upstream (following Class 2 methodology). Also, Class 3 flow locations upstream of regulated sites may be problematic, possibly located within the pool created by the control structure or where backwater effects occur.
Like heavily urbanized watersheds, those with land-use, land cover, or basin character extrema (for example, intensively forested or agricultural land use or large percentage of impervious surface area) may also be unsuitable for regression-based flood-flow estimates (see table 2 of Roland and Stuckey (2019) for a complete list of the basin characteristics considered as inputs for the regional regression equations). Though only five basin characteristics were found to be significant explanatory variables at the 95-percent confidence level, the remaining basin characteristics in table 2 of Roland and Stuckey (2019) should be inspected for outliers when evaluating the suitability of the regression-based flood-flow estimates for watersheds of interest. Values for these basin characteristics for a watershed of interest can be generated using the PASS web tool (Stuckey and Hoffman, 2010). Table 5 in Roland and Stuckey (2019) presents ranges of basin characteristics for watersheds that were used in the development of the regional regression equations; basins with values outside of those ranges were not recommended for use in the equations. FIS flow locations where PASS generated basin characteristics were outside of these bounds were flagged in the data release associated with this report (Weaver and others, 2022) with the BC_Flag field. Smaller watersheds are more vulnerable than larger watersheds, as a concentrated land use will have a greater effect with a larger total percentage of drainage area within the basin. FIS flow locations were flagged where drainage areas were less than those of the ranges presented in table 5 of Roland and Stuckey (2019), however, flood flows of larger basins can still be affected by intensive or widespread land use. Although not included within the scope of this study, a screening tool could be used to determine where regression-based estimates are not suitable particularly at flow locations that contain outlier land use, land cover, or basin character extrema.
The extrema for FIS flow locations’ drainage area can also be problematic for regression-based flood-flow estimates where unique hydrology exists. Larger watersheds can span multiple FFRs or even state boundaries. PASS handles these situations by generating a weighted flow from the contributing percentage area from each FFR it spans. However, in certain situations, it may be more appropriate to use a single FFR’s regression equation or not to use a regression-based approach at all. Larger watersheds are also more likely to have widespread flow regulation that may attenuate flood flows, even though no regulation occurs near the site. Smaller basins may have unique topography, geology, or even watershed shapes (such as long narrow steep-sided basins, or predominantly flat coastal plains or karst basins) that make them unsuitable for regression-based flood-flow estimates.
With the documented errors existing within the FEMA FIS dataset, the incomplete FIS date and generalized method of flood-flow estimation, and the limitations of the USGS derived regression-based flood-flow estimates, the comparisons and analysis herein this report should be interpreted with care. Although definitive conclusions may not be drawn from the comparisons between FEMA FIS flood-flow estimates and USGS-derived regression-based flood-flow estimates, there is still value in both the direct comparison of flood-flow estimates at individual FIS flow locations and the examination of patterns at the watershed, hydrologic unit code (HUC), county, regional, and state levels. The purpose of this report is to provide an overall comparison between existing FEMA FIS flood-flow estimates and updated USGS-derived regression-based flood-flow estimates. Direct comparisons at individual FIS flow locations can be found in the associated data release (Weaver and others, 2022). The tables and figures in this report are intended as supplemental tools to the data release to aid FEMA in prioritizing restudies at the hydrologic unit code, county, and regional level. The following section contains the observations and findings made in the analysis of those tools and is intended to inform decision makers.
Discussion
A portion of the FEMA supplied dataset did not match in drainage area with that of the batch processed PASS generated drainage-area values. Roughly 20 percent (1,027 of 5,258) of FIS flow locations in Pennsylvania had drainage-area values that differed by more than 10 percent. This difference may be owing to advances in geospatial techniques for determining drainage area not available at the time of the FIS, inclusion or exclusion of a nearby tributary, or input error. Figure 4 does not display a greater deviation in data from either the central grouping of points or the equivalent 1:1 line with the mean (−9.3 percent) and median (−9.6 percent) of DA_10Flag equal to Y points similar to that of the filtered dataset; −9.4 percent and −10.1 percent, respectively. However, the spread of data is greater with a standard deviation of 60.6 percent. Some of the FIS flow locations where large differences exist may be attributed to geolocation discrepancies with the NHDPlus HD stream grid. Instances where FIS flow locations failed to snap to the NHDPlus HD stream grid would typically result in a low estimate for the USGS derived value when the PASS web tool returns a small drainage-area value. Because few order of magnitude differences existed where the USGS value was smaller than the FEMA FIS value, this suggests most of the drainage-area discrepancies can be attributed to the FEMA supplied values. Third-party investigations into the FEMA FIS dataset found transcription errors existed, resulting in large differences in drainage-area and flood-flow values (Weaver and others, 2022). Even though a large number of FIS flow locations were excluded from analysis due to drainage-area differences, it still appears that the flood-flow values associated with these points may be reasonable estimates. It may require that rectification of the drainage-area discrepancies be conducted first, followed by inspection of FIS flow locations where large 1-percent AEP differences exist.
Roland and Stuckey (2019) cautioned that the regional regression equations should not be used for the computation of flood-flow estimates if the contributing drainage area or basin characteristics were outside of the ranges used to develop the regression equations. For this reason, FIS flow locations were excluded from analysis in this report where input basin characteristics to the regional regression equation were outside of the ranges in table 5 of Roland and Stuckey (2019). Although the computations were still reported for these FIS flow locations in the data release associated with this report, the following observations should be considered. Drainage area is an input variable in each of the five FFR’s regression equations and by far has the most flagged FIS flow locations of all input basin characteristics in Weaver and others (2022) with 807 flagged FIS flow locations. For each FFR, FIS flow locations were flagged where drainage-area values were outside of the following ranges:
• FFR 1: 3.04–1,490 mi2
• FFR 2: 0.92–1,610 mi2
• FFR 3: 1.42–1,280 mi2
• FFR 4: 1.20–512 mi2
• FFR 5: 2.27–1,030 mi2
Because drainage area correlates positively with flood-flow, points in figure 5 generally have a larger drainage-area value in the top right and a smaller drainage-area value in the bottom left. Most points in the top right plot above the equivalent 1:1 line, indicating the USGS-derived flood-flow value is larger than the existing FEMA FIS flood-flow value where drainage-area values are greater than the suggested thresholds in table 5 of Roland and Stuckey (2019). Conversely, in the bottom left of the plot, the points are more dispersed with more divergent points below the equivalent 1:1 line. These observations are confirmed when inspecting summary statistics for the low and high drainage-area values based on the thresholds of table 5 in Roland and Stuckey (2019). Within the subset of 213 FIS flow locations above the drainage-area thresholds, the mean, median, and standard deviation were 49.6 percent, 45.3 percent, and 42.4 percent, respectively. Among 594 FIS flow locations below the drainage-area thresholds, the mean, median, and standard deviation were −17.4 percent, −11.1 percent, and 62.9 percent, respectively. USGS derived regression-based estimates for the FIS flow locations with drainage-area values above the recommended thresholds are consistently higher than FEMA FIS estimates. FIS flow locations with drainage-area values that are lower than the recommended thresholds are more variable than the remainder of the dataset. Although the regression-based values are not suitable for these ranges, they do display the challenges associated with the increased variability in small watersheds and the potential overestimation of regression-based estimates on larger watersheds in which flood-flow attenuation is likely due to flood control.
Figures 11, 12, 13, and 14 display the final FIS flow locations in the southwest, northwest, northeast, and southeast quadrants of Pennsylvania, respectively. The FIS flow locations are represented by their percentage-difference value between the USGS derived regression-based 1-percent AEP flood-flow estimate and the FEMA FIS derived 1-percent AEP flood-flow estimate. A negative value (where the FEMA FIS derived value is larger) less than −25 percent is displayed in two color scales of red and a positive value (where the USGS-derived regression-based value is larger) greater than 25 percent displayed in two color scales of blue. FIS flow locations with percentage-difference values between −25 percent and 25 percent are represented in tan. With the FIS flow locations overlaying HUC 12 and Pennsylvania county boundaries, these maps can be used in conjunction with figures 9 and 10 to make general observations on the spatial distribution of the filtered FIS flow locations and their respective percentage-difference values. When viewing figure 10, it is evident that Allegheny County is a clear outlier among Pennsylvania counties with 74 FIS flow locations, having percentage-difference values greater than or equal to 67 percent or less than or equal to −67 percent. Figure 9 also shows a large negative median percentage-difference value for Allegheny County (−48.1 percent), as well as surrounding counties in southwest Pennsylvania. Figure 11 displays a large number of FIS flow locations with negative percentage-difference values existing in Allegheny County and the southwest region. Clustering or lineaments of FIS flow locations with consistently red symbology is also evident. These are mostly FIS flow locations along the same stream reaches.
Another grouping exists in southern Centre County, with a cluster of blue FIS flow locations (figs. 11 and 12). Although Centre County does not stand out in figures 9 or 10 with a median percentage-difference value of 14.1 percent and only 8 FIS flow locations with percentage-difference values outside of 67 percent, this area is notably the carbonate dominated valleys surrounding State College. Northeastern Pennsylvania (fig. 13) reveals much more variation with respect to positive (blue), negative (red), and neutral (tan) percentage difference valued FIS flow locations. Still, distinct lineaments can be observed.
Figure 14 represents southeastern Pennsylvania, the most densely populated quadrant of the State where land use is dominated by agriculture and urbanization. Large areas of carbonate geology also exist with an abundance of more gently sloped watersheds typical of the Piedmont province. Some counties that are more discernable for their blue symbols include: Franklin, Adams, Cumberland, Lancaster, and Bucks. These counties each have median percentage-difference values that are greater than 12.5 percent with Franklin County, having the largest value of 43.7 percent (fig. 9). Franklin, Berks, and Bucks also have more than 20 FIS flow locations with percentage-difference values greater than or equal to 67 percent or less than or equal to −67 percent (fig. 10), making them potential restudy candidates as well. Alternatively, Dauphin County exhibits more red symbols (fig. 14) and has 20 FIS flow locations with percentage-difference values greater than or equal to 67 percent or less than or equal to −67 percent and a median percentage difference of −55.5 percent (figs. 9 and 10). Red lineaments and clusters can be observed in the Fishing Creek, Swatara Creek, Paxton Creek, and Conewago Creek watersheds (fig. 14). Several factors may be contributing to this anomaly with varied land use (agricultural, suburban development, forested), geology, and topography.
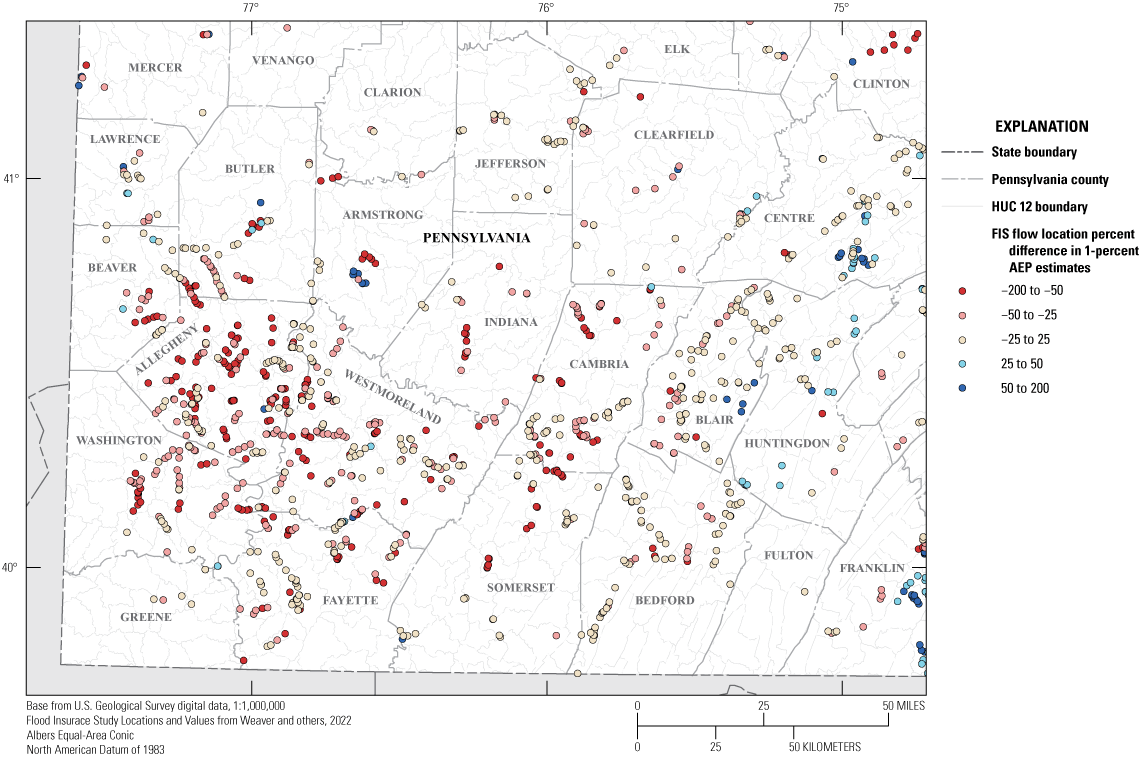
Map showing southwestern quadrant of Pennsylvania displaying flood insurance study (FIS) flow locations with graduated symbology representing the percentage difference in 1-percent annual exceedance probability (1%AEP) flood flows between U.S. Geological Survey (USGS) derived regression-based estimates and Federal Emergency Management Agency (FEMA) FIS estimates. A positive percentage difference indicates that the USGS value is larger, whereas a negative percentage difference indicates that the FEMA FIS value is larger.
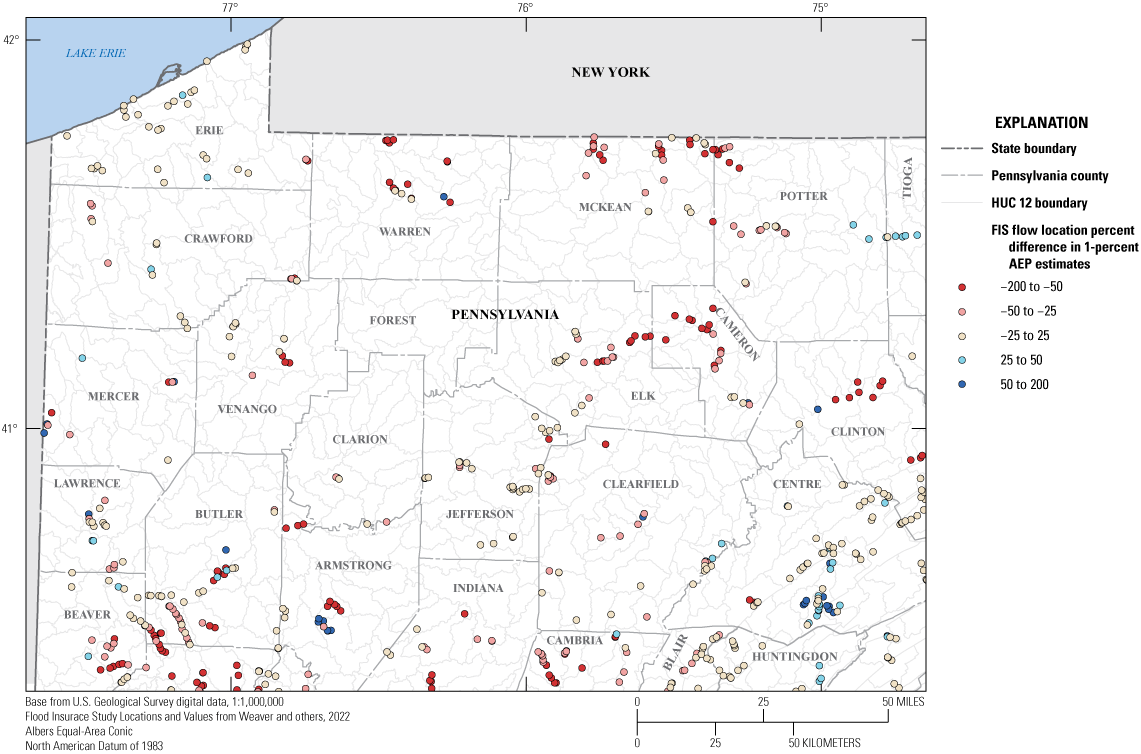
Map showing northwestern quadrant of Pennsylvania displaying flood insurance study (FIS) flow locations with graduated symbology representing the percentage difference in 1-percent annual exceedance probability (1%AEP) flood flows between U.S. Geological Survey (USGS) derived regression-based estimates and Federal Emergency Management Agency (FEMA) FIS estimates. A positive percentage difference indicates that the USGS value is larger, where a negative percentage difference indicates that the FEMA FIS value is larger.
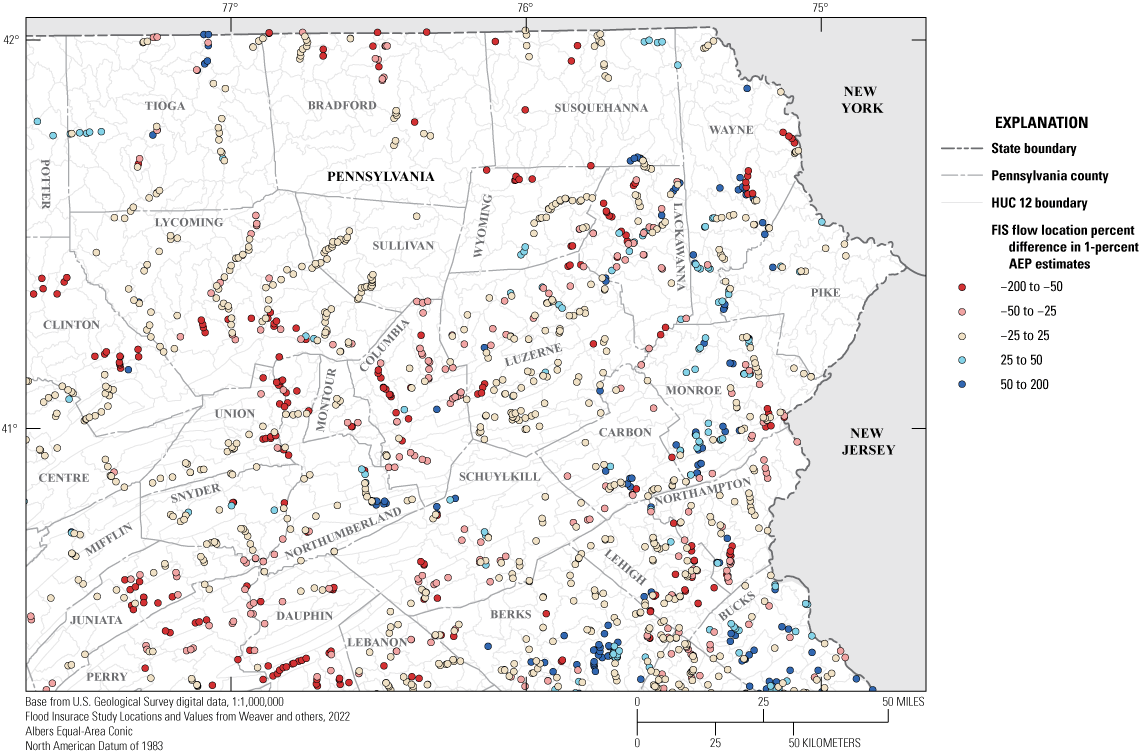
Map showing northeastern quadrant of Pennsylvania displaying flood insurance study (FIS) flow locations with graduated symbology representing the percentage difference in 1-percent annual exceedance probability (1%AEP) flood flows between U.S. Geological Survey (USGS) derived regression-based estimates and Federal Emergency Management Agency (FEMA) FIS estimates. A positive percentage difference indicates that the USGS value is larger, where a negative percentage difference indicates that the FEMA FIS value is larger.
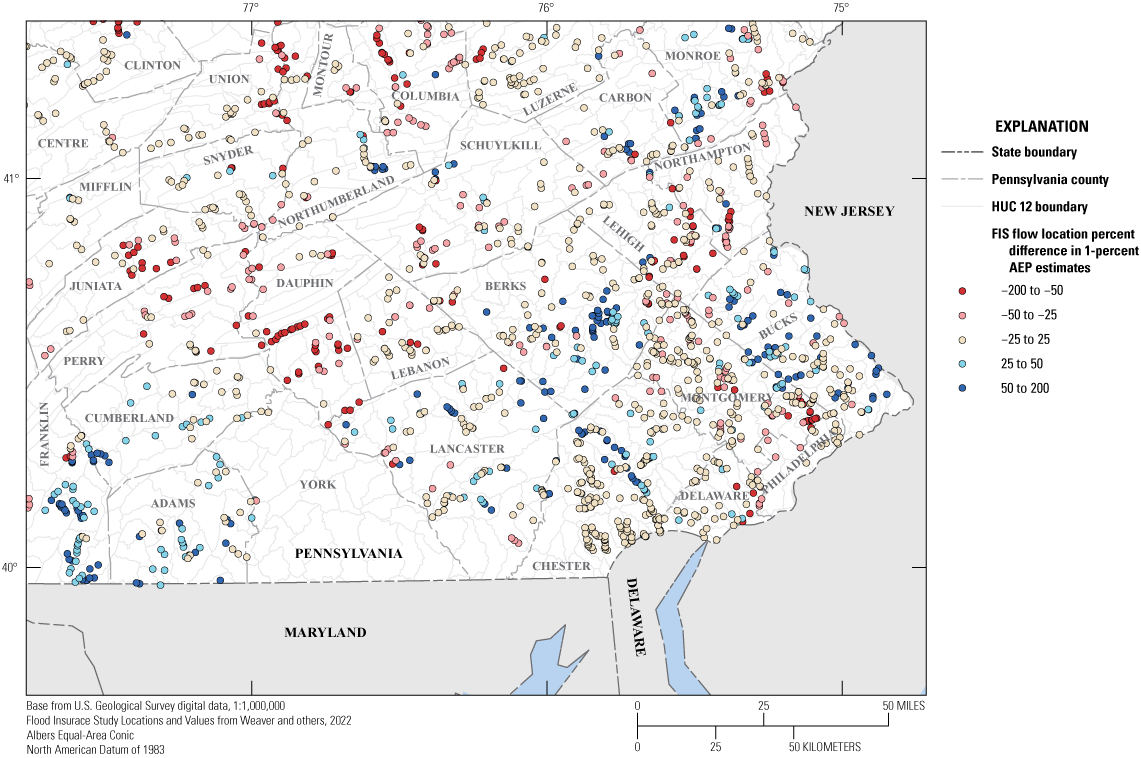
Map showing southeastern quadrant of Pennsylvania displaying flood insurance study (FIS) flow locations with graduated symbology representing the percentage difference in 1-percent annual exceedance probability (1%AEP) flood flows between U.S. Geological Survey (USGS) derived regression-based estimates and Federal Emergency Management Agency (FEMA) FIS estimates. A positive percentage difference indicates that the USGS value is larger, where a negative percentage difference indicates that the FEMA FIS value is larger.
Summary
Ultimately, Federal Emergency Management Agency (FEMA) Region 3 will decide what counties, watersheds, or flood insurance study (FIS) flow locations to prioritize for restudy, utilizing their coordinated needs management strategy tool and ample flood-risk data. Having the most up-to-date peak-flow data and understanding contemporary and ever-changing hydrology are essential components to completing this task. Although limitations exist, the data and analysis contained within this report and the associated data release will inform FEMA Region 3 in prioritizing restudies. By identifying areas or basins that may be exhibiting shifts in flood-flow hydrology, subsequent hydrologic and hydraulic studies can inform decision makers to better protect the communities of Pennsylvania from the risks associated with stream flooding.
Comparisons between existing FEMA FIS flood-flow values and flood-flow estimates based on recently updated regional regression equations from the U.S Geological Survey (USGS) indicate observations of large differences. With limitations to the use and application of regression equations in addition to the unknown accuracy of previous studies, these differences are not conclusive in suggesting temporal trends in flood flows nor suggestive of the correctness of FEMA or USGS derived flood-flow values. However, the differences do offer valuable insight where differences are very large (greater than or equal to 67 percent or less than or equal to −67 percent) or unidirectional (mostly positive or mostly negative) across a region, watershed, or stream reach. Southwestern Pennsylvania exhibited consistently lower flood-flow magnitudes using the updated regression techniques when compared to existing FIS values (flood-flow region 2: −39 percent median percentage difference, 74 FIS flow locations greater than or equal to 67 percent difference or less than or equal to −67 percent difference in Allegheny County), whereas southeastern Pennsylvania had several counties that exhibited consistently higher USGS derived flood-flow magnitudes (Franklin: +43.7 percent median percentage difference, 23 FIS flow locations greater than or equal to 67 percent difference or less than or equal to −67 percent difference; Berks: +13.5 percent median percentage difference, 26 FIS flow locations greater than or equal to 67 percent difference or less than or equal to −67 percent difference; and Bucks: +27.3 percent median percentage difference, 22 FIS flow locations greater than or equal to 67 percent difference or less than or equal to −67 percent difference).
Continued data collection and analysis can enhance determination of temporal trends regionally in flood-flow hydrology. The potential correlations between land use, land cover, and basin character data with directional (+ or −) flood-flow shifts observed in this study may provide insight into which watersheds are most suitable for regression-based flood-flow estimates and, alternatively, which watersheds are most susceptible to gross under or over estimation when using regression-based estimates. Combining temporal comparisons of flood-flow estimates where historical information exists could show where real trends are occurring or where changes can be attributed to varying methodology in flood-flow estimation. Additionally, work may be done to further validate the flow weighting and transfer methodology used in this report. The methodology may be applicable beyond the 0.5–1.5 drainage-area ratio and may also be valid for some streamgages where flow control structures exist. This method could be incorporated into the USGS Pennsylvania StreamStats web tool to provide flood-flow estimates beyond solely regression-based estimates.
This report and the analysis contained within are intended only to provide a statewide overview comparison of flood-flow estimates between existing FEMA FISs and the updated USGS regional regression equations developed by Roland and Stuckey (2019). Further analysis at the county and watershed scale will be essential to accurately assess flood-flow estimates, and ultimately, determine the true flood risk of Pennsylvania communities. The companion data release to this report is intended to be used as a tool for any continuing effort to compare and assess differences between flood-flow estimates. FIS flow locations are geolocated to enable spatial analysis at subscales beyond the state level (Weaver and others, 2022).
References Cited
Ehlke, M.H., and Reed, L.A., 1999, Comparison of methods for computing streamflow statistics for Pennsylvania streams: U.S. Geological Survey Water-Resources Investigations Report 1998–4068, 80 p., accessed May 5, 2022, at https://doi.org/10.3133/wri994068.
England, J.F., Jr., Cohn, T.A., Faber, B.A., Stedinger, J.R., Thomas, W.O., Jr., Veilleux, A.G., Kiang, J.E., and Mason, R.R., 2019, Guidelines for determining flood flow frequency—Bulletin 17C: U.S. Geological Survey Techniques and Methods, book 4, chap. B5, 148 p. [Also available at https://doi.org/10.3133/tm4B5.]
Federal Emergency Management Agency [FEMA], 2020, Flood insurance study status: Federal Emergency Management Agency web page, accessed December 6, 2022, at https://www.fema.gov/flood-maps/change-your-flood-zone/status/flood-insurance-study.
Federal Emergency Management Agency [FEMA], 2023, Coordinated needs management strategy: Federal Emergency Management Agency web page, accessed June 5, 2022, at https://www.fema.gov/flood-maps/tools-resources/risk-map/coordinated-needs-management-strategy.
Flippo, H.N., Jr., 1982, Evaluation of the streamflow-data program in Pennsylvania: U.S. Geological Survey Water-Resources Investigations Report 82–21, 56 p. [Also available at https://doi.org/10.3133/wri8221.]
Frankson, R., Kunkel, K.E., Champion, S.M., Stewart, B.C., DeGaetano, A.T., Sweet, W., and Spaccio, J., 2022: Pennsylvania state climate summary 2022: National Oceanic Atmospheric Administration Technical Report NESDIS 150–PA, 5 p., accessed September 7, 2022, at https://statesummaries.ncics.org/chapter/pa/.
Konrad, C.P., 2003, Effects of urban development on floods: U.S. Geological Survey Fact Sheet 076– 03, 4 p., accessed July 23, 2022, at https://doi.org/10.3133/fs07603.
Mastin, M.C., Konrad, C.P., Veilleux, A.G., and Tecca, A.E., 2016, Magnitude, frequency, and trends of floods at gaged and ungaged sites in Washington, based on data through water year 2014 (ver. 1.2, November 2017): U.S. Geological Survey Scientific Investigations Report 2016–5118, 70 p., accessed July 18, 2022, at https://doi.org/10.3133/sir20165118.
Moglen, G.E., and Shivers, D.E., 2006, Methods for adjusting U.S. Geological Survey rural regression peak discharges in an urban setting: U.S. Geological Survey Scientific Investigations Report 2006–5270, 55 p., accessed July 18, 2022, at https://doi.org/10.3133/sir20065270.
Ries, K.G., III, comp., 2007, The national streamflow statistics program—A computer program for estimating streamflow statistics for ungaged sites: U.S. Geological Survey Techniques and Methods, book 4, chap. A6, 37 p., accessed April 21, 2022, at https://doi.org/10.3133/tm4A6.
Roland, M.A., and Stuckey, M.H., 2007, Analysis of flood-magnitude and flood-frequency data for streamflow-gaging stations in the Delaware and North Branch Susquehanna River Basins in Pennsylvania: U.S. Geological Survey Open-File Report 2007–1235, 22 p., accessed May 24, 2022, at https://doi.org/10.3133/ofr20071235.
Roland, M.A., and Stuckey, M.H., 2008, Regression equations for estimating flood flows at selected recurrence intervals for ungaged streams in Pennsylvania: U.S. Geological Survey Scientific Investigations Report 2008–5102, 57 p., accessed September 4, 2020, at https://doi.org/10.3133/sir20085102. [Superseded by USGS Scientific Investigations Report 2019–5094.]
Roland, M.A., and Stuckey, M.H., 2019, Development of regression equations for the estimation of flood flows at ungaged streams in Pennsylvania (ver. 1.1, December 2020): U.S. Geological Survey Scientific Investigations Report 2019–5094, 36 p., accessed May 27, 2020, at https://doi.org/10.3133/sir20195094.
Sauer, V.B., Thomas, W.O., Stricker, V.A., and Wilson, K.V., 1983, Flood characteristics of urban watersheds in the United States: U.S. Geological Survey Water-Supply Paper 2207, 63 p. [Also available at https://www.usgs.gov/publications/flood-characteristics-urban-watersheds-united-states.]
Sloto, R.A., Stuckey, M.H., and Hoffman, S.A., 2017, Evaluation of the streamgage network for estimating streamflow statistics at ungaged sites in Pennsylvania and the Susquehanna River Basin in Pennsylvania and New York: U.S. Geological Survey Scientific Investigations Report 2016–5149, 102 p., accessed January 10, 2022, at https://doi.org/10.3133/sir20165149.
Stuckey, M.H., and Hoffman, S.A., 2010, Pennsylvania StreamStats—A web-based application for obtaining water resource-related information: U.S. Geological Survey Fact Sheet 2010–3086, 2 p., accessed January 29, 2021, at https://doi.org/10.3133/fs20103086.
Stuckey, M.H., and Reed, L.A., 2000, Techniques for estimating magnitude and frequency of peak flows for Pennsylvania streams: U.S. Geological Survey Water-Resources Investigations Report 00–4189, 43 p., accessed May 12, 2022, at https://doi.org/10.3133/wri004189.
U.S. Geological Survey, 2020, NHDPlus high resolution: U.S. Geological Survey web page, accessed December 8, 2020, at https://www.usgs.gov/national-hydrography/nhdplus-high-resolution.
U.S. Army Corps of Engineers, 2020, National inventory of dams: U.S. Army Corps of Engineers database, accessed March 24, 2020, at https://nid.sec.usace.army.mil/.
Weaver, M.R., Roland, M.A., Colgin, J.E., and Stuckey, M.H., 2022, USGS-derived 1-percent annual exceedance probability flood-flow estimates at flood insurance study locations across Pennsylvania: U.S. Geological Survey data release, https://doi.org/10.5066/P9FG2MF2.
Conversion Factors
Abbreviations
EMA
expected moments algorithm
FEMA
Federal Emergency Management Agency
FFR(s)
flood-flow region(s)
FIS(s)
flood insurance study (studies)
HUC
hydrologic unit code
IQR
interquartile range
NHDPlus HR
National Hydrography Dataset Plus High Resolution
PASS
Pennsylvania StreamStats
PennDOT
Pennsylvania Department of Transportation
USGS
U.S. Geological Survey
VSR
valid statistical reach
For additional information about this report, contact:
Director, Pennsylvania Water Science Center
U.S. Geological Survey
215 Limekiln Road,
New Cumberland, PA 17070
For additional information, visit:
https://www.usgs.gov/centers/pennsylvania-water-science-center
Publishing support provided by the Baltimore Publishing Service Center
Disclaimers
Any use of trade, firm, or product names is for descriptive purposes only and does not imply endorsement by the U.S. Government.
Although this information product, for the most part, is in the public domain, it also may contain copyrighted materials as noted in the text. Permission to reproduce copyrighted items must be secured from the copyright owner.
Suggested Citation
Weaver, M.R., Stuckey, M.H., Colgin, J.E., and Roland, M.A., 2024, Estimation and comparison of 1-percent annual exceedance probability flood flows at Federal Emergency Management Agency flood insurance study flow locations across Pennsylvania: U.S. Geological Survey Scientific Investigations Report 2023–5133, 33 p., https://doi.org/10.3133/sir20235133.
ISSN: 2328-0328 (online)
Study Area
| Publication type | Report |
|---|---|
| Publication Subtype | USGS Numbered Series |
| Title | Estimation and comparison of 1-percent annual exceedance probability flood flows at Federal Emergency Management Agency flood insurance study flow locations across Pennsylvania |
| Series title | Scientific Investigations Report |
| Series number | 2023-5133 |
| DOI | 10.3133/sir20235133 |
| Publication Date | April 03, 2024 |
| Year Published | 2024 |
| Language | English |
| Publisher | U.S. Geological Survey |
| Publisher location | Reston, VA |
| Contributing office(s) | Pennsylvania Water Science Center |
| Description | Report: viii, 33 p.; Data Release |
| Country | United States |
| State | Pennsylvania |
| Online Only (Y/N) | Y |
| Additional Online Files (Y/N) | N |