

Reservoir Evolution, Downstream Sediment Transport, Downstream Channel Change, and Synthesis of Geomorphic Responses of Fall Creek and Middle Fork Willamette River to Water Years 2012–18 Streambed Drawdowns at Fall Creek Lake, Oregon
Links
- Document: Report (24.8 MB pdf) , HTML , XML
- Data Releases:
- USGS data release - Surficial particle count and clay horizon marker data for Fall Creek and the Middle Fork Willamette River, Oregon in 2015–2017
- USGS data release - Fall Creek and Middle Fork Willamette geomorphic mapping geodatabase
- USGS data release - Structure-from-motion datasets of Fall Creek Lake, Oregon, acquired during annual drawdown to streambed November 2016
- USGS data release - Geomorphic mapping of Fall Creek Lake, Oregon, 2016
- NGMDB Index Page: National Geologic Map Database Index Page (html)
- Download citation as: RIS | Dublin Core
Acknowledgments
This study was prepared in cooperation with the U.S. Army Corps of Engineers. We are thankful for the support from Gregory Taylor, Molly Casperson, Gwendolyn Jones, Chad Helms, Doug Garletts, Kathryn Tackley, Mary Karen Scullion, Yamen Hoque, Norman Buccola, Chris Edwards, Doug Swanson, Jim Burton, Kathryn Warner, Kristin Powers, and Jacob Macdonald with the U.S. Army Corps of Engineers. Brian Bangs (formerly with the Oregon Department of Fish and Wildlife, now U.S. Fish and Wildlife Service) provided insights on processes and habitat responses to streambed drawdowns in the reaches downstream from Fall Creek Dam. John and Pam Baumann, Pat and Kerney Simpson, Jeff and Joan Devore, and Carol Brewer (residents, landowners, and land managers along Fall Creek and the Middle Fork Willamette River) provided access to monitoring sites and shared observations regarding channel conditions and streambed drawdown operations at Fall Creek Lake. Melissa Olson and Jason Nuckols with The Nature Conservancy provided access to field monitoring sites and perspectives on channel changes. Audrey Squires and Sarah Dyrdahl (both formerly with the Middle Fork Willamette Watershed Council) contributed knowledge of the Middle Fork Willamette River Basin. Audrey also assisted with field surveys. Mikel Calle Navarro (formerly with El Museo Nacional de Ciencias Naturales) provided field assistance. Aerial imagery was provided by Frontier Precision (Chase Fly) and Brown-Western Aviation (Gary and Mary Brown). Joseph Mangano, Scott Anderson, Jeff Sloan, Todd Burton, Adam Mosbrucker, and Lisa Faust (U.S. Geological Survey [USGS]) assisted with aerial imagery acquisition and structure-from-motion approaches. A variety of USGS scientists provided expertise and equipment that shaped the scientific approach, methods, and manuscript, including Joseph Mangano, Christina Murphy, Jon Major, James White, Brandon Overstreet, Jim O’Connor, and Charles Cannon. Krista Jones (USGS) reviewed early versions of the manuscript and Heather Bervid (USGS) assisted with manuscript preparation. Additional field assistance and data processing assistance was provided by Heather Bervid, Tessa Harden, Justin Reale, and Erin Poor with the USGS, as well as Alexandra Costello and Stephen Ross (formerly with the USGS).
Executive Summary
Chapter A. Introduction
Fall Creek Dam impounds Fall Creek Lake, a 10-kilometer-long reservoir in western Oregon and is operated by the U.S. Army Corps of Engineers (USACE) primarily for flood-risk management (or flood control) in late autumn through early spring months, as well as for water quality, irrigation, recreation, and habitat in late spring through early autumn. Since 2011 (water year [WY] 2012), Fall Creek Lake has been temporarily drawn down each year to facilitate downstream passage of juvenile spring Chinook salmon (Oncorhynchus tshawytscha) through the 55-meter (m) high dam. This annual dam operation is temporary, typically lasting about 1–2 weeks from WY 2012 through 2020 (drawdown operations in WY 2022–24 have increased to more than 6 weeks). Drawdown of the reservoir results in lake levels being lowered to the elevation near the historical, pre-dam streambed. The annual streambed drawdowns of WY 2012–18 have improved fish passage and led the USACE to formally adopt streambed drawdowns as part of annual operations at Fall Creek Dam. However, temporarily lowering the lake to streambed creates free-flowing conditions in the reservoir that result in the erosion and episodic export of predominantly sand and finer-grained sediments (less than 2 millimeters [mm]) to the lower gravel-bed reaches of Fall Creek and the Middle Fork Willamette River. The introduction of large volumes of sand and finer-grain sediment into the dam-regulated reaches downstream from Fall Creek Dam prompted questions about the geomorphic responses to annual streambed drawdowns within Fall Creek Lake and downstream reaches along Fall Creek and the Middle Fork Willamette River. The U.S. Geological Survey (USGS) in partnership with USACE initiated a comprehensive geomorphic and sediment transport investigation to assess the coupled processes of reservoir erosion, sediment evacuation from Fall Creek Lake, and patterns of sediment transport and deposition in reaches downstream from the Fall Creek Dam that have resulted from annual streambed drawdowns.
The purpose of this report is to systematically describe the processes of sediment erosion, transport, and deposition at Fall Creek Lake and geomorphic interactions between reaches upstream and downstream from Fall Creek Dam that relate to dam operations. Specifically, this report focuses on evaluating geomorphic responses to streambed drawdowns from WY 2012 through 2018 and placing drawdown-induced geomorphic responses within the broader context of physiographic and historical conditions and dam operations of Fall Creek and Middle Fork Willamette Rivers. Key objectives for this study were to characterize changes in reservoir morphology and substrate at Fall Creek Lake, describe the character and temporal pattern of sediment transport downstream from Fall Creek Dam, characterize geomorphic changes in channel reaches downstream from the Fall Creek Dam, and relate these data to the annual streambed drawdowns of WY 2012–18. This study uses multiple independent monitoring and measurement approaches to assess site, reach, and river-scale geomorphic responses to drawdowns to inform dam and reservoir management. Patterns and processes of reservoir evolution were assessed with geomorphic mapping and volumetric analyses of topography through comparison of multiple digital surface models (DSMs). Just downstream from Fall Creek Dam, analyses of sediment export from the reservoir focused on suspended sediment but also incorporated bedload analyses to assess sediment sizes. Geomorphic assessments downstream from the dam used reach-scale and site-scale approaches to document changes in channel morphology and substrate, including site measurements of sand and finer-grained sediment deposition and in-channel bed-material, volumetric change analyses from comparison of digital elevation models (DEMs), and repeat geomorphic mapping. Findings from this study inform river management and dam operations by providing an understanding of (1) coupled upstream-downstream geomorphic responses to the Fall Creek Lake streambed drawdowns, (2) geomorphic responses of Fall Creek Lake streambed drawdowns in comparison to drawdowns at other large dams, (3) controls on reservoir erosion and downstream geomorphic responses, and (4) implications for future hydrogeomorphic changes that may result from continued drawdowns and monitoring activities to assess those changes.
Chapter B. Reservoir Morphology and Evolution Related to Dam Operations at Fall Creek Lake
To understand the volume and distribution of sediment accumulation in Fall Creek Lake since dam closure in 1965, decadal-scale sedimentation patterns (spanning approximately 1965–2016) are evaluated using a combination of storage curve analyses and geomorphic mapping. Short-term (drawdown event-scale) patterns of erosion, sedimentation, and sediment export downstream are evaluated using a combination of geomorphic mapping and change detection analyses that quantify the distribution and total volume of sediment erosion and deposition within Fall Creek Lake.
Geomorphic mapping of reservoir topography and analyses of historical datasets reveals four categories of landforms and sediment processes within Fall Creek Lake related to lake level operations:
-
• lacustrine sedimentation expressed in the reservoir floor,
-
• fluvial erosion and deposition within historical stream channels during streambed drawdowns,
-
• channel-like features created by erosion within the reservoir floor during streambed drawdowns, and
-
• erosion on reservoir hillslopes.
Where the reservoir floor is mapped for this study as pelagic (deep water), deposition up to 3 meters (m) thick by lacustrine processes and burial of pre-dam topography with deposits thinning toward the edges of the valley floor and upstream areas of reservoir are observed. Despite over 50 years of sediment accumulation since dam construction, the main stream channels of Fall and Winberry Creeks (or reservoir thalwegs) through the reservoir are well defined, though their distinct morphology is likely influenced by a long history of recurring historical drawdowns to or near streambed since dam construction. Unregulated streamflow and sediment transport through the reservoir primarily are confined to these channels during the streambed drawdown periods. Erosional channel-like features created by drawdowns are carved through underlying, unconsolidated reservoir floor sediments and are most prominent in the lower reservoir below minimum conservation pool (the low pool elevation during winter flood season); sediment generated from the formation of these drawdown channels is more likely to be transported through and out of the reservoir than sediment deposits along the reservoir hillslopes at the valley margins that are separated from main channels by areas of low-gradient reservoir floor. Morphologic changes in the lower reservoir topography between January 2012 and November 2016 indicate overall net erosion of about 129,500 cubic meters (m3). The most prominent geomorphic changes occurred along the main channels of Fall and Winberry Creeks near the Fall Creek Dam where incision, lateral migration, and slumping banks resulted in vertical and lateral adjustments to channel position, whereas most changes fell below the detectable limit on higher-elevation reservoir floor surfaces except where erosion occurred along features mapped as drawdown channels.
Chapter C. Sediment Delivery from Fall Creek Lake and Transport through Downstream Reaches
USGS implemented a sediment monitoring program in WY 2013–18 to evaluate the quantity and character of reservoir sediment exported from Fall Creek Lake during streambed drawdowns. Turbidity and suspended sediments were monitored annually autumn through spring to span the WY 2013–18 streambed drawdowns; however, unequal monitoring timeframes each year reduced the ability to compare results and factors affecting sediment export from the reservoir difficult between years. These data were originally measured to develop regressions and compute suspended-sediment loads (SSL). Bedload sediment monitoring from a cableway at the Fall Creek streamgage was completed in the autumn-winter of WY 2013 and 2017. The limited number of samples and presumed variability in sediment supply from the reservoir precluded construction of streamflow and bedload discharge relations to compute more than instantaneous bedload.
Sand and finer-grained silts and clays were transported from the reservoir in suspension, though some coarser grains (up to 32 mm) were also mobilized and transported downstream from the dam as bedload. Observations of increased sediment transport downstream from Fall Creek Dam coincided with lake levels approaching about 3 m (10 feet [ft] or elevation 690 ft) above the streambed regulating outlets. Suspended-sediment loads computed for the full monitoring periods WY 2013–18 at the Fall Creek streamgage, located 1.4 kilometers (km) downstream from Fall Creek Dam, range from 54,700 metric tons (t) in WY 2013 to 13,900 t in WY 2018. Although the total annual SSL varied from year to year, the overall seasonal patterns of suspended sediment transport throughout each year were similar during monitoring in WY 2013-18. Suspended-sediment loads were low prior to the drawdown, then increased rapidly as lake levels lowered and approached the streambed. In the weeks following the drawdown period, as pool levels were increased, SSL remained slightly elevated above pre-drawdown levels but generally declined through the following winter and spring except during streamflow-driven pulses of suspended-sediment transport. WY 2013 had the greatest total computed SSL for each streambed drawdown and partial-year monitoring period. SSL computed for the partial-year period have generally decreased since WY 2013 and have varied by about 6,800 t with the exception of WY 2014. WY 2014 SSL reflects anomalously low sediment export due to low streamflows and freezing conditions that stabilized reservoir floor deposits. Bedload measurements in the short 1.4-km reach between Fall Creek Dam and the Fall Creek streamgage showed an inverse correlation between bedload transport rates and discharge, which probably reflects diminishing supply of coarse-sized sediment. Sand was more abundant (60–100 percent) than gravel in bedload samples confirming sand and finer-grained sediment dominated sediment evacuated from the reservoir during streambed drawdowns at Fall Creek Lake.
Chapter D. Geomorphic Responses to Fall Creek Lake Streambed Drawdowns Downstream from Fall Creek Dam
In the days, weeks, and months following streambed drawdown operations at Fall Creek Dam through WY 2018, sites downstream from the dam displayed a variety of geomorphic responses to reservoir sediment delivery within the main channel and overbank areas. Evaluation of streambed elevations at two streamgages located 1.4 km downstream from the dam on Fall Creek and 16.3 km downstream from the dam on the Middle Fork Willamette River indicated the effects of drawdown sediment on bed elevations were modest and transient. Repeat particle size measurements (October 2015 and September 2016) at five sites along Fall Creek and the Middle Fork Willamette River showed similar grain-sized distributions that do not reveal substantial deposition of fine-grained sediment related to the WY 2016 streambed drawdown. Altogether, these findings indicate that transport capacity in the main, low-flow channels of Fall Creek and Middle Fork Willamette River during WY 2012–18 was sufficient to mobilize and evacuate reservoir sediments from streambed drawdowns or other bank material and tributary sources. However, other monitoring for this study indicate low-velocity zones in off-channel areas are prime locations for sand and finer-grain sediment deposition. Patterns of overbank sediment accumulation indicate that the magnitude and timing of overbank deposition on bars and low-elevation floodplain varies with proximity to the dam, geomorphic setting, streamflows, and other factors. Sand and finer-grained reservoir sediments carried as suspended-sediment load in the reaches downstream from Fall Creek Dam were deposited in overbank areas as observed with clay-horizon markers during WY 2016–17. Overbank deposition quantified with Geomorphic Change Detection (GCD) software evaluated landform-scale patterns of erosion and deposition using repeat light detection and ranging (lidar) surveys at two sites in the Upper Fall Creek reach and one site in the Jasper reach for 3 years (2012–15) and one site in the Clearwater reach for 6 years (2009–15). Deposition thickness and spatial patterns from the GCD analysis were variable; some sites had dispersed but measurable deposition while at others, deposition was highly localized and exceeded 1 m in depth. Patterns of overbank deposition illustrate interactions among bar morphology, local hydraulics, and suspended-sediment transport dynamics that can create patches of highly localized deposition. The measured deposition at the two Fall Creek GCD sites likely resulted from reservoir sediments released from Fall Creek Lake during streambed drawdowns in WY 2016 and 2017 because the limited sediment inputs from bank material (geomorphically laterally stable reach) or tributaries (no significant tributaries) provided few other sediment sources. On the Middle Fork Willamette River, observed patterns of overbank deposition could reflect sediment sourced from upstream tributaries, bank erosion, or Fall Creek Lake streambed drawdown operations.
Despite the introduction of several thousand tons of reservoir sediment delivered from the Fall Creek Lake streambed drawdowns to below-dam river corridors, reach-scale mapping of channel features downstream from Fall Creek Dam shows minimal evidence of changes in channel planform or landforms that can be attributed to a drawdowns in WY 2012–16. On Upper Fall Creek reach, widespread increases in gravel bars or other in-channel sediment did not result from the five streambed drawdowns. The main changes attributable to sediment releases from Fall Creek Lake were localized increases in vegetated bar area, particularly on channel margin areas where sand and finer-grain sediment was deposited and rapidly colonized by vegetation. The area of mapped secondary water features decreased between 2005 and 2016, but that may be due to lower discharges depicted in the 2016 aerial photographs and less mapped area of inundation. Primary changes along the Lower Fall Creek reach include a 6.4 percent decrease in area of secondary water features between 2011 and 2016, and a nearly twofold increase in the area of unvegetated bars. Immediately downstream from the Fall Creek confluence, there were negligible changes in the location and areas of vegetated bars and the main wetted channel between 2005 and 2016, and local increases in bar area cannot be attributed solely to deposition of reservoir sediments from Fall Creek Lake because (1) areas along the Middle Fork Willamette River just upstream from the Fall Creek confluence display similar type and magnitude of changes and (2) some of the increases at the confluence area pre-date the drawdowns. The cumulative effect of sediment releases from Fall Creek Lake streambed drawdowns from WY 2012 to 2016 on downstream channel planform and landforms are modest compared to the river-scale transformations and planform changes that occurred in the decades following dam construction.
Chapter E. Discussion of Geomorphic Responses of Fall Creek and Middle Fork Willamette River to Streambed Drawdowns at Fall Creek Lake
Multiple aspects of Fall Creek Dam infrastructure and operations exert first-order controls on the magnitudes of reservoir erosion that occur during the streambed drawdowns and ultimately determine the sediment delivery to downstream reaches. Key aspects of the dam and its operations that are most relevant to assessing geomorphic responses to streambed drawdowns include the (1) dam infrastructure, including configuration and size of regulating outlets and their proximity to the streambed which dictates the capacity and competence of the river to deliver sediment to downstream reaches and mode of sediment transport as suspended-sediment load or bedload; (2) frequency of historical drawdowns and long-term, year-round dam operations and lake level management, which partly dictate reservoir morphology and locations and magnitudes of readily erodible materials; (3) dam operations and hydroclimatic conditions during the streambed drawdown (including length of the drawdown and streamflows entering the reservoir), which directly control the timing, duration and magnitude of reservoir erosion and sediment evacuation; and (4) dam operations following the streambed drawdown operation that regulate streamflows (and thereby sediment transport conditions) downstream of Fall Creek Dam which primarily reflect interactions between hydroclimatic conditions and flood control operations.
Patterns of sediment erosion and evacuation observed in this study at Fall Creek Lake from WY 2012–18 suggest that reservoir erosion during annual streambed drawdowns may remain similar or decrease in future years assuming (1) annual streambed drawdown operations are implemented in similar manner as the WY 2012–18 drawdowns (in terms of duration, late autumn or early winter implementation, rate of pool-level lowering to reach streambed, and other factors), (2) streambed drawdowns coincide with similar conditions as were observed WY 2012–18 (similar sediment yield into reservoir, low reservoir inflows, limited precipitation, moderate air temperature), and (3) no major geomorphic changes in the main reservoir channels of Fall and Winberry Creeks occur (for example, channel avulsion). Under such conditions, it is hypothesized that the stream channel within the reservoir would achieve a quasi-equilibrium state with respect to annual influx and export of sediment and aided by the substantial amount of in-channel bedrock, will remain laterally stable without erosion across reservoir deposits.
Patterns of sediment transport measured at the Fall Creek streamgage downstream from Fall Creek Dam provide insight into the potential effects of future streambed drawdowns at Fall Creek Lake. Analyses of suspended sediment measured in WY 2013–18 show a major reduction in suspended-sediment loads between WY 2013 and later years, indicating streamflows transporting sediment through the reservoir to downstream reaches during streambed drawdowns have become supply limited. The 6-year suspended-sediment monitoring and sampling program is insufficient to make predictions about future sediment transport conditions because of uneven monitoring periods and varying controls on reservoir sediment erosion. It is likely that future suspended-sediment loads will be variable but similar to those observed in WY 2015–18 if operational, climatic, and geomorphological factors remain similar to those monitored WY 2015–18. Suspended-sediment loads downstream from Fall Creek Lake will likely remain highest when regulating outlets are fully open and Fall Creek is free flowing with the reservoir fully drained with little to no residual pool. Over time, it is possible that the suspended-sediment loads would reflect mobilization of reservoir sediment deposited in the previous year rather than erosion of sediment deposited years or decades earlier. Bedload is likely to remain a small fraction of the total sediment load evacuated from the reservoir and is relatively modest compared with pre-dam bedload transport rates because most coarse sediment remains trapped by the dam.
If sediment releases from Fall Creek Lake and ensuing streamflow conditions follow a similar pattern in the future as was assessed in this study spanning WY 2012–18, near-term geomorphic adjustments downstream of the dam are expected to be modest. Barring major operational, climatic, and geomorphological changes, local site-scale deposition on bars, overbank areas, or off-channel features that persists several months after the streambed drawdown will likely continue to be highly variable, ranging from negligible to several centimeters of deposition. At the landform-scale, low velocity areas nearest to Fall Creek Dam will likely continue to undergo rapid deposition immediately during and after a streambed drawdown event, similar to patterns observed for WY 2012–18. Some of the sediment entering these off-channel features and margin areas may be temporarily stored, then later remobilized and dispersed farther downstream. But if newly deposited sediment persists through the following spring, there is a greater likelihood that local vegetation will establish, reinforce deposited material, and trap sediment during later drawdowns. The reach-scale geomorphic changes may become more apparent if (1) streambed drawdowns continued for several decades, and geomorphic changes were measured at decadal scales or (2) the amount of sediment introduced to downstream reaches substantially increased and (or) sediment transport capacity decreased. The continued streamflow regulation of Fall Creek Dam after sediment releases provides an opportunity to strategically manage streamflows during and after the streambed drawdowns to minimize downstream sediment impacts and ensure other operational thresholds are satisfied.
This study provides a comprehensive foundation of datasets and geomorphic analyses to inform dam operations at Fall Creek Lake, monitor sediment transport downstream, and consider operational schemes for future drawdowns. The datasets from this study also provide baselines of sediment transport and geomorphic conditions to assess future changes in reservoir and downstream environments. Future monitoring could be tailored to address specific questions regarding the long-term geomorphic effects of streambed drawdowns on fluvial habitats, flood hazards, cultural resources, or downstream water quality. Future monitoring activities could focus on the relevant geomorphic processes and spatial domains within the three categories used for this study: (1) reservoir erosion and net sediment evacuation, (2) sediment delivery to downstream reaches, including magnitude and temporal pattern of sediment transport, and (3) geomorphic responses of downstream reaches to sediment delivery. Specifically, high priority future monitoring activities could include:
-
• Repeat topographic or photographic surveys in the reservoir to characterize changes occurring within individual drawdowns, to quantify sediment export, to determine temporal changes in reservoir storage, and to identify locations of erosion and deposition.
-
• Continuous, year-round turbidity monitoring supplemented with suspended-sediment measurements at a streamflow-gaging station immediately downstream from the dam to quantify sediment export.
-
• Repeat geomorphic monitoring, mapping, or modeling in downstream reaches to track changes in channel and over bank features using a combination of site- and reach-scale monitoring approaches. This could support assessments of sediment deposition and ensuing vegetation encroachment on flood hazards and habitats and examine how sediment transport and depositional processes may be affected by different sediment supply, streamflow, or dam management scenarios.
Chapter A. Introduction
The U.S. Army Corps of Engineers (USACE) temporarily lowers water levels in Fall Creek Lake in western Oregon to facilitate annual downstream passage of juvenile spring Chinook salmon (Oncorhynchus tshawytscha) through the 55-meter (m)-high dam. Since 2011 (water year [WY] 2012), lake levels have been lowered to an elevation near the historical streambed for a short period (typically about 1–2 weeks) in late autumn or early winter, enabling downstream fish passage through the dam’s regulating outlets. This reservoir operation (herein “streambed drawdown”) has substantially improved downstream fish passage and survival of juvenile fish during outmigration (Northwest Fisheries Science Center, 2015), but temporarily exposing reservoir sediments to fluvial erosion and transport has also increased the export of predominantly fine (less than 2 millimeters [mm]) sediment to the lower reaches of Fall Creek and the Middle Fork Willamette River (relative to typical dam operations for flood control; Schenk and Bragg, 2014, 2015, 2021) where it can influence channel morphology and aquatic habitats (for example, Kondolf and others, 2014; Espa and others, 2016) similar to responses observed following dam removals (for example, Major and others, 2012; Wilcox and others, 2014; East and others, 2015). Repeated releases of large amounts of reservoir sediments to the river corridors downstream from Fall Creek Dam (Schenk and Bragg, 2014, 2021) and observations of sediment accumulation in off-channel habitats (Bangs and others, 2011–14; Brian Bangs, Oregon Department of Fish and Wildlife, oral commun., July 2015) prompted questions regarding near- and long-term consequences of sediment delivery to downstream channel morphology and aquatic habitats (fig. A1). The magnitude, timing, and character of sediment released from the reservoir influences deposition and erosion processes in downstream reaches. Therefore, understanding sedimentation and erosion processes within Fall Creek Lake under historical and continued streambed drawdowns is critical to understand downstream geomorphic responses and future trajectories of change. This study documents geomorphic changes in Fall Creek Lake and downstream reaches along Fall Creek and the Middle Fork Willamette River over multiple periods at different temporal and spatial scales to evaluate WY 2012–18 streambed drawdown responses and thereby provide an understanding of reservoir morphology and evolution at Fall Creek Lake (Chapter B. Reservoir Morphology and Evolution Related to Dam Operations at Fall Creek Lake) that inform the sediment delivery from Fall Creek Lake and downstream transport (Chapter C. Sediment Delivery from Fall Creek Lake and Transport through Downstream Reaches) and geomorphic responses downstream from the dam (Chapter D. Geomorphic Responses to Fall Creek Lake Streambed Drawdowns Downstream from Fall Creek Dam) related to streambed drawdowns. The synthesis and discussion (Chapter E. Discussion of Geomorphic Responses of Fall Creek and Middle Fork Willamette River to Streambed Drawdowns at Fall Creek Lake) places key findings within the broader context of physiographic, historical, and dam management conditions and provides considerations for future implications of continued streambed drawdowns.
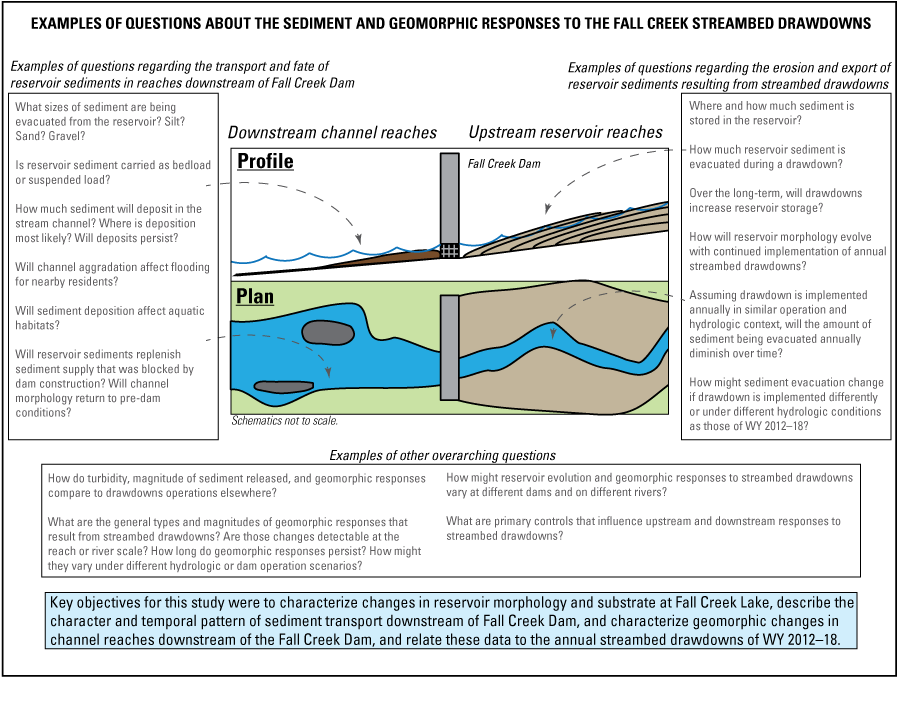
Examples of geomorphic and sediment-related questions that arose following the water year (WY) 2012 streambed drawdown at Fall Creek, Oregon, and prompted the study outlined in this report.
Background
Large dams (greater than 15 meters [m]; International Commission on Large Dams, 2011) provide multiple benefits to society including hydropower, flood control, water storage, recreation, and irrigation (for example, World Commission on Dams, 2000; Billington and others, 2005; Ho and others, 2017). Despite their importance, the construction and subsequent operation of large dams pose migratory barriers to organisms (for example, Collins, 1976; Bjornn and Peery, 1992), interrupt the downstream transport of water, sediment, and nutrients along the river network (for example, Williams and Wolman, 1984; Graf, 2006; Richter and Thomas, 2007), threaten cultural resources (for example, Smith, 1998; Corcoran and others, 2001), and alter downstream water quality (for example, Hamilton and others, 2022; Stratton Garvin and Rounds, 2022). The physical and biological effects of large dams are well documented; for example, dams trap coarse sediment and reduce peak streamflows, resulting in altered geomorphic processes and consequent adjustments to channel morphology, substrates, morphology, and physical habitats in downstream reaches (for example, Williams and Wolman, 1984; Grant and others, 2003; Graf, 2006). In the Pacific Northwest, large dams block migration of anadromous fish species between historical spawning grounds located in upper basin areas and lower basin reaches used for rearing and migration to the ocean where juvenile fish grow to adulthood (for example, Collins, 1976; Bjornn and Peery, 1992; National Marine Fisheries Service [NMFS], 2008; Hansen and others, 2017). Strategies to mitigate the possible impacts imposed by dams in response to aging infrastructure, changing societal values, and regulatory concerns have been implemented in recent decades, including dam removals (for example, Major and others, 2012; Wilcox and others, 2014; East and others, 2015), changes in dam operations (for example, environmental streamflow programs or streambed drawdowns; Richter and Thomas, 2007; Warner and others, 2014; Murphy and others, 2019a, c), and infrastructure upgrades (such as the comprehensive infrastructural upgrades proposed in the Willamette River Basin to improve water temperature and fish passage; NMFS, 2008).
In western Oregon, managers at Fall Creek Dam in the Willamette Valley have implemented a combination of infrastructural and operational strategies to improve fish passage while still providing societal benefits provided by the dam, such as flood control. Fall Creek Dam is one of 13 Willamette Valley Project (WVP) large dams operated by the USACE within the Willamette River Basin (fig. A2). Spring Chinook salmon were listed as threatened under the Endangered Species Act (ESA) in 1999 (NMFS, 1999a, b). In late spring, adult spring Chinook salmon enter the Willamette River system and migrate upstream toward historical spawning grounds. These fish entering Fall Creek are collected at the base of Fall Creek Dam and transported to spawning reaches upstream from the dam where they spawn in autumn (Nesbit and others, 2014; Hansen and others, 2017). Juveniles emerge from spawning gravels in late winter, then migrate downstream, becoming entrained in Fall Creek Lake where they rear during spring and summer. Unlike many large dams that lack downstream fish passage for juvenile salmon, Fall Creek Dam was constructed with fish horns (openings on the upstream side of the dam that resemble horns designed to allow downstream fish passage; fig. A3). However, soon after the dam was fully operational in the late 1960s, fisheries biologists found that fish passage and survival was low through the horns (Smith and Korn, 1970).
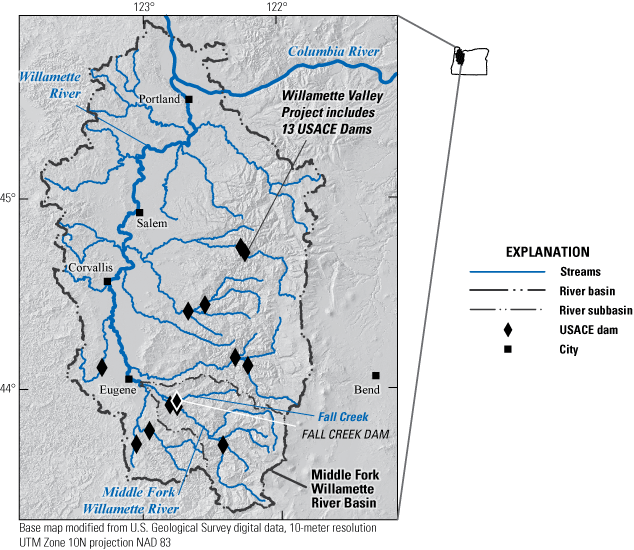
Distribution of U.S. Army Corps of Engineers (USACE) Willamette Valley Project dams in the Willamette River Basin, Oregon.
Fish horns at Fall Creek Lake, Oregon, constructed with the dam in 1965 to provide downstream fish passage. Photographs taken by Gregory Taylor, U.S. Army Corps of Engineers, January 6, 2011.
While downstream fish-passage resulting from drawdown operations at Fall Creek Lake was successful (Northwest Fisheries Science Center, 2015), temporarily transforming a reservoir to a free-flowing river also exposed erodible reservoir sediments to fluvial erosion and transport, resulting in sediment export to downstream reaches. During the WY 2012 streambed drawdown, anecdotal reports described the channel just downstream from the dam filling with sediment (fig. A4) and clogging of irrigation withdrawal pipes (Gregory Taylor, USACE, oral commun., July 2015; J. Baumann, landowner, oral commun., September 2015; R. White, landowner, oral commun., September 2015). Additionally, Oregon Department of Fish and Wildlife (ODFW) observed substantial sediment deposition downstream from Fall Creek Dam while monitoring off-channel habitats used by Oregon Chub (Oregonichthys crameri; B. Bangs, oral commun., July 2015; Bangs and others, 2011–2014, 2016; Bangs and Meeuwig, 2017). Subsequent drawdowns also supplied large quantities of sediment mobilized from the reservoir to the downstream reaches of Fall Creek and the Middle Fork Willamette River (Schenk and Bragg, 2014, 2021).
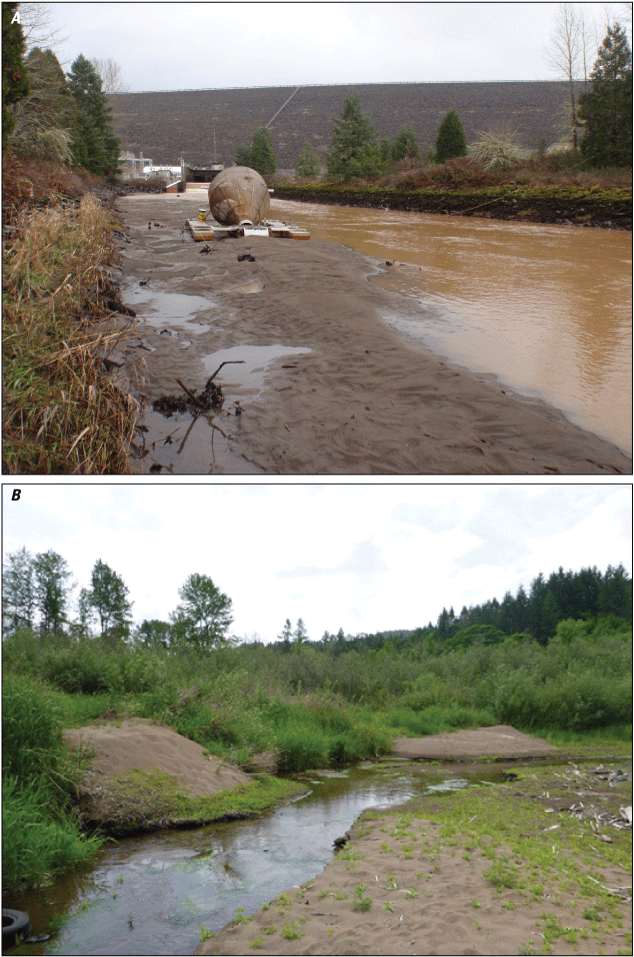
(A)Large quantities of sediment released from the water year 2012 Fall Creek Lake, Oregon, streambed drawdown filled the Fall Creek channel just downstream from the dam and left U.S. Army Corps of Engineers screw trap (for fish monitoring) out of the water and prompted questions about the fate of sediment. Photograph by Gregory Taylor, U.S. Army Corps of Engineers, January 19, 2012. (B) Large deposits of sediment observed 23.8 km downstream from Fall Creek Dam on the Middle Fork Willamette River also prompted questions about the source of that sediment and the fate of sediment released from Fall Creek Lake. Photograph by J. Rose Wallick, U.S. Geological Survey, June 4, 2015.
The release of reservoir sediments has consequences for downstream water quality, infrastructure, and aquatic habitats. Studies of large sediment releases on other regulated rivers provide insights about geomorphic responses to the Fall Creek Lake streambed drawdowns and approaches for measuring those responses. Studies monitoring or modeling changes in reservoir deposits resulting from drawdown operations for sediment management (for example, Kantoush and Schleiss, 2009; Kantoush and Sumi, 2010; Guertault and others, 2014; Tsakiris and others, 2019), as well as research on the downstream sediment effects on water quality and aquatic species (for example, Crosa and others, 2009; Baoligao and others, 2016; Espa and others, 2016, 2019; Quadroni and others, 2016; Hauer and others, 2020) and on the effects of changes in sediment transport and streamflows regimes to channel morphology or vegetation (for example, Brandt, 1999, 2005; Wohl and Cenderelli, 2000; Anderson, 2007; Asaeda and Rashid, 2012; Grant and others; 2015; Hauer and others, 2020) illustrate the considerable variability in site settings, types and durations of drawdowns, magnitudes of reservoir erosion and downstream sediment transport associated with drawdowns, and downstream effects observed downstream from dams. Fluvial responses of gravel-bed rivers to coupled reservoir and downstream conditions related to the operation and removal of large dams are even more well documented than drawdowns. The dam removal studies provide useful analogs for considering geomorphic responses to drawdowns and a framework for investigating the linkages between reservoir erosion and downstream sediment transport and deposition (for example, Skalak and others, 2009; Major and others, 2012; Wilcox and others, 2014; East and others, 2015; Magirl and others, 2015; Randle and others, 2015; Warrick and others, 2015; Foley and others, 2017). Altogether, these reservoir drawdown and dam removal studies highlight the wide variability in geomorphic responses at different spatial and temporal scales and the importance of multiple independent approaches to evaluate the erosion and downstream transport of reservoir sediments.
Multiple monitoring and research studies have been initiated to evaluate different physical and biological aspects of the Fall Creek streambed drawdowns. A USGS sediment monitoring study documented turbidity, suspended sediment, and dissolved oxygen downstream from Fall Creek Dam from WY 2013 to 2018 and bedload in WY 2013 (Schenk and Bragg, 2014, 2021; U.S. Geological Survey [USGS], 2021). Sediment monitoring was completed at the USGS streamflow-gaging stations on Fall Creek below Winberry Creek (14151000) and the Middle Fork Willamette River at Jasper (14152000; fig. A5), although additional sites were monitored in WY 2013 (Schenk and Bragg, 2014, 2021). These previous studies from the sediment monitoring program underlie and form the basis of Chapter C. Sediment Delivery from Fall Creek Lake and Transport through Downstream Reaches, which also incorporates some additional, previously unpublished bedload sampling from WY 2017. Fisheries studies have evaluated passage and survival of juvenile spring Chinook salmon at Fall Creek Dam (Nesbit and others, 2014; Hansen and others, 2017; Murphy and others, 2019c) and changes in food webs and fisheries communities within the reservoir (Whitmore and others, 2017; Murphy and others, 2019a, b). ODFW began monitoring changes in select off-channel habitats used by Oregon Chub downstream from Fall Creek Dam on Fall Creek and the Middle Fork Willamette River in 2010, specifically assessing changes in habitat area and substrate in addition to fish species and vegetation (Bangs and others, 2011, 2012, 2013, 2014, 2016; Bangs and Meeuwig, 2017). Additionally, the USACE developed hydraulic and sediment transport models of Fall Creek Lake to inform reservoir management decisions in the Willamette Valley and elsewhere (Gibson and Crain, 2019).
The purpose of this study is to assess geomorphic responses to annual streambed drawdowns within Fall Creek Lake and downstream reaches along Fall Creek and the Middle Fork Willamette River (fig. A6) from WY 2012 to 2018 and place observations within the broader geomorphic and historical context of processes influencing these river corridors. Key objectives for this study were to characterize changes in reservoir morphology and substrate at Fall Creek Lake, describe the character and temporal pattern of sediment transport downstream from Fall Creek Dam, characterize geomorphic changes in channel reaches downstream from the Fall Creek Dam, and relate these data to the annual streambed drawdowns of WY 2012–18. Patterns and processes of reservoir evolution were assessed with geomorphic mapping and volumetric analyses through comparison of multiple digital surface models (DSMs). Just downstream from Fall Creek Dam, reservoir sediment export analyses focused on suspended sediment but also incorporated bedload analyses to assess sediment sizes. Downstream geomorphic assessments used reach-scale and site-scale approaches to document changes in morphology and substrate, including site measurement of sand and finer-grained sediments (less than 2 mm) deposition and in-channel bed-material, volumetric change analyses from comparison of digital elevation models (DEMs), and repeat geomorphic mapping. Details of datasets used for this study are summarized in appendix 1. The geomorphic responses of downstream reaches and associated effects on aquatic habitats, flood conveyance or other societal concerns ultimately reflect coupled interactions between reservoir sediment erosion upstream from the dam and the fluvial transport and deposition downstream from the dam. While this study did not explicitly evaluate controls on these coupled interactions, the documented upstream and downstream geomorphic responses to streambed drawdowns reflect the cumulative effects of human and natural controls on reservoir erosion and provide a foundation for hypothesizing controls on those processes. Datasets and papers supporting the work described in this report are also available (Keith, 2019; Keith and Gordon, 2019; Keith and Stratton, 2019; Keith and Mangano, 2020; Keith and Stratton Garvin, 2021; Keith and others, 2023a, b).
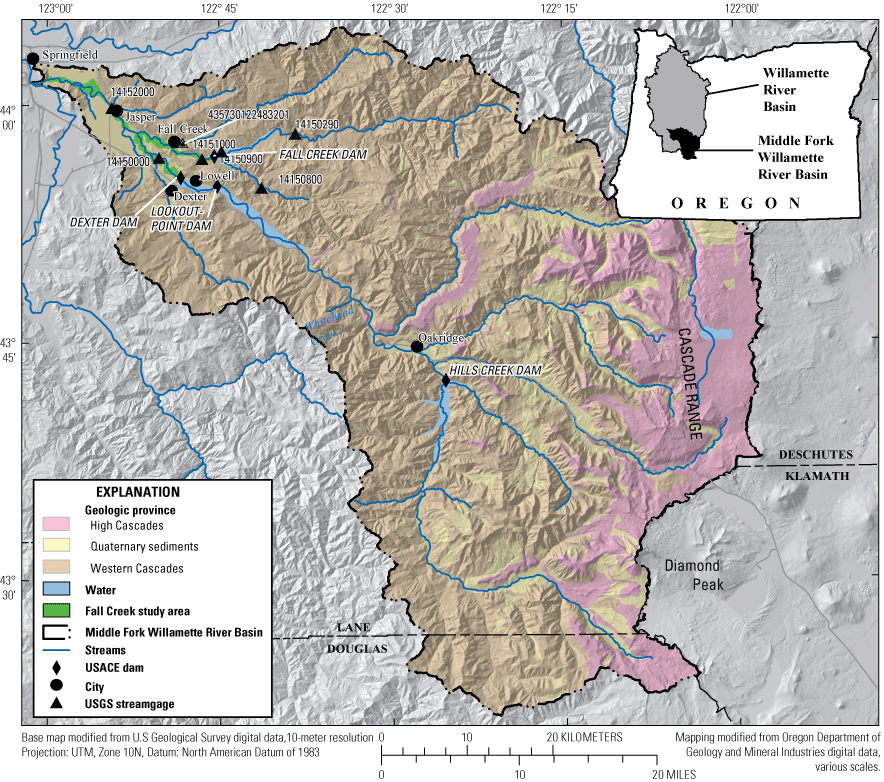
Stream network, basin and county boundaries, geologic provinces, study area, U.S. Geological Survey (USGS) streamflow-gaging stations, U.S. Army Corps of Engineers (USACE) dams, and other features in the Fall Creek and Middle Fork Willamette River Basins, Oregon.
Purpose and Scope
The purpose of this report is to systematically describe the processes of sediment erosion, transport, and deposition related to streambed drawdowns at Fall Creek Lake and interactions between reaches upstream and downstream from Fall Creek Dam that relate to dam operations. Report organization focuses on three distinct categories to evaluate responses to dam operations, followed by a synthesis to facilitate linkages among those categories:
-
(1) reservoir morphology evolution within Fall Creek Lake, including a broad characterization of sediment accumulation in Fall Creek Lake since dam construction in 1965 (Chapter B. Reservoir Morphology and Evolution Related to Dam Operations at Fall Creek Lake),
-
(2) fluvial transport of reservoir sediment downstream from Fall Creek Dam resulting from streambed drawdowns (Chapter C. Sediment Delivery from Fall Creek Lake and Transport through Downstream Reaches),
-
(3) geomorphic responses downstream from Fall Creek Dam (Chapter D. Geomorphic Responses to Fall Creek Lake Streambed Drawdowns Downstream from Fall Creek Dam), and
-
(4) synthesis of linkages among channel morphology, coupled upstream and downstream responses to streambed drawdowns, context for the magnitude of those responses relative to dam operations at other reservoirs, and implications for future response (Chapter E. Discussion of Geomorphic Responses of Fall Creek and Middle Fork Willamette River to Streambed Drawdowns at Fall Creek Lake).
Each chapter evaluates a distinct suite of geomorphic and sediment transport processes occurring on different temporal and spatial scales, and required specific analytical approaches to evaluate those processes. This study focuses on the rivers most influenced by the construction and operation of Fall Creek Dam, including Fall Creek Lake, Fall Creek downstream from Fall Creek Dam, and the Middle Fork Willamette River downstream from the Fall Creek confluence, as well as the portions of the Middle Fork Willamette River not influenced by the streambed drawdowns upstream from the Fall Creek confluence to Dexter Dam (fig. A5). Historical changes spanning from 1926 to 2016 along Fall Creek and the Middle Fork Willamette River downstream from the flood-control dams are documented in a companion report (Keith and others, 2023a) The datasets created and evaluated for this study (app. 1) provide a baseline for future monitoring, and lessons learned from the multi-faceted monitoring approach employed at Fall Creek will aid in identifying useful monitoring activities at various temporal and spatial scales and geomorphic regimes. Findings from this study inform river management and dam operations by providing an understanding of (1) the coupled upstream-downstream geomorphic responses to the Fall Creek Lake streambed drawdowns, (2) geomorphic responses of Fall Creek Lake streambed drawdowns in comparison to drawdowns at other large dams, (3) controls on reservoir erosion and downstream geomorphic responses, and (4) implications for future hydrogeomorphic changes that may result from continued drawdowns and monitoring activities to assess those changes.
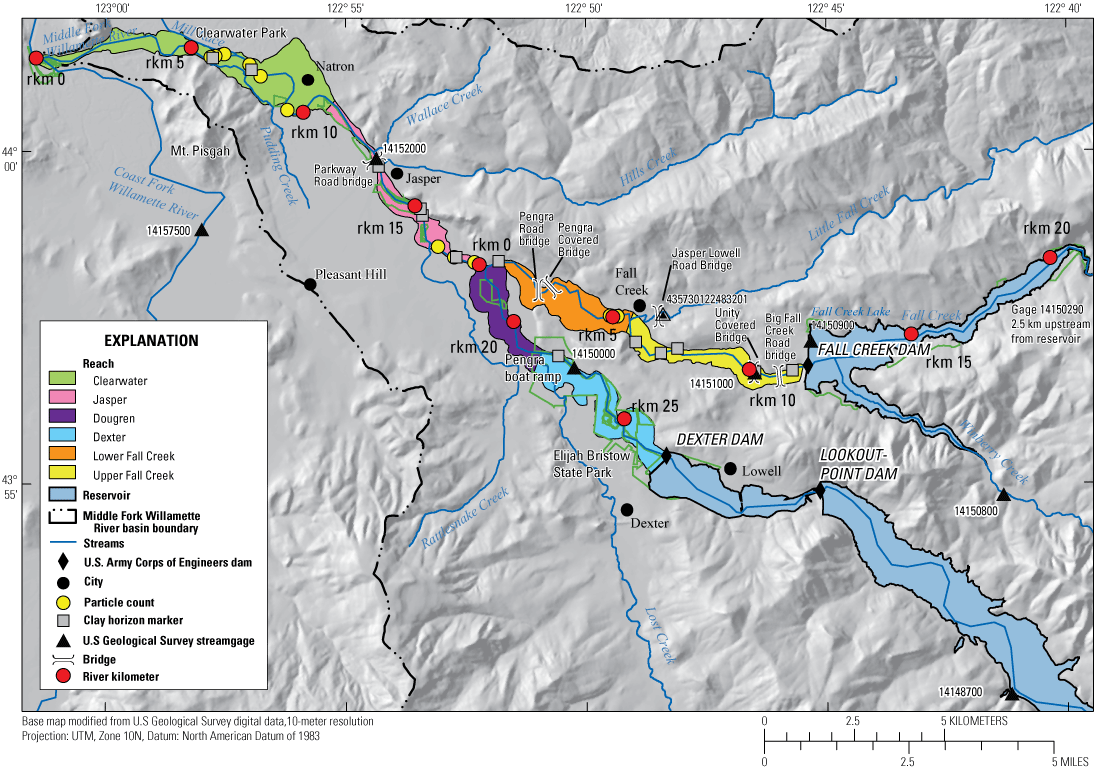
Study area reaches including the alluvial and mixed-bed channels and floodplain for Fall Creek and the Middle Fork Willamette River downstream from Fall Creek and Dexter Dams to the confluence with the confluence with the Coast Fork Willamette River, Oregon. The study area also includes Fall Creek Lake upstream from Fall Creek Dam.
Fall Creek Dam Terminology Used in this Study
For this study, we define and apply a standard set of terms to ensure clarity when describing dam operations and water levels at Fall Creek Lake (fig. A7). These terms reflect language used in the operation of WVP dams (for example, table 2-1 of NMFS, 2008) and recognizes other formal or informal terminology may be used in other regions.
Pool, lake, and reservoir: These terms are commonly used interchangeably to describe water bodies impounded behind large dams in the Willamette Valley. At Fall Creek Lake (fig. A7), the word “Lake” is part of the proper name for the water body behind Fall Creek Dam, and proper names for water bodies behind Lookout Point and Dexter Dams are Lookout Point Lake and Dexter Reservoir. In this study, we differentiate between “pool” and “reservoir.” The term “reservoir” is used to generally describe the entire spatial domain inundated at maximum water levels and includes seasonally dry areas, whereas “pool” is used more narrowly to describe water-surface extent or elevation at a specific operational condition (see “Pool levels” term below).
Drawdown: This term generally refers to the dam management action of lowering pool levels to different elevations to meet a specific purpose. For example, drawdowns occur at Fall Creek Dam for seasonal flood control, fish passage, and occasional construction or maintenance. The various pool levels for Fall Creek Lake are defined below.
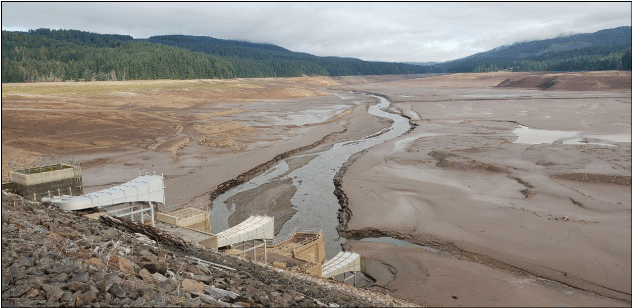
Streambed drawdown: This term describes the process of lowering lake levels to elevation 680 ft NGVD 29 coinciding with a level near the historical, pre-dam streambed (approximately 670 ft) at Fall Creek Lake. The management objective for this operation is to support downstream passage of juvenile spring Chinook salmon through the regulating outlets at the base of Fall Creek Dam. During the streambed drawdown operation at Fall Creek Lake, there is no residual pool behind the dam, and water movement through the two reservoir regulating outlets (1.7 m wide by 3.0 m high) is that of a free-flowing channel.
Reservoir flushing: Reservoir flushing terminology is widely used in reservoir literature (for example, Morris and Fan, 1998; Kondolf and others, 2014; Morris, 2015) referring to sediment maintenance operations that seek to pass reservoir sediment downstream, thereby recovering storage capacity in the reservoir. Flushing is a term that describes rapid lowering of pool levels to low-elevation dam outlets creating hydraulic conditions sufficient to mobilize sediment and “flush” it out of the reservoir. Characteristic differences between flushing and sluicing (another operation used to pass reservoir sediments downstream) are summarized elsewhere (for example, Morris and Fan, 1998; Kondolf and others, 2014; Morris, 2015). The USACE was not implementing flushing or sluicing operations at Fall Creek Dam during the WY 2012–18 streambed drawdowns, although reservoir sediment evacuation occurs during the Fall Creek Lake streambed drawdown.
Pool levels: At Fall Creek Lake, five main pool levels (fig. A7) are used to frame the operational and geomorphic conditions that influence the processes considered for this study:
Full pool or maximum pool (830 ft NGVD29; 254 m NAVD88): Full pool represents the upper operational target elevation of the reservoir. All reservoir features are inundated at full pool (fig. A7).
Minimum conservation pool (728 ft NGVD29; 223 m NAVD88): At Fall Creek and many other WVP dams, pool levels are routinely lowered (drawn down) for flood-risk management (hereinafter, flood control) in winter months. Seasonal drawdown to minimum conservation pool represents the lower operational target elevation for annual flood-control operations. Features below minimum conservation pool at Fall Creek are typically inundated except during streambed drawdown and features above minimum conservation pool are variously wetted and dried as the water surface elevation is seasonally adjusted by reservoir operators (fig. A7).
BiOp fish passage pool (714 ft NGVD29; 219 m NAVD88): Biological Opinion (BiOp) Reasonable and Prudent Actions (RPAs) for Fall Creek Dam request lowering pool levels to at least 714 ft to support downstream passage of juvenile spring Chinook salmon; although in practice, streambed drawdowns (pool levels of 680 ft) have been used in place of the BiOp fish passage pool target elevation (fig. A7).
Upper elevation during streambed-drawdown (pool level below 690 ft NGVD29; 211 m NAVD88): Sediment monitoring data (Schenk and Bragg, 2014, 2021) collected downstream from Fall Creek Dam during streambed drawdowns, along with anecdotal information from observations (Gregory Taylor, U.S. Army Corps of Engineers, oral commun., November 2016), suggest increased reservoir sediment mobilization and transport when pool levels approach elevation 690 ft (fig. A7). Therefore, this study defines streambed drawdown as occurring over a narrowly defined range of pool elevations between 690 and 680 ft. At elevation 690 ft, the pool level is considered to be at the “streambed-drawdown condition” pool level. These thresholds are mainly used in the summation of suspended-sediment loads and calculation of streambed drawdown streamflow statistics addressed in Chapter C. Sediment Delivery from Fall Creek Lake and Transport through Downstream Reaches.
Lower elevation during streambed drawdown and post-dam streambed (680 ft NGVD29; 208 m NAVD88): The post-dam streambed elevation immediately upstream from Fall Creek Dam is defined as elevation 680 ft (approximately 10 ft higher than the pre-dam streambed of 670 ft) and is exposed when lake levels are fully drawn down and no residual pool remains (fig. A7). In WY 2012–18, this condition mainly occurred for short periods in the autumn or winter during annual streambed drawdown operations to enhance fish passage through Fall Creek Dam.
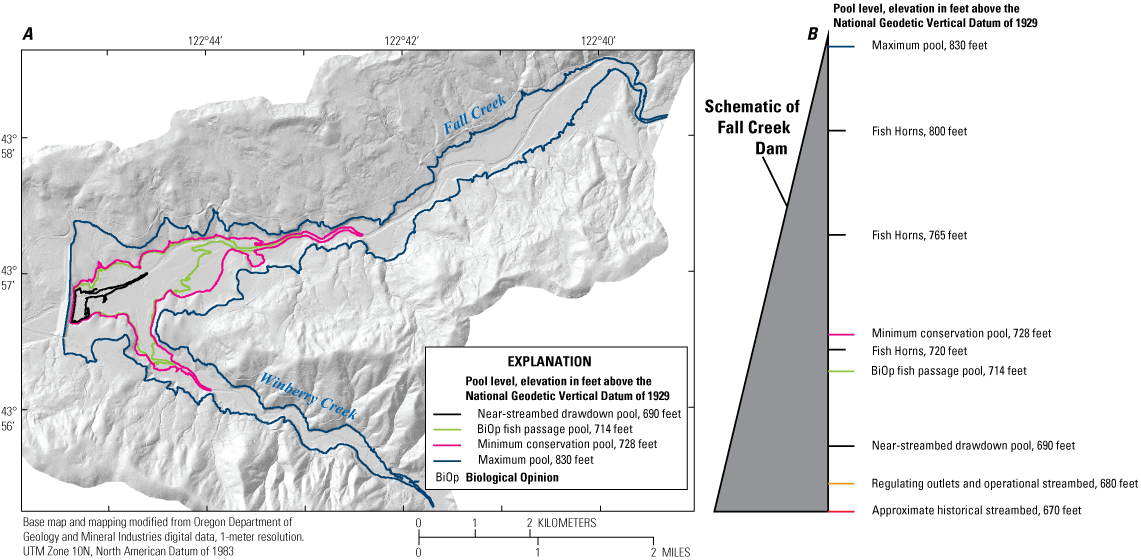
Light detection and ranging image of Fall Creek Lake acquired during water-year 2012 streambed drawdown including key pool level contours (A). Vertically scaled schematic of Fall Creek Dam including key pool levels and infrastructure (B). Elevations in feet (ft) above National Geodetic Vertical Datum of 1929 (NGVD 1929).
Overview of the Middle Fork Willamette River and Fall Creek Basins and Study Area
The Middle Fork Willamette River Basin (3,548 km2) originates within the southern Oregon Cascade Range (fig. A5) with a relief of 1,350 m. The basin is 92.2 percent forested with developed areas mainly concentrated in the lowermost basin, and less than 1 percent of basin landcover is classified as impervious (USGS, 2018b, derived from 2011 National Land Cover Data). Fall Creek Basin is a 653 km2 tributary watershed of the Middle Fork Willamette River. The Middle Fork Willamette River Basin (fig. A5) has a temperate Mediterranean climate (Köppen-Geiger climate classification system) with warm dry summers and cool wet winters. Mean annual precipitation is 166 centimeters (cm) and mean annual air temperature ranges from 4.56 to 16.4 °C (USGS, 2018b, from PRISM 1971–2000 800-m grid). In the Fall Creek Basin, most of the winter precipitation falls as rain. Hydrogeomorphic conditions and study reaches along Fall Creek and Middle Fork Willamette River mainly reflect the geology (fig. A2), upstream sediment supply, hydrology (figs. A2, A3), streamflow regulation by dams (table A2), as well as other human and natural influences (Keith and others, 2023a).
Study Area
The study area includes the lower 27.3 km of the Middle Fork Willamette River below Dexter Dam and the lower 11.5 km of Fall Creek downstream from Fall Creek Dam, as well as the 10-km long Fall Creek Lake (fig. A6). Downstream from Dexter Dam, the Middle Fork Willamette River is predominantly an alluvial, gravel-bed river, whereas Fall Creek downstream from Fall Creek Dam flows over bedrock and alluvium, reflecting relatively greater valley confinement along Fall Creek compared to the Middle Fork Willamette River. Both river corridors are flanked by broad floodplains and locally impinge upon valley walls composed of bedrock or early Quaternary terrace gravels. The width of the primary active channel is typically greater than 100 m along the Middle Fork Willamette River with an average gradient of about 0.0024 m/m. Fall Creek downstream from Fall Creek Dam is steeper and narrower, with typical active channel width of about 20–60 m and average gradient of about 0.0027 m/m. Fall Creek is a predominantly straight, single-thread channel for 5 km below Fall Creek Dam, then adopts a more sinuous planform, with intermittent secondary channel features formed prior to streamflow regulation. The Middle Fork Willamette River below Dexter Dam has sinuous, single thread segments, but some segments of the active channel and floodplain contain numerous active gravel bars, secondary channels, and islands, so that the overall planform of the Middle Fork Willamette River in the study area is similar to a “wandering gravel-bed river” (Church, 1983).
Like the Willamette River and other major gravel-bed rivers of the Willamette Valley, the river channels and floodplains of both Fall Creek and Middle Fork Willamette River have fundamentally changed since Euro-Americans first settled in the Willamette Valley in the mid-19th century (for example, Sedell and Froggatt, 1984; Dykaar, 2005, 2008; Gregory and others, 2002a, 201954; Wallick and others, 2007, 2013159; Keith and others, 2023a). Flood control, bank stabilization, large-wood removal, conversion of riparian forests to agriculture, and other large-scale alterations have substantially changed the basin’s streamflow, sediment, and large-wood regimes, resulting in narrower floodplain corridors and less complex assemblage of landforms in present-day floodplains compared with conditions in the mid-19th century (Wallick and others, 2013; Keith and others, 2023a). The underlying geology and bank stabilization structures constructed by USACE and local partners in the mid-20th century (Gregory and others, 2002b) both affect bank erodibility and resulting patterns of bank erosion, sediment exchange between the channel and floodplain, and overall channel morphology on Fall Creek and Middle Fork Willamette River (Wallick and others, 2006, 2013; Keith and others, 2023a; fig. A6). Prior to dam construction, a 10.5 km-reach on the Middle Fork Willamette River below Dexter Dam evolved through the development of large meander loops as islands coalesced, avulsions that created and abandoned channels, and rapid gravel bar growth in newly created channels (Dykaar, 2005, 2008); by 2004, river channel length and avulsions had decreased, exposed gravel patches have been reduced by 70 percent, and island area decreased by 57 percent (Dykaar, 2005, 2008).
Dividing the study area into reaches (fig. A6; table A1) provides a framework for systematically evaluating the geomorphology of the river corridors and their responses to sediment releases from the Fall Creek streambed drawdowns. The study area is divided into seven reaches based on channel morphology, slope, and location of major tributaries (fig. A6; table A1).
Fall Creek
Fall Creek Lake (fig. A8A) encompasses the 10-km-long reservoir reach upstream from Fall Creek Dam inundated at maximum pool (elevation 830 ft). The main channels of the reservoir flow over variable substrate including bedrock, gravel, and finer materials. The average water-surface slope for the Fall Creek channel through the reservoir from WY 2012 lidar (Watershed Sciences, Inc., 2012; topographic lidar collected during full streambed drawdown) is about 0.0038, with the sections above and below minimum conservation pool elevation being 0.0044 and 0.0030, respectively. Even steeper is the Winberry Creek arm below minimum conservation pool at 0.0063.
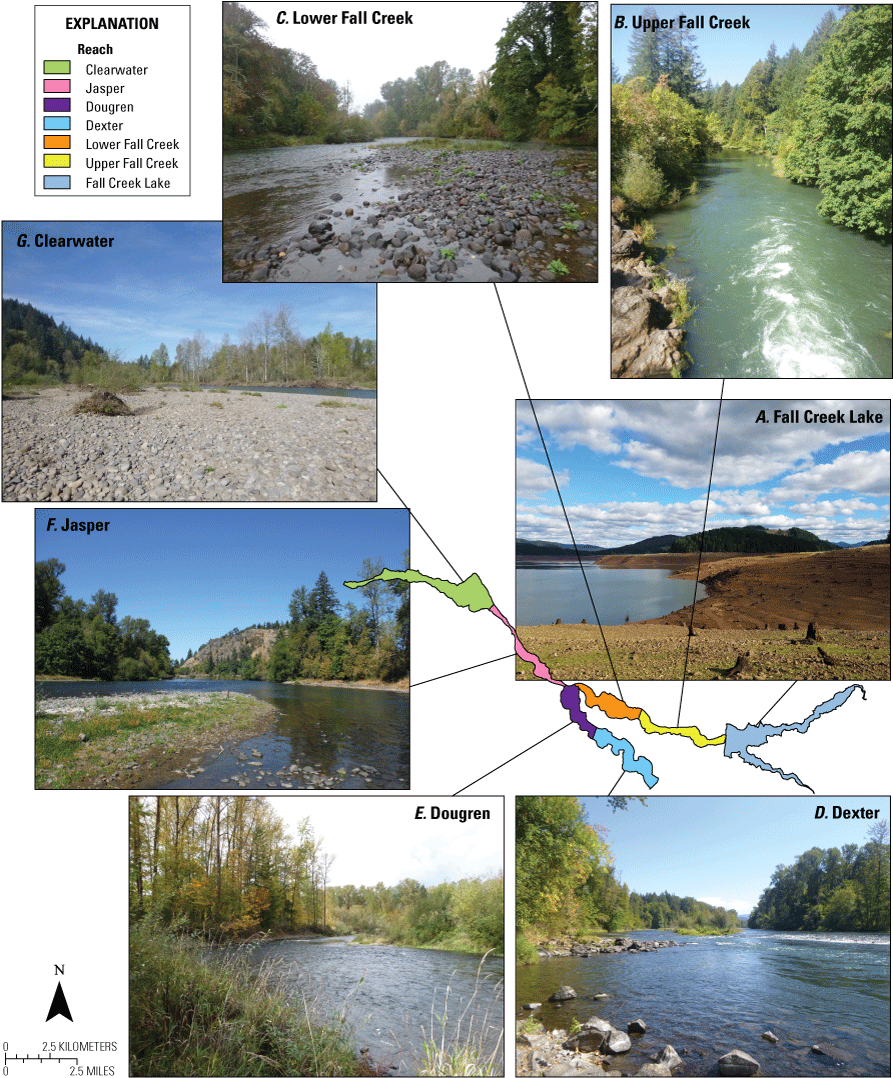
Photographs showing characteristics of the study reaches for Fall Creek and Middle Fork Willamette River, Oregon. Fall Creek Lake taken from Winberry State Recreation Site, facing upstream, November 1, 2016 (A). Upper Fall Creek reach, Fall Creek at rkm 10.9, facing downstream from the Big Fall Creek Road bridge, September 15, 2016 (B). Lower Fall Creek reach, Fall Creek downstream from the confluence with Little Fall Creek near rkm 4.9, facing downstream, October 19, 2015 (C). Dexter reach, Middle Fork Willamette River near rkm 21.8, facing upstream, September 15, 2016 (D). Dougren reach, Middle Fork Willamette River near rkm 19.7, facing downstream, October 28, 2015 (E). Jasper reach, Middle Fork Willamette River near rkm 15.4, facing downstream, September 14, 2016 (F). Clearwater reach, Middle Fork Willamette River near rkm 5.8, facing downstream, March 31, 2016 (G). Photographs taken by Mackenzie Keith, U.S. Geological Survey.
Upper Fall Creek (fig. A8B) is a mixed-bed reach with bedrock and coarse alluvium and encompasses 5.9 km of Fall Creek between base of Fall Creek Dam to the confluence of Little Fall Creek. The reach was historically, laterally stable, likely due to local bedrock controls, relatively smaller basin, and low sediment supply (O’Connor and others, 2014; Keith and others, 2023a). Reductions in peak streamflows and sediment supply since upstream dam construction have resulted in less pronounced geomorphic transformation in this reach (related to the historical stability) relative to other study reaches (Keith and others, 2023a). Presently (during the period of this study), Fall Creek streamflows on sections of bedrock and alluvium. Volcanic and volcaniclastic rocks bound the channel at river kilometer (rkm) 10.5–10.4. A series of steep and flat sections are likely controlled by bedrock occurrence but overall, this is the second steepest (0.0029) and least sinuous (1.08) reach within the study area. The average primary active channel width is about 37 m, although it ranges from about 20 to 180 m.
Lower Fall Creek (fig. A8C) is an alluvial reach with sections flowing on bedrock and includes the lowermost 5.6 km of Fall Creek from the confluence with Little Fall Creek to mouth of Fall Creek. Like Upper Fall Creek reach, the Lower Fall Creek reach primarily was historically stable (Keith and others, 2023a); however, additional sediment supply and streamflow from Little Fall Creek likely supports the presence of the gravel bars in this reach. The channel bed in this reach is composed of sections of bedrock and alluvium. Volcanic and volcaniclastic rocks provide lateral control the channel at rkm 2.6–2.4 and 1.1–0.0. This reach has a similar gradient (0.0026) to the Dexter reach and the greatest sinuosity (1.36) in the study area. Primary active channel widths are similar to that in the Upper Fall Creek reach (average of 40 m; range from about 20 to 125 m).
Middle Fork Willamette River
Dexter reach (fig. A8D) is a multi-thread alluvial reach with large floodplain islands and encompasses 5.9 km of the Middle Fork Willamette River from the base of Dexter Dam to the confluence with Lost Creek. The Dexter reach was a historically laterally dynamic section of the Middle Fork Willamette River with expansive and actively shifting unvegetated gravel bars (Dykaar, 2005, 2008; Keith and others, 2023a). Compared with Fall Creek, the Dexter reach has a much larger drainage area, sediment supply, and valley width that have contributed to the morphology of this multi-thread, alluvial section of the Middle Fork Willamette River and enabled lateral migration throughout the Holocene floodplain (Wallick and others, 2013). Portions of the left side of the channel along Elijah Bristow State Park are comprised of levees. The Middle Fork Willamette River is confined by Pleistocene terrace gravels near rkm 25.6–25.2, 23.6–23.2, and 22.0–21.6 on the right side of the river. This reach has a similar gradient (0.0026) to the Lower Fall Creek reach and has a similar sinuosity (1.14) to the Dougren and Jasper reaches. The average primary active channel width is about 70 m, although it ranges from about 30 to 110 m.
Dougren reach (fig. A8E) is also a multi-thread alluvial reach with floodplain islands and includes 3.6 km of the Middle Fork Willamette River from the confluence of Lost Creek to mouth of Fall Creek. In the Dougren reach, conditions have changed from historically dynamic to presently (during the period of this study) stable (Dykaar, 2005, 2008; Keith and others, 2023a). Like the Dexter reach, low elevation floodplains with mature woody vegetation bound most of the main channel, and while limited in frequency, some small (less than 3,000 m2) unvegetated gravel bars are present. Mapped revetments limiting lateral migration and preventing access to floodplain sediment sources are present from approximately floodplain kilometer (fpkm) 17.3 to 16.3 and 16.5 to 15.5 and have been in place since 1958 (Institute for a Sustainable Environment Lab, 2017). The Dougren reach is the steepest reach in the study area (0.0032) and has a similar sinuosity (1.11) to the Dexter and Jasper reaches.
Jasper reach (fig. A8F) consists of a dominantly alluvial, single-thread channel with a few large side channels and includes 7.2 km of the Middle Fork Willamette River from the mouth of Fall Creek to rkm 10.7 where there is a change in channel and valley morphology. Most of the Jasper reach appears to have been laterally stable since before upstream dams were constructed; although, there has been a clear reduction in unvegetated gravel bar area since the implementation of dams (Keith and others, 2023a). Much of the reach (rkm 15.4–10.7) is constrained on right bank by Western Cascades tuff and volcanic rocks and Quaternary terrace gravels. While this reach is dominantly alluvial, there are segments that locally flow on bedrock, most apparently just downstream from the railroad bridge and near the town of Jasper. This reach is slightly steeper than the Clearwater reach (0.0020 versus 0.0019, respectively) and has a similar sinuosity (1.13) to the Dexter and Dougren reaches.
Clearwater reach (fig. A8A) is a fully alluvial, sinuous reach with active gravel bars encompassing the lowermost 10.7 km of Middle Fork Willamette River where the river and valley widen and flows to the Coast Fork Willamette River confluence. Historically, most of this reach was laterally dynamic except in a few locations where local narrow valley width and bedrock control would have limited channel change. On the left bank between rkm 5.6 and 3.9 and from rkm 2.2 to 1.5 along the right bank, the channel is bound primarily by basalt. Mapped revetments located between fpkm 8.5 and 5.0 were emplaced between 1948 and 1954 (Institute for a Sustainable Environment Lab, 2017) and mostly limit lateral migration into Quaternary fan delta deposits that are outside the Holocene floodplain. Historical reductions in peak streamflows and sediment supply, as well as other channel modifications, have resulted in vegetation encroachment and increased lateral stability (Keith and others, 2023a). The Clearwater reach has the lowest gradient (0.0019) of reaches within this study and the most sinuous (1.21) of those along the Middle Fork Willamette River. The downstream end of this reach terminates at the confluence with the Coast Fork Willamette River and head of the main Willamette River.
Table A1.
Geomorphic study reaches for Fall Creek and the Middle Fork Willamette River, Oregon.[Drainage area at downstream end, in km2: Drainage areas derived from StreamStats (U.S. Geological Survey [USGS], 2018b). Water surface gradient: Gradient and average floodplain widths based on 2015 light detection and ranging (lidar) topography (Quantum Spatial, 2016). Gradient through Fall Creek Lake based on 2012 lidar topography (Watershed Sciences, Inc., 2012). Sinuosity: Sinuosity based on 2016 aerial photography (National Agriculture Imagery Program, 2016) wetted-channel centerline and 2015 lidar (Quantum Spatial, 2016) floodplain centerline. Average primary active channel width, in m: Based on total primary active channel domain mapped from 2016 aerial photography (National Agriculture Imagery Program, 2016). Average floodplain width, in m: Gradient and average floodplain widths based on 2015 lidar (Quantum Spatial, 2016) topography. Floodplain widths determined from the floodplain monitoring corridor delineated by Wallick and others (2018) and are not representative of the full historical floodplain. Abbreviations: rkm, river kilometer; km, kilometer; fpkm, floodplain kilometer; km2, square kilometers; m, meters; NA, not applicable or not measured; lidar, light detection and ranging]
Geology and Sediment Supply
The Fall Creek Basin is almost entirely underlain by the steeply dissected, less permeable Tertiary volcanic rocks of the Western Cascades (Tague and Grant, 2004; fig. A5); in contrast, the Middle Fork Willamette River Basin also drains Western Cascades (66 percent), and there is also a substantial contributing area (20 percent) underlain by highly permeable Pliocene and Quaternary lava flows of the High Cascades (Tague and Grant, 2004; fig. A5). Within the Western Cascades, Eocene to Miocene volcanic and volcaniclastic rocks of the Little Butte Volcanics are dominant (Peck and others, 1964; Sherrod, 1991; Smith and Roe, 2015). The Holocene floodplains of Fall Creek and Middle Fork Willamette River downstream from the Fall Creek Lake and Dexter Reservoir (respectively), are bordered by Pliocene to Pleistocene terrace gravels, upper Pleistocene Missoula Flood deposits, and Western Cascades volcanic rocks (O’Connor and others, 2001).
The geology and steep terrain underlying the Western Cascades historically supported high rates of bed-material sediment entering the river corridors of the study area. Landslides (Lyons and Beschta, 1983) and forest fires (U.S. Forest Service [USFS], 1995) influence sediment supply to Middle Fork Willamette River and Fall Creek. Processes that may have influenced sediment supply to Fall Creek Lake include clearcutting that began in the 1940s and peaked in the 1960s (USFS, 1995) and forest fires (Rakestraw and Rakestraw, 1991; USFS, 1995; USGS, 2018a). However, dams prevent much of this sediment from reaching the lower river corridors of the study area (O’Connor and others, 2014). A regional model for bed-material loads in Western Oregon provides estimates of 23,000 t/year of coarse sediment input to Fall Creek Lake and 82,000 t/year coarse sediment to the Lookout Point Lake and Dexter Reservoir and assumes a 0.69 coefficient of variation determined from Monte Carlo assessment that approximates the standard error (O’Connor and others, 2014; O’Connor and others, 2021). Similarly, regional models of suspended-sediment loads representative of WY 2012 conditions suggest about 1,300 t (standard error of 1,700 t) of fine sediment is entering the Fall Creek annually from Fall and Winberry Creeks, and that 62,000 t (standard error of 31,000 t) of fine sediment from the Middle Fork Willamette River (excluding reservoir tributaries) is entering Lookout Point Lake (Wise, 2018; O’Connor and others, 2021). Since construction in the mid-20th century, USACE dams in the Middle Fork Willamette River Basin (Hills Creek, Lookout Point, Dexter, and Fall Creek Dams; fig. A5) trap nearly all coarse sediment entering the lower reaches of Fall Creek and Middle Fork Willamette River and reduce the amount of fine-grained sediment transport. Reduction in the amount of bedload due to dams is about 95 percent at the mouth of Fall Creek and about 94 percent near the mouth of the Middle Fork Willamette River (O’Connor and others, 2014). Sediment trapping efficiency for fine-grained sediment at Fall Creek Lake calculated from measurements 1 month prior to the WY 2013 drawdown is about 46 percent (updated estimate from Schenk and Bragg, 2014, based on corrected sediment inflows to the reservoir).
Hydrology and Streamflow Regulation by Dams
Major tributaries within the study area (fig. A6) include Winberry Creek (rkm 12.6), which joins Fall Creek just upstream from Fall Creek Dam and forms the primary southern arm within Fall Creek Lake, and Little Fall Creek (rkm 5.7). Lost, Rattlesnake, Hills, Wallace, and Pudding Creeks all enter the Middle Fork Willamette River between rkm 21.4 and 5.5. Additionally, since 1852, the Mill Race (fig. A6) diverted streamflow from the Middle Fork Willamette River near Clearwater Park (rkm 6.3) to the city of Springfield for grist and lumber mills. Restoration efforts on the Mill Race have been completed, and hydraulic modeling used 300 ft3/s as a “normal” streamflow condition for the Mill Race (Schall, 2017). Other minor withdrawals from Fall Creek and Middle Fork Willamette River for irrigation and other purposes were not quantified for this study.
Three USGS streamflow-gaging stations within the study area (table A2; figs. A5, A6) have recorded streamflow since WY 1936 on Fall Creek (14151000; rkm 10.1; herein referred to as Fall Creek streamgage) since WY 1947 near Dexter on the Middle Fork Willamette River (14150000; rkm 22.5; herein referred to as Dexter streamgage) and since WY 1906 at Jasper (14152000; rkm 13.1; herein referred to as Jasper streamgage) on the Middle Fork Willamette River (table A2; figs. A5, A6; USGS, 2021). Other streamgages referenced for this study are summarized in table A2.
Table A2.
U.S. Geological Survey streamgages within the Fall Creek sub-basin and lower Middle Fork Willamette River Basin downstream from Dexter Dam.[Period of record: Calendar year. Current references time of report publication. Period of record range includes missing data. Peak discharge data were not available for 14150290. Post-regulation peak discharge: Between 1953 when Lookout-Dexter became operational, and 1966 when Fall Creek became operational (1953–1966), peak flows at the Jasper streamgage ranged from 16,300 to 43,500 ft3/s. Abbreviations: OR, Oregon; km2, square kilometers; ft3/s, cubic feet per second; NA, not applicable or not measured; Jan., January; Nov., November; Dec., December]
The USACE operates three major multi-purpose reservoirs and one re-regulating reservoir within the Middle Fork Willamette River Basin (figs. A5, A6) that have altered streamflow to downstream river reaches since 1953. Lookout Point Dam (84 m-tall), Hills Creek Dam (93 m-tall), and Fall Creek Dam (55 m-tall) operate primarily as flood-control reservoirs that capture high streamflows during winter months, reducing peak streamflows for downstream communities, then release stored water during spring and summer months to support other authorized purposes. As a result of dam operations, summer streamflows are typically higher than they were in pre-dam periods (Gregory and others, 2007). Dexter Dam (35.7 m-tall) re-regulates power-generating water releases from Lookout Point Dam. Each dam is also operated to meet multiple seasonally varying streamflow objectives described in the 2008 Biological Opinion (BiOp) for the WVP (NMFS, 2008). Typical mean daily streamflows (fig. A9; since WY 2008 following implementation of the BiOp) vary from 1,200 to 8,000 ft3/s at the Dexter streamgage on the Middle Fork Willamette River, though greater streamflows regularly occur in the winter and spring months. Since dam construction, baseflows at the Fall Creek streamgage during July and August are typically 50–300 ft3/s, but short-term operational releases have exceeded 3,000 ft3/s since WY 2008. In the autumn and winter months from October to March, Fall Creek daily streamflows are typically greater than 500 ft3/s with peak streamflows from 2,000 to 4,000 ft3/s, and a maximum peak streamflow of 5,820 ft3/s (April 10, 2019; USGS, 2021).
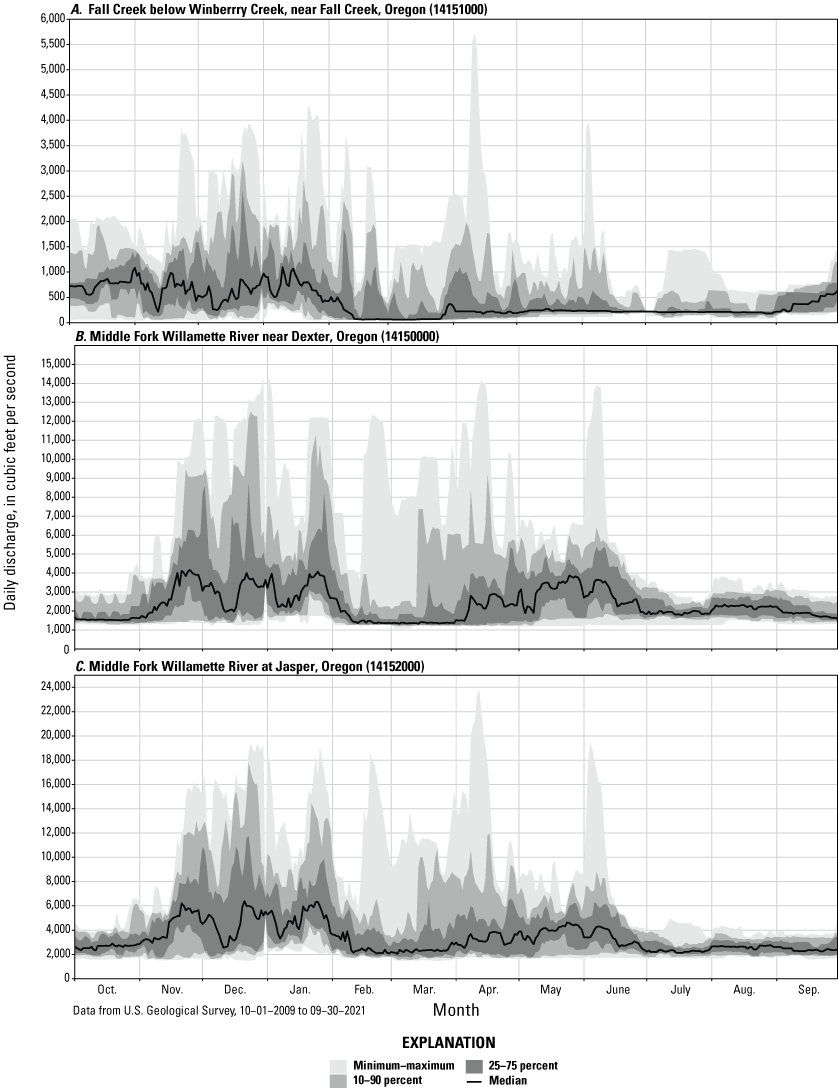
Minimum and maximum, 10–90 percentile, 25–75 percentile, and median streamflow statistics for water years 2009–2021 for Fall Creek below Winberry 14151000 (A); Middle Fork Willamette River near Dexter 14150000 (B); and Middle Fork Willamette River at Jasper 14152000 (C).
The river corridors downstream from Dexter and Fall Creek Dams have had substantial reductions in peak streamflows since the dams became fully operational in the mid-19th century. Prior to the construction of Fall Creek Dam in 1965, the 0.5 annual exceedance probability flood (often referred to as the 2-year recurrence interval) at the Fall Creek streamgage was about 10,300 ft3/s and the peak of record was 24,700 ft3/s (WY 1957; table A2; fig. A10). Since dam construction, flows at the streamgage had not exceeded 5,000 ft3/s during dam operations until the WY 2019 peak-flow event. At the Dexter streamgage on the Middle Fork Willamette River, the peak of record prior to streamflow regulation is 62,200 ft3/s (WY 1953; table A2; fig. A10), and the peak streamflow for the regulated period (beginning in 1961 after Hills Creek, Lookout Point, and Dexter Dams were fully operational) is 29,500 ft3/s (WY 1965; table A2; fig. A10). Farther downstream at the Jasper streamgage, where peak streamflows have been regulated by all four dams since 1965 (WY 1966), pre- and post-flow regulation period maximum annual peak streamflows were 94,000 ft3/s (WY 1910) and 24,400 ft3/s (WY 2019), respectively (table A2; fig. A10). Gregory and others (2007) calculated a 50 percent reduction in the 0.5 annual exceedance probability streamflow for the Middle Fork Willamette River at the Jasper streamgage.
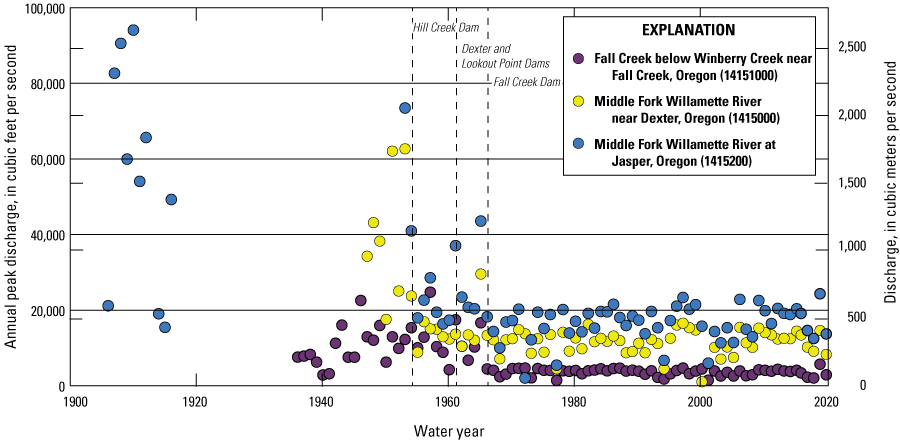
Annual peak streamflow for U.S. Geological Survey streamgages on (A) Fall Creek below Winberry Creek, Oregon (14151000), (B) Middle Fork Willamette River near Dexter, Oregon (14150000), and (C) Middle Fork Willamette River at Jasper, Oregon (14152000).
In addition to the streambed drawdown operation, dams in the Middle Fork Willamette River and Fall Creek Basins are managed to support a variety of other biological objectives for recovery of spring Chinook salmon, including streamflows on the main-stem Willamette River that may benefit winter steelhead (NMFS, 2008). The 2008 BiOp was a primary driver of streamflows in spring and summer during this study, but other environmental streamflow programs were in effect in the Willamette River Basin. In 2002, The Nature Conservancy (TNC) and USACE created the Sustainable Rivers Project (SRP) to identify and implement streamflows at dams that would be ecologically beneficial for downstream aquatic species and riparian vegetation communities while continuing to meet congressionally authorized purposes at those dams (Warner and others, 2014). For the Middle Fork Willamette River, “The ecological goals include re-establishment of physical processes creating and connecting in-channel and off-channel habitats, recruitment of cottonwood on floodplains, promoting salmon migration, and mitigating thermal impacts of the dam releases” (Konrad, 2010). Streamflow recommendations and targets were developed to align with those ecological goals (Gregory and others, 2007). Implementation of SRP streamflow recommendations at Lookout Point and Dexter Dams on the Middle Fork Willamette River began in 2015 and have been evaluated by Jones and others (2016) and White and others (2023). Comparison of measured streamflows (2008–2022) to SRP target streamflows reveals that small autumn and spring pulse events were met in most years, whereas baseflows were exceeded every year, and winter bankfull and flood events were not achieved (White and others, 2023).
Dam Infrastructure and Streambed Drawdown Operations at Fall Creek Dam
Characteristics of the Fall Creek Dam infrastructure and operations are pertinent to understanding geomorphic evolution of the reservoir and downstream reaches in response to annual streambed drawdowns. Fall Creek Dam is a rock fill dam with concrete spillway and three sets of three nested fish horns at different elevations that pass water and fish downstream (fig. A7; U.S. Army Corps of Engineers [USACE], 2015; Hansen and others, 2017). Unique to this infrastructure are two regulating outlets (1.7 m wide by 3.0 m high) at the base of the dam. The 55-m-high, 1,554-m-long dam is operated primarily for flood risk management, and secondarily for water quality, irrigation, recreation, and habitat, and has a storage capacity of 115,000 acre-feet (USACE, 2018). Flood-control season lasts from November to March where pool levels are typically held elevations of 728 ft, whereas conservation season from April to November is restricted to a maximum elevation of 830 ft (USACE, 2018; fig. A11). More typically, pool levels are about 758 ft from November to January and near maximum pool levels of 830 ft from May to August (Hansen and others, 2017).
![Reservoir rule curve (operational target for the lake water-surface elevation, in
feet [ft]) for Fall Creek Lake, Oregon.](https://pubs.usgs.gov/sir/2023/5135/images/sir20235135_figA.11.png)
Reservoir rule curve (operational target for the lake water-surface elevation, in feet [ft]) for Fall Creek Lake, Oregon.
During the streambed drawdowns, Fall Creek essentially becomes a free-flowing river through the lower regulating outlet. Draining of the reservoir for short periods to support downstream fish passage through the regulating outlets was assessed for multiple years (Smith and Korn, 1970; Downey and Smith, 1992) prior to implementation of annual streambed drawdowns that began in WY 2012. In 2008, the Biological Opinion (BiOp) for the USACE’s WVP mandated a series of improvements to address fish passage and other adverse effects of the dams (NMFS, 2008). The BiOp identified Reasonable and Prudent Actions (RPAs) for Fall Creek Dam to improve the downstream passage and survival of juvenile spring Chinook salmon including drawing down lake levels to at least 714 ft elevation (NGVD 1929) or lower (fig. A7) and building a new adult fish collection facility downstream from the dam (NMFS, 2008). In 2011 (during WY 2012), the USACE began annual implementation of a full streambed drawdowns, lowering the reservoir pool elevations to 680 ft, resulting in successful downstream fish passage and survival (Nesbit and others, 2014; Northwest Fisheries Science Center, 2015; Hansen and others, 2017). Nesbit and others (2014) assessed fish passage during the WY 2013 drawdown, finding 95 percent of juvenile spring Chinook salmon migrated out of the reservoir between elevations 720 and 700 ft. Evaluation of fish capture data from the rotary screw trap downstream from the Fall Creek Dam, suggest that drawing down the lake fully to streambed also helped to expel warm-water, invasive species, which predate upon and compete with native species in the lake (Murphy and others, 2019c). By 2015, streambed drawdowns became part of the standard operations (G. Taylor, USACE, written commun., October 2021).
Pool levels at Fall Creek Lake have been lowered to elevations near streambed multiple times since dam construction (fig. A12). Between the late 1960s and 1990s, Fall Creek Lake has been lowered well below minimum conservation pool (728 ft) to an elevation 700 ft (or lower) nearly 40 times. After a pause in drawdowns during WY 2000–11, annual streambed drawdowns were resumed in WY 2012 under the 2008 BiOp (fig. A12). As evident from Fall Creek Lake level records (USGS streamgage 14150900, Fall Creek Lake near Lowell, Oregon; USACE, 2017; fig. A12), some of these drawdown operation resulted in pool elevations that reached streambed (680 ft; WY 1969–75, 1977, 1982) or were within about 3 m (10 ft) of streambed (690 ft; WY 1976, 1978–80, 1983–84, 1990, 1992)—an elevation below which recent drawdown activities have been observed to mobilize large amounts of sediment (Gregory Taylor, USACE, oral commun., November 2015). The streambed drawdowns evaluated in this study (WY 2012–18) occurred in late autumn or early winter and typically lasted 1–2 weeks. However, in 2021 (after this study was completed), streambed drawdown operations were modified in response to a court injunction that directed USACE to improve conditions for fish passage and water quality to better support spring Chinook salmon and winter steelhead trout (U.S. District Court for the District of Oregon, 2021). As a result, the streambed drawdown operations for WY 2022–24 were extended nearly 6 weeks from December 1 to January 15, and were followed by period of delayed refill with exceptions for flood risk management actions.
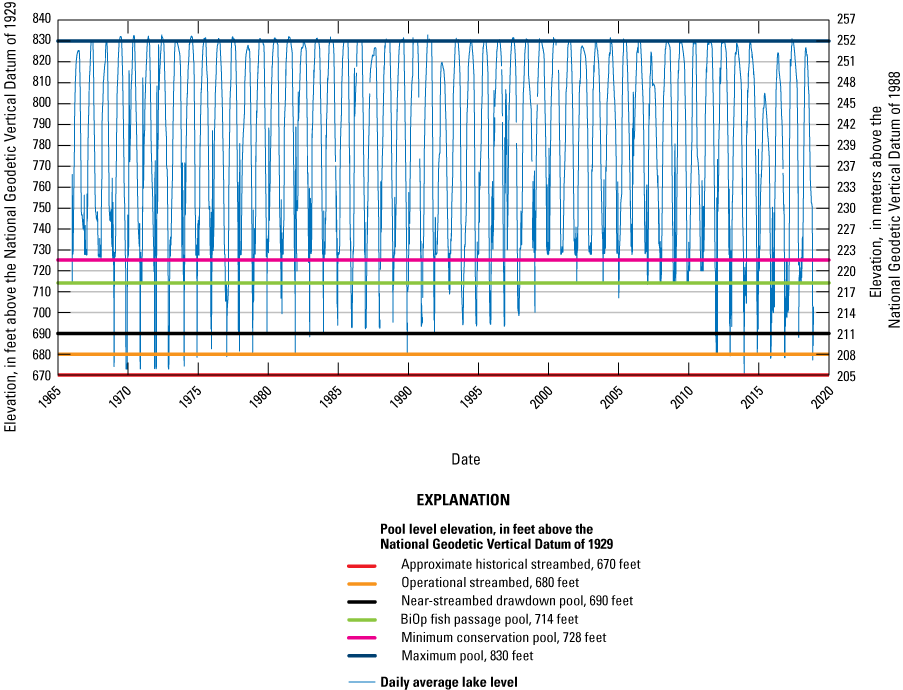
Historical pool elevations, in feet (ft), at Fall Creek Lake, Oregon (14150900 Fall Creek Lake near Lowell, Oregon, and U. S. Army Corps of Engineers data), from 1966 to 2018 annotated with key operational pool levels.
Chapter B. Reservoir Morphology and Evolution Related to Dam Operations at Fall Creek Lake
During streambed drawdowns at Fall Creek Lake (figs. A7, B1), reservoir sediment is eroded and transported to downstream reaches (Schenk and Bragg, 2014, 2021) where it can influence channel morphology and aquatic habitats. Sediment studies following dam removal (for example, Major and others, 2012; Wilcox and others, 2014; East and others, 2015) are useful for anticipating reservoir evolution and downstream responses to streambed drawdowns. The magnitude, timing, and character of sediment released influences deposition and erosion processes in downstream reaches. Therefore, understanding sedimentation and erosion processes within Fall Creek Lake under continued drawdown or other operational regimes is critical to understand downstream geomorphic responses and future change trajectories affecting aquatic habitats, flood-control management, and other river and floodplain issues.
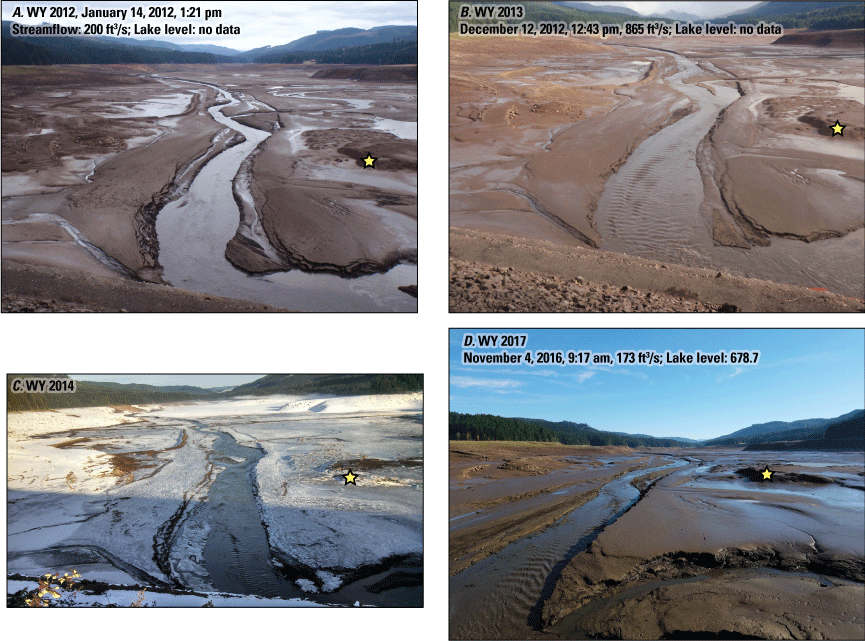
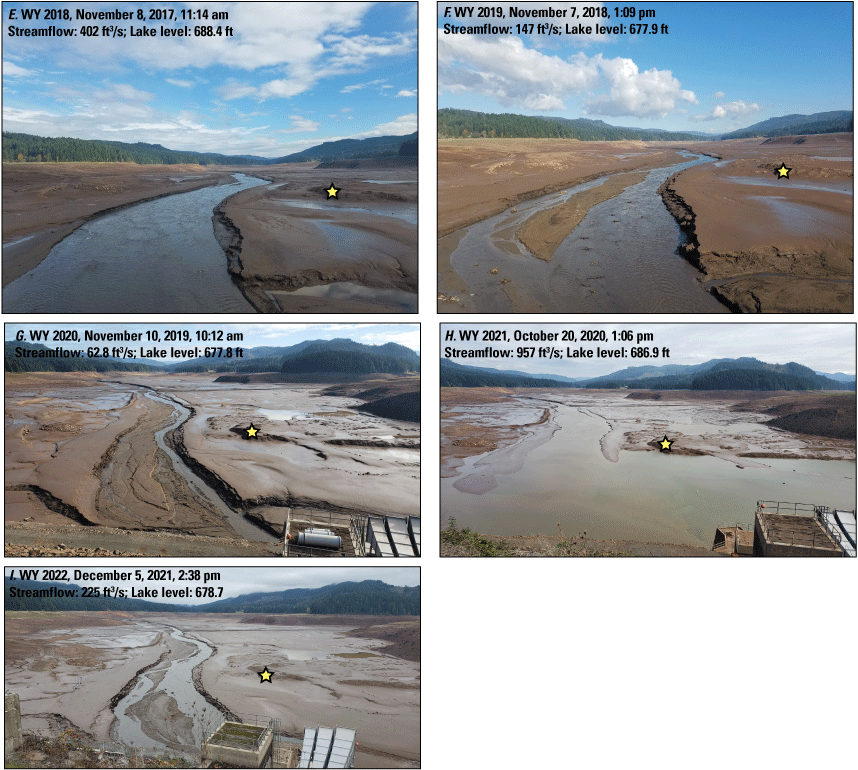
Repeat photographs facing upstream into the reservoir (Fall Creek Lake) from Fall Creek Dam, Oregon, during streambed drawdowns. Star symbols placed to similar location in all photographs. Discharge during photograph acquisition is provided in cubic feet per second (ft3/s) and taken from U.S. Geological Survey streamflow-gaging station 14151000 Fall Creek below Winberry Creek near Fall Creek, Oregon. Lake elevation during photograph acquisition is provided in feet (ft) above the National Geodetic Vertical Datum (NGVD) 1929 from and taken from U.S. Geological Survey lake level station 14150900, Fall Creek Lake near Lowell, Oregon. Water year (WY) 2012 taken by Gregory Taylor, U.S., Army Corps of Engineers (USACE), January 14, 2012 (A); WY 2013 taken by Gregory Taylor, USACE, December 12, 2012 (B); WY 2014 taken by Liam Schenk, U.S. Geological Survey (USGS), between December 8 and 17, 2013 (C); WY 2017 taken by Mackenzie Keith, USGS, November 4, 2016 (D); WY 2018 taken by Mackenzie Keith, USGS, November 8, 2017 (E); WY 2019 taken by Mackenzie Keith, USGS November 7, 2018 (F); WY 2020 taken by J. Rose Wallick, USGS, November 12, 2019 (G); WY 2021 taken by J. Rose Wallick, USGS, October 20, 2020 (H); WY 2022 taken by J. Rose Wallick, USGS, December 7, 2021 (I).
This chapter describes several analytical approaches to develop qualitative and quantitative understanding of reservoir sedimentation and erosion processes within Fall Creek Lake. To understand the volume and distribution of sediment accumulation in Fall Creek Lake since the dam closure in 1965, decadal-scale sedimentation patterns are evaluated using a combination of storage curve (the relation between reservoir storage capacity and lake elevation) analyses and geomorphic mapping. Short-term (drawdown event-scale) patterns of erosion, sedimentation, and sediment export downstream are evaluated using a combination of geomorphic mapping and change detection analyses that quantify the distribution and total volume of sediment erosion and deposition within Fall Creek Lake. Analyses at these two timescale analyses provide an understanding of the river and reservoir bed morphology, sedimentation, erosion processes, and change trajectories in Fall Creek Lake that inform the sediment transport patterns (“Chapter C. Sediment Delivery from Fall Creek Lake and Transport through Downstream Reaches”) and downstream geomorphic responses (“Chapter D. Geomorphic Responses to Fall Creek Lake Streambed Drawdowns Downstream from Fall Creek Dam”) related to streambed drawdowns.
Datasets and Methods
Geomorphic analyses of long-term and drawdown-influenced sedimentation and erosion processes in Fall Creek Lake relied on historical topographic maps and surveys, historical and recent storage curves, recently acquired light detection and ranging (lidar), and aerial photographs and elevation data collected for this study. Datasets and methods are summarized in this chapter; previous publications document detailed methods for the data acquisition and processing (Keith and Mangano, 2020) and for geomorphic mapping (app. 2; Keith and Stratton Garvin, 2021) completed for this study. A complete list of datasets is provided in appendix 1.
Historical Data Analysis: Storage Curves, Maps, and Channel Surveys
Several historical datasets were evaluated to estimate sediment volume and distribution in Fall Creek Lake. Historical (pre-dam) morphology, land cover, land use, geology, and channel substrate within the footprint of Fall Creek Lake was evaluated from historical maps (USGS, 1942, 1955a, b; USACE, 1947, 1966), aerial photographs (1936), and habitat surveys (1938; McIntosh and others, 2009). Long-term spatial and temporal patterns of sediment deposition in Fall Creek Lake were mainly determined from reservoir storage curves (relation between reservoir storage capacity and lake elevation) augmented with information from historical surveys. Comparison of reservoir storage curves of Fall Creek Lake from 1988 and 2012 as well as a partial storage curve from 1965 (for elevations above 710 ft NGVD29; provided by Jacob Macdonald, U.S. Army Corps of Engineers, written commun., July 6, 2016) provides estimates of total storage loss and changes in the storage-elevation profile of the reservoir over time. Historical survey data, maps, and cross-sections of reservoir topography were also reviewed (U.S. Army Corps of Engineers [USACE], 1966; Jacob Macdonald, U.S. Army Corps of Engineers, written commun., January 29, 2019; app. 1) to provide rough estimates of reservoir sediment thickness and distribution.
Aerial Photograph Acquisition and Digital Surface Model Development
DSMs and orthophotographs of the empty Fall Creek Lake (fig. B2) created with structure-from-motion techniques (SfM; for example, Micheletti and others, 2015) serve as base layers for reservoir geomorphic mapping. Methods for aerial photograph collection, processing, and resulting datasets are summarized here, with more complete descriptions provided within the metadata for each dataset (Keith and Mangano, 2020). Prior to photograph acquisition, 40 ground-control targets were placed throughout Fall Creek Lake and surveyed with real-time kinematic global positioning system (RTK-GPS with reported horizontal and vertical precision ranging from 0.01 to 0.05 m; fig. B3) to project photogrammetry models into real world coordinates (fig. B2). Aerial photography was collected by unoccupied aerial systems (UAS) on November 8 and November 9, 2016 (Sony ILCE-5100; 6,000 by 4,000 pixel resolution), and from a Cessna aircraft with a wing-mounted digital camera (Ricoh GRII; 4,982 by 3,264 pixel resolution) on November 10, 2016, similar to the methods used by Randle and others (2015) and Anderson and others (2017). Agisoft Photoscan Professional (version 1.4) software was used to generate models of dense point clouds, DSMs, and orthophotographs for each day of acquired photographs. The models resulted in ground resolutions of 4.18 cm/pixel or smaller (table B3). Average point densities for each model ranged from of 58.2 to 76.6 points/m2 (table B1).
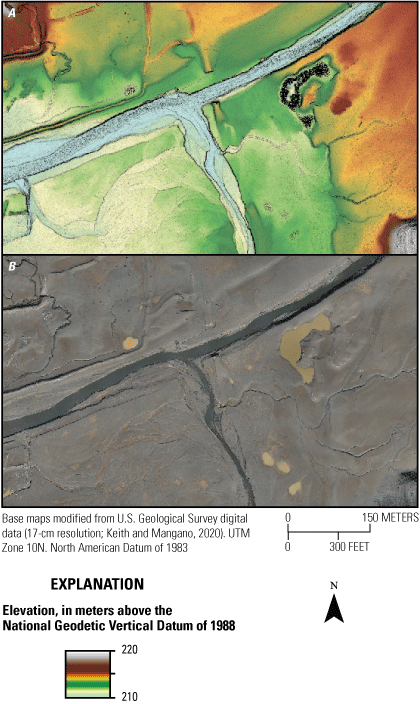
Examples of structure-from-motion datasets created from aerial photographs acquired during streambed drawdown at Fall Creek, Oregon, on November 10, 2016, including digital surface model (A) and orthophotograph (B; Keith and Mangano, 2020).
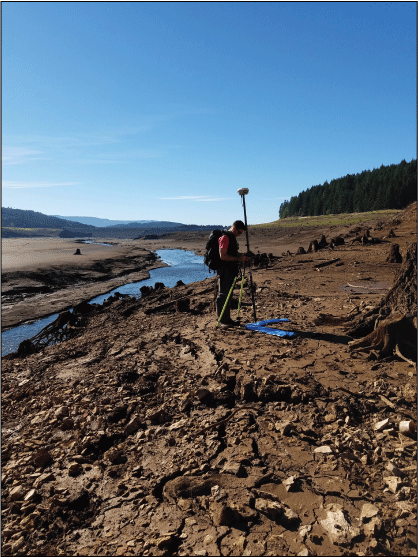
Surveyor recording ground-control target location with real-time kinematic global positioning system (RTK-GPS) in Fall Creek Lake during streambed drawdown condition. Photograph looking downstream toward Fall Creek Dam. Photograph by Mackenzie Keith, U.S. Geological Survey, taken November 8, 2016.
Table B4.
Structure-from-motion model sources, resolutions, and uncertainties from aerial photography acquired during the November 2016 streambed drawdown at Fall Creek Lake, Oregon.[Date: month/day/year. Method: UAS acquisition collected by Frontier Precision, Inc., Boise, Idaho. OAS acquisition collected by Brown-Western Aviation, Independence, Oregon. Abbreviations: UAS, unoccupied aerial systems; OAS, occupied aerial systems; m, meters; km2, square kilometers; cm, centimeter; pix, pixel; points/m2, points per square meter; xy error, horizontal error; z error, vertical error]
Reservoir Geomorphic Mapping Methods
Detailed geomorphic mapping of WY 2017 reservoir landforms and substrate (general description provided in table B1 and more fully described in appendix 2 and Keith and Stratton Garvin, 2021) provides a basis for evaluating geomorphic processes and patterns of sediment transfer within Fall Creek Lake and to quantify short-term changes from WY 2012 to 2017 streambed drawdown operations. The mapping framework has three main components: process domains (3), landforms (17), and substrate classification (7). The over-arching classification structure is tied to the process domains, which correspond to regions of the reservoir that have distinct landforms and broadly similar suites of geomorphic processes (table B2; app. 2). Mapped landforms and substrate character provided information about (1) sediment regime and processes that formed the landform, (2) general context for the categories of sediment sizes particles being mobilized during drawdown processes, and (3) susceptibility to erosion and re-distribution in future drawdowns (table B3; app. 2).
Table B2.
Process domain, landform, and substrate units for 2016 Fall Creek Lake, Oregon, mapping (modified from Keith and Stratton Garvin, 2021).| Mapping unit | Description |
|---|---|
| Main channel | Consists of landforms that actively convey streamflow during full streambed drawdown for Fall Creek and Winberry Creek; at higher pool levels, it may also be referred to as the reservoir thalweg |
| Reservoir hillslope | Encompasses the typically steep valley walls that extend from edge of the reservoir at elevation 830 feet downward to a prominent break in slope at the reservoir floor |
| Reservoir floor | Includes a broad, low gradient suite of planar surfaces that collectively form the reservoir floor and extend from valley-edge hillslopes to the main channel |
| Reservoir hillslope | Consists of steep areas of the reservoir margins that typically extend from the reservoir floor upward to the reservoir margins at elevation 830 feet |
| Pelagic reservoir floor | Main floor of the reservoir extending between the reservoir hillslope and main reservoir channels. It is generally downslope of the reservoir hillslope domain, relatively flat, and would be fully and deeply inundated by water at maximum pool (830 feet). |
| Littoral reservoir floor | Shallow water environment with sparse vegetation due to seasonal variations in water levels and consists of localized, relatively low gradient (typically less than about 2 degrees) areas along the reservoir margins adjacent to the mapping boundary at maximum pool elevation. |
| Sloped reservoir floor | Areas within the main body of the reservoir floor domain with relatively steeper slopes (greater than about 5 degrees) than adjacent pelagic or littoral reservoir floor units (typically less than about 2 degrees). These areas are not located on the reservoir margin and thus not considered part of the reservoir hillslope. |
| Wetted channel | Includes the main wetted channel areas of Fall and Winberry Creeks at streambed drawdown, but not other smaller, permanent tributaries. |
| Channel bank | Consists of sloping margins along the alluvially formed channel that confines discharge during the low-flow full reservoir drawdown (definition modified from Osterkamp, 2008), are only mapped for the main Fall Creek and Winberry Creek channels. |
| Slumping bank | Includes channel banks showing signs of slumping or mass failure are mapped as slumping banks. These landforms include features that show evidence of recent slumping, as well as older features that have likely been active during previous drawdowns. |
| Bar | Streamlined features located along the main channel bed or within tributaries that are composed of gravel to sand-sized sediment. Bars are recently active landforms formed through fluvial depositional processes; they represent recent sediment transport and deposition by fluvial processes as opposed to lacustrine processes. |
| Bedrock (feature) | Bedrock outcrops are present throughout the Fall Creek Lake but are only mapped as a distinct feature when outcrops exist within the main channel where they can interact or influence fluvial deposition, transport, and erosion during drawdown operations. |
| Tributary channel | Includes small channels that typically originate beyond the reservoir perimeter and drain directly into Fall or Winberry Creeks. In contrast to the main channel landforms, tributary channels are mapped from the top of banks, encompassing banks, wetted or dry channel bed, and any adjacent channel margins. |
| Drawdown channel | Channels that typically originate predominantly through head cuts through the reservoir floor or reservoir hillslope and do not extend beyond the perimeter of Fall Creek Lake as do tributaries. |
| Drawdown distributary zone | Broad areas containing a complex set of distinct landforms within the pelagic reservoir floor that are generally located at distal end of drawdown channels and display a series of floodplain splays and small deltaic lobes that are cross-cut by erosional channel features. The suite of landforms included within a drawdown distributary zone signifies areas of streamflow expansion and deposition. |
| Drawdown terrace | Planar surfaces that have either been incised by channels and abandoned by continued incision or might be small areas or reservoir floor that have been dissected from the larger floor by channel erosion around the feature (an erosion island). These features can occur in main channel or reservoir floor domains and are interpreted as resulting from drawdown operations. |
| Fan | Features that generally coincide with the locations of abrupt decreases in slope resulting in streamflow deceleration and subsequent deposition of sediment and detritus, forming a fan shape. Most fans within Fall Creek Lake consist of alluvial fans; although, Floodplain splay deposits from tributary and drawdown channels are also included in this mapping unit, as are debris fans or cones from debris flows. |
| Landslide | A single landslide on the north shore of Fall Creek Lake. The head scarp of this slide is beyond the boundaries of the reservoir, but the runout appears to have reached the main channel of Fall Creek based on the landslide toe position. |
| Cut | Areas where the topography has been affected by the human removal of material. Many of these landforms are topographically lower than adjacent topography and mantled with a thin layer of sediment. Cut landforms commonly form pond or channel-like features at lowered lake levels. |
| Fill | Areas where the reservoir topography has been purposely changed by the addition of material and are often associated with pre-dam infrastructure (for example, roads). Many of these fill areas are now mantled with sediment, but the underlying morphology of the fill landform itself is still clearly visible (for example, road embankment). Fill landforms may include piles of blocky material (mostly in the lower reservoir, where piles are probably associated with dam construction), as well as filled road grades and pre-impoundment pond embankments. |
| Bedrock | Areas dominated by bedrock material. |
| Gravel | Gravel areas consisting of coarse sediment patches comprised of clasts that are predominantly coarser than sand. |
| Sand and (or) gravel | Areas with a mix of coarse gravel- and (or) sand-sized sediment. |
| Sand and (or) mud | The sand and (or) mud category consists of patches of fine-grained sediment that are predominantly comprised of sand, silt, and mud with overall grain size generally less than 2 millimeters. |
| Infrastructure | Features such as pre-dam roads or home foundations and maintained boat ramps and Fall Creek Dam. Several of these features are mantled by sediment. |
Table B3.
Select geomorphic mapping unit landforms, associated process domains, and inferred sediment regime under typical seasonal flood-control operations and during streambed drawdown operations at Fall Creek Lake, Oregon.[See appendix 2 of this report and Keith and Stratton (2019) for additional landform mapping units and more detailed descriptions of mapping domains, landforms, and substrate. Mapping from Keith and Stratton Garvin (2021).]
Geomorphic mapping is based on 2016 SfM DSM and orthophotographs and supplemented with 2012 lidar in upper segments of Fall and Winberry Creeks (app. 1; Keith and Mangano, 2020). Landforms were digitized at a scale of 1:500 with 2016 DSM and orthophotograph coverage and 1:1,500 in areas with lidar-only coverage within Fall Creek Lake. All in-reservoir landforms greater than 10 m2 were digitized according to mapping protocols specific to each landform based on their morphology and topographic characteristics. The mapping hierarchy was created to specifically identify landforms created and shaped by streambed drawdown operations (table B3) and landforms that had a greater potential to supply sediment to reaches downstream from Fall Creek Dam compared with those created through longer-term sedimentation processes (app. 2). Therefore, landforms in the main channel domain, such as channel banks and slumping banks, were mapped in greater detail, whereas landforms less likely to drive sediment export during streambed drawdown operations within the reservoir floor and hillslope domains, such as broad areas of reservoir that span multiple pre-dam terraces at higher elevations than the main channel, were lumped into one landform. A general category defining substrate was then attributed to each landform based on the appearance in the high-resolution base imagery. Field verification of substrate was limited and conducted during other reservoir-based field work during the 2016 and 2017 streambed drawdowns.
Topographic Change Assessment
Net volumetric changes and patterns of sediment deposition and erosion for the period 2012–16 were assessed using digital elevation models (DEMs) and digital surface models (DSMs) of Fall Creek Lake during full streambed drawdowns acquired in January 2012 (lidar; Watershed Sciences, Inc., 2012) and November 10, 2016 (SfM data acquired for this study); see appendix 1 for resolution and accuracy details. Quantitative comparisons between the datasets were made with Geomorphic Change Detection (GCD) Software version 6.1.14 (Riverscapes Consortium, 2018). Change detection analyses were focused on the reservoir floor and main channel domains within the lower 2.5 km of the reservoir where ground control coverage was greatest and where most observed changes have occurred. Within this area of interest, the higher-resolution 2016 DSM was also resampled to 0.5-m resolution cell size and snapped to the lidar raster for spatial concurrency between datasets.
The GCD software calculated total erosion, total deposition, and net volumetric change, along with propagated uncertainty analyses within the area of interest. Propagated uncertainty analyses consider the relative error for each survey (Brasington and others, 2000; Lane and others, 2003; Wheaton, 2008). An error surface of 12 cm (default for photogrammetric surveys) was applied to the 2016 DSM and is deemed reasonable given the total model error for control points was 0.08 m and the total error for check points was 0.12 m. For the 2012 lidar data, an error surface of 0.15 m (default for lidar surveys) was used. Comparatively, reported overall project vertical accuracy root mean square error (RMSE) for the lidar data was 0.02 m (Watershed Sciences, Inc., 2012), so this default error surface is considered a relatively conservative estimate of survey error. Spatial homogeneity in surface uncertainty was assumed for the SfM and lidar datasets for the analyses completed here, though approaches for more spatially explicit approaches exist (for example, see Wheaton and others, 2010) and might be more appropriate if doing a more in-depth analysis of topographic change in the reservoir. Overall, the propagated error approach resulted in an uncertainty threshold of about 0.19 m. No account of wetted area uncertainty was made due to the absence of lidar penetration of water, modeled shallow depths, depth distortion from SfM techniques, and variance in discharge during data acquisition (daily mean discharge of 4,200 ft3/s in WY 2012 and 155 ft3/s in WY 2017). Without streamgages in the reservoir to illustrate the relation between discharge and water depth, it is difficult to quantify uncertainty due to discharge, though at the Fall Creek streamgage downstream from the dam, the stage difference between 4,200 ft3/s in WY 2012 and 155 ft3/s is about 5.2 ft (1.6 m), which is quite substantial. Adjusting total erosion volumes for discharge would likely decrease the overall estimated total amount of erosion.
Pre-Dam Valley and Channel Morphology
Fall Creek Lake encompasses a narrow valley that ranges in width from 50 to 900 m and is bounded by steep hillslopes. Topographic and geologic maps (USGS, 1942, 1955a, 1955b; USACE, 1947, 1966; app. 1) show that prior to dam construction in 1965, the main valley floor was a broad, flat surface bisected by the Fall and Winberry Creek stream channels (fig. B4). Valley floor elevations gently slope toward Fall Creek, generally varying by less than 25 m across valley. The main valley floor was mapped by the USACE in 1947 as Quaternary alluvium composed of “slightly consolidated sand, gravel and clay,” whereas Fall Creek stream channel was mapped as Recent alluvium of composed of “unconsolidated sand and gravel.” Habitat surveys completed by the Bureau of Fisheries (now National Marine Fisheries Service) in 1938 (McIntosh and others, 2009) describe channel substrate and spawning conditions for Fall Creek. Within a 7-km stream segment extending upstream from the confluence of Winberry Creek, 40 percent of the channel bed was comprised of “large” alluvial sediment (defined as greater than 152 mm), 33 percent was comprised of “medium” sediment (76–152 mm); and 22 percent was comprised of “small” sediment (6–76 mm), and “mud and (or) sand” (less than 6 mm) covered 4.6 percent of the bed (McIntosh and others, 2009). Altogether, the surveyors determined that 36.8 percent of the surveyed area had usable spawning habitat (McIntosh and others, 2009).
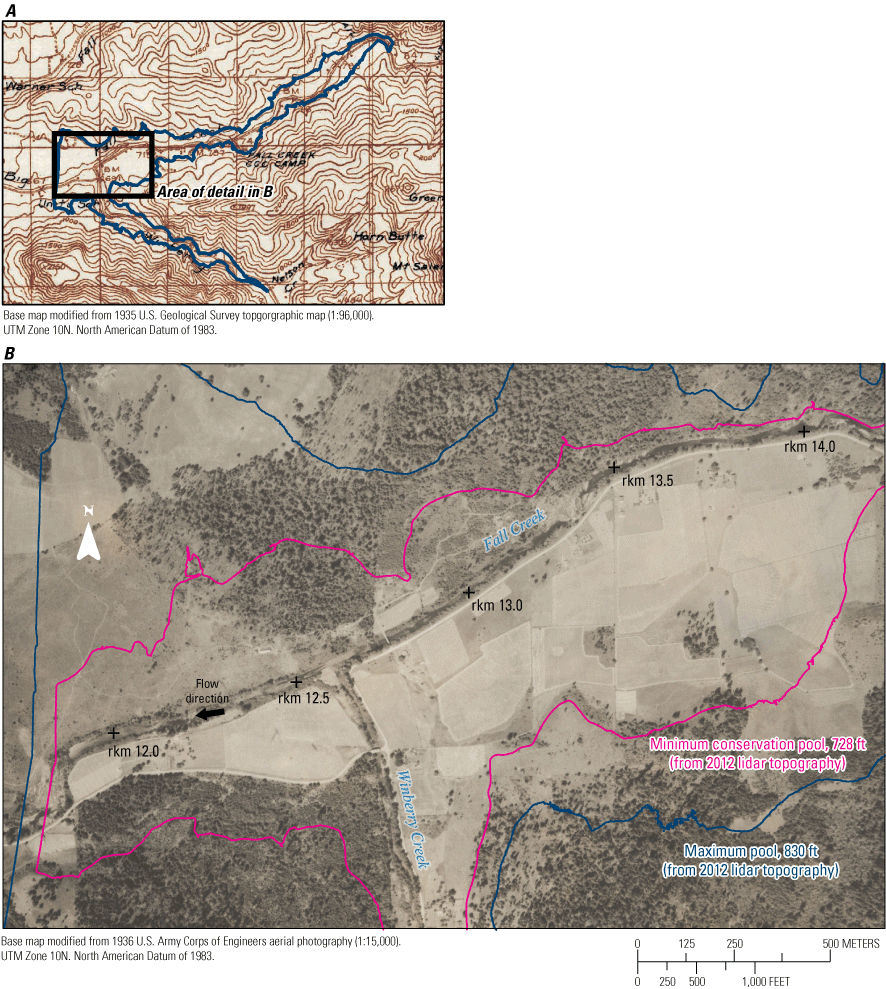
Historical U.S. Geological Survey topographic map from 1935 of the Fall Creek valley (A) and U.S. Army Corps of Engineers aerial photographs (B) from 1936 near the confluence of Winberry Creek prior to the construction of and impoundment by Fall Creek Dam, Oregon, including maximum and minimum conservation pool elevations contours in feet (ft) derived from light detection and ranging (lidar). Aerial photograph and topographic map details are included in appendix 1.
Aerial photographs from 1936 (app. 1) show that valley-edge hillsides encompassed by Fall Creek Lake were heavily forested and much of the present-day reservoir floor was used for agricultural purposes, with fields extending across the valley floor to the margins of the Fall and Winberry Creeks (fig. B4). Houses and other structures were distributed throughout the present-day reservoir, and roads follow the length of Fall and Winberry Creeks (fig. B4). The streams flowed through the valley floor, occupying low-sinuosity, single thread, semi-alluvial channels with intermittent bedrock outcrops (fig. B4). Unvegetated gravel bars were intermittent and range in size up to 2,700 m2, and few vegetated bars were apparent. Side channels and alcoves were also sparse and, where present, were co-located with gravel bars.
Reservoir Sedimentation from Assessment of Water-Storage Curves and Repeat Surveys
Repeat topographic data from 1965 to 1966, 2012, and 2016 show that overall sediment accumulation in Fall Creek Lake since the dam was constructed is greatest near the dam, and the depositional wedge gradually thins upstream along the 10-km-long reservoir (fig. B5A). This wedge-style deposition, with thick deposits near the dam thinning upstream, is typical of large reservoirs seasonally operated for flood control (Randle and Bountry, 2017). In the lower 1–2 km of the reservoir, sediment accumulation is thickest (about 3 m) in the main channel and along areas topographically lower and closer to the main channel while distal sedimentation across the valley floor is on the order of about 1 m (fig. B5B). Farther upstream, the Fall Creek valley narrows with smaller magnitudes of deposition concentrated within the main channel (fig. B5C, D). In the upper reservoir, repeat survey data show possible erosion (for example, near rkm 17 and 20), but the profile data represent water-surface elevations at unknown discharges, which introduces uncertainty of as much as 1.6 m when considering channel bed elevations. Overall, sediment deposited in Fall Creek Lake since dam construction in 1965 has displaced areas formerly available for water storage, primarily reducing the reservoir storage volume at low lake levels. However, comparison of 2012 and 2016 topography show evidence of incision in the lower reservoir (for example, fig. B5A, B).
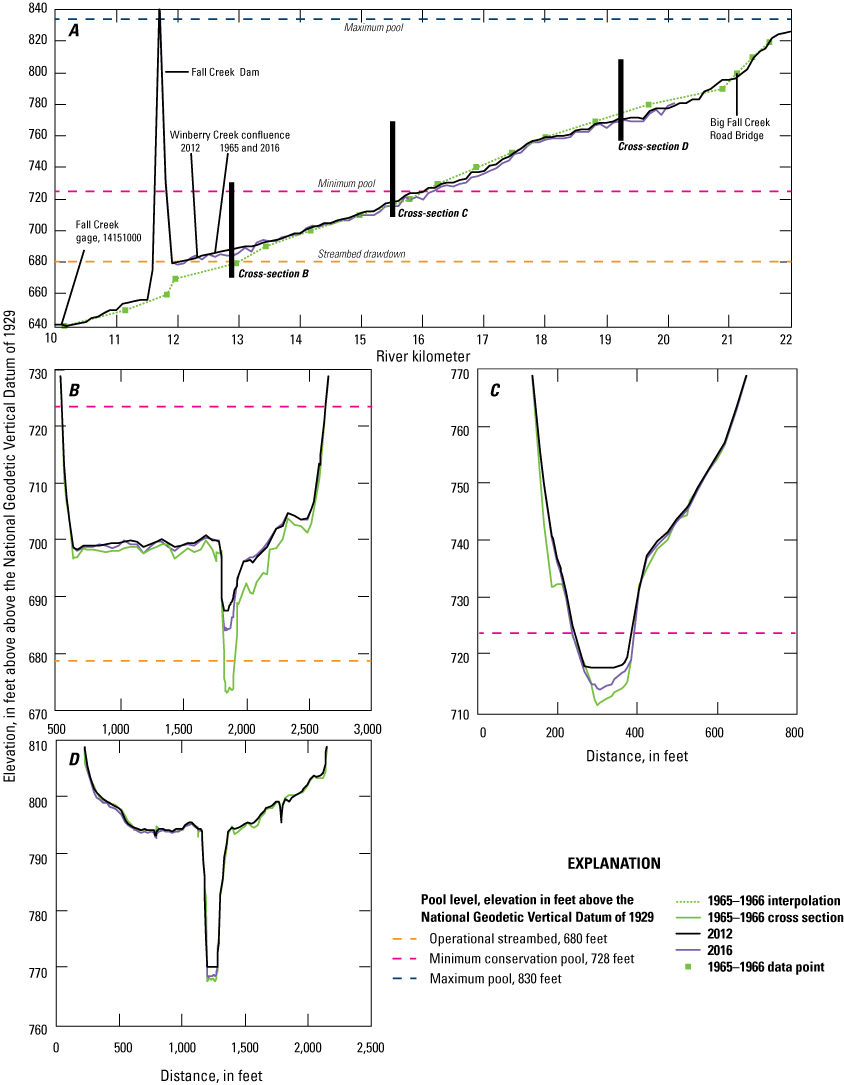
Longitudinal water-surface elevation profiles (A) and cross-sections (B–D) within Fall Creek Lake, Oregon, from 1965 to 1966 U.S. Army Corps of Engineers (USACE) topographic data, 2012 lidar data, and 2016 structure-from-motion survey data. Pre-dam profile elevations (A) were extracted from a pre-dam topographic map (U.S. Army Corps of Engineers, 1966), while pre-dam cross-sections (B–D) were extracted from 1965 survey data (arbitrary horizontal datum, values provided by Jacob Macdonald, U.S. Army Corps of Engineers, written commun., January 29, 2019).
Storage curves from 1965, 1988, and 2012 indicate that overall loss in water storage for Fall Creek Lake is relatively small and that sediment accumulation is concentrated in the lower reservoir near the dam (fig. B6). At maximum pool (830 ft), storage loss is about 1-percent (net change of 1,520 acre-ft between 1965 and 2012). At minimum conservation pool (728 ft) reservoir storage curves reveal a 1-percent (116-acre-ft) reduction from 1988 to 2012. At 690 ft, a level where anecdotal reports suggest increased sediment export from reservoir, water storage has decreased by about 81-percent (661 acre-ft) between 1988 and 2012. In the reservoir area below 698 ft and above 727 ft, overall trends in water-storage changes between 1988 and 2012 suggests decreasing water storage, likely due to deposition, except for a zone of modest change between about 750 and 770 ft (fig. B6C). Between 698 and 727 ft, water storage increases with increasing elevation, signifying erosion and net gain in water storage of about 100 acre-ft (fig. B6C).
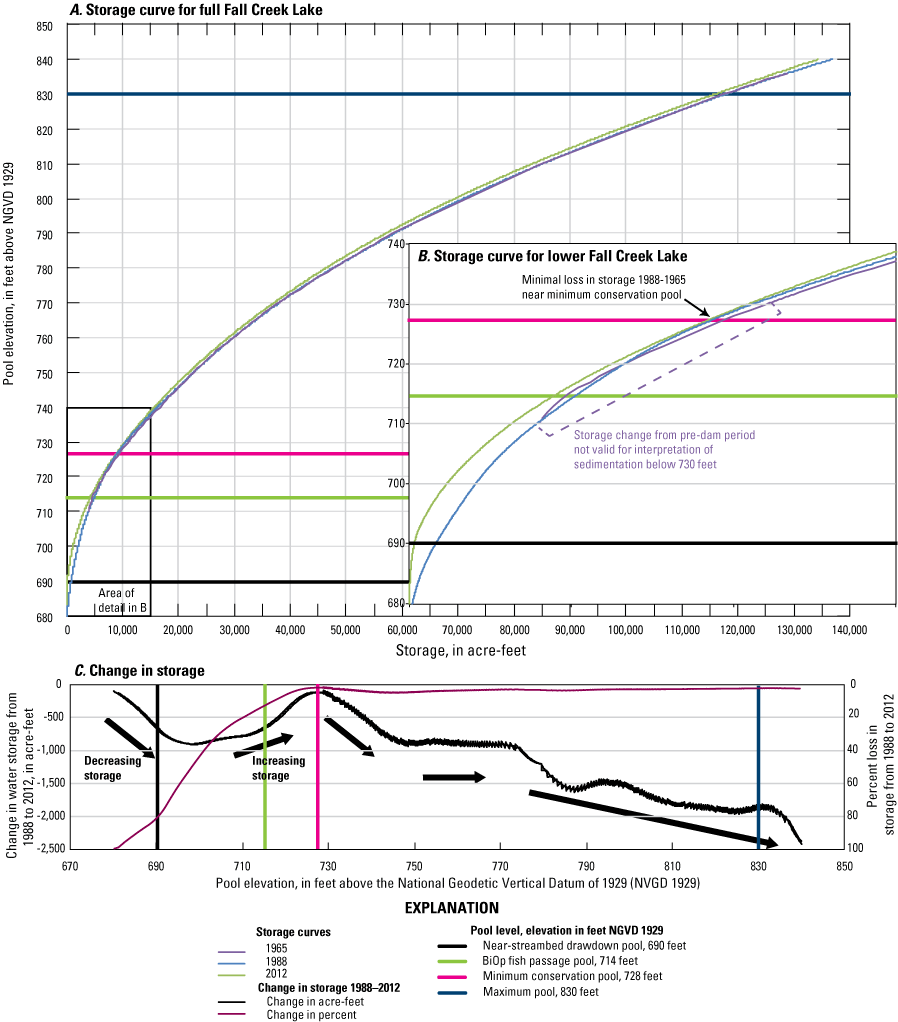
U.S. Army Corps of Engineers Fall Creek Lake storage curves for 1965 (based on pre-dam topography), 1988, and 2012 for the full reservoir (A) and an area of increased detail in the lower reservoir (B; data provided by Jacob Macdonald, U.S. Army Corps of Engineers, written commun., July 6, 2016). Graph showing total magnitude of storage changes (smoothed by 10-point moving average) and cumulative percent of storage loss between 1988 and 2012 (C).
The small loss in total reservoir storage since 1965 is likely within the range of uncertainty associated with storage curves and suggests rates of reservoir sedimentation have been low. This is consistent with studies scoping the viability and longevity of Willamette River Basin reservoirs that found sedimentation was likely to be low on the basis of upstream contributing geologies and likely sediment yield (USACE, 1954). It also is likely that the frequent pool level lowering to or near streambed has also played a role in exporting reservoir sediments past the dam and helping lead to small loss in reservoir storage. However, comparison of 1965–66 topographic data to more recent datasets (fig. B5) indicate sediment accumulation is concentrated in the lower Fall Creek Lake near the dam, where sediment deposits are most susceptible to erosion and export during streambed drawdowns. Losses in water-storage between streambed and elevation 727 ft result from sedimentation over the 1988–2012 period. Water-storage increases between 698 and 727 ft just below minimum conservation pool (728 ft) imply greater amounts of erosion than deposition due to morphologic changes. Because the 2012 storage curve reflects reservoir morphology after one recent streambed drawdown (WY 2012) and other multiple instances when lake level neared streambed (fig. A12), it is possible that increased erosion between 698 and 727 ft was driven by streambed drawdown operations; however, it is likely there are other processes and changes, such as history of flood-control lake level fluctuations or hillslope erosion, that could account for those changes. The overall net loss in water storage from 1988 to 2012 throughout the reservoir as indicated by storage curves, regardless of elevation, suggests greater sediment import into Fall Creek Lake than export, which is also supported by USGS sediment-gaging data from WY 2013 (Schenk and Bragg, 2014).
Reservoir Landforms, Processes, and Sediment Characterization
Geomorphic reservoir mapping at Fall Creek Lake (figs. B7–9) highlights differences in landform characteristics that relate to geomorphic processes active at varying pool levels. The three process domains—reservoir hillslopes, reservoir floor, and main channel—include all mapped landforms within the spatial extent of the domain.
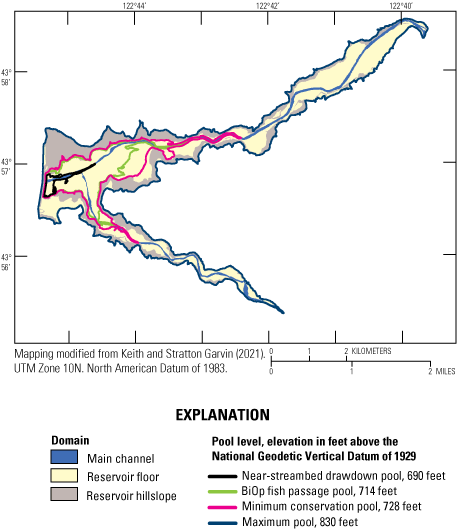
Geomorphic mapping of reservoir process domains at Fall Creek Lake, Oregon.
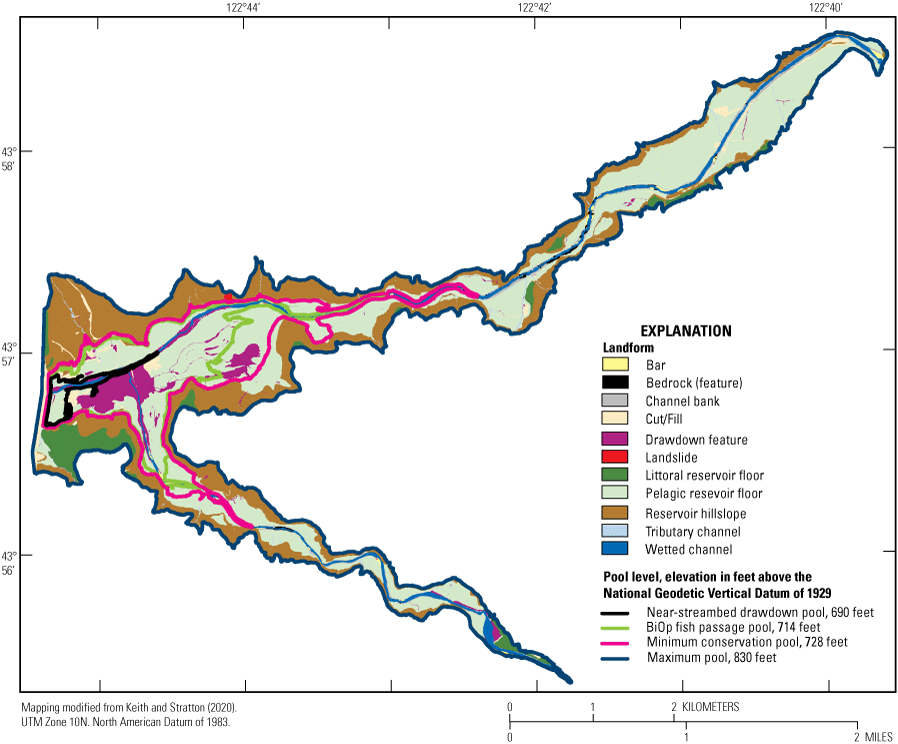
Geomorphic mapping of reservoir landforms at Fall Creek Lake, Oregon.
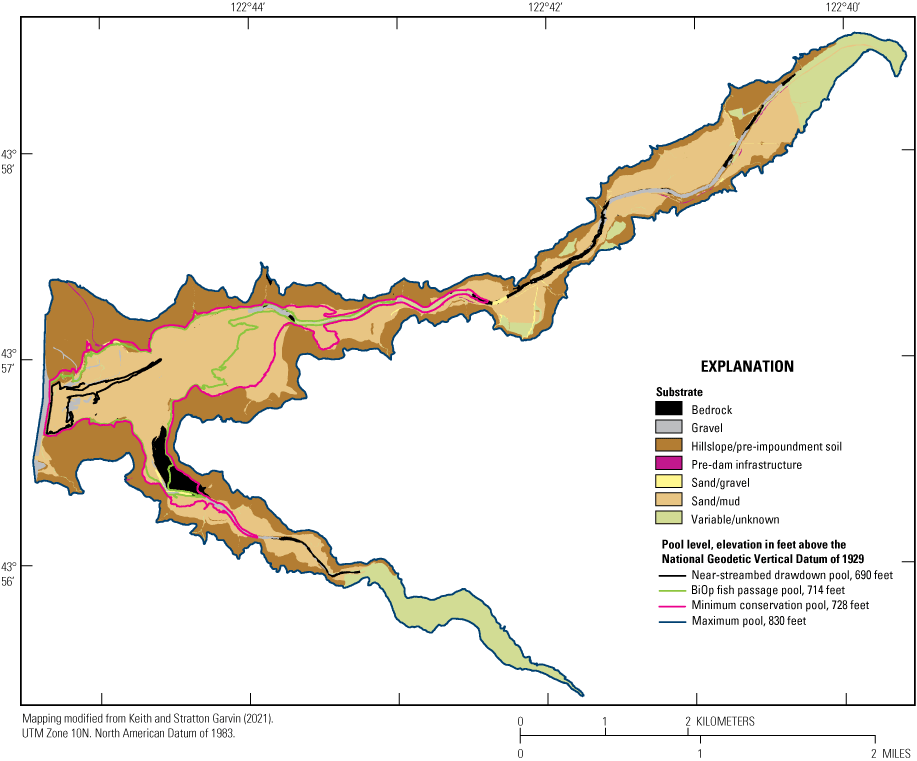
Geomorphic mapping of generalized reservoir substrate at Fall Creek Lake, Oregon.
Reservoir Hillslopes
The reservoir hillslope domain encompasses steeply sloping surfaces that extend from the reservoir floor to the mapping boundary at maximum pool (830 ft; fig. B7). Reservoir hillslopes comprise about 36 percent (2.58 km2) of the total mapped area. Within the reservoir hillslope domain, the dominant landform category is reservoir hillslope (fig. B10), generally identifiable by wave-built terracettes on relatively steep slopes (fig. B11). Other landforms mapped in this domain include tributary channels, landslides, cut, fill, drawdown channels, fans, and bars (fig. B10, app. 2). Most landforms within the reservoir hillslope domain lie above minimum conservation pool (elevation 728 ft); only 6 percent of the area below this elevation is mapped as reservoir hillslope domain (figs. B8, B10; app. 2). Landforms mapped as reservoir hillslopes predominantly have hillslope and (or) pre-dam soil substrate where soil and regolith are exposed.
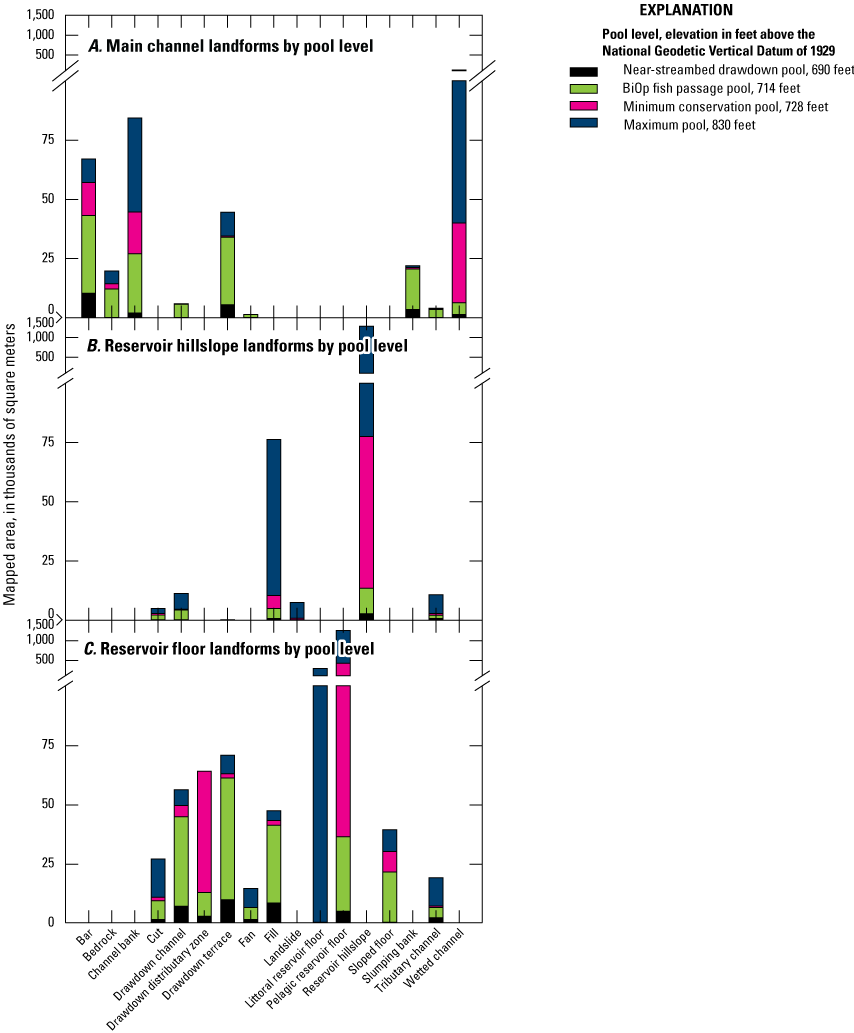
Distribution of mapped geomorphic landform units as a function of pool elevations at Fall Creek Lake, Oregon, for the main channel (A), reservoir hillslope (B), and reservoir floor mapping domains (C).
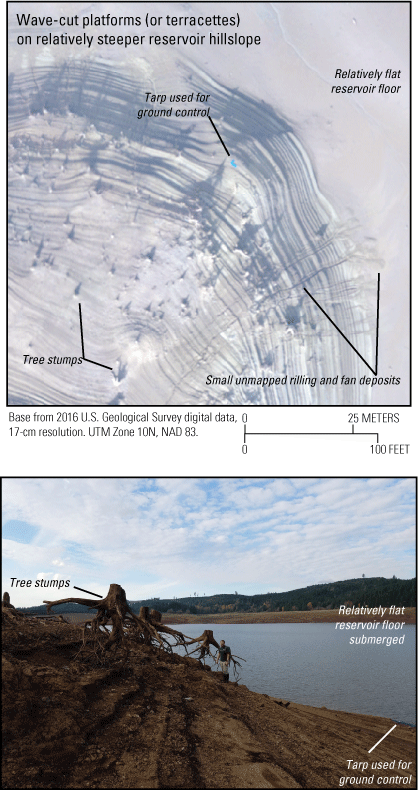
Orthophotograph (A; November 10, 2016; Keith and Mangano, 2020) and oblique photograph (B; November 1, 2016; taken by Mackenzie Keith, U.S. Geological Survey) displaying wave-built terracettes, tree stumps, and aerial photograph target on the reservoir hillslope.
The terraced morphology of reservoir hillslopes indicates that this domain is predominantly influenced by wave action that occurs when the reservoir functions as a lake. At full streambed drawdown, hillslope landforms are not directly interacting with pool levels. Lowered pool levels during seasonal flood-control operations and full streambed drawdowns expose reservoir hillslopes to hillslope and gully erosion processes that can deliver sediment to the reservoir floor (for example, fig. B11A and B show exposed tree roots and rilling carved in hillslopes). Tributaries that bisect the reservoir hillslope domain are steep, and fans located at some mouths indicate that tributaries can deliver coarse- and fine-grained sediment, especially where they are connected with the main reservoir channel.
Reservoir Floor
The reservoir floor domain (fig. B7) comprises about 55 percent (3.91 km2) of the total mapped area. This domain has broad, planar topography with most commonly sand and (or) mud substrate and is crossed by channels, infrastructure, and other mapped landforms (figs. B8, B9C; app. 2). The pelagic reservoir floor, is relatively flat, has a smooth appearance in aerial imagery, is bound by reservoir hillslopes, and is more deeply inundated by water than the littoral reservoir floor. The littoral reservoir floor is similarly broad and flat but is less deeply inundated and lacks adjacent reservoir hillslope. “Pelagic” is typically used in limnology to indicate deep-water conditions too dark for macrophyte growth, whereas the littoral zone is generally understood as an interface zone between terrestrial and aquatic environments (Wetzel, 2001). While precise definitions vary, the terms are used here to delineate the deep, reservoir floor from the shallow reservoir floor. While both of these reservoir floor landform units reflect pre-dam topography, the littoral reservoir floor has fewer buried tree stumps and more infrastructure (cut or fill features) (figs. B12, B13; table B3). The pelagic floor is more often punctuated with drawdown-related drainage features (fig. B12; table B3). Local patches of coarse rock apparent on reservoir floor domain indicate that coarse gravel to cobble-sized material generated from reservoir hillslopes persists while sand and finer sediment generated from reservoir hillslopes is more readily transported through and out the reservoir to downstream reaches.
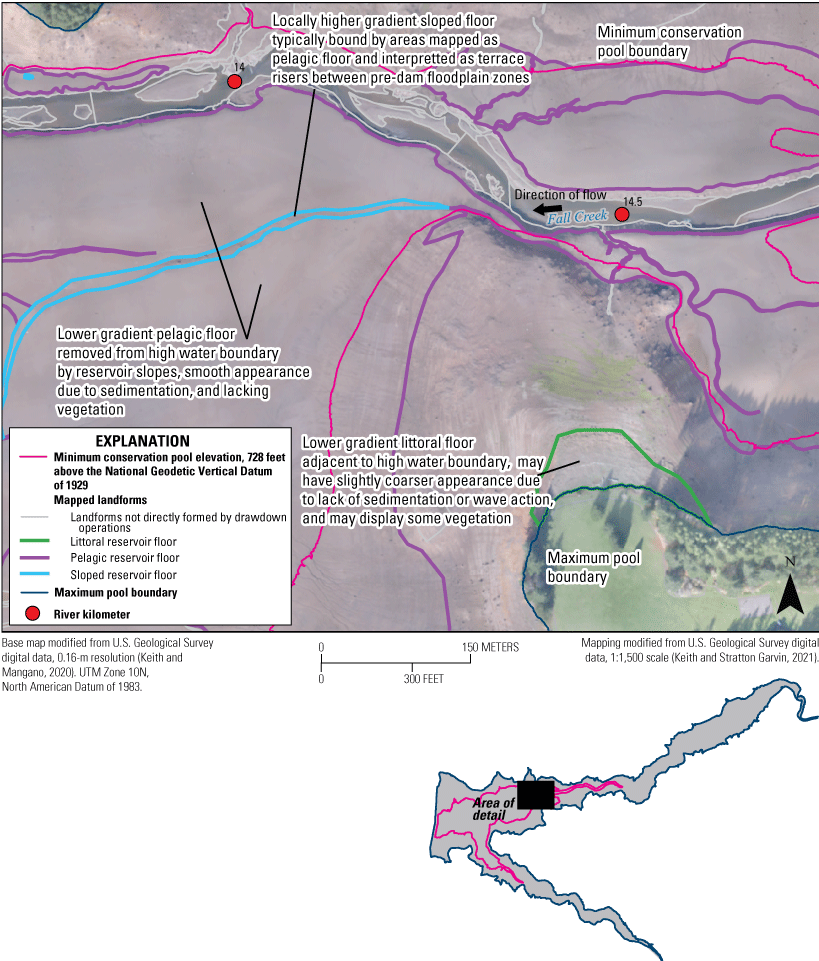
Examples of reservoir floor landform units (littoral floor and pelagic floor) from geomorphic reservoir mapping within Fall Creek Lake, Oregon.
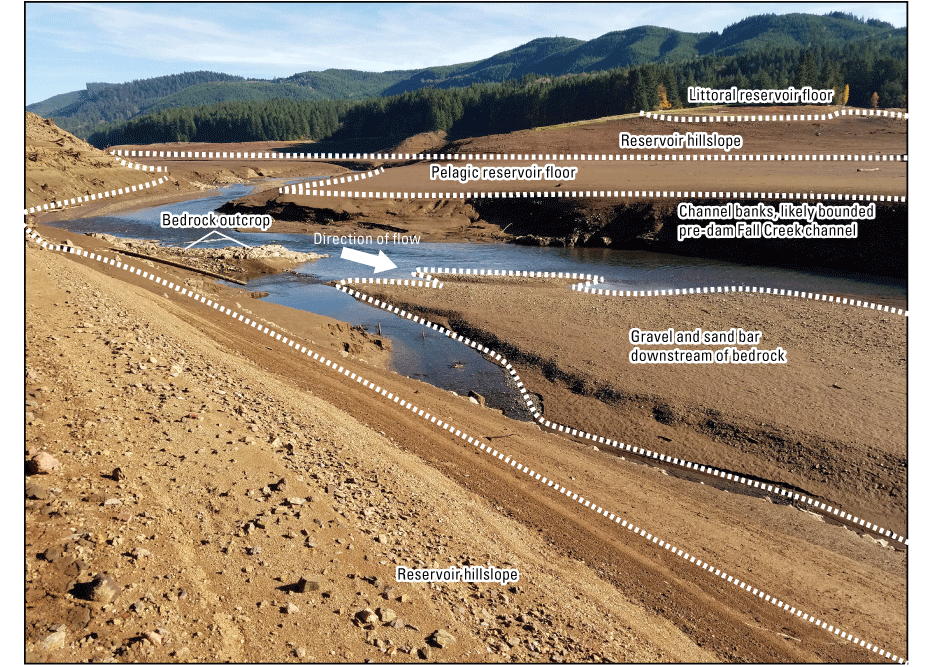
Diverse array of landforms and substrate within a relatively small area of Fall Creek Lake, Oregon. Photograph by Mackenzie Keith, U.S. Geological Survey, November 8, 2016. Dashed line added to illustrate approximate boundaries among features.
Drawdown channels, drawdown terraces, and drawdown distributary zones (figs. B7, B10, B14, B15; table B3) are a related set of mapped landforms within the reservoir floor domain that show evidence of recent erosion, fluvial sediment transport, and re-deposition. Drawdown channels originate near the margins of the reservoir floor but lack an obvious stream channel source draining from reservoir hillslopes or beyond the reservoir. Some drawdown channels flow toward the main Fall or Winberry Creek channels, but they may also terminate within adjacent pelagic reservoir floor as drawdown distributary zones, relatively wider areas that show small deltaic lobes and cross-cutting channels. Drawdown terraces border drawdown channels and Fall and Winberry Creeks and are typically elongate, planar surfaces inset within the reservoir floor. Drawdown channels, terraces, and distributary zones are almost exclusively mapped with sand and (or) mud substrate (fig. B16).
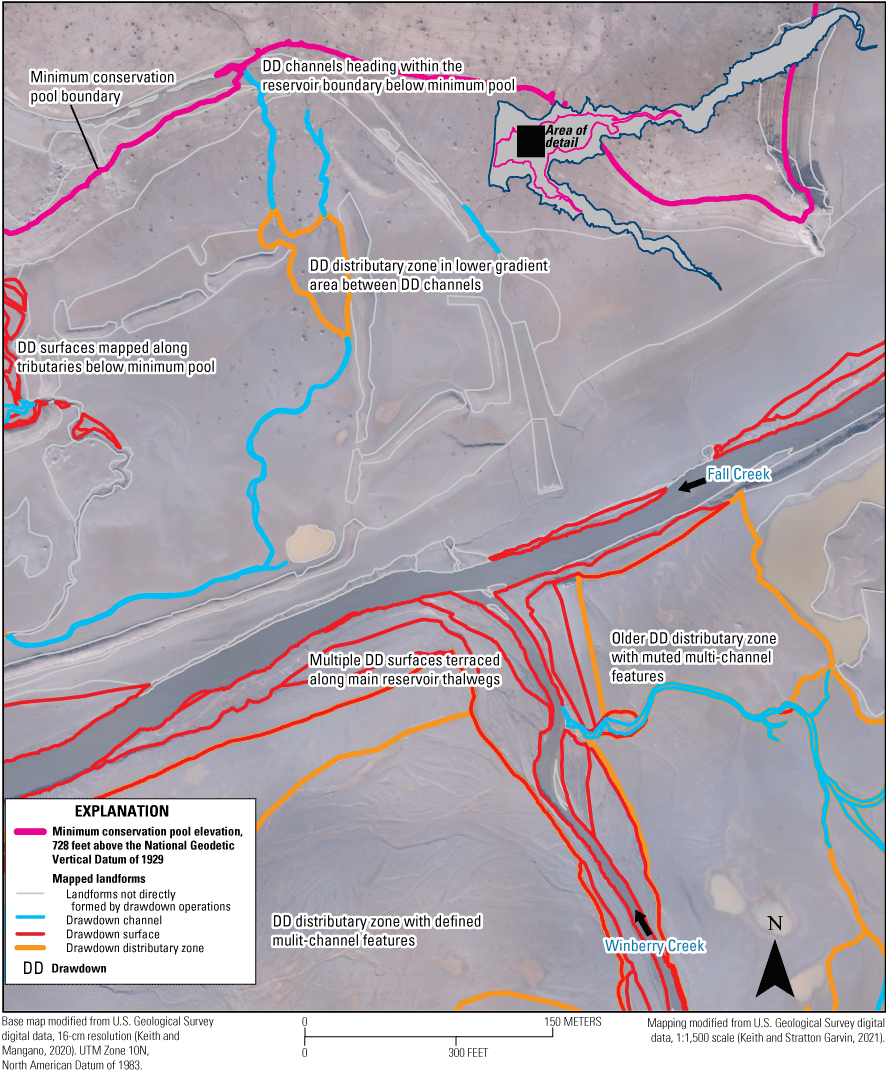
Examples of drawdown-related landform units (drawdown channels, drawdown distributary zones, and drawdown surfaces) near the confluence of Fall and Winberry Creeks from geomorphic reservoir mapping within Fall Creek Lake, Oregon.
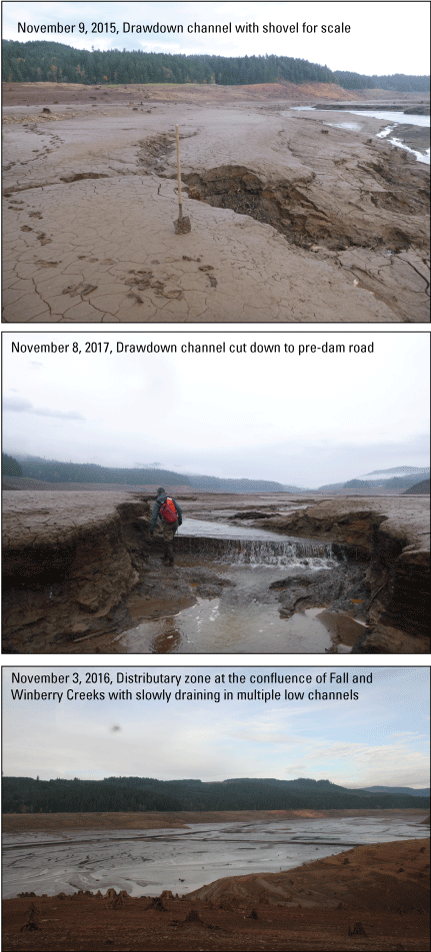
Examples of drawdown channels and distributary zones at Fall Creek Lake, Oregon during streambed drawdowns. Photographs by Mackenzie Keith, U.S. Geological Survey.
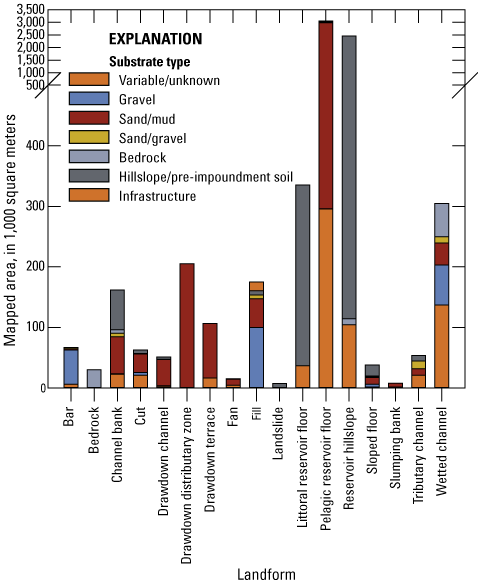
Reservoir landforms for Fall Creek Lake, Oregon, divided by substrate type.
The topography and substrate of the pelagic and littoral reservoir floor landforms combined with field observations of planar bedding within these units indicate lacustrine deposition over pre-dam topography from sand and finer-grained sediment settling in a calm lake environment. However, when pool levels are low, high reservoir inflows may rework reservoir floor deposits through overbank deposition in upper, free-flowing segments of the reservoir. Sedimentation has been greatest in the lower reservoir near the Fall Creek Dam (fig. B5) in the pelagic reservoir floor (fig. B8). Deeper burial of pre-dam features results in smoother, more muted topography than in the littoral reservoir floor where historical topography is more evident under a thinner mantle of fine-grain deposits.
Drawdown channels and drawdown terraces (fig. B14) have distinct streamlined edges that mark them as erosional landforms carved through unconsolidated reservoir floor sediments. Drawdown channels and drawdown terraces are created by erosional processes active during pool lowering. Drawdown channels are similar to the auxiliary lateral or longitudinal flushing channel features described by Morris and Fan (1998, p. 15.6), and drawdown terraces are analogous to cut terraces in riverine settings (Leopold and others, 1964). Sediment generated from the formation and conveyance within these drawdown landforms is transported to main or tributary channels within the reservoir or deposited in the drawdown distributary zones, areas of streamflow expansion and deposition similar to deltas. Drawdown-created landforms are present at many operational pool levels but are more abundant below minimum conservation pool at 728 ft. (figs. B8, B10; app. 2).
Main Channel
The main channel spatial domain is 9 percent (0.63 km2) of the mapped reservoir area and contains the wetted channels of Fall and Winberry Creeks and associated landforms such as bars, in-channel bedrock, channel banks, and slumping banks. Alluvial landforms with gravel or sand and (or) mud substrate compose 19 and 25 percent (respectively) of this domain. Bedrock substrate comprises 14 percent of the domain (app. 2). Channel banks locally are made up of pre-dam hillslope and (or) pre-impoundment soils, mostly in the upper reservoir (app. 2). Landforms within the main channel domain include the wetted channel, bars, bedrock outcrops, banks, and drawdown terraces (figs. B8, B10; app. 2). Bars are streamlined features located along the bed of the wetted channel. Eighty-four percent of bars in the main channel have substrate class of gravel, 6 percent of bars were mapped as sand and (or) mud or sand and (or) gravel, and the remainder were classified as variable and (or) unknown substrates (app. 2). Bars are mapped along channel margins throughout the length of the reservoir and are typically less than 400 m2, but range in size up to about 2,400 m2 near the middle of the reservoir (about rkm 17.6; fig. B10). Channel banks exhibiting mass wasting processes were separated into a separate slumping banks landform mapping unit to quantify areas actively eroding and generating sediment available for transport to the lower reservoir or downstream reaches. Slumping banks are about 4.5 percent of the area mapped as channel banks, are entirely composed of sand and (or) mud substrate and were identified from orthophotograph coverage. Slumping banks mapped with lidar-only coverage were mapped as unknown. Undifferentiated channel banks were chiefly composed of pre-impoundment soil or bedrock substrates (44 percent) and inferred to be more stable than those mapped as sand and (or) mud substrate (38 percent; fig. B16; app. 2).
Although the wetted channel comprises only 4.3 percent of the total mapped area within the reservoir, it is the main conduit of streamflow and sediment during low lake levels. The wetted channels of Fall and Winberry Creeks were mapped as variable and (or) unknown substrates (45 percent of the mapped wetted channel), but the majority of identifiable substrates suggests the streams flow over gravel (22 percent) and bedrock (18 percent; app. 2). Bedrock landforms include isolated outcrops within or flanking the main channel bed and sections of bedrock that compose the banks; there are few bedrock outcrops in the lower reservoir, and the highest density of mapped bedrock in the main channel domain coincides with an approximate 2.5 km segment near the transition to minimum conservation pool (728 ft). Bedrock is delineated as a feature only where it acts as an in-channel feature interacting on a regular basis with fluvial deposition, transport, and erosion.
The streamlined alluvial features and exposed bedrock landforms of the main channel domain indicate erosional fluvial processes during lowered lake levels that stand in stark contrast to the depositional, lacustrine features that exhibit planar bedding and are submerged at high lake levels. Steep channel banks and slumping banks signify recent bank erosion by lateral migration or channel widening and incision that has led to over steepening of unconsolidated, saturated banks with subsequent failure, consistent with geomorphic change detection analyses (see the “Magnitude and Distribution of Sediment Erosion and Deposition Water Years 2012–17” section). Likewise, bars indicate depositional locations for gravel traveling along the main channel as bedload and are interpreted as recently formed landforms from the sharp, streamlined shapes and lack of fine-grained sediment burial. The abundance of exposed bedrock within the main channel domain, in portions of the reservoir primarily upstream from minimum pool, indicates relatively high sediment transport capacity (or relatively low sediment supply) that can remove accumulated gravel and finer sediments when exposed to sufficient water velocities. Although bars and bedrock features are subject to lacustrine deposition during higher lake levels, fine material is apparently removed prior to exposure during full streambed drawdown. Drawdown terraces within the main channel domain are formed similarly to those within tributaries, but drawdown channels through the reservoir floor can be much larger. Repeated pool lowering during seasonal flood-control operations, combined with annual streambed drawdown events to facilitate fish passage, enable sediment erosion, transport, and re-deposition and move sediment from the upper elevations of the reservoir floor to the lower elevations of the reservoir.
Substrate
The dominant substrates within Fall Creek Lake (fig. B9) are sand and (or) mud (46 percent) and Hillslope and (or) pre-impoundment soil (39 percent), consistent with the large areas and typical materials mapped within reservoir floor and reservoir hillslope domains (respectively; figs. B9, B17). All other substrate mapping units each comprise less than 9 percent or less of the total mapped reservoir area. At lower elevations, the proportion of fine-grained lake sediments increases. At minimum conservation pool (elevation 728 ft) where reservoir floor landforms dominate (fig. B17), sand and (or) mud substrate comprises 84 percent of the pool area. Within the BiOp fish-passage pool (elevation 714 ft) sand and (or) mud comprises 87 percent of the mapped area, and within the much smaller pool nearing streambed (elevation 690 ft), substrate is almost entirely sand and (or) mud (95 percent; fig. B17; app. 2).
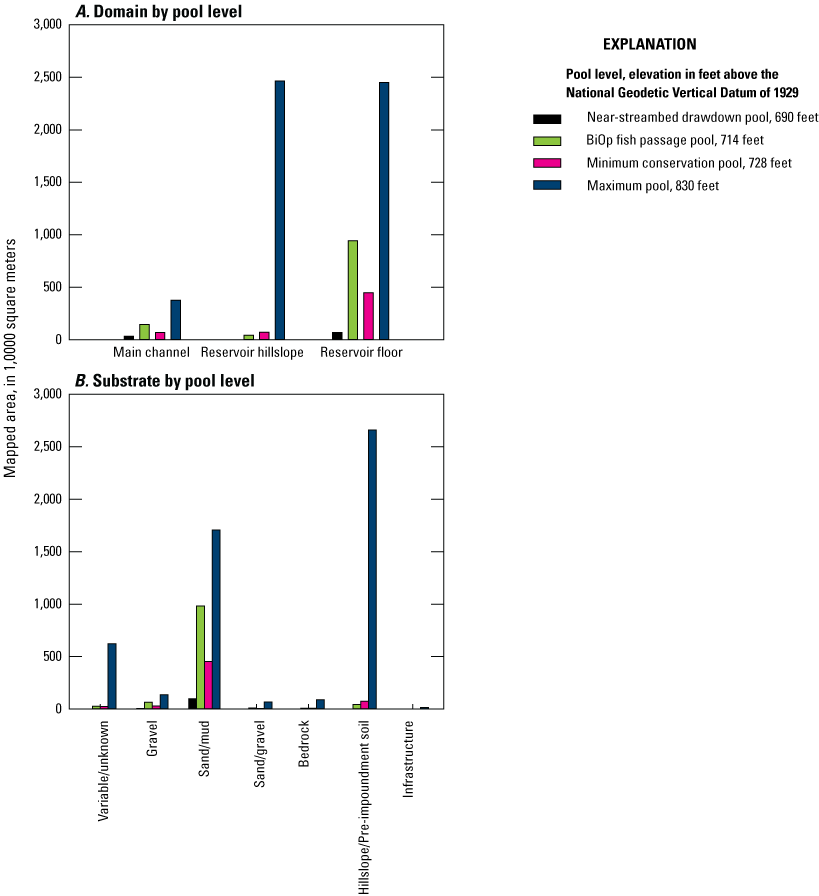
Distribution of reservoir domains (A) and mapped substrate units (B) as a function of key pool elevation at Fall Creek Lake, Oregon.
Magnitude and Distribution of Sediment Erosion and Deposition Water Years 2012–17
Magnitude of Erosion and Deposition in the Fall Creek Lake Water Years 2012–17
Within the lower reservoir of Fall Creek Lake, topographic change analyses show 143,200 m3 of change for erosion and 13,700 m3 of change for deposition (table B1; fig. B18). Total net erosion is 129,500 m3, which suggests an annual average net erosion rate over the 5-year analyses period of about 25,900 m3/year. However, field measurements downstream (Schenk and Bragg, 2014, 2021; G. Taylor, USACE, oral commun., 2017) indicate that larger amounts of sediment were eroded during earlier streambed drawdown periods (WY 2012–13) than during later drawdowns suggesting later streambed drawdowns were shifting toward being supply limited as sediments from accessible reservoir supply are exhausted, similar to patterns of reservoir sediment change observed following dam removals (for example, Major and others, 2012; Collins and others, 2017)
Table B1.
Volumetric changes calculated within the lower reservoir between January 13, 2012 (light detection and ranging [lidar] digital elevation model [DEM]), and November 10, 2016 (structure-from-motion digital surface model [DSM]), reservoir surveys acquired during streambed drawdown operations at Fall Creek Lake, Oregon.[Net change (t): Conversion from cubic meters to metric tons based on applying a general range of bulk density (1.13–1.71 grams per cubic centimeters as cited Randle and others, 2015); although, bulk densities may encompass a narrower range (Miller, 1953). Abbreviations: m2, square meters; m3, cubic meters; cm, centimeters; t, metric tons; NA, not applicable or not measured]
![Elevation changes calculated within the lower reservoir between January 13, 2012 (light
detection and ranging [lidar]), and November 10, 2016 (structure-from-motion), reservoir
surveys acquired during streambed drawdown operations at Fall Creek Lake, Oregon,
for the total area of interest (A), close-up near the reservoir thalweg (B), and close-up
of a distributary zone (C).](https://pubs.usgs.gov/sir/2023/5135/images/sir20235135_figB.18.png)
Elevation changes calculated within the lower reservoir between January 13, 2012 (light detection and ranging [lidar]), and November 10, 2016 (structure-from-motion), reservoir surveys acquired during streambed drawdown operations at Fall Creek Lake, Oregon, for the total area of interest (A), close-up near the reservoir thalweg (B), and close-up of a distributary zone (C).
Comparison of the reservoir elevation changes from 2012 to 2016 with mapped reservoir landforms shows erosion was focused in the main channels of Fall and Winberry Creeks (fig. B18). The area with greatest lowering of the reservoir topography was about 0.7 km upstream from the dam where the change in channel bed elevations decreased by up to 3.8 m (point A on fig. B18). Areas with a net increase in vertical elevation were few and mainly located along the channel margins (for example, rkm 13.4, point B on fig. B18) where deposition of less than a meter was caused by bar formation or sediment delivery from slumping banks. In some cases, drawdown terraces, situated above the channel bed, also accumulated sediment (for example, rkm 12.3, point C on fig. B18). Few vertically stable areas within the main channel of Fall Creek were measured, and where present, typically coincide with bedrock outcrops (for example, rkm 14; point D on fig. B18).
Much of the pelagic reservoir floor appeared vertically stable with no changes greater than the uncertainty threshold. Prominent areas of erosion within the reservoir floor domain were associated with drawdown channels, drawdown terraces, and drawdown distributary zones. The large distributary zone near the confluence of Winberry Creek (rkm 12.6; fig. B18) showed changes in elevation ranging from +0.32 to −0.9 m, though the overall feature was dominantly erosional with large areas of no detectable change. Some drawdown channels showed incision up to 1.8 m near the confluences of Fall and Winberry Creek channels (point E on fig. B18).
Patterns of Erosion and Deposition During the 2016 Streambed Drawdown
In addition to the volumetric analyses, direct comparison between the three orthophotographs acquired during the November 2016 (WY 2017) streambed drawdown were used to qualitatively assess patterns and processes of planimetric geomorphic change within Fall Creek Lake during a single streambed drawdown event. Comparison of 2016 orthophotographs between November 8 and 9, and November 9 and 10, shows the main channel was laterally stable along much of the reservoir except for the lowest 1.5 km of the reservoir where lateral adjustments in bank location were systematically greater than 0.5 m over distances of 20–50 m. For the period between November 8 and 9, the maximum observed lateral erosion resulted in about 2.5 m of bank retreat near rkm 13.4; over the following days (November 9–10) the maximum observed lateral erosion was about 0.75 m near the same location (figs. B19A–C). For both days, these findings suggest average lateral erosion rates of 1.1 m/day are possible at discharges of about 155–194 ft3/s at the end of the low precipitation drawdown period. Other localized erosion areas over November 8–10 were observed in drawdown surface landforms and along the transition between channel and reservoir floor (for example, fig. B19D–F). At different discharges or under other conditions, such as with substantial rain or below freezing temperatures, lateral erosion through reservoir floor deposits would likely vary. Additionally, bank stability also varies with water table elevation, so erosion rates are likely higher in the days immediately following lake lowering, when slumping may reflect positive pore pressure in exposed channel banks.
![Repeat orthoimagery acquired November 8, 9, and 10, 2016, during streambed drawdown
operations at Fall Creek Lake, Oregon. Images A–C and D–F show examples of areas of
the greatest lateral migration observed over the 3-day period along the main reservoir
thalweg about 1.5 and 0.07 kilometers (river kilometers [rkm] 13.4 and 11.9), respectively,
upstream from the dam.](https://pubs.usgs.gov/sir/2023/5135/images/sir20235135_figB.19.png)
Repeat orthoimagery acquired November 8, 9, and 10, 2016, during streambed drawdown operations at Fall Creek Lake, Oregon. Images A–C and D–F show examples of areas of the greatest lateral migration observed over the 3-day period along the main reservoir thalweg about 1.5 and 0.07 kilometers (river kilometers [rkm] 13.4 and 11.9), respectively, upstream from the dam.
Summary of Reservoir Evolution and Erosion During Streambed Drawdowns
Construction and operation of Fall Creek Dam has transformed 11 km of Fall Creek and adjacent valley floor from a single thread, semi-alluvial stream to a lacustrine environment dominated by fine-grained sediment deposition. Prior to dam construction, Fall Creek was a relatively straight channel flowing through a 50–1,000 m-wide valley floor (fig. B4). Since dam construction in 1965, sediment has been deposited across the valley floor, with sedimentation concentrated in the channel and lower reservoir near the Fall Creek Dam, where deposits are up to 3 m thick. Reservoir sediment deposits thin upstream and laterally away from primary channels (fig. B5).
Reservoir sedimentation since dam construction has resulted in a modest reduction in total water storage. At maximum pool, the loss of storage from 1965 to 2012 is less than about 2 percent (corresponding to about 1,520 acre-ft; fig. B6). However, change is not uniform across the reservoir. Between 1988 and 2012, a net increase in water storage (suggesting net erosion) occurred between elevations 680 and 698 ft, and net loss in water storage (indicating deposition) was dominant between elevations 698 and 727 ft. Altogether, the storage curves from 1988 to 2012 indicate Fall Creek Lake was continuing to accumulate sediment during this period, despite spanning one full streambed drawdown and multiple instances of near-streambed drawdown conditions (see the “Dam Infrastructure and Streambed Drawdown Operations at Fall Creek Dam” section in Chapter A. Introduction).
During most of the year when Fall Creek Lake fluctuates between minimum and maximum pool levels, lacustrine conditions dominate in the pool below minimum conservation level. When the lake is temporarily lowered during the drawdown, fluvial conditions dominate, and the pre-dam channel becomes a free-flowing channel subject to fluvial processes. Geomorphic mapping of the reservoir floor reveals four key categories of landforms and sediment processes within Fall Creek Lake related to lake level operations:
-
• Lacustrine sedimentation expressed in the reservoir floor occurs during relatively high pool levels. Where reservoir floor is mapped as pelagic (fig. B8), smooth, muted topography indicates burial of pre-dam topography (fig. B12, table B3).
-
• Erosion and formation of channel-like features created by streambed drawdowns occur primarily within reservoir floor and main channel deposits as the lake is draining. Erosional drawdown channel and terrace landforms are carved through underlying, unconsolidated sediments are prominent in the lower reservoir (figs. B8, B14). Sediment generated from the formation of and conveyance within these drawdown landforms can be transported to main or tributary channels and is more likely to be transported through and out of the reservoir than sediment deposited along valley floor landforms distant from channels. As lake levels fall below minimum conservation pool (728 ft) to streambed, sediment is eroded from reservoir deposits below minimum conservation pool and then flows to the lower reservoir near the dam through the main channel and small drainage channels that cross the reservoir floor.
-
• Fluvial erosion and deposition within historical stream channels occurs during streambed drawdowns and in free-flowing portions at higher pool levels. Well-defined channels for Fall and Winberry Creeks allow efficient conveyance of water and sediment through the reservoir during low lake levels. During streambed drawdowns, fluvial erosion of reservoir deposits delivers mostly sand and finer-grained sediment to the regulating outlets than can be exported downstream.
-
• Erosion on reservoir hillslopes is driven by wave interaction at lake levels and gravitational processes at relatively lower lake levels.
Vertical changes in the lower reservoir topography between January 2012 and November 2016 indicate overall net erosion and export of reservoir sediment (table B1; figs. B5, B18). During streambed drawdowns, the most prominent changes were along the channel in the lowermost reservoir where inferred incision, lateral migration, and slumping banks result in vertical and lateral adjustments to channel position. Minimal change was detectable within the reservoir floor domain except where erosion was associated with mapped drawdown related features (fig. B18).
Chapter C. Sediment Delivery from Fall Creek Lake and Transport through Downstream Reaches
During streambed drawdowns at Fall Creek Lake (fig. A7), reservoir sediments are transported downstream from Fall Creek Dam through Fall Creek and the Middle Fork Willamette River (fig. C1). Finer-grained sands, silts, and clays are entrained as suspended-sediment load in the water column, whereas coarser sediments that roll or bounce along the channel move as bedload. The annual amount of sediment released from the reservoir, distribution of grain sizes, and the temporal patterns in transport conditions immediately downstream, all partly determine sediment transport and geomorphic responses of downstream reaches to streambed drawdowns. Sediment transport conditions downstream from Fall Creek Dam (1) reflect erosional processes occurring in the reservoir and trends in reservoir erosion and reservoir sediment export, (2) indicate years with greater reservoir sediment transport to downstream reaches, and (3) potentially affect water quality, aquatic life, and downstream water users.
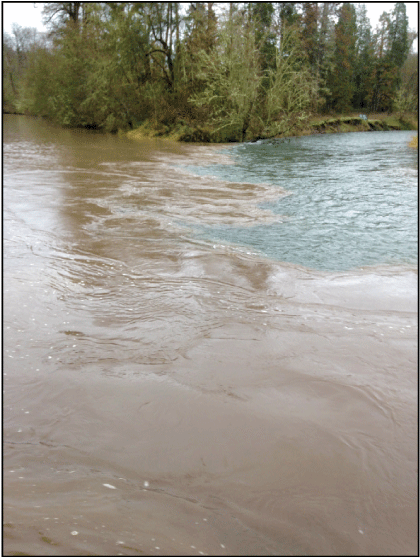
Confluence of Fall Creek (left side of photograph) and the Middle Fork Willamette River (right side of photograph) where relatively more turbid water sourced from streambed drawdown operations at Fall Creek Lake (11.5 kilometers [km] upstream) joins less turbid water released from Dexter Dam (9.4 km upstream), looking upstream, from river right. Photograph by Heather Bragg, U.S. Geological Survey, November 21, 2014.
This chapter describes the fluvial transport of reservoir sediments in Fall Creek and Middle Fork Willamette River downstream from Fall Creek Dam. To assess the character and interannual variability of reservoir sediment entering Fall Creek in response to streambed drawdowns in Fall Creek Lake, turbidity and suspended sediment were monitored in WY 2013–18. Monitoring occurred at multiple stations during WY 2013 (Schenk and Bragg, 2014; figs. A5, A6; table A2), then at the Fall Creek streamgage during WY 2014–18 (Schenk and Bragg, 2021; USGS, 2021). Additionally, a limited number of bedload measurements were made at the Fall Creek streamgage in WY 2013 (Schenk and Bragg, 2014) and in WY 2017. The sediment transport monitoring program focused on suspended sediment because previous studies (for example, Wohl and Cenderelli, 2000; Anderson, 2007) and anecdotal information from the WY 2012 streambed drawdown at Fall Creek (G. Taylor, U.S. Army Corps of Engineers, written commun., April, 2015; Brian Bangs, USFWS, oral commun., 2015) indicated that most reservoir sediment transported during the streambed drawdown was sand and finer-grained sediment, a hypothesis that was confirmed with both suspended-sediment and bedload measurements made at the Fall Creek streamgage. In the paired SSC and bedload measurement made in WY 2013, 51.7–72.9 percent of the suspended-sediment samples contained grain sizes less than 0.0625 mm and 97.7–98.2 percent of the bedload samples contained grain sizes less than 2 mm (Schenk and Bragg, 2014). Sediment quantity and grain size affect consequent changes in downstream channel morphology, so findings from the sediment monitoring program are necessary to evaluate morphologic adjustments related to streambed drawdowns (WY 2012–18) and to anticipate future changes from long-term implementation of annual streambed drawdowns. Fall Creek and Jasper streamgage datasets also reveal temporal variation in reservoir sediment transport rates and provide insight on how discharge affects transport capacity and how reservoir sediments may be temporarily deposited, eroded, and re-entrained through downstream reaches. The sediment monitoring program also focused on computing suspended-sediment loads (SSL) before, during, and immediately after the streambed drawdowns, typically spanning a 3–6-month monitoring period. The monitoring efforts varied each year, reducing the ability to compare year-to-year results and limit understanding about factors affecting reservoir sediment export.
Methods
Suspended-Sediment Monitoring and Calculation of Loads Water Years 2013–18
Continuous discharge and turbidity were used in conjunction with discrete SSC samples to develop ordinary least squares regression models following USGS techniques and methods described in Rasmussen and others (2009). At the Fall Creek streamgage (14151000), regression models were typically developed for three distinct phases within each yearly monitoring period, including pre-streambed drawdown, streambed drawdown, and post-streambed drawdown periods, reflecting changes in the grain size (sand versus finer-grained sediments) of suspended sediment that affected turbidity sensor response and relations of turbidity with SSC. However, for some years, a single regression model was developed owing to a limited number of samples or non-distinguishable grain-size characteristics of sediment between the phases (Schenk and Bragg, 2021). The regression models produced continuous records of SSC (at 15-minute intervals), which were combined with continuous discharge records (also at 15-minute intervals) to compute SSL for each monitoring location. For periods of missing turbidity, SSC was estimated using various methods and multiplied by the discharge to compute SSL; turbidity and SSC sampling and SSL computations followed established protocols (Edwards and Glysson, 1999; Rasmussen and others, 2009), and additional details can be found reports by Schenk and Bragg (2014, 2021).
Bedload Sediment Monitoring and Calculation of Transport Rates Water Years 2013 and 2017
Bedload measurement collection for WY 2013 is documented in Schenk and Bragg (2014) at the Fall Creek streamgage (fig. A6). Similar collection methods were employed in WY 2017. Sample collection in WY 2017 was timed to characterize transport rates at a variety of streamflows during and following streambed drawdown. Sampling followed the multiple equal-width-increment (MEWI) method described in Edwards and Glysson (1999) for two of the WY 2017 samples collected with two passes across the channel and a minimum of 20 total verticals. Two additional samples followed a slightly modified sampling protocol and consisted of 18 verticals. Bedload samples were collected by wading with a BLH-84 handheld sampler (7.6 by 7.6 cm opening, 1.4 expansion ratio) during lower streamflows on November 4, 2017, and from the cableway with a BL-84 sampler secured with a stayline about 15 m upstream during higher streamflows (fig. C2). Bedload samples were analyzed at the Cascades Volcano Observatory Sediment Laboratory for grain size and mass, as well as loss-on-ignition (LOI) for organic content. Samples were dried, sieved into full-phi size class and each size class weighed.
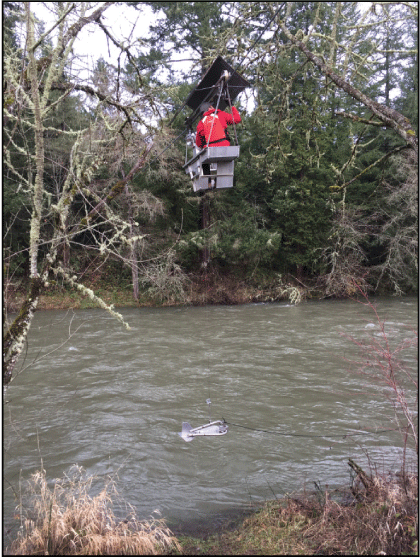
Bedload sampling from the cableway with a BL-84 sampler at the U.S. Geological Survey streamflow-gaging station Fall Creek below Winberry Creek, Oregon (14151000), looking toward right bank of Fall Creek. Photograph by Heather Bragg, U.S. Geological Survey, December 20, 2016.
A transport rate for each MEWI measurement was calculated following guidance in Edwards and Glysson (1999), using the formula
whereQb
is the bedload transport rate (kg/s),
w
is the width of the sampler (m),
M
is the total sample mass (kg),
W
is the wetted width (m), and
T
is the total sample time on the bed (s).
Each bedload sample pass was analyzed separately for grain size and LOI, but only the full samples were used to calculate transport rates. Bedload rates reported in Schenk and Bragg (2014) were computed with the English units form of equation 1 and are converted to SI units for this report.
Suspended-Sediment Transport Water Years 2013–18
Suspended-sediment transport was monitored at six sites along Fall Creek and the Middle Fork Willamette River (fig. A5; table A2) in WY 2013 and at two sites in WY 2014–18 (Schenk and Bragg, 2014, 2021; USGS, 2021). The sediment monitoring period each year spanned several months beginning approximately a few days to 1 month before the streambed drawdown and continuing through the winter season after the streambed drawdown operation, with the exception of WY 2018 when suspended-sediment concentration (SSC) samples were not collected after the drawdown. Suspended-sediment loads (SSL) were calculated for all sites in WY 2013 and at the Fall Creek streamgage for all monitoring years based on measurements of discharge, turbidity, and SSC (Schenk and Bragg, 2021; USGS, 2021). Suspended-sediment loads were not computed at the Jasper streamgage after WY 2013 because the measurements suggested non-uniform mixing of suspended sediment across the channel, rendering representative sampling for SSC more challenging and therefore expensive.
Continuous SSL computations, including 90-percent prediction intervals, were summarized for the full monitoring period each year, as well as shorter intervals corresponding to conditions when Fall Creek Lake levels were at or lower than streambed condition (below 690 ft NGVD29) to inform reservoir sediment export and associated downstream geomorphic changes. Total volume of water at the Fall Creek streamgage (14151000) was also calculated for the drawdown periods where lake levels were less than 690 ft to provide context for evaluating suspended-sediment transport relative to transporting streamflows by multiplying the instantaneous streamflow (in ft3/s) measured at 15-minute intervals by 900 and summing for the period.
Water Year 2013 Suspended-Sediment Budgets from Schenk and Bragg (2014)
Schenk and Bragg (2014) assessed suspended-sediment loads using computed SSC values and time series of streamflow at six sites in WY 2013 to develop sediment budgets between the Fall Creek Lake inflow and outflow and between the Fall Creek and Jasper streamgages. Over a 93-day period spanning the streambed drawdown, more than 6 times as much sediment was computed passing the Fall Creek streamgage (14151000; 54,300 metric tons [t], error ranging from 40,400 t [−25.7 percent] to 73,500 t [+35.2 percent]) downstream from the Fall Creek Dam as was entering the reservoir from Fall Creek (Fall Creek above North Fork near Lowell, Oregon, 14150290; 6,450 t; error ranging from 4,300 t [−33.3 percent] to 10,350 t [+60.5 percent]) and Winberry Creek (Winberry Creek near Lowell, Oregon, 14150800; 2,060 t; error ranging from 1,710 t [−17.1 percent] to 2,410 t [+16.9 percent]), most of which was mobilized during the 6-day streambed drawdown operation when turbidity and SSC were elevated (Schenk and Bragg, 2014; values for 14150290 updated from original report). Over a 106-day period, Schenk and Bragg (2014) also calculated a balance of about 7,440 t more suspended sediment at the Jasper streamgage (14152000) than at the Fall Creek streamgage (14151000) accounting for sources from Little Fall Creek (Little Fall Creek near Lowell, Oregon, 435730122483201) and the Middle Fork Willamette River near Dexter Dam (Middle Fork Willamette River near Dexter, Oregon, 14150000), but about 25,000 t more sediment passing the Fall Creek over a shorter 6-day period coinciding with the streambed drawdown. The authors note:
“This difference may represent unquantified SSL from tributaries downstream of Fall Creek Lake and Dexter; resuspension of sediment stored in Fall Creek and the Middle Fork Willamette River; underestimation of SSL from the upstream sites; overestimation of SSL at Jasper; or a combination of all four. Conversely, the positive difference during the 6-day drawdown indicates sediment deposition and storage in the same river reaches; an overestimation of SSL from the upstream sites; underestimation of SSL at Jasper, or a combination of all three.”
Suspended-Sediment Transport at the Streamflow-Gaging Station Fall Creek Below Winberry Creek, Oregon (14151000), Water Years 2013–18
Suspended-sediment loads computed for the full monitoring periods WY 2013–18 at the Fall Creek streamgage 1.4 km downstream from Fall Creek Dam range from 54,700 t in WY 2013 to 13,900 t in WY 2018 (table C1; figs. C3, C4). Calculated SSL were greatest in WY 2013 measured for the 119 day monitoring period, and 73 percent of that mass occurred during the 5.0-day drawdown period when lake levels were below 690 ft (40,200 t; table C1; figs. C3, C4). Substantially less suspended sediment was calculated for WY 2014 (25,100 t for the 133-day monitoring period) when cumulative discharge was about a third of that observed in WY 2015 and when air temperatures were below freezing conditions in the first few days of the 9.1-day streambed drawdown period (table C1; figs. C3, C4). Extensive ice within the reservoir during the beginning of the WY 2014 streambed drawdown combined with low discharges led to reductions in reservoir erosion and subsequent sediment export to downstream reaches (Schenk and Bragg, 2021). In WY 2015, 33,000 tons of suspended sediment were mobilized during the 103-day monitoring period, including 7,160 t during the 3.8 days when reservoir elevations were less than 690 ft; 1,740 t (error ranging from 1,040 t [−40.1 percent] to 2,170 t [+25.1 percent]) were transported in the period when the reservoir elevation was raised and lowered in the middle of the drawdown, for a total of 8,900 t during the drawdown timeframe. In WY 2016, the computed load over the 206-day monitoring period (25,600 t), and the sediment mobilized during the streambed drawdown below 690 ft (5,900 t) were slightly less than WY 2015 even though the WY 2016 streambed drawdown durations was about twice as long and cumulative discharge was about 25 percent greater than in WY 2015; although daily median discharge during the drawdown was much lower (table C1). The reservoir elevation also was raised and lowered in the middle of the WY 2016 drawdown; SSL export for lake elevations below 690 ft (5,900 t) and the 4.6 days above 690 ft (2,980 t; error ranging from 1,680 t [−43.7 percent] to 5,260 t [+76.7 percent]) during the streambed drawdown timeframe resulted in the similar SSL (8,900 t) as the WY 2015 streambed drawdown timeframe including SSL from above and below 690 ft. In WY 2017, 18,600 t of suspended sediment was calculated for the full 198-day monitoring period. The second greatest loads calculated for the streambed drawdown period occurred in WY 2017 and 2018, which both had 11,300 t of SSL during the respective drawdowns, at low and moderate median streamflow observed during the drawdown monitoring program (table C1).
Table C1.
Calculated suspended-sediment loads for periods of monitoring at U.S. Geological Survey streamflow-gaging station Fall Creek below Winberry Creek, Oregon (14151000), for partial water-year monitoring periods and streambed drawdown monitoring periods to evaluate streambed drawdown operations at Fall Creek Lake from water year 2013 to 2018 (Schenk and Bragg, 2014, 2021).[Suspended-sediment loads include missing and estimated data. Prediction interval loads do not include missing or estimated loads that are included in the total load. Streambed drawdown dates based on lake elevations of 690 feet NGVD29. Dates: month/day/year. Abbreviations: DD, drawdown; SSL, suspended-sediment load; PI, prediction interval; Q, discharge; WY, water year; %, percent; +, plus; –, minus]
Fall Creek Lake levels were raised above 690 feet NGVD for short periods during the WY 2015 and 2016 streambed drawdowns. Suspended-sediment load data between 11/22/2014 4:00:00 AM and 11/26/2014 4:00:00 AM and between 11/18/2015 5:15:00 AM and 11/22/2015 8:30:00 PM are excluded from the streambed drawdown (DD) loads in this table.
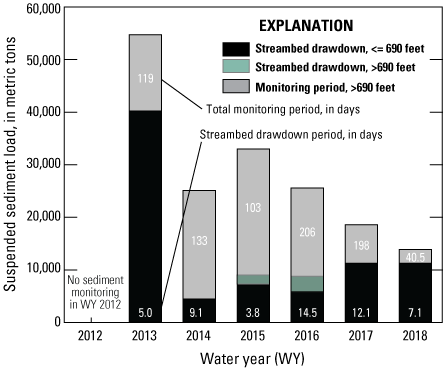
Total suspended-sediment loads at U.S. Geological Survey (USGS) streamflow-gaging station Fall Creek below Winberry Creek (14151000) calculated for the period coinciding with streambed-drawdown conditions (pool elevations below 690 feet [ft]) and for the full monitoring period each water-year from 2013 through 2018 (fig. modified from Schenk and Bragg, 2021; USGS, 2021). [<=, less than or equal to; >, greater than]
![Cumulative suspended-sediment loads and cumulative discharge at U.S. Geological Survey
streamflow-gaging station Fall Creek below Winberry Creek (141151000) for water years
[WY] 2013–18.](https://pubs.usgs.gov/sir/2023/5135/images/sir20235135_figC.4.png)
Cumulative suspended-sediment loads and cumulative discharge at U.S. Geological Survey streamflow-gaging station Fall Creek below Winberry Creek (141151000) for water years [WY] 2013–18.
Despite considerable year-to-year variability in SSL, streamflow conditions, dam operations, and partial-year monitoring programs that varied in duration and preclude calculation of annual loads, the SSL data from WY 2013 to 2018 reveal three key findings. First, total loads for each WY monitoring periods were much higher in WY 2013 compared with WY 2014–18, indicating diminishing sediment supply (table C1). Although WY 2014 data likely reflect anomalously low sediment export due to freezing conditions and low inflows to Fall Creek Lake, subsequent years also resulted in suspended-sediment loads that were 40–66 percent lower than those computed for WY 2013. Second, the suspended-sediment loads passing the Fall Creek streamgage during streambed-drawdown conditions (lake level below 690 ft) comprise a major portion (between 18 and 73 percent) of each-year’s full monitoring period sediment load (table C1; fig. C4). Third, seasonal patterns of suspended-sediment transport followed a similar overall pattern each year whereby sediment loads are low prior to the drawdown, then increase rapidly as lake levels approach the streambed drawdown elevation of 680 ft (fig. C5). Following the drawdown period (as lake levels rise above 690 ft), calculated loads remain slightly elevated above pre-drawdown levels but decline through the following months (fig. C4).
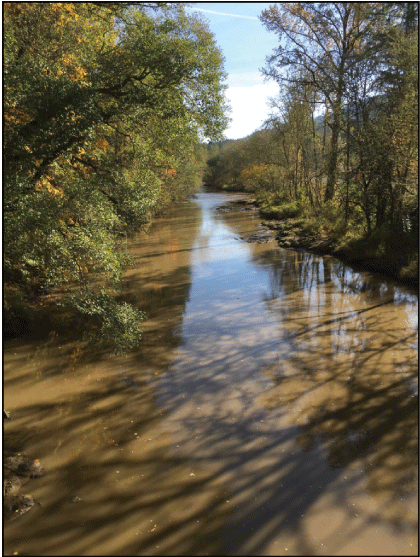
Fall Creek during streambed drawdown operations depicting a period of elevated turbidity and suspended-sediment concentration. Photograph of Fall Creek, looking upstream. Taken by Heather Bragg, U.S. Geological Survey, November 6, 2015.
Bedload Sediment Transport Water Years 2013 and 2017
Although the primary focus of the WY 2013–18 USGS Fall Creek drawdown sediment monitoring program was suspended-sediment transport, fluvial erosion of the reservoir during streambed drawdown operations results in export of coarser sands and gravels transported as bedload to downstream reaches. In gravel-bed rivers like Fall Creek and the Middle Fork Willamette River, bedload sediment supply is a key factor determining channel morphology, as increases in grain size or flux rates can result in aggradation, increased rates of channel migration, or other morphologic adjustments (for example, Leopold, 1992; Church, 2006).
To assess the magnitudes and grain sizes of bedload sediment exported from Fall Creek Lake during the streambed drawdowns, a limited number of bedload transport measurements were made at the Fall Creek streamgage in WY 2013 (Schenk and Bragg, 2014) and WY 2017. Unlike the suspended-sediment monitoring that quantified the sediment loads at the Fall Creek and Jasper streamgages, the main objectives for measuring bedload were to assess the grain-size distribution and magnitude of coarse sediments transported as bedload during drawdowns and the relative importance of bedload transport to determine how coarse sediment export from Fall Creek Lake could affect channel morphology and aquatic habitats downstream from the dam that might warrant further monitoring and investigation.
Table C2.
Bedload measurement mass, sand and organic content, and calculated bedload discharge rates for bedload samples collected at the Fall Creek below Winberry streamflow-gaging station (14151000), Oregon, in water years 2013 and 2017 during and following Fall Creek Lake streambed drawdowns.[Water year 2013 data from Schenk and Bragg (2014). Water year 2017 bedload samples each consisted of two cross-sections that were analyzed individual for grain size and organic content, but the full sample is used to calculate bedload discharge rates. Discharge varied over the collection of some samples. Values representative of the dominant discharge collected during sampling. Total mass: Sample mass in grams as reported from laboratory analyses completed at the U.S. Geological Survey Cascades Volcano Observatory Sediment Laboratory. Abbreviations: ft3/s, cubic feet per second; m3/s, cubic meters per second; g, grams; kg/s, kilograms per second; kg/min, kilograms per minute; kg/min/m, kilograms per minute per meter; mm, millimeter; WY, water year; NA, not applicable or not measured]
In WY 2013, 6 MEWI bedload samples were collected at the Fall Creek streamgage at streamflows ranging from 737 to 894 ft3/s and in mass from 839 to 1,523 grams (g) during the streambed drawdown operation (table C2; fig. C6). At the beginning of the drawdown (0 days), organic content ranged from 25 to 42 percent (table C2; fig. C6). The 4 subsequent measurements made during the streambed drawdowns also had relatively high organic contents ranging from 18 to 23 percent of the sample. The inorganic portion of each sample was dominantly finer than 2 mm (97.0–98.1 percent; table C2; fig. C6). The largest clasts observed during the WY 2013 measurements did not exceed 4 mm. Calculated instantaneous transport rates for the six samples were consistent (49–88 kg/min; or unit bedload discharges of 1.7–3.1 kg/min/m) over the small range of streamflows sampled during the streambed drawdowns (Schenk and Bragg, 2014, table C2).
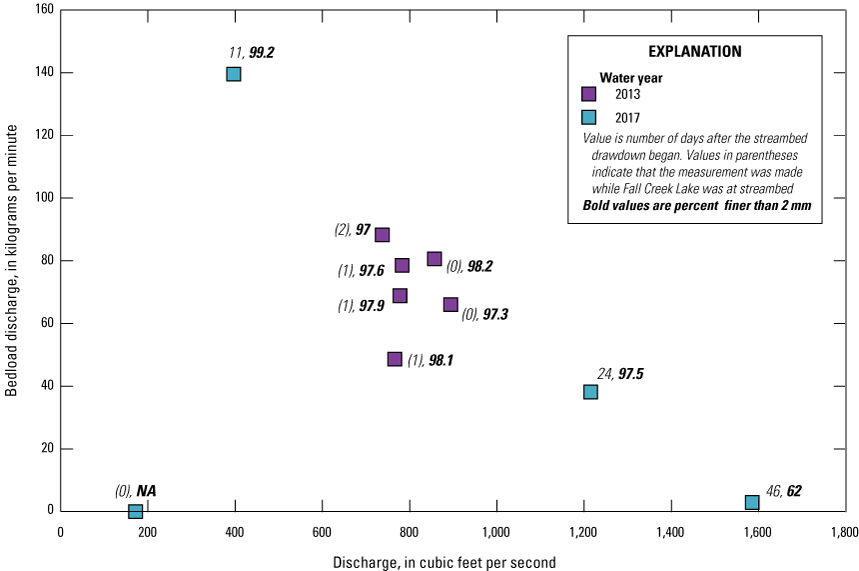
Calculated bedload discharge rates versus streamflow at the U.S. Geological Survey streamflow-gaging station Fall Creek below Winberry Creek (14151000) for samples collected in water years 2013 and 2017. Points are annotated with percent sand and finer content in bold and the number of days following the first day of full streambed drawdown in italics. Values in parentheses indicate the measurement was collected during the Fall Creek Lake streambed drawdown operations.
In WY 2017, 4 MEWI bedload samples were collected at the Fall Creek streamgage at streamflows ranging from 171 to 1,590 ft3/s. No sample was retained for the November 4, 2016, measurement collected during the streambed drawdown as the sample was almost entirely comprised of leaves and other organic debris and assumed to have an associated bedload transport rate of 0 (table C2; fig. C6). The remaining 3 samples ranged in mass from 147 to 2,203 grams (table C2; fig. C6). Organic content for each sample ranged from 1.6 to 15.2 percent (substantially lower than WY 2013), and the inorganic component was mainly sand and other particles less than 2 mm (varying from 67 to 99 percent). Coarser clasts usually did not exceed 32 mm and comprised a minimal component of the total bedload sample except in the final sampling effort on December 20, 2016, when coarser grains composed nearly 40 percent of the sample collected 36 days after the start of the WY 2017 drawdown at a streamflow of 1,585 ft3/s (table C2; fig. C6). Transport rates in WY 2017 spanned a greater range of streamflows and timing after the drawdown began than the suite of samples from WY 2013 and resulted in a larger spread of calculated transport rates (approximately 0–139 kg/min; or unit bedload discharges of 0–4.8 kg/m/m). During field visits to the streamgage site in January and March 2017, the presence of small gravel (about 32 mm or smaller) littering the low-flow channel margins was noted, but by May 2017, most of those gravels had been transported past the site.
In both WY 2013 and 2017, too few samples were collected to develop a relation between stream discharge and bedload sediment, and the large variability in reservoir sourced sediment over a season would further make that impractical. However, assessment of instantaneous transport rates as function of discharge is useful. In conditions where bedload sediment supply is unlimited relative to a stream’s ability to transport available sediment (where transport capacity is transport limited [Gilbert and Murphy, 1914, p. 35]), bedload transport rates would be expected to increase with increasing stream discharge. Downstream from Fall Creek Dam, however, the bedload transport data reveal decreasing bedload rates (excluding the November 4, 2016, sample) with increasing stream discharge when the reservoir is at streambed. Bedload transport rates were smaller at higher streamflows months after the streambed drawdown (fig. C6).
The reduction in measured bedload transport rates with increasing discharge likely reflect diminishing sediment supply from the reservoir and reach upstream from the Fall Creek streamgage during the streambed drawdowns. The predominance of sediment less than 2 mm in most of the bedload samples confirms sand and smaller sediment preferentially is eroded and transported from Fall Creek Lake during streambed drawdowns, despite the abundance of exposed gravel apparent in the main channel of the reservoir (described in “Reservoir Landforms, Processes, and Sediment Characterization” section). However, the relatively high percentage of coarse sediment greater than 2 mm in the December 20, 2016, sample (about 39 percent) compared with previous bedload samples may reflect characteristics of the sediment supply or transport capacity. For example, (1) the supply of sand-sized sediment available for downstream transport as bedload had diminished in the 36 days following the start of the November 2016 drawdown; (2) higher discharges in December 2016 increased sediment transport capacity, enabling greater bedload transport of gravel (greater than 2 mm); or (3) higher discharges may have enabled finer sands to travel as suspended-sediment load rather than bedload, lowering the bedload transport rates and coarsening the resulting fraction carried as bedload. Field observations by the sediment-gaging team suggest an exhausted supply of fine-grained sediment in the channel upstream from the streamgage by about December 20, 2016, but additional bedload measurements paired suspended-sediment measurements at the Fall Creek streamgage would have been needed to confirm these hypotheses.
Summary of Suspended-Sediment and Bedload Transport
Sediment monitoring to evaluate the quantity and character of sediment exported from Fall Creek Lake in relation to streambed drawdowns spanned the several months of each streambed drawdown operation in WY 2013–18 (Schenk and Bragg, 2014, 2021; USGS, 2021). Sediment delivered from the reservoir to downstream reaches was primarily in suspension and comprised of sand and fine-grained particles smaller than 2 mm. Some coarser grains as large as 32 mm were also mobilized and transported downstream from the dam as bedload. However, bedload comprises a small part of total sediment load; based on paired bedload and SL sampling in WY 2013, bedload comprising 8–15 percent of total load (Schenk and Bragg, 2014). Suspended-sediment budgets developed for WY 2013 by Schenk and Bragg (2014), showed greater transport at the Jasper streamgage than the Fall Creek streamgage during pre-drawdown and post-drawdown periods suggesting sources of fine-grained sediment from sources other than Fall Creek Lake or possibly from WY 2012 streambed drawdown sediments deposited within the 14.9-km segment between the Fall Creek and Jasper streamgages.
Computed partial-year SSL varies with streamflow conditions, dam operations, and the length of each partial-year monitoring program. Variation in monitoring period in different years reduces the ability to compare SSL between years and makes it challenging to understand factors affecting sediment export from the reservoir. SSL for the full monitoring period and during the streambed drawdown, were greatest in WY 2013 and probably greater in WY 2012, though no monitoring was completed during the first full streambed drawdown. Total SSL for full monitoring periods each year have decreased since WY 2013, and loads computed for the drawdown periods between WY 2014 and 2018 vary by about 6,800 t, suggesting a diminished supply of sediment from the reservoir wedge deposit. WY 2014 data likely reflect anomalously low sediment export due to low streamflows and freezing conditions, but temperature as a driving factor of sediment erosion was not evaluated for this study. Seasonal patterns of suspended-sediment transport followed a similar overall pattern each year whereby sediment loads are low prior to the drawdown, then increase rapidly as lake levels approach the streambed drawdown elevation of 680 ft. Following the drawdown period during increasing pool levels, SSL remained slightly elevated above pre-drawdown levels, with high SSC but reduced streamflow, and declined through the following months.
A limited number of bedload measurements in WY 2013 and 2017 precludes assessing bedload fraction of total load sediment transport for entire water years, and for all years where drawdown monitoring occurred (WY 2013–18). However, those measurements show reduced bedload transport rates with increasing discharge and likely reflect diminishing sediment supply from upstream. Sand was more abundant than gravel in all the bedload samples confirming that erosion and transport during streambed drawdowns primarily consisted of sediment with diameter less than 2 mm (sands and smaller) at Fall Creek Lake.
Chapter D. Geomorphic Responses to Fall Creek Lake Streambed Drawdowns Downstream from Fall Creek Dam
The annual streambed drawdown operations at Fall Creek Lake in WY 2012–18 mobilized and transported reservoir sediments to downstream reaches (chaps. B, C). Sand and finer-grain sediments can deposit in downstream channels, off-channel features, and overbank areas where changes in channel morphology and substrate can affect aquatic habitats, flood conveyance, and infrastructure. Fall Creek and Middle Fork Willamette River downstream from Fall Creek Dam provide migration and rearing habitat for ESA-listed spring Chinook salmon (Oncorhynchus tshawytscha) as well as other native fish and wildlife, such as Oregon Chub which were formerly an ESA listed species (U.S. Fish and Wildlife Service, 2015), prompting questions about the effects of reservoir sediments on aquatic habitats. Additionally, numerous residential properties are located on low-elevation floodplains downstream from Fall Creek Dam, as well as infrastructure such as bridges, roads, and water diversions, which can be affected by changes in channel conveyance or morphology associated with sediment deposition. The streambed drawdowns at Fall Creek Lake are, at the time of this publication, an annual operation that are likely to occur for years or decades into the future, motivating questions about the longer-term, cumulative geomorphic responses of streambed drawdowns on downstream reaches.
The morphology and substrates of gravel-bed rivers like Fall Creek and Middle Fork Willamette River reflect sediment transport conditions produced by the balance between sediment supply and transport capacity (Church, 2002, 2006; Lisle, 2012). On these regulated rivers, both sediment supply and transport capacity have been substantially diminished by the presence of upstream flood control dams (figs. A2, A5). The Fall Creek Lake drawdown operations increased the supply of sediment entering downstream reaches, which in turn may trigger adjustments in channel morphology and grain sizes within the channel bed and floodplain areas. The magnitude, duration, and frequency of sediment released from Fall Creek Lake determines sediment supply conditions to downstream reaches. When coupled with the hydrogeomorphic conditions unique to each reach and upstream flood control operations at Fall Creek and Dexter Dams, a unique suite of potential downstream geomorphic responses can occur compared with other reservoir operations elsewhere that have released sediment to downstream reaches (for example, intentional sediment releases to support reservoir sediment management such as those documented by Shelley and others, 2021).
Existing studies provide useful context for anticipating the likely range of downstream geomorphic responses that may result from streambed drawdowns at Fall Creek Lake and highlight priority areas for research and monitoring addressed in this study. Within the active channel of gravel-bed rivers, sand and fine-sediment deposition can trigger changes in the texture, planform, and morphology of bed and bar landforms (Buffington and Montgomery, 1999; Leopold, 1992; Church, 2006). Changes along channel margins could include deposition in off-channel areas or channel perimeter where slow velocities permit suspended sediment to settle. Overbank deposition could occur on low-elevation bars (particularly those that are vegetated), which flank many of the rivers downstream from USACE dams in the Willamette Valley (Wallick and others, 2013). Geomorphic changes could occur at a range of spatial scales from small areas (less than 1 m2) to entire landforms (hundreds of m2) or reaches (thousands of m2). Geomorphic responses to large sediment loads can be temporary or persistent, depending on local patterns of sediment supply and transport capacity in the days, months, and years following sediment release and could occur immediately (in the days or weeks following drawdown) or over longer time scales (in months, years following drawdowns) (for example, Wohl and Cenderelli, 2000; Major and others, 2012). For example, small gravels and fine-grained sediment released from the Halligan Reservoir, Colorado, during drawdown operations were primarily deposited in main channel pools of the North Fork Poudre River and in eddy bars along channel margins (Wohl and Cenderelli, 2000). Over the year following initial deposition, coarse reservoir sediment was first evacuated from pools closest to the dam and subsequently eroded from pools farther downstream, whereas eddy deposits were generally reworked and persisted longer (Wohl and Cenderelli, 2000).
This chapter describes changes in channel substrates, overbank deposition, and channel morphology across varying spatial and temporal scales that occurred in the days to years following implementation of annual streambed drawdowns at Fall Creek Lake. Multiple independent monitoring and mapping approaches were employed to address questions about the near- and long-term responses of annual reservoir sediment releases to reaches downstream from Fall Creek Dam, focusing on channel areas that are subject to inundation in the current (post-dam) streamflow regime. Each approach targeted specific geomorphic processes within different active channel and overbank areas and the unique changes that can result from the introduction of reservoir sediments. Monitoring approaches encompass a range of spatial scales (sites, landforms, and reaches) and temporal scales to document geomorphic responses in the days, months, and years following implementation of the streambed drawdowns. The geomorphic responses to the streambed drawdowns, spatial scale of those responses, and approaches used to evaluate those responses are divided into two categories:
-
(1) Site-scale characterization of channel bed elevations, bed-material grain sizes, and overbank deposition are paired with landform-scale evaluation of deposition and erosion patterns. Paired observations are used to quantify changes that would not be detectable with reach-scale approaches and were used to track rapidly changing conditions following the streambed drawdowns. Methods include specific streamgage analyses, bed-material measurements, deposition measurements on clay-horizon markers, and comparison of repeat light detection and ranging (lidar) datasets spanning multiple periods following the implementation of streambed drawdowns at Fall Creek Lake.
-
2) Reach-scale changes in channel planform 2- to 5-year intervals are evaluated with repeat geomorphic channel mapping from aerial photographs to assess incremental and cumulative changes in channel morphology that reflect multiple drawdowns, as well as other influences such as streamflow, spanning WY 2005–16.
Site-Scale Changes in Channel-Bed Elevations, Bed-Material Grain Size, and Fine-Sediment Deposition and Landform-Scale Evaluation of Erosion and Deposition in Response to Streambed Drawdowns
Site-Scale Changes in Channel-Bed Elevation at Streamgages from Specific Streamgage Analyses, Water Years 1972–2020
Vertical changes in bed-elevation can be evaluated with specific streamgage analyses (Blench, 1969; Klingeman, 1973; Juracek and Fitzpatrick, 2009; Cashman and others, 2021). Discharge values at many USGS streamflow-gaging stations are computed from stage measurements based on a stage–discharge relation (rating curve; for example, see Rantz, 1982). Over time, that relation can change with local changes in hydraulics or channel geometry. Changes in channel geometry due to vertical adjustments from channel bed lowering (incision) or raising (aggradation) are easier to detect at low streamflow than at higher streamflows that are more sensitive to changes in channel width. Field measurements of stage and discharge collected over time are used to create a rating curve. Persistent adjustments in the channel bed may warrant creation of a new rating curve, whereas temporary adjustments due to episodic fill or scour related to sources of streamflows (floods) or sediments (drawdown operations, upstream bank failure, or debris flows) would deviate from an existing rating curve but not require a whole new rating curve. The methods for specific streamgage analyses at the USGS streamflow-gaging stations at Fall Creek, as well as at Dexter and Jasper (Middle Fork Willamette River; fig. A6), are presented here with findings focused on the period spanning streambed drawdowns at Fall Creek Lake to identify potential changes in channel bed elevation relating to reservoir sediment releases. Longer-term changes in bed elevations at the Jasper gage were evaluated with specific streamgage analyses (spanning 1953–2012) by Wallick and others (2013) and based on earlier analyses by Klingeman (1973).
Specific Streamgage Analyses Methods
For this study, specific streamgage analyses were used to identify local variation in the channel bed elevations and longer-term trends in the stage-discharge relations for USGS streamflow-gaging station 14151000 Fall Creek below Winberry Creek, Oregon (rkm 10.1). The streamgage has been at its current location and datum since August 1982, prior to which it resided on left bank at the same datum since September 1935 (non-recording streamgage before August 4, 1950). From October to December of 1911, a non-recording streamgage was located 0.25 miles downstream from the current location. Field measurements made for discharges less than 6,000 ft3/s (corresponding to maximum release from Fall Creek Dam) were selected to compare measured stage at various discharge values with rated stage values:
whereStageM
is the measured stage at a given discharge,
StageRC
is the rated stage at a given discharge and can be determined from a rating curve, and
Stageresidual
is the stage residual or difference between measured and rated stages.
For example, if the measured streamflow of 100 ft3/s corresponds to a stage of 10.00 ft on the rating curve, but the measured stage at 100 ft3/s is 10.04 ft, this results in a +0.04 ft stage residual indicative of channel fill using the streamgage datum and the benchmark rating (current rating curve for the Fall Creek streamgage is 26.0; current ratings available at WaterWatch [USGS, 2023]; current and historical available by contacting the USGS). Field measurements are typically rated for accuracy (excellent, ±2 percent; good, ±5 percent; fair, ±8 percent; or poor, greater than 8 percent; Curtis and others, 2021). Though no measurements were removed based accuracy rating, a summary of the quality of data for each streamgage is provided in the results.
R-statistical language was used to extract and compare field measurements directly from the National Water Information System (NWIS; R-script modified from Anderson, S.W, U.S. Geological Survey, written commun., 2017). Early field measurements (prior to the 1970s) are generally not included in the NWIS database (USGS, 2021), although they are available on request; and the first discharge measurement available in NWIS below the 6,000 ft3/s threshold discharge was collected January 25, 1972; hence, earlier field measurements not in NWIS were excluded. A similar approach was used to evaluate vertical changes in streambed at the USGS streamflow-gaging stations on the Middle Fork Willamette River near Dexter (14150000) and Jasper (14152000). The discharge threshold for both sites was set to 7,500 ft3/s, which is a moderate streamflow for the larger, alluvial Middle Fork Willamette River and is more likely to reveal variation in the channel bed elevation compared with higher-streamflow measurements where variation in stage may reflect changes in channel banks or streamside vegetation. The streamflow records at the Dexter streamgage began in 1946 although the streamgage has only been at its current location since 1955. Similarly, streamflow gaging at Jasper dates back to as early as 1905 although the streamgage has been at its current location since 1953. The first measurements made below 7,500 ft3/s on the Dexter and Jasper streamgages that were available in NWIS are from 1983 and 1985, respectively, so prior measurements were excluded from the specific streamgage analyses.
Specific Streamgage Analyses Results
At the Fall Creek streamgage, 261 field measurements (from January 25, 1972, through September 24, 2020) were less than 6,000 ft3/s and available in NWIS. Of those measurements, 56 percent were categorized as good, 39 percent were categorized as fair, and 5 percent were categorized as poor (1 measurement was unspecified). Stage residuals between those measurements and predicted stages from the benchmark rating curve 26.0 range from −0.07 to 0.32 m where negative values are lower than current rating predicted stage and positive values are higher (fig. D1A). Overall, measured stages at the streamgage are relatively stable with 252 of the field measurement residuals evaluated falling within 2 standard deviations (plus or minus [±] 0.07 m) of the mean (0.00 m) from the rating curve prediction. The other nine residual values all were positive and four of those values coincide with to Fall Creek Lake streambed drawdown events (fig. D1B). Since the streambed drawdowns began in WY 2012, field measurements show slightly greater deviations from the current rating that occur during or shortly after (a few months) the official streambed drawdown. The most apparent of these deviations is for three measurements made during the WY 2012 drawdown where the relation between streamgage height and discharge suggests an increase in local bed elevation of 0.12 m (December 1, 2011) relative to the current rating and reaching as much as 0.32 m on January 25, 2012. During the WY 2013 streambed drawdown, measurements made on December 12 and 13, 2012, were nearly 0.09 m greater than predicted from the current rating curve. Other measurements collected during subsequent streambed drawdown periods of WY 2014–18 were generally closer to predicted values.
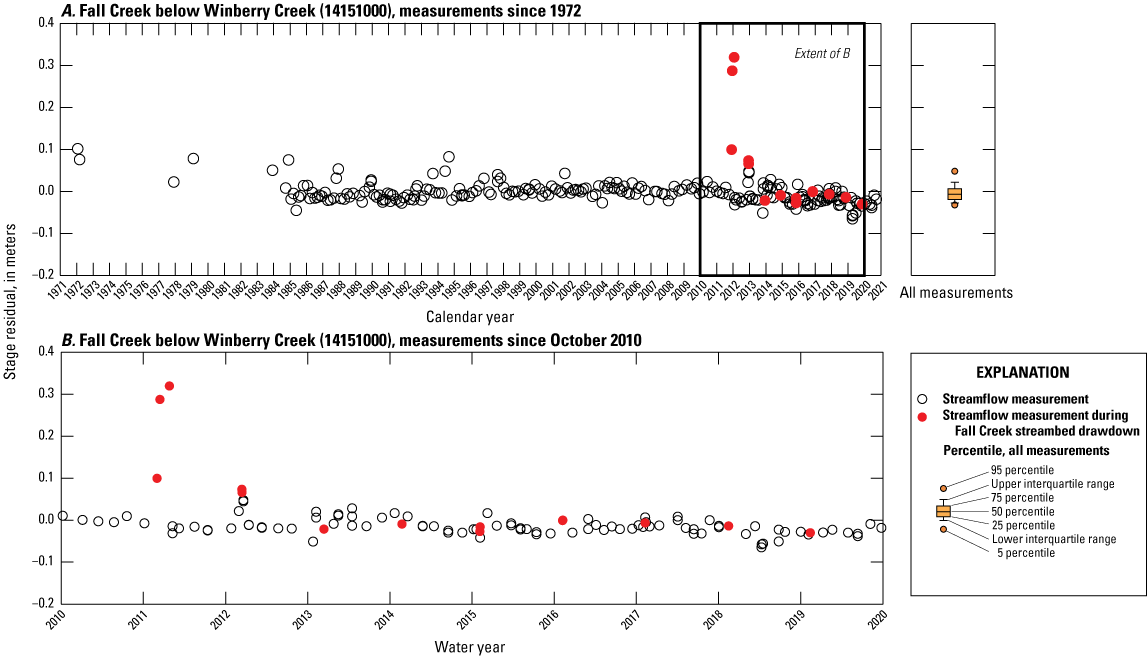
Residuals between the stage–discharge relation field measurements and the current stage–discharge rating curve (26.0) from January 25, 1972, to September 24, 2020, for the U.S. Geological Survey streamflow-gaging station 14151000 Fall Creek below Winberry Creek, Oregon (A), and higher resolution graph of the residuals since annual streambed drawdowns began in water year 2012 (B).
Specific streamgage analyses at the Fall Creek streamgage indicate that, although channel bed elevations varied minimally between 1972 and 2020, temporary increases in the bed elevation occurred in the months following streambed drawdowns in WY 2012–20. The overall trend of vertical stability is supported by minimal net variation in the stage-discharge relation, coinciding with field observations of bedrock near the Fall Creek streamgage and other historical analyses that indicate long-term stability (Keith and others, 2023a). The few measurements with the greatest stage residuals were recorded during streambed drawdowns in WY 2012 and 2013 (fig. D1B) likely reflect actual increases in water surface elevations driven by temporary increases in channel bed elevation and are consistent with observations of temporary sediment storage on the channel bed during the drawdowns (fig. D2). These apparent increases in bed elevation during the early streambed drawdown periods do not persist throughout the year, and sediment dissipates quickly (days to weeks) depending on magnitude of sediment released following the streambed drawdown. The temporary increases in bed elevation during the drawdowns were greater in WY 2012 and 2013 than during the WY 2014–20 drawdowns, consistent with patterns of SSL for WY 2012–18 (Chapter C. Sediment Delivery from Fall Creek Lake and Transport through Downstream Reaches).
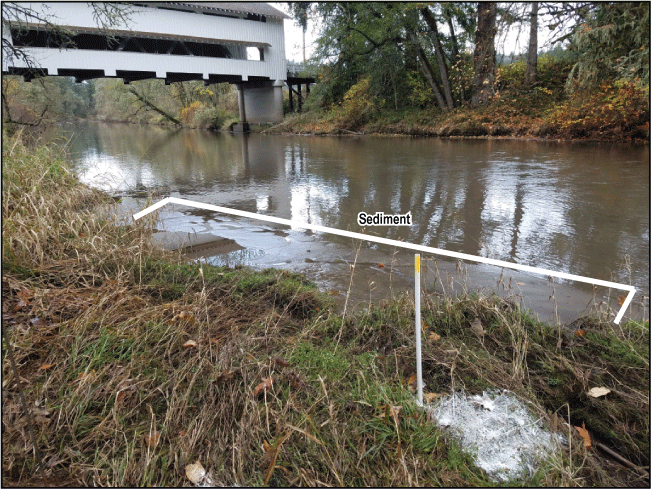
Temporary sediment storage in the main channel of Fall Creek during streambed drawdown operations at Fall Creek Lake (1.4 kilometers [km] upstream). Photograph of Fall Creek looking toward right bank near the U.S. Geological Survey streamflow-station Fall Creek below Winberry Creek, Oregon, 14151000. Photograph by Mackenzie Keith, U.S. Geological Survey November 9, 2016.
Channel bed elevations along the Middle Fork Willamette River were evaluated from gaging station measurements available in NWIS that date back to the early 1980s. Specific streamgage analyses indicate a trend of gradually decreasing bed elevations at the Dexter streamgage and generally stable bed elevations at the Jasper streamgage. At the Dexter streamgage (located upstream from the Fall Creek confluence and 4.8 km downstream from Dexter Dam), there have been 212 measurements at discharges lower than 7,500 ft3/s between December 7, 1983, and September 3, 2020 (post-regulation). Thirty-five percent of the measurements were categorized as good, 53 percent were fair, and 11 percent were poor (1 measurement was unspecified). Stage residuals from the benchmark rating (23.0) range from −0.09 to 0.36 m (fig. D3A), but generally, the comparison suggests a decrease in bed elevation of about 0.30 m since the early 1990s. For the short period of WY 2012–20 spanning streambed drawdowns, the specific streamgage analyses at Dexter shows decreasing bed elevations that are consistent with longer-term trends of apparent bed lowering since 1983.
In contrast to the Dexter specific streamgage analyses showing gradual bed lowering, the 175 measurements made at the Jasper streamgage between January 25, 1985, and September 23, 2020, were compared to the benchmark rating curve 16.0 and indicate general bed stability since the mid-1980s (fig. D3B). Measurements at the Jasper streamgage were categorized as excellent (1 percent), good (78 percent), fair (20 percent), poor (1 percent), or unspecified (1 percent). After the streambed drawdowns were implemented at Fall Creek Dam, there have been a few large stage residuals (for example, October 2014, June 2017, February 2020, which range from 0.04 to 0.06 m; highlighted in fig. D3) that potentially signify increases in channel bed elevation resulting from reservoir sediment releases. However, these residuals fall within the full range of variability (from −0.05 to 0.07 m) observed for the overall analysis period; therefore, any assessment of aggradation is uncertain and cannot be attributed to sediment deposition from the Fall Creek drawdown. Additionally, these stage residuals are on the order of a size of gravel to cobble and may reflect natural variability in bed conditions. Even if these stage residuals are representative of actual aggradation, the increases in bed elevations are temporary (subsequent measurements do not indicate persistent change in stage for that discharge), and the magnitude of potential aggradation is very modest (less than several centimeters). Wallick and others (2013) compared rating curves over a longer period at the Jasper streamgage (WY 1953–2012) for low to moderate streamflows (1,150–11,500 ft3/s). They found the incision prior to 1975 was followed by relative stability through WY 2012. Although, re-evaluation of that streamgage (Wallick and others, 2013) suggests some minor (less than 0.3 m) aggradation between WY 1953 and 1973 followed by relative stability.
Overall, findings from specific streamgage analyses indicate sediment released from the Fall Creek Lake streambed drawdowns is not causing persistent, aggradation in the low-flow stream channel of the Fall Creek or Middle Fork Willamette River near the Fall Creek and Jasper streamgages (respectively). Reservoir sediments may temporarily be deposited in the channel near the gaging station at Fall Creek, but this sediment is rapidly carried downstream in subsequent weeks and months following the drawdown. Additionally, evaluation of the decadal-scale relations between streamflow discharge and stage suggests that the channel bed at the locations of the Fall Creek and Jasper streamgages have been relatively stable since the late 1970s to early 1980s. At these streamgages, overall bed stability and the presence of bedrock in the reach suggest that transport capacity and sediment supply are somewhat balanced or that transport capacity exceeds sediment supply (at least in post-dam regime). Conversely, potential incision at the Dexter streamgages since the early 1980s suggests transport capacity exceeds sediment supply.
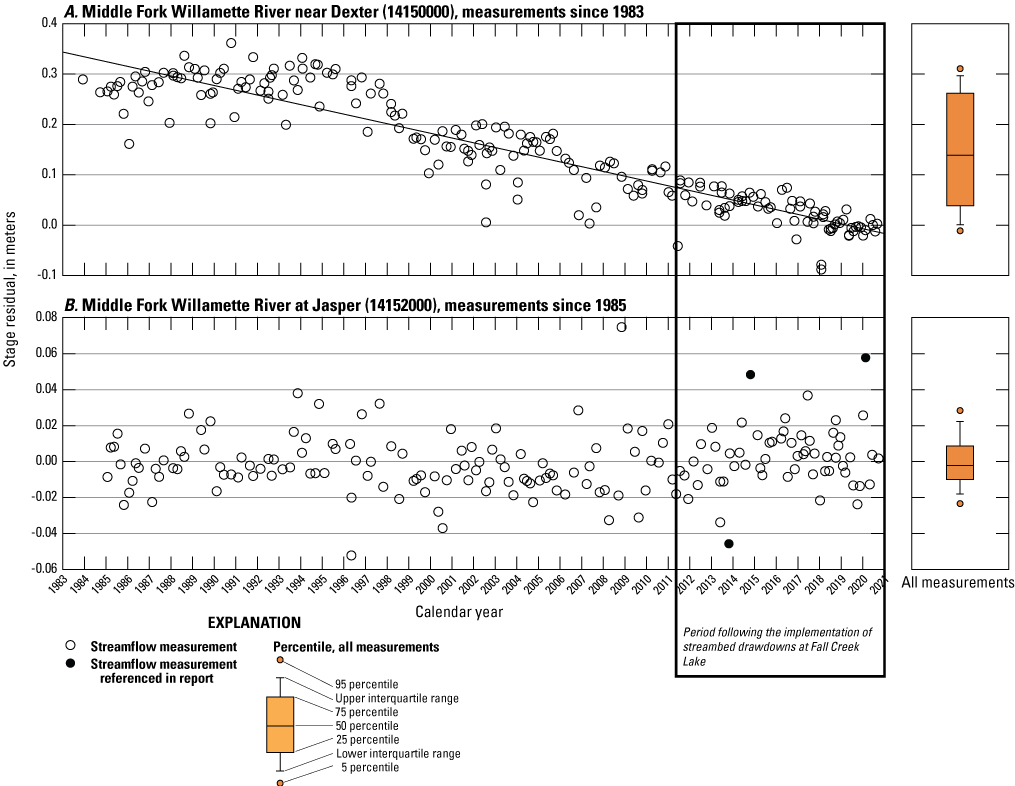
Residuals between the stage–discharge relation field measurements and the current stage–discharge rating curves for the U.S. Geological Survey streamflow-gaging stations 14150000 Middle Fork Willamette River near Dexter, Oregon (A), using rating 23.0 from measurements spanning from December 7, 1980, to September 3, 2020, and 14152000 Middle Fork Willamette River at Jasper, Oregon, (B) using rating 16.0 from measurements spanning from January 25, 1985, to September 23, 2020.
Site-Scale Characterization of Bed-Material Grain Size, Water Years 2015–16
Bed-material substrates of gravel-bed rivers reflect sediment transport conditions balanced by sediment supply and transport capacity (Church, 2002, 2006; Lisle, 2012). Evaluation of bed-material grain sizes is useful for characterizing morphology and sediment transport conditions along a river. Where repeat measurements are made over time using similar methods to collect a representative sample, bed-material grain size can indicate local changes that may have resulted from variation in streamflows or sediment supply. Increased sediment supply from Fall Creek Lake during streambed drawdowns can potentially change overall size of bed-material within the channel bed and gravel bars downstream from the dam. For example, the release of fine-grained sediments into these gravel-bed rivers might be expected to result in an overall fining of the channel bed and reduction in overall grain size or could result in local sand deposition on gravel bars, which has implications for bar mobility, aquatic habitats, and vegetation succession. For this study, bed-material grain sizes were measured at multiple gravel bars in 2015 and 2016 along Fall Creek and Middle Fork Willamette River to assess overall sediment transport that reflects decadal-scale condition as well as short term (annual) changes that may relate to the transport and deposition of reservoir sediments released during streambed drawdowns at Fall Creek Lake.
Bed-Material Grain-Size Measurement Methods
Surficial bed-material grain-size measurements were made during 2015 and 2016 at 11 sites along Fall Creek and the Middle Fork Willamette River downstream from Fall Creek Dam. A total of 16 measurements were made within 3 reaches (Lower Fall Creek reach on Fall Creek and the Jasper and Clearwater reaches of Middle Fork Willamette River; table D1). Sampling locations and approaches were selected to evaluate changes in substrate size and identify the locations and magnitudes of sand deposition on gravel bars. Too few bars in the Upper Fall Creek reach were present to permit sampling, and site access to bars within the Dexter and Dougren reaches was limited, precluding sampling on those reaches. In October 2015, two bed-material grain-size measurements were collected on Fall Creek and four were collected on the Middle Fork Willamette River (fig. A6; table D1, Keith, 2019). In September 2016, an additional 10 measurements were made in the same 3 reaches to collect repeat measurements at 5 bars and expand to the bed material characterization within the study area (fig. A6; table D1; Keith, 2019). Measurements were made using a modified Wolman (1954) pebble count. A minimum of 100 clasts were measured with a gravel template (Federal Interagency Sediment Project, US SAH–97 Gravelometer), along a transect parallel to main channel streamflow direction. Descriptive statistics from grain-size measurements were used to address the longitudinal variation in bed-material substrates downstream from Fall Creek Lake, while repeat measurements at 1-year intervals at select sites were used to assess changes in substrate conditions. Grain-size data were loosely compared with measurements made in 2015 by Jones and others (2016) at one site on the lower Middle Fork Willamette River (rkm 5.6), although those measurements followed slightly different protocols. Selected grain-size statistics include the 16th, 50th, and 84th percentile diameters (D16, D50, and D84, respectively), as well as sorting (Folk and Ward, 1957) and sand fraction (percent of the sample less than 2 mm).
Table D1.
Surficial bed-material distributions along Fall Creek and the Middle Fork Willamette River, Oregon, collected by the U.S. Geological Survey during 2015 and 2016 (water years 2016 and 2017) for this study.[Easting and Northing projected units are in meters for UTM, Zone 10 North, North American Datum of 1983. Date is given in month/day/year format. Abbreviations: US, upstream; DS, downstream; LFC, Little Fall Creek; PC2, particle count 2; RR, rail road; TNC, The Nature Conservancy; Rkm, river kilometer; D16, 16th percentile diameter; D50, 50th percentile diameter; D84, 84th percentile diameter; mm, millimeters]
Uncertainty in grainsize distributions determined from surficial particle counts can source from sampling size, operator sampling bias, variation in site location or time, and collection technique (for example, see Wohl and others, 1996; Bunte and Abt, 2001; Olsen and others, 2005; for discussions regarding measurement error and variability, see Daniels and McCusker, 2010). Particle counts for this study were completed using the same collection technique, but re-occupied sites were recorded with handheld GPS with coordinate uncertainty of about ±3 m. However, the precision of a sampling size of 100 particles is typically too low to compare grain-size distributions among sites or over different periods, particularly in rivers that are not moderately-well sorted (Bunte and Abt, 2001). The lateral fining between channel and bar apex, which commonly reflects selective transport as finer particles are more easily transported by greater streamflows present in the main channel as well as helical flow conditions, could potentially be a substantial source of uncertainty between repeat particle count results. To quantify operator sampling bias, distribution statistics were compared within single samples where 2 separate team members measured 50 clasts along each of the 2 parallel tapes (n = 14). The difference between D50 values for different operators was typically within about 11 percent for most sites but as high as 35 percent at Sand Mountain bar.
Bed-Material Surface Grain-Size Measurement Results
Bed-material grain-size measurements from Fall Creek and Middle Fork Willamette River show that bed-material substrates are primarily composed of cobble to gravel-sized particles with median grain sizes (D50) ranging from 34 to 90 mm and no apparent longitudinal patterns in bed-material textures (table D1; fig. D4). The two sites within the Lower Fall Creek reach had D50 values of 40.4 and 59.0 mm (figs. D4, D5A). Within the Jasper reach of Middle Fork Willamette River, D50 for the three sites ranged from 43.8 to 90.0 mm (figs. D4, D5B). In the Clearwater reach of the Middle Fork Willamette River, D50 at 6 sites ranged from 36.3 to 69.1 mm (figs. D4, D5C), but surficial measurements by Jones and others (2016) along other bar features using different methods found finer gravel distributions (D50 less than 32.0 mm, rkm 5.6). The sand fraction at many sites within the study area was 0 and did not exceed 6 percent for any of the sampled sites (table D1; fig. D5). Bed-material grain sizes were moderately-well to moderately sorted (classification from Folk and Ward, 1957; table D1; fig. D5) except at four sites that had localized sand accumulations and non-zero sand fractions—rkm 5.1 on Fall Creek (Downstream Little Fall Creek) and rkm 17.1, 16.6, and 9.5 on the Middle Fork Willamette River (Sand Mountain, River Right Island, and Orchard Bars, respectively).
In 2016, five additional sites in the Clearwater reach of the Middle Fork Willamette River were measured to better characterize spatial variability in surface grain size within and among bars. These measurements reveal distinctly coarser (Upstream The Nature Conservancy [TNC]) and finer (Downstream TNC) sections of a single large gravel bar located at rkm 5.8–5.7, where D50 values range from 59.1 to 34.1 mm. Bed-material textures on closely spaced bars did not show an apparent longitudinal pattern in D50 values; however, one of the finer grain-size distribution bars (Wide Bar, where D50 was 36.3 mm) was located in a relatively wide, laterally active area and was moderately well sorted (table D1; fig. D5C; Keith, 2019). All sites in this reach had a D16 greater than 19.0 mm and a D84 less than 113 mm. Sand content at Orchard and Upstream TNC Bars was 6 and 4 percent, respectively. Orchard Bar was poorly sorted whereas most other sites were moderately sorted.
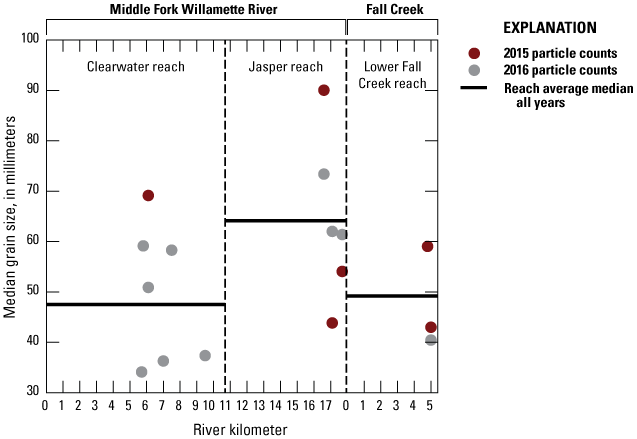
Surficial bed-material reach-averaged and site-specific median grain sizes along Fall Creek and the Middle Fork Willamette River, Oregon, collected in 2015 and 2016 (water years 2016 and 2017).
![Surficial bed-material distributions along Fall Creek (Lower Fall Creek reach [A])
and the Middle Fork Willamette River (Jasper reach [B] and Clearwater reach [C]),
Oregon, collected in October 2015 and September 2016 (water year 2016).](https://pubs.usgs.gov/sir/2023/5135/images/sir20235135_figD.5.png)
Surficial bed-material distributions along Fall Creek (Lower Fall Creek reach [A]; Downstream of Little Fall Creek [DS LFC] and Particle Count 2 [PC2] sites) and the Middle Fork Willamette River (Jasper reach [B]; Downstream of Confluence [DS Confluence], Sand Mountain, Rail Road Island [RR Island] sites and Clearwater reach [C]; Clearwater, Wide, Crazy Banks, Orchard, and Upstream [US TNC] and Downstream Nature Conservancy [DS TNC] sites), Oregon, collected in October 2015 and September 2016 (water year 2016).
Repeat measurements of bed-material substrates from 2015 and 2016 within the Lower Fall Creek, Jasper, and Clearwater reaches do not reveal substantial changes between years in bed-material textures at the sampling sites; although, a larger sampling size for the particle counts would be needed to accurately compare sites over time (Bunte and Abt, 2001). At rkm 5.1 in Lower Fall Creek reach (Downstream of Little Fall Creek [DSLFC] site) just downstream from Little Fall Creek, very similar bed-material textures were observed in both 2015 and 2016, with D50 values varying by about 3 mm, while particle size distributions, sand fractions (6 percent) and sorting (poorly sorted) were consistent for both years (fig. A6; table D1; fig. D5A, Keith, 2019). The three sites on the Middle Fork Willamette River in the Jasper reach showed minimal changes. Potential coarsening was detected at Downstream of Confluence (DSC; rkm 17.7) and Sand Mountain (rkm 17.1) Bars where D50 value increased by nearly 20 mm in 2016. But for the Rail Road Island Bar (rkm 16.6), the 2016 distribution was only slightly finer the 2015 distribution where the sand fraction increased from 0 to 3 percent although changes are typically within the range of uncertainty determined for error due to sampling bias. Sorting changed from moderately sorted to poorly sorted at Sand Mountain and Rail Road Island Bars where sand content increased slightly (by less than 3 percent; table D1; fig. D5B, Keith, 2019). Within the Clearwater reach, one repeat bed-material grain-size measurement was made at Clearwater Park (rkm 6.1) showing similar grain-size distributions in both years.
Overall, the surficial grain-size data reveal several findings regarding sediment transport conditions in the study area and effects of Fall Creek Lake streambed drawdowns on downstream substrates. First, all of the sampling sites had little to no sand and were dominated by cobble to gravel size substrate, indicating minimal persistent deposition of sands and fine-grained sediment sourced from Fall Creek Lake on the channel bed; however, these analyses do not address infiltration of fine sediments into the channel bed. Because grain-size distributions vary considerably from site to site and no apparent longitudinal trend in surface grain size was detected along Fall Creek and the Middle Fork Willamette River, the observed patterns of grain-size variation likely reflect local conditions, such as hydraulics and availability of coarse sediment liberated from nearby bank erosion rather than reach-scale trends in transport capacity. Broadly similar patterns of river-specific transport capacity and bed-material supply for Fall Creek and Middle Fork Willamette River are expected because (1) bed-material supply to Fall Creek and Middle Fork Willamette River is essentially depleted due to upstream dams and lack of large unregulated tributaries (O’Connor and others, 2014), (2) streamflow magnitudes are dominated by regulated dam releases, and (3) reach-scale slope values within the Lower Fall Creek, Jasper, and Clearwater reaches are similar (table D1). Although there are only five sites from which to evaluate temporal changes in bar substrate, the lack of substantial, systematic changes in bed-material textures between 2015 and 2016 suggests that sediment releases from the Fall Creek Lake streambed drawdown in WY 2015 did not produce system-wide deposition of fine-grained sediment on the gravel bar surfaces sampled within this period.
Site-Scale Deposition of Fine-Grained Sediment from Clay-Horizon Markers, Water Years 2016–17
Sand and finer sediment deposition along channel margins or on low elevation overbank surfaces can influence channel conveyance (potentially increasing flood hazards), aquatic and riparian habitats (potentially leading to losses in low-velocity areas accessible at high streamflows), and riparian vegetation (through burial of existing stands or creation of new establishment sites). To assess magnitudes and patterns of overbank deposition that may have resulted from Fall Creek Lake streambed drawdowns, a short-term, event-based, monitoring program in WY 2016–17 was established to measure local deposition within the active channel and floodplain areas at twelve sites along Fall Creek and the Middle Fork Willamette River with clay-horizon markers (fig. A6; Keith, 2019). Repeat site-scale measurements of deposition in the days and months following the streambed drawdowns at Fall Creek Lake provide a dataset from which to assess depositional patterns that may relate to the streambed drawdowns and other influences such as variation in streamflow, sediment supply from other sources, and local hydraulics. Clay-horizon markers are a tool to measure aggradation of sediment depths on surfaces that typically are only subject to low velocity streamflows (for example, Kleiss, 1996; Gellis and others, 2009; Curtis and others, 2013; Hupp and others, 2008, 2015). Bright white feldspar clay powder forms a distinct stratigraphic layer in the sediment record at the time of installation; if the layer is not locally redistributed or eroded, it can be used to measure the depth of deposition above the clay marker following subsequent flooding or other sedimentation events. The advantage of using clay-horizon markers for sedimentation monitoring is that they provide a distinct, pre-event (prior to WY 2016 and 2017 Fall Creek Lake streambed drawdowns for this study) surface from which to measure fine-grained deposition and have a limited effect on the local hydraulics that influence local sedimentation (Steiger and others, 2003).
Clay-Horizon Marker Methods
Clay-horizon markers were installed at multiple sites within Fall Creek and Middle Fork Willamette River in early WY 2016 and 2017 prior to the annual Fall Creek Lake streambed drawdown of each respective year. Approaches for this study were broadly similar to those used by Kleiss (1996) to assess bottomland hardwood wetland sedimentation in the Cache River Basin, Arkansas, and Hupp and others (2008) for floodplain sedimentation in the Atchafalaya River Basin, Louisiana. Each marker consisted of feldspar clay powder placed onto ground surfaces cleared of sticks or other large debris (grasses or exposed soil were left intact) in 0.5 by 0.5 m squares about 0.5 cm thick. At each site (fig. A6), clay markers were placed in transects spanning an array of geomorphic conditions such as: low-elevation unvegetated bars to high-elevation, vegetated bars; off-channel features inundated at low streamflows and adjacent vegetated bars (for example, fig. D6); and along low elevation floodplains. Multiple markers were installed at 10 sites in the autumn of WY 2016 prior to the annual Fall Creek streambed drawdown. Clay-horizon markers were replaced at 9 of those sites in autumn of WY 2017 and installed at one new site. Upon deployment, each clay-horizon marker was flagged on an outside corner with PVC or rebar so that sites could be relocated after burial. Because local hydraulics near the PVC or rebar appeared to affect markers at some sites, space between poles and clay markers was adjusted to 0.5 m or greater at two sites in WY 2017. Measurement sites along Fall Creek were generally accessible by foot, while most sites on the Middle Fork Willamette River were only accessible by boat, so timing of measurement observations varied with streamflow and other site access logistics. For most sites along Fall Creek, 500 ft3/s was considered the maximum discharge for accessing markers (Fall Creek streamgage, 14151000). For the Middle Fork Willamette River, the streamflow threshold for accessing marker sites was about 2,000 ft3/s (Dexter streamgage, 14150000) upstream from the Fall Creek confluence and 2,500 ft3/s (Jasper streamgage, 14152000) downstream from the Fall Creek confluence. For each marker, the measurement dates and sediment thickness were recorded, as were streamflow data (including average mean daily streamflow for period between measurements and number of days exceeding site access threshold) from the nearest streamgage. If clay horizon makers showed evidence of disturbance from erosion, wildlife, or vegetation growth, the markers were not replaced. Clay markers submerged under water were not measured.
![Example of clay-horizon markers deployed at the Row Tree site on Fall Creek (river
kilometer [rkm] 6.36) illustrating marker distribution across low-elevation floodplain
in relation to local hydraulics within oblique photograph (A; photograph by Mackenzie
Keith, U.S. Geological Survey, January 8, 2017) and topo-bathymetric lidar image (B).](https://pubs.usgs.gov/sir/2023/5135/images/sir20235135_figD.6.png)
Example of clay-horizon markers deployed at the Row Tree site on Fall Creek (river kilometer [rkm] 6.36) illustrating marker distribution across low-elevation floodplain in relation to local hydraulics within oblique photograph (A; photograph by Mackenzie Keith, U.S. Geological Survey, January 8, 2017) and topo-bathymetric light detection and ranging (lidar) image (B).
Clay-horizon markers are useful for measuring very localized sediment accumulation, but as with other techniques for measuring sedimentation, there are many sources of uncertainty that can confound interpretation of results. Uncertainty can arise from implementation (quality of marker deployment, geomorphic setting and site selection, number of markers deployed) and measurement (number and locations of measurement within a marker, precision, observer accuracy). Additionally, interpretation of deposited material can also lead to some uncertainty in the magnitude or source of sediment observed on the clay-horizon marker; for example, fluvially-deposited sediment should be distinguished from sediment introduced by wildlife disturbance, hillslopes, or other sources. Even within an individual marker during one measurement period, measured deposition can be spatially variable across the marker, making it difficult to characterize overall patterns of deposition. Uneven ground conditions underlying each marker and spatially heterogeneous deposition patterns could affect measured depths, so multiple depth measurements were used at each clay marker to characterize variability in deposition to the nearest millimeter using a ruler. Over time, settling and compaction of sediment deposits could account for reductions in measured sediment depths; especially considering most sites underwent inundation and fluvial modification after initial sediment deposition. However, reductions in measured sediment depths over time related to compaction or fluvial or wind erosion of the deposit were not directly evaluated in this study. Additionally, accurate sampling of coarser sands proved to be difficult. Sandy deposits measured in August 2017 lacked sufficient cohesion to permit excavation and measurement down to the clay marker surface; to mitigate these conditions, water was gently poured over the deposits to increase cohesion, which also resulted in some minor compaction and reduced sediment depths. Observer repeatability was not directly accounted for in this study. Interpolation between marker sites or extrapolation of marker findings to other similar geomorphic landforms across a reach introduces additional uncertainties because local aggradation reflects complex local hydraulics. Direct comparisons of deposition within and among sites is challenging because of the diversity of geomorphic settings where floodplain sedimentation was monitored for this this study. For example, a transect of multiple clay markers deployed at different elevations across a gravel bar produces a different suite of depositional conditions than a nested cluster of markers within an off-channel feature affected by backwater from the main channel. In order to better characterize the magnitudes of deposition that may be occurring throughout the study area, sites that spanned multiple geomorphic conditions and assumed to be generally representative of those conditions were prioritized over multiple sites with similar geomorphic conditions.
Clay-Horizon Marker Results
The range of measured sediment depths at clay-horizon markers along Fall Creek and Middle Fork Willamette River varied considerably within and among sites over the 2 years of monitoring to assess deposition associated with the WY 2016 and 2017 streambed drawdowns at Fall Creek Lake. Sediment deposited on clay-horizon markers was primarily silt to medium sands (fig. D7), although coarse sand and some gravels were also observed (fig. D8). Overall, cumulative deposition in WY 2016 (July–September 2016 measurements) varied from less than 6 mm at individual markers within the Unity, Row Tree, Place Road, and The Nature Conservancy (TNC) sites to 185 mm at Sand Mountain, although maximum sediment thickness measured earlier in the season was sometimes greater. Five sites displayed more than 50 mm of cumulative deposition at individual markers (Tufti, Row Tree, Fall Creek Confluence, Sand Mountain sites; figs. D9A, E, F, H; Keith, 2019). In WY 2017, 6 sites showed less than 6 mm of deposition at individual markers (Fall Creek Gage, Unity, Place Road, Row Tree, Sand Mountain, and TNC), but no sites exceeded 50 mm in depth (maximum recorded depth was 49 mm at Sand Mountain). Maximum depth at most sites in WY 2017 was much lower than was observed in 2016, ranging from 20 to 40 mm. Comparisons of sediment depths at markers within individual sites reveal considerable within-site variability, with typical marker average spanning less than 6 mm at higher elevation markers and those farther from the main channel to more than 20 mm at low-elevation sites near the channel (fig. D9; Keith, 2019).
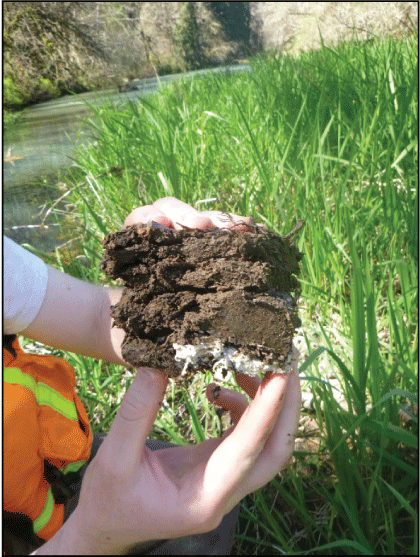
Primarily sands and silts deposited over of bright white clay-horizon marker at the Row Tree site (river kilometer 6.4 along Fall Creek). Photograph by Mackenzie Keith, U.S. Geological Survey, March 31, 2016.
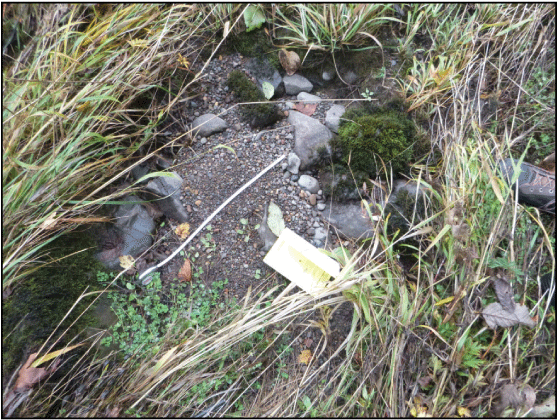
Coarse sand and gravels deposited along the Fall Creek channel at the Tufti site (river kilometer 11.3 along Fall Creek). Photograph by Mackenzie Keith, U.S. Geological Survey, November 9, 2015.
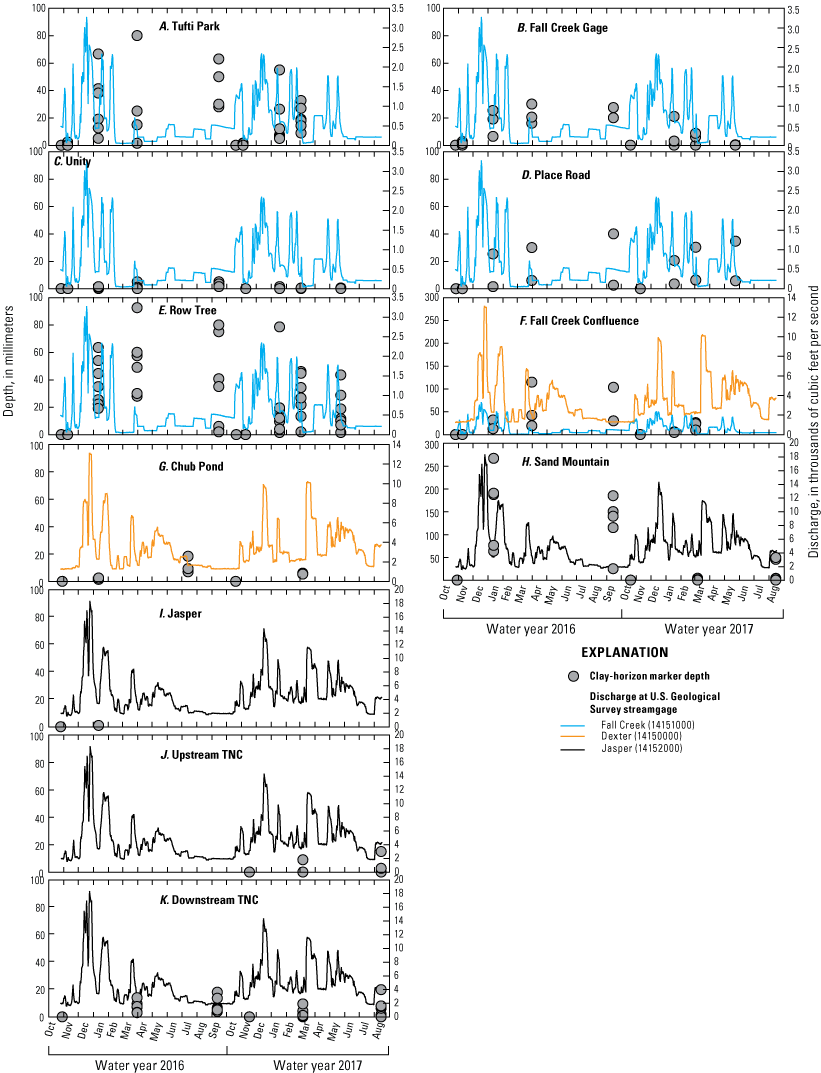
Range of average clay-horizon marker sediment depths (in millimeters [mm]) measured at sites along Fall Creek and the Middle Fork Willamette River, Oregon, in water years (WY) 2016 and 2017. Each measurement point represents the average measurement from a single clay-horizon marker within the site. See figure A3 for clay-horizon marker locations withing the study area. Mean-daily discharge from the U.S. Geological Survey streamflow-gaging station Fall Creek below Winberry Creek (14151000) illustrates the range of streamflows between measurements at the Tufti (A), Fall Creek Gage (B), Unity (C), Place Road (D), and Row Tree (E), and Fall Creek Confluence sites (F). Mean-daily discharge from the U.S. Geological Survey (USGS) streamflow-gaging station Middle Fork Willamette River near Dexter, Oregon (14150000), illustrates the range of streamflows between measurements at the Chub Pond (G) and Fall Creek Confluence sites (F). Mean-daily discharge from the USGS streamflow-gaging station Middle Fork Willamette River at Jasper, Oregon (14152000), illustrates the range of streamflows between measurements at the Sand Mountain (H), Jasper (I), The Nature Conservancy (TNC) Upstream (J), and TNC Downstream sites (K).
During WY 2016, most clay-horizon marker sites showed a general increase in floodplain deposition in the days and months since the November 2015 streambed drawdown. In the days immediately following the initiation of the streambed drawdown (drawdown began November 5, 2015; measurements made on November 9, 2015) when streamflows were modest (daily-mean discharge between 71 and 696 ft3/s), only 4 of the 28 clay-horizon markers showed measurable deposition. At these four clay markers, deposition was relatively modest (less than 2.7 mm) and observed only at low elevation markers nearest to the channel at the two sites nearest to Fall Creek Dam (Tufti Park and Fall Creek Gage; fig. D9A, B; Keith, 2019). The next measurement effort in January 2016 followed a longer period of higher streamflows (about 2 months since previous measurement on Fall Creek; first measurements on the Middle Fork Willamette River) that spanned the maximum mean daily streamflows for WY 2016 (3,270, 13,100, and 18,300 ft3/s at the Fall Creek, Dexter, and Jasper streamgages, respectively) observed during the total clay-horizon marker monitoring period. During the January 2016 measurement, up to 267 mm of sediment was measured at Sand Mountain on the Middle Fork Willamette River (subsequent erosion at the marker resulted in 185 mm cumulative sediment thickness near the end of WY 2016; fig. D9H), and most clay markers in the Upper and Lower Fall Creek and Jasper reaches showed minor to moderate deposition (fig. D9). For comparison, clay markers at the Chub Pond site in the Dougren reach (reference site on the Middle Fork Willamette River upstream from the Fall Creek confluence and not influenced by Fall Creek Lake streambed drawdowns) also showed minor deposition up to 2.5 mm in this period (fig. D9G; Keith, 2019). Most of the sites revisited along Fall Creek in March 2016 continued to show minor increases in sediment thickness at one or more markers, though the Tufti and Fall Creek sites were dominated by decreases in sediment depths. Six sites showed continued deposition of more than 10 mm at a minimum of one marker through the summer of 2016, although the Middle Fork Willamette River sites had not been sampled since January 2016 and reductions in sediment depths were apparent at most markers along the Fall Creek sites. Clay markers where measured sediment depths decreased over time often showed evidence of erosion and there were several instances where the entire markers were lost. For example, Tufti, Row Tree, Fall Creek Confluence, and Sand Mountain sites all contained markers with more than a 10-mm decrease in sediment thickness from the previous visit. At the time of the last measurement WY 2016, nine markers had been destroyed or were missing and vegetation had begun to displace the remaining markers so that any future measurements were not reliable. Therefore, new markers were deployed in WY 2017 slightly upstream from the WY 2016 markers.
Field observations in WY 2017 reveal similar temporal and longitudinal patterns in floodplain sedimentation to those observed in WY 2016, although the magnitudes of sediment deposition were much lower in WY 2017. Maximum marker depth observed in WY 2017 was 78.5 mm compared with 267 mm observed in WY 2016 (fig. D9). During the measurement period in January 2017, nearly all markers showed deposition along Fall Creek ranging up to 78.5 mm at the Row Tree site, though the Unity site only showed 1.5 mm or less of sediment (fig. D9). By March, sites along Upper and Lower Fall Creek reaches showed variable depositional patterns generally with losses in sediment depth at markers near the main channel and little to no increase in depths for the Tufti, Fall Creek streamgage, and Unity sites (figs. D9A–C). A similar pattern for the Row Tree site was also measured for the March measurement on the side of the bar closest to the channel; however, more substantial increases in sediment depth (increase of up to 28 mm) were observed farthest from the main channel (fig. D9E). Sediment depths also increased at the Fall Creek Confluence markers that were not underwater (fig. D9F). By May 2017, most sites along Fall Creek showed decreases in sediment depths with several of the clay-horizon markers being unrecoverable. Sites on the Middle Fork Willamette River were first measured in March 2017, 6 months following the WY 2017 streambed drawdown. Downstream from the confluence with Fall Creek deposition on clay-horizon markers showed smaller magnitude depths (ranging from 0 to 9.4 mm the TNC Downstream site) compared with WY 2016. Additionally, the Chub Pond site upstream from the confluence with Fall Creek showed deposition up to 5.3 mm. Later measurements in August 2017 showed substantial deposition at Sand Mountain and TNC Downstream (up to 45.3 and 10.4 mm, respectively) while most other sites showed no to little change in measured sediment thickness at the clay-horizon markers.
Landform-Scale Erosion and Deposition from Lidar Comparison, 2009–15
Repeat landform-scale assessment of floodplain topography was conducted to document cumulative changes and spatial patterns in erosion and deposition across 3- to 6-year periods that may relate streambed drawdowns or other geomorphic processes. The measurements at the clay-horizon markers provide a method for tracking small (millimeter-scale) variation in local deposition that may occur in the days and months following an individual drawdown operation, whereas the topographic change analyses characterize erosion and deposition across entire landforms for multiple years. The topographic change analyses focused on four sites along Fall Creek and the Middle Fork Willamette River downstream from the Fall Creek Dam where substantial changes in landforms have been observed following the implementation of streambed drawdowns in WY 2012.
Topographic Change Methods
Topographic change analyses were completed at four gravel-bar features co-located with clay-horizon marker sites (table D2; fig. D10) including the Unity and Row Tree sites on Fall Creek and the Sand Mountain and Downstream TNC site on the Middle Fork Willamette River. Lidar datasets were used to characterize an initial “baseline” topography at each site, which was compared against topographic-bathymetric lidar data collected September 2015 (Quantum Spatial, 2016; app. 1). For the Unity, Row Tree, and Sand Mountain sites, the initial topographic lidar dataset was acquired in February 2012 (Watershed Sciences, Inc., 2012), and for the Downstream TNC site, the initial topographic lidar surface was acquired March 2009 (Watershed Sciences, Inc., 2009) before annual streambed drawdowns began. Lidar rasters for each site were resampled to 1-m spatial resolution and clipped to a shape coinciding with excluding water depicted in the baseline (2009 or 2012 depending on coverage) topographic lidar dataset. Baseline surfaces were then compared to the 2015 topo-bathymetric lidar with GCD software (version 6.1.14; Riverscapes Consortium, 2018) similar to methods described in the “Magnitude and Distribution of Sediment Erosion and Deposition Water Years 2012–17” section in Chapter B. Reservoir Morphology and Evolution Related to Dam Operations at Fall Creek Lake with direct comparison (raw) and propagated uncertainty analyses. Default errors for topographic (0.15 m for 2009 and 2012 data) and topo-bathymetric (0.18 m for 2015 data) lidar from the GCD software were applied as uniform errors to account for uncertainty in the surveys (overall, minimum detection threshold of 0.23 m) and were used for the propagated threshold analyses. Comparatively, overall project vertical accuracy RMSE reported for the lidar datasets ranges from 0.04 (Watershed Sciences, Inc., 2009) to 0.02 m (Watershed Sciences, Inc., 2012) for the topographic lidar and from 0.03 to 0.04 m (Quantum Spatial, 2016) for the topo-bathymetric lidar (app. 1); therefore, the default error surfaces are considered a relatively conservative estimate of survey error associated with the datasets.
Table D2.
Deposition, erosion, and volume change summary from topographic change analyses with Geomorphic Change Detection (GCD) software in ArcGIS between 2009–12 and 2015 for select sites along Fall Creek and the Middle Fork Willamette River, Oregon.[Change analyses completed with Geomorphic Change Detection (GCD) software in ArcGIS. Default uniform error surfaces were used for topographic lidar data (0.15 m) and topobathymetric lidar data (0.18 m). Additional survey details are included in appendix 1 of this study. Average annual net volume change and Annual average net volume change normalized by area: provided for normalization, however, it is likely changes varied annually over the periods analyzed and average estimates are not representative of real conditions. Dates given in month/day/year format. Abbreviations: ±, plus or minus; rkm, river kilometer; cm, centimeter; TNC, The Nature Conservancy]
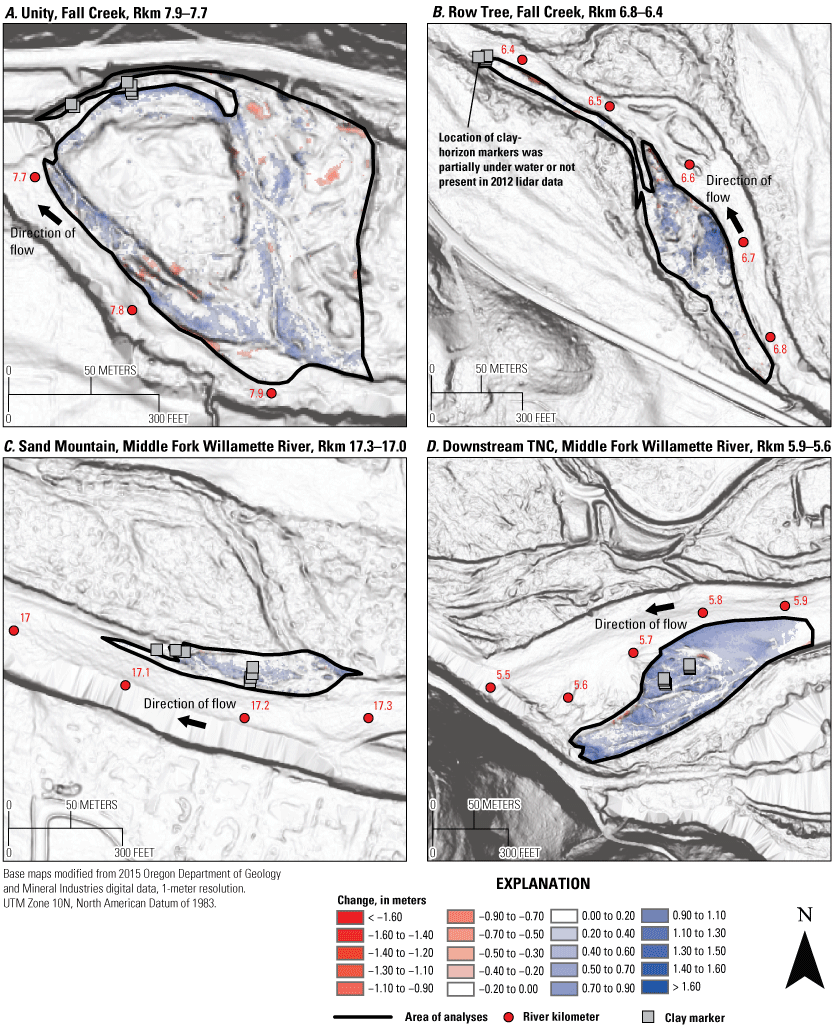
Calculated changes in elevation from light detection and ranging (lidar) datasets derived from change analyses with Geomorphic Change Detection (GCD) software in ArcGIS between 2012 and 2015 for the Unity site (A) on Fall Creek (river kilometers [rkm] 7.9–7.7), Row Tree site (B) on Fall Creek (rkm 6.8–6.4), and Sand Mountain site (C) on the Middle Fork Willamette River (rkm 17.3–17.0), and between 2009 and 2015 for the Downstream The Nature Conservancy (TNC) site (D) on the Middle Fork Willamette River (rkm 5.9–5.6). [<, less than; >, greater than]
Topographic Change Comparison Results
Overall, detectable topographic changes at the four sites along Fall Creek and the Middle Fork Willamette River primarily showed deposition; although, smaller localized instances of erosion were also identified at all sites. Comparison of the 2012 and 2015 lidar at the Unity, Row Tree, and Sand Mountain locations shows broad-scale deposition encompassing substantial parts of the gravel bars and low-elevation floodplain (table D2; fig. D10) with depositional volumes ranging from about 526±325 m3 at the Sand Mountain site to about 1,560±1,040 m3 at the Unity site. Locally, the greatest deposition detected over the 2012–15 measurement period within a single cell (1 m2 area) within the Unity, Row Tree, and Sand Mountain sites was 1.55, 1.80, and 1.14 m thick, respectively. At the Downstream TNC site where topographic change was measured for the 2009–15 period, detected volumetric change are much greater, revealing 7,240±3,590 m3 of deposition across the site and local (grid cell) deposition as great as 1.75 m.
At the Unity site, 3.8 km downstream from Fall Creek Dam (table D2; fig. D10A), the majority of detected deposition was distributed along the margins of the small floodplain island and in a small former side channel, whereas erosion occurred in local patches. Both the average depositional depth and average erosional depth across the site was 0.38±0.21 m; however, volumetrically, deposition dominates due to the much larger spatial area where sediment was deposited, resulting in 1,850±1,020 m3 of deposition compared with total erosion of 291±164 m3, indicating an average annual net deposition of about 520 m3/year for 2012–15. A submerged alcove adjacent to the area of change analyses and present in the 2012 lidar was excluded from the measurement area due to a lack of elevation data. This alcove had largely filled with sediment by the time of 2015 topo-bathymetric lidar acquisition (as verified by field observations in WY 2016; fig. D11). Extending the change analyses to include this sediment filled alcove by the time of the 2015 lidar (fig. D10A) would result in at least an additional 340 m3 of deposition for this site. Calculated depositional depths were more than a meter in the alcove without accounting for any deposition below the 2012 water surface. At the Unity site, three clay-horizon markers were included in the topographic change analysis area; depositional changes detected for 2012–15 from lidar topographic analyses ranged from 0.26 to 0.76 m—greater than the 5 mm net deposition measured on the markers in WY 2016 and 2017.
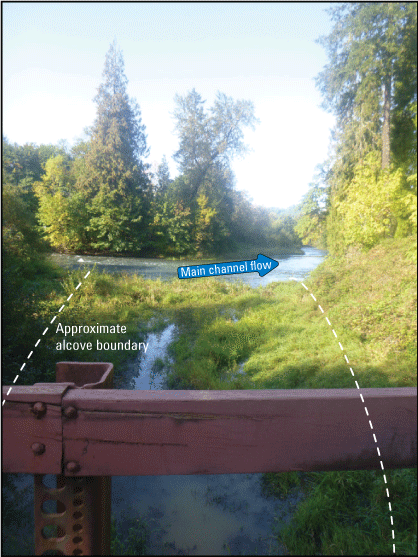
Reservoir sediment accumulation and vegetation growth within the alcove at the Unity site (river kilometer 7.7 along Fall Creek). Approximate alcove boundary is represented with a dashed line. Photograph facing downstream along alcove toward Fall Creek from private bridge. Photograph by Mackenzie Keith, U.S. Geological Survey, September 15, 2016.
Deposition along the Row Tree site located 5.1 km downstream from Fall Creek Dam was distributed across the broad, heavily vegetated gravel bar and low elevation floodplain, with much of the total area showing no elevation change (fig. D10B). Within areas of the Row Tree site that show changes in elevation, average depositional depths (0.50±0.23 m) were slightly less than the calculated average erosion (0.55±0.23 m) although deposition occurred over a larger area. The total volume change of sediment (1,940 m3) suggests an average annual deposition rate from 2012 to 2015 at the Row Tree site of 490 m3/year—similar to that at Unity site (table D2). An alcove at the downstream end of the site (not included in the analysis area) had undergone deposition after 2012 such that channel areas that were submerged in 2012 lidar had accumulated enough sediment to support deployment of the clay-horizon markers to support measurements of overbank deposition by 2015.
At the Sand Mountain site on Middle Fork Willamette River, 0.8 km downstream from the Fall Creek confluence, local patterns of deposition were highly variable. Sediment depths were greatest at the upstream end of the bar near an entrance to a slough and also along the downstream end of the bar at the head of an alcove, but the largest areal distributions of newly deposited sediment were along the lower and central areas of the main bar (fig. D10C). Average deposition thickness calculated was 0.38±0.23 m, just slightly greater than the average erosional thickness (0.31±0.23 m). Similar to other sites evaluated with lidar comparisons, total erosion volumes were minimal because of the relatively small areas undergoing erosion. Field observations in October of 2015, when the clay-horizon markers were deployed prior to the WY 2016 streambed drawdown, showed that recent fluvially transported sand deposits were locally about a meter in depth. This site continued to accumulate sediment after the WY 2016 streambed drawdown, and at the time of the January 2016 measurement, an additional 260 mm of sand had accumulated on 1 clay-horizon marker. However, despite substantial local deposition, net overall deposition across the bar complex of the Sand Mountain site (175 m3/year) between 2012 and 2015 indicates this site on the Middle Fork Willamette River has undergone less overall topographic change than the Unity or Row Tree sites on Fall Creek (520 and 490 m3/year, respectively).
At the Downstream TNC site, on the Middle Fork Willamette River (fig. D10D), deposition was distributed across the bar with few localized patches of erosion. The average annual depositional thickness across the site is slightly greater than erosional depths at 0.48±0.23 m/year and 0.43±0.23 m/year, respectively. Of the four landform-scale sites evaluated for this study, average annual deposition was the greatest at the Downstream TNC site (1,210 m3/year) by nearly 30–60 percent, even after normalizing for differences in site area and the longer period between surveys (Downstream TNC site spans 2009–2015, whereas other sites span 2012–15). Substantial changes in the channel planform at the TNC site limit change analyses to the 2009 bar area that excludes a large portion of the same site that was present at the time of the 2015 lidar survey. The distance of the Downstream TNC site from the sediments sourced at Fall Creek Lake (greater than 23 km) and the confounding presence of other sediment sources preclude clear linkages between reservoir sediment export from Fall Creek Lake and deposition at the Downstream TNC site. However, sediment sources could not be determined definitively at the TNC site given the presence of fine-grained depositional patches distributed along Fall Creek and Middle Fork Willamette River upstream, relatively low volumes of sediment entering from tributaries (O’Connor and others, 2014), or sediment supplied from bank erosion (as described in the following section).
Reach-Scale Morphology and Changes in Channel Planform, Water Years 2005–16
Digital geomorphic channel maps were produced to depict channel and floodplain conditions along Fall Creek and the Middle Fork Willamette River from multiple aerial photograph datasets spanning WY 2005–16. These maps (Keith and Gordon, 2019) provide an inventory of landforms and channel features from which to assess post-dam channel morphology and evaluate spatial and temporal changes that may result from multiple influences. Keith and Gordon (2019) also mapped landforms from 1936 aerial photograph and the channel planform from 1926; the longer-term historical changes along Fall Creek and the Middle Fork Willamette River are discussed in the companion paper (Keith and others, 2023a). Geomorphic mapping over multiple periods provides a systematic framework for linking changes in channel features with the underlying geomorphic and vegetation processes that shape channel morphology. The mapping approaches and analyses in this study were selected to characterize planimetric changes such as bar growth, channel widening, channel migration, or changes in vegetation cover that may relate to increases in sediment supply associated with the Fall Creek Lake streambed drawdowns, and this mapping framework for the channel areas downstream from Fall Creek and Dexter Dams differs substantially form the mapping framework developed the upstream reservoir reach of Fall Creek Lake (Chapter C. Sediment Delivery from Fall Creek Lake and Transport through Downstream Reaches). The floodplain mapping corridor used in this study comprises a zone influenced by present-day geomorphic processes within the broader “geomorphic floodplain” (delineated by Wallick and others [2013] along the Middle Fork Willamette River and for this study along Fall Creek), comprising the landforms and habitats formed mainly by fluvial geomorphic processes active during the Holocene climatic regime of the last 10,000 years. This process-based definition of the floodplain is distinct from regulatory definitions based on attributes such as inundation frequency or channel migration rates.
Channel Mapping Methods and Units
Geomorphic maps of the active channel and adjacent floodplain were developed for the reaches downstream from Dexter and Fall Creek Dams to document reach-scale changes in channel planform that may have resulted from annual streambed drawdowns at Fall Creek Lake. Repeat mapping was conducted for 5 years (2005, 2011, 2012, 2014, and 2016) to characterize planform changes at 1–2 year intervals prior to and after annual streambed drawdowns that began in 2011 (WY 2012). For this study, the active channel was defined as the area typically inundated during annual high streamflows and includes features such as the low-flow channel, side channels, and both vegetated and unvegetated gravel bars. These features likely evolved through frequent bed-material transport prior to dam construction (Church, 2006) but are more stable due to reductions in coarse sediment supply and the magnitude and frequency of peak streamflow events following dam construction (Wallick and others, 2013).
A mapping corridor was defined for this study to provide a static spatial boundary for repeat mapping including the active channel and adjacent floodplain areas. For Fall Creek, the mapping corridor was defined using methods similar to those described in Wallick and others (2011) and includes the Holocene floodplain, extending from Fall Creek Dam to the confluence with the Middle Fork Willamette River. For the Middle Fork Willamette River, the mapping corridor was modified from a previous mapping corridor developed by Jones and others (2016) and encompasses channel-adjacent portions of the Holocene floodplain downstream from Dexter Dam.
The aerial photograph mapping methods used for this study have similar hierarchy and protocols to previous channel mapping studies for other gravel-bed rivers in Oregon, including the Chetco, Umpqua, and Sprague Rivers (Wallick and others, 2010, 2011; O’Connor and others, 2014). Additionally, the mapping presented herein expands upon mapping frameworks developed specifically for the Middle Fork Willamette River in previous studies (Dykaar, 2008; McDowell and Dietrich, 2012; Jones and others, 2016) with increased spatial, temporal, and mapping unit resolution to characterize potentially subtle planform changes that may relate to sediment releases from Fall Creek Lake streambed drawdown operations. The mapping datasets produced for each period include information on reaches, large-scale process domains, landforms, water-features, vegetation density, and vegetation cover (table D3). Features were digitized at 1:2,500 scale in ArcGIS with a minimum mapping unit of 200 m2. Additionally, wetted channel centerlines were mapped for the 2005 and 2016 periods to aid in documenting changes in channel position. A minimum of two project team members reviewed all mapping to ensure similar mapping quality among reaches and mapping periods.
Table D3.
Abbreviated mapping unit descriptions for repeat geomorphic channel and floodplain mapping along the major alluvial reaches of Fall Creek and the Middle Fork Willamette River, Oregon (Keith and Gordon, 2019).| Mapping unit | Description |
|---|---|
| Floodplain | Floodplain area outside the active channel corridor is not directly mapped and given the “other monitoring corridor” designation. Several large, vegetated island features on the Middle Fork Willamette River surrounded by active channel features are mapped as Floodplain domain, primarily consisting of the large floodplain islands and their internal water features. |
| Primary active channel | Active channel for Fall Creek and the Middle Fork Willamette River. |
| Tributary active channel | Active channel of tributaries to Fall Creek and the Middle Fork Willamette River; mapped tributaries include Little Fall and Lost Creeks. |
| Other | Area outside the active channel visible in the aerial photographs. This area is largely floodplain or non-visible active channel side channels that run through the floodplain and cannot be seen in the aerial photographs. Similar to geomorphic channel mapping by Wallick and others (2011), this larger static window ensures a constant total area for mapping analyses. |
| Main wetted channel | The active channel inundated by water at the time of aerial photograph acquisition. |
| Bar | All bars composed of gravel and finer sediment within the active channel that can include islands or features along the channel margin. Bars are exposed and above the water surface during aerial photograph acquisition. |
| Bedrock | Bedrock outcrops include features formed of bedrock and lacking vegetation either adjacent to or within the wetted channel. |
| Secondary water feature | Wetted features within the bounds of the active channel that do not convey the majority of flow in overall channel including side channels, alcoves, and disconnected water features that may be smaller, narrower, or appear shallower than the main wetted channel. Only the wetted area is mapped. |
| Floodplain island | Floodplain primarily surrounded by active channel features and typically densely vegetated with mature, woody vegetation. |
| Side channel | Secondary water feature that diverges from the main wetted channel and is connected at both the upstream and downstream ends. |
| Alcove | Secondary water feature connected to the main wetted channel or side channel at the downstream end only. |
| Pond | Secondary water feature entirely surrounded by bar, bedrock, or floodplain features. |
| Other | Secondary water features that do not fit the criteria for ponds, alcoves, side channels or some water feature in the Other domain. Most of these features are connected to the main wetted channel or side channel at the upstream end only. |
| NA | Not Applicable. Features not inundated are not assigned a water type. |
| Water feature, not in the active channel | Designation is reserved for water features encompassed within the Other domain. Features are often obscured by abundant vegetation and are not consistently mapped due to variation in water levels, shadows, vegetation canopy density, and tonal quality in each photograph time period. |
| Main wetted channel | Spatially identical with the Main wetted channel feature class. |
| Bare | Less than 10 percent vegetation cover by area. |
| Dense | Vegetation cover greater than 50 percent by area. |
| NA | Not Applicable. Water features, bedrock, and other features are not assigned a vegetation density. |
| Herbaceous | Cover area dominated by herbaceous vegetation. |
| Woody | Cover area dominated by woody to shrubby vegetation. |
| NA | Not Applicable. Other domain features are not assigned a cover type. |
| Water | Cover area is water. |
| Bare | Cover area is sediment and has less than 10 percent vegetation. |
Uncertainty
Uncertainty Related to Discharge During Photograph Acquisition
Multiple sources of uncertainty can influence the geomorphic mapping and interpretation of results, especially considering that modest planform changes may occur over short periods on these laterally stable, regulated rivers (Wallick and others, 2013; Jones and others, 2016). The mapped extent of water features and gravel bars is particularly sensitive to discharge at the time of aerial photograph acquisition, which can affect the overall interpretation of channel change (for example, see analyses on the Chetco and Umpqua Rivers in Oregon [Wallick and others, 2010, 2011] or the Trinity River in California [Curtis and Guerrero, 2015; Curtis and others, 2015]). Low-relief active channel features like bars can be submerged by high streamflows biasing the mapping results toward smaller areas of gravel bars and exposed at low streamflows appearing larger and biasing results toward greater mapped area. Conversely, off-channel water features like side channels and alcoves would have larger areas at high streamflows and smaller areas at low streamflows. The influence of discharge at the time of aerial photograph acquisition on mapped bar areas for different years (table D4) was assessed with linear regressions between discharge at the time of photo acquisition and mapped bar area for each reach for the 2005–16 mapping, similar to the approach applied on Umpqua River (Wallick and others, 2011) and Middle Fork Willamette River (Jones and others, 2016). This relation between bar area and discharge is expected to deteriorate if bar area changes due to geomorphic processes such as deposition or erosion rather than changing due to exposure or submersion as a result of change in discharge, which is possible with sediment supplied from the Fall Creek Lake streambed drawdowns. Given the scales of changes expected to be related to secondary water features and vegetation conditions (and the presumably non-linear relation with discharge), we elected not to apply any adjustments (normalization based on regression between discharge and reach map areas) to mapping areas for this study.
Table D4.
Discharge from U. S. Geological Survey streamflow-gaging stations during the acquisition of aerial photographs used for repeat mapping of Fall Creek and Middle Fork Willamette River.[Discharge values based on mean daily discharge in cubic feet per second. The average mean daily discharge is used when photograph acquisition spans multiple days. Additional photograph details can be in appendix 1 of this study. Dates given in month/day/year format. Abbreviation: ND, no data]
Other Sources of Uncertainty in Repeat Aerial Photograph Mapping
Other sources of uncertainty in mapping derived from image quality or view obstruction included glare, shadows, or overhanging vegetation. These issues can result in erroneously mapped features, particularly with delineating the edge of water and back edges of bars when these boundaries are obscured or when vegetation cover type or density was misclassified due to shadows. Mapping errors associated with these issues were reduced through multiple quality assurance and quality control efforts and querying images from adjacent periods. Though mapping uncertainty was not quantified for this study, Curtis and Guerrero (2015) did a thorough analysis of uncertainties related to repeat geomorphic mapping on the Trinity River, California, and found that digitizing precision was greater for smooth, visible boundaries and poorer for features obscured by shadows or canopy cover. Misalignment of features during the photograph registration process could also introduce errors; however, offset of line placement from misaligned imagery used in this study likely results in errors smaller than those imposed by line placement during digitization. Because the mapping was primarily used for areal change analyses and not morphologic change assessment through overlay analyses (for example, this study did not systematically quantify bank erosion or channel migration), photograph offset was deemed negligible. Considering these multiple sources of uncertainty and overall scope of this study, landform areas were aggregated over one or more kilometers and at the reach scale to characterize general spatial and temporal trends in geomorphic conditions. The relative scale of features along the Fall Creek reaches compared with those along the Middle Fork Willamette River were more sensitive to digitizing uncertainties because these features were smaller and sparser, with a greater percentage of area obscured by mature riparian vegetation or shadows. Though we did not systematically evaluate all potential sources of error, the total uncertainty associated with the final mapping produced in this study is likely within 10 percent, similar to other reported uncertainties for similar mapping efforts (for example, Swanson and others, 2011; Curtis and others, 2015)
Results of Repeat Geomorphic Mapping from Aerial Photography
The active channels of Fall Creek and Middle Fork Willamette River include landforms shaped by annual bed-material transport and scouring streamflows that preclude vegetation encroachment, as well as vegetated bars that were active in the pre-dam era but are currently stabilized with herbaceous and woody vegetation (Keith and others, 2023a). Repeat geomorphic mapping from aerial photography spanning 2005–16 (figs. D12–D14) shows that these landforms include the low-streamflow wetted channel which flows over bedrock and unvegetated gravel bars signifying frequent scour or substrate mobilization. Repeat geomorphic mapping and changes over the longer-term historical scale between 1936 and 2016 are discussed in the companion paper (Keith and others, 2023a); the 1936 mapping is shown repeat mapping figures for this chapter to provide some historical context. Although both rivers occupy primarily single-thread, laterally stable channels, there are substantial differences in alluvial character and channel planform among reaches. Fall Creek occupies a narrow channel (about 40 m wide) that occasionally flows over bedrock with gravel bars and secondary channel features concentrated in lower sections of the mapped reach. In contrast, the Middle Fork Willamette River occupies a broader (about 90–150 m wide), fully alluvial channel throughout the study area with fewer bedrock outcrops (mainly located in Jasper reach) and larger, more abundant gravel bars and secondary water features (especially in downstream reaches). The dominant features within the 2016 active channels of Fall Creek and Middle Fork Willamette River are the main, low-flow wetted channel, which comprise 20–61 percent of the active channel and gravel bars, which comprise 9–29 percent of the active channel mapped for all reaches in the study area. The distribution, areal extent, and vegetative cover of gravel bars are highly variable throughout the study area, ranging from unvegetated gravel bars to bars covered in dense, mature woody vegetation. The reaches immediately downstream from Fall Creek and Dexter Dams (Upper Fall Creek and Dexter reaches, respectively) have relatively narrow active channels with smaller, intermittent unvegetated gravel bars (fig. D12; app. 3) compared with downstream reaches. With increasing distance from the dams, the active channels of each river widen and unvegetated bars become larger and more abundant (fig. D12; app. 3). Floodplain islands and bedrock outcrops were less common in the study area than gravel bars, with bedrock especially prominent on the Upper Fall Creek and Jasper reaches whereas floodplain islands were most common in the Dexter and Dougren reaches (fig. D12; app. 3). Mapping results are further described by reach.
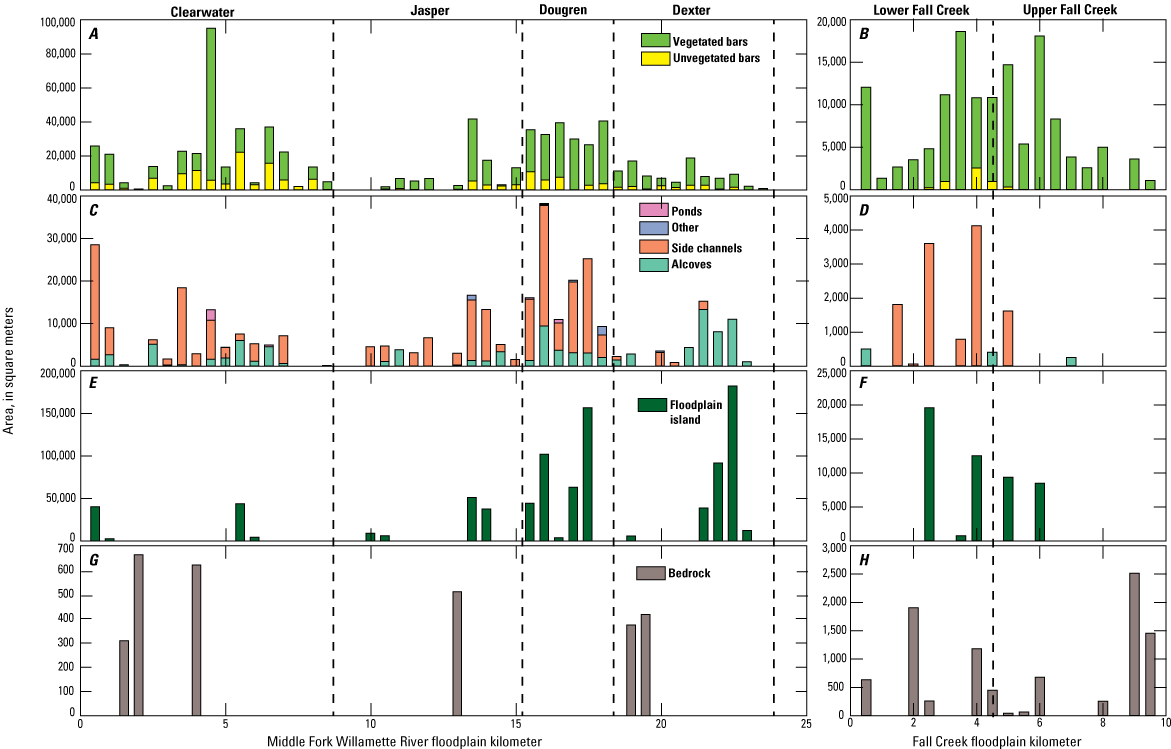
Landform area by floodplain kilometer (fpkm) from geomorphic mapping areas from 2016 aerial photographs, including total gravel bar area subdivided by vegetation cover for the Middle Fork Willamette River (A) and Fall Creek (B); secondary water features subdivided by type for the Middle Fork Willamette River (C) and Fall Creek (D); floodplain islands for the Middle Fork Willamette River (E) and Fall Creek (F); and bedrock for the Middle Fork Willamette River (G) and Fall Creek (H).
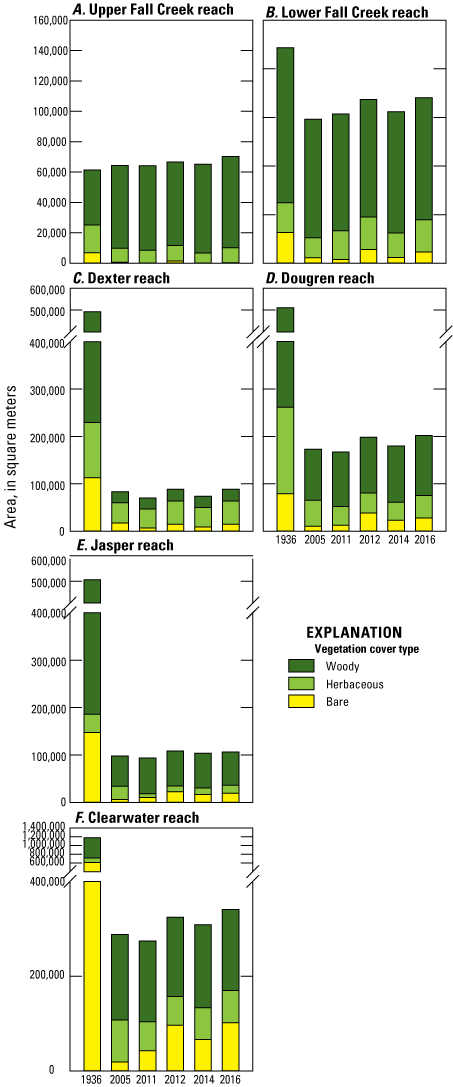
Total bar area by reach and year (1936–2016), subdivided by vegetation type from repeat geomorphic mapping from aerial photography for Fall Creek (A–B) and the Middle Fork Willamette River (C–F), Oregon.
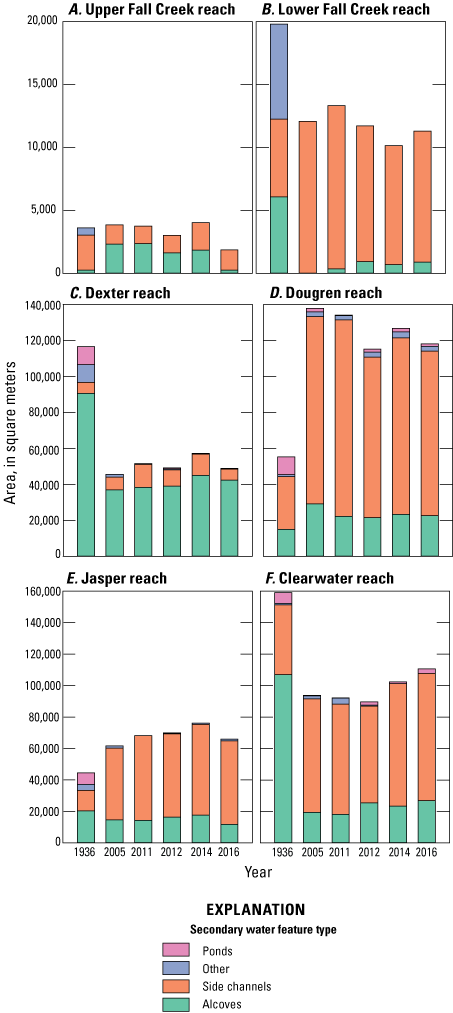
Total secondary water feature area by reach and year (1936–2016), subdivided by water type from repeat geomorphic mapping from aerial photography for Fall Creek (A–B) and the Middle Fork Willamette River (C–F), Oregon.
Temporal Changes in Bar Landforms and Secondary Water Features by Reach, Water Years 2005–16
Upper Fall Creek Reach
The Upper Fall Creek reach (fig. D15) was laterally stable between 2005 and 2016 with most variation in mapped features owing to changes in the locations, morphology, and vegetative cover of gravel bars. Bar landforms flanking the main channel were predominantly covered in herbaceous and woody vegetation during that period, as well (figs. D12, D13, D15; app. 3). From 2005 to 2016, total bar area (including vegetated and unvegetated bars) increased by about 9 percent, from 64,300 to 70,400 m2, which was primarily driven by increases in vegetated bar area as areas that mapped as main channel or secondary water features in 2005 became bars with either herbaceous or woody vegetation by 2016 (fig. D13; table D5; app. 3). From 2005 to 2011, prior to implementation of annual streambed drawdowns, changes in mapped bar areas were negligible and likely within the range of mapping uncertainty. From 2011 to 2012 (spanning the WY 2012 streambed drawdown), mapped bar area increased by 2,500 m2 (or about 4 percent), due mainly to increases in unvegetated bars and bars with herbaceous cover. The unvegetated gravel bars mapped in the 2012 photographs were not detected in the 2014 photographs, leading to small decreases in overall mapped bars (about 2 percent) during that period, which spanned two streambed drawdowns. Between 2014 and 2016, also encompassing two streambed drawdowns (WY 2014 and 2015), mapped vegetated and unvegetated bar area collectively increased by 5,200 m2 (about 8 percent; fig. D13; app. 3).
Table D5.
Landform area, unit area (landform area divided by reach length), and percent of landform within the whole active channel area by reach for geomorphic mapping along Fall Creek and the Middle Fork Willamette River, Oregon, from geomorphic mapping from 2016 aerial photography.[Abbreviations: km, kilometer; m2, square meters; m2/m, square meters per meter; --, no data]
The lower 0.54 km of the Fall Creek centerline Falls within the Dougren reach floodplain. All features along this segment are included in the Dougren reach and the reach length for Lower Fall Creek reach is shorter than that used in table A2.
Some of the adjustments in bar area between 2005 and 2016 likely reflect higher discharges represented in the aerial photographs from 2005 and 2014 compared with other years. For example, no unvegetated gravel was mapped in 2014 when aerial photograph discharge was 415 ft3/s, whereas mapped unvegetated gravel was greater in 2012 and 2016 when discharge was lower (150 and 225 ft3/s, respectively; table D4; fig. D13). However, the 2011 and 2016 aerial photographs were collected at relatively similar discharges (222 and 225 ft3/s, respectively), so planimetric changes from those periods are expected to represent actual geomorphic change; the maps show very similar bar features with main change being an increase in woody vegetation (table D4; fig. D13). Considering the relatively modest changes in the mapped bars and various sources of mapping uncertainty, the repeat mapping of bars on Upper Fall Creek reach indicates that widespread bar building and bar growth did not occur in the period spanning five streambed drawdowns (WY 2012–16) and that the main changes potentially attributable to sediment releases from Fall Creek Lake were localized increases in vegetated bar area, particularly where unvegetated channel margins mapped in 2005 and 2011 were converted to herbaceous or woody bars in subsequent mapping years.
Although secondary water features are sparse and relatively small along Upper Fall Creek reach (compared with other study reaches), these features underwent major losses in area between 2005 and 2016 (figs. D14, D15; app. 3). The total area of all secondary water features decreased by 52 percent (1,990 m2) between 2005 and 2016, and mainly occurred through an 89 percent reduction in the area of alcoves between 2014 and 2016 and much of that attributable to losses in a single feature at the Unity site (rkm 7.9–7.7; figs. D14, D15; app. 3). The losses in secondary water features at the Unity site also coincide with locations of calculated net deposition from lidar comparison between 2012 and 2015 (table D2; fig. D10A). The apparent net loss in secondary water features during the 2005–16 period may partly owe to lower discharges at the time of aerial photograph acquisition in 2016 compared with 2005 (464 and 225 ft3/s, respectively; table D4). Likewise, the modest decrease in area of main wetted channel between 2005 and 2016 (less than 3 percent) could also relate to lower aerial photograph discharge in 2016; however, actual narrowing of the wetted channel where bar areas increased, and mapping uncertainty related to channel margins being obscured by vegetation or shadows may have also contributed this decrease. Despite various sources of mapping uncertainty, the mapped losses in secondary water features were validated with visual inspection of aerial photographs and field visits, suggesting that at least some of the mapped loss in secondary water features relates to deposition.
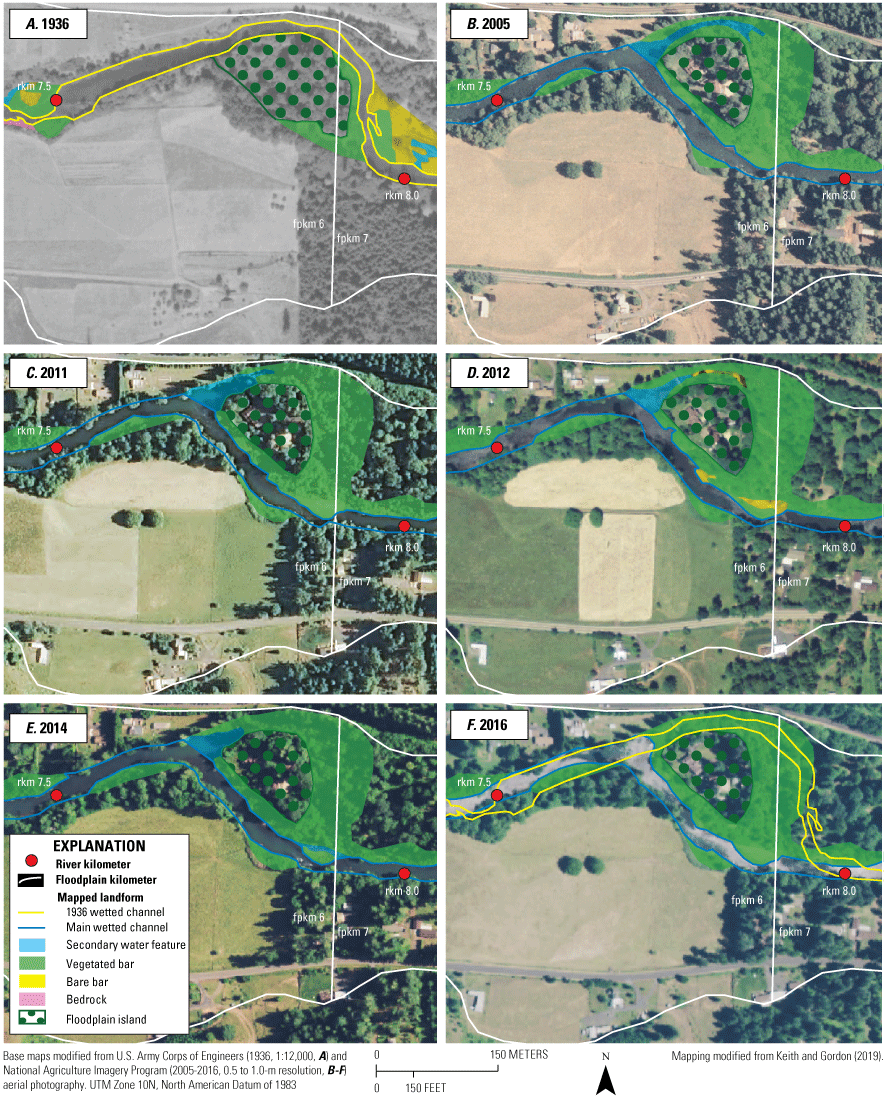
Repeat geomorphic mapping of the Upper Fall Creek reach between river kilometer 7.5 and 8.0 (floodplain kilometer [fpkm] 6–7) along Fall Creek, Oregon, for 1936 (A), 2005 (B), 2011 (C), 2012 (D), 2014 (E), and 2016 (F).
Lower Fall Creek Reach
Like the Upper Fall Creek reach, the Lower Fall Creek reach (fig. D16) also maintained a stable planform with similar locations and sizes of channel features between 2005 and 2016. Bars within this reach were dominated by woody-type vegetative cover, but unlike the Upper Fall Creek reach, secondary water features primarily consisted of side channels rather than alcoves. Net changes between 2005 and 2016 included an increase in total bar area of 14.8 percent (8,800 m2) and 7 percent decrease (770 m2) in the area of secondary water features (fig. D13; app. 3), although the area of both features fluctuated slightly over time. From 2005 to 2011, before the streambed drawdowns were implemented, total area of mapped bars decreased by 3.7 percent (similar to the changes on Upper Fall Creek reach 2005–11). From 2011 to 2012, spanning the WY 2012 streambed drawdown, total mapped bar area increased 9.6 percent (from about 61,400 to 67,400 m2), mainly through increases in unvegetated bars. In 2011, 2012, 2014, and 2016 (spanning multiple drawdowns), the area of vegetated bars remained approximately constant but the area of unvegetated bars in each period fluctuated substantially. From 2011 to 2012, unvegetated bar area increased 259 percent (4,110 m2), followed by a 57 percent decrease from 2012 to 2014 (3,260 m2), coinciding with higher discharge in 2014 aerial photographs and 90 percent increase from 2014 to 2016 (2,200 m2). Considering only mapping from periods with similar discharge (2011 and 2016; table D4), increases in total unvegetated bar areas from 1,590 to 4,640 m2 indicates an actual net increase in bars following the implementation of streambed drawdowns (fig. D13; app. 3). Mapped area of secondary water features increased 10 percent from 2005 to 2011, then decreased by 24 percent from 2011 to 2014 and increased 11 percent from 2014 to 2016 (app. 3). The decrease in mapped secondary water features 2012–14 and subsequent increase 2014–16 was primarily attributable to a fluctuation of inundation extent within single feature (side channel at rkm 2.0 downstream from Pengra Road bridge). This side channel was mapped as part of the main channel in 2014 because higher discharge at the time of aerial photograph acquisition obscured a portion of a bar that separates these channel features at low streamflow conditions when subsequent aerial photographs were acquired.
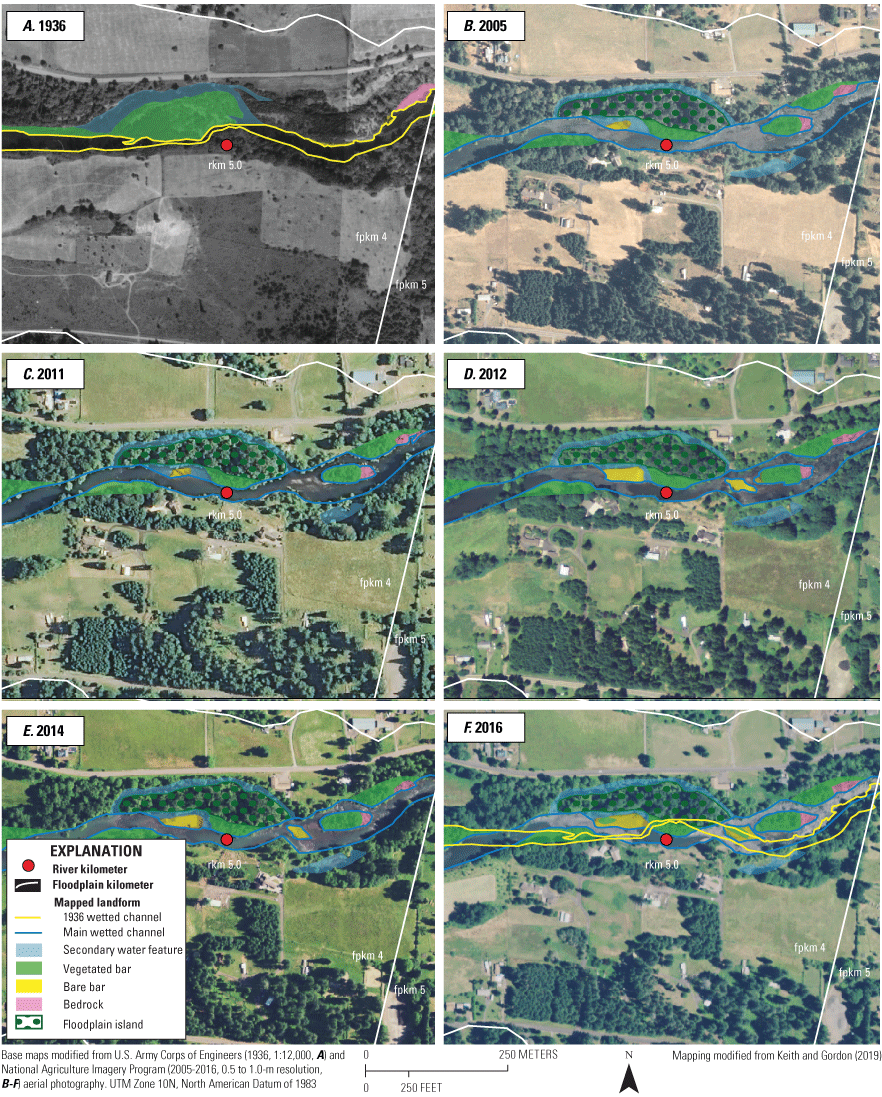
Repeat geomorphic mapping of the Lower Fall Creek reach between river kilometer 5.4 and 4.7 (floodplain kilometer [fpkm] 4–5) along Fall Creek, Oregon, for 1936 (A), 2005 (B), 2011 (C), 2012 (D), 2014 (E), and 2016 (F).
Considering the overall trends in bar and channel features amid mapping uncertainty and variation in discharge at the time of aerial photograph acquisition (table D4), the main planimetric changes from 2011 to 2016 on Lower Fall Creek reach that coincide with the Fall Creek Lake streambed drawdowns include (1) a reduction in the area of secondary water features by 6.4 percent reflecting decreases in the area of side channels, local conversions of side channels to alcove (7.9–7.7; figs. D12, D14, D16), and local adjustments in the perimeter of main and side channels, and (2) a nearly twofold increase in the area of unvegetated bars, reflecting bar growth near the confluence with Little Fall Creek while vegetated bar area remained approximately similar.
Dexter Reach
Repeat mapping of the Dexter reach of Middle Fork Willamette River from 2005 to 2016 shows that this reach (downstream from Dexter Dam and upstream from Fall Creek confluence) had a stable channel planform with minor changes in unvegetated gravel bars and secondary water features (fig. D17). Mapped gravel bars in the Dexter reach were predominantly covered in herbaceous vegetation (fig. D13), and secondary water features were predominantly alcoves (fig. D14; app. 3). From 2005 to 2016, the net change in total area of mapped bars was minor (6.4 percent increase, or 5,320 m2) although the total area of gravel bars between each mapping period varied by up to 27 percent (fig. D17; app. 3). That variation mainly occurred in the unvegetated gravel bars and likely reflects differences in discharge in the underlying aerial photographs. For example, the 59 percent decrease in unvegetated bar area (10,100 m2) between 2005 and 2011 may reflect higher streamflow in the 2011 photographs (3,300 ft3/s compared with 2,290 ft3/s) and the subsequent 108 percent increase in unvegetated bar area (7,760 m2) from 2011 to 2012 may reflect increased bar exposure at a lower discharge (1,840 ft3/s) in 2012 (table D4; app. 3). The mapped area of secondary water features in the Dexter reach increased by about 7 percent (3,290 m2) between 2005 and 2016, but much of this change is attributable to features near rkm 24.6–24.1 (fpkm 21) where bar growth led to expansion of an alcove behind the bar and creation of a side channel. Because the Dexter reach is not affected by streambed drawdowns at Fall Creek and there are limited sources of sediment downstream from the dam in this reach, the minor changes in mapped water features most likely reflect differences in aerial photograph discharge as field observations did not reveal substantial changes in water features. For example, the years with greatest area of mapped water features (2011 and 2014) were also years with substantially greater discharge (table D4).
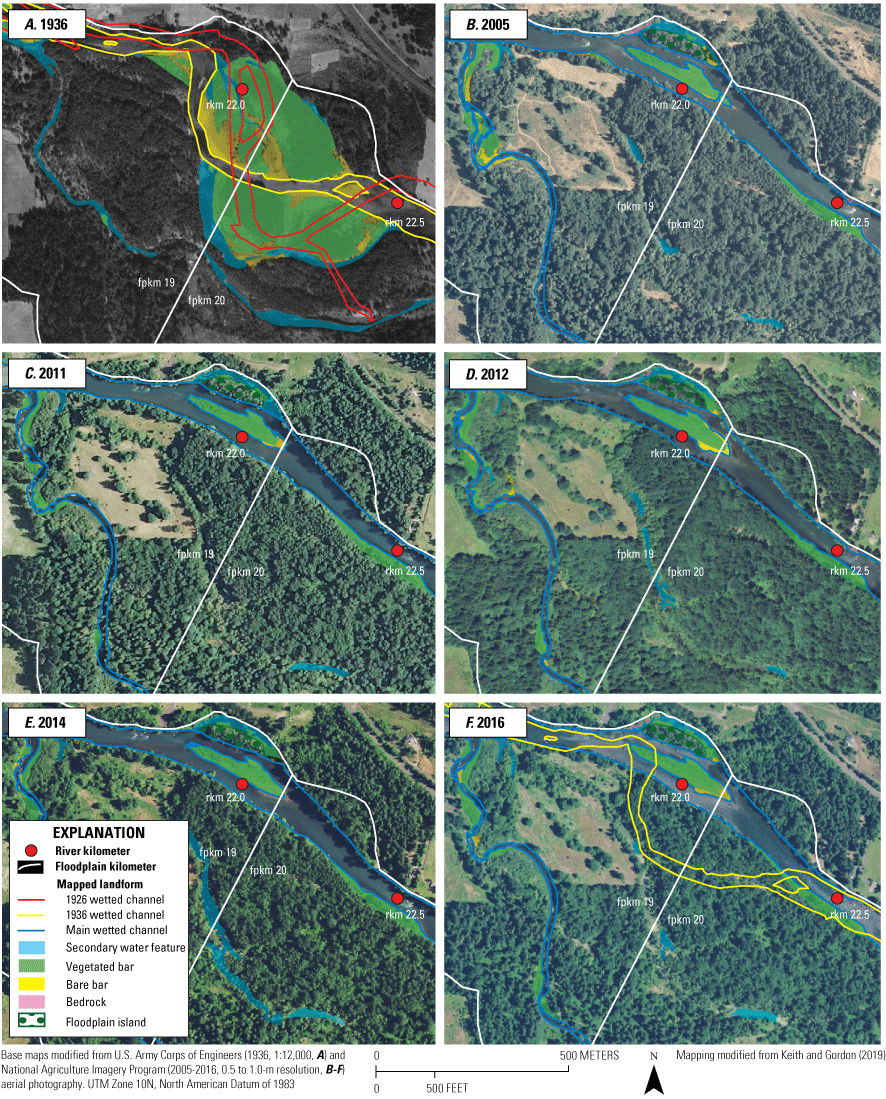
Repeat geomorphic mapping of the Dexter reach between river kilometer 22.6 to 21.4 (floodplain kilometer [fpkm] 18–19.5) along the Middle Fork Willamette River, Oregon, for 1936 (A), 2005 (B), 2011 (C), 2012 (D), 2014 (E), and 2016 (F).
Dougren Reach
The Dougren reach of Middle Fork Willamette River is immediately upstream from Fall Creek confluence and although much of the reach was laterally stable between 2005 and 2016 (fig. D18), channel changes near the confluence area resulted in mapped changes in the reach-aggregated area of gravel bars and wetted features. Throughout the 2005–16 period, gravel bars on the Dougren reach were predominantly covered by woody-type vegetation, with very few mapped unvegetated bars (fig. D13), and side channels were the main type of secondary water features (fig. D14; app. 3). Net changes in mapped features from 2005 to 2016 included a 17 percent increase (28,900 m2) in the total area of mapped bars when the area of unvegetated bars more than doubled (17,600 m2), and smaller decreases in herbaceous bars and increases in woody bars were mapped (fig. D13; app. 3). Area of mapped secondary water features decreased by 14 percent during that same period (19,900 m2), which was mainly attributable to changes at the confluence with Fall Creek and could reflect the wider active channel in this location and the presence of actively shifting mid-channel bars. Though local changes in gravel bars and secondary water features that owe to erosion and deposition are apparent from the mapping, the reach-aggregated trends in bar area almost certainly also reflect variation in discharge at the time of aerial photograph discharge rather than reach-wide channel change because the years, with greatest area of unvegetated gravel bars (2012 and 2016) coinciding with lowest discharges at the time of aerial photograph acquisition (table D4; figs. D13, D14).
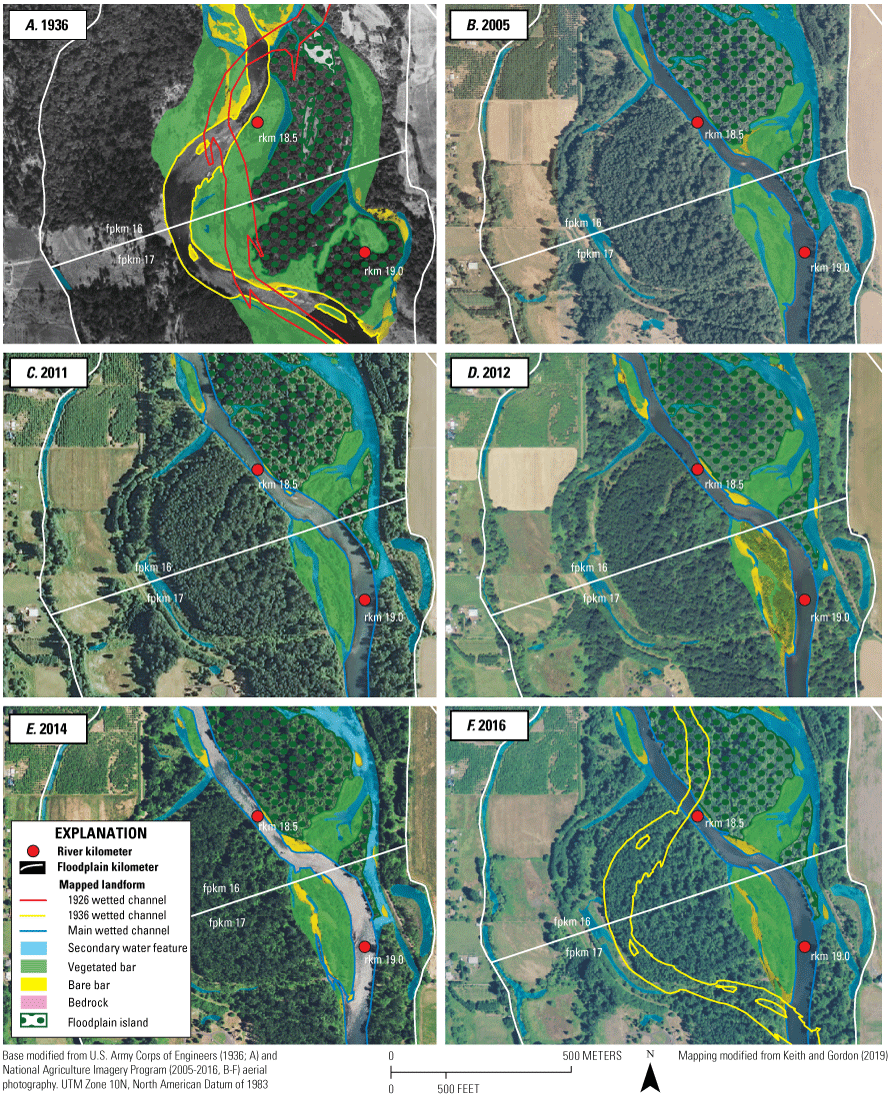
Repeat geomorphic mapping of the Dougren reach between river kilometer 19.2 and 18.1 (floodplain kilometer [fpkm] 16–17) along the Middle Fork Willamette River, Oregon, for 1936 (A), 2005 (B), 2011 (C), 2012 (D), 2014 (E), and 2016 (F).
Jasper Reach
The Jasper reach of the Middle Fork Willamette River is immediately downstream from the confluence with Fall Creek and was laterally stable with few changes in overall planform between 2005 and 2016 (fig. D19). Like most other reaches of the study area, gravel bars on the Jasper reach were predominantly covered with woody vegetation and secondary water features were primarily side channels (figs. D13, D14; app. 3). Most of the changes in gravel bars from 2005 to 2016 were mapped in the upper part of Jasper reach between rkm 17.9 and 15.3 (fpkm 15.5 and 13.5), while the lower portion of the reach that flows along the base of hillslopes and adjacent to bedrock outcrops was more stable (fig. D19). From 2005 to 2016, the total area of mapped bars increased by 8.9 percent (8,690 m2), when the area of unvegetated bars more than tripled (from 5,690 to 19,200 m2) and smaller increases (10 percent) in woody vegetated bars and decreases (40 percent) in herbaceous bars occurred (fig. D13; app. 3). Between 2005 and 2011 (prior to the first drawdown in autumn of 2011 [WY 2012]), the area of unvegetated bars increased by 83 percent (4,750 m2; fig. D13; app. 3). Trends in unvegetated bar area following the implementation of annual streambed drawdowns include a 112 percent increase in area from 2011 to 2012 (11,700 m2), a 25 percent decrease in area from 2012 to 2014 (5,620 m2), and a 17 percent increase in area from 2014 to 2016 (2,710 m2). Trends in total area of secondary water features include an 11 percent increase in area from 2005 to 2011, less than 9 percent increases for the 2011–12 and 2012–14 periods, and a 14 percent decrease from 2014 to 2016 (fig. D14; app. 3). Because discharges in the aerial photographs in 2012 and 2016 post-dating drawdown implementation were similar (varying by less than 190 ft3/s; table D4), the mapped changes in bars and secondary water features between 2012 and 2016 likely reflect actual geomorphic changes as well as other sources of uncertainty introduced during mapping.
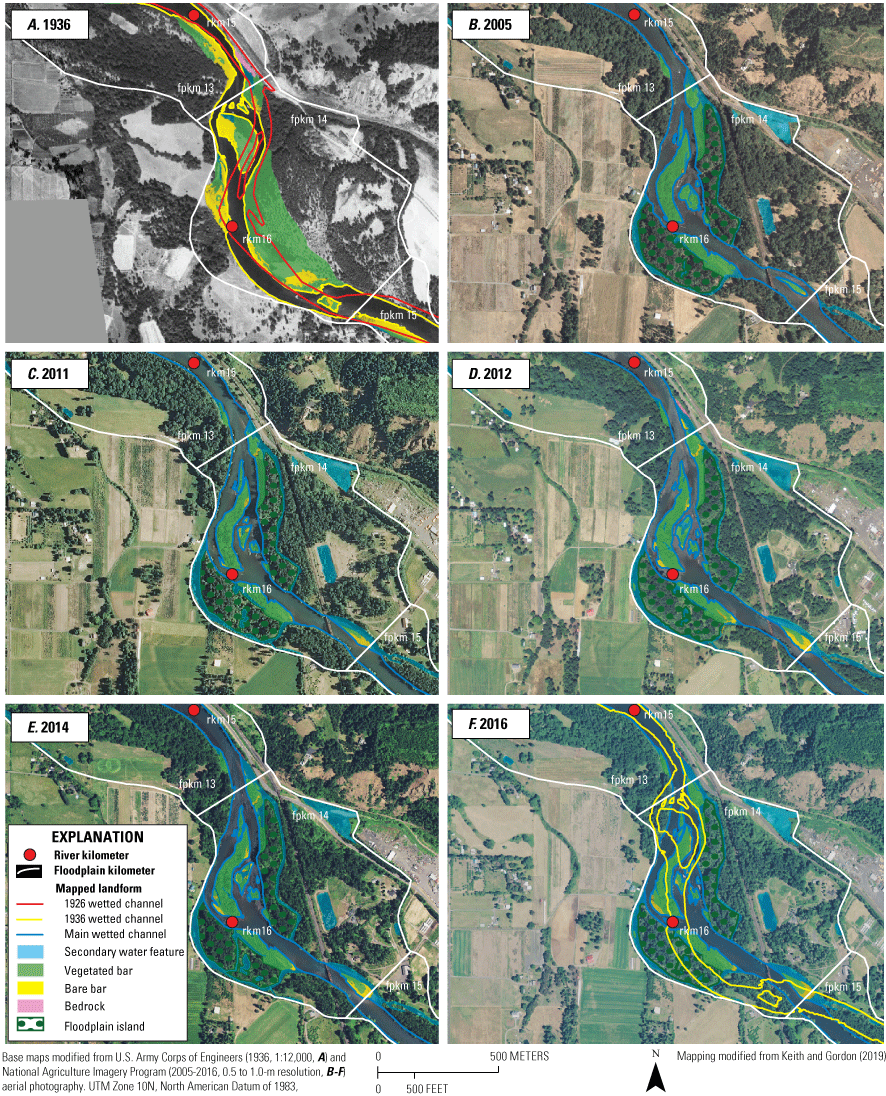
Repeat geomorphic mapping of the Jasper reach between river kilometer 16.9 and 15.0 (floodplain kilometer [fpkm] 13–15) along the Middle Fork Willamette River, Oregon, for 1936 (A), 2005 (B), 2011 (C), 2012 (D), 2014 (E), and 2016 (F).
Considering overall mapping results from the Jasper reach and associated uncertainty, key findings of geomorphic changes between 2005 and 2016 include: (1) negligible changes in the location and areas of vegetated bars and the main wetted channel indicate overall geomorphic stability of the reach in the present (post-dam) streamflow and sediment regime, and (2) the main detectable change from the repeat mapping was a twofold increase in unvegetated bars partially owing to substantial increases between 2005 and 2011 (pre-dating streambed drawdowns at Fall Creek Lake) followed by another twofold increase in unvegetated bar area between 2011 and 2012 (spanning the first streambed drawdown). Negligible changes in bars and secondary water features in the lower Jasper reach (downstream from about rkm 15.0) also suggest that reach-scale aggradation and associated geomorphic responses are not occurring in response to sediment releases from Fall Creek Lake in this segment of the Middle Fork Willamette River. Where increases in unvegetated bars were most apparent, changes were concentrated in a more laterally active segment that coincides with lateral channel change near the confluence of Fall Creek (where mapping from the Dougren reach also shows greater amounts of channel change) and pre-date the Fall Creek Lake streambed drawdowns; it is therefore difficult to attribute changes in gravel bars after 2012 solely to deposition from Fall Creek Lake streambed drawdowns. However, the concentration of bars at upstream end of the Jasper reach near the Fall Creek confluence, and persistence of these bars over time, likely provides suitable areas for deposition of reservoir sediment.
Clearwater Reach
Although much of the Clearwater reach of the Middle Fork Willamette River was laterally stable from 2005 to 2016 (fig. D20), local segments were laterally dynamic and reach-aggregated changes in the area of gravel bars and secondary water features were the greatest in this reach compared with other reaches in this study. Like other reaches, gravel bars were predominantly covered with woody vegetation, but the Clearwater reach also had a substantially greater proportion of unvegetated bars compared with other reaches (comprising about 30 percent of total bar area in 2016, figs. D12, D13; app. 3). Between 2005 and 2016, the total area of bars increased by 18.5 percent (53,100 m2), due mainly to increases in unvegetated bars (82,300 m2) while herbaceous and woody bars underwent net losses in area of 19,800 m2 and 9,390 m2 (respectively; fig. D13; app. 3). Between 2005 and 2011, prior to streambed drawdowns, at Fall Creek Lake there was a minor (4.6 percent, 13,300 m2) decrease in total bar area, yet the mapped area of unvegetated bars increased by 23,300 m2 despite higher discharge in the 2011 aerial photographs (table D4) that would bias these features toward smaller areas if no actual geomorphic change had occurred, whereas herbaceous and woody bars decreased by 26,900 and 9,710 m2, respectively. For the mapping periods bracketing the first full streambed drawdown at Fall Creek Lake (2011 and 2012), the 18 percent increase in total bar area (50,000 m2) was mainly due to mapped increases in unvegetated bars. From 2012 to 2014, unvegetated gravel bar area decreased by 30,100 m2 followed by an increase of 35,000 m2 during the 2014–16 period. Although the mapped area of secondary water features within the Clearwater reach increased by 18 percent (16,700 m2) from 2005 to 2016, the 2005–11 and 2011–12 mapping intervals each show minor losses in these landforms (app. 3; fig. D14). The largest increase reach-aggregated area of mapped secondary water features occurred between 2012 and 2014 (14 percent, 12,700 m2), with additional increases in mapped area observed between 2014 and 2016 (fig. D14; app. 3). Although minor fluctuation in aerial photograph discharge (table D4) may partly explain some of the variation in mapped area of gravel bars and secondary water features, distinct changes in locations of gravel bars and perimeter of side channels are apparent from the aerial photographs, suggesting that some of the computed changes relate to local erosion or deposition. For example, lateral channel shifting resulted in erosion of a vegetated bar between 2005 and 2016 at rkm 7.0–6.7, while at the same time, the area between rkm 7.1 and 6.8 underwent deposition and bar growth (fig. D20).
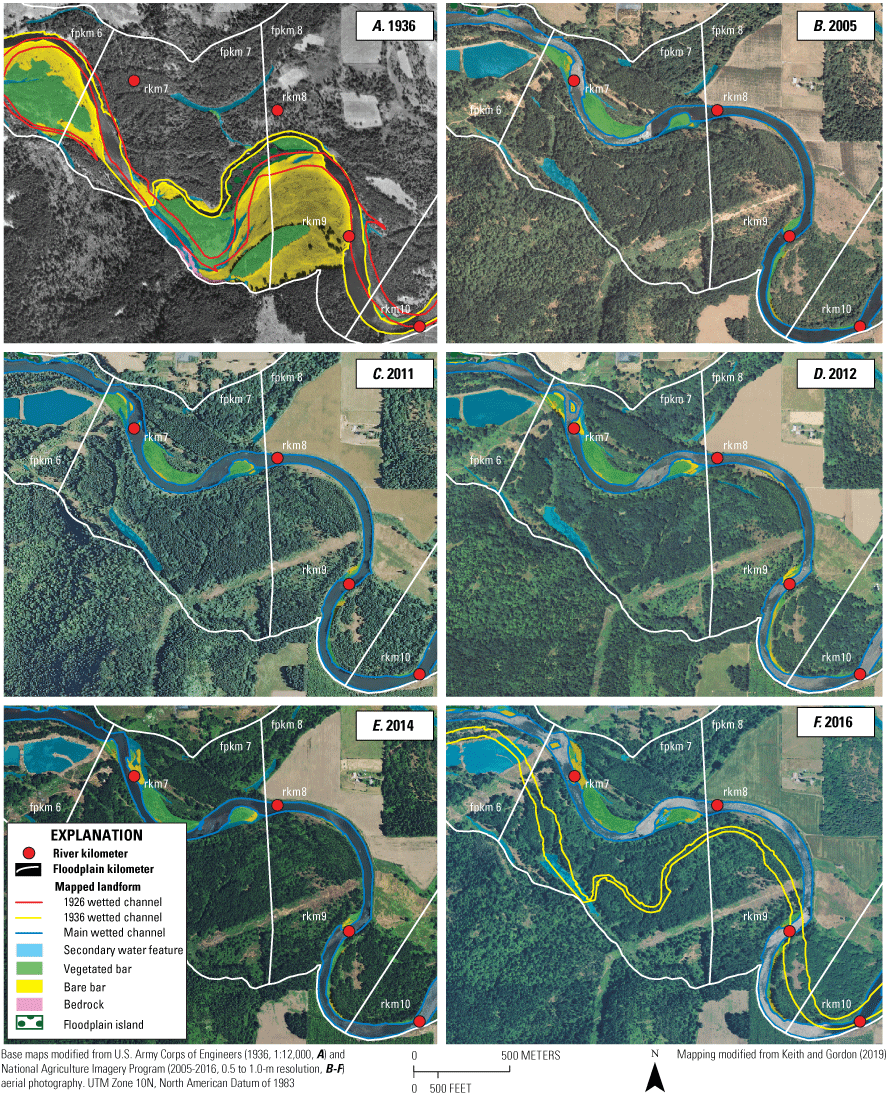
Repeat geomorphic mapping of the Clearwater reach between river kilometer 10.1 and 6.1 (floodplain kilometer [fpkm] 6–9) along the Middle Fork Willamette River, Oregon, for 1936 (A), 2005 (B), 2011 (C), 2012 (D), 2014 (E), and 2016 (F).
Altogether, the repeat mapping of the Clearwater reach from 2005 to 2016 shows that this reach has laterally active areas where modest, but detectable, bank erosion along bars covered in herbaceous and woody vegetation is coupled with steady increases in the area of unvegetated bars. Despite uncertainty in the repeat channel maps, increases in unvegetated bars from 2005 to 2016 are approximately matched by losses in vegetated bars over the same period, indicating sediment released from Fall Creek Lake streambed drawdowns is not the only source of sediment contributing to bed-material deposition and bar growth in this reach. Also, similar to the Jasper reach, the Clearwater reach underwent increases in unvegetated bars (and losses in vegetated bars) between 2005 and 2011—prior to the Fall Creek Lake annual streambed drawdowns—suggesting that erosion and re-deposition of gravel stored in channel-flanking bars is an ongoing process pre-dating streambed drawdown operations.
Summary of Downstream Geomorphic Responses to Streambed Drawdowns at Fall Creek Lake
Site-scale measurements at streamflow-gaging stations and gravel bars show that reservoir sediments released from Fall Creek Lake during annual streambed drawdowns of WY 2012–18 (evaluated in this study) are not producing substantial, long-lasting changes in the main channel elevation or bed-material substrates at the sampling sites. The specific streamgage analysis at the Fall Creek streamgage (1.4 km downstream from Fall Creek Dam) indicates that the geometry of the low-flow channel has undergone minimal net changes since 1972. These indications of vertical stability are supported by field observations of extensive in-channel bedrock near the gaging station. Despite this stability, transient scour and fill near the Fall Creek streamgage occurred during and immediately following the WY 2012 and 2013 streambed drawdowns. The specific streamgage analysis showed evidence of short-term increases in stage (up to 0.32 m) for low-flow discharges signifying temporary storage of reservoir sediment on the channel bed. However, these apparent increases in bed elevation dissipate quickly (within days to weeks), reflecting the magnitude of sediment released and streamflows following the streambed drawdowns. Farther downstream at the Jasper streamgage on the Middle Fork Willamette River, specific streamgage analyses did not detect substantial trends in bed elevations that could be attributed to the streambed drawdowns indicating that (1) most of the reservoir sediment passing the Jasper streamgage remain in suspension at this location (Chapter C. Sediment Delivery from Fall Creek Lake and Transport through Downstream Reaches) and (2) the coarser sands and fine gravels released from the drawdowns have either not yet reached the Jasper streamgage or the magnitude of bedload sediment passing the Jasper streamgage does not result in detectable aggradation. Bed-material textures at the five sites sampled in both 2015 and 2016 do not reveal changes noticeable fining trends, showing that sediment releases from the Fall Creek Lake did not result in substantial deposition of fine-grained sediment on the gravel bar surfaces sampled within this period. The findings of the specific streamgage analyses and repeat bed-material measurements are supported by observations from field visits and repeat ground-based photographs indicating a lack of persistent, system-wide deposition of sand and finer-grained sediment on the bed of the main low-flow channels in the study area, although it is likely that fine sediments may have infiltrated gravels. Altogether, these findings indicate that transport-capacity in the main, low-flow channels of Fall Creek and Middle Fork Willamette River during WY 2012–18 was sufficient to mobilize and evacuate fine-grained reservoir sediments from streambed drawdowns or other sources; however, other anecdotal observations by other researchers (ODFW surveys [Bangs and others, 2020] and landowners [J. Baumann, oral commun., November 2015]) and monitoring for this study (“Site-Scale Deposition of Fine-Grained Sediment from Clay-Horizon Markers, Water Years 2016–17” section of this chapter) indicate low-velocity zones in off-channel areas are prime locations for sand and finer-grain sediment deposition.
Site-scale measurements of sediment deposition on vegetated bars and low-elevation floodplains at 12 sites along Fall Creek and Middle Fork Willamette River using clay-horizon markers show that reservoir sediments carried as suspended-sediment load were locally deposited during WY 2016–17 and that the magnitude and timing of overbank deposition varies with proximity to the dam, geomorphic setting, streamflows, and other factors. In the low-flow days following the WY 2016 and 2017 streambed drawdowns, deposition was only observed at lowest elevation marker sites 3.6 km downstream from Fall Creek Dam and was undetectable at sites farther downstream and those that had not yet been inundated. The months following the streambed drawdowns encompassed several higher streamflow events, and deposition was subsequently detected at nearly all downstream sites, even those 24 km downstream from Fall Creek Dam on the Middle Fork Willamette River. Sediment deposition magnitudes were lower in WY 2017 than WY 2016, which may reflect the smaller magnitude of sediment released from the Fall Creek Lake (Chapter C. Sediment Delivery from Fall Creek Lake and Transport through Downstream Reaches) and lower observed streamflows in WY 2017 (peak mean daily streamflow in WY 2017 was only about 72–78 percent of that observed in WY 2016). The smaller amounts of reservoir sediment supply and lower streamflow in 2017 compared with 2016 likely created conditions that led to less inundation carrying fine sediment, and thereby less deposition, on higher-elevation clay-horizon markers.
At the landform-scale, comparison of topography at four sites where cumulative patterns of erosion and deposition were evaluated using repeat lidar surveys, bar and floodplain landforms were primarily evolving by net deposition, though some localized erosion was also detected. Deposition thickness and spatial patterns were variable (table D2; fig. D10), including sites with dispersed, but measurable deposition ranging from a few mm to over 1 m (Unity; fig. D10A), as well as sites where deposition was highly localized and exceeding 1 m in depth (Sand Mountain; fig. D10C). Although topographic changes could not be quantified in channel areas that were below the water surface at time of topographic lidar acquisition (2012 or 2009), field observations of these sites indicate that deposition could be substantial (fig. D11). Average annual deposition at the four sites ranges from 175 to 1,210 m3/year (table D2). The measured deposition at Fall Creek sites most likely is from reservoir sediments released from Fall Creek Lake during streambed drawdowns because the geomorphic stability of this river and limited tributary inputs provide few other sediment sources. Likewise, sediment deposited at the Sand Mountain site on Middle Fork Willamette River also likely originates from Fall Creek Lake, but small tributaries and known (albeit modest) channel changes upstream on the Middle Fork Willamette River could also be contributing to sediment to this site. Sources of sediment deposited at the TNC site on the Middle Fork Willamette River at the downstream end of the study area are more confounded and could reflect sediment sourced from nearby bank erosion (fig. D10D) as well as Fall Creek Lake streambed drawdown operations or other upstream sources (see the “Reach-Scale Morphology and Changes in Channel Planform, Water Years 2005–16” section in this chapter). Additionally, hydraulic conditions at the TNC site could be especially conducive to deposition of suspended sediment because the comparatively wide active channel, large channel-flanking bars, and vegetation promote deposition processes at moderate to high streamflows.
Although the Upper and Lower Fall Creek reaches are immediately below Fall Creek Dam and received influxes of fine-grained sediment from annual streambed drawdowns between 2011 and 2016, repeat mapping of the active channel from 2005 to 2016 suggests that reservoir sediments are having a minor influence on reach-scale patterns of channel change and that geomorphic changes potentially attributable to the drawdown are mostly focused on along the channel margins and in off-channel areas (figs. D13–D16; app. 3). Repeat mapping of bars on Upper Fall Creek reach (fig. D15) indicates that widespread increases in gravel bars did not result from the five streambed drawdowns encompassed by the 2005–16 mapping. The main change from 2011 to 2016 potentially attributable to sediment releases from Fall Creek Lake were localized increases in vegetated bar area particularly where channel margin areas were converted to herbaceous or woody bars. Mapped losses in secondary water features between 2005 and 2016 may partly owe to lower discharges in 2016 (table D4), but some of these losses were validated with visual inspection of aerial photographs and field visits. Primary changes along the Lower Fall Creek reach (fig. D16) include (1) a 6.4 percent decrease in area of secondary water features between 2011 and 2016 spanning Fall Creek Lake streambed drawdowns owing to decreases in the area of side channels and conversion of some side channels to alcoves, and (2) a nearly twofold increase in the area of unvegetated bars while vegetated bar area remained approximately similar. Although other datasets from this study (fig. D10) and accounts from other researchers (ODFW surveys [Bangs and others, 2020], and landowners [J. Baumann, oral commun., November 2015 and other dates]) indicate local deposition can exceed 1 m, those local changes are seldom detectable with repeat mapping from aerial photographs conducted at 1–3 year intervals, because the (1) scale of deposition is smaller than photograph resolution, (2) deposition along channel margins is obscured by vegetation, and (3) temporary deposition during the early months following autumn streambed drawdowns typically dissipated before aerial photographs were collected (typically summer).
Downstream from Fall Creek on the Middle Fork Willamette River, overall reach-scale planform changes between 2005 and 2016 reflect the wider active channel, less valley confinement, and increasing scale and abundance of alluvial landforms through the Jasper and Clearwater reaches (figs. D13, D14, D19, D20; app. 3). In the Jasper reach (fig. D19), negligible changes in the location and areas of vegetated bars and the main wetted channel reveal the overall geomorphic stability of the reach, which partly reflects geological control as well as streamflow regulation and sediment trapping by upstream dams. The most notable change in this reach detected with repeat mapping was a twofold increase in unvegetated bars between 2005 and 2016, which partly owes to substantial increases area between 2005 and 2011 (pre-dating streambed drawdowns at Fall Creek Lake) as well as increases between 2011 and 2012 (spanning the first streambed drawdown). Local increases in unvegetated bars between 2005 and 2016 were documented (app. 3) in a laterally active zone with multiple bars and off-channel features just downstream from the confluence with Fall Creek but are difficult to attribute solely to deposition of reservoir sediments from Fall Creek Lake because (1) areas just upstream from the confluence also display similar changes and (2) some of the increases at the confluence area pre-date the Fall Creek Lake streambed drawdowns. Farther downstream, repeat mapping of the Clearwater reach from 2005 to 2016 (fig. D20) shows laterally active segments where modest erosion of herbaceous and woody vegetation is coupled with increases in the area of unvegetated bars indicating sediment released from Fall Creek Lake streambed drawdowns is not the only source of sediment contributing to bed-material deposition and unvegetated bar growth in this reach. Documented increases in unvegetated bars in this reach prior to the implementation of Fall Creek Lake streambed drawdowns and continued increases in WY 2012–16 after streambed drawdowns were implemented indicates erosion and re-deposition of gravel stored in bars are ongoing processes that pre-date streambed drawdown operations. In both the Jasper and Clearwater reaches, sediment sourced from tributaries and local reworking of bars or floodplain material provides an additional layer in complexity in attributing geomorphic changes directly to streambed drawdowns.
Chapter E. Discussion of Geomorphic Responses of Fall Creek and Middle Fork Willamette River to Streambed Drawdowns at Fall Creek Lake
Chapter E. Discussion of Geomorphic Responses to Streambed Drawdowns at Fall Creek LakeDuring Fall Creek Lake streambed drawdowns, reservoir water levels are temporarily drawn down to streambed elevation to aid in the passage of juvenile spring Chinook salmon (Oncorhynchus tshawytscha) through the reservoir area and dam to downstream reaches as they rear and migrate toward the ocean. The lowered water levels and free-flowing conditions created in the reservoir during the streambed drawdown operations expose unconsolidated reservoir sediments to fluvial erosion and transport to reaches of Fall Creek and the Middle Fork Willamette River downstream from the dam. The streambed drawdowns considered in this study occurred annually from WY 2012 through 2018, typically for 1–2 weeks in late autumn and early winter. This study determined that in the days, months, and years following the streambed drawdowns, reservoir sediments delivered to downstream reaches undergo various transport pathways and travel times, including (1) rapid transit and eventual export from these reaches, (2) temporary storage and re-entrainment along the river corridor, or (3) longer-term deposition and storage, which in turn can trigger a wide variety of geomorphic responses such as changes in bed-material substrate, channel morphology, and patterns of overbank deposition over a range of temporal and spatial scales. Similar to dam removals (for example, Skalak and others, 2009; Major and others, 2012; Wilcox and others, 2014; East and others, 2015; Magirl and others, 2015; Randle and others, 2015; Warrick and others, 2015; Foley and others, 2017), streambed drawdowns trigger tightly coupled geomorphic responses in reaches upstream and downstream of the dam. In response to streambed drawdowns at Fall Creek Lake, reservoir erosion is the dominant process upstream from Fall Creek Dam, which in turn, directly influences sediment transport and deposition patterns dominant in downstream reaches.
The overall suite of geomorphic responses to the Fall Creek Lake streambed drawdowns from WY 2012 to 2018 provides insight into the interactions among the hydrogeomorphic processes influencing the reservoir and downstream reaches and the role of dam operations in altering these processes. Objectives of this study were to (1) characterize changes in reservoir morphology and substrate in Fall Creek Lake, (2) describe the character and temporal pattern of sediment transport downstream from Fall Creek Dam, and (3) characterize geomorphic changes in channel reaches downstream from Fall Creek Dam that relate to the annual streambed drawdowns of WY 2012–18. Key findings of this study pertain to (1) the coupled upstream-downstream geomorphic responses to the Fall Creek Lake streambed drawdowns, (2) geomorphic responses of Fall Creek Lake streambed drawdowns in comparison to drawdowns at other large dams, (3) controls on reservoir erosion and downstream geomorphic responses, and (4) implications for future geomorphic changes with continuation of streambed drawdowns. In this chapter, key findings of various geomorphic responses to the Fall Creek streambed drawdowns for different geomorphic processes, spatial areas, and timeframes (as described in previous chapters) are synthesized to provide overarching insights regarding coupled interactions between reservoir erosion, downstream transport of reservoir sediments, and geomorphic implications for downstream reaches.
Channel Morphology and Historical Transformation of Fall Creek and Middle Fork Willamette River Since the Construction of Dams
Fall Creek Lake
Fall Creek Lake (fig. A6) was created when Fall Creek Dam was constructed in 1965, impounding Fall Creek and resulting in the inundation of relatively narrow (50–1,000 m-wide) valleys bisected by Fall and Winberry Creeks (figs. A7, B4A). Aerial photographs from 1936 and other historical datasets show that steep, valley-edge hillslopes confining the reservoir were heavily forested (fig. B4); the valley floor was dominated by agricultural and residential areas in the mid-19th century prior to dam construction; and that much of Fall Creek flowed on bedrock, with occasional gravel bars and patches of coarse substrates (Keith and others, 2023a). After nearly six decades of impoundment, the valley floor had evolved to reservoir floor with predominantly fine-grained, unconsolidated sediment deposits mantling the pre-dam topography. Within the reservoir floor, thicker deposits (about 3 m) were located in the lower reservoir near the dam where pre-dam topography is completely obscured by overlying sediments (fig. B5B). Repeat surveys and detailed geomorphic mapping in the reservoir show that reservoir deposits thin upstream (or up-reservoir), and many pre-dam valley features and infrastructure remain identifiable despite varying amounts of burial by sediment (fig. B5). Exposed in-channel bedrock and overall channel stability upstream from minimum pool indicate fluvial processes are still active, at least intermittently, within the stream channel, and sand and finer-grained sediments deposited during lacustrine conditions at higher lake levels can be mobilized from the upper reservoir to the lower reservoir or downstream from the dam. Although the Fall Creek stream channel is presently (during the period of this study) flowing through a reservoir and is bordered by broad reservoir floor surfaces that evolve by lacustrine sedimentation, the stream channel in the middle and upper reservoir was historically and is presently a stable bedrock channel with intermittent gravel bars that may be episodically mobilized.
Fall Creek
Downstream from Fall Creek Dam, Fall Creek flows through a relatively confined valley (compared with the Middle Fork Willamette River) reflected by a narrow, semi-alluvial channel that efficiently conveys water and sediment at typical regulated streamflows. Unlike many gravel-bed rivers below large dams (Grant, 2012), the morphology of Fall Creek has changed little in the six decades following dam construction (Keith and others, 2023a). The channel within the study area had an overall planform and distribution of landforms with little change between 1936 and 2016 (figs. D15, D16). The most substantial morphologic change detected over this period was a reduction in unvegetated gravel bars mainly attributed to vegetation encroachment (94 percent loss in the Upper Fall Creek reach; 63 percent loss in the Lower Fall Creek reach; Keith and others, 2023a). As of 2016, the channel has both bedrock and alluvial segments with greater alluvial cover downstream from the confluence with Little Fall Creek (figs. D12–D13; app. 3). The presence of in-channel bedrock (fig. D12) and lack of full alluvial cover on the channel bed in 1936 and 2016 suggests transport capacity along Fall Creek has historically and recently exceeded sediment supply, particularly in the Upper Fall Creek reach between Fall Creek Dam (rkm 11.6–11.8) and near the confluence with Little Fall Creek (rkm 5.6), where in-channel bedrock is most extensive.
Middle Fork Willamette River
Downstream from Dexter Dam, the Middle Fork Willamette River flows through a relatively less confined valley than Fall Creek and is a large, gravel-bed river that remains a fully alluvial river notwithstanding substantial transformations in channel morphology and reduction in lateral dynamism following the construction of three upstream dams. The Middle Fork Willamette River Basin was historically one of the largest producers of streamflow and gravel of all Willamette River Basin tributaries (Gregory and others, 2007; O’Connor and others, 2014). The lower 27.5 km of the Middle Fork Willamette River encompassing the reaches downstream from Dexter Dam were laterally dynamic with multi-thread and single-thread channels flanked by large, shifting gravel bars prior to dam construction (panel A of figs. D17–D20; Keith and others, 2023a). After streamflow regulation and other channel modifications in the mid-20th century, the lower reaches of the Middle Fork Willamette River have become more stable and encompass a narrower floodplain corridor. By 2016, former gravel bars were converted to low-elevation floodplains colonized by young, dense forests that flank much of the present-day channels (fig. E1; Keith and others, 2023a). Compared with Fall Creek study reaches, the Middle Fork Willamette River study reaches have about twice the area of bars per unit length of channel, 13 times the area of unvegetated gravel bars per unit length of channel, and 11 times the area of secondary water features per unit length of channel (in 2016; fig. D12; table D5). Although all study reaches along the Middle Fork Willamette River have a much greater abundance of alluvial related features (bars, secondary water features, and floodplain islands) than Fall Creek, these reaches have relatively smaller and fewer actively shifting gravel bars than other unregulated, fully alluvial large rivers of western Oregon (O’Connor and others, 2014). For example, the area of mapped gravel bars per unit length of channel for fluvial reaches of the Rogue River was 63.2 m2/m (Lobster Creek reach in 2009; Jones and others, 2012) and the Chetco River was 51.6 m2/m (Chetco River in 2008; Wallick and others, 2010), whereas mapped bar area per unit length channel on Fall Creek downstream from Fall Creek Dam was 12.5 m2/m and 27.1 m2/m in the Middle Fork Willamette River downstream from Dexter Dam in 2016 (table D5).
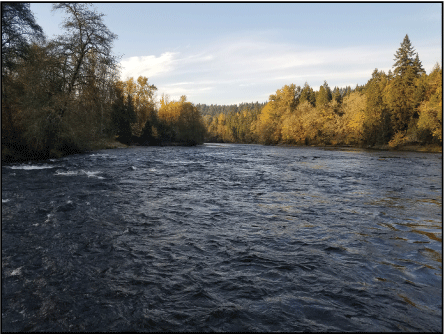
Low-elevation, densely vegetated floodplain along the Middle Fork Willamette River in the Dexter reach. Photograph by Mackenzie Keith, U.S. Geological Survey, November 7, 2018.
Coupled Upstream-Downstream Geomorphic Responses to Fall Creek Lake Streambed Drawdowns during Water Years 2012–18
Similar to dam removals, the geomorphic responses of Fall Creek and downstream reaches of the Middle Fork Willamette River to annual drawdowns of Fall Creek Lake reflect coupled interactions between erosion and export of reservoir sediments and the fate of this sediment in the reaches downstream from the dam. Understanding geomorphic responses to the Fall Creek streambed drawdowns during WY 2012–18 and improving the ability to anticipate geomorphic responses to future streambed drawdowns benefits from consideration of the various natural and anthropogenic factors that control reservoir erosion during the drawdowns and the hydrogeomorphic conditions that control the transport and deposition of that sediment in downstream reaches (fig. E2). Streambed drawdowns at Fall Creek Lake erode and mobilize large magnitudes of predominantly sand and smaller sized sediment from the reservoir during short periods each year. This fine-grained sediment transport substantially increases the sediment supply to reaches downstream from the dam (Schenk and Bragg, 2014, 2021) and, consequently, triggers an array of geomorphic responses downstream from the dam. The magnitudes and types of geomorphic adjustments occurring in reservoir and downstream reaches in response to the drawdowns, as well as the timing and persistence of those responses varies spatially and temporally following streambed drawdowns. There was also considerable variation in the geomorphic responses among the WY 2012–18 drawdowns and cumulatively over that period. While this study did not explicitly evaluate controls on these coupled interactions, the documented upstream and downstream geomorphic responses to streambed drawdowns reflect the cumulative effects of human and natural controls on reservoir sediment erosion and downstream sediment transport, thus providing a foundation for hypothesizing controls on those processes.
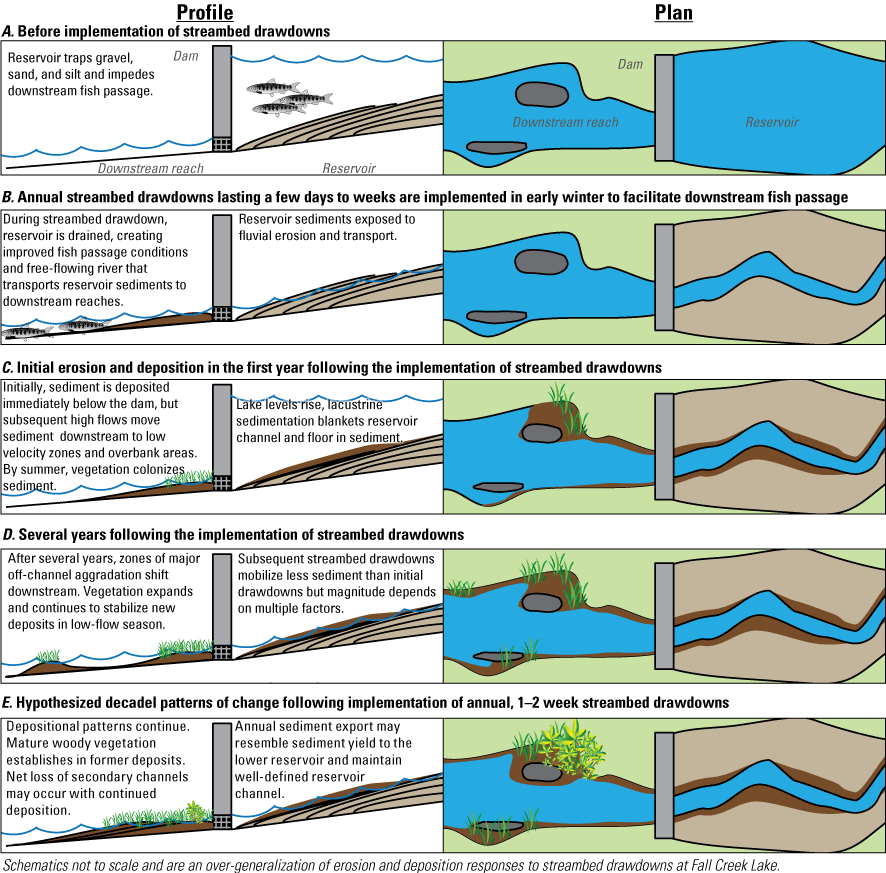
Plan and profile schematics of conceptual framework for reservoir evolution within Fall Creek Lake, Oregon, in response to annual streambed drawdowns. The framework includes the following phases: reservoir sedimentation during elevated pool levels (A); lake level lowering to facilitate the downstream migration of juvenile spring Chinook salmon (Oncorhynchus tshawytscha; B); mobilization of reservoir sediment during draining and free flowing conditions is concentrated near the main channels during drawdowns (C); mobilization of reservoir sediment during draining and free flowing conditions (D and E) is still concentrated near the main channels during subsequent drawdowns with some additional incision and lateral migration; however, pre-dam morphology and distribution of sedimentation reduces the magnitude of change over time.
Reservoir Sedimentation, Streambed-Drawdown Related Erosion, and Sediment Supply to Downstream Reaches
Findings from the reservoir mapping and analyses are consistent with regional estimates of sediment yield (O’Connor and others, 2014; Wise and O’Connor, 2016; Wise, 2018; Wise, 2020; O’Connor and others, 2021), and pre-dam (USACE, 1954) studies indicating that, although reservoir sediment accumulation in Fall Creek Lake is relatively low compared with other U.S. reservoirs such as the Missouri River Basin (for example, Graf and others, 2010; Reservoir Sedimentation Database [RESSED] database, https://water.usgs.gov/osw/ressed/db_doc2013/index.html), reservoir sediment is concentrated near the dam where it is most susceptible to erosion and export during streambed drawdown operations. The spatial distributions and thicknesses of sediment deposited in the reservoir reflect many factors including pre-dam morphology, sediment supply to the reservoir (and for example, relation to land use changes or fire), location of the regulating outlets, historical streambed drawdowns, longer-term typical operations for seasonal flood management, and annual streambed drawdowns. Comparison of historical datasets (pre-dam) to more recent topography (2012 and 2016) shows most of the reservoir deposition is concentrated in the lower reservoir at elevations below minimum conservation pool (728 ft). Annual streambed drawdown events since WY 2012, in combination with earlier intermittent streambed drawdowns (fig. A12), have helped to create the conditions necessary to maintain a well-defined and actively evolving channel in much of Fall Creek Lake. During periods of low pool levels (including streambed drawdowns), bedload transport and re-deposition of coarse-grained sediment is mainly constrained to the channel. Higher pool levels create lacustrine conditions that support deposition of sand and finer-grained sediment on the former pre-dam floodplain and terrace surfaces (presently, the reservoir floor during the period of this study) and lowermost areas of the reservoir. Hence, most of the reservoir floor is mantled by unconsolidated sands and finer material. Upstream from minimum conservation pool where the reservoir landforms are often exposed during seasonal flood-control operations coinciding with winter floods, the Fall Creek channel continues to undergo active bedload transport and has high bedload transport capacities relative to incoming sediment supply as indicated by bedrock and gravel reaches within the reservoir main channel. The broader morphology of the upper reservoir largely reflects pre-dam topography, as surfaces outside of the main channel have been minimally buried by reservoir sedimentation; the overall lack of thick, erodible fine-grained sediment deposits and distance of those deposits from the dam or other tributary and drainage channels together indicates that the upper reservoir only contributes minor amounts of sediment to reaches downstream of the dam during streambed drawdowns.
During streambed drawdown operations at Fall Creek Lake of WY 2012–18, pool levels were lowered nearly 15 m (50 ft) below minimum conservation pool (728 ft). Incremental lowering of pool levels, and ultimately a free-flowing channel, provided a suite of conditions for erosive processes to interact with sands and finer sized, unconsolidated sediment deposits in the lower reservoir that have accumulated in preceding decades. Drawdown-influenced erosion through the reservoir floor deposits is mainly limited to areas adjacent to the main reservoir channel (and to some degree within drawdown channels), as most of the reservoir floor is topographically higher than or farther from the main channel during streambed drawdown and inaccessible to major erosion and reworking. Areas immediately upstream from the dam, where reservoir sedimentation has buried the pre-dam channel, are subject to substantial downcutting and lateral migration through sands and finer-grained material during streambed drawdowns. When the reservoir was completely drained and streamflows through the reservoir were confined to the main channel, broad areas of reservoir floor deposits were largely inaccessible to erosive flows, because those deposits are perched on paleo-floodplain and terraces. However, drawdown-related landforms such as channels, terraces, and distributary zones developed within the broader reservoir floor as a result of streambed drawdowns show evidence of sediment entrainment and mobilization. Although the stream channel may entrain gravel and other clasts larger than sand that are transported as bed-material during annual streambed operations or other periods of lowered lake levels (such as during flood control operations in winter months), much of the gravel transport is occurring over highly resistant channel bed because many sections of the main channel flow on or adjacent to bedrock, particularly upstream from minimum pool (figs. B9–B10A).
These observations support a geomorphic framework in which the processes shaping reservoir sedimentation and erosion vary between the different zones of the reservoir according to their proximity to the main reservoir channel and the varying depositional and erosional processes active at different dam management and streamflow scenarios. In areas immediately upstream from the dam where sand and finer-grained sediment accumulation is thick and readily accessible to fluvial erosion and transport, the direct controls on erosion are dam operations (predominantly lake level and changes in lake level) and streamflow (unregulated streamflow entering the reservoir). Sediment eroded from the area proximal to the dam and main streambed drawdown channel is more likely to be transported downstream from Fall Creek Dam during streambed drawdowns than sediment recently mobilized from reservoir margins because of its proximity to the regulating outlets. Reservoir sediments stored farther upstream in the reservoir, and on higher elevation margins of the reservoir floor are thinner than deposits proximal to the dam and reflect underlying pre-dam floodplain and terrace surfaces; these sediment deposits must be eroded and routed farther through the reservoir prior to export. Channel stability imposed by localized occurrences of bedrock limits lateral migration, channel widening, and incision that might otherwise be anticipated from rapid lowering of lake levels and erosive conditions potentially created by this operation (for example, Morris and Fan, 1998; Major and others, 2012; Kondolf and others, 2014).
Downstream Responses to Reservoir Sediments Released During Streambed Drawdowns–Patterns of Sediment Transport and Effects on Channel Morphology
Sediment loads quantified from the sediment transport monitoring program provide insights regarding reservoir sediment erosion and export from the Fall Creek Lake during streambed drawdowns of WY 2013–18, including the amount and character of sediment exiting the reservoir, and temporal trends in the downstream transport of reservoir sediment (Schenk and Bragg, 2014, 2021; USGS, 2021). Sediment transport measured at the Fall Creek streamgage is primarily sourced from sediment evacuation from the reservoir during the streambed drawdowns because there is limited sediment sources or storage in the narrow, steep, and short 1.4-km-segment between Fall Creek Dam and the streamgage site. Measurements of sediment transport in WY 2013–18 reveal the distribution of reservoir sediments was primarily sand and finer-grained particles (less than 2 mm) that traveled in suspension. Some coarser grains (largest measured was 32 mm) were also mobilized and transported downstream during the streambed drawdowns, although the coarse sediment likely comprise a very small portion of total sediment load (Chapter C. Sediment Delivery from Fall Creek Lake and Transport through Downstream Reaches).
The total amount of reservoir sediment eroded from Fall Creek Lake and delivered to downstream reaches as a direct result of the annual streambed drawdowns from WY 2013 to 2018 was more than 80,000 t (Chapter C. Sediment Delivery from Fall Creek Lake and Transport through Downstream Reaches; table C1). Although the exact amount of sediment delivery to downstream reaches due to streambed drawdowns is challenging to quantify without data from WY 2012 and year-round sediment transport monitoring in subsequent years, the available sediment transport measurements, together with net changes in reservoir topography, reveal insights to the total net volumes of sediment delivered from the WY 2013–18 operations and annual variation in reservoir sediment evacuation. The total net reservoir erosion (146,000–221,000 t; Chapter B. Reservoir Morphology and Evolution Related to Dam Operations at Fall Creek Lake; table B1) represented in the WY 2012 lidar and WY 2017 structure from motion (SfM) datasets spans nearly five full streambed drawdowns and part of the WY 2012 drawdown. This results in annual average rate of erosion of 29,200–44,200 t/year over 5 years, which is similar in magnitude to the SSL calculated for WY 2013 (40,200 t) but greater than SSL calculated for later years (4,500–11,300 t/year; Chapter C. Sediment Delivery from Fall Creek Lake and Transport through Downstream Reaches; table C1).
The patterns of sediment transport measured at Fall Creek streamgage also reflect aspects of the streambed drawdown operations and subsequent sequence of regulated streamflows released from Fall Creek Dam. Drawdown operations in WY 2013–18 coinciding with sediment transport monitoring typically lasted 1–2 weeks, occurred in late autumn or early winter, and were followed by several months of high streamflows (albeit regulated; Schenk and Bragg, 2021). Reservoir sediment evacuated from Fall Creek Lake can be temporarily stored in the short reach between Fall Creek Dam and Fall Creek streamgage, but this supply appears to be exhausted annually based on temporal patterns of sediment transport (decreasing transport for a given discharge), field observations, and repeat geomorphic mapping (described in “Results of Repeat Geomorphic Mapping from Aerial Photography” section). The length of time required to deplete the annual reservoir sediment supply delivered downstream from the dam varied during WY 2013–18 from a few weeks to several months depending on the magnitude of sediment delivery and the magnitude and duration of streamflows in the ensuing months after the streambed drawdown (Schenk and Bragg, 2021). By spring of each year during the suspended-sediment monitoring period, SSL typically were small, even during moderate to high streamflows. Likewise, SSL measured at the Fall Creek streamgage vary substantially over time with sequence of drawdown operations, length of time monitored in each year, operational aspects in how the drawdown and near-drawdown conditions were implemented at Fall Creek Dam, reservoir inflow and outflow, climatic conditions (for example, during freezing conditions in WY 2014), and length of time Fall Creek was fully at streambed in the reservoir. Despite year-to year variability, an overall decrease in suspended-sediment loads from the reservoir has been observed since the largest measured loads in WY 2013, which is about 4–9 times greater than loads measured in WY 2014–18.
In gravel-bed channels, sediments carried as bedload form important morphological and habitat features (such as gravel bars and riffles). At Fall Creek, questions arose regarding whether sediment releases from Fall Creek Lake could supplement downstream bedload and potentially offset reductions in coarse sediment resulting from trapping by the dam. Bedload samples at the Fall Creek streamgage revealed that sediment traveling as bedload was predominantly sand, as opposed to the coarser gravels and cobbles that compose the channel bed and bar features. Also, bedload discharge rates were low (less than 140 kg/min) for WY 2013 and 2017, even for measurements collected during free-flowing conditions in the reservoir (no residual pool) during streambed drawdown operations, indicating minimal transfer of coarse gravel substrate through the dam. An inverse pattern of decreasing bedload transport with increasing streamflow over time likely reflects an exhausted, finite supply of bedload sediment released from the reservoir but may also suggest a change in streamflows where fine sand is converted to suspended load with increasing discharge. Altogether, the bedload measurements (together with field observations and geomorphic mapping downstream from Fall Creek Dam) show that (1) the mixed bedrock and coarse alluvial channel between the dam and the Fall Creek streamgage lacks coarse-grained sediment that is transportable during typical regulated winter streamflows, (2) the bedload released from the reservoir during streambed drawdowns is primarily sand, (3) bedload is rapidly exhausted in the weeks and months following the streambed drawdown, and (4) Fall Creek sediment transport is supply-limited following nearly six decades of upstream trapping of coarse sediment by Fall Creek Dam despite substantial concomitant reductions in the magnitude of peak streamflows through dam regulation and the relatively small additions of sand and fine-grained sediment supplied during streambed drawdowns.
In the days, weeks, and months following streambed drawdown operations at Fall Creek Lake, reaches downstream from the dam displayed a variety of geomorphic responses to reservoir sediment delivery. Immediately downstream from Fall Creek Dam, the upper segments of the main channel of Fall Creek became initially blanketed with the large supply of reservoir sediment during streambed drawdown operations delivered in late autumn (typically November-December for WY 2012–18). In addition to high SSL computed from the sediment monitoring program, sands and finer-grained deposits of sediment have been observed within the channel (fig. D2), and temporary increases in bed elevation have been observed (fig. D1). But over the course of the ensuing winter high-streamflow season, transport capacity was sufficiently high enough to clear these sands and finer-grained sediment from the main channel areas of Fall Creek and any minor increases in bed elevation near the Fall Creek streamgage that resulted from drawdown sediment dissipated by spring. The temporary pattern of sedimentation and redistribution in the weeks to months following streambed drawdown operation was systematically measured in WY 2016–17 for this study and with anecdotal observation of previous drawdowns (WY 2012–15) and qualitative observations from more recent drawdowns (WY 2018–19). On the Middle Fork Willamette River downstream from the Fall Creek confluence, transport capacity was also sufficiently high to transport streambed drawdown sediment out of the main channel following initial periods of relatively high turbidity and suspended-sediment conditions. However, sand, silt, and organic matter did repeatedly accumulate in low-velocity areas like side channels, alcoves, and along channel margins in the months and years following implementation of streambed drawdown operations.
Larger and thicker deposits of sand and finer-grained sediments were likely established during the earliest drawdowns (WY 2012–13) in off-channel areas nearer to the dam on Fall Creek than in subsequent years (figs. D10, D15, D16; fig. E3). During WY 2014–18, with reduction of sediment released from the reservoir (fig. C3) and as some off-channel areas have lost accommodation space (figs. D10, D15), relatively less sediment was deposited in reaches of Fall Creek immediately downstream of the dam compared with WY 2011–12; although, the accumulation of new sand and finer-grained sediment deposition on bars and low floodplain surfaces in any particular year is dependent on streamflows and local inundation patterns along with upstream supply (fig. D9). Along the Middle Fork Willamette River, deposition of sediment likely sourced from streambed drawdowns, in addition to sediment potentially derived from other sources, appeared to be more variable longitudinally than was observed along Fall Creek (figs. D9, D19, D20); deposits were still mostly limited to low velocity areas along high bars and low floodplains.
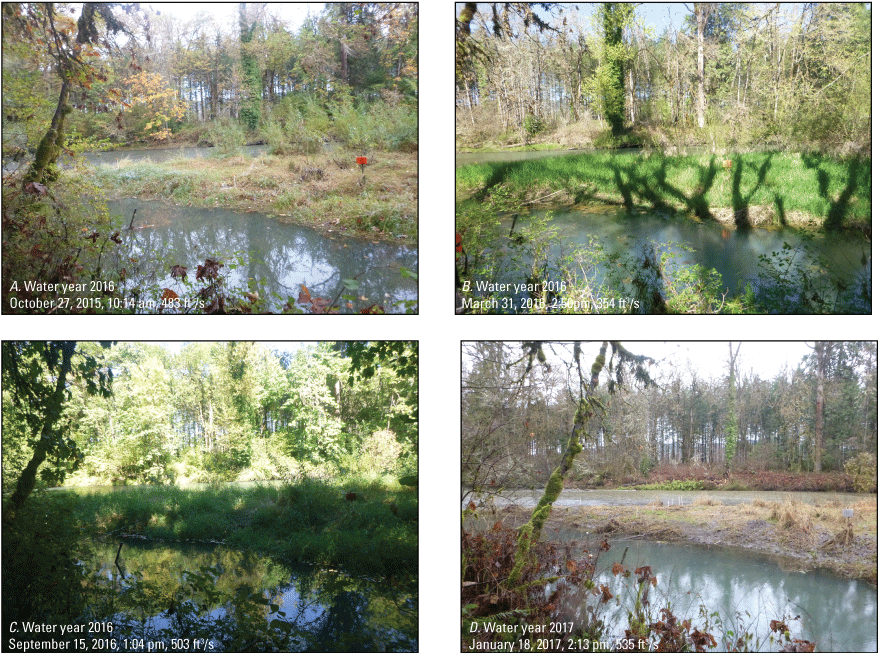
Row Tree site along Fall Creek (background), Oregon, showing an alcove (foreground), and low vegetated bar (photograph center) during water year (WY) 2016 pre-drawdown herbaceous and young woody vegetation (A), WY 2016 post-drawdown springtime colonization by reed canary grass over reservoir sediments (B), post-WY 2016 and pre-WY 2017 drawdown conditions with vegetation expansion in the autumn (C) and post-WY 2017 drawdown conditions in the winter with new reservoir sediment accumulation over the bar features (D). Photographs by Mackenzie Keith, U.S. Geological Survey.
In the spring and summer, newly deposited patches of sand and finer-grained sediment became a focal area for the establishment of riparian vegetation. Canary grass and willows (fig. D6; fig. E3) have been observed to rapidly colonize some monitoring sites during this study; however, the degree to which vegetation preexisted prior to this study in areas of deposition is unknown. Existing grasses and young willow may have been buried by reservoir sediments and grown vertically through deposits or colonized newly created sand bars created from reservoir sediments. Many types of riparian vegetation are adapted to disturbance and can rapidly adjust to burial by or colonization of fluvial sediments (for example, Shafroth and others, 2002; Politti and others, 2017), so the vegetative responses to the Fall Creek deposition are not unexpected, especially considering the temperate Mediterranean climate (Köppen-Geiger climate classification) of the study area and long growing season conducive to vegetation establishment. Once established on unconsolidated, sandy deposits from the Fall Creek streambed drawdowns, grasses and woody shrubs reinforce the stability of the deposit and increase local roughness, and absent large-scale flooding or other disturbance, reduces the likelihood of subsequent scour of those deposits by typical regulated streamflows.
Low-velocity, off-channel areas are prime locations for sand and finer-grained reservoir sediment to accumulate. These features are relatively small and intermittently distributed along Fall Creek both historically (prior to dam construction) and presently (during the period of this study), owing largely to geologic and physiographic controls on channel morphology (Chapter D. Geomorphic Responses to Fall Creek Lake Streambed Drawdowns Downstream from Fall Creek Dam; Keith and others, 2023a; figs. D14–D16; app. 3). Partly due to their relatively small size and shallow depths, off-channel areas on Fall Creek that underwent sand and finer-grained sediment deposition in WY 2012–18 likely only have a limited amount of space to store new sediment from future drawdowns. Because the total area of off-channel features along the Fall Creek reaches is small due to lateral channel stability and lack of coarse sediment supply from upstream, further losses in secondary water features would account for large portions of the total reach area of off-channel features in these reaches. Ultimately, a reduction in off-channel features could signify a loss of low-velocity habitats used by native fish (such as Oregon chub [Oregonichthys crameri]; for example, Bangs and Meeuwig, 2017) and other aquatic life year-round or as slow-water refuges during high streamflows. The relative size of secondary water features and unvegetated bars on the Middle Fork Willamette River is much greater than those along Fall Creek (fig. D14; app. 3), and changes in area of these habitat-related features might comprise a smaller portion of channel than do changes to these features on Fall Creek. However, within all study area reaches, the reach-scale responses of bars, secondary water features, and other landforms to streambed drawdowns was challenging to detect given the mapping approaches, variability in discharge, and relatively small number (five) of streambed drawdowns assessed within the geomorphic mapping periods (figs. D13, D14).
Context for Magnitude of Change from Fall Creek Lake Streambed Drawdowns—Comparison to Other Drawdowns or Sediment Releases
Strategic drawdowns of reservoirs to manage sediment has occurred for decades (for example, see background in chapter 3 of Morris and Fan [1998], and chapter 2 in Brandt [1999]), and studies monitoring or modeling changes in reservoir deposits resulting from these types of operations are increasing (for example, Kantoush and Schleiss, 2009; Kantoush and Sumi, 2010; Guertault and others, 2014; 2017). However, there are few studies documenting the influence of mobilized reservoir sediment on downstream geomorphology and habitat, and there are even fewer studies that directly relate patterns of reservoir erosion with downstream geomorphic responses. Several recent studies provide useful comparisons with Fall Creek streambed drawdowns, including research on the downstream sediment impacts to water quality and aquatic species (for example, Crosa and others, 2009; Baoligao and others, 2016; Espa and others, 2016; Quadroni and others, 2016) and on the impacts of changing sediment and streamflows to channel morphology (Brandt, 1999, 2005; Wohl and Cenderelli, 2000; Anderson, 2007; Grant and others; 2015). However, it is difficult to draw strict comparisons between Fall Creek and other drawdown studies because of the many differences in these rivers, reservoirs, and drawdown operations. For example, drawdown operations vary substantially among sites with differences in drawdown duration, rates of pool change, residual pool presence, as do dam infrastructure and streamflow and sediment inputs to the reservoir. Additionally, geomorphic and sediment transport investigations of reservoir drawdowns and downstream responses vary among sites, according to the sampling program downstream from the sediment release (study purposes, types of measurements, measurement locations, sampling techniques, frequency in relation to streamflows). More particularly, the paucity of previous studies focusing on downstream changes may be limited because many drawdown operations are designed to maximize reservoir erosion and sediment evacuation to promote long-term sustainability of reservoirs that are losing water-storage capacity. In contrast, Fall Creek Lake drawdowns are strategically timed for fish passage and secondarily, aim to minimize reservoir sediment evacuation and downstream geomorphic impacts. Additionally, infrastructure at other sites may not have the capability to lower pool levels to “streambed” (or free-flowing conditions), thereby only transporting a limited amount of finer sediment to downstream reaches where it travels in suspension and may have minimal impacts on channel morphology.
Reservoir Evolution
Similar to Fall Creek, a study of drawdown operations in France found that reservoir evolution is a function of management and sediment supply. Guertault and others (2014) evaluated changes in reservoir volume sediment budgets over nearly 3 decades during flush and inter-flush periods (1984–2012) at the Génissat Dam on the Rhone River in France (though other dams on the Swiss–French Rhone and tributaries contributed to sediment and hydrologic conditions at the site). They identified different areas of erosional and depositional processes within the reservoir related to the flush (drawdown) and inter-flush (not drawdown) periods and found that sediment transport within the reservoir is highly dependent on pool level, so that overall reservoir evolution was mainly a function of reservoir management and sediment supply. Over about a 15-year period of annual sediment flushing events, they also found no significant change in the longitudinal distribution of grain sizes along the reservoir channel bed though coarser sediments could have been buried underneath finer sediments.
Geomorphic assessment of reservoir processes related to moderate fluctuations in lake levels (1.1–6.6 m annually)—though not specifically drawdown operations—of the Bratsk Reservoir in Eastern Siberia by Kaczmarek and others (2016) revealed that existing geomorphic processes were intensified by the construction and operation of the reservoir, that those processes interact with one another, and that geomorphic evolution of the shore area is closely linked to water-level changes. Though the Bratsk Reservoir is larger and local geology and site-specific processes are much different than those at Fall Creek Lake, the reservoir hillslopes and shorelines of Fall Creek Lake display erosional and depositional processes within overprinting of landforms and those processes arealso linked to fluctuation in pool levels (fig. B11).
Downstream Sediment Transport
Suspended-sediment transport resulting from reservoir sediment releases including drawdowns, reservoir flushing, and dam removals are typically characterized in terms of suspended-sediment concentrations (SSC) and suspended-sediment loads (SSL) as measured at sites downstream from the dams because fine-grained sediment dominated by silts and clays though sometimes also sands evacuated during these operations are primarily carried as suspended sediment rather than bedload sediment. Though becoming more common, as of 2021, there are few studies documenting reservoir sediment flushing or drawdown operations that were implemented in conjunction with sediment transport gaging programs. Available studies indicate substantially lower peak values of SSC at Fall Creek compared with other reservoirs during controlled sediment flushing events, but comparable values of SSC and SSL at other reservoirs with partial drawdowns where sediment flushing is not the primary goal. In their synthesis of reservoir sedimentation, Morris and Fan (1998) stated, “The initial period of flushing, with a duration ranging from a few hours to several days, depending on the size of the reservoir, is characterized by extremely high sediment concentrations, typically exceeding 100 grams per liter (g/L) at the dam site and in some cases even exceeding 1,000 g/L.” Likewise, SSC measured 6.7 km downstream from the Cancano Reservoir (Adda River, Italy) from 2010 to 2012, where controlled sediment flushing operations spanned 40–50 days per year had maximum values of SSC exceeding 99 g/L, although average concentrations were much lower (less than 8 g/L) and the implementation of multiple measures to minimize sediment concentration, such as increasing regulated tributary streamflows to reaches downstream from the dam and utilizing an instream settling basin, appeared to reduce SSC at a site 22.9 km downstream from the dam (Espa and others, 2016). At the Valgrosina Reservoir, Valtellina, northern Italy, Crosa and others (2009) compared SSC levels to the impacts to fish and macroinvertebrates during two streambed drawdowns in 2006–07 to inform a regulatory framework for sediment releases resulting from controlled reservoir flushing operations. Maximum SSC from these events ranged up to 70–80 g/L during the initial drawdown phases but average concentrations of 4–5 g/L were more typical during the operations. After flushing operations ceased, geomorphic observations of reaches downstream from the dam revealed few areas with substantial sediment deposits, suggesting much of the reservoir sediments had been transported to downstream reaches. In contrast, at Fall Creek Lake, the peak sampled SSC 1.4 km downstream from Fall Creek Dam during the USGS sampling program from WY 2012–18 was 15.3 g/L, during WY 2015 (November 21, 2014). Although measured SSC from the Fall Creek drawdowns were nearly an order of magnitude lower than the “typical” conditions of 100 g/L (Morris and Fan, 1998), suspended-sediment loads from Fall Creek are comparable with other sites. For example, at the Cancano Reservoir, total annual sediment loads ranged from 14,620 to 70,920, t over the 3 years of controlled flushes (2010–12; Espa and others, 2016), which are within an order of magnitude of SSL computed for the full monitoring periods at the Fall Creek streamgage (ranging from 13,900 to 54,700 t; table C1). At the USACE’s Cougar Dam on the South Fork McKenzie River (also located in the Willamette River Basin in Oregon; fig. A2), Anderson (2007) measured sediment transport during a partial drawdown spanning WY 2002–04 during which lake levels were maintained at 60–90 m below normal low pool to facilitate construction of a temperature control tower. Downstream from Cougar Dam, the peak SSC of the 3-year (WY 2002–04) monitoring period was 0.266 g/L (1/30/2003, 14159500 streamgage) and partial-year SSL ranged from 4,100 to 17,000 t, which is substantially less than the partial-year SSL calculated at Fall Creek WY 2013–18 (fig. C3; table C1). Despite impounding a substantially larger basin, the much smaller SSC and SSL measured in the South Fork McKenzie River during the Cougar Dam partial drawdown compared with the Fall Creek annual streambed drawdowns likely reflect the substantial residual pool at Cougar Dam (typically more than 40 m deep at the dam) that diminished transport capacity of sediment passing through the reservoir and trapped sediments eroded from upper areas of the reservoir. Likewise, a partial drawdown of Lake Mills on the Elwha River in 1994 resulted in temporarily lowering the lake by about 5.5 m (leaving a residual pool behind the 64-m-high dam) to evaluate reservoir sediment deposits and inform the 2014 dam removal (Childers and others, 2000). Although the Lake Mills drawdown resulted in substantial erosion and reconfiguration of the reservoir delta, much of the mobilized suspended sediment was trapped in the residual pool, and maximum SSC measured downstream from the dam was 20 mg/L (Childers and others, 2000).
Previous studies of sediment transport resulting from reservoir drawdowns indicate that coarse sediment (greater than 2 mm) transport in downstream reaches can increase as reservoirs rapidly drain during dewatering periods and streamflow increases as water is evacuated from the reservoir. Reservoir dewatering and increased streamflow can mobilize bed-material sediment in reaches downstream from the dam prior to the period of reservoir sediment erosion and downstream export that occurs during full streambed drawdown conditions. This concept of a two-part sediment pulse (mobilization of downstream sediment during reservoir draining, followed by export of reservoir sediment) stems from studies of Cachí Reservoir on the Reventazón River, Costa Rica, together with an extensive review of downstream sediment transport conditions produced by reservoir flushing (Brandt, 1999, 2005). Bed-material transport during the draining of Fall Creek Lake prior to the full streambed drawdown was not measured at Fall Creek between WY 2013 and 2018. However, substantial increases in coarse bed-material mobilization were probably not likely during those periods because extensive in-channel bedrock and a limited amount of exposed, readily erodible sands and finer gravels mantle the channel bed downstream from Fall Creek Dam and create a vertically stable channel with coarse sediment unlikely to mobilize during streamflows that are typically observed in reservoir dewatering period (less than 2,000 ft3/s). Additionally, any finer sediments from the prior year drawdown that could be mobilized at low streamflows have likely already been transported farther downstream during the prior winter (Chapter C. Sediment Delivery from Fall Creek Lake and Transport through Downstream Reaches). During free-flowing streambed conditions, streamflows are typically much lower (39–777 ft3/s in WY 2013–18; Schenk and Bragg, 2021) than during the reservoir draining period, further limiting coarser gravel transport in downstream reaches. If the annual streambed drawdowns at Fall Creek Lake continue to be operationally similar to those that occurred during WY 2013–18, a substantial increase in sediment transport prior to full streambed drawdown (such as that described by Brandt [2005]) is not likely to occur. However, if the operations were to change so that reservoir dewatering produced much greater streamflows capable of mobilizing bed-material sediment in the reaches downstream from the dam, either by inducing a rapid drawdown rate or with prolonged streambed drawdown that would be more susceptible to stormflows passing through the reservoir, increased mobilization and transport of bed material could result, with coarser sediment than has been seen in recent drawdowns.
Downstream Changes in Channel Morphology and Habitats
Deposition of reservoir sediment in the reaches downstream from dams on Fall Creek and Middle Fork Willamette River in WY 2013–18 primarily occurred in low-velocity areas along channel margins, which is similar to sediment releases from drawdowns elsewhere. At Halligan Reservoir on the North Fork Poudre River, Colorado, most deposition occurred in low velocity pools and those deposits were reworked during subsequent streamflows (Wohl and Cenderelli, 2000). Accordingly, bedload depletion from the pools was strongly related to transport rates downstream (Wohl and Cenderelli, 2000). Similarly, Espa and others (2016) found that the downstream deposition of reservoir sediments from the Cancano Reservoir (Italy) drawdowns were largely confined to low velocity areas of the Adda River with minimal deposition in the main channel except in some very low gradient reaches. In another study, monitoring hydrogeomorphic responses to controlled drawdown on the Inn River at the Gepatsch Reservoir (Austria) showed no significant changes in particle-size distributions along gravel bars downstream from the reservoir (Hauer and others, 2020). These findings are comparable with other examples of sediment releases into high-energy streams (from dam removals and landslides) where transport capacity of finer sediments is sufficient to transport those finer sediments to downstream reaches as suspended-sediment load with net deposition primarily occurring locally along pools and channel margin areas (for example, Major and others, 2012; Wilcox and others, 2014; Anderson and others, 2017).
Infiltration of fine-grained sediment into coarser substrate can negatively affect certain aquatic habitats such as spawning redds for native resident and anadromous fish or benthic invertebrates like mussels. Although the impacts of fine sediment to salmon spawning habitats are well-documented elsewhere (for example, Tappel and Bjornn, 1983; Everest and others, 1987; Roy and others, 2003), impacts to spawning habitat for spring Chinook salmon on Fall Creek were not evaluated in this study, but could be a focus of future monitoring. Although fine-sediment burial and intrusion into spawning beds was not evaluated, the bed-material grain-size measurements at gravel bars downstream from Fall Creek Lake for this study, together with anecdotal observations do not indicate wide-spread deposition and persistence of fine-grained reservoir sediments on coarse bed substrates for the main channel reaches downstream from the Fall Creek streamgage. Although the majority of historical and present-day spawning of spring Chinook salmon occurs upstream from Fall Creek Dam (McIntosh and others, 2009), redd burial could be more problematic in the upstream segment between the Fall Creek streamgage and Fall Creek Dam, where sediment delivery during the streambed drawdown can result in short-term deposition until subsequent streamflows in following months transports this sediment downstream (Chapter C. Sediment Delivery from Fall Creek Lake and Transport through Downstream Reaches), the timing of which overlaps with incubation period for spring Chinook salmon (NMFS, 2008). Elsewhere in the Willamette River Basin, fine-grained sediment intrusion into gravel-bed substrate was monitored downstream from Cougar Dam on the South Fork McKenzie River, where spring Chinook salmon spawning is concentrated and where concerns about impacts to spawning habitats were prompted by drawdowns for construction of a reservoir temperature control tower. Monitoring of the WY 2002–04 Cougar Dam drawdowns showed an abundance of fine-grained sediment in transport downstream from the dam (Anderson, 2007) and infiltration to gravels (Anderson, 2007; Grant and others, 2015) that almost certainly resulted at least in part to the drawdown operations.
Implications of Findings for Future Geomorphic Responses to Annual Fall Creek Lake Streambed Drawdowns
A suite of factors controls the magnitude and timing of reservoir erosion, sediment transport, and downstream patterns of sediment deposition at Fall Creek Lake, which are founded on observations of the geomorphic responses observed during the WY 2012–18 streambed drawdowns. These factors are (1) not necessarily independent of one another (for example, dam operators may time the drawdown to coincide with low inflows to the reservoir), (2) vary temporally (for example, as Fall Creek Lake inflows and pool levels fluctuate seasonally for flood control as well as during streambed drawdown operations), and (3) vary spatially (for example, sediment transport capacity downstream from the dam varies with channel slope and streamflow). In recognition of this complexity, predicting the exact magnitude and timing of future geomorphic responses is challenging, especially because the timing, duration, and frequency of streambed drawdowns may change in the future. The streambed drawdowns evaluated in this study (WY 2012–18) occurred in late autumn or early winter and typically lasted 1–2 weeks. However, in 2021 (after this study was completed), streambed drawdown operations were modified in response to a court injunction that directed USACE to improve conditions for fish passage and water quality to better support spring Chinook salmon and winter steelhead trout (U.S. District Court for the District of Oregon, 2021). As a result, the streambed drawdown operations for WY 2022–24 extended nearly six weeks from December 1 to January 15 and were followed by period of delayed refill with exceptions for flood risk management actions. Recognizing that streambed drawdown operations at Fall Creek Dam are likely to persist in some form into the future to aid downstream fish passage, the results of this study provide a framework for considering 1) hypothesized responses to future streambed drawdowns and b) potential implications of long-term, annual drawdown program.
Implications for Reservoir Morphology and Future Erosion
Reservoir evolution observed over the streambed drawdowns of WY 2012–18 informed delineation of Fall Creek Lake whereby reservoir zones and landforms are classified according to geomorphic processes including the varying depositional and erosional processes active at different dam management and streamflow scenarios as well as proximity to the main reservoir channel (which partly implies susceptibility to erosion; see “Fall Creek Dam Terminology Used in this Study,” “Hydrology, and Streamflow Regulation by Dams,” and “Dam Infrastructure and Streambed Drawdown Operations at Fall Creek Dam” sections of Chapter A. Introduction). For example, in areas immediately upstream from the dam where fine-grained sediment accumulation is thick and readily accessible to fluvial erosion and transport, the direct controls on reservoir sediment erosion are dam operations (predominantly lake level) and streamflow (a function of unregulated streamflow entering the reservoir). In comparison, sediment stored along reservoir margins at higher elevations of the reservoir floor (including the pre-dam floodplain and terraces) is less susceptible to erosion and downstream export because it is generally inaccessible to erosive streamflows during the streambed drawdowns, and any eroded sediment must be routed through the reservoir prior to export.
Multiple aspects of Fall Creek Dam infrastructure and operations exert first-order controls on the magnitudes of reservoir erosion that occur during the streambed drawdowns and ultimately dictate the sediment delivery to downstream reaches. Key aspects of the dam and its operations that are most relevant to assessing geomorphic responses to streambed drawdowns include the (1) dam infrastructure, including configuration and size of regulating outlets and their proximity to the streambed, which dictates the amount and type of sediment that can be transported to downstream reaches and mode of sediment transport; (2) frequency of historical streambed drawdowns and the overall pattern of long-term, year-round dam operations and lake level management, which partly dictate reservoir morphology and locations and magnitudes of readily erodible materials; (3) dam operations during the streambed drawdown, which directly control the timing and duration of reservoir erosion and sediment evacuation; and (4) dam operations following the streambed drawdown operation that regulate streamflows (and thereby sediment transport conditions) downstream of Fall Creek Dam which primarily reflect interactions between hydroclimatic conditions and flood control.
Variability in sediment yield to lower the reservoir area, streamflows entering the reservoir during streambed drawdowns, and other hydroclimatic conditions likely also exert controls on the magnitude and character of sediment mobilized to reaches downstream from Fall Creek Dam. The historical and annual volumes and types of sediment delivered to the lower parts of Fall Creek Lake directly determines the amount of readily erodible sediment that can be eroded and delivered to downstream reaches during streambed drawdowns. Varying sediment yield due to changes in land use, climate, or occurrences like forest fire and landslides could change the magnitude of sediment or suite of grain sizes that are delivered to the lower reservoir and later eroded and passed downstream. For example, the recent Jones Fire (summer 2017) burned about 42 km2 (9 percent) of the watershed upstream from Fall Creek Dam, and the Bedrock Fire (summer 2023) burned about 120 km2 (24 percent) of the watershed upstream from Fall Creek Dam, including areas adjacent to the Fall Creek channel. Similarly, streamflows entering Fall Creek Lake during the streambed drawdown operation directly control magnitudes and styles of reservoir erosion, sediment entrainment, and export from the reservoir. The role of streamflow as a first-order control on reservoir erosion and sediment mobilization has been previously documented in dam removal and reservoir flushing studies (for example, Major and others, 2012) and corroborate the WY 2012–18 findings from Fall Creek. Generally, greater discharge magnitudes through the reservoir during free-flowing conditions at streambed drawdown will increase transport capacity of sediment through the reservoir, hence increasing erosivity along reservoir channel banks and bed and leading to greater amounts of erosion and downstream transport. Storm events that increased streamflow during low reservoir pool elevations at Cougar Dam in WY 2004 were responsible for lateral erosion and channel migration of the channel through reservoir deposits (Anderson, 2007). In addition to reservoir discharge, the findings from Fall Creek drawdowns WY 2012–18 indicate that overall hydroclimatic conditions during the streambed drawdown, particularly precipitation and freezing air temperatures, can also influence the magnitudes of reservoir erosion and sediment export.
Patterns of sediment erosion and evacuation observed in this study at Fall Creek Lake from WY 2012–18 suggest that reservoir erosion during annual streambed drawdowns may remain similar or decrease in future years assuming (1) annual streambed drawdown operations are implemented in similar manner as the WY 2012–18 drawdowns (in terms of duration, late autumn or early winter implementation, rate of pool-level lowering to reach streambed, and other factors), (2) streambed drawdowns coincide with similar conditions as were observed WY 2012–18 (similar sediment yield into reservoir, low reservoir inflows, limited precipitation, moderate air temperature), and (3) no major geomorphic changes in the main reservoir channels of Fall and Winberry Creeks occur (for example, channel avulsion). Under such conditions, it is hypothesized that the stream channel within the reservoir would achieve a quasi-equilibrium state with respect to annual influx and export of sediment and aided by the substantial amount of in-channel bedrock, will remain laterally stable without erosion across reservoir deposits. This scenario is supported by the conceptual model proposed by Morris and Fan (1998, p. 15.6), which described the evolution of repeat reservoir flushing.
If the annual streambed drawdowns were to continue for many years or decades into the future, some of the sediment stored in the upstream portion of the reservoir could shift downstream, triggering morphological adjustments in the Fall Creek stream channel within the reservoir and possibly altering the trajectory of annual reservoir erosion and sediment export. Though Guertault and others (2014) found no significant changes in the reservoir channel of the Verbois Reservoir over multiple years of flushing, observations at other sites (Morris and Fan, 1998; Kondolf and others, 2014) suggested persisting progradation of coarse sediment through the reservoir. Morris and Fan (1998, p. 15.6) also suggested the possible occurrence of later or additional channel migration through floodplain deposits related to bed aggradation from coarse delta deposits.
Although Fall Creek Lake lacks a well-defined coarse sediment delta at the head of reservoir, the main reservoir channel above minimum conservation pool (728 ft) includes exposed gravel bars (fig. B9; table 3.1). It is possible that coarse sediments could be mobilized downstream, resulting in aggradation of the main reservoir channel. Aggradation of the main reservoir channel could, in turn, increase channel and streamflow connectivity to adjacent to reservoir floor deposits that are currently inaccessible to fluvial erosion during typical low streamflows that occur during streambed drawdowns. However, there is considerable uncertainty regarding the amount and character of coarse sediment stored in the upper reservoir, the mobility of this sediment under different streamflow scenarios, and potential implications for reservoir erosion.
Implications for Future Sediment Transport Downstream from Fall Creek Dam
Analyses of suspended sediment measured in WY 2013–18 shows a stark reduction in suspended-sediment loads between WY 2013 and later years and suggests future suspended-sediment loads may remain variable but similar to those observed WY 2015–18 if factors such as operations, sediment yield, and reservoir inflows remain similar. Suspended-sediment loads downstream from Fall Creek Dam will likely remain highest during the official drawdown period when regulating outlets are fully open and Fall Creek is free flowing or near streambed with little to no residual pool. Over time, the suspended-sediment load sourced from the reservoir would increasingly comprise a larger portion of sediment deposited the previous year rather than sediments that have been deposited historically and remained for several years on the reservoir floor near the dam. Bedload is likely to remain a small fraction of the total sediment load evacuated from the reservoir and is also likely relatively modest compared with historical (pre-dam) bedload transport rates because nearly all coarse sediment is trapped by the dam (Schenk and Bragg, 2014; O’Connor and others, 2014). An alternative, though highly uncertain longer-term response, is that the coarse gravel deposited within the reservoir channel may migrate farther through the reservoir (see the “Implications for Reservoir Morphology and Future Erosion” subsection of this chapter), and downstream from Fall Creek Dam resulting in greater bedload transport than has been observed for this study.
Implications for Future Geomorphic Changes Downstream from Fall Creek Dam
Despite substantial reductions in peak streamflow magnitude due to regulation from Fall Creek Dam, streamflows released from the dam in the months following each drawdown of WY 2012–18 had ample transport capacity to entrain and transport reservoir sediment delivered to downstream reaches during the streambed drawdowns, resulting in modest net geomorphic changes to the downstream reaches. Multiple controlling factors influence processes, patterns, and magnitudes of geomorphic responses to streambed drawdowns and fate of sediment in the reaches downstream from Fall Creek Dam. Interactions among channel morphology, streamflows, hydraulics, and vegetation were observed to partially control patterns of sediment deposition and overall changes in channel morphology that resulted from streambed drawdowns of WY 2012–18. If sediment releases and ensuing streamflow conditions follow a similar pattern in the future (after WY 2018), then the near-term reach-scale geomorphic adjustments from future drawdowns (perhaps next 2–10 years) are expected to be modest, based on the lack of substantial, reach-scale changes in channel planform or landforms detected from aerial photographs (figs. D13, D14; app. 3). However, reach-scale geomorphic changes may become more apparent if (1) streambed drawdowns continued for several decades and geomorphic changes were evaluated at sub-decadal timesteps to provide a longer record from which to assess net change or (2) the magnitude of sediment supply introduced to downstream reaches substantially increases and (or) sediment transport capacity decreases in the months immediately following streambed drawdown operations. For example, a streambed drawdown and major sediment release in late spring, followed by several months of low streamflows would likely result in different sediment transport and deposition patterns compared with the late autumn or early winter drawdowns of WY 2012–18 evaluated in this study, which were each followed by several months of relatively high streamflows. At the landform-scale (for example, the scale of an individual alcove), low velocity areas nearest to Fall Creek Dam will likely continue to undergo rapid deposition immediately after a streambed drawdown event, similar to patterns observed for WY 2012–18 (figs. D6, D10). Similar to observations from WY 2012–18, some of the sediment entering these off-channel features and margin areas may be temporarily stored, then later remobilized and dispersed farther downstream from post-depositional streamflows are large enough, but if deposits persist through the following spring, there is a greater likelihood that local vegetation establishment (as observed, primarily reed canary grass and willows) will reinforce deposited material and serve as a sediment trap following later drawdowns. Additionally, as the limited area of alcoves and side channels along Fall Creek continue to accumulate sediment, increased amounts of released reservoir sediment may be bypassed directly to the Middle Fork Willamette River. Regardless of how much or what types of sediment enter reaches downstream from Fall Creek Dam, the presence of the dam provides an opportunity to strategically manage streamflows during and after the streambed drawdowns to minimize downstream sediment impacts while also ensuring other operational thresholds are satisfied (Loire and others, 2021; fig. A11).
Implications for Monitoring Geomorphic and Sediment Transport Responses to Future Drawdowns
Although annual streambed drawdowns such as those implemented at Fall Creek Lake are uncommon, even more infrequent is the comprehensive and coupled investigation of reservoir evolution, downstream sediment transport, and geomorphic responses to channel and overbank areas documented in this study. Nonetheless, the datasets from this study provide a baseline for future monitoring, and lessons learned from the multi-faceted monitoring approach employed at Fall Creek provides a foundation for identifying useful monitoring activities at various temporal and spatial scales at Fall Creek or other reservoirs where major lake level fluctuations or deep drawdowns occur. Future monitoring could be tailored to address specific management questions or concerns (such as impacts to habitats, flood hazards, or cultural resources) and could include status and trends monitoring to track changes in reservoir conditions, downstream sediment transport, or downstream channel morphology (app. 4). Drawing upon the methods used in this study, as well as those from dam removal studies, future monitoring could focus on the three geomorphic process categories affected by the streambed drawdown operation: (1) reservoir erosion and net sediment evacuation; (2) sediment delivery to downstream reaches, including magnitude and temporal pattern of sediment transport; and (3) geomorphic responses of downstream reaches to sediment delivery. Outstanding questions and priority monitoring to evaluate streambed drawdown responses at Fall Creek Lake, Fall Creek, and the Middle Fork Willamette River are described in appendix 4, and priority monitoring activities are summarized here:
-
o Repeat topographic or photographic surveys in the reservoir including repeat, time-lapse photographs from fixed points around the reservoir to characterize changes occurring within individual drawdowns and reservoir-wide aerial surveys at decadal (or more frequent) intervals to quantify sediment export and change in reservoir storage over time and identify locations of erosion and deposition that may be important for cultural sites or physical habitat for species of concern.
-
o Continuous, year-round turbidity monitoring supplemented with suspended-sediment measurements at a streamflow-gaging station immediately downstream from the dam to quantify sediment export during a particular drawdown and document turbidity conditions, which may be important to aquatic species, landowners who withdraw water for irrigation, or downstream water supply.
-
o Repeat geomorphic monitoring, mapping, or modeling in downstream reaches to track changes in channel and over bank features using a combination of site- and reach-scale monitoring approaches, including repeat photographic monitoring, reach-scale geomorphic mapping, topographic surveys, and site-scale monitoring of grain sizes and overbank deposition. These approaches would support assessments of the effects of sediment deposition and ensuing vegetation encroachment on flood hazards, infrastructure or fluvial habitats. Monitoring and evaluation is useful for determining how sediment transport and depositional processes may be affected by different sediment supply, streamflow, or dam management scenarios that might occur in future and implications for important aspects of affected river corridors.
Conclusions
Annual streambed drawdown operations at Fall Creek Lake in western Oregon implemented since 2011 (water year [WY] 2012) temporarily lowered lake levels to facilitate the downstream passage of ESA-listed spring Chinook salmon through the 55 m-high dam. These lowered lake levels exposed reservoir sediments to fluvial erosion and allowed transport to reaches of Fall Creek and the Middle Fork Willamette River downstream of Fall Creek Dam. Until 2020, the streambed drawdown operation typically spanned 1–2 weeks in late autumn or early winter, but in 2021, the operation was extended to about 6 weeks spanning December and January, and the operation may be changed again in the future. To support ongoing management of Fall Creek Dam, this report documents geomorphic responses to annual streambed drawdowns between WY 2012 and 2018. The multiple spatial and temporal scales used to evaluate these responses highlight coupled interactions between the geomorphic evolution of a flood control reservoir and reaches downstream from the dam. Altogether, these findings also highlight the various and often overlapping controls on reservoir sedimentation and erosion, and the downstream transport and fate of reservoir sediments.
Multiple aspects of Fall Creek Dam infrastructure and operations exert first-order controls on the magnitudes of reservoir erosion that occur during the streambed drawdowns and ultimately dictate the sediment delivery to downstream reaches: (1) dam infrastructure limits the amount and type of sediment that can be transported to downstream reaches and mode of sediment transport; (2) historical frequency of streambed drawdowns and long-term, year-round dam operations partly dictate reservoir morphology and distribution of readily erodible sediments; and (3) streambed drawdown operations directly control the timing and duration of reservoir erosion and sediment evacuation. At Fall Creek Lake, pre-dam morphology acts as an indirect control on the distribution and magnitude of sedimentation and streambed drawdown related erosion, while historical and current dam operations act as a direct control with lake levels controlling the overall depositional or erosional regime. Geomorphic features and the distribution of sediment in the Fall Creek Lake reflect a complex history of alternating depositional, transport, and erosional processes influenced both by reservoir operations and the morphology of the pre-dam valley and hillslopes. Reservoir erosion during streambed drawdowns is focused within the lower reservoir in thickest unconsolidated deposits along the main reservoir channel, but other drawdown-related landforms indicate erosion and transport of sand and finer-grained sediment from buried paleo-floodplain and terrace deposits, culminating in about 129,500 m3 of net erosion between WY 2012 and 2017.
Sediment monitoring 1.4 km downstream from the dam showed that most of the sediment released from Fall Creek Lake was sand sized or finer (less than 2 mm) and most of that sediment traveled in suspension. Suspended-sediment loads have generally decreased between WY 2013 (and likely WY 2012) and 2018, consistent with interpretation of reservoir process and anecdotal observations of downstream responses. Seasonal patterns of suspended-sediment transport followed a similar overall pattern each year whereby sediment loads are low prior to the drawdown, then increase rapidly as lake levels approach the streambed drawdown elevation of 680 ft. Following the drawdown period during increasing pool levels, SSL remained slightly elevated above pre-drawdown levels but decline through the following months.
Downstream from Fall Creek Dam, the upper segments of the main channel of Fall Creek became initially inundated with the large supply of sediment during streambed drawdown operations of WY 2012–18 evaluated in this study, but over the weeks and months following streambed drawdown operations, the main channels of Fall Creek and the Middle Fork Willamette River were largely cleared of that sediment. Locally, low velocity areas like alcoves, side channels, and channel margins, especially in locations nearest to Fall Creek Dam evolve by sands and finer-grained sediment accumulation. Late season vegetation establishment and longer-term growth likely reinforce the stability of the streambed drawdown deposits. Most of these local changes are not detectable at the reach scale or at sub-annual timeframes.
This study informs management operations at Fall Creek Lake for downstream fish passage and downstream sediment management. Overall, fish passage and the ecological benefits of streambed drawdowns have been deemed successful, and this study reveals that many of the hypothesized geomorphic impacts on reaches downstream from the dam were short-term or transient during WY 2012–18. However, in reaches downstream from Fall Creek Dam, vegetation colonization on recently deposited patches of reservoir sediment or sediment deposition in off-channel features, and potential long-term reductions in those features may have longer-term impacts. Multiple factors influence magnitude and type of geomorphic responses to streambed drawdowns, both upstream and downstream from Fall Creek Dam, and while the patterns observed here are specific to Fall Creek Lake, the approaches and findings from this study can support a broader understanding of reservoir drawdowns for other purposes, such as sediment management or construction elsewhere. Furthermore, these findings support understanding of the present-day conditions within the study area and potential longer-term geomorphic responses downstream from Fall Creek Dam. While the purpose for drawdown operations and the drivers of reservoir erosion at Fall Creek Lake may differ from other reservoirs, the approaches described here linking process-based mapping and interpretation of erosional landforms to volumetric analyses could be modified to inform drawdown operations at other reservoirs to support sediment management for reservoir sustainability. Considering the geomorphic changes related to the streambed drawdowns between WY 2012 and 2018 documented for this study, future monitoring could be used to address outstanding questions about the impacts of continued annual streambed drawdowns on key habitats or management issues (such as flood conveyance and loss of flood storage in the downstream channel) and might encompass repeat reach-scale mapping, topographic surveys, ground-based observations at select sites, or hydraulic modeling.
References Cited
Anderson, C.W., 2007, Influence of Cougar Reservoir drawdown on sediment and DDT transport and deposition in the McKenzie River Basin, Oregon, water years 2002–04: U.S. Geological Survey Scientific Investigations Report 2007–5164, 42 p., accessed August 24, 2023, at https://pubs.er.usgs.gov/publication/sir20075164.
Anderson, S.W., Keith, M.K., Magirl, C.S., Wallick, J.R., Mastin, M.C., and Foreman, J.R., 2017, Geomorphic response of the North Fork Stillaguamish River to the State Route 530 landslide near Oso, Washington: U.S. Geological Survey Scientific Investigations Report 2017–5055, 85 p., accessed August 24, 2023, at https://pubs.usgs.gov/sir/2017/5055/sir20175055.pdf.
Bangs, B., Collver, M., and Harrison, A., 2020, Investigating the relationship between instream flow, hydrologic, connectivity, and habitat quality in off-channel habitats: Presentation by Oregon Department of Fish and Wildlife Native Fish Investigations Program at Willamette Basin Fisheries Science Review, Corvallis, Oregon, accessed July 7, 2021, at https://pweb.crohms.org/tmt/documents/FPOM/2010/Willamette_Coordination/WFSR/.
Brandt, S.A., 2005, Conceptualization of hydraulic and sedimentary processes in downstream reaches during flushing of reservoirs, in Byong-Ho Jun, Sang-Il Lee, Il Won Seo and Gye-Woon Choi, eds., 2005, Proceedings of the XXXI International Association of Hydraulic Engineering and Research Congress—Water engineering for the future—Choices and challenges: Seoul, Korea, September 11–16, p. 2577–2588.
Brasington, J., Rumsby, B.T., and McVey, R.A., 2000, Monitoring and modelling morphological change in a braided gravel-bed river using high resolution GPS-based survey: Earth Surface Processes and Landforms, v. 25, no. 9, p. 973–990, accessed August 19, 2021, at https://doi.org/10.1002/1096-9837(200008)25:9<973::AID-ESP111>3.0.CO;2-Y.
Bunte, K., and Abt, S.R., 2001, Sampling surface and subsurface particle-size distributions in wadable gravel and cobble-bed streams for analyses in sediment transport, hydraulics, and stream-bed monitoring: U.S. Department of Agriculture, Forest Service, Rocky Mountain Research Station, General Technical Report RMRS-GTR-74, 428 p.
Cashman, M.J., Gellis, A.C., Boyd, E., Collins, M.J., Anderson, S.W., McFarland, B.D., and Ryan, A.M., 2021, Channel response to a dam-removal sediment pulse captured at high-temporal resolution using routine streamgage data: Earth Surface Processes and Landforms, v. 46, no. 6, p. 1145–1159, accessed August 11, 2021, at https://doi.org/10.1002/esp.5083.
Collins, M.J., Snyder, N.P., Boardman, G., Banks, W.S., Andrews, M., Baker, M.E., Conlon, M., Gellis, A., McClain, S., Miller, A., and Wilcock, P., 2017, Channel response to sediment release—Insights from a paired analysis of dam removal: Earth Surface Processes and Landforms, v. 42, no. 11, p. 1636–1651.
Curtis, J.A., Flint, L.E., and Hupp, C.R., 2013, Estimating floodplain sedimentation in the Laguna de Santa Rosa, Sonoma County, CA: Wetlands, v. 33, no. 1, p. 29–45, accessed August 26, 2022, at https://doi.org/10.1007/s13157-012-0350-4.
Curtis, J.A., and Guerrero, T.M., 2015, Geomorphic mapping to support river restoration on the Trinity River downstream from Lewiston Dam, California, 1980–2011: U.S. Geological Survey Open-File Report 2015–1047, 15 p., accessed August 23, 2023, at https://doi.org/10.3133/ofr20151047.
Curtis, J., Poitras, T., Bond, S., and Byrd, K., 2021, Sediment mobility and river corridor assessment for a 140-kilometer segment of the main-stem Klamath River below Iron Gate Dam, California: U.S. Geological Survey Open-File Report 2020–1141, 38 p., accessed August 23, 2023, at https://doi.org/10.3133/ofr20201141.
Curtis, J.A., Wright, S.A., Minear, J.T., and Flint, L.E., 2015, Assessing geomorphic change along the Trinity River downstream from Lewiston Dam, California, 1980–2011: U.S. Geological Survey Scientific Investigations Report 2015–5046, 69 p., accessed August 23, 2023, at https://doi.org/10.3133/sir20155046.
Dykaar, B.B., 2008, A catalogue of geomorphic change on the Middle and Coast Forks of the Willamette River using recent aerial orthophotography—Santa Cruz, California: Salem, Ecohydrology West, prepared for U.S. Army Corps of Engineers, Portland, Oregon, and Oregon Department of Fish and Wildlife, 37 p.
East, A.E., Pess, G.R., Bountry, J.A., Magirl, C.S., Ritchie, A.C., Logan, J.B., Randle, T.J., Mastin, M.C., Minear, J.T., Duda, J.J., Liermann, M.C., McHenry, M.L., Beechie, T.J., and Shafroth, P.B., 2015, Large-scale dam removal on the Elwha River, Washington, USA—River channel and floodplain geomorphic change: Geomorphology, v. 228, p. 765–786.
Everest, F.H., Beschta, R.L., Scrivener, J.C., Koski, K.V., Sedell, J.R., and Cederholm, C.J., 1987, Fine sediment and salmonid production—A paradox, in Salo, E.O., and Cundy, T.W., eds., Streamside management—Forestry and fishery interactions: Seattle, University of Washington Institute of Forest Resources Contribution 57, p. 98–142.
Foley, M.M., Bellmore, J.R., O’Connor, J.E., Duda, J.J., East, A.E., Grant, G.G., Anderson, C.W., Bountry, J.A., Collins, M.J., Connolly, P.J., Craig, L.S., Evans, J.E., Green, S.L., Magilligan, F.J., Magirl, C.S., Major, J.J., Pess, G.P., Randle, T.J., Shafroth, P.B., Torgensen, C.E., Tullos, D., and Wilcox, A.C., 2017, Dam removal—Listening in: Water Resources Research, v. 53, no. 7, p. 5229–5246.
Gellis, A.C., Hupp, C.R., Pavich, M.J., Landwehr, J.M., Banks, W.S.L., Hubbard, B.E., Langland, M.J., Ritchie, J.C., and Reuter, 2009, Sources, transport, and storage of sediment in the Chesapeake Bay Watershed: U.S. Geological Survey Scientific Investigations Report 2008–5186, 95 p., accessed August 23, 2023, at https://pubs.usgs.gov/sir/2008/5186/pdf/sir2008-5186rev1142011.pdf.
Gibson, S.A., and Crain, J.D., 2019, Modeling sediment concentrations during a drawdown reservoir flush: Simulating the Fall Creek operations with HEC-RAS: U.S. Army Corps of Engineers, Coastal and Hydraulics Laboratory, Engineer Research and Development Center, ERDC/TN RSM-19-7, 10 p, accessed December 23, 2019, at https://erdc-library.erdc.dren.mil/xmlui/handle/11681/33884.
Grant, G.E., 2012, Chapter 15, The geomorphic response of gravel-bed rivers to dams: perspectives and prospects, in Church, M. Biron, P.M., Roy, A.G., eds., Gravel-bed rivers: processes, tools, environments: Chichester, United Kingdom, John Wiley & Sons, p. 165–181, accessed August 24, 2023, at https://doi.org/10.1002/9781119952497.ch15.
Grant, G.E., Lewis, S.L., Stewart, G., and Glasmann, J.R., 2015, Sediment problems and consequences during temporary drawdown of a large flood control reservoir for environmental retrofitting, in Lollino, G., Arattano, M., Rinaldi, M., Giustolisi, O., Marechal, J., and Grant, G.E., eds., 2015, Engineering Geology for Society and Territory—Volume 3, River Basins, Reservoir Sedimentation and Water Resources: Springer, Cham, p. 27–30 p.
Grant, G.E., Schmidt, J.C., and Lewis, S.L., 2003, A geological framework for interpreting downstream effects of dams on rivers, in O’Connor, J.E., and Grant, G.E., eds., 2003, A peculiar river—Geology, geomorphology, and hydrology of the Deschutes River, Oregon: American Geophysical Union, Water Science and Application 7, p. 209–225, accessed August 24, 2023, at https://doi.org/10.1029/007WS13.
Gregory, S., Ashkenas, L., Oetter, D., Minear, P., and Wildman, K., 2002a, Historical Willamette River channel change, in Hulse, D., Gregory, S., and Baker, J., eds., Willamette River Basin atlas: Corvallis, Oregon State University Press, p. 18–24, accessed August 23, 2013, at http://oregonstate.edu/dept/pnwerc/.
Gregory, S., Ashkenas, L., Oetter, D., Wildman, R., Minear, P., Jett, S., and Wildman, K., 2002b, Revetments, in Hulse, D., Gregory, S., and Baker, J., eds., Willamette River Basin atlas: Corvallis, Oregon State University Press, p. 32–33, accessed August 23, 2013, at http://oregonstate.edu/dept/pnw-erc/.
Gregory, S., Wildman, R., Hulse, D., Ashkenas, L., and Boyer, K., 2019, Historical changes in hydrology, geomorphology, and floodplain vegetation of the Willamette River, Oregon: River Research and Applications, v. 35, no. 8, p. 1279–1290, accessed June 2, 2020, at https://doi.org/10.1002/rra.3495.
Hansen, A.C., Kock, T.J., and Hansen, G.S., 2017, Synthesis of downstream fish passage information at projects owned by the U.S. Army Corps of Engineers in the Willamette River Basin, Oregon: U.S. Geological Survey Open File Report 2017–1101, 118 p., accessed August 24, 2023, at https://doi.org/10.3133/ofr20171101.
Hauer, C., Haimann, M., Holzapfel, P., Flodl, P., Wagner, B., Hubmann, M., Hofer, B., Habersack, H., and Schletterer, M., 2020, Controlled reservoir drawdown—Challenges for sediment management and integrative monitoring—An Austrian case study—Part A—Reach scale: Water, v. 12, 22 p., accessed August 24, 2023, at https://doi.org/10.3390/w12041058.
Hupp, C.R., Schenk, E.R., Kroes, D.E., Willard, D.A., Townsend, P.A., and Peet, R.K., 2015, Patterns of floodplain sediment deposition along the regulated lower Roanoke River, North Carolina—Annual, decadal, centennial scales: Geomorphology, v. 228, p. 666–680, accessed August 26, 2022, at https://doi.org/10.1016/j.geomorph.2014.10.023.
Institute for a Sustainable Environment Lab, 2017, Floodplain forest ca. 2010 datasets and technical details: Corvallis, Oregon, Oregon State University website, accessed September 28, 2021, at https://ir.library.oregonstate.edu/collections/5425kh23p.
International Commission on Large Dams, 2011, Constitution: International Commission on Large Dams, accessed March 15, 2022, at https://www.icold-cigb.org/userfiles/files/CIGB/INSTITUTIONAL_FILES/Constitution2011.pdf.
Jones, K.L., Mangano, J.F., Wallick, J.R., Bervid, H.D., Olson, M., Keith, M.K., and Bach, L., 2016, Summary of environmental flow monitoring for the Sustainable Rivers Project on the Middle Fork Willamette and McKenzie Rivers, western Oregon, 2014–15: U.S. Geological Survey Open-File Report 2016–1186, 91 p., accessed August 24, 2023, at https://doi.org/10.3133/ofr20161186.
Jones, K.L., O’Connor, J.E., Keith, M.K., Mangano, J.F., and Wallick, J.R., 2012, Preliminary assessment of channel stability and bed-material transport in the Rogue River basin, southwestern Oregon, 2011–12: U.S. Geological Survey Open-File Report 2011–1280, 96 p., accessed August 24, 2023, at https://doi.org/10.3133/ofr20111280.
Kaczmarek, H., Mazaeva, O.A., Kozyreva, E.A., Babicheva, V.A., Tyszkowski, S., Rybchenko, A.A., Brykała, Z., Bartczak, A., and Słowiński, M., 2016, Impact of large water level fluctuations on geomorphological processes and their interactions in the shore zone of a dam reservoir: Journal of Great Lakes Research, v. 42, no. 5, p. 926–941.
Kantoush, S.A., and Sumi, T., 2010, River morphology and river sediment management strategies for sustainable reservoir in Japan and European Alps: Disaster Prevention Research Institute Annuals, v. 53, no. B, p., 821–839., accessed February 3, 2020, at https://www.dpri.kyoto-u.ac.jp/nenpo/nenpo.html.
Keith, M.K., 2019, Surficial particle count and clay horizon marker data for Fall Creek and the Middle Fork Willamette River, Oregon in 2015–2017: U.S. Geological Survey Data Release, accessed March 8, 2019, at https://doi.org/10.5066/P9MGNDHN.
Keith, M.K., and Gordon, G.W., 2019, Fall Creek and Middle Fork Willamette Geomorphic Mapping Geodatabase: U.S. Geological Survey data release, accessed March 8, 2019, at https://doi.org/10.5066/P9THIZD6.
Keith, M.K., and Stratton, L.E., 2019, Linking sedimentation and erosion patterns with reservoir morphology and dam operations during streambed drawdowns in a flood-control reservoir in the Oregon Cascades: Proceeding of SEDHYD-2021, Sedimentation and Hydrologic Modeling Conference, June 24–28, Reno, Nevada, 12 p.
Keith, M.K., and Mangano, J.F., 2020, Structure-from-motion datasets of Fall Creek Lake, Oregon, acquired during annual drawdown to streambed November 2016: U.S. Geological Survey data release, accessed March 9, 2020, at https://doi.org/10.5066/P9AYWU8Z.
Keith, M.K., and Stratton Garvin, L.E., 2021, Geomorphic mapping of Fall Creek Lake, Oregon, 2016: U.S. Geological Survey data release, accessed January 25, 2021, at https://doi.org/10.5066/P9YZSJJJ.
Keith, M.K., Wallick, J.R., Flitcroft, R.L., Kock, T.J., Brown, L.A., Miller, R., Hagar, J.C., Guillozet, K., and Jones, K.L., 2022, Monitoring framework to evaluate effectiveness of aquatic and floodplain habitat restoration activities for native fish along the Willamette River, northwestern Oregon: U.S. Geological Survey Open-File Report 2022–1037, 116 p., accessed July 14, 2023, at https://doi.org/10.3133/ofr20221037.
Keith, M.K., Wallick, J.R., Gordon, G.W., and Bervid, H.D., 2023a, Historical changes to channel planform and bed elevations downstream from dams along Fall Creek and Middle Fork Willamette River, Oregon, 1926–2016: U.S. Geological Survey Scientific Investigations Report 2023–5048, 34 p., accessed July 14, 2023, at https://doi.org/10.3133/sir20235048.
Kondolf, G.M., Gao, Y., Annandale, G.W., Morris, G.L., Jiang, E., Zhang, J., Cao, Y., Carling, P., Fu, K., Guo, Q., Hotchkiss, R., Peteuil, C., Sumi, T., Wang, H.-W., Wang, Z., Wei, Z., Wu, B., Wu, C., and Yang, C.T., 2014, Sustainable sediment management in reservoirs and regulated rivers—Experiences from five continents: Earth’s Future, v. 2, no. 5, p. 256–280.
Lane, S.T., Westaway, R.M., and Murray Hicks, D., 2003, Estimation of erosion and deposition volumes in a large, gravel-bed, braided river using synoptic remote sensing: Earth Surface Processes and Landforms, v. 28, no. 3, p. 249–271, accessed August 4, 2021, at https://doi.org/10.1002/esp.483.
Major, J.J., O’Connor, J.E., Podolak, C.J., Keith, M.K., Grant, G.E., Spicer, K.R., Pittman, S., Bragg, H.M., Wallick, J.R., Tanner, D.Q., Rhode, A., and Wilcock, P.R., 2012, Geomorphic response of the Sandy River, Oregon, to removal of Marmot Dam: U.S. Geological Survey Professional Paper 1792, 64 p.
McIntosh, B.A., Clarke, S.E., and Sedell, J.R., 2009, Bureau of Fisheries stream habitat surveys, Willamette River Basin, Summary Report 1934–1942: Pacific Northwest Research Station, U.S. Department of Agriculture-Forest Service, Oregon State University, U.S. Department of Energy, Bonneville Power Administration, Division of Fish and Wildlife, Project No. 89-104, Contract No. DE-AI79-89BP02246, BPA Report/DOE/BP-02246-3, 492 p.
Miller, C.R., 1953, Determination of the unit weight of sediment for use in sediment volume compaction, in Strand, R.I. and Penibertori, E.L., eds., 1982, Reservoir sedimentation: technical guideline for Bureau of Reclamation: U.S. Bureau of Reclamation, Sedimentation and River Hydraulics Section, Denver, Colorado, 48 p.
National Agriculture Imagery Program, 2016, National Agriculture Imagery Program 2016 aerial photography: U.S. Department of Agriculture, Natural Resources Conservation Service, digital data, accessed February 5, 2024, at https://datagateway.nrcs.usda.gov/.
National Marine Fisheries Service [NMFS], 1999a, Endangered and threatened species—Threatened status for three Chinook salmon evolutionarily significant units (ESUs) in Washington and Oregon, and endangered status for one Chinook salmon ESU in Washington: Federal Register, v. 64, no. 56, p. 14308–14328.
National Marine Fisheries Service [NMFS], 2008, Endangered Species Act section 7(a)(2) consultation biological opinion and Magnuson-Stevens Fishery Conservation and Management Act essential fish habitat consultation on the Willamette River Basin Flood Control Project: National Marine Fisheries Service, Northwest Region, Seattle, Washington, National Oceanic and Atmospheric Administration Fisheries Log Number: FINWRl2000/02117 [variously paged], accessed March 2018, at https://media.fisheries.noaa.gov/2021-11/willamette-2008-biological-opinion.pdf.
Nesbit, M.G., Axel, G.A., Sanford, B.P., Burke, B.J., Frick, K.E., and Lamb, J.J., 2014, Passage behavior and survival of juvenile spring Chinook salmon at Fall Creek Dam, 2012: Report of Fish Ecology Division, Northwest Fisheries Science Center, National Marine Fisheries Service, prepared for U.S. Army Corps of Engineers, Portland District, Portland, Oregon, 31 p.
Northwest Fisheries Science Center, 2015, Status review update for Pacific salmon and steelhead listed under the Endangered Species Act: Pacific Northwest, National Oceanic and Atmospheric Administration, Northwest Fisheries Science Center report, 356 p., accessed March 2019 at https://www.webapps.nwfsc.noaa.gov/assets/11/8623_03072016_124156_Ford-NWSalmonBioStatusReviewUpdate-Dec%2021-2015%20v2.pdf.
O’Connor, J.E., Mangano, J.F., Anderson, S.W., Wallick, J.R., Jones, K.L., and Keith, M.K., 2014, Geologic and physiographic controls on bed‐material yield, transport, and channel morphology for alluvial and bedrock rivers, western Oregon: Geological Society of America Bulletin, v. 126, no. 3–4, p. 377–397.
Peck, D.L., Griggs, A.B., Schlicker, H.G., Wells, F.G., and Dole, H.M., 1964, Geology of the central and northern parts of the western Cascade Range in Oregon: U.S. Government Printing Office Professional Paper 449, 56 p., 1 plate, accessed September 30, 2021, at https://doi.org/10.3133/pp449.
Politti, E., Bertoldi, W., Gurnell, A., and Henshaw, A., 2017, Feedbacks between the riparian Salicaceae and hydrogeomorphic processes—A quantitative review: Earth-Science Reviews, v. 176, p. 147–165, accessed September 30, 2021. https://doi.org/10.1016/j.earscirev.2017.07.018.
Rakestraw, L., and Rakestraw, M., 1991, History of the Willamette National Forest: U.S. Department of Agriculture, Forest Service, Pacific Northwest Region, Willamette National Forest, Eugene, Oregon, 329 p., accessed March 2018 at https://foresthistory.org/wp-content/uploads/2017/01/HISTORY-OF-THE-WILLAMETTE-NATIONAL-FOREST.pdf.
Richter, B.D., and Thomas, G.A., 2007, Restoring environmental flows by modifying dam operations: Ecology and Society, v. 12, no. 1, Synthesis, part of a Special Feature on Restoring Riverine Landscapes, 26 p., accessed July 14, 2023, at https://www.ecologyandsociety.org/vol12/iss1/art12/.
Riverscapes Consortium, 2018, Geomorphic change detection software website: Riverscapes Consortium, version 6.1.14, North Arrow Research, accessed on August 14, 2018, at http://gcd.riverscapes.xyz/.
Schall, D., 2017, Transforming Springfield’s Mill Race into a community asset: Stormwater, accessed April 2018, at https://www.stormh2o.com/home/article/13031881/transforming-springfields-mill-race-into-a-community-asset.
Shafroth, P.B., Friedman, J.M., Auble, G.T., Scott, M.L., and Braatne, J.H., 2002, Potential responses of riparian vegetation to dam removal—Dam removal generally causes changes to aspects of the physical environment that influence the establishment and growth of riparian vegetation: Bioscience, v. 52, no. 8, p. 703–712, accessed September 30, 2021, https://doi.org/10.1641/0006-3568(2002)052[0703:PRORVT]2.0.CO;2.
Shelley, J., Hotchkiss, R.H., Boyd, P.E., and Gibson, S., 2021, Discharging sediment downstream—Case studies in cost effective, environmentally acceptable reservoir sediment management in the United States: Journal of Water Resources Planning and Management, v. 148, no. 2, accessed September 2, 2022, at https://doi.org/10.1061/(ASCE)WR.1943-5452.0001494.
Sherrod, D.R., 1991, Geologic map of a part of the Cascade Range between latitudes 43-44, central Oregon: U.S. Geological Survey IMAP 1891, scale 1:25,000, accessed August 24, 2023, at https://doi.org/10.3133/i1891.
Smith, R.L., and Roe, W.P., 2015, OGDC-6, Oregon Geologic Data Compilation, release 6: Oregon Department of Geology and Mineral Industries, digital geodatabase available at https://www.oregongeology.org/pubs/dds/p-OGDC-6.htm.
Stratton Garvin, L.E., and Rounds, S.A., 2022, The thermal landscape of the Willamette River—Patterns and controls on stream temperature and implications for flow management and cold-water salmonids: U.S. Geological Survey Scientific Investigations Report 2022–5035, 43 p., accessed January 17, 2024, at https://doi.org/10.3133/sir20225035.
Swanson, B.J., Meyer, G.A., and Coonrod, J.E., 2011, Historical channel narrowing along the Rio Grande near Albuquerque, New Mexico in response to peak discharge reductions and engineering—Magnitude and uncertainty of change from air photo measurements: Earth Surface Processes and Landforms, v. 36, no. 7, p. 885–900, accessed September 14, 2022, https://onlinelibrary.wiley.com/doi/epdf/10.1002/esp.2119.
Tague, C., and Grant, G.E., 2004, A geological framework for interpreting the low-flow regimes of Cascade streams, Willamette River Basin, Oregon: Water Resources Research, v. 40, no. 4, W04303, accessed December 11, 2023, at https://doi.org/10.1029/2003WR002629.
Tsakiris, A., Kramer, C., Hall, B., Vasquez, J., and First, J., 2019, Improving sediment management in the Cowlitz Falls hydropower facility: Reno, Nevada, Proceedings of the Federal Interagency Sedimentation and Hydrologic Modeling Conference, June 24–28, 2019, 4 p., accessed December 31, 2019, at http://www.sedhyd.org/2019/proceedings/SEDHYD_Proceedings_2019_Volume3.pdf.
U.S. Army Corps of Engineers [USACE], 2017, dataquery 2.0: U.S. Army Corps of Engineers, Northwestern Division, dataquery 2.0 website, accessed June 13, 2018, at https://www.nwd-wc.usace.army.mil/dd/common/dataquery/www/.
U.S. Army Corps of Engineers [USACE], 2018, Fall Creek Dam and Reservoir: U.S. Army Corps of Engineers, project website, accessed June 13, 2018, at https://www.nwd-wc.usace.army.mil/dd/common/dataquery/www/.
U.S. District Court for the District of Oregon, 2021, Attachment 3, document 227: U.S. District Court for the District of Oregon Case 3:18-cv-00437-HZ, document 227, filed November 2, 2021, documents available from the U.S. Army Corps of Engineers, accessed January 17, 2024, at https://usace.contentdm.oclc.org/utils/getfile/collection/p16021coll7/id/19583.
U.S. Fish and Wildlife Service, 2015, Endangered and threatened wildlife and plants—Removing the Oregon chub from the Federal list of endangered and threatened Wildlife: Federal Register, v. 80, no. 33, p. 9126–9150, accessed March 12, 2020, https://www.govinfo.gov/content/pkg/FR-2015-02-19/pdf/2015-02951.pdf.
U.S. Forest Service [USFS], 1995, Fall Creek watershed analysis: U.S. Forest Service, Willamette National Forest Ranger District, accessed March 27, 2018, at https://www.fs.usda.gov/detail/willamette/landmanagement/planning/?cid=stelprd3794256.
U.S. Geological Survey [USGS], 1942, Lowell quadrangle, Oregon, topographic map, 1:125,000: U.S. Geological Survey, topographic map, 1:125,000, accessed October 8, 2021, at and available from https://ngmdb.usgs.gov/topoview/.
U.S. Geological Survey [USGS], 1955a, Hardesty Mountain Qauadrangle, Oregon-Lane County, 15-minute series topographic map: U.S. Geological Survey, topographic map, 1:62,500, accessed October 8, 2021, at https://ngmdb.usgs.gov/topoview/.
U.S. Geological Survey [USGS], 1955b, Lowell quadrangle, Oregon-Lane County, 15-minute series topographic map: U.S. Geological Survey, topographic map, 1:62,500, accessed October 8, 2021, at https://ngmdb.usgs.gov/topoview/.
U.S. Geological Survey [USGS], 2018a, Jones Fire (Willamette National Forest, OR): U.S. Geological Survey Landslide Hazards Program Post-fire Debris Flow Hazards website, accessed March 27, 2018, at https://landslides.usgs.gov/hazards/postfire_debrisflow/detail.php?objectid=123.
U.S. Geological Survey [USGS], 2021, National Water Information System: U.S. Geological Survey, National Water Information System: Web interface, accessed May 29, 2019, at https://nwis.waterdata.usgs.gov/nwis.
U.S. Geological Survey [USGS], 2018b, StreamStats: Streamflow statistics and spatial analysis tools for water-resources applications: U.S. Geological Survey web application, accessed January 7, 2020, at https://streamstats.usgs.gov/ss/.
U.S. Geological Survey [USGS], 2023, WaterWatch: U.S. Geological Survey web site, accessed August 22, 2023, at https://waterwatch.usgs.gov/?id=mkrc.
Wallick, J.R., Anderson, S.W., Cannon, C., and O’Connor, J.E., 2010, Channel change and bed‐ material transport in the lower Chetco River, Oregon: U.S. Geological Survey Scientific Investigations Report 2010–5065, 68 p. [Also available at https://pubs.usgs.gov/sir/2010/5065/.]
Wallick, J.R., Bach, L.B., Keith, M.K., Olson, M., Mangano, J.F., and Jones, K.L., 2018, Monitoring framework for evaluating hydrogeomorphic and vegetation responses to environmental flows in the Middle Fork Willamette, McKenzie, and Santiam River Basins, Oregon: U.S. Geological Survey Open-File Report 2018–1157, 66 p. [Also available at https://doi.org/10.3133/ofr20181157.]
Wallick, J.R., Jones, K.L., O’Connor, J.E., and Keith, M.K., Hulse, David, and Gregory, S.V., 2013, Geomorphic and vegetation processes of the Willamette River floodplain, Oregon—Current understanding and unanswered questions: U.S. Geological Survey Open-File Report 2013–1246., 70 p., accessed September 30, 2021, at https://doi.org/10.3133/ofr20131246.
Watershed Sciences, Inc., 2009, Lidar remote sensing data collection, Willamette Valley Phase 1, Oregon: Portland, Oregon, prepared by Watershed Sciences, for the Department of Geology and Mineral Industries, Portland, Oregon, digital data and report, 40 p., available from Oregon Department of Geology and Mineral Resources, accessed August 24, 2023, at https://www.oregongeology.org/lidar/.
Watershed Sciences, Inc., 2012, Lidar remote sensing data collection Fall Creek: Portland, Oregon, prepared by Watershed Sciences, Inc. for David Smith and Associates, Portland, Oregon, digital data and report, 27 p., available from Oregon Department of Geology and Mineral Resources, accessed August 24, 2023, at https://www.oregongeology.org/lidar/.
Wheaton, J.M., 2008, Chapter 4—Accounting for DEM uncertainty in morphological sediment budgeting, in Wheaton, J.M., 2008, Uncertainty in morphological sediment budgeting of rivers: Unpublished PhD Thesis, University of Southampton, Southampton, England, p. 72–145; accessed August 24, 2023, at http://etalweb.joewheaton.org.s3.amazonaws.com/Downloads/Thesis/JMWthesis_Part4.pdf.
White, J.S., Garvin, L.E.S., Wallick, J.R., Maher, A., and Bervid, H., 2023, Comparison of environmental flow recommendations for the Willamette Basin Sustainable Rivers Program, WYs 2008–2022: U.S. Geological Survey data release, accessed January 13, 2024, at https://doi.org/10.5066/P9A46G20.
Wise, D.R., 2018, Updates to suspended sediment SPARROW model developed for western Oregon and northeastern California: U.S. Geological Survey Scientific Investigations Report 2018–5156, 23 p., accessed September 30, 2021, at https://doi.org/10.3133/sir20185156.
Wise, D.R., 2020, Water-quality conditions related to bedload, suspended sediment, and silicate solutes in watersheds of western Oregon and northwestern California: U.S. Geological Survey data release, accessed August 24, 2023, at https://doi.org/10.5066/P9ISVO3S.
Wise, D.R., and O’Connor, J.E., 2016, A spatially explicit suspended-sediment load model for western Oregon: U.S. Geological Survey Scientific Investigations Report 2016–5079, 25 p., accessed August 24, 2023, at https://doi.org/10.3133/sir20165079.
Appendix 1. Datasets Used or Created for This Study
Table 1.1.
Datasets used or generated for characterizing geomorphology of Fall Creek and the Middle Fork Willamette River and to support analyses addressing physical responses to streambed drawdowns at Fall Creek Lake, Oregon.[Resolution for mapping datasets generated for this study were often created at a range of scales; the coarsest resolution is listed but some reaches or features may have been created at a larger scale. Abbreviations: SfM, Structure from Motion; UAS, unoccupied aerial systems; OAS, occupied aerial systems; DEM, digital elevation model; USGS, U.S. Geological Survey; USACE, U.S. Army Corps of Engineers; NAIP, National Agriculture Imagery Program; DOGAMI, Oregon Department of Geology and Mineral Industries; lidar, light detection and ranging; mtn., mountain; m, meter; --, not applicable or not available]
| Dataset type | Year | Coverage | Resolution | Repository | Source |
|---|---|---|---|---|---|
| Aerial photography | 2016 | Full study area coverage | 1-m | https://datagateway.nrcs.usda.gov/ | NAIP |
| 2014 | Full study area coverage | 1-m | https://datagateway.nrcs.usda.gov/ | NAIP | |
| 2012 | Full study area coverage | 1-m | https://datagateway.nrcs.usda.gov/ | NAIP | |
| 2011 | Full study area coverage | 1-m | https://datagateway.nrcs.usda.gov/ | NAIP | |
| 2005 | Full study area coverage | 0.5-m | https://datagateway.nrcs.usda.gov/ | NAIP | |
| 1936 | Full coverage for reaches downstream from Fall Creek and Dexter Dam | 1:15,000 | https://www.sciencebase.gov/catalog/item/5b984388e4b0702d0e842606 | USACE | |
| Geomorphic mapping of active channel landforms and floodplain features | 2016 | Reaches downstream from Fall Creek and Dexter Dam | 1:3,000 | https://www.sciencebase.gov/catalog/item/5b984388e4b0702d0e842606 | USGS |
| 2014 | Reaches downstream from Fall Creek and Dexter Dam | 1:3,000 | https://www.sciencebase.gov/catalog/item/5b984388e4b0702d0e842606 | USGS | |
| 2012 | Reaches downstream from Fall Creek and Dexter Dam | 1:3,000 | https://www.sciencebase.gov/catalog/item/5b984388e4b0702d0e842606 | USGS | |
| 2011 | Reaches downstream from Fall Creek and Dexter Dam | 1:3,000 | https://www.sciencebase.gov/catalog/item/5b984388e4b0702d0e842606 | USGS | |
| 2005 | Reaches downstream from Fall Creek and Dexter Dam | 1:3,000 | https://www.sciencebase.gov/catalog/item/5b984388e4b0702d0e842606 | USGS | |
| 1936 | Reaches downstream from Fall Creek and Dexter Dam | 1:3,000 | https://www.sciencebase.gov/catalog/item/5b984388e4b0702d0e842606 | USGS | |
| Wetted channel centerlines | 2016 | Reaches downstream from Fall Creek and Dexter Dam | 1:3,000 | https://www.sciencebase.gov/catalog/item/5b984388e4b0702d0e842606 | USGS |
| 2005 | Reaches downstream from Fall Creek and Dexter Dam | 1:3,000 | https://www.sciencebase.gov/catalog/item/5b984388e4b0702d0e842606 | USGS | |
| 1936 | Reaches downstream from Fall Creek and Dexter Dam | 1:3,000 | https://www.sciencebase.gov/catalog/item/5b984388e4b0702d0e842606 | USGS | |
| Historical USGS pre-dam plan and profile | 1926 | Middle Fork Willamette River, full coverage of within study area and continues upstream to about Oakridge | 1:31,860 | https://www.usgs.gov/core-science-systems/usgs-library; https://www.sciencebase.gov/catalog/item/5b984388e4b0702d0e842606 | USGS |
| Pre-dam USGS topographic maps | 1942 | Lowell Quadrangle, Oregon, topographic map | 1:125,000 | https://ngmdb.usgs.gov/topoview/. | USGS |
| 1955a | Hardesty Mtn. Quadrangle, Oregon-Lane County, 15-minute series topographic map | 1:62,500 | https://ngmdb.usgs.gov/topoview/. | USGS | |
| 1955b | Lowell Quadrangle, Oregon-Lane County, 15-minute series topographic map | 1:62,500 | https://ngmdb.usgs.gov/topoview/. | USGS | |
| Pre-dam USACE reservoir topography | 1966 | Pre-dam topographic map | varies | -- | USACE |
| Fall Creek Lake range-line cross sections | 1965, 2012 | Fall Creek Lake reach | varies | -- | USACE |
| Fall Creek Lake storage curves | 1965, 1988, 2012 | Fall Creek Lake reach | varies | -- | USACE |
| Reservoir geomorphic mapping | 2016* | Fall Creek Lake reach | 200-m | https://doi.org/10.5066/P9YZSJJJ | USGS |
| Topographic lidar | 2009 | Jasper to confluence with the Coast Fork Willamette River | 1.0-m | https://www.oregongeology.org/lidar/ | DOGAMI |
| 2012 | Fall Creek Lake and downstream from USACE dams on Fall Creek and Middle Fork Willamette River to Jasper | 0.5-m | https://www.oregongeology.org/lidar/ | DOGAMI | |
| Topographic-bathymetric lidar | 2015 | Full study area downstream from dams | 1.0-m | https://www.oregongeology.org/lidar/ | DOGAMI |
| SfM UAS (point clouds, DEMs, and orthophotographs) | 2016 | Lower Fall Creek Lake | 0.13-m | https://doi.org/10.5066/P9AYWU8Z. | USGS |
| 2016 | Lower Fall Creek Lake | 0.11-m | https://doi.org/10.5066/P9AYWU8Z. | USGS | |
| SfM OAS (point clouds, DEMs, and orthophotographs) | 2016 | Most of Fall Creek Lake | 0.17-m | https://doi.org/10.5066/P9AYWU8Z. | USGS |
| Sediment depths at clay-horizon markers | 2015–17 | Dispersed through Fall Creek and the Middle Fork Willamette River | -- | https://doi.org/10.5066/P9MGNDHN | USGS |
| Particle counts | 2015–16 | Dispersed through Fall Creek and the Middle Fork Willamette River | -- | https://doi.org/10.5066/P9MGNDHN | USGS |
| Bedload and suspended-sediment loads | 2012–18 | Fall Creek gage | -- | https://nwis.waterdata.usgs.gov/or/nwis/qwdata/?site_no=14151000&agency_cd=USGS | USGS |
Appendix 2. Fall Creek Lake Geomorphic Mapping Framework and Unit Descriptions
Process Domains
Process domain classifications are applied to groupings of landforms with related formational or functional processes. For example, reservoir hillslopes generally line the perimeter of the reservoir and are subject to hillslope processes during low pool levels and wave cutting when interacting with pool levels. Domains are not directly delineated; digitized landforms are assigned to different domains.
Main Channel
The main channel domain consists of landforms that actively convey streamflow during full streambed drawdown for Fall Creek and Winberry Creek; at higher pool levels, it may also be referred to as the reservoir thalweg. The main channel domain is represented by the main wetted channel area, bars, in-channel bedrock, banks and slumping banks, in-channel drawdown terraces, or other alluvial features created by the free-flowing river when reservoir pool level is at full streambed drawdown, approximately 680 feet (ft; NGVD 1929) at the dam.
Reservoir Hillslope
The reservoir hillslope encompasses the typically steep valley walls that extend from edge of the reservoir at elevation 830 ft downward to a prominent break in slope at the reservoir floor. It often includes wave cut features, rilling, or small streams. The reservoir hillslope domain may also have herbaceous vegetation on high-elevation surfaces that have not been inundated for an extended amount of time.
Reservoir Floor
The reservoir floor domain generally includes a broad, low gradient suite of planar surfaces that collectively form the reservoir floor and extend from valley-edge hillslopes to the main channel. Multiple styles of the broad reservoir floor include marginal floor along the reservoir boundary (mapped as “littoral reservoir floor”), the main paleo valley-bottom and adjacent terraces (mapped as “pelagic reservoir floor”), and isolated floor perched within the bounds of the reservoir hillslope domain (also mapped as “pelagic reservoir floor”). This domain most commonly includes areas of former Fall and Winberry Creek floodplain and terraces. The main transition from reservoir hillslope to reservoir floor primarily is at a prominent break in slope, but in some instances the break is more gradual and difficult to define with digital terrain surfaces. Changes in wave-cutting, sediment color or type, the presence of exposed tree stumps that display lack of burial by sediment and exposed roots versus mostly buried tree stumps, and the transition from single-thread tributary or gully to a distributed fan/distributary-like feature can be observed in the orthophotographs helping signal the boundary between floor and hillslope.
Landforms
Mapped landforms within the reservoir primarily consist of features (greater than 10 m2) interpreted to have been formed predominantly by reservoir processes. These landforms are affected by operations such as streambed drawdowns, seasonal flood-mitigation drawdowns, and full pool operations, and are often associated with related erosional and or depositional processes. Additionally, mapping includes infrastructure (including such as cuts and fills) and exposed bedrock. The landform descriptions and delineation criteria below are generally organized as follows:
-
• General description and surface expression or distinguishing feature;
-
• Criteria for linework digitization and landform delineation (for example, break in slope, width in meters, inundation) or elaboration on distinguishing features;
-
• Formation processes;
-
• Geomorphic significance in relation to drawdown operations.
Reservoir Hillslope
-
• The reservoir hillslope consists of steep areas of the reservoir margins that typically extend from the reservoir floor upward to the reservoir margins at elevation 830 ft.
-
• The reservoir hillslope landform consists of steep slopes (greater than about 5 degrees) forming the reservoir walls and includes isolated gravel and (or) bedrock knobs where they are visible at the surface. Steeper areas tend to show extensive wave-cut terracettes indicative of net erosion, but in lower gradient areas may have some sediment accumulation. Reservoir hillslopes are primarily delineated by breaks in slope, a change in substrate type or color, or the presence of in situ stumps often with exposed root systems indicating erosion. The lower boundary for reservoir hillslope is commonly defined by a break in slope with the reservoir floor. The reservoir hillslope landforms are exclusively found within the reservoir hillslope domain.
-
• The main reservoir hillslope, or valley slope, formation pre-dates dam construction. The reservoir slope represents areas unlikely to accumulate sediment, due to the migration of sediment downslope to the reservoir floor, or subject to net erosion due to wave action resulting from reservoir drawdowns. These features are typically net erosional, as sometimes evidenced wave-cutting and exposed root systems of in situ stumps visible in the 2016 orthophotographs. Fall Creek Lake shows prominent wave-cut terraces on the reservoir slope common with fluctuating lake levels; however, in reservoirs operated with constant or near-constant head, the reservoir slope would not generally show evidence of significant erosion. For example, in former Lakes Aldwell and Mills, two small hydroelectric reservoirs operated as run-of-the-river, the reservoir slopes were characterized by net neutral or net positive sedimentation (Stratton and Grant, 2019).
-
• Reservoir hillslopes may be sources of fine-grained sediment and some coarse sediment to the reservoir floor areas, as lake levels are lowered, and wave energy interacts with ground surface. However, there is likely limited transport of this locally-derived material beyond the reservoir floor through the regulating outlets to downstream reaches unless the reservoir hillslope is adjacent to the main channel/reservoir thalweg of Fall and Winberry Creeks, tributary channels, or drawdown channels.
Pelagic Reservoir Floor
-
• The pelagic reservoir floor is the main floor of the reservoir extending between the reservoir hillslope and main reservoir channels. It is generally downslope of the reservoir hillslope domain, relatively flat, and would be fully and deeply inundated by water at maximum pool (830 ft).
-
• The pelagic reservoir floor generally has a low gradient (typically less than about 2 degrees) and a smooth appearance in DSM (lack of topographic roughness) and orthophotographs (lack of color variation) related to sand and finer-grain sediment accumulation. The pelagic reservoir floor within this mapping framework is bound by reservoir hillslopes that separate the mapped floor and from mapping boundary at reservoir maximum pool. Three general types pre-dam surfaces are incorporated in the pelagic reservoir floor, although, they are not distinguished as separate landform mapping units: (1) the pre-reservoir and paleo-floodplain is the flattest and is typically adjacent to the main channel; (2) Fall Creek paleo-terrace is typically upslope and separated from paleo-floodplain by terrace risers (usually mapped as sloped floor) with relatively fewer rills and channels; and (3) isolated paleo-terraces that are perched above other reservoir floor units are typically separated or surrounded by the reservoir hillslope mapping unit and generally show minimal reservoir sedimentation. In the upper reservoir, where seasonally-low water levels cause extended subaerial periods, sediment deposition after construction of Fall Creek Dam appears to be minimal; in these areas, in situ tree stumps that pre-date dam construction are still visible and provide evidence of minimal deposition, particularly where the basal root-flare is still visible. In the lower reservoir, where pelagic reservoir floor deposits are thicker, flat broad areas of typically finer sediments mantle or fully bury stumps and may display a mud-crack pattern in the 2016 orthophotographs.
-
• “Pelagic” is typically used in limnology to indicate deep-water conditions too dark for macrophyte growth (Wetzel, 2001). While precise definitions vary, the term is used here to delineate the deep reservoir floor from the shallow, littoral reservoir floor. The pelagic reservoir floor appears to be (1) net depositional, (2) deeply inundated frequently enough to preclude significant macrophyte growth, and (3) primarily influenced by suspended-sediment deposition. Within Fall Creek, the pelagic reservoir floor generally has a smooth surface appearance lacking bedforms, suggesting that deposition is primarily due to suspended-sediment deposition, which tends to mantle pre-existing topography. Both the pelagic and littoral reservoir floor deposits appear to mantle pre-dam terraces and floodplains of Fall and Winberry Creeks.
-
• During drawdown operations at Fall Creek Lake (seasonal and annual streambed operations), the pelagic reservoir floor is a potential source of sediment to be remobilized; relatively thicker deposits in the lower reservoir that are only exposed during streambed drawdowns may be a more likely to be exposed to erosive process and serve as a greater source of sediment than fully-dewatered, thinner deposits in the upper reservoir. However, the smooth, low-gradient surface indicates these areas of the reservoir floor domain have not been dramatically influenced by major erosional drawdown processes except where incised drawdown-related landforms (mapped as drawdown channels, terraces, and distributary zones, described below) occur. At the time of mapping, the long-term dam operation and the short-term streambed drawdown sediment regimes for the pelagic reservoir floor remain primarily depositional or neutral, respectively.
Littoral Reservoir Floor
-
• The littoral reservoir floor is a shallow water environment with sparse vegetation due to seasonal variations in water levels and consists of localized, relatively low gradient (typically less than about 2 degrees) areas along the reservoir margins adjacent to the mapping boundary at maximum pool elevation. Areas mapped as the littoral reservoir floor include shallow zones adjacent to Fall Creek Lake State Park and some shallow areas in the uppermost reservoir along Fall and Winberry Creeks.
-
• The littoral reservoir floor is generally delineated as low gradient and shallow (at full pool) marginal areas of Fall Creek Lake, where the reservoir hillslope banks are not steeply sloped. The littoral reservoir floor tends to have well-established herbaceous vegetation, as identified in orthophotograph, indicative of extended time without inundation and little erosional influence removing soil. Unlike the pelagic reservoir floor, the littoral reservoir floor within this mapping framework is not bound by reservoir hillslopes and this mapped floor unit extends to the mapping boundary at reservoir maximum pool.
-
• In limnology, the littoral zone is generally understood as an interface zone between terrestrial and aquatic environments (Wetzel, 2001). In natural lakes, this zone is subject to periodic drying events as the result of seasonal lake level variation and tends to be characterized by fine-grained sediment deposition and extensive macrophyte growth. The term is used for this mapping framework to delineate the deep pelagic reservoir floor from the shallow, littoral reservoir floor.
-
• During drawdown operations at Fall Creek Lake (seasonal and annual streambed operations), the littoral reservoir floor is likely only a very limited source of sediment supply to the main reservoir channels and reaches downstream from the dam, although sediments are subject to resuspension by wind, waves, and fluctuating lake levels. Like the pelagic reservoir floor areas, the relatively smooth, low-gradient surfaces indicate these areas of the reservoir floor domain have not been dramatically influenced by major erosional drawdown processes.
Sloped Reservoir Floor
-
• Sloped reservoir floor units are areas within the main body of the reservoir floor domain with relatively steeper slopes (greater than about 5 degrees) than adjacent pelagic or littoral reservoir floor units (typically less than about 2 degrees). These areas are not located on the reservoir margin and thus not considered part of the reservoir hillslope; they are also generally smaller (average area about 600 square meters [m]) than reservoir hillslope polygons (average area about 21,400 m2).
-
• Sloped reservoir floor may also include isolated domes of sloping, more resistant materials or other locally steep locations within the reservoir floor domain. Sloped reservoir was delineated based on relatively steeper slopes than adjacent pelagic or littoral reservoir floor. This landform was defined by the main break in slope when clearly defined. On more gradual slope transitions without a clear break in slope between sloped reservoir floor and other landforms, best judgement was used to digitize the boundary using other evidence like changes in color or visible substrate. Often these landforms show bedrock, in situ tree stumps, or wave-cut morphology visible in the 2016 orthophotographs.
-
• Sloped reservoir landforms may include bedrock knobs, small former hills completely inundated by the reservoir, or the risers of pre-dam terraces. Multiple generations of Fall and Winberry Creek terraces are visible in the morphology of the reservoir floor and are only delineated separately where terrace risers form slopes steep enough to prevent substantial sedimentation.
-
• Sloped floor areas tend not to have thick sediment accumulation as shown by the bedrock, in situ tree stumps with exposed root flare, and wave-cut morphology visible in the 2016 orthophotographs and, therefore, do not represent substantial sources of sediment available during reservoir drawdown operations, although sediments are subject to resuspension by wind, waves, and fluctuating lake levels. Additionally, since many of these mapped features are composed of bedrock or other hillslope/pre-impoundment soil materials, their inherent stability could limit the lateral migration of drawdown channels that form in the reservoir floor.
Wetted Channel
-
• Wetted channels mapped in Fall Creek Lake include the main wetted channel areas of Fall and Winberry Creeks at streambed drawdown, but not other smaller, permanent tributaries. Landform delineation is defined by the area inundated by water at the time of complete reservoir drawdown as observed in orthophotograph (November 10, 2016) or from the 2012 light detection and ranging (lidar) dataset where 2016 coverage is not available. This mapping unit includes the main wetted channel bed surface and forms a part of the main channel domain.
-
• The wetted channel is delineated based on the intersection of surface water and dry land along the edges of Fall and Winberry Creeks as visible in the 2016 orthophotograph. Landforms smaller than the minimum mapping unit that are adjacent to or within the wetted channel may be lumped with the wetted channel (for example, small bars). Where orthophotograph coverage is unavailable in the upper kilometer of reservoir, the approximate boundary of the wetted channel is delineated based on lidar data (2012), at breaks in slope, variation in surface texture (indicating relatively rougher land versus smoother water), and relief between presumed channel and surrounding landforms.
-
• In Fall Creek Lake, the general position of the wetted channel (2016) was likely established prior to dam construction and channel features do not appear to have changed substantially in the about 50 years following dam construction. The position and geometry of the channel is likely maintained with a combination of long-term operations including seasonal flood-control drawdowns and historical streambed (or near streambed) drawdowns, allowing fluvial processes to operate along the main channel, and a relatively low coarse sediment supply (O’Connor and others, 2014, 2021), which prevents substantial lacustrine deposition and overprinting of the main channel. The combination of these factors, combined with recent and historical full pool drawdowns, has helped maintain the lower reservoir channel. In additions, bedrock outcrops and valley walls adjacent controls have also helped maintain the overall later position of the channel.
-
• During streambed drawdown operations at Fall Creek Lake, the wetted channel is the main conduit for sediment transport to the dam and farther downstream. Over the course of an individual drawdown event, the channel incises into sediments deposited within the channel itself, which contributes to lateral shifting and channel widening (through slumping or failure of over-steepened banks). Additional sediment is supplied from some reservoir floor erosion. Over the course of the multiple full-pool drawdown events (WY 2012–18), it appears, from comparisons with pre-dam maps and aerial photographs (Chapter B. Reservoir Morphology and Evolution Related to Dam Operations at Fall Creek Lake), that the Fall Creek channel in the reservoir has approximately re-established its course prior to impoundment. The upper reaches of Winberry Creek appear to be contained within the pre-impoundment channel, while the lower reach appears to have migrated laterally and incised into a relatively large area of reservoir floor deposits immediately upstream from its confluence with Fall Creek. As noted by Morris and Fan (1998) the re-occupation of the pre-impoundment stream channel is typical of most reservoirs subject to flushing events.
Channel Bank
-
• Channel banks (or channel margins), for this study, are defined as sloping margins along the alluvially-formed channel that confines discharge during the low-flow full reservoir drawdown (definition modified from Osterkamp, 2008) and are only mapped for the main Fall and Winberry Creek channels.
-
• Channel banks were delineated separately from the main wetted channels where distinct channel banks were clearly visible. A second category of channel banks (slumping bank) is delineated separately (described below).
-
• Channel banks within the Fall Creek Lake are generally formed by one of two processes. In the upper reaches, existing banks predate the construction of Fall Creek Dam and are maintained by typical fluvial processes during winter flood-control drawdowns. In the lower reaches of the reservoir where enough sediment has been deposited to bury the pre-dam channel, the present-day channel and banks were likely formed or have been re-established through incision of the reservoir floor deposits during streambed drawdowns.
-
• Channel banks that formed as the main reservoir channel incised into reservoir floor deposits provide a source of material for evacuation from the reservoir. Channel banks that formed prior to dam construction probably only contribute a very limited amount of sediment during drawdowns, but along with the main channel may help to confine sediment-rich streamflows and channel sediment to lower reaches of the reservoir.
Slumping Bank
-
• Channel banks showing signs of slumping or mass failure are mapped as slumping banks. These landforms include features that show evidence of recent slumping, as well as older features that have likely been active during previous drawdowns. Landforms mapped as slumping banks include discrete curvilinear scarps and transverse cracks within the runout of unconsolidated slumped material; as mapped, slumping bank landforms include both the erosional source and depositional slump areas. In some areas, the curvilinear morphology of a slump failure is still visible along stream banks but is less pronounced than more recent failures by the subsequent deposition of reservoir sediments; although apparently inactive when orthophotographs and DSM were collected, these less distinct failures are presumed to represent slumps from previous (before 2016) drawdown events and are mapped as slumping banks.
-
• Like channel banks, slumping banks are delineated separately from the main wetted channels. The slumping banks are distinguished from regular channel banks by evidence of mass failure, such as curvilinear scarps and displaced slump deposit.
-
• Slumping banks occur in channel banks where active incision causes mass failure or when saturated banks become dewatered during receding lake levels. Sediment evacuates from the main drawdown channel or reservoir thalweg until incision lowers the bed such that banks over steepen, and bank slumping is the result of lateral migration or widening of the channel. Most often, slumping banks occur in the lower reservoir within finer sediment sized reservoir floor deposits.
-
• As noted by Morris and Fan (1998), slope failure by slumping or sliding is the primary mechanism by which flushing channels are widened during reservoir drawdowns. In the Fall Creek Lake, slumping banks typically occur along the lower reaches of Fall and Winberry Creeks within relatively fine (sand and mud) reservoir floor deposits, and failure of that sediment into or near the main wetted channels increases the likelihood of transportation through the reservoir and to reaches downstream from the dam.
Bar
-
• As mapped, bars within Fall Creek Lake are streamlined features located along the main channel bed or within tributaries that are composed of gravel to sand-sized sediment. Bars are recently active landforms formed through fluvial depositional processes; they represent recent sediment transport and deposition by fluvial processes as opposed to lacustrine processes. Though some bars are relatively large (up to 4,500 m2), the mean mapped bar size is about 360 m2.
-
• Only parts of bars above the water surface are delineated. Many bar-like features (drawdown terraces, described below) along the main Fall Creek channel have similar planform to bars (with elongated, streamlined morphology), but top elevations of the bars rise less than about 0.5 m above the water-surface elevation (from 2016 topography) and appear to be actively accumulating or eroding based on comparisons with 2012 lidar topography and repeat field visits spanning 2015–18, when the reservoir pool elevation is at streambed. Bars are distinguished from drawdown terraces (described below) by the dominant process creating the feature. Some relatively finer-grained bars (as seen in orthophotographs) are mapped in smaller tributaries and drawdown channels, but most bars are located within the main Fall and Winberry Creek channels and are composed of sand and gravel.
-
• Mapped bars are recently active landforms formed through fluvial depositional processes with free-flowing channel conditions during periods of lowered lake levels. These features appear to be actively accumulating or eroding when the reservoir pool elevation is at streambed.
-
• During streambed drawdowns at Fall Creek Lake, bar features associated with the main channels and within tributaries and drawdowns channels all represent recently active sediment mobilization and re-deposition. During lowered lake levels, sediment stored within the bars is subject to remobilization with increases in discharge within the channel and are actively accumulating or supplying bed-material sediment when the lake level is at streambed.
Bedrock (Feature)
-
• Bedrock outcrops are present throughout the Fall Creek Lake but are only mapped as a distinct feature when outcrops exist within the main channel where they can interact or influence fluvial deposition, transport, and erosion during drawdown operations. These features are typically about 220 m2 in mapped size but range up to 2,230 m2.
-
• Exposed bedrock in the main channel domain can occur as isolated outcrops within or flanking the main channel as sections of channel banks. Bedrock outcrops in the main channel domain restrict or interact with the main channel processes; bedrock outside of the main channel domain is typically mapped as an alternative feature (for example, reservoir hillslope landform in the reservoir hillslope domain) but given the substrate designation of bedrock. Bedrock may be differentiated from gravel bars or fine-grained channel banks by surface texture whereby bedrock outcrops tend to display parallel ridges or cracks and have a more jagged outline compared with smooth texture of streamlined alluvial depositional features. Some areas mapped as bedrock are mantled in finer sediment; these are mapped as bedrock where the majority (more than 50 percent) of the feature is exposed bedrock and bedrock morphology is evident beneath the mantle of sediment.
-
• Bedrock formation as a mapped geomorphic landform pre-dates dam construction.
-
• Bedrock features within the main channel of Fall and Winberry Creeks may restrict lateral channel migration or incision of the reservoir thalweg during streambed drawdowns.
Tributary Channel
-
• Tributary channels are small channels that typically originate beyond the reservoir perimeter and drain directly into Fall or Winberry Creeks. In contrast to the main channel landforms, tributary channels are mapped from the top of banks, encompassing banks, wetted or dry channel bed, and any adjacent channel margins. Tributary channels are generally straight in the relatively steep reservoir hillslope domains but increase in sinuosity within the lower gradient reservoir floor.
-
• Tributary channels were delineated based on a channel width, where channels wider than 1 m were mapped. The upstream end of tributary channels is mapped so that they truncate near the outer reservoir boundary (elevation 830 ft). Tributary channels originate near or outside the reservoir mapping boundary and are distinct from drawdown channel landforms, which solely originate within the reservoir boundaries from drawdown processes.
-
• In the Fall Creek Lake, tributary features were originally formed by fluvial and hillslope processes and continue to be maintained by those processes. The general locations of these features were established prior to dam construction and have not changed substantially in the last 50 years since the dam was constructed. Because the smaller tributaries tend to be located near the reservoir perimeter (and, by extension, higher in elevation), the upper reaches are exposed during both normal operating drawdowns and full-pool drawdowns. This probably both reduces the amount of sediment deposited and helps the tributaries evacuate annual deposits, maintaining them in their pre-impoundment location.
-
• Tributaries likely play an important role in the transport of water and sediment from distal reservoir hillslope and floor regions of the Fall Creek Lake to the main channel. During streambed drawdown, the exposed channels can flow freely, and many have changing landforms similar to those mapped in this hierarchy for the main channel although are too small to be mapped within this dataset.
Drawdown Channel
-
• Drawdown channels are channels that originate predominantly through head cuts by the reservoir floor or reservoir hillslope and do not extend beyond the perimeter of Fall Creek Lake as do tributaries. Drawdown channels may drain to Winberry or Fall Creeks but also frequently evolve into small drawdown distributary zones (described below) at their distal ends on the reservoir floor.
-
• Drawdown channels are delineated similarly to tributary channels, where the width of the mapped feature between the tops of banks exceeds than 1 m. Where channels do not show a clear edge in orthophotograph, drawdown channel features were delineated based on the clearest break in slope in a DSM-derived slope model. Included in this mapping category are drawdown channels that appear to be actively conveying water and sediment (as indicated by sharp, distinct break between the reservoir floor and channel indicating recent erosion) and older drawdown channels, which were likely formed during previous drawdowns but now have rounded, smooth banks that lack signs of recent erosion. Some drawdown channels also show signs of headward erosion that formed deep, steep-walled channels (gullies) with sharp knickpoints whereas other drawdown channels begin as gently sloping features that gradually deepen in the downstream direction. The pelagic reservoir floor commonly contains networks of small unmapped drawdown channels, particularly within the lower paleo-floodplain.
-
• Drawdown channels are drainage features that likely form in response to seasonal and streambed drawdowns of the reservoir. As lake levels are lowered, water draining from the low gradient floor likely concentrates within these channels, increasing local capacity to mobilize and transport fine-grained sediment thereby carving the channel. Once the channels incise into reservoir floor deposits, over-steepening and bank failure is the primary mechanism for widening of those channels (Morris and Fan, 1998, p. 15.17), evident at Fall Creek from field observations and 2016 orthophotographs. Over time, these features can evolve through knickpoint migration or increases in local slope that increase the efficiency of streamflow and sediment transport through the feature.
-
• As mapped from 2016 drawdown imagery, many drawdown channels are dry at full streambed drawdown but probably convey sediment when lake levels are being lowered or during storm events when exposed above the reservoir water surface. Topographically, most drawdown channels are incised into reservoir floor deposits and their bed elevations are higher than nearby pre-impoundment surfaces in net-depositional portions of the reservoir.
Drawdown Distributary Zone
-
• Drawdown distributary zones are broad areas containing a complex set of distinct landforms within the pelagic reservoir floor that are generally located at distal end of drawdown channels and display a series of floodplain splays and small deltaic lobes that are cross-cut by erosional channel features. The suite of landforms included within a drawdown distributary zone signifies areas of streamflow expansion and deposition.
-
• Drawdown distributary zones are distinguished from adjacent pelagic reservoir floor by their complex topography of drawdown channels and drawdown surfaces; the complexity and scale of those features prevents detailed mapping of each individual feature. These features are often found adjacent (upstream or downstream) to drawdown channels and sometimes coinciding with a change in gradient of the drawdown channel streamflow direction.
-
• Drawdown distributary zones are probably formed and abandoned during drawdown events (based on interpretation of these landforms within the 2016 aerial photographs), when the dewatering of the reservoir initiates progradation of sediment along the reservoir floor.
-
• Seasonal flood control drawdowns, combined with annual streambed drawdown events, probably serve to mobilize sediment from the upper reservoir areas to the lower reservoir areas through these drawdown distributary zones and drawdown channels.
Drawdown Terrace
-
• Drawdown terraces are planar surfaces up to about 7,070 m2 that have either been incised by channels and abandoned by continued incision or might be small areas or reservoir floor that have been dissected from the larger floor by channel erosion around the feature (an erosion island). These features can occur in main channel or reservoir floor domains and are interpreted as resulting from drawdown operations.
-
• In most instances, drawdown terraces are in the form of terraces adjacent to and above the elevation of the main channel at the time of orthophotograph and DSM collection. Drawdown terraces may generally appear similar to lateral bars mapped in the channel bottom of Fall and Winberry Creeks; and although the drawdown terraces typically have an oblate, streamlined planform similar to bars, their topographic position (generally about 0.5 m or more higher than the main wetted channel and bars) and planar surface indicate they are erosional remnants of former reservoir floor and stream bed deposits, whereas bars indicate transport and deposition of coarse-grain sediment (greater than 2 mm). Although the taller drawdown terrace features may undergo basal erosion along their margins at streambed drawdown, they are largely geomorphically inactive at streambed drawdown. Drawdown terraces area exclusively mapped within the reservoir floor and main channel domains.
-
• Drawdown terraces are formed by migration and subsequent incisions of fluvial channels in response to reduction in local base level during streambed drawdown events, and similar processes creating cut terraces. While Fall Creek and Winberry Creek appear to flow in approximately the same location as their pre-inundation channels, the presence of drawdown terraces indicate that the two main creeks and other smaller tributaries have migrated laterally across the reservoir floor prior to cutting into the former streambed elevation. Drawdown terraces within this mapping framework may also be formed as reservoir floor is incised through by drawdown channels stranding a part of the reservoir floor between the channels.
-
• Drawdown terraces are created through erosional processes as result of drawdown operations. When these features are formed through later migration and subsequent incision, they are likely a source of fine-grained sediment during one or multiple drawdown events. Because these features are mostly composed of finer sediments (92 percent mapped as the sand and (or) mud substrate category), there is a potential for these features to erode through later migration or slumping during future streambed drawdown events.
Fan
-
• Fans are minor reservoir features that generally coincide with the locations of abrupt decreases in slope resulting in streamflow deceleration and subsequent deposition of sediment and detritus, forming a fan shape. Most fans within Fall Creek Lake consist of alluvial fans; although, floodplain splay deposits from tributary and drawdown channels are also included in this mapping unit, as are debris fans or cones from debris flows.
-
• Fan landforms were defined by their characteristic morphology comprised of a low-gradient deposit of sediment and detritus. Fans most often occur at a break in slope along a tributary or drawdown channel, sometimes at the confluence with the main Fall Creek channel. Most mapped features are on the scale of a single lobe of sediment (and relatively small, averaging about 400 m2), but some fan landform features have multiple lobes.
-
• Alluvial fans form as sediment and other material is deposit at a break in slope along a channel where velocity is reduced. Debris flow fans are created during episodic events of concentrated sediment flows that are commonly initiated beyond the reservoir mapping margins and can coincide with alluvial fans. Floodplain splays are lateral floodplain deposits from flows that breach an adjacent levee along a channel.
-
• Overall, most mapped fans in the Fall Creek Lake are a very small potential source of sediment significant to the streambed drawdowns because they cover a small spatial extent.
Landslide
-
• A single landslide feature is mapped (about 7,480 m2) on the north shore of Fall Creek Lake. The head scarp of this slide is beyond the boundaries of the reservoir, but the runout appears to have reached the main channel of Fall Creek based on the landslide toe position.
-
• The landslide outline was primarily defined by morphology visible from various renderings of slope and hill shade images derived from the 2016 DSM. Tension cracks in the ground were observed during 2016 field visits and are visible in the 2016 orthophotograph, which helped to define the feature. However, placement of the linework along lateral failure and runout areas has a high uncertainty. The head scarp beyond the 830 ft elevation reservoir mapping boundary is not mapped.
-
• Landslides into reservoirs appear to be relatively common (for example, Stratton and Grant, 2019) and can be the cause of major influxes of terrestrial sediment into the reservoir basin (Schuster, 1979). Mass wasting is one mechanism by which fine and coarse sediment may be deliver to the lower reservoir reaches.
-
• Based on the absence of vegetation, the head scarp of the slide into Fall Creek Lake appears to be recently active. Additionally, anecdotal mention of failure (employee of Sky Camp; oral commun., November 2016), the presence of tension cracks observed during 2016 field visits, and volumetric change analyses between the 2012 lidar and 2016 photogrammetrically derived elevation datasets suggest recent movement. Sediment from past landslide movement and potential future failures could supply sediment that gets mobilized downstream from the dam during streambed drawdown operations.
Cut
-
• Landforms mapped as cut are areas where the topography has been affected by the human removal of material (primarily for borrow material). Many of these landforms are topographically lower than adjacent topography and mantled with a thin layer of sediment. Cut landforms commonly form pond or channel-like features at lowered lake levels.
Fill
-
• Landforms mapped as fill are areas where the reservoir topography has been purposely changed by the addition of material and are often associated with pre-dam infrastructure (for example, roads). Many of these fill areas are now mantled with sediment, but the underlying morphology of the fill landform itself is still clearly visible (for example, road embankment). Fill landforms may include piles of blocky material (mostly in the lower reservoir, where piles are probably associated with dam construction), as well as filled road grades and pre-impoundment pond embankments.
Substrate
Substrate is the surficial grain-size grouping or material of a feature, as identified in orthophotograph (resolution of 4.18 centimeters [cm]/pixel). Substrate categories are generalized, not systematically field-verified, and based almost solely on appearance (texture and color) in orthophotograph. Outside the boundary of the orthophotograph, several substrate types are unknown and mapped as such; although, mapped landforms with partial coverage by the 2016 orthophotograph were classified as the visible substrate, and some areas with no orthophotograph coverage were classified from field observations.
Bedrock
Bedrock may have jagged or blocky appearance in both DSMs and orthophotographs, contrasting with the smooth texture of alluvial landforms. Bedrock may also appear lighter in color than sand and finer deposits and hillslope but is more similar in color to gravel deposits.
Gravel
Gravel areas consist of coarse sediment patches comprised of clasts that are predominantly coarser than sand. Typically, these areas are confined to the main channel within the reservoir and have a lighter grayish and rougher textured appearance than finer (brown and smooth surfaces) sediments.
Sand and (or) Gravel
Areas with a mix of coarse gravel- and (or) sand-sized sediment with a grayish to brownish appearance with slightly smoother surfaces than the gravel substrate category.
Sand and (or) Mud
The sand and (or) mud category consists of patches of fine-grained sediment that are predominantly comprised of sand, silt, and mud with overall grain size generally less than 2 millimeters (mm). Sand and (or) mud substrate covers most low relief landforms in the lower reservoir and has a slightly browner color and smoother appearance than the coarser gravel (greater than 2 mm) substrate.
Infrastructure
Substrate labeled as infrastructure includes features such as pre-dam roads or home foundations and maintained boat ramps and Fall Creek Dam. Several of these features are mantled by sediment so they are sometimes mapped from a combination of orthophotograph and DSM and are delineated more on the shape or morphology of the landform. If sediment covering infrastructure is sufficiently thick that the underlying landform is identifiable but not clearly defined because of sediment deposition, then the landform is mapped as the appropriate sediment category for the overlying sediment (most commonly sand and (or) mud).
Variable and (or) Unknown
The variable and (or) unknown substrate classification is used for areas where the substrate is identifiable but too spatially variable (less than about 10 m2 by patch) to map as separate polygons and for areas where the substrate is unknown. Landforms where substrate was unknown are primarily outside the boundary of the 2016 orthophotograph; although, mapped landforms with partial coverage by the 2016 orthophotograph were classified as the visible substrate, and some areas with no orthophotograph coverage were classified from field observations. Within the wetted channel landform, substrate varies and is partially obscured by water depth or high turbidity, so this landform is mapped with even greater uncertainty and generalization.
Hillslope and (or) Pre-Impoundment Soil
Soil or sediments deposited prior to the impoundment by Fall Creek Dam are mapped with substrate type hillslope and (or) pre-impoundment soil. These include soils or regolith associated with former hillslopes along the reservoir margins and are often exposed wave erosion.
Area of Mapped Process Domains, Landforms, and Substrate as a Function of Key Operational Pool Elevations at Fall Creek Lake
Table 2.1.
Geomorphic mapping for the Fall Creek Lake, Oregon (Keith and Stratton Garvin, 2021), based on datasets from Keith and Mangano (2020). Mapped reservoir domain, landform, and substrate areas are summarized for key operational pool elevations including maximum pool (830 feet [ft], NGVD 29), minimum conservation pool (728 ft), Biological Opinion (BiOp) fish passage pool (714 ft), and increased sediment mobilization at 690 ft within about 10 ft of streambed drawdown (680 ft), as well as the main channel domain, which is not tied to a specific elevation.[Values are raw numbers in square meters from intersection of Fall Creek Lake pool elevations with geomorphic reservoir mapping [Keith and Stratton Garvin, 2021], not rounded to significant figures as presented in the text. Abbreviation: --, no data]
Table 2.2.
Geomorphic mapping for the Fall Creek Lake, Oregon, based on datasets from Keith and Mangano (2020).[Mapped reservoir landform area by substrate for the full mapping area. Values are raw numbers in square meters from intersection of Fall Creek Lake pool elevations with geomorphic reservoir mapping [Keith and Stratton Garvin, 2021], not rounded to significant figures as presented in the text.]
References Cited
Keith, M.K., and Mangano, J.F., 2020, Structure-from-motion datasets of Fall Creek Lake, Oregon, acquired during annual drawdown to streambed November 2016: U.S. Geological Survey data release, https://doi.org/10.5066/P9AYWU8Z.
Keith, M.K., and Stratton Garvin, L.E., 2021, Geomorphic mapping of Fall Creek Lake, Oregon, 2016: U.S. Geological Survey data release, accessed July 14, 2023, at https://doi.org/10.5066/P9YZSJJJ.
O’Connor, J.E., Mangano, J.F., Anderson, S.W., Wallick, J.R., Jones, K.L., and Keith, M.K., 2014, Geologic and physiographic controls on bed‐material yield, transport, and channel morphology for alluvial and bedrock rivers, western Oregon: Geological Society of America Bulletin, v. 126, no. 3–4, p. 377–397.
Watershed Sciences, Inc., 2012, Lidar remote sensing data collection Fall Creek: Portland, Oregon, prepared by Watershed Sciences, Inc., for David Smith and Associates, Portland, Oregon, digital data and report, 27 p., available from Oregon Department of Geology and Mineral Resources, accessed July 15, 2023, at https://www.oregongeology.org/lidar/.
Appendix 3. Fall Creek and Middle Fork Willamette River Geomorphic Mapping Summary Tables
Table 3.1.
Summary of mapped landform area from geomorphic mapping of Fall Creek and the Middle Fork Willamette River, Oregon, summarized by reaches developed for this study.[Values are raw values in square meter, which differ from reported text values are rounded to three significant digits. See appendix 2 and table D3 within this report for reach descriptions and mapping unit attributes, respectively. Repeat geomorphic mapping from Keith and Gordon [2019]. Abbreviation: TNC, The Nature Conservancy]
References Cited
Keith, M.K., and Gordon, G.W., 2019, Fall Creek and Middle Fork Willamette Geomorphic Mapping Geodatabase: U.S. Geological Survey data release, https://doi.org/10.5066/P9THIZD6.
Appendix 4. Outstanding Questions and Priority Monitoring to Evaluate Streambed Drawdown Responses at Fall Creek Lake, Fall Creek, and the Middle Fork Willamette River
Outstanding Questions Regarding Changes in Sediment and Morphology Related to Streambed-Drawdown Operations at Fall Creek Lake
Findings from this study provide insights regarding interactions among reservoir erosion, transport of reservoir sediment to river reaches downstream from the dam, and geomorphic responses of downstream reaches to the annual streambed drawdown operations at Fall Creek Dam. The findings also prompt a number of outstanding questions regarding future trajectories of geomorphic change in both the reservoir and downstream reaches and long-term, cumulative implications of the annual streambed drawdowns that may arise in the coming years or decades. Examples of outstanding questions that may warrant additional research or monitoring include the following:
-
• What is the annual sediment supply to the reservoir and how does variation in sediment supply potentially affect overall patterns of reservoir sedimentation? How might sediment supply to the reservoir change in future in response to variation in land use, climate, landslides, or forest fires or other influences? How might variation in sediment supply, reservoir sedimentation ultimately affect sediment erosion and export during future streambed drawdowns?
-
• Or alternatively, if sediment supply is unlikely to be impacted significantly by changes in land use, climate, landslides, or forest fires or other influences, will those changes impact streamflows that mobilize sediment within the Fall Creek Lake and downstream reaches? How will that impact geomorphology and habitats affected by streambed drawdown sediment?
-
• When might Fall Creek Lake achieve a quasi-equilibrium balance between sediment supply entering Fall Creek Lake from upstream sources and sediment existing the reservoir through streambed drawdowns? What is the best and most cost-efficient means to determine if this is occurring? What are the implications of this reservoir storage situation compared with other scenarios and which situation is optimal for achieving different management or ecological objectives? How can reservoir management and dam operations be used to achieve desired sediment balance situation?
-
• Will gravel in the main reservoir channels of Fall Creek Lake be mobilized to the lower reservoir either (1) aggrade or (2) be transported to reaches downstream from the dam?
-
• How might sediment transport in reaches downstream from Fall Creek Dam vary over time in response to future drawdowns? Will the total suspended-sediment loads remain similar or decrease?
-
• What are the conditions when suspended-sediment loads (SSL), turbidity, and dissolved oxygen (DO) might be harmful to aquatic life and how might these conditions be minimized?
-
• What is the decadal reach-scale response of continued annual streambed drawdown operations?
-
• How does fine-grained sediment (less than 2 mm) affect the main channel bed and substrate?
-
• Will increased sand supply from Fall Creek Lake streambed drawdown increase the overall coarse sediment mobility in reaches downstream from the dam?
-
• How is the vegetation-deposition feedback loop affecting sediment transport and sedimentation?
-
• Can streamflows be used to erode and flush out streambed drawdown deposits downstream from Fall Creek Dam where vegetation, particularly more shrubby and woody vegetation, has been established?
-
• Will sediment deposition in overbank areas of off-channel areas affect streamflow conveyance and flood hazards?
-
• Will there be a net loss of off-channel or low-velocity areas that impact habitat for aquatic species?
Priority Monitoring to Track Future Changes in Fall Creek Lake and Downstream Reaches
Future monitoring in Fall Creek Lake and downstream reaches could be prioritized to address outstanding questions related to geomorphic changes that could affect flood hazards, infrastructure, or floodplain habitats and could include status and trends monitoring to document changes in reservoir conditions, downstream sediment transport, or downstream channel morphology. Multiple temporal and spatial scales were used to track geomorphic responses to streambed drawdowns for this study, and future monitoring activities could be tailored to track long-term changes at the reach-scale and more frequent changes at the site-scale. Reach-scale geomorphic responses to streambed drawdowns from WY 2012 to 2018 were hard to detect on Fall Creek and the Middle Fork Willamette River due to the modest changes that occurred over the short time frames studied (2–3 year intervals), especially compared with historical conditions. If mapped over longer periods (for example, 10 or more years), reach-scale geomorphic changes may become more apparent or perhaps changing reservoir conditions and dam operations could translate to greater amounts of reservoir erosion and more prominent downstream impacts. Over the few streambed drawdowns evaluated for this study, geomorphic responses in reaches downstream from Fall Creek Dam were most substantial when observed locally at the site-scale (Chapter D. Geomorphic Responses to Fall Creek Lake Streambed Drawdowns Downstream from Fall Creek Dam). Drawing upon the methods used in this study, as well as those from dam removal studies, future monitoring could focus on longer-term monitoring at repeat sites along Fall Creek and Middle Fork Willamette River within areas reflecting different geomorphic processes affected by the streambed drawdown operation: (1) reservoir sedimentation and erosion, (2) sediment delivery to downstream reaches, including magnitude and temporal pattern of sediment transport, and (3) geomorphic responses of downstream reaches to sediment delivery. Optimal monitoring would likely entail multiple approaches tailored to specific management questions and concerns that balance the frequency and resolution of data collection and analyses with research priorities.
Priority Monitoring to Track Reservoir Sedimentation and Erosion within Fall Creek Lake
Ground-Based Photographs
Repeat ground-based photography can be used to monitor reservoir changes and inform management of multiple aspects such as sediment, flood storage, cultural resources, natural hazards, and habitats. One of the simplest and cheapest monitoring approaches is to collect repeat ground-based photographs from positions on the dam and reservoir hillslopes. Ideally, photographs would be taken from fixed, time-lapse cameras similar to others used to monitor dam removal (for example, Major and others, 2012). The protocols and considerations for repeat ground-based photographs are well established (Ciannella and others, 2021; Keith and others, 2022, see chapter C) and could include installation of several fixed cameras to encompass key areas of the reservoir. The ground-based images are useful for qualitative assessments, or if coupled with sufficient ground survey data, they can be used to create digital elevation or surface models useful for quantifying erosion and deposition. Ground-based photographs taken at frequent intervals (for example, hourly during a short streambed drawdown) could supplement less frequent photographic or topographic survey approaches encompassing the entire reservoir.
Photographic and Topographic Surveys
Reservoir surveys collected multiple times during a single drawdown or collected several years apart would enable quantification areas of erosion and deposition and support analyses of reservoir evolution. Repeat mapping of reservoir topography is also useful for documenting changes in the magnitude and location of drawdown related erosion, identifying areas that are continuing to accrue sediment during higher pool levels, and linking these sedimentation patterns to dam operations to better anticipate future trajectory of erosion. Because Fall Creek Lake is completely drained on an annual basis, high-resolution, reservoir-wide photographic or topographic surveys can be readily acquired using various methods. Aerial photographs, satellite imagery, light detection and ranging (lidar), or surveys collected remotely are useful for efficiently mapping the entire reservoir area at a single period, optimally when the Fall Creek Lake is empty, or nearly empty, whereas ground-based surveys are not typically feasible in the lower reservoir because thick sediment deposits that may entrap and pose a hazard to surveyors. For Fall Creek Lake, surveys used in this study (Chapter B. Reservoir Morphology and Evolution Related to Dam Operations at Fall Creek Lake; Keith and Mangano, 2020) collected by a piloted aircraft, with camera affixed to the wing proved to be more cost and time efficient covering a larger portion of the reservoir than unoccupied aerial systems (UAS) that resulted in similar resolutions. However, if surveys are only needed for small areas of the reservoir, UAS may be more appropriate, especially if rapidly changing conditions due to reservoir sedimentation or erosion are occurring. Lidar surveys ideally would be acquired with high-resolution imagery so that detailed maps of reservoir morphology, sediment grain sizes, and other in-reservoir features (such as bedrock or relict infrastructure) could be mapped. Readily available satellite imagery may also be available, though at typically lower spatial resolutions than collected with UAS or lidar.
These approaches would also be useful within the exposed areas at other large flood-control reservoirs; however, other approaches would be necessary to acquired data below areas still covered by water. At reservoirs with large residual pools or where drawdowns have been proposed but the lake has not yet been drained, a combination of topographic and bathymetric surveys would be required. At other WVP reservoirs where drawdowns are considered, it would be useful to establish baseline maps of reservoir morphology and the distribution of gravel, sand, and bedrock longitudinally and laterally throughout the reservoirs, to provide a basis for comparing changes that may result from future drawdowns. At those reservoirs it might be most efficient to collect high-resolution imagery at the lowest pool levels initially (for example, during winter when reservoirs are lowered for flood control) and again periodically depending on drawdown length, timing, frequency, streamflow rates, among other considerations.
Priority Monitoring to Evaluate Sediment Transport Downstream from Fall Creek Dam
Turbidity Monitoring with Suspended-Sediment Measurements
Continuous turbidity monitoring paired with suspended-sediment measurements immediately downstream from Fall Creek Dam was an effective tool in WY 2012–18 for quantifying the amount and timing of sediment released from Fall Creek Lake streambed drawdown operations; however, the ability to evaluate annual or longer-term trends and to compare results across different types of drawdown conditions or years was limited due to the variable periods monitored each year. When coupled with continuous streamflow measurements from the Fall Creek streamgage, a year-round, continuous sediment monitoring program, building from previous shorter-term deployments, is probably one of the highest priority monitoring activities that could be employed in the future as this was useful for understanding geomorphic evolution of both the reservoir and downstream reaches. The most basic sediment monitoring program would entail year-round turbidity monitoring, which could provide information about the timing and general patterns of sediment transport based on water clarity, thereby providing an indication of the timing and quantity of material in suspension in the water column. This indication could then be linked to dam operations and streamflows; however, turbidity alone as a surrogate for sediment transport, in the absence of ongoing, targeted sediment sample collection, is not entirely valid (Rasmussen and others, 2009). As was done during individual monitoring periods from WY 2013 through 2018 (Schenk and Bragg, 2014) by collecting a sufficient number of suspended-sediment samples across a range of conditions, suspended-sediment concentrations can be regressed against turbidity, enabling real-time computation of suspended-sediment concentrations and loads. The suspended-sediment samples could also be analyzed to assess the grain sizes of sediment exported from the reservoir, as was done previously, which when compared with similar data from outside the drawdown periods could help better assess sediment sources. Although it would provide less complete data for year-to-year comparisons and long-term trends, a streamlined sediment monitoring program could continue to focus on the period just prior to the streambed drawdown and extend for high streamflow months following the drawdown until streamflows diminish in spring as was done previously. Although more costly, year-round monitoring would likely provide a more complete representation of sediment transport patterns and better understanding of the forces and mechanisms contributing to them. At other WVP reservoirs where drawdowns might be considered, turbidity and suspended-sediment monitoring (as opposed to bedload monitoring) to characterize baseline, non-drawdown and drawdown conditions would also be a critically important monitoring activity, especially given that most other WVP reservoirs cannot fully lower pool levels to streambed at the dam site, and residual reservoir pools will likely capture coarser sands and gravel.
Priority Monitoring to Track Future Geomorphic Changes Downstream from Fall Creek Dam
Characterization of Bed-Material Sediment and Infiltration
Characterizing changes in the streambed would be useful for determining long-term trends toward fining or coarsening of sediment downstream that might be related to changes in sediment supply from streambed drawdowns at Fall Creek Dam. In addition, these analyses could also be used to better understand changes in the transport capacity related to environmental streamflow management. Sediment characterization could be completed with more traditional particle counts as described in study (Chapter D. Geomorphic Responses to Fall Creek Lake Streambed Drawdowns Downstream from Fall Creek Dam) or with other approaches like facies mapping (for example, Buffington and Montgomery, 1999) or ground-based photography and photogrammetric analyses (for example, Vázquez-Tarrío and others, 2017). Annual or bi-annual measurements at a subset of sites along Fall Creek and the Middle Fork Willamette River could provide information on changing grain size and sediment transport related to streambed drawdowns, as well as possibly be informative of other dam operations and streamflow events like environmental streamflow operations from Dexter and Lookout Point Dams.
Streambed drawdown sediment supplied from Fall Creek Lake has temporarily aggraded the main channel for short periods during the period of WY 2012–18, but over the course of a few weeks or months, most of this reservoir sediment passes through the main channel of Fall Creek. Although much of the fine-grained sediment appears to be evacuated from Fall Creek, some unknown portion may infiltrate the coarser channel bed substrate, potentially affecting aquatic habits, or it may affect patterns of bed-material mobility. Infiltration of fine-grained sediment into the channel bed has been documented downstream from other drawdown operations (Anderson, 2007). In general, substrate infiltration of fines could have impacts on salmon spawning redds, mussel beds, or other macroinvertebrates and primary producers (Wood and Armitage, 1997), though the distribution of these habitats and their sensitivity to sand and finer sediment deposition likely varies spatially and seasonally in the reaches downstream from Fall Creek Dam. Various approaches could be used to better understand the degree to which fine-grained sediment has infiltrated bed sediments including subsurface sediment traps and infiltration buckets (Anderson, 2007), coring techniques (Evans and Wilcox, 2014), or comparison of surface and bulk subsurface samples (for example, Curtis and others, 2021). Such sediment investigations could be coupled with water-quality monitoring (for example, temperature or inter-gravel dissolved oxygen) to gain deeper understanding of habitat responses to sediment releases. Additionally, laboratory studies have shown that episodic pulses of relatively finer-grained sediment into a coarser-grained river channel can increase the mobility of the overall riverbed by decreasing bed roughness, thereby increasing velocity near the bed and mobilizing coarser particles (Venditti and others, 2010; Curran and Wilcock, 2005).
Reach-Scale Geomorphic Mapping from Aerial Photography
While the observed reach-scale changes in channel morphology from streambed drawdown operations appear to be small in most reaches downstream from Fall Creek Dam (from aerial photograph analyses that extend through WY 2016), it is possible notable changes could take years to manifest at the reach scale (for example, see explanation of the “rate law” in Graf, 1977). Additionally, if any major changes in drawdown operations or other reservoir conditions occur, downstream responses may also shift in pattern and magnitude. Decadal-scale responses might be relevant to societal concerns like channel migration zones (CMZ) or habitat. Repeat aerial photograph mapping along Fall Creek and the Middle Fork Willamette River (including the reaches downstream from Dexter Dam) at the decadal scale could be used to assess increases or decreases in habitat and assess any potential channel migration. Mapping would also help inform evolution of the channel as newly vegetated areas mature and capture more sediment, perhaps triggering lateral or vertical changes that may be important to streamflow capacity in the channel.
Site-Scale Monitoring at Key Areas of Special Concern
Reach-scale responses related to streambed drawdowns at Fall Creek Lake may be small or not apparent on an annual timescale along Fall Creek and the Middle Fork Willamette River. However, findings from this study highlight the magnitude of local changes (scale of a bar or alcove, for example) that might be observed at the annual, seasonal, or streamflow-event time scale. Such changes could be important for specific species or habitat concerns. Repeat observations or measurements at key sites could use one or some combination of the following approaches: clay-horizon markers, photographs at a few sites, stratigraphic analyses, vegetation plot monitoring. These monitoring approaches are typically easy to implement and cost-efficient while providing useful information, and the distribution of sites and frequency of measurements can be tailored to answer more specific questions about site-scale evolution. For example, clay-horizon markers could be implemented at a subset of sites of key sites downstream from Fall Creek Dam to address questions regarding deposition on bars and low-elevation floodplain surfaces. Alternatively, or in addition, repeat acquisition of ground-based photographs could be used to document the seasonal sedimentation and vegetation responses at important habitat locations; photographs could be taken periodically on an equal-time interval schedule supplemented with photograph acquisition following “trigger” events that might be defined by some discharge-related threshold.
Topographic and Bathymetric Surveys at the Site- to Reach-Scale
Analyses of repeat topography, such as from lidar, topo-bathymetric lidar, ground-based surveys, structure-from-motion approaches, sonar, or other sources, can be informative at the reach and site-scales. Similar to geomorphic mapping from aerial photography, these datasets could be mapped to track reach-scale changes in key landforms or directly compared to understand the reach-scale to site-scale magnitudes of channel changes. Repeat analyses of bathymetric data (such as from bathymetric lidar or sonar) include the added benefit of providing changes below water surfaces, where acquisition techniques are suitable. Frequency of new data collection and frequency of analyses could reflect the questions of scale and appropriate techniques relative to acquisitions and processing costs. For example, questions regarding reach-scale aggradation or degradation within a reach of the lower Middle Fork Willamette River may be better addressed at the decadal time scale from costlier topo-bathymetric lidar and (or) single-beam sonar versus questions regarding vertical and lateral changes within a small alcove on Fall Creek might be better addressed with lower cost ground-based measurements or unoccupied aerial systems and structure-from-motion (UAS–SfM) approaches covering a small area every 2–5 years. Longitudinal surveys of channel-bed elevations could be carried out at the decadal scale and compared to existing topo-bathymetric lidar from 2015.
Two-Dimensional Hydraulic and Sediment Transport Modeling
Though not strictly a monitoring activity, two-dimensional hydraulic modeling can be used to show how changes in channel morphology and sediment deposition and vegetation encroachment may influence inundation patterns, water surface elevations, and ultimately flood hazards for residents of Fall Creek and Middle Fork Willamette River below Fall Creek Dam. These detailed hydraulic models could be coupled with sediment transport modeling to inform sediment management in Fall Creek and potentially inform the development of dam operations and “flushing streamflows” that could move reservoir sediments through downstream reaches while minimizing local deposition. The sediment transport modeling would also be useful to assess different future trajectories that might result from various sediment export scenarios from the reservoir and understand potential thresholds for deposition in low-velocity areas at different streamflows. Overlaying modeled depositional areas with habitat data, such as from Oregon chub reports (Oregonichthys crameri; Bangs and others, 2011–2014, 2016; Bangs and Meeuwig, 2017) or other habitat mapping could be used to prioritize sites for other monitoring activities or maintenance, such as mechanical removal of sediment. Hydraulic models could be updated at decadal scales as new topographic and bathymetric data become available to evaluate potential changes in flood profiles and impacts to local landowners.
References Cited
Anderson, C.W., 2007, Influence of Cougar Reservoir drawdown on sediment and DDT transport and deposition in the McKenzie River Basin, Oregon, water years 2002–04: U.S. Geological Survey Scientific Investigations Report 2007–5164, 42 p., accessed August 24, 2023, at https://pubs.er.usgs.gov/publication/sir20075164.
Curran, J.C., and Wilcock, P.R., 2005, Effect of sand supply on transport rates in a gravel bed river: Journal of Hydraulic Engineering, v. 131, no. 11, accessed August 24, 2023, https://doi.org/10.1061/(ASCE)0733-9429(2005)131:11(961).
Curtis, J., Poitras, T., Bond, S., and Byrd, K., 2021, Sediment mobility and river corridor assessment for a 140-kilometer segment of the main-stem Klamath River below Iron Gate Dam, California: U.S. Geological Survey Open-File Report 2020–1141, 38 p., accessed July 27, 2022, at https://doi.org/10.3133/ofr20201141.
Keith, M.K., and Mangano, J.F., 2020, Structure-from-motion datasets of Fall Creek Lake, Oregon, acquired during annual drawdown to streambed November 2016: U.S. Geological Survey data release, accessed October 13, 2021, at https://doi.org/10.5066/P9AYWU8Z.
Keith, M.K., Wallick, J.R., Flitcroft, R.L., Kock, T.J., Brown, L.A., Miller, R., Hagar, J.C., Guillozet, K., and Jones, K.L., 2022, Monitoring framework to evaluate effectiveness of aquatic and floodplain habitat restoration activities for native fish along the Willamette River, northwestern Oregon: U.S. Geological Survey Open-File Report 2022–1037, 116 p., accessed July 14, 2023, at https://doi.org/10.3133/ofr20221037.
Major, J.J., O’Connor, J.E., Podolak, C.J., Keith, M.K., Grant, G.E., Spicer, K.R., Pittman, S., Bragg, H.M., Wallick, J.R., Tanner, D.Q., Rhode, A., and Wilcock, P.R., 2012, Geomorphic response of the Sandy River, Oregon, to removal of Marmot Dam: U.S. Geological Survey Professional Paper 1792, 64 p.
Vázquez-Tarrío, D., Borgniet, L., Liébault, R., and Recking, A., 2017, Using UAS optical imagery and SfM photogrammetry to characterize the surface grain size of gravel bars in a braided river (Vénéon River, French Alps): Geomorphology, v. 285, p. 94–105, accessed October 13, 2021, at https://doi.org/10.1016/j.geomorph.2017.01.039.
Venditti, J.G., Dietrich, W.E., Nelson, P.A., Wydzga, M.A., Fadde, J., and Sklar, L., 2010, Effect of sediment pulse grain size on sediment transport rates and bed mobility in gravel bed rivers: Journal of Geophysical Research, v. 115, 19 p., accessed August 24, 2023, at https://doi.org/10.1029/2009JF001418.
Conversion Factors
International System of Units to U.S. customary units
Temperature in degrees Celsius (°C) may be converted to degrees Fahrenheit (°F) as °F = (1.8 × °C) + 32.
Temperature in degrees Fahrenheit (°F) may be converted to degrees Celsius (°C) as °C = (°F – 32) / 1.8.
Datums
Vertical coordinate information is primarily referenced to the National Geodetic Vertical Datum of 1929 (NGVD 29) because the U.S. Army Corps of Engineers dam operations at Fall Creek Lake reference that datum. We also include some references to North American Vertical Datum of 1988 (NAVD 88), and those are noted where presented.
Horizontal coordinate information is referenced to the North American Datum of 1983 (NAD 83).
Elevation, as used in this report, refers to distance above the vertical datum. Altitude, as used in this report, refers to distance above the local ground level.
Abbreviations
DEM
digital elevation model
DSM
digital surface model
ESA
Endangered Species Act
fpkm
floodplain kilometer
GCD
Geomorphic Change Detection
GIS
geographic information system
GPS
Global Positioning System
lidar
light detecting and ranging
OAS
occupied aerial systems
rkm
river kilometer
RMSE
root mean square error
RPA
Reasonable and Prudent Action
RTK-GPS
real-time kinematic
SfM
structure from motion
SSC
suspended-sediment concentration
SSL
suspended-sediment load
TNC
The Nature Conservancy
UAS
unoccupied aerial systems
USACE
U.S. Army Corps of Engineers
USGS
U.S. Geological Survey
WVP
Willamette Valley Project
WY
water year (begins October 1 and ends September 30)
For more information about the research in this report, contact the
Director, Oregon Water Science Center
U.S. Geological Survey
601 SW 2nd Avenue, Suite 1950
Portland, OR 97204
https://www.usgs.gov/centers/oregon-water-science-center
Manuscript approved on December 11, 2023
Publishing support provided by the U.S. Geological Survey
Science Publishing Network, Tacoma Publishing Service Center
Edited by Jeff Suwak and Vanessa Ball
Illustration support by Joseph F. Mangano
Layout and figures by Luis E. Menoyo
Disclaimers
Any use of trade, firm, or product names is for descriptive purposes only and does not imply endorsement by the U.S. Government.
Although this information product, for the most part, is in the public domain, it also may contain copyrighted materials as noted in the text. Permission to reproduce copyrighted items must be secured from the copyright owner.
Suggested Citation
Keith, M.K., Wallick, J.R., Schenk, L.N., Stratton Garvin, L.E., Gordon, G.W., and Bragg, H.M., 2024, Reservoir evolution, downstream sediment transport, downstream channel change, and synthesis of geomorphic responses of Fall Creek and Middle Fork Willamette River to water years 2012–18 streambed drawdowns at Fall Creek Lake, Oregon: U.S. Geological Survey Scientific Investigations Report 2023–5135, 155 p., https://doi.org/10.3133/sir20235135.
ISSN: 2328-0328 (online)
Study Area
| Publication type | Report |
|---|---|
| Publication Subtype | USGS Numbered Series |
| Title | Reservoir evolution, downstream sediment transport, downstream channel change, and synthesis of geomorphic responses of Fall Creek and Middle Fork Willamette River to water years 2012–18 streambed drawdowns at Fall Creek Lake, Oregon |
| Series title | Scientific Investigations Report |
| Series number | 2023-5135 |
| DOI | 10.3133/sir20235135 |
| Publication Date | May 17, 2024 |
| Year Published | 2024 |
| Language | English |
| Publisher | U.S. Geological Survey |
| Publisher location | Reston, VA |
| Contributing office(s) | Oregon Water Science Center |
| Description | Report: xiv, 155 p.; 4 Data Releases |
| Country | United States |
| State | Oregon |
| Online Only (Y/N) | Y |