

Water-Quality Characteristics of the Red River of the North and Tributaries in the Fargo-Moorhead Metropolitan Area, North Dakota, 2019–22
Links
- Document: Report (5.3 MB pdf) , HTML , XML
- Dataset: USGS National Water Information System database —USGS water data for the Nation
- Data Release: USGS data release - Data and scripts used in water-quality characteristics of the Red River of the North and tributaries in the Fargo-Moorhead metropolitan area, North Dakota 2019–22
- NGMDB Index Page: National Geologic Map Database Index Page (html)
- Download citation as: RIS | Dublin Core
Abstract
The Flood Risk Management Project was initiated in 2008 in the Fargo-Moorhead metropolitan area to reduce flood risk, flood damages, and flood protection costs in the Fargo-Moorhead metropolitan area. In cooperation with the U.S. Army Corps of Engineers, the U.S. Geological Survey initiated a water-quality monitoring study to describe the water-quality characteristics of the Red River of the North and its tributaries in the Fargo-Moorhead metropolitan area during the preconstruction period of the Flood Risk Management Project from October 1, 2019, to October 1, 2022. The monitoring study included the collection of discrete and continuous water-quality data and streamflow monitoring at selected sites that integrated and enhanced existing monitoring programs within the study area.
Discrete samples collected at 10 sites in the Fargo-Moorhead metropolitan area were analyzed for major ions, trace elements, nutrients, suspended sediment, pesticides, and fecal indicator bacteria. In general, major ion concentrations were higher at sites on the tributaries (Wild Rice, Sheyenne, and Maple Rivers) compared to sites on the Red River of the North. In general, bicarbonate, calcium, magnesium, and sulfate represented most of the dissolved ions measured in samples collected at the 10 sites. Calcium, chloride, fluoride, potassium, silica, and sodium were also measured in samples, but they represented a smaller portion of the total dissolved ions. Sulfate was the most dominant dissolved ion that had the highest concentrations among the major ions measured in samples.
A total of 18 trace elements were analyzed in discrete samples. Several of the trace elements had concentrations below the laboratory reporting level in all of the samples, including antimony, beryllium, cadmium, chromium, silver, and thallium. Sites on the Wild Rice River generally had the highest concentrations of arsenic, barium, boron, manganese, and nickel compared to the other sites.
Nutrients analyzed in discrete samples included filtered and unfiltered concentrations of ammonia, nitrate plus nitrite, phosphorus, and organic carbon. The median filtered ammonia concentration at most sites was less than the laboratory reporting level of 0.03 milligram per liter as nitrogen except for the Sheyenne River at Harwood, North Dakota (U.S. Geological Survey [USGS] station 05060400), and Red River of the North near Georgetown, Minnesota (USGS station 05062130). The lowest median unfiltered nitrate plus nitrite concentration was measured at sites on the Red River of the North upstream from the Fargo-Moorhead metropolitan area and the highest median was at sites on the Red River of the North downstream from the Fargo-Moorhead metropolitan area compared to all other sites. The increase in nitrate plus nitrite concentrations could reflect the effect of the wastewater-treatment plant discharge that enters the Red River of the North upstream from the site located downstream from the Fargo-Moorhead metropolitan area and from urban runoff. Phosphorus (unfiltered) concentrations were generally higher at sites on the Maple and Sheyenne Rivers compared to the other sites and were higher at sites on the Red River of the North downstream from the Fargo-Moorhead metropolitan area compared to sites upstream on the Red River of the North.
Suspended-sediment concentrations were generally highest at sites in the Sheyenne River and lowest in the upstream Red River of the North sites. Suspended-sediment concentration was highly variable in samples collected at the 10 sites, mostly influenced by the occurrence of snowmelt and rainfall-runoff events. The Sheyenne River near Kindred, N. Dak. (USGS station 05059000) had the largest range in sediment concentrations in samples collected at the 10 sites. For all sites other than the Sheyenne River near Kindred, N. Dak., 95 percent or more of the suspended sediment had particle diameter sizes less than 0.0625 millimeter in 50 percent of the samples (median).
Of the 102 pesticides and pesticide degradates analyzed, 45 constituents had no detectable concentrations in any of the 17 samples collected at five sites. The remaining 57 pesticides had at least one detection in the samples collected at the five sites. The sites on the Wild Rice River (near Abercrombie, N. Dak., USGS station 05053000, and near St. Benedict, N. Dak., USGS station 05053500) and Sheyenne River near Kindred, N. Dak., had fewer pesticide detections compared to the Maple River below Mapleton, N.Dak. (USGS station 05060100) and the Red River of the North at Fargo, N. Dak (USGS station 05054000) and near Georgetown, Minn.
Patterns in annual loads generally followed the same pattern as streamflow at the 10 sites for water years 2020–22. A water year is the 12-month period from October 1 to September 30 and is designated by the calendar year in which it ends. The greatest loads for all constituents were delivered at the two downstream sites on the Red River of the North; sites that also had the highest annual streamflows among the sites and the greatest loads were delivered in water year 2020 when the highest streamflows occurred at the sites. Likewise, the least loads for most constituents were at the Maple River and were least in 2021 compared to the other years because of low-streamflow conditions.
Water-quality measurements continuously recorded at the Red River of the North at Hickson, N. Dak. (USGS station 05051522); Red River of the North at Fargo, N. Dak.; and Red River of the North near Georgetown, Minn. included water temperature, specific conductance, dissolved oxygen, pH, and turbidity. Specific conductance values were similar for the Red River of the North near Hickson, N. Dak., and Red River of the North at Fargo, N. Dak., when compared to the Red River of the North near Georgetown, Minn. that had higher values than the other two sites. Dissolved oxygen concentrations and pH were similar among the three sites on the Red River. The patterns in turbidity were mostly related to streamflow conditions and were similar among the three sites on the Red River of the North.
Introduction
Flooding is a common occurrence in the flat and wide valley of the Red River of the North (Red River), and residents of the Fargo-Moorhead metropolitan area (fig. 1) are accustomed to fighting floods. In the Fargo-Moorhead metropolitan area, the Red River has exceeded the National Weather Service flood stage of 18 feet in 55 of the past 121 years (1902 through 2022), and 27 of the past 30 years (1993 through 2022; U.S. Geological Survey, 2023). The Fargo-Moorhead metropolitan area typically floods during the spring in late March and early April when snowmelt occurs (Galloway and others, 2011). Flood-management activities in the Fargo-Moorhead metropolitan area such as sandbagging, levee systems, and the Sheyenne River diversion channel have reduced the effects of flooding. In the spring of 2009, during a historic crest of 40.8 feet, extreme emergency measures were used in the Fargo-Moorhead metropolitan area to narrowly avoid major flood damages (U.S. Army Corps of Engineers, 2011; U.S. Geological Survey, 2023). However, as the Fargo-Moorhead metropolitan area continues to grow, future average annual flood damages were estimated at more than $195 million if no additional actions for flood management were taken to reduce flooding (U.S. Army Corps of Engineers, 2011).
The Flood Risk Management Project (hereafter referred to as the “Project”) was initiated in 2008 in the Fargo-Moorhead metropolitan area to reduce flood risk, flood damages, and flood protection costs (Metro Flood Diversion Authority, 2023). The Project consists of an approximately 30-mile-long diversion channel; an upstream staging area; gated structures on the Wild Rice River, the Red River, and at the diversion channel inlet; a dam embankment; an overflow spillway; and aqueducts with overflow spillways into the diversion channel on the Sheyenne River and Maple River (fig. 1; Metro Flood Diversion Authority, 2023). The Project is led in partnership by the St. Paul District of the U.S. Army Corps of Engineers, the Metro Flood Diversion Authority, and the Cities of Fargo and Moorhead. Construction on components of the Project began in 2019, and completion is estimated by the spring of 2027 (Metro Flood Diversion Authority, 2023).
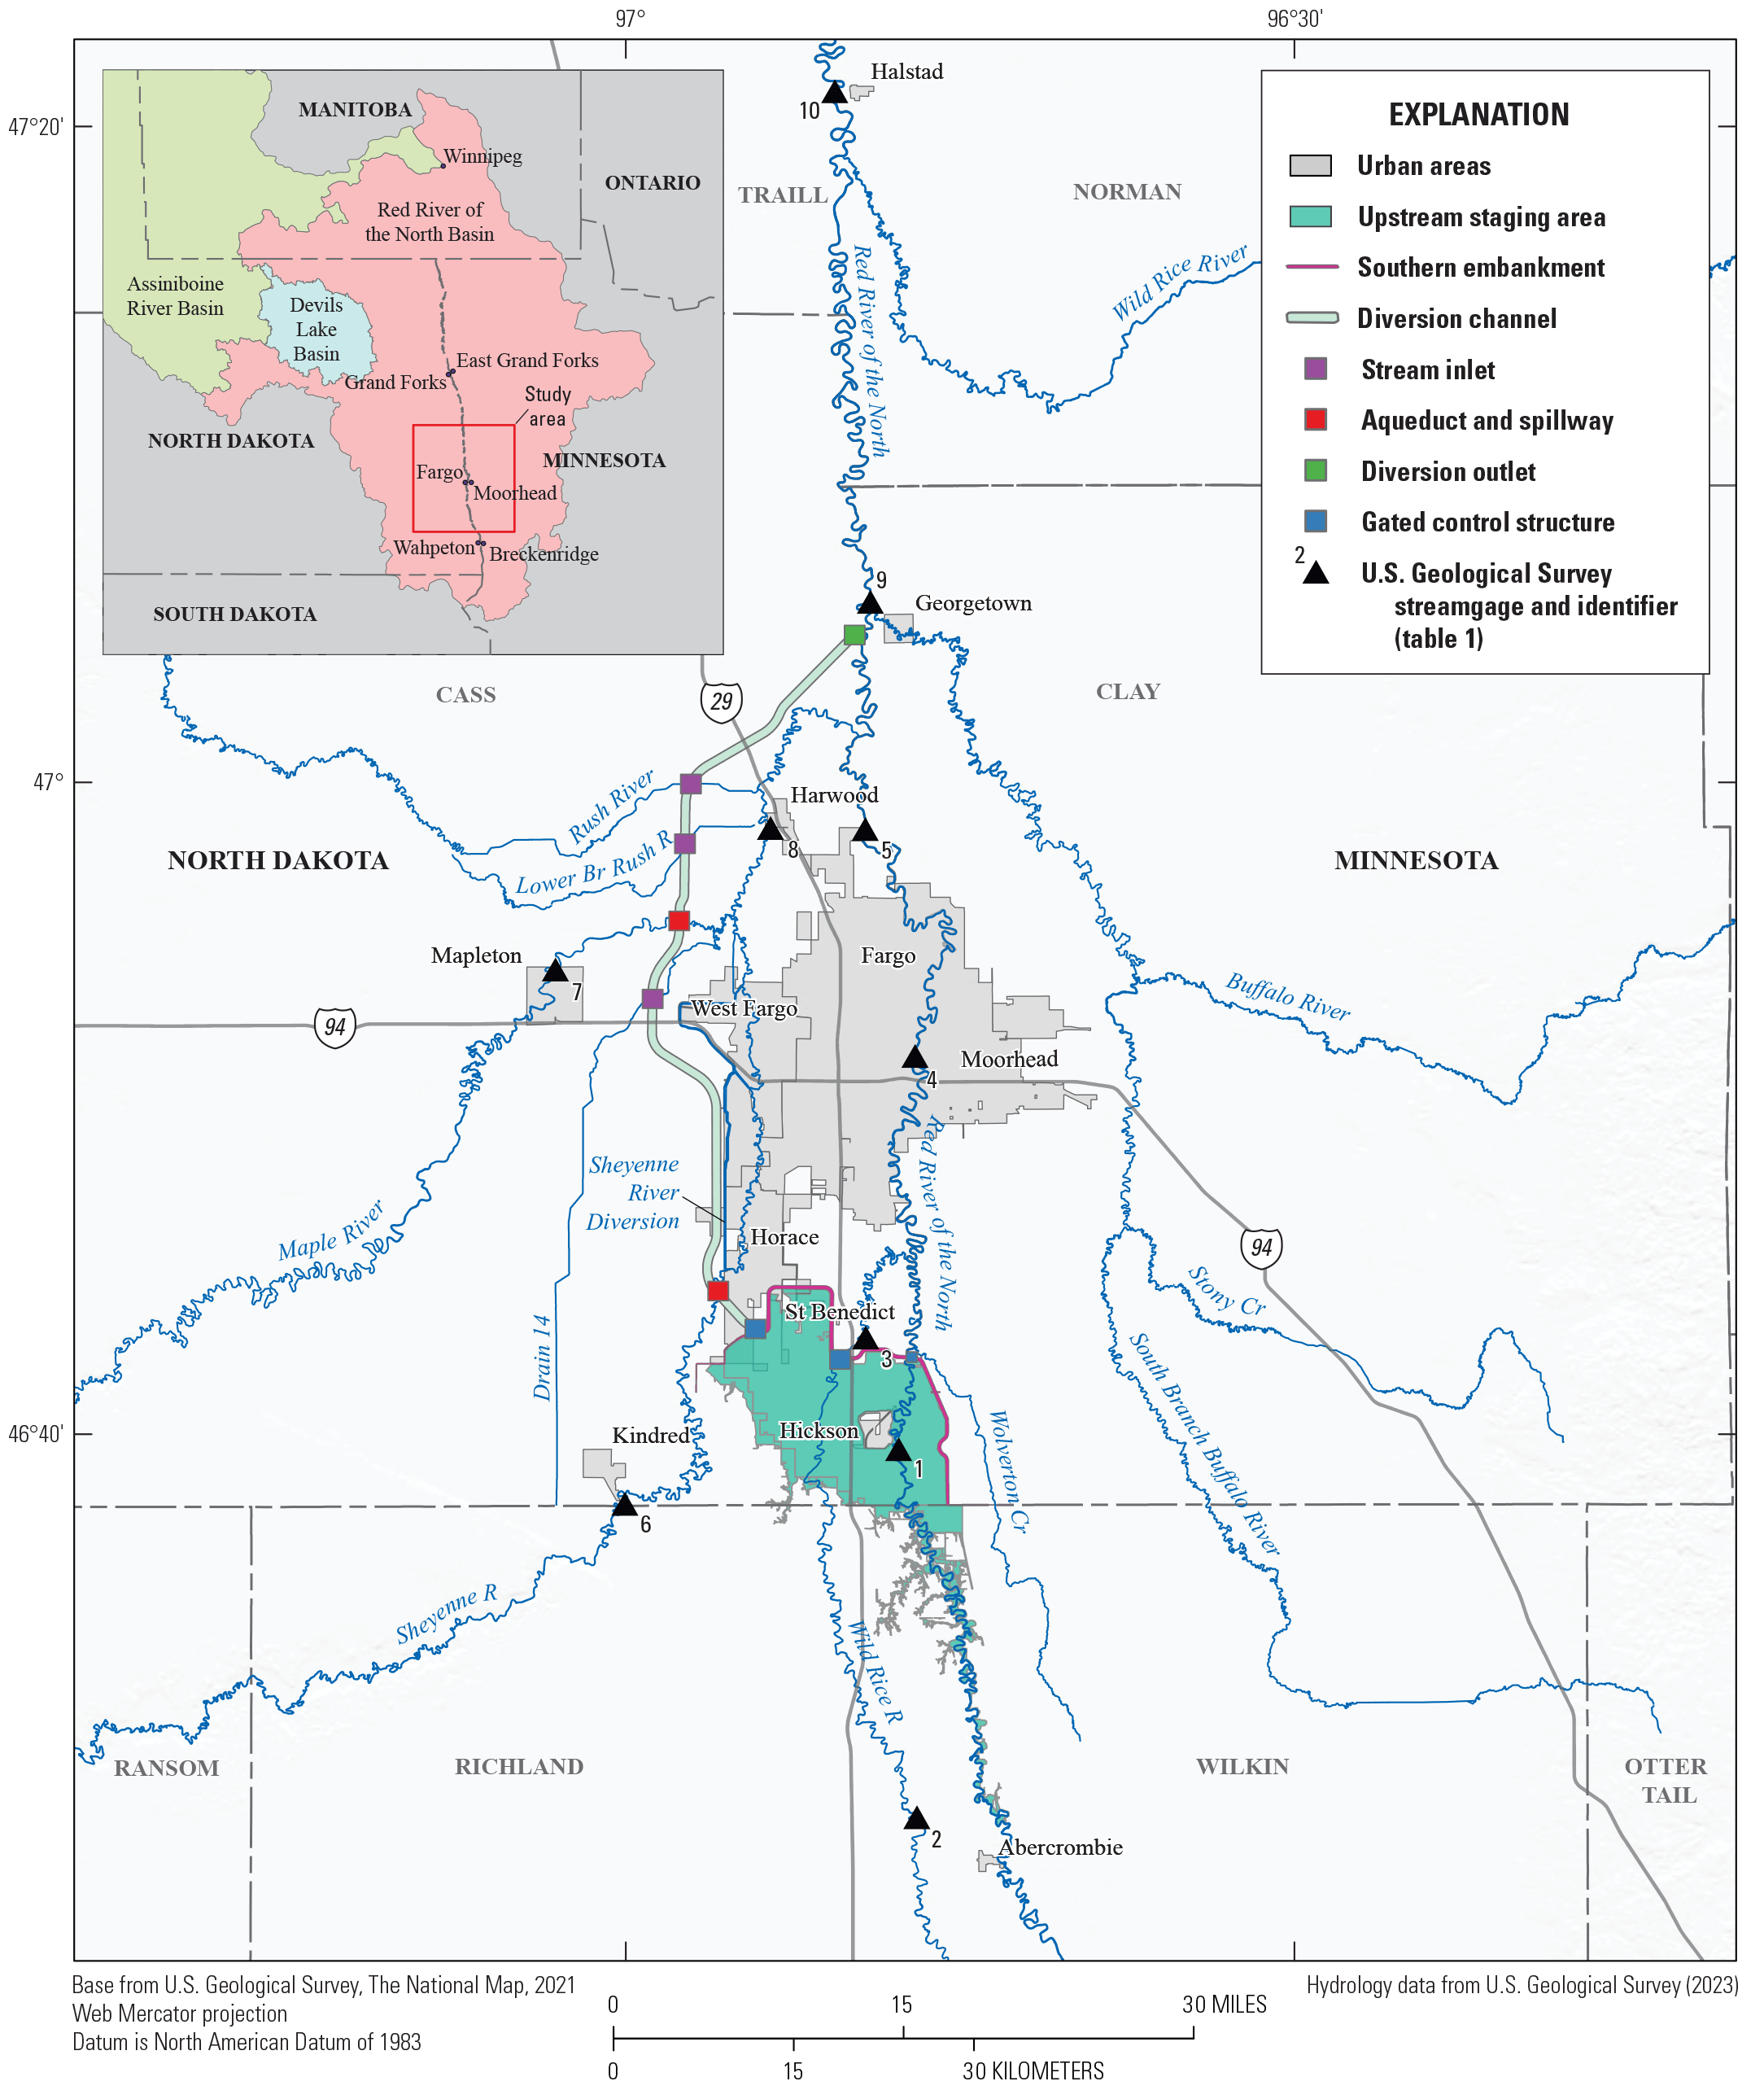
Location of selected sites in the Fargo-Moorhead metropolitan area.
Because of potential detrimental environmental effects from the construction and operations of the Project, an adaptive management and monitoring plan was recommended as part of the Final Feasibility Report and Environmental Impact Statement (U.S. Army Corps of Engineers, 2011). Design and planning for water-quality monitoring throughout all phases of the Project (preconstruction, during construction, and postconstruction) was completed as a collaborative effort that included the U.S. Geological Survey (USGS), Minnesota Department of Natural Resources, Minnesota Pollution Control Agency, North Dakota Department of Environmental Quality (NDDEQ), North Dakota Department of Game and Fish, local city and county municipalities, and the Metro Flood Diversion Authority.
In cooperation with the U.S. Army Corps of Engineers, the USGS initiated a water-quality monitoring study related to the preconstruction phase of the Project from October 1, 2019, to October 1, 2022. The monitoring study included the collection of discrete and continuous water-quality data and streamflow monitoring at selected sites that integrated and enhanced existing monitoring programs within the study area. The design was meant to provide consistent sampling methods at critical site locations to detect trends in water quality and to estimate constituent loads (mass per time). This study was designed to provide understanding of how water-quality constituents are transported and how that could change throughout the Project. Continuous, real-time water-quality monitoring upstream and downstream from the Project also provided information on changes in water quality that might happen on a shorter timescale such as from rainfall-runoff events, spills, and channel disturbances. Quality-control and quality-assurance samples and methods were built into the sampling program to provide confidence in the data being collected for water resource managers to make well-informed decisions. The monitoring data collected during all three phases of the Project will be critical for understanding changes over time and will help identify potential detrimental effects of the Project on surface waters in the area.
Purpose and Scope
The primary purpose of this report is to describe the water-quality characteristics of the Red River and its tributaries in the Fargo-Moorhead metropolitan area during the preconstruction period of the Project (from October 1, 2019, to October 1, 2022) to assess conditions before construction activities begin on the Project. Discrete water-quality samples were collected 8 times per year (January, April [2 samples], May, June, July, August, and October) at 10 locations (fig. 1, table 1). Additional samples were collected during flood events when flows were greater than selected thresholds. Samples were analyzed for total dissolved solids (TDS), major ions, trace elements, nutrients, suspended sediment, pesticides, and fecal indicator bacteria. Continuous water-quality monitors were operated for recording water temperature, specific conductance, dissolved oxygen (DO), pH, and turbidity at three locations on the Red River, and continuous streamflow was also monitored at all sampling sites except for Red River of the North near Harwood, North Dakota (USGS station 05054200; hereafter referred to as “site 5”; table 1). All streamflow and water-quality data except for pesticide and fecal indicator bacteria data are publicly available from the USGS National Water Informational System website (U.S. Geological Survey, 2023). Pesticide and fecal indicator bacteria are available in Nustad and others (2024).
Water-quality characteristics are described using statistics of the discrete data for comparing water-quality variability among the 10 sites, and constituent loads and yields were estimated for selected constituents to describe the transport of the selected constituents in the study area. Loads and yields were computed for TDS, chloride, sodium, sulfate, nitrate plus nitrite (unfiltered), phosphorus (unfiltered), and suspended sediment at the 10 sites using discrete sample data and continuous streamflow data. Patterns in the continuously measured water-quality data are also shown to describe changes through time at the three sites on the Red River (sites 1, 4, and 9) from October 1, 2019, to October 1, 2022.
Table 1.
Data collection sites for the Red River of the North and selected tributaries near the Fargo-Moorhead metropolitan area.[ID, identification; USGS, U.S. Geological Survey; mi2, square mile; ft3/s, cubic feet per second; DWQ, discrete water quality samples; CWQ, continuous water-quality data; D, continuous discharge; --, not applicable]
| Site ID (fig. 1) |
USGS station number | Site name | Drainage area1 (mi2) |
Data collected | Flood event sampling threshold (ft3/s) |
Sampling sites when threshold is triggered |
|---|---|---|---|---|---|---|
| 1 | 05051522 | Red River of the North at Hickson, N. Dak. | 4,194 | DWQ, CWQ, D | -- | -- |
| 2 | 05053000 | Wild Rice River near Abercrombie, N. Dak. | 2,080 | DWQ, D2 | 3,160 | 2,3 |
| 3 | 05053500 | Wild Rice River near St. Benedict, N. Dak. | 2,230 | DWQ, D | -- | -- |
| 4 | 05054000 | Red River of the North at Fargo, N. Dak. | 6,649 | DWQ, CWQ, D2 | -- | -- |
| 5 | 05054200 | Red River of the North near Harwood, N. Dak. | 6,724 | DWQ | -- | -- |
| 6 | 05059000 | Sheyenne River near Kindred, N. Dak. | 35,020 | DWQ, D2 | 4,190 | 2 |
| 7 | 05060100 | Maple River below Mapleton, N. Dak. | 1,470 | DWQ, D2 | 6,280 | 7,8 |
| 8 | 05060400 | Sheyenne River at Harwood, N. Dak. | 36,700 | DWQ, D | -- | -- |
| 9 | 05062130 | Red River of the North near Georgetown, Minn. | 315,163 | DWQ, CWQ, D2 | -- | -- |
| 10 | 05064500 | Red River of the North at Halstad, Minn. | 317,536 | DWQ, D | -- | -- |
Drainage areas from U.S. Geological Survey (2019a).
Study Area Description
The Red River begins at Wahpeton, North Dakota, at the confluence of the Bois de Sioux and Otter Tail Rivers. The Red River flows north for approximately 550 river miles before emptying into Lake Winnipeg, Manitoba, Canada. Meandering over a flat lacustrine plain consisting primarily of clay-rich, unconsolidated (erodible) and glacial sediments, the shallow channel of the Red River forms the boundary between North Dakota and Minnesota (U.S. Army Corps of Engineers, 2011). The drainage area for the Red River Basin is about 45,000 square miles (excluding the Assiniboine River and Devils Lake Basins) and encompasses parts of eastern North Dakota, northwestern Minnesota, and northeastern South Dakota in the United States and southern Manitoba in Canada (International Joint Commission, 2023).
The Red River flows through several urban areas along its path including the cities of Fargo, N. Dak.; Moorhead, Minn.; Grand Forks, N. Dak.; East Grand Forks, Minn.; and Winnipeg, Manitoba. Western tributaries to the Red River near the Fargo-Moorhead metropolitan area include the Wild Rice, Sheyenne, and Maple Rivers (fig. 1). The larger eastern tributaries in the metropolitan area include Wolverton Creek, Buffalo River, and the Wild Rice River. Additionally, there are many agricultural field drains, ditches, and canals that transport excess water straight to the Red River or its tributaries. Because of the Red River’s low gradient within the basin and its shallow river channel, the timing of spring thaw and snowmelt can greatly exacerbate flooding. Snow in the upstream part of the Red River Basin begins to melt first, whereas areas downstream remain mostly frozen. This snowmelt pattern can cause ice jams to form and subsequent backwater (water that is retarded, backed up, or turned back in its course because of an obstruction or an opposing current) as flood flows move north. The annual spring high-flow event attributed to this snowmelt pattern varies in the extent of its magnitude from year to year with frequent exceedance of established flood stages within the Red River Basin.
The study area is in the general vicinity of the Fargo-Moorhead metropolitan area and includes selected sites on the Red River and its western tributaries (fig. 1). The Project in the Fargo-Moorhead metropolitan area consists of an approximately 30-mile-long diversion channel; an upstream staging area; a southern dam embankment; aqueducts with overflow spillways into the diversion channel on the Sheyenne and Maple Rivers; and gated structures on the Wild Rice River (western tributary to the Red River), the Red River, and where the diversion channel begins on the southern embankment (fig. 1; Metro Flood Diversion Authority, 2023).
The dam embankment is planned to provide downstream flood protection when the combined flow of the Red River and Wild Rice River exceed approximately 21,000 cubic feet per second (ft3/s; U.S. Army Corps of Engineers, 2019). During periods of low to normal flow, where the combined flow is below 21,000 ft3/s, the proposed gates at the Wild Rice River and Red River will remain completely open, allowing water to freely pass. During a high-flow condition, where inflows exceed 21,000 ft3/s, the gated control structures will be used to release a portion of the inflows in the upstream staging area downstream through the natural stream systems (for example, the Red River or Wild Rice River). The remaining portion of the flow/flood volume will be temporarily stored upstream from the dam and released into the diversion channel through its control structure. The diversion channel will be constructed in North Dakota and intercept and reroute all flows from the Lower Rush and Rush Rivers and several local drains to its confluence with the Red River just upstream from the USGS streamgage on the Red River of the North near Georgetown, Minn. (USGS station 05062130; hereafter referred to as “site 9”; fig. 1). Two aqueduct structures, one along the Sheyenne River and one along the Maple River, will be constructed to direct flows across the diversion channel during normal and low-flow conditions (U.S. Army Corps of Engineers, 2019). Each aqueduct has a spillway that will reroute a portion of the flows into the diversion channel if the river experiences a flood event.
Methods
The following sections describe methods used for the collection and analysis of discrete water-quality samples, continuous water-quality measurements, and continuous measurement of streamflow. Data were collected by the USGS in the general vicinity of the Fargo-Moorhead metropolitan area and included selected sites at or near existing USGS streamflow monitoring sites (fig. 1, table 1). A total of 10 sites were sampled, including five sites on the Red River, which are located upstream and downstream from the Fargo-Moorhead metropolitan area, and five sites on western tributaries to the Red River near the metropolitan area, including the Wild Rice, Sheyenne, and Maple Rivers (fig. 1, table 1). No samples were collected on any of the eastern tributaries to the Red River.
Discrete Sample Collection
Discrete water-quality samples were collected at 10 selected sites in the Fargo-Moorhead metropolitan area (fig. 1, table 1) from October 1, 2019, to October 1, 2022. Routine samples were collected eight times a year in the months of January, April (two samples), May, June, July, August, and October. The spatial distribution, frequency, and timing of the sample collection was designed to detect long-term changes over time and determine what could be potentially causing the changes. The design was based on a study by Galloway and others (2012) to support the analysis of constituent trends and loads and is used as the basis of the NDDEQ statewide sampling network (North Dakota Department of Environmental Quality, 2023). Additional samples were collected during flood events when flows were forecast to exceed defined thresholds (table 1). The additional flood event samples provided information to support the computation of loads, because material is more likely to be transported during such events. The design also incorporated and enhanced existing monitoring programs in the area.
Water-quality samples were collected and processed following protocols described in U.S. Geological Survey (variously dated) except for fecal indicator bacteria and pesticides. Fecal indicator bacteria and pesticide samples were processed using the same methods as the NDDEQ statewide sampling network to provide data that are consistent with the existing network (North Dakota Department of Environmental Quality, 2023). Samples were collected to provide a representative discharge-weighted, depth-integrated sample at each stream location by using an equal-width-increment (EWI) method, equal-discharge-incremental (EDI) method, or a multi-vertical increment method depending on the flow conditions (U.S. Geological Survey, variously dated). The EWI method involves dividing the cross-section into 10 equal intervals and collecting depth-integrated samples from each interval then compositing the samples using a churn splitter for processing the samples. The EDI method involves dividing the cross-section into at least five equal discharge increments and collecting depth-integrated samples in each increment, which are then composited for processing. EWI and EDI methods are isokinetic sampling techniques, which means they are done in a way where the velocity of the water entering the sampling device equals the velocity of the stream to provide representative samples of the material being transported in the stream (U.S. Geological Survey, variously dated). These techniques are used when velocities in the cross-section are greater than 1.5 feet per second (ft/s). When velocities are less than 1.5 ft/s, isokinetic samples cannot be collected, so a multivertical method was used. The multivertical increment method is the same as the EWI method except that the samples are collected nonisokinetically. Field measurements were collected with every sample using methods described in U.S. Geological Survey (variously dated). Measurements included water temperature, specific conductance, DO, pH, and turbidity.
Samples were analyzed for a broad suite of constituents including TDS, major ions, trace elements, nutrients, suspended sediment, pesticides, fecal indicator bacteria, and field measurements (table 2). Pesticide samples were only collected six times a year (late April, May, June, July, August, and October) at 5 of the 10 sites (sites 2, 4, 6, 7, and 9; table 1). Pesticides were only collected at the five selected sites because these sites were part of another ongoing pesticide sampling program. Only samples collected in May, June, July, and August were analyzed for fecal indicator bacteria at all 10 sites. Most constituents, except for sediment and pesticides, were analyzed by the NDDEQ Laboratory in Bismarck, N. Dak., using methods described in U.S. Environmental Protection Agency (2017) and Clesceri and others (1999). By using the NDDEQ Laboratory, consistent methods are provided for comparison to existing data collected in the study area as part of other monitoring networks. Samples were analyzed for suspended-sediment concentration (SSC) and size analysis (percent of diameter size less than 0.0625 millimeters [mm]) by the USGS Iowa Sediment Laboratory in Iowa City, Iowa, using methods described in Guy (1970). Pesticides, including 102 different pesticides and pesticide degradates, were analyzed by the Montana State University’s Agriculture Experiment Station Analytical Laboratory, in Bozeman, Montana, in coordination with the North Dakota Department of Agriculture. Samples were preserved and shipped according to protocols described by the appropriate laboratory. All discrete sample data except for pesticide and fecal indicator data can be accessed at U.S. Geological Survey (2023). Pesticide and fecal indicator data for October 1, 2019, to October 1, 2022, are available in Nustad and others (2024).
Samples were collected during flood events according to streamflow thresholds used to define a flood event at sites in the study area (table 1). Flood event samples are critical for good estimates of annual constituent loads that are transported past a site. In general, most of the mass transported in a stream is during high-flow events. Also, concentrations of various constituents do not always peak at the same time as the peak in streamflow; they can also frequently peak on the rise of the hydrograph and sometimes on the fall of the hydrograph during an event. Samples were collected on the rise, peak, and fall of an event (three samples) when thresholds were met, which was only for two events during October 1, 2019, to October 1, 2022. Thresholds that would trigger a sampling event were based on the 10-percent annual chance exceedance (10-year recurrence interval) for a selected site on each of the three tributaries (table 1). Redundant samples were not collected if the regularly scheduled routine sample was collected during a flood event.
Table 2.
List of constituents measured in samples collected at 10 sites in the Fargo-Moorhead metropolitan area from October 1, 2019, to October 1, 2022.[mg/L, milligram per liter; NDDEQ, North Dakota Department of Environmental Quality Laboratory; µg/L, microgram per liter; N, nitrogen; P, phosphorus; C, carbon; USGS IA; U.S. Geological Survey Iowa Sediment Laboratory; mm, millimeter; °C, degree Celsius; MSU; Montana State University Laboratory; µS/cm; microsiemen per centimeter; FNU, formazin nephelometric unit]
Continuous Monitoring
Continuous water-quality monitors were operated at three locations on the Red River (sites 1, 4, and 9; fig. 1) to monitor the conditions between discrete sampling times. Monitors were equipped with sensors to measure water temperature, specific conductance, DO, pH, and turbidity every 15 minutes at the three sites. The continuous monitors were maintained and calibrated, and the data were processed using methods described in Wagner and others (2006). All continuously recorded data can be accessed at U.S. Geological Survey (2023).
Streamflow data are critical for understanding water-quality conditions and are required for the computation of constituent trends and loads. Streamflow data were collected for use with the water-quality concentration data to calculate constituent loads and yields described in this report. Water-quality trends were not computed for this report. Stream stage was measured continuously at 9 of the 10 streamgages (table 1). The continuous stage data were used with instantaneous discharge measurements to develop stage-discharge rating curves to compute continuous streamflow using methods described in Rantz and others (1982). Data for stream stage and streamflow can be accessed at U.S. Geological Survey (2023).
Data Analysis
To characterize the water quality in the Fargo-Moorhead metropolitan area using the discrete sample data collected from October 1, 2019, to October 1, 2022, descriptive statistics were generated for comparing water-quality characteristics between sites. Constituent loads and yields were estimated for selected constituents to describe the transport of the selected constituents in the study area.
Descriptive Statistics
Descriptive statistics were computed for discrete data compiled from samples collected at the 10 sites in the Fargo-Moorhead metropolitan areas from October 1, 2019, to October 1, 2022, to describe the spatial variability of concentrations in the study area. Statistics were compiled into tables that include the minimum; maximum; and the 10th, 25th, 50th (median), 75th, and 90th percentiles of values for individual constituents and measurements at each site. Selected constituents were also shown graphically using boxplots that display the distribution of data by showing the 25th, 50th (median), and 75th percentiles of values; the largest and smallest values within 1.5 times the interquartile range below and above the 25th and 75th percentiles, respectively; and outliers in the data.
Load and Yield Estimation
Constituent load is a function of the volumetric rate of water passing a point in the stream, known as streamflow, and the constituent concentration within the water. Constituent yield is a function of constituent load and the drainage area contributing to flow at the site.
The program R–LOADEST (Runkel and others, 2004; Runkel, 2013) was used to estimate constituent loads using regression methods. These methods use natural logarithm-transformed relations between streamflow and the constituent concentration within the water to estimate the daily constituent concentration within the water (or constituent load) for a particular constituent at a site (Cohn and others, 1989, 19925; Cohn, 1995). The regression method can account for non-normal data distributions, seasonal and long-term cycles, censored data, biases associated with using logarithmic transformations, and serial correlations of the residuals (Cohn, 1995). Regression methods use discrete water-quality samples often collected during several years and a daily streamflow hydrograph. A regression model for estimating constituent load can be expressed as the following equation:
whereln ()
represents the natural logarithm function;
L
is the constituent load;
β0, β1, β2, β3, and β4
are the coefficients of the model;
Qd
is the daily mean streamflow, in cubic feet per second;
T
is decimal time, in years; and
E
is the model error.
In this model, relations between streamflow and load are identified by the β1 coefficient, temporal trends are identified by β2, and seasonal effects are identified by β3 and β4. Transforming the results of the model from logarithmic space to linear space was accomplished using an adjusted maximum likelihood estimator (AMLE) (Cohn and others, 1992). The AMLE method can also handle censored values. For this application, the variables included in the load model (eq. 1) were selected by using various diagnostic statistics provided by R–LOADEST to evaluate the significance of the variables to include in the model for each site and constituent combination. The explanatory variables were considered statistically significant if the probability value (p-value) was less than 0.05 for the t-statistic. When using the AMLE method, normal distribution (normality) of the dataset is assumed. The validity of the normality assumption for the residuals was examined using the Turnbull-Weiss likelihood ratio normality statistic (Turnbull and Weiss, 1978). If the p-value from the Turnbull-Weiss statistic was less than 0.05, the residual plots were examined for homoscedasticity (equal statistical variances) and normality. There were some cases where the p-value was less than 0.05, but the AMLE method was used because the dataset contained censored data. As a measure of how much variability in the dependent variable is explained by the independent variable and the R–LOADEST regression equation, coefficient of determination (R2) values were computed and expressed as a percentage. The R2 value is a number, 0–1, that when multiplied by 100 is interpreted as the percentage of the variability in the dependent variable explained by the independent variable(s) and the regression equation (Helsel and others, 2020). Generally, a larger R2 value indicates a better relation. For example, an R2 of 100 percent indicates that all the variability in the dependent variable is explained by the independent variable(s). However, a large R2 value does not guarantee the relation is useful (Neter and others, 1996). For example, if estimates require extrapolation outside of the observed independent variables, the estimates may not be accurate. Unless constituent concentrations were highly variable, R2 values were expected to be large for the R–LOADEST models because the dependent variable in the R–LOADEST models (constituent load) is a function of one of the independent variables (streamflow).
As a measure of uncertainty in the load estimates, the standard error of prediction was provided in R–LOADEST output (Runkel and others, 2004). To compare uncertainty among sites with large differences in loads, the standard error of prediction was expressed as a percentage of the total estimated load during the 3-year period for each site and constituent (table 3).
Table 3.
Load model characteristics used to determine selected constituent loads at 10 sites in the Fargo-Moorhead metropolitan area from October 1, 2019, to October 1, 2022.[ID, identification; ln(), natural logarithm function; Q, streamflow; π, pi; T, decimal time]
| Site ID (fig. 1) | Site name | Number of values used in calibration (number of censored values) |
Load model | Coefficient of determination (percent) | Standard error of prediction, as a percent of total load during 2019–22 |
|---|---|---|---|---|---|
| 1 | Red River of the North at Hickson, N. Dak. | 24 (0) | 13.76+1.29lnԚ | 94.1 | 8.2 |
| 2 | Wild Rice River near Abercrombie, N. Dak. | 24 (0) | 12.58+0.94lnԚ | 98.9 | 5.8 |
| 3 | Wild Rice River near St Benedict, N. Dak. | 23 (0) | 12.40+0.93lnԚ | 98.5 | 7.5 |
| 4 | Red River of the North at Fargo, N. Dak. | 24 (0) | 14.19+1.20lnԚ | 96.3 | 7.5 |
| 5 | Red River of the North near Harwood, N. Dak. | 29 (0) | 14.42+1.11lnԚ | 95.8 | 6.4 |
| 6 | Sheyenne River near Kindred. N. Dak. | 29 (0) | 14.21+0.89lnԚ | 98.0 | 3.4 |
| 7 | Maple River below Mapleton, N. Dak. | 30 (0) | 12.94+0.84lnԚ | 98.4 | 5.3 |
| 8 | Sheyenne River at Harwood, N. Dak. | 29 (0) | 14.54+0.85lnԚ | 98.3 | 3.4 |
| 9 | Red River of the North near Georgetown, Minn. | 29 (0) | 15.40+0.97lnԚ | 97.2 | 4.4 |
| 10 | Red River of the North at Halstad, Minn. | 29 (0) | 15.55+0.94lnԚ | 96.4 | 5.3 |
| 1 | Red River of the North at Hickson, N. Dak. | 24 (0) | 10.53+0.96lnԚ | 95.4 | 4.8 |
| 2 | Wild Rice River near Abercrombie, N. Dak. | 24 (0) | 9.20+0.90lnԚ | 98.1 | 7.4 |
| 3 | Wild Rice River near St Benedict, N. Dak. | 24 (0) | 9.05+0.89lnԚ | 97.0 | 9.8 |
| 4 | Red River of the North at Fargo, N. Dak. | 24 (0) | 10.96+0.99lnԚ | 96.5 | 5.6 |
| 5 | Red River of the North near Harwood, N. Dak. | 30 (0) | 11.32+0.87lnԚ | 94.8 | 5.1 |
| 6 | Sheyenne River near Kindred. N. Dak. | 30 (0) | 11.15+0.80lnԚ | 93.9 | 5.4 |
| 7 | Maple River below Mapleton, N. Dak. | 30 (0) | 9.95+0.77lnԚ | 98.3 | 4.8 |
| 8 | Sheyenne River at Harwood, N. Dak. | 30 (0) | 11.53+0.76lnԚ | 95.6 | 4.8 |
| 9 | Red River of the North near Georgetown, Minn. | 30 (0) | 12.28+0.82lnԚ | 96.1 | 4.2 |
| 10 | Red River of the North at Halstad, Minn. | 30 (0) | 12.39+0.81lnԚ | 96.4 | 4.2 |
| 1 | Red River of the North at Hickson, N. Dak. | 24 (0) | 10.83+1.27lnԚ | 89.1 | 11.5 |
| 2 | Wild Rice River near Abercrombie, N. Dak. | 24 (0) | 10.16+0.88lnԚ | 98.2 | 6.7 |
| 3 | Wild Rice River near St Benedict, N. Dak. | 23 (0) | 9.98+0.87lnԚ | 97.3 | 9.4 |
| 4 | Red River of the North at Fargo, N. Dak. | 24 (0) | 11.39+1.20lnԚ | 94.2 | 9.6 |
| 5 | Red River of the North near Harwood, N. Dak. | 29 (0) | 11.75+1.04lnԚ | 92.2 | 8.3 |
| 6 | Sheyenne River near Kindred. N. Dak. | 29 (0) | 12.11+0.86lnԚ | 94.2 | 5.9 |
| 7 | Maple River below Mapleton, N. Dak. | 30 (0) | 10.54+0.79lnԚ | 97.5 | 5.9 |
| 8 | Sheyenne River at Harwood, N. Dak. | 29 (0) | 12.37+0.78lnԚ | 94.9 | 5.5 |
| 9 | Red River of the North near Georgetown, Minn. | 29 (0) | 12.96+0.88lnԚ | 93.6 | 6.1 |
| 10 | Red River of the North at Halstad, Minn. | 29 (0) | 13.05+0.85lnԚ | 92.5 | 6.9 |
| 1 | Red River of the North at Hickson, N. Dak. | 24 (0) | 12.50+1.69lnԚ | 86.0 | 20.5 |
| 2 | Wild Rice River near Abercrombie, N. Dak. | 24 (0) | 11.90+ 0.95lnԚ | 98.5 | 6.9 |
| 3 | Wild Rice River near St Benedict, N. Dak. | 24 (0) | 11.71+0.93lnԚ | 98.0 | 8.6 |
| 4 | Red River of the North at Fargo, N. Dak. | 24 (0) | 13.18+1.42lnԚ | 91.9 | 15.0 |
| 5 | Red River of the North near Harwood, N. Dak. | 30 (0) | 13.46+1.28lnԚ | 91.2 | 11.6 |
| 6 | Sheyenne River near Kindred. N. Dak. | 30 (0) | 13.33+0.90lnԚ | 97.7 | 3.8 |
| 7 | Maple River below Mapleton, N. Dak. | 30 (0) | 12.21+0.84lnԚ | 97.7 | 6.3 |
| 8 | Sheyenne River at Harwood, N. Dak. | 30 (0) | 13.70+0.86lnԚ | 97.7 | 4.0 |
| 9 | Red River of the North near Georgetown, Minn. | 30 (0) | 14.53+1.04lnԚ | 94.8 | 6.5 |
| 10 | Red River of the North at Halstad, Minn. | 30 (0) | 14.63+0.99lnԚ | 93.5 | 7.6 |
| 1 | Red River of the North at Hickson, N. Dak. | 19 (5) | 5.60+1.97lnQ+0.42sin(2πT)+0.71cos(2πT) | 66.2 | 79.3 |
| 2 | Wild Rice River near Abercrombie, N. Dak. | 18 (6) | 3.71+1.67lnQ+0.47sin(2πT)+0.91cos(2πT) | 87.4 | 77.7 |
| 3 | Wild Rice River near St Benedict, N. Dak. | 18 (6) | 3.60+1.67lnQ-0.09sin(2πT)+0.94cos(2πT) | 83.7 | 112.7 |
| 4 | Red River of the North at Fargo, N. Dak. | 20 (4) | 6.21+1.88lnQ+0.25sin(2πT)+0.80cos(2πT) | 78.9 | 59.7 |
| 5 | Red River of the North near Harwood, N. Dak. | 30 (0) | 8.20+0.69lnQ+0.08sin(2πT)+0.25cos(2πT) | 57.2 | 20.5 |
| 6 | Sheyenne River near Kindred. N. Dak. | 23 (7) | 5.52+1.61lnQ+0.35sin(2πT)+0.73cos(2πT) | 81.6 | 33.6 |
| 7 | Maple River below Mapleton, N. Dak. | 22 (8) | 4.57+1.67lnQ+0.61sin(2πT)+1.34cos(2πT) | 84.3 | 74.9 |
| 8 | Sheyenne River at Harwood, N. Dak. | 23 (7) | 6.09+1.70lnQ+0.56sin(2πT)+0.79cos(2πT) | 81.5 | 43.1 |
| 9 | Red River of the North near Georgetown, Minn. | 30 (0) | 8.67+0.92lnQ+0.28sin(2πT)+0.36cos(2πT) | 81.4 | 14.9 |
| 10 | Red River of the North at Halstad, Minn. | 30 (0) | 8.85+1.03lnQ+0.12sin(2πT)+0.47cos(2πT) | 78.8 | 20.4 |
| 1 | Red River of the North at Hickson, N. Dak. | 24 (0) | 5.61+1.19lnԚ | 80.7 | 15.2 |
| 2 | Wild Rice River near Abercrombie, N. Dak. | 24 (0) | 4.03+1.12lnԚ | 94.8 | 16.9 |
| 3 | Wild Rice River near St Benedict, N. Dak. | 24 (0) | 3.75+1.15lnԚ | 96.3 | 15.7 |
| 4 | Red River of the North at Fargo, N. Dak. | 24 (0) | 5.89+1.28lnԚ | 85.9 | 18.1 |
| 5 | Red River of the North near Harwood, N. Dak. | 30 (0) | 6.79+0.84lnԚ | 85.4 | 9.0 |
| 6 | Sheyenne River near Kindred. N. Dak. | 30 (0) | 6.08+1.56lnԚ | 96.0 | 10.9 |
| 7 | Maple River below Mapleton, N. Dak. | 30 (0) | 5.02+1.09lnԚ | 95.6 | 12.5 |
| 8 | Sheyenne River at Harwood, N. Dak. | 30 (0) | 6.48+1.33lnԚ | 95.6 | 10.1 |
| 9 | Red River of the North near Georgetown, Minn. | 30 (0) | 7.63+1.07lnԚ | 93.8 | 7.4 |
| 10 | Red River of the North at Halstad, Minn. | 30 (0) | 7.84+1.06lnԚ | 93.0 | 8.7 |
| 1 | Red River of the North at Hickson, N. Dak. | 24 (0) | 11.06+1.54lnQ-0.05sin(2πT)-0.95cos(2πT) | 90.1 | 18.4 |
| 2 | Wild Rice River near Abercrombie, N. Dak. | 24 (0) | 9.39+1.27lnQ-0.01sin(2πT)-0.88cos(2πT) | 95.0 | 21.7 |
| 3 | Wild Rice River near St Benedict, N. Dak. | 24 (0) | 9.21+1.29lnQ-0.06sin(2πT)-0.76cos(2πT) | 96.2 | 20.6 |
| 4 | Red River of the North at Fargo, N. Dak. | 24 (0) | 11.15+1.63lnQ+0.07sin(2πT)-1.29cos(2πT) | 89.8 | 27.7 |
| 5 | Red River of the North near Harwood, N. Dak. | 30 (0) | 11.98+1.35lnQ-0.18sin(2πT)-1.09cos(2πT) | 87.7 | 18.1 |
| 6 | Sheyenne River near Kindred. N. Dak. | 30 (0) | 12.03+1.96lnQ+0.04sin(2πT)-0.85cos(2πT) | 96.8 | 14.9 |
| 7 | Maple River below Mapleton, N. Dak. | 29 (0) | 10.30+1.29lnQ-0.003sin(2πT)-0.57cos(2πT) | 96.8 | 14.7 |
| 8 | Sheyenne River at Harwood, N. Dak. | 30 (0) | 12.32+1.54lnQ-0.07sin(2πT)-0.79cos(2πT) | 96.2 | 12.7 |
| 9 | Red River of the North near Georgetown, Minn. | 30 (0) | 13.29+1.34lnQ-0.22sin(2πT)-1.16cos(2πT) | 91.9 | 14.2 |
| 10 | Red River of the North at Halstad, Minn. | 30 (0) | 13.59+1.27lnQ-0.24sin(2πT)-1.10cos(2πT) | 89.6 | 16.5 |
Loads and yields were estimated for total dissolved solids, chloride, sodium, sulfate, nitrate plus nitrite (unfiltered), phosphorus (unfiltered), and suspended sediment for the period of October 1, 2019, to October 1, 2022. Annual and seasonal loads were estimated for the 10 sites and selected constituents. Annual loads in tons (short) per year were computed for the water years (October 1 to September 30) 2020, 2021, and 2022. Because streamflow is not measured at site 5 on the Red River, daily streamflow from the Red River of the North at Fargo, N. Dak. (USGS station 05054000; hereafter referred to as “site 4”; fig. 1) was used with the concentration data for site 5 to estimate loads at site 5 because site 4 is located upstream and there are no major inputs between the sites. Annual yields, in tons per year per square mile, were also calculated for each site by dividing the annual loads by the drainage area (in square miles; table 1; U.S. Geological Survey, 2019a) contributing to flow at the sampling site for each constituent.
Quality Assurance and Quality Control
Quality-assurance and quality-control samples were included in the sampling program to provide confidence and defensibility of the data being collected. Quality-control samples included 24 field blanks, 12 concurrent replicates, and 20 irreplicate samples from October 1, 2019, to October 1, 2022. Field blanks were collected to assess any positive bias caused by contamination from the field equipment and processing techniques (Mueller and others, 2015). Concurrent replicate samples provided information on the variability (random measurement error) of the analytical results (Mueller and others, 2015). Different from replicates, irreplicates are not used to assess variability in analytical results, rather they are used to assess comparability of data generated through different methods (Mueller and others, 2015). To assess the comparability of data collected using USGS sample collection methods and NDDEQ collection methods, two irreplicate samples per year were collected at the Wild Rice near Abercrombie, N. Dak. (USGS station 05053000; hereafter referred to as “site 2”), site 5 (Red River), Sheyenne River near Kindred, N. Dak., (USGS station 05059000; hereafter referred to as “site 6”), and Maple River below Mapleton, N. Dak., (USGS station 05060100; hereafter referred to as “site 7”; table 1). The irreplicates consisted of a sample collected using each method, and both samples were analyzed by the USGS Iowa Sediment Laboratory and the NDDEQ Laboratory. All quality-control sample data for October 1, 2019, to October 1, 2022, are provided in a USGS data release (Nustad and others, 2024).
Blanks
Field blanks were processed using certified inorganic-free blank water using the same techniques and equipment used to process environmental samples following protocols described in U.S. Geological Survey (variously dated). The timing and site for field blank sample collection was randomly selected throughout the period of October 1, 2019, to October 1, 2022, to avoid bias related to timing of sample collection and site location. All field blanks were analyzed for trace element and nutrient constituents.
Of the 24 blank samples collected from October 1, 2019, to October 1, 2022, and analyzed for 24 different constituents, only three samples had a detectable concentration for one constituent. Two samples had detectable unfiltered ammonia concentrations and one sample had a detectable concentration of unfiltered nitrate plus nitrite (Nustad and others, 2024). All detected concentrations were near the laboratory reporting level of 0.03 milligram per liter (mg/L) as nitrogen (N). The two ammonia detections in samples collected in July 2021 and January 2022 had concentrations of 0.04 and 0.05 mg/L as N, respectively. A sample collected in August 2021 had a nitrate plus nitrite concentration of 0.04 mg/L as N. Overall the field blank data indicate that the equipment cleaning and processing techniques used for the discrete sample collection did not introduce any bias from contamination into samples collected from October 1, 2019, to October 1, 2022.
Replicates and Irreplicates
Two types of replicate samples were collected for evaluating variability and comparability of results. Concurrent replicate samples were used to evaluate the variability and reproducibility of sample results by using two sets of identical equipment and concurrently collecting and processing two sets of samples. The timing and location for concurrent replicate sample collection was randomly selected throughout the period of October 1, 2019, to October 1, 2022, to avoid any bias in the evaluation of variability in sample results. Irreplicate samples were used to evaluate comparability of results using two different sampling methods. Two samples were collected sequentially: one using USGS collection and processing methods described earlier in the “Methods” section of this report and one using collection and processing methods that NDDEQ uses as part of their sampling programs (North Dakota Department of Environmental Quality, 2023). The NDDEQ method generally involves collecting the sample at a single point in the center of flow in the channel and at a single depth using a Van Dorn sampler. The NDDEQ method differs from USGS methods described earlier that involve collecting samples that are a composite of subsamples collected across the channel and are depth integrated. Irreplicate samples were collected at sites that have historically been sampled by NDDEQ (sites 2, 5, 6, and 7), but the timing for irreplicate sample collection was randomly selected throughout the period of October 1, 2019, to October 1, 2022.
To compare differences between replicate and irreplicate samples, the relative percent difference (RPD) was calculated for each sample set (tables 4 and 5). The RPD provides a measure of the precision of the chemical analyses between two samples. The RPD was calculated as the absolute difference in concentration from the sample pairs divided by mean concentration multiplied by 100 for the environmental and replicate pairs with detections in both samples.
In general, the concurrent replicate data indicated that for most constituents, results were reproducible, and variability was generally less than 10 percent (table 4). For most constituents, the mean RPD was less than 10 percent except for silica, aluminum, iron, manganese, and nickel (table 4). The median RPDs were less than 5 percent for all the constituents analyzed, indicating most of the replicate samples had minimal variability. The constituents with higher mean RPDs were affected by a few samples with larger differences. For example, only 2 of the 12 replicate samples collected had iron concentrations greater than the laboratory reporting level, and those two samples had RPDs of 113.8 and 167.7 percent, accounting for the high mean RPD and low median RPD (Nustad and others, 2024). Although one-half of the samples had manganese concentrations greater than the laboratory reporting level, the RPDs were less than 20 percent except for two samples that had RPDs of 154.0 and 160.4 percent. Similarly, only a small subset of the replicate samples resulted in higher mean RPDs for silica, aluminum, and nickel. For iron and manganese in particular, variability in laboratory analysis rather than the sample collection may explain the higher RPDs based on the variability in concentrations in other samples described in this report.
Irreplicate samples were collected and analyzed to test for comparability of results using two different sampling methods. The effect of sampling methods on sampling results can vary depending on flow conditions and site conditions. Because one method involves collecting a sample at a single point in the stream and the other method includes depth-integrated and width-integrated sampling to represent the entire stream cross-section, differences in concentrations could result when the stream is not well mixed at the sampling location or has sand-sized or larger sediment particles in suspension. Larger particles require more energy to stay in suspension, so concentrations are generally not distributed uniformly vertically in the water column (Guy, 1970). Therefore, constituents that can be attached to sediment particles could also not be uniformly distributed.
The RPD from irreplicates collected at four sites (sites 2, 5, 6, and 7; table 5) from October 1, 2019, to October 1, 2022, indicated some differences owing to site conditions and was dependent on the constituent. The mean RPD was greater than 10 percent for more constituents at the sites on the Sheyenne River (site 6) and Red River (site 5) compared to the other two sites. Many of the trace elements such as aluminum, iron, manganese, and zinc along with ammonia (filtered and unfiltered) and unfiltered nitrate plus nitrite had RPDs greater than or equal to 18 percent (table 5) at the Red River (site 5). The Red River site is downstream from the wastewater-treatment plant discharge for the City of Fargo, and the possible reason that there are large differences in the irreplicates, particularly for the nutrients, is that the water in the cross section where samples were collected may not have been well mixed at the time of sample collection. Similarly, at the Sheyenne River (site 6), several trace elements (aluminum, barium, iron, manganese, nickel), unfiltered ammonia, and SSC had RPDs greater than 10 percent. The higher RPDs for constituents at the Sheyenne River site, SSC in particular, may be related to vertical mixing of sediment. Samples collected at the site indicated a higher median SSC and higher percentage of sand-sized particles (discussed in the “Spatial Characteristics” section) compared to the other sites. Depending on streamflow conditions, at times concentrations might not be distributed uniformly vertically in the water column because larger particles require more energy to stay in suspension. For the sites on the Wild Rice River (site 2) and Maple River (site 7), fewer constituents had RPDs greater than 10 percent compared to the sites on the Sheyenne and Red Rivers (table 5). For the Wild Rice River (site 2), fluoride, aluminum, iron, and manganese all had mean RPDs greater than 10 percent, and at the Maple River (site 7) only copper and filtered ammonia had mean RPDs greater than 10 percent. For iron and manganese, the mean RPDs were greater than or equal to 18 percent at all sites except for the Maple River (site 7). For these two constituents, the higher RPDs measured in the irreplicate and replicate samples (tables 4 and 5) may be related more to variability in the analytical method rather than the collection methods.
The RPD calculated for all irreplicate samples indicated that for most constituents, results were comparable between the two sampling methods. Similar to the replicate data, the mean RPDs for the irreplicates were less than 10 percent for most constituents except aluminum, barium, iron, manganese, and unfiltered ammonia (table 5). The median RPDs were also less than 5 percent for all constituents analyzed, indicating most of the irreplicate samples had comparable results. Larger differences for some of the trace elements and nutrients may be related to variability in analytical method as well as sampling method.
Table 4.
Summary of 12 replicate samples collected in the Fargo-Moorhead metropolitan area, October 1, 2019, to October 1, 2022.[RPD, relative percent difference; antimony, beryllium, cadmium, chromium, lead, silver, and thallium had RPDs equal to 0 and are not shown]
Table 5.
Summary of irreplicate samples collected at four sites in the Fargo-Moorhead metropolitan area (five samples at each site), October 1, 2019, to October 1, 2022.[RPD, relative percent difference; antimony, beryllium, cadmium, chromium, lead, silver, and thallium had RPDs equal to 0 and are not shown]
Streamflow Characteristics in the Fargo-Moorhead Metropolitan Area
Streamflow is highly variable in the Red River Basin over various time scales and affects the water-quality characteristics. On a seasonal scale, the highest streamflows typically are in the spring (March through May), generally late March or early April because of snowmelt or rainfall on snow or partially frozen soils. Streamflow during September through February is low and dominated by base flow from groundwater or reservoir discharge. During April through September, streamflow recedes as snowmelt runoff diminishes and net evaporation increases. During October 1, 2019, to October 1, 2022, streamflow conditions varied seasonally and annually, and water-quality samples were collected over the range of streamflow conditions (fig. 2). Several large rainfall events in September and October 2019 led to unusually high-streamflow conditions in the fall (September through November) of 2019. The snowmelt runoff in April 2020 produced the highest daily mean streamflow for the entire 3-year period at all sites except for at site 1 (Red River) and Sheyenne River near Kindred, N. Dak. (USGS station 05059000; hereafter referred to as “site 6”), which had higher daily mean streamflows in May 2022. Several rainfall events in the summer of 2020 kept streamflow somewhat high for most of the summer (June through August). Dry conditions starting in the fall of 2020 and continuing into 2021 resulted in the lowest streamflow conditions of the 3-year period in the summer, fall, and winter (December, January, February) of 2021. Precipitation and snowmelt runoff in the spring (March through May) of 2022 resulted in high-streamflow conditions at all the sites that persisted into the summer months from additional rainfall events. The streamflow in the summer months of 2022 was highest compared to the summer months in 2020 and 2021 for all sites (fig. 2).
The annual mean streamflow for the Red River and its tributaries (Wild Rice, Sheyenne, and Maple Rivers) in the Fargo-Moorhead metropolitan area during the sampling period of October 1, 2019, to October 1, 2022 (water years 2020–22) was well above the long-term annual mean streamflow in water years 2020 and 2022 but well below the long-term annual mean streamflow in water year 2021 (fig. 3). Streamflow in the Red River Basin generally has had a noticeable increase since the early 1990s from a shift in climatic conditions in the 1980s (Vecchia, 2008; Kolars and others, 2016; Ryberg and others, 2016). For example, at the Red River (site 4), the annual mean streamflows for 20 of the last 30 years (1993 through 2022), are in the top 25th percentile for the 121-year period of record (1902 through 2022; U.S. Geological Survey, 2023). Water year 2020 had the 5th highest annual mean streamflow and 2022 had the 10th highest annual mean streamflow for the period of record, whereas the annual mean streamflow for 2021 was much lower and ranked 55th highest for the period of record. The tributaries had similar patterns in annual streamflow as the Red River. For example, the annual mean streamflow for site 6 (Sheyenne River) was the 2nd highest in 2020 and the 5th highest in 2022 for the 73-year period of record (1950 through 2022) with 2021 ranked 43rd highest annual streamflow. The Wild Rice River at site 2 had annual mean streamflows that ranked 4th highest for 2020 and 11th highest for 2022 for the 90-year period of record (1933 through 2022), with an annual mean streamflow for 2021 that ranked 51st highest (fig. 3).
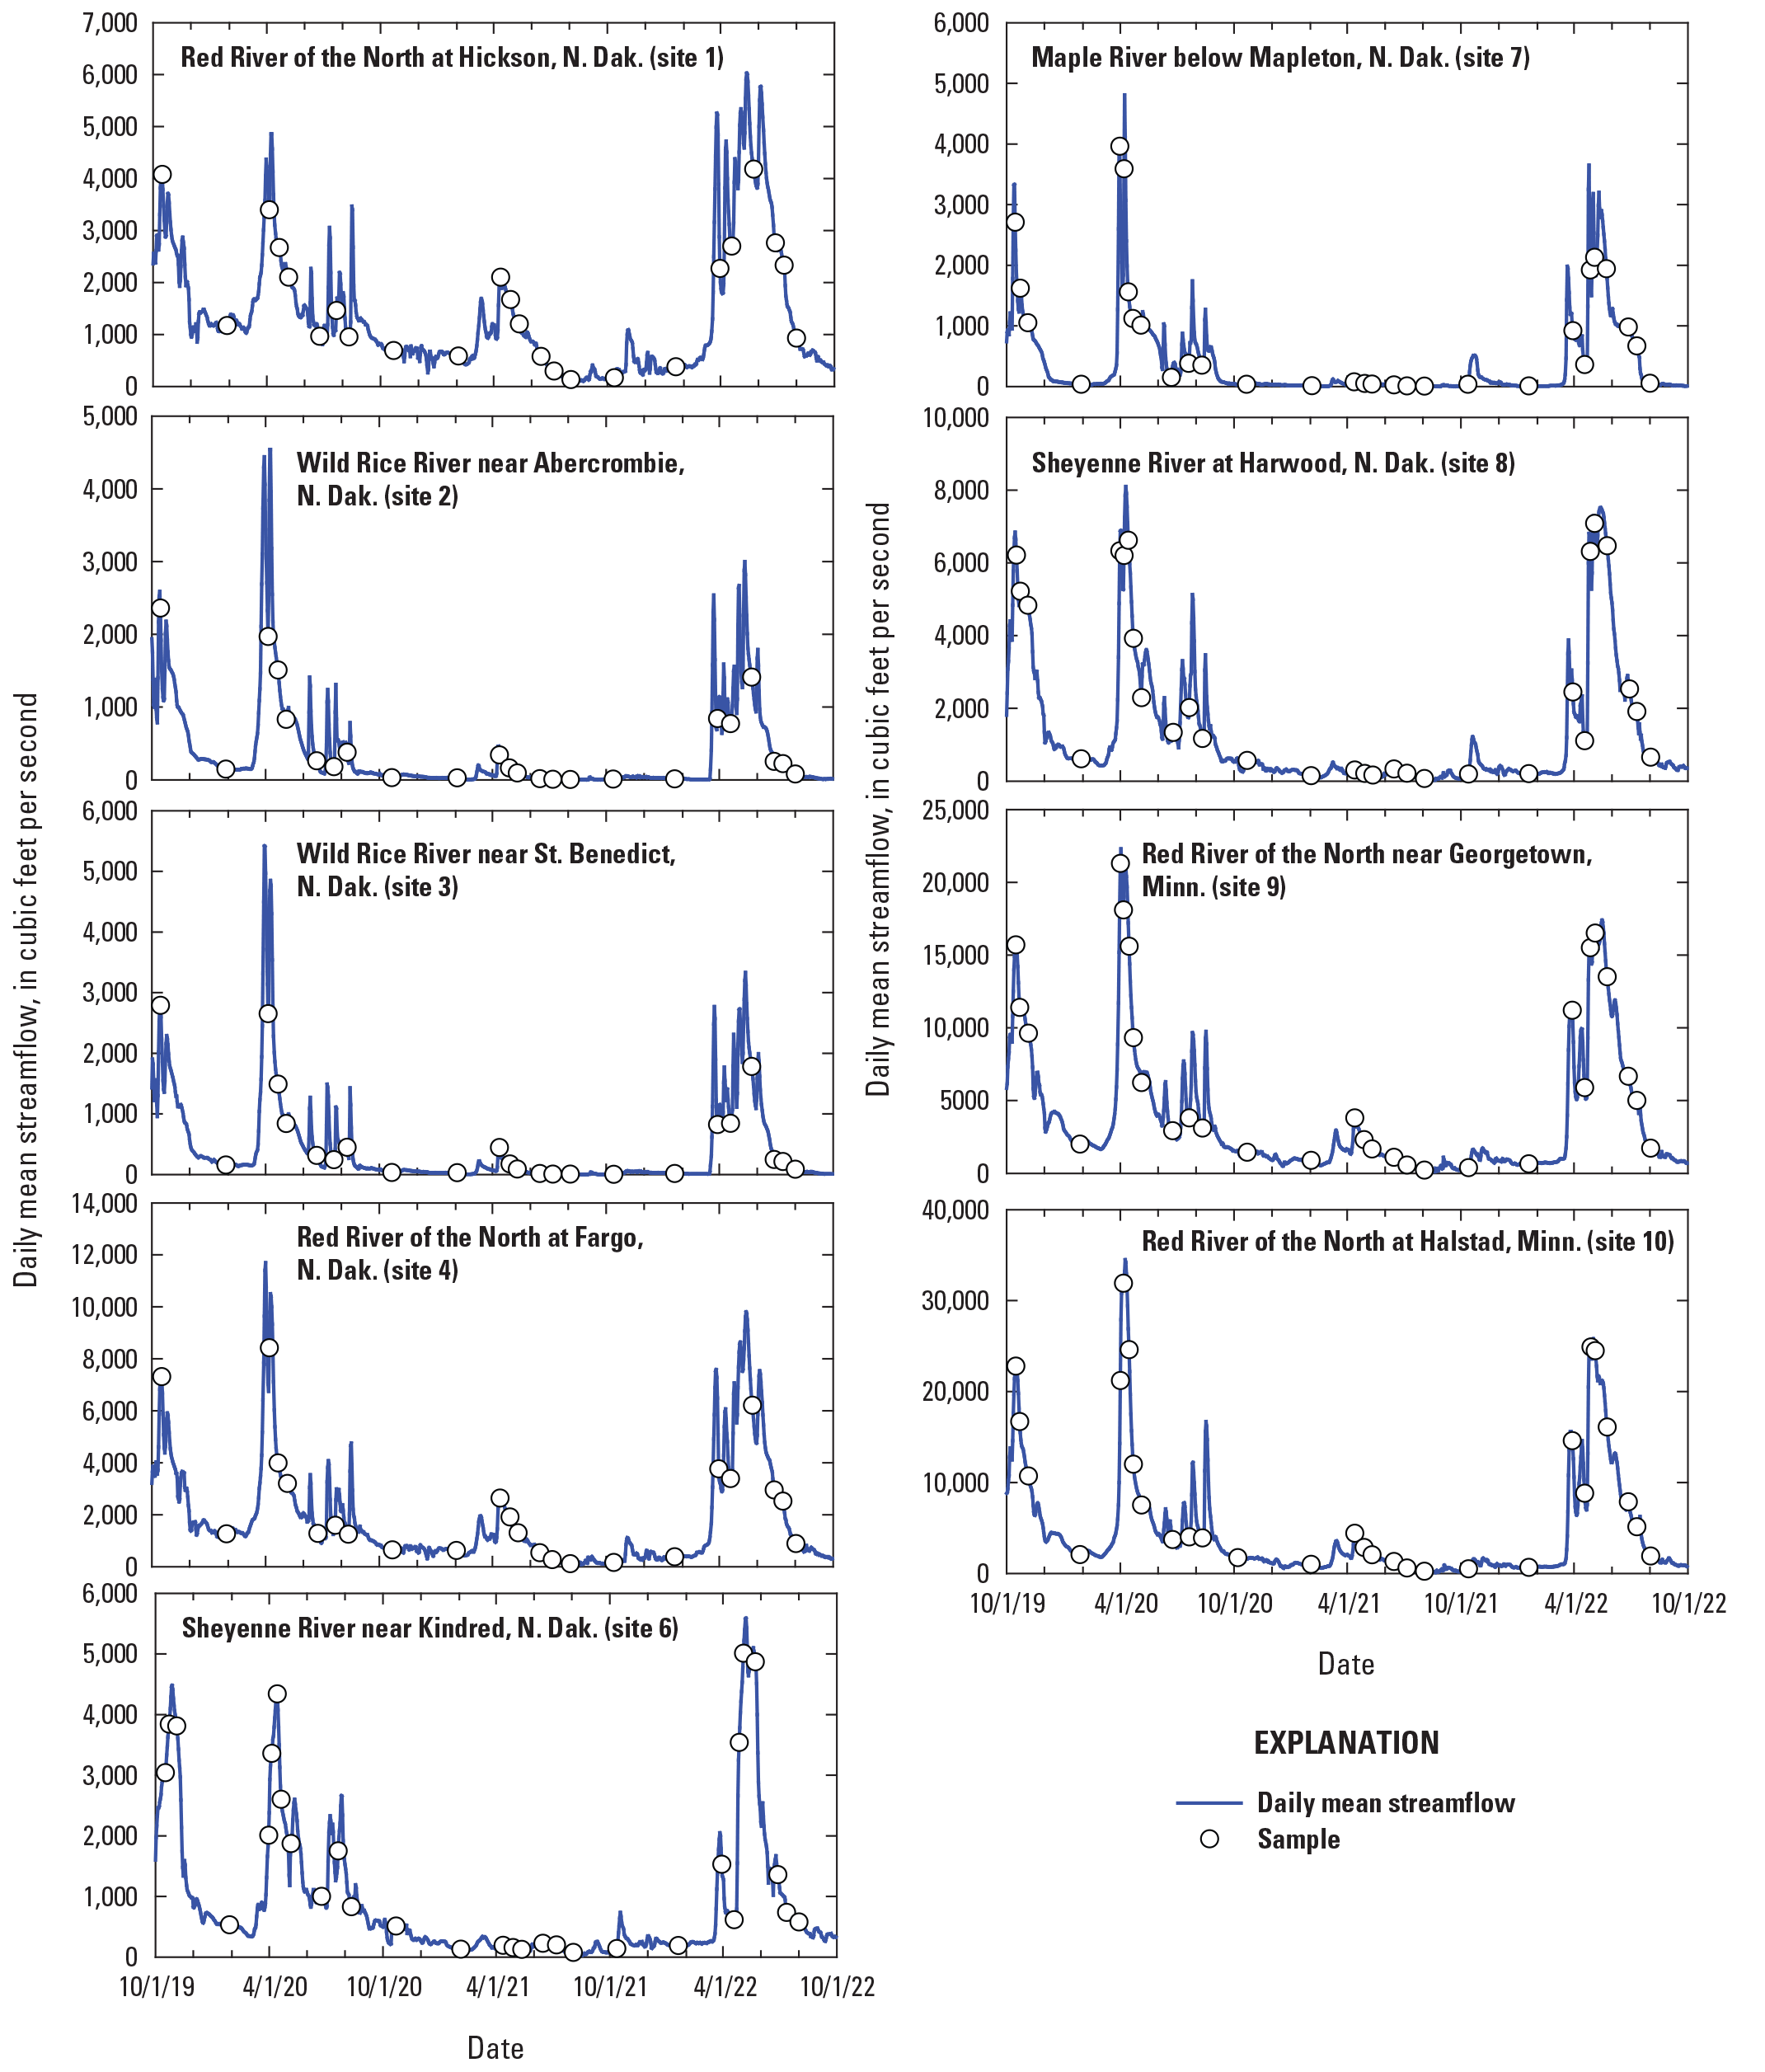
Daily mean streamflow for nine sampling locations in the Fargo-Moorhead metropolitan area with water-quality sample times, October 1, 2019, to October 1, 2022.
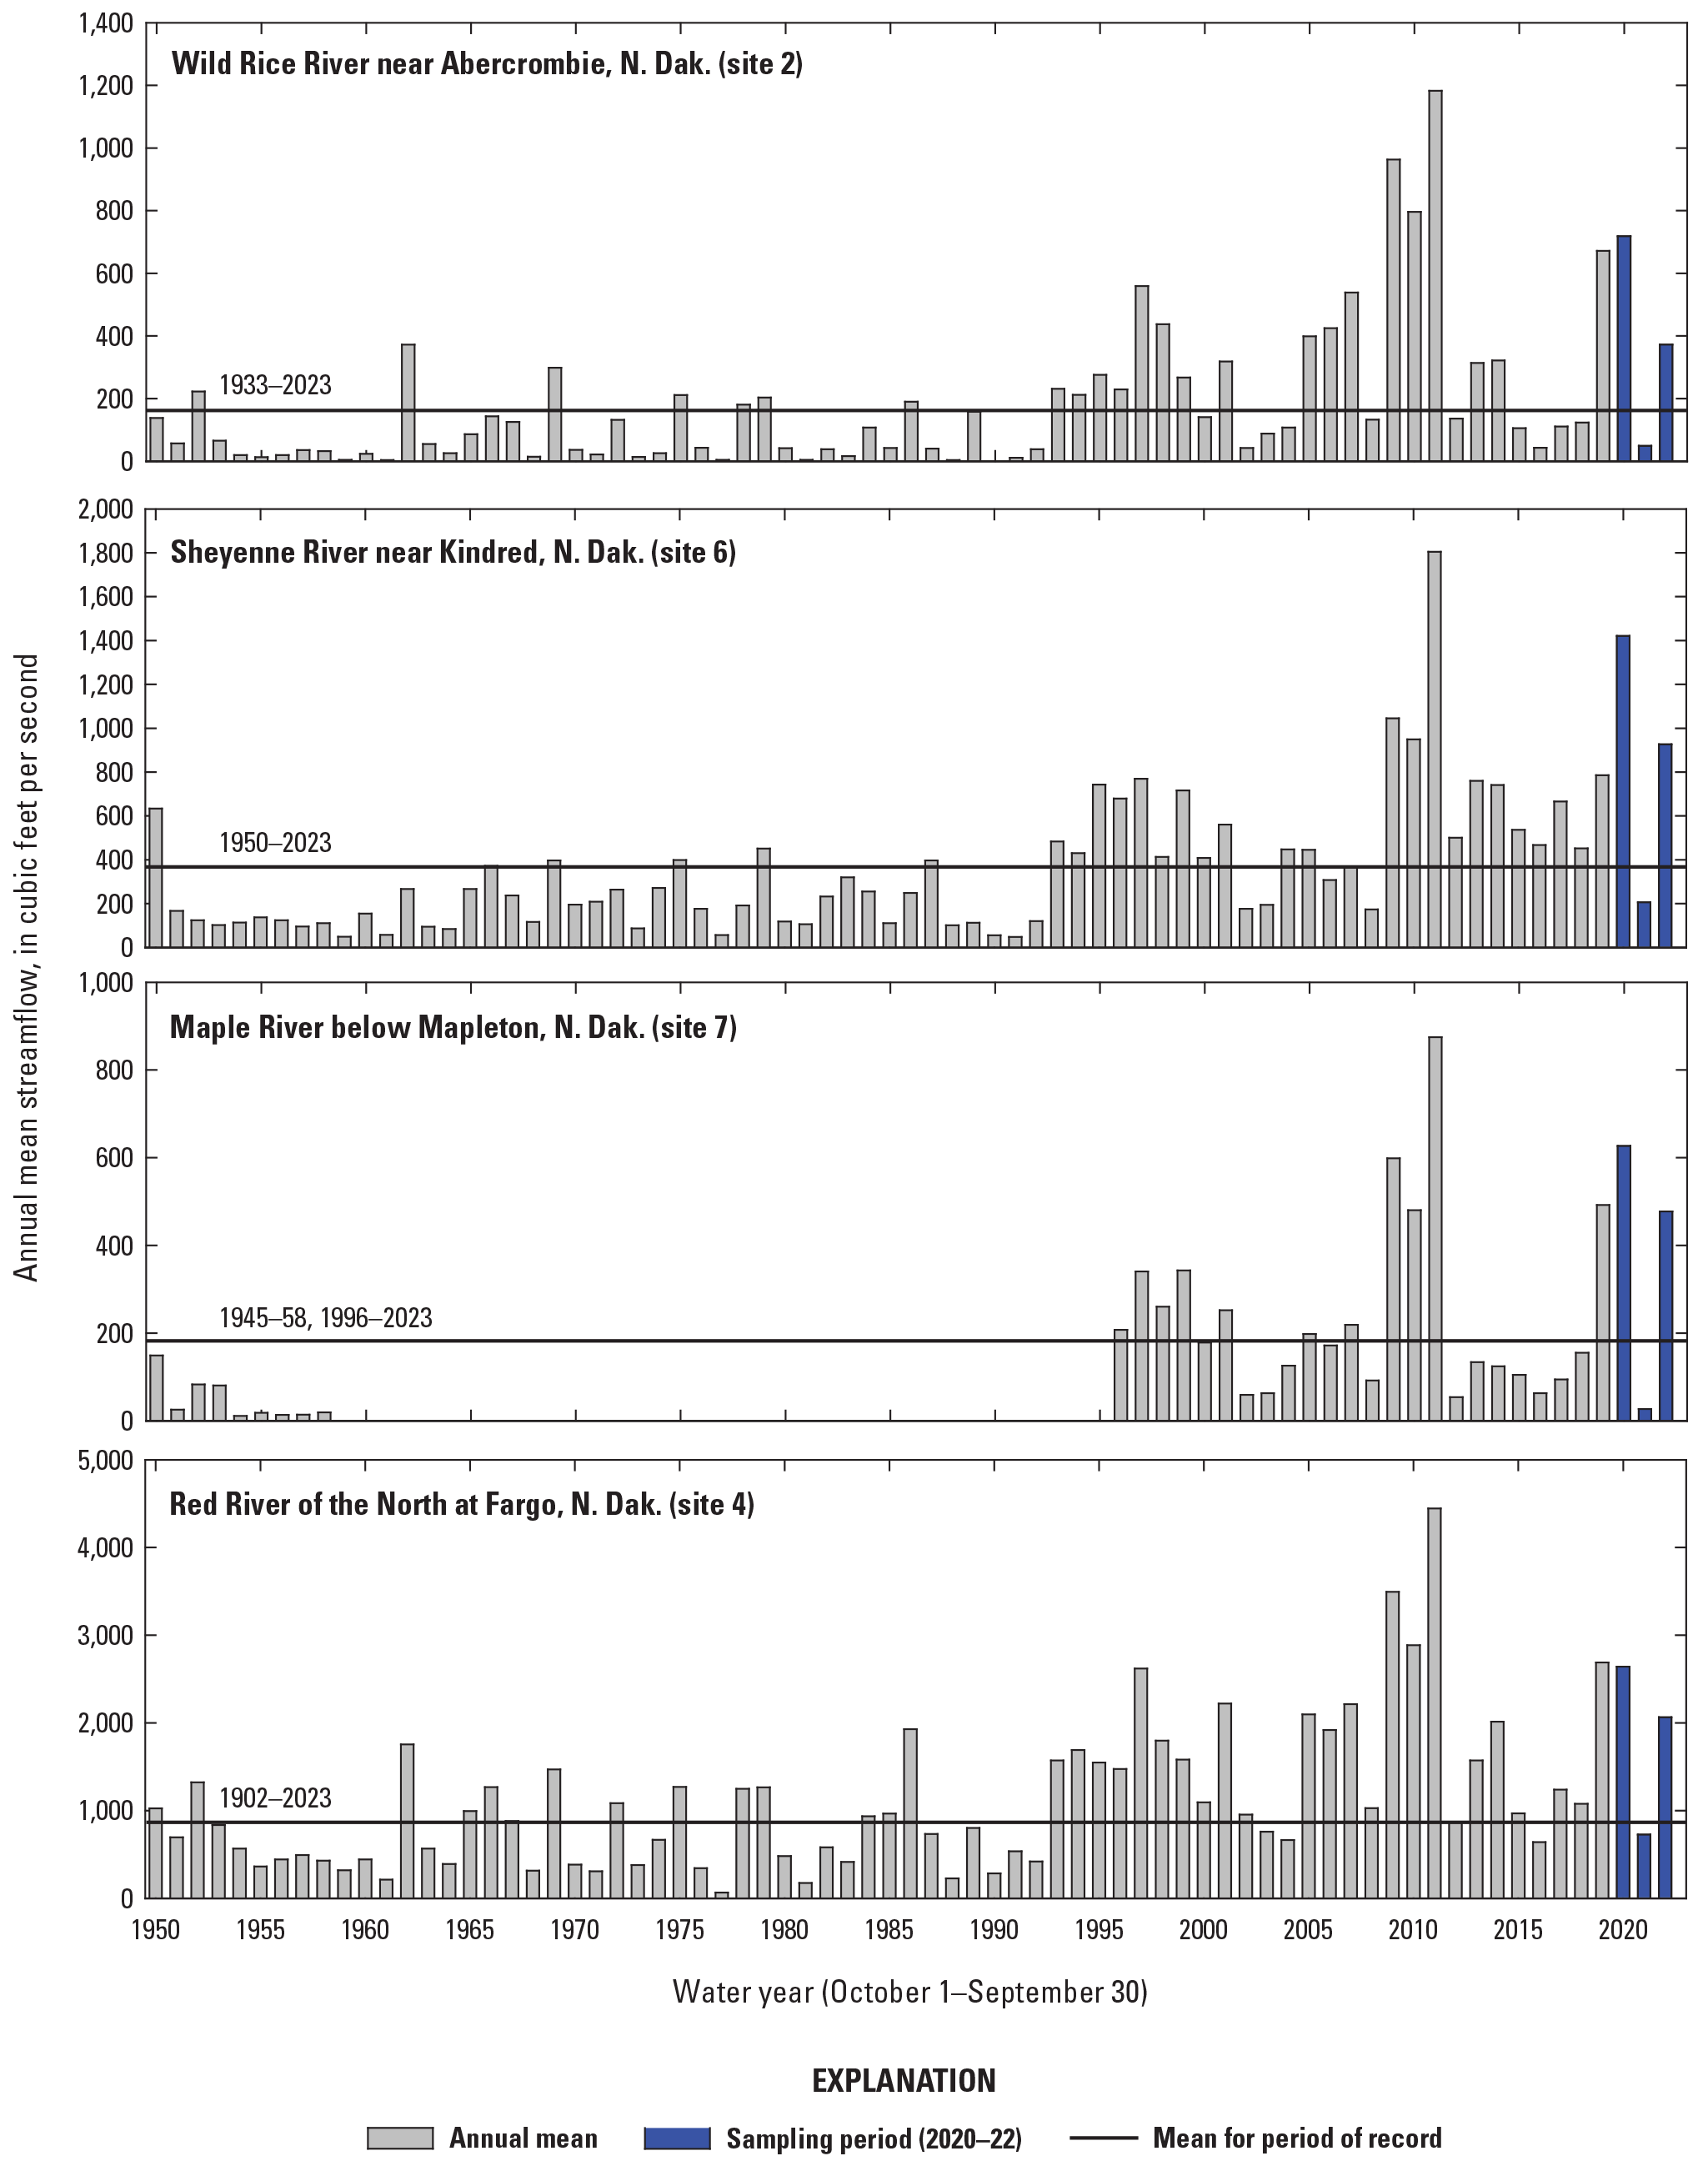
Annual mean streamflow for selected sites on the Red River of the North and tributaries in the Fargo-Moorhead metropolitan area, 1950 through 2022.
Samples were collected at five sites on the Red River and at five sites on the major tributaries west of the Red River, including the Wild Rice River, Maple River, and Sheyenne River (fig. 1). The Red River near Hickson, N. Dak. (USGS station 05051522; hereafter referred to as “site 1”) represents streamflow and water-quality conditions upstream from the Fargo-Moorhead metropolitan area. The Wild Rice River enters the Red River between site 1 and site 4 on the Red River and contributed about 21 to 29 percent of the annual mean streamflow at site 4 during 2022 and 2020, respectively, and only about 7 percent in 2021 when there were relatively low-streamflow conditions (table 6). The Maple River enters the Sheyenne River upstream from the Sheyenne River at Harwood, N. Dak. (USGS station 05054200; hereafter referred to as “site 8”) and contributed 29 and 32 percent of the annual streamflow in the Sheyenne River at site 8 in 2022 and 2020, respectively, and only about 11 percent of the annual streamflow in 2021 during relatively low-streamflow conditions (table 6). The Sheyenne River enters the Red River between sites 5 and 9 and contributed about 37 to 39 percent of the annual streamflow in the Red River at site 9 in 2022 and 2020, respectively, and about 22 percent of the annual streamflow in 2021.
Table 6.
Summary of annual mean streamflow at nine sites on the Red River of the North and tributaries in the Fargo-Moorhead metropolitan area, water years 2020 through 2022.[ID, identification; water years defined as October 1–September 30]
| Site ID (fig. 1) |
Site name | Annual mean streamflow (cubic feet per second) | Period of record (water years) | Mean streamflow for period of record | ||
|---|---|---|---|---|---|---|
| 2020 | 2021 | 2022 | ||||
| 1 | Red River of the North at Hickson, N. Dak. | 1,788 | 680 | 1,594 | 1976–2023 | 1,034 |
| 2 | Wild Rice River near Abercrombie, N. Dak. | 718 | 49 | 372 | 1933–2023 | 162 |
| 3 | Wild Rice River near St. Benedict, N. Dak. | 790 | 52 | 440 | 2020–23 | 427 |
| 4 | Red River of the North at Fargo, N. Dak. | 2,641 | 726 | 2,064 | 1902–2023 | 865 |
| 6 | Sheyenne River near Kindred. N. Dak. | 1,421 | 206 | 926 | 1950–2023 | 367 |
| 7 | Maple River below Mapleton, N. Dak. | 627 | 27 | 477 | 1945–58, 1996–2023 | 182 |
| 8 | Sheyenne River at Harwood, N. Dak. | 2,190 | 243 | 1,477 | 2020–23 | 1,303 |
| 9 | Red River of the North near Georgetown, Minn. | 5,593 | 1,092 | 3,924 | 2020–23 | 3,536 |
| 10 | Red River of the North at Halstad, Minn. | 7,022 | 1,267 | 4,887 | 1962–2023 | 2,785 |
Water-Quality Characteristics in the Fargo-Moorhead Metropolitan Area
Water-quality characteristics in the Fargo-Moorhead metropolitan area during the preconstruction phase of the Flood Risk Management Project were determined using a number of different methods from October 1, 2019, to October 1, 2022. Discrete water-quality samples were collected frequently at 10 sites on the Red River and its tributaries (fig. 1) for constituents including TDS, major ions, trace elements, nutrients, suspended sediment, pesticides, fecal indicator bacteria, and field measurements (table 2) to determine water-quality changes over time at various hydrologic conditions and the spatial variability of water quality among the sites. Constituent loads were estimated using streamflow data and the discrete water-quality sample data to determine the mass of the selected constituents being transported in the Red River and its tributaries. Continuous water-quality measurements including water temperature, specific conductance, DO, pH, and turbidity were recorded at three sites on the Red River to determine how water quality changes over shorter time scales such as daily or hourly time periods.
Spatial Characteristics
Discrete sample data for 10 sites were used to describe the spatial variability in water quality for the Red River and its tributaries in the Fargo-Moorhead metropolitan area from October 1, 2019, to October 1, 2022. Variability among the sites for TDS, selected major ions, trace elements, nutrients, sediment, pesticides, and fecal indicator bacteria constituents are described in the following section, and summary statistics are provided for all the constituents analyzed and field measurements taken for samples collected at the 10 sites.
Total Dissolved Solids and Major Ions
Discrete samples collected at the 10 sites in the Fargo-Moorhead metropolitan area were analyzed for TDS and major ion constituents including bicarbonate, calcium, chloride, fluoride, magnesium, potassium, silica, sodium, and sulfate. Variability in concentrations of major ions among the sites can depend on the variability of soils and geology in the watersheds that contribute to the sites, runoff and groundwater characteristics, and anthropogenic factors (Hem, 1985). Different soils and geologic units can produce different compositions of dissolved ions and can be delivered to streams from groundwater inputs and the interaction of precipitation and runoff with soils. In general, groundwater tends to have higher concentrations of dissolved ions because of longer contact time with the geological material compared to concentrations in snowmelt and rainfall runoff that has relatively less contact time with the surficial geology and soils before entering a stream.
Major ion concentrations were generally higher at sites on the tributaries (Wild Rice, Sheyenne, and Maple Rivers) compared to sites on the Red River (table 7, fig. 4). Saline soils in North Dakota contain a mixture of salts, with sulfates being the most dominant form (Franzen, 2007). Sulfur is abundant in the soils throughout the Red River Basin but is especially abundant in the saline soils of the western part of the basin in North Dakota (Stoner and others, 1993). Surficial aquifers west of the Red River in North Dakota that could contribute flow to the tributaries also generally have much higher dissolved solids compared to aquifer units east of the Red River in Minnesota (Cowdery, 1998). Several tributaries enter the Red River from the east including the Buffalo River (just upstream from site 9), Otter Tail River (upstream from site 1), Wolverton Creek (between sites 1 and 4), and Wild Rice River (between sites 9 and 10; fig. 1), and the major ion concentrations in the Red River represent a mixture of the various tributaries from different portions of the basin.
TDS represent a sum of all dissolved ions in the water sample, and the composition of ions that make up the TDS can vary from sample to sample. The highest TDS concentrations among the 10 sites were measured in samples collected at sites on the Wild Rice River with median concentrations of 1,135 mg/L at site 2 and 1,130 mg/L at the Wild Rice River near St. Benedict, N.Dak., (USGS station 05053500; hereafter referred to as “site 3”; table 7 and fig. 4). The Maple River (site 7) also had relatively high TDS with a median concentration of 977 mg/L. The Sheyenne River sites (sites 6 and 8) had median concentrations of 848 and 858 mg/L, respectively. In comparison, the median concentrations for the Red River ranged from 548 mg/L (site 1) to 730 mg/L (site 9). In addition to natural sources of dissolved ions, runoff from urban areas also can increase concentrations in streams, which may partially explain why TDS concentrations increase in the Red River from site 1 to site 9. Concentrations decrease downstream at the Red River of the North near Halstad, Minn. (USGS station 05064500; hereafter referred to as “site 10”), likely because of inputs from the Wild Rice River from the Minnesota side of the basin.
In general, bicarbonate, calcium, magnesium, and sulfate represented the largest fraction of dissolved ions measured in samples collected at the 10 sites (table 7). Calcium, chloride, fluoride, potassium, silica, and sodium were also measured in samples, but they represented a smaller portion of the dissolved ions. Bicarbonate concentration was similar among the sites, with slightly higher median concentrations at sites on the Wild Rice and Sheyenne Rivers. Median bicarbonate concentrations were 363 and 357 mg/L for sites 2 and 3 on the Wild Rice River, respectively, and 350 and 330 mg/L for sites 6 and 8 on the Sheyenne River, respectively (table 7). Median concentrations for all other sites ranged from 254 mg/L (site 1) to 298 mg/L (site 7). Calcium was also the highest among the sites at the Wild Rice River, with median concentrations of 119 and 120 mg/L at sites 2 and 3, respectively, followed by the Maple River (site 7) with a median concentration of 107 mg/L (table 7 and fig. 4). All other sites had median calcium concentrations ranging from 63 mg/L (site 1) to 89 mg/L (site 8). Similarly, magnesium was the highest among the sites at the Wild Rice River, with median concentrations of 97 and 95 mg/L at sites 2 and 3, respectively, followed by the Maple River (site 7) with a median concentration of 75 mg/L. All other sites had median magnesium concentrations ranging from 55 mg/L (sites 4 and 10) to 60 mg/L (site 5).
Sulfate was the most dominant dissolved ion that had the highest concentrations among the major ions measured in samples collected at the 10 sites (table 7 and fig. 4). Nustad and Vecchia (2020) determined that sulfate significantly increased from 2000 to 2015 in the Red River Basin, including at sites described in this report (sites 2, 4, 5, 6, 7, and 10). Similar to the other major ions, sulfate concentration was the highest among the sites at the Wild Rice River, with median concentrations of 593 and 584 mg/L at sites 2 and 3, respectively, followed by the Maple River (site 7) with a median concentration of 464 mg/L. Sites on the Red River had median sulfate concentrations ranging from 243 mg/L (site 1) to 325 mg/L (site 5). As a comparison to historical data, the median sulfate concentration for samples collected from 1995 to 2017 described in Nustad and Vecchia (2020) were 489 mg/L for site 2, 158 mg/L for site 4, and 441 mg/L for site 7.
Table 7.
Summary of major ion constituent data from samples collected at 10 sites in the Fargo-Moorhead metropolitan area, October 1, 2019, to October 1, 2022.[ID, identification; Min, minimum; Max, maximum]
| Site ID (fig. 1) | River name | Number of observations | Number of censored observations | Percent of data censored | Min | Max | 10th percentile | 25th percentile | 50th percentile | 75th percentile | 90th percentile |
|---|---|---|---|---|---|---|---|---|---|---|---|
| 1 | Red River of the North | 24 | 0 | 0 | 276 | 1,090 | 299 | 365 | 548 | 759 | 816 |
| 2 | Wild Rice River | 24 | 0 | 0 | 581 | 1,630 | 942 | 1,065 | 1,135 | 1,360 | 1,537 |
| 3 | Wild Rice River | 23 | 0 | 0 | 447 | 1,830 | 931 | 1,060 | 1,130 | 1,455 | 1,598 |
| 4 | Red River of the North | 24 | 0 | 0 | 344 | 1,010 | 360 | 436 | 611 | 856 | 901 |
| 5 | Red River of the North | 29 | 0 | 0 | 370 | 1,090 | 390 | 520 | 677 | 867 | 945 |
| 6 | Sheyenne River | 29 | 0 | 0 | 525 | 1,200 | 619 | 725 | 848 | 976 | 1,084 |
| 7 | Maple River | 30 | 0 | 0 | 429 | 1,840 | 560 | 784 | 977 | 1,315 | 1,608 |
| 8 | Sheyenne River | 29 | 0 | 0 | 506 | 1,250 | 559 | 703 | 858 | 1,060 | 1,156 |
| 9 | Red River of the North | 29 | 0 | 0 | 410 | 1,000 | 544 | 653 | 730 | 800 | 881 |
| 10 | Red River of the North | 29 | 0 | 0 | 347 | 969 | 440 | 563 | 663 | 749 | 852 |
| 1 | Red River of the North | 24 | 0 | 0 | 188 | 328 | 233 | 246 | 254 | 273 | 288 |
| 2 | Wild Rice River | 24 | 0 | 0 | 174 | 572 | 282 | 323 | 363 | 392 | 504 |
| 3 | Wild Rice River | 24 | 0 | 0 | 165 | 559 | 269 | 307 | 357 | 411 | 504 |
| 4 | Red River of the North | 24 | 0 | 0 | 184 | 353 | 240 | 254 | 270 | 286 | 305 |
| 5 | Red River of the North | 30 | 0 | 0 | 173 | 339 | 224 | 248 | 267 | 294 | 306 |
| 6 | Sheyenne River | 30 | 0 | 0 | 217 | 478 | 256 | 301 | 350 | 377 | 390 |
| 7 | Maple River | 30 | 0 | 0 | 151 | 586 | 180 | 240 | 298 | 362 | 447 |
| 8 | Sheyenne River | 30 | 0 | 0 | 193 | 488 | 227 | 282 | 330 | 364 | 404 |
| 9 | Red River of the North | 30 | 0 | 0 | 185 | 385 | 206 | 275 | 291 | 321 | 343 |
| 10 | Red River of the North | 30 | 0 | 0 | 172 | 392 | 200 | 255 | 289 | 313 | 335 |
| 1 | Red River of the North | 24 | 0 | 0 | 38 | 101 | 43 | 46 | 63 | 83 | 95 |
| 2 | Wild Rice River | 24 | 0 | 0 | 65 | 186 | 93 | 113 | 119 | 132 | 143 |
| 3 | Wild Rice River | 23 | 0 | 0 | 55 | 179 | 97 | 110 | 120 | 142 | 153 |
| 4 | Red River of the North | 24 | 0 | 0 | 45 | 100 | 49 | 54 | 71 | 88 | 95 |
| 5 | Red River of the North | 29 | 0 | 0 | 48 | 99 | 52 | 57 | 80 | 88 | 95 |
| 6 | Sheyenne River | 29 | 0 | 0 | 58 | 110 | 64 | 71 | 87 | 94 | 100 |
| 7 | Maple River | 30 | 0 | 0 | 53 | 216 | 64 | 85 | 107 | 140 | 172 |
| 8 | Sheyenne River | 29 | 0 | 0 | 59 | 129 | 64 | 67 | 89 | 102 | 107 |
| 9 | Red River of the North | 29 | 0 | 0 | 52 | 104 | 64 | 72 | 79 | 84 | 92 |
| 10 | Red River of the North | 29 | 0 | 0 | 44 | 104 | 57 | 63 | 76 | 81 | 92 |
| 1 | Red River of the North | 24 | 0 | 0 | 14 | 27 | 15 | 15 | 17 | 22 | 25 |
| 2 | Wild Rice River | 24 | 0 | 0 | 21 | 62 | 27 | 32 | 38 | 49 | 60 |
| 3 | Wild Rice River | 24 | 0 | 0 | 16 | 105 | 26 | 30 | 41 | 53 | 62 |
| 4 | Red River of the North | 24 | 0 | 0 | 16 | 33 | 17 | 19 | 21 | 27 | 31 |
| 5 | Red River of the North | 30 | 0 | 0 | 14 | 55 | 19 | 22 | 26 | 32 | 36 |
| 6 | Sheyenne River | 30 | 0 | 0 | 16 | 77 | 25 | 30 | 41 | 51 | 63 |
| 7 | Maple River | 30 | 0 | 0 | 20 | 110 | 23 | 34 | 46 | 70 | 96 |
| 8 | Sheyenne River | 30 | 0 | 0 | 19 | 89 | 21 | 30 | 41 | 55 | 70 |
| 9 | Red River of the North | 30 | 0 | 0 | 15 | 52 | 19 | 25 | 30 | 36 | 46 |
| 10 | Red River of the North | 30 | 0 | 0 | 14 | 50 | 16 | 23 | 26 | 31 | 40 |
| 1 | Red River of the North | 24 | 0 | 0 | 0.12 | 0.26 | 0.14 | 0.14 | 0.16 | 0.19 | 0.22 |
| 2 | Wild Rice River | 24 | 0 | 0 | 0.13 | 0.39 | 0.18 | 0.21 | 0.27 | 0.31 | 0.33 |
| 3 | Wild Rice River | 24 | 0 | 0 | 0.14 | 0.38 | 0.19 | 0.22 | 0.26 | 0.30 | 0.34 |
| 4 | Red River of the North | 24 | 0 | 0 | 0.12 | 0.28 | 0.14 | 0.15 | 0.18 | 0.21 | 0.24 |
| 5 | Red River of the North | 30 | 0 | 0 | 0.13 | 0.32 | 0.16 | 0.17 | 0.22 | 0.24 | 0.28 |
| 6 | Sheyenne River | 30 | 0 | 0 | 0.09 | 0.32 | 0.15 | 0.18 | 0.21 | 0.22 | 0.24 |
| 7 | Maple River | 30 | 0 | 0 | 0.09 | 0.32 | 0.13 | 0.18 | 0.22 | 0.24 | 0.28 |
| 8 | Sheyenne River | 30 | 0 | 0 | 0.09 | 0.30 | 0.15 | 0.18 | 0.21 | 0.24 | 0.27 |
| 9 | Red River of the North | 30 | 0 | 0 | 0.11 | 0.28 | 0.15 | 0.18 | 0.22 | 0.23 | 0.25 |
| 10 | Red River of the North | 30 | 0 | 0 | 0.11 | 0.29 | 0.16 | 0.18 | 0.20 | 0.23 | 0.27 |
| 1 | Red River of the North | 24 | 0 | 0 | 28 | 111 | 31 | 34 | 56 | 72 | 82 |
| 2 | Wild Rice River | 24 | 0 | 0 | 43 | 136 | 83 | 88 | 97 | 110 | 122 |
| 3 | Wild Rice River | 23 | 0 | 0 | 33 | 154 | 81 | 90 | 95 | 118 | 135 |
| 4 | Red River of the North | 24 | 0 | 0 | 34 | 102 | 36 | 39 | 55 | 75 | 88 |
| 5 | Red River of the North | 29 | 0 | 0 | 32 | 112 | 34 | 43 | 60 | 81 | 91 |
| 6 | Sheyenne River | 29 | 0 | 0 | 33 | 73 | 40 | 49 | 57 | 67 | 71 |
| 7 | Maple River | 30 | 0 | 0 | 28 | 137 | 38 | 61 | 75 | 92 | 121 |
| 8 | Sheyenne River | 29 | 0 | 0 | 33 | 83 | 38 | 49 | 59 | 71 | 77 |
| 9 | Red River of the North | 29 | 0 | 0 | 32 | 85 | 43 | 49 | 59 | 70 | 78 |
| 10 | Red River of the North | 29 | 0 | 0 | 27 | 83 | 34 | 43 | 55 | 68 | 75 |
| 1 | Red River of the North | 24 | 0 | 0 | 3.3 | 18.4 | 3.7 | 4.2 | 5.0 | 5.9 | 6.7 |
| 2 | Wild Rice River | 24 | 0 | 0 | 10.2 | 16.5 | 11.3 | 11.8 | 13.1 | 14.0 | 15.1 |
| 3 | Wild Rice River | 23 | 0 | 0 | 9.5 | 17.0 | 10.6 | 11.9 | 13.0 | 13.8 | 15.0 |
| 4 | Red River of the North | 24 | 0 | 0 | 3.8 | 10.9 | 4.4 | 4.9 | 6.2 | 7.2 | 8.0 |
| 5 | Red River of the North | 29 | 0 | 0 | 4.8 | 9.4 | 5.3 | 6.6 | 7.4 | 8.1 | 8.6 |
| 6 | Sheyenne River | 29 | 0 | 0 | 9.4 | 20.0 | 10.0 | 10.8 | 12.5 | 15.4 | 18.2 |
| 7 | Maple River | 30 | 0 | 0 | 7.7 | 17.5 | 8.5 | 9.6 | 10.0 | 11.9 | 14.9 |
| 8 | Sheyenne River | 29 | 0 | 0 | 9.2 | 18.8 | 9.3 | 10.1 | 11.6 | 13.4 | 17.2 |
| 9 | Red River of the North | 29 | 0 | 0 | 6.4 | 11.5 | 7.3 | 7.8 | 8.6 | 9.7 | 10.4 |
| 10 | Red River of the North | 29 | 0 | 0 | 6.3 | 11.6 | 6.7 | 7.3 | 8.2 | 8.9 | 9.9 |
| 1 | Red River of the North | 24 | 0 | 0 | 7.2 | 23.9 | 9.0 | 11.9 | 16.6 | 19.0 | 20.2 |
| 2 | Wild Rice River | 24 | 0 | 0 | 6.1 | 29.7 | 9.1 | 16.0 | 19.3 | 25.5 | 26.3 |
| 3 | Wild Rice River | 24 | 0 | 0 | 4.3 | 29.4 | 7.7 | 13.5 | 19.5 | 24.7 | 26.1 |
| 4 | Red River of the North | 24 | 0 | 0 | 6.8 | 22.3 | 9.7 | 13.1 | 17.3 | 19.2 | 21.3 |
| 5 | Red River of the North | 30 | 0 | 0 | 4.1 | 23.3 | 9.2 | 13.3 | 16.6 | 18.8 | 21.1 |
| 6 | Sheyenne River | 30 | 0 | 0 | 2.6 | 28.3 | 15.5 | 17.0 | 20.2 | 23.1 | 25.5 |
| 7 | Maple River | 30 | 0 | 0 | 2.8 | 31.1 | 7.8 | 15.0 | 19.3 | 23.8 | 27.6 |
| 8 | Sheyenne River | 30 | 0 | 0 | 2.1 | 28.6 | 15.1 | 17.3 | 19.4 | 21.6 | 24.1 |
| 9 | Red River of the North | 30 | 0 | 0 | 4.0 | 24.6 | 11.6 | 15.9 | 17.8 | 20.7 | 22.7 |
| 10 | Red River of the North | 30 | 0 | 0 | 5.4 | 24.2 | 11.0 | 15.4 | 18.1 | 20.1 | 22.5 |
| 1 | Red River of the North | 24 | 0 | 0 | 11 | 77 | 14 | 19 | 30 | 40 | 44 |
| 2 | Wild Rice River | 24 | 0 | 0 | 47 | 170 | 76 | 83 | 99 | 124 | 166 |
| 3 | Wild Rice River | 23 | 0 | 0 | 30 | 204 | 74 | 79 | 98 | 133 | 173 |
| 4 | Red River of the North | 24 | 0 | 0 | 17 | 80 | 20 | 26 | 37 | 50 | 60 |
| 5 | Red River of the North | 29 | 0 | 0 | 19 | 90 | 24 | 37 | 44 | 56 | 65 |
| 6 | Sheyenne River | 29 | 0 | 0 | 52 | 181 | 67 | 82 | 100 | 124 | 154 |
| 7 | Maple River | 30 | 0 | 0 | 33 | 218 | 41 | 63 | 87 | 128 | 160 |
| 8 | Sheyenne River | 29 | 0 | 0 | 44 | 191 | 51 | 71 | 95 | 127 | 157 |
| 9 | Red River of the North | 29 | 0 | 0 | 27 | 96 | 38 | 51 | 62 | 75 | 91 |
| 10 | Red River of the North | 29 | 0 | 0 | 22 | 94 | 28 | 45 | 55 | 64 | 87 |
| 1 | Red River of the North | 24 | 0 | 0 | 32 | 607 | 44 | 75 | 243 | 378 | 423 |
| 2 | Wild Rice River | 24 | 0 | 0 | 285 | 895 | 467 | 511 | 593 | 706 | 766 |
| 3 | Wild Rice River | 24 | 0 | 0 | 199 | 994 | 458 | 518 | 584 | 743 | 836 |
| 4 | Red River of the North | 24 | 0 | 0 | 59 | 542 | 86 | 135 | 282 | 404 | 475 |
| 5 | Red River of the North | 30 | 0 | 0 | 65 | 570 | 107 | 172 | 325 | 456 | 490 |
| 6 | Sheyenne River | 30 | 0 | 0 | 221 | 514 | 262 | 295 | 353 | 414 | 470 |
| 7 | Maple River | 30 | 0 | 0 | 185 | 975 | 269 | 382 | 464 | 630 | 847 |
| 8 | Sheyenne River | 30 | 0 | 0 | 205 | 535 | 246 | 310 | 375 | 465 | 515 |
| 9 | Red River of the North | 30 | 0 | 0 | 157 | 459 | 192 | 255 | 319 | 388 | 414 |
| 10 | Red River of the North | 30 | 0 | 0 | 123 | 421 | 157 | 193 | 265 | 344 | 386 |
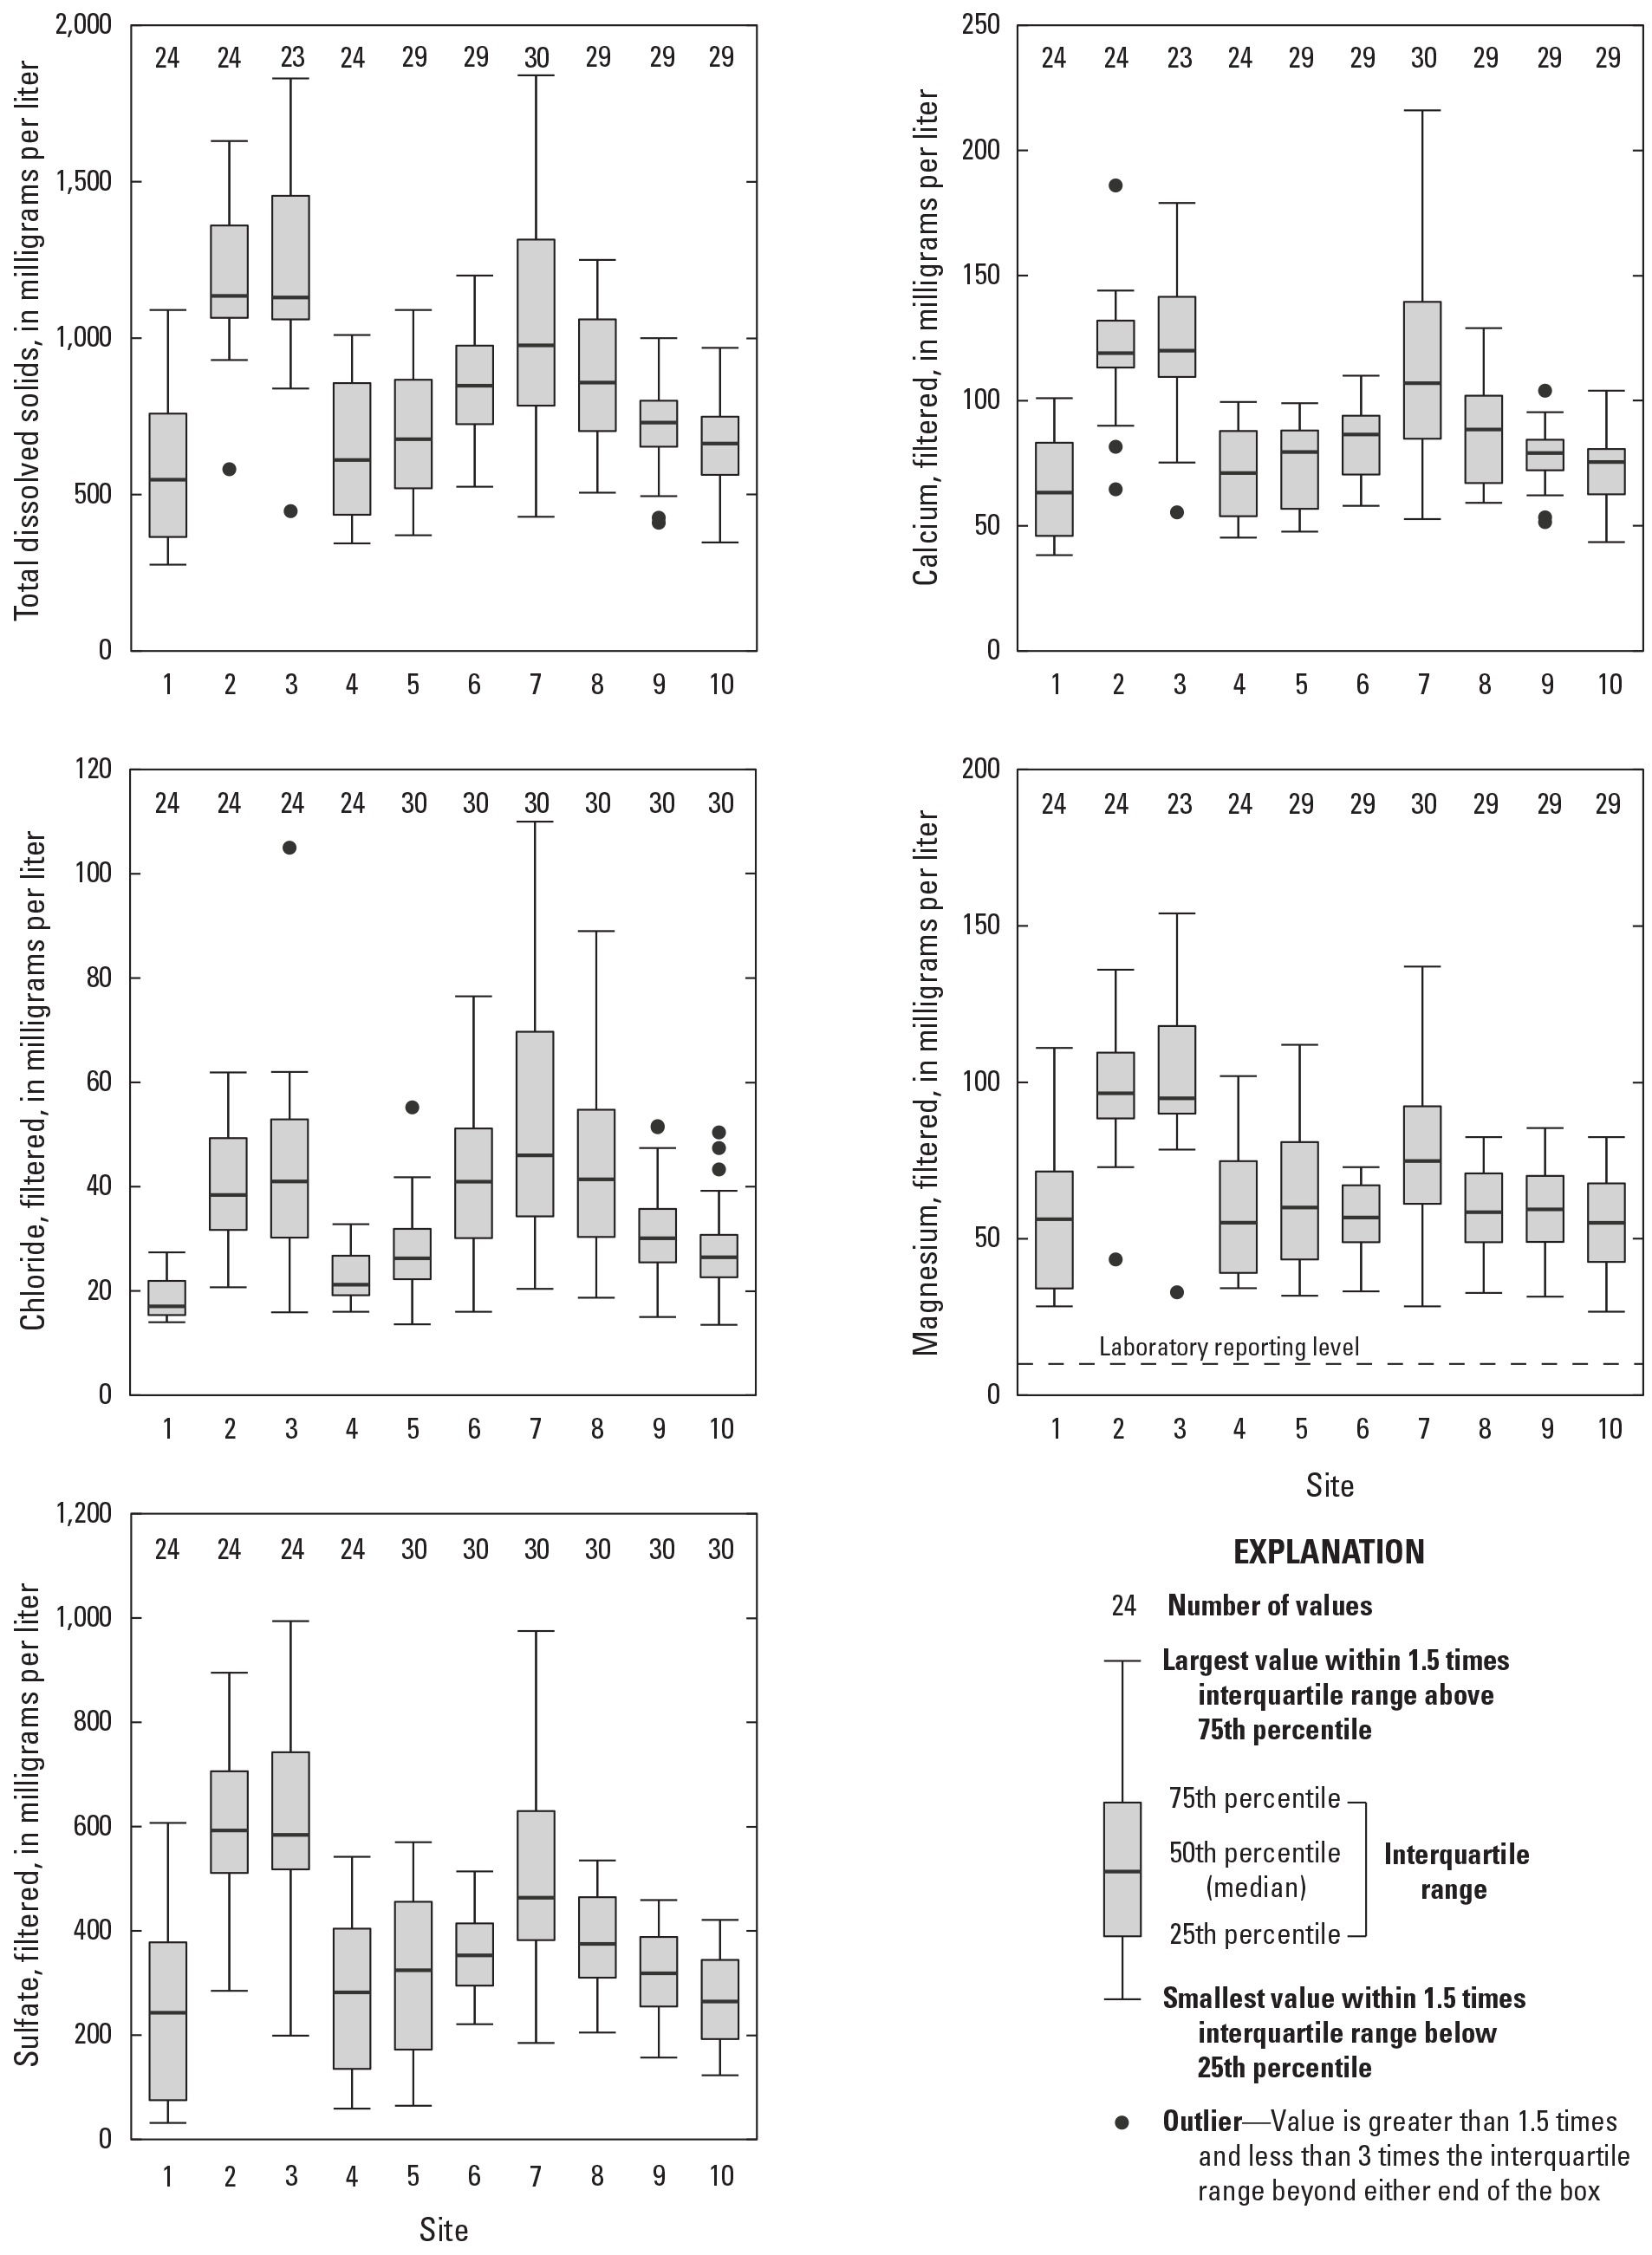
Distribution of concentrations for total dissolved solids, calcium, chloride, magnesium, and sulfate from samples collected at 10 sites in the Fargo-Moorhead metropolitan area from October 1, 2019, to October 1, 2022.
Trace Elements
A total of 18 trace elements were analyzed in discrete samples collected at the 10 sites in the Fargo-Moorhead metropolitan area from October 1, 2019, to October 1, 2022 (table 8). Several of the trace elements had concentrations below the laboratory reporting level in all samples, including antimony, beryllium, cadmium, chromium, silver, and thallium. Most of the other trace elements were only detected in a small portion of samples and at concentrations near the laboratory reporting level. Trace elements that were frequently detected in samples included barium, boron, manganese, and nickel.
The Wild Rice River generally had the highest concentrations of barium, boron, manganese, and nickel compared to the other sites (table 8 and fig. 5). Arsenic was not detected in most samples collected at the 10 sites except at the Wild Rice River at sites 2 and 3 that had median concentrations of 6.2 and 5.8 micrograms per liter (μg/L), respectively (table 8). The highest concentrations measured at sites 2 and 3 were 21.4 and 21.3 μg/L, respectively, although the highest concentration measured among all sites was 33.4 μg/L on the Maple River (site 7). Barium was detected in all samples collected at the 10 sites, with the highest median concentrations at sites on the Wild Rice River (sites 2 and 3) and sites 1 and 4 on the Red River. Median concentrations ranged from 53.6 μg/L at the Sheyenne River (site 6) to 64.6 μg/L at the Wild Rice River (site 3). Boron had the highest concentrations at sites 2 and 3 on the Wild Rice River with median concentrations of 210 and 211 μg/L, respectively. Median boron concentrations for the other sites ranged from 78 μg/L (site 1) to 180 μg/L (site 6). For manganese, sites on the three tributaries (Wild Rice, Sheyenne, and Maple Rivers) had higher concentrations compared to the Red River sites. Median concentrations of manganese were 73 and 63 μg/L for sites 2 and 3 on the Wild Rice River, respectively; 75 and 71 μg/L for sites 6 and 8 on the Sheyenne River, respectively; and 72 μg/L at site 7 on the Maple River (table 8). In comparison, median concentrations of manganese ranged from less than 10 μg/L (sites 1 and 5) to 15 μg/L (site 10) on the Red River. Nickel had the highest median concentrations at sites 2 and 3 on the Wild Rice River with values of 7.5 and 7.9 μg/L, respectively. Median nickel concentrations for all the other sites ranged from less than 5 μg/L (sites 1, 4, and 5) to 7.4 μg/L (site 6).
Table 8.
Summary of trace element constituent data from samples collected at 10 sites in the Fargo-Moorhead metropolitan area, October 1, 2019, to October 1, 2022.[ID, identification; Min, minimum; Max, maximum; <, less than; all samples were analyzed for antimony, beryllium, cadmium, chromium, silver, thallium, but they were not detected in any samples, not included in this table]
| Site ID (fig. 1) | River name | Number of observations | Number of censored observations | Percent of data censored | Min | Max | 10th percentile | 25th percentile | 50th percentile | 75th percentile | 90th percentile | |
|---|---|---|---|---|---|---|---|---|---|---|---|---|
| 1 | Red River of the North | 24 | 23 | 96 | <50 | 60 | <50 | <50 | <50 | <50 | <50 | |
| 2 | Wild Rice River | 24 | 20 | 83 | <50 | 120 | <50 | <50 | <50 | <50 | 71 | |
| 3 | Wild Rice River | 24 | 22 | 92 | <50 | 600 | <50 | <50 | <50 | <50 | <50 | |
| 4 | Red River of the North | 24 | 21 | 88 | <50 | 760 | <50 | <50 | <50 | <50 | 71 | |
| 5 | Red River of the North | 30 | 28 | 93 | <50 | 396 | <50 | <50 | <50 | <50 | <50 | |
| 6 | Sheyenne River | 30 | 23 | 77 | <50 | 580 | <50 | <50 | <50 | <50 | 144 | |
| 7 | Maple River | 30 | 17 | 57 | <50 | 1,190 | <50 | <50 | <50 | 86 | 156 | |
| 8 | Sheyenne River | 30 | 22 | 73 | <50 | 150 | <50 | <50 | <50 | <50 | 90 | |
| 9 | Red River of the North | 30 | 26 | 87 | <50 | 284 | <50 | <50 | <50 | <50 | 81 | |
| 10 | Red River of the North | 30 | 21 | 70 | <50 | 330 | <50 | <50 | <50 | 65 | 111 | |
| 1 | Red River of the North | 24 | 22 | 92 | <5.0 | 6.0 | <5.0 | <5.0 | <5.0 | <5.0 | <5.0 | |
| 2 | Wild Rice River | 24 | 5 | 21 | <5.0 | 21.4 | <5.0 | 5.4 | 6.2 | 11.2 | 16.6 | |
| 3 | Wild Rice River | 24 | 7 | 29 | <5.0 | 21.3 | <5.0 | <5.0 | 5.8 | 11.4 | 13.7 | |
| 4 | Red River of the North | 24 | 17 | 71 | <5.0 | 8.2 | <5.0 | <5.0 | <5.0 | 5.3 | 5.7 | |
| 5 | Red River of the North | 30 | 25 | 83 | <5.0 | 8.0 | <5.0 | <5.0 | <5.0 | <5.0 | 5.4 | |
| 6 | Sheyenne River | 30 | 17 | 57 | <5.0 | 10.2 | <5.0 | <5.0 | <5.0 | 7.0 | 8.3 | |
| 7 | Maple River | 30 | 20 | 67 | <5.0 | 33.4 | <5.0 | <5.0 | <5.0 | 7.4 | 11.5 | |
| 8 | Sheyenne River | 30 | 19 | 63 | <5.0 | 10.4 | <5.0 | <5.0 | <5.0 | 6.7 | 9.4 | |
| 9 | Red River of the North | 30 | 21 | 70 | <5.0 | 8.8 | <5.0 | <5.0 | <5.0 | 5.6 | 7.4 | |
| 10 | Red River of the North | 30 | 20 | 67 | <5.0 | 9.3 | <5.0 | <5.0 | <5.0 | 5.5 | 8.1 | |
| 1 | Red River of the North | 24 | 0 | 0 | 45.6 | 85.2 | 53.8 | 55.6 | 62.3 | 68.9 | 73.0 | |
| 2 | Wild Rice River | 24 | 0 | 0 | 43.7 | 88.9 | 56.7 | 58.1 | 63.0 | 75.1 | 77.0 | |
| 3 | Wild Rice River | 24 | 0 | 0 | 27.4 | 85.1 | 53.0 | 57.5 | 64.6 | 72.6 | 76.5 | |
| 4 | Red River of the North | 24 | 0 | 0 | 46.0 | 88.3 | 52.9 | 59.7 | 63.5 | 70.6 | 79.1 | |
| 5 | Red River of the North | 30 | 0 | 0 | 25.7 | 74.4 | 52.6 | 56.3 | 60.1 | 65.2 | 71.4 | |
| 6 | Sheyenne River | 30 | 0 | 0 | 29.6 | 81.9 | 39.6 | 46.4 | 53.6 | 73.8 | 79.7 | |
| 7 | Maple River | 30 | 0 | 0 | 31.0 | 108.0 | 44.6 | 49.6 | 55.4 | 72.1 | 79.3 | |
| 8 | Sheyenne River | 30 | 0 | 0 | 17.7 | 87.9 | 40.3 | 47.9 | 53.9 | 67.1 | 76.3 | |
| 9 | Red River of the North | 30 | 0 | 0 | 18.2 | 77.2 | 45.5 | 51.8 | 58.8 | 61.6 | 70.6 | |
| 10 | Red River of the North | 30 | 0 | 0 | 30.0 | 90.0 | 41.2 | 47.4 | 55.1 | 63.1 | 70.3 | |
| 1 | Red River of the North | 24 | 0 | 0 | 51 | 128 | 66 | 73 | 78 | 93 | 113 | |
| 2 | Wild Rice River | 24 | 0 | 0 | 103 | 484 | 127 | 159 | 210 | 267 | 385 | |
| 3 | Wild Rice River | 24 | 1 | 4 | <50 | 424 | 109 | 153 | 211 | 258 | 371 | |
| 4 | Red River of the North | 24 | 0 | 0 | 68 | 138 | 74 | 78 | 96 | 117 | 126 | |
| 5 | Red River of the North | 30 | 1 | 3 | 50 | 144 | 78 | 92 | 101 | 119 | 135 | |
| 6 | Sheyenne River | 30 | 1 | 3 | 50 | 253 | 112 | 144 | 180 | 207 | 234 | |
| 7 | Maple River | 30 | 0 | 0 | 81 | 356 | 91 | 107 | 176 | 245 | 275 | |
| 8 | Sheyenne River | 30 | 1 | 3 | <50 | 300 | 101 | 118 | 154 | 217 | 232 | |
| 9 | Red River of the North | 30 | 1 | 3 | <50 | 178 | 86 | 103 | 128 | 146 | 167 | |
| 10 | Red River of the North | 30 | 1 | 3 | <50 | 238 | 77 | 96 | 122 | 138 | 165 | |
| 1 | Red River of the North | 24 | 24 | 100 | <5.0 | <5.0 | <5.0 | <5.0 | <5.0 | <5.0 | <5.0 | |
| 2 | Wild Rice River | 24 | 24 | 100 | <5.0 | <5.0 | <5.0 | <5.0 | <5.0 | <5.0 | <5.0 | |
| 3 | Wild Rice River | 24 | 24 | 100 | <5.0 | <5.0 | <5.0 | <5.0 | <5.0 | <5.0 | <5.0 | |
| 4 | Red River of the North | 24 | 24 | 100 | <5.0 | <5.0 | <5.0 | <5.0 | <5.0 | <5.0 | <5.0 | |
| 5 | Red River of the North | 30 | 30 | 100 | <5.0 | <5.0 | <5.0 | <5.0 | <5.0 | <5.0 | <5.0 | |
| 6 | Sheyenne River | 30 | 28 | 93 | <5.0 | 6.0 | <5.0 | <5.0 | <5.0 | <5.0 | <5.0 | |
| 7 | Maple River | 30 | 28 | 93 | <5.0 | 13.3 | <5.0 | <5.0 | <5.0 | <5.0 | <5.0 | |
| 8 | Sheyenne River | 30 | 29 | 97 | <5.0 | 5.4 | <5.0 | <5.0 | <5.0 | <5.0 | <5.0 | |
| 9 | Red River of the North | 30 | 28 | 93 | <5.0 | 5.2 | <5.0 | <5.0 | <5.0 | <5.0 | <5.0 | |
| 10 | Red River of the North | 30 | 29 | 97 | <5.0 | 6.4 | <5.0 | <5.0 | <5.0 | <5.0 | <5.0 | |
| 1 | Red River of the North | 24 | 23 | 96 | <50 | 141 | <50 | <50 | <50 | <50 | <50 | |
| 2 | Wild Rice River | 24 | 22 | 92 | <50 | 251 | <50 | <50 | <50 | <50 | <50 | |
| 3 | Wild Rice River | 24 | 21 | 88 | <50 | 982 | <50 | <50 | <50 | <50 | 51 | |
| 4 | Red River of the North | 24 | 19 | 79 | <50 | 798 | <50 | <50 | <50 | <50 | 112 | |
| 5 | Red River of the North | 30 | 26 | 87 | <50 | 1,080 | <50 | <50 | <50 | <50 | 55 | |
| 6 | Sheyenne River | 30 | 21 | 70 | <50 | 1,980 | <50 | <50 | <50 | 61 | 252 | |
| 7 | Maple River | 30 | 20 | 67 | <50 | 1,170 | <50 | <50 | <50 | 77 | 162 | |
| 8 | Sheyenne River | 30 | 22 | 73 | <50 | 187 | <50 | <50 | <50 | 52 | 117 | |
| 9 | Red River of the North | 30 | 25 | 83 | <50 | 566 | <50 | <50 | <50 | <50 | 77 | |
| 10 | Red River of the North | 30 | 20 | 67 | <50 | 642 | <50 | <50 | <50 | 65 | 151 | |
| 1 | Red River of the North | 24 | 23 | 96 | <5.0 | 5.5 | <5.0 | <5.0 | <5.0 | <5.0 | <5.0 | |
| 2 | Wild Rice River | 24 | 24 | 100 | <5.0 | <5.0 | <5.0 | <5.0 | <5.0 | <5.0 | <5.0 | |
| 3 | Wild Rice River | 24 | 24 | 100 | <5.0 | <5.0 | <5.0 | <5.0 | <5.0 | <5.0 | <5.0 | |
| 4 | Red River of the North | 24 | 24 | 100 | <5.0 | <5.0 | <5.0 | <5.0 | <5.0 | <5.0 | <5.0 | |
| 5 | Red River of the North | 30 | 30 | 100 | <5.0 | <5.0 | <5.0 | <5.0 | <5.0 | <5.0 | <5.0 | |
| 6 | Sheyenne River | 30 | 30 | 100 | <5.0 | <5.0 | <5.0 | <5.0 | <5.0 | <5.0 | <5.0 | |
| 7 | Maple River | 30 | 30 | 100 | <5.0 | <5.0 | <5.0 | <5.0 | <5.0 | <5.0 | <5.0 | |
| 8 | Sheyenne River | 30 | 30 | 100 | <5.0 | <5.0 | <5.0 | <5.0 | <5.0 | <5.0 | <5.0 | |
| 9 | Red River of the North | 30 | 30 | 100 | <5.0 | <5.0 | <5.0 | <5.0 | <5.0 | <5.0 | <5.0 | |
| 10 | Red River of the North | 30 | 30 | 100 | <5.0 | <5.0 | <5.0 | <5.0 | <5.0 | <5.0 | <5.0 | |
| 1 | Red River of the North | 24 | 14 | 58 | <10 | 37 | <10 | <10 | <10 | 17 | 19 | |
| 2 | Wild Rice River | 24 | 2 | 8 | <10 | 1,350 | 14 | 36 | 73 | 244 | 560 | |
| 3 | Wild Rice River | 24 | 5 | 21 | <10 | 1,100 | <10 | 17 | 63 | 189 | 489 | |
| 4 | Red River of the North | 24 | 11 | 46 | <10 | 116 | <10 | <10 | 11 | 25 | 47 | |
| 5 | Red River of the North | 30 | 17 | 57 | <10 | 179 | <10 | <10 | <10 | 20 | 38 | |
| 6 | Sheyenne River | 30 | 1 | 3 | <10 | 930 | 20 | 36 | 75 | 153 | 336 | |
| 7 | Maple River | 30 | 2 | 7 | <10 | 2,070 | 11 | 30 | 72 | 298 | 533 | |
| 8 | Sheyenne River | 30 | 5 | 17 | <10 | 329 | <10 | 21 | 71 | 100 | 173 | |
| 9 | Red River of the North | 30 | 13 | 43 | <10 | 143 | <10 | <10 | 13 | 35 | 79 | |
| 10 | Red River of the North | 30 | 13 | 43 | <10 | 359 | <10 | <10 | 15 | 37 | 54 | |
| 1 | Red River of the North | 24 | 24 | 100 | <5.0 | <5.0 | <5.0 | <5.0 | <5.0 | <5.0 | <5.0 | |
| 2 | Wild Rice River | 24 | 16 | 67 | <5.0 | 13.2 | <5.0 | <5.0 | <5.0 | 5.5 | 9.6 | |
| 3 | Wild Rice River | 24 | 17 | 71 | <5.0 | 11.4 | <5.0 | <5.0 | <5.0 | 5.6 | 9.4 | |
| 4 | Red River of the North | 24 | 24 | 100 | <5.0 | 5.0 | <5.0 | <5.0 | <5.0 | <5.0 | <5.0 | |
| 5 | Red River of the North | 30 | 30 | 100 | <5.0 | <5.0 | <5.0 | <5.0 | <5.0 | <5.0 | <5.0 | |
| 6 | Sheyenne River | 30 | 30 | 100 | <5.0 | <5.0 | <5.0 | <5.0 | <5.0 | <5.0 | <5.0 | |
| 7 | Maple River | 30 | 25 | 83 | <5.0 | 7.3 | <5.0 | <5.0 | <5.0 | <5.0 | 5.5 | |
| 8 | Sheyenne River | 30 | 30 | 100 | <5.0 | <5.0 | <5.0 | <5.0 | <5.0 | <5.0 | <5.0 | |
| 9 | Red River of the North | 30 | 30 | 100 | <5.0 | <5.0 | <5.0 | <5.0 | <5.0 | <5.0 | <5.0 | |
| 10 | Red River of the North | 30 | 30 | 100 | <5.0 | <5.0 | <5.0 | <5.0 | <5.0 | <5.0 | <5.0 | |
| 1 | Red River of the North | 24 | 20 | 83 | <5.0 | 6.4 | <5.0 | <5.0 | <5.0 | <5.0 | 5.4 | |
| 2 | Wild Rice River | 24 | 1 | 4 | <5.0 | 11.8 | 5.3 | 6.4 | 7.5 | 8.7 | 10.3 | |
| 3 | Wild Rice River | 24 | 2 | 8 | <5.0 | 14.3 | 5.5 | 6.8 | 7.9 | 9.5 | 11.4 | |
| 4 | Red River of the North | 24 | 14 | 58 | <5.0 | 7.9 | <5.0 | <5.0 | <5.0 | 5.4 | 6.7 | |
| 5 | Red River of the North | 30 | 16 | 53 | <5.0 | 8.2 | <5.0 | <5.0 | <5.0 | 5.5 | 6.0 | |
| 6 | Sheyenne River | 30 | 2 | 7 | <5.0 | 12.7 | 5.4 | 6.2 | 7.4 | 8.2 | 9.9 | |
| 7 | Maple River | 30 | 6 | 20 | <5.0 | 12.7 | <5.0 | 5.8 | 6.8 | 8.2 | 11.5 | |
| 8 | Sheyenne River | 30 | 2 | 7 | <5.0 | 12.3 | 5.4 | 5.9 | 6.6 | 7.5 | 8.2 | |
| 9 | Red River of the North | 30 | 11 | 37 | <5.0 | 9.8 | <5.0 | <5.0 | 5.3 | 6.2 | 7.0 | |
| 10 | Red River of the North | 30 | 15 | 50 | <5.0 | 11.6 | <5.0 | <5.0 | 5.1 | 5.9 | 7.7 | |
| 1 | Red River of the North | 24 | 24 | 100 | <5.0 | <5.0 | <5.0 | <5.0 | <5.0 | <5.0 | <5.0 | |
| 2 | Wild Rice River | 24 | 22 | 92 | <5.0 | 8.0 | <5.0 | <5.0 | <5.0 | <5.0 | <5.0 | |
| 3 | Wild Rice River | 24 | 23 | 96 | <5.0 | 8.7 | <5.0 | <5.0 | <5.0 | <5.0 | <5.0 | |
| 4 | Red River of the North | 24 | 23 | 96 | <5.0 | 9.0 | <5.0 | <5.0 | <5.0 | <5.0 | <5.0 | |
| 5 | Red River of the North | 30 | 29 | 97 | <5.0 | 8.9 | <5.0 | <5.0 | <5.0 | <5.0 | <5.0 | |
| 6 | Sheyenne River | 30 | 29 | 97 | <5.0 | 7.9 | <5.0 | <5.0 | <5.0 | <5.0 | <5.0 | |
| 7 | Maple River | 30 | 28 | 93 | <5.0 | 7.0 | <5.0 | <5.0 | <5.0 | <5.0 | <5.0 | |
| 8 | Sheyenne River | 30 | 28 | 93 | <5.0 | 7.7 | <5.0 | <5.0 | <5.0 | <5.0 | <5.0 | |
| 9 | Red River of the North | 30 | 29 | 97 | <5.0 | 8.1 | <5.0 | <5.0 | <5.0 | <5.0 | <5.0 | |
| 10 | Red River of the North | 30 | 29 | 97 | <5.0 | 5.7 | <5.0 | <5.0 | <5.0 | <5.0 | <5.0 | |
| 1 | Red River of the North | 24 | 23 | 96 | <5.0 | 16.1 | <5.0 | <5.0 | <5.0 | <5.0 | <5.0 | |
| 2 | Wild Rice River | 24 | 23 | 96 | <5.0 | 7.8 | <5.0 | <5.0 | <5.0 | <5.0 | <5.0 | |
| 3 | Wild Rice River | 24 | 22 | 92 | <5.0 | 7.4 | <5.0 | <5.0 | <5.0 | <5.0 | <5.0 | |
| 4 | Red River of the North | 24 | 21 | 88 | <5.0 | 9.0 | <5.0 | <5.0 | <5.0 | <5.0 | <5.0 | |
| 5 | Red River of the North | 30 | 27 | 90 | <5.0 | 35.7 | <5.0 | <5.0 | <5.0 | <5.0 | 5.1 | |
| 6 | Sheyenne River | 30 | 26 | 87 | <5.0 | 29.0 | <5.0 | <5.0 | <5.0 | <5.0 | 6.6 | |
| 7 | Maple River | 30 | 27 | 90 | <5.0 | 8.0 | <5.0 | <5.0 | <5.0 | <5.0 | 5.1 | |
| 8 | Sheyenne River | 30 | 29 | 97 | <5.0 | 6.2 | <5.0 | <5.0 | <5.0 | <5.0 | <5.0 | |
| 9 | Red River of the North | 30 | 29 | 97 | <5.0 | 6.2 | <5.0 | <5.0 | <5.0 | <5.0 | <5.0 | |
| 10 | Red River of the North | 30 | 28 | 93 | <5.0 | 9.5 | <5.0 | <5.0 | <5.0 | <5.0 | <5.0 | |
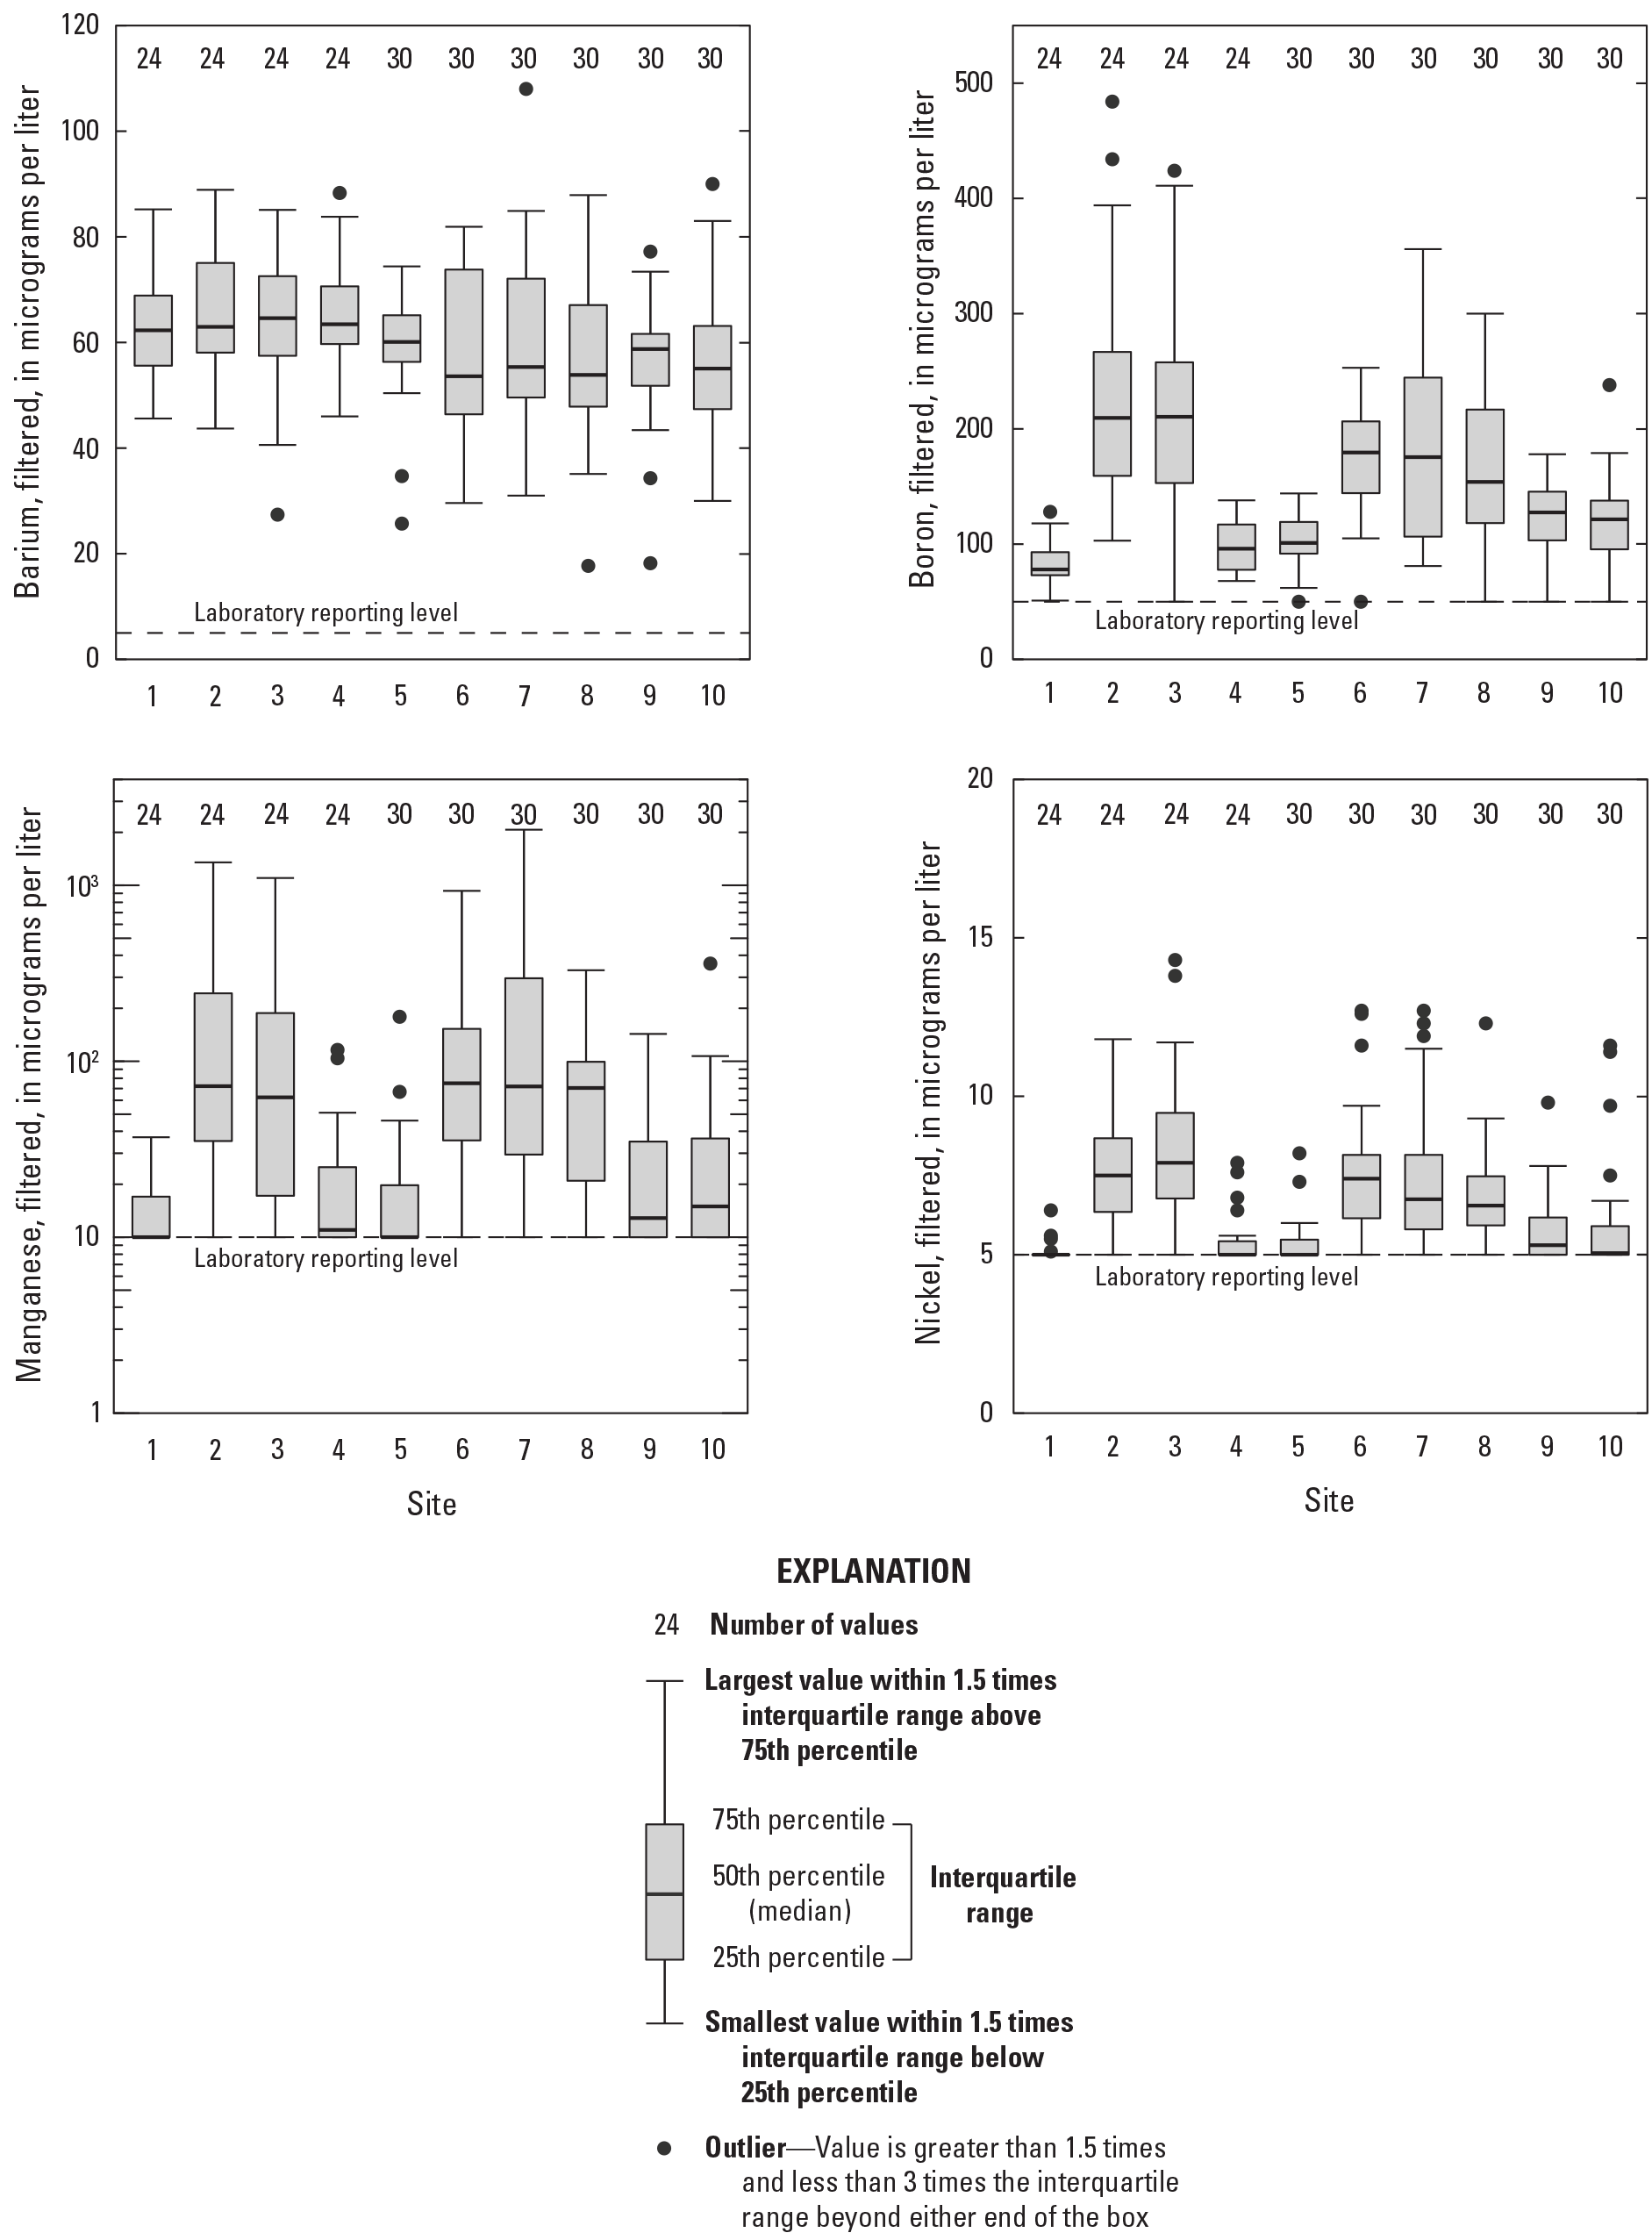
Distribution of concentrations for barium, boron, manganese, and nickel from samples collected at 10 sites in the Fargo-Moorhead metropolitan area from October 1, 2019, to October 1, 2022.
Nutrients
Nutrients analyzed in discrete samples collected at the 10 sites in the Fargo-Moorhead metropolitan area from October 1, 2019, to October 1, 2022, included filtered and unfiltered concentrations of ammonia, nitrate plus nitrite, phosphorus, and organic carbon (table 9). Nutrient dynamics are controlled by activities in the basin and processes that occur in the stream. Wastewater-treatment plant discharge can be a major point source of nitrogen (mainly nitrate), phosphorus, and organic material (Hem, 1985). Septic systems can act as point sources as nutrients migrate through the groundwater system into the stream. The effect of point sources usually is more evident during low-flow conditions in a stream because concentrations are less affected by dilution. Nonpoint sources of nitrogen, phosphorus, and organic carbon mainly are delivered during runoff events as rainfall washes material off the landscape into the stream, resulting in greater concentrations during high-flow conditions. Some nonpoint sources of nutrients include runoff from agricultural areas, where fertilizers are applied or livestock production occurs; runoff from urban areas, where fertilizers are applied to lawns, shrubs, and trees; and from atmospheric deposition of nitrogen (Hem, 1985). Natural sources of nitrogen and phosphorus include fixation of atmospheric nitrogen by plants and animals, dissolution of phosphorus-bearing rocks or minerals in the soil, and oxidation of organic matter, including soil organic matter and decaying plants and animals (Hem, 1985).
Instream processes also can affect nutrient concentrations (Allan, 1995). Aquatic vegetation, particularly algae, depends on nitrogen and phosphorus for its food supply. Nitrate is the most stable ion of nitrogen over a wide range of conditions and is readily assimilated by algae. Total (unfiltered) phosphorus concentrations include inorganic phosphorus (in solution, complexed with iron or other trace metals, or adsorbed to sediment particles) and organic phosphorus (Allan, 1995). Sources of organic carbon in the water column can include those outside the aquatic system and within the aquatic system. Natural sources of organic carbon outside the aquatic system include soils and plants, and sources within the aquatic system include excretion from actively growing algae or the decomposition of dead algae and macrophytes (Allan, 1995). Anthropogenic (human influenced) sources of organic carbon include wastewater-treatment discharges, animal waste, and septic systems. Activities that cause land disturbance such as row-crop agriculture, animal grazing, road construction and maintenance, and urbanization also can result in increased stream concentrations of organic carbon (Allan, 1995).
In general, concentrations of ammonia were relatively low in samples collected from October 1, 2019, to October 1, 2022 (table 9). The median filtered ammonia concentration at most of the sites was less than the laboratory reporting level of 0.03 mg/L as N except for at site 8 (Sheyenne River) and site 10 (Red River), which had medians of 0.04 mg/L as N. One-half of the sites had median concentrations of unfiltered ammonia that were less than the laboratory reporting level of 0.03 mg/L as N (sites 1–4, 9) with the Maple River (site 7) having the highest median of 0.06 mg/L as N. The remaining sites (sites 5, 6, 8, and 10) all had median concentrations of 0.04 mg/L as N (table 9).
Nitrate plus nitrite concentrations were more variable among sites compared to ammonia concentrations, and filtered and unfiltered concentrations of nitrate plus nitrite were similar in samples collected at the sites (table 9). The lowest median unfiltered nitrate plus nitrite concentration was measured at the Red River upstream from the Fargo-Moorhead metropolitan area (site 1, 0.18 mg/L as N), and the highest median was in the Red River downstream from the Fargo-Moorhead metropolitan area (site 5, 0.91 mg/L as N) compared to all of the other sites (fig. 6). The increase in nitrate plus nitrite concentration could reflect the influence of the wastewater-treatment plant discharge that enters the Red River upstream from site 5 and from urban runoff that can wash fertilizers applied to lawns, shrubs, and trees in the urban areas into the stream. Site 4 (Red River) is also upstream from the wastewater-treatment plant discharge into the Red River and had relatively lower median nitrate plus nitrite concentrations (median of 0.23 mg/L as N for both unfiltered and filtered concentrations). The Maple River (site 7) had the highest median nitrate plus nitrite concentration among the tributary sites (0.74 mg/L as N unfiltered, 0.73 mg/L as N filtered), and the Sheyenne River (site 6) had the lowest median among the tributaries (0.20 mg/L as N unfiltered, 0.30 mg/L as N filtered). Higher concentrations at site 7 on the Maple River may be attributed to a mix of agricultural activities such as field runoff, and urban runoff from the City of Mapleton, N. Dak. (fig. 1), which is upstream from the site.
Total (unfiltered) phosphorus concentrations were generally higher at sites on the Maple and Sheyenne Rivers compared to the other sites and were higher at sites on the Red River downstream from the Fargo-Moorhead metropolitan area compared to sites upstream on the Red River (table 9 and fig. 6). The median total phosphorus concentration at site 7 on the Maple River was 0.41 mg/L as phosphorus (P) and was 0.35 and 0.34 mg/L as P at sites 6 and 8 on the Sheyenne River, respectively. For the Red River, sites 1 and 4 had median total phosphorus concentrations of 0.15 and 0.16 mg/L as P, respectively, compared to sites 5, 9, and 10 which had median concentrations of 0.28, 0.32, and 0.32 mg/L as P, respectively. Dissolved (filtered) phosphorus followed similar patterns as total phosphorus, with the highest median concentration on the Maple River (site 7) and relatively higher concentrations on the Red River downstream from the Fargo-Moorhead metropolitan area (sites 5, 9, and 10).
Organic carbon concentrations in samples collected at the 10 sites were not highly variable over time and among the sites (table 9 and fig. 6). Total (unfiltered) organic carbon had the highest median concentrations at sites on the Wild Rice River at 12.2 and 12.0 mg/L as carbon (C) at sites 2 and 3, respectively, compared to the other sites. All other sites had median concentrations that ranged from 8.2 mg/L as C (site 1) to 10.6 mg/L as C (site 7). The greatest range in concentrations was measured in samples from the Maple River (site 7) that varied from 7.0 to 14.9 mg/L as C. Dissolved (filtered) organic carbon followed similar patterns, with the highest median concentrations at sites on the Wild Rice River with the highest variability at the site on the Maple River.
Table 9.
Summary of nutrient constituent data from samples collected at 10 sites in the Fargo-Moorhead metropolitan area, October 1, 2019, to October 1, 2022.[ID, identification; Min, minimum; Max, maximum; <, less than]
| Site ID (fig. 1) | River name | Number of observations | Number of censored observations | Percent of data censored | Min | Max | 10th percentile | 25th percentile | 50th percentile | 75th percentile | 90th percentile |
|---|---|---|---|---|---|---|---|---|---|---|---|
| 1 | Red River of the North | 24 | 17 | 71 | <0.03 | 0.23 | <0.03 | <0.03 | <0.03 | 0.06 | 0.16 |
| 2 | Wild Rice River | 24 | 12 | 50 | <0.03 | 0.59 | <0.03 | <0.03 | <0.03 | 0.15 | 0.30 |
| 3 | Wild Rice River | 24 | 14 | 58 | <0.03 | 0.38 | <0.03 | <0.03 | <0.03 | 0.09 | 0.30 |
| 4 | Red River of the North | 24 | 13 | 54 | <0.03 | 0.24 | <0.03 | <0.03 | <0.03 | 0.09 | 0.17 |
| 5 | Red River of the North | 30 | 13 | 43 | <0.03 | 0.49 | <0.03 | <0.03 | 0.04 | 0.09 | 0.17 |
| 6 | Sheyenne River | 30 | 13 | 43 | <0.03 | 0.22 | <0.03 | <0.03 | 0.04 | 0.10 | 0.17 |
| 7 | Maple River | 30 | 10 | 33 | <0.03 | 0.55 | <0.03 | <0.03 | 0.06 | 0.11 | 0.21 |
| 8 | Sheyenne River | 30 | 13 | 43 | <0.03 | 0.29 | <0.03 | <0.03 | 0.04 | 0.10 | 0.20 |
| 9 | Red River of the North | 30 | 14 | 47 | <0.03 | 0.34 | <0.03 | <0.03 | <0.03 | 0.09 | 0.16 |
| 10 | Red River of the North | 30 | 14 | 47 | <0.03 | 0.30 | <0.03 | <0.03 | 0.04 | 0.08 | 0.14 |
| 1 | Red River of the North | 24 | 16 | 67 | <0.03 | 0.23 | <0.03 | <0.03 | <0.03 | 0.07 | 0.12 |
| 2 | Wild Rice River | 24 | 15 | 63 | <0.03 | 0.58 | <0.03 | <0.03 | <0.03 | 0.08 | 0.28 |
| 3 | Wild Rice River | 24 | 17 | 71 | <0.03 | 0.42 | <0.03 | <0.03 | <0.03 | 0.06 | 0.31 |
| 4 | Red River of the North | 24 | 13 | 54 | <0.03 | 0.26 | <0.03 | <0.03 | <0.03 | 0.09 | 0.20 |
| 5 | Red River of the North | 30 | 15 | 50 | <0.03 | 0.47 | <0.03 | <0.03 | <0.03 | 0.08 | 0.18 |
| 6 | Sheyenne River | 30 | 18 | 60 | <0.03 | 0.21 | <0.03 | <0.03 | <0.03 | 0.06 | 0.16 |
| 7 | Maple River | 30 | 15 | 50 | <0.03 | 0.55 | <0.03 | <0.03 | <0.03 | 0.10 | 0.21 |
| 8 | Sheyenne River | 30 | 15 | 50 | <0.03 | 0.29 | <0.03 | <0.03 | 0.04 | 0.12 | 0.18 |
| 9 | Red River of the North | 30 | 15 | 50 | <0.03 | 0.35 | <0.03 | <0.03 | <0.03 | 0.08 | 0.16 |
| 10 | Red River of the North | 30 | 14 | 47 | <0.03 | 0.29 | <0.03 | <0.03 | 0.04 | 0.07 | 0.13 |
| 1 | Red River of the North | 24 | 5 | 21 | <0.03 | 5.11 | <0.03 | 0.05 | 0.18 | 0.48 | 1.27 |
| 2 | Wild Rice River | 24 | 6 | 25 | <0.03 | 5.21 | <0.03 | 0.06 | 0.30 | 0.53 | 1.28 |
| 3 | Wild Rice River | 24 | 6 | 25 | <0.03 | 5.74 | <0.03 | <0.03 | 0.35 | 0.75 | 1.38 |
| 4 | Red River of the North | 24 | 4 | 17 | <0.03 | 5.95 | <0.03 | 0.09 | 0.23 | 0.51 | 1.27 |
| 5 | Red River of the North | 30 | 0 | 0 | 0.18 | 6.77 | 0.41 | 0.50 | 0.91 | 1.54 | 3.02 |
| 6 | Sheyenne River | 30 | 7 | 23 | <0.03 | 1.17 | <0.03 | 0.09 | 0.20 | 0.36 | 0.51 |
| 7 | Maple River | 30 | 8 | 27 | <0.03 | 4.57 | <0.03 | 0.04 | 0.74 | 0.96 | 1.49 |
| 8 | Sheyenne River | 30 | 7 | 23 | <0.03 | 1.95 | <0.03 | 0.07 | 0.33 | 0.59 | 0.79 |
| 9 | Red River of the North | 30 | 0 | 0 | 0.33 | 5.40 | 0.39 | 0.48 | 0.72 | 1.23 | 1.80 |
| 10 | Red River of the North | 30 | 0 | 0 | 0.05 | 2.64 | 0.30 | 0.47 | 0.77 | 1.25 | 1.74 |
| 1 | Red River of the North | 24 | 5 | 21 | <0.03 | 3.93 | <0.03 | 0.08 | 0.20 | 0.52 | 1.27 |
| 2 | Wild Rice River | 24 | 6 | 25 | <0.03 | 5.46 | <0.03 | 0.07 | 0.35 | 0.61 | 1.42 |
| 3 | Wild Rice River | 24 | 7 | 29 | <0.03 | 6.48 | <0.03 | <0.03 | 0.34 | 0.71 | 1.75 |
| 4 | Red River of the North | 24 | 4 | 17 | <0.03 | 6.45 | <0.03 | 0.11 | 0.23 | 0.53 | 1.32 |
| 5 | Red River of the North | 30 | 0 | 0 | 0.20 | 7.30 | 0.49 | 0.65 | 1.10 | 1.62 | 3.45 |
| 6 | Sheyenne River | 30 | 7 | 23 | <0.03 | 1.62 | <0.03 | 0.14 | 0.30 | 0.46 | 0.57 |
| 7 | Maple River | 30 | 10 | 33 | <0.03 | 4.91 | <0.03 | <0.03 | 0.73 | 1.03 | 1.79 |
| 8 | Sheyenne River | 30 | 7 | 23 | <0.03 | 2.42 | <0.03 | 0.08 | 0.47 | 0.72 | 0.89 |
| 9 | Red River of the North | 30 | 0 | 0 | 0.39 | 6.08 | 0.47 | 0.56 | 0.83 | 1.54 | 1.87 |
| 10 | Red River of the North | 30 | 0 | 0 | 0.07 | 2.78 | 0.30 | 0.58 | 0.91 | 1.44 | 1.94 |
| 1 | Red River of the North | 24 | 0 | 0 | 0.05 | 0.40 | 0.08 | 0.08 | 0.15 | 0.24 | 0.30 |
| 2 | Wild Rice River | 24 | 0 | 0 | 0.07 | 0.62 | 0.11 | 0.19 | 0.27 | 0.35 | 0.40 |
| 3 | Wild Rice River | 24 | 0 | 0 | 0.07 | 0.49 | 0.09 | 0.18 | 0.28 | 0.38 | 0.40 |
| 4 | Red River of the North | 24 | 0 | 0 | 0.03 | 0.44 | 0.07 | 0.11 | 0.16 | 0.28 | 0.32 |
| 5 | Red River of the North | 30 | 0 | 0 | 0.12 | 0.87 | 0.16 | 0.19 | 0.28 | 0.36 | 0.43 |
| 6 | Sheyenne River | 30 | 0 | 0 | 0.03 | 0.91 | 0.09 | 0.17 | 0.35 | 0.49 | 0.65 |
| 7 | Maple River | 30 | 0 | 0 | 0.11 | 0.90 | 0.17 | 0.34 | 0.41 | 0.51 | 0.64 |
| 8 | Sheyenne River | 30 | 0 | 0 | 0.06 | 0.62 | 0.14 | 0.23 | 0.34 | 0.46 | 0.56 |
| 9 | Red River of the North | 30 | 0 | 0 | 0.12 | 0.53 | 0.17 | 0.25 | 0.32 | 0.39 | 0.46 |
| 10 | Red River of the North | 30 | 0 | 0 | 0.11 | 0.53 | 0.18 | 0.24 | 0.32 | 0.37 | 0.47 |
| 1 | Red River of the North | 24 | 2 | 8 | <0.02 | 0.29 | 0.03 | 0.05 | 0.09 | 0.16 | 0.20 |
| 2 | Wild Rice River | 24 | 0 | 0 | 0.03 | 0.34 | 0.07 | 0.12 | 0.20 | 0.26 | 0.30 |
| 3 | Wild Rice River | 24 | 1 | 4 | <0.02 | 0.36 | 0.06 | 0.13 | 0.19 | 0.28 | 0.32 |
| 4 | Red River of the North | 24 | 1 | 4 | <0.02 | 0.29 | 0.06 | 0.08 | 0.10 | 0.17 | 0.23 |
| 5 | Red River of the North | 30 | 1 | 3 | <0.02 | 0.71 | 0.10 | 0.14 | 0.20 | 0.26 | 0.36 |
| 6 | Sheyenne River | 30 | 4 | 13 | <0.02 | 0.29 | <0.02 | 0.12 | 0.18 | 0.21 | 0.25 |
| 7 | Maple River | 30 | 1 | 3 | <0.02 | 0.81 | 0.09 | 0.24 | 0.33 | 0.42 | 0.48 |
| 8 | Sheyenne River | 30 | 2 | 7 | <0.02 | 0.36 | 0.12 | 0.15 | 0.18 | 0.26 | 0.30 |
| 9 | Red River of the North | 30 | 0 | 0 | 0.07 | 0.32 | 0.12 | 0.15 | 0.21 | 0.26 | 0.27 |
| 10 | Red River of the North | 30 | 0 | 0 | 0.06 | 0.37 | 0.11 | 0.15 | 0.21 | 0.25 | 0.30 |
| 1 | Red River of the North | 23 | 0 | 0 | 6.2 | 11.9 | 6.3 | 6.9 | 8.2 | 9.0 | 10.6 |
| 2 | Wild Rice River | 24 | 0 | 0 | 7.8 | 14.1 | 10.2 | 11.4 | 12.2 | 12.7 | 13.0 |
| 3 | Wild Rice River | 24 | 0 | 0 | 8.4 | 13.1 | 9.8 | 11.2 | 12.0 | 12.4 | 12.6 |
| 4 | Red River of the North | 24 | 0 | 0 | 6.5 | 10.8 | 6.8 | 7.7 | 9.1 | 9.5 | 10.3 |
| 5 | Red River of the North | 29 | 0 | 0 | 6.8 | 11.0 | 7.1 | 7.7 | 9.1 | 9.7 | 10.3 |
| 6 | Sheyenne River | 29 | 0 | 0 | 7.3 | 13.3 | 7.8 | 8.9 | 9.8 | 10.8 | 11.7 |
| 7 | Maple River | 29 | 0 | 0 | 7.0 | 14.9 | 8.4 | 9.3 | 10.6 | 11.9 | 12.8 |
| 8 | Sheyenne River | 30 | 0 | 0 | 7.6 | 11.7 | 8.0 | 8.5 | 9.8 | 11.0 | 11.1 |
| 9 | Red River of the North | 29 | 0 | 0 | 6.8 | 11.0 | 7.6 | 8.6 | 9.3 | 10.1 | 10.6 |
| 10 | Red River of the North | 30 | 0 | 0 | 6.1 | 12.7 | 7.6 | 8.8 | 9.5 | 10.4 | 10.8 |
| 1 | Red River of the North | 24 | 0 | 0 | 6.4 | 12.7 | 6.8 | 7.0 | 8.5 | 9.7 | 10.6 |
| 2 | Wild Rice River | 24 | 0 | 0 | 7.9 | 15.1 | 10.5 | 11.9 | 12.4 | 13.0 | 13.7 |
| 3 | Wild Rice River | 24 | 0 | 0 | 8.6 | 14.0 | 10.2 | 11.6 | 12.4 | 12.9 | 13.5 |
| 4 | Red River of the North | 24 | 0 | 0 | 6.7 | 11.5 | 7.0 | 7.9 | 9.3 | 9.8 | 10.8 |
| 5 | Red River of the North | 30 | 0 | 0 | 7.1 | 11.8 | 7.5 | 8.0 | 9.6 | 10.5 | 11.0 |
| 6 | Sheyenne River | 29 | 0 | 0 | 6.4 | 12.4 | 7.6 | 9.1 | 10.4 | 11.0 | 12.3 |
| 7 | Maple River | 30 | 0 | 0 | 7.1 | 15.7 | 8.8 | 9.4 | 11.0 | 12.3 | 13.1 |
| 8 | Sheyenne River | 29 | 0 | 0 | 7.2 | 12.5 | 8.5 | 9.1 | 10.4 | 11.5 | 11.9 |
| 9 | Red River of the North | 30 | 0 | 0 | 7.2 | 11.9 | 8.3 | 9.1 | 9.8 | 10.6 | 11.5 |
| 10 | Red River of the North | 29 | 0 | 0 | 6.6 | 11.7 | 8.3 | 9.1 | 10.2 | 10.8 | 11.3 |
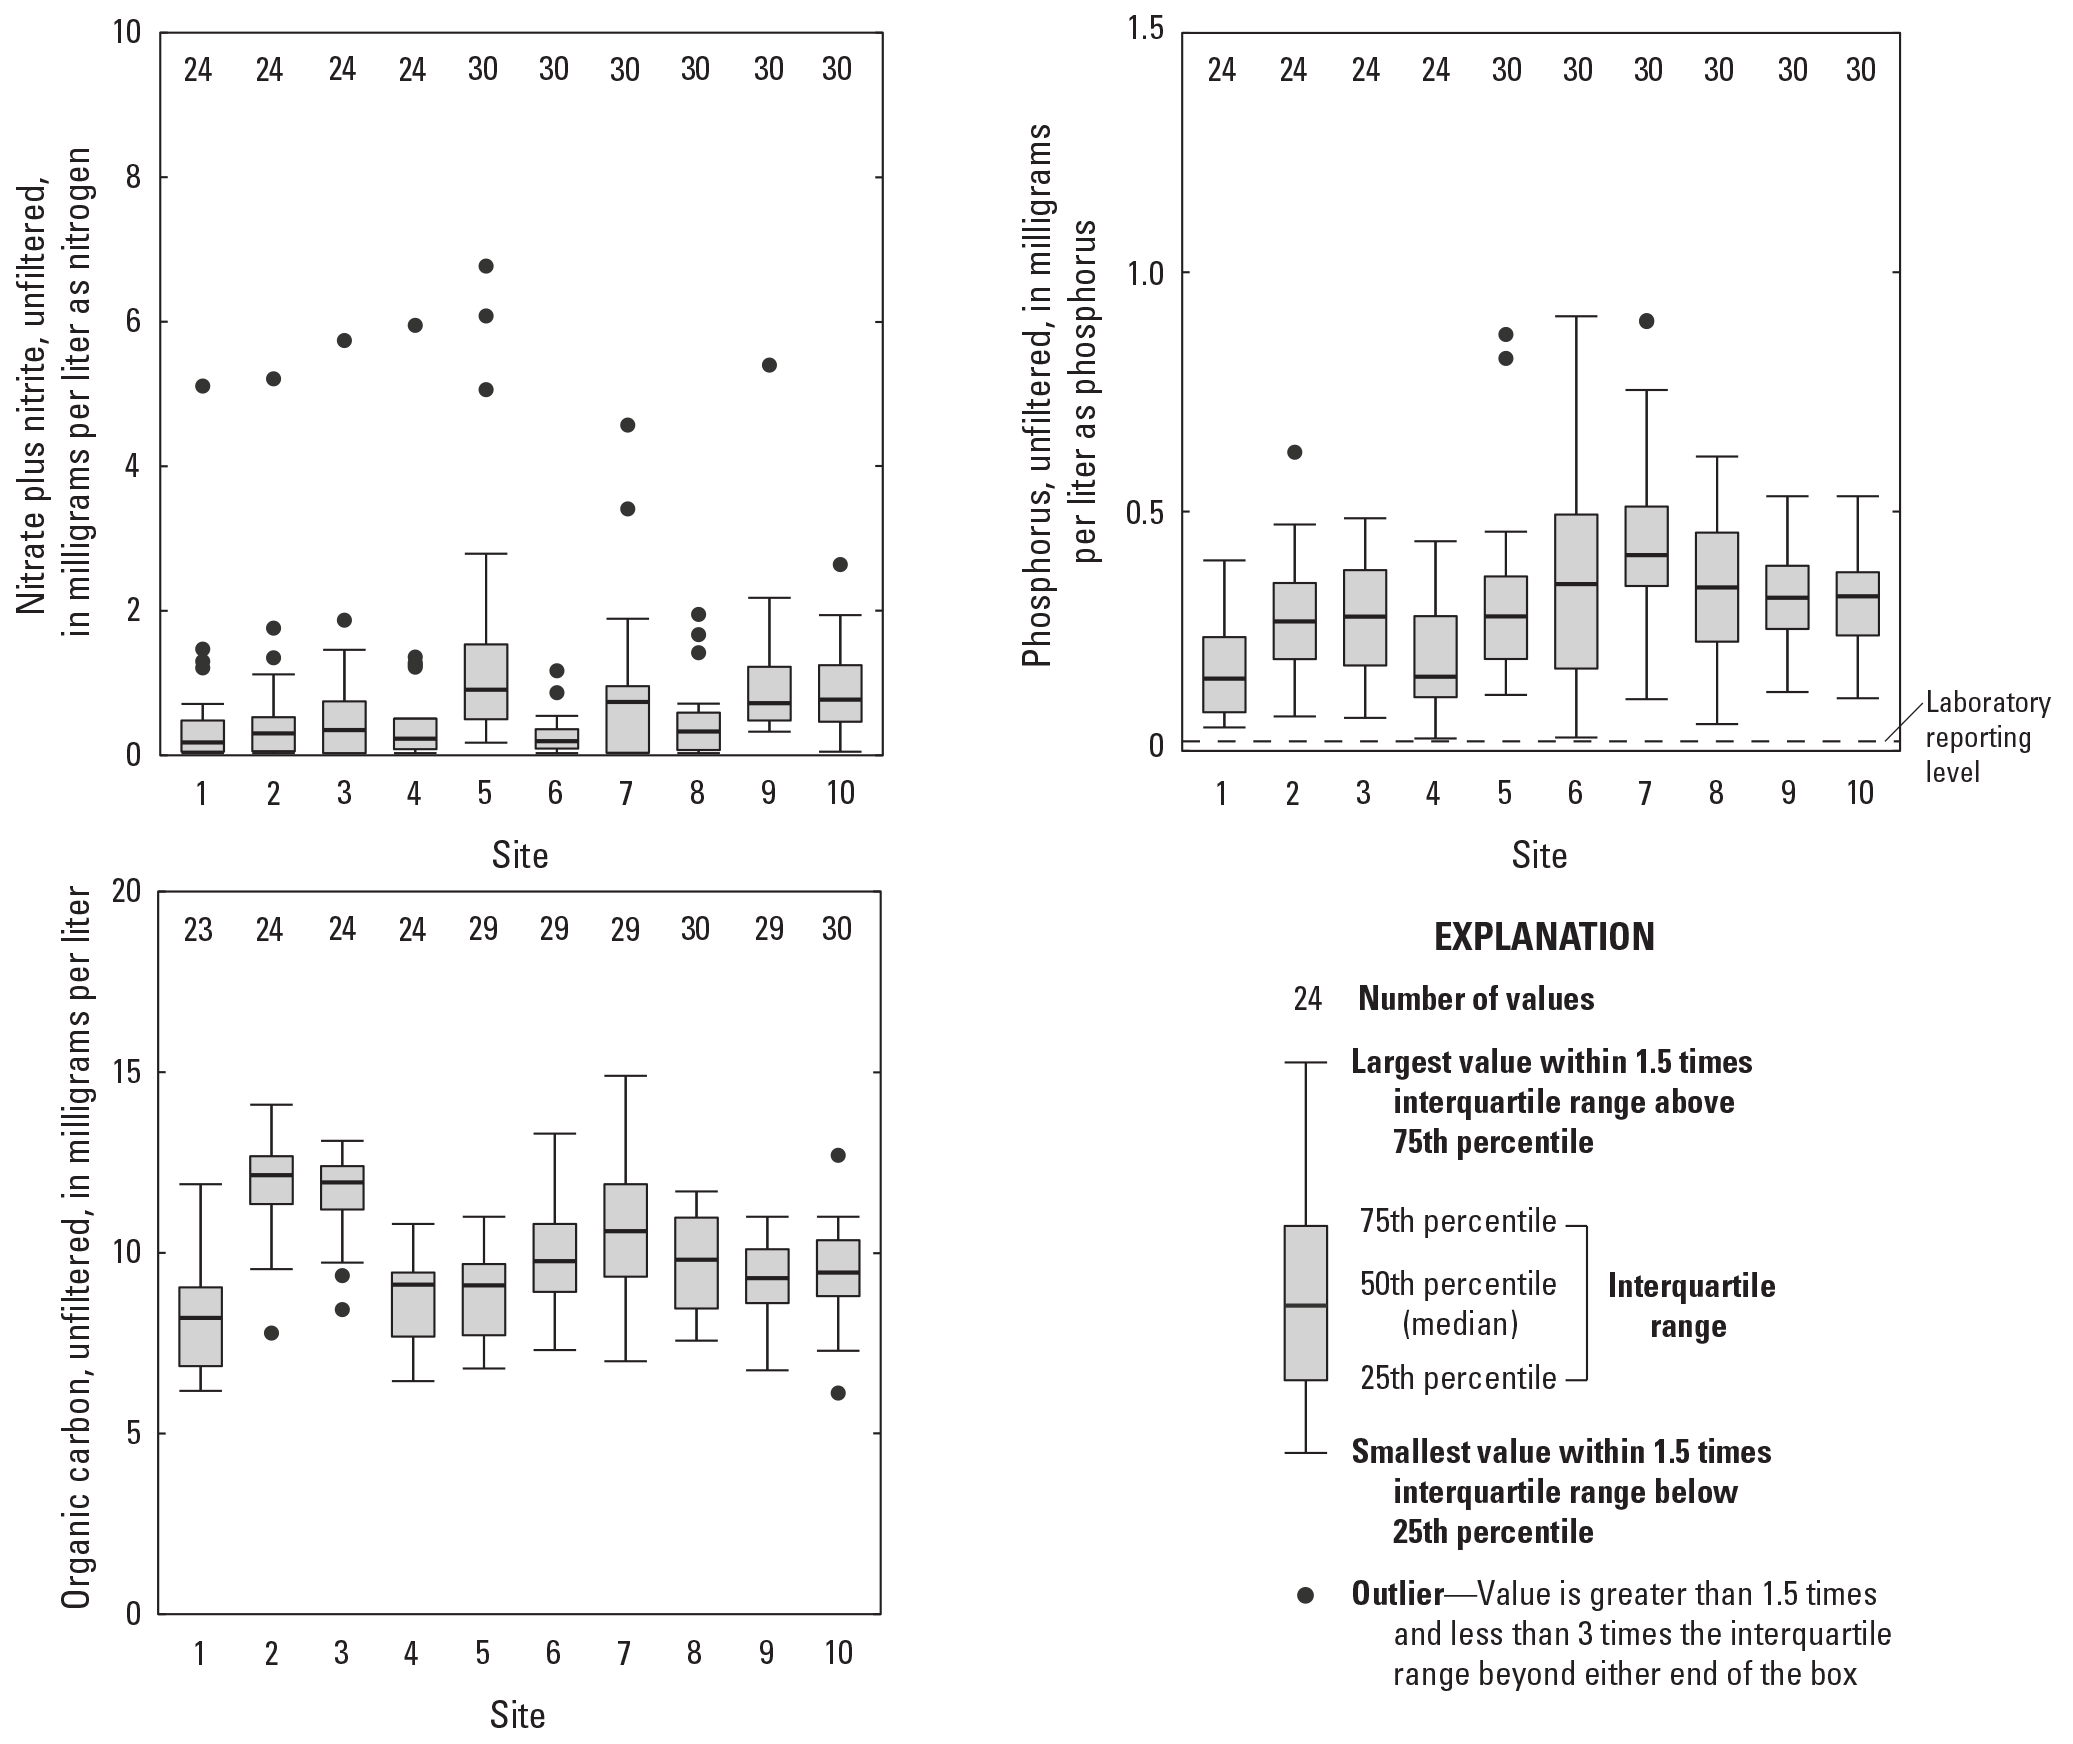
Distribution of concentrations for unfiltered nitrate plus nitrite, phosphorus, and organic carbon from samples collected at 10 sites in the Fargo-Moorhead metropolitan area from October 1, 2019, to October 1, 2022.
Suspended Sediment
Suspended sediment in water is the particulate matter that consists of soil and rock particles eroded from the landscape. Sediment can be transported in the water column or can settle to the streambed. Large concentrations of suspended sediment often are associated with storm-runoff events that increase streamflow, erosion, and resuspension of bed material (Guy, 1970).
SSC measured in samples collected from the 10 sites in the Fargo-Moorhead metropolitan area from October 1, 2019, to October 1, 2022, were generally highest at sites in the Sheyenne River and lowest in the Red River at sites 1 and 4 (table 10, fig. 7). The Sheyenne River had a median concentration of 211 mg/L at site 6 and a median concentration of 180 mg/L at site 8. Median concentrations in the Wild Rice River were 98 and 99 mg/L for sites 2 and 3, respectively, and the median for the Maple River (site 7) was 108 mg/L. The Red River at sites 1 and 4 had a median concentration of 63 mg/L for both sites, compared to the most downstream sites (sites 9 and 10) that had median concentrations of 155 and 151 mg/L, respectively. The higher concentrations at the downstream Red River sites likely represent the input from the Sheyenne River, which had higher SSC compared to the other tributary sites and enters the Red River upstream from sites 9 and 10.
SSC was highly variable in samples collected at the 10 sites, mostly influenced by the occurrence of snowmelt and rainfall runoff events. The Sheyenne River at site 6 had the largest range with concentrations from 4 to 1,210 mg/L. The other sites ranged from 2 mg/L (site 4) to 588 mg/L (site 8). In general, the lowest SSC was measured in the winter months when there was ice cover with little to no runoff and relatively low-streamflow conditions. Conversely, the highest concentrations were generally measured near the peak in streamflow during a high-flow event. For example, the maximum SSCs for the two Sheyenne River sites were measured on April 27, 2022, on the rising limb of the peak during the largest peak in streamflow for the period of October 1, 2019, to October 1, 2022 (fig. 2).
The distribution of suspended-sediment particle sizes in samples collected at the 10 sites was relatively uniform among the sites, except for at site 6 (Sheyenne River; table 10 and fig. 7). Most of the suspended sediment at sites in the Fargo-Moorhead metropolitan area had particle diameter sizes less than 0.0625 mm, meaning the sediment is predominantly silt- and clay-sized particles. For all sites other than the Sheyenne River at site 6, 95 percent or more of the suspended sediment had diameter size less than 0.0625 mm in 50 percent (median) of the samples. In comparison, the Sheyenne River at site 6 had more sand-sized or larger particles in the suspended sediment, with 83 percent of the material having particle diameters less than 0.0625 mm in 50 percent of the samples (17 percent greater than 0.0625 mm). Previous studies have also shown more sand-sized or larger particles in suspension and in the bed material at sites in the Sheyenne River compared to sites on the Red River and other tributaries in the Fargo-Moorhead metropolitan area (Blanchard and others, 2011; Galloway and others, 2011).
The particle sizes at each site varied in samples, mostly related to the flow conditions when samples were collected. Snowmelt and rainfall runoff events can transport larger material into the streams as it is washed off the landscape, and higher velocities can transport larger material in the stream channel. Sand-size (0.0625 mm) or larger particles constituted as much as 57 percent (43 percent with diameters less than 0.0625 mm) of a suspended-sediment sample collected at the Sheyenne River at site 6 (table 10). At the other sites, particles with diameters less than 0.0625 mm constituted no less than 64 percent of the suspended sediment in samples, except for a sample collected at site 4. A sample collected at the Red River at site 4 measured only 25 percent of the suspended sediment less than 0.0625 mm, but it is likely that some bottom material or bedload may have biased the sample given that the sample was not collected near a rising or peak streamflow condition, and the velocities were not likely high enough to transport the larger particles in suspension.
Total suspended solids (TSS) are commonly used to quantify concentrations of suspended solid-phase material in surface water. Often TSS are used as a surrogate for SSC, which includes the inorganic sand, silt, and clay matrix transported in streams, and SSC and TSS frequently have been used interchangeably. However, the analytical methods differ and the two may not be equivalent when solid-phase material, especially sand, becomes more concentrated (Gray and others, 2000). TSS generally followed the same patterns as SSC, with the highest concentrations in samples collected in the Sheyenne River (sites 6 and 8) and lowest in samples collected in the Red River at sites 1 and 4 (table 10 and fig. 7). One difference was the highest median TSS among the sites was measured at the Sheyenne River at site 8 (160 mg/L) compared to SSC, where the highest median value was measured at site 6 on the Sheyenne River. The difference is likely related to the particle size difference at the two sites and the bias in the TSS analysis when sand-sized or large particles are in suspension compared to SSC. Suspended sediment collected at site 6 generally had a larger percentage of sand-sized particles (diameters greater than 0.0625 mm) compared to the other sites, including the downstream Sheyenne River (site 8), which could cause a low bias in TSS for some samples. Gray and others (2000) determined that TSS are fundamentally unreliable for the analysis of solid-phase material in natural-water samples with sand-size material. Whereas SSC analytical methods measure all the sediment and the mass of the entire water-sediment mixture of the original sample, TSS methods only use an aliquot of the original sample for subsequent analysis. The TSS analysis can have a low bias when there are large particles in suspension because they can settle out before the extraction of the aliquot used for the analysis.
Table 10.
Summary of suspended sediment, total suspended solids, and field measurement data from samples collected at 10 sites in the Fargo-Moorhead metropolitan area, October 1, 2019, to October 1, 2022.[ID, identification; Min, minimum; Max, maximum; <, less than]
| Site ID (fig. 1) | River name | Number of observations | Number of censored observations | Percent of data censored | Min | Max | 10th percentile | 25th percentile | 50th percentile | 75th percentile | 90th percentile |
|---|---|---|---|---|---|---|---|---|---|---|---|
| 1 | Red River of the North | 24 | 0 | 0 | 4 | 173 | 14 | 38 | 63 | 109 | 137 |
| 2 | Wild Rice River | 24 | 0 | 0 | 7 | 366 | 16 | 48 | 98 | 139 | 188 |
| 3 | Wild Rice River | 24 | 0 | 0 | 8 | 287 | 20 | 49 | 99 | 161 | 197 |
| 4 | Red River of the North | 24 | 0 | 0 | 2 | 303 | 5 | 35 | 63 | 123 | 202 |
| 5 | Red River of the North | 30 | 0 | 0 | 6 | 301 | 13 | 68 | 104 | 146 | 207 |
| 6 | Sheyenne River | 30 | 0 | 0 | 4 | 1,210 | 20 | 48 | 211 | 426 | 738 |
| 7 | Maple River | 29 | 0 | 0 | 14 | 427 | 25 | 55 | 108 | 167 | 283 |
| 8 | Sheyenne River | 30 | 0 | 0 | 8 | 588 | 36 | 66 | 180 | 259 | 315 |
| 9 | Red River of the North | 30 | 0 | 0 | 10 | 428 | 26 | 92 | 155 | 265 | 306 |
| 10 | Red River of the North | 30 | 0 | 0 | 9 | 542 | 51 | 93 | 151 | 231 | 360 |
| 1 | Red River of the North | 24 | 0 | 0 | 75 | 99 | 89 | 92 | 95 | 97 | 98 |
| 2 | Wild Rice River | 24 | 0 | 0 | 89 | 100 | 92 | 98 | 99 | 100 | 100 |
| 3 | Wild Rice River | 24 | 0 | 0 | 84 | 100 | 96 | 98 | 99 | 99 | 100 |
| 4 | Red River of the North | 24 | 0 | 0 | 25 | 100 | 91 | 97 | 98 | 99 | 99 |
| 5 | Red River of the North | 30 | 0 | 0 | 86 | 100 | 96 | 97 | 98 | 99 | 99 |
| 6 | Sheyenne River | 30 | 0 | 0 | 43 | 100 | 61 | 66 | 83 | 94 | 96 |
| 7 | Maple River | 29 | 0 | 0 | 64 | 100 | 95 | 97 | 98 | 99 | 100 |
| 8 | Sheyenne River | 30 | 0 | 0 | 77 | 100 | 86 | 94 | 96 | 97 | 99 |
| 9 | Red River of the North | 30 | 0 | 0 | 94 | 100 | 95 | 96 | 97 | 99 | 99 |
| 10 | Red River of the North | 30 | 0 | 0 | 94 | 100 | 96 | 97 | 99 | 99 | 99 |
| 1 | Red River of the North | 24 | 2 | 8 | <5 | 158 | 12 | 35 | 58 | 107 | 133 |
| 2 | Wild Rice River | 24 | 0 | 0 | 12 | 320 | 17 | 51 | 87 | 129 | 196 |
| 3 | Wild Rice River | 24 | 0 | 0 | <5 | 310 | 16 | 51 | 90 | 153 | 185 |
| 4 | Red River of the North | 24 | 2 | 8 | <5 | 210 | 8 | 38 | 63 | 108 | 146 |
| 5 | Red River of the North | 30 | 1 | 3 | <5 | 314 | 13 | 67 | 99 | 136 | 190 |
| 6 | Sheyenne River | 30 | 1 | 3 | <5 | 700 | 22 | 39 | 144 | 251 | 396 |
| 7 | Maple River | 30 | 1 | 3 | <5 | 380 | 17 | 59 | 97 | 161 | 217 |
| 8 | Sheyenne River | 30 | 1 | 3 | <5 | 490 | 38 | 93 | 160 | 220 | 258 |
| 9 | Red River of the North | 30 | 0 | 0 | 6 | 334 | 27 | 81 | 130 | 216 | 264 |
| 10 | Red River of the North | 30 | 0 | 0 | 7 | 498 | 54 | 76 | 123 | 213 | 285 |
| 1 | Red River of the North | 23 | 0 | 0 | 0.0 | 25.8 | 1.7 | 4.9 | 13.3 | 24.2 | 25.2 |
| 2 | Wild Rice River | 24 | 0 | 0 | 0.0 | 25.5 | 0.2 | 2.4 | 13.3 | 23.4 | 25.1 |
| 3 | Wild Rice River | 24 | 0 | 0 | 0.0 | 26.4 | 0.7 | 3.5 | 13.6 | 24.0 | 24.6 |
| 4 | Red River of the North | 24 | 0 | 0 | 0.0 | 27.0 | 1.0 | 4.6 | 13.8 | 24.4 | 25.8 |
| 5 | Red River of the North | 30 | 0 | 0 | 0.0 | 26.3 | 0.9 | 4.3 | 8.1 | 23.0 | 24.9 |
| 6 | Sheyenne River | 30 | 0 | 0 | 0.0 | 25.6 | 0.6 | 3.0 | 8.7 | 22.6 | 24.7 |
| 7 | Maple River | 30 | 0 | 0 | -0.1 | 25.8 | 1.8 | 3.5 | 10.0 | 22.0 | 23.9 |
| 8 | Sheyenne River | 30 | 0 | 0 | 0.0 | 26.3 | 0.7 | 3.6 | 7.8 | 22.3 | 24.7 |
| 9 | Red River of the North | 30 | 0 | 0 | 0.0 | 26.9 | 0.9 | 3.6 | 8.1 | 23.1 | 24.7 |
| 10 | Red River of the North | 30 | 0 | 0 | 0.0 | 26.4 | 0.4 | 3.8 | 8.7 | 22.8 | 24.8 |
| 1 | Red River of the North | 24 | 0 | 0 | 474 | 1,430 | 504 | 594 | 838 | 1,085 | 1,171 |
| 2 | Wild Rice River | 24 | 0 | 0 | 887 | 2,260 | 1,340 | 1,488 | 1,570 | 1,820 | 2,021 |
| 3 | Wild Rice River | 24 | 0 | 0 | 714 | 2,390 | 1,336 | 1,465 | 1,560 | 1,933 | 2,160 |
| 4 | Red River of the North | 24 | 0 | 0 | 537 | 1,380 | 598 | 683 | 901 | 1,250 | 1,287 |
| 5 | Red River of the North | 30 | 0 | 0 | 616 | 1,450 | 637 | 787 | 1,010 | 1,270 | 1,300 |
| 6 | Sheyenne River | 30 | 0 | 0 | 768 | 1,770 | 916 | 1,083 | 1,235 | 1,365 | 1,590 |
| 7 | Maple River | 30 | 0 | 0 | 677 | 2,620 | 832 | 1,115 | 1,380 | 1,785 | 2,183 |
| 8 | Sheyenne River | 30 | 0 | 0 | 756 | 1,800 | 851 | 1,053 | 1,225 | 1,500 | 1,679 |
| 9 | Red River of the North | 30 | 0 | 0 | 650 | 1,480 | 830 | 978 | 1,090 | 1,148 | 1,270 |
| 10 | Red River of the North | 30 | 0 | 0 | 562 | 1,480 | 681 | 872 | 981 | 1,098 | 1,222 |
| 1 | Red River of the North | 24 | 0 | 0 | 6.0 | 13.3 | 6.6 | 7.2 | 9.9 | 12.0 | 12.8 |
| 2 | Wild Rice River | 24 | 0 | 0 | 2.8 | 14.3 | 5.7 | 6.1 | 8.0 | 10.9 | 12.2 |
| 3 | Wild Rice River | 24 | 0 | 0 | 4.6 | 14.0 | 5.8 | 6.7 | 7.8 | 10.4 | 12.5 |
| 4 | Red River of the North | 24 | 0 | 0 | 5.6 | 14.2 | 6.1 | 7.1 | 9.9 | 12.2 | 12.9 |
| 5 | Red River of the North | 30 | 0 | 0 | 5.9 | 13.1 | 6.6 | 7.8 | 10.1 | 12.0 | 12.6 |
| 6 | Sheyenne River | 30 | 0 | 0 | 6.9 | 13.7 | 7.4 | 8.9 | 10.4 | 12.5 | 12.9 |
| 7 | Maple River | 30 | 0 | 0 | 4.4 | 12.7 | 6.0 | 6.9 | 9.7 | 10.7 | 12.3 |
| 8 | Sheyenne River | 30 | 0 | 0 | 7.0 | 14.2 | 7.2 | 7.8 | 10.3 | 11.6 | 12.6 |
| 9 | Red River of the North | 30 | 0 | 0 | 5.8 | 12.9 | 6.6 | 7.8 | 10.2 | 11.8 | 12.3 |
| 10 | Red River of the North | 30 | 0 | 0 | 6.1 | 12.6 | 6.5 | 7.5 | 10.0 | 11.0 | 11.8 |
| 1 | Red River of the North | 22 | 0 | 0 | 7.8 | 8.7 | 8.0 | 8.0 | 8.2 | 8.3 | 8.3 |
| 2 | Wild Rice River | 22 | 0 | 0 | 7.2 | 8.5 | 7.8 | 8.0 | 8.1 | 8.3 | 8.4 |
| 3 | Wild Rice River | 21 | 0 | 0 | 7.6 | 8.5 | 7.9 | 8.0 | 8.2 | 8.3 | 8.4 |
| 4 | Red River of the North | 23 | 0 | 0 | 7.6 | 8.7 | 7.8 | 8.0 | 8.1 | 8.3 | 8.5 |
| 5 | Red River of the North | 27 | 0 | 0 | 7.7 | 8.5 | 7.8 | 7.9 | 8.1 | 8.2 | 8.3 |
| 6 | Sheyenne River | 28 | 0 | 0 | 7.8 | 8.7 | 7.9 | 8.0 | 8.2 | 8.3 | 8.5 |
| 7 | Maple River | 27 | 0 | 0 | 7.5 | 8.7 | 7.8 | 8.0 | 8.1 | 8.2 | 8.4 |
| 8 | Sheyenne River | 29 | 0 | 0 | 7.7 | 8.6 | 7.7 | 8.0 | 8.1 | 8.3 | 8.4 |
| 9 | Red River of the North | 28 | 0 | 0 | 7.7 | 8.5 | 7.8 | 8.0 | 8.2 | 8.3 | 8.4 |
| 10 | Red River of the North | 27 | 0 | 0 | 7.6 | 8.5 | 7.8 | 8.0 | 8.1 | 8.2 | 8.3 |
| 1 | Red River of the North | 24 | 0 | 0 | 2 | 65 | 3 | 17 | 28 | 47 | 55 |
| 2 | Wild Rice River | 24 | 0 | 0 | 5 | 150 | 10 | 26 | 44 | 58 | 79 |
| 3 | Wild Rice River | 24 | 0 | 0 | 6 | 110 | 12 | 30 | 44 | 64 | 90 |
| 4 | Red River of the North | 24 | 0 | 0 | 3 | 96 | 4 | 21 | 29 | 47 | 62 |
| 5 | Red River of the North | 30 | 0 | 0 | 6 | 120 | 9 | 32 | 45 | 63 | 81 |
| 6 | Sheyenne River | 30 | 0 | 0 | 3 | 310 | 9 | 15 | 58 | 97 | 151 |
| 7 | Maple River | 30 | 0 | 0 | 7 | 210 | 12 | 39 | 55 | 71 | 123 |
| 8 | Sheyenne River | 30 | 0 | 0 | 4 | 260 | 17 | 32 | 71 | 98 | 122 |
| 9 | Red River of the North | 30 | 0 | 0 | 5 | 160 | 13 | 46 | 61 | 98 | 132 |
| 10 | Red River of the North | 30 | 0 | 0 | 5 | 200 | 19 | 44 | 72 | 107 | 151 |
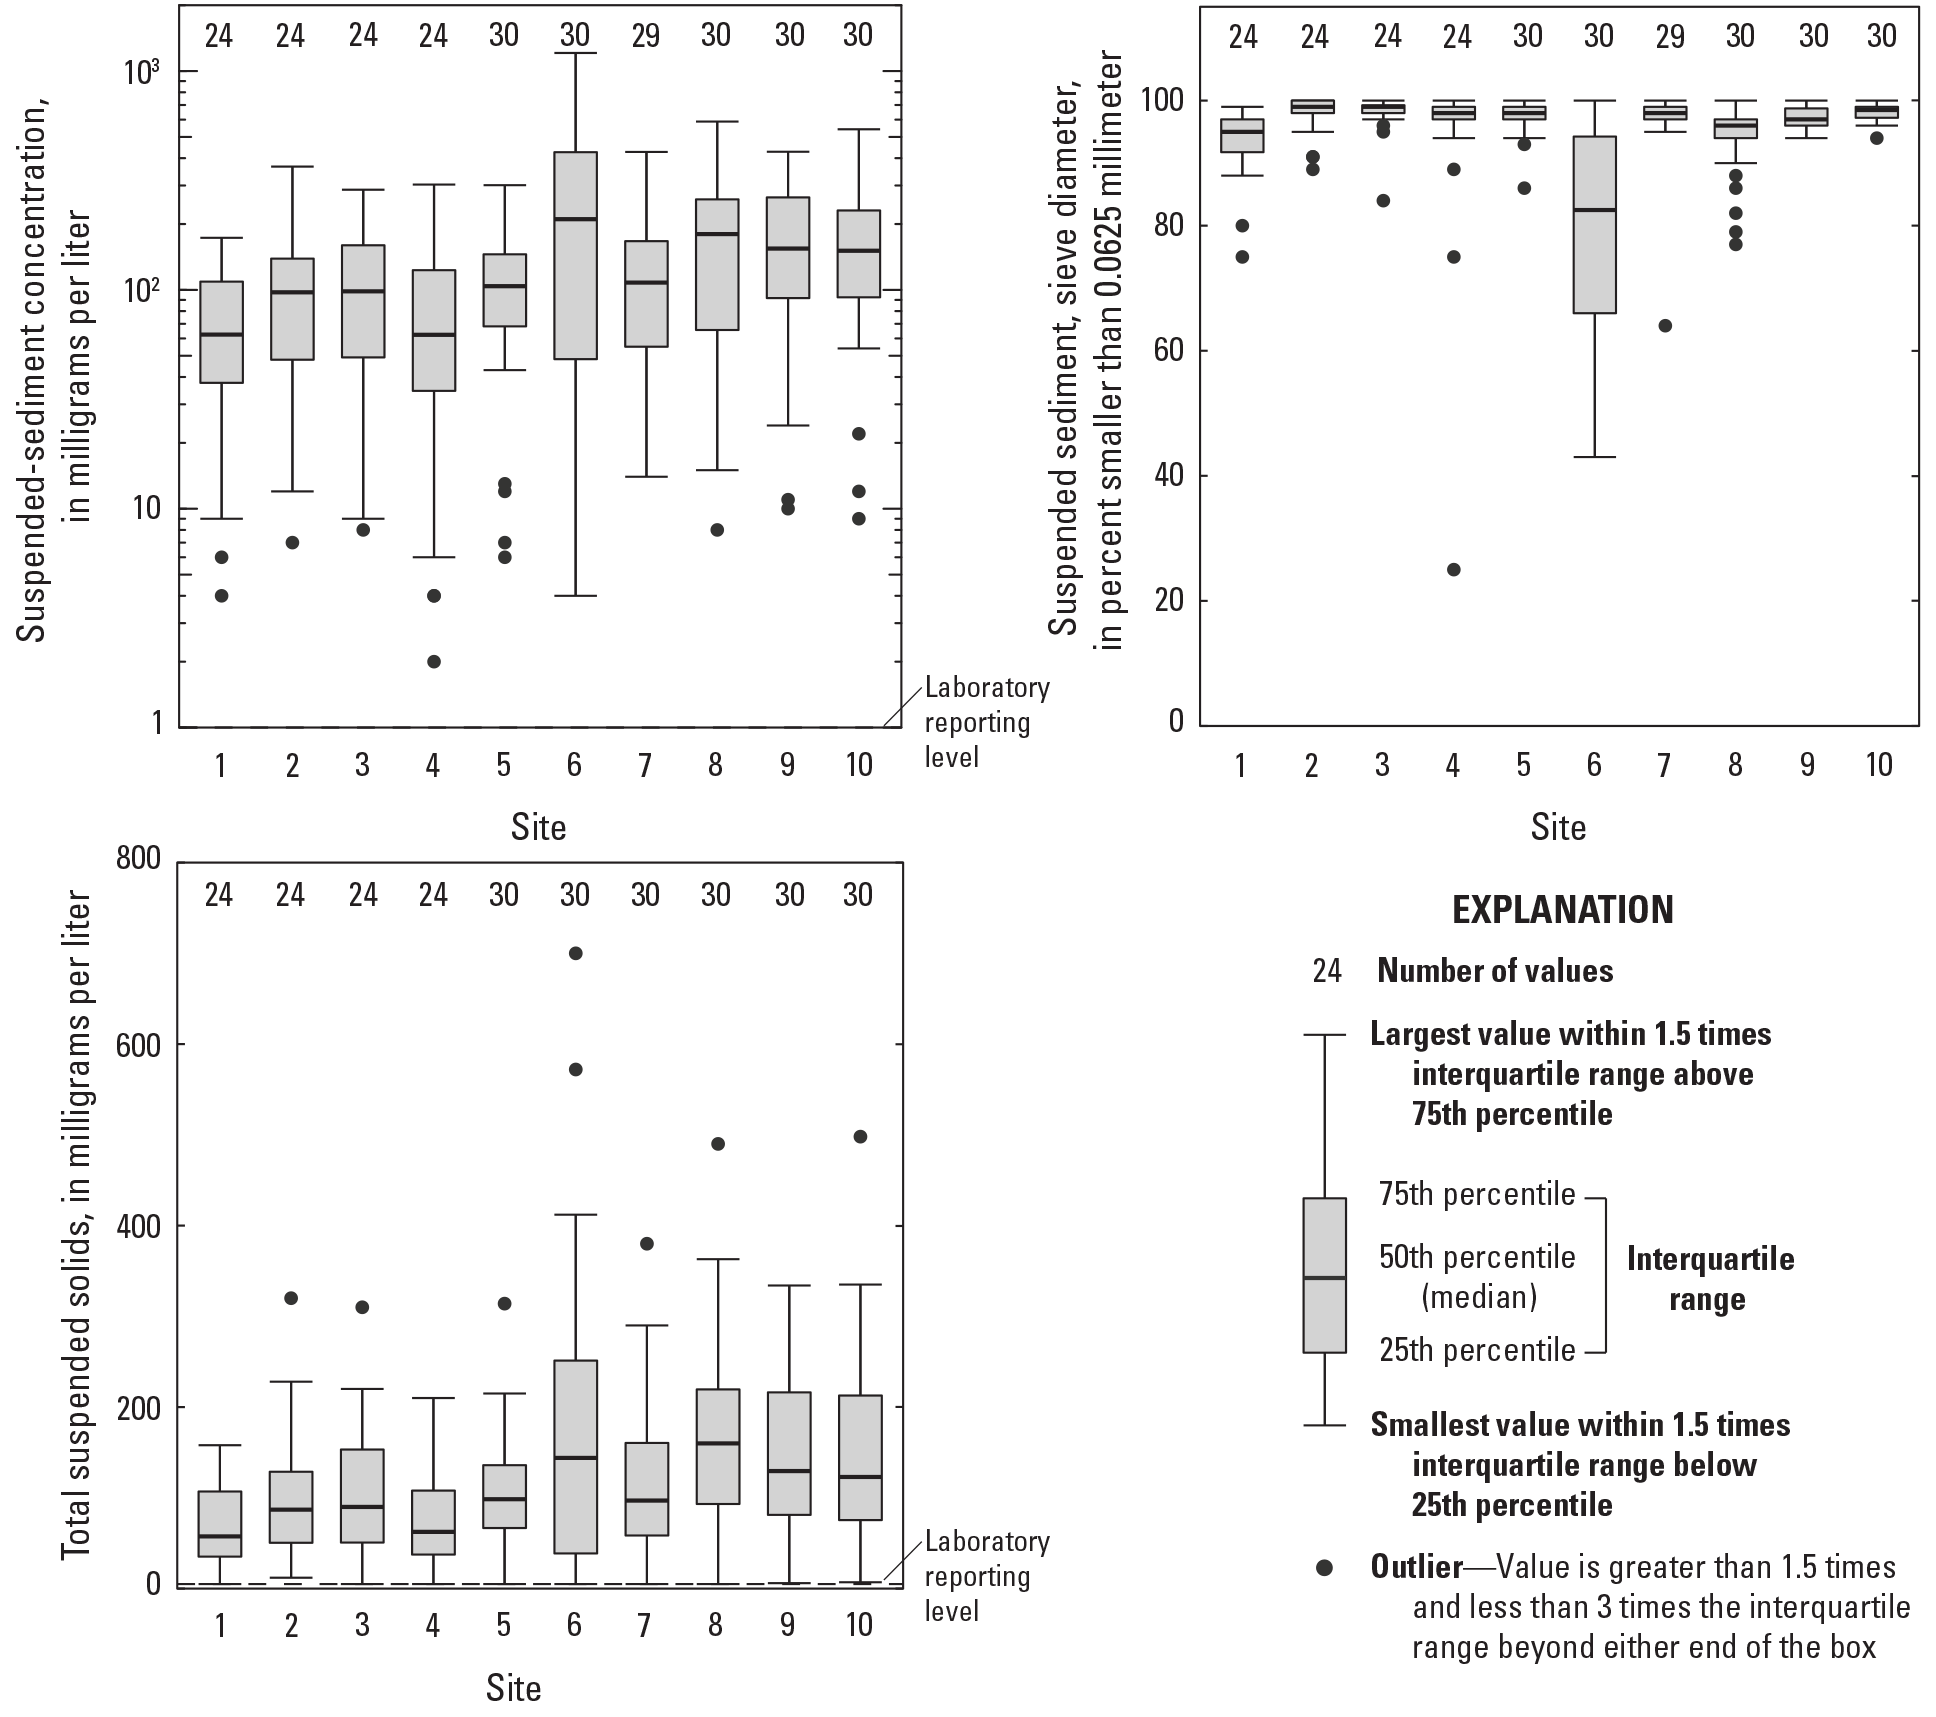
Distribution of concentrations for suspended sediment and total suspended solids from samples collected at 10 sites in the Fargo-Moorhead metropolitan area from October 1, 2019, to October 1, 2022.
Pesticides
Samples collected from April through October at the Wild Rice River (site 2), Sheyenne River (site 6), Red River (sites 4 and 9), and the Maple River (site 7) were analyzed for 102 different pesticides and pesticide degradates. Of the 102 constituents analyzed, 45 constituents had no detectable concentrations in any of the 17 samples collected at each of the five sites from October 1, 2019, to October 1, 2022 (table 11). The remaining 57 pesticides had at least 1 detection in the samples collected at the five sites (tables 12 and 13). Some detections could not be quantified with a value for concentration because although they had a concentration that was greater than the detection level, the concentration was less than the laboratory reporting level. When the concentration is less than the laboratory reporting level, there is a high level of uncertainty in the concentration value, so the laboratory reported a detection but not a quantified concentration.
The sites on the Wild Rice River (site 2) and Sheyenne River (site 6) had fewer pesticide detections compared to the Maple River (site 7) and the Red River sites (sites 4 and 9). Out of 969 possible pesticide detections (17 samples and 57 pesticide analytes), a total of 389 detections were measure at site 2 and 391 detections were measured at site 6 or about 40 percent of pesticides analyzed were detected at each site. For the Maple River (site 7), a total of 437 pesticide detections or 45 percent of the pesticide analytes were detected, with 300 detections (31 percent) having quantifiable concentrations (table 13). For the Red River, 411 detections were measured at site 4 and 497 detections were measured at site 9 (42 and 51 percent of the total at each site, respectively), with 25 and 33 percent of the samples having quantifiable concentrations, respectively (table 12).
Of the 57 pesticides detected at the five sites, 14 pesticides or degradates were detected in nearly all samples (tables 12 and 13). Although acetochlor was only detected in about 20 percent of the samples collected at each site, two degradates of acetochlor were detected in all samples, and most had quantifiable concentrations. Atrazine and two of its degradate compounds, deethyl atrazine and hydroxy atrazine, were also detected in every sample with quantifiable concentrations. Likewise, metolachlor and two of its degradate compounds, metolachlor ethanesulfonic acid and metolachlor oxanilic acid, were detected in nearly all samples. Other pesticides detected in nearly all samples included 2,4-D; bentazon; dimethenamid (and one of its degradate compounds); imazapyr; and imazethapyr. Other pesticides that were detected frequently, but at mostly low concentrations that were not quantifiable, included alachlor (and one of its degradate compounds), deisopropyl atrazine (a degradate of atrazine), 4-chloro-2-methylphenoxy acetic acid (MCPA), prometon, propiconazole, pyrasulfotole, saflufenacil, sulfentrazone, tebuconazole, and tetraconazole (tables 12 and 13).
Pesticide compounds with quantifiable detections had relatively low concentrations in the samples collected at the five sites (tables 12 and 13). Acetochlor is an herbicide commonly used on corn and soybeans in North Dakota (North Dakota Department of Agriculture, 2023). The highest measured concentration was 3.400 μg/L at site 9, with the highest concentrations all below 1 μg/L at the other four sites. The two acetochlor degradates, acetochlor ethanesulfonic acid and acetochlor oxanilic acid, had maximum concentrations of 1.600 μg/L (site 7) and 1.700 μg/L (site 2), respectively. Atrazine is a broadleaf herbicide used primarily on corn and had a maximum concentration of 2.700 μg/L at site 7. For comparison, the U.S. Environmental Protection Agency (EPA) has a maximum contaminant level (MCL) of 3 μg/L for atrazine (Norman and others, 2018). There were four atrazine degradates detected in samples, but all concentrations were less than 0.500 μg/L in samples collected at the five sites (tables 12 and 13). Metolachlor is used for grass and broadleaf weed control primarily on corn crops in North Dakota (North Dakota Department of Agriculture, 2023). The highest concentration of metolachlor was 3.300 μg/L at sites 2 and 7. The two metolachlor degradates, metolachlor ethanesulfonic acid and metolachlor oxanilic acid, both had maximum concentrations of 1.700 μg/L (both at sites 2 and 7). There are no EPA MCLs for metolachlor or its degradates.
Other frequently detected pesticides that had relatively low concentrations at the five sites included 2,4-D; bentazon; dimethenamid; imazapyr; and imazethapyr. 2,4-D is a widely used herbicide that controls broadleaf weeds for turf, lawns, rights-of-way, pastures, and a variety of vegetable crops (U.S. Environmental Protection Agency, 2023a). The highest concentration of 2,4-D at the five sites was 0.970 μg/L at site 2 on the Wild Rice River. Bentazon, imazapyr, and imazethapyr are also herbicides that had maximum concentrations of 1.10 μg/L, 0.086 μg/L, 0.094 μg/L, respectively, all at site 7 on the Maple River (table 13). Dimethenamid, an herbicide, and a degradate product, dimethenamid oxanilic acid, were frequently detected and had maximum concentrations of 0.540 μg/L and 0.300 μg/L, respectively, both at site 2 on the Wild Rice River.
Table 11.
Pesticides and degradates that were not detected in any samples collected from five sites in the Fargo-Moorhead metropolitan area, October 1, 2019, to October 1, 2022.Table 12.
Summary of pesticides and degradates detected in samples collected from two sites on the Red River of the North in the Fargo-Moorhead metropolitan area, October 1, 2019, to October 1, 2022.[No., number; unquant., unquantifiable; quant., quantifiable; Max; maximum; conc., concentrations; µg/L, microgram per liter; H, herbicide; --, not applicable or not available; HD, herbicide degradate; F, fungicide; IN, insecticide neonictinoid; I, insecticide; 17 total samples were collected at each of the sites from October 1, 2019, to October 1, 2022]
Table 13.
Summary of pesticides and degradates detected in samples collected from sites on the Wild Rice, Sheyenne, and Maple Rivers in the Fargo-Moorhead metropolitan area, October 1, 2019, to October 1, 2022.[No., number; unquant., unquantifiable; quant., quantifiable; Max; maximum; conc., concentrations; µg/L, microgram per liter; H, herbicide; --, not applicable or not available; HD, herbicide degradate; F, fungicide; IN, insecticide neonictinoid; I, insecticide; 17 total samples were collected at each of the sites from October 1, 2019, to October 1, 2022]
Fecal Indicator Bacteria
Fecal indicator bacteria are used to measure the sanitary quality of water. Indicator bacteria are not typically disease-causing but are correlated to the presence of water-borne pathogens. Sources of fecal indicator bacteria include undisinfected wastewater-treatment discharges; combined-sewer overflows; septic systems; animal wastes from feedlots, barnyards, and pastures; manure application areas; and stormwater runoff (U.S. Environmental Protection Agency, 2023b). Escherichia coli (E. coli) was the indicator bacteria measured at the 10 sites on the Red River and its tributaries in the Fargo-Moorhead metropolitan area. E. coli is strictly an inhabitant of the gastrointestinal tract of warm-blooded animals and its presence in water is direct evidence of fecal contamination from warm-blooded animals and the possible presence of pathogens (Dufour, 1977).
E. coli counts in samples collected at the 10 sites from October 1, 2019, to October 1, 2022, were highly variable among the sites and among the samples collected at each site (table 14 and fig. 8). Only samples collected from May through August at the sites were analyzed for E. coli, resulting in 12 or 13 E. coli samples at each site for the 3-year period. In general, sites on the tributaries and on the Red River upstream from the urban areas around Fargo and Moorhead had lower counts of E. coli compared to sites downstream from the urban areas. E. coli counts for the Wild Rice River (sites 2 and 3) had median values of 41 and 15 colonies per 100 milliliters (col/100 mL), respectively, and the Maple River (site 7) had a median of 20 col/100 mL (table 14). The Red River at site 1 had a median of 15 col/100 mL. The Sheyenne River at site 6 had the highest median among the sites upstream from the Fargo-Moorhead metropolitan area with a median of 63 col/100 mL. The higher E. coli counts at site 6 may be attributed to factors such as runoff from livestock feeding operations or pastureland, or the presence of leaking septic systems in the area. In comparison, sites near the urban areas had relatively higher E. coli counts compared to the other sites. The Red River at site 5 and the Sheyenne River at site 8 had the highest median E. coli counts among all sites with values of 190 and 120 col/100 mL, respectively. The Red River at site 4 had the highest count in a single sample at 13,000 col/100 mL, likely associated with stormwater runoff from the surrounding urban areas. However, the median of all the E. coli samples for site 4 was only 20 col/100 mL. E. coli counts generally decreased at sites farther downstream from the Fargo-Moorhead metropolitan area on the Red River. The Red River at site 9 had a median of 115 col/100 mL and the Red River at site 10 had a median of 41 col/100 mL (table 14).
Table 14.
Summary statistics for Escherichia coli (E. coli) counts in samples collected at 10 sites in the Fargo-Moorhead metropolitan area, October 1, 2019, to October 1, 2022.[ID, identification; Min, minimum; Max, maximum; <, less than]
| Site ID (fig. 1) |
River name | Number of observations | Number of censored observations | Percent of data censored | Escherichia coli counts, in colonies per 100 milliliters | ||||||
|---|---|---|---|---|---|---|---|---|---|---|---|
| Min | Max | 10th percentile | 25th percentile | 50th percentile | 75th percentile | 90th percentile | |||||
| 1 | Red River of the North | 12 | 5 | 42 | <10 | 41 | <10 | <10 | 15 | 41 | 41 |
| 2 | Wild Rice River | 12 | 1 | 8 | <10 | 97 | 11 | 20 | 41 | 52 | 62 |
| 3 | Wild Rice River | 12 | 4 | 33 | <10 | 210 | <10 | <10 | 15 | 36 | 113 |
| 4 | Red River of the North | 12 | 3 | 25 | <10 | 13,000 | <10 | <10 | 20 | 41 | 82 |
| 5 | Red River of the North | 13 | 2 | 15 | <10 | 930 | <10 | 41 | 190 | 500 | 722 |
| 6 | Sheyenne River | 12 | 1 | 8 | <10 | 960 | <10 | 25 | 63 | 303 | 433 |
| 7 | Maple River | 13 | 2 | 15 | <10 | 170 | 11 | 20 | 20 | 52 | 149 |
| 8 | Sheyenne River | 12 | 2 | 17 | <10 | 300 | <10 | 42 | 120 | 180 | 255 |
| 9 | Red River of the North | 12 | 3 | 25 | <10 | 1,200 | <10 | 48 | 115 | 163 | 236 |
| 10 | Red River of North | 12 | 3 | 25 | <10 | 330 | <10 | <10 | 41 | 150 | 189 |
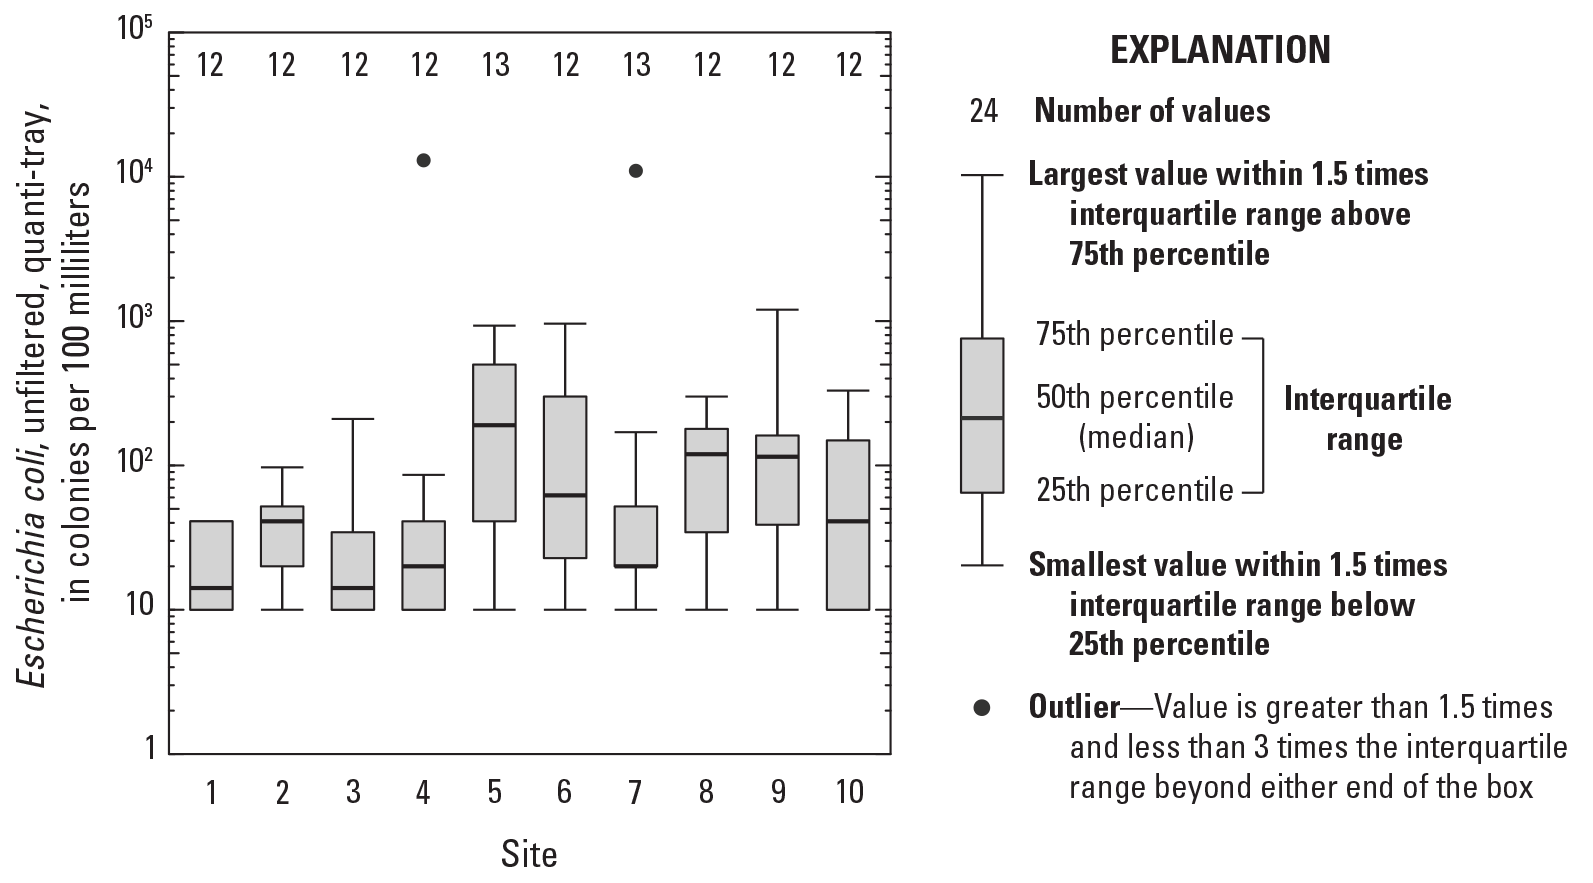
Distribution of concentrations for Escherichia coli from samples collected at 10 sites in the Fargo-Moorhead metropolitan area from October 1, 2019, to October 1, 2022.
Estimated Loads and Yields
Annual and seasonal loads were estimated for TDS, chloride, sodium, sulfate, nitrate plus nitrite (unfiltered), phosphorus (unfiltered), and suspended sediment using streamflow data and the discrete water-quality sample data collected at 10 sites in the Fargo-Moorhead metropolitan area from October 1, 2019, to October 1, 2022. Annual yields (load/contributing area) were also computed for the 10 sites for water years 2020–22.
Patterns in annual loads generally were the same as patterns in streamflow at the 10 sites for water years 2020–22 (fig. 9). Because load represents the mass of a constituent that is transported past a site, more material is generally transported during higher streamflow compared to lower streamflow. The greatest loads for all constituents generally were delivered at sites 9 and 10 on the Red River; sites that also had the highest annual streamflows among the sites (fig. 9). The greatest loads generally were delivered in water year 2020 when the streamflows were highest at the sites (fig. 9). Likewise, the least loads for most constituents were at the Maple River (site 7) and were least in 2021 compared to the other years because of low-streamflow conditions. Patterns in annual yields were different depending on the constituent compared to loads for the 10 sites in the Fargo-Moorhead metropolitan area because the yield reflects mass being transported at a site that is normalized to the contributing drainage area at each site.
Table 15.
Annual loads for total dissolved solids, chloride, sodium, and sulfate at 10 sites in the Fargo-Moorhead metropolitan area for water years 2020–22.[ID, identification]
| Site ID (fig. 1) | River name | Annual loads, in thousands of tons (short) | |||||||||||
|---|---|---|---|---|---|---|---|---|---|---|---|---|---|
| Total dissolved solids | Chloride | Sodium | Sulfate | ||||||||||
| 2020 | 2021 | 2022 | 2020 | 2021 | 2022 | 2020 | 2021 | 2022 | 2020 | 2021 | 2022 | ||
| 1 | Red River of the North | 1,120 | 332 | 1,090 | 32.2 | 12.6 | 28.3 | 61.5 | 18.5 | 59.7 | 549 | 118 | 635 |
| 2 | Wild Rice River | 747 | 58.8 | 388 | 23.4 | 2.04 | 12.2 | 57.6 | 5.33 | 30.1 | 389 | 29.7 | 202 |
| 3 | Wild Rice River | 794 | 63.7 | 442 | 25.9 | 2.30 | 14.5 | 61.8 | 5.73 | 34.5 | 408 | 32.6 | 227 |
| 4 | Red River of the North | 1,930 | 412 | 1,560 | 58.7 | 16.3 | 45.7 | 119 | 25.5 | 96.4 | 1,000 | 162 | 857 |
| 5 | Red River of the North | 1,870 | 446 | 1,490 | 66.2 | 21.3 | 50.7 | 123 | 32.2 | 96.5 | 935 | 179 | 772 |
| 6 | Sheyenne River | 1,100 | 197 | 717 | 48.2 | 10.5 | 32.0 | 133 | 25.4 | 87.7 | 458 | 81.1 | 299 |
| 7 | Maple River | 491 | 35.6 | 365 | 21.8 | 2.02 | 16.0 | 40.8 | 3.58 | 30.1 | 238 | 17.6 | 177 |
| 8 | Sheyenne River | 1,630 | 255 | 1,110 | 73.3 | 14.3 | 50.2 | 176 | 32.3 | 120 | 712 | 109 | 481 |
| 9 | Red River of the North | 3,910 | 795 | 2,730 | 152 | 39.6 | 107 | 322 | 76.4 | 225 | 1,780 | 325 | 1,250 |
| 10 | Red River of the North | 4,350 | 871 | 3,020 | 163 | 41.1 | 113 | 335 | 79.2 | 232 | 1,870 | 343 | 1,300 |
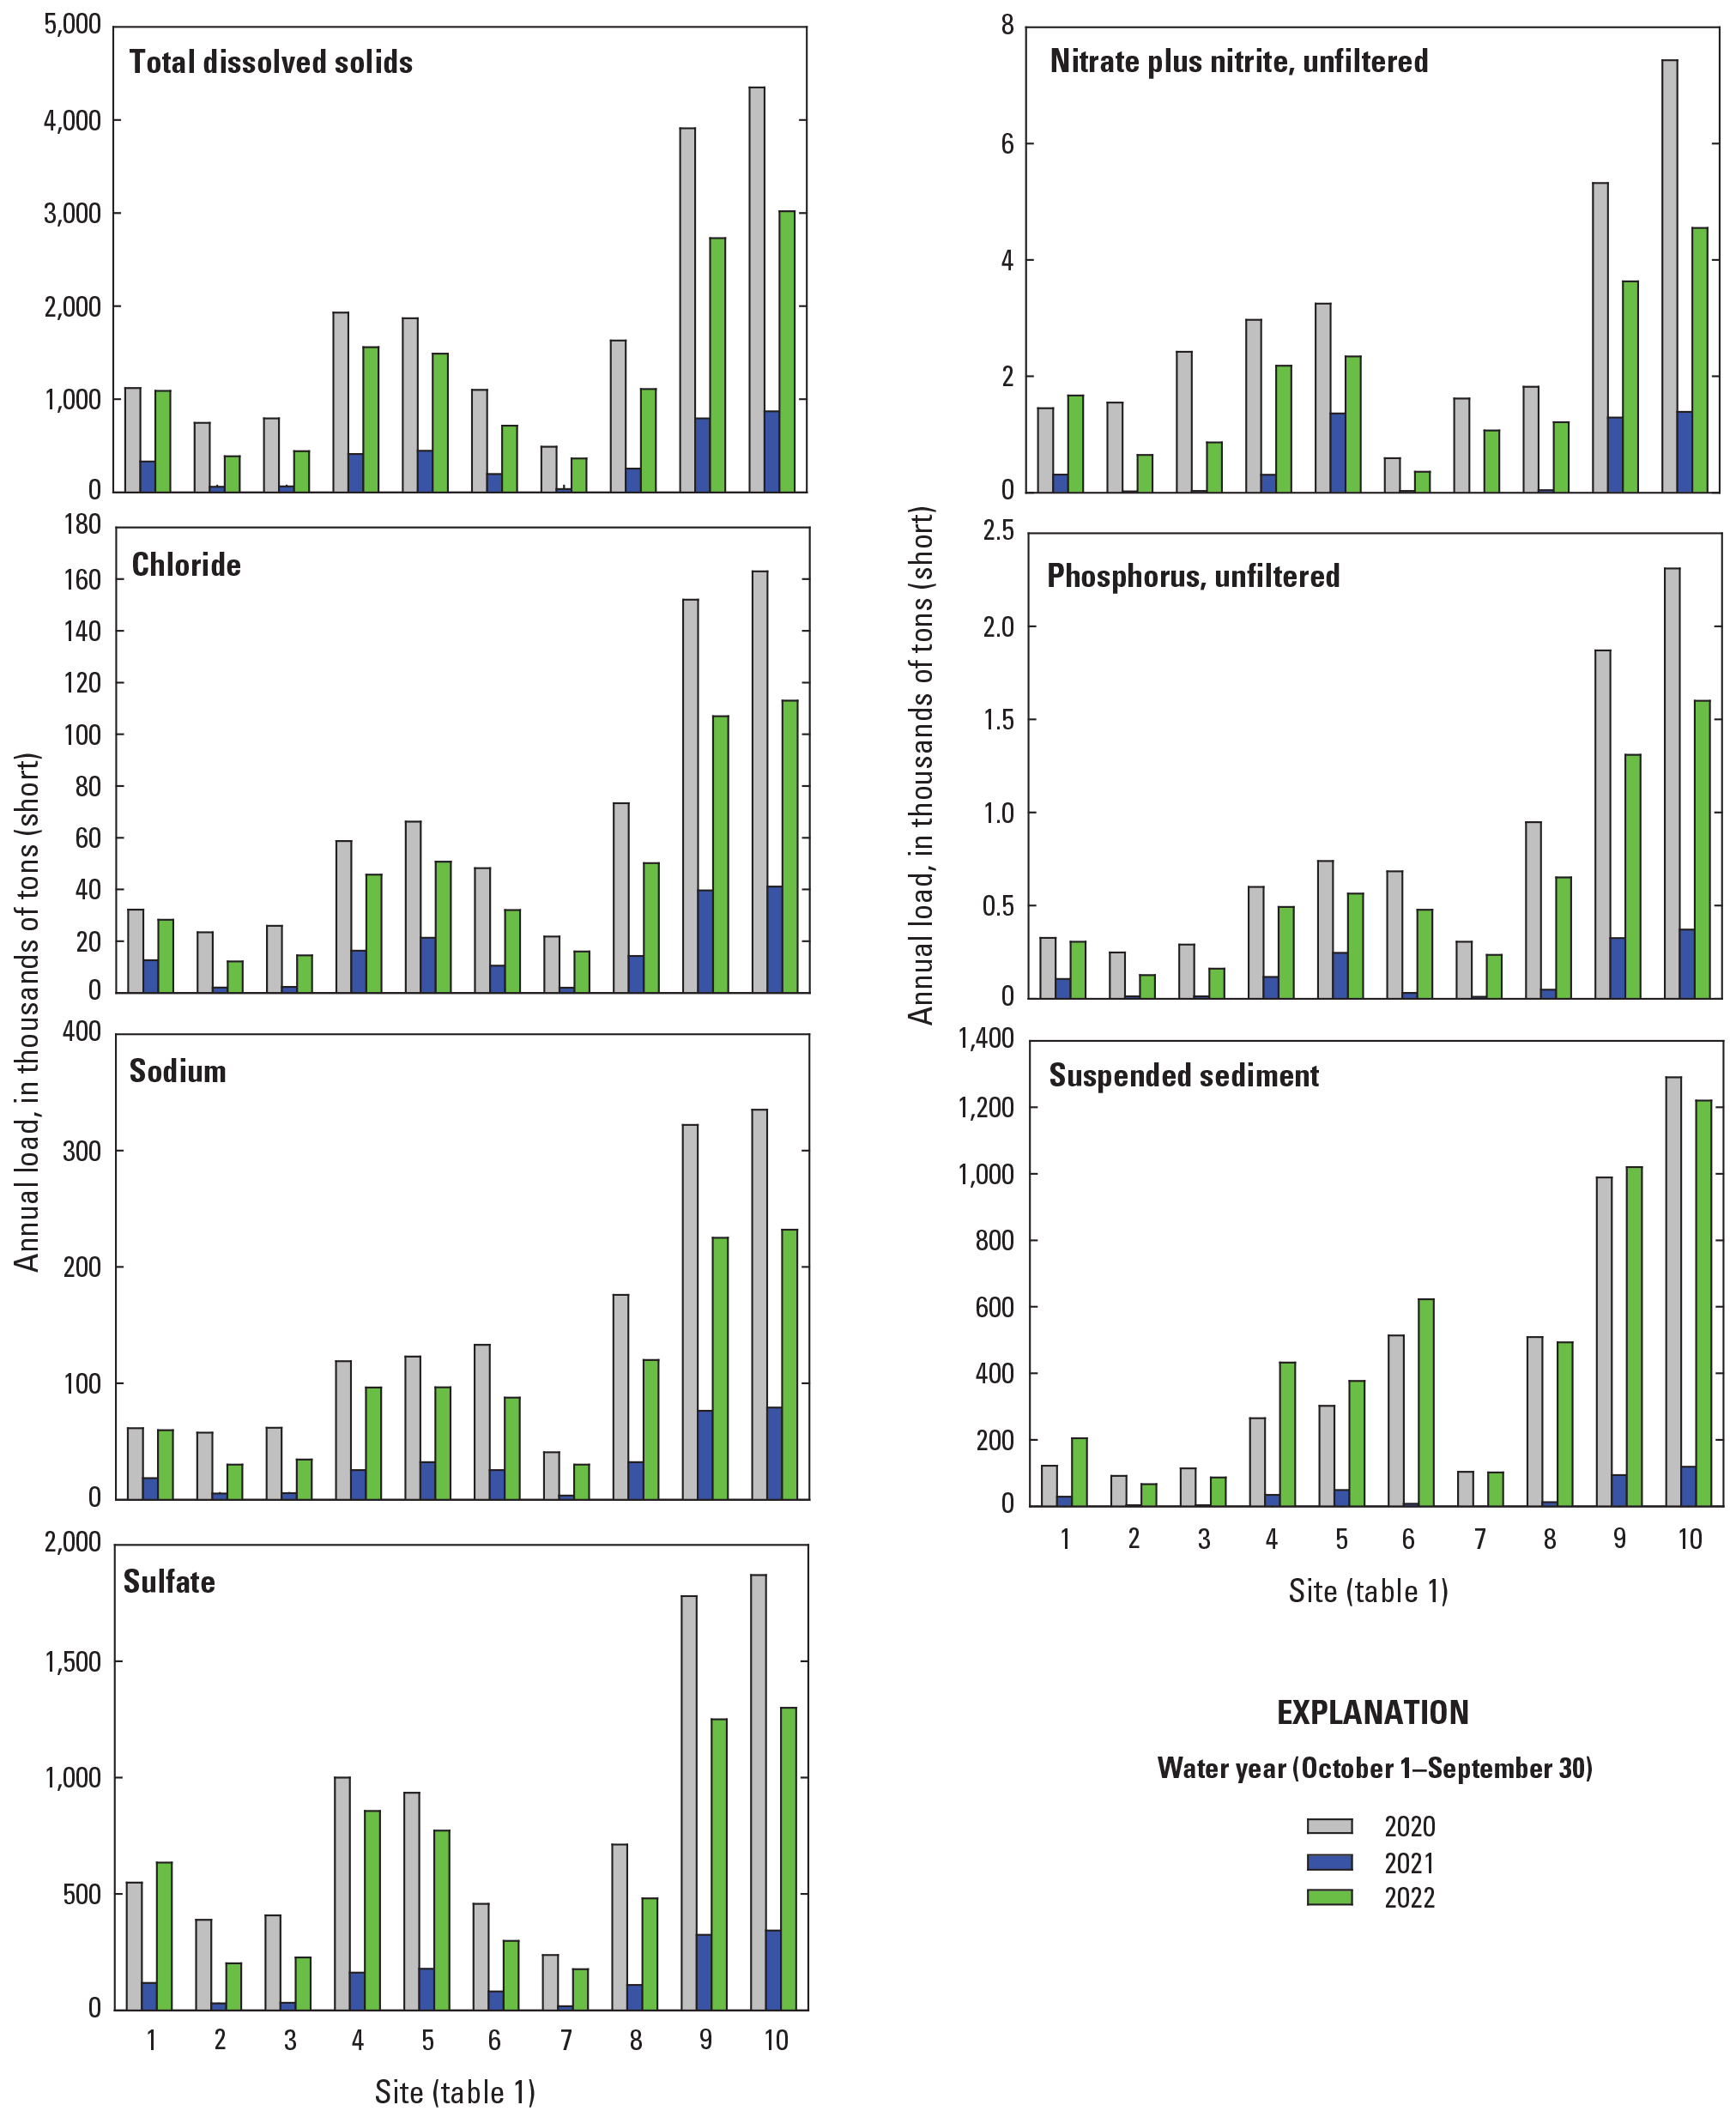
Annual loads for selected constituents at 10 sites in the Fargo-Moorhead metropolitan area for water years 2020–22.
Total Dissolved Solids and Major Ions
Annual loads of TDS for the Red River increased from upstream to downstream sites through the Fargo-Moorhead metropolitan area, which generally reflected the mass added from the tributary inputs between sites in water years 2020 through 2022. Annual TDS loads for the Red River in water year 2020 ranged from 1,120,000 tons at site 1 to 4,350,000 tons at site 10 (table 15 and fig. 9). In comparison, TDS loads in water year 2021 ranged from 332,000 tons at site 1 to 871,000 tons at site 10. For the Wild Rice River, annual loads ranged from 58,800 tons (2021) to 747,000 tons (2020) at site 2 and from 63,700 tons (2021) to 794,000 tons (2020) at site 3. The Wild Rice River enters the Red River between site 1 and site 4 and contributed about 80 percent (2021) to 98 percent (2020) of the increase in TDS load between sites 1 and 4. Because water year 2021 had little runoff and low-streamflow conditions compared to the other years, the lower percent contribution from the Wild Rice River to the Red River in 2021 may indicate sources other than runoff may have contributed a larger percentage of the TDS loads, such as groundwater discharge. TDS loads for the Sheyenne River ranged from 197,000 (2021) to 1,100,000 tons (2020) at site 6 and from 255,000 (2021) to 1,630,000 tons (2020) at site 8 (table 15 and fig. 9). The Sheyenne River enters the Red River between sites 5 and 9 and contributed about 73 percent (2021) to 90 percent (2022) of the increase in TDS load between sites 5 and 9. Annual TDS loads for the Maple River (site 7) ranged from 35,600 tons (2021) to 491,000 tons (2020) and contributed 61 percent (2021) to 93 percent (2021 and 2022) of the increase in TDS load between sites 6 and 8 on the Sheyenne River.
Similar to TDS, chloride loads for the Red River increased from upstream to downstream sites through the Fargo-Moorhead metropolitan area, which generally reflected the mass added from the tributary inputs between sites. For water year 2020, 32,200 tons of chloride were transported past site 1 on the Red River. The mass increased to 58,700 tons at site 4; 66,200 tons at site 5; 152,000 tons at site 9; and 163,000 tons at site 10 (table 15 and fig. 9). The Wild Rice River (site 3) contributed 2,300 (2021) to 25,900 tons (2020), or about 62 (2021) to 98 percent (2020) of the increase in chloride load between sites 1 and 4 on the Red River. The Sheyenne River enters the Red River between sites 5 and 9 and transported between 14,300 (2021) and 73,300 tons (2020, site 8), or about 78 (2021) to 89 percent (2022) of the increase between sites 5 and 9 on the Red River (table 15 and fig. 9).
Sulfate and sodium loads were much larger than chloride loads but followed similar patterns, with loads on the Red River increasing from upstream to downstream sites through the Fargo-Moorhead metropolitan area in water years 2020 through 2022. In water year 2020, annual sodium loads increased from 61,500 tons at site 1 to 335,000 tons at site 10 on the Red River, and sulfate loads increased from 549,000 tons at site 1 to 1,870,000 tons at site 10 (table 15 and fig. 9). In comparison, for water year 2021, which had relatively low-streamflow conditions, annual sodium loads ranged from 18,500 tons at site 1 to 79,200 tons at site 10 on the Red River and sulfate loads ranged from 118,000 tons at site 1 to 343,000 tons at site 10. The Wild Rice River (site 3) contributed 5,730 (2021) to 61,800 tons (2020), or about 82 (2021) to 100 percent (2020) of the increase in sodium load between sites 1 and 4 on the Red River. For sulfate, the Wild Rice River (site 3) contributed 32,600 (2021) to 408,000 tons (2020), or about 74 (2021) to 100 percent (2022) of the increase in sodium load between sites 1 and 4 on the Red River. The Sheyenne River (site 8) transported between 32,300 (2021) and 176,000 tons (2020) of sodium, or about 73 (2021) to 93 percent (2022) of the increase in sodium load between sites 5 and 9 on the Red River (table 14 and fig. 9). For sulfate, the Sheyenne River (site 8) contributed 109,000 (2021) to 712,000 tons (2020), or about 75 (2021) to 100 percent (2022) of the increase in sulfate load between sites 1 and 4 on the Red River.
The transport of constituents can vary throughout the year, with the largest mass generally transported during periods of higher streamflow compared to periods of lower streamflow. Most of the TDS, chloride, sodium, and sulfate were transported in the spring and fall months in water years 2020 and 2021, but most of the load was transported in the spring in water year 2022 followed by summer (table 16). On average, 40 to 41 percent of annual TDS load was delivered in the spring in water years 2020 and 2021, respectively, compared to 64 percent in the spring for water year 2022. Also, in water years 2020 and 2021, an average of 29 to 33 percent, respectively, of the annual TDS load was transported in the fall, compared to only 4 percent of the annual load transported in the fall for water year 2022. In water year 2022, 28 percent of the annual TDS load was transported in the summer. For the Sheyenne River in water year 2021, because of very low-streamflow conditions in the winter, spring, and summer, the largest portion of the annual TDS load was delivered in the fall. Chloride, sodium, and sulfate loads followed the same seasonal pattern in the transport of loads as TDS.
Table 16.
Seasonal loads for selected constituents at 10 sites in the Fargo-Moorhead metropolitan area, October 1, 2019, to October 1, 2022.[ID, identification; Fall, September through November; winter, December, January, and February; spring, March through May; summer, June through August]
| Site ID (fig. 1) | River name | Seasonal loads, in tons (short) | ||||||||||||
|---|---|---|---|---|---|---|---|---|---|---|---|---|---|---|
| 2020 | 2020 | 2020 | 2020 | 2021 | 2021 | 2021 | 2021 | 2022 | 2022 | 2022 | 2022 | 2023 | ||
| Fall1 | Winter | Spring | Summer | Fall | Winter | Spring | Summer | Fall | Winter | Spring | Summer | Fall2 | ||
| 1 | Red River of the North | 312,000 | 160,100 | 388,300 | 214,000 | 96,200 | 60,700 | 179,300 | 33,040 | 34,120 | 37,900 | 632,000 | 381,700 | 14,600 |
| 2 | Wild Rice River | 223,900 | 62,500 | 342,600 | 108,800 | 20,360 | 7,740 | 36,390 | 2,759 | 7,409 | 5,967 | 290,200 | 83,720 | 1,770 |
| 3 | Wild Rice River | 245,900 | 64,400 | 352,100 | 122,600 | 21,830 | 8,690 | 39,070 | 3,119 | 7,900 | 6,690 | 331,100 | 96,340 | 1,630 |
| 4 | Red River of the North | 530,000 | 212,700 | 793,000 | 335,900 | 116,100 | 75,800 | 228,600 | 36,810 | 39,150 | 47,000 | 1,004,000 | 459,900 | 16,500 |
| 5 | Red River of the North | 505,000 | 223,500 | 744,000 | 340,100 | 127,100 | 85,700 | 237,900 | 42,940 | 45,370 | 55,000 | 929,000 | 445,600 | 19,300 |
| 6 | Sheyenne River | 322,000 | 127,000 | 355,900 | 249,100 | 102,200 | 46,200 | 44,400 | 34,040 | 51,100 | 53,100 | 403,800 | 193,200 | 26,500 |
| 7 | Maple River | 145,000 | 20,630 | 200,400 | 116,500 | 16,360 | 5,954 | 15,330 | 5,045 | 27,250 | 5,720 | 233,000 | 98,370 | 1,950 |
| 8 | Sheyenne River | 479,000 | 170,600 | 559,300 | 373,100 | 123,000 | 59,000 | 65,600 | 42,930 | 81,200 | 64,300 | 620,800 | 320,700 | 32,400 |
| 9 | Red River of the North | 1,062,000 | 481,000 | 1,428,000 | 816,000 | 283,500 | 151,800 | 346,900 | 103,100 | 149,700 | 132,700 | 1,615,000 | 810,400 | 54,000 |
| 10 | Red River of the North | 1,195,000 | 483,000 | 1,614,000 | 924,000 | 316,800 | 165,200 | 396,000 | 105,500 | 138,700 | 132,400 | 1,909,000 | 807,700 | 58,600 |
| 1 | Red River of the North | 8,093 | 5,471 | 10,403 | 6,691 | 3,720 | 2,641 | 5,902 | 1,584 | 1,614 | 1,853 | 14,691 | 9,777 | 691 |
| 2 | Wild Rice River | 6,949 | 2,083 | 10,553 | 3,519 | 710 | 279 | 1,233 | 103 | 266 | 218 | 8,993 | 2,709 | 65 |
| 3 | Wild Rice River | 7,940 | 2,242 | 11,256 | 4,133 | 795 | 328 | 1,384 | 121 | 296 | 255 | 10,644 | 3,235 | 63 |
| 4 | Red River of the North | 15,371 | 7,803 | 22,286 | 11,249 | 4,711 | 3,320 | 8,208 | 1,750 | 1,835 | 2,234 | 27,230 | 13,981 | 780 |
| 5 | Red River of the North | 16,726 | 9,654 | 23,990 | 13,257 | 6,165 | 4,526 | 10,051 | 2,515 | 2,620 | 3,187 | 28,653 | 15,738 | 1,107 |
| 6 | Sheyenne River | 13,498 | 6,163 | 15,274 | 11,224 | 5,072 | 2,488 | 2,407 | 1,880 | 2,697 | 2,823 | 16,808 | 8,887 | 1,352 |
| 7 | Maple River | 6,287 | 1,088 | 8,622 | 5,334 | 886 | 353 | 840 | 296 | 1,357 | 337 | 9,857 | 4,444 | 116 |
| 8 | Sheyenne River | 20,551 | 8,612 | 24,382 | 17,227 | 6,442 | 3,349 | 3,693 | 2,502 | 4,372 | 3,625 | 26,476 | 14,830 | 1,745 |
| 9 | Red River of the North | 39,106 | 21,346 | 52,308 | 33,240 | 13,645 | 8,046 | 16,173 | 5,673 | 7,819 | 7,193 | 57,992 | 32,319 | 2,838 |
| 10 | Red River of the North | 42,778 | 20,846 | 57,081 | 36,190 | 14,468 | 8,265 | 17,525 | 5,496 | 7,009 | 6,843 | 66,384 | 31,693 | 2,909 |
| 1 | Red River of the North | 17,104 | 8,898 | 21,280 | 11,831 | 5,377 | 3,411 | 9,944 | 1,860 | 1,919 | 2,141 | 34,289 | 20,811 | 825 |
| 2 | Wild Rice River | 16,989 | 5,316 | 25,647 | 8,821 | 1,864 | 751 | 3,182 | 282 | 712 | 590 | 21,947 | 6,792 | 177 |
| 3 | Wild Rice River | 18,840 | 5,484 | 26,609 | 9,974 | 1,981 | 829 | 3,408 | 309 | 746 | 649 | 25,211 | 7,797 | 161 |
| 4 | Red River of the North | 32,820 | 13,181 | 48,990 | 20,857 | 7,196 | 4,699 | 14,181 | 2,282 | 2,424 | 2,913 | 62,027 | 28,428 | 1,025 |
| 5 | Red River of the North | 32,667 | 15,705 | 47,619 | 23,127 | 9,255 | 6,405 | 16,601 | 3,303 | 3,473 | 4,225 | 58,701 | 29,332 | 1,478 |
| 6 | Sheyenne River | 38,768 | 15,948 | 43,033 | 30,609 | 12,921 | 5,977 | 5,757 | 4,430 | 6,568 | 6,840 | 48,429 | 23,894 | 3,377 |
| 7 | Maple River | 11,859 | 1,963 | 16,296 | 9,940 | 1,588 | 619 | 1,502 | 521 | 2,479 | 593 | 18,690 | 8,305 | 204 |
| 8 | Sheyenne River | 50,046 | 20,058 | 59,122 | 41,131 | 14,849 | 7,548 | 8,344 | 5,595 | 9,998 | 8,187 | 64,565 | 35,358 | 3,991 |
| 9 | Red River of the North | 84,704 | 43,101 | 113,429 | 69,283 | 26,676 | 15,154 | 32,029 | 10,512 | 14,798 | 13,431 | 126,737 | 67,869 | 5,364 |
| 10 | Red River of the North | 88,942 | 41,225 | 118,954 | 73,442 | 28,143 | 15,666 | 34,393 | 10,287 | 13,240 | 12,850 | 139,044 | 64,248 | 5,527 |
| 1 | Red River of the North | 170,543 | 62,185 | 206,132 | 94,200 | 32,275 | 17,525 | 73,622 | 8,855 | 9,394 | 9,499 | 395,771 | 218,067 | 3,810 |
| 2 | Wild Rice River | 116,523 | 31,966 | 179,272 | 56,074 | 10,265 | 3,862 | 18,518 | 1,366 | 3,700 | 2,966 | 151,332 | 43,167 | 879 |
| 3 | Wild Rice River | 126,304 | 33,002 | 181,013 | 62,962 | 11,151 | 4,429 | 20,031 | 1,587 | 4,028 | 3,409 | 170,168 | 49,501 | 832 |
| 4 | Red River of the North | 287,698 | 89,214 | 449,284 | 157,450 | 43,729 | 26,209 | 98,885 | 11,877 | 12,824 | 14,860 | 586,078 | 240,023 | 5,276 |
| 5 | Red River of the North | 262,145 | 95,190 | 397,602 | 157,047 | 49,802 | 31,454 | 103,540 | 14,830 | 15,846 | 18,828 | 509,922 | 223,353 | 6,650 |
| 6 | Sheyenne River | 135,371 | 52,632 | 148,733 | 103,899 | 42,294 | 18,985 | 18,247 | 13,939 | 21,022 | 21,815 | 169,586 | 80,524 | 10,940 |
| 7 | Maple River | 70,294 | 10,119 | 97,259 | 56,705 | 8,043 | 2,940 | 7,539 | 2,494 | 13,304 | 2,825 | 112,667 | 47,833 | 963 |
| 8 | Sheyenne River | 209,635 | 73,420 | 244,834 | 162,318 | 52,715 | 25,082 | 27,947 | 18,191 | 34,764 | 27,364 | 272,161 | 139,114 | 13,849 |
| 9 | Red River of the North | 492,961 | 207,093 | 666,190 | 363,300 | 117,455 | 60,370 | 146,149 | 40,383 | 59,977 | 52,290 | 758,490 | 365,034 | 21,574 |
| 10 | Red River of the North | 519,347 | 196,932 | 706,309 | 389,275 | 126,115 | 63,609 | 159,567 | 40,095 | 53,268 | 50,358 | 838,877 | 340,220 | 22,643 |
| 1 | Red River of the North | 333 | 250 | 744 | 107 | 45 | 57 | 216 | 9 | 15 | 27 | 1,280 | 350 | 3 |
| 2 | Wild Rice River | 308 | 66 | 1,130 | 43 | 3 | 2 | 20 | 0.1 | 1 | 1 | 602 | 45 | 0 |
| 3 | Wild Rice River | 939 | 109 | 1,277 | 89 | 8 | 3 | 21 | 0.1 | 3 | 2 | 777 | 82 | 0 |
| 4 | Red River of the North | 785 | 308 | 1,694 | 162 | 53 | 62 | 206 | 7 | 17 | 29 | 1,788 | 344 | 3 |
| 5 | Red River of the North | 776 | 674 | 1,125 | 548 | 368 | 365 | 572 | 143 | 188 | 273 | 1,240 | 616 | 67 |
| 6 | Sheyenne River | 229 | 57 | 250 | 51 | 17 | 9 | 6 | 2 | 6 | 12 | 299 | 40 | 2 |
| 7 | Maple River | 420 | 24 | 1,119 | 56 | 3 | 2 | 6 | 0.2 | 22 | 2 | 979 | 71 | 0 |
| 8 | Sheyenne River | 537 | 113 | 1,040 | 121 | 19 | 14 | 14 | 2 | 15 | 16 | 1,041 | 138 | 3 |
| 9 | Red River of the North | 1,255 | 955 | 2,235 | 756 | 340 | 323 | 599 | 112 | 200 | 283 | 2,318 | 800 | 56 |
| 10 | Red River of the North | 2,234 | 1,145 | 2,890 | 991 | 461 | 351 | 623 | 95 | 213 | 273 | 3,145 | 880 | 65 |
| 1 | Red River of the North | 89 | 50 | 111 | 64 | 31 | 20 | 55 | 11 | 12 | 13 | 172 | 107 | 5 |
| 2 | Wild Rice River | 76 | 16 | 123 | 31 | 4 | 1 | 8 | 0.4 | 1 | 1 | 100 | 24 | 0 |
| 3 | Wild Rice River | 93 | 16 | 143 | 37 | 4 | 1 | 9 | 0.4 | 1 | 1 | 129 | 30 | 0 |
| 4 | Red River of the North | 168 | 62 | 253 | 102 | 33 | 21 | 67 | 10 | 10 | 12 | 324 | 143 | 4 |
| 5 | Red River of the North | 185 | 110 | 264 | 150 | 71 | 53 | 115 | 30 | 31 | 38 | 314 | 176 | 13 |
| 6 | Sheyenne River | 265 | 36 | 249 | 123 | 25 | 6 | 6 | 4 | 9 | 8 | 371 | 86 | 5 |
| 7 | Maple River | 95 | 7 | 137 | 64 | 5 | 1 | 5 | 1 | 12 | 1 | 165 | 57 | 0 |
| 8 | Sheyenne River | 328 | 52 | 371 | 182 | 31 | 10 | 12 | 7 | 19 | 11 | 458 | 158 | 7 |
| 9 | Red River of the North | 521 | 211 | 706 | 377 | 118 | 60 | 148 | 40 | 59 | 51 | 806 | 381 | 21 |
| 10 | Red River of the North | 654 | 224 | 900 | 467 | 139 | 66 | 178 | 41 | 55 | 52 | 1,075 | 408 | 24 |
| 1 | Red River of the North | 21,694 | 5,542 | 46,825 | 43,577 | 7,223 | 1,727 | 19,094 | 5,100 | 1,587 | 1,016 | 105,207 | 96,588 | 1,300 |
| 2 | Wild Rice River | 17,262 | 1,764 | 52,011 | 19,954 | 848 | 107 | 2,522 | 155 | 164 | 75 | 50,506 | 16,076 | 63 |
| 3 | Wild Rice River | 25,600 | 2,236 | 61,629 | 24,007 | 1,034 | 139 | 2,754 | 168 | 203 | 96 | 66,014 | 20,315 | 60 |
| 4 | Red River of the North | 30,988 | 4,604 | 139,109 | 85,795 | 6,069 | 1,118 | 25,807 | 5,152 | 948 | 616 | 264,216 | 165,120 | 922 |
| 5 | Red River of the North | 52,660 | 8,790 | 121,240 | 110,263 | 14,022 | 2,715 | 31,115 | 9,310 | 2,945 | 1,622 | 208,580 | 162,526 | 2,564 |
| 6 | Sheyenne River | 130,306 | 6,275 | 230,129 | 142,226 | 8,139 | 714 | 1,565 | 2,094 | 1,881 | 944 | 519,396 | 99,355 | 1,938 |
| 7 | Maple River | 23,332 | 785 | 52,068 | 27,300 | 932 | 104 | 804 | 297 | 2,010 | 111 | 72,233 | 27,232 | 67 |
| 8 | Sheyenne River | 122,365 | 8,521 | 215,530 | 156,835 | 10,078 | 1,250 | 3,193 | 3,515 | 4,909 | 1,451 | 344,786 | 139,511 | 2,771 |
| 9 | Red River of the North | 174,320 | 22,668 | 366,590 | 400,161 | 37,864 | 4,571 | 48,714 | 24,469 | 11,684 | 3,849 | 571,991 | 425,680 | 8,423 |
| 10 | Red River of the North | 246,677 | 27,199 | 474,001 | 510,203 | 53,032 | 6,245 | 63,784 | 28,209 | 12,433 | 4,644 | 743,775 | 448,175 | 11,155 |
The highest annual yields of TDS, chloride, sodium, and sulfate varied by site and by water year (fig. 10 and table 17). Annual yields of TDS were highest among all sites at the two Wild Rice River sites (sites 2 and 3) and the Maple River (site 7) for water year 2020; at sites 1, 4, and 5 on the Red River for water year 2021; and at sites 1 and 4 on the Red River and the Maple River (site 7) in water year 2022. For the Red River, annual TDS yields ranged from 248 (site 10) to 290 tons per year per square mile (tons/yr/mi2; site 4) in water year 2020, from 50 (site 10) to 79 tons/yr/mi2 (site 1) in water year 2021, and from 172 (site 10) to 260 tons/yr/mi2 (site 1) in water year 2022. Annual yields of TDS for the Wild Rice River ranged from 28 (2021) to 359 tons/yr/mi2 (2020) at site 2 and from 29 (2021) to 356 tons/yr/mi2 (2020) at site 3. The Maple River (site 7) had yields ranging from 24 (2021) to 334 tons/yr/mi2 (2020). Annual yields of TDS for the Sheyenne River ranged from 39 (2021) to 219 tons/yr/mi2 (2020) at site 6 and from 38 (2021) to 243 tons/yr/mi2 (2020) at site 8.
The Maple River (site 7) had the highest chloride yields among all the sites in water years 2020 and 2022 with annual yields of 15 and 11 tons/yr/mi2, respectively. For water year 2021, yields were similar for all sites; however, sites 1, 5, and 9 on the Red River had the highest annual yields of 3 tons/yr/mi2.
Annual yields of sodium were highest among all sites at the two Wild Rice River sites (sites 2 and 3) and the Maple River (site 7) for water years 2020 and 2022. All three sites had annual sodium yields of 28 tons/yr/mi2 in 2020 and 14, 15, and 20 tons/yr/mi2 for sites 2, 3, and 7 in water year 2022, respectively. In water year 2021, sodium yields were similar among the sites, and the highest annual sodium yield was 5 tons/yr/mi2 at sites 5, 9, and 10 on the Red River and sites 6 and 8 on the Sheyenne River.
Patterns in annual sulfate yields were similar to TDS and sodium for water year 2020 with highest yields at the two Wild Rice River sites (sites 2 and 3) and at the Maple River (site 7). The Wild Rice River had annual sulfate yields of 187 and 183 tons/yr/mi2 for sites 2 and 3, respectively, and the Maple River (site 7) had an annual yield of 162 tons/yr/mi2 (fig. 10 and table 17). For water years 2021 and 2022, the highest sulfate yields were at Red River sites. For water year 2021, sites 1, 4, and 5 had annual sulfate yields of 28, 24, and 27 tons/yr/mi2, respectively. All other sites had yields less than or equal to 21 tons/yr/mi2. In water year 2022, sites 1 and 4 had the highest sulfate yields at 151 and 129 tons/yr/mi2. The Maple River (site 7) had a sulfate yield of 120 tons/yr/mi2 and all other sites had yields less than or equal to 115 tons/yr/mi2.
Table 17.
Annual yields for total dissolved solids, chloride, sodium, and sulfate at 10 sites in the Fargo-Moorhead metropolitan area for water years 2020–22.[ID, identification; water year defined as October 1–September 30; drainage areas are in table 1]
| Site ID (fig. 1) | River name | Annual yields, in tons (short) per year per square mile | |||||||||||
|---|---|---|---|---|---|---|---|---|---|---|---|---|---|
| Total dissolved solids | Chloride | Sodium | Sulfate | ||||||||||
| 2020 | 2021 | 2022 | 2020 | 2021 | 2022 | 2020 | 2021 | 2022 | 2020 | 2021 | 2022 | ||
| 1 | Red River of the North | 267 | 79 | 260 | 8 | 3 | 7 | 15 | 4 | 14 | 131 | 28 | 151 |
| 2 | Wild Rice River | 359 | 28 | 187 | 11 | <1 | 6 | 28 | 3 | 14 | 187 | 14 | 97 |
| 3 | Wild Rice River | 356 | 29 | 198 | 12 | 1 | 7 | 28 | 3 | 15 | 183 | 15 | 102 |
| 4 | Red River of the North | 290 | 62 | 235 | 9 | 2 | 7 | 18 | 4 | 14 | 150 | 24 | 129 |
| 5 | Red River of the North | 278 | 66 | 222 | 10 | 3 | 8 | 18 | 5 | 14 | 139 | 27 | 115 |
| 6 | Sheyenne River | 219 | 39 | 143 | 10 | 2 | 6 | 26 | 5 | 17 | 91 | 16 | 60 |
| 7 | Maple River | 334 | 24 | 248 | 15 | 1 | 11 | 28 | 2 | 20 | 162 | 12 | 120 |
| 8 | Sheyenne River | 243 | 38 | 166 | 11 | 2 | 7 | 26 | 5 | 18 | 106 | 16 | 72 |
| 9 | Red River of the North | 258 | 52 | 180 | 10 | 3 | 7 | 21 | 5 | 15 | 117 | 21 | 82 |
| 10 | Red River of the North | 248 | 50 | 172 | 9 | 2 | 6 | 19 | 5 | 13 | 107 | 20 | 74 |
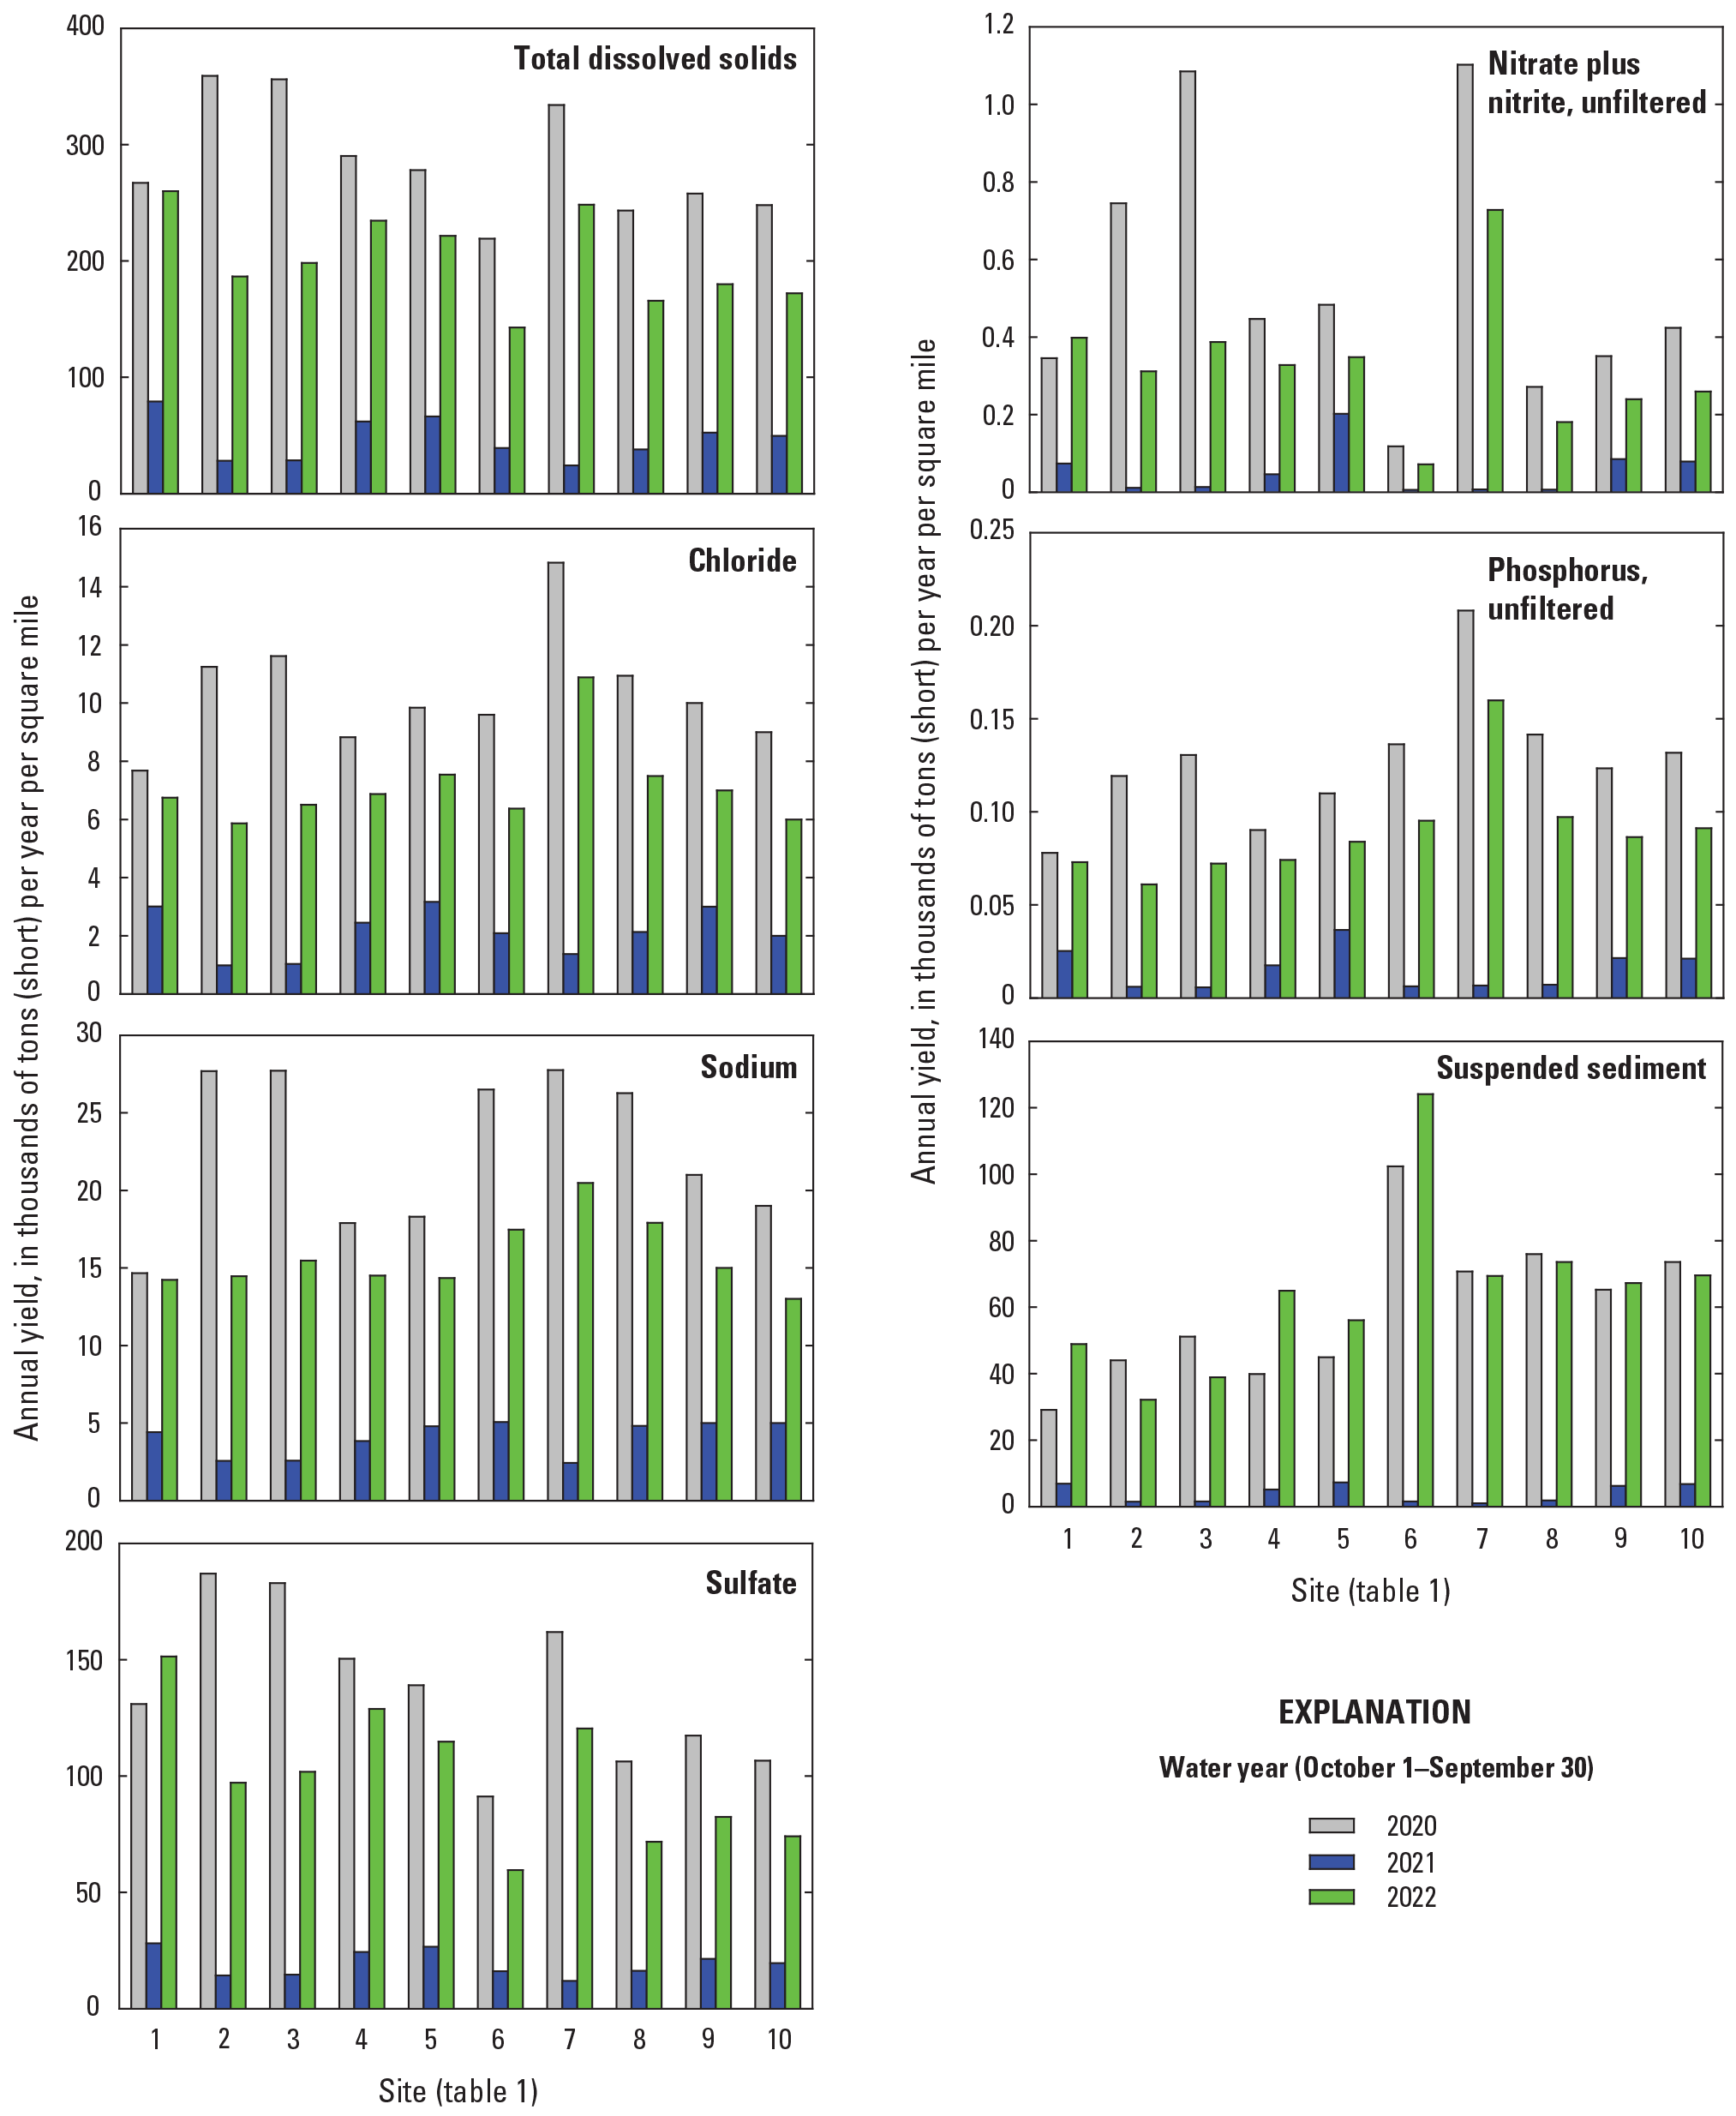
Annual yields for total dissolved solids, chloride, sodium, sulfate, nitrate plus nitrate, total phosphorus, and suspended sediment at 10 sites in the Fargo-Moorhead metropolitan area for water years 2020–22.
Nutrients
Nutrient loads had different patterns from major ion loads among the sites on the Red River and its tributaries. Although most major ions are generally conservative, nutrients can have several sources and sinks that can affect how they are transported. Annual nitrate plus nitrite loads for the Red River in water year 2020 ranged from 1,450 tons at site 1 to 7,430 tons at site 10 (table 18 and fig. 9). In water year 2021, during relatively low-streamflow conditions, nitrate plus nitrite loads were about the same at sites 1 and 4 but substantially increased from sites 4 to 5 (table 18). Nitrate plus nitrite loads increased from 308 tons at site 4 to 1,360 tons at site 5 in water year 2021, likely affected by inputs from the wastewater-treatment plant discharge between the two sites on the Red River. The nitrate plus nitrite loads farther downstream on the Red River decreased at site 9 to 1,290 tons then slightly increased to 1,390 at site 10. In water year 2022, nitrate plus nitrite loads for the Red River followed a similar pattern to water year 2020, but generally loads were lower, ranging from 1,670 tons at site 1 to 4,550 tons at site 10 (table 18 and fig. 9). The Wild Rice River at site 3 had the highest nitrate plus nitrite loads in water year 2020 among the tributary sites, but the Sheyenne River (site 8) had the highest loads among the tributary sites in water years 2021 and 2022 (table 18 and fig. 9). Annual nitrate plus nitrite loads for the Wild Rice River ranged from 23.6 tons (2021) to 1,550 tons (2020) at site 2 and from 29.4 tons (2021) to 2,420 tons (2020) at site 3. Annual nitrate plus nitrite loads for the Sheyenne River ranged from 29.0 (2021) to 593 tons (2020) at site 6 and from 44.0 (2021) to 1,820 tons (2020) at site 8 (table 18 and fig. 9). There were large increases from site 6 to site 8 in water years 2020 and 2022 compared to water year 2021 that may reflect the input of nonpoint sources of nitrate plus nitrite into the Sheyenne River during the years that had substantially more runoff including larger inputs from the Maple River. Annual nitrate plus nitrite loads for the Maple River (site 7) ranged from 10.1 tons in water year 2021 to 1,620 tons in water year 2020.
Table 18.
Annual loads for nitrate plus nitrite, phosphorus, and suspended sediment at 10 sites in the Fargo-Moorhead metropolitan area for water years 2020–22.[ID, identification]
| Site ID (fig. 1) | River name | Annual loads, in tons (short) | Annual loads, in thousands of tons (short) | |||||||
|---|---|---|---|---|---|---|---|---|---|---|
| Nitrate plus nitrite, unfiltered, as nitrogen | Phosphorus, unfiltered, as phosphorus | Suspended sediment | ||||||||
| 2020 | 2021 | 2022 | 2020 | 2021 | 2022 | 2020 | 2021 | 2022 | ||
| 1 | Red River of the North | 1,450 | 310 | 1,670 | 327 | 106 | 306 | 122 | 28.9 | 205 |
| 2 | Wild Rice River | 1,550 | 23.6 | 648 | 248 | 12.5 | 127 | 91.5 | 3.10 | 66.9 |
| 3 | Wild Rice River | 2,420 | 29.4 | 864 | 291 | 12.8 | 161 | 114 | 3.46 | 86.7 |
| 4 | Red River of the North | 2,970 | 308 | 2,180 | 600 | 117 | 493 | 265 | 34.1 | 432 |
| 5 | Red River of the North | 3,250 | 1,360 | 2,340 | 739 | 246 | 564 | 302 | 48.8 | 377 |
| 6 | Sheyenne River | 593 | 29.0 | 359 | 684 | 31.5 | 478 | 514 | 7.82 | 623 |
| 7 | Maple River | 1,620 | 10.1 | 1,070 | 306 | 9.81 | 235 | 104 | 1.49 | 102 |
| 8 | Sheyenne River | 1,820 | 44.0 | 1,210 | 948 | 48.0 | 651 | 509 | 12.6 | 493 |
| 9 | Red River of the North | 5,320 | 1,290 | 3,630 | 1,870 | 325 | 1,310 | 989 | 94.3 | 1,020 |
| 10 | Red River of the North | 7,430 | 1,390 | 4,550 | 2,310 | 371 | 1,600 | 1,290 | 119 | 1,220 |
Total phosphorus loads showed a different pattern than nitrate plus nitrite, with increasing phosphorus being transported from upstream to downstream sites on the Red River through the Fargo-Moorhead metropolitan area. Total phosphorus loads on the Red River ranged from 327 tons at site 1 to 739 tons at site 5, with a considerable increase to 1,870 tons at site 9 and 2,310 tons at site 10 in water year 2020 (fig. 9 and table 18). In water year 2021, total phosphorus loads on the Red River ranged from 106 tons at site 1 to 371 tons at site 10 and for water year 2022 loads ranged from 306 tons at site 1 to 1,600 tons at site 10, with the largest increase between sites 5 and 9 (fig. 9 and table 18). The Sheyenne River at site 8 had the highest annual total phosphorus loads among all tributary sites in water years 2020 through 2022 and likely contributed to the large increase between site 5 and 9 on the Red River. Total phosphorus loads for the Sheyenne River ranged from 31.5 (2021) to 684 tons (2020) at site 6 and from 48.0 (2021) to 948 tons (2020) at site 8. The Maple River (site 7) had total phosphorus loads that ranged from 9.81 tons (2021) to 306 tons (2020). In comparison, total phosphorus loads transported in the Wild Rice River ranged from 12.5 (2021) to 248 tons (2020) at site 2 and from 12.8 (2021) to 291 tons (2020) at site 3.
The transport of constituents can vary throughout the year, with the largest mass generally transported during periods of higher streamflow. Similar to major ions, most of the nutrient loads were transported in the spring and fall months in water years 2020 and 2021, but most of the load was transported only in the spring in water year 2022 (table 16). A larger portion of the annual nitrate plus nitrite loads were transported in the spring compared to major ions, likely because fertilizers are often applied to crops and lawns in the spring and nutrients can be washed into the streams during rainfall runoff events that generally occur more frequently in the spring months. On average, 50 to 52 percent of annual nitrate plus nitrite load was transported in the spring in water years 2020 and 2021, respectively, compared to 79 percent in the spring for water year 2022. Also, in water years 2020 and 2021, an average of 28 and 26 percent, respectively, of the annual nitrate plus load was transported in the fall, compared to only 3 percent of the annual load transported in the fall for water year 2022. Similarly, 42 and 41 percent of the annual phosphorus (unfiltered) load was delivered in the spring in water years 2020 and 2021, respectively, compared to 69 percent in the spring for water year 2022. For the Sheyenne River in water year 2021, because of very low-streamflow conditions in the winter, spring, and summer, the largest portions of the annual nitrate plus nitrite and phosphorus loads were transported in the fall. For nitrate plus nitrite, 60 percent of the annual load was transported in the fall of 2021 at site 6 and 52 percent of the annual load was transported in the fall of 2021 at site 8. For phosphorus, 65 percent of the annual load was transported in the fall of 2021 at site 6 and 56 percent of the annual load was transported in the fall of 2021 at site 8.
The highest annual yields of nutrients varied by site and by water year (fig. 10 and table 19). Annual yields of nitrate plus nitrite were highest among all sites at site 7 on the Maple River in water years 2020 and 2022 with yields of 2,200 pounds per year per square mile (lbs/yr/mi2) and 1,460 lbs/yr/mi2, respectively. In 2021, the highest yield among all sites was at site 5 on the Red River, likely related to the low-streamflow conditions and the input of the wastewater-treatment plant discharge upstream from the site. For site 4 on the Red River, located upstream from the wastewater-treatment plant discharge, the annual nitrate plus nitrite yield for 2021 was 93 lbs/yr/mi2 compared to site 5, which had a yield of 405 lbs/yr/mi2. The other Red River sites (sites 1, 9, and 10) all had yields less than or equal to 170 lbs/yr/mi2. The two Wild Rice River sites (sites 2 and 3) also had some of the highest nitrate plus nitrite yields in water years 2020 and 2022 with yields of 1,490 lbs/yr/mi2 at site 2 and 2,170 lbs/yr/mi2 at site 3 in 2020 and 623 lbs/yr/mi2 at site 2 and 775 lbs/yr/mi2 at site 3 in 2022. Annual nitrate plus nitrite yields for the Sheyenne River ranged from 12 (2021) to 236 lbs/yr/mi2 (2020) at site 6 and 13 (2021) to 543 lbs/yr/mi2 (2020) at site 8.
Table 19.
Annual yields for nitrate plus nitrite, phosphorus, and suspended sediment at 10 sites in the Fargo-Moorhead metropolitan area for water years 2020–22.[ID, identification; water year defined as October 1–September 30; drainage areas are in table 1]
| Site ID (fig. 1) | River name | Annual yields, in pounds per year per square mile | Annual yields, in tons (short) per year per square mile | |||||||
|---|---|---|---|---|---|---|---|---|---|---|
| Nitrate plus nitrite, unfiltered, as nitrogen | Phosphorus, unfiltered, as nitrogen | Suspended sediment | ||||||||
| 2020 | 2021 | 2022 | 2020 | 2021 | 2022 | 2020 | 2021 | 2022 | ||
| 1 | Red River of the North | 691 | 148 | 796 | 156 | 50.5 | 146 | 29 | 7 | 49 |
| 2 | Wild Rice River | 1,490 | 23 | 623 | 238 | 12 | 122 | 44 | 1 | 32 |
| 3 | Wild Rice River | 2,170 | 26 | 775 | 261 | 11.5 | 144 | 51 | 2 | 39 |
| 4 | Red River of the North | 893 | 93 | 656 | 180 | 35.2 | 148 | 40 | 5 | 65 |
| 5 | Red River of the North | 967 | 405 | 696 | 220 | 73.2 | 168 | 45 | 7 | 56 |
| 6 | Sheyenne River | 236 | 12 | 143 | 273 | 12.5 | 190 | 102 | 2 | 124 |
| 7 | Maple River | 2,200 | 14 | 1,460 | 416 | 13.3 | 320 | 71 | 1 | 69 |
| 8 | Sheyenne River | 543 | 13 | 361 | 283 | 14.3 | 194 | 76 | 2 | 74 |
| 9 | Red River of the North | 702 | 170 | 479 | 247 | 42.9 | 173 | 65 | 6 | 67 |
| 10 | Red River of the North | 847 | 159 | 519 | 263 | 42.3 | 182 | 74 | 7 | 70 |
Phosphorus yields were similar to nitrate plus nitrite yields, with the highest yields among all the sites at the Maple River (site 7) in water years 2020 and 2022, and the highest yields at site 5 on the Red River among all the sites in water year 2021 (fig. 10 and table 19). Maple River (site 7) had annual total phosphorus yields of 416 lbs/yr/mi2 in 2020 and 320 lbs/yr/mi2 in 2022. All other sites had total phosphorus yields less than or equal to 283 lbs/yr/mi2 in 2020 and less than or equal to 194 lbs/yr/mi2 in 2022. In water year 2021, site 5 on the Red River had a yield of 73.2 lbs/yr/mi2 compared to all other sites that had yields less than or equal to 50.5 lbs/yr/mi2. Similar to nitrate plus nitrite, the higher phosphorus yield at site 5 in water year 2021 is likely related to the low-streamflow conditions and the input of the wastewater-treatment plant discharge upstream from the site. Unlike nitrate plus nitrite, the sites on the Wild Rice River (sites 2 and 3) had the lowest phosphorus yields among all the tributary sites in all 3 years.
Suspended Sediment
Annual suspended-sediment loads for the Red River increased from upstream to downstream sites through the Fargo-Moorhead metropolitan area, and the Sheyenne River had the greatest loads among the tributaries (fig. 9 and table 18) in water years 2020 through 2022. Annual suspended-sediment loads for the Red River in water year 2020 ranged from 122,000 tons at site 1 to 1,290,000 tons at site 10 and from 205,000 tons at site 1 to 1,220,000 tons at site 10 in water year 2022 (table 18 and fig. 9). In comparison, suspended-sediment loads in water year 2021 ranged from 2,890 tons at site 1 to 119,000 tons at site 10. The Sheyenne River transported 7,820 (2021) to 623,000 tons (2022) at site 6 and 12,600 (2021) to 509,000 tons (2020) at site 8. In comparison, the Wild Rice River transported 3,100 (2021) to 91,500 tons (2020) of suspended sediment at site 2 and 3,460 (2021) to 114,000 tons (2020) of suspended sediment at site 3. The Maple River (site 7) transported 1,490 (2021) to 104,000 tons (2020) of suspended sediment.
The transport of suspended sediment varied throughout the year, with the largest mass generally transported during periods of higher streamflow. Most of the suspended-sediment loads were transported in the spring and fall months in water years 2020 and 2021, but almost all of the load was transported in the spring and summer in water year 2022 (table 16). On average, 46 to 47 percent of the annual suspended-sediment load was transported in the spring in water years 2020 and 2021, respectively, compared to 66 percent in the spring and 33 percent in the summer for water year 2022. Also, in water years 2020 and 2021, an average of 20 and 34 percent, respectively, of the annual suspended-sediment load was transported in the fall, compared to only 1 percent of the annual load transported in the fall for water year 2022. For the Sheyenne River in water year 2021, because of very low-streamflow conditions in the winter, spring, and summer, the largest portion of the annual suspended-sediment loads was transported in the fall. About 65 percent of the annual suspended-sediment load was transported in the fall of 2021 at site 6 and 56 percent of the annual load was transported in the fall of 2021 at site 8.
Annual yields of suspended sediment were highest at the two Sheyenne River sites (sites 6 and 8) among all sites for water years 2020 and 2022 (fig. 10 and table 19). Annual suspended-sediment yields were 102 tons/yr/mi2 at site 6 and 76 tons/yr/mi2 at site 8 for water year 2020 and 124 tons/yr/mi2 at site 6 and 74 tons/yr/mi2 at site 8 for water year 2022. All other sites had suspended-sediment yields less than or equal to 74 tons/yr/mi2 in 2020 and less than or equal to 69 tons/yr/mi2 in 2022. In water year 2021, suspended-sediment yields were similar among the sites and the highest annual yield was 7 tons/yr/mi2 at sites 1 and 5 on the Red River.
Continuous Water Quality
Water quality has been monitored continuously on the Red River at site 4 from June 2003 to October 2022 and the Red River at site 1 and site 9 from October 2019 to October 2022. Water-quality measurements recorded at the three sites included water temperature, specific conductance, DO, pH, and turbidity. Water temperature is important for accurate measurement of the other field measurements and is presented for each site in table 20 but is not discussed in the text.
Specific Conductance
Electrical conductivity is a measure of the capacity of water to conduct an electrical current and is a function of the types and quantities of dissolved substances in water (Hem, 1985). As concentrations of dissolved ions increase, conductivity of the water increases. Specific conductance is the conductivity expressed in units of microsiemens per centimeter at 25 degrees Celsius.
Specific conductance values were similar for the Red River at site 1 and site 4, compared to site 9, which generally had higher values than the other two sites from October 1, 2019, to October 1, 2022. Instantaneous values of specific conductance at site 1 ranged from 410 to 2,770 microsiemens per centimeter at 25 degrees Celsius (μS/cm at 25 °C) with an annual mean of 607 μS/cm at 25 °C in 2021 to 935 μS/cm at 25 °C in 2022 (table 20). Instantaneous values of specific conductance at site 4 ranged from 407 to 2,570 μS/cm at 25 °C with an annual mean of 713 μS/cm at 25 °C in 2021 to 1,100 μS/cm at 25 °C in 2022. Higher values of specific conductance were recorded at site 9 with instantaneous values ranging from 558 to 2,210 μS/cm at 25 °C with an annual mean of 1,003 μS/cm at 25 °C in 2021 to 1,160 μS/cm at 25 °C in 2020 (table 20). A much larger range in specific conductance was measured by continuous water-quality monitors compared to specific conductance values measured with discrete water-quality samples (table 10).
Specific conductance varied with time at the three sites, likely related to the variability in streamflow conditions (figs. 2 and 11–13). The highest values for all three sites were generally from October 2021 through March 2022, which was during a period of low-streamflow conditions that persisted for most of 2021 and during a period when there was ice cover on the channel. Without any inputs from precipitation and runoff, which can dilute the salts (sulfate, chloride, sodium, and others) in the river thereby lowering the specific conductance, the values tend to stay higher from groundwater inputs and the accumulation of salts with the lack of events to flush them down the river. The specific conductance decreased rapidly near the end of March 2022 when the streamflow increased from snowmelt runoff. The lowest values generally occurred in short periods from dilution during rainfall-runoff events that caused increased streamflow. A relatively longer period of low specific conductance values occurred from late August 2020 to April 2021 following a period that had a number of higher streamflow events from snowmelt runoff and rainfall runoff from April 2020 through July 2020.
Table 20.
Summary statistics for continuous water-quality monitors at three sites on the Red River of the North for water years 2020–22.[Water year defined as October 1 through September 30; °C, degree Celsius; µS/cm at 25 °C, microsiemen per centimeter at 25 degrees Celsius; mg/L, milligram per liter; FNU, formazin nephelometric unit]
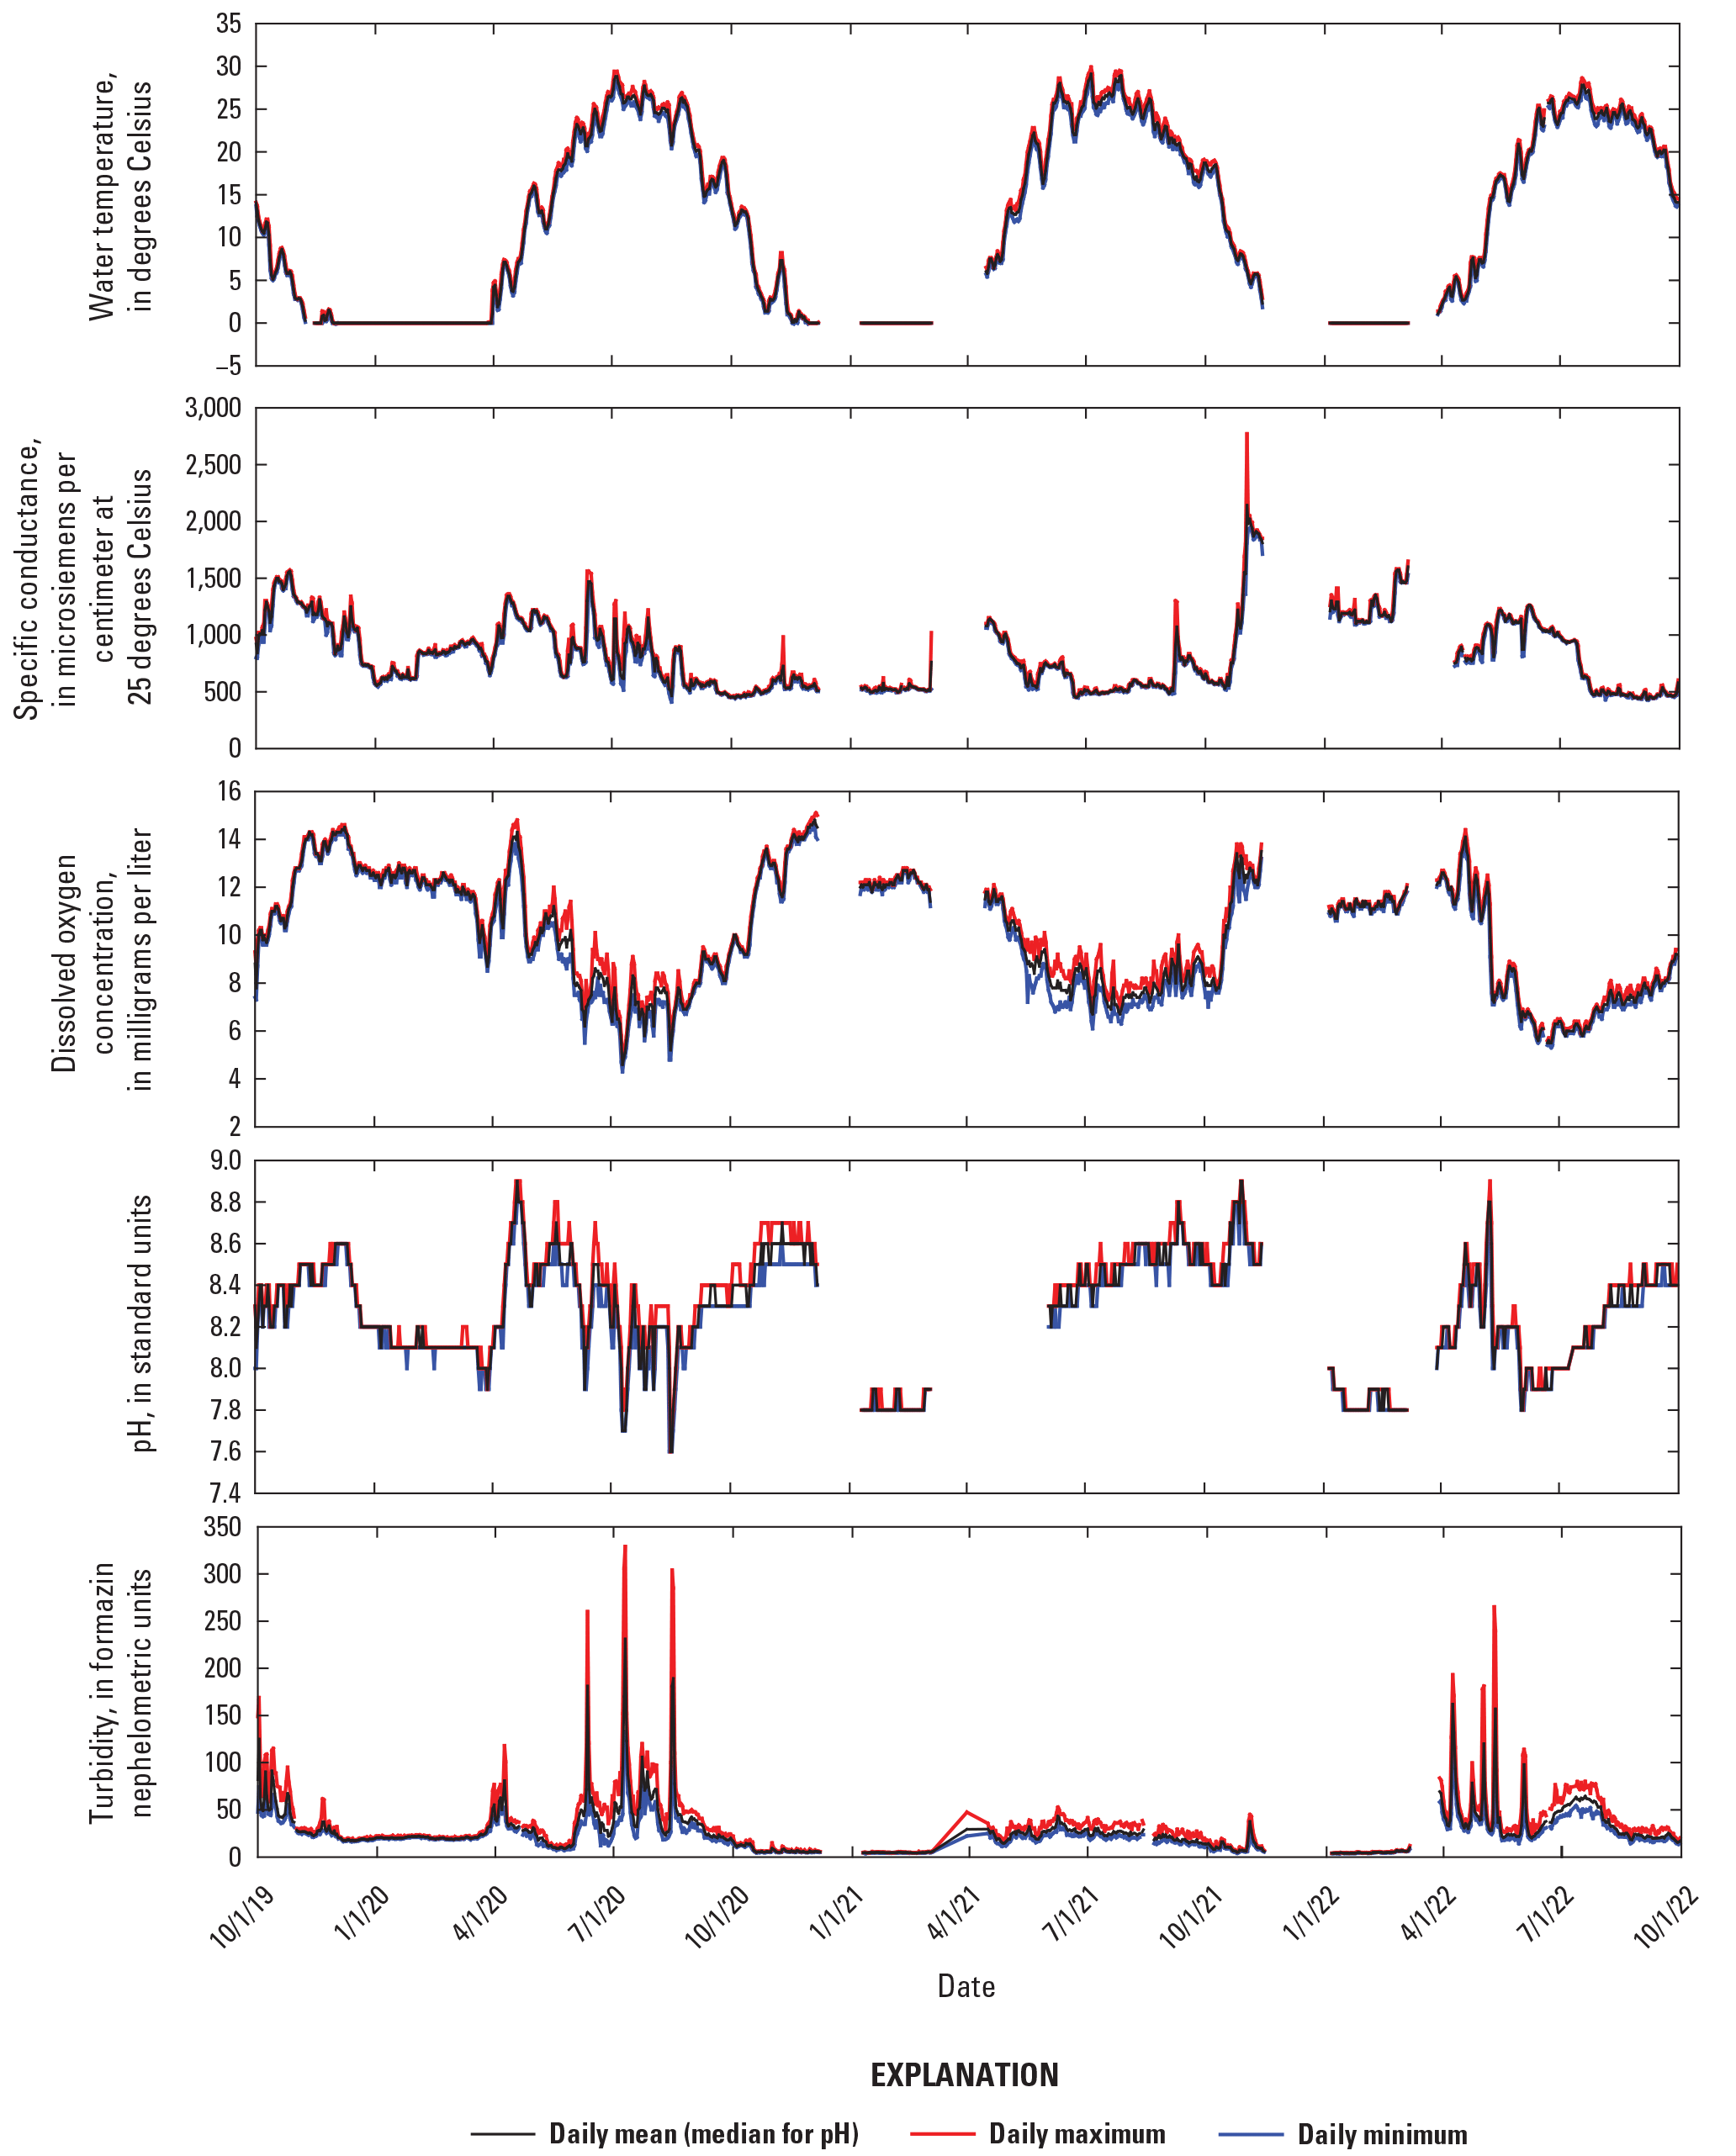
Daily values for continuous water temperature, specific conductance, dissolved oxygen, pH, and turbidity at the Red River of the North near Hickson, North Dakota (U.S. Geological Survey station 05051522; site 1), October 1, 2019, to October 1, 2022.
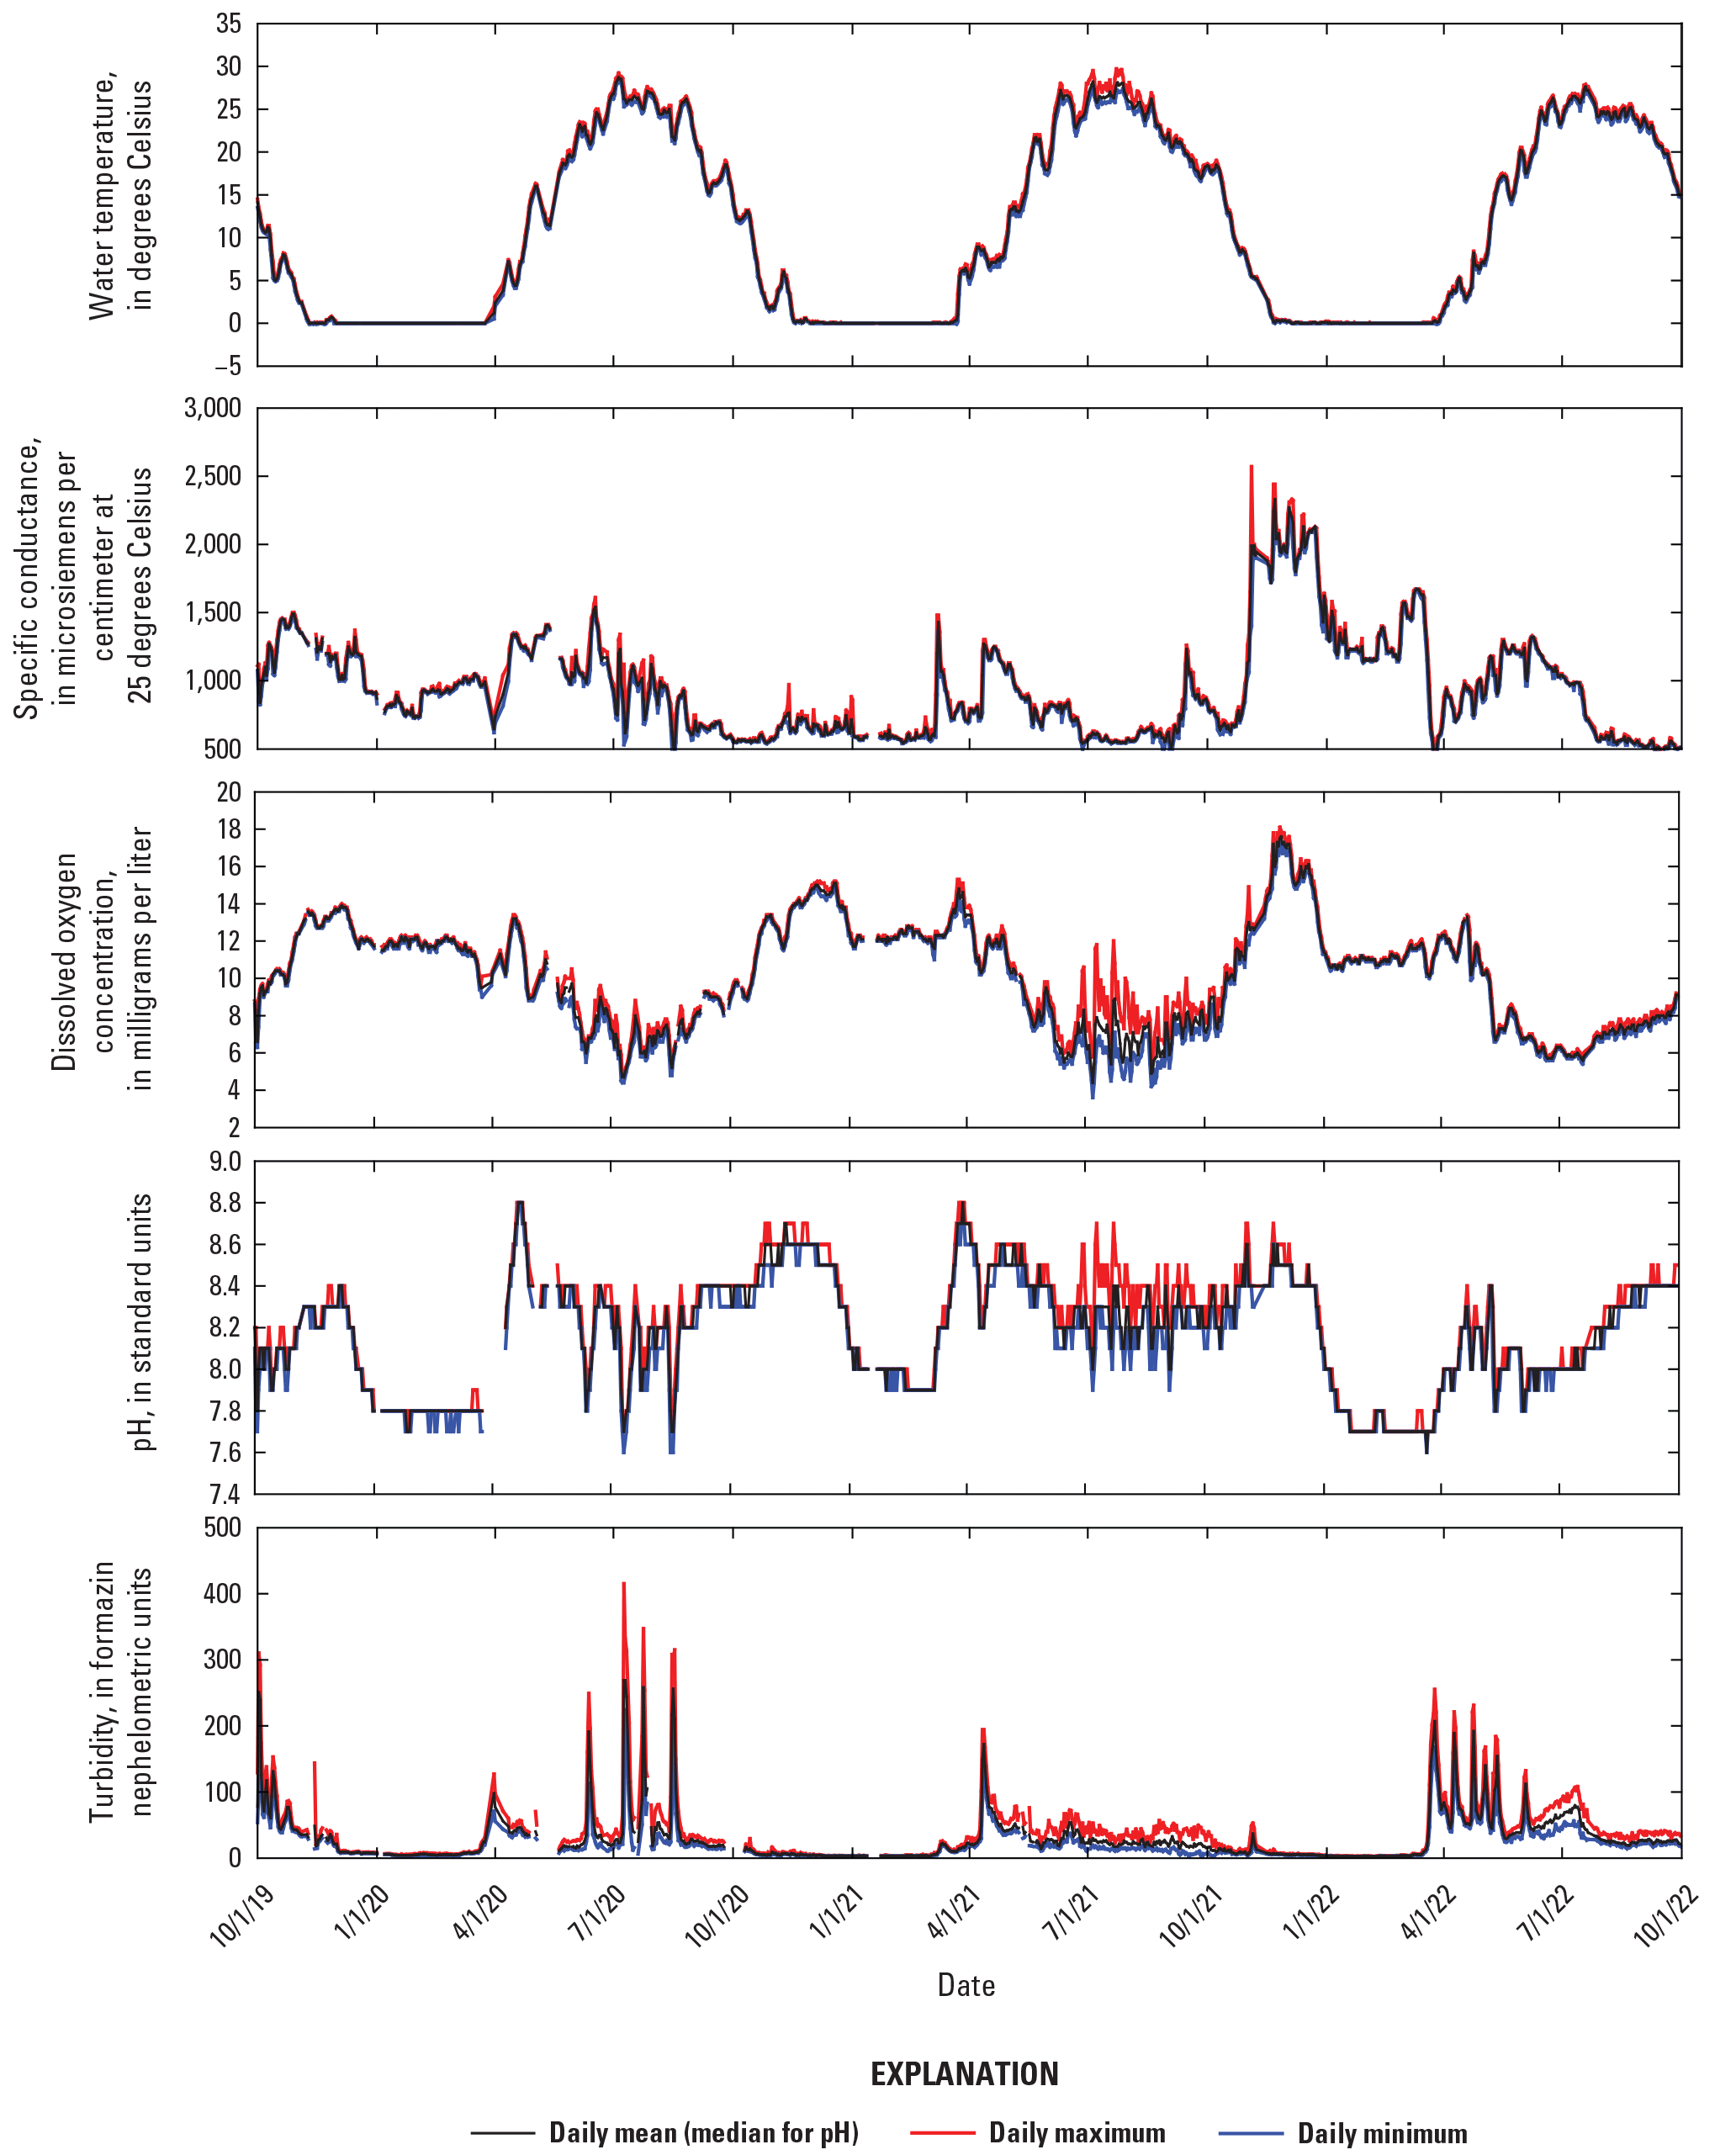
Daily values for continuous water temperature, specific conductance, dissolved oxygen, pH, and turbidity at Red River of the North at Fargo, North Dakota (U.S. Geological Survey station 05054000; site 4), October 1, 2019, to October 1, 2022.
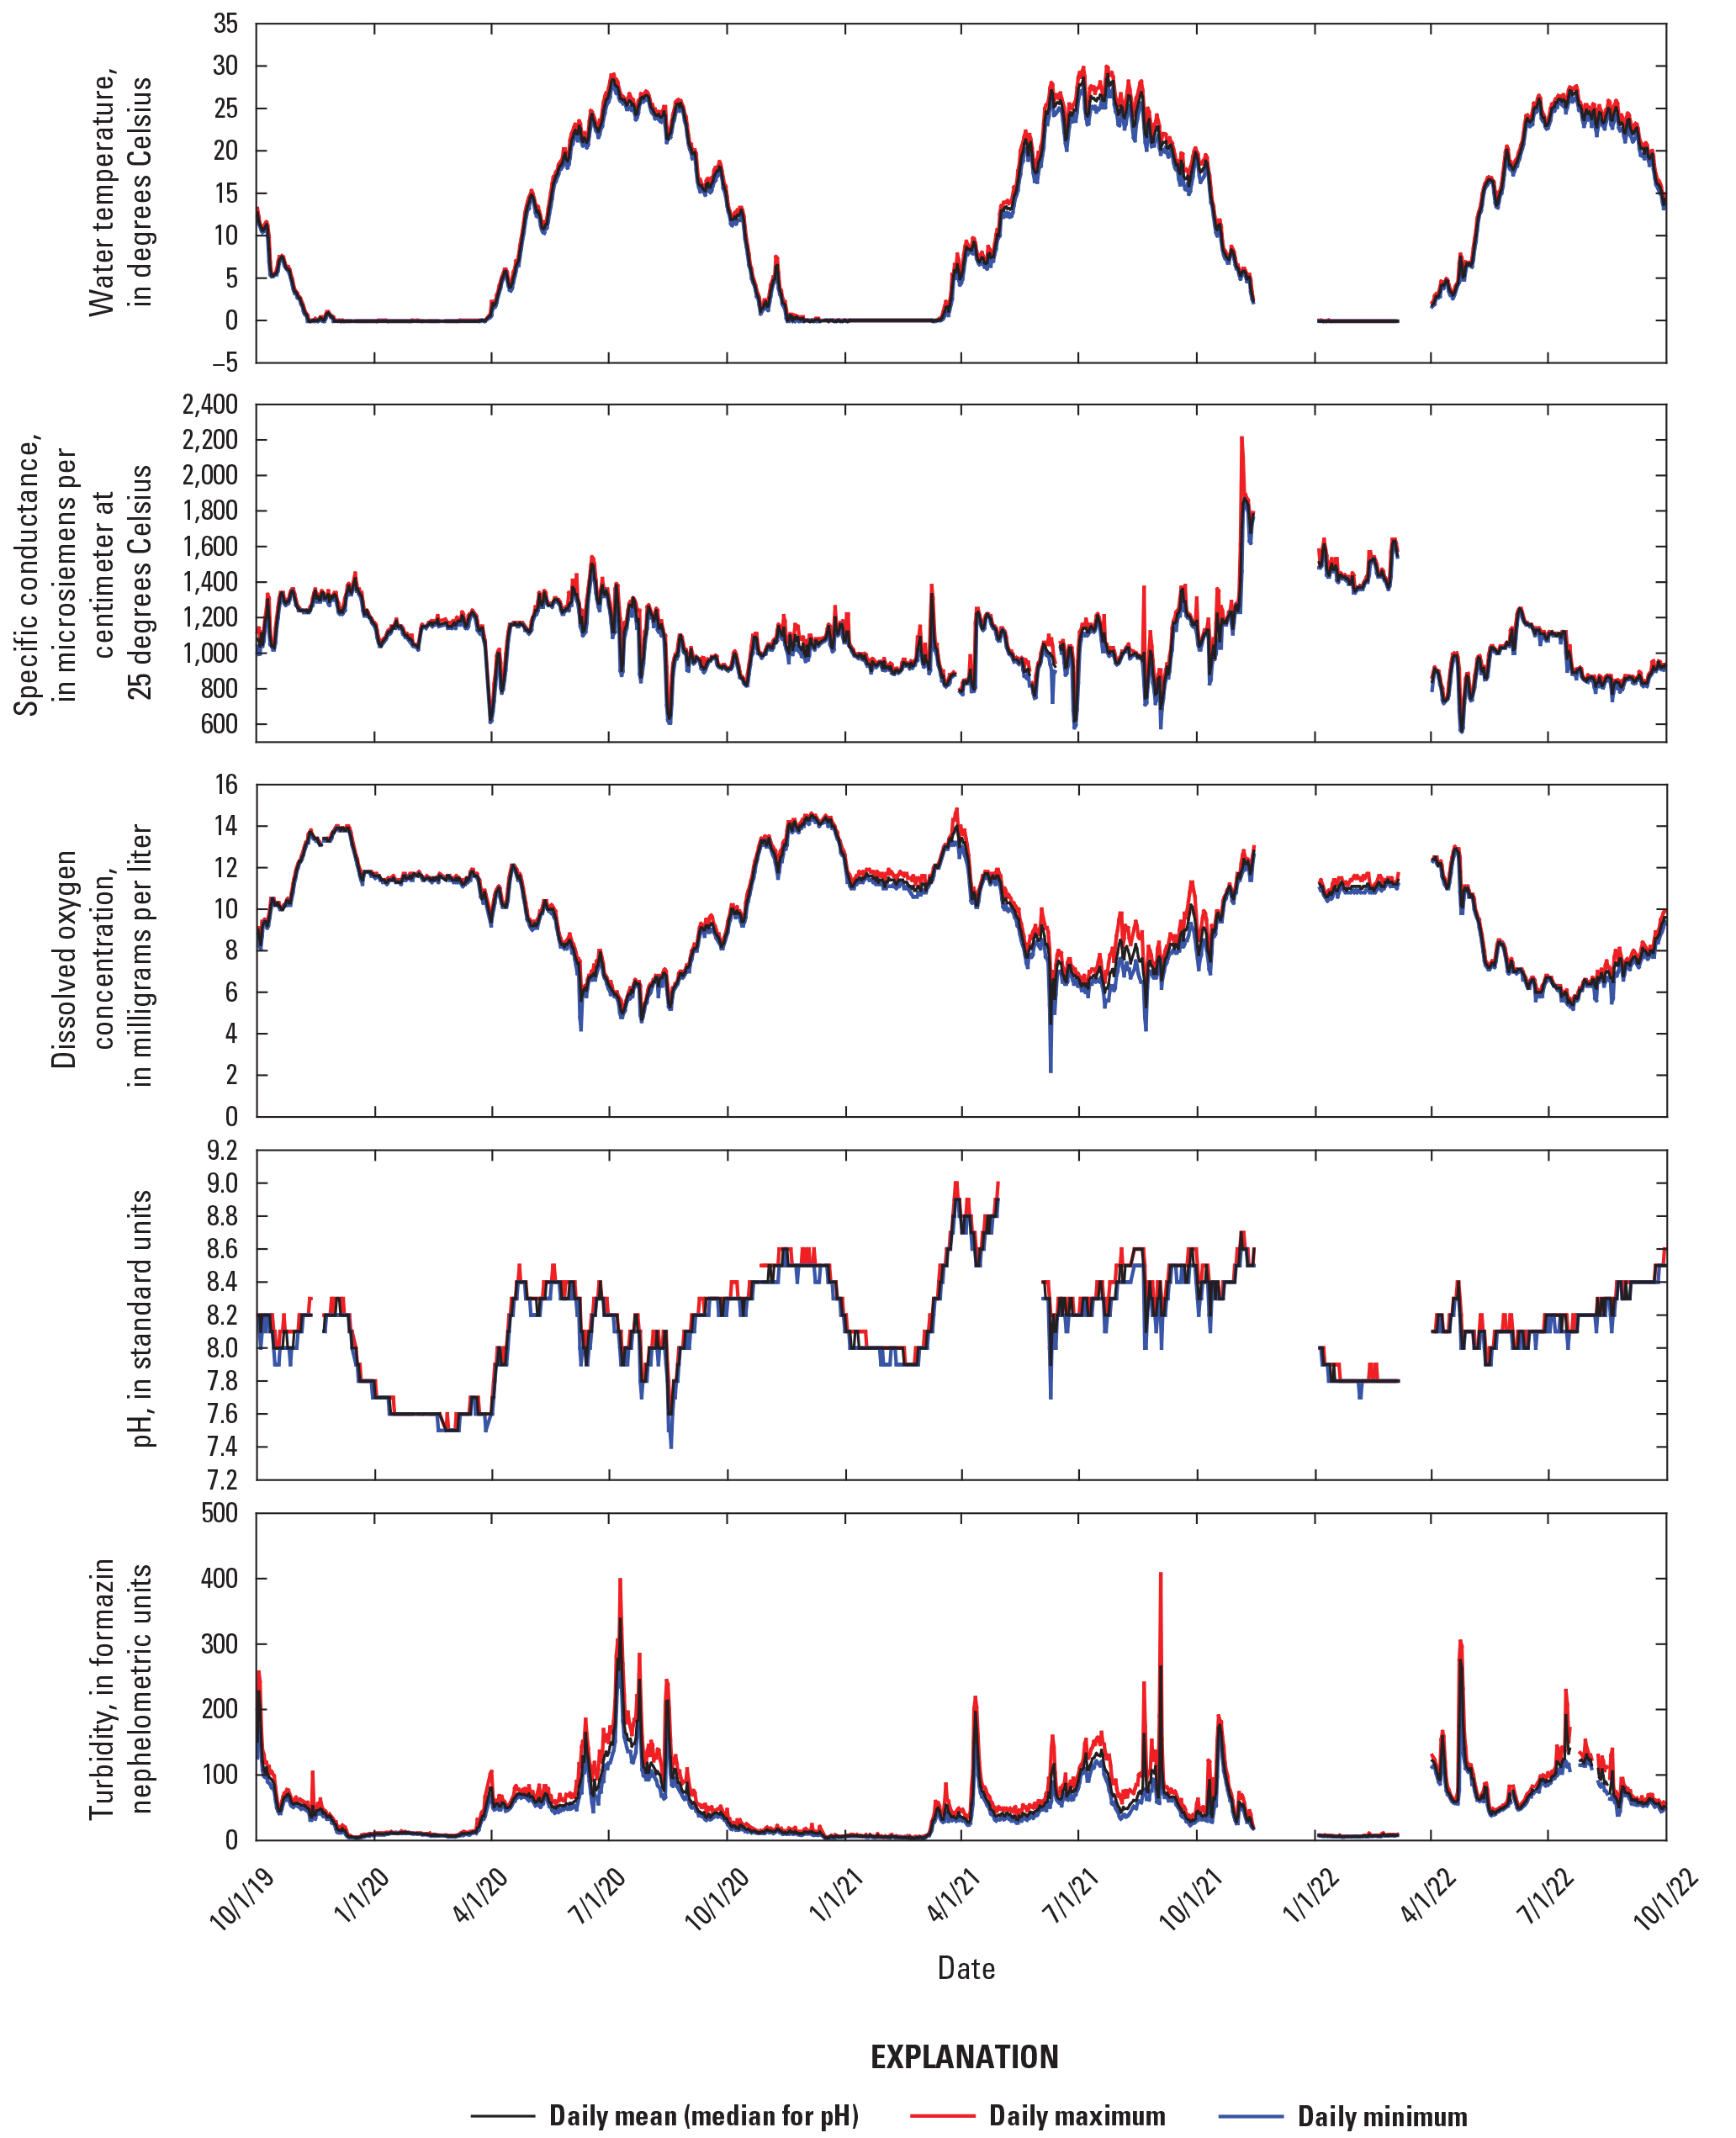
Daily values for continuous water temperature, specific conductance, dissolved oxygen, pH, and turbidity at Red River of the North near Georgetown, Minnesota (U.S. Geological Survey station 05062130; site 9), October 1, 2019, to October 1, 2022.
For most of the period from October 1, 2019, to October 1, 2022, the Red River at site 9 had higher values of specific conductance than the other two sites (sites 1 and 4) except during periods of prolonged high-streamflow conditions (figs. 2 and 11–13). The higher values at site 9 compared to the two upstream sites may be related to a number of factors including inputs from tributaries that enter the Red River between the sites, differences in groundwater inputs, and inputs from the surrounding urban area such as runoff and wastewater discharge.
Dissolved Oxygen
The solubility of DO is affected by water temperature and atmospheric pressure. The DO solubility increases with colder water, where warmer water holds less DO, and solubility increases with increasing atmospheric pressure and decreases with decreasing atmospheric pressure. DO is important in chemical reactions in water and in the life cycles of aquatic organisms (Hem, 1985). Sources of DO in surface waters primarily are atmospheric reaeration and photosynthetic activity of aquatic plants. DO is consumed by the respiration of aquatic plants, ammonia nitrification, and the decomposition of organic matter in a stream (Hem, 1985).
DO concentrations were similar among the three sites on the Red River (sites 1, 4, 9; table 20). Instantaneous DO concentrations at site 1 ranged from 4.3 to 15.1 mg/L with an annual mean ranging from 9.3 mg/L in 2022 to 10.5 mg/L in 2020 (table 20). Instantaneous DO concentrations at site 4 ranged from 3.6 to 18.1 mg/L with an annual mean ranging from 9.9 mg/L in 2022 to 10.3 mg/L in 2021. Instantaneous DO concentrations at site 9 ranged from 2.2 to 14.8 mg/L with an annual mean ranging from 9.0 mg/L in 2022 to 10.3 mg/L in 2021 (table 20). For all three sites, the range in DO concentration measured with discrete water-quality samples was 5.6 to 14.2 mg/L (table 10), which was much smaller than the range of DO concentrations for the continuous water-quality data.
DO concentrations followed similar seasonal patterns among the three sites on the Red River (figs. 11–13). DO concentrations were generally higher in the fall (September through November) and winter (December, January, and February) and lower in the summer months (June through August). The higher concentrations in the fall and winter are likely because of colder water temperatures that can hold more oxygen (figs. 11–13) and reduced biological activity that can consume oxygen in the water column. In the summer months, warmer water temperatures can reduce the capacity to hold DO in solution and particularly when there is little velocity with low-streamflow conditions, oxygen can be consumed by organic decomposition in the bottom material and through respiration by algae.
DO concentrations demonstrated the effects of biological activity and other processes that affect oxygen solubility during certain periods from October 1, 2019, to October 1, 2022, at the three sites (figs. 11–13). Diurnal variations in DO concentrations were noticeable, particularly during the summer in 2021, when there were relatively low-streamflow conditions in the Red River. The diurnal variations reflect algal processes in a stream because during the day, when solar radiation is the greatest, aquatic plants use photosynthesis during growth, which produces oxygen and consumes carbon dioxide (CO2). During the night, aquatic plants undergo respiration, which produces CO2 and consumes oxygen (Allan, 1995). During extended low-streamflow conditions in the summer, like those measured in 2021, when water temperatures are greater and the water column has more light penetration than other periods of the year, algal growth can occur more readily.
pH
The pH of an aqueous solution is controlled by interrelated chemical reactions that produce or consume hydrogen ions (Hem, 1985). Many reactions that occur in natural water among solutes (solid or gaseous) or other liquid species involve hydrogen ions and, therefore, affect the pH. For example, the reaction of CO2 with water is one of the most important in controlling the pH in natural water systems (Hem, 1985).
pH was similar among the three sites on the Red River (sites 1, 4, 9; table 20). Instantaneous pH at site 1 ranged from 7.6 to 8.9 standard units with an annual mean ranging from 8.2 standard units in 2022 to 8.3 standard units in 2020 and 2021 (table 20). Instantaneous pH at site 4 ranged from 7.6 to 8.8 standard units with an annual mean ranging from 8.1 standard units in 2020 and 2022 to 8.3 standard units in 2021. Instantaneous pH at site 9 ranged from 7.4 to 9.0 standard units with an annual mean ranging from 8.0 standard units in 2020 to 8.3 standard units in 2021 (table 20). Compared to the range in pH of 7.6 to 8.7 standard units (table 10) for discrete water-quality samples at all sites, the range of pH values was slightly larger for the continuous water-quality data.
In general, pH was lower at the three sites in the winter months compared to pH in the summer and fall with some short periods of low pH also in the summer of 2020 (figs. 11–13). The higher pH values in the summer and fall may be attributed to inputs from rainfall runoff when precipitation infiltrates through soils, particularly alkaline soils, and is released into the stream. The downward spikes in pH during the summer months in 2020 may be attributed to more intensive rainfall-runoff events, where precipitation has less time to interact with the soils in the watershed and directly runs off to the stream. Rainwater generally has a pH less than 7 standard units (U.S. Geological Survey, 2019b) that can temporarily decrease the stream pH, which is about 8.0–8.3 standard units, on average, at the three Red River sites (table 20). During the winter months when the channel was ice covered, water temperatures were low, and runoff was minimal, the pH remained relatively steady and generally was lower than during other times of the year.
Similar to DO, pH can also fluctuate diurnally, with higher pH during the day and lower pH at night as was measured during low-streamflow conditions in the summer months in 2021 (figs. 11–13). The fluctuations are the result of the same processes that produce the diurnal changes in DO during low-streamflow conditions. As aquatic plants produce CO2 during respiration at night, pH decreases, and when CO2 is consumed during the day from photosynthesis, pH increases (Allan, 1995).
Turbidity
Turbidity is an expression of the optical properties of water that cause light rays to be scattered and absorbed (Gray and Glysson, 2003). Turbidity of water is caused by the presence of suspended inorganic matter such as clay and silt; suspended and dissolved organic matter such as plankton, microscopic organisms, small terrestrial organic material, and organic acids; and water color.
The patterns in turbidity were mostly related to streamflow conditions and were similar among the three sites on the Red River (sites 1, 4, 9) from October 1, 2019, to October 1, 2022 (table 20). Instantaneous turbidity at site 1 ranged from 4 to 329 formazin nephelometric units (FNUs) with an annual mean ranging from 16 FNUs in 2021 to 35 FNUs in 2020 (table 20). Instantaneous turbidity at site 4 ranged from 2 to 415 FNUs with an annual mean ranging from 20 FNUs in 2021 to 36 FNUs in 2020. Instantaneous turbidity at site 9 ranged from 3 to 407 FNUs with an annual mean ranging from 42 FNUs in 2021 to 64 FNUs in 2022 (table 20). For all three sites, the range in turbidity measured with discrete water-quality samples was 2 to 160 FNUs (table 10), which was much smaller than the range of turbidity from the continuous water-quality data.
Turbidity patterns reflected the streamflow patterns at the three sites, with higher variability and higher values in the spring and summer, particularly during spring snowmelt and rainfall-runoff events (figs. 2 and 11–13). Runoff events deliver sediment and other material into the stream, which results in higher turbidity. The highest values for turbidity were measured in the summer and early fall in 2020 at the three sites when there were frequent high-streamflow events (fig. 2) compared to the summer and fall in 2021 when there was little runoff and low-streamflow conditions. Even during periods in the summer and fall when runoff had decreased, turbidity stayed relatively high because most of the sediment that is transported in the Red River consists of silts and clay that can stay in suspension in the water column even at lower velocities compared to heavier material like sand. In the winter months when the channel is ice covered and there is very little runoff, turbidity values were relatively low with little variation (figs. 11–13). Other factors such as the occurrence of algae in the stream also can increase the turbidity, although to a lesser degree than the transport of sediment.
Summary
The Flood Risk Management Project was initiated in 2008 in the Fargo-Moorhead metropolitan area to reduce flood risk, flood damages, and flood protection costs. In cooperation with the U.S. Army Corps of Engineers, the U.S. Geological Survey (USGS) initiated a water-quality monitoring study to describe the water-quality characteristics of the Red River and its tributaries in the Fargo-Moorhead metropolitan area during the preconstruction period of the Flood Risk Management Project from October 1, 2019, to October 1, 2022, to assess conditions before construction activities begin on the Flood Risk Management Project. The monitoring study included the collection of discrete and continuous water-quality data and streamflow monitoring at selected sites that integrated and enhanced existing monitoring programs within the study area.
Streamflow is highly variable in the Red River Basin over various time scales and affects the water-quality characteristics. The annual mean streamflow for the Red River and tributaries (Wild Rice, Sheyenne, and Maple Rivers) in the Fargo-Moorhead metropolitan area during the sampling period (water years 2020–22) were well above the long-term annual mean streamflow in water years 2020 and 2022 but well below the long-term annual mean streamflow in water year 2021.
Discrete samples collected at 10 sites in the Fargo-Moorhead metropolitan area were analyzed for major ions, trace elements, nutrients, suspended sediment, pesticides, and fecal indicator bacteria. In general, major ion concentrations were higher at sites on the tributaries compared to sites on the Red River. The highest total dissolved solids concentrations among the 10 sites were measured in samples collected at the Wild Rice River near Abercrombie, North Dakota (USGS station number 05053000; site 2) with a median concentration of 1,135 milligrams per liter and the Wild Rice River near St. Benedict, N. Dak. (USGS station number 05053500; site 3) with a median concentration of 1,130 milligrams per liter. In comparison, the median concentrations for the Red River ranged from 548 milligrams per liter at the Red River of the North at Hickson, N. Dak. (USGS station number 05051522; site 1) to 730 milligrams per liter at the Red River of the North near Georgetown, Minnesota (USGS station number 05062130; site 9). In general, bicarbonate, calcium, magnesium, and sulfate represented the largest portion of the dissolved ions measured in samples collected at the 10 sites. Sulfate was the most dominant dissolved ion that had the highest concentrations among the major ions measured in samples collected at the 10 sites. Similar to the other major ions, sulfate was the highest among the sites at the Wild Rice River, with median concentrations of 593 and 584 milligrams per liter at sites 2 and 3, respectively. Sites on the Red River had median sulfate concentrations ranging from 243 milligrams per liter (site 1) to 325 milligrams per liter at the Red River of the North near Harwood, N. Dak. (USGS station number 05054200; site 5).
A total of 18 trace elements were analyzed in discrete samples collected at the 10 sites in the Fargo-Moorhead metropolitan area. Several of the trace elements had concentrations below the laboratory reporting level in all samples, including antimony, beryllium, cadmium, chromium, silver, and thallium. Most of the other trace elements were only detected in a small portion of samples and at concentrations near the laboratory reporting level. Trace elements that were frequently detected in samples included barium, boron, manganese, and nickel. Sites on the Wild Rice River generally had the highest concentrations of arsenic, barium, boron, manganese, and nickel compared to the other sites.
Nutrients analyzed in discrete samples collected at the 10 sites in the Fargo-Moorhead metropolitan area included filtered and unfiltered concentrations of ammonia, nitrate plus nitrite, phosphorus, and organic carbon. The median filtered ammonia concentration at most of the sites was less than the laboratory reporting level of 0.03 milligram per liter as nitrogen except for the Sheyenne River at Harwood, N. Dak. (USGS station number 05060400; site 8) and Red River of the North at Halstad, Minn. (USGS station number 05054500; site 10), which had median concentrations of 0.04 milligram per liter as nitrogen. The lowest median unfiltered nitrate plus nitrite concentration was measured at the Red River upstream from the Fargo-Moorhead metropolitan area, and the highest median was in the Red River downstream from the Fargo-Moorhead metropolitan area compared to all other sites. The increase in nitrate plus nitrite concentration could reflect the influence of the wastewater-treatment plant discharge that enters the Red River upstream from site 5 and from urban runoff that can wash fertilizers applied to lawns, shrubs, and trees in the urban areas into the stream. Phosphorus (unfiltered) concentrations were generally higher at sites on the Maple and Sheyenne Rivers compared to the other sites and were higher at sites on the Red River downstream from the Fargo-Moorhead metropolitan area compared to sites upstream on the Red River. The median phosphorus concentration at the Maple River below Mapleton, N. Dak. (USGS station number 05060100; site 7) was 0.41 milligram per liter as phosphorus and was 0.35 and 0.34 milligram per liter as phosphorus at the Sheyenne River near Kindred, N. Dak. (USGS station number 05054200; site 6) and site 8 on the Sheyenne River, respectively.
Suspended-sediment concentrations were generally highest at sites in the Sheyenne River and lowest in the Red River at site 1 and the Red River of the North at Fargo, N. Dak. (USGS station number 05054000; site 4). The Sheyenne River had a median concentration of 211 milligrams per liter at site 6 and a median concentration of 180 milligrams per liter at site 8. The Red River at sites 1 and 4 had a median concentration of 63 milligrams per liter for both sites, compared to the most downstream sites (sites 9 and 10) that had median concentrations of 155 and 151 milligrams per liter, respectively. The higher concentrations at the downstream Red River sites likely represent the input from the Sheyenne River, which had higher suspended-sediment concentration compared to the other tributary sites and enters the Red River upstream from sites 9 and 10. The distribution of suspended-sediment particle sizes in samples collected at the 10 sites was relatively uniform among the sites, except for the Sheyenne River at site 6. Most of the suspended sediment at sites in the Fargo-Moorhead metropolitan area had particle diameter sizes less than 0.0625 millimeter, meaning the sediment is predominantly silt- and clay-sized particles.
Samples collected at the Wild Rice River (site 2), Sheyenne River (site 6), Red River (sites 4 and 9), and the Maple River (site 7) were analyzed for 102 different pesticides and pesticide degradates. Of the 102 constituents analyzed, 45 constituents had no detectable concentrations in any of the 17 samples collected at each of the five sites. The remaining 57 pesticides had at least 1 detection in the samples collected at the five sites. The sites on the Wild Rice River and Sheyenne River had fewer pesticide detections compared to the Maple River and the Red River sites. Although acetochlor was only detected in about 20 percent of the samples collected at each site, two degradates of acetochlor were detected in all samples, and most had quantifiable concentrations. Atrazine and two of its degradate compounds, deethyl atrazine and hydroxy atrazine, were also detected in every sample with quantifiable concentrations. Likewise, metolachlor and two of its degradate compounds, metolachlor ethanesulfonic acid and metolachlor oxanilic acid, were detected in nearly all samples.
Escherichia coli (E. coli) counts in samples collected at the 10 sites were highly variable among the sites and among the samples collected at each site. In general, sites on the tributaries and on the Red River upstream from the urban areas around Fargo and Moorhead had lower counts of E. coli compared to sites downstream from the urban areas. E. coli counts for the Wild Rice River (sites 2 and 3) had median values of 41 and 15 colonies per 100 milliliters, respectively, and the Maple River (site 7) had a median of 20 colonies per 100 milliliters. The Red River at site 1 had a median of 15 colonies per 100 milliliters. The Sheyenne River at site 6 had the highest median among the sites upstream from the Fargo-Moorhead metropolitan area with a median of 63 colonies per 100 milliliters. The Red River at site 5 and the Sheyenne River at site 8 had the highest median E. coli counts among all sites with values of 190 and 120 colonies per 100 milliliters, respectively.
Annual and seasonal loads were estimated for total dissolved solids, chloride, sodium, sulfate, nitrate plus nitrite (unfiltered), phosphorus (unfiltered), and suspended sediment using streamflow data and the discrete water-quality sample data collected at 10 sites in the Fargo-Moorhead metropolitan area. Annual yields (load/contributing area) were also computed for the 10 sites. Patterns in annual loads generally were the same as patterns in streamflow at the 10 sites for water years 2020–22. The greatest loads for all constituents generally were delivered at sites 9 and 10 on the Red River; sites that also had the highest annual streamflows among the sites and the greatest loads generally were delivered in water year 2020 when the streamflows were highest at the sites. Likewise, the least loads for most constituents were at the Maple River and were least in 2021 compared to the other years because of low-streamflow conditions.
Annual loads of total dissolved solids for the Red River increased from upstream to downstream sites through the Fargo-Moorhead metropolitan area, which generally reflected the mass added from the tributary inputs between sites in water years 2020 through 2022. Annual total dissolved solids loads for the Red River in water year 2020 ranged from 1,120,000 tons at site 1 to 4,350,000 tons at site 10. In comparison, total dissolved solids loads in water year 2021 ranged from 332,000 tons at site 1 to 871,000 tons at site 10. Similar to total dissolved solids, chloride loads for the Red River increased from upstream to downstream sites through the Fargo-Moorhead metropolitan area, which generally reflected the mass added from the tributary inputs between sites. Sulfate and sodium loads were much larger than chloride loads but followed similar patterns, with loads on the Red River increasing from upstream to downstream sites through the Fargo-Moorhead metropolitan area in water years 2020 through 2022.
Annual yields of total dissolved solids were highest among all sites at the two Wild Rice River sites (sites 2 and 3) and the Maple River (site 7) for water year 2020; at sites 1, 4, and 5 on the Red River for water year 2021; and at sites 1 and 4 on the Red River and the Maple River (site 7) in water year 2022. The Maple River (site 7) had the highest chloride yields among all the sites in water years 2020 and 2022. Annual yields of sodium were also highest among all sites at the two Wild Rice River sites and the Maple River for water years 2020 and 2022. In water year 2021, sodium yields were similar among the sites. Patterns in annual sulfate yields were similar to total dissolved solids and sodium for water year 2020 with highest yields at the two Wild Rice River sites and at the Maple River. For water years 2021 and 2022, the highest sulfate yields were at Red River sites.
In water year 2021, during relatively low-streamflow conditions, nitrate plus nitrite loads were about the same at Red River sites 1 and 4 but substantially increased from sites 4 to 5, likely affected by inputs from the wastewater-treatment plant discharge between the two sites on the Red River. The nitrate plus nitrite loads farther downstream on the Red River decreased at site 9 then slightly increased at site 10. In water year 2022, nitrate plus nitrite loads for the Red River followed a similar pattern to water year 2020. There were large increases between the Sheyenne River sites (sites 6 and 8) in water years 2020 and 2022 compared to water year 2021. Phosphorus loads on the Red River ranged from 327 tons at site 1 to 2,310 tons at site 10 in water year 2020. In water year 2021, phosphorus loads on the Red River ranged from 106 tons at site 1 to 371 tons at site 10 and for water year 2022 loads ranged from 306 tons at site 1 to 1,600 tons at site 10. The Sheyenne River at site 8 had the highest annual phosphorus loads among all tributary sites in water years 2020 through 2022.
Annual yields of nitrate plus nitrite were highest among all sites at the Maple River in water years 2020 and 2022. In 2021, the highest yield among all sites was at site 5 on the Red River, likely related to the low-streamflow conditions and the input of the wastewater-treatment plant discharge upstream from the site. Phosphorus yields were similar to nitrate plus nitrite yields, with the highest yields among all the sites at the Maple River in water years 2020 and 2022, and the highest yields at site 5 on the Red River among all the sites in water year 2021. Unlike nitrate plus nitrite, the sites on the Wild Rice River had the lowest phosphorus yields among all the tributary sites in all 3 years.
Annual suspended-sediment loads for the Red River increased from upstream to downstream sites through the Fargo-Moorhead metropolitan area, and the Sheyenne River had the greatest loads among the tributaries in water years 2020 through 2022. Annual yields of suspended sediment were highest at the two Sheyenne River sites among all sites for water years 2020 and 2022. In water year 2021, suspended-sediment yields were similar among the sites, and the highest annual yield was at sites 1 and 5 on the Red River.
Water quality has been monitored continuously on the Red River at Fargo (site 4) from June 2003 to October 2022 and the Red River at site 1 and site 9 from October 2019 to October 2022. Water-quality measurements recorded at the three sites included water temperature, specific conductance, dissolved oxygen, pH, and turbidity. Specific conductance values were similar for the Red River at site 1 and site 4, compared to site 9, which generally had higher values than the other two sites. Instantaneous values of specific conductance at site 1 ranged from 410 to 2,770 microsiemens per centimeter at 25 degrees Celsius, site 4 ranged from 407 to 2,570 microsiemens per centimeter at 25 degrees Celsius, and site 9 had instantaneous values ranging from 558 to 2,210 microsiemens per centimeter at 25 degrees Celsius. Dissolved oxygen concentrations were similar among the three sites on the Red River. Instantaneous dissolved oxygen concentrations at site 1 ranged from 4.3 to 15.1 milligrams per liter, site 4 ranged from 3.6 to 18.1 milligrams per liter, and site 9 ranged from 2.2 to 14.8 milligrams per liter. pH was similar among the three sites on the Red River. Patterns in turbidity were mostly related to streamflow conditions and were similar among the three sites on the Red River. Instantaneous turbidity at site 1 ranged from 4 to 329 formazin nephelometric units, site 4 ranged from 2 to 415 formazin nephelometric units, and site 9 ranged from 3 to 407 formazin nephelometric units.
References Cited
Blanchard, R.A., Ellison, C.A., Galloway, J.M., and Evans, D.A., 2011, Sediment concentrations, loads, and particle size distributions in the Red River of the North and selected tributaries near Fargo, North Dakota, during the 2010 spring high-flow event: U.S. Geological Survey Scientific Investigations Report 2011–5064, 27 p., accessed December 4, 2022 at https://doi.org/10.3133/sir20115064.
Cohn, T.A., 1995, Recent advances in statistical methods for the estimation of sediment and nutrient transport in rivers: Reviews of Geophysics, v. 33, no. S2, p. 1117–1123. [Also available at https://doi.org/10.1029/95RG00292.]
Cohn, T.A., Caulder, D.L., Gilroy, E.J., Zynjuk, L.D., and Summers, R.M., 1992, The validity of a simple statistical model for estimating fluvial constituent loads—An Empirical study involving nutrient loads entering Chesapeake Bay: Water Resources Research, v. 28, no. 9, p. 2353–2363. [Also available at https://doi.org/10.1029/92WR01008.]
Cohn, T.A., DeLong, L.L., Gilroy, E.J., Hirsch, R.M., and Wells, D.K., 1989, Estimating constituent loads: Water Resources Research, v. 25, no. 5, p. 937–942. [Also available at https://doi.org/10.1029/WR025i005p00937.]
Cowdery, T.K., 1998, Ground-water quality in the Red River of the North Basin, Minnesota and North Dakota, 1991–95: U.S. Geological Survey Water-Resources Investigations Report 98–4175, 15 p., accessed February 26, 2023 at https://doi.org/10.3133/wri984175.
Galloway, J.M., Blanchard, R.A., and Ellison, C.A., 2011, Sediment concentrations, loads, and particle-size distributions in the Red River of the North and selected tributaries near Fargo, North Dakota, during the 2011 spring high-flow event: U.S. Geological Survey Scientific Investigations Report 2011–5134, 30 p., accessed February 26, 2023, at https://doi.org/10.3133/sir20115134.
Galloway, J.M., Vecchia, A.V., Vining, K.C., Densmore, B.K., and Lundgren, R.F., 2012, Evaluation of water-quality characteristics and sampling design for streams in North Dakota, 1970–2008: U.S. Geological Survey Scientific Investigations Report 2012–5216, 304 p., accessed November 18, 2022, at https://doi.org/10.3133/sir20125216.
Gray, J.R., and Glysson, G.D., eds., 2003, Proceedings of the Federal interagency workshop on turbidity and other sediment surrogates, April 30–May 2, 2002, Reno, Nevada: U.S. Geological Survey Circular 1250, 56 p. [Also available at https://doi.org/10.3133/cir1250.]
Gray, J.R., Glysson, G.D., Turcios, L.M., and Schwarz, G.E., 2000, Comparability of suspended-sediment concentration and total suspended solids data: U.S. Geological Water-Resources Investigations Report 00–4191, 14 p. [Also available at https://doi.org/10.3133/wri004191.]
Guy, H.P., 1970, Fluvial sediment concepts: U.S. Geological Survey Techniques of Water-Resources Investigations, book 3, chap. C1, 55 p. [Also available at https://doi.org/10.3133/twri03C1.]
Helsel, D.R., Hirsch, R.M., Ryberg, K.R., Archfield, S.A., and Gilroy, E.J., 2020, Statistical methods in water resources: U.S. Geological Survey Techniques and Methods, book 4, chap. A3, 458 p. [Also available at https://doi.org/10.3133/tm4A3.] [Supersedes U.S. Geological Survey Techniques of Water-Resources Investigations, book 4, chap. A3, version 1.1.]
Hem, J.D., 1985, Study and interpretation of the chemical characteristics of natural water: U.S. Geological Survey Water-Supply Paper 2254, 263 p. [Also available at https://doi.org/10.3133/wsp2254.]
International Joint Commission, 2023, The International Red River Watershed Board: International Joint Commission, accessed March 30, 2023, at https://www.ijc.org/sites/default/files/IRRB-FoldedBrochure-v12-Print.pdf.
Kolars, K.A., Vecchia, A.V., and Ryberg, K.R., 2016, Stochastic model for simulating Souris River precipitation, evapotranspiration, and natural streamflow: U.S. Geological Survey Scientific Investigations Report 2015–5185, 55 p., accessed May 5, 2020, at https://doi.org/10.3133/sir20155185.
Metro Flood Diversion Authority, 2023, Metro Flood Diversion Authority: accessed March 30, 2023, at https://fmdiversion.gov/.
Mueller, D.K., Schertz, T.L., Martin, J.D., and Sandstrom, M.W., 2015, Design, analysis, and interpretation of field quality-control data for water-sampling projects: U.S. Geological Survey Techniques and Methods, book 4, chap. C4, 54 p., accessed February 21, 2023, at https://doi.org/10.3133/tm4C4.
Norman, J.E., Toccalino, P.L., and Morman, S.A., 2018, Health-Based Screening Levels for evaluating water-quality data (2d ed.): U.S. Geological Survey web page, accessed February 21, 2023, at https://doi.org/10.5066/F71C1TWP.
North Dakota Department of Agriculture, 2023, Pesticide Water Quality Program: North Dakota Department of Agriculture, accessed February 26, 2023, at https://www.ndda.nd.gov/divisions/pesticide-fertilizer-division/pesticide-water-quality-program.
North Dakota Department of Environmental Quality, 2023, Water quality monitoring & assessment—Standard operating procedures (SOPs): North Dakota Department of Environmental Quality, accessed April 11, 2023, at https://deq.nd.gov/WQ/3_Watershed_Mgmt/5_WQMonit/WQMonit.aspx.
Nustad, R.A., and Vecchia, A.V., 2020, Water-quality trends for selected sites and constituents in the international Red River of the North Basin, Minnesota and North Dakota, United States, and Manitoba, Canada, 1970–2017: U.S. Geological Survey Scientific Investigations Report 2020–5079, 75 p., accessed February 26, 2023, at https://doi.org/10.3133/sir20205079.
Nustad, R.A., Galloway, J.M., and Wheeling, S.L., 2024, Data and scripts used in water-quality characteristics of the Red River of the North and tributaries in the Fargo-Moorhead metropolitan area, North Dakota 2019–22: U.S. Geological Survey data release, accessed January 2024 at https://doi.org/10.5066/P9B0S8L0.
Rantz, S.E., and others, 1982, Measurement and computation of streamflow—Volume 2, Computation of discharge: U.S. Geological Survey Water-Supply Paper 2175, p. 285–631. [Also available at https://doi.org/10.3133/wsp2175.]
Runkel, R.L., Crawford, C.G., and Cohn, T.A., 2004, Load estimator (LOADEST)—A FORTRAN program for estimating constituent loads in streams and rivers: U.S. Geological Survey Techniques and Methods, book 4, chap. A5, 69 p., accessed December 4, 2021, at https://doi.org/10.3133/tm4A5.
Runkel, R.L., 2013, Revisions to LOADEST, April 2013: U.S. Geological Survey, 6 p., accessed August 8, 2021, at https://water.usgs.gov/software/loadest/doc/loadest_update.pdf.
Ryberg, K.R., Vecchia, A.V., Akyüz, F.A., and Lin, W., 2016, Tree-ring based estimates of long-term seasonal precipitation in the Souris River region of Saskatchewan, North Dakota, and Manitoba: Canadian Water Resources Journal, v. 41, no. 3, p. 412–428. [Also available at https://doi.org/10.1080/07011784.2016.1164627.]
Stoner, J.D., Lorenz, D.L., Wiche, G.J., and Goldstein, R.M., 1993, Red River of the North Basin, Minnesota, North Dakota, and South Dakota: Journal of the American Water Resources Association, v. 29, no. 4, p. 575–615. [Also available at https://doi.org/10.1111/j.1752-1688.1993.tb03229.x.]
Turnbull, B.W., and Weiss, L.A., 1978, A likelihood ratio statistic for testing goodness of fit with randomly censored data: Biometrics, v. 34, no. 3, p. 367–375. [Also available at https://doi.org/10.2307/2530599.]
U.S. Army Corps of Engineers, 2011, Final feasibility report and environmental impact statement Fargo-Moorhead Metropolitan Area Flood Risk Management: U.S. Army Corps of Engineers, St. Paul, Minn., 585 p., accessed March 30, 2023, at https://fmdiversion.gov/wp-content/uploads/2015/03/Main_Report_with_Attachments.pdf.
U.S. Army Corps of Engineers, 2019, Final supplemental environmental assessment #2 modifications to the Fargo Moorhead Metropolitan Area Flood Risk Management Project: U.S. Army Corps of Engineers, St. Paul, Minn., 101 p., accessed March 30, 2023, at https://fmdiversion.gov/wp-content/uploads/2022/11/Final_FMM_SEA_Feb2019-reduced.pdf.
U.S. Environmental Protection Agency, 2017, Approved general-purpose methods: U.S. Environmental Protection Agency, accessed July 12, 2018, at http://water.epa.gov/scitech/methods/cwa/methods_index.cfm.
U.S. Environmental Protection Agency, 2023a, 2,4-D: U.S. Environmental Protection Agency, accessed July 11, 2023, at https://www.epa.gov/ingredients-used-pesticide-products/24-d.
U.S. Environmental Protection Agency, 2023b, Indicators—Enterococci: U.S. Environmental Protection Agency, accessed July 18, 2023, at https://www.epa.gov/national-aquatic-resource-surveys/indicators-enterococci.
U.S. Geological Survey, variously dated, National field manual for the collection of water-quality data: U.S. Geological Survey Techniques of Water-Resources Investigations, book 9, chaps. A1–A10. [Also available at https://www.usgs.gov/mission-areas/water-resources/science/national-field-manual-collection-water-quality-data-nfm.]
U.S. Geological Survey, 2019a, The StreamStats program: U.S. Geological Survey, accessed on March 14, 2023, at https://streamstats.usgs.gov/ss/.
U.S. Geological Survey, 2019b, pH and water: U.S. Geological Survey, accessed February 21, 2023, at https://www.usgs.gov/special-topics/water-science-school/science/ph-and-water.
U.S. Geological Survey, 2023, USGS water data for the Nation: U.S. Geological Survey National Water Information System database, accessed February 21, 2023, at https://doi.org/10.5066/F7P55KJN.
Vecchia, A.V., 2008, Climate simulation and flood risk analysis for 2008–40 for Devils Lake, North Dakota: U.S. Geological Survey Scientific Investigations Report 2008–5011, 28 p. [Also available at https://doi.org/10.3133/sir20085011.]
Wagner, R.J., Boulger, R.W., Jr., Oblinger, C.J., and Smith, B.A., 2006, Guidelines and standard procedures for continuous water-quality monitors—Station operation, record computation, and data reporting: U.S. Geological Survey Techniques and Methods, book 1, chap. D3, 51 p., plus 8 attachments, accessed February 26, 2013, at https://doi.org/10.3133/tm1D3.
Conversion Factors
U.S. customary units to International System of Units
Temperature in degrees Celsius (°C) may be converted to degrees Fahrenheit (°F) as follows:
°F = (1.8 × °C) + 32.
Datums
Vertical coordinate information is referenced to the North American Vertical Datum of 1988 (NAVD 88).
Horizontal coordinate information is referenced to the North American Datum of 1983 (NAD 83).
Supplemental Information
Specific conductance is given in microsiemens per centimeter at 25 degrees Celsius (µS/cm at 25 °C).
Concentrations of chemical constituents in water are given in either milligrams per liter (mg/L) or micrograms per liter (µg/L).
Sediment particle size is given in millimeters (mm).
A water year is the 12-month period from October 1 to September 30 and is designated by the calendar year in which it ends.
Abbreviations
AMLE
adjusted maximum likelihood estimator
C
carbon
CO2
carbon dioxide
DO
dissolved oxygen
E. coli
Escherichia coli
EDI
equal-discharge-incremental
EPA
U.S. Environmental Protection Agency
EWI
equal-width-increment
FNU
formazin nephelometric unit
MCL
maximum contaminant level
N
nitrogen
NDDEQ
North Dakota Department of Environmental Quality
P
phosphorus
p-value
probability value
R2
coefficient of determination
RPD
relative percent difference
SSC
suspended-sediment concentration
TDS
total dissolved solids
USGS
U.S. Geological Survey
For more information about this publication, contact:
Director, USGS Dakota Water Science Center
821 East Interstate Avenue, Bismarck, ND 58503
1608 Mountain View Road, Rapid City, SD 57702
605–394–3200
For additional information, visit: https://www.usgs.gov/centers/dakotawater
Publishing support provided by the
Rolla Publishing Service Center
Disclaimers
Any use of trade, firm, or product names is for descriptive purposes only and does not imply endorsement by the U.S. Government.
Although this information product, for the most part, is in the public domain, it also may contain copyrighted materials as noted in the text. Permission to reproduce copyrighted items must be secured from the copyright owner.
Suggested Citation
Galloway, J.M., Nustad, R.A., and Wheeling, S., 2024, Water-quality characteristics of the Red River of the North and tributaries in the Fargo-Moorhead metropolitan area, North Dakota, 2019–22: U.S. Geological Survey Scientific Investigations Report 2023–5136, 76 p., https://doi.org/10.3133/sir20235136.
ISSN: 2328-0328 (online)
Study Area
| Publication type | Report |
|---|---|
| Publication Subtype | USGS Numbered Series |
| Title | Water-quality characteristics of the Red River of the North and tributaries in the Fargo-Moorhead metropolitan area, North Dakota, 2019–22 |
| Series title | Scientific Investigations Report |
| Series number | 2023-5136 |
| DOI | 10.3133/sir20235136 |
| Publication Date | January 18, 2024 |
| Year Published | 2024 |
| Language | English |
| Publisher | U.S. Geological Survey |
| Publisher location | Reston, VA |
| Contributing office(s) | Dakota Water Science Center |
| Description | Report: vii, 76 p.; Data Release; Dataset |
| Country | United States |
| State | Minnesota, North Dakota |
| Online Only (Y/N) | Y |
| Additional Online Files (Y/N) | N |