

Isolation and Identification of Microcystin-Degrading Bacteria in Lake Erie Source Waters and Drinking-Water Plant Sand Filters
Links
- More information: Publisher Index Page (via DOI)
- Document: Report (1.91 MB pdf) , HTML , XML
- Data Release: USGS data release - Microcosm experiment data of microcystin-degrading bacteria in Lake Erie source waters and drinking-water plants, 2015–18
- NGMDB Index Page: National Geologic Map Database Index Page (html)
- Download citation as: RIS | Dublin Core
Acknowledgments
We gratefully acknowledge personnel at the Ohio drinking-water treatment plants that helped to collect samples or provided access to their facilities—City of Bowling Green, City of Clyde, Camp Patmos, City of Sandusky, and Village of Marblehead. Thanks to Toby Sanan, U.S. Environmental Protection Agency, for helping us better understand microcystin concentrations in experimental results, and to Dr. Xiaozhen Mou, Kent State University, for providing positive controls.
Abstract
The increasing prevalence of cyanobacterial harmful algal blooms and the toxins they produce is a global water-quality issue. In the Western Basin of Lake Erie, high microcystin concentrations have led to water-quality advisories, process adjustments for treating drinking water, and increased water-quality monitoring. Biodegradation is an environmentally friendly and cost-effective way to reduce concentrations of microcystins in drinking water; however, few studies have been done to determine biodegradation potential of bacteria indigenous to the Lake Erie watershed. As part of a cooperative program between the U.S. Geological Survey and the U.S. Environmental Protection Agency, this study aimed to identify naturally occurring microcystin-degrading bacteria in source waters and in the sand filters of drinking-water treatment plants in the Western Basin of Lake Erie. Biodegradation of microcystin-LR was found to occur in microcosms developed with three different Lake Erie-area sources—Lake Erie water, water from storage reservoirs supplied by inland streams, and water or solid medium from sand/anthracite filters at drinking-water plants. In microplates with microcystin-LR as the sole carbon source, 10 isolates exhibited cellular respiration and were, therefore, identified as promising microcystin biodegraders; 4 of those isolates subsequently were found to have potential to form biofilms. The 10 promising isolates along with 14 additional isolates from the microcosms were identified by 16S ribosomal RNA sequencing: 15 isolates were γ-proteobacteria, 6 isolates were β-proteobacteria, 1 isolate was an α-proteobacterium, 1 isolate was a flavobacterium in the phylum Bacteroidetes, and 1 isolate was in the phylum Actinobacteria. Isolates were screened for possession of the mlrA gene (found to encode for the protein responsible for cleaving the cyclic structure of microcystin), and results indicate that, for Lake Erie source waters and elsewhere, more work would be required to identify microcystin-biodegradation pathways and products and to confirm biodegradation rates in pure culture isolates.
Introduction
Cyanobacteria cause a multitude of water-quality concerns, including the potential to produce potent cyanotoxins. Microcystins are one of the most frequently detected cyanotoxins in freshwaters. The presence of microcystins in lakes and reservoirs led the World Health Organization to establish a guideline of 1 microgram per liter (µg/L) for finished drinking water (World Health Organization, 1999). Treatment methods such as adsorption on activated carbon and chlorination are effective techniques for reducing microcystins in drinking water. Some treatments are costly and (or) may result in disinfection byproducts, such as trihalomethanes and halogenic acetic acids, which are regulated in drinking water because of the public health risk (Eleuterio and Batista, 2010).
An environmentally friendly and cost-effective way to augment existing treatments is to reduce microcystin concentrations through biodegradation (Gągała and Mankiewicz-Boczek, 2012). Early studies identified microcystin-degrading bacteria from an Australian river (Jones and others, 1994) and a reservoir in Japan (Takenaka and Watanabe, 1997). Gene sequencing identified the isolates as Sphingomonas sp., a diverse genus belonging to the α-proteobacteria class and currently well known to have various biodegradation capabilities, including the ability to degrade microcystins (Bourne and others, 2001; Aylward and others, 2013). Later studies reported the identification of additional microcystin-biodegrading species in Europe, China, and Florida and Lake Erie in the United States (Hu and others, 2009; Manage and others, 2009; Ramani and others, 2012; Thees and others, 2019). Researchers have reported that efficient biodegradation of microcystins appears to be site specific (Ho and others, 2012) and that diverse groups of microorganisms and metabolic pathways facilitate this biodegradation (Edwards and others, 2008).
One efficient way to use bacteria for microcystin biodegradation is through biological filtration processes in drinking-water treatment plants (Ho and others, 2012). In a laboratory study, investigators showed that the biofilm collected from sand filters from an Australian water-treatment plant effectively removed microcystins through biodegradation (Ho and others, 2006). The biofilm from the sand was shown to contain bacteria with the mlrA gene, which is a gene that encodes for the protein responsible for cleaving the cyclic structure of microcystin. A microcystin-degrading Morganella sp. was isolated from the biofilm of an active anthracite biofilter from a Los Angeles drinking-water plant and from the water source for this plant, Lake Mead in Arizona and Nevada (Eleuterio and Batista, 2010). Biofilms play a crucial role in removing aqueous pollutants, including toxins (Li and others, 2017). In addition, biofilms provide cells protection from environmental stressors, accumulate nutrients, and provide a favorable growth environment for cells.
In Lake Erie over several recent years, researchers and local health officials have identified harmful algal blooms caused by cyanobacteria during the summer and early fall seasons. This has been especially common in the Western Basin of Lake Erie (fig. 1), where the City of Toledo was forced to issue a do-not-drink water advisory for 400,000 residents during August 2–4, 2014, because of high microcystin levels. It was determined through the Great Lakes Restoration Initiative (U.S. Environmental Protection Agency, 2015) that studies were needed to gain knowledge of the potential for biodegradation of microcystins by bacteria indigenous to Lake Erie and its tributaries, where increasing temperatures and continued inputs of nutrients will likely cause the control and management of toxins in source waters to become more challenging and costly in the future (Thees and others, 2019). From 2015 to 2016, the U.S. Geological Survey (USGS), in cooperation with the U.S. Environmental Protection Agency, sought to determine whether microcystin-degrading bacteria could be isolated from source waters and sand filters from drinking-water plants in areas of the Western Basin of Lake Erie affected by cyanobacterial harmful algal blooms and identify whether the isolates possess the mlrA gene.
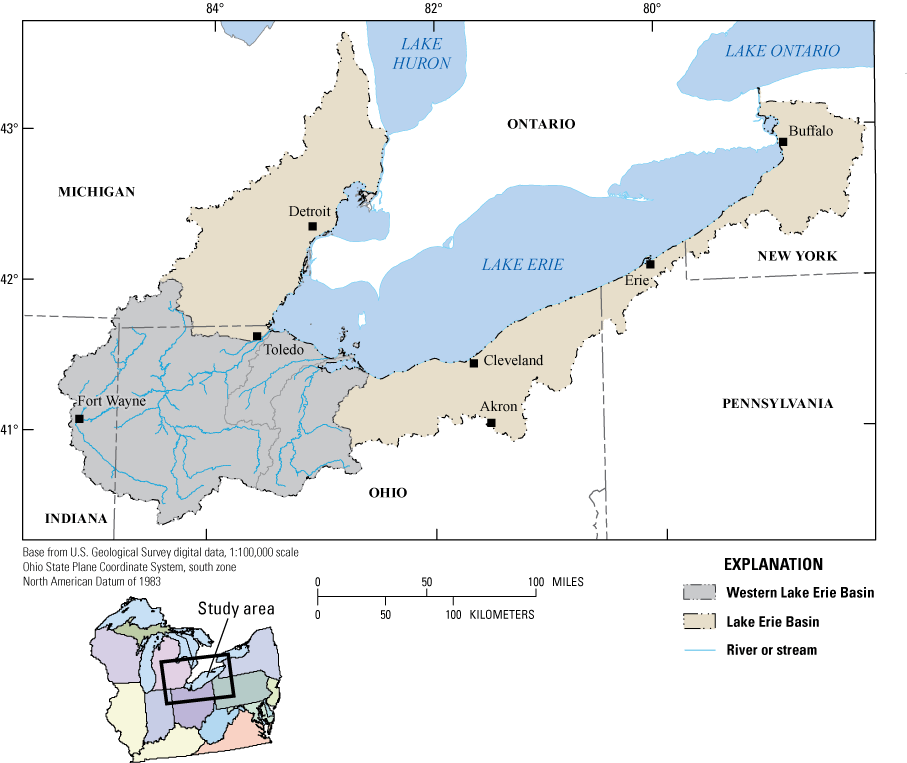
Map showing the Western Basin of Lake Erie within the Lake Erie Basin.
Purpose and Scope
The purposes of the study were to identify naturally occurring, microcystin-degrading bacteria in source waters and in water or solid medium from sand filters of drinking-water plants in the Western Basin of Lake Erie and watershed by using microcosms and to determine whether the presence or quantity of the mlrA gene could be found in the bacteria isolates. Additionally, after isolates were identified, the study objectives were expanded to include the identification of biofilm formation potential, an important characteristic for further assessment of the ability of the selected isolates to remove contaminants from water. This study provides early steps towards using biodegradation as a control strategy for removing microcystins from drinking-water supplies. The future application of economically feasible and effective treatments for toxins caused by cyanobacterial blooms would require additional research beyond the scope of this study.
This report presents the changes in microcystin concentrations observed in microcosm experiments, the results from the screening of selected isolates for the presence of the mlrA gene and for microcystin biodegradation potential, the identification of selected isolates by 16S ribosomal RNA (rRNA) sequencing, and results from the screening of promising isolates for biofilm formation. The report discusses the insights provided by these results. Raw data used in this study are available in a USGS data release (Francy and Cicale, 2024).
Materials and Methods
Study Sites and Sampling
Samples were collected from August 2015 to July 2016 from five drinking-water plants with a history of elevated microcystin concentrations in their untreated source waters (Ohio Environmental Protection Agency, 2015a). Samples were collected either from source waters, from water skimmed from the surface of the sand/anthracite filters, or, when access was available, from the solid medium of the sand/anthracite filters. To collect the solid-medium samples, water was drained from the filter well; a sterile scoop was used to take multiple samples across the well from the top 3–4 inches; and samples were combined as a composite. Two plants obtain their water from storage reservoirs supplied by inland streams (sites Inland 1 and 2); one plant sources water from Lake Erie and is on a Lake Erie island (Lake Erie 1); and two plants source water from Lake Erie and are on the Western Basin shoreline (Lake Erie 2 and 3) (table 1). Samples were transported on ice and analyzed within 24 hours of collection in microcosm experiments.
Table 1.
Drinking-water treatment plants, sample information, and isolates recovered, Western Basin of Lake Erie, 2015–16.[µg/L, microgram per liter; ND, not determined; <, less than]
Microcosm Setup and Incubation
Seven batch microcosm experiments were done to isolate and identify microorganisms from source waters or sand filters that were able to biodegrade microcystin-LR (MC–LR), the most common and toxic variant in the environment. Experiments were done in 500-milliliter (mL) flasks containing either source waters or supernatants from sand/anthracite filters along with buffer and nutrient amendments (table 2). For pretreatment of solid-medium samples from sand/anthracite filters, 20 grams of sample was added to 200 mL of sterile, deionized water with a nutrient and salt amendment, modified from Sandman and Ecker (2014) (table 2). The suspension was placed on a rotary shaker for 45 minutes to remove attached microorganisms, then allowed to settle for 1 minute; the resultant supernatant was then filtered through a 5-micrometer (µm) filter to remove large particles, and the filtrate was used in subsequent experiments. Microcystin-LR was added in concentrations ranging from 18 to 80 µg/L. Flasks were prepared with the following treatments: (1) unfiltered source water with MC–LR added, (2) source water or sand/anthracite supernatant filtered through a 5-µm filter with MC–LR added, (3) source water or sand/anthracite supernatant filtered through a 0.2-µm filter with MC–LR added (abiotic control), and (4) source water or sand/anthracite supernatant with no MC–LR added (background control).
Table 2.
Nutrient medium used to prepare 200 mL of pretreatment buffer or microcosms to isolate microcystin biodegraders in 200-milliliter solution.[Nutrient mediums adapted from Sandman and Ecker (2014). mL, milliliter]
Flasks were incubated in a shaking water bath at 28 degrees Celsius (°C) for 14 days. Aliquots (12 mL) were removed at various intervals (0, 1, 2, 4, 8, and 14 days), stored in a −80 °C freezer, and analyzed by enzyme-linked immunosorbent assay (ELISA) in batch for microcystin concentrations. At each time step, a second aliquot (500 microliters [μL]) was mixed with approximately 100 μL of sterile glycerol in a 1.5-mL microcentrifuge tube and frozen at −80 °C for later culture analysis. Based on observed decreases in microcystin concentrations, aliquots were selected to later be cultured to identify and isolate potential microcystin degraders. Pure culture isolates were (1) screened for the ability to metabolize microcystin as the only carbon source and (2) tested for the presence of the mlrA gene. Based on the abilities of isolates to metabolize microcystin as the only carbon source, a select group of the most promising microcystin biodegraders were tested for biofilm formation potential and identified by 16S rRNA sequencing.
Microcystin Concentration Measurement
Microcosm aliquots were analyzed for microcystins by ELISA based on procedures described in Ohio Environmental Protection Agency (2015b). Aliquots were freeze-thawed three times at −70 °C/80 °C to lyse cells and release intact microcystin, filtered through 0.45-µm glass-fiber filters, and added to a microtiter plate kit with ELISA reagents per manufacturer’s instructions (Microcystin-ADDA ELISA kit, Abraxis LLC, Warminster, Pa.). The immunoassay is a direct competitive ELISA in which a toxin in a sample and an antibody conjugate compete for binding sites of antibodies in solution; then, upon the addition of a substrate reagent to the solution, a color signal is generated. Each aliquot was analyzed in duplicate, with each aliquot’s absorbance value read by microplate reader at 450 nanometers, from which the mean absorbance value was calculated. The quality-assurance/quality-control measures include initial demonstration of capability, along with establishment of benchmarks, such as a method detection limit (at 0.3 µg/L), calibration standards and standard curve requirements, a laboratory diluent blank, a positive control, and acceptable coefficients of variation in replicates (USGS Ohio Water Microbiology Laboratory, accessed November 2017 at https://oh.water.usgs.gov/micro_qaqc_methods_for_cyanobacterial_toxins.htm).
Culture Isolations
In microcosms where the concentration of microcystin decreased over time, frozen culture aliquots from 0-time, 1-day, 4-day, and 8-day flasks were thawed, and 100 µL of the culture aliquot was spread-plated on R2A agar plates (BD Difco, Franklin Lakes, N.J., Fisher, catalog no. 218263). After 7 to 14 days incubation at 28 °C, the plates were inspected for phenotypic differences in colony morphology and for an increase in the same colony morphology between the 0-time/1-day plates and the 4-day/8-day plates. When differences in colony abundance or colony types were observed, approximately 10 individual colonies from 4-day/8-day plates were selected for isolation and enrichment as potential biodegraders. Colonies were isolated on lysogeny broth (LB) agar plates (BD Difco, Fisher, catalog no. DF0446-07-5) by three-phase streak, grown in LB broth for 3–5 days at 28 °C, and then frozen in LB broth plus 20-percent glycerol for further testing. Isolates were assigned a name based on the abbreviated name of the site where the bacteria were collected, followed by the alphabetical letter in order of isolation from the R2A agar plates.
Presence of the mlrA Gene
Isolates from six of seven microcosm experiments were screened for the presence of mlrA, a gene associated with microcystin biodegradation (Bourne and others, 2001). Pure culture freezer stocks were grown in tryptic soy broth (TSB) (TSB, Becton-Dickinson, Franklin Lakes, N.J.) at 28 °C until turbid (up to 2 days). After sufficient growth was achieved, 200 µL of each culture was extracted by using a silica-based DNA extraction kit (Qiagen, Hilden, Germany, catalog no. 69506). Quantitative polymerase chain reaction (qPCR) was used to test for the presence of the mlrA gene by using a primer-and-probe set with run conditions listed in Hoefel and others (2009). Each culture extract was run in duplicate, and synthetic plasmid standards (Integrated DNA Technologies, Coralville, Iowa, custom gene synthesis) were included on each qPCR plate. In addition, a matrix spike was performed on a subset of cultures to ensure there was no matrix inhibition. Standard curve information for qPCR analysis is reported in appendix 1, table 1.2.
Screening for Evidence of Microcystin Biodegradation
The isolates cultured from flasks that showed observed decreases in microcystin concentrations were tested for MC–LR biodegradation potential by means of a colorimetric microplate method that measures cellular respiration, adapted from Manage and others (2009). For enrichment cultures, frozen isolates were inoculated into 10 mL of enrichment media. Initial enrichments for biodegradation tests included (1) minimal medium with MC–LR and (2) TSB with 0, 20, 100, or 2,000 µg/L MC–LR; however, both MC–LR alone and increased concentrations of MC–LR with TSB exhibited inhibitory effects on isolate growth (data not shown). As a result, enrichment media used for MC–LR microplate biodegradation tests were (1) TSB prepared per manufacturer’s recommendations and (or) (2) half-strength TSB with 5 µg/L MC–LR. The enrichment medium used was a compromise of ensuring expression of MC–LR degradative genes of interest while still yielding sufficient microbial growth for degradation experiments.
After 48 hours of incubation at 28 °C, cells were centrifuged at 1,000 × g (gravitational force) for 15 minutes, and the pellet was washed with the amended buffer (table 2). After the wash procedure was repeated, cultures were incubated overnight in a shaking water bath at 28 °C with gentle agitation in 5 mL of buffer to remove exogenous sources of carbon. To account for different rates of growth during enrichment, cell density was estimated on a microplate reader (BioTek Instruments, Winooski, Vt., USA, Model EPOCH2) and normalized between cultures (A590=0.35). Diluted isolates were then assessed for the ability to replicate when available sources of carbon were limited to MC–LR.
The Biolog MT2 MicroPlate (Biolog, Hayward, Calif.) method detects evidence of cellular respiration through proportional reduction of a tetrazolium dye, which yields a purple color whose absorbance is read by a microplate reader spectrophotometrically at 590 nanometers. This method requires the user to supply a carbon source to allow for cellular respiration; therefore, production of this color change when exogenous sources of carbon are limited to MC–LR allows the user to infer degradation in a high-throughput format. Wells were inoculated with diluted isolates in triplicate and received MC–LR at a final concentration of 20 µg/L, corresponding to the no-contact recreational advisory level set by the Ohio Environmental Protection Agency at the time of the study (Ohio Environmental Protection Agency, 2015a). Paired blanks of the isolates, receiving no MC–LR, were also prepared in triplicate and used to account for background absorbance levels. Plates were incubated at 28 °C and read spectrophotometrically at regular intervals for up to 96 hours post-inoculation. To quantify the biodegradation potential of each isolate, mean absorbance at each time step in the background control was subtracted from mean absorbance in the isolate test wells. Escherichia coli (American Type Culture Collection, 700891) and a strain of Stenotrophomonas rhizophila capable of degrading MC–LR (obtained from Dr. Xiaozhen Mou, Kent State University, Kent, Ohio) were included in each analysis and served as negative and positive controls, respectively.
Ten isolates, identified as promising MC–LR biodegraders through the MT2 MicroPlate screening process, were selected for further identification and testing. Isolates with high peak absorbance values were selected, and if several isolates showed similar absorbance patterns across time-step intervals, one isolate was selected to represent a group with similar patterns.
After incubation in an additional MT2 MicroPlate, with MC–LR as the sole carbon source, the 10 isolates were tested to confirm biodegradation through ELISA analysis. Isolates were analyzed in seven replicate wells—with E. coli and a strain of S. rhizophila serving as negative and positive controls, respectively—and incubated at 28 °C, then read spectrophotometrically at regular intervals for up to 96 hours after inoculation. The microcystin concentration at 0-time, and 8-day was analyzed by ELISA.
Sequencing for Taxonomic Identification of Isolates
The 10 selected isolates and 14 additional isolates (selected randomly to include all sampling sites) were taxonomically identified by 16S rRNA sequencing. Pure culture freezer stocks were grown in TSB at 28 °C until turbid (up to 2 days). After sufficient growth was achieved, 200 µL of each culture was extracted using a silica-based DNA isolation kit (Qiagen, catalog no. 69506). Using universal 16S primers 27F and 1492R (Weisburg and others, 1991), polymerase chain reaction (PCR) testing was run for each extracted isolate. PCR products were run on a fast gel electrophoresis system (Lonza, Basel, Switzerland, catalog no. 57067) to confirm product length. The PCR products were purified by using a rapid PCR purification kit (Qiagen, catalog no. 28104) and then sent to a laboratory for Sanger sequencing (Sanger and others, 1980) (GENEWIZ, South Plainfield, N.J.). The returned sequences were run through the Ribosomal Database Project (Wang and others, 2007) to determine isolate genus (and possible species) identifications.
Biofilm Production Assay
The 10 selected isolates were tested for biofilm formation potential based on procedures described in Djordjevic and others (2002) and Merritt and others (2005). Pure culture freezer stocks were grown overnight in TSB for 24 hours at 28 °C. Pseudomonas aeruginosa 10145 was used as a positive control, and 10-percent TSB was used as a negative control. A diluted culture was prepared (100 µL of culture with 9.9 mL of 10-percent TSB), and 200 mL was added into 8 replicate wells of a 96-well plate. The initial absorbance (optical density of 595 nanometers [OD595]) of each well was recorded, and the plate was incubated for 48 hours at 28 °C. The 48-hours OD595 of each well was read, media and planktonic cells were removed by gentle pipetting, and the wells were dried for 45 minutes. After the wells were dry, the attached biofilm cells were stained with 250 µL of 1-percent crystal violet for 20 minutes. After excess crystal violet was removed and the wells were washed three times with sterile deionized water, the plate was air dried. After 24 hours, the dye was solubilized with 250 µL of 95-percent ethanol; the contents were transferred to a new microtiter plate; and the OD595 of crystal violet remaining in each well was read. The mean absorbance of eight wells was calculated. To quantify potential biofilm production for each isolate, the mean destained absorbance of the isolate was subtracted from the mean destained absorbance of the 10-percent TSB negative control.
Data Management and Statistical Analysis
Raw data reported herein and used for statistical analysis are available in the USGS data release by Francy and Cicale (2024). Spearman’s correlation coefficient was used to assess the relation between the destained absorbance and the 48-hour growth absorbance in biofilm tests. Statistical comparisons among different isolates for biofilm formation were made by using notched boxplots. Notched boxplots are useful for comparing medians among multiple groups (Chambers and others, 1983; McGill and others, 1978). If the notches for two boxes do not overlap, there is strong evidence (approximately 95-percent confidence) that the medians differ.
Results
Microcystin Degradation in Microcosms With Samples From Drinking-Water-Plant Source Waters and Sand/Anthracite Filters
Concentrations of microcystins in samples collected from source waters and the water or solid medium from sand filters ranged from less than 0.3 to 5.5 µg/L (table 1). Results from three microcosm experiments showed at least a 60-percent reduction of microcystin by 14 days (fig. 2A through C); the percentages of microcystin remaining in Inland 1 (fig. 2A) and Lake Erie 2 (fig. 2B) source waters showed similar patterns. For unfiltered source water (blue circles in fig. 2), microcystin degradation was nearly complete at 4 days, with 7.0 percent and 11.3 percent remaining in the inland 1 and Lake Erie 2 source waters, respectively. For the 5-µm-filtered source waters (green squares), results indicated increases in microcystin concentrations at 2 or 4 days—possibly due to inherent method variability of ELISA—followed by microcystin decline and nearly complete degradation at 8 days for Inland 1 (12.3 percent) or 14 days for Lake Erie 2 (14.1 percent). In the abiotic controls, the percent of microcystin remaining after 14 days was 102 percent for Inland 1 and 70.4 percent for Lake Erie 2. Degradation was slower and not as complete in the Lake Erie 1 sand/anthracite filter medium, with 40 percent of microcystin remaining after 14 days. There was no degradation in the background controls, where initial microcystin concentrations were less than 1.0 µg/L.
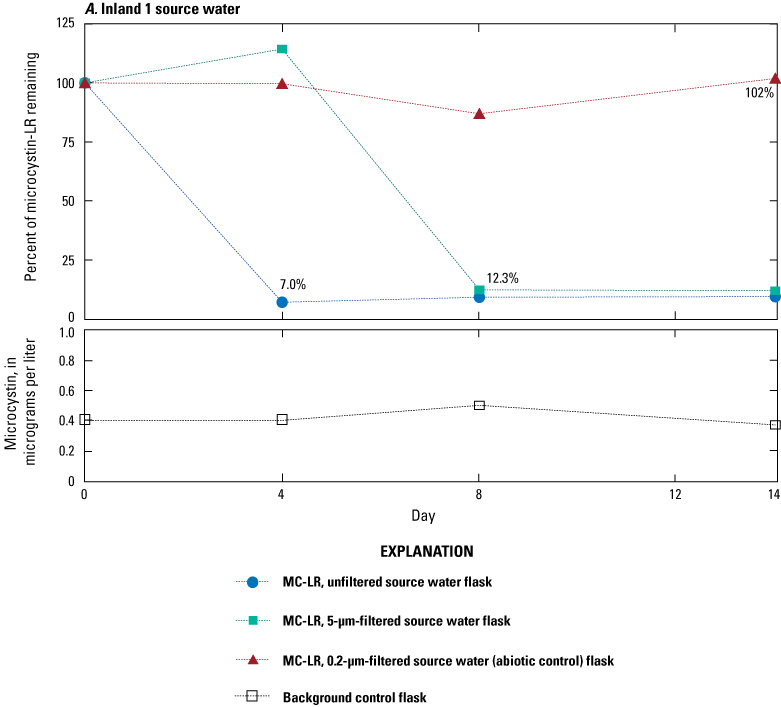
Graphs showing percentage of microcystin-LR (MC–LR) remaining in microcosm flasks as determined by enzyme-linked immunosorbent assay in A, Inland 1 source water (sampled August 17, 2015), B, Lake Erie 2 source water (sampled October 6, 2015), and C, Lake Erie 2 sand/anthracite filter (sampled July 13, 2016). Blue circles indicate unfiltered source water with MC–LR added, green squares indicate source water or supernatant filtered through a 5-micrometer (µm) filter with MC–LR added, red triangles indicate source water or supernatant filtered through a 0.2-µm filter with microcystin added (abiotic control), and open squares indicate source water or supernatant filtrate with no microcystin added (background control). Because of low concentrations in the background control, these data are presented as microcystin concentrations over time instead of percent remaining. Data from Francy and Cicale (2024).
Isolation and Identification of Potential Microcystin Biodegraders
From the microcosm experiments, 97 colonies were selected, isolated, and frozen (app. 1, table 1.1). Of those isolates, 11 were unable to grow on either LB or TSB and therefore were not further tested. Eighty-six isolates were screened for the presence of the mlrA gene. The mlrA gene was not detected in any of the isolates tested, and no matrix inhibition was found.
Sixty-seven isolates were successfully enriched with or without MC–LR and screened for MC–LR biodegradation potential on MT2 microplates, with MC–LR as the only carbon source. TSB and half-strength TSB with 5-µg/L MC–LR enrichment medium resulted in the highest peak absorbance for 31 and 36 isolates, respectively (app. 1, table 1.1). The time to reach peak absorbance (representing MC–LR degradation) varied by isolate and ranged from 1 to 96 hours. Isolate peak absorbance values ranged from 0.024 absorbance units (AU) at 6 hours for a Lake Erie 2 isolate (LE2.d) to 1.0176 AU at 24 hours for a Lake Erie 1 filter isolate (LE1F.r) (app. 1, table 1.1). Peak absorbance values for the E. coli negative control were 0 AU for E. coli enriched on TSB with 5 µg/L MC–LR and 0.060 AU for E. coli enriched on TSB alone. Absorbance values less than or equal to 0.060 AU for isolates grown on TSB alone, therefore, are unlikely to indicate any biodegradation potential (these values are indicated in app. 1, table 1.1). The average peak absorbance for all 67 isolates was 0.146 AU.
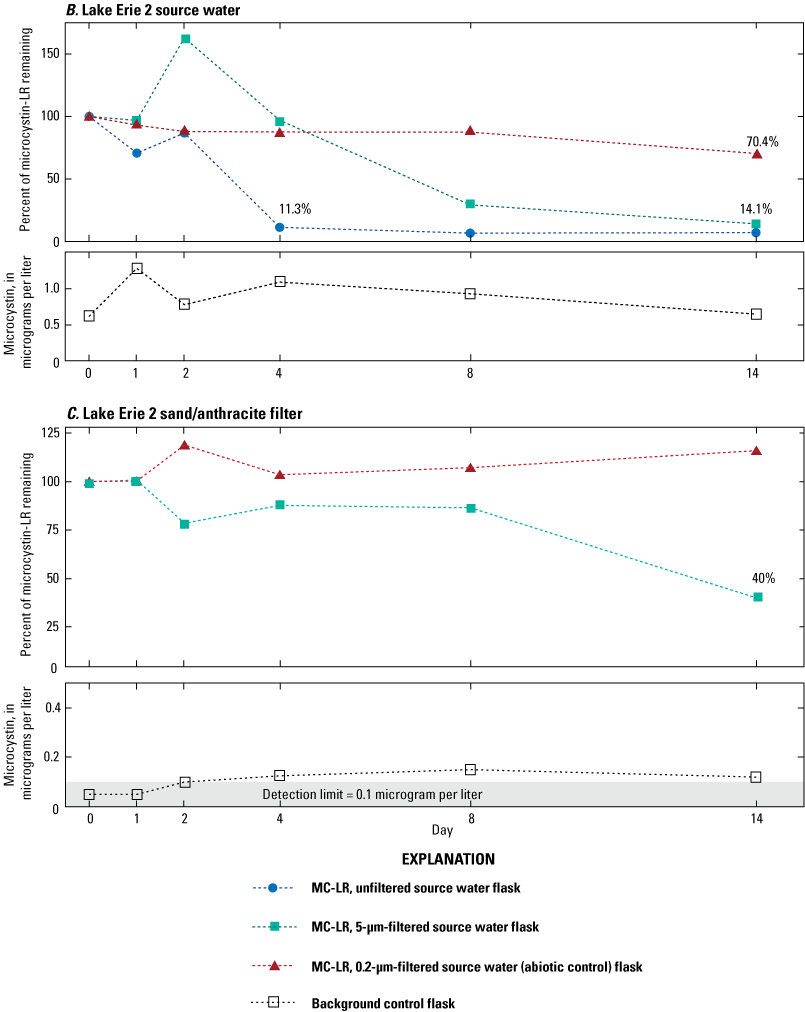
Ten isolates with high peak absorbance values (greater than 0.1 AU) in the MC–LR MT2 microplate screening were selected for biofilm testing and sequencing; these isolates were considered “promising” microcystin biodegraders in that they were capable of respiration when exogenous sources of carbon were limited to MC–LR (table 3). The promising isolates were from both the Inland and Lake Erie sites; seven isolates were from source waters, and three were from the water or solid medium from sand/anthracite filters. Isolates exhibited different rates and patterns of growth, indicating different rates of MC–LR degradation (fig. 3). Of the three isolates from a Lake Erie plant sand/anthracite filter (fig. 3A), two had similar growth patterns and showed peak absorbance values at 96 hours (LE1f.h and LE3F.g), and one showed the highest peak of any isolate at 24 hours (LE1F.r). The four isolates from Inland 1 had different growth patterns (fig. 3B), and absorbance values peaked at 96 hours for three isolates and 48 hours for one isolate (Inland1.b). The isolate Inland1.n had a similar growth pattern to that of the positive control, S. rhizophila. The three remaining isolates were from different sites and showed different peak absorbance values at different time steps (fig. 3C).
Table 3.
Isolates identified as promising microcystin biodegraders, from samples collected in the Western Basin of Lake Erie, 2015–16.[Data from Francy and Cicale (2024). Peak mean absorbance was calculated by subtracting mean absorbance of isolate growing on microcystin-LR (MC–LR) as the only carbon source from mean absorbance of isolate with no MC–LR added. Biofilm formation was calculated by subtracting the mean destained absorbance of the isolate from the mean destained absorbance of the negative control. nm, nanometer; AU, absorbance units; d, day; TSB, tryptic soy broth; @, at; h, hour; µg/L, microgram per liter]
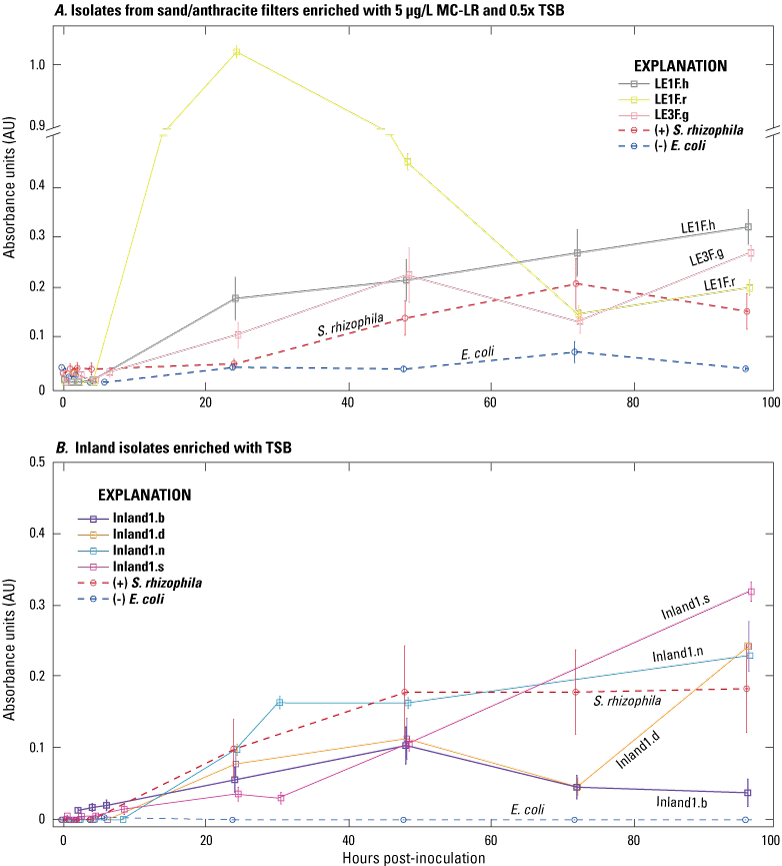
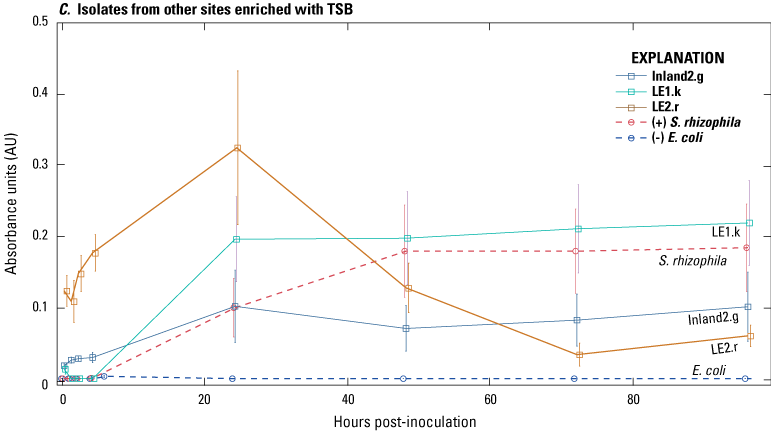
Spectrophotometric time series of 10 isolates cultured with microcystin-LR (MC–LR) as the sole source of exogenous carbon in MT2 microplates: A, isolates from sand/anthracite filters from Lake Erie enriched with 5 micrograms per liter (µg/L) MC–LR and 0.5× tryptic soy broth (TSB); B, isolates from Inland 1 source waters enriched with TSB; and C, isolates from other Lake Erie and Inland 2 source water sites enriched with TSB. Absorbance at 590 nanometers from wells with MC–LR as the only carbon source was subtracted from wells without MC–LR. Bars indicate ± the standard error of the mean of three replicate wells. Stenotrophomonas rhizophila is the positive control (+), and Escherichia coli is the negative control (−). Data from Francy and Cicale (2024).
The 10 promising isolates and 14 additional isolates (randomly selected to include all sampling sites) were identified by sequencing. The 24 isolates were identified as follows (app. 1, table 1.1): 8 Pseudomonas spp., 4 Aeromonas veronii, 3 Acidovorax spp., 3 Acinetobacter johnsonii, 2 Comamonas spp., 1 Ensifer adhaerens, 1 Chryseobacterium jejuense, 1 Variovorax spp., and 1 Pimelobacter simplex. The 10 selected isolates included isolates identified as Pseudomonas spp., Aeromonas veronii, Acidovorax spp., Acinetobacteria johnsonii, and Chryseobacterium jejuense (table 3).
The 10 promising isolates were screened in a second MT2 microplate spiked with 5 µg/L of MC–LR as the only carbon source for confirmation of degradation. Concentrations of MC–LR were analyzed by ELISA at the beginning and at the end of the 8-day incubation period (fig. 4). Microcystin concentration decreased for the positive control, S. rhizophila, from 4.80 to 2.53 µg/L, and the microcystin concentration of the negative control, E. coli, decreased from 3.51 to 2.13 µg/L (fig. 4A). Initial microcystin concentrations of isolate wells ranged from 3.00 to less than 5.09 µg/L. Final concentrations of isolate wells ranged from 2.13 to 4.62 µg/L (fig. 4A). The positive control and two isolates (LE2.r, Inland1.d) had less than 60 percent of their initial concentrations of MC–LR remaining at the end of the 8-day incubation period (fig. 4B).
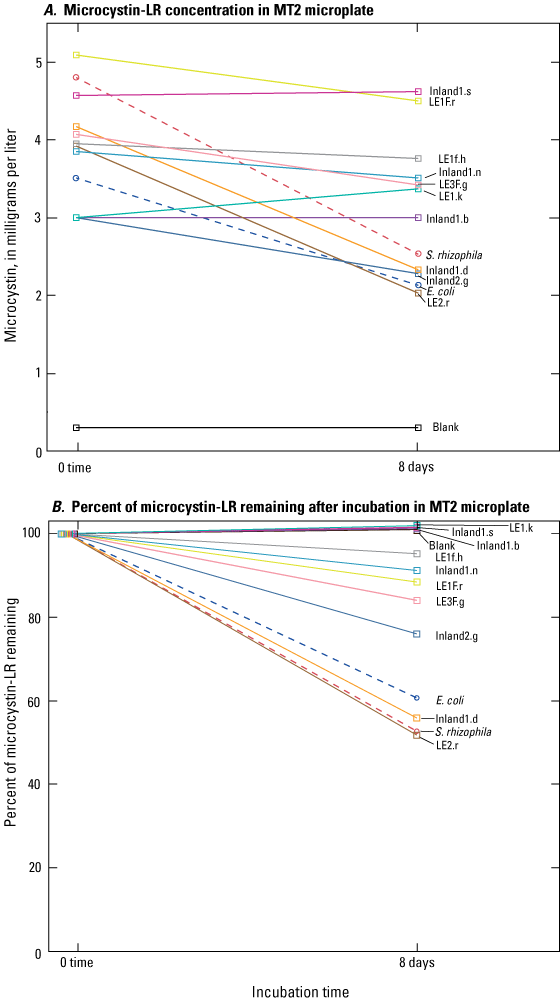
Microcystin concentrations and percent remaining in isolate wells from Lake Erie source waters, Lake Erie sand/anthracite filters, and inland lake source waters, incubated for 8 days in MT2 microplate; A, microcystin-LR concentrations in isolate wells after 8-day incubation; B, percent remaining of microcystin-LR concentrations in isolate wells after 8-day incubation. E. coli; Escherichia coli, E. coli; S. rhizophila, Stenotrophomonas rhizophila. Data from Francy and Cicale (2024).
Biofilm Formation Potential
The 10 promising isolates were screened for biofilm formation in 8 replicate wells of a 96-well plate. For this procedure, after 48-hour growth (“48-hour growth absorbance”), planktonic cells were removed, and the remaining biofilms were stained, washed, and destained (“destained absorbance”). No significant correlation was found between the destained absorbance and 48-hour growth absorbance (rho=0.18, p-value=0.5567, data not shown); the lack of statistical correlation indicates that biofilm formation was independent of cell growth. Biofilm production was quantified by subtracting the mean destained absorbance of the isolate from the mean destained absorbance of the negative control (table 3). Higher biofilm production is associated with higher destained absorbance values. Five isolates (Inland1.n, LE2.r, Inland2.g, Inland1.d, and LE1F.r) showed potential for biofilm production in that the median destained absorbance in replicate wells was significantly greater than the median destained absorbance of the 10-percent TSB negative control (fig. 5); however, for Inland1.n, the difference was not as large as for the other isolates. Because planktonic cells were removed before staining/destaining, the positive values for the five isolates demonstrate the potential for biofilm production and represent cells that remained attached to the bottom of the plate that are likely biofilm producers.
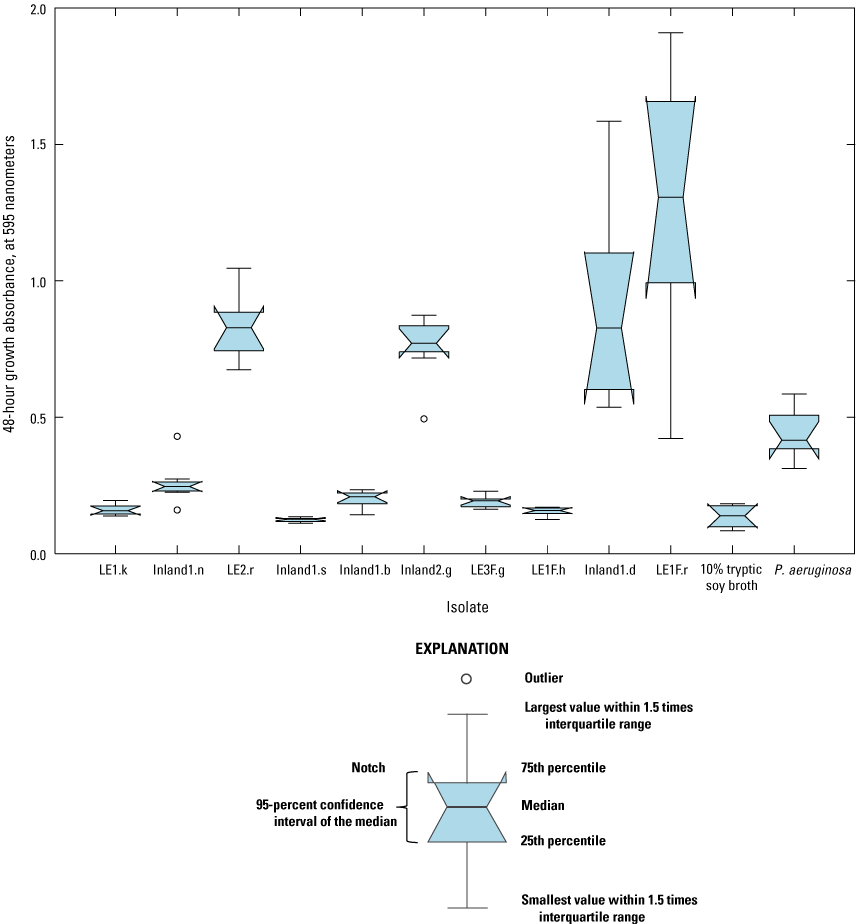
Graph showing potential biofilm production of 10 isolates from Lake Erie source waters, Lake Erie sand/anthracite filters, and inland lake source waters. To quantify potential biofilm production for each isolate, the mean destained absorbance of the isolate was subtracted from the mean destained absorbance of the negative control. Absorbance was read at 595 nanometers in microtiter plates. Notches of the boxplots indicate a 95-percent confidence interval from the median. P. aeruginosa, Pseudomonas aeruginosa. Data from Francy and Cicale (2024).
Discussion
The results of this study provide insights into the potential of microorganisms in source waters and sand/anthracite filters from drinking-water plants in the Western Basin of Lake Erie to degrade microcystin, produce biofilms, and possess the mlrA gene (found by other researchers to encode for the protein responsible for cleaving the cyclic structure of microcystin [Bourne and others, 2001]). The isolation of potential microcystin-degrading bacteria and their identification by gene sequencing are also reported.
Seven microcosm experiments were done to assess microcystin biodegradation in source water or in the water or filter medium from sand/anthracite filters collected at drinking-water plants in the Lake Erie watershed. At least a 60-percent reduction of microcystin concentrations by 14 days occurred in microcosms derived from three different Lake Erie-area sources—water from a storage reservoir supplied by an inland stream, Lake Erie water, and solid medium from a sand/anthracite filter. Edwards and others (2008) found that microcystins were degraded by microorganisms in a variety of river and lake waters, and the potential to degrade microcystin was not dependent on prior exposure to the toxin.
Eighty-six isolates from six of the seven microcosm experiments were screened for the presence of the mlrA gene. The mlrA gene was not detected in any of the isolates tested, and laboratory controls indicate that the lack of detection was not due to matrix inhibition. Similarly, Thees and others (2019) did not find the mlrABCD cluster degradation genes in 13 Lake Erie isolates tested. The mlrA gene had previously been identified in microcystin biodegraders from Australian waters (Hoefel and others, 2009) and had been found elsewhere in the world (Jimbo and others, 2010; Li and others, 2011; Lezcano and others, 2016). As suggested in a study by Mou and others (2013), two possible reasons why mlrA was not found in this study are that (1) the primer-and-probe set was developed by using Sphingomonas and Sphingopyxis species and therefore may be inefficient against other taxa that contain the mlr pathway and (2) the bacterial taxa that degraded microcystin in this study may contain alternate genes or pathways for degradation. Edwards and others (2008) found novel biodegradation intermediates in a study of Scottish waters, and such findings indicate that a broad selection of microorganisms and (or) variety of enzymatic pathways are capable of degrading microcystin. Dziga and others (2017) identified several MC–LR biodegradation products formed by naturally occurring biodegrading bacteria in rivers and lakes in Poland. In the Western Basin of Lake Erie, more work is needed to identify specific degradation pathways and cellular mechanisms involved with MC–LR.
A high-throughput method in a microplate format with MC–LR as the only carbon source was used to identify potential microcystin biodegraders. Some isolates degraded MC–LR better when initially enriched with MC–LR, whereas others did not. The E. coli negative control produced some absorbance after enrichment with TSB. This may have been from catabolism or residual TSB, which would still produce oxidation. Ten isolates that showed absorbance values at 590 nanometers that were greater than 0.1 AU (a threshold indicating growth using MC–LR as a sole carbon source) were identified as “promising” microcystin biodegraders and selected for further testing.
The analysis of microcystin concentration from the second MT2 microplate experiment with MC–LR as the only carbon source shows two isolates, Inland1.d and LE2.r, have the potential for degradation of microcystin compared with the positive control. The percent of microcystin remaining in the Inland1.d MT2 microplate wells was 55.9 percent, 51.8 percent in LE2.r wells, and 52.7 percent in the positive control wells. The final concentration of microcystin in the positive control was less than the negative control, with 60.7 percent of microcystin remaining. The decrease in the negative control could be due to the natural degradation of the MC–LR over the 8-day incubation period and the variability of concentration by the ELISA method. The other isolates did not show a substantial difference from the final concentration of the E. coli negative control, with greater than 76 percent of microcystin remaining, although the concentration decreased over the 8-day incubation. The variability inherent in the ELISA method and in the S. rhizophila positive control and E. coli negative control limits the interpretation of the assay. Given the limitations of the ELISA method, MT2 microplate experiments could be confirmed with high-performance liquid chromatography to determine exact microcystin concentrations.
In the current study, 4 of the 10 promising isolates showed substantial potential for biofilm formation when compared to the negative control. Assemblages of biodegrading bacteria in biofilms offer advantages over the use of free cells to remove pollutants, such as microcystin (Li and others, 2017). Biofilms protect cells from predators and offer a stable, nutrient-rich environment for growth and replication. Given the importance of biofilms, biological filtration has been suggested as the best way to implement biodegradation of cyanobacterial toxins (Ho and others, 2012). In a pilot-scale field study, Grützmacher and others (2002) showed that slow sand filtration was an effective method for biodegradation of dissolved and cell-bound microcystins. Biodegradation of microcystins by sand filtration was first demonstrated in laboratory column studies by Ho and others (2006), in which the time required for a biofilm to be established and microcystin degradation to commence was less than 4 days. A microcystin-degrading bacterium was isolated from an anthracite biofilter from Lake Mead, Arizona and Nevada, and investigators determined that biodegradation ability was affected by other types of organic matter and toxin concentrations in the influent water (Eleuterio and Batista, 2010). Jimbo and others (2010) confirmed that microcystin-degrading bacteria were present in the biofilm of a biological treatment facility in Japan.
Twenty-four isolates, including the 10 promising microcystin-biodegrading isolates, were identified to the genus or species level by rRNA sequencing (app. 1, table 1.1). The 24 isolates showed potential to grow on MC–LR as the sole carbon source in microplates. They were identified as follows: 15 isolates were γ-proteobacteria (Pseudomonas, Aeromonas, and Acinetobacter), 6 isolates were β-proteobacteria (Acidovorax, Comamonas, and Variovorax), 1 isolate was an α-proteobacterium (Ensifer adhaerens), 1 isolate was a flavobacterium in the phylum Bacteroidetes (Chryseobacterium), and 1 isolate was in the phylum Actinobacteria (Pimelobacter). In another Lake Erie study (Thees and others, 2019), investigators identified potential microcystin biodegraders from 12 different families; in common with the current study were the genera Pseudomonas and Acinetobacter. Mou and others (2013) identified a diverse array of bacterial phyla in Lake Erie waters that showed changes in the RNA transcription profile of the microcosms with microcystin as compared to the negative controls; isolates with this response to microcystin included the Bacteroidetes, Actinobacteria, and the Proteobacteria classes found in the current study.
Over half of the 24 isolates in the study (including 7 of the 10 promising isolates) were in the class γ-proteobacteria in the genera Pseudomonas, Aeromonas, and Acinetobacter. The γ-proteobacteria include the fecal indicator E. coli, pathogens such as Salmonella and Vibrio, and nonpathogenic or opportunistic bacteria found in soil and water with a wide range of metabolic capabilities. Other researchers have identified these three genera of γ-proteobacteria as microcystin degraders; examples include Pseudomonas aeruginosa from a lake in Japan (Takenaka and Watanabe, 1997), Aeromonas sp. from a reservoir in central Poland (Mankiewicz-Boczek and others, 2015), and Acinetobacter sp. from Lake Tai Hu, China (Li and others, 2016). Another γ-proteobacteria, Morganella morganii, capable of degrading MC–LR, was isolated from a biofilter in Lake Mead, Arizona and Nevada. In addition, a microcystin-degrading Pseudomonas sp. was found in water collected from Lake Mead (Eleuterio and Batista, 2010).
Five potential microcystin biodegraders (Acidovorax, Comamonas, and Variovorax) identified in the present study were in the class β-proteobacteria, with 2 of the 10 promising isolates identified as Acidovorax. To our knowledge, this is the first report of Acidovorax, Comamonas, and Variovorax as potential microcystin biodegraders. The Comamonas and Variovorax isolates, however, had low absorbance values and thus lower biodegradation potential (less than 0.1 AU) and so were not among the 10 promising isolates screened for biofilm formation potential. In other studies, β-proteobacteria in the Burkholderiales order have been identified as microcystin biodegraders including a Burkholderia sp. from a coastal lagoon in Brazil (Lemes and others, 2008) and Ralstonia solanacearum from Lake Dian Chi, China (Zhang and others, 2011).
In the current study, only one isolate was identified in the α-proteobacteria class (Ensifer adhaerens), with an absorbance value in MT2 microplates of just over 0.1 AU. The Sphingomonadaceae, a family in the α-proteobacteria class, were cited as the group of bacteria most frequently identified to date as microcystin biodegraders (Gągała and Mankiewicz-Boczek, 2012); however, in the present study, no Sphingomonadaceae were found among the biodegraders. A Sphingomonas sp. was isolated from an Australian river and identified as the first bacterium capable of degrading microcystin (Jones and others, 1994). Microcystin-biodegrading Sphingomonas spp. were later isolated in waters in Japan (Park and others, 2001), Argentina (Amé and others, 2006), and New Zealand (Somdee and others, 2013).
One isolate was identified as an Actinobacteria (Pimelobacter), with an absorbance value (0.079 AU) only slightly greater than that of the negative control (0.060 AU). Manage and others (2009) isolated several different Actinobacteria genera (Arthrobacter, Brevibacterium, and Rhodococcus) from surface waters in Scotland, the first report of microcystin degraders not belonging to the Proteobacteria phylum. From Lake Okeechobee, Florida, Ramani and others (2012) identified two bacterial isolates that degraded MC–LR, one of which was an Actinobacteria (Microbacterium sp.).
One notable isolate was a flavobacterium in the phylum Bacteroidetes (Chryseobacterium jejuense). This isolate showed the highest absorbance of any isolate tested (1.02 AU). To our knowledge, this is the first Bacteroidetes to be identified specifically as a microcystin biodegrader. Although Wu and others (2013) isolated a novel species of Chryseobacterium, with the proposed name Chryseobacterium tailhuense, from decomposing algal mats in Lake Tai Hu, China, the strain’s microcysin-biodegrading properties were not investigated.
Summary
Microcystin-biodegradation potential was indicated in microorganisms found in Lake Erie waters and in water or solid medium from sand filters in drinking-water treatment plants in the Western Basin of Lake Erie. The mlrA gene, which encodes for the enzyme responsible for cleaving the cyclic structure of microcystin, was not detected in any of the isolates tested. Four of the 10 most promising microcystin-biodegrading isolates showed substantial potential biofilm formation, a necessary component for implementing biodegradation as a control strategy in drinking-water plants. The Lake Erie isolates were identified mainly as proteobacteria, along with one isolate each from the phyla Actinobacteria and Bacteroidetes. In Lake Erie source waters, more work would need to be done to identify microcystin-biodegradation pathways and products and to confirm biodegradation rates in pure culture isolates.
References Cited
Amé, M.V., Echenique, J.R., Pflugmacher, S., and Wunderlin, D.A., 2006, Degradation of Microcystin-RR by Sphingomonas sp. CBA4 isolated from San Roque reservoir (Córdoba–Argentina): Biodegradation, v. 17, p. 447–455, accessed October 5, 2017, at https://doi.org/10.1007/s10532-005-9015-9.
Aylward, F.O., McDonald, B.R., Adams, S.M., Valenzuela, A., Schmidt, R.A., Goodwin, L.A., Woyke, T., Currie, C.R., Suen, G., and Poulsen, M., 2013, Comparison of 26 sphingomonad genomes reveals diverse environmental adaptations and biodegradative capabilities: Applied and Environmental Microbiology, v. 79, no. 12, p. 3724–3733. [Also available at https://doi.org/10.1128/AEM.00518-13.]
Bourne, D.G., Riddles, P., Jones, G.J., Smith, W., and Blakeley, R.L., 2001, Characterisation of a gene cluster involved in bacterial degradation of the cyanobacterial toxin microcystin LR: Environmental Toxicology, v. 16, no. 6, p. 523–534. accessed March 26, 2019, at https://doi.org/10.1002/tox.10013.
Djordjevic, D., Wiedmann, M., and McLandsborough, L.A., 2002, Microtiter plate assay for assessment of Listeria monocytogenes biofilm formation: Applied and Environmental Microbiology, v. 68, no. 6, p. 2950–2958, accessed September 9, 2016, at https://doi.org/10.1128/AEM.68.6.2950-2958.2002.
Dziga, D., Maksylewicz, A., Maroszek, M., Budzyńska, A., Napiorkowska-krzebietke, A., Toporowska, M., Grabowska, M., Kozak, A., Rosińska, J., and Meriluoto, J., 2017, The biodegradation of microcystins in temperate freshwater bodies with previous cyanobacterial history: Ecotoxicology and Environmental Safety, v. 145, p. 420–430., accessed November 30, 2018, at https://doi.org/10.1016/j.ecoenv.2017.07.046.
Edwards, C., Graham, D., Fowler, N., and Lawton, L.A., 2008, Biodegradation of microcystins and nodularin in freshwaters: Chemosphere, v. 73, no. 8, p. 1315–1321, accessed July 31, 2015, at https://doi.org/10.1016/j.chemosphere.2008.07.015.
Eleuterio, L., and Batista, J.R., 2010, Biodegradation studies and sequencing of microcystin-LR degrading bacteria isolated from a drinking water biofilter and a fresh water lake: Toxicon, v. 55, no. 8, p. 1434–1442, accessed March 24, 2016, at https://doi.org/10.1016/j.toxicon.2010.02.020.
Francy, D.S., and Cicale, J.R., 2024, Microcosm experiment data of microcystin-degrading bacteria in Lake Erie source waters and drinking-water plants, 2015–18: U.S. Geological Survey data release, https://doi.org/10.5066/P9DL080Y.
Gągała, I., and Mankiewicz-Boczek, J., 2012, The natural degradation of microcystins (cyanobacterial hepatotoxins) in fresh water—The future of modern treatment systems and water quality improvement: Polish Journal of Environmental Studies, v. 21, no. 5, p. 1125–1139. [Also available at http://www.pjoes.com/The-Natural-Degradation-of-Microcystins-Cyanobacterial-Hepatotoxins-in-Fresh-Water,88849,0,2.html.]
Grützmacher, G., Böttcher, G., Chorus, I., and Bartel, H., 2002, Removal of microcystins by slow sand filtration: Environmental Toxicology, v. 17, no. 4, p. 386–394. [Also available at https://doi.org/10.1002/tox.10062.]
Ho, L., Meyn, T., Keegan, A., Hoefel, D., Brookes, J., Saint, C.P., and Newcombe, G., 2006, Bacterial degradation of microcystin toxins within a biologically active sand filter: Water Research, v. 40, no. 4, p. 768–774. [Also available at https://doi.org/10.1016/j.watres.2005.12.009.]
Ho, L., Sawade, E., and Newcombe, G., 2012, Biological treatment options for cyanobacteria metabolite removal—A review: Water Research, v. 46, no. 5, p. 1536–1548, accessed June 1, 2017, at https://doi.org/10.1016/j.watres.2011.11.018.
Hoefel, D., Adriansen, C.M.M., Bouyssou, M.A.C., Saint, C.P., Newcombe, G., and Ho, L., 2009, Development of an mlrA gene-directed TaqMan PCR assay for quantitative assessment of microcystin-degrading bacteria within water treatment plant sand filter biofilms: Applied and Environmental Microbiology, v. 75, no. 15, p. 5167–5169. [Also available at https://doi.org/10.1128/AEM.00036-09.]
Hu, L.B., Yang, J.D., Zhou, W., Yin, Y.F., Chen, J., and Shi, Z.Q., 2009, Isolation of a Methylobacillus sp. that degrades microcystin toxins associated with cyanobacteria: New Biotechnology, v. 26, nos. 3–4, p. 205–211, accessed June 29, 2017, at https://doi.org/10.1016/j.nbt.2009.09.001.
Jimbo, Y., Okano, K., Shimizu, K., Maseda, H., Fujimoto, N., Utsumi, M., and Sugiura, N., 2010, Quantification of microcystin-degrading bacteria in a biofilm from a practical biological treatment facility by real-time PCR: Journal of Water and Environment Technology, v. 8, no. 3, p. 193–201, accessed May 15, 2017, at https://doi.org/10.2965/jwet.2010.193.
Jones, G.J., Bourne, D.G., Blakeley, R.L., and Doelle, H., 1994, Degradation of the cyanobacterial hepatotoxin microcystin by aquatic bacteria: Natural Toxins, v. 2, no. 4, p. 228–235. [Also available at https://doi.org/10.1002/nt.2620020412.]
Lemes, G.A.F., Kersanach, R., da Silva Pinto, L., Dellagostin, O.A., Yunes, J.S., and Matthiensen, A., 2008, Biodegradation of microcystins by aquatic Burkholderia sp. from a South Brazilian coastal lagoon: Ecotoxicology And Environmental Safety, v. 69, no. 3, p. 358–365, September 28, 2017, at https://doi.org/10.1016/j.ecoenv.2007.03.013.
Lezcano, M.A., Morón-López, J., Agha, R., López-Heras, I., Nozal, L., Quesada, A., and El-Shehawy, R., 2016, Presence or absence of mlr genes and nutrient concentrations co-determine the microcystin biodegradation efficiency of a natural bacterial community: Toxins, v. 8, no. 11, 17 p., accessed June 15, 2017, at https://doi.org/10.3390/toxins8110318.
Li, H., Ai, H., Kang, L., Sun, X., and He, Q., 2016, Simultaneous Microcystis algicidal and microcystin degrading capability by a single Acinetobacter bacterial strain: Environmental Science & Technology, v. 50, no. 21, p. 11903–11911, accessed September 28, 2016, at https://doi.org/10.1021/acs.est.6b03986.
Li, J., Li, R., and Li, J., 2017, Current research scenario for microcystins biodegradation—A review on fundamental knowledge, application prospects and challenges: Science of the Total Environment, v. 595, p. 615–632, accessed September 20, 2017, at https://doi.org/10.1016/j.scitotenv.2017.03.285.
Li, J., Shimizu, K., Sakharkar, M.K., Utsumi, M., Zhang, Z., and Sugiura, N., 2011, Comparative study for the effects of variable nutrient conditions on the biodegradation of microcystin-LR and concurrent dynamics in microcystin-degrading gene abundance: Bioresource Technology, v. 102, no. 20, p. 9509–9517, accessed January 3, 2017, at https://doi.org/10.1016/j.biortech.2011.07.112.
Manage, P.M., Edwards, C., Singh, B.K., and Lawton, L.A., 2009, Isolation and identification of novel microcystin-degrading bacteria: Applied and Environmental Microbiology, v. 75, no. 21, p. 6924–6928. [Also available at https://doi.org/10.1128/AEM.01928-09.]
Mankiewicz-Boczek, J., Gągała, I., Jurczak, T., Jaskulska, A., Pawełczyk, J., and Dziadek, J., 2015, Bacteria homologus to Aeromonas capable of microcystin degradation: Open Life Sciences, v. 10, no. 1, p. 119–129, accessed September 28, 2017, at https://doi.org/10.1515/biol-2015-0012.
McGill, R., Tukey, J.W., and Larsen, W.A., 1978, Variations of box plots: The American Statistician, v. 32, no. 1, p. 12–16. [Also available at https://doi.org/10.1080/00031305.1978.10479236.]
Merritt, J.H., Kadouri, D.E., and O’Toole, G.A., 2005, Growing and analyzing static biofilms: Current Protocols in Microbiology, 00, 1B.1.1–1B.1.17, accessed June 7, 2017, at https://doi.org/10.1002/9780471729259.mc01b01s00.
Mou, X., Lu, X., Jacob, J., Sun, S., and Heath, R., 2013, Metagenomic identification of bacterioplankton taxa and pathways involved in microcystin degradation in Lake Erie: PloS One, v. 8, no. 4, article e61890, 14 p., accessed March 3, 2015, https://doi.org/10.1371/journal.pone.0061890.
Ohio Environmental Protection Agency, 2015a, Ohio algae information for recreational waters: Ohio Environmental Protection Agency web page, accessed September 2015 at https://epa.ohio.gov/monitor-pollution/pollution-issues/harmful-algae-blooms.
Park, H.-D., Sasaki, Y., Maruyama, T., Yanagisawa, E., Hiraishi, A., and Kato, K., 2001, Degradation of the cyanobacterial hepatotoxin microcystin by a new bacterium isolated from a hypertrophic lake: Environmental Toxicology, v. 16, no. 4, p. 337–343. [Also available at https://doi.org/10.1002/tox.1041.]
Ramani, A., Rein, K., Shetty, K.G., and Jayachandran, K., 2012, Microbial degradation of microcystin in Florida’s freshwaters: Biodegradation, v. 23, p. 35–45, accessed June 13, 2017, at https://doi.org/10.1007/s10532-011-9484-y.
Sandman, K., and Ecker, C., 2014, Pseudomonas isolation and identification—An introduction to the challenges of polyphasic taxonomy: Journal of Microbiology & Biology Education, v. 15, no. 2, p. 287–291, accessed July 30, 2015, at https://doi.org/10.1128/jmbe.v15i2.754.
Sanger, F., Coulson, A.R., Barrell, B.G., Smith, A.J.H., and Roe, B.A., 1980, Cloning in single-stranded bacteriophage as an aid to rapid DNA sequencing: Journal of Molecular Biology, v. 143, no. 2, p. 161–178. [Also available at https://doi.org/10.1016/0022-2836(80)90196-5.]
Somdee, T., Thunders, M., Ruck, J., Lys, I., Allison, M., and Page, R., 2013, Degradation of [Dha7]MC-LR by a microcystin degrading bacterium isolated from Lake Rotoiti, New Zealand: ISRN Microbiology, article 596429, 8 p, accessed October 5, 2017, at https://doi.org/10.1155/2013/596429.
Takenaka, S., and Watanabe, M.F., 1997, Microcystin LR degradation by Pseudomonas aeruginosa alkaline protease: Chemosphere, v. 34, no. 4, p. 749–757. [Also available at https://doi.org/10.1016/S0045-6535(97)00002-7.]
Thees, A., Atari, E., Birbeck, J., Westrick, J.A., and Huntley, J.F., 2019, Isolation and characterization of Lake Erie bacteria that degrade the cyanobacterial microcystin toxin MC-LR: Journal of Great Lakes Research, v. 45, no. 1, p. 138–149, accessed March 25, 2019, at https://doi.org/10.1016/j.jglr.2018.10.013.
U.S. Environmental Protection Agency, 2015, Great Lakes Restoration Initiative (GLRI): U.S. Environmental Protection Agency Great Lakes Funding website, accessed July 2015 at https://www.epa.gov/great-lakes-funding/great-lakes-restoration-initiative-glri.
Wang, Q., Garrity, G.M., Tiedje, J.M., and Cole, J.R., 2007, Naïve Bayesian classifier for rapid assignment of rRNA sequences into the new bacterial taxonomy: Applied and Environmental Microbiology, v. 73, no. 16, p. 5261–5267, accessed June 5, 2016, at https://doi.org/10.1128/AEM.00062-07.
Weisburg, W.G., Barns, S.M., Pelletier, D.A., and Lane, D.J., 1991, 16S ribosomal DNA amplification for phylogenetic study: Journal of Bacteriology, v. 173, no. 2, p. 697–703, accessed November 10, 2016, at https://doi.org/10.1128/jb.173.2.697-703.1991.
World Health Organization, 1999, WHO guideline values for drinking water quality, chap. 5.1.2 of Toxic cyanobacteria in water—A guide to their public health consequences, monitoring and management: London, E & FN Spon, p. 162–165, accessed September 2014 at https://cdn.who.int/media/docs/default-source/wash-documents/water-safety-and-quality/toxic-cyanobacteria---1st-ed.pdf.
Wu, Y.-F., Wu, Q.-L., and Liu, S.-J., 2013, Chryseobacterium taihuense sp. nov., isolated from a eutrophic lake, and emended descriptions of the genus Chryseobacterium, Chryseobacterium taiwanense, Chryseobacterium jejuense and Chryseobacterium indoltheticum: International Journal of Systematic and Evolutionary Microbiology, v. 63, p. 913–919, accessed October 5, 2017, at https://doi.org/10.1099/ijs.0.040337-0.
Zhang, M.L., Yan, H., and Pan, G., 2011, Microbial degradation of microcystin-LR by Ralstonia solanacearum: Environmental Technology, v. 32, no. 15, p. 1779–1787, accessed September 28, 2017, at https://doi.org/10.1080/09593330.2011.556148.
Appendix 1. Supplementary Tables
Table 1.1.
Isolates from microcosm experiments, test results, and 10 promising microcystin biodegraders from samples collected in the Western Basin of Lake Erie, 2015–16.[Data from Francy and Cicale (2024). Sequencing score represents the quality of the identification of the nucleobases generated by automated DNA sequencing. Rows for promising microcystin biodegraders are shaded in green as an additional visual aid. nm, nanometer; AU, absorbance units; ND, not detected; --, not determined; TSB, tryptic soy broth; µg/L, microgram per liter; MC–LR, microcystin-LR; E. coli, Escherichia coli; S. rhizophila, Stenotrophomonas rhizophila]
Conversion Factors
Temperature in degrees Celsius (°C) may be converted to degrees Fahrenheit (°F) as follows:
°F = (1.8 × °C) + 32.
Temperature in degrees Fahrenheit (°F) may be converted to degrees Celsius (°C) as follows:
°C = (°F – 32) / 1.8.
Supplemental Information
Concentrations of chemical constituents in water are given in either milligrams per liter (mg/L) or micrograms per liter (µg/L).
For more information about this report, contact:
Director, Ohio-Kentucky-Indiana Water Science Center
U.S. Geological Survey
5957 Lakeside Blvd.
Indianapolis, IN 46278-1996
or visit our website at
Disclaimers
Any use of trade, firm, or product names is for descriptive purposes only and does not imply endorsement by the U.S. Government.
Although this information product, for the most part, is in the public domain, it also may contain copyrighted materials as noted in the text. Permission to reproduce copyrighted items must be secured from the copyright owner.
Suggested Citation
Francy, D.S., Cicale, J.R., Stelzer, E.A., Reano, D.C., and Ecker, C.D., 2024, Isolation and identification of microcystin-degrading bacteria in Lake Erie source waters and drinking-water plant sand filters: U.S. Geological Survey Scientific Investigations Report 2023–5137, 23 p., https://doi.org/10.3133/sir20235137
ISSN: 2328-0328 (online)
Study Area
| Publication type | Report |
|---|---|
| Publication Subtype | USGS Numbered Series |
| Title | Isolation and identification of microcystin-degrading bacteria in Lake Erie source waters and drinking-water plant sand filters |
| Series title | Scientific Investigations Report |
| Series number | 2023-5137 |
| DOI | 10.3133/sir20235137 |
| Publication Date | January 31, 2024 |
| Year Published | 2024 |
| Language | English |
| Publisher | U.S. Geological Survey |
| Publisher location | Reston, VA |
| Contributing office(s) | Ohio-Kentucky-Indiana Water Science Center |
| Description | Report: vii, 23 p.; Data Release |
| Country | United States |
| Other Geospatial | Lake Erie |
| Online Only (Y/N) | Y |
| Additional Online Files (Y/N) | Y |