

Extent and Duration of Cold-Water Areas Associated with Side Channels and Tributaries of the Lower Yakima River, Washington, September 2018–20
Links
- Document: Report (8.46 MB pdf) , HTML , XML
- Data Release: USGS data release - Temperature data collected from the lower Yakima River from October 2018 to October 2020
- NGMDB Index Page: National Geologic Map Database Index Page (html)
- Download citation as: RIS | Dublin Core
Acknowledgments
The study was jointly funded by the U.S. Geological Survey and a grant to the Benton Conservation District from the Washington Department of Ecology (WRYBP-VER1-BentCD-00004) as part of the Yakima River Basin Integrated Water Resource Management Plan. We thank our partners at the Confederated Tribes and Bands of the Yakama Nation for their collaboration in development of this study. In particular, we thank Tom Elliott, Confederated Tribes and Bands of the Yakama Nation, for his guidance in locating and installing temperature sensors near Zillah, Washington. Finally, we thank I. M. Fletcher for his help preparing for fieldwork throughout the project.
Abstract
Previous work on the lower Yakima River, Washington (downstream from Union Gap), has identified several cold-water areas that could be thermal refuges for migrating salmonids. These cold-water areas are characterized by small tributaries that are typically cooler than the main-stem river during summer months (June–August). Twenty-seven temperature sensors were deployed along the lower 90 miles of the Yakima River at 7 locations where cold water had been previously observed. Deployments lasted from 1 to 2 years from September 2018 to September 2020 to document the extent and duration of these cold-water areas. Cold-water areas included the mouths of tributaries, alongside channels, and alcoves. Throughout summer months, main-stem river temperatures were warm, averaging about 92 days, when maximum daily temperatures exceeded 21 degrees Celsius (°C). The relationship between temperatures in the lower Yakima River and its tributaries varied seasonally; tributary water temperatures were 2–10 °C cooler than the main-stem river during summer months but 6–10 °C warmer than main-stem temperatures during winter months. The cooling effect of tributary inputs reduced downstream temperatures in the main stem by an average of 2–4 °C up to 175 feet downstream from tributary mouths. Side channel locations showed evidence of cooling, most likely from subsurface groundwater seeps, but the magnitude of cooling was less evident compared to tributaries. This study provides new information on spatial and temporal dynamics of cold-water areas on the lower Yakima River, which might provide cold-water habitat for migrating fishes in the future.
Introduction
The Yakima River Basin, in central Washington State (fig. 1), is critical habitat for spawning, rearing, and migration of multiple species of native salmonids. Of these species, Pacific salmon (Oncorhynchus spp.) receive significant attention because they rely on cold water to survive. Concerted efforts in the Yakima River Basin have improved lower Yakima River (downstream from Union Gap) water quality, habitat, and flow to support native salmonid species. However, the lower river currently (2023) experiences low dissolved oxygen and high pH values from aquatic plant production, often exceeding water-quality criteria during summer months (June–August). In addition, the lowest portion of the Yakima River Basin (downstream from Prosser) undergoes seasonal increases in water temperatures during summer months that threaten the existence of native salmon (Appel and others, 2011; Gendaszek and Appel, 2021). Specifically, warmer river water temperatures during base-flow conditions are a limiting factor for adult migration of steelhead (Oncorhynchus mykiss), sockeye salmon (Oncorhynchus nerka), spring and summer Chinook salmon (Oncorhynchus tshawytscha), Pacific lamprey (Entosphenus tridentatus), and to a lesser amount fall Chinook salmon (Oncorhynchus tshawytscha). Rapidly warming late spring and summer water temperatures can limit success of late season juvenile out-migrants (Kock and others, 2020). These challenges are compounded by warm water temperatures providing more favorable conditions for invasive predatory piscine populations compared to native salmon stocks (McMichael, 2017).
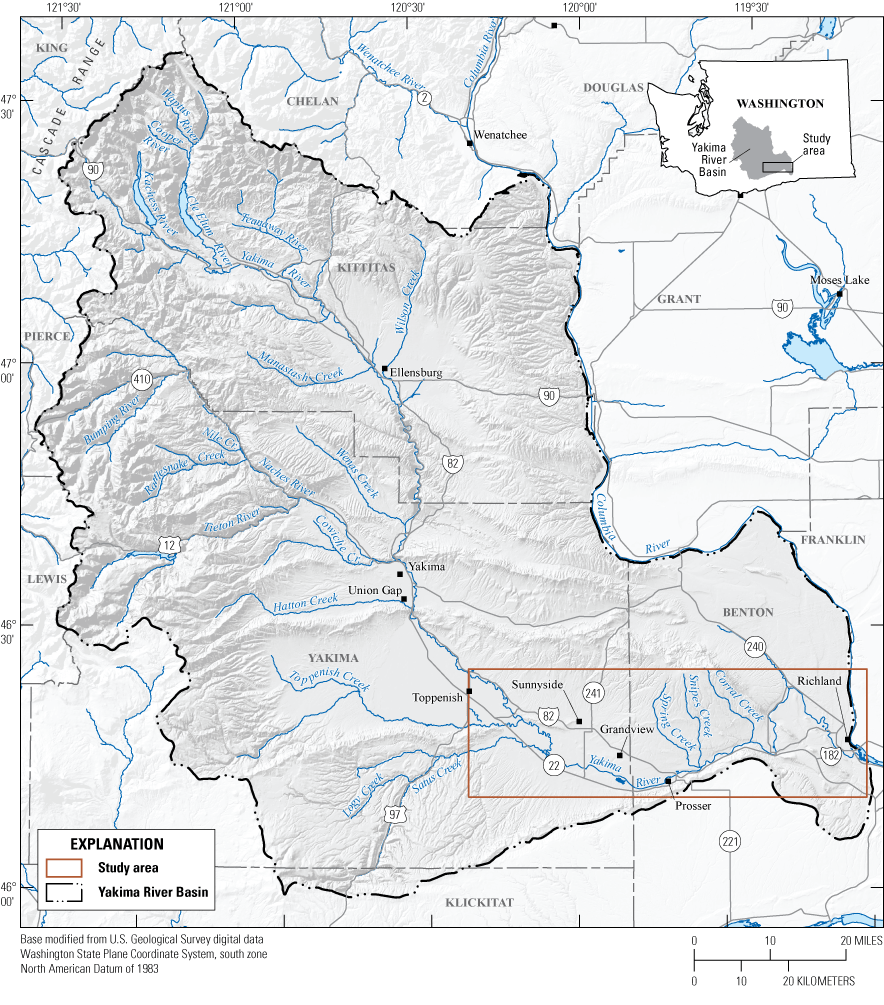
The study area in the Yakima River Basin, Washington.
The lower Yakima River is a critical section of the Yakima River for native salmonids. It is a migration corridor for Yakima River salmonid species, and sections of the lower river provide key spawning and rearing habitat for fall and summer Chinook. In summer months, main-stem river temperatures warm from Sunnyside Dam to the confluence. At base-flow conditions, river temperatures are driven primarily by solar radiation (Stanford and others, 2002; Voss and others, 2008). As such, cooler Yakima River temperatures rapidly warm in late spring and early summer (late May–June) and cool with the onset of autumn sometime between late August and early September (Appel and others, 2011). The seasonal timing of river warming coincides with critical migration periods for several Yakima River salmonids. River temperature provides cues to salmonoid species for migration timing and impacts the amount of available dissolved oxygen in the water. Pacific salmon species have maximum temperature thresholds ranging from 22 to 26 degrees Celsius (°C), but even sub-lethal temperatures have negative effects on fish health and behavior (Brett 1952, 1971). Warm water temperatures increase physiological stress, pre-spawn mortality, susceptibility to disease, and likelihood of straying, while decreasing their swimming performance, growth, and overall survival of salmon (Coutant, 1977; Brett, 1979; Li and others, 1994; Carter, 2005). Although the Yakima Basin Steelhead Recovery Plan (Conley and others, 2009) names the six focal fish species as bull trout, spring Chinook, fall Chinook, sockeye, steelhead, and Pacific lamprey, river management decisions are often based on the needs of steelhead because they are Endangered Species Act (16 U.S.C. 1531 et seq.) listed, and benefits to steelhead are assumed to benefit other native species. In a review of numerous studies, the Washington State Department of Ecology (Ecology, 2012) concluded that daily maximum water temperatures should not exceed 21 °C to fully protect adult steelhead during migration (Carter, 2005). The main-stem water-temperature standard of 21 °C is the thermal threshold for salmonids in the Yakima River Basin downstream Cle Elum, even though there might be slight adaptive differences to the local watershed conditions because of species differences and life stage.
Adult and juvenile salmonids exploit temperature variation in river systems to thermoregulate their core body temperatures by seeking and remaining in cooler water areas when average river temperatures are warm, enabling species to survive at their tolerance limits (Neill, 1979; Torgersen and others, 1999; Breau and others, 2007). These cooler areas are thermal refuges that enable fish to metabolically recuperate as they migrate through reaches of a river, which are warm enough to cause physiological stress. Fish can detect water temperature differences to within less than 0.1 °C (McCullough, 1999) and respond to these temperature changes by moving to areas that are more favorable. Thermal heterogeneity in rivers and streams is formed from a variety of features and includes groundwater seeps, cold-water tributaries, riparian shading, deep pools, and side channels (Ebersole and others, 2003; Vaccaro, 2011; Kurylyk and others, 2015; Gendaszek and Appel, 2021). In addition, groundwater-surface water exchange and hyporheic flow can cause cold-water anomalies in rivers (Vaccaro, 2011). Features of a river that are known to contribute to hyporheic exchange include stream meanders, riffle-pool sequences, and complex instream habitats. In the Yakima River, the cold-water features are thought to provide refuge for some migrating salmon species during times when ambient river temperatures are otherwise too warm. In contrast, during winter and spring, these areas might be warmer than the main stem, likely providing rearing and growth opportunities for out-migrating juvenile salmon and other native fish species.
Torgersen and others (2012) summarized the literature on thermal refuge use by fish and discussed the hierarchical river structures that contribute to thermal refuges in basins. On a basin and subbasin level, cold-water refuges are driven by elevation, topography, geology, channel slope, and interactions between the surface and sub-surface hydrology (Torgersen and others, 2012). However, use of thermal refuges by fish is complex; there are often physiological and biological tradeoffs for fish that move to cold-water refuges. For example, fish use certain areas of rivers for feeding and shelter even if these areas provide sub-optimal temperatures (Torgersen and others, 2012). In addition, although temperatures might be more favorable in thermal refuges, the conditions of the refuge (depth, cover from predators, dissolved oxygen, connectivity, and habitat space) might not be optimal (Torgersen and others, 2012).
Thermal variability in the lower Yakima River has been studied over the past several decades, with evolving methods. In 1997, the Bureau of Reclamation (Reclamation) conducted a Forward Looking Infrared (FLIR) flight over the lowest 108 miles of the Yakima River to identify cool-water inputs and document longitudinal river temperatures (Holroyd, 1998). Quantum Spatial (2020) completed a second FLIR survey of the river from Union Gap to the mouth. FLIR imaging only documents surface water temperatures, but both surveys indicated numerous cold-water surface features (such as inflow from tributaries, springs, and hyporheic inflow), ranging from 1 to 4 °C cooler than the main stem, which could be used by salmonids. In 2008 and 2009, Benton Conservation District (BCD) documented several locations of cooler water patches on the Yakima River downstream from Prosser Dam during a longitudinal thermal survey of the lower river. Appel and others (2011) reported that daily maximum temperatures in the river exceeded 21 °C for the 2008 and 2009 summertime floats; however, thermal heterogeneity in the lower reach was reported because of cooler areas resulting from non-point source seeps, irrigation wasteways and tributaries, and deeper pools. These cooler areas are often along the riparian area and sometimes in side channels (for example, the side channel at Interstate 182 [I-182] bridge). Though the cooler areas often exceeded 21 °C, these locations ranged from 0.5 to 2.0 °C cooler than the surrounding main-stem Yakima River water temperatures (Appel and others, 2011). This temperature difference is important because a water temperature difference of 1 °C can be sufficient to reduce physiological stress in salmonids, significantly reducing metabolic costs in elevated but sub-lethal temperature conditions (Berman and Quinn, 1991). Vaccaro (2011) summarized a variety of thermal data for the Yakima River and confirmed that incoming shallow groundwater and subsurface flows (likely enhanced or driven by applied irrigation water and return flows from fields) buffered the daily rise in summer water temperatures in the Prosser Reach. Another thermal longitudinal survey during summer 2018 covering more than 100 river miles (RM), from Wapato to Richland, Washington, identified numerous in-stream cold-water patch locations from groundwater, basin drainages, and springs and irrigation returns (Gendaszek and others, 2020; Gendaszek and Appel, 2021). Longitudinal temperature data were collected simultaneously from three boats along the right bank, center, and left bank of the river and covered the same river reach studies by Appel and others (2011). In addition to these large-scale temperature surveys, continuous temperature was monitored at three fixed locations on the lower Yakima River by the U.S. Geological Survey (USGS) and BCD at Prosser (USGS site 12509489), Kiona (USGS site 12510500), and West Richland (USGS site 12511800). These data were collected from June 2018 through September 2020, and monitoring at Kiona and West Richland continued from March through October in 2021 and 2022. Data from these fixed stations show that the temperature of the main stem of the river exceeded 21 °C throughout the summer months and approached 30 °C during the warmest periods, with temperatures increasing from Prosser downstream to West Richland (U.S. Geological Survey, 2021).
Temperature levels fluctuate over the day and night from solar radiation, and air temperature increases during the daytime. Because the health of aquatic species is predominantly a function of maximum temperatures, most Washington State temperature criteria are the largest 7-day average of the daily maximum temperatures in a waterbody. However, the Washington Administrative Code 173-201A-602 (Ecology, 2011) provides a special criterion for the Yakima River from the confluence of the Cle Elum River (RM 186) to the mouth that temperature should not exceed a 1-day maximum value of 21.0 °C because of human activities, and if natural conditions exceed this value, temperature increases should not be greater than 0.3 °C. This criterion recognizes that not all waters can naturally stay below the fully protective temperature criteria. When a waterbody is naturally warmer than the forementioned criteria, the standards allow additional warming because of human activities. In this case, the combined effects of all human activities should not increase 0.3 °C more than a the naturally warmer temperature condition.
Temperature criteria for the lower Yakima River attempts to protect migrating adult salmonids by setting a maximum threshold criterion of 21 °C (Washington Administrative Code 173-201A-200; Ecology, 2020). Though thresholds for adult survivability of salmon species are unknown for Yakima River salmon stocks, work on the Willamette River Basin by White and others (2022) indicated that adult Chinook salmon migration is impaired between 20 and 23 °C, with mortality occurring above 24 °C. Because the entire lower Yakima River is not able to meet State temperature criteria during base-flow conditions, thermal heterogeneity and enhancing cold areas on the lower river are being investigated to support salmonid spawning, rearing, and migration during inhospitable temperatures. Thermal variability within the lower 100 miles of the Yakima River might provide areas of the river that meet the temperature criteria for salmonoids. Therefore, identification of in-stream thermal variability is the first step for development of future projects geared toward meeting lower Yakima River temperature criteria and regulatory standards. This study expands on the previous lower Yakima River work by collecting continuous temperature data during a two-year period (October 2018 to October 2020) to document the duration and extent of known thermal refuges in the lower Yakima River.
Purpose and Scope
Previous work on the thermal heterogeneity provided information on locations of thermal refuges in the lower Yakima River. This study expands on that information by measuring continuous temperature at multiple locations of known thermal cold-water areas on the lower river for a 1–2-year period (October 2018 to October 2020). The goal is to document the duration and extent of these thermal refuges.
This study supports the efforts of the Yakima River Basin Integrated Water Resource Management Plan to enhance rearing and migratory habitat on the Yakima River (Reclamation and Ecology, 2012). It complements the lower Yakima River Thermal Refuge Assessment and Enhancement project (managed by Benton Conservation District through Yakima River Basin Integrated Plan funding) that identified potential cold-water locations on the lower Yakima River in 2018. Studying and characterizing thermal refuge locations is critical for supporting management and habitat interventions to enhance, promote, or use these areas for anadromous species.
Study Area
The lower Yakima River flows through arid south-central Washington State. It is part of the Yakima River Basin that drains approximately 6,000 square miles on the east side of the Cascade Range (fig. 1). The study area encompasses the lowest part of the Yakima River Basin, which flows through south Yakima and Benton Counties. The lower Yakima River Basin is separated from the upper Yakima River Basin by a natural break at Union Gap (Wise and others, 2009; Gendaszek and Appel, 2021). The hydrologic and geomorphic conditions of the Yakima River Basin downstream from Union Gap contribute to the formation, maintenance, and distribution of cool water anomalies on the lower Yakima River (Gendaszek and Appel, 2021). For this study, the lower Yakima River is divided into three reaches based on basin hydrology, counties, and distinct reach geomorphology. The upper-most reach extends downstream from Union Gap (RM 103.8) to Mabton, Washington (RM 60). This stretch of river flows through south Yakima County. The lowest reaches for this study, Prosser and Kiona Reaches, are in Benton County. The Prosser Reach begins upstream from Prosser, Washington (RM 47), and ends at Benton City near the USGS gaging station at Kiona near RM 30. The Kiona Reach is the lowest stretch of river and flows from Benton City to the river’s confluence (RM 0) with the Columbia River in Richland, Washington.
The Yakima River Basin headwaters are in the Cascade Range of Washington State. Reservoirs capture snowpack and spring melt. The spring freshet typically occurs between April and May. Low flows on the lower Yakima River coincide with warm temperatures during June through August. River temperatures rapidly cool between late August and early September (Reclamation, 2008). The irrigation season, when water is withdrawn from the Yakima River in Yakima and Benton Counties, runs from mid-March to mid-October. Central Washington receives an average of 7–9 inches of rain annually and relies heavily on irrigation to maintain agricultural crops and livestock, which influences water quality and seasonal flow of the Yakima River.
For decades, warm temperatures, suspended solids, turbidity, Dichlorodiphenyltrichloroethane, and other pesticides have been documented in the lower Yakima River. By the mid-1990s, water-quality evaluations by the USGS indicated that some improvements had been made, but water-quality issues related to sediment and sediment-borne pollutants remained (Rinella and others, 1999). As a result, several reaches of the lower Yakima River and several of its tributaries did not meet numerous State water-quality criteria and Federal guidelines. Consequently, Ecology (2012) placed these water bodies on Washington State’s 303(d) list (https://www.epa.gov/tmdl/approval-washington-2012-303d-list). Water-quality issues of concern in the entire Yakima River Basin include fecal coliform bacteria, suspended sediments, turbidity, toxic chemicals, pH, nutrients, dissolved oxygen, and temperature. The water-quality issues in the basin impact the beneficial uses of the water, potentially making it unsafe for drinking or recreation and threatening the health of aquatic animals and fish living in it. Currently (2023), there are two Yakima River fish species listed as “threatened” under the Endangered Species Act: mid-Columbia bull trout (U.S. Fish and Wildlife Service, 1998) and mid-Columbia steelhead (National Oceanic and Atmospheric Administration, 2014). Conley and others (2009) summarized studies in the upper and middle Yakima River that indicated elevated temperatures, toxic chemicals, lack of foraging habitat, and predation were creating obstacles for survival of these species.
The Wapato Reach has a broad alluvial floodplain with a dynamic river channel and extensive riparian forests; however, construction of bridges, dikes, and roads in this stretch have constricted or cut off portions of the floodplain (Stanford and others, 2002). The Wapato Reach floodplain supports a mixture of agricultural, conservation, and small urban areas, and the Confederated Tribes and Bands of the Yakama Nation has maintained expansive amounts of floodplains and vegetated growth along the river corridor. Significant tributaries entering the Wapato reach include Toppenish Creek, Satus Creek, and Sulphur Creek Wasteway.
Columbia River basalt dominates the Prosser reach between Prosser and Benton City restricting the river channel. There is minimal floodplain, braiding, or channel meander in this stretch of the river. This portion of the river is known as the “bedrock reach” and has minimal opportunities for shading and bank vegetation. The river is wide and shallow during base-flow conditions. Several irrigation wasteways drain into the river in the Prosser Reach (Spring/Snipes, Corral, and Knox Creeks). These wasteways are a source of cold water because of groundwater infiltration from heavy irrigation and act like natural tributaries for the lower Yakima River. Downstream from Benton City, the reach is less confined because the basalt transitions to more alluvial deposits. Alluvial islands formed by historical floods in this reach help mediate changes in channel morphology. Only one tributary drains into the river in the Kiona Reach. Amon Wasteway, at RM 2.7, is the lowest tributary to the Yakima River Basin.
The lower Yakima River supports anadromous runs of steelhead; spring, summer, and fall Chinook salmon; Coho salmon; and sockeye salmon. Juvenile salmon and Steelhead out-migrate through the lower Yakima River to the Columbia River, and adult salmonids migrate from the Columbia through the lower Yakima River. Historically, most of the fall Chinook spawned downstream from Prosser, but recent changes in aquatic vegetation have resulted in a shift of fall Chinook spawning to upstream from Prosser Dam because of decreased spawning gravel quality (Appel and others, 2011).
Study Locations
Sampling locations for this study were determined based on (1) data collected during recent longitudinal floats when cold water was observed (Gendaszek and Appel, 2021) and (2) local knowledge on cold-water areas in the lower river. In general, two basic types of thermal refuge were monitored: those formed by distinct tributary inputs and those alongside channels where cold water was less well defined and more diffuse. Tributary locations included Amon Wasteway, Corral Creek, and Spring/Snipes Creeks in the lower portion of the river, and an unnamed tributary to a side channel upstream near Zillah (fig. 2). Side channel locations were near Fox Island in West Richland, just downstream from the USGS Kiona gage near Benton City, and the McCoy side channel near Zillah (fig. 2). Lastly, a site was monitored where a distinct cold-water source entered a side channel near the I-182 bridge in Richland, Washington. This I-182 location resembled a tributary input refuge nested in a side channel to the main stem and is of increased interest to local resource managers as a potential habitat enhancement site on the lower river.
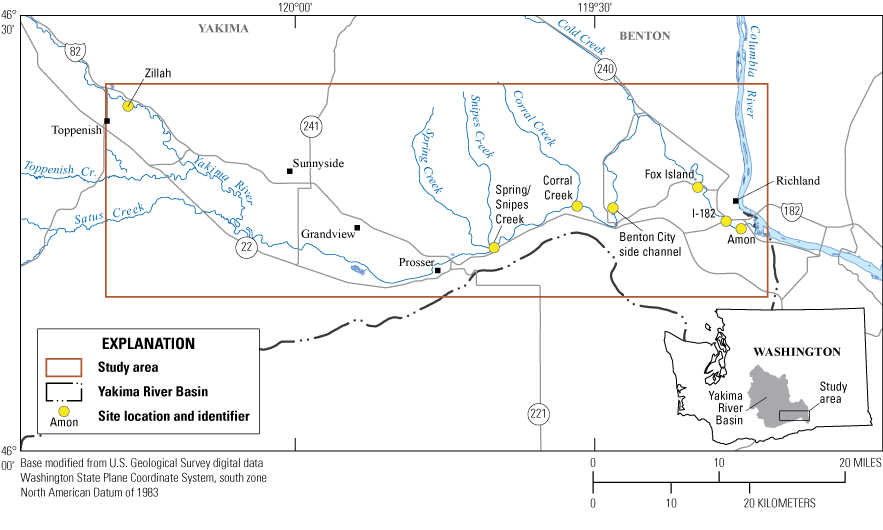
Locations of the cold-water monitoring sites in the study area, in the Yakima River Basin, Washington.
Amon Wasteway
Amon Wasteway is a major irrigation return flow facility for the Kennewick Irrigation District. The wasteway has a drainage area of 62 square miles and most of the flow is dominated by irrigation activity, with only a small fraction (less than 0.5 cubic feet per second) from natural processes, such as snowmelt and runoff (Smith and others, 2005). The creek carries excess water from the district’s main irrigation canal and delivers water to about 1,500 users in the district (Child and others, 2010) and likely includes groundwater returns from irrigation in other parts of the basin (Drost and others, 1997). The creek also carries stormwater runoff from the cities of Richland and Kennewick. The mouth of Amon Wasteway enters the Yakima River close to RM 3.0.
Five temperature sensors were installed near the Amon Wasteway input to the Yakima River. Two sensors were installed in Amon Wasteway, an upstream sensor (Amon_US, Amon upstream) about 500 feet from the mouth of the creek, and a downstream sensor (Amon_DS, Amon downstream) about 150 feet from the mouth (fig. 3) to record water temperature entering the main stem. In the main stem of the Yakima River, three temperature sensors were installed: one upstream from the Amon Wasteway input (Yakima_US Amon), and two downstream from the mouth of Amon Wasteway (Yakima_DS1 Amon, Yakima_DS2 Amon). These three sensors recorded change in temperature along the right bank of the main stem because of Amon Wasteway water. Yakima_DS1 Amon was about 20 feet downstream the mouth of Amon Wasteway and Yakima_DS2 Amon was about 175 feet downstream from the mouth and within 10 feet of the right bank. The sensor at the most downstream site (Yakima_DS2) was not found during retrieval in October 2020 so only a single year of data was available for that location.
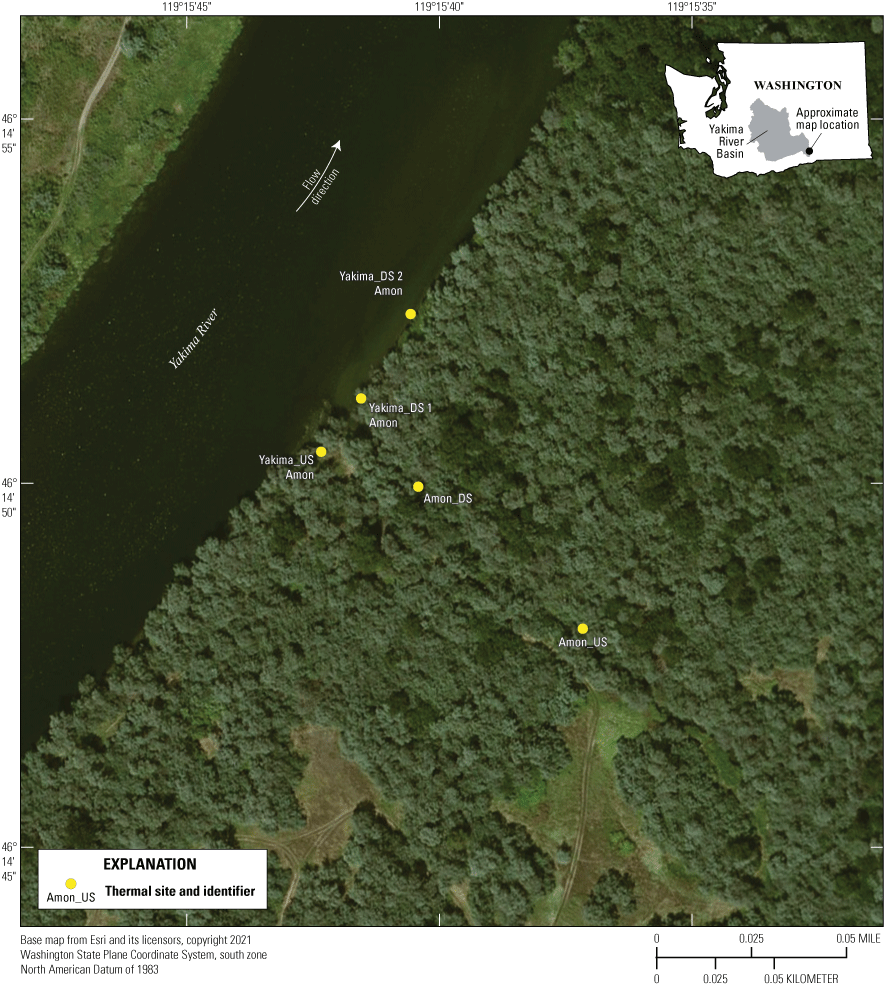
Locations of temperature sensors at Amon Wasteway, Washington. For site identifier explanations, see table 1.
I-182 Side Channel
At RM 4.7, the I-182 bridge crosses the Yakima River in Richland, Washington, and there is a 2,700-foot-long side channel. About 450 feet from the head of the side channel, a cold-water point source is known as the “Bubble-Up.” The Bubble-Up and associated settling ponds are part of the I-182 Highway infrastructure. Groundwater is collected in a regional network of stormwater pipes and emerges from the top of a riser pipe in the I-182 collection pond. There is some uncertainty regarding the ultimate source of the water: whether the source is subterranean flow from nearby irrigation infrastructure or natural groundwater. The cold water from the settling ponds enters the island side channel over a man-made rock weir. This site was selected based on previous measurements of unusually cold water at this site, about 4–5 °C cooler than the main stem, making it a potential physiological refuge for salmonids. Adult salmonid access to the site, however, is not possible in its current configuration because of the shallow upstream entrance of the side channel. The goal of instrumenting this location was to determine the influence of the cold water on the side channel upstream and downstream from its entry point. Three temperature sensors were installed at this location for approximately 2 years (water years 2019 and 2020). These sensors were at the outlet of the groundwater Bubble-Up (I182 input), in the side channel upstream from the pond (I182_US), and in the channel downstream from the pond (I182_DS) (fig. 4). No sensors were installed in the main stem because the temperature at I182_US was assumed to be equal to the main-stem temperature.
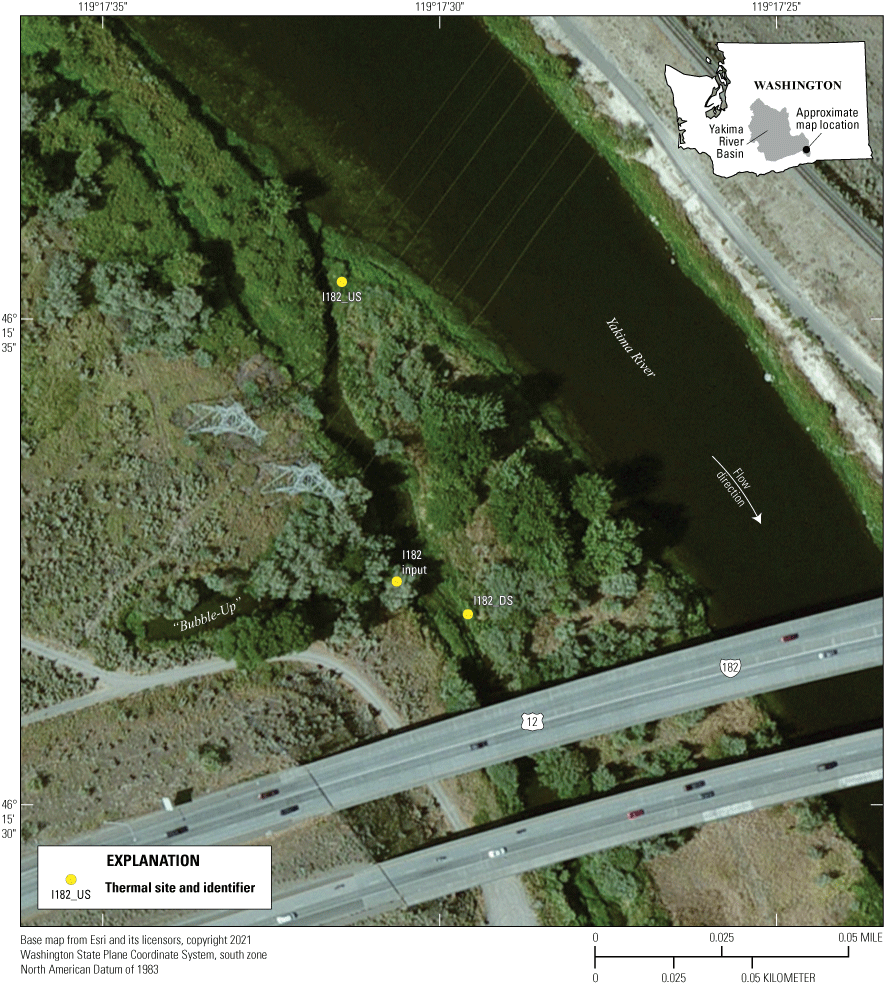
Locations of temperature sensors at Interstate 182 side channel, Washington. For site identifier explanations, see table 1.
Fox Island Side Channel
Fox Island, along the right bank of the Yakima River, is upstream from Van Giesen Bridge in West Richland, Washington, and adjacent to the West Richland Golf Course. The island has a side channel that is disconnected at the upstream end during summer-month base flows but is inundated and connected at higher flows. The side channel consists of a series of small channels and deep pools. During base-flow conditions, cold water enters the main stem at the downstream end of the island, near RM 8.5. Three temperature sensors were installed to monitor this location for a 2-year period (fig. 5). A sensor was installed upstream in the side channel in a deep pool (Fox_pool) where water is present year-round and hidden from public view. A second sensor was installed near the outlet of the side channel, close to the main stem (Fox_pool out). However, the sensor at the pool outlet was lost during the first year of deployment. A second sensor was installed at the pool outlet location in September 2019, retrieved in June 2020, to determine if temperature in the upstream pool was indicative of water entering the channel. Finally, the downstream temperature at the Fox Island location was collocated at the USGS water-quality site at Van Giesen (USGS site 12511800), which was for a concurrent project. The Van Giesen site was approximately 450 feet downstream from the outlet from the Fox Island side channel complex.
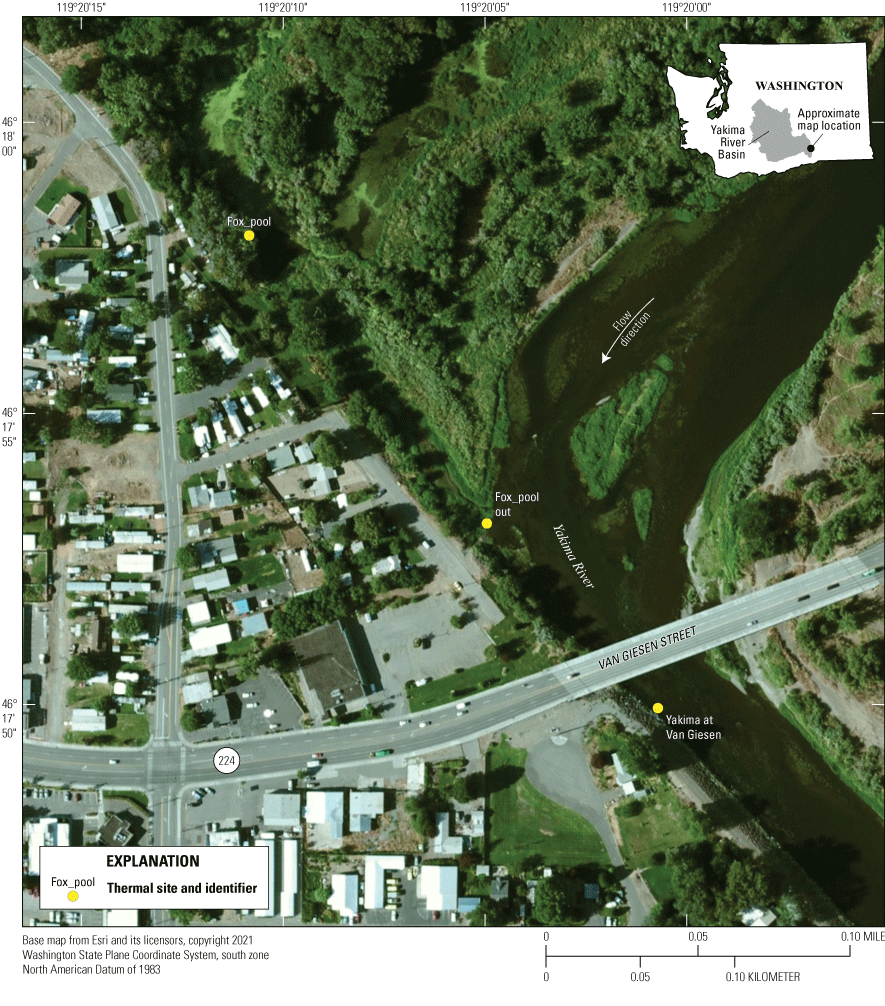
Locations of temperature sensors at Fox Island side channel, Washington. For site identifier explanations, see table 1.
Benton Side Channel
Near Benton City, a 1,000-foot-long side channel lies on the left bank of the with a 90-degree bend near the downstream end. The island side channel is heavily vegetated along most of its length. There is a deep pool at the 90-degree bend in the side channel. This side channel is near RM 28 and was chosen based on previous work that showed cold-water locations along the channel, particularly near the downstream bend in the channel (Appel and others, 2011; Gendaszek and Appel, 2021). This deep pool in the side channel is a historical spawning area for fall Chinook, and the cold water in this channel is likely from diffuse subsurface seeps. Three temperature sensors were installed at this location (fig. 6) in September 2019, one along the right bank and about halfway down the channel (Benton 6), one at the bend in the channel downstream (Benton 2), and one close to where the side channel reenters the main channel of the Yakima River (Benton 1). These three sensors were in place for 1 year. In addition, BCD installed 4 sensors in August 2020 to capture finer longitudinal resolution in the side channel. One of these sensors did not record data correctly, but the remaining three sensors (Benton 3, Benton 4, and Benton 6) collected data from early August 2020 until October 1, 2020. In addition, temperature data were collected form the main stem upstream at Kiona (USGS site 12510500, RM 30), as part of another project for comparison to side channel temperatures.
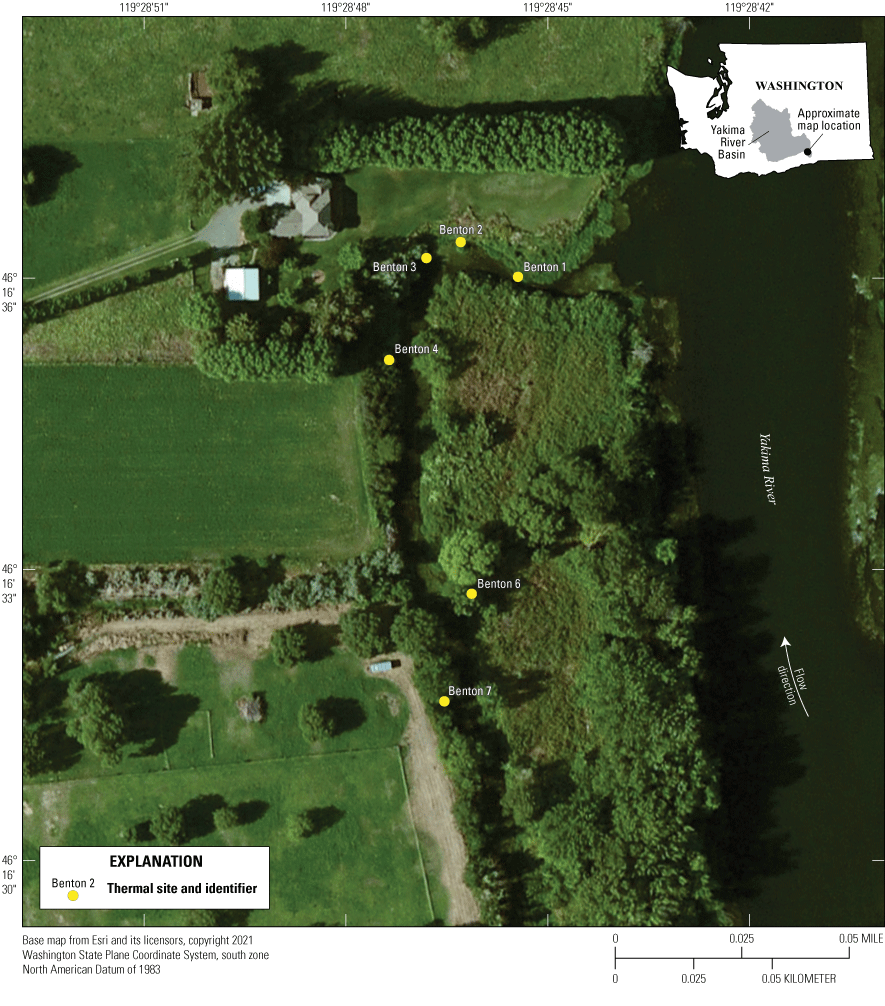
Locations of temperature sensors at the Benton side channel, Washington. For site identifier explanations, see table 1.
Corral Creek
Corral Creek drains approximately 25 square miles (Ries and others, 2017) and enters the main stem of the Yakima River at RM 33.4 on the left bank of the main-stem river. Corral Creek is part of the Roza Irrigation system and originates just upstream from Roza Canal. Corral Creek is for routing or draining excess water out of the main canal back to the Yakima River. With no natural tributaries, Corral Creek is primarily fed by irrigation enhanced groundwater, overland flows, along with Yakima River flows from the Roza Irrigation system. The tributary/canal flows through a meadow at the headwaters into a heavily vegetated and constrained valley before it joins with the main-stem Yakima River (Romey and Cramer, 2001). Most of the adjacent land, including the confluence, is rural and privately owned. Corral Creek was identified from previous work (Appel and others, 2011; Gendaszek and Appel, 2021) as a potential cold-water refuge. In addition, Corral Creek has stream habitat that has been rated “fair to good” for natural production of salmonids with beaver ponds, riffles, and gravel/cobble substrate (Romey and Cramer, 2001). Three temperature sensors were installed in September 2019 and retrieved in September 2020 (fig. 7). The three sensors were at the mouth of Corral Creek (Corral Input), just upstream from Corral Creek in the main stem of the Yakima River (Yakima_US Corral), and approximately 100 feet downstream from the Corral Creek inflow (Yakima_DS Corral).
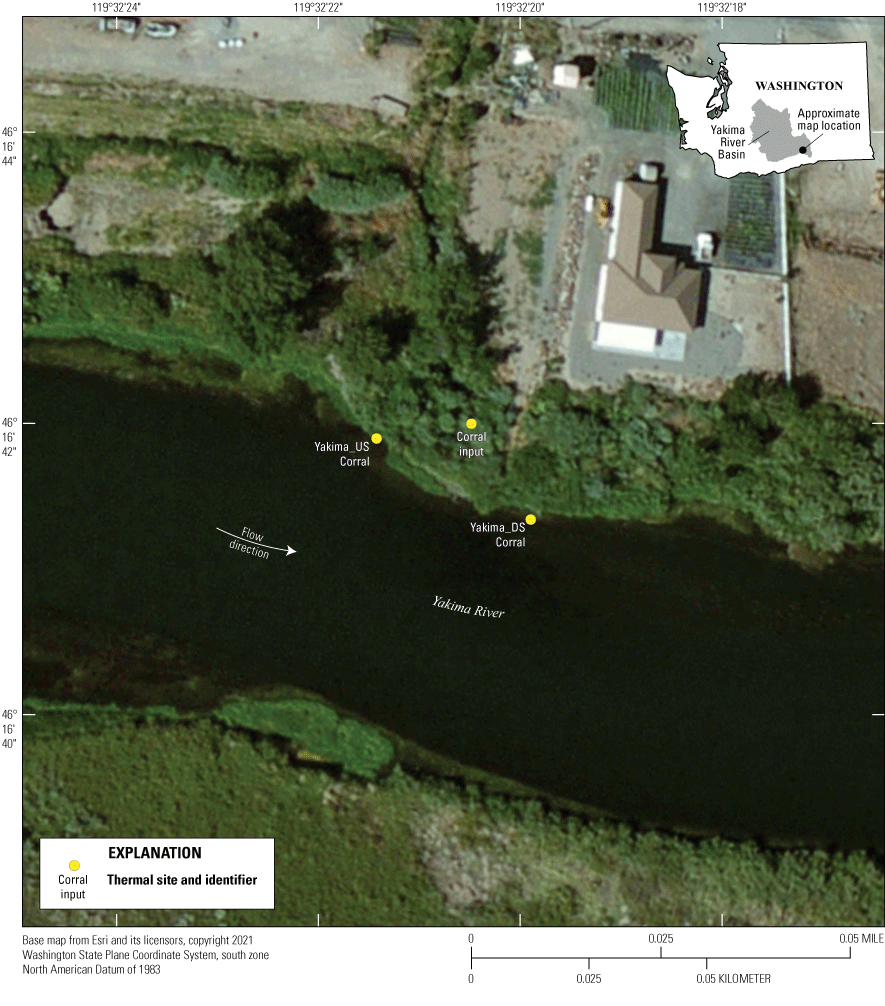
Locations of temperature sensors at the Corral Creek tributary, Washington. For site identifier explanations, see table 1.
Spring/Snipes Creek Side Channel and Tributary
Spring and Snipes Creeks are part of the Roza Irrigation District system. Around RM 42, Spring and Snipes Creeks enter the Yakima River along the left bank of the main stem. These two creeks drain approximately 77.5 square miles of land to the north of the main stem (Ries and others, 2017). Originating upstream form Roza Canal, Snipes Creek flows near the town of Whitstran, Washington. The headwaters enter a constrained valley with the lower half of Snipes Creek flowing through a broad floodplain. Adjacent land use for Snipes Creek is rural agriculture with vineyards, livestock, and residential areas. The Spring Creek tributary joins Snipes Creek approximately 575 feet upstream from their joint confluence with an island side channel on the Yakima River main stem. Spring Creek begins near Roza Canal and ends at its junction into Snipes Creek (Romey and Cramer, 2001). Snipes Creek enters the main stem on the downstream end of a side channel along the river, thus enabling documentation of the side channel and tributary refuge at the same location. Similar to Corral Creek, previous work by Romey and Cramer (2001) reported that Spring and Snipes Creeks had fair to good habitat for natural salmonid production. These creeks are natural tributary channels consisting of gravel and cobble substrate, which might make it suitable thermal refuge habitat depending on cold-water dynamics. To monitor these dynamics, four temperature sensors were installed at the refuge location (fig. 8). A sensor was installed at the mouth of Snipes Creek (Snipes input), one sensor was upstream from the tributary input in the main stem of the river (Yakima_US Snipes), and one was approximately 300 feet downstream from the Snipes input (Yakima_DS Snipes). The fourth sensor was installed in the side channel just upstream from the Snipes input to record differences between the Yakima_US Snipes site and the end of the side channel near the Snipes input. These four sensors were installed in September 2018 and retrieved in September 2020. However, because of a data logging error, data from the Yakima_DS Snipes were not collected during year one.
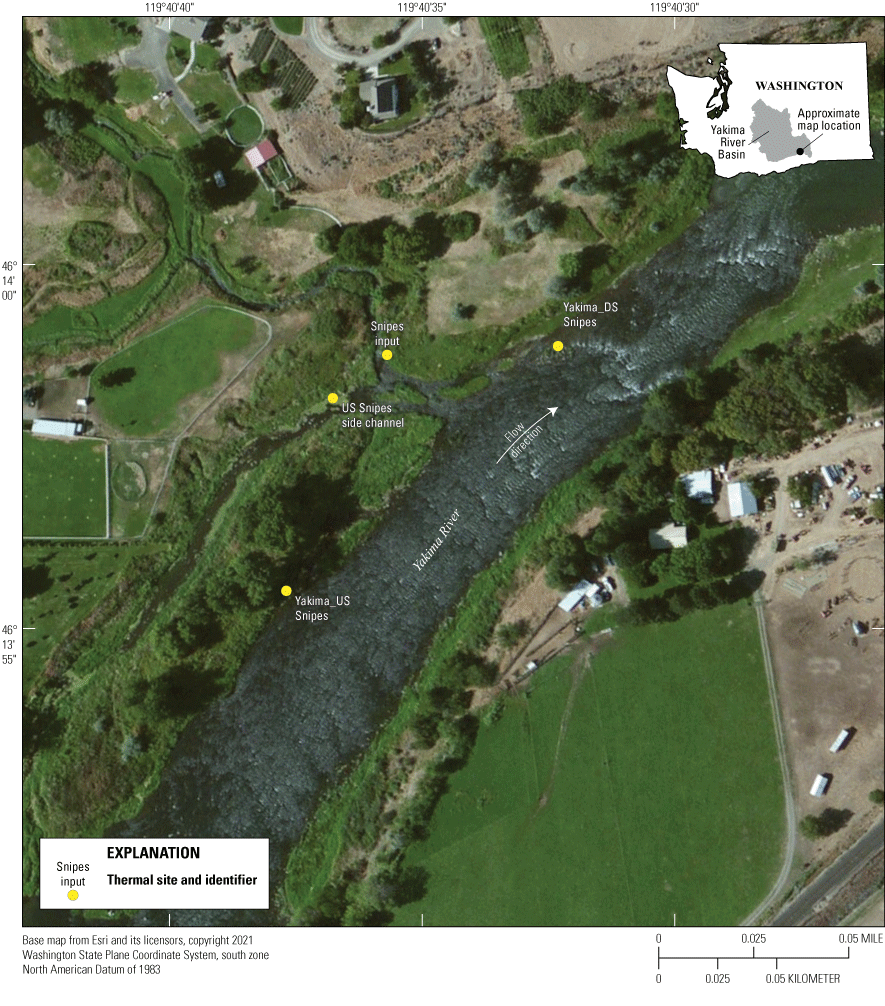
Locations of temperature sensors at the Spring/Snipes Creek tributary, Washington. For site identifier explanations, see table 1.
Zillah Side Channel and Alcove
The most upstream cool-water input location was near Zillah, Washington, and the Confederated Tribes and Bands of the Yakama Nation reservation near RM 91. This part of the Yakima River includes a more dynamic channel with multiple side channels, meanders, and active floodplains. Data were collected from three temperature sensors at a tributary input, a side channel, and an alcove-type thermal refuge during water year 2020 (fig. 9). The first location was instrumented upstream from the Meyers Road (Rd.), crossing where a disconnected side channel (alcove) site was instrumented (Zillah alcove). This alcove was just downstream from a beaver dam and connected to the main stem of the Yakima River downstream from the Meyers Rd. overpass. The second location was in a side channel off McCoy Rd. (McCoy side channel). The third sensor was installed late in water year 2020 in a small tributary that entered the river near the McCoy side channel (McCoy tributary). This location was selected because it showed potential as a cold-water source from the 1997 FLIR flights (Holroyd, 1998). A temperature sensor installed in the main stem of the river just upstream from the Meyers Rd. overpass was lost during high flows leaving comparison of refuge data to the main stem at RM 91 impossible. However, in a separate project, BCD installed a temperature sensor in the main stem of the river at RM 93 that recorded temperatures from early August 2020 through September 2020. Although this sensor was upstream by 2 miles and did not include the entire summer period, it provided context to data collected by USGS.
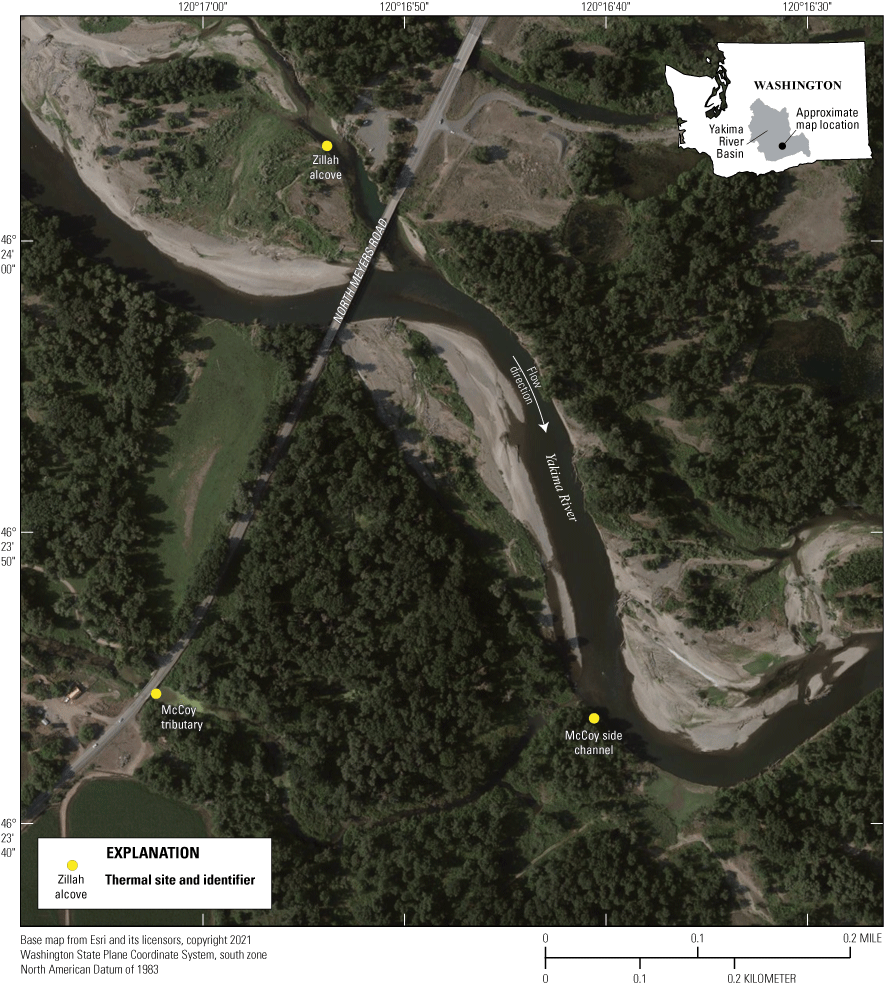
Locations of temperature sensors at the Zillah side channel and alcove, Washington. For site identifier explanations, see table 1.
Methods of Investigation
The seasonal duration and spatial extent of thermal refuges in the study area were determined during a 1–2-year period (October 2018–20) at seven locations. Six of these locations were between the mouth of the Yakima River and Prosser Dam, and one was upstream from the other six, near Zillah, Washington. At each monitoring location, multiple internally logging temperature sensors (Hobo Water Temperature Pro V2, Onset Computer Corp.) were installed to record the thermal characteristics of the cold-water source and to determine if the main-stem temperature near the input was influenced by this cooler input. To examine these thermal dynamics, the temperature sensors were deployed at each site in the cold-water source and upstream and downstream from the cold-water source to bracket influence on ambient river temperatures. Temperature sensors were attached to a steel spike or housed in a small PVC (Polyvinyl Chloride) casing and anchored to the riverbed (fig. 10). Temperature sensors were positioned within 1 foot of the river bottom.
Thirty temperature sensors were deployed for this study, but data from only 27 are in table 1. Three of the sensors were either lost in the field because of high flows or the sensor malfunctioned resulting in data loss. Temperature data were recorded at 30–60-minute intervals for 1–2 years. Most deployments took place in September 2018 or 2019 during lower river stage to facilitate access to the streambed.
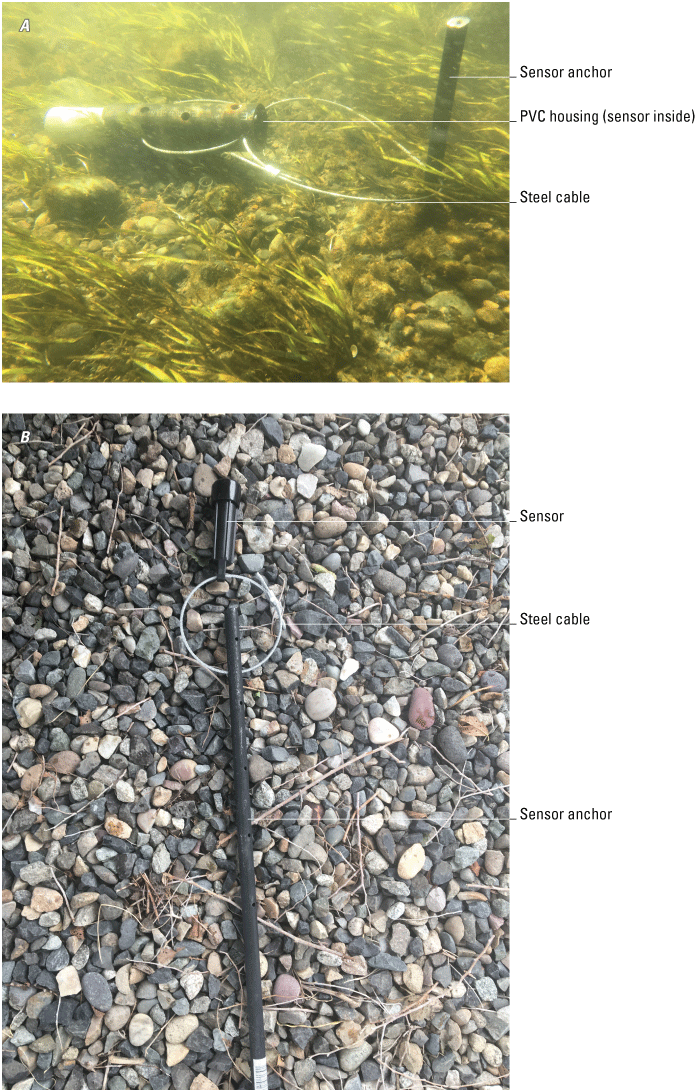
Examples of the two deployment methods used for measuring near streambed water temperatures, Richland, Washington, September 1, 2018. Photographs by Rich Sheibley, U.S. Geological Survey.
Table 1.
Cold-water monitoring sites in the lower Yakima River from October 2018 to October 2020.[USGS, U.S. Geological Survey; STAID, station identifier; ID, identifier; RM, river mile; US, upstream; DS, downstream; Sept., September; Oct., October; Aug., August]
Statistical Methods
Maximum daily temperatures were calculated from time-series data at all sites for each day the sensors were deployed. The use of maximum daily temperature as the main metric of analysis enabled direct comparison to the established temperature criteria that river water should not exceed 21 °C for the lower Yakima River (Ecology, 2012). Maximum daily temperatures for each month were compared across temperature sites within each of the six river locations using a non-parametric Kruskal-Wallis test for the analysis of variance. These comparisons were combined with a post hoc Friedman’s least significant difference test to determine which months had temperatures that were statistically different from each other up and downstream from each cold-water input (p-value of 0.05). All statistical analysis was performed using R (version 4.2.0, R Core Team, 2022), RStudio (version 2022.02.3), and the Hmisc (version 4.7-0, https://CRAN.R-project.org/package=Hmisc) and Agricolae (version 1.3-5, https://CRAN.R-project.org/package=agricolae) packages.
Data Quality
To ensure accurate data, USGS procedures for the collection of continuous water temperature were followed and included pre and post laboratory checks, field checks, sensor cleaning during the deployment (Wagner and others, 2006; Conn and others, 2017), site visits, corrections for drift and fouling, and field maintenance. Temperature sensors were checked before and after field deployment, using a five-point temperature verification check in the laboratory using a National Institute of Standards and Technology (NIST)-certified thermistor (Wagner and others, 2006; Conn and others 2017). All 27 temperature sensors were within the USGS tolerance of plus or minus (±) 0.2 °C compared to the NIST-certified thermistor. In addition to the laboratory verifications, deployed sensors were periodically field checked with side-by-side comparisons to a field thermistor. The field thermistor was verified prior to use in the field by comparing to a NIST certified thermistor. These field checks verified the accuracy of and helped with interpretation of the time-series data. There was no data correction because the post deployment laboratory checks passed the USGS accuracy criteria (±0.2 °C). The final temperature records were analyzed, approved, and audited following standard USGS procedures (Wagner and others, 2006; Conn and others 2017). Continuous temperature data and daily statistics for all sites are in Sheibley and Foreman (2023).
Results
Each monitoring location had a unique set of conditions to assess the duration and extent of cold-water areas. Results are presented individually from the most downstream location at Amon Wasteway to the most upstream location at Zillah, Washington.
Amon Wasteway
Daily maximum temperatures in Amon Wasteway were similar at upstream and downstream locations, with an average increase of 1.3 °C averaged over the 2-year deployment, indicating a slight warming as water got closer to the Yakima River. Temporally, the data showed similar average daily maximum temperatures (fig. 11) between the upstream and downstream sensors. However, for this report, only the upstream Amon Wasteway sensor (Amon_US) was compared to the main-stem Yakima River temperatures, because the Yakima River occasionally backs up into the downstream part of Amon Wasteway when the Yakima River flow increase. In addition, future restoration work in this area might be redirecting the outlet of Amon Wasteway to a new location, so the analysis focused on the upstream sensor to demonstrate potential cooling for future cold-water enhancement projects. Therefore, no further discussion of data from Amon_DS are provided.
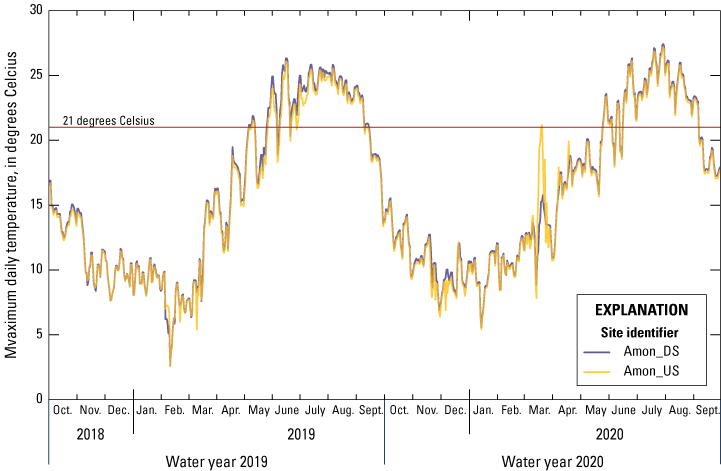
Daily maximum temperatures at the upstream and downstream temperature sensors in Amon Wasteway, Washington, water years 2019 and 2020. For site identifier explanations, see table 1.
Maximum daily temperatures in Amon Wasteway and the main stem followed similar patterns throughout the water year with the coolest temperatures in October through February, warming beginning in early March, and peak daily maximum temperatures in late July to early August (fig. 12). Cooling started in the main stem and Amon Wasteway in August. Maximum daily water temperatures exceeded the 21 °C criteria for the river an average of 110 days in water year 2019 and 94 days in water year 2020 in the wasteway and main stem (table 2). The period for continuous days exceeding 21 °C varied slightly across the 5 locations but in general ranged from mid-June to mid-September each water year (table 2).
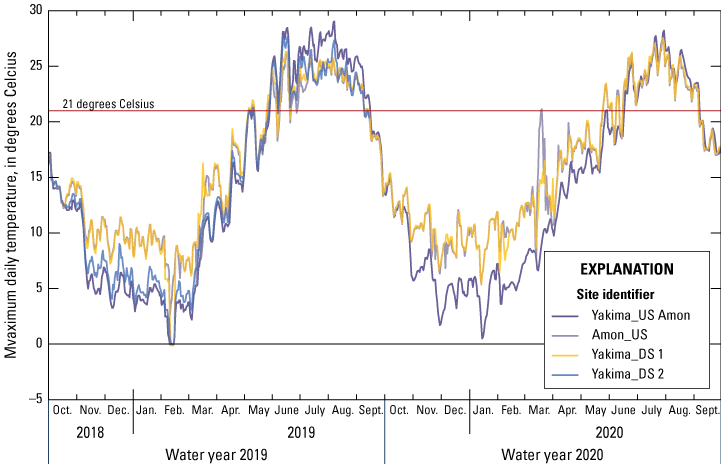
Maximum daily temperatures from upstream, downstream, and in Amon Wasteway, Washington, water years 2019 and 2020. For site identifier explanations, see table 1.
Table 2.
Number of days the daily maximum temperature exceeded 21 degrees Celsius at each cold-water site, water years 2019 and 2020.[USGS, U.S. Geological Survey; STAID, station identifier; ID, identifier; RM, river mile; US, upstream; DS, downstream; Aug., August; Sept., September; --, no data]
Comparison of maximum daily temperatures in the main˗stem Yakima River upstream from Amon Wasteway to those in the creek showed a similar pattern for 2019 and 2020 water years (fig. 13). From October through May, daily maximum temperatures in Amon Wasteway were warmer than the main stem. In contrast, from June through September, the daily maximum temperatures in Amon Wasteway tributary were cooler than the main stem (fig. 13). During the 2019 summer months, maximum daily temperatures ranged from 1.1 to 2.7 °C cooler in Amon Wasteway than in the main stem upstream from the Amon Wasteway mouth, with a June through September average of 2.2 °C cooler (table 3). During the 2020 summer months, these differences were comparatively less, ranging from 0.9 °C cooler (August 2020) to 1.3 °C warmer (June 2020), with an average difference of 0.1 °C cooler from June through September (table 3). The duration of cooling from Amon Wasteway varied between water years, with 72 days from June through September 2019 when the creek was more than 2 °C cooler than the main stem, compared to only 3 days in 2020 (table 3). The differences in maximum daily temperature upstream and downstream from Amon Wasteway show the main stem of the Yakima River warmed from autumn through spring and cooled in summer months (fig. 1). These results indicate that summer cooling from Amon Wasteway can extend a minimum of 170 feet downstream along the right bank, where Yakima_DS2 Amon is (fig. 14).
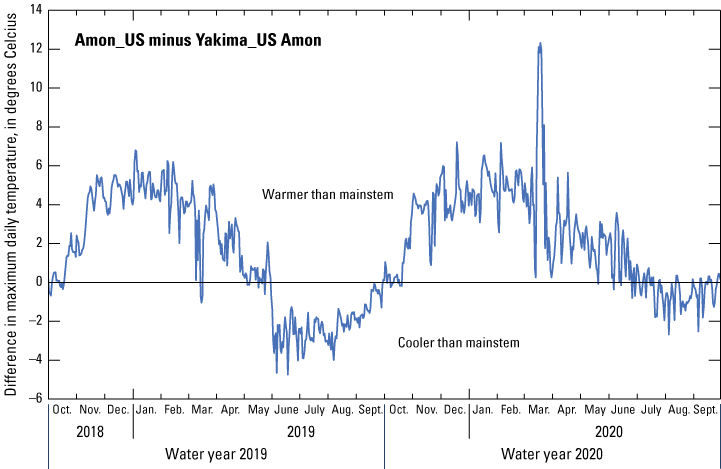
Comparison of maximum daily temperatures in the main stem upstream from Amon Wasteway to those in Amon Wasteway, Washington, water years 2019 and 2020. Positive values indicate main stem is warmer than the tributary input and negative values indicate main stem is cooler than the tributary input. For site identifier explanations, see table 1.
Table 3.
Summary of maximum daily temperature differences of more than 2 degrees Celsius between cold˗water input and the main stem at each monitoring location, lower Yakima River, from June through September 2019 and 2020.[WY, water year; °C, degrees Celsius; I˗182, Interstate 182; RM, river mile; US, upstream; --, no data]
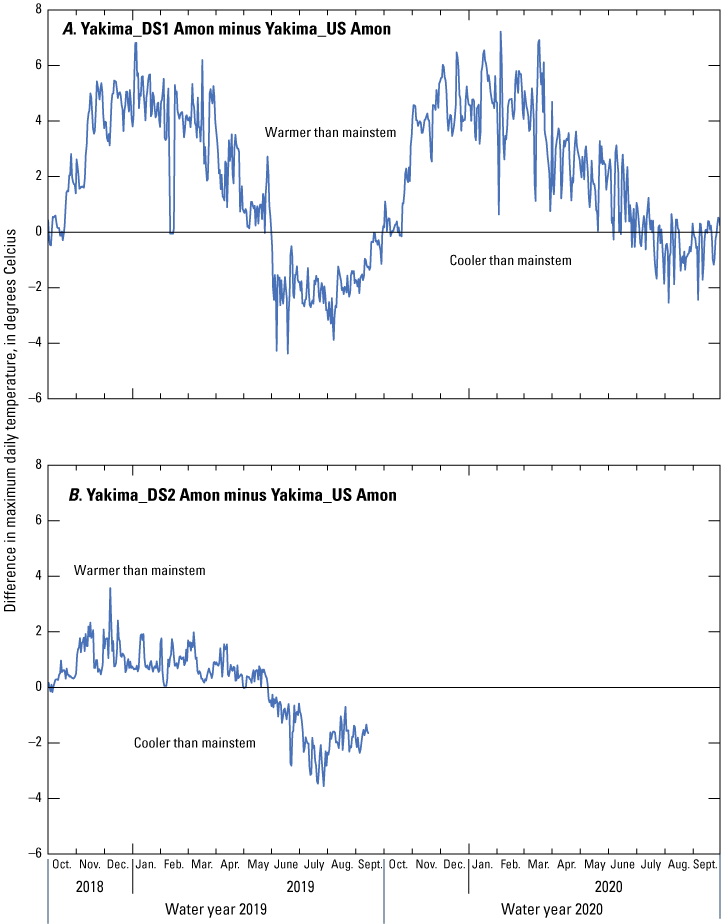
Difference between daily maximum temperatures upstream from Amon Wasteway, Washington, to Amon downstream 1 (A) and Amon downstream 2 (B), water years 2019 and 2020. Positive values indicate the main stem was warmed by Amon Wasteway and negative values indicate a cooling of the main stem from the wasteway. For site identifier explanations, see table 1.
Differences between monthly maximum daily temperatures across the Amon Wasteway sites were statistically significant. In water year 2019, June temperatures were warmest in the Yakima River upstream from Amon Wasteway and coolest in Amon Wasteway. Yakima_DS1 Amon was statistically similar to Amon_US and Yakima_DS2 Amon was similar to the Yakima River upstream from Amon; however, these two downstream locations were not statistically different from each other (fig. 15A). The overall pattern in June 2019 matches the observed time˗series data; water from Amon Wasteway was cooler than the main˗stem Yakima River upstream from the mouth of Amon Wasteway. In July and August 2019, the two sites downstream in the main stem were statistically similar to each other, and trended toward cooler temperatures from Amon Wasteway, with the upstream location significantly warmer than the other sites (fig. 15B–C). In contrast, as the main stem cooled in September, the daily maximum temperatures across the four sites were not statistically different from each other, indicating a change in thermal regime (fig. 15D).
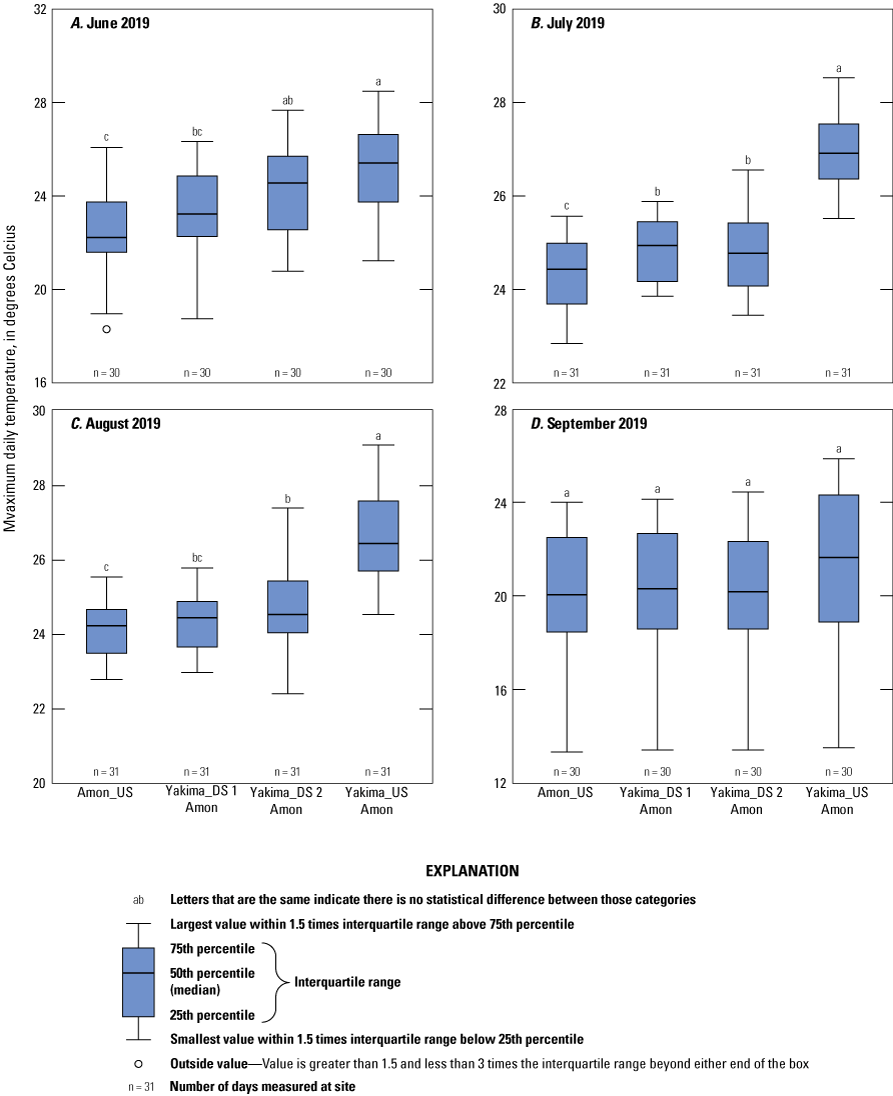
Maximum daily temperatures across sites near Amon Wasteway, Washington, June–September 2019. For site identifier explanations, see table 1.
In water year 2020, the patterns in monthly maximum daily temperatures were different compared to water year 2019. First, in June 2020 daily maximum temperatures in the main stem were cooler than Amon Wasteway or the downstream sites, which were statistically similar (fig. 16). Second, in July and September 2020 temperatures at all locations were statistically similar (fig. 16). Only in August 2020 was there a statistically significant cooling of the main stem from Amon Wasteway.
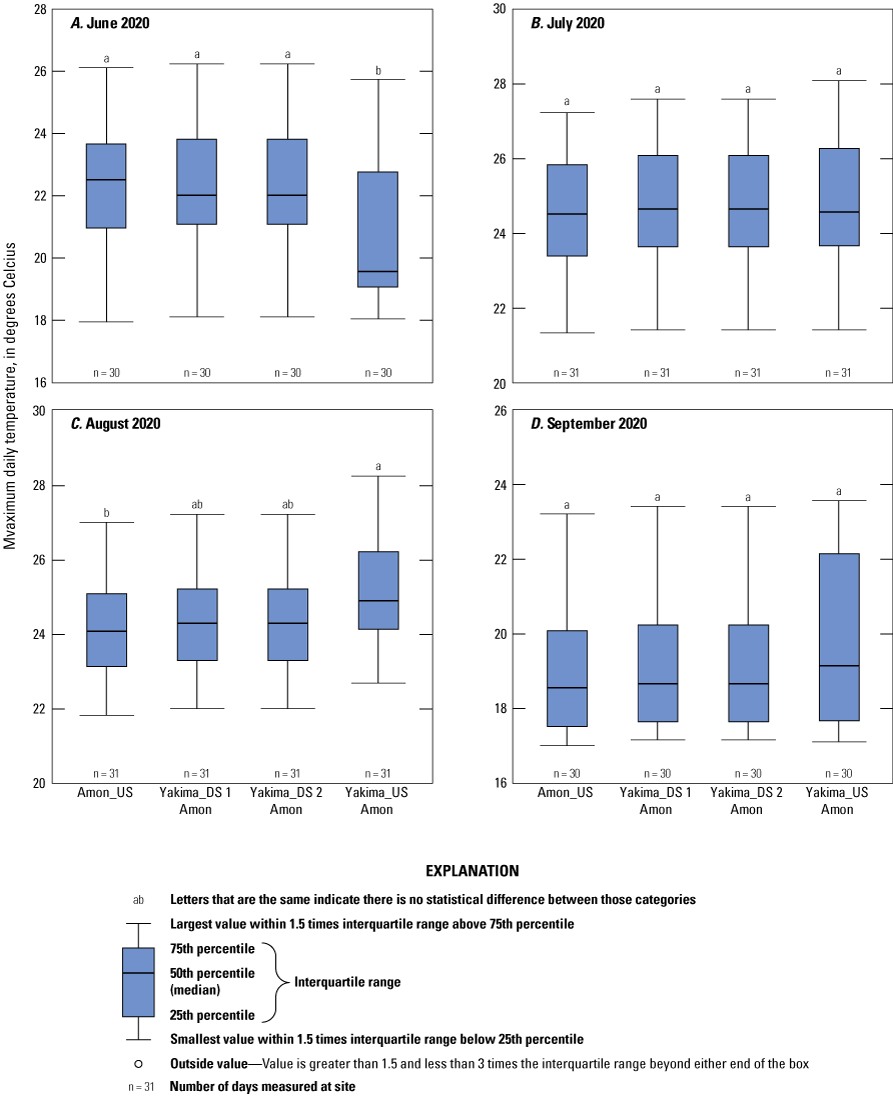
Maximum daily temperatures across sites near Amon Wasteway, Washington, June–September 2020. For site identifier explanations, see table 1.
I˗182 Side Channel
At the I˗182 location, maximum daily temperatures at the three monitoring locations followed similar patterns between water years 2019 and 2020 (fig. 17) with the largest values occurring during the summer months and smallest values during winter months. Sites in the side channel exceeded 21 °C in summer months and the number of days exceeding 21 °C ranged from 89 to 102 days during June through September in 2019 and 2020. In contrast, the groundwater input to the side channel stayed much cooler and only exceeded 21 °C for 5 days in August 2020 (table 2).
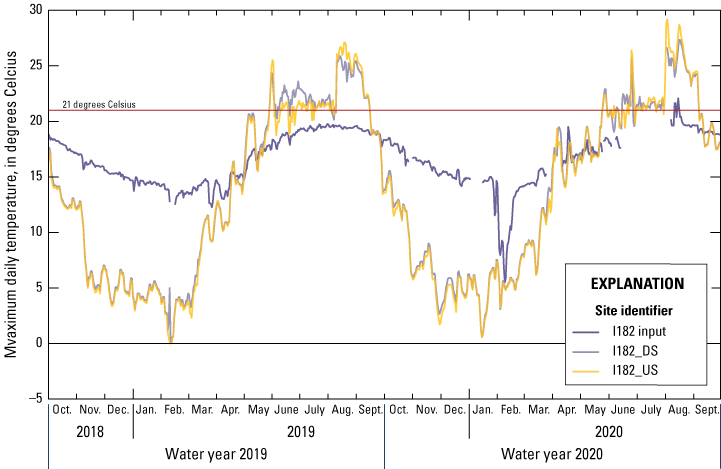
Maximum daily temperatures at the groundwater input and sites upstream and downstream from the input to the Interstate 182 side channel, Washington, water years 2019 and 2020. For site identifier explanations, see table 1.
The input from the groundwater pond was much warmer, by up to 10–12 °C, than the upstream and downstream locations in winter (fig. 18A–B). Beginning in late April, temperatures from the groundwater pond were cooler than the side channel locations, with some days 7–8 °C cooler (fig. 18A–B). The average difference between the I˗182 input and the side channel upstream was 3 °C in 2019 and 2020. In 2019, there were 74 days when the cold˗water input was at least 2 °C cooler than the side channel (table 3). The largest temperature difference between the cold˗water input and the side channel was August in 2019 and 2020, when the I˗182 input was about 5–6 °C cooler, on average, compared to the upstream location (table 3). However, these temperature differences were not consistently detected at the downstream monitoring location. The difference between maximum daily temperatures upstream and downstream from the groundwater input were less than 1 °C from late September through until spring (fig. 19), and in late spring through summer results were mixed with some days indicating a 2–3-°C warming in the side channel, and other times showing a 2–3-°C cooling trend in the side channel.
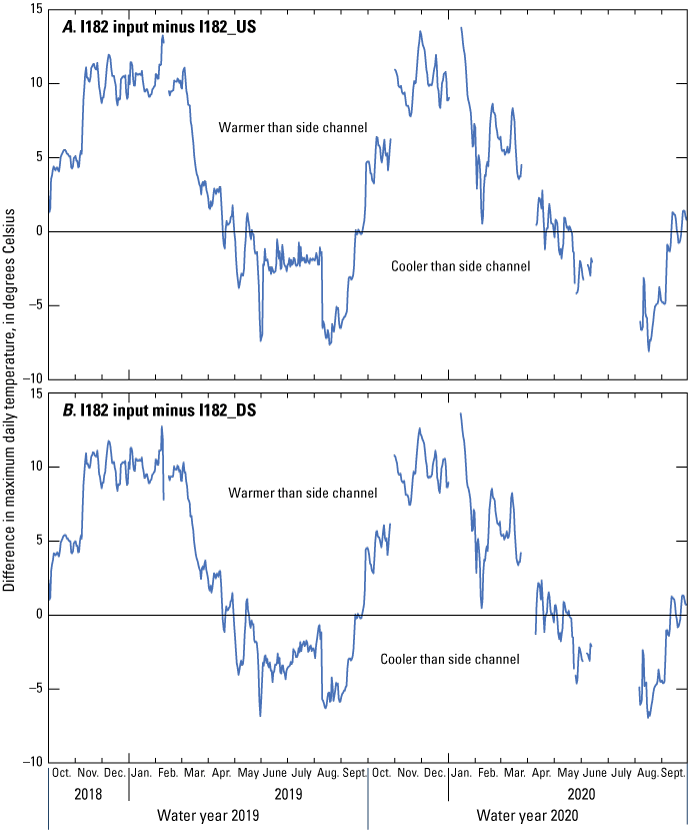
Difference between daily maximum temperatures of the groundwater input and the upstream (A) and downstream (B) side channel at Interstate 182, Washington, water years 2019 and 2020. Positive values indicate the groundwater input was warmer than the side channel and negative values indicate the groundwater input was cooler than the side channel. For site identifier explanations, see table 1.
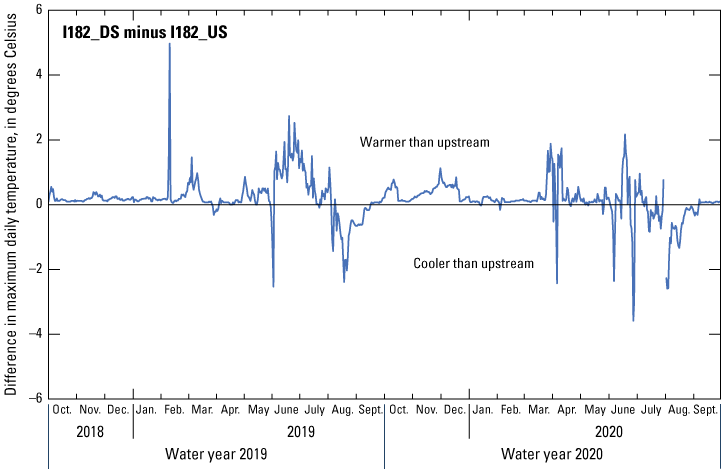
Difference between daily maximum temperatures downstream and upstream from the groundwater input in the side channel at Interstate 182, Washington, water years 2019 and 2020. Positive values indicate that downstream water is warmer than upstream and negative values indicate that downstream water is cooler than upstream. For site identifier explanations, see table 1.
These temperature differences are confirmed looking at the variation in monthly daily maximum temperatures across the three monitoring locations. In water year 2019, the I˗182 input was statistically cooler than the upstream and downstream locations from June through September (fig. 20). The downstream location is warmer than the upstream location in June and July 2019, cooler in August 2019, and by September 2019 the upstream and downstream temperatures are similar. In water year 2020, the I˗182 input was statistically cooler than the side channel locations in June through August but statistically similar in September, when the river began to cool (fig. 21). However, during water year 2020, the upstream and downstream temperatures were not statistically different from each other throughout summer months (fig. 21). The temperature data from the I˗182 input site were influenced by solar radiation, as indicated by large diurnal temperature variations, during July 2020 and not included in this analysis. Variability in the temperature data indicated that the sensor was out of water or close to out of water, and temperatures were more indicative of air temperature than water temperature.
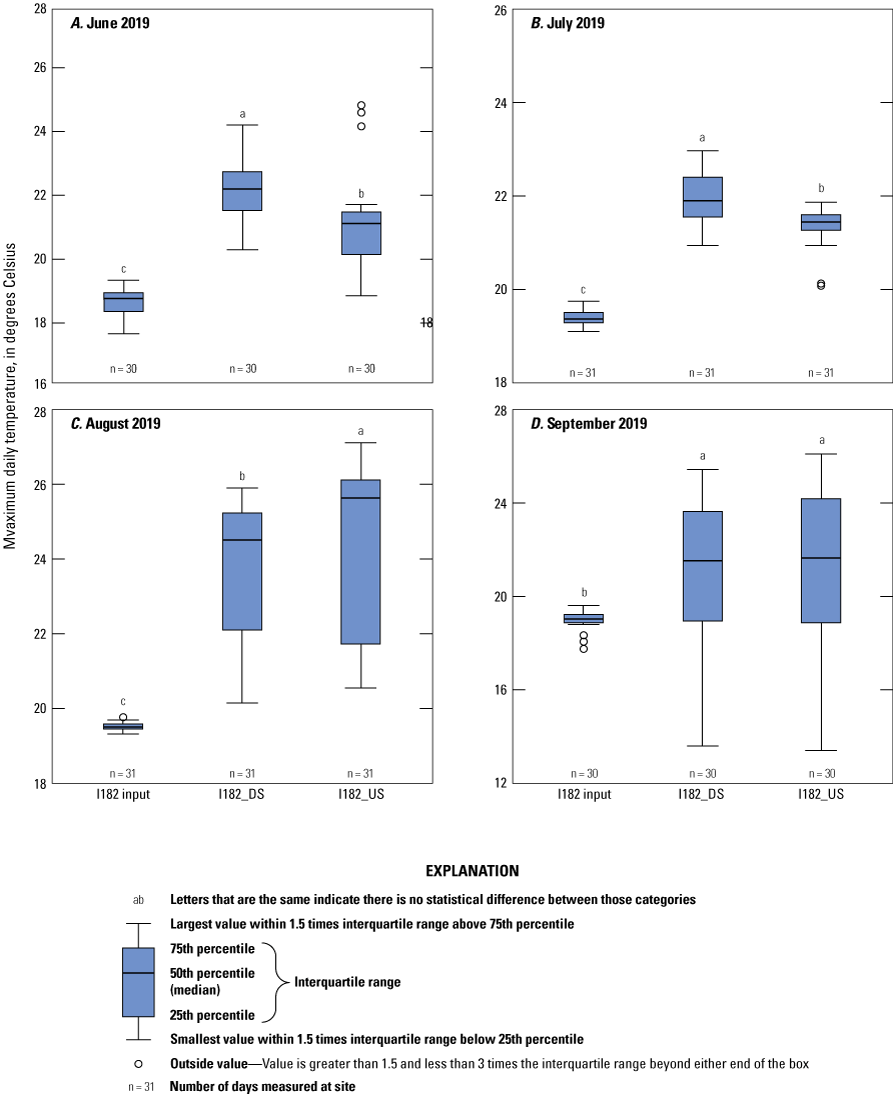
Maximum daily temperatures across sites in the Interstate 182 (I˗182) side channel, Washington, June–September 2019. For site identifier explanations, see table 1.
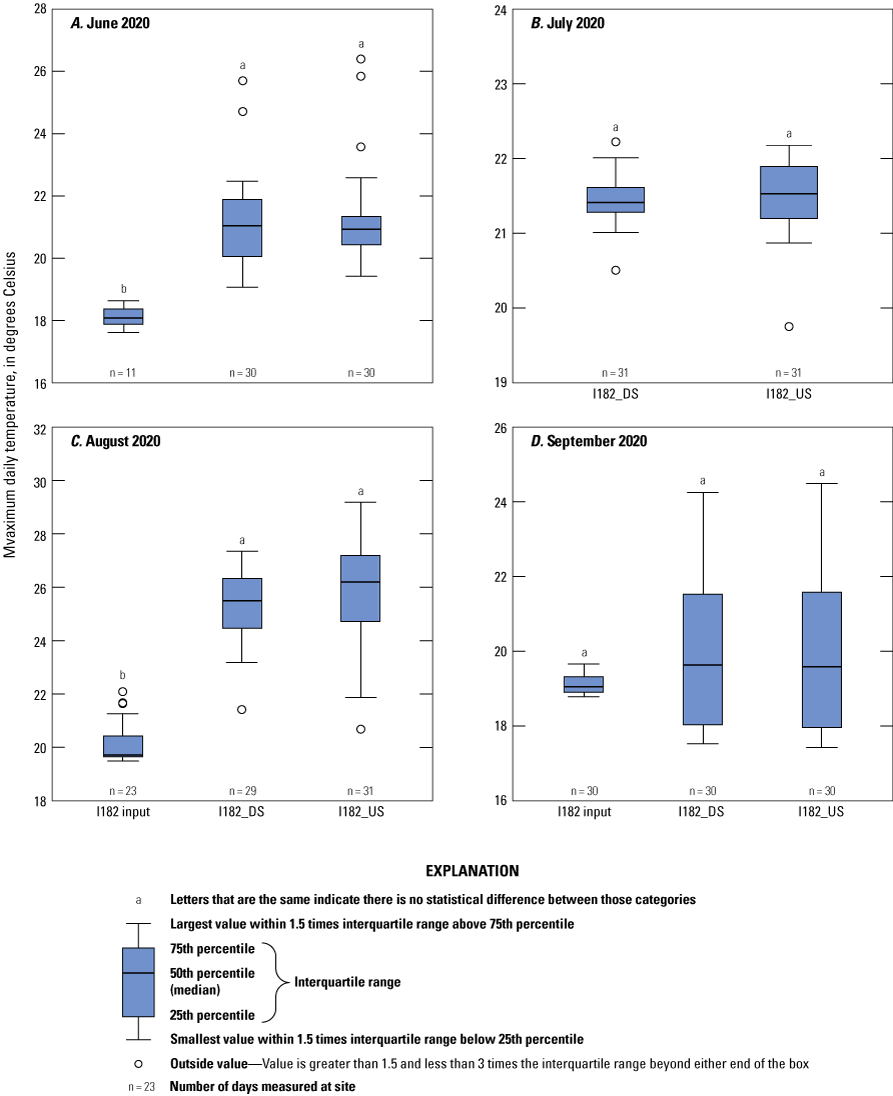
Maximum daily temperatures across sites in the Interstate 182 (I˗182) side channel, Washington, June–September 2020. For site identifier explanations, see table 1.
Data from this location indicate potential for creating cold˗water refuges, as indicated by the large differences between the I˗182 input and side channel temperatures. However, these differences are not translated downstream because of thermal mixing, limiting the usefulness of this refuge site in its current hydrological condition.
Fox Island Side Channel
The Fox Island side channel site was monitored from September 2018 to September 2020. Maximum daily temperatures from the Fox Island pool and the main stem of the river at Van Giesen followed similar patterns throughout the water year. Winter temperatures were coolest (around 5 °C) in January, warmed during spring, and peaked at about 27 °C in July and August. Maximum temperatures exceeded 21 °C almost every day from June until early September (fig. 22; table 2). In water year 2019, temperatures exceeded 21 °C from 108 to 110 days, and in water year 2020 they ranged from 89 to 95 days.
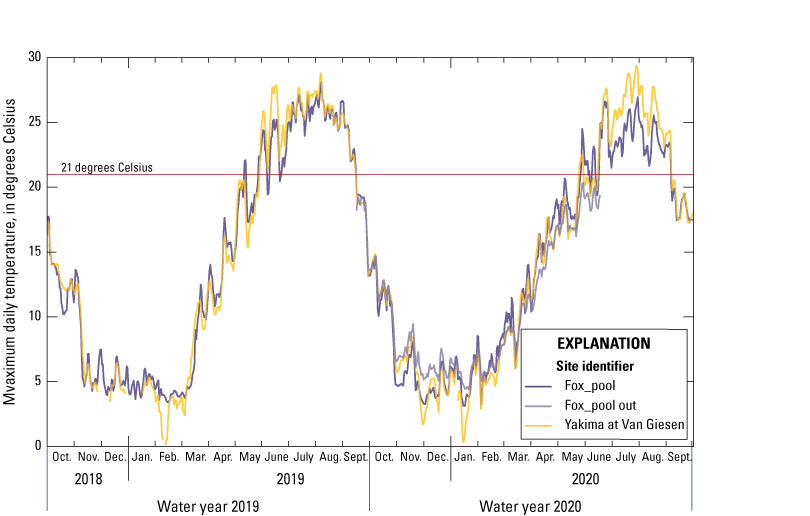
Maximum daily temperatures at the Fox Island side channel pool and the main stem of the Yakima River at Van Giesen, Washington, water years 2019 and 2020. For site identifier explanations, see table 1.
Comparison between the Fox Island pool and the pool outlet from September 2019 to June 2020 showed that on average the difference in maximum daily temperatures during this period was about 0.2 °C. From September 2019 through early February 2020, the pool outlet was warmer than temperature in the pool; it became cooler compared to the pool temperature from March through the end of data collection in June 2020 (fig. 23). The purpose of installing the sensor at the pool outlet was to determine thermal patterns that were entering the main stem; however, because this sensor was lost during the first year of data collection, further comparisons to the Yakima River main stem in this area rely on the more complete record from the side channel pool. The limited data from the pool outlet indicate that between the side channel pool and the outlet, some cooling is taking place during summer months, which could enhance thermal refuges in this area (fig. 23).
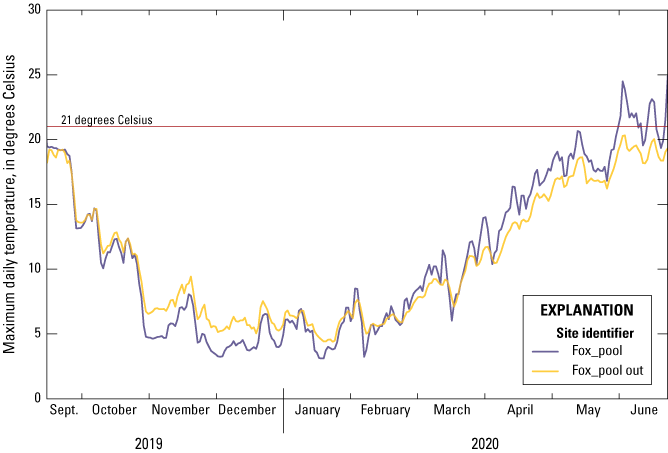
Comparison of maximum daily temperatures from in the side channel pool and the pool outlet at the Fox Island, Washington, September 2019–June 2020. For site identifier explanations, see table 1.
Differences in maximum daily temperatures between the side channel pool and the main stem at Van Giesen followed similar patterns as other refuge locations, but they were not as pronounced. From winter through spring, pool temperatures were warmer than the main stem and in summer months the pool was cooler than the main stem. However, these patterns are not consistent, with several days throughout the year when the opposite is observed, and the pool is cooler than the main stem in winter and warmer than the main stem during summer months (fig. 24). In 2019, June temperatures in the pool were, on average, 2.1 °C cooler than Van Giesen, but from July through September, there were no days when the difference was greater than 2 °C (table 3). In contrast, the Fox Island pool was at least 2 °C cooler for 45 days in July and August 2020 (table 3).
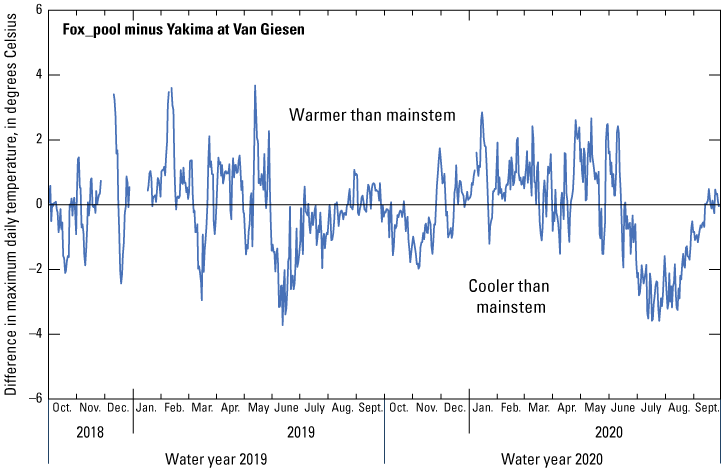
Difference in maximum daily temperatures between the Fox Island pool and main stem of the Yakima River near Van Giesen, Washington, water years 2019 and 2020. Positive values indicate the side channel pool was warmer than the main stem, negative values indicate the pool was cooler than the main stem. For site identifier explanations, see table 1.
Benton Side Channel
The Benton side channel location was instrumented for up to 1 year at six locations. Three sites (Benton 1, Benton 2, and Benton 6) collected data from September 2019 through September 2020, and an additional three sites (Benton 3, Benton 4, and Benton 7) installed by BCD recorded data from August through September 2020; however, the sensor at Benton 7 only recorded for about 2 weeks (August 7–August 21, 2020) and is not included in analysis. These five side channel sensors (Benton 1–4, and 6) were compared to the main˗stem temperatures at Kiona, about 2 river miles upstream. Maximum daily temperatures in the side channel exceeded 21 °C most days from mid˗June through mid˗September 2020, with minimum temperatures recorded during winter months (fig. 25). From October 2019 through early June 2020, the main˗stem temperatures at Kiona were similar to the side channel temperatures. During August 2020 through September 2020, when the five side˗channel and Kiona sensors were collecting data, maximum daily temperatures were within a few degrees of each other until early September, when these differences decreased, and temperatures were uniform throughout the side channel (fig. 26). The temperature differences were not consistent with water cooling as it flowed through this side channel from Benton 6 at the upstream end to Benton 1 at the most downstream end. For example, maximum daily temperatures at Benton 3 and Benton 4, in the center of the channel, were cooler than other sites, which indicated that along the length of the side channel there were diffuse areas of cooler water entering. However, this cooler water still exceeded the criteria of 21 °C. In addition, maximum daily temperatures at Kiona were always warmer than the side channel during this period.
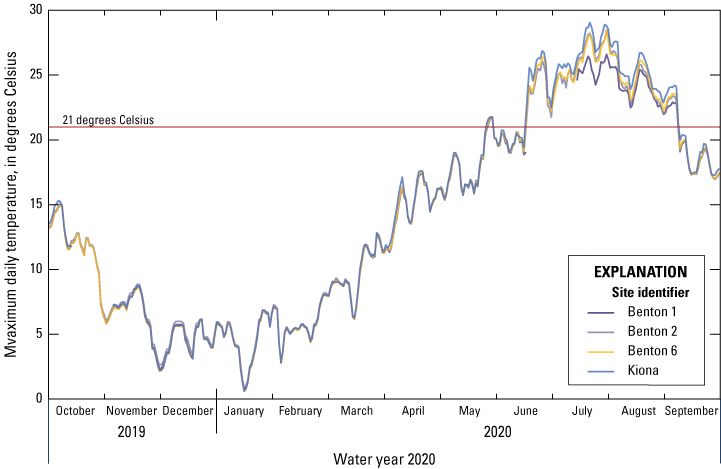
Maximum daily temperatures across the three primary Benton side channel sites (Benton 1, 2, and 6) and the main stem at Kiona, Washington, water year 2020. For site identifier explanations, see table 1.
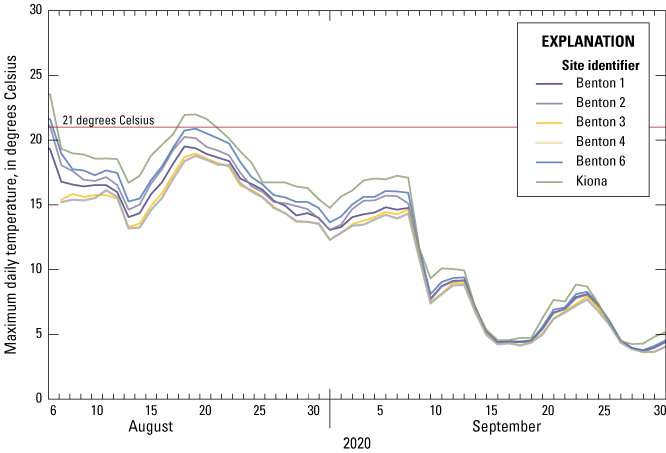
Maximum daily temperatures across the five Benton side channel sites and the main stem at Kiona, Washington, from August through September 2020. For site identifier explanations, see table 1.
Even though the side channel temperatures exceeded 21 °C most of the summer months, July 2020 temperatures at the downstream end of the side channel were 2.3 °C cooler on average compared to the data at Kiona (table 3). In addition, differences between the upstream (Benton 6) and downstream (Benton 1) end of the side channel showed significant cooling through July and August 2020, with some days the temperature difference ranging from 2 to 2.5 °C between the two sites (fig. 27).
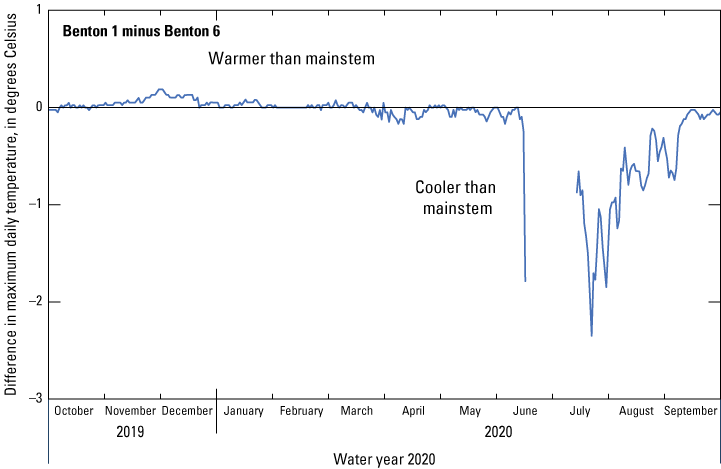
Difference in maximum daily temperatures between the upstream (Benton 6) and downstream (Benton 1) ends of the Benton side channel, Washington, water year 2020. Positive values indicate a warming trend as water moved through the channel and negative values indicate a cooling trend. For site identifier explanations, see table 1.
Corral Creek
Maximum daily temperatures at Corral Creek followed similar patterns as recorded elsewhere (fig. 28). During autumn and winter, Corral Creek input was warmer than the main stem of the Yakima River; but in early spring through the rest of the water year the creek became cooler than the main stem. Maximum daily temperatures in the main stem upstream and downstream from Corral Creek exceeded 21 °C for 60 days between mid˗June and early September (fig. 28), though Corral Creek exceeded this value for 20 days during July 2020.
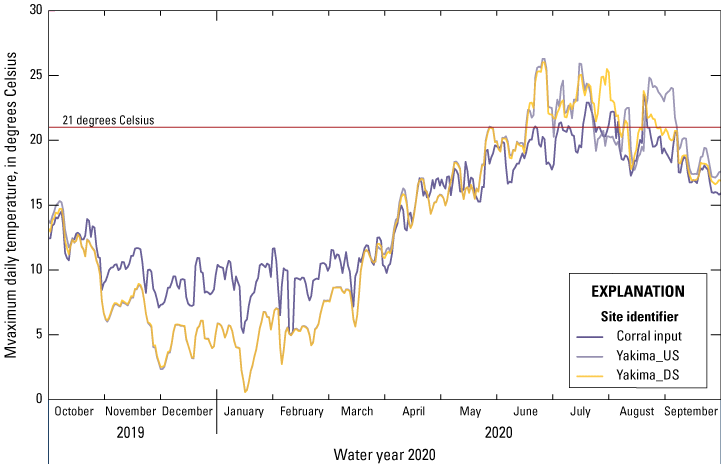
Maximum daily temperatures across the Corral Creek tributary sites, Washington, water year 2020. For site identifier explanations, see table 1.
In the summer months (June–September 2020), differences in maximum daily temperature between Corral Creek and the Yakima River upstream averaged about 2 °C but were 6–7 °C on occasion (fig. 29A). Furthermore, cold water from Corral Creek translated downstream where temperatures were often 2–4 °C cooler than upstream from the Corral input (late August through September 2020, figure 29B). From June through September 2020, there were 47 days when Corral Creek was at least 2 °C cooler than the main stem upstream and ranged from 2.6 °C cooler in June to 1.2 °C cooler in August (table 3).
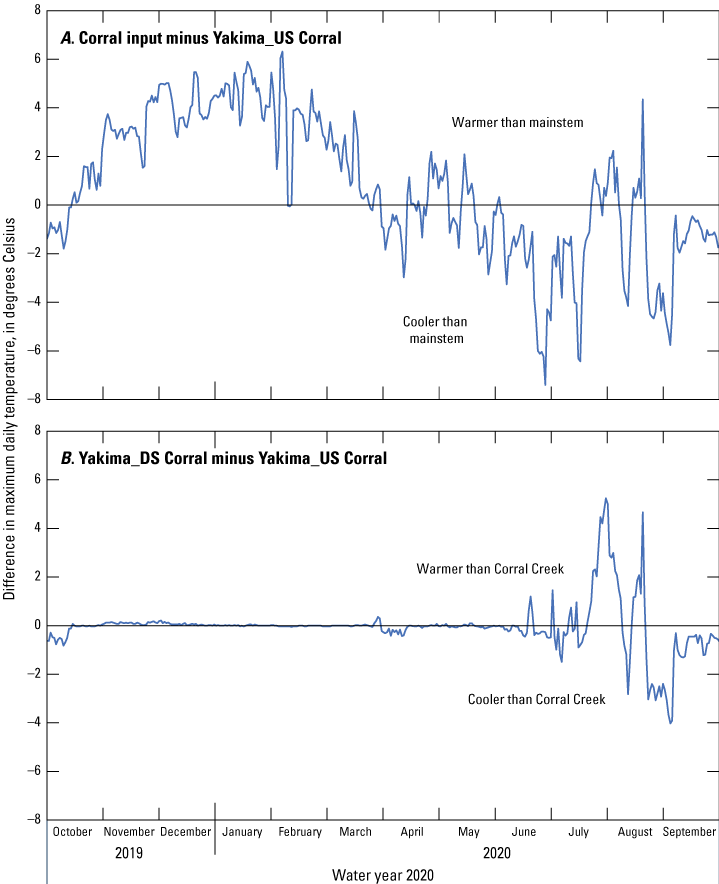
Difference in maximum daily temperatures between Corral Creek input and the Yakima River upstream (A), and between main stem of the Yakima River upstream and downstream from Corral Creek (B), Washington, water year 2020. Positive values in (A) indicate that Corral Creek was warmer than the main stem and negative values indicate the creek was cooler than the main stem, and Positive values in (B) indicate that the main stem was not warmed by Corral Creek and negative values indicate the creek was cooled by Corral Creek. For site identifier explanations, see table 1.
The variability of monthly maximum daily temperatures shows significant differences between the Corral Creek input and the Yakima River main stem; however, these relationships changed from June through September 2020 (fig. 30). In June and August 2020, the upstream and downstream Yakima River main˗stem temperatures were similar to each other, and both were warmer than the Corral Creek input. In July 2020, Corral Creek had the coolest temperatures, the main˗stem temperatures downstream from Corral Creek were the warmest, and both were statistically different from the upstream temperatures. In September 2020, there was evidence that cooler Corral Creek water was translated about 100 feet to the downstream site, and both are significantly cooler than the Yakima River upstream (fig. 30).
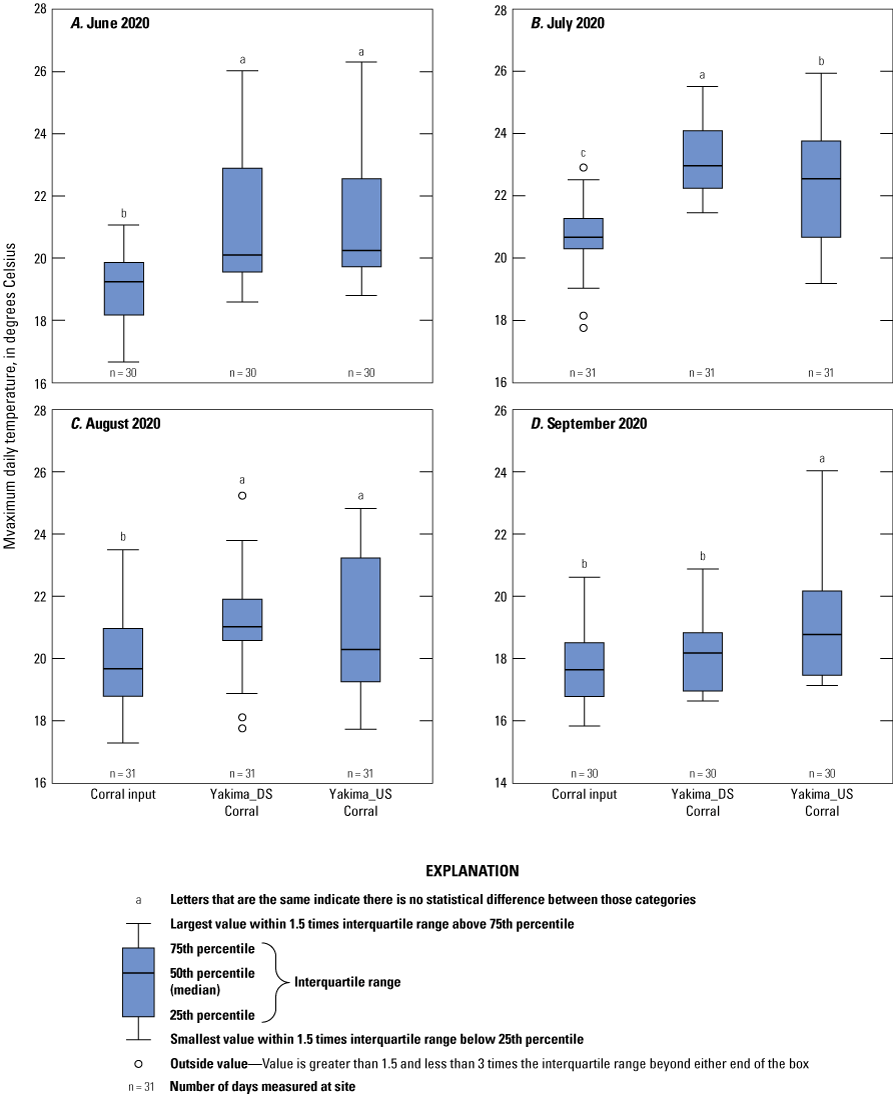
Variation of maximum daily temperatures across sites near Corral Creek, Washington, June–September 2020. For site identifier explanations, see table 1.
Spring/Snipes Creek Side Channel and Tributary
Four temperature sensors were installed for up to two years near Spring/Snipes Creek (fig. 8). Maximum daily temperatures followed the same patterns as other refuge sites; the coolest temperatures were in winter and warmest in summer months, with temperatures often exceeding the criteria of 21 °C (fig. 31). In water year 2019, the Snipes Creek input exceeded 21 °C for 87 days compared to 105– 107 days in the main stem and side channel upstream from Snipes Creek, respectively (table 2). In water year 2020, the number of days that exceeded 21 °C decreased slightly for the main stem and side channel locations to 83–94 days, respectively. However, the Snipes Creek input was much cooler during water year 2020, with only 34 days when it exceeded the 21-°C criteria (table 2).
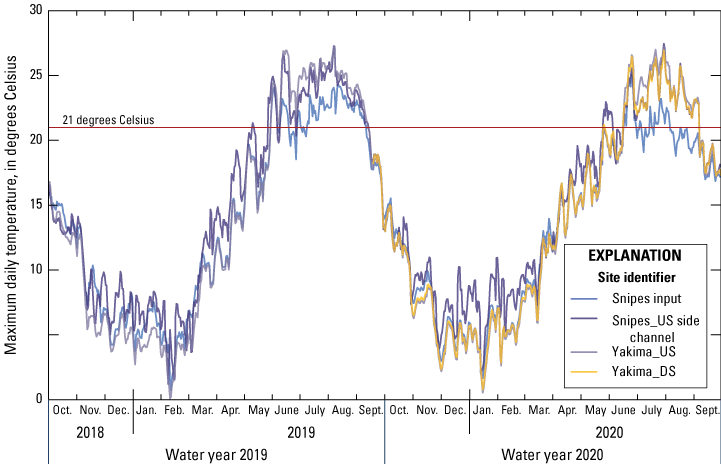
Maximum daily temperatures across the four Snipes Creek tributary sites, Washington, water years 2019 and 2020. For site identifier explanations, see table 1.
In summer months, the maximum daily temperatures in the Snipes Creek input were up to 5–6 °C cooler than the Yakima River main stem upstream (fig. 32A). In addition, the difference between maximum daily temperatures in the main stem of the river upstream and downstream from Snipes Creek were 1–2 °C cooler during the summer months, indicating that the Snipes Creek input was influencing main˗stem temperatures for about 300 feet downstream (fig. 32B). From June through September, the Spring/Snipes input was, on average, 2.2 °C cooler than the main stem in 2019, and 2.3 °C cooler in 2020 (table 3). The largest differences were in July and August 2020, when the input from Spring/Snipes Creek was on average 3.6–3.9 °C cooler than the main stem (table 3).
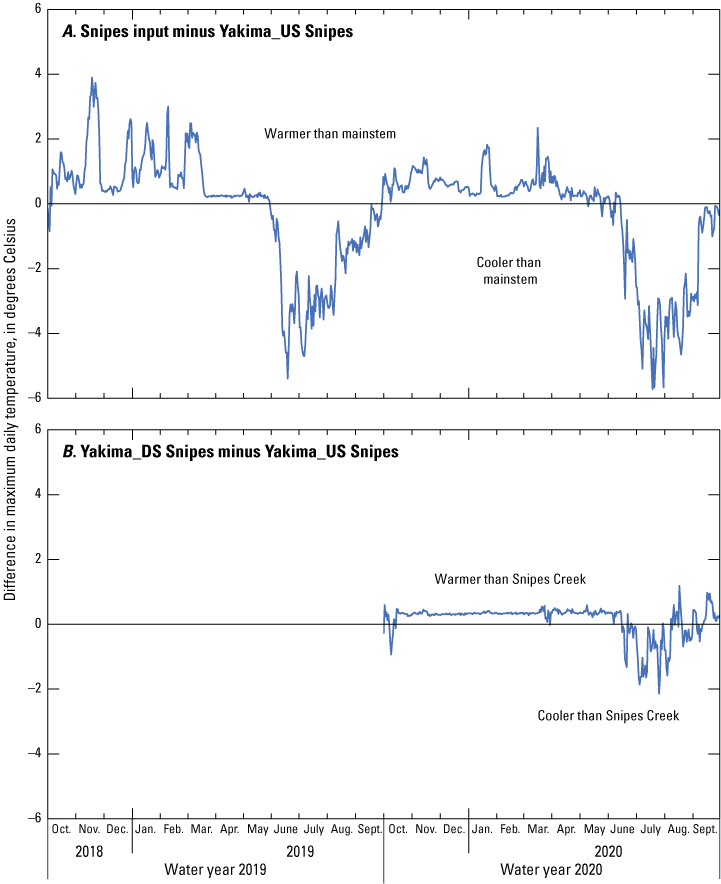
Difference in maximum daily temperatures between Snipes Creek input and the Yakima River upstream for water years 2019 and 2020 (A) and the main stem of the Yakima River upstream and downstream from Snipes Creek, Washington, water year 2020 (B). Positive values in (A) indicate that Snipes Creek was warmer than the main stem and negative values indicate the creek was cooler than the main stem, and Positive values in (B) indicate that the main stem was not warmed by Snipes Creek and negative values indicate the creek was cooled by Corral Creek.For site identifier explanations, see table 1.
Monthly variation in maximum daily temperatures in water year 2019 showed that from June through August, Snipes Creek input was significantly cooler than sites in the side channel and upstream in the main stem, and the side channel site was significantly cooler than the upstream site in the main stem (fig. 33). In September 2019, maximum daily temperatures at all sites were statistically similar (fig. 33). Patterns in monthly variation in maximum daily temperature were different in summer 2020. In June 2020, monthly temperatures were similar across all sites and again in September 2020 (fig. 34). However, in July and August 2020, the Snipes Creek input was significantly cooler than the other three locations (fig. 34).
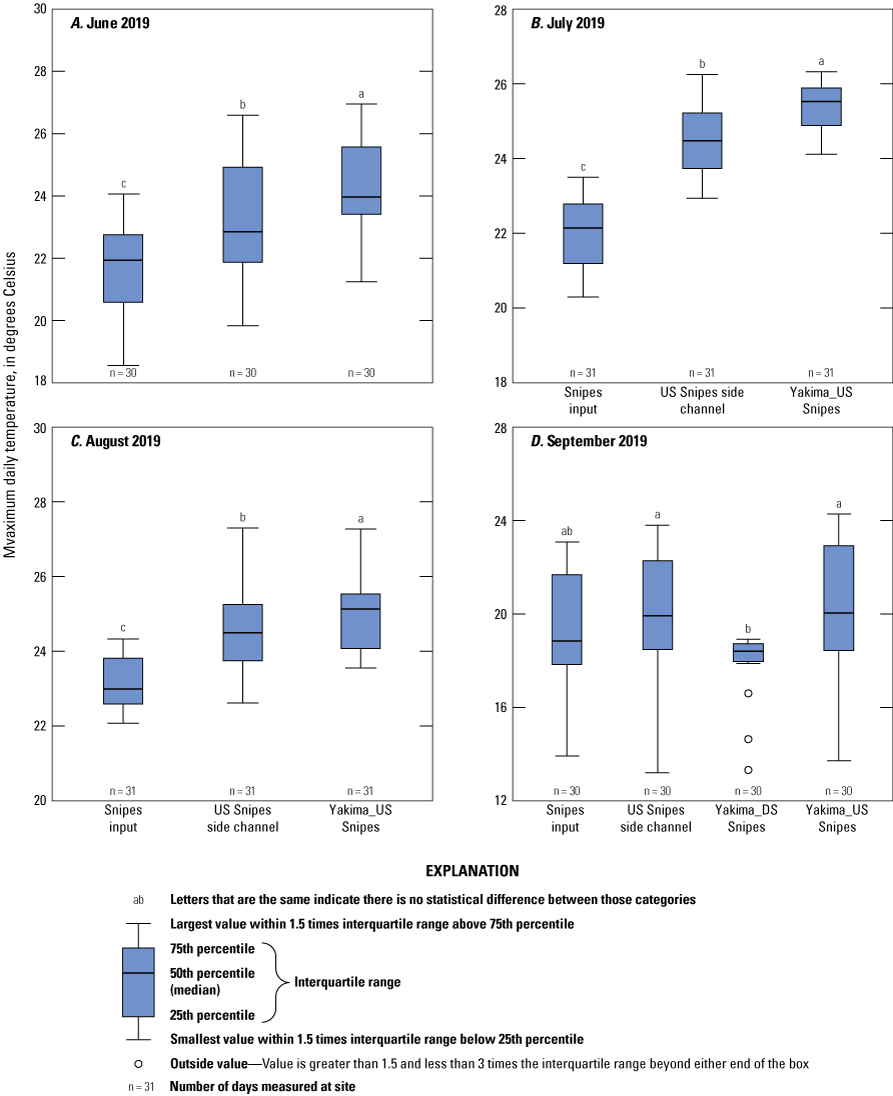
Variation of maximum daily temperatures across sites near Snipes Creek, Washington, June–September 2019. For site identifier explanations, see table 1.
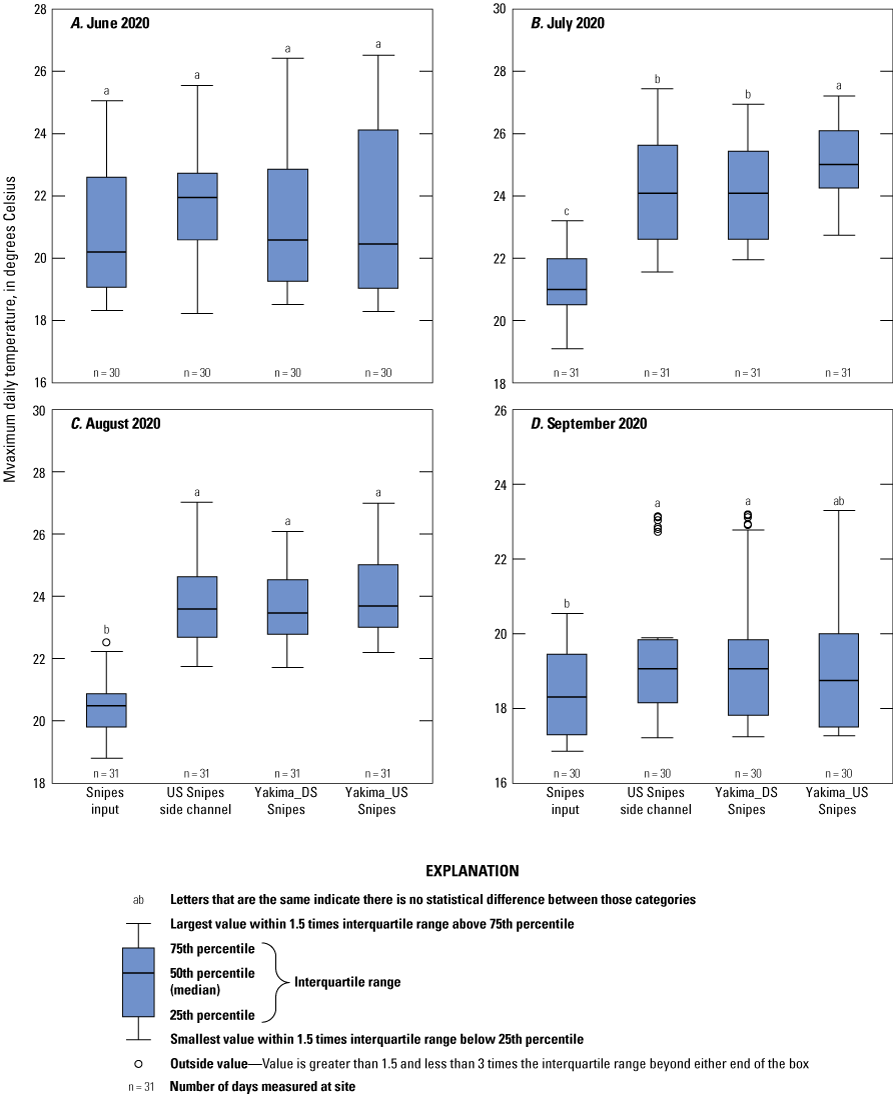
Variation of maximum daily temperatures across sites near Snipes Creek, Washington, June–September 2020. For site identifier explanations, see table 1.
Zillah Side Channel and Alcove
Three temperature sensors were installed across different types of cold˗water inputs near Meyers Rd. near Zillah, Washington, and RM 91. There were sensors in McCoy tributary, the McCoy side channel, and Zillah alcove (fig. 9). The temperature sensor installed at the McCoy tributary only collected data from July 22 to August 21, 2020, and maximum daily temperatures exceeded 21 °C every day it was deployed. Cold˗water influence was not observed in the McCoy tributary, so it was removed from the analysis and results. Of the remaining two sites, maximum daily temperatures remained below 21 °C during the entire water year in 2020 except for three days in June 2020 in the McCoy side channel (fig. 35; table 2). The temperature sensor in the main˗stem Yakima River at RM 91 was lost during the deployment, so the McCoy side channel temperatures were compared to the BCD monitoring location upstream at RM 93. This main˗stem sensor collected data from August 7 to October 30, 2020, and maximum daily temperatures in the main stem were warmer than the McCoy side channel and Zillah alcove sites, remaining warmer than 21 °C until early September 2020 (fig. 36).
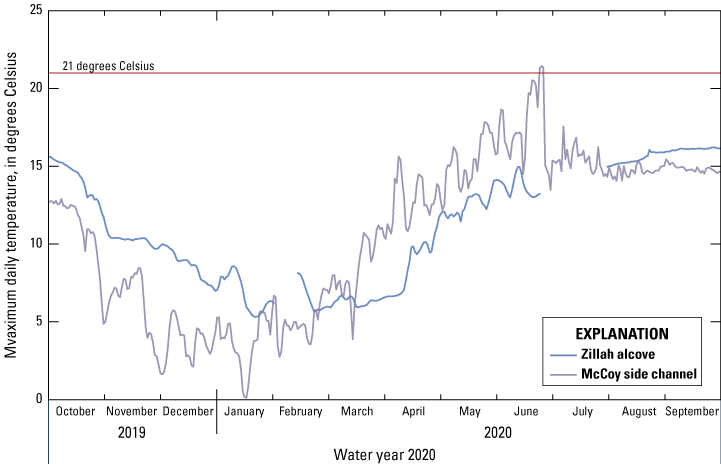
Maximum daily temperatures at the McCoy side channel and Zillah alcove sites near Zillah, Washington, water year 2020.
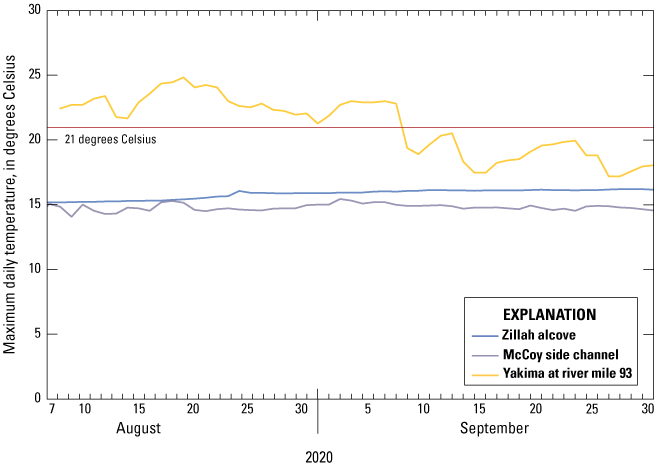
Comparison of maximum daily temperatures from the Zillah cold˗water sites to the main stem of the Yakima River upstream at river mile 93, Washington, August–September 2020.
Discussion
Continuous temperature monitoring at seven locations in the lower Yakima River revealed consistent patterns during the September 2018 to September 2020 period. The main stem of the Yakima River exceeded 21 °C almost every day in the summer months at all locations. On average, the main˗stem maximum daily temperatures exceeded 21 °C for more for 92 days during summer months (June through August, table 2); some locations exceeded 21 °C for over 110 days. The extended time where main˗stem temperatures are above 21 °C is problematic because summer months are when summer Chinook salmon and Sockeye salmon attempt to migrate through the lower Yakima River (Kock and others, 2020). Salmonids have a preferred temperature of less than 20 °C (Neill, 1979), and water temperatures of 22 °C exceed their thermal tolerance and can be lethal (Brett, 1971). Therefore, current thermal conditions in summer months in the lower main˗stem Yakima River are detrimental to the survival of these migratory species.
Data from this study show that cold˗water inputs provide water that is substantially cooler than the main˗stem Yakima River during warm summer months (June through August), so enhancement of these sites to maximize the spatial extent of cooling could benefit salmon during these periods. Even though many tributaries exceed the maximum daily temperature of 21 °C, these water sources are often at least 2 °C cooler compared to the main stem (table 3). For example, in 2019, Amon Wasteway was at least 2 °C cooler than the main stem for 72 days from June through September, despite being warmer than 21 °C during this same period. This temperature difference might explain why adult Sockeye have been observed holding near the Amon Wasteway mouth in temperatures otherwise too warm for these species. However, the exceedingly warm temperatures in the lower Yakima River during summer months have been shown to deter adult Sockeye salmon from entering and migrating upstream (Kock and others, 2020).
Cold˗water sources from tributaries (Amon Wasteway, I˗182 groundwater spring, Corral Creek, and Snipes Creek) showed the same patterns across sites. Tributary inputs remained cooler than the main stem of the Yakima River during summer months, indicating these tributaries could act as thermal refuges for salmonids where the cooler water enters the main stem of the river. The difference between the tributary input temperatures and the main˗stem river temperatures varied across sites, with Amon Wasteway showing the smallest difference (0–4 °C), and the I˗182 spring input showing the greatest difference (0–8 °C). Corral and Spring/Snipes Creeks showed similar differences, ranging from 0 to 6 °C compared to the upstream main˗stem temperatures. However, these cooler water conditions were diminished by early to mid˗September, when the main stem of the Yakima River began to cool and the potential benefit from these tributaries decreases (table 3). Therefore, development of these cool˗water patches into potential thermal habitat would benefit the earliest adult salmonid migrants, namely Sockeye, and spring and summer Chinook salmon. Across all sites, and both water years, the main stem of the Yakima River consistently exceeded 21 °C from late May˗early June until early to mid˗September (table 2).
In contrast to summer month conditions, tributary inputs were warmer than the main stem during late autumn and winter. Amon Wasteway was about 4–6 °C warmer than the main˗stem Yakima River. Spring/Snipes and Corral Creeks were 2–4 °C warmer, and the I˗182 spring input was 8–10 °C warmer during the winter months. The warmer temperatures in winter at these sites could benefit native fish species, and the relationships between fish use in winter at these locations could be the focus of new research.
The data show that cooler water entering the main stem from tributaries results in cooler conditions downstream. Two monitoring locations, downstream from Amon Wasteway, indicated that main˗stem temperatures along the bank decreased at least 2–4 °C to a downstream distance of 175 feet from the tributary input. At the Corral Creek monitoring location, late summer temperatures in 2020 decreased by 2–4 °C at the monitoring location 100 feet downstream from the tributary input. Main˗stem temperatures downstream from Snipes Creek were the least reduced but still showed about a 2-°C difference compared to the upstream monitoring location.
Although not as pronounced as a tributary flow, cold water from non˗point sources (such as groundwater seeps) shows potential for cooling. For example, the Benton side channel showed some cooling at the downstream end (fig. 26). In addition, temperatures at the downstream end of the side channel at Spring/Snipes Creek were cooler compared to the main˗stem temperatures upstream.
Cold˗water heterogeneity in the lower Yakima River has been documented (Appel and others, 2011; Gendaszek and Appel, 2021), but how these areas are used by native resident and migratory fish species is not as well understood. Berman and Quinn (1991) studied thermoregulation by spring Chinook salmon in the upper Yakima River. They reported that adult Chinook were associated mostly with islands, pools, and rock outcroppings along the stream banks. In particular, streamflow associated with islands could be diverted through loose gravels at the head of the island and emerge downstream where it can cool as it flows through the subsurface. Kock and others (2020) monitored tagged Sockeye salmon from June through October 2019, showing that out˗migrating salmonids left the lower Yakima River during a period of increasing water temperature, and the tagged Sockeye salmon did not reenter the Yakima River until September, when water temperatures cooled. Tagged fish in that study used thermal refuges near cooler tributaries for about 30 minutes on average before leaving the lower river in June, and about 2–3 hours, on average, during migration upstream to Prosser Dam in September 2019. There is some evidence that fish use some of the cooler water inputs. Enhancing the cold˗water inputs to provide more functional thermal refuge habitat (for example, increased depth, enhanced shading, or decreased mixing with warmer river water) might help adult salmon migrate, especially if the main˗stem Yakima River continues to warm as a function of climate change.
Kurylyk and others (2015) reviewed management strategies for preserving and enhancing existing thermal refuges, and for creating new thermal refuges. For example, groundwater and surface˗water interactions and hyporheic exchange can result in thermal anomalies in rivers and streams (Brunke and Gonser, 1997). Characteristics of the river corridor that enhance groundwater and surface˗water exchange include complex instream habitats, stream meanders, side channels, and riffle˗pool sequences. Maintaining or enhancing these characteristics, when feasible, could result in lower water temperature or reduced stress to fish. In addition, reconnection of disconnected cold˗water side channels (alcoves) might provide additional thermal refuge habitat for migratory fish. Furthermore, installation of deflection barriers where cold tributaries join a warm main stem can reduce the hydraulic and thermal mixing between cold˗water plumes and the main stem, resulting in an increased area of cold water (Bilby, 1984; Kurylyk and others, 2015). Experimental riparian shading reduces surface water temperatures up to 4 °C (Ebersole and others, 2003) in small streams. Increasing shading with native plantings along the banks and confluence of tributaries (such as Spring/Snipes or Corral Creeks) could result in substantive thermal benefits. The Benton side channel is mostly shaded throughout, which might contribute to some of the cooling measured at the location. In contrast, Amon Wasteway is heavily shaded in the lower reaches prior to entering the Yakima River, yet still exceeded 21 °C for most of the summer months. These differences in how water temperatures respond to shading suggest that although shading in tributary basins could mitigate warming, it might require multiple interventions to improve cold˗water conditions.
Work to enhance cold˗water areas on the lower Yakima River is underway. Mid˗Columbia Fisheries, in coordination with Benton Conservation District, installed a thermal refuge demonstration project at RM 25 on the lower Yakima River in 2019 after monitoring of springs and seeps from 2016 to 2018 indicated cold˗water refuge potential at the site (Smith and others, 2019). At RM 25, an elevated agricultural road prevented the oxbow’s cold˗water flow from entering the Yakima River. This project replaced undersized culverts under the agricultural roads with two gated culverts to manage of the water levels. The concentrated cold˗water flows from the newly designed 520˗foot excavated oxbow into a constructed alcove on the main˗stem river. The project was designed to mimic floodplain function under normative flows by increasing the cold˗water influence of the oxbow on the river. Planting native trees and shrubs along the oxbow provides shade and decreases downstream warming in the excavated oxbow. In 2021, the project began monitoring fish use at the newly constructed alcove using passive integrated transponder tag antenna to better understand the project’s impact on migrating juvenile and adult salmon. Future thermal restoration projects are currently (2023) in consideration for the I˗182 side channel and Amon Wasteway. The I˗182 side channel showed the most potential for cold˗water refuge in this study because of the differences in cold water; however, the cold˗water source flow volume at the I˗182 site is much less than other sites investigated (Amon Wasteway, and Corral and Spring/Snipes Creeks). Furthermore, because of current hydrologic conditions (such as low flow, shallow depth, high macrophyte abundance), the site is not currently (2023) a functional habitat for migrating fish. Development of thermal refuge projects could consider additional parameters (such as flow volume, stability of the cold˗water source, and monitored temperature) for determining sites for thermal refuge habitat enhancement.
Many of the monitored cold˗water areas exceeded the 21-°C State threshold for many of the summer months and might not provide physiological refuge for all adult native species. These areas were frequently cooler than the main˗stem river temperatures during base˗flow conditions, by at least 1–2 °C, and if enhanced, might provide thermal refuge (table 3). Thermal habitat enhancement on the lower Yakima River, to insulate native adult salmonid populations against warming river temperatures driven by climate change, would likely reduce stress on salmonids.
Summary
Results from the current study provide long˗term temperature data for cold˗water areas on the lower Yakima River. Over a 2˗year period, data showed that tributary inputs are cooler in the summer months, warmer in the winter months, and these effects were translated downstream. Data from side channels indicate cooling from groundwater seeps. In general, maximum daily temperatures in the main stem exceed the 21-°C threshold for 90–110 days each summer, from late June to the end of August 2019–20. By early September, the main stem cooled appreciably, which enables the in˗migration of some Yakima River salmonids. The temperature data indicate the potential for improving habitat conditions in the future.
Future work at these cold˗water sites might include studying flow volumes and site hydrology (geometry) to ascertain usability as a thermal refuge. Management interventions (such as reconnecting floodplains and side channels, constructing deflection barriers near tributaries, enhancing shading, and maintaining river features to maximize groundwater and surface˗water exchange) could be considered to preserve, enhance, and create functional thermal refuges on the lower Yakima River. With anticipated climate change impacts in the Yakima River Basin, resulting in warmer river temperatures and lower springtime flows, and a shift in the timing of river warming to earlier in the year, thermal refuge habitat locations could become increasingly important for the basin’s migratory species.
References Cited
Appel, M., Little, R., Wendt, H., and Nielson, M., 2011, Assessment of the lower Yakima River in Benton County, Washington: Benton Conservation District, The Yakima Basin Fish, and Wildlife Recovery Board, Kennewick, Washington, 182 p., accessed December 10, 2020. at http://www.ybfwrb.org/Assets/Documents/Assessments/Lower_Yakima_Assessment.pdf.
Bureau of Reclamation and Washington Department of Ecology [Reclamation and Ecology], 2012, Yakima River Basin Integrated Water Resource Management Plan—Final Programmatic Environmental Impact Statement Benton, Kittitas, Klickitat and Yakima Counties: U.S. Department of the Interior Bureau of Reclamation and Washington State Department of Ecology, 894 p., accessed March 5, 2019, at http://www.usbr.gov/pn/programs/yrbwep/2011integratedplan/index.html.
Breau, C., Cunjak, R.A., and Bremset, G., 2007, Age˗specific aggregation of wild juvenile Atlantic salmon Salmo salar at cool water sources during high temperature events: Journal of Fish Biology, v. 71, no. 4, p. 1179–1191, accessed June 15, 2020, at https://doi.org/10.1111/j.1095˗8649.2007.01591.x.
Brett, J.R., 1971, Energetic responses of salmon to temperature—A study of some thermal relations in the physiology and freshwater ecology of Sockeye salmon (Oncorhynchus nerka): American Zoologist, v. 11, no. 1, p. 99–113, accessed June 15, 2020, at https://doi.org/10.1093/icb/11.1.99.
Child, D., Courter, I., and Duery, S., 2010, Suitability of Amon Wasteway for salmonid production: Kennewick Irrigation District, 58 p., accessed June 15, 2020, at https://www.kid.org/wp˗content/uploads/2014/05/2010˗Amon˗Aquatic˗Habitat˗Report.pdf.
Conley, A., Freudenthal, J., Lind, D., Mees, P., and Visser, R., 2009, 2009 Yakima Basin Steelhead Recovery Plan—Extracted from the 2005 Yakima Subbasin Recovery Plan (with updates): Yakima, Washington, Yakima Basin Fish & Wildlife Recovery Board, 354 p., accessed June 15, 2020, at https://www.westcoast.fisheries.noaa.gov/publications/recovery_planning/salmon_steelhead/domains/interior_columbia/middle_columbia/mid˗c˗yakima.pdf.
Conn, K.E., Huffman, R.L., and Barton, C., 2017, Quality˗assurance plan for water˗quality activities in the U.S. Geological Survey Washington Water Science Center: U.S. Geological Survey Open˗File Report 2017–1044, 66 p., accessed June 15, 2020, at https://doi.org/10.3133/ofr20171044.
Drost, B.W., Cox, S.E., and Schurr, K.M., 1997, Changes in ground˗water levels an ground˗water budgets, from predevelopment to 1986, in parts of the Pasco Basin, Washington: U.S. Geological Survey Water Resources Investigations Report 96–4086, 179 p., accessed October 20, 2020, at https://pubs.usgs.gov/wri/1996/4086/report.pdf.
Gendaszek, A.S., Appel, M., and Sheibley, R.W, 2020, 2018 Longitudinal water temperature profiles of the Yakima River, Washington: U.S. Geological Survey data release, accessed June 15, 2020, at https://doi.org/10.5066/P9YCIA50.
Gendaszek, A.S., and Appel, M., 2021, Thermal heterogeneity and cold˗water anomalies within the lower Yakima River, Yakima and Benton Counties, Washington: U.S. Geological Survey Scientific Investigations Report 2021–5140, 43 p., accessed December 10, 2021, at https://doi.org/10.3133/sir20215140.
Kock, T.J., Evans, S.D., Hansen, A.C., Ekstrom, B.K., Visser, R., Saluskin, B., and Hoffarth, P., 2020, Evaluation of water temperature effects on adult sockeye salmon (Oncorhynchus nerka) behavior in the Yakima River, Washington, 2019: U.S. Geological Survey Open˗File Report 2020–1033, 15 p., accessed November 10, 2020, at https://doi.org/10.3133/ofr20201033.
Kurylyk, B.L., MacQuarrie, K.T.B., Linnansaari, T., Cunjak, R.A., and Curry, R.A., 2015, Preserving, augmenting, and creating cold˗water thermal refugia in rivers—Concepts derived from research on the Miramichi River, New Brunswick (Canada): Ecohydrology, v. 8, no. 6, p. 1095–1108, accessed November 10, 2020, at https://doi.org/10.1002/eco.1566.
McMichael, G., 2017, Factors influencing predation on juvenile fishes emigrating through the lower Yakima River Basin: Richland, Washington, Mainstem Fish Research, LLC, 55 p., accessed March 2, 2019, at http://dx.doi.org/10.13140/RG.2.2.28193.30569.
National Oceanic and Atmospheric Administration, 2014, Endangered and threatened wildlife—Final rule to revise the code of Federal regulations for species under the jurisdiction of the National Marine Fisheries Service: Federal Register, v. 79, no. 71, p. 20802–20817, accessed November 20, 2020, at https://www.govinfo.gov/content/pkg/FR˗2014˗04˗14/pdf/2014˗08347.pdf.
Neill, N., 1979, Mechanisms of fish distribution in heterothermal environments: American Zoologist, v. 19, no. 1, p. 305–317, accessed May 7, 2020, at https://doi.org/10.1093/icb/19.1.305.
R Core Team, 2022, R—A language and environment for statistical computing: Vienna, Austria, R Foundation for Statistical Computing, accessed February 1, 2021, at https://www.R˗project.org/.
Ries, K.G., III, Newson J.K., Smith, M.J., Guthrie, J.D., Steeves, P.A., Haluska, T.L., Kolb, K.R., Thompson, R.F., Santoro, R.D., and Vraga, H.W., 2017, StreamStats, version 4: U.S. Geological Survey Fact 2017–3046, 4 p., accessed December 10, 2020, at https://doi.org/10.3133/fs20173046. [Supersedes USGS Fact Sheet 2008–3067.]
Rinella, J.F., McKenzie, S.W., Crawford, J.K., Foreman, W.T., Fuhrer, G.J., Morace, J.L., and Aiken, G.R., 1999, Surface water˗quality assessment of the Yakima River Basin, Washington—Distribution of pesticides and other organic compounds in water, sediment, and aquatic biota, 1987–91: U.S. Geological Survey, Water˗Supply Paper 2354˗B, 180 p., October 20, 2020, at https://pubs.er.usgs.gov/publication/wsp2354B.
Sheibley, R.W., and Foreman, J.R., 2023, Temperature data collected from the lower Yakima River from October 2018 to October 2020: U.S. Geological Survey data release, https://doi.org/10.5066/P9MHTEGN.
Stanford, J.A., Snyder, E.B., Lorang, M.N., Whited, D.C., Matson, P.L., and Chaffin, J.L., 2002, The reaches project— Ecological and geomorphic studies supporting normative flows in the Yakima River basin, Washington: Yakima, Washington, Flathead Lake Biological Station, University of Montana, Yakima Office, Final Report to Bureau of Reclamation, 152 p.
Torgersen, C.E., Price, D.M., Li, H.W., and McIntosh, B.A., 1999, Multiscale thermal refugia and stream habitat associations of Chinook salmon in northeastern Oregon: Ecological Applications, v. 9, no. 1, p. 301–319, accessed December 10, 2020, at https://doi.org/10.1890/1051˗0761(1999)009[0301:MTRASH]2.0.CO;2.
Torgersen, C.E., Ebersole, J.L., and Keenan, D.M., 2012, Primer for identifying cold˗water refuges to protect and restore thermal diversity in riverine landscapes: U.S. Environmental Protection Agency 910˗C˗12˗001, accessed April 17, 2018, at http://faculty.washington.edu/cet6/pub/Torgersen_etal_2012_cold_water_refuges.pdf.
U.S. Fish and Wildlife Service, 1998, Endangered and Threatened Wildlife and Plants; Determination of Threatened Status for the Klamath River and Columbia River Distinct Population Segments of Bull Trout: Federal Register, v. 63, no. 111, p. 31647–31674, accessed December 20, 2020, at https://www.govinfo.gov/content/pkg/FR˗1998˗06˗10/pdf/98˗15319.pdf.
U.S. Geological Survey, 2021, USGS water data for the Nation: U.S. Geological Survey National Water Information System database, accessed January 2021, at https://doi.org/10.5066/F7P55KJN.
Vaccaro, J.J., 2011, River˗aquifer exchanges in the Yakima River Basin, Washington: U.S. Geological Survey Scientific Investigations Report 2011–5026, 98 p., accessed November 20, 2020, at https://doi.org/10.3133/sir20115026.
Wagner, R.J., Boulger, R.W., Jr., Oblinger, C.J., and Smith, B.A., 2006, Guidelines and standard procedures for continuous water˗quality monitors—Station operation, record computation, and data reporting: U.S. Geological Survey Techniques and Methods 1–D3, 51 p., plus 8 attachments, accessed June 15, 2018, at http://pubs.water.usgs.gov/tm1d3.
Washington Department of Ecology [Ecology], 2012, 2012 Washington State Water Quality Assessment: Olympia, Washington, Washington State Department of Ecology, Water Quality Program, accessed December 20, 2020, at https://ecology.wa.gov/Water˗Shorelines/Water˗quality/Water˗improvement/Assessment˗of˗state˗waters˗303d.
Washington Department of Ecology [Ecology], 2011, Use designations for fresh waters by water resource inventory area (WRIA), sec. 602 of Water Quality Standards for Surface Waters in the State of Washington: Washington Administrative Code, title 173, pt. VI, accessed June 15, 2020, at https://app.leg.wa.gov/WAC/default.aspx?cite=173˗201A˗602.
Washington Department of Ecology [Ecology], 2020, Fresh water designated uses and criteria, sec. 200 of Water Quality Standards for Surface Waters in the State of Washington: Washington Administrative Code, title 173, pt. II, accessed March 2021, at https://app.leg.wa.gov/WAC/default.aspx?cite=173˗201A.
White, J.S., Peterson, J.T., Stratton Garvin, L.E., Kock, T.J., and Wallick, J.R., 2022, Assessment of habitat availability for juvenile Chinook salmon (Oncorhynchus tshawytscha) and steelhead (O. mykiss) in the Willamette River, Oregon: U.S. Geological Survey Scientific Investigations Report 2022–5034, 44 p., accessed December 15, 2020, at https://doi.org/10.3133/sir20225034.
Wise, D.R., Zuroske, M.L., Carpenter, K.D., and Kiesling, R.L., 2009, Assessment of eutrophication in the lower Yakima River Basin, Washington, 2004–07: U.S. Geological Survey Scientific Investigations Report 2009–5078, 108 p., accessed June 15, 2018, at https://doi.org/10.3133/sir20095078.
Conversion Factors
For information about the research in this report, contact
Director, Washington Water Science Center
U.S. Geological Survey
934 Broadway, Suite 300
Tacoma, Washington 98402
https://www.usgs.gov/centers/washington˗water˗science˗center
Manuscript approved on December 18, 2023
Publishing support provided by the U.S. Geological Survey
Science Publishing Network, Tacoma Publishing Service Center
Edited by Nathan Severance
Illustration support by Teresa Lewis
Layout and design by Luis Menoyo
Disclaimers
Any use of trade, firm, or product names is for descriptive purposes only and does not imply endorsement by the U.S. Government.
Although this information product, for the most part, is in the public domain, it also may contain copyrighted materials as noted in the text. Permission to reproduce copyrighted items must be secured from the copyright owner.
Suggested Citation
Sheibley, R.W., Appel, M., Little, R., and Foreman, J.R., 2024, Extent and duration of cold-water areas associated with side channels and tributaries of the lower Yakima River, Washington, September 2018–20: U.S. Geological Survey Scientific Investigations Report 2023–5140, 50 p., https://doi.org/10.3133/sir20235140.
ISSN: 2328-0328 (online)
Study Area
| Publication type | Report |
|---|---|
| Publication Subtype | USGS Numbered Series |
| Title | Extent and duration of cold-water areas associated with side channels and tributaries of the lower Yakima River, Washington, September 2018–20 |
| Series title | Scientific Investigations Report |
| Series number | 2023-5140 |
| DOI | 10.3133/sir20235140 |
| Publication Date | March 04, 2024 |
| Year Published | 2024 |
| Language | English |
| Publisher | U.S. Geological Survey |
| Publisher location | Reston, VA |
| Contributing office(s) | Washington Water Science Center |
| Description | Report: ix, 50 p.; Data Release |
| Country | United States |
| State | Washington |
| Other Geospatial | Lower Yakima River |
| Online Only (Y/N) | Y |