

Water-Level and Recoverable Water in Storage Changes, High Plains Aquifer, Predevelopment to 2019 and 2017 to 2019
Links
- Document: Report (3.5 MB pdf) , HTML , XML
- Data Release: USGS data release - Data from maps of water-level changes in the High Plains aquifer in parts of Colorado, Kansas, Nebraska, New Mexico, Oklahoma, South Dakota, Texas, and Wyoming, predevelopment (about 1950) to 2019 and 2017 to 2019
- NGMDB Index Page: National Geologic Map Database Index Page (html)
- Download citation as: RIS | Dublin Core
Acknowledgments
Most of the water-level data used in this report were provided to the U.S. Geological Survey by the following State, local, and Federal entities: Colorado—Division of Water Resources (also known as the Office of the State Engineer); Kansas—Department of Agriculture, Division of Water Resources, and the Kansas Geological Survey; Nebraska—Central Nebraska Public Power and Irrigation District, Natural Resources Districts, and University of Nebraska–Lincoln, Conservation and Survey Division; New Mexico—Office of the State Engineer; Oklahoma—Water Resources Board; South Dakota—Department of Environment and Natural Resources; Texas—Groundwater Conservation Districts and the Texas Water Development Board; Wyoming—State Engineer’s Office; and Federal—Bureau of Reclamation and U.S. Fish and Wildlife Service. The authors thank the above entities for providing the water-level data and for their responsiveness regarding questions about the data.
Abstract
The High Plains aquifer underlies 111.8 million acres (about 175,000 square miles) in parts of eight States: Colorado, Kansas, Nebraska, New Mexico, Oklahoma, South Dakota, Texas, and Wyoming. Water-level declines began in parts of the High Plains aquifer soon after the beginning of substantial groundwater irrigation (about 1950). This report presents water-level changes and change in recoverable water in storage in the High Plains aquifer from predevelopment (about 1950) to 2019 and from 2017 to 2019.
Water-level changes from predevelopment to 2019, by well, ranged from a rise of 86 feet to a decline of 265 feet; the range for 99 percent of the wells was from a rise of 42 feet to a decline of 203 feet. Water-level changes from 2017 to 2019, by well, ranged from a rise of 34 feet to a decline of 27 feet; the range for 99 percent of the wells was from a rise of 11 feet to a decline of 11 feet. The area-weighted, average water-level changes in the aquifer were an overall decline of 16.5 feet from predevelopment to 2019 and a rise of 0.1 foot from 2017 to 2019. Recoverable water in storage in the aquifer in 2019 was about 2.91 billion acre-feet, which was a decline of about 286.4 million acre-feet since predevelopment and a rise of 1.6 million acre-feet from 2017 to 2019.
Introduction
The High Plains aquifer underlies 111.8 million acres (Macres; about 175,000 square miles [mi2]) in parts of eight States: Colorado, Kansas, Nebraska, New Mexico, Oklahoma, South Dakota, Texas, and Wyoming (fig. 1; Qi, 2010). In the High Plains aquifer, groundwater generally is under unconfined conditions (Weeks and Gutentag, 1981). The saturated thickness of the aquifer, which is the distance from the water table to the base of the aquifer, ranges from 0 feet (ft) to about 1,200 ft (McGuire and others, 2012). Gutentag and others (1984) reported that the aquifer, a few parts of the aquifer area, was discontinuous; these areas total about 6.90 Macres (10,777 mi2) and are labeled in the figures of this report as “area of little or no saturated thickness.” Wells drilled in areas of little or no saturated thickness (fig. 1) likely will not yield water unless the wells penetrate localized saturated sediment in buried channels or depressions in the bedrock surface (Gutentag and others, 1984).
Water-level changes, High Plains aquifer, predevelopment (about 1950) to 2019.
The area overlying the High Plains aquifer is one of the primary agricultural regions in the Nation; in parts of the area, farmers and ranchers began using groundwater for irrigation in the late 1890s (Johnson, 1902). Estimated irrigated acreage was 2.1 Macres in 1949, 13.7 Macres in 1980, 13.9 Macres in 1997, 14.7 Macres in 2002, 15.8 Macres in 2005, 15.8 Macres in 2007, 14.9 Macres in 2012, and 14.8 Macres in 2017 (Heimes and Luckey, 1982; Thelin and Heimes, 1987; U.S. Department of Agriculture, 1999; Brown and others, 2019). In 2017, about 14 percent of the overlying aquifer area was irrigated, not including the areas with little or no saturated thickness (Brown and others, 2019).
Estimated groundwater withdrawals from the High Plains aquifer for irrigation increased from 4 to 19 million acre-feet (Macre-ft) from 1949 to 1974; estimated groundwater withdrawals for irrigation in 1980 were 18 Macre-ft (Heimes and Luckey, 1982, 1983). Groundwater withdrawals from the aquifer for irrigation were 19.4 Macre-ft in 2000 (Maupin and Barber, 2005) and 13.0 Macre-ft in 2015 (Lovelace and others, 2020).
Water-level declines began in parts of the High Plains aquifer soon after the onset of substantial groundwater irrigation (about 1950; Gutentag and others, 1984). From 1938 to 1951, water-level declines of more than 50 ft were documented in the High Plains aquifer in parts of Texas (Gaum, 1953). By 1980, water levels in the High Plains aquifer had declined more than 100 ft in parts of Kansas, New Mexico, Oklahoma, and Texas; more than 50 ft in parts of Colorado; and more than 25 ft in parts of Nebraska and Wyoming. In contrast, by 1980, water-level rises and declines in the High Plains aquifer in South Dakota were less than 10 ft (Luckey and others, 1981).
Changes in the static water level of an aquifer result from an imbalance between discharge and recharge and is determined by measuring the water level in wells screened in the aquifer in winter or spring after substantial recovery from pumping from the previous irrigation season in the measured well or in nearby wells and before the start of pumping in the current year. The measured water level in the well may not be the fully recovered water level, in that the water level may continue to rise until pumping resumes; however, after reviewing water-level histories in many wells screened in the High Plains aquifer and their response to pumping in aquifer tests (Freeze and Cherry, 1979), the water-level measured in winter or spring is assumed to be an acceptable approximation of the fully recovered water level.
Lovelace and others (2020) estimated that about 95 percent of groundwater pumped from the High Plains aquifer in 2015 was for irrigation, and the remaining was for public and domestic water supply and other uses. Discharge from the aquifer also occurs as evapotranspiration, and seepage to streams, springs, and other surface-water bodies. Discharge as evapotranspiration and seepage primarily occurs in the northern part of the High Plains aquifer. Recharge to the aquifer primarily is from precipitation, but other sources of recharge include irrigation return flows and infiltration from streams, canals, and reservoirs (Luckey and Becker, 1999; Stanton and others, 2011; Peterson and others, 2020). Water-level declines may result in increased costs to extract groundwater because of additional energy needed for greater pumping lift and decreased well yields (Taylor and Alley, 2001). Water-level declines also can affect groundwater availability, surface-water flow, and near-stream (riparian) habitat areas (Alley and others, 1999; Peterson and others, 2020).
In response to water-level declines, the U.S. Congress, under the authority of Title III to the Water Resources Research Act (Public Law 98–242 and Public Law 99–662), directed the U.S. Geological Survey (USGS) to monitor water levels in the High Plains aquifer. Since 1987, the USGS, in collaboration with many State, local, and Federal water-resources entities, has compiled water levels from wells completed in the High Plains aquifer.
Purposes of this report are to present (1) water-level changes in the High Plains aquifer from the time before substantial development of groundwater for irrigation (about 1950 and hereinafter referred to as “predevelopment”) to 2019 and from 2017 to 2019; (2) recoverable water in storage in the High Plains aquifer in 2019; and (3) changes in recoverable water in storage in the High Plains aquifer, from predevelopment to 2019 and from 2017 to 2019. The raster datasets of water-level changes, from predevelopment to 2019 and 2017 to 2019, and the water-level-change data for the wells used for the analyses are available as a USGS data release (McGuire and Strauch, 2024).
Data and Methods
For this report, geospatial data organized as grid datasets, which are matrices of equally sized cells arranged in rows and columns and hereinafter referred to as “rasters,” are used in the following calculations:
-
· Area-weighted, average water-level changes, from predevelopment to 2019 and from 2017 to 2019,
-
· Recoverable water in storage in 2019, and
-
· Change in recoverable water in storage, from predevelopment to 2019 and from 2017 to 2019.
Water-Level Data
The water-level data for the High Plains aquifer were largely obtained from measurements in irrigation wells when the water level in the wells had substantially, but not necessarily fully, recovered from pumping in the measured well or nearby wells for the previous irrigation season. Most of the remaining wells are other types of wells, including monitoring, domestic, and stock wells. Many State, local, and Federal water-resource entities measured these wells and provided the water-level data for this report to the USGS or through publicly available websites, which are listed later in this section. The primary water-level data used in this report include predevelopment water levels and measured or estimated water levels for 2017 and 2019. Supplemental water-level data and published areas of water-level changes without available measured data for predevelopment were used to substantiate the contours used to control interpolation of the primary water-level data.
Predevelopment generally is before about 1950 (Gutentag and others, 1984); however, in some areas (for example, in the north-central part of the Texas Panhandle), predevelopment is the late 1990s, or in other areas (for example, in north-central Nebraska), groundwater has not yet (2023) been substantially developed for irrigation. Recoverable water in storage is the fraction of water in the aquifer that will drain by gravity and can be withdrawn by wells. In an unconfined aquifer, the recoverable water fraction is quantified as the parameter specific yield. The remaining water in the aquifer is held to the aquifer material by capillary forces and generally cannot be withdrawn by wells (Meinzer, 1923). Water levels used in this report, referred to as static water levels, generally were measured in winter (October to February) or early spring (March to May), when irrigation wells typically were not pumping, and after water levels generally had recovered from pumping during the previous irrigation season. The beginning and end of irrigation season varies by climate and crop type across areas underlain by the High Plains aquifer, starting from about March to mid-June through about July to September.
Water-level data used in this report generally were from measurements collected by an electric tape, steel tape, or transducer using methods similar to those described by Cunningham and Schalk (2011). The wells were measured by many State, local, and Federal water-resources agencies; and the measurement results are available in the Kansas Geological Survey groundwater database (Kansas Geological Survey, 2021), Texas Water Development Board groundwater database (Texas Water Development Board, 2022), USGS National Groundwater Monitoring Network data portal (USGS, 2022a), USGS National Water Information System (NWIS; USGS, 2022b), and Wyoming State Engineer’s Office water database (Wyoming State Engineer’s Office, 2021).
Most of the wells were measured manually one to two times per water year. A water year is the 12-month period, October 1 through September 30, and is designated by the calendar year in which it ends. If a well was measured one time per water year, typically the well was measured in the winter or early spring; if a well was measured two times per water year, in general the well was measured in winter or early spring and in fall. Some wells were measured nearly continuously using instrumentation with sensors that recorded the water level periodically, generally every 15 to 60 minutes (Cunningham and Schalk, 2011). Available water-level data for each well were reviewed to select a water level that (1) reasonably represented the static water level for each applicable water year, which was generally the minimum depth-to-water measurement for manually measured wells or the minimum mean daily depth-to-water measurement for wells measured continually; and (2) was hydrologically consistent with water-level altitudes in nearby wells. In addition, available water levels for wells in the same raster cell were reviewed to determine whether the water-level changes for 2017 to 2019 were of similar magnitude to other wells in the cell. If the water-level changes were not similar, the water-level records for each well were further examined to assess whether the water levels indicated an upward or downward gradient or different hydrogeologic conditions. If the water levels in wells in the same cell were substantially different, generally the water levels from the shallowest well were used. If it was determined that a water level for a given year should not be used in the water-level-change maps, the use field for the well for that water year ([usexxxx], where xxxx represents the measurement water year), which is a field in the well shapefiles (McGuire and Strauch, 2024), was set to a negative number so that subsequent processing would ignore this water level.
Most of the measured wells supply water for irrigation; irrigation wells often have lubricating oil floating on the water surface. The lubricating oil can adversely affect water-level precision and accuracy in the measured well. If oil is not on the surface of the water in the well, the precision of the water-level measurement generally is 0.01 ft; if oil is on the surface of the water, the precision of the water-level measurement likely is greater than 0.01 ft. For this study, the amount of oil on the surface of the water was not assessed (Cunningham and Schalk, 2011); therefore, the effect on the water-level accuracy that should be attributed to oil on the water surface is unknown.
Primary Water-Level Data
Static water levels were measured in 8,381 wells for water year 2017; 8,615 wells for water year 2018; and 8,284 wells for water year 2019. In addition, because New Mexico measured most of their wells on a 5-year rotating schedule, the most recent static water-level measurements from water year 2015 to water year 2018 were retrieved as the estimated 2019 measurements for 71 wells in New Mexico, which did not have a 2019 measurement (table 1).
Table 1.
Number of wells used for 2017, 2018, and 2019 static water levels, and for the water-level comparison periods, predevelopment (about 1950) to 2019 and 2017 to 2019, by State and in total for the High Plains aquifer.[Data are from Kansas Geological Survey (2021), Texas Water Development Board (2022), U.S. Geological Survey (2022a, 2022b), and Wyoming State Engineer’s Office (2021)]
For 71 wells in the predevelopment to 2019 water-level comparison period, 2015, 2016, 2017, or 2018 water levels were used instead of 2019 water levels because many wells in New Mexico were measured only once every 5 years or because the 2019 water level was not an approximately static water level.
The primary water-level data used to map water-level changes and percent change in saturated thickness from predevelopment to 2019 include predevelopment water levels, the static water levels for 2019, and, for New Mexico only, static water levels for 2015–18. In New Mexico, 34 wells have a static water level for predevelopment and for 2019, and 71 wells have a static water level for predevelopment and at least 1 year from 2015 to 2018 but not for 2019. The latest available water levels were used for these 71 wells, including water levels from 10 wells measured in 2015, 41 wells measured in 2016, 10 wells measured in 2017, and 10 wells measured in 2018. For all States, the only water-level data used to map water-level changes from 2017 to 2019 were from wells with a static water level measured in water years 2017 and 2019.
Weeks and Gutentag (1981) and McGuire and others (2003) compiled predevelopment water levels; that is, the earliest water-level measurement for a well. Predevelopment water levels were identified for more than 20,000 wells. The median measurement year for these predevelopment water levels was 1957 (McGuire and others, 2003). A predevelopment water level was not available for 5,614 of the wells with 2019 water levels likely because these wells were installed or first measured after substantial irrigation had begun in the area.
The static water-level measurements were provided by the following State, local, and Federal entities through data files or downloads from applicable websites:
-
· Colorado—Division of Water Resources (also known as the Office of the State Engineer) water-level data were retrieved from the National Groundwater Monitoring Network data portal (USGS, 2022a).
-
· Kansas—Department of Agriculture, Division of Water Resources, and the Kansas Geological Survey water-level data were retrieved from the Kansas Geological Survey groundwater database (Kansas Geological Survey, 2021).
-
· Nebraska—Central Nebraska Public Power and Irrigation District (https://cnppid.com/), University of Nebraska–Lincoln, Conservation and Survey Division (https://snr.unl.edu/csd/), and the following Natural Resources Districts water-level data were retrieved from the USGS NWIS (USGS, 2022b):
-
· Central Platte (https://cpnrd.org/)
-
· Lewis & Clark (https://lcnrd.nebraska.gov/)
-
· Little Blue (https://littlebluenrd.org/)
-
· Lower Big Blue (https://www.lbbnrd.net/)
-
· Lower Elkhorn (http://www.lenrd.org/)
-
· Lower Loup (https://www.llnrd.org/)
-
· Lower Niobrara (https://lnnrd.org/)
-
· Lower Platte North (https://lpnnrd.org/)
-
· Lower Platte South (https://lpsnrd.org/)
-
· Lower Republican (https://www.lrnrd.org/)
-
· Middle Niobrara (https://www.mnnrd.org/)
-
· Middle Republican (https://www.mrnrd.org/)
-
· North Platte (https://www.npnrd.org/)
-
· Papio Missouri River (https://www.papionrd.org/)
-
· South Platte (https://www.spnrd.org/)
-
· Tri-Basin (https://www.tribasinnrd.org/)
-
· Twin Platte (https://tpnrd.org/)
-
· Upper Big Blue (https://www.upperbigblue.org/)
-
· Upper Elkhorn (https://uenrd.org/)
-
· Upper Loup (https://www.upperloupnrd.org/)
-
· Upper Niobrara White (https://unwnrd.org/)
-
· Upper Republican (https://www.urnrd.org/)
-
-
· New Mexico—Office of the State Engineer (https://www.ose.state.nm.us/) water-level data used in this report were measured by the USGS New Mexico Water Science Center and were retrieved from the USGS NWIS (USGS, 2022b).
-
· Oklahoma—Water Resources Board (https://www.oklahoma.gov/owrb) water-level data were retrieved from the USGS NWIS (USGS, 2022b).
-
· South Dakota—Department of Agriculture and Natural Resources (https://danr.sd.gov) water-level data were retrieved from the USGS NWIS (USGS, 2022b).
-
· Texas—The Water Development Board and the following Groundwater Conservation Districts water-level data were retrieved from the Texas Water Development Board’s groundwater database (Texas Water Development Board, 2022):
-
· Garza County (https://www.twdb.texas.gov/groundwater/conservation_districts/gcdinfo1.asp)
-
· Gateway (http://www.gatewaygroundwater.com/)
-
· Glasscock (http://glasscock-groundwater.org)
-
· Hemphill County (https://www.twdb.texas.gov/groundwater/conservation_districts/gcdinfo2.asp)
-
· High Plains No. 1(https://www.hpwd.org/)
-
· Llano Estacado (http://www.llanoestacadouwcd.org/)
-
· Mesa (https://www.mesauwcd.org/)
-
· Mesquite (https://www.twdb.texas.gov/groundwater/conservation_districts/gcdinfo2.asp)
-
· North Plains (https://northplainsgcd.org/)
-
· Panhandle (https://www.pgcd.us/)
-
· Permian Basin (https://www.pbuwcd.com/)
-
· Sandy Land (http://www.sandylandwater.com/)
-
· South Plains (https://www.spuwcd.org/)
-
-
· Wyoming—State Engineer’s Office water-level data were retrieved from their water database (Wyoming State Engineer’s Office, 2021).
-
· Federal—Bureau of Reclamation (https://www.usbr.gov/gp/nkao/), U.S. Fish and Wildlife Service (https://www.fws.gov/refuge/crescent-lake and https://www.fws.gov/refuge/valentine/), and USGS offices in Colorado, Kansas, Nebraska, New Mexico, Oklahoma, South Dakota, Texas, and Wyoming with current and (or) historical water-level data retrieved from the USGS NWIS (USGS, 2022b).
Supplemental Water-Level Data
Supplemental water-level data (McGuire and Strauch, 2024) were used to substantiate contours used to control the interpolation process for the maps of water-level changes and percent change in saturated thickness from predevelopment to 2019, especially in areas with minimal data. The supplemental data include measured static water levels for the following:
-
· Wells measured in 2019 and first measured before June 15, 1978, but not for predevelopment. For these wells, water-level change, predevelopment to 2019, was estimated as the first available static water level minus the 2019 water level.
-
· Wells measured in 1980 and in 2019 but not for predevelopment. For these wells, water-level change, predevelopment to 2019, was estimated as the sum of the water-level-change “from” value in the polygon attributes of water-level change, predevelopment to 1980 (Luckey and others, 1981; Cederstrand and Becker, 1999c), and the water-level-change value from 1980 to 2019.
-
· For all States, except New Mexico, wells measured for the latest water year from 2015 to 2018, but not for 2019, and for predevelopment.
Luckey and others (1981), Weeks and Gutentag (1981), and Kastner and others (1989) compiled water levels for 1980. The 1980 water levels were generally measured after the irrigation season in 1979 and before the irrigation season in 1980 (that is, in water year 1980), but some wells were measured 1 or 2 years earlier.
Other Published Areas of Water-Level Change
Finally, published areas of water-level change without available measured water levels for predevelopment were incorporated into the contours used to control the interpolation process for the maps of water-level changes and percent change in saturated thickness from predevelopment to 2019. These areas are in northwest and central Nebraska and southwest Wyoming and are outlined with a blue dashed line in figure 1 (Lowry and others, 1967; Luckey and others, 1981; Cederstrand and Becker, 1999c; Young and others, 2019).
Characteristics of Raster Datasets
For this report, rasters were generated for water-level changes and percent changes in saturated thickness from predevelopment to 2019, and for water-level changes from 2017 to 2019. The rasters were generated using two versions of a geographic information system—ArcInfo Workstation, version 9.3, and ArcMap, version 10.8.1 (Esri, 1992, 2010, 2020); the commands used will hereinafter be referred to as “ArcGIS commands.” The rasters were georeferenced to geographic coordinates on an Albers equal-area conic projection using the North American Datum of 1983. The cell size for all rasters was 500 by 500 meters or about 62 acres. Water-level-change values were calculated as feet. Recoverable water in storage was output as billion acre-feet, and changes in recoverable water in storage values were summarized as million acre-feet.
The rasters of water-level changes for predevelopment to 2019 and 2017 to 2019, are available for download in tagged image file or TIFF format (McGuire and Strauch, 2024). The interpolation process, which was used to generate the rasters, is described in sections “Analysis of Water-Level Changes, Predevelopment to 2019”and “Analysis of Water-Level Changes, 2017 to 2019.” The interpolation process can result in cell values for cells collocated with a measured well that are generally similar to, but commonly not exactly equal to, the corresponding values based on those water-level measurements. This difference is at least partially because the cell values represent the interpolated value for the cell area and the measured values are values at specific locations within the area represented by the cell.
Analysis of Water-Level Changes, Predevelopment to 2019
The distribution of water-level changes from predevelopment to 2019 was determined using the same methods used by McGuire (2013) for water-level changes from predevelopment to 2011. A raster of the distribution of water-level changes from predevelopment to 2019 was generated using the ArcGIS topogrid command with (1) the water-level-change data from wells measured in predevelopment and measured in 2019 or, for New Mexico only, estimated for 2019 as the primary source data, and (2) contours of water-level change, predevelopment to 2019, to control the interpolation. For the first use of the topogrid command, the input contour file was empty, and the output raster was input to the ArcGIS contour command to generate a contour file. These contours became a template for the input contours to subsequent topogrid commands. The contours of water-level change, which were input to subsequent topogrid command, were manually modified iteratively, as needed, using primary and supplemental water-level-change data and published areas of water-level change without available measured water levels for predevelopment.
The mapped areas between a decline of less than 5 ft and a rise of less than 5 ft were termed areas of no substantial change and were assigned a value of zero water-level change in the raster rather than using the interpolation of water-level-change values in these areas. McGuire (2013) discussed the effect of using zero in the areas of no substantial changes instead of the interpolated water-level-change values. The raster was then used to calculate area-weighted, average water-level changes from predevelopment to 2019, by State and for the aquifer, using the same methods used in McGuire (2013) to calculate area-weighted, average water-level changes from predevelopment to 2011.
Analysis of Water-Level Changes, 2017 to 2019
The distribution of water-level changes from 2017 to 2019 was determined using the same method as McGuire (2013) for the raster of water-level changes from 2009 to 2011. A raster was generated using the ArcGIS command topogrid with (1) the water-level-change data from wells measured in 2017 and 2019, and (2) the water-level-change contours of declines of 1 ft and rises of 1 ft.
The range of no substantial change for 2017 to 2019 was defined as declines less than 1 ft to rises of less than 1 ft, which is different than the range of no substantial change for predevelopment to 2019 and was defined as declines less than 5 ft to rises less than 5 ft. This approach was used for the 2017 to 2019 period because there generally are sufficient data for 2017 to 2019 water-level change to delineate the areas between a decline of less than 1 ft and a rise of less than 1 ft. The areas of no substantial change were assigned a value of zero water-level change rather than using the interpolation of water-level-change values in these areas. McGuire (2013) discusses the effect of using zero in the areas of no substantial changes instead of the interpolated water-level-change values. This raster was used to calculate area-weighted, average water-level changes from 2017 to 2019, by State and for the aquifer using the same methods used in McGuire (2013) to calculate area-weighted, average water-level changes from 2009 to 2011.
Characterizing Specific Yield
Specific yield of the aquifer is needed to calculate recoverable water in storage. Specific yield of a rock or soil, with respect to water, is the ratio of the volume of water, which the saturated rock or soil will yield by gravity, to the rock or soil volume (Meinzer, 1923). A map of specific-yield ranges for the High Plains aquifer was interpolated from depth-interval-weighted specific yields estimated from lithologic logs collected at selected wells or test holes distributed across the aquifer and generally drilled to the base of the aquifer (Gutentag and others, 1984; Cederstrand and Becker, 1998).
A specific-yield raster was created from the map of specific-yield ranges in the High Plains aquifer (Gutentag and others, 1984; Cederstrand and Becker, 1998) using the ArcMap command polygrid. The raster value, hereafter referred to as “average-mapped specific yield,” was set equal to the average of the assigned range for the associated specific-yield polygons (McGuire and others, 2012). The area-weighted, average specific yield of the aquifer, not including the areas of little or no saturated thickness, is 15.1 percent overall for the aquifer; area-weighted, average specific yield by State ranges from 8.1 percent in Wyoming to 18.5 percent in Oklahoma (Gutentag and others, 1984; McGuire and others, 2012).
Calculation of Recoverable Water in Storage and Change in Recoverable Water in Storage
Recoverable water in storage for 2019 and changes in recoverable water in storage in the High Plains aquifer for the predevelopment to 2019 and the 2017 to 2019 periods were calculated on a cell-by-cell basis by applying “map algebra” techniques (Tomlin and Berry, 1979) to coregistered rasters sharing a common cell size and orientation. Recoverable water in storage for 2019 was calculated by (1) summing the rasters of saturated thickness for 2009 (McGuire and others, 2012) with the rasters of water-level changes for 2009 to 2011 (McGuire, 2013), 2011 to 2013 (McGuire, 2014), 2013 to 2015 (McGuire, 2017), 2015 to 2017 (McGuire and Strauch, 2022), and 2017 to 2019 (this report) as volumes with units of square meter-feet; and (2) multiplying the result by the raster of the average-mapped specific yield (McGuire and others, 2012) and by a factor to convert units of square meter-feet to billion acre-feet. Changes in recoverable water in storage in the High Plains aquifer for the predevelopment to 2019 and the 2017 to 2019 periods were calculated by multiplying the raster cell values of water-level changes for each period by the raster cell values of average-mapped specific yield (McGuire and others, 2012) and by a factor to convert units of square meter-feet to million acre-feet. Changes in recoverable water in storage from predevelopment to 2019 and from 2017 to 2019, by State and by aquifer, were calculated using the resultant raster.
Analysis of Percent Change in Saturated Thickness, Predevelopment to 2019
A raster of percent change in saturated thickness from predevelopment to 2019 was prepared for this report. A raster of percent change in saturated thickness, 2017 to 2019, was not prepared because long-term water-level changes are the primary focus of this report. The raster of percent change in saturated thickness from predevelopment to 2019 was generated using the ArcGIS command topogrid with the following inputs:
-
· Percent change in saturated thickness at each well location with a water level measured in predevelopment and measured or estimated for 2019,
-
· Estimated altitude of the aquifer base, relative to the North American Vertical Datum of 1988 (McGuire and others, 2012), and
-
· Contours of percent change in saturated thickness.
Predevelopment saturated thickness was calculated for each well by subtracting the altitude of the base of aquifer from the predevelopment water-level altitude (North American Vertical Datum of 1988). Percent change in saturated thickness from predevelopment to 2019 was calculated by dividing water-level change from predevelopment to 2019 by predevelopment saturated thickness.
The ArcGIS contour command generated the initial input set of contours of percent change in saturated thickness based on the raster output from the first use of the topogrid command. The input contours of percent change in saturated thickness were later manually modified iteratively, as needed, using primary and supplemental percent change in saturated-thickness data.
Water-Level Changes
Water-level changes in the High Plains aquifer are presented for two periods: predevelopment to 2019 and 2017 to 2019. In addition, water-level changes are presented with respect to saturated thickness in predevelopment.
Water-Level Changes, Predevelopment to 2019
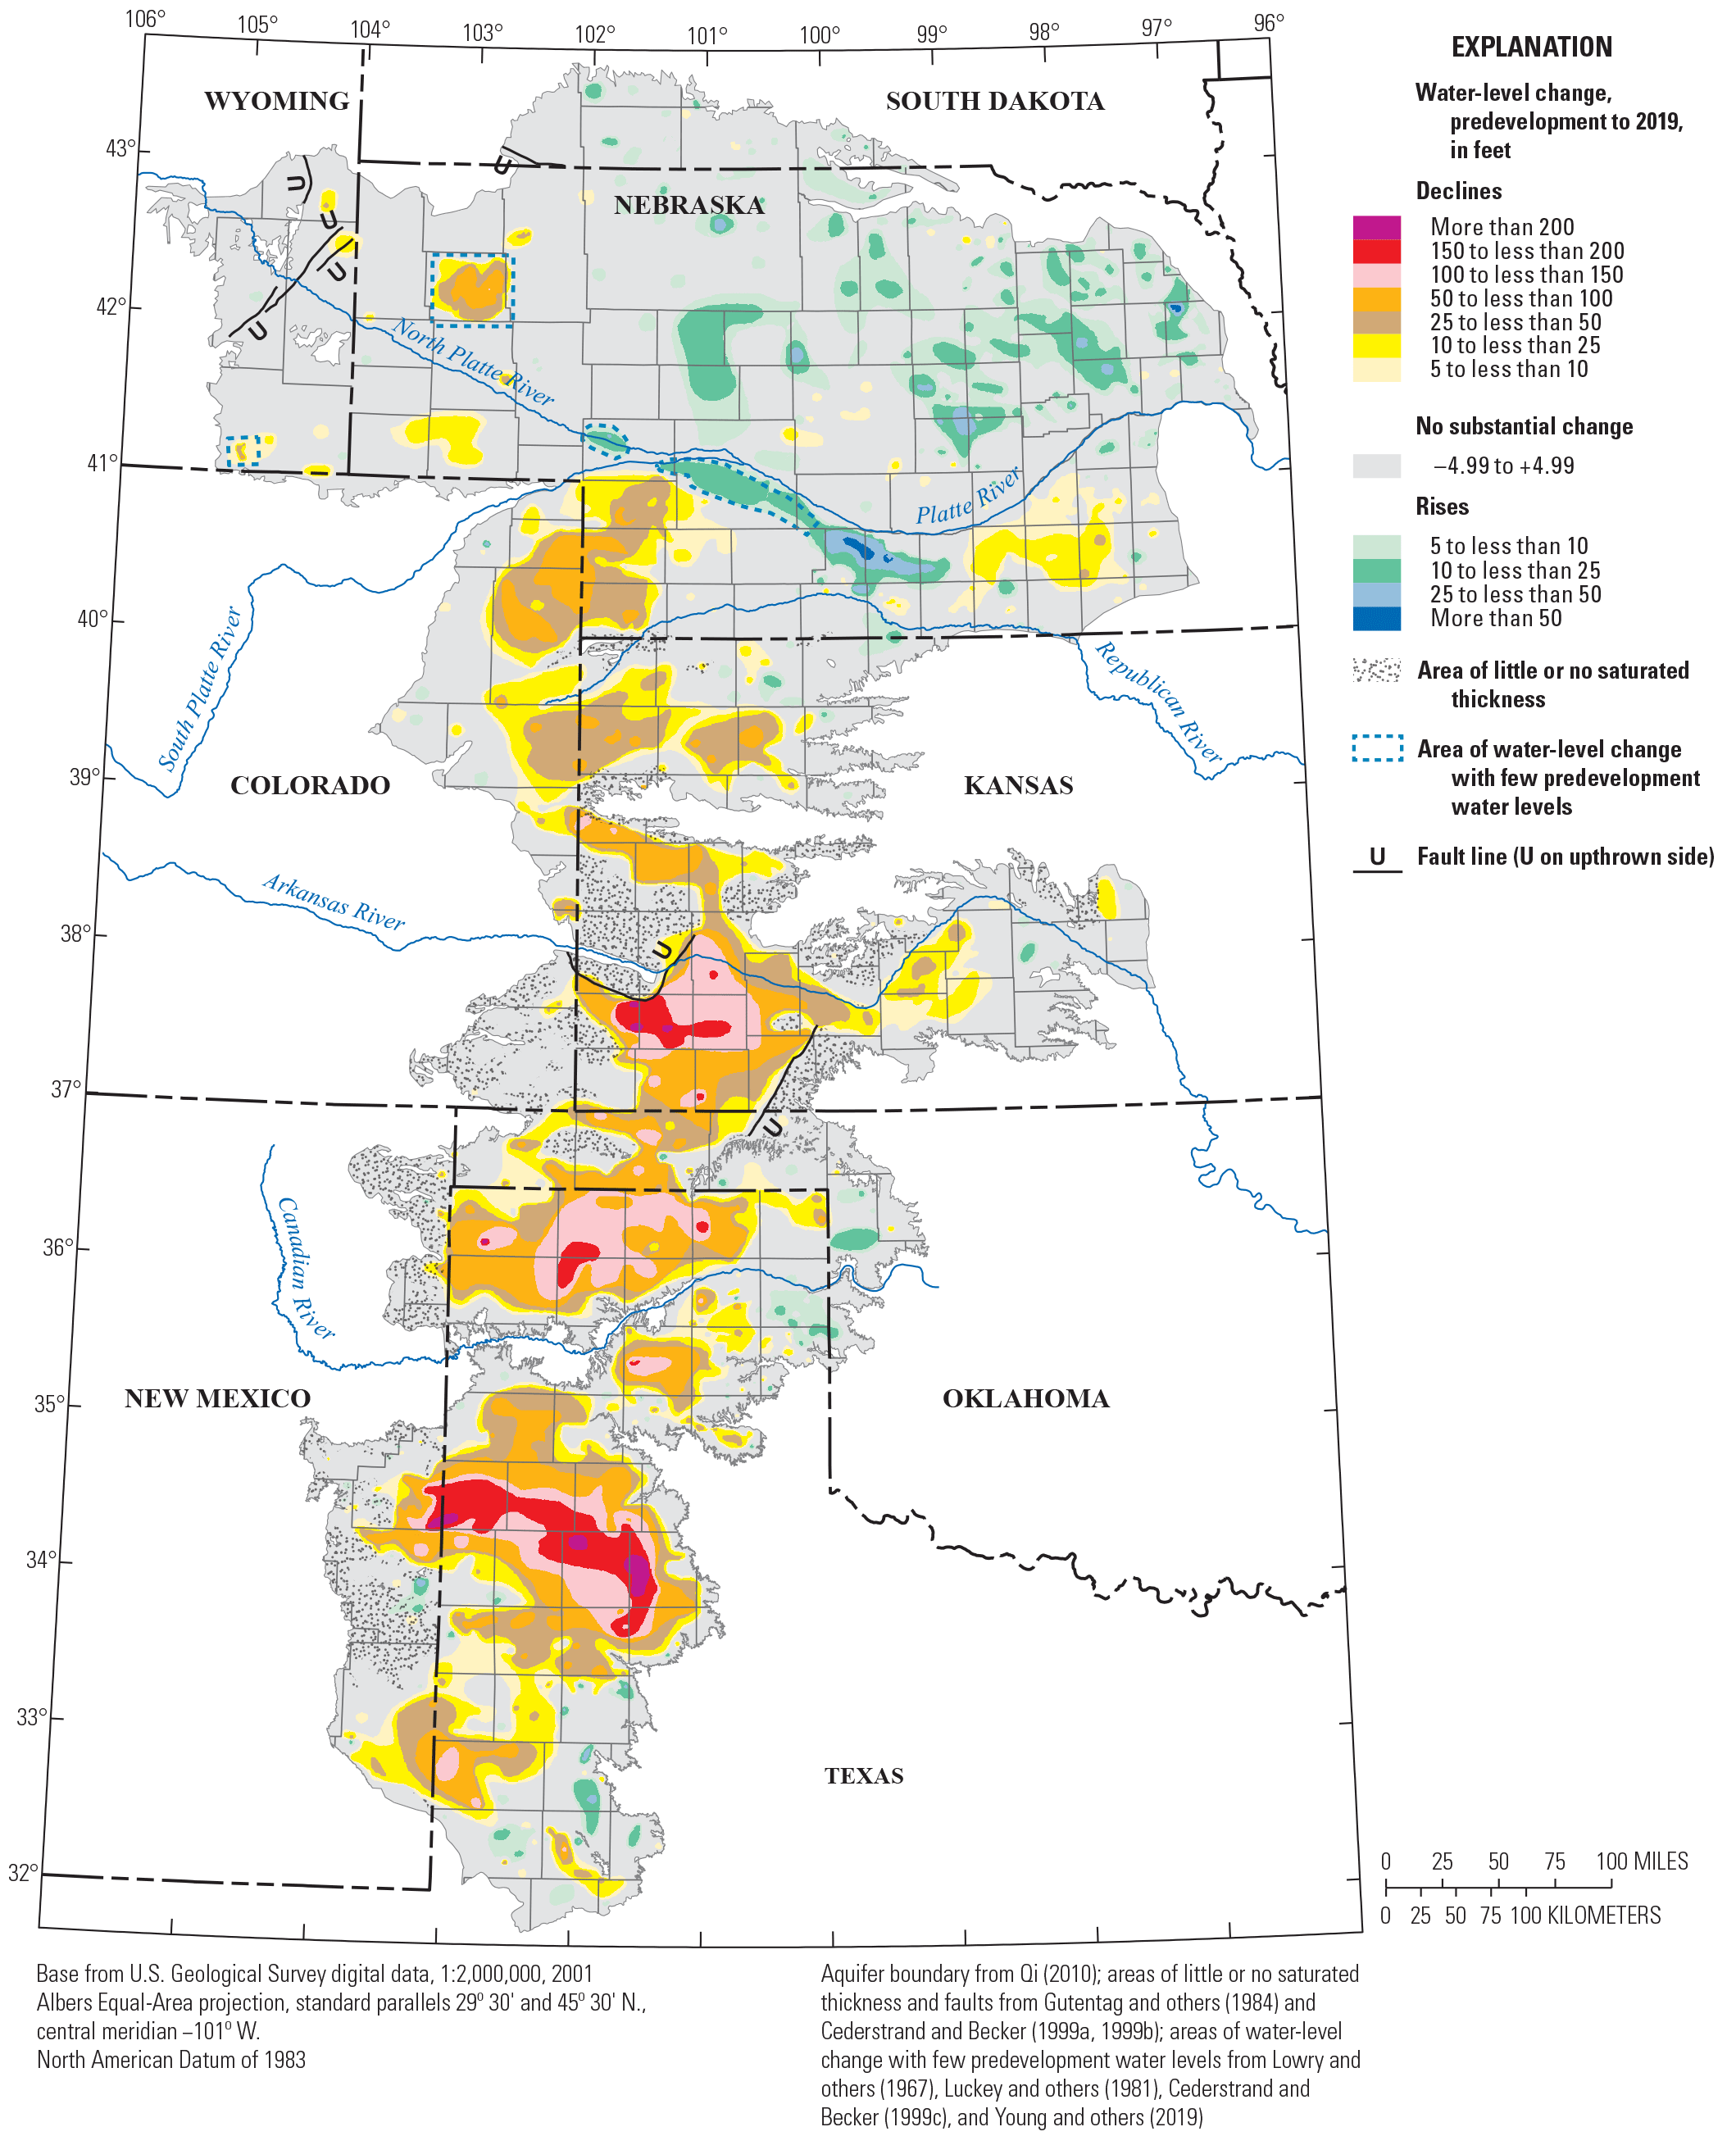
The map of water-level changes in the High Plains aquifer from predevelopment to 2019 (fig. 1) is based on water levels from 2,741 wells, including estimated water levels from 71 wells in New Mexico (table 1), and on other published data (Lowry and others, 1967; Luckey and others, 1981; Young and others, 2019). The other published data were used to portray water-level changes in areas in Nebraska and Wyoming with few predevelopment water levels (fig. 1). Water-level changes in wells, predevelopment to 2019, ranged from the following:
-
· a rise of 86 ft in Nebraska to a decline of 265 ft in Texas,
-
· a rise of 42 ft to a decline of 203 ft in 99 percent of the wells,
-
· a rise of 5 ft to a decline of 5 ft in 34 percent of the wells, and
-
· a rise of 1 ft to a decline of 1 ft in 7 percent of the wells.
The area-weighted, average water-level change from predevelopment to 2019 was a decline of 16.5 ft (table 2). When summarized by State, the area-weighted, average water-level change from predevelopment to 2019 ranged from a decline of 44.1 ft in Texas to a rise of 0.5 ft in South Dakota (table 2). From predevelopment to 2019, not including the areas of little or no saturated thickness, water levels declined 5 ft or more in 34 percent of the aquifer area, 10 ft or more in 27 percent of the aquifer area, 25 ft or more in 19 percent of the aquifer area, and 50 ft or more in 12 percent of the aquifer area. In about 56 percent of the aquifer area, water-level changes ranged from a 5-ft decline to a 5-ft rise, which is considered an area of no substantial change. From predevelopment to 2019, water levels rose 5 ft or more in 10 percent of the aquifer area and 10 ft or more in 4 percent of the aquifer area.
Table 2.
Area-weighted, average water-level changes in the High Plains aquifer, not including areas of little or no saturated thickness, predevelopment (about 1950) to 2019 and 2017 to 2019, by State and for the aquifer.[Data are from McGuire and Strauch (2024). Positive values indicate water-level rises; negative values indicate water-level declines]
Water-Level Changes, 2017 to 2019
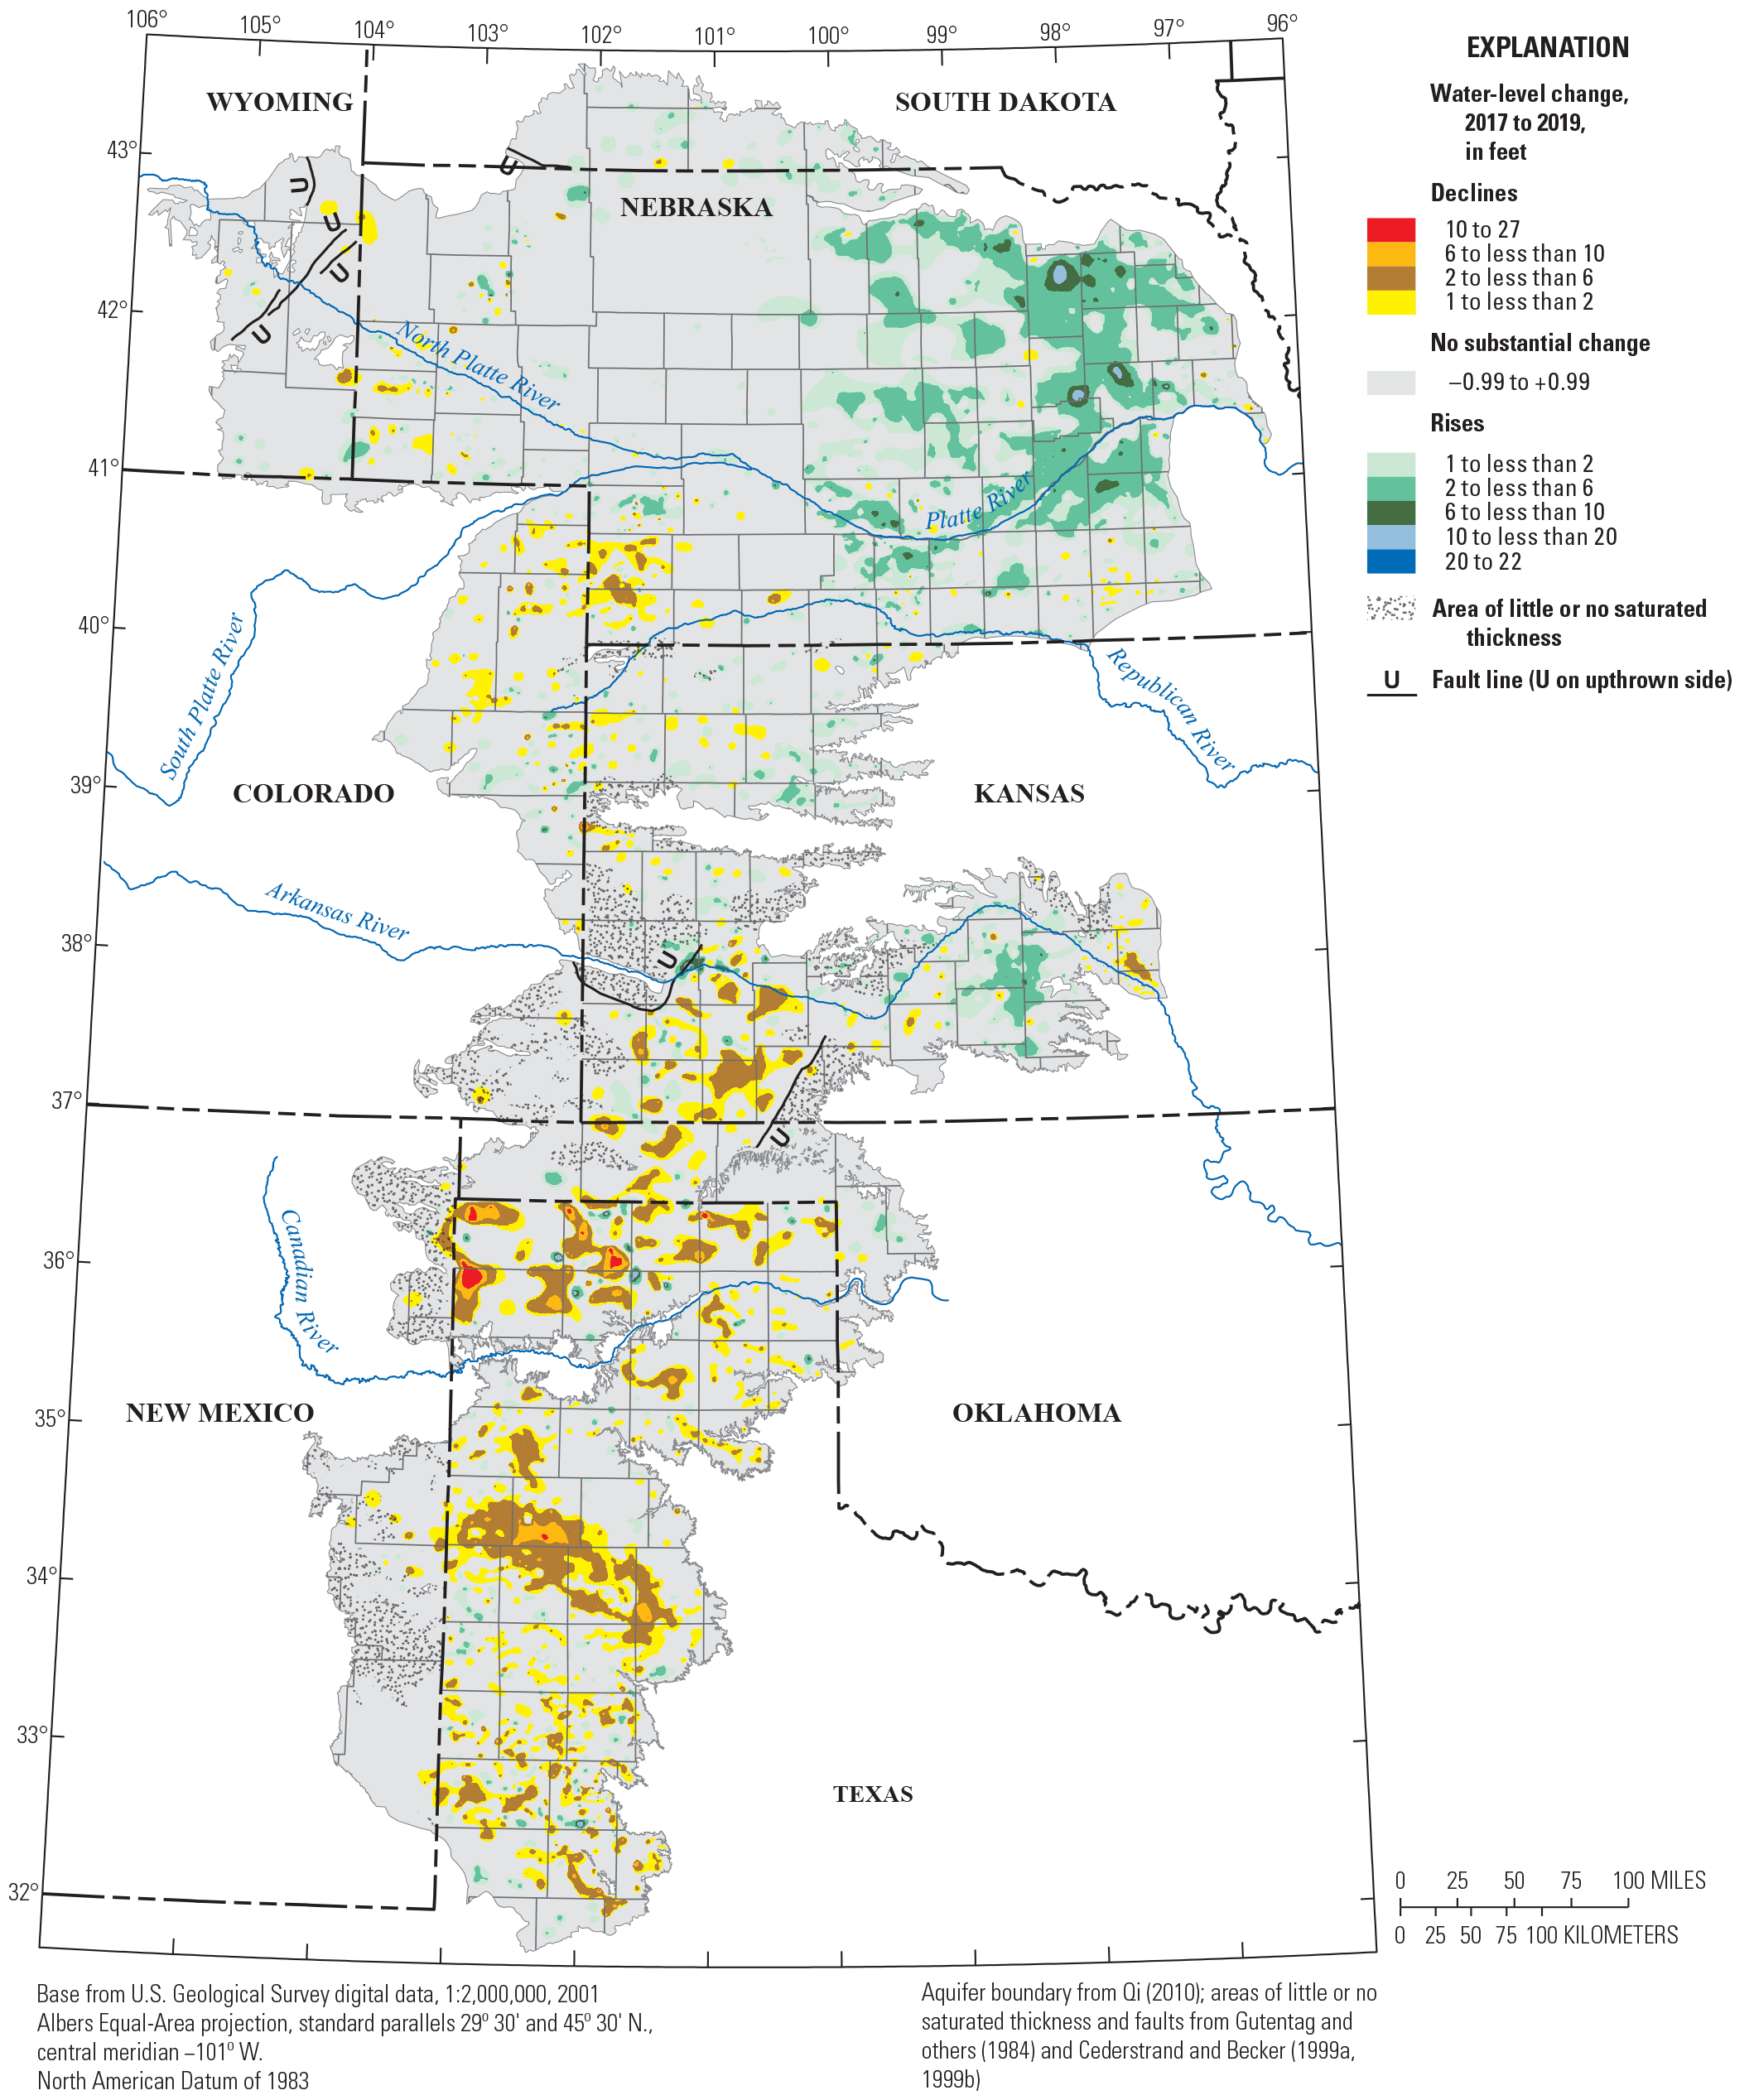
The map of water-level changes in the High Plains aquifer from 2017 to 2019 (fig. 2), was based on water levels from 7,195 wells measured before the irrigation season in 2017 and 2019 (table 1). Water-level changes in the measured wells ranged from the following:
-
· a rise of 34 ft in Texas to a decline of 27 ft in Texas,
-
· a rise of 11 ft to a decline of 11 ft in 99 percent of the wells,
-
· a rise of 5 ft to a decline of 5 ft in 92 percent of the wells, and
-
· a rise of 1 ft to a decline of 1 ft in 42 percent of the wells.
Water levels declined 3 ft or more in 9 percent of the measured wells and declined 6 ft or more in 3 percent of the measured wells. Water levels rose 3 ft or more in 12 percent of measured wells and rose 6 ft or more in 3 percent of measured wells.
The area-weighted, average water-level change for the aquifer for the 2017 to 2019 period was a rise of 0.1 ft (fig. 2; table 2). Area-weighted, average water-level changes, 2017 to 2019, by State ranged from a 0.7-ft decline in Texas to a 0.7-ft rise in Nebraska.
Water-level changes, High Plains aquifer, 2017 to 2019.
Percent Change in Saturated Thickness, Predevelopment to 2019
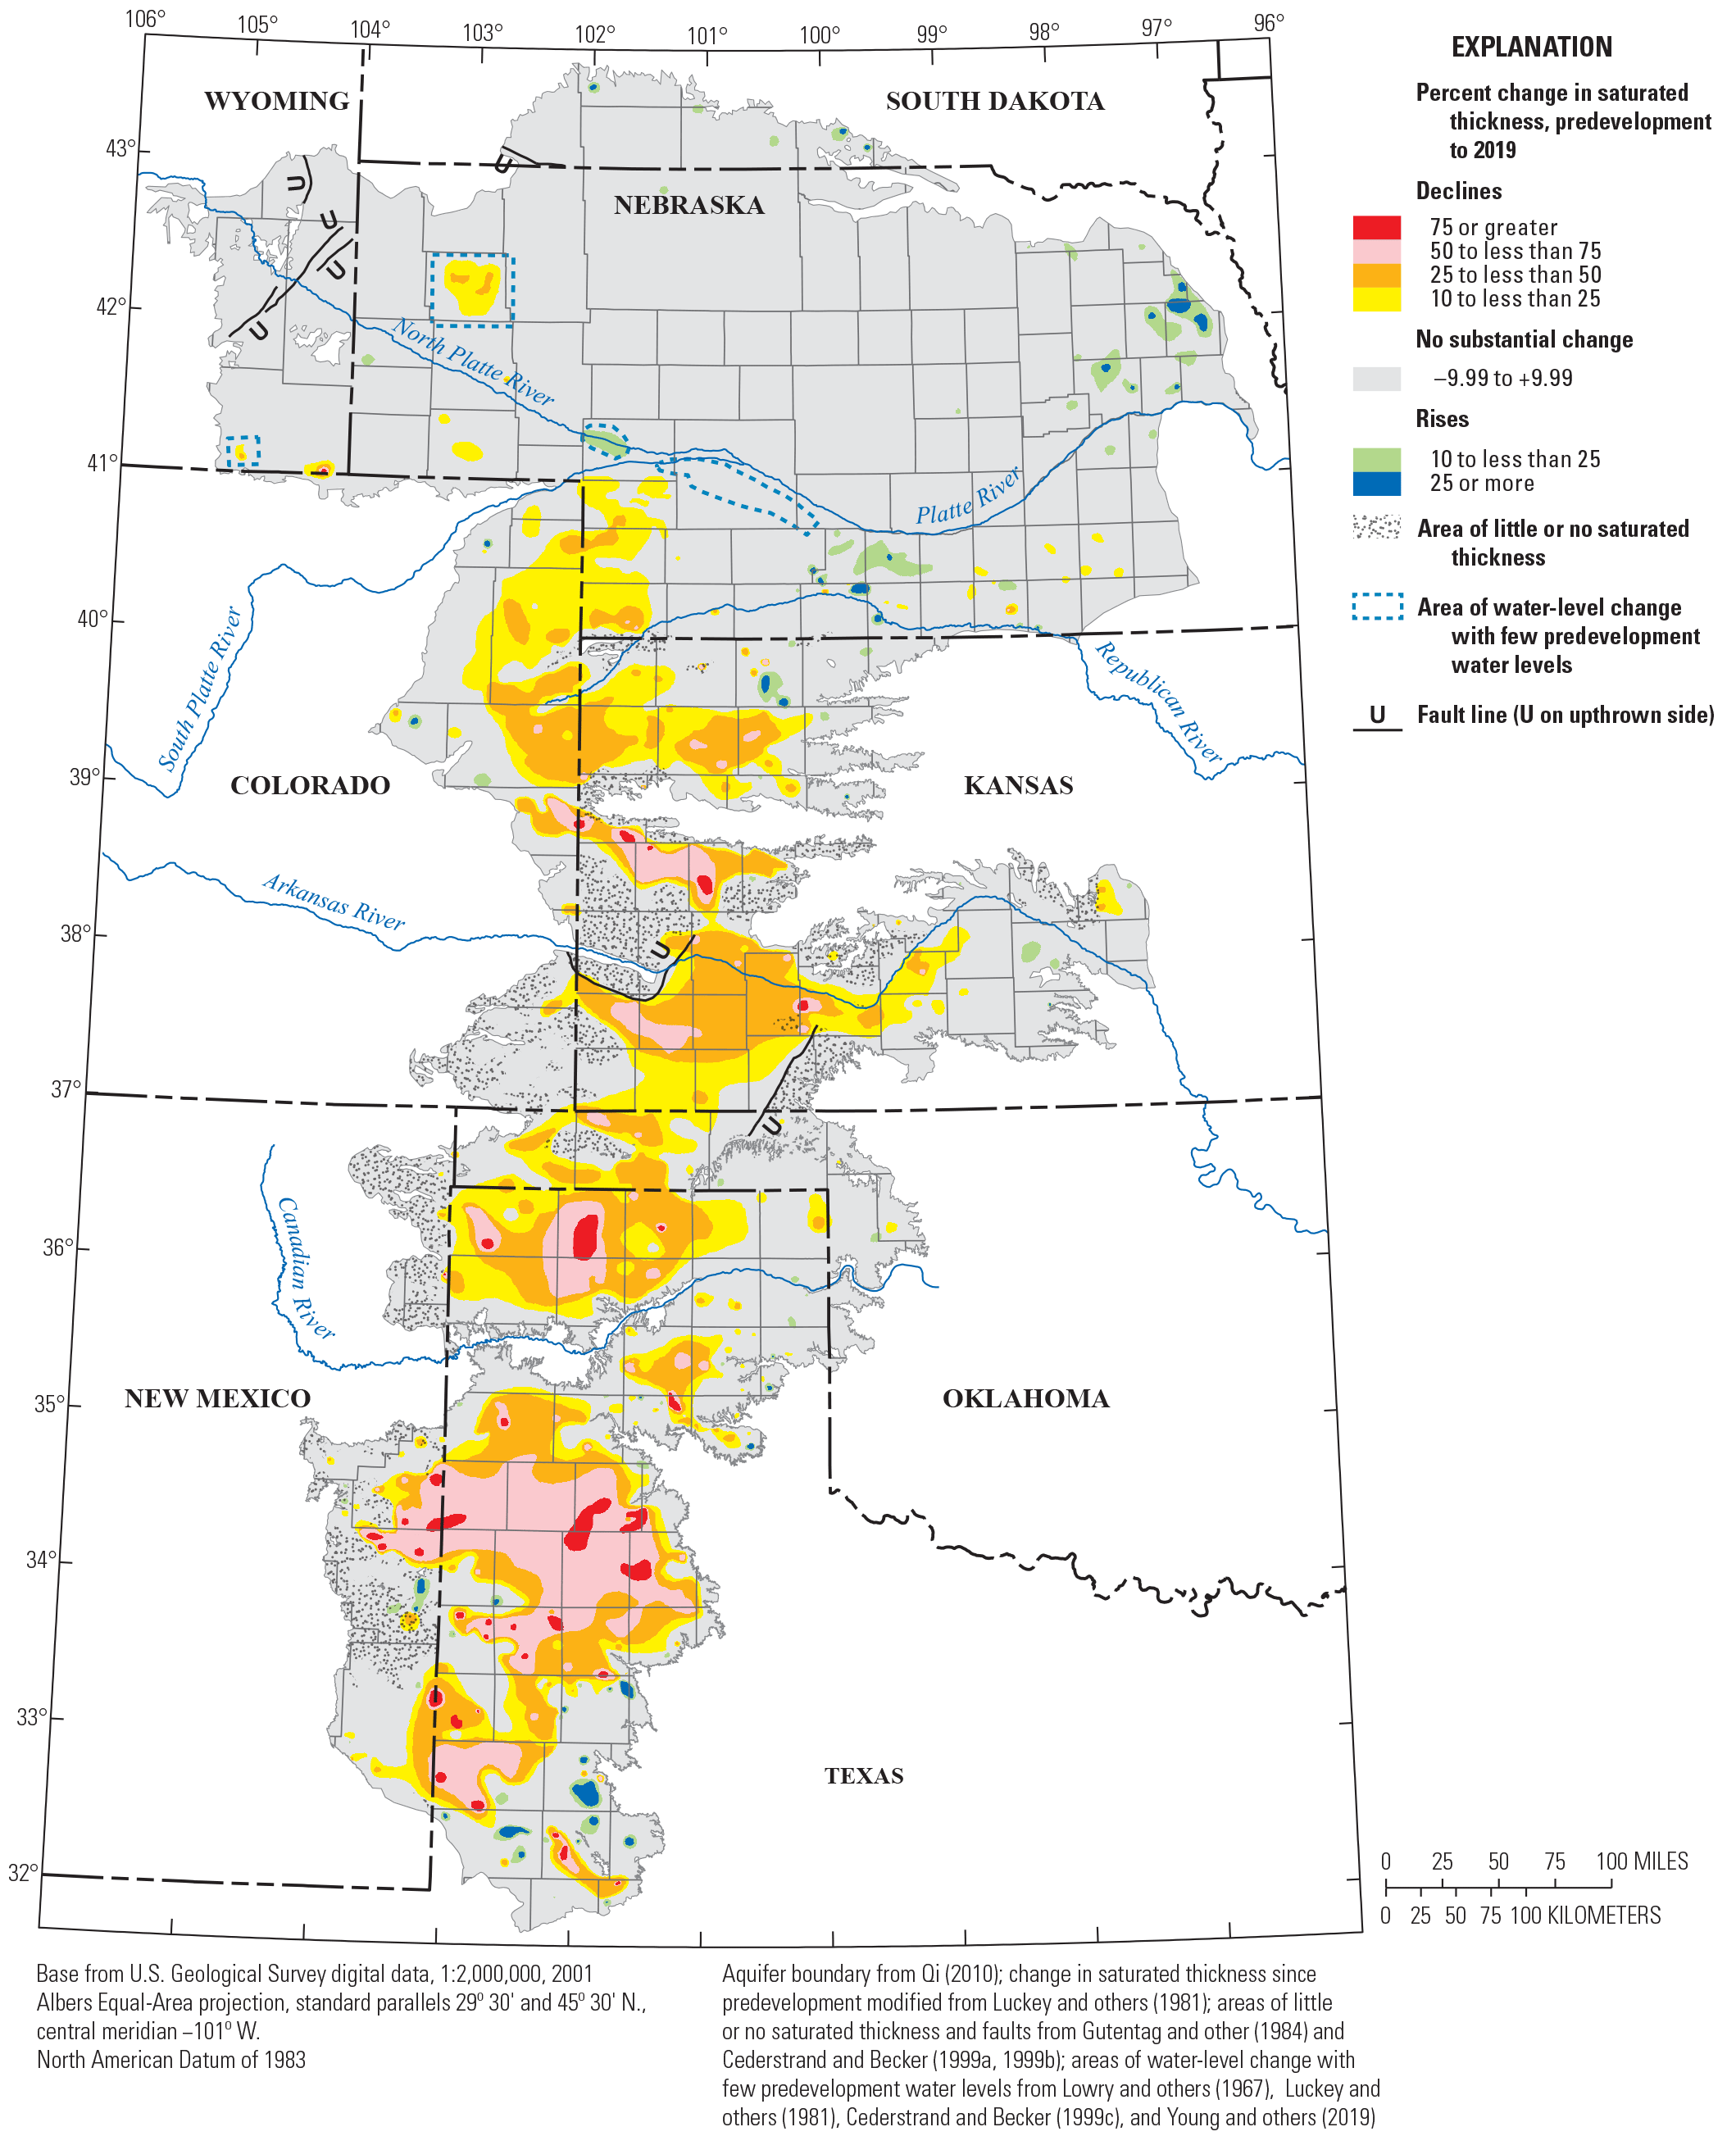
The water-level changes from predevelopment to 2019 as a percentage of predevelopment saturated thickness are shown in figure 3. This map is similar in some areas to the water-level-change map for the same period (fig. 1); however, a large water-level change would not correspond to a substantial percent change in saturated thickness if the predevelopment saturated thickness was large relative to the water-level change. Conversely, an area with small water-level change may correspond to a large percent change in saturated thickness if its predevelopment saturated thickness was small. By 2019, percent change in saturated thickness as a percentage of the aquifer area, not including the areas of little or no saturated thickness, was a decrease of 10 percent or more in 24.5 percent of the area, a decrease of 25 percent or more in 15.0 percent of the area, a decrease of 50 percent or more in 5.7 percent of the area, an increase of 10 percent or more in 1.6 percent of the area, and between a rise of 10 percent and a decline of 10 percent in 73.9 percent of the area.
Percent change in saturated thickness, High Plains aquifer, predevelopment (about 1950) to 2019.
Recoverable Water in Storage and Change in Recoverable Water in Storage, from Predevelopment to 2019 and from 2017 to 2019
Recoverable water in storage in the High Plains aquifer was estimated, using various methods, to have been about 3.20 Gacre-ft at predevelopment (McGuire and others, 2012), 3.25 Gacre-ft in 1980 (Gutentag and others, 1984), 2.98 Gacre-ft in 2000 (McGuire and others, 2003), 2.96 Gacre-ft in 2009 (McGuire and others, 2012), and 2.92 Gacre-ft in 2013 (McGuire, 2014). Recoverable water in storage in the High Plains aquifer in 2019 was estimated by this study as 2.91 Gacre-ft.
Change in recoverable water in storage from predevelopment to 2019 declined by 286.4 Macre-ft for the aquifer overall (table 3) or about a 10-percent decline in storage since predevelopment (McGuire and others, 2012). Changes in recoverable water in storage from predevelopment to 2019, by State, ranged from a decline of 169.6 Macre-ft in Texas to a rise of 0.2 Macre-ft in South Dakota (table 3). Recoverable water in storage from 2017 to 2019 rose 1.6 Macre-ft overall; changes in recoverable water in storage from 2017 to 2019, by State, ranged from a decline of 2.7 Macre-ft in Texas to a rise of 4.3 Macre-ft in Nebraska (table 3).
Table 3.
Change in recoverable water in storage in the High Plains aquifer, predevelopment (about 1950) to 2019 and 2017 to 2019, by State and for the aquifer.[Data are from McGuire and Strauch (2024). Positive values indicate increases in recoverable water in storage; negative values indicate decreases in recoverable water in storage]
Summary
The High Plains aquifer underlies 111.8 million acres (about 175,000 square miles) in parts of eight States: Colorado, Kansas, Nebraska, New Mexico, Oklahoma, South Dakota, Texas, and Wyoming. Water-level declines began in parts of the High Plains aquifer soon after the onset of substantial groundwater irrigation (about 1950). In response to the water-level declines, the U.S. Congress directed the U.S. Geological Survey to monitor water levels in the High Plains aquifer. Since 1987, the U.S. Geological Survey, in collaboration with many State, local, and Federal water-resources entities, has compiled water levels from wells completed in the High Plains aquifer. Water levels were measured in 8,381 wells for water year 2017 and in 8,284 wells for water year 2019. For 71 wells in New Mexico, water levels were estimated for 2019 using the latest static water level measured from water year 2015 to 2018 if the well had a predevelopment water level but did not have a static water level measured in 2019.
This report presents water-level changes in the High Plains aquifer from predevelopment (about 1950) to 2019 and from 2017 to 2019. The water levels used in this report generally were measured in winter or early spring, when irrigation wells typically were not pumping, and after water levels had generally recovered from pumping during the previous irrigation season. The report also presents recoverable water in storage in 2019 and changes in recoverable water in storage from predevelopment to 2019 and 2017 to 2019. The methods to calculate area-weighted, average water-level changes; recoverable water in storage; and change in recoverable water in storage used geospatial data layers organized as rasters with a cell size of 500 meters by 500 meters, which is an area of about 62 acres.
The map of water-level changes in the High Plains aquifer from predevelopment to 2019 is based on water levels from 2,741 wells and other published data. Water-level changes from predevelopment to 2019, in individual wells, ranged from a rise of 86 feet (ft) in Nebraska to a decline of 265 ft in Texas; the range for 99 percent of the wells was from a rise of 42 ft to a decline of 203 ft. The area-weighted, average water-level change from predevelopment to 2019 was a decline of 16.5 ft. By 2019, 15 percent of the aquifer area had a decrease in saturated thickness of more than 25 percent from its predevelopment saturated thickness, 6 percent of the aquifer area had more than a 50-percent decrease, and about 2 percent of the aquifer area had more than a 10-percent increase.
Water levels were measured in 7,195 wells before the irrigation season in 2017 and 2019. Water-level changes in the measured wells ranged from a 27-ft decline in Texas to a 34-ft rise in Texas; the range for 99 percent of the wells was from a rise of 11 ft to a decline of 11 ft. The area-weighted, average water-level change from 2017 to 2019, was a rise of 0.1 ft.
Recoverable water in storage in 2019 was about 2.91 billion acre-feet overall, which was a decline of about 286.4 million acre-feet (Macre-ft) (about 10 percent) since predevelopment. Changes in recoverable water in storage from predevelopment to 2019, by State, ranged from a decline of about 169.6 Macre-ft in Texas to a rise of 0.2 Macre-ft in South Dakota. Recoverable water in storage from 2017 to 2019 rose 1.6 Macre-ft overall; changes in recoverable water in storage, 2017 to 2019, by State ranged from a decline of 2.7 Macre-ft in Texas to a rise of 4.3 Macre-ft in Nebraska.
References Cited
Alley, W.M., Reilly, T.E., and Franke, O.L., 1999, Sustainability of ground-water resources: U.S. Geological Survey Circular 1186, 79 p. [Also available at https://doi.org/10.3133/cir1186.]
Brown, J.F., Howard, D.M., Shrestha, D., and Benedict, T.D., 2019, Moderate Resolution Imaging Spectroradiometer (MODIS) Irrigated Agriculture Datasets for the Conterminous United States (MIrAD-US): U.S. Geological Survey data release, accessed August 2021 at https://doi.org/10.5066/P9NA3EO8.
Cederstrand, J.R., and Becker, M.F., 1998, Digital map of specific yield for High Plains aquifer in parts of Colorado, Kansas, Nebraska, New Mexico, Oklahoma, South Dakota, Texas, and Wyoming: U.S. Geological Survey Open-File Report 98–414, accessed August 2021 at https://doi.org/10.3133/ofr98414.
Cederstrand, J.R., and Becker, M.F., 1999a, Digital map of geologic faults for the High Plains Aquifer in parts of Colorado, Kansas, Nebraska, New Mexico, Oklahoma, South Dakota, Texas, and Wyoming: U.S. Geological Survey Open-File Report 99–261, accessed August 2021 at https://doi.org/10.3133/ofr99261.
Cederstrand, J.R., and Becker, M.F., 1999b, Digital map of areas of little or no saturated thickness for the High Plains Aquifer in parts of Colorado, Kansas, Nebraska, New Mexico, Oklahoma, South Dakota, Texas, and Wyoming: U.S. Geological Survey Open-File Report 99–266, accessed August 2021 at https://doi.org/10.3133/ofr99266.
Cederstrand, J.R., and Becker, M.F., 1999c, Digital map of changes in water levels from predevelopment to 1980 for the High Plains Aquifer in parts of Colorado, Kansas, Nebraska, New Mexico, Oklahoma, South Dakota, Texas, and Wyoming: U.S. Geological Survey Open-File Report 99–265, accessed August 2023 at https://doi.org/10.3133/ofr99265.
Cunningham, W.L., and Schalk, C.W., comps., 2011, Groundwater technical procedures of the U.S. Geological Survey: U.S. Geological Survey Techniques and Methods, book 1, chap. A1, 151 p., accessed August 2021 at https://doi.org/10.3133/tm1A1.
Gaum, C.H., 1953, High Plains, or Llano Estacado, Texas-New Mexico, chap. 6 of Subsurface facilities of water management and patterns of supply—Type area studies, vol. 4 of The physical and economic foundation of natural resources: Interior and Insular Affairs Committee, p. 94–104. [Also available at https://babel.hathitrust.org/cgi/pt?id=osu.32435061292421&view=1up&seq=118&skin=2021.]
Gutentag, E.D., Heimes, F.J., Krothe, N.C., Luckey, R.R., and Weeks, J.B., 1984, Geohydrology of the High Plains aquifer in parts of Colorado, Kansas, Nebraska, New Mexico, Oklahoma, South Dakota, Texas, and Wyoming: U.S. Geological Survey Professional Paper 1400–B, 63 p. [Also available at https://doi.org/10.3133/pp1400B.]
Heimes, F.J., and Luckey, R.R., 1982, Method for estimating historical irrigation requirements from ground water in the High Plains in parts of Colorado, Kansas, Nebraska, New Mexico, Oklahoma, South Dakota, Texas, and Wyoming: U.S. Geological Survey Water-Resources Investigations Report 82–40, 64 p. [Also available at https://doi.org/10.3133/wri8240.]
Heimes, F.J., and Luckey, R.R., 1983, Estimating 1980 ground-water pumpage for irrigation on the High Plains in parts of Colorado, Kansas, Nebraska, New Mexico, Oklahoma, South Dakota, Texas, and Wyoming: U.S. Geological Survey Water-Resources Investigations Report 83–4123, 40 p. [Also available at https://doi.org/10.3133/wri834123.]
Johnson, W.D., 1902, The High Plains and their utilization (concluded), in Hydrography, part IV of Walcott, C.D., Twenty-second annual report of the Director of the United States Geological Survey, 1900–1901: Washington, D.C., U.S. Geological Survey Annual Report 22, 690 p. [Also available at https://doi.org/10.3133/ar22_4.]
Kansas Geological Survey, 2021, WIZARD water well levels database: Lawrence, Kansas Geological Survey database, accessed August 2021 at https://www.kgs.ku.edu/Magellan/WaterLevels/index.html.
Kastner, W.M., Schild, D.E., and Spahr, D.S., 1989, Water-level changes in the High Plains aquifer underlying parts of South Dakota, Wyoming, Nebraska, Colorado, Kansas, New Mexico, Oklahoma, and Texas; Predevelopment through nonirrigation season 1987-1988: U.S. Geological Survey Water-Resources Investigations Report 89–4073, 61 p. [Also available at https://doi.org/10.3133/wri894073.]
Lovelace, J.K., Nielsen, M.G., Read, A.L., Murphy, C.J., and Maupin, M.A., 2020, Estimated groundwater withdrawals from principal aquifers in the United States, 2015 (ver. 1.2, October 2020): U.S. Geological Survey Circular 1464, 70 p., accessed August 2021 at https://doi.org/10.3133/cir1464.
Lowry, M.E., Crist, M.A., and Tilstra, J.R., 1967, Geology and ground-water resources of Laramie County, Wyoming, with a section on Chemical quality of ground water and of surface water, by J.R. Tilstra: U.S. Geological Survey Water-Supply Paper 1834, 71 p. [Also available at https://doi.org/10.3133/wsp1834.]
Luckey, R.R., and Becker, M.F., 1999, Hydrogeology, water use, and simulation of flow in the High Plains aquifer in northwestern Oklahoma, southeastern Colorado, southwestern Kansas, northeastern New Mexico, and northwestern Texas: U.S. Geological Survey Water-Resources Investigations Report 99–4104, 68 p. [Also available at https://doi.org/10.3133/wri994104.]
Luckey, R.R., Gutentag, E.D., and Weeks, J.B., 1981, Water-level and saturated-thickness changes, predevelopment to 1980, in the High Plains aquifer in parts of Colorado, Kansas, Nebraska, New Mexico, Oklahoma, South Dakota, Texas, and Wyoming: U.S. Geological Survey Hydrologic Investigations Atlas HA–652, 2 sheets, scale 1:2,500,000. [Also available at https://doi.org/10.3133/ha652.]
Maupin, M.A., and Barber, N.L., 2005, Estimated withdrawals from principal aquifers in the United States, 2000: U.S. Geological Survey Circular 1279, 46 p. [Also available at https://doi.org/10.3133/cir1279.]
McGuire, V.L., 2013, Water-level and storage changes in the High Plains aquifer, predevelopment to 2011 and 2009–11: U.S. Geological Survey Scientific Investigations Report 2012–5291, 15 p. [Also available at https://doi.org/10.3133/sir20125291.]
McGuire, V.L., 2014, Water-level changes and change in water in storage in the High Plains aquifer, predevelopment to 2013 and 2011–13: U.S. Geological Survey Scientific Investigations Report 2014–5218, 14 p. [Also available at https://doi.org/10.3133/sir20145218.]
McGuire, V.L., 2017, Water-level and recoverable water in storage changes, High Plains aquifer, predevelopment to 2015 and 2013–15: U.S. Geological Survey Scientific Investigations Report 2017–5040, 14 p., accessed August 2021 at https://doi.org/10.3133/sir20175040.
McGuire, V.L., and Strauch, K.R., 2022, Water-level and recoverable water in storage changes, High Plains aquifer, predevelopment to 2017 and 2015–17: U.S. Geological Survey Scientific Investigations Report 2022–5080, 15 p., accessed June 2023 at https://doi.org/10.3133/sir20225080.
McGuire, V.L., and Strauch, K.R., 2024, Data from maps of water-level changes in the High Plains aquifer in parts of Colorado, Kansas, Nebraska, New Mexico, Oklahoma, South Dakota, Texas, and Wyoming, predevelopment (about 1950) to 2019 and 2017 to 2019: U.S. Geological Survey data release, https://doi.org/10.5066/P9WPP01S.
McGuire, V.L., Johnson, M.R., Schieffer, R.L., Stanton, J.S., Sebree, S.K., and Verstraeten, I.M., 2003, Water in storage and approaches to ground-water management, High Plains aquifer, 2000: U.S. Geological Survey Circular 1243, 51 p. [Also available at https://doi.org/10.3133/cir1243.]
McGuire, V.L., Lund, K.D., and Densmore, B.K., 2012, Saturated thickness and water in storage in the High Plains aquifer, 2009, and water-level changes and changes in water in storage in the High Plains aquifer, 1980 to 1995, 1995 to 2000, 2000 to 2005, and 2005 to 2009: U.S. Geological Survey Scientific Investigations Report 2012–5177, 28 p. [Also available at https://doi.org/10.3133/sir20125177.]
Meinzer, O.E., 1923, Outline of ground-water hydrology, with definitions: U.S. Geological Survey Water-Supply Paper 494, 71 p. [Also available at https://doi.org/10.3133/wsp494.]
Peterson, S.M., Traylor, J.P., and Guira, M., 2020, Groundwater availability of the Northern High Plains aquifer in Colorado, Kansas, Nebraska, South Dakota, and Wyoming: U.S. Geological Survey Professional Paper 1864, 57 p. [Also available at https://doi.org/10.3133/pp1864.]
Qi, S.L., 2010, Digital map of aquifer boundary for the High Plains aquifer in parts of Colorado, Kansas, Nebraska, New Mexico, Oklahoma, South Dakota, Texas, and Wyoming: U.S. Geological Survey Data Series 543. [Also available at https://doi.org/10.3133/ds543.]
Stanton, J.S., Qi, S.L., Ryter, D.W., Falk, S.E., Houston, N.A., Peterson, S.M., Westenbroek, S.M., and Christenson, S.C., 2011, Selected approaches to estimate water-budget components of the High Plains, 1940 through 1949 and 2000 through 2009: U.S. Geological Survey Scientific Investigations Report 2011–5183, 79 p. [Also available at https://doi.org/10.3133/sir20115183.]
Taylor, C.J., and Alley, W.M., 2001, Ground-water-level monitoring and the importance of long-term water-level data: U.S. Geological Survey Circular 1217, 68 p. [Also available at https://doi.org/10.3133/cir1217.]
Texas Water Development Board, 2022, Groundwater Database (GWDB) reports and downloads: Texas Water Development Board Groundwater Database, accessed September 2022 at https://www.twdb.texas.gov/groundwater/data/gwdbrpt.asp.
Thelin, G.P., and Heimes, F.J., 1987, Mapping irrigated cropland from Landsat data for determination of water use from the High Plains aquifer in parts of Colorado, Kansas, Nebraska, New Mexico, Oklahoma, South Dakota, Texas, and Wyoming: U.S. Geological Survey Professional Paper 1400–C, 38 p. [Also available at https://doi.org/10.3133/pp1400C.]
U.S. Geological Survey [USGS], 2022a, National Ground-Water Monitoring Network: U.S. Geological Survey digital data, accessed September 2022 at https://cida.usgs.gov/ngwmn/.
U.S. Geological Survey [USGS], 2022b, USGS water data for the Nation: U.S. Geological Survey National Water Information System database, accessed December 2022 at https://doi.org/10.5066/F7P55KJN.
Weeks, J.B., and Gutentag, E.D., 1981, Bedrock geology, altitude of base, and 1980 saturated thickness of the High Plains aquifer in parts of Colorado, Kansas, Nebraska, New Mexico, Oklahoma, South Dakota, Texas, and Wyoming: U.S. Geological Survey Hydrologic Investigations Atlas HA–648, 2 sheets, scale 1:2,500,000. [Also available at https://doi.org/10.3133/ha648.]
Wyoming State Engineer’s Office, 2021, Real-time SEO water data: Wyoming State Engineer’s Office digital data, accessed April 2021 at https://seoflow.wyo.gov/.
Young, A.R., Burbach, M.E., Howard, L.M., Lackey, S.O., and Joeckel, R.M., 2019, Nebraska statewide groundwater-level monitoring report 2019: University of Nebraska-Lincoln, Conservation and Survey Division, Nebraska Water Survey Paper 87, 24 p. [Also available at https://snr.unl.edu/csd-esic/GWMapArchives/GWReports/GW_Level_Report_2019.pdf.]
Conversion Factors
U.S. customary units to International System of Units
One acre-foot of water is equivalent to the volume of water that would cover 1 acre (43,560 square feet) to a depth of 1 foot (325,851 gallons or 43,560 cubic feet).
Datums
Horizontal coordinate information is referenced to the North American Datum of 1983 (NAD 83).
Vertical coordinate information is referenced to the North American Vertical Datum of 1988 (NAVD 88).
Altitude, as used in this report, refers to distance above the vertical datum.
Supplemental Information
Water year is the 12-month period, October 1 through September 30, and is designated by the calendar year in which it ends.
For more information about this publication, contact:
Director, USGS Nebraska Water Science Center
5231 South 19th Street
Lincoln, NE 68512
402–328–4100
For additional information, visit: https://www.usgs.gov/centers/ne-water
Publishing support provided by the
Rolla Publishing Service Center
Disclaimers
Any use of trade, firm, or product names is for descriptive purposes only and does not imply endorsement by the U.S. Government.
Although this information product, for the most part, is in the public domain, it also may contain copyrighted materials as noted in the text. Permission to reproduce copyrighted items must be secured from the copyright owner.
Suggested Citation
McGuire, V.L., and Strauch, K.R., 2024, Water-level and recoverable water in storage changes, High Plains Aquifer, predevelopment to 2019 and 2017 to 2019: U.S. Geological Survey Scientific Investigations Report 2023–5143, 15 p., https://doi.org/10.3133/sir20235143.
ISSN: 2328-0328 (online)
Study Area
| Publication type | Report |
|---|---|
| Publication Subtype | USGS Numbered Series |
| Title | Water-level and recoverable water in storage changes, High Plains Aquifer, predevelopment to 2019 and 2017 to 2019 |
| Series title | Scientific Investigations Report |
| Series number | 2023-5143 |
| DOI | 10.3133/sir20235143 |
| Publication Date | February 13, 2024 |
| Year Published | 2024 |
| Language | English |
| Publisher | U.S. Geological Survey |
| Publisher location | Reston, VA |
| Contributing office(s) | Nebraska Water Science Center |
| Description | Report: vi, 15 p.; Data Release |
| Country | United States |
| Online Only (Y/N) | Y |
| Additional Online Files (Y/N) | N |