

A Comparison of Water-Quality and Stormwater Inflow and Outflow During Habitat Restoration at the McEwen Storm Drainage Pond, South Valley, Albuquerque, New Mexico, 2020–22
Links
- Document: Report (3.68 MB pdf) , HTML , XML
- Data Release: USGS water data for the Nation - U.S. Geological Survey National Water Information System database
- NGMDB Index Page: National Geologic Map Database Index Page (html)
- Download citation as: RIS | Dublin Core
Acknowledgments
Thanks to the Bernalillo County staff and First Choice Community Health Care for providing knowledge about the area and the opportunity to carry out this study.
The authors would like to thank U.S. Geological Survey (USGS) staff who assisted in the collection of these samples at late hours of the night on weekends and holidays, including Elaiya Journey, Harold Nelson, and Zach Shephard, as well as former USGS staff Christina Bryant, Alanna Jornigan, and Amber Lidell.
Abstract
In 2020, the U.S. Geological Survey began targeted monitoring, in partnership with Bernalillo County, at three locations within the McEwen storm drainage pond to evaluate and compare the water quality of stormwater as it enters and exits the study area, which is channelized and routes urban stormwater runoff through a wetland area. Stage in McEwen pond and precipitation at a nearby precipitation gage were evaluated to observe relations between rainfall and stage, as well as how long the stage remained elevated at the site. Peak stage ranged from 0.73 to 2.4 feet, with the time to reach peak stage at McEwen pond ranging from 45 minutes to 10 hours and 45 minutes. The stage remained elevated for a median of 3 days. Monitored water-quality parameters included physical parameters, bacteria, sediment, and nutrients. Bacteria was the only parameter that frequently exceeded the New Mexico Water Quality standard. Significant differences (p less than 0.05) among sites were few, consisting of those for total nitrogen and dissolved ammonia concentrations, which decreased toward the middle of the pond and were lower in the outflow from the pond compared to concentrations at the east and west sites. The middle of McEwen pond showed an increase in the percentage of fine-grained sediment, which suggests that larger particles settled into the pond and were further filtered as water traveled through the swales. Concentrations of suspended sediment and dissolved nutrients were significantly lower in 2022 compared to previous years. Although the site is still undergoing restoration and plants are becoming established, observations over the last several years indicate that site restoration has resulted in changes to the study area through processes such as nutrient uptake and the filtering of larger sediment particles.
Introduction
Bernalillo County, along with 13 other local entities, is regulated by the U.S. Environmental Protection Agency (EPA) and its National Pollutant Discharge and Elimination System (NPDES) through a Municipal Separate Storm Sewer System (MS4) permit (no. NMR04A000; EPA, 2023a). The MS4 permit is a multisource watershed-based permit that, upon implementation, can improve water quality and help managers effectively meet total maximum daily load limits and improve watershed management (EPA, 2023b). Resource managers from the 14 entities are included under the watershed-based MS4 permit and are required to employ best management plans to reduce contaminant loads to the Rio Grande, which flows north to south through Albuquerque (fig. 1). The MS4 permit requires wet weather monitoring for the following: total suspended solids (TSS), total dissolved solids (TDS), chemical oxygen demand, biological oxygen demand, dissolved oxygen, oil and grease, Escherichia coli (E. coli), pH, total Kjeldahl nitrogen (TKN), nitrate plus nitrite, dissolved phosphorus, total ammonia plus organic nitrogen, total phosphorus, polychlorinated biphenyls, and gross alpha particle activity.
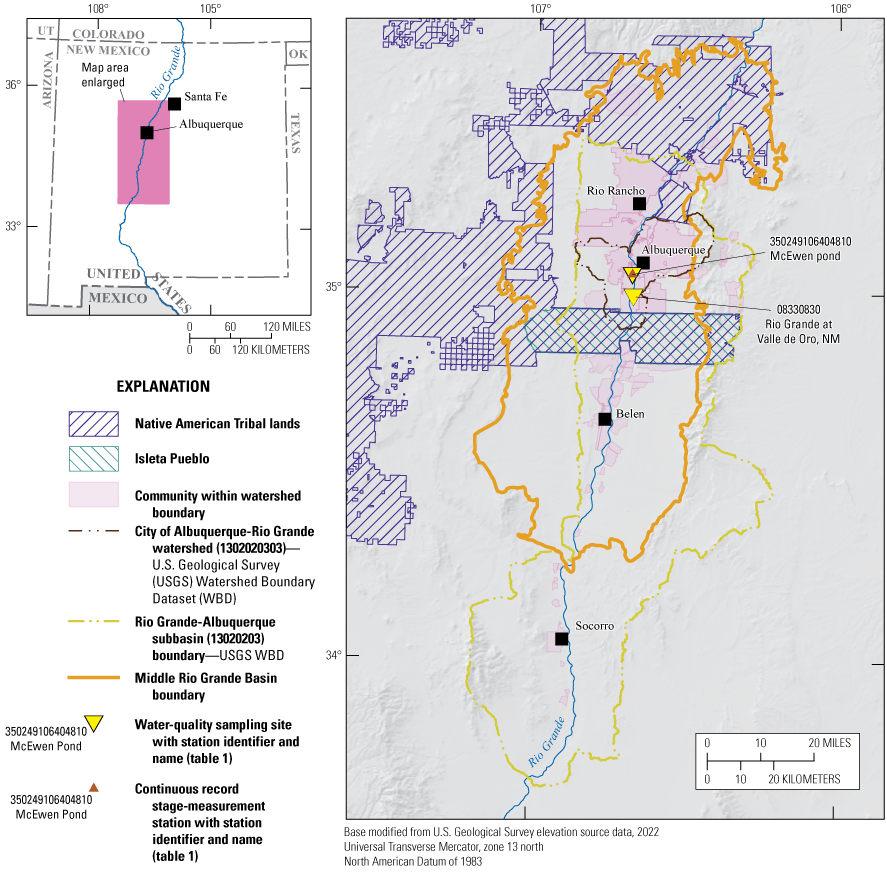
Region surrounding study area within the Rio Grande – Albuquerque HUC 8 watershed and the Middle Rio Grande Basin in central New Mexico.
The McEwen storm drainage pond (hereafter “McEwen pond”; fig. 2), located in the unincorporated neighborhood of South Valley near Albuquerque, New Mexico, is an example of one of the many best management practices employed within the watershed to manage stormwater. Bernalillo County, whose jurisdiction includes the City of Albuquerque and the South Valley, collaborated with the U.S. Fish and Wildlife Service (USFWS), whose jurisdiction includes Valle de Oro National Wildlife Refuge (fig. 2), on several Prescribed Endemic Refuge Connected Habitat Areas (PERCHAs) within Bernalillo County owned and maintained drainage facilities. McEwen pond is one of the PERCHAs for which one of the objectives is to establish habitat areas for wildlife, linking Bernalillo County properties with Valle de Oro National Wildlife Refuge (USFWS, 2019).
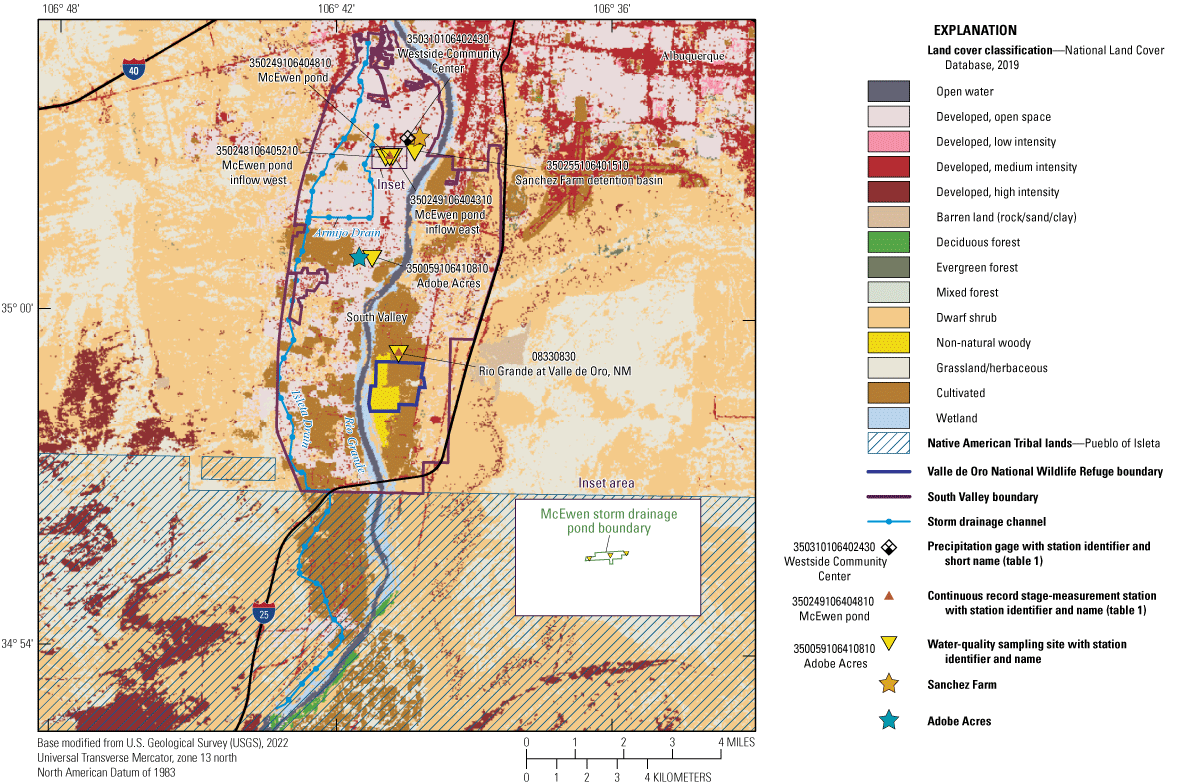
Study area in Albuquerque, New Mexico, the South Valley neighborhood, and land cover (Dewitz and USGS, 2021).
McEwen pond is an approximately 2-acre stormwater retention facility operated and maintained by the Bernalillo County Public Works Division (figs. 2 and 3). The pond is adjacent to approximately 10 acres of property, owned by First Choice Community Healthcare, to the north and south of the pond (fig. 3). Development of the McEwen pond PERCHA included establishment of swales and channels to route urban stormwater runoff to the pond outlet, as well as to fruit trees and wetlands, to help filter the stormwater runoff (Bernalillo County, 2023).
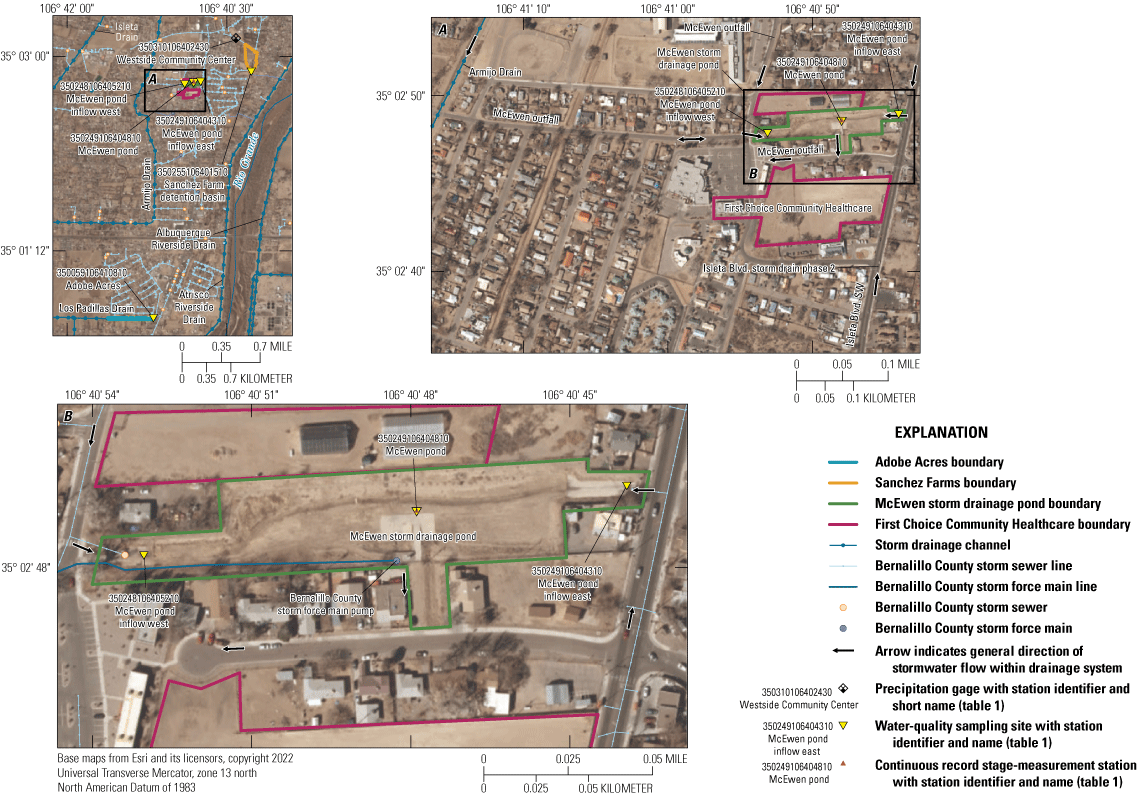
Detailed view of McEwen pond, neighboring properties, and storm drainage.
In 2010, the board of directors of First Choice Community Healthcare began acquiring land to construct health-promoting enterprises (First Choice Community Healthcare, 2016). Approximately 20 acres of land is planned for development as part of a South Valley Community Commons, including training centers, a community farm, and community garden plots, among other efforts. McEwen pond lies within the expanded Commons area, and, as such, will contribute to the planned wellness ecosystem (First Choice Community Healthcare, 2016).
In 2018, the U.S. Geological Survey (USGS), in cooperation with Bernalillo County, began water-quality monitoring at a central site within McEwen pond to begin an evaluation of the effectiveness of the restoration at the site. Initially, grab samples were collected when water was present at the site, sometimes well after rainfall events and from stagnant water that remained at the site several days after the rainfall events. In 2020, the USGS began a more targeted monitoring campaign that focused on measuring water quality at two additional locations where runoff entered the pond, as well as near the center of the pond, where both inflows combine and exit the south-central pond area (fig. 3, table 1).
Table 1.
Study area sites, including water-quality sampling sites, stage, and precipitation gages.[Latitude and longitude values are referenced to the North American Datum of 1983. ID, identification number; USGS, U.S. Geological Survey; nr, near; NM, New Mexico]
Purpose and Scope
The purpose of this report is to compare water-quality and stormwater inflow and outflow during habitat restoration at McEwen pond from 2020 through 2022. During this time period, McEwen pond restoration with native vegetation was ongoing, and water-quality data were evaluated to determine if differences were observed between locations and years. Additionally, stage from the pond center and precipitation data from a nearby USGS precipitation gage were evaluated to determine how long water stayed ponded at the site, the amount of precipitation needed to create flow within the study area, and the amount of time it took for water from precipitation events at the precipitation gage to reach McEwen pond (fig. 2, table 1).
Description of Study Area
The study area is in the South Valley of Albuquerque, an unincorporated area adjacent to the southern border of the city, and the Rio Grande flows through the South Valley (fig. 2). McEwen pond is located near the northern boundary of the South Valley, which is dominated by urban development. McEwen pond was excavated and lined with clay in 2017 to serve as a stormwater drainage basin. The land surface in this area is lower than surrounding properties and receives stormwater from east and west inflows (fig. 3). Stormwater collects at the center of the site before entering an overflow structure leading to a subsurface drain system and pump station where flow is artificially controlled by Bernalillo County water managers. Despite McEwen pond being fenced off along its perimeter, preventing public access into the site while it is undergoing restoration, vandalism occurred throughout the study period, impacting sample collection.
During 2018–19, a trail was created on the northern slope of the basin, but at present, the area is fenced off, preventing any access to the trail. At the start of the study in 2018, native vegetation was sparse at McEwen pond, and included many invasive species (USFWS, 2019). In 2020, invasive species were removed, and native species, including trees, shrubs, vines, forbs, desert succulents, and cacti, were planted by Rocky Mountain Youth Corps (P. Polechla, Tree New Mexico, written commun., 2020). Although it will take several years for the plants to become fully established, vegetation cover has already increased at the site since first established (fig. 4).
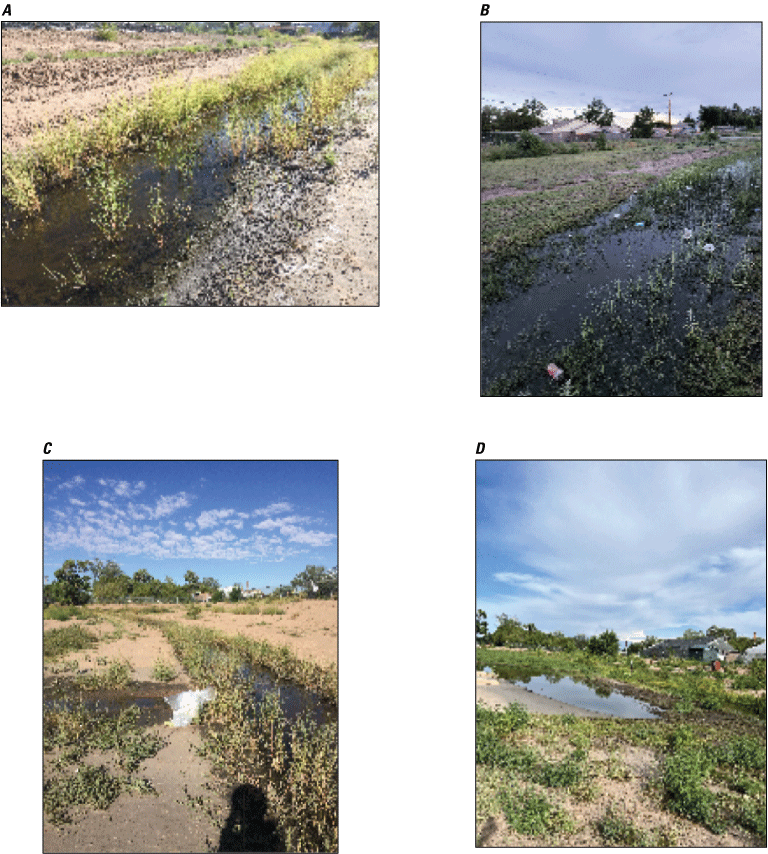
Before (September 2018) and after (August 2022) landscape at McEwen pond with similar views to the northeast and northwest. A, Northeast view, September 12, 2018; B, northeast view, August 9, 2022; C, northwest view, September 12, 2018; and D, northwest view August 2, 2022.
Hydrology
Hydrologic unit codes (HUCs) are units by which the watersheds of the United States are classified. HUCs range from 2 to 14 digits, based on area, where fewer digits indicate a larger watershed area (USGS, 2022a). Albuquerque and the South Valley area are within the HUC 8 watershed 13020203, the Rio Grande-Albuquerque subbasin, which encompasses 3,216 square miles (fig. 1). The HUC 10 watershed where the study area is located is HUC 1302020303 (City of Albuquerque-Rio Grande watershed, 330 square miles). The land cover in the HUC 10 watershed is 47 percent shrubland/grassland; 34 percent urban development; and 4 percent crops, pasture, and hay (fig. 2; Dewitz and USGS, 2021). The major contributor of water to the study area is stormwater drainage infrastructure (fig. 3).
Stormwater inputs differ between the east and west portions of McEwen pond (fig. 3). The area east of the study site is highly developed with the busy thoroughfare of SW. The east side of McEwen pond receives stormwater from the Bernalillo County storm drainage running along Isleta Boulevard SW. The west side receives stormwater from Bernalillo County storm drainage, as well. The area west of the study site is developed, but there is more shrubland and residential area contributing to storm drainage than on the east side. The areas surrounding McEwen pond are mostly impervious surfaces (fig. 5; Dewitz and USGS, 2021). Visually apparent color and turbidity differences in water characteristics have been documented when comparing the confluence of the East and West sites (fig. 6). The level of water in the pond is artificially controlled by Bernalillo County via a pump station at McEwen pond. Pumped water flows out of the McEwen pond area, as indicated by the southward flow on figure 3A, to the Bernalillo County force main pump, then through the Armijo Drain (fig. 3) and Isleta Drain to the Rio Grande (fig. 2). The Armijo and Isleta Drains are part of a system of canals that transport water to and from the Rio Grande.
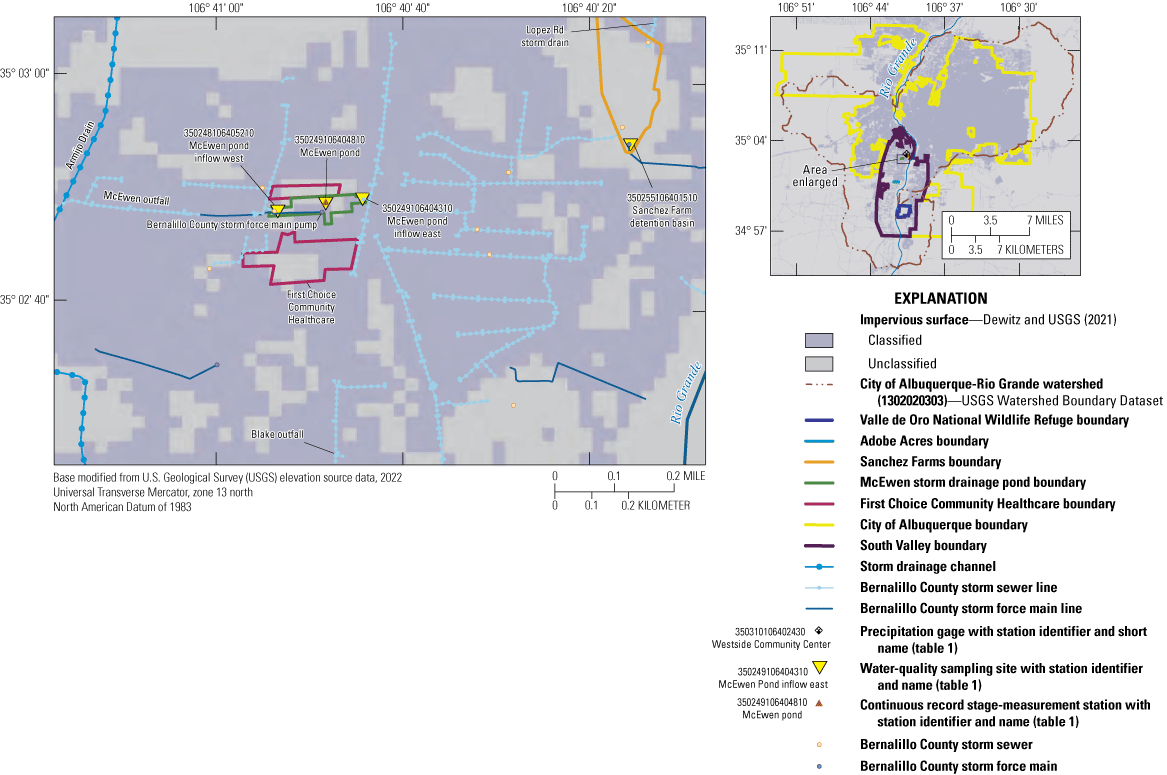
Impervious surface coverage near McEwen pond (Dewitz and USGS, 2021).
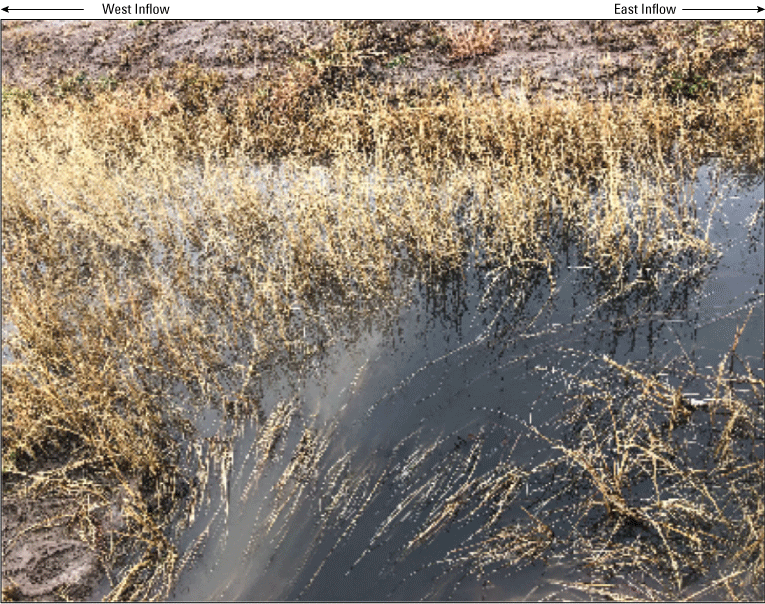
Confluence of western and eastern inflows at the center of McEwen pond on November 21, 2019 (photograph by Christina Bryant, U.S. Geological Survey).
Climate
The climate in the study area is semiarid, with mostly sunny days and low humidity (Thorn and others, 1993). The monsoon season in the Middle Rio Grande Basin, an alluvial basin, is from June to October. Rainfall during this season is generally localized and short-lived, making rainfall patterns spatially and temporally variable throughout the watershed. Monsoonal storms are typically small, convective cells that are flashy and intense and move through the area quickly (Veenhuis, 2003). On average, the Middle Rio Grande Basin receives 45–62 percent of its annual rainfall during the monsoon season (Bartolino and Cole, 2002). During the 2020–22 water years, annual precipitation ranged from 6.28 to 8.76 inches (in.) at the Westside Community Center precipitation gage (table 1, fig. 2). (A water year is defined as October 1 through September 30 of the following year, with the year designated by the year in which it ends.) During the sampling seasons (June–September, 2020–22), precipitation ranged from 4.12 to 4.92 in.
Previous Monitoring and Related Studies
Urbanization has substantially increased stormwater runoff to drainage systems and natural stream channels in Albuquerque (Kelly and others, 2006). Since 1992, the USGS, in cooperation with University of New Mexico, Bernalillo County, Albuquerque Metropolitan Arroyo and Flood Control Authority, and the New Mexico Highway Department have collected stormwater-quality data to meet regulations outlined in the NPDES stormwater permit (Veenhuis, 2003). Precipitation patterns, hydrologic conditions, and discharge calculations have been extensively documented by the USGS and its cooperators (Kelly and others 2006; Storms and others, 2015; Shephard and others, 2019).
During water years 2017 and 2018, Shephard and others (2019) investigated the prevalence of polychlorinated biphenyls from Rio Grande tributary stormwater channels in the urban area of Albuquerque. Additionally, they used the Arid Lands Hydrologic Model, a rainfall runoff model adapted from the U.S. Department of Agriculture, to estimate stormwater discharge from two different sites within the South Valley: Adobe Acres, approximately 2.2 miles southeast of McEwen pond, and Sanchez Farms, approximately 0.44 mile northeast of McEwen pond (fig. 2). The average estimated runoff volume at Adobe Acres was 1.86 acre-feet, and the cumulative event precipitation averaged 0.43 in. for the two events modeled at that site. The stormflow was noted to be flashy, and the average time to peak discharge was 2 hours and 32 minutes. The discharge and flow at Sanchez Farms were more variable; two separate modeled storm events had cumulative precipitation totals of 0.36 and 1.45 in. and corresponding runoff volumes of 2.23 and 12.90 acre-feet, respectively. Time to peak discharge differed greatly for these two events, being 1 hour and 5 minutes and 26 hours and 15 minutes, respectively.
Methods
Field methods involved stage measurement, automated and grab sampling, sample processing for automated sampler samples and grab samples, and quality control and assurance procedures. Laboratory methods involved analysis for E. coli, nutrients, TDS, suspended sediment concentration (SSC), and TSS. Data were analyzed using multiple statistical tests. Field and solution blanks were analyzed in the quality control sample assessment. Water-quality, stage, and precipitation data for sampled sites are publicly available from the USGS National Water Information System (USGS, 2022b) using the site identification numbers in table 1.
Field Procedures
Six events per year were sampled during the monsoon season from June 2020 through September 2022, using autosamplers located at the East, Center, and West sites of McEwen pond (fig. 3, table 1). The East and West sites were located at the corresponding inflow to the pond. The Center site was centrally located in the pond, and two samples were collected from that location. The initial sample was collected by the autosampler when flow entered the pond and reached a designated stage. A final sample was collected as a grab sample near the Center site, either at the outflow grate or near the edge of the concrete apron at the outflow area.
Stage
The stage height gage (Center site, fig. 3, table 1) is centrally located and at a topographic low within the study area. The gage began recording stage on June 3, 2020. The water level was measured using a bubble gage, following methods described in Sauer and Turnipseed (2010). A nonrecording staff gage served as a reference to verify the bubble gage readings. A crest-stage gage was also installed to provide verification of peak stage for the site.
Automated Sampler Sample Collection
Autosamplers (Teledyne ISCO Model 6712) were installed and housed in an enclosure in secure, level positions. The Center and East site autosamplers were installed in 2019, and the West site autosampler was installed in late 2020, between the sampling seasons for 2020 and 2021. The East and West site autosamplers were programmed to be triggered by liquid-level actuators at the start of a rainfall event. Each actuator was located at the base of the inflow, which is a culvert pipe. The Center site autosampler was programmed to be triggered by pond water levels using an actuator located at an arbitrary stage of approximately 0.90 foot (ft), which was just above the minimum stage required for flow to exit the pond. The stages mentioned henceforth are relative to the local arbitrary datum at the site.
Each autosampler holds 24 1-liter (L) polyethylene bottles. Prior to each deployment, the polyethylene bottles were cleaned with Liquinox detergent and thoroughly rinsed with tap water, followed by deionized water. One polyethylene bottle in each set was sterilized using an autoclave to collect and hold E. coli samples.
Upon the onset of runoff at the East and West inflow sites, the autosamplers were programmed to sample all 24 bottles consecutively without any pause. This was done because of the flashy nature of monsoonal storms, which typically are small cells moving rapidly through the area (Veenhuis, 2003). Only bottles 1–4 were collected for processing unless there was a suspected error in collecting those bottles, such as low automated sampler sample pump counts; in that case, bottles 5–8 were used. All remaining bottles were emptied. The autosampler was then refilled with clean bottles in spaces 1–8, including two autoclaved bottles for E. coli sampling.
For the Center site, bottles 1–4 were collected consecutively upon exceedance of the sample threshold. This was followed by a delay of 30 minutes before resuming collection of the next four bottles. The first sample set was used for sample processing and the second set was used as a backup in case of unforeseen problems, such as line clogging or inadequate sample volume.
Grab Sample Collection
At the end of each event, discrete samples, known as grab samples, were collected near the outflow grate, which is directly south of the Center site. Depending on the timing and intensity of the storm event, the location of the grab sampling near the outflow grate sometimes varied. If the water level had not receded enough so that obtaining a grab sample near the outflow grate was possible, the grab sample was collected, using autosampler bottles, near the staff gage in a grassy area directly north of the concrete apron leading to the outflow grate. The concrete apron is set at a stage of approximately 0.82 ft. These grab samples were taken using a clean set of four 1–L polyethylene bottles, with one of the bottles being autoclaved for E.coli sample collection.
There were cases in which the East or West autosamplers did not get triggered during a storm event because of stormflow flashiness (where water would quickly flow in and trigger the autosampler, but not enough water came through to be collected), autosampler malfunction, or vandalism. In these cases, grab samples were collected near the inflow in place of the autosampler collection. Because of the difficulty in obtaining a grab sample on the East site, grab samples were collected approximately 100 ft west of the inflow in a grassy area (fig. 3). In addition, because of safety issues and rain event timing, grab samples may have been collected several hours after the storm peak at both the East and West sites.
Sample Processing for Automated Sampler Samples and Grab Samples
The sample processing procedures were modified from the USGS National Field Manual (USGS, variously dated). Samples were processed at the USGS laboratory in Albuquerque, New Mexico. Autosampler bottles were used for several purposes, including one bottle each for the following: (1) raw and filtered subsampling, (2) suspended sediment analysis, (3) E. coli analysis (autoclaved bottle), and (4) physical parameter analysis.
Raw water from the first bottle was used to determine concentrations of TSS and total nutrients. The bottle was first inverted 10 times to get a well-mixed sample. Raw water was poured into prepared sample bottle containers for the particulate fractions then preserved with sulfuric acid. Raw water was passed through a 0.45-micrometer-pore-size capsule filter to determine concentrations of TDS and dissolved nutrients. The capsule filter was preconditioned using deionized water inside a sample processing chamber, which prevents atmospheric contamination of the sample.
A second autosampler bottle was sent to the USGS Sediment Laboratory in Albuquerque, N. Mex., for suspended sediment analysis. A third bottle was used to measure physical parameters, including pH, specific conductance, dissolved oxygen, and turbidity using a multiparameter sonde. Physical parameters were recorded using an In Situ Aqua TROLL 600 (In Situ, Inc., Fort Collins, Colorado) at the USGS laboratory in Albuquerque, N. Mex. This is in contrast to the usual practice of measuring concentrations of physical parameters at the field site, because these samples were collected using autosampler bottles, often a few hours before analysis. The final autoclaved autosampler bottle was used to determine concentration of E. coli.
Quality Control and Assurance Sample Collection
Quality control and assurance samples were collected to ensure that field collection methods or equipment did not introduce contamination into the sampling process. These samples were also used to determine the variability in the sample collection process and laboratory methods.
Field blanks were collected using the autosamplers and tubing in place in the field. The autosampler’s polyester-braid polyvinyl-chloride tubing was rinsed with deionized water during the initial purge/withdraw cycle so as not to contaminate the inorganic blank water. Once purged, the autosamplers were manually triggered to withdraw inorganic blank water as part of the normal sample-collection process. An exception to this was the field blank for E. coli, for which the autoclaved bottle inside the autosampler was manually filled with sterile deionized water, because the inorganic blank water used for other blanks was not sterile. The autosampler bottles were then capped, chilled, and processed in the USGS laboratory in Albuquerque, New Mexico. Field blanks were collected from 2020 through 2022 for a total of five field blanks. Source solution blanks, for which inorganic blank water was poured directly into the final sample bottles at the USGS laboratory in Albuquerque, N. Mex., were also collected in conjunction with the field blanks to evaluate the inorganic blank water.
Sequential replicates were used to assess the variability of samples collected in the field and the variability in laboratory analysis. However, given the way the autosamplers were programmed to collect samples, replicates were not collected using the autosampler. Replicate samples were only collected in conjunction with grab samples at the West and Center sites. Three replicates were collected throughout the project.
Additionally, quality control samples were analyzed to assess the bacterial analysis process at the USGS laboratory in Albuquerque, N. Mex., each time E. coli was analyzed. Sterilized, deionized water was used for processing and analyzing E. coli, and a blank was processed using sterilized, deionized water for each sample set.
Analytical Procedures
Samples were analyzed for E. coli, TSS, SSC, TDS, total and dissolved nutrients, and physical parameters, which included pH, specific conductance, dissolved oxygen, and turbidity. Nutrient analysis include the following: ammonia (NH3 + NH4+; dissolved and total), ammonia plus organic nitrogen (dissolved and total), dissolved nitrite and nitrate plus nitrite, total nitrogen (dissolved and total), total phosphorus, and dissolved orthophosphate.
Escherichia coli
Bacteria samples were analyzed by following the USGS protocols described in Myers and others (2014). USGS staff analyzed water samples for E. coli using the Colilert method (Standard Methods Committee of the American Public Health Association, American Water Works Association, and Water Environment Federation, 2022; USGS, variously dated). The samples were chilled and analyzed within 24 hours of sample collection. The bottle was gently shaken before pouring 100 (milliliters) mL of sample into a sterile graduated cylinder. From the cylinder, the sample was immediately poured into a sterilized 100-mL bottle followed by a reagent packet. The bottle was then gently shaken to prevent foaming and bubbles. Once the reagent was dissolved, the sample was poured into a Quanti-Tray and sealed with an IDEXX Quanti-Tray Sealer PLUS (IDEXX Laboratories, Inc., Westbrook, Maine). After sealing, the Quanti-Tray with the sample was then incubated at 35 degrees Celsius (°C) for 24–28 hours. After the incubation period, the E. coli density was calculated by counting the number of small and large wells that fluoresced on the Quanti-Tray under a long-wave ultraviolent light at 365 nanometers. The Colilert method reported results as most probable number per 100 milliliters (MPN/100 mL), which has been evaluated to have a 1:1 relationship to results reported in colony forming units per 100 milliliters (cfu/100 mL; Noble and others, 2004).
For each bacteria sample, 1:10 and 1:100 dilutions were also prepared because of potentially high E. coli density. For each dilution, processing of the bacteria samples followed the same format previously stated, except that sterile deionized water was used to dilute the sample. For each 1:10 dilution, 90 mL of sterile deionized water and 10 mL of the bacteria sample were placed in a sterilized 100-mL bottle, followed by a reagent packet. For each 1:100 dilution, 99 mL of sterile deionized water and 1 mL of bacterial sample were used.
Nutrients
Total nitrogen in environmental water occurs as ammonia (NH3 + NH4+), nitrate (NO3-), nitrite (NO2-), dissolved organic nitrogen, and particulate nitrogen. Several nutrient analytical methods were utilized by the USGS National Water Quality Laboratory in Denver, Colorado. All concentrations were reported in milligrams per liter. Total nitrogen concentrations were calculated by summing nitrite and nitrate, ammonia, and organic nitrogen concentrations and were analyzed by using the alkaline persulfate digestion method for both dissolved (filtered) and total (unfiltered) samples (Patton and Kryskalla, 2003). Ammonia was analyzed in both dissolved and total samples (EPA, 1993). Ammonia plus organic nitrogen, also known as TKN, was analyzed in both dissolved and total samples using the Kjeldahl digestion method (Patton and Truitt, 2000). Phosphorus was dissolved and analyzed using the Kjeldahl digestion method with an automated colorimetric finish (Patton and Truitt, 1992). Dissolved orthophosphate was analyzed as phosphorus (Fishman, 1993). Colorimetric methods were used to analytically determine dissolved nitrate plus nitrite as nitrogen (Patton and Kryskalla, 2011).
TDS, SSC, and TSS
TDS were analyzed at the USGS National Water Quality Laboratory and reported in milligrams per liter dried at 180 °C (Fishman and Friedman, 1989). SSC and TSS are used as a regulatory metric to quantify concentrations of suspended solid-phase material in stormwater. SSC is a measure of the dry weight sediments from a whole volume of a water-sediment mixture, whereas TSS is a measure of the dry weight of sediments from a known volume of a subsample of the original water-sediment mixture. SSC and TSS are reported in milligrams per liter. TSS was analyzed by RTI Laboratories in Livonia, Michigan, using the American Public Health Association Standard Method 2540D (American Public Health Association, American Water Works Association, and Water Environment Federation, 2015).
SSC was analyzed by the USGS Sediment Laboratory in Albuquerque, N. Mex., which followed the quality-assurance plan for the analysis of fluvial sediment (Stiles, 2006). The samples were analyzed using either the filtration method or the evaporation method, as described in American Society for Testing and Materials D3977–97 (American Society for Testing and Materials, 2019). The method used depended on the amount of sand or clay in the sample. If the evaporation method was used, the samples were washed into an evaporation dish, dried, and weighed. If the specific conductance was greater than 1,000 microsiemens per centimeter at 25 degrees Celsius (µS/cm at 25 °C) and the sample could not be filtered easily, the sample was processed for dissolved solids and then evaporated as usual. If the filtration method was used, the sample was poured into a crucible, vacuum pressured, and forced through a filter. The crucible was then dried, cooled, and weighed. Samples were also analyzed to determine the percentage of sediment that was less than 0.0625 millimeter in diameter. If these samples had a small amount of sediment (less than 0.5 gram of fine-grained sediment), they were filtered, otherwise they were evaporated, correcting for dissolved solids. The sample was wet sieved through a filter that retains the fines, and the remaining sand was rinsed into a separate filter or evaporating dish. If the sample contained greater than 0.5 gram of fine sediment, then the sample was wet sieved directly into evaporating dishes, correcting for dissolved solids if the specific conductance was above 1,000 μS/cm.
Data Analysis
Statistical analyses were done within the R statistical computing environment (R Core Team, 2022). Because a small percentage of data (19 percent of dissolved ammonia and 11 percent of nitrate plus nitrite) was censored below the laboratory reporting level, censored values were replaced with half of the reporting level for analysis. To evaluate correlations, Kendall’s tau was calculated using the base R function “cor.test” because of the small dataset and the non-normal distribution of the data. Strong linear correlations typically correspond to tau values of about 0.7 or above (Helsel and others, 2020). The Kruskal-Wallis test, base R function “kruskal.test,” was used to evaluate differences in medians among the sites or time periods within groups. If a probability value (p-value) was less than (<) 0.05, the differences were considered to be significant. If a significant difference was found, Dunn’s nonparametric comparison test for Kruskal-type ranked data was used with the Benjamini-Hochberg correction method to determine which sites or years differed significantly from each other. The test was performed by using the R package “PMCMRplus” and its “kwAllPairsDunnTest” function (Pohlert, 2021).
Quality Control Sample Assessment
Five field blanks collected using the autosampler, and two source solution blanks were evaluated. The field blanks each had varying detections (table 2) and the source solution blanks had no detections. TSS, suspended sediment, ammonia plus organic nitrogen (dissolved and total), total phosphorus, orthophosphate, and total nitrogen (dissolved and total) were all detected in at least one field blank. The highest concentrations found in the blanks were multiplied by 5 to determine a threshold of influence for detected concentrations (EPA, 1989, p. 5–16 to 5–17). Environmental data were then reviewed to determine the percentage of samples that fell below that threshold. Only two analytes exceeded the threshold concentration in greater than 25 percent of the environmental samples. TSS concentrations were below the threshold of 85 milligrams per liter (mg/L) in 30 percent of the samples. Orthophosphate concentrations were below the threshold of 0.2567 mg/L in 66 percent of the samples.
Table 2.
Blank sample data for major ions and trace elements in groundwater samples.[<, less than; mg/L, milligram per liter]
Because the sampling tubing connected to the autosampler could not be replaced or cleaned before sample collection, it was expected that there would be detections in the field blanks. Some field blanks were clean and did not have detections for some analytes. The only analyte that was consistently detected in the field blanks was total nitrogen (filtered); therefore, the analytical results are not censored in the data analysis documented in this report. It should be noted, however, that there was potential influence on the concentrations by field equipment that could not be decontaminated and cleaned regularly.
Three replicate pairs were collected (table 3) using grab sampling techniques. Because there were few replicate pairs, relative percent difference (RPD) was used to evaluate them (Mueller and others, 2015). RPD is calculated using the following equation:
Table 3.
Replicate pairs with detections and associated variability in groundwater samples.The RPDs for replicate pairs where the RPD was greater than 20 percent are shown in table 3 and range from 23.2 to 127 percent. Because replicates were collected only by using the grab sample method, the replicate variability may not be representative of the autosampler sampling method. The replicate samples highlight the variability in the grab sampling method, whereby two separate bottles were collected from either nonflowing water ponded near the West site or water flowing out of the pond near the Center site.
Stage, Precipitation, and Water Retention
No correlations were found between total rainfall and (1) peak water levels in the pond or (2) how long the water level remained elevated at the site after runoff ceased. From June 3, 2020, through September 30, 2022, 34 events resulted in elevated stage at McEwen pond (fig. 7, table 4). Peak stage ranged from 0.73 to 2.40 ft, with a corresponding range in precipitation depth of 0.06 and 0.85 in., respectively. A stormwater pump station located at the outflow of McEwen pond allows Bernalillo County to control the outflow of water from the pond. Therefore, the length of time water was retained in the pond was controlled by this pump station and was variable. Stage remained elevated for a median of 3 days, ranging from a minimum of 2 days to a maximum of 6 days.
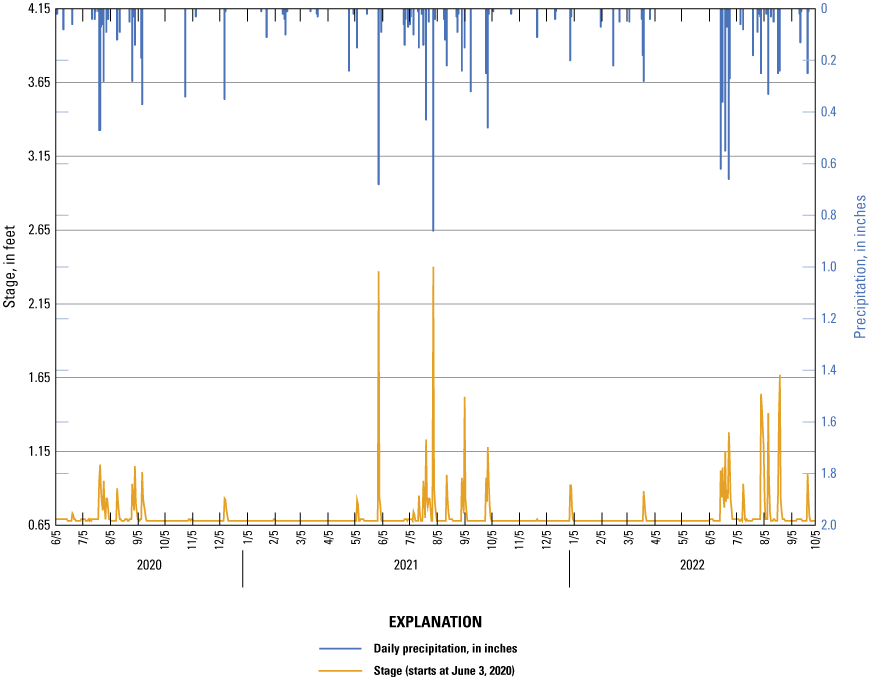
Precipitation and stage during the study period from June 3, 2020, to September 22, 2022.
Table 4.
A summary of peak stage and precipitation during storm events at McEwen pond.[Dates shown as month, day, year]
Evaluation of Spatial and Temporal Differences in Stormwater Quality
Physical parameters, suspended sediment and solids, bacteria, and nutrients were summarized by location and year (tables 5 and 6). Several parameters, including dissolved oxygen; dissolved solids; E. coli; nitrate, filtered, as nitrogen; nitrate plus nitrite; and pH were compared with the New Mexico Water Quality Standard (NMWQS; table 7) 20.6.4.105 New Mexico Administrative Code (New Mexico Water Quality Control Commission, 2010). The NMWQS designates the Rio Grande in the study area for the following uses: irrigation, marginal warm-water aquatic life, livestock watering, public water supply, wildlife habitat, and primary contact. The last item is defined as water use “in which there is prolonged human contact” for recreational or ceremonial purposes, and the marginal warm-water standard is defined as temperature that may routinely exceed 32.2 °C.
Table 5.
Numerical summaries of parameters grouped by location.Table 6.
Numerical summaries of parameters grouped by year.[Water-quality data from the U.S. Geological Survey (USGS) National Water Information System (USGS, 2022b). µS/cm at 25 °C, microsiemens per centimeter at 25 degrees Celsius; mg/L, milligram per liter; FNU, formazin nephelometric unit; MPN/100mL, most probable number per 100 milliliters; <, less than]
Table 7.
New Mexico Water Quality Standards criteria for physical and chemical constituents pertinent to stormwater.An evaluation of antecedent dry days provided no evidence that concentrations of any measured parameter were higher at the onset of early monsoonal storms compared to those measured later during the season. Additionally, outliers were evaluated to determine if they were part of one event or had other similar characteristics, but no patterns were observed. Parameters were also evaluated to determine if there were statistically significant differences among sites (including the Center site initial and final samples) and among years. If significant differences were identified by the Kruskal-Wallis test (p < 0.05), then Dunn’s nonparametric comparison test results were included in tables 8 and 9.
Table 8.
Probability values (p-values) from the Dunn’s nonparametric comparison test for Kruskal-type ranked data grouped by location at McEwen pond using the Benjamini-Hochberg correction method.[Significant p-values less than 0.05 are in bold]
Table 9.
Probability values (p-values) from the Dunn’s nonparametric comparison test for Kruskal-type ranked data grouped by year using the Benjamini-Hochberg correction method.[Significant p-values less than 0.05 are in bold]
Physical Parameters
The pH of water plays an important role in the chemical processes of natural water, and the pH of water can play a major role in water chemistry and toxicity (EPA, 2023c). Metals are more soluble at lower pH, and nitrogen use by aquatic life can be determined by pH (Wetzel, 2001; EPA, 2023c). The pH ranged from 6.1 to 8.8 standard units at McEwen pond, with the highest pH being at the East site. The NMWQS for pH in the Rio Grande is 6.6–9.0 standard units (New Mexico Water Quality Control Commission, 2010). One sampling event, on July 20, 2021, yielded samples with pH below the NMWQS at all three sampling locations. No significant differences in pH were observed among sites, but there was a significant decrease in pH in 2022 as compared to 2020 and 2021 (table 9).
Specific conductance is the ability of a substance to conduct an electrical current (Hem, 1985) and is related to the concentration of dissolved solids in water. The median specific conductance from all sites ranged from 131 to 164 µS/cm, and the maximum specific conductance was 455 µS/cm at the West site. No significant differences were observed between sites or years.
Dissolved oxygen is an indicator of overall biological health (EPA, 2023c). Concentrations at the sites ranged from 1.2 mg/L (East site) to 8.6 mg/L (Center site), and the median concentrations ranged from 4.8 to 6.2 mg/L. The dissolved oxygen NMWQS is derived from marginal warm-water criteria for surface waters in New Mexico. The minimum dissolved oxygen concentration required in New Mexico surface water is 5.0 mg/L for early life stages and 3.0 mg/L for other life stages (New Mexico Water Quality Control Commission, 2010); life stages refer to aquatic life in surface waters. Two samples had dissolved oxygen concentrations below the NMWQS lower limit of 3.0 mg/L, namely the Center site final sample and the East site sample collected on August 2, 2022, which were 2.8 and 1.2 mg/L, respectively.
Suspended Sediment and Solids
Suspended sediment is known to affect water clarity, and many contaminants including nutrients and bacteria are known to adsorb to, and are transported by, suspended sediment (Drever, 1997). A potential source of suspended sediment includes surface runoff, which is the primary contributor to McEwen pond. SSC and TSS are used to quantify concentrations of suspended solid-phase material in surface water (Gray and others, 2000). The two analytical methods were compared extensively in over 3,000 samples by Gray and others (2000), who found bias in the relation between SSC and TSS, where SSC values increased at a greater rate than TSS values. They found that SSC produced more reliable results for concentrations of suspended solid-phase material in natural water. The two values are not comparable and should not be used interchangeably. Both analytical method results are described herein because of the NPDES reporting requirement of TSS rather than SSC.
Median SSC ranged from 103 to 418 mg/L, and the greatest SSC concentration, 18,700 mg/L, was found at the East site (table 5). The median percentage of silt (suspended sediment smaller than 0.0625 millimeter) ranged from 79 to 98 percent, with the highest median values at both the Center initial and final samples (table 5). Median TSS ranged from 77 to 270 mg/L, and the highest concentration, 3,900 mg/L, was found at the East site (table 5). SSC and TSS were each evaluated to determine if there were significant differences among sites, and p-values were all greater than (>) 0.05, ranging from 0.14 to 0.80. Therefore, there were no significant differences in SSC or TSS between sites. Significant differences were found in the percentage of silt at the Center initial and final samples when compared to the East and West sites (table 8). This indicates that larger particles are entering the pond and settling out before leaving the pond. Significant differences in SSC were observed among years (table 9), with concentrations increasing in 2021 but then decreasing in 2022. TSS had a similar pattern, but the only significant difference was found between 2021 and the previous year (2020) and following year (2022) (table 9).
SSC was evaluated to see if there were any correlations with other measured parameters. Results of the Kendall tau test suggest weak correlation for all parameters (τ < 0.7) except for TSS, which had a strong correlation with SSC (τ = 0.81). The next strongest correlation observed was with turbidity (τ = 0.51).
TDS are often used to evaluate water quality and often occur naturally in streams because of rock weathering. Wastewater effluent and urban runoff can increase TDS (Hem, 1985). Median concentrations for all sites ranged from 119 to 147 mg/L, with a maximum concentration of 600 mg/L observed at the West site, which is below the NMWQS for TDS of 1,500 mg/L (New Mexico Water Quality Control Commission, 2010). No significant differences were found between sites or years.
Bacteria
Fecal indicator bacteria, such as E. coli, are used to determine the presence of potential pathogens, which could be present in stormwater runoff and may cause illness. Median E. coli concentrations ranged from 915 to 3,600 MPN/100 mL, with the highest concentration measured at the West site. There were no significant differences found between sample locations, (p > 0.05); however, E. coli was found to be statistically greater in 2022 compared to other study years (table 9).
The fecal-coliform bacteria water-quality standard is based on an E. coli concentration of 410 cfu/100 mL for primary contact (New Mexico Water Quality Control Commission, 2010). E. coli concentrations measured at McEwen pond exceeded the standard in 52 of 69 samples collected over the study period. Median concentrations ranged from 915 to 3,600 MPN/100 mL, with a maximum concentration of 240,000 MPN/100 mL. There is also a separate water-quality standard for Isleta Pueblo (fig. 1), which is 88 cfu/100 mL for a single sample (EPA, 2023e). The McEwen pond E. coli concentrations are reported in MPN/100 mL, which has been evaluated to have a 1:1 relationship to results reported in colony forming units per 100 milliliters (Noble and others, 2004). Fifty-eight of 69 samples collected over the study period exceeded the Isleta Pueblo standard.
Nutrients
Nutrients are essential to aquatic life, but excessive concentrations of nutrients can have harmful effects on stream water quality. Sources of nutrient input can include agricultural runoff, stormwater, and wastewater. Nitrogen occurs in water as nitrite/nitrate, ammonia/ammonium, and organic nitrogen (Hem, 1985). Median dissolved total nitrogen concentrations ranged from 1.89 to 2.65 mg/L, compared to 2.28 to 4.43 mg/L for total nitrogen (table 5). Median concentrations ranged from 0.17 to 0.40 mg/L for dissolved ammonia and from 0.32 to 0.77 mg/L for total ammonia (table 5). Median concentrations for dissolved nitrite ranged from 0.035 to 0.072 mg/L. Dissolved nitrate concentrations ranged from 0.519 to 0.769 mg/L, with a maximum concentration of 5.95 mg/L, a value below the EPA drinking-water standard of 10 mg/L (EPA, 2023d).
The NMWQS for livestock watering, which is defined as the use of a surface water for consumption by livestock, allows for higher concentrations of nitrates plus nitrite of up to 132 mg/L (New Mexico Water Quality Control Commission, 2010). All samples collected during 2020–22 at McEwen pond were below this standard, which ranged from <0.04 to 6.02 mg/L (table 5). Median concentrations of dissolved organic nitrogen ranged from 1.1 to 1.7 mg/L, and total organic nitrogen ranged from 1.6 to 3.4 mg/L. Median concentrations for both dissolved Kjeldahl nitrogen and TKN ranged from 1.3 to 1.9 and from 2.1 to 4.0 mg/L, respectively.
Sources of phosphorus in the environment can include fertilizers, animal waste, sewage and wastewater effluent, soil erosion, and urban runoff (Hem, 1985). Median concentrations of dissolved orthophosphate ranged from 0.158 to 0.364 mg/L, with a maximum concentration of 0.999 mg/L (table 5). Total phosphorus concentrations ranged from 0.44 to 1.20 mg/L.
Some spatial and temporal differences in nutrient concentrations were observed. The outflow, or final, samples collected at the Center site had dissolved ammonia and total nitrogen concentrations significantly lower than those for samples collected at the East and West sites (table 8). Orthophosphate concentration differed significantly between the West site and other sampling locations (table 8). Several nutrient concentrations were significantly different in 2022 compared to the previous 2 years (table 9). Dissolved total nitrogen, ammonia, nitrate plus nitrite, nitrate, and organic nitrogen concentrations were all significantly lower in 2022 than in preceding years. Total ammonia, which was unfiltered, was also significantly lower in 2022.
Site Restoration and Potential Effects on Stormwater Quality
Despite restoration of the study site being in progress, coupled with the variability and uncertainty associated with small datasets, some of the observations in measured data indicate the site has benefited from restoration progress thus far. Fewer significant differences were observed between sites than between years (tables 8 and 9). However, there were significant decreases in concentrations of total nitrogen, total organic nitrogen, total phosphorus, and dissolved ammonia measured at the Center site (final sample) compared to the East and West sites. An overall increase in the percentage of silt was observed at the Center site in both the initial and final samples, as compared to the East and West sites, which indicates that larger particles are settling into the pond as the water travels from the east and west inflows toward the outlet near the center of the pond.
There were significant differences found in multiple analytes when comparing 2022 to the previous years (table 9). SSC and pH decreased significantly, as did concentrations of multiple nutrients, including dissolved ammonia, nitrate plus nitrite, nitrate, organic nitrogen, and total nitrogen. Of the particulate fractions, only total ammonia had a significant decrease in 2022 relative to prior years. The significance of these decreases could indicate nutrient uptake by plants that have grown within the study area over time (Clary and others, 2020).
Restoration at McEwen pond is ongoing (2022). A comparative assessment when vegetation is more established and the restoration efforts are complete could give a more complete picture of the effects of restoration at McEwen pond. Comparison of water quality over the period 2020–22 indicates that sediments and nutrients may continue to be reduced by the restoration efforts at the site.
Summary
Bernalillo County collaborated with the U.S. Fish and Wildlife Service, whose jurisdiction includes Valle de Oro National Wildlife Refuge, on several Prescribed Endemic Refuge Connected Habitat Areas to develop habitat areas on Bernalillo County properties within Bernalillo County owned and maintained drainage facilities. One of the Prescribed Endemic Refuge Connected Habitat Areas is the McEwen storm drainage pond, where the development included establishing swales and channelization to route urban stormwater runoff through a wetland area to help filter the stormwater runoff. In 2020, the U.S. Geological Survey began targeted monitoring after storm events at three locations at the site to evaluate the water quality of stormwater entering and leaving the study area. Monitoring prior to 2020 was done by means of grab samples collected at the center of the site and often not directly after rain events.
Stage and precipitation were evaluated to observe relations between the amount of rainfall and the water level in McEwen pond, as well as how long the stage remained elevated at the site after runoff cessation. Peak stage ranged from 0.73 to 2.4 feet above a local arbitrary datum at the site, with a corresponding cumulative precipitation total of 0.06 and 0.85 inch, respectively. Stage was elevated for a median period of 3 days and ranged in duration from 2 to 6 days. The time to reach peak stage at McEwen storm drainage pond from the first precipitation detected at Westside Community Center precipitation gage ranged from 45 minutes to 10 hours and 45 minutes. Both precipitation and stage were evaluated to determine if they correlated with each other, as well as with every analyte and physical parameter, and no significant correlations were found.
The following parameters were compared to New Mexico Water Quality Standards: dissolved oxygen, dissolved solids, Escherichia coli, nitrate as nitrogen, nitrate plus nitrite, and pH. Only one sampling event (July 20, 2021) at all locations yielded pH values below the standard, which ranges from 6.6 to 9.0 standard units. One sampling event, on August 2, 2022, at two locations yielded dissolved oxygen values below the standard of 3.0 milligrams per liter. No samples exceeded the total dissolved solids standard of 1,500 milligrams per liter. Escherichia coli concentrations exceeded the primary contact standard of 410 colony forming units per 100 milliliters in 52 of 69 samples. All of the nutrient samples were below the standards for nitrate as nitrogen and nitrate plus nitrite.
Concentrations of all parameters were also evaluated to determine if there were statistically significant differences (p less than 0.05) among sites (including the Center site initial and final samples) and among years. Fewer significant differences were observed among sites than among years. However, there were significant decreases in total nitrogen and dissolved ammonia in the Center final sample compared to samples from the East and West sites. An overall increase in the percentage of silt was observed at the Center site in both the initial and final samples, which indicates that larger particles are settling into the pond and may be filtered while water travels through the swale and plants.
Significant differences were observed in the annual data, especially in 2022 compared to the other 2 years. Concentrations of suspended sediment and several nutrients were significantly lower in 2022 relative to the preceding 2 years, which could indicate that nutrient uptake by plants is occurring as the plants continue to mature over time.
Although site restoration is ongoing, as is plant maturation and establishment, observations made over the duration of the monitoring campaign indicate that site restoration has resulted in changes to the study area through processes such as nutrient uptake and the filtering of larger sediment particles.
References Cited
American Public Health Association, American Water Works Association, and Water Environment Federation, 2015, Standard methods for the examination of water and wastewater: Standard Methods web page, accessed December 19, 2022, at https://www.standardmethods.org/doi/10.2105/SMWW.2882.030#_i23.
American Society for Testing and Materials, 2019, Standard test methods for determining sediment concentration in water samples—[ASTM D3977–97] (reapproved 2019): ASTM International Compass web page, accessed March 28, 2022, at https://compass.astm.org.
Bartolino, J.R., and Cole, J.C., 2002, Ground-water resources of the Middle Rio Grande Basin, New Mexico: U.S. Geological Survey Circular 1222, 132 p., accessed February 12, 2023, at https://doi.org/10.3133/cir1222.
Bernalillo County, 2023, Prescribed Endemic Refuge Connected Habitat Areas (PERCHAs): Bernallilo County web page, accessed March 28, 2023, at https://www.bernco.gov/community-services/blog/2021/04/06/prescribed-endemic-refuge-connected-habitat-areas-perchas/.
Clary, J., Jones, J., Leisenring, M., Hobson, P., and Strecker, E., 2020, International Stormwater BMP Database—2020 Summary statistics: Water Research Foundation, 118 p., accessed December 19, 2023, at https://www.waterrf.org/system/files/resource/2020-11/DRPT-4968_0.pdf.
Dewitz, J., and U.S. Geological Survey, 2021, National Land Cover Database (NLCD) 2019 products (ver. 2.0, June 2021): U.S. Geological Survey data release, accessed November, 8, 2021, at https://doi.org/10.5066/P9KZCM54.
First Choice Community Healthcare, 2016, Charrette Report: First Choice Community Healthcare web page, accessed November 5, 2019, at http://www.fcch.com/uploads/images/Charrette%20Report%20/Charrette%20Report.pdf.
Fishman, M.J., 1993, Methods of analysis by the U.S. Geological Survey National Water Quality Laboratory—Determination of inorganic and organic constituents in water and fluvial sediments: U.S. Geological Survey Open-File Report 93–125, 217 p., accessed January 24, 2023, at https://doi.org/10.3133/ofr93125.
Gray, J.R., Glysson, G.D., Turcios, L.M., and Schwarz, G.E., 2000, Comparability of suspended-sediment concentration and total suspended solids data: U.S. Geological Survey Water-Resources Investigations Report 2000–4191, 14 p., accessed November 7, 2022, at https://doi.org/10.3133/wri004191.
Helsel, D.R., Hirsch, R.M., Ryberg, K.R., Archfield, S.A., and Gilroy, E.J., 2020, Statistical methods in water resources: U.S. Geological Survey Techniques and Methods, book 4, chap. A3, 458 p., accessed February 25, 2022, at https://doi.org/10.3133/tm4A3. [Supersedes USGS Techniques of Water-Resources Investigations, book 4, chap. A3, ver. 1.1.]
Hem, J.D., 1985, Study and interpretation of the chemical characteristics of natural water (1st ed.): U.S. Geological Survey Water-Supply Paper 2254, 263 p., accessed March 9, 2023, at https://pubs.usgs.gov/wsp/wsp2254/.
Kelly, T., Romero, O., and Jimenez, M., 2006, Rainfall, runoff, and water-quality data for the urban storm-water program in the Albuquerque, New Mexico, metropolitan area, water year 2004: U.S. Geological Survey Open-File Report 2006–1105, accessed December 19, 2022, at https://pubs.usgs.gov/publication/ofr20061105.
Mueller, D.K., Schertz, T.L., Martin, J.D., and Sandstrom, M.W., 2015, Design, analysis, and interpretation of field quality-control data for water-sampling projects: U.S. Geological Survey Techniques and Methods, book 4, chap. C4, 54 p., accessed December 3, 2021, at https://doi.org/10.3133/tm4C4.
Myers, D.N., Stoeckel, D.M., Bushon, R.N., Francy, D.S., and Brady, A.M.G., 2014, Fecal indicator bacteria (ver. 2.1): U.S. Geological Survey Techniques of Water-Resources Investigations, book 9, chap. A7, sec. 7.1, accessed January 25, 2023, at https://pubs.usgs.gov/publication/twri09A7.1.
Noble, R.T., Leecaster, M.K., McGee, C.D., Weisberg, S.B., and Ritter, K., 2004, Comparison of bacterial indicator analysis methods in stormwater-affected coastal waters: Water Research, v. 38, no. 5, p. 1183–1188. [Also available at https://doi.org/10.1016/j.watres.2003.11.038.]
Patton, C.J., and Kryskalla, J.R., 2003, Methods of Analysis by the U.S. Geological Survey National Water Quality Laboratory—Evaluation of alkaline persulfate digestion as an alternative to Kjeldahl digestion for determination of total and dissolved nitrogen and phosphorus in water: U.S. Geological Survey Water-Resources Investigation Report, 44 p., accessed January 25, 2023, at https://doi.org/10.3133/wri034174.
Patton, C.J., and Kryskalla, J.R., 2011, Colorimetric determination of nitrate plus nitrite in water by enzymatic reduction, automated discrete analyzer methods: U.S. Geological Survey Techniques and Methods, book 5, chap. B8, 34 p., accessed January 25, 2023, at https://pubs.usgs.gov/tm/05b08/.
Patton, C.J., and Truitt, E.P., 1992, Methods of analysis by the U.S. Geological Survey National Water Quality Laboratory—Determination of total phosphorus by a Kjeldahl digestion method and an automated colorimetric finish that includes dialysis: U.S. Geological Survey Open-File Report 92–146, 11 p., accessed January 25, 2023, at https://doi.org/10.3133/ofr92146.
Patton, C.J., and Truitt, E.P., 2000, Methods of analysis by the U.S. Geological Survey National Water Quality Laboratory—Determination of ammonium plus organic nitrogen by a Kjeldahl digestion method and an automated photometric finish that includes digest cleanup by gas diffusion: U.S. Geological Survey Open-File Report 00–170, 31 p., accessed December 19, 2022, at https://doi.org/10.3133/ofr00170.
Pohlert, T., 2021, PMCMRplus—Calculate pairwise multiple comparisons of mean rank sums extended: Comprehensive R Archive Network software release, accessed February 2022, at https://cran.r-project.org/web/packages/PMCMRplus.
R Core Team, 2022, R—A language and environment for statistical computing: Vienna, Austria, R Foundation for Statistical Computing website, accessed February 2022, at https://www.R-project.org/.
Sauer, V.B., and Turnipseed, D.P., 2010, Stage measurement at gaging stations: U.S. Geological Survey Techniques and Methods: book 3, chap. A7, 45 p., accessed on January 24, 2023, at https://pubs.usgs.gov/publication/tm3A7.
Shephard, Z.M., Conn, K.E., Beisner, K.R., Jornigan, A.D., and Bryant, C.F., 2019, Characterization and load estimation of polychlorinated biphenyls (PCBs) from selected Rio Grande tributary stormwater channels in the Albuquerque urbanized area, New Mexico, 2017–18: U.S. Geological Survey Open-File Report 2019–1106, 48 p., accessed January 24, 2023, at https://doi.org/10.3133/ofr20191106.
Standard Methods Committee of the American Public Health Association, American Water Works Association, and Water Environment Federation, 2022, 9223 Enzyme substrate coliform test, in Lipps, W.C., Baxter, T.E., and Braun-Howland, E., eds., Standard methods for the examination of water and wastewater: Washington, D.C., APHA Press, 4 p., accessed December 28, 2022, at https://www.standardmethods.org/doi/10.2105/SMWW.2882.194.
Stiles, J., 2006, Quality-assurance plan for the analysis of fluvial sediment by the U.S. Geological Survey New Mexico Water Science Center Sediment Laboratory: U.S. Geological Survey Open-File Report 2006–1333, 23 p., accessed May 5, 2022, at https://pubs.usgs.gov/of/2006/1333/report.pdf.
Storms, E.F., Oelsner, G.P., Locke, E.A., Stevens, M.R., and Romero, O.C., 2015, Summary of urban stormwater quality in Albuquerque, New Mexico, 2003–12: U.S. Geological Survey Scientific Investigations Report 2015–5006, 48 p., accessed January 24, 2023, at http://dx.doi.org/10.3133/sir20155006.
Thorn, C.R., McAda, D.P., and Kernodle, J.M., 1993, Geohydrologic framework and hydrologic conditions in the Albuquerque Basin, central New Mexico: U.S. Geological Survey Water-Resources Investigations Report 93–4149, 106 p., accessed January 24, 2023, at https://doi.org/10.3133/ wri934149.
U.S. Environmental Protection Agency [EPA], 1989, Data evaluation, chap. 5 in Risk assessment guidance for Superfund—Volume I, human health evaluation manual (part A): Washington, D.C., Office of Emergency and Remedial Response, U.S. Environmental Protection Agency Report EPA/540/1–89/002, 30 p., accessed May 21, 2023, at https://www.epa.gov/risk/risk-assessment-guidance-superfund-rags-part.
U.S. Environmental Protection Agency [EPA], 1993, Method 350.1—Determination of ammonia nitrogen by semi-automated colorimetry (rev. 2.0): U.S. Environmental Protection Agency web page, accessed January 25, 2023, at https://www.epa.gov/esam/epa-method-3501-determination-ammonia-nitrogen-semi-automated-colorimetry.
U.S. Environmental Protection Agency [EPA], 2023a, NPDES Stormwater General Permit for MS4s in the Middle Rio Grande watershed in New Mexico: U.S. Environmental Protection Agency web page, accessed March 12, 2023, at https://www.epa.gov/npdes-permits/npdes-stormwater-general-permit-ms4s-middle-rio-grande-watershed-new-mexico.
U.S. Environmental Protection Agency [EPA], 2023b, Permit limits—Watershed-based permitting: U.S. Environmental Protection Agency web page, accessed March 12, 2023, at https://www.epa.gov/npdes/permit-limits-watershed-based-permitting.
U.S. Environmental Protection Agency [EPA], 2023c, Factsheets on water quality parameters: U.S. Environmental Protection Agency web page, accessed March 12, 2023, at https://www.epa.gov/awma/factsheets-water-quality-parameters.
U.S. Environmental Protection Agency [EPA], 2023d, National Primary Drinking Water Regulations: U.S. Environmental Protection Agency web page, accessed March 12, 2023, at https://www.epa.gov/ground-water-and-drinking-water/national-primary-drinking-water-regulations.
U.S. Environmental Protection Agency, [EPA], 2023e, Water quality standards regulations—Pueblo of Isleta: U.S. Environmental Protection Agency web page, accessed November 1, 2023, at https://www.epa.gov/wqs-tech/water-quality-standards-regulations-pueblo-isleta.
U.S. Fish and Wildlife Service [USFWS], 2019, Valle de Oro National Wildlife Refuge and Bernalillo County—Draft Environmental Assessment for the Prescribed Endemic Refuge Connected Habitat Areas project Bernalillo County, New Mexico: U.S. Fish and Wildlife Service report, 83 p., accessed December 19, 2022, at https://www.bernco.gov/community-services/wp-content/uploads/sites/57/2021/04/Environmental-Assessment-PERCHAs-Project-DRAFT.pdf.
U.S. Geological Survey [USGS], 2022a, Hydrologic unit maps: U.S. Geological Survey web page, accessed May 4, 2022, at https://water.usgs.gov/GIS/huc.html.
U.S. Geological Survey [USGS], 2022b, USGS water data for the Nation: U.S. Geological Survey National Water Information System database, accessed November 8, 2022, at https://doi.org/10.5066/F7P55KJN.
U.S. Geological Survey [USGS], [variously dated], National field manual for the collection of water-quality data: U.S. Geological Survey Techniques of Water-Resources Investigations, book 9, chaps. A1–A10, accessed December 6, 2021, at https://pubs.water.usgs.gov/twri9A.
Veenhuis, J.E., 2003, Municipal stormwater sampling program, metropolitan area, Albuquerque, New Mexico—Summary of sampling, 1992–2002: U.S. Geological Survey Fact Sheet 005–03, accessed February 6, 2023, at https://pubs.usgs.gov/fs/2003/0005/report.pdf.
Conversion Factors
Datums
Vertical coordinate information is referenced to the North American Vertical Datum of 1988 (NAVD 88).
Horizontal coordinate information is referenced to the North American Datum of 1983 (NAD 83).
Elevation, as used in this report, refers to distance above the vertical datum.
Stage, as used in this report, is the height of water surface above an arbitrary datum established at the gage (gage datum).
Supplemental Information
Specific conductance is given in microsiemens per centimeter at 25 degrees Celsius (µS/cm at 25 °C).
Concentrations of chemical constituents in water are given in milligrams per liter (mg/L).
Abbreviations
cfu
colony forming units
E. coli
Escherichia coli
EPA
U.S. Environmental Protection Agency
HUC
hydrologic unit code
MS4
Municipal Separate Storm Sewer System
NMWQS
New Mexico Water Quality Standard
NPDES
National Pollutant Discharge and Elimination System
PERCHAs
Prescribed Endemic Refuge Connected Habitat Areas
RPD
relative percent difference
SSC
suspended sediment concentration
TDS
total dissolved solids
TKN
total Kjeldahl nitrogen
TSS
total suspended solids
USGS
U.S. Geological Survey
For more information about this publication, contact
Director, New Mexico Water Science Center
U.S. Geological Survey
6700 Edith Blvd. NE
Albuquerque, NM 87113
For additional information, visit
https://www.usgs.gov/centers/nm-water
Publishing support provided by
Lafayette Publishing Service Center
Disclaimers
Any use of trade, firm, or product names is for descriptive purposes only and does not imply endorsement by the U.S. Government.
Although this information product, for the most part, is in the public domain, it also may contain copyrighted materials as noted in the text. Permission to reproduce copyrighted items must be secured from the copyright owner.
Suggested Citation
Travis, R.E., Van Zante, C.A., Montero, N.Y., and Miltenberger, K.E., 2024, A comparison of water quality and stormwater inflow and outflow during habitat restoration at the McEwen storm drainage pond, South Valley, Albuquerque, New Mexico, 2020–22: U.S. Geological Survey Scientific Investigations Report 2023–5144, 29 p., https://doi.org/10.3133/sir20235144.
ISSN: 2328-0328 (online)
Study Area
| Publication type | Report |
|---|---|
| Publication Subtype | USGS Numbered Series |
| Title | A comparison of water-quality and stormwater inflow and outflow during habitat restoration at the McEwen storm drainage pond, South Valley, Albuquerque, New Mexico, 2020–22 |
| Series title | Scientific Investigations Report |
| Series number | 2023-5144 |
| DOI | 10.3133/sir20235144 |
| Publication Date | March 15, 2024 |
| Year Published | 2023 |
| Language | English |
| Publisher | U.S. Geological Survey |
| Publisher location | Reston, VA |
| Contributing office(s) | New Mexico Water Science Center |
| Description | Report: viii, 29 p.; Data Release |
| Country | United States |
| State | New Mexico |
| City | Albuquerque |
| Online Only (Y/N) | Y |