

Comparison of Longitudinal Stream Temperature Profiles and Significant Thermal Features from Airborne Thermal Infrared and Float Surveys of the Skykomish, Snoqualmie, and Middle Fork Snoqualmie Rivers, King and Snohomish Counties, Washington, Summer 2020 and 2021
Links
- Document: Report (8 MB pdf) , HTML , XML
- Data Release: USGS Data Release - Water temperature mapping of the Skykomish, Snoqualmie, and Middle Fork Snoqualmie Rivers, Washington— Longitudinal stream temperature profiles, significant thermal features, and airborne thermal infrared and RGB imagery mosaics
- NGMDB Index Page: National Geologic Map Database Index Page (html)
- Download citation as: RIS | Dublin Core
Acknowledgments
The Washington Department of Ecology funded much of the work described in this report through an agreement under the Centennial Clean Water Program (WQC-2020-TulaTr-00164) with Tulalip Tribes, who contracted NV5 Geospatial, Inc. (formerly Quantum Spatial, Inc.), to conduct airborne thermal infrared and three-band red, green, blue surveys and produce the longitudinal stream temperature profiles and imagery mosaics. The Tulalip Tribes used these funds and in-kind contributions to enter a Joint Funding Agreement with the U.S. Geological Survey (USGS, 20YGJFA30081, with two amendments) to conduct float surveys, analyze and interpret data from the thermal infrared and float surveys, and produce a data release along with this report (Restivo and others, 2023).
The authors thank Kurt Nelson of the Tulalip Tribes’ Natural Resources Department, Aimee Fullerton of the National Oceanic and Atmospheric Administration, Matthew Baerwalde of the Snoqualmie Indian Tribe’s Environmental and Natural Resources Department, and Andrew Miller, formerly of King County’s Natural Resources Department, for their support of this study. The authors also thank USGS colleagues Catherine Seguin, Chaska Boucher, and Julia David, as well as Matt Pouley of the Tulalip Tribes, for their assistance in various aspects of float survey data collection and processing.
Abstract
Summer water temperatures in the Skykomish, Snoqualmie, and Middle Fork Snoqualmie Rivers in western Washington have in recent decades exceeded the water temperature criteria for aquatic life uses set by the Washington Department of Ecology. This temperature increase is of particular concern because these rivers provide critical habitat for several salmonid populations, including Endangered Species Act-listed Chinook salmon (Onchorhynchus tshawytscha), steelhead trout (O. mykiss), and bull trout (Salvelinus confluentus), thus helping sustain Endangered Species Act-listed Southern Resident orcas (Orcinus orca). To inform salmonid restoration efforts within these rivers, this study used high-resolution thermal infrared (TIR) and three-band red, green, blue imagery acquired from repeated airborne surveys conducted in August 2020 and 2021 to (1) quantify longitudinal stream temperature profiles (LTPs) and (2) identify and characterize significant thermal features (STFs), including cold-water anomalies that could represent thermal refuges and serve as salmonid habitat. In addition, drag-probe water temperature surveys (“float surveys”) were performed on the Skykomish and Middle Fork Snoqualmie Rivers during August–September 2020 and on a segment of the Middle Fork Snoqualmie River in August 2021. These float surveys were intended to evaluate this thermal profiling method in comparison to airborne TIR surveys, by employing a novel method of processing float survey data to adjust for diurnal heating.
The Middle Fork Snoqualmie River warmed about 7 degrees Celsius (°C) from upstream to downstream in the 2020 airborne TIR survey and 9 °C in the 2021 airborne TIR survey, and the Snoqualmie River warmed about 4 °C in both surveys. The water temperature of the Skykomish River cooled in the 2020 and 2021 surveys, primarily because of cold inflow from the Sultan River. The overall shapes of airborne TIR LTPs of the same river were similar in the 2020 and 2021 surveys, with increasing and decreasing gradients in temperature tending to be nearly parallel over the same reaches and abrupt changes in temperature typically identified at the same locations. A total of 854 STFs were identified in the 2020 TIR imagery, and 732 STFs were identified in the 2021 TIR imagery. Interannual persistence was detected in 36.4 to 61.3 percent of lateral groundwater, side channel, and small tributary STFs, depending on the river surveyed, and in 14.8 to 28.7 percent of hyporheic and diffuse groundwater STFs. Hyporheic flow was commonly detected at the downstream end of a riffle, but not often detected directly downstream from large woody debris. Shade from riparian vegetation did not reduce water temperatures but rather maintained the water temperature recorded just upstream from the shaded section.
The adjusted average water temperature profiles from the float surveys were comparable to the LTPs derived from the airborne TIR surveys, with differences in temperature gradient primarily because the surveys were performed under different streamflow, radiation, and shading conditions. Though float surveys were found to be a valuable means of obtaining thermal profiles comparable to profiles obtained by airborne TIR surveys, one key advantage of airborne TIR surveys is that they may be used to precisely locate STFs over long distances, during a short survey duration, and in areas inaccessible to most watercraft.
Introduction
High water temperatures are one of the greatest threats to the survival of Pacific salmon and trout (Onchorhynchus spp.). Above their thermal tolerances, they have decreased growth and reproductive success and increased vulnerability to diseases, parasites, and competition from nonnative species, among many other adverse effects (Beauchamp, 2009; Richter and Kolmes, 2005; Sullivan and others, 2000; McCullough, 1999, Fagerlund and others, 1995; Brett, 1956). These tolerances effectively constrain Pacific salmon and trout to a reduced total area of thermally suitable cold-water habitat within a stream network, though high water temperatures can act as a barrier that prevents migration. To overcome these limitations, Pacific salmon and trout can use patches of cold water, or “thermal refuges,” within the otherwise thermally intolerable stream network, which may be associated with tributaries, side channels, and discrete or diffuse groundwater discharge into the channel (Torgersen and others, 1999; Isaak and others, 2010, Isaak and others, 2017). Understanding stream temperature heterogeneity and the distribution and availability of thermal refuges is thus important to mitigating the effects of high water temperatures on Pacific salmon and trout, especially because declines in mountain snowpack attributed to the warming climate have caused decreased summer streamflow, which is more easily heated by solar radiation (Mote and others, 2018; Mantua and others, 2010; Isaak and others, 2017).
The temperature of water in a river changes because of heat exchange between the water and the surrounding environment, a process driven by incoming solar radiation, channel morphology, and hydrology (Edinger and others, 1974; Chapra, 2008). In forested rivers, water temperatures and their rates of change depend on the relative influence of groundwater inputs, as well as air temperature, river depth, and effective shade, which are influenced by riparian canopy structure, streamflow volume, river aspect and width, topography, and the sun’s ecliptic, or path, at a given time of year (Brown, 1983; Adams and Sullivan, 1989; Sullivan and Adams, 1991).
Though water temperatures in a river typically increase gradually in the downstream direction, there may exist areas of thermal anomalies because of heating or cooling from point or diffuse sources. For example, hyporheic and discrete groundwater inflows provide relatively colder water to the main channel in the summer and relatively warmer water in the winter. Other thermal anomalies may result from side channels or tributaries, industrial effluents, stormwater discharges, geothermal activity, or significant changes in effective shade. Thermal anomalies are of particular interest to salmonid restoration efforts because of their potentially significant role in heating or cooling a river, as well as their potential to be a thermal refuge and serve as salmonid habitat.
The Skykomish, Snoqualmie, and Middle Fork Snoqualmie River Basins have historically provided critical spawning, rearing, and core habitat for several salmonid species. These salmonid species include natural populations of Chinook salmon (O. tshawytscha), steelhead trout (O. mykiss), and bull trout (Salvelinus confluentus)—listed as “Threatened” under the Endangered Species Act—as well as coho salmon (O. kisutch)—listed as a ”Species of concern”—pink salmon (O. gorbuscha), chum salmon (O. keta), and native char (S. malma) (Solomon and Boles, 2002; Stohr and others, 2011; Svrjcek and others, 2013; Snohomish County Surface Water Management and the Sustainable Lands Survey Executive Committee [SWM], 2017; U.S. Fish and Wildlife Service, 2022). Because of the thermal constraints on salmonids and other aquatic species, the Washington Department of Ecology maintains temperature criteria for waters designated for aquatic life uses. These standards range between 12 degrees Celsius (°C) and 17.5 °C, referring to the highest permissible 7-day average of the daily maximum temperatures (7-DADMax), and vary depending on the habitat classification and time of year (Washington Department of Ecology, 2020). Over the past two decades, however, summer 7-DADMax water temperatures within the Skykomish, Snoqualmie, and Middle Fork Snoqualmie Rivers have frequently exceeded these temperature criteria, as well as the 23 °C threshold above which temperatures can be lethal to salmonids (Stohr and others, 2011; Svrjcek and others, 2013; Kubo and leDoux, 2016). The average abundance of spawning Chinook salmon from 2017 to 2021 in the Snoqualmie and Skykomish River Basins was less than 4 percent of the low-productivity target abundance (Washington Department of Fish and Wildlife, 2023). High water temperatures in the Skykomish and Snoqualmie Rivers have also affected the survival of Endangered Species Act-listed Southern Resident orcas (Southern Residents; Orcinus orca). The Skykomish and Snoqualmie Rivers combine in Monroe, Washington, to form the Snohomish River, the second largest producer of Chinook salmon in Puget Sound (Svrjcek and others, 2013; Kaje, 2009). Washington Executive Order 18-02 (Inslee, 2018) recognizes that “the health of Southern Residents and Chinook salmon are tightly linked,” and that “reduced Chinook salmon runs undermine the potential for the Southern Resident population to successfully reproduce and recover.”
During the summer of 2015, the Snoqualmie River had record low streamflows and high air temperatures. That summer, water temperatures in the Middle Fork Snoqualmie River, which accounts for about half of the summer streamflow in the main-stem Snoqualmie River, were consistently close to the maximum recorded water temperatures of the main-stem Snoqualmie River. Conversely, water temperatures in the North Fork Snoqualmie and South Fork Snoqualmie Rivers were consistently below water temperatures in the main-stem Snoqualmie River (Kubo and leDoux, 2016; Stohr and others, 2011). This difference suggested that high water temperatures in the Middle Fork Snoqualmie River were a key driver of high water temperatures in the main-stem Snoqualmie River and thus merited further investigation. The Snoqualmie Science Coordination and Advisory Team, a group representing Tribal, County, State, and Federal entities studying water temperature in the Snoqualmie and Skykomish River Basins, identified the following information was needed to guide decision making on measures to mitigate high water temperatures:
-
• Fine-scaled longitudinal stream temperature profiles (LTPs) of each river taken when water temperatures were likely to be their highest of the year.
-
• The location, classification, temperature, and interannual persistence of significant thermal features (STFs). STFs were defined as external sources of relatively colder or warmer water to the surrounding surface water that could decrease mean water temperatures and potentially serve as thermal refuges for salmonids, or conversely increase mean water temperatures and possibly reduce salmonid habitat. These features included groundwater and hyporheic discharge zones, side channels, and tributaries.
High-resolution airborne thermal infrared (TIR) surveys have become increasingly used to (1) obtain longitudinal profiles of water temperature at the water’s surface for large lengths of river and (2) identify STFs expressed at the water’s surface (Torgersen and others, 2001; Tonolla and others, 2012; Dugdale and others, 2013; Fullerton and others, 2015; Dugdale and others, 2015; Dugdale, 2016; Curtis and others, 2021). Because of the short duration of airborne TIR surveys, the results can be viewed nearly-synoptically, or as a “snapshot in time,” such that water temperatures at a location can be directly compared to water temperatures at any other location upstream or downstream, assuming no significant diurnal heating or cooling effects during the survey. A true synoptic survey where a single image frame captures the entire watershed could only have been done at high altitudes, such as using a satellite, which would have resulted in low data resolution. Float surveys (also called “longitudinal surveys” or “Lagrangian drag-probe surveys”) have also been used as a less expensive and low-tech means of profiling water temperature and detecting STFs (Vaccaro and Maloy, 2006; Vaccaro and others, 2008; Gendaszek and Appel, 2021). Float surveys can be especially advantageous in deep, stratified rivers that wouldn’t necessarily express thermal anomalies at the water’s surface. However, interpreting the LTPs produced from float surveys can be challenging because the water temperature changes from diurnal heating and cooling during the relatively longer survey duration.
By evaluating LTPs in the context of the location and characteristics of STFs, inferences can be drawn as to why certain segments of the river heat more than others, and which locations would potentially be most appropriate for in-stream and riparian area restoration projects that could reduce high water temperatures. Such projects may include the installation of engineered log jams to promote hyporheic mixing, restoring trees in the riparian area to increase effective shade, protecting existing riparian buffers, and removing or setting-back levees to restore connection with the floodplain, which could potentially allow for water stored in wetlands from winter flood events to slowly discharge into the main channel as relatively colder groundwater in the summer (Kurylyk and others, 2015). Furthermore, LTPs can be useful for calibrating physically based hydrology and water temperature models, such as an existing distributed hydrology soil and vegetation model developed by the University of Washington Climate Impacts Group used to explore the effect of management actions and climate scenarios on fluvial and thermal conditions in the Snoqualmie River Basin (Sun and others, 2015; Yan and others, 2021; Fullerton and others, 2022).
Purpose and Scope
The purpose of this study was to quantify river temperature heterogeneity, evaluate longitudinal stream temperature profiles (LTPs), and identify and characterize significant thermal features (STFs) in the Skykomish, Snoqualmie, and Middle Fork Snoqualmie Rivers to inform the design, siting, and prioritization of habitat restoration and protection options aimed at mitigating high water temperatures and recovering endangered salmonid populations. To do so, this study mapped water temperatures in these rivers using high-resolution thermal infrared (TIR) and co-acquired true-color red, green, blue (RGB) imagery from airborne surveys conducted in August 2020 and 2021. The imagery mosaics from the airborne TIR and RGB surveys were used to measure the LTPs of the Skykomish, Snoqualmie, and Middle Fork Snoqualmie Rivers and identify the location of STFs expressed at the water’s surface. These surveys were done twice to evaluate the interannual persistence of STFs and the temporal variability of water temperature patterns in the LTPs, because the presence of STFs and the patterns in LTPs have been shown to vary over time in other studies (Dugdale and others, 2013). The study area for the TIR and RGB surveys, from upstream to downstream, was (1) the Middle Fork Snoqualmie River from above the Goldmyer Hot Springs trailhead to the North Fork Snoqualmie River confluence (33 river miles), (2) the main-stem Snoqualmie River from the North Fork Snoqualmie River confluence to Chinook Bend Natural Area in Carnation, Washington (23 river miles), and (3) the Skykomish River from Gold Bar, Washington, to its confluence with the Snoqualmie River in Monroe, Washington (26 river miles) (fig. 1).
In addition, water temperature float surveys were conducted on the Skykomish and Middle Fork Snoqualmie Rivers, August–September 2020, and a follow-up survey on the Middle Fork Snoqualmie River August 2021, to evaluate this less expensive and low-tech method of producing LTPs. The resulting LTPs from the float surveys were adjusted by subtracting the estimated diurnal heating that occurred since the start of the survey to produce pseudo-synoptic LTPs for comparison with the near-synoptic LTPs from the airborne TIR surveys. The study area for the 2020 float surveys, from upstream to downstream, was (1) the Middle Fork Snoqualmie River from the Taylor River confluence to the Three Forks Natural Area in Snoqualmie, Washington (21 river miles), and (2) the Skykomish River from Big Eddy River Access in Gold Bar, Washington, to its confluence with the Snoqualmie River in Monroe, Washington (24 river miles) (fig. 1). The follow-up float survey in 2021 was done on the Middle Fork Snoqualmie River from the Granite Creek confluence to the intersection of Tanner Road and North Bend Way in historical Tanner, Washington (about 8 river miles).
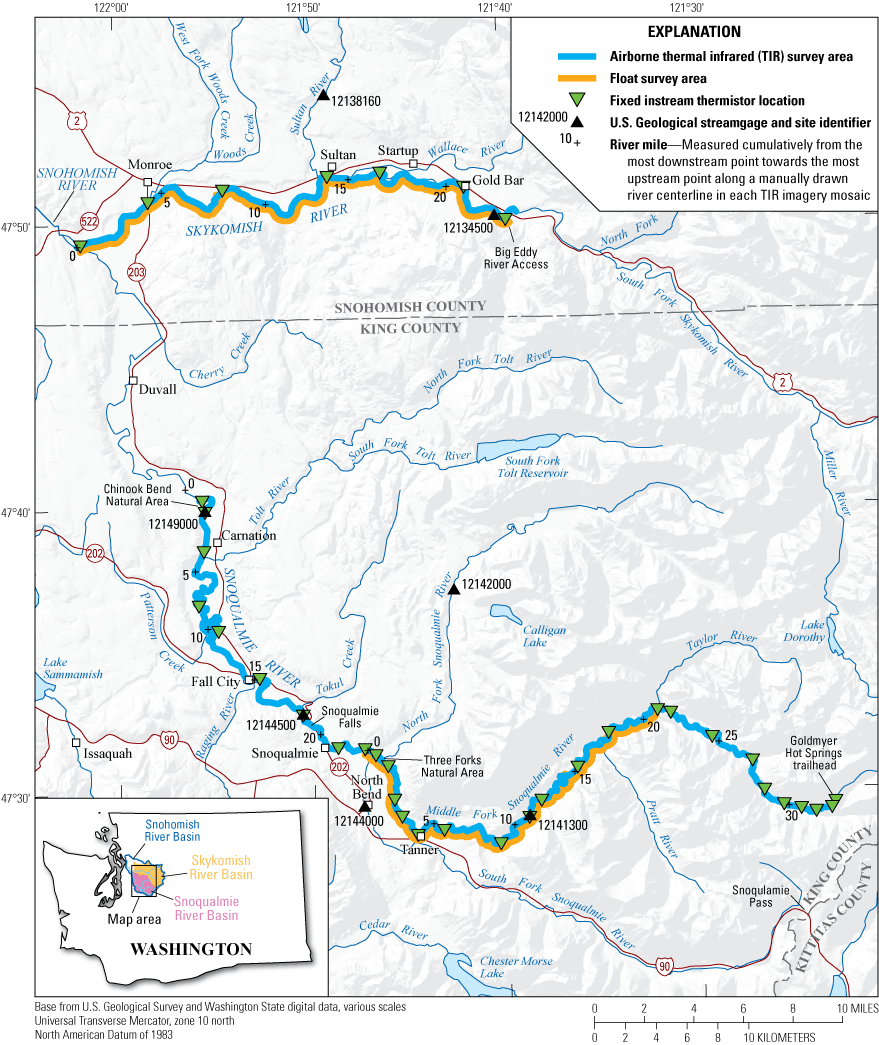
Study areas for the float surveys and airborne thermal infrared surveys of the Skykomish, Snoqualmie, and Middle Fork Snoqualmie Rivers, Snohomish and King Counties, Washington.
Hydroclimatic Setting
The Skykomish and Snoqualmie Rivers, in Snohomish and King Counties, Washington, drain a total area of 1,537 square miles from their steep alpine headwaters in the Cascade Range to their confluence at the Snohomish River in Monroe, Washington. The maximum basin elevations of the Skykomish and Snoqualmie Rivers are 7,950 and 7,550 feet (ft), respectively, whereas the Snohomish River begins at an elevation of approximately 13 ft (Mastin and others, 2016). The climate is temperate marine with warm, dry summers and cool, wet winters. The hydrologic regimes are strongly influenced by mountain snowpack and rainfall in the higher elevations of the Snoqualmie and Skykomish River Basins, where most of the precipitation is received because of the topographic relief of the Cascade Range (Stohr and others, 2011). Winter streamflow is relatively high, driven by short-term precipitation events and snowmelt. During the spring, snowmelt is the primary source of surface runoff. Streamflow decreases through the summer as snowpack and precipitation is reduced, with lowest streamflows typically occurring during early September (Stohr and others, 2011; Yan and others, 2021).
The Snoqualmie River Basin is typically delineated into the upper basin and lower basin, separated by Snoqualmie Falls, the predominant geologic feature and barrier to fish passage within the City of Snoqualmie, where the Snoqualmie River drops over a 268-ft shelf of volcanic rock. This bedrock control is largely responsible for the level alluvial valley around the Cities of Snoqualmie and North Bend, which has a low slope that allows for almost no bedload transport (Bethel, 2004). The upper Snoqualmie River Basin, which includes the North Fork Snoqualmie, South Fork Snoqualmie, and Middle Fork Snoqualmie Rivers, is mostly forest land managed either privately or by the U.S. Forest Service, with residential and commercial land uses concentrated around Snoqualmie and North Bend, Washington (Onwumere and Batts, 2004). The lower Snoqualmie River Basin and lower Skykomish River Basin are situated in a broad, low-angle alluvial floodplain that contains both prime agricultural land and vital habitat for Chinook and other salmonids. Historically supporting extensive agricultural and timber economies, the lower Skykomish and Snoqualmie River Basins are now comprised of residential and commercial centers alongside enduring mixed agricultural uses (Joy, 1994; SWM, 2017). The Snoqualmie River system is highly valued for its recreational uses, aquatic habitat, and domestic water supply uses (Stohr and others, 2011). The Skykomish River was the first to be designated in Washington’s State Scenic Rivers System, recognizing its important natural, scenic, historic, ecological, and recreational value (Chapter 79.72 RCW; Washington State Code Reviser, 1999).
History of Study Area
Rapid development of the floodplain for agriculture as well as the clearing of riparian forest, upland forest, and in-stream woody debris to support timber economies occurred during the early 1900s following European settlement (SWM, 2017; Herrera Environmental Consultants, 2013). From the 1920s to 1960s, levees, dikes, and riprap were installed along sections of the Skykomish, Snoqualmie, and Middle Fork Snoqualmie Rivers to protect landowners from flooding, channel migration and erosion (SWM, 2017). These channel modifications permitted for greater development of the floodplain, but significantly reduced salmonid habitat by removing connectivity to side channels and diminishing suitable gravel spawning areas by impeding the ability of large flood events to deposit and store fine sediments in the floodplain rather than in the main channel (SWM, 2017; Solomon and Boles, 2002). These channel alterations and land and water use changes that occurred over the past 160 years, along with changes associated with global heating such as increased air temperatures and reduced inflow from snowmelt during summer months, are the main drivers of increased water temperatures, and consequently, reduced salmonid habitat in these river basins (Poole and Berman, 2001; Moore and others, 2005; Washington Department of Ecology, 2007; Stohr and others, 2011; Herrera Environmental Consultants, 2013; Svrjcek and others, 2013; Dalton and others, 2013; Wuebbles and others, 2017; SWM, 2017).
Methods
Fixed Instream Thermistors
Prior to the airborne TIR and float surveys, U.S. Geological Survey (USGS), National Oceanic and Atmospheric Administration, and King County staff deployed 37 fixed instream thermistors (HOBO MX2204 or TidbiT v2, logging every 15 or 30 minutes, respectively), spaced about every 1 to 5 river miles throughout the study area to record water temperature during the data acquisition time frame (fig. 1). Thermistors were tethered with a 1/8-inch (in.) steel cable to a large boulders or trees on the edge of the channel and housed in a 4-in. segment of 2-in. white PVC (Polyvinyl Chloride) pipe to shield the sensor from solar radiation. The steel cable tether was extended streamward when possible, to allow for the sensor to (1) sit in the main flow of the channel, (2) not be in pools or riffles, and (3) ideally be visible to the sky for locating it in the thermal imagery. The steel cable was weighted and concealed with boulders and the sensor sat just above the stream bed at a location deeper than 1.5 ft and shallower than 6 ft to allow for fully submerged data loggers and avoid a stratified water column. Cross-sectional water temperature profiles were conducted at every thermistor site upon deployment to ensure that the channel was well-mixed, and that the thermistor was representative of mean cross-section temperatures at that location.
Seven thermistors were deployed along the Skykomish River, nine were deployed along the Snoqualmie River, and twenty-one were deployed along the Middle Fork Snoqualmie River. The positions of the loggers were recorded using a Garmin 60CSx global positioning system (GPS) device (horizontal accuracy of approximately 15 to 30 ft). Data from these thermistors were used to radiometrically calibrate the TIR imagery, perform quality-assurance checks on the float survey data, and compute adjustments to the float survey data to subtract the estimated amount of temperature increase during the survey from diurnal heating. Quality-assurance and quality-control for instream thermistors followed procedures outlined in the USGS National Field Manual for the Collection of Water-Quality Data (Wilde, 2006) and the USGS Guidelines and Standard Procedures for Continuous Water-Quality Monitors (Wagner and others, 2006). A two-point calibration check was performed on the instream thermistors prior to initial deployment using a thermistor certified by the National Institute of Standards and Technology.
Thermal Infrared and True-Color Red, Green, Blue Surveys
TIR and RGB imagery mosaics were produced by NV5 Geospatial (NV5; formerly Quantum Spatial, Inc.) from airborne surveys of the Skykomish, Snoqualmie, and Middle Fork Snoqualmie Rivers. NV5 co-acquired the imagery during two distinct airborne surveying efforts, in August (Aug.) 16–17, 2020, and Aug. 3–5, 2021, using a FLIR SC6000 longwave infrared sensor and a Sony α7R III (three band) camera mounted in a fiberglass enclosure to a Bell 206 Long Range helicopter. The surveys were conducted during afternoon hours, with clear skies and warm air temperatures, to maximize the thermal contrast between the river water and the banks. The aircraft was flown following the river channels to ensure full coverage of wetted channels and floodplains. In a few sections of the river, it was necessary to make multiple passes to ensure full coverage. At a flying altitude of 1,300 ft above ground level the FLIR SC6000 and Sony α7R III achieved ground sampling distances of less than 20 in. and 4 in., respectively.
For the first surveying effort, TIR and RGB imagery was collected for the Skykomish River on Aug. 16, 2020 (14:09–15:30 pacific daylight time [PDT]), and for the Snoqualmie and Middle Fork Snoqualmie Rivers on Aug. 17, 2020 (15:25–16:00 PDT and 14:10–15:25 PDT, respectively). Supplemental data for the first surveying effort were acquired on Aug. 18, 2020 (14:00–14:47 PDT), to fill in small gaps and include coverage of side channels of interest in the Skykomish and Middle Fork Snoqualmie Rivers. For the second surveying effort, TIR and RGB imagery for the Skykomish River was collected on Aug. 4, 2021 (13:41–15:10 PDT), for the Snoqualmie River on Aug. 3, 2021 (14:04–14:37 PDT), and for the Middle Fork Snoqualmie River on Aug. 3, 2021 (14:37–15:40 and 16:58–17:20 PDT, gap in time because of helicopter refuel). Supplemental data for the second surveying effort were acquired on Aug. 4, 2021 (16:25–16:46 PDT), for the Middle Fork Snoqualmie River and on Aug. 5, 2021 (13:53–14:15 PDT), for the Skykomish River.
The FLIR SC6000 sensor is a cooled, calibrated radiometer with internal non-uniformity correction and drift compensation. The FLIR SC6000 sensor uses a focal plane array of detectors to sample incoming radiation. This technology presents a challenge in achieving uniformity across the detector array. The sensor has a correction scheme which reduces non-uniformity across the image frame; however, differences in temperature (typically < 0.5 °C) might be observed near the edge of the image frame. To reduce these differences, the FLIR SC6000 sensor was set to acquire images at a rate of 1 image per second (1 Hz), resulting in 60 percent or greater forward overlap between images so that frame edges could be excluded from the river channel in the TIR imagery mosaics. TIR images were recorded directly from the sensor to an on-board computer as raw digital numbers to later be converted to radiant temperature. Co-acquired RGB images were recorded to the Sony a7R III as .jpeg files.
The individual TIR and RGB images were referenced with timestamp, position, altitude, and heading information provided by an onboard survey-grade GPS and inertial measurement unit (IMU). Position and altitude of the aircraft was measured twice per second (2 Hz) while pitch, roll, and yaw (heading) were measured 200 times per second (200 Hz). Initially, a boresight calibration flight was processed to calculate the misalignment angles between the FLIR SC6000 sensor and the IMU system, allowing for direct georeferencing of the TIR imagery without aerial triangulation.
Kinetic water temperatures recorded during the surveys by fixed instream thermistors were used to radiometrically calibrate the thermal signature of the TIR imagery. TIR imagery was also radiometrically calibrated using air temperature and relative humidity data recorded during the surveys by five nearby weather stations (Skykomish River: KWAMONRO11 and KWAGOLDB15; Snoqualmie River: KWACARNA1; Middle Fork Snoqualmie River: KWANORTH112 and KWASNOQU73) (TWC Product and Technology, 2023a–e). The raw TIR images collected initially contain digital numbers which are then converted to radiance temperatures based on the factory calibration of the FLIR SC6000. These factory calibration values were overridden in FLIR ResearchIR Max software (version 4.40.11.35; FLIR Systems, 2020) upon exporting the individual image frames to correct for atmospheric attenuation and the thermal radiation properties of water, which has an emissivity of 0.98, a reflectivity of .02 and a transmissivity of 0. This override option is available only for a cooled-TIR Quantum Well Infrared Photodetector sensor like the FLIR SC6000 used for the surveys. Air temperature and relative humidity taken from the weather station closest to the site were also entered into FLIR ResearchIR Max in this step.
The calculated radiant temperatures were then adjusted to bring the radiant values into a best-fit agreement with the recorded kinetic temperatures at the fixed instream thermistors, with radiant values representing the median of ten pixels, where water is visible, sampled from the image in the immediate vicinity of the instream thermistor’s location. In some cases, the surveyed location of a thermistor was slightly adjusted to allow for sampling pixels where water is visible. This calibration adjustment was made in FLIR ResearchIR Max by modifying the initial input air temperature from its recorded value, with a goal of reaching a mean absolute error of less than 1.0 °C water temperature difference between the mosaic and thermistor-recorded values at the time of acquiring the TIR imagery.
TIR and RGB Imagery Mosaics
After exporting the calibrated TIR and raw RGB image frames, the following method developed internally by NV5 was used to produce georeferenced, orthorectified TIR and RGB imagery mosaics (Diabat and Miwa, 2020, 2021a, b):
-
1. Calculate camera misalignment angles from a system boresight flight conducted close to the TIR survey area using the Calibration and Quality Control software module within Applanix POSPac MMS (version 8.4; Trimble, 2023a).
-
2. Resolve kinematic corrections for aircraft position data using kinematic aircraft GPS and static ground GPS data. Develop a smoothed best estimate of trajectory (SBET) file that blends post-processed aircraft position with sensor head position and altitude recorded throughout the survey (Applanix POSPac MMS version 8.4; Trimble, 2023a).
-
3. Calculate exterior orientation for each image event by linking the event timestamps with the SBET and boresight misalignment angles (Applanix POSPac MMS version 8.4; Trimble, 2023a).
-
4. Generate individual TIR ortho images using a publicly available digital elevation model (DEM) in the OrthoMaster software module within Inpho (version 10.1; Trimble, 2023b).
-
5. Apply exterior orientation to individual RGB photos using Agisoft Metashape (version 1.7.4; Agisoft, 2021) and perform aerial triangulation using automatically generated tie points and ground control data. Orthorectify RGB images using mesh surface generated within Metashape using structure from motion techniques.
-
6. Mosaic orthorectified TIR imagery using the OrthoVista software module within Inpho (version 10.1; Trimble, 2023b), generating seams between individual photos. No color balancing was applied, and minimal seam line feathering was performed to preserve the calibrated temperature values displayed the final TIR mosaic.
-
7. Mosaic orthorectified RGB imagery using Agisoft Metashape (version 1.7.4; Agisoft, 2021), blending seams between orthophotos and applying global color balancing to achieve consistent tonality throughout the study area.
The RGB imagery was mosaicked to MrSID Generation 3 format (.sid) using a 20:1 compression ratio and the TIR imagery was mosaicked to Tag Image File Format (.tif) raster images. A visual inspection of the final imagery mosaics was performed to ensure co-registration of the TIR and RGB mosaics. Because of the coarseness of the DEM resolution compared to the TIR and RGB imagery and sometimes temporal difference between the datasets, there were small seamline offsets (about 1.6 ft) in some areas of the mosaics.
Each pixel in the TIR mosaics had a water temperature value stored as degrees Celsius multiplied by 10, an unsigned integer pixel type. Though pixel values are in degrees Celsius multiplied by 10, any temperature values derived from these pixels values are in degrees Celsius. A layer display file developed by USGS aided in visualizing the TIR mosaics, providing symbology for the mosaics by applying a color scale based on temperature classes (Restivo and others, 2023).
Longitudinal Stream Temperature Profiles
To produce the longitudinal stream temperature profiles (LTPs), first river centerlines were manually drawn and digitized by NV5 using the TIR mosaic indicated in the “Mosaic” attribute field for each point in the profile as a guide, as well as the co-acquired true-color red, green, blue (RGB) imagery mosaic. This was done for each river surveyed and for the entire length of the surveyed study area. The centerlines were drawn to represent the main flow path while avoiding as many non-water features as possible, such as aquatic vegetation, boulders, and overhanging canopy. However, a few non-water features cannot always be avoided, such as bridges. River distances were measured cumulatively from the most downstream point to the most upstream point in the surveyed study area. Therefore, the calculated length represents only the sections of river within the surveyed study area and is not relative to the overall river length outside of the study area nor the commonly used river mile as defined by the USGS National Hydrography Dataset.
After the centerlines were digitized, points spaced every 10 meters (32.8 ft) along the river centerlines were then generated to represent the LTP of each river. Summary statistics were calculated for each point in the LTP by using an algorithm to sample pixel values of water temperature along the manually drawn centerline in the corresponding thermal imagery mosaic within a 2-meter radius buffer around each point, and then using this sample to compute the mean, median, maximum, minimum, and standard deviation of water temperature (in degrees Celsius) associated with each point. Because of the nature of the automated point generation, some point buffers inevitably sampled pixels on bridges or non-water features, skewing the temperatures. These points were identified as outliers by having a maximum temperature within the sample greater than 23.5 °C or a standard deviation greater than or equal to 0.35 °C and were excluded from the final LTPs. These thresholds were determined by observing in the TIR and RGB imagery that points with a maximum temperature or standard deviation above these thresholds sampled non-water features, biasing the mean water temperature high from the land being warmer than the water.
Significant Thermal Features
STFs in each TIR imagery mosaic were identified manually in ArcGIS Pro (version 3.0.2; Esri, 2022) by first applying a custom color scale that assigned a color for each user-defined group of values in the Pixel Value entity of a mosaic, with group labels edited to correspond to equivalent values in degrees Celsius. This color scale classified pixels into separate color groups of water temperature incremented by 1.0 °C from 13.1 to 16.0 °C (for example, 13.1 to 14.0 °C) and incremented by 0.5 °C in the mid-high range from 16.1 to 22.0 °C (for example, 16.1 to 16.5 °C). Temperatures from 7.1 to 13.0 °C and from 22.1 to 23.5 °C were classified into two separate color groups, whereas temperatures below 7.1 °C and above 23.5 °C were assigned no color. These groupings attempted to maximize the contrast between water temperatures in the mid-high range of values, where the hyporheic features may be relatively close in temperature to the surface water it mixes with, while limiting the total number of groups such that colors could still be easily distinguished. With a color assigned to each group of water temperatures, thermal anomalies were identified by differences in color between what would be expected in a river with no thermally distinct inputs and other water sources such as lateral groundwater flow, hyporheic flow, and tributaries.
A well-mixed river with no thermally distinct inputs from other water sources can be expected to have relatively homogenous water temperatures across the main channel and slightly higher water temperatures at the edges where the river is typically shallower and velocities are slower. A well-mixed river can also be expected to show a gradual increase in water temperature as it moves downstream because of serial exposure to solar radiation over time and an increased surface area exposed to solar radiation as the channel widens, among other heat exchange processes. Deviations from these expected water temperatures were indicative of thermal inputs from other water sources. These sources were assigned to one of three classifications: (1) lateral groundwater, side channel and small tributary (“Lateral GW/Side Channel/Small Trib”), (2) hyporheic flow and diffuse groundwater (“Hyporheic/Diffuse GW”), or (3) tributary.
Lateral groundwater inputs were indicated by patches of water, or in some cases rocks, at the river edges that were colder than the water or rocks directly upstream, as evidenced by differences in pixel color with the aforementioned color scale applied. Because these features can be small, a single pixel on the river edge colder than upstream pixels was considered evidence of a lateral groundwater input, though most often these features appeared as a group of cold pixels. Side channels and small tributaries were grouped in this category because the water surface in these features was often obscured by vegetation, making it difficult to determine if there was continuity in surface water flow from upstream to downstream or if the flow was mostly originating from or was significantly cooled by a discrete groundwater source contained within the side channel or small tributary. Where the water surface within side channels or small tributaries was not obscured by vegetation, these features often did contain cold thermal anomalies indicative of discrete groundwater inputs.
Hyporheic flow and diffuse groundwater was indicated by patches of water, typically 10 or more pixels, within the main channel and not on the river’s edges, that were colder than the water directly upstream. This classification method assumes that the surface water would not have cooled in the downstream direction if not for cold-water inflows from these sources. Hyporheic flow occurs where shallow groundwater mixes with surface water in the porous zone beneath a stream bed, whereas diffuse groundwater was assumed to originate from a discrete, deeper source of groundwater in the phreatic zone and dispersed after mixing with the surface water. These two sources were grouped together because of the difficulty in distinguishing between them in TIR imagery because both appear as a diffuse patch of colder water expressed at the water surface in the main channel. Cold patches below a set of rapids often were identified as hyporheic flow, considering that water passing over the rapids should be well-mixed. Stratification was only considered likely in deep pools, which were often identifiable by their darker colored water in the RGB imagery. A single pixel was not considered sufficient evidence of hyporheic and diffuse groundwater.
Named tributaries were identified and classified as a Tributary STF. Except for these named tributaries, determinations of STF classifications were subjectively made by the analyst and the best available information on water temperature. The RGB imagery mosaics from the 2020 and 2021 surveys were key to making many STF-type determinations, along with an understanding of river hydrology, groundwater and surface-water interactions, and water temperature dynamics. However, it is important to note that a different analyst may interpret and classify these features differently or identify features that were not identified within the provided shapefiles of STFs. Likewise, applying a different color scale by changing the maximum and minimum values for each color group to focus on a refined range of water temperatures in the TIR imagery mosaics could reveal additional STFs that were not identified using the color scale applied for this analysis. When using the RGB imagery to confirm STFs, attention was given to the distortion that occurs between the TIR and RGB imagery mosaics in that that they do not always line up perfectly, particularly at the river edges.
Summary statistics (mean, median, maximum, minimum, and standard deviation) were computed for each STF point using a sample of water temperature values from that year's thermal imagery mosaic within a 1-meter radius buffer around each point. Because some of the STFs are small and (or) adjacent to non-water pixels, some of the temperature values sampled within the 1-meter buffer may not be representative of the temperature of the feature. As such, the maximum, minimum, and standard deviation of temperature should be considered when interpreting the STFs, because these statistics can indicate if non-water features were sampled within the 1-meter buffer. A nearest distance to the centerline of the channel and a corresponding river mile distance along that centerline were computed for each point. In addition, STFs of the same type identified in 2021 that were within 10 meters of their location in 2020 were classified as being “persistent” across the survey years.
Float Surveys
Float surveys were conducted on the Skykomish River over several days from Aug. 24 to September (Sept.) 11, 2020. The Middle Fork Snoqualmie River float surveys were conducted over several days from Aug. 17 to Sept. 11, 2020, with a follow-up survey on a reach of interest conducted Aug. 3, 2021, the same day as the airborne TIR survey of the Middle Fork Snoqualmie River. Float survey data were collected by measuring near-surface and near-streambed (henceforth, “near-bottom”) water temperature, conductivity, and GPS position at three-second intervals from an inflatable kayak drifting downstream at ambient river velocity, following the method of Vaccaro and Maloy (2006). By moving downstream at ambient velocity, the change in water temperature within a theoretical parcel of water can be tracked, with deviations from the diurnal heating of the parcel presumably from groundwater discharge, surface water inflows or losses, and riparian shading.
Where river velocities were too low, the kayak was propelled by slow, steady, manual rowing. Where depths were too shallow the kayak was walked alongside and pushed. Water temperature and conductivity was logged using two HOBO U24 sensors individually housed in protective, porous, 2 × 10-in. white PVC pipes affixed to the end of the kayak, one with an adjustable 10-ft length rope for measuring near-bottom temperatures and the other with a 3-ft length of rope for measuring near-surface temperatures. A two-point calibration check was performed on the HOBO U24 sensors prior to initial use using conductivity standards and a thermistor certified by the National Institute of Standards and Technology. Within the study area there were several sections of Class III rapids, particularly on the Middle Fork Snoqualmie River, where despite the protective housing the sensor stopped logging from impact against small boulders in the channel. Therefore, the float survey for those segments with missing data needed to be repeated later than desired for comparative analysis with the results from the airborne TIR surveys.
Float survey data were processed using HOBOware Pro (version 3.7.17; Onset, 2019), ArcGIS Desktop (version 10.8.1; Esri, 2021), and RStudio (version 1.4.1106; RStudio Team, 2021) with R (version 3.6.0; R Core Team, 2019). First, ArcGIS Desktop was used to remove GPS points recorded when the kayak was not advancing downstream. Next, a spatial join was performed to reference the GPS points to distances along the same river centerlines in which distances for the corresponding airborne TIR LTPs are referenced so as to facilitate direct comparison of results. Then, near-surface and near-bottom specific conductance at 25 °C were computed from conductivity in Onset HOBOware Pro’s Conductivity Assistant using the first option of Natural Waters correction per EN27888. An R script then joined the GPS data to corresponding water temperature and specific conductance readings based on the time stamp. Erroneous water temperature data from the HOBO U24 sensor being out of water, as indicated by a specific conductance value less than or equal to 5 microsiemens, were removed. This 5-microsiemen threshold was based on values recorded when the sensor was known to have been out of water.
The R script then computed an adjusted near-surface and near-bottom water temperature by subtracting the estimated temperature increase, caused by diurnal heating, from the recorded near-surface and near-bottom temperatures for each point in the survey. This estimated temperature increase was equal to (1) the elapsed time, in seconds, at each float survey point since the start of the float survey multiplied by (2) the average rate of temperature increase (in degrees Celsius per second) during the survey, as computed from water temperature recorded by the nearest upstream and downstream fixed instream thermistors for each float survey point. Float surveys targeted a noon start time to ensure that water temperature recorded at fixed instream thermistors during the survey would only be increasing in a monotonic, near-linear trend, thus permitting computation of the temperature adjustment for each point using this simple linear equation. Finally, the R script computed the five-point centered moving average of the adjusted near-surface and adjusted near-bottom water temperature to reduce noise in the data to better see general tendencies. This moving average was thus referred to as the near-surface or near-bottom adjusted average water temperature. Adjusted average water temperature values were computed prior to any rounding of the values used in the computation.
Results
The georeferenced imagery mosaics, LTPs, and STFs from the airborne TIR and RGB surveys, as well as the LTPs from the float surveys, may be downloaded from the data release accompanying this report (Restivo and others, 2023). Water temperature records from the fixed instream thermistors are available through the Washington Department of Ecology's Environmental Information Management System (Washington Department of Ecology, 2023).
Airborne TIR Surveys
The Middle Fork Snoqualmie River had the most warming from upstream to downstream compared to the Skykomish and Snoqualmie Rivers, about 7 °C in the 2020 survey and 9 °C in the 2021 survey, despite having about twice as many persistent STFs per river mile. The Snoqualmie River had about 4 °C of warming in both surveys and the Skykomish River showed an overall reduction in water temperature in both surveys (table 1). This cooling in the Skykomish River was attributed primarily to cold inflow from the Sultan River.
Table 1.
Significant thermal features identified in the 2020 and 2021 thermal infrared imagery mosaics.[GW, groundwater; STFs, significant thermal features]
Skykomish River
Radiant water temperatures from the calibrated airborne TIR imagery mosaics of the Skykomish River corresponded to kinetic water temperature values recorded by instream thermistors during the TIR surveys within a maximum absolute difference of 0.6 °C for the 2020 survey and 0.9 °C for the 2021 survey. Mean absolute error was 0.3 °C for the 2020 survey and 0.2 °C for the 2021 survey. Water temperature values along the airborne TIR LTPs of the Skykomish River varied between 16.6 and 20.8 °C for the 2020 survey and between 18.6 and 21.2 °C for the 2021 survey (fig. 2). USGS streamgage 12134500 (Skykomish River Near Gold Bar, WA; USGS, 2023a) recorded a discharge of 785 cubic feet per second (ft3/s) during the 2020 survey and 1,010 ft3/s during the 2021 survey. Air temperatures at the KWAMONRO11 weather station in Monroe reached a high of 35.6 °C during the day of the 2020 survey and 31.1 °C during the day of the 2021 survey (TWC Product and Technology, 2023c).
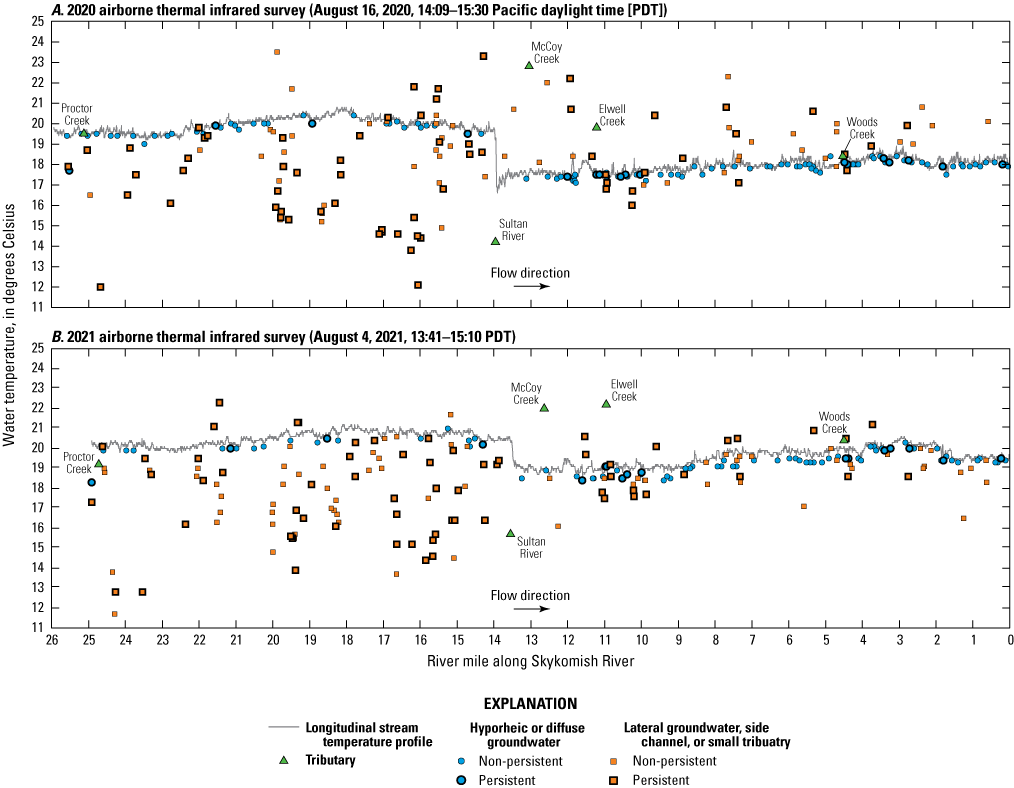
Longitudinal stream temperature profiles and significant thermal features from airborne thermal infrared surveys of the Skykomish River, Washington for A, August 16, 2020, and B, August 4, 2021.
The river mile referencing for the airborne TIR LTPs on the Skykomish River varies slightly between the 2020 and 2021 surveys because of differences in how the centerline was drawn at splits in the channel near Elwell Creek and within the final river mile of the study area. The airborne TIR LTPs for both surveys begin near Reiter Pit sand and gravel mine in Gold Bar, Washington, at an approximate elevation of 250 ft, with water temperatures of 19.8 °C in the 2020 survey and 20.4 °C in the 2021 survey. From Reiter Pit until just upstream from the Sultan River confluence, about 12 river miles downstream, the overall thermal gradient of the Skykomish River was relatively stable, varying from the temperature at the upstream end of this reach within plus or minus 1.0 °C for both surveys and warming only 0.2 °C total by the end of the reach. Within this reach, temperatures increased as the river flowed through populated areas of Gold Bar and Startup in a wider active channel with less effective shade and then decreased on the approach to the town of Sultan. The highest mean temperatures in the airborne TIR LTPs, 20.8 °C in the 2020 survey and 21.2 °C in the 2021 survey, were in Startup just upstream from a right bank levee adjacent to deforested farmland on Reese Road.
A total of 37 persistent Lateral GW/Side Channel/Small Trib STFs with mean temperatures below 20.0 °C in both survey years were identified upstream from the Sultan River, 11 of which had mean temperatures of 16.0 °C or below in both survey years. For example, a groundwater-fed side channel on the right bank just downstream from Proctor Creek was as cold as 12.0 °C in the 2020 survey and 11.7 °C in the 2021 survey (fig. 3). Similarly, a prominent groundwater-fed side channel that enters on the left bank about 2 river miles upstream from the Sultan River confluence was as cold as 12.1 °C in the 2020 survey and 13.7 °C in the 2021 survey.
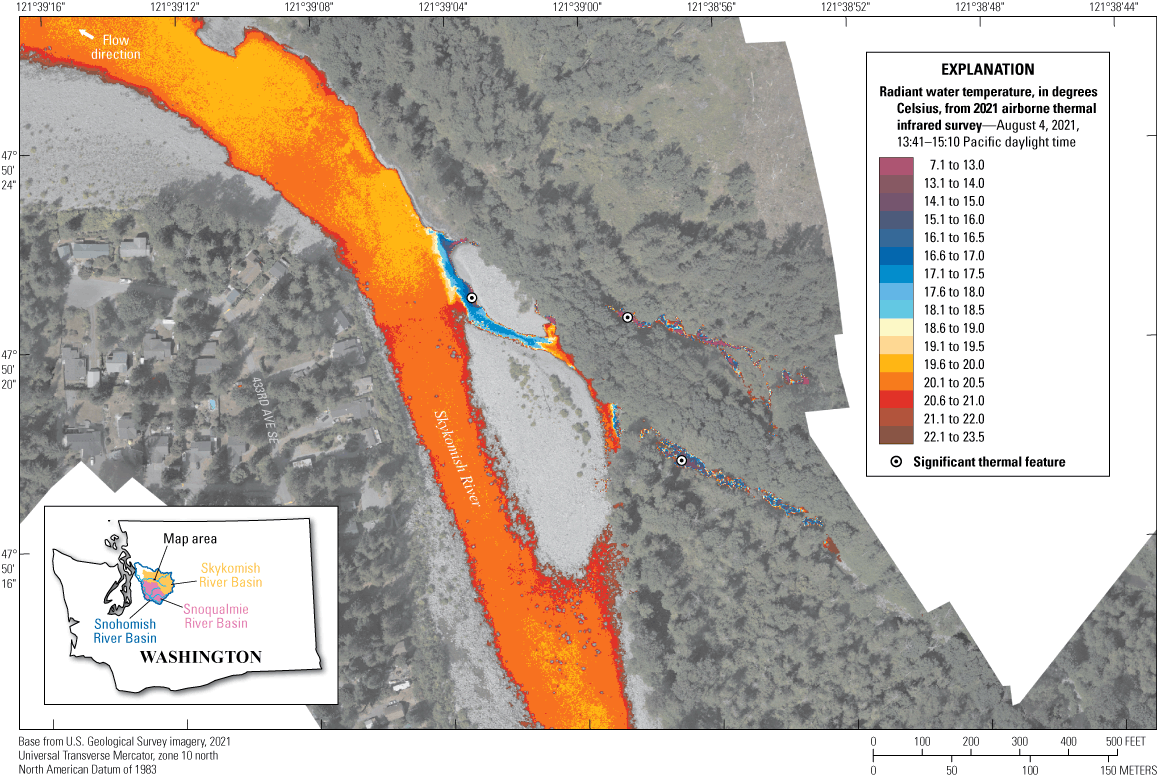
Radiant water temperatures and true-color red, green, blue imagery at river mile 24.3 from the airborne thermal infrared survey of the Skykomish River, Washington, August. 4, 2021.
The Sultan River, regulated by Snohomish County Public Utility District at Culmback Dam, is the predominant thermal feature in the lower Skykomish River. Based on discharge data during the TIR surveys from USGS streamgages 12138160 (Sultan River Below Powerplant Near Sultan, WA; USGS, 2023b) and 12134500 (Skykomish River Near Gold Bar, WA; USGS, 2023a), the Sultan River contributed about 54 percent (913 ft3/s) of the combined streamflow of the Skykomish and Sultan Rivers during the 2020 survey and about 30 percent (427 ft3/s) during the 2021 survey. The mean water temperature of the Sultan River at its confluence with the Skykomish River during the 2020 and 2021 surveys was 14.2 and 15.7 °C, respectively. Comparing water temperatures in the Skykomish River just upstream from the Sultan River confluence to about 0.5 river miles downstream from the Sultan River confluence, where the Skykomish River seems well-mixed with the Sultan River, the contribution of cold water from the Sultan River effectively reduced water temperature in the Skykomish River by 2.4 °C in the 2020 survey and 1.5 °C in the 2021 survey.
From 0.5 miles downstream from the Sultan River to the downstream end of the Skykomish River, at an approximate elevation of 13 ft, water temperatures remained relatively stable, varying from the temperature at the upstream end of this reach within +1.6 and ˗0.4 °C and warming about 0.5 °C total. McCoy and Elwell Creeks were two notably warm tributaries downstream from the Sultan River. McCoy Creek had a mean temperature of 22.8 °C in the 2020 survey and 22.0 °C in the 2021 survey, and Elwell Creek had a mean temperature of 19.8 °C in the 2020 survey and 22.2 °C in the 2021 survey. However, these two inflows, along with other relatively warmer inflows from small tributaries or side channels downstream from the Sultan River, did not have a significant effect in warming the main channel.
About 2.4 times as many persistent Lateral GW/Side Channel/Small Trib STFs per river mile were identified upstream from the Sultan River compared to downstream, and none of those downstream were below 16 °C. Conversely, though Hyporheic/Diffuse GW STFs were observed throughout the Skykomish River, about 2.7 times as many persistent Hyporheic/Diffuse GW STFs per river mile were found downstream from the Sultan River compared to upstream.
Snoqualmie River
Radiant water temperatures from the calibrated airborne TIR imagery mosaics of the Snoqualmie River corresponded to kinetic water temperature values recorded by instream thermistors during the TIR surveys within a maximum absolute difference of 1.5 °C for the 2020 survey and 0.7 °C for the 2021 survey. Mean absolute error was 0.8 °C for the 2020 survey and 0.4 °C for the 2021 survey. Water temperature values along the airborne TIR LTPs of the Snoqualmie River varied between 16.0 and 20.4 °C for the 2020 survey and 17.9 and 21.8 °C for the 2021 survey (fig. 4). USGS streamgages 12144500 (Snoqualmie River Near Snoqualmie, WA; USGS, 2023e) and 12149000 (Snoqualmie River Near Carnation, WA; USGS, 2023f) recorded discharges of 536 and 747 ft3/s during the 2020 and 2021 surveys, respectively. During the 2021 survey these same streamgages recorded 559 and 919 ft3/s, respectively. Air temperatures at the KWACARNA1 weather station in Carnation reached a high of 33.9 °C during the day of the 2020 survey and 31.7 °C during the day of the 2021 survey (TWC Product and Technology, 2023a).
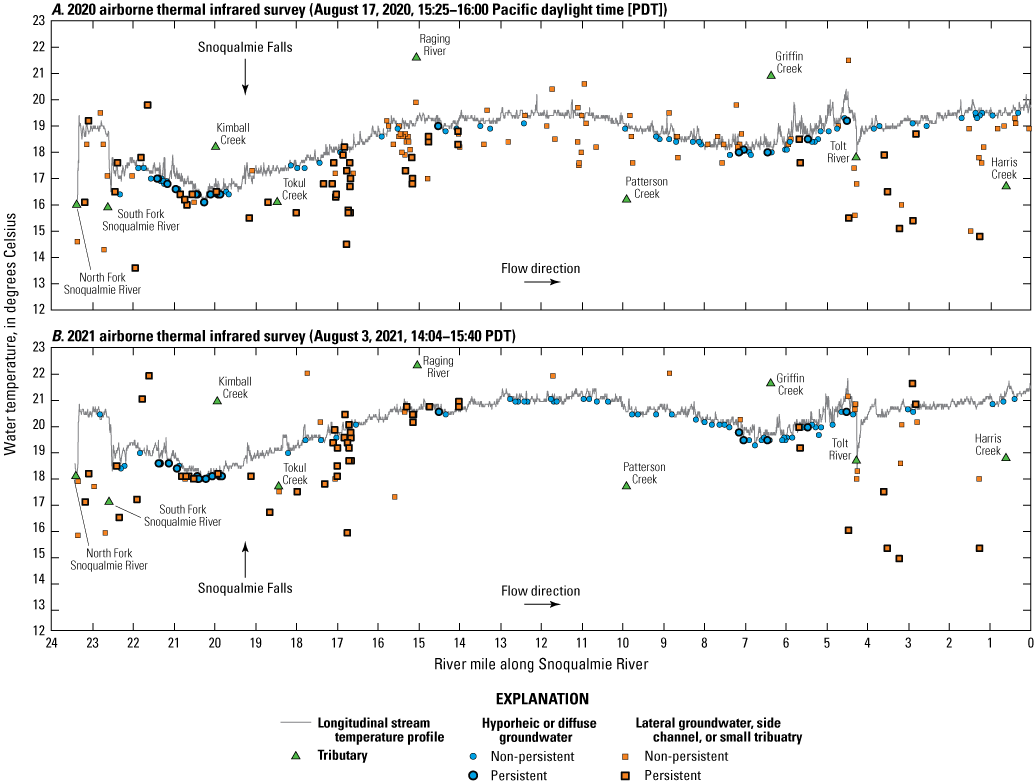
Longitudinal stream temperature profiles and significant thermal features from airborne thermal infrared surveys of the Snoqualmie River, Washington for A, August 17, 2020, and B, August 3, 2021.
The airborne TIR LTPs of the main-stem Snoqualmie River began at the Three Forks Natural Area in North Bend, Washington, at an approximate elevation of 410 ft, where the North Fork Snoqualmie River joins the Middle Fork Snoqualmie River, followed by the confluence with the South Fork Snoqualmie River 0.7 river miles downstream at river mile (RM) 22.6. Based on discharge data during the TIR surveys from USGS streamgages 12141300 (MF Snoqualmie River Near Tanner, WA; USGS, 2023c), 12142000 (NF Snoqualmie River Near Snoqualmie Falls, WA; USGS, 2023d), and 12144000 (SF Snoqualmie River at North Bend, WA; USGS, 2023g) the Middle Fork Snoqualmie River contributed about 53 percent (234 ft3/s) of the combined streamflow of the three forks during the 2020 survey and about 55 percent (262 ft3/s) during the 2021 survey, at mean water temperatures of 20.0 and 21.4 °C, respectively. The North Fork Snoqualmie River contributed about 12 percent (54.0 ft3/s) of the combined streamflow during the 2020 survey and about 10 percent (49.3 ft3/s) during the 2021 survey, at mean water temperatures of 16.0 and 18.0 °C, respectively. The South Fork Snoqualmie River contributed about 35 percent (155 ft3/s) of the combined streamflow during the 2020 survey and about 34 percent (162 ft3/s) during the 2021 survey, at mean water temperatures of 15.9 and 17.0 °C, respectively. Comparing the Middle Fork Snoqualmie River temperatures to the water temperature about 0.5 river miles downstream from the South Fork Snoqualmie River confluence, where the North Fork and South Fork Snoqualmie Rivers seem well-mixed with the Middle Fork Snoqualmie River, at RM 22.1, the contributions of cold water from the North Fork and South Fork Snoqualmie Rivers reduced water temperatures in the Middle Fork Snoqualmie River by about 2.5 °C in the 2020 survey and 2.3 °C in the 2021 survey.
Over the next 1.75 river miles downstream from RM 22.1, water temperature decreased about a 1.7 °C as the Snoqualmie River passed Meadowbrook Slough and Borst Lake (Snoqualmie Mill Pond), coinciding with a group of 14 persistent Hyporheic/Diffuse GW and Lateral GW/Side Channel/Small Tributary STFs. Then water temperatures increased over the next 5.25 river miles as the Snoqualmie River passed the relatively warmer Kimball Creek near RM 20, flowed over Snoqualmie Falls at RM 19.25, and then passed the relatively colder Tokul Creek near RM 18.5. Water temperatures continued to increase as the river flowed west by parcels with little riparian buffer between RM 18 and RM 17.5. Snoqualmie Falls golf course adjoined the Snoqualmie River from RM 17 to RM 15. At the upstream segment of the golf course, from RM 17 to RM 16.5, a group of persistent Lateral GW/Side Channel/Small Tributary STFs was identified along the left bank, which drains the forested northern slopes of Snoqualmie Ridge. No Lateral GW/Side Channel/Small Tributary STFs were found on the right bank from RM 17 to RM 15 except for one at the far upstream end of the golf course. From RM 16.5 to RM 15.5 the Snoqualmie River took a north-northeast trajectory where the golf course bordered the river closely on both banks. In this segment there was notably scarce riparian vegetation, coinciding with an absence of Lateral GW/Side Channel/Small Tributary STFs in both year’s TIR imagery. Lateral GW/Side Channel/Small Tributary STFs reappeared on the left bank as the river bent back west for the final half a river mile until reaching the significantly warmer Raging River near RM 15, where temperatures briefly peaked. Overall, from RM 20.25 to RM 15, the Snoqualmie River warmed 3.3 °C in the 2020 survey and 2.8 °C in the 2021 survey.
Downstream from the Raging River water temperatures gradually increased as the Snoqualmie River traveled northwest through mostly agricultural land, with temperatures plateauing between RM 12.5 and RM 10.5 at a local maximum of 20.2 °C in the 2020 survey and 21.4 °C in the 2021 survey. Water temperatures then decreased downstream from this plateau as the river flowed past the relatively colder Patterson Creek and continued northward, eventually reaching a local minimum of 18.0 °C in the 2020 survey and 19.3 °C in the 2021 survey. This minimum coincided with a group of persistent Hyporheic/Diffuse GW STFs within about one river mile upstream and downstream from Griffin Creek at RM 6.4 and near several wetlands including Green and Horseshoe Sloughs. Though many non-persistent STFs were identified between RM 14 and 7.2, other than Patterson Creek there was a complete lack of persistent STFs in this reach in the 2020 and 2021 surveys.
Downstream from Griffin Creek water temperatures increased over the next 1.75 river miles, reaching their maximum within the study area just upstream from the Tolt River (RM 4.25), 20.4 °C in the 2020 survey and 21.8 °C in the 2021 survey. The Tolt River sharply decreased water temperatures in the Snoqualmie River, by 2.4 °C in the 2020 survey and 3.7 °C in the 2021 survey. However, this effect was only temporary, with temperatures increasing over the next 0.25 river miles by 0.8 °C in the 2020 survey and 2.3 °C in the 2021 survey. From RM 4 to the downstream end of the study area at Chinook Bend Natural Area, at an approximate elevation of 60 ft, water temperatures continued to generally increase, reaching 20.2 °C in the 2020 survey and 21.7 °C in the 2021 survey, nearly as a high as the study area maxima recorded just upstream from the Tolt River.
Middle Fork Snoqualmie River
Radiant water temperatures from the calibrated airborne TIR imagery mosaics of the Middle Fork Snoqualmie River corresponded to kinetic water temperature values recorded by instream thermistors during the TIR surveys within a maximum absolute difference of 1.5 °C for the 2020 survey and 1.6 °C for the 2021 survey. Mean absolute error was 0.9 °C for the 2020 survey and 0.4 °C for the 2021 survey. Water temperature values along the airborne TIR LTPs of the Middle Fork Snoqualmie River varied between 11.8 and 20.8 °C for the 2020 survey and 12.9 and 22.0 °C for the 2021 survey (fig. 5). USGS streamgage 12141300 (MF Snoqualmie River Near Tanner, WA; USGS, 2023c) reported a discharge of 234 ft3/s during the 2020 survey and 262 ft3/s during the 2021 survey. Air temperatures at the KWANORTH112 weather station in North Bend reached a high of 33.9 °C during the day of the 2020 survey and 30.6 °C during the day of the 2021 survey (TWC Product and Technology, 2023d).
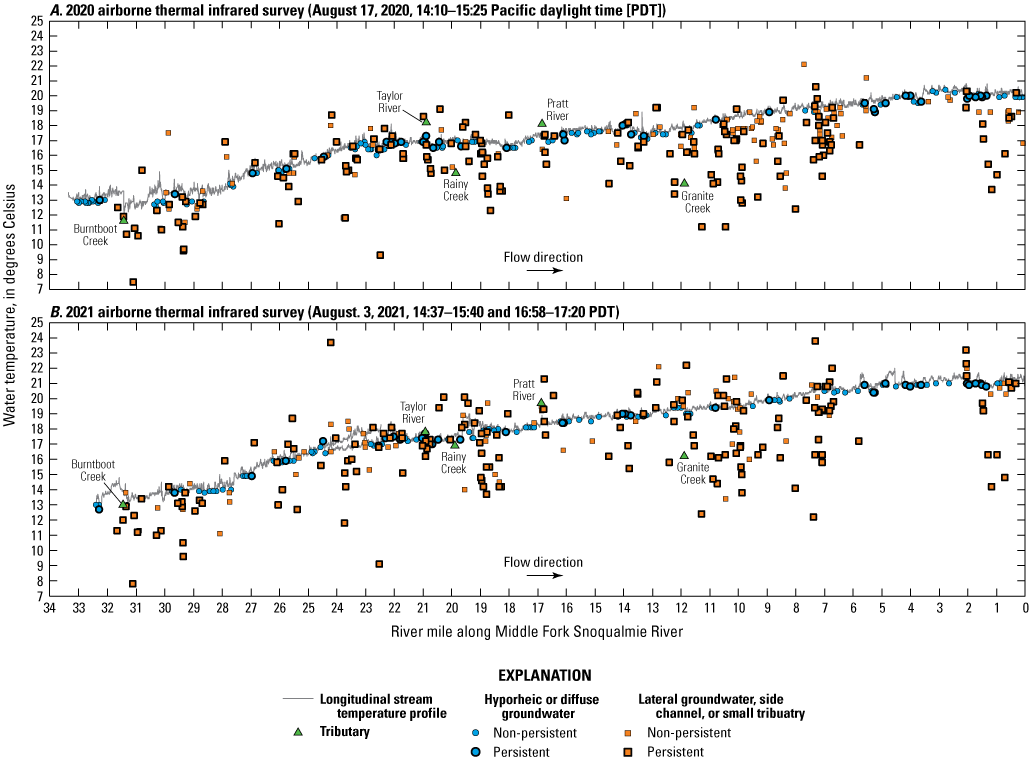
Longitudinal stream temperature profiles and significant thermal features from airborne thermal infrared surveys of the Middle Fork Snoqualmie River, Washington for A, August 17, 2020, and B, August 3, 2021.
The 2021 airborne TIR LTP of the Middle Fork Snoqualmie River has two segments that overlap between RM 22.5 and RM 24.5. The downstream profile was derived from the TIR imagery collected Aug. 3 from 14:37 to 15:40 PDT (Snoqualmie_TIR_Mosaic_2021A.tif; Restivo and others, 2023), and the upstream profile was from TIR imagery collected Aug. 3 from 15:45 to 16:58 PDT (Snoqualmie_TIR_Mosaic_2021B.tif; Restivo and others, 2023), with a break in between acquisition times to refuel the helicopter. Both airborne TIR LTPs of the Middle Fork Snoqualmie River began upstream from the Goldmyer Hot Springs trailhead in Mount Baker-Snoqualmie National Forest, at RM 33.4 in the 2020 survey and RM 32.4 in the 2021 survey, at an approximate elevation of 1,900 ft, and ended just upstream from the North Fork Snoqualmie River confluence, at an approximate elevation of 410 ft. Water temperatures at the upstream end of the study area were 13.5 °C in the 2020 survey and 13.2 °C in the 2021 survey and remained relatively stable until about RM 27.8, varying from the temperature at the upstream end of this reach within +1.4 and ˗1.7 °C in the 2020 survey and within +1.8 and ˗0.3 °C in the 2021 survey. Water temperatures in the reach upstream from RM 27.8 were buffered by 16 persistent Lateral GW/Side Channel/Small Tributary STFs with mean temperatures below 13.5 °C in both surveys, as well as Burntboot Creek, which had a mean temperature of 11.6 °C in the 2020 survey and 13.0 °C in the 2021 survey.
Between RM 27.8 and 22.0, the Middle Fork Snoqualmie River warmed from 14.3 to 17.1 °C in the 2020 survey and from 14.2 to 18.0 °C in the 2021 survey, with a local maximum at RM 22.1 of 18.1 °C in the 2020 survey and 18.5 °C in the 2021 survey. In this reach, 24 persistent Lateral GW/Side Channel/Small Tributary STFs were identified, 5 of which had mean temperatures at or below 14.5 °C in both surveys. From RM 22 to RM 18 water temperatures were relatively stable, varying from the temperature at the upstream end of this reach within +0.5 and ˗0.7 °C in the 2020 survey and within +0.9 and ˗1.1 °C in the 2021 survey. Water temperatures in this reach were buffered by 15 persistent Lateral GW/Side Channel/Small Tributary STFs with mean water temperatures less than the water temperature at the upstream end of the overall study area, which was 17.1 °C in the 2020 survey and 18.0 °C in the 2021 survey, as well as by 7 persistent Hyporheic/Diffuse GW STFs. In both surveys the Taylor River had mean water temperatures at or slightly above the main channel temperatures, whereas Rainy Creek contributed colder water than that of the main channel.
Downstream from RM 18.0 the Middle Fork Snoqualmie River temperature increased at a fairly consistent gradient in both surveys, about 0.2 °C per river mile. The Pratt River joined near RM 16.8 with mean temperatures of 18.1 °C in the 2020 survey and 19.7 °C in the 2021 survey, and Granite Creek entered near RM 11.9 with mean temperatures of 14.1 °C in the 2020 survey and 16.2 °C in the 2021 survey. The Middle Fork Snoqualmie River left the National Forest near RM 8.8 and continued about 3 river miles through sparsely residential, forested land until reaching more densely developed suburban riverfront properties in historical Tanner, Washington. Between RM 14.6 and RM 5.7 there were 66 persistent Lateral GW/Side Channel/Small Trib STFs, 24 of which had mean temperatures below 17.0 °C in both surveys. However, between RM 5.7 and 2.1 there were no persistent Lateral GW/Side Channel/Small Trib STFs identified in either survey. The maximum temperatures in the Middle Fork Snoqualmie River airborne TIR LTPs were recorded in this reach, 20.8 °C at RM 2.1 in the 2020 survey and 22.0 °C at RM 4.5 in the 2021 survey.
Float Surveys
Skykomish River
Near-surface and near-bottom water temperatures from the 2020 Skykomish River float surveys corresponded to water temperature values recorded by instream thermistors within a maximum absolute difference of 0.5 °C. The near-surface and near-bottom adjusted average LTPs from the 2020 float surveys of the Skykomish River had similar temperature gradients compared to the LTP from the 2020 airborne TIR survey (fig. 6). The near-surface water temperature was on average 0.1 °C warmer than near-bottom water temperature measured at the same time and location (minimum difference = ˗0.9 °C, maximum difference = 1.1 °C), indicating streamflow was generally well-mixed during the survey. Near-surface temperatures were greater than 0.5 °C warmer than near-bottom temperatures around RM 5.19 and RM 17.96. Near-surface temperatures were briefly colder than near-bottom temperatures at the Sultan River confluence where the colder water from the Sultan River had not yet reached the deeper bottom of the Skykomish River.
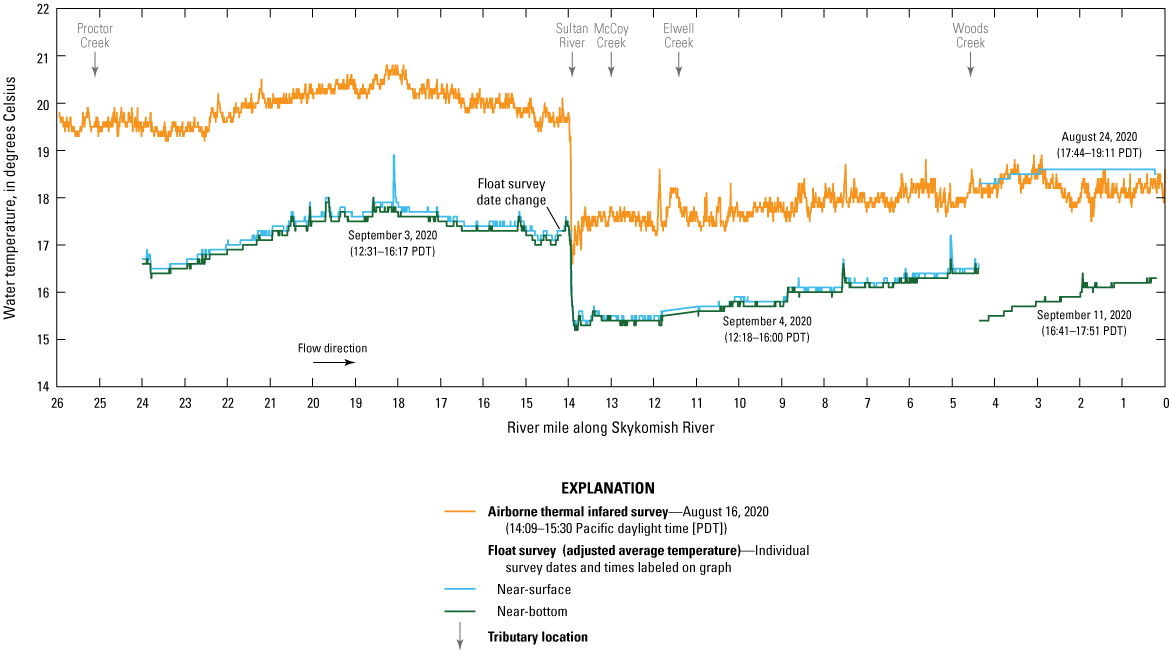
Comparison of longitudinal stream temperature profiles from the airborne thermal infrared survey (August 16, 2020) and float surveys (August 24−September 11, 2020) of the Skykomish River, Washington.
From the upstream end of the complete float survey study area to just upstream from the Sultan River confluence the adjusted average near-surface and near-bottom water temperatures increased by 0.6 °C. The highest near-surface and near-bottom adjusted average water temperatures for the study area, 18.9 and 18.0 °C, respectively, were recorded in Startup near the same locations as the highest temperatures in the airborne TIR LTPs.
The Sultan River contributed about 43 percent (441 ft3/s) of the combined streamflow of the Skykomish and Sultan Rivers during the Sept. 4, 2020, float survey, based on discharge data during the float survey from USGS streamgages 12138160 (Sultan River Below Powerplant Near Sultan, WA; USGS, 2023b) and 12134500 (Skykomish River Near Gold Bar, WA; USGS, 2023a). Assuming the Skykomish River was well-mixed in the float survey by 0.5 river miles downstream from the Sultan River confluence, as shown in the 2020 airborne TIR mosaic, the contribution of cold water from the Sultan River during the float survey effectively reduced water temperature in the Skykomish River by about 2.1 °C. From 0.5 river miles downstream from the Sultan River confluence to just upstream from Woods Creek adjusted average water temperatures increased by 1.2 °C, or about 0.4 °C every 3 river miles.
For the segment from Woods Creek to just upstream from the Snoqualmie River confluence, the near-surface and near-bottom float surveys had to be done on separate dates. The separate dates were because of the near-bottom sensor being lost during the Aug. 24 survey, the downstream-most instream thermistor being tampered with during the Sept. 4 survey, and the near-surface sensor malfunctioning during the Sept. 11 survey. In these final 4.4 river miles adjusted average temperatures increased by 0.2 °C in the near-surface survey and 0.9 °C in the near-bottom survey.
Middle Fork Snoqualmie River
Near-surface and near-bottom water temperatures from the Middle Fork Snoqualmie River float surveys corresponded to water temperature values recorded by instream thermistors within a maximum absolute difference of 1.1 °C for the 2020 surveys and within 0.4 °C for the 2021 survey. The near-surface and near-bottom adjusted average LTPs from the 2020 float surveys of the Middle Fork Snoqualmie River had similar temperature gradients compared to the LTP from the 2020 airborne TIR survey, except for the segment from RM 12.0 to RM 3.8. However, repeating the float survey for this segment on the same day as the 2021 airborne TIR survey yielded near-surface and near-bottom adjusted average LTPs that more closely resembled the 2021 airborne TIR LTP (fig. 7). Near-surface water temperature was on average 0.1 °C warmer than near-bottom water temperature measured at the same time and location (minimum difference = -0.1 °C, maximum difference = 0.8 °C), indicating a generally well-mixed channel. Near-surface temperatures were greater than 0.5 °C warmer than near-bottom temperatures around RMs 2.15, 14.38, and 17.63.
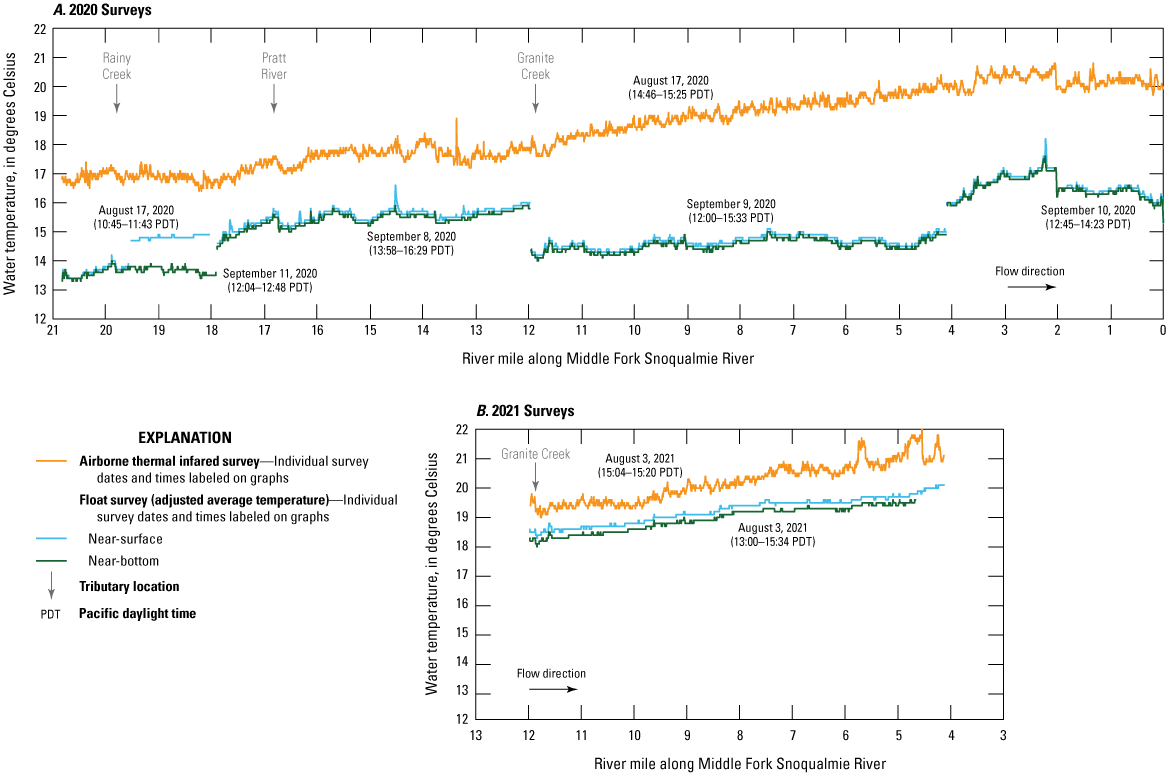
Comparison of longitudinal stream temperature profiles from A, the 2020 airborne thermal infrared survey (August 17, 2020) and float surveys (September 8−11, 2020) and B, the 2021 airborne thermal infrared survey and float survey (August 3, 2021) of the Middle Fork Snoqualmie River, Washington.
From the upstream end of the complete 2020 float survey study area at RM 20.8, adjusted average water temperatures rose slightly until cooling at Rainy Creek, and then remained relatively stable until the end of the segment at RM 17.6. The near-surface survey on this segment was conducted over two dates because of float sensor malfunction and tampering that occurred with instream thermistors.
The subsequent downstream segment of the 2020 float survey, from RM 17.6 to RM 11.8 (ending just upstream from Granite Creek), closely matches the LTP from the 2020 airborne survey, just offset by about ˗2.0 °C. Adjusted average water temperatures in this segment increased by about 1.4 °C total. A spike in water temperature was recorded at RM 14.38, corresponding to what seemed to be a warm eddy on the right bank in the 2020 airborne TIR imagery. A sudden decrease in adjusted average water temperature was recorded just downstream from the Pratt River, as shown in the 2020 airborne TIR LTP.
The 2020 float survey segment from RM 12.0 to RM 3.8 revealed a stable adjusted average thermal profile, warming only about 0.6 °C in 8.2 river miles. This segment’s stable thermal profile contrasted with the higher gradient of the 2020 airborne TIR LTP, which warmed by about 2.2 °C in the same reach. When the float survey for this segment was repeated on the same day as the 2021 airborne TIR survey, the float survey adjusted average LTP and the airborne TIR LTP both showed a total warming of 1.6 °C, most of which occurred downstream from RM 10.
In the downstream-most 2020 float survey segment adjusted average water temperatures increased by about 2.2 °C between RM 3.8 and RM 2.2, compared to about 0.8 °C of warming in the airborne TIR LTP. Adjusted average water temperatures then cooled by about 1.0 °C at the downstream end of a brief split in the channel from RM 2.2 to RM 2.0, coinciding with a persistent Hyporheic/Diffuse GW STF identified in the TIR imagery and a decrease in water temperature of about 0.9 °C in the 2020 airborne TIR LTP at the same location. Downstream from this split in the channel, adjusted average water temperatures stayed relatively stable in the remaining 2.0 river miles upstream from the North Fork Snoqualmie River confluence.
Discussion
Interannual Variation in Airborne TIR LTPs and Persistence of STFs
This study profiled water temperatures to identify significant thermal features in the rivers of interest and characterized the interannual variation of the thermal profiles, location tendencies, and interannual persistence of significant thermal features. The overall temperature gradients of airborne thermal infrared (TIR) longitudinal stream temperature profiles (LTPs) of the same river were similar in the 2020 and 2021 surveys. The water temperature offset between the 2020 and 2021 airborne TIR LTPs was mainly attributed to differences in air temperature and radiation on the day of, and a few days prior to, the surveys. Increasing and decreasing temperature gradients in the 2020 and 2021 airborne TIR LTPs tended to occur at near-parallel gradients over the same reaches, and abrupt changes in temperature were typically at the same locations. The magnitudes of temperature changes from major tributaries, such as the Sultan and South Fork Snoqualmie Rivers, were proportional to the mean temperature and percent contributing streamflow of those tributaries. Though this correlation was expected, it may be useful for resource managers to consider the case of the regulated Sultan River, whose effect in reducing temperatures persists throughout the rest of the Skykomish River, because water temperatures in this downstream reach seem to be buffered by the high number of Hyporheic/Diffuse groundwater (GW) STFs.
The thermal imagery mosaics showed where lateral, hyporheic, and diffuse groundwater flow tended to occur. Hyporheic flow was not commonly detected directly downstream from large woody debris, contrary to expectations, but there are some cases, such as at river mile (RM) 20.4 in the Snoqualmie River (fig. 8). However, large woody debris are known to promote hyporheic flow indirectly by increasing channel complexity and helping develop pools and riffles (Gippel, 1995; Abbe and Montgomery, 1996). Shade did not reduce water temperatures but did maintain the water temperature recorded just upstream from the shaded section, thus buffering against further heating as the water moved downstream. Because shade did not reduce water temperatures, it is unlikely that shaded sections of the river were misclassified as Hyporheic/Diffuse GW STFs.
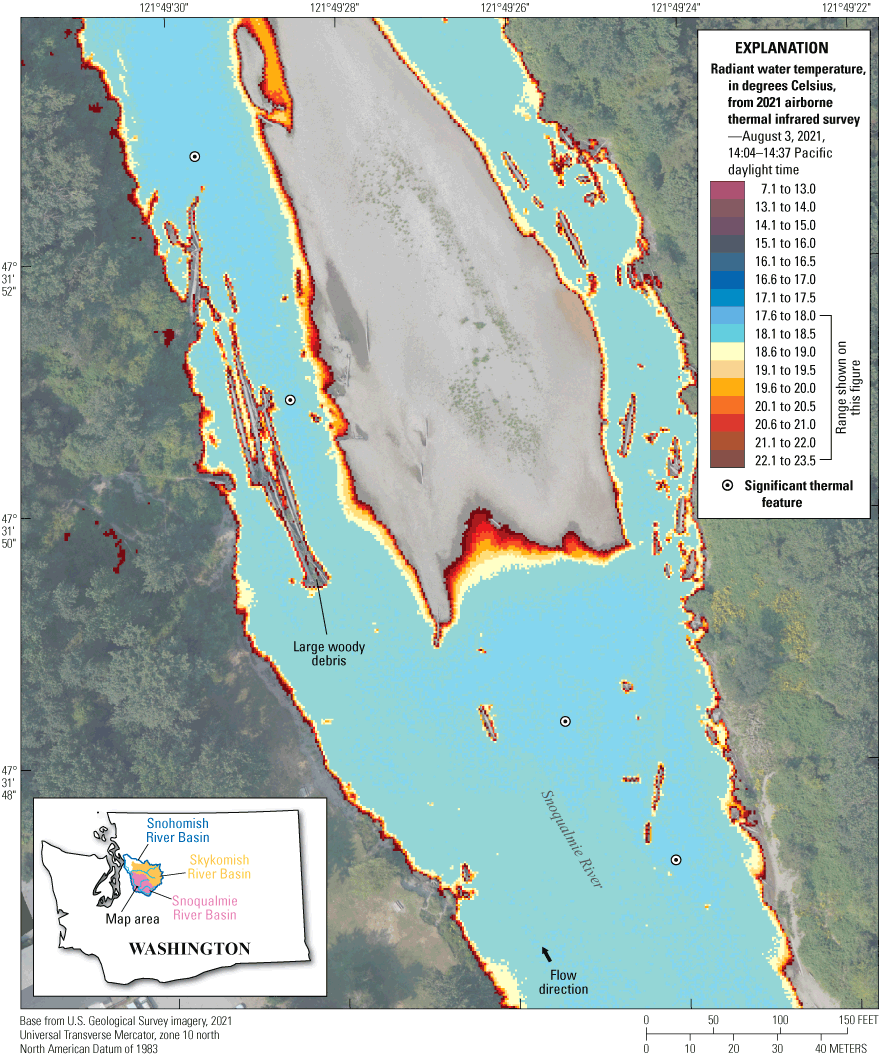
Radiant water temperatures and true-color red, green, blue imagery at river mile 20.4 from the airborne thermal infrared survey of the Snoqualmie River, Washington, August 3, 2021 (14:04–14:37 Pacific daylight time).
Hyporheic flow was commonly detected at the downstream end of a riffle, such as at RM 13.3 in the Middle Fork Snoqualmie River (fig. 9). However, dispersed cold-water anomalies on the upstream approach to a riffle were often assumed to be slightly stratified colder water already in the channel at shallower depths being forced to the surface, where it was detected by the thermal imagery as the channel became shallower, and were thus not counted as STFs (which are defined in this study as external sources). For example, in the case of Snoqualmie Falls, a geological pinch-out, the cold-water anomalies recorded just upstream from the falls were assumed to be colder water from sources farther upstream that had traveled along the bottom the river and was then forced to the surface as the river went over the falls (fig. 10). Farther upstream from Snoqualmie Falls, between the Three Forks Confluence and Kimball Creek, there were many persistent cold-water anomalies that were likely forced into the channel as depth to bedrock decreased in the approach to the falls. These anomalies were counted as STFs because they were likely hydraulically connected to Meadowbrook Slough and Borst Lake (external sources). Though true-color red, green, blue (RGB) imagery helped in assessing channel depths in the upstream approach to riffles and the falls, more information on channel bathymetry, substrate, and basin geology would help such determinations, as well as interpreting and classifying other STFs identified in the TIR imagery.
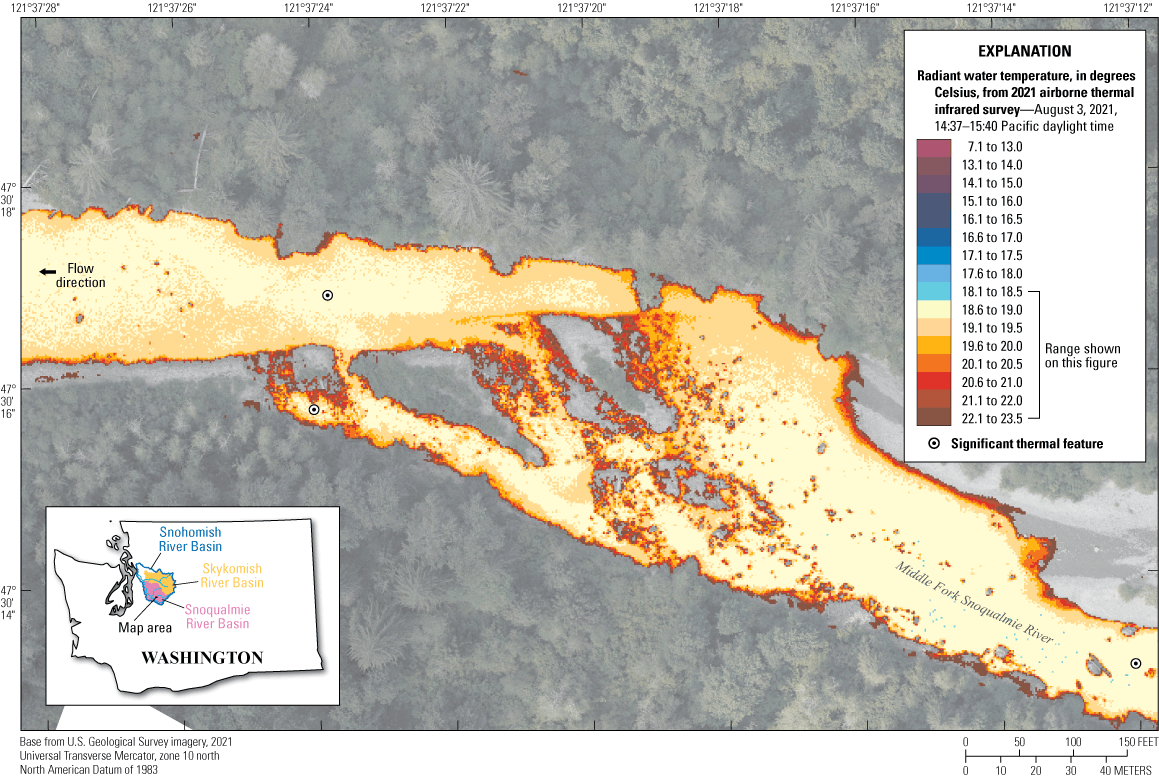
Radiant water temperatures and true-color red, green, blue imagery at river mile 13.3 from the airborne thermal infrared survey of the Middle Fork Snoqualmie River, Washington, August 3, 2021.
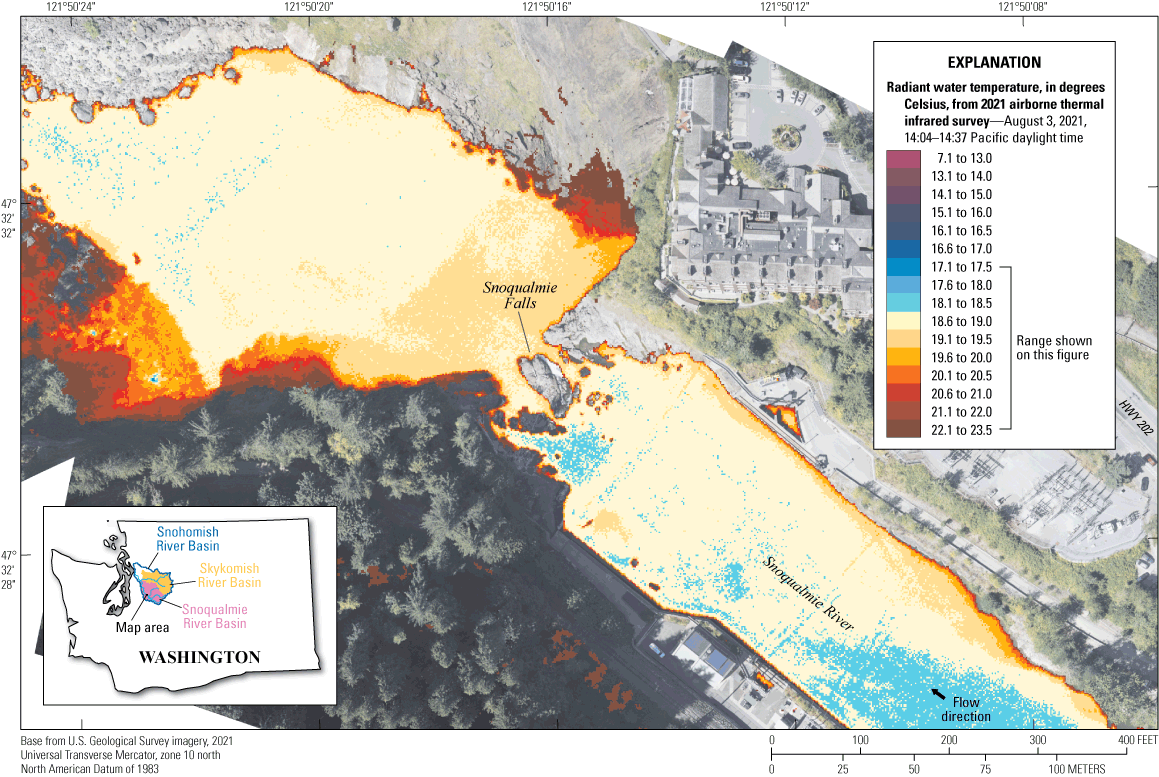
Radiant water temperatures and true-color red, green, blue imagery of Snoqualmie Falls from the airborne thermal infrared survey of the Snoqualmie River, Washington, August 3, 2021.
Several features outside of the wetted channel that were likely stranded lateral or diffuse groundwater flows were identified using only the RGB imagery, though these features were not included as STFs. Such features were identified by water flowing downstream from otherwise dry cobble surroundings, such as at the confluence of a dry side channel near RM 21 on the Skykomish River (fig. 11), or by a patch of vegetation growing in cobbles near otherwise non-vegetated cobbles.
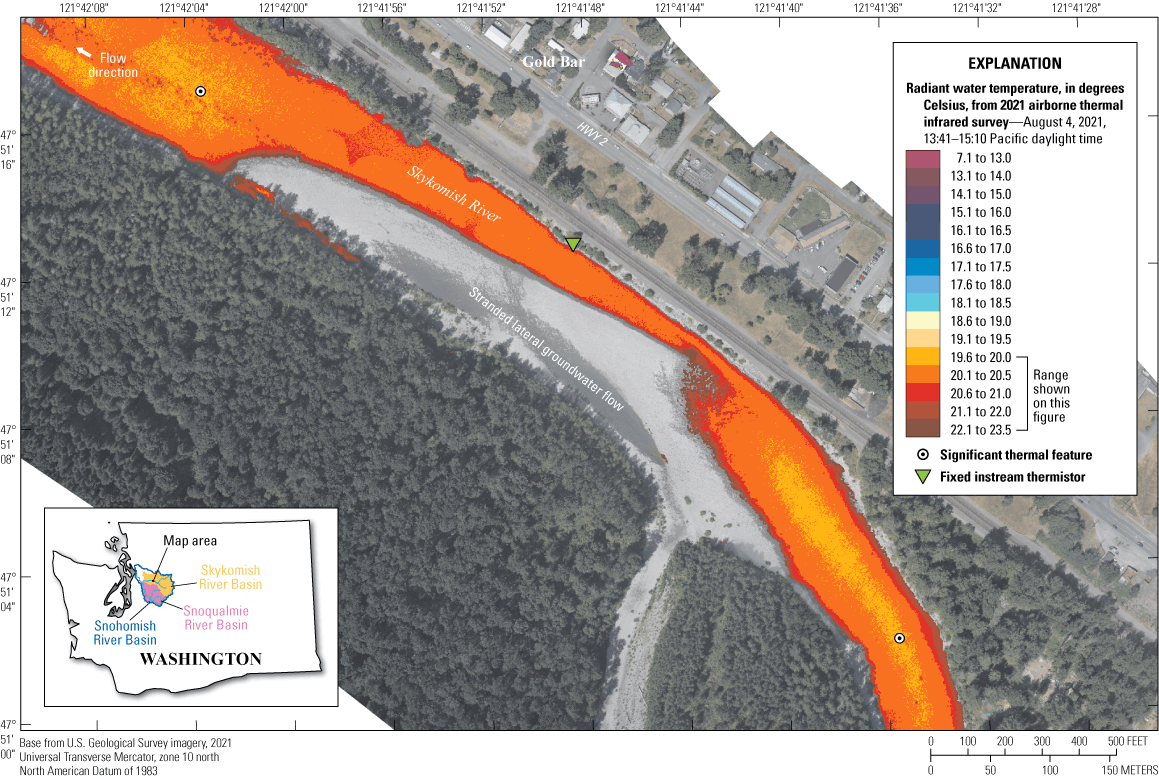
Radiant water temperatures and true-color red, green, blue imagery near river mile 21 from the airborne thermal infrared survey of the Skykomish River, Washington, August 4, 2021 (13:41–15:10 Pacific daylight time).
Interannual persistence was detected in 36.4 to 61.3 percent of Lateral GW/Side Channel/Small Trib STFs, depending on the river surveyed, and in 14.8 to 28.7 percent of Hyporheic/Diffuse GW STFs. However, the inability to detect STFs in one year’s TIR mosaic does not necessarily imply that they were not present at the time of the survey. STFs may not have been sufficiently expressed at the water’s surface to be detected by the TIR survey method. It is possible that additional STFs may be identified in a finer color scale than 0.5 °C intervals. Also, dense or broad canopy cover at river edges likely obscured lateral groundwater flows that may have been present, thus preventing them from being identified.
Comparisons between radiometrically calibrated temperatures in the TIR imagery mosaics and the recorded temperatures from instream thermistors yielded mean absolute errors between 0.2 and 0.9 °C, which may be interpreted as the overall accuracy of those surveys. The main source of this error is likely the uncertainty in the surveyed global positioning system (GPS) location of the instream thermistor, taken using a relatively low-accuracy handheld GPS device, because variations in water temperature were exhibited in the TIR imagery over shorter distances than the horizontal accuracy of the GPS device. The surveyed locations of some thermistors were slightly adjusted to allow for sampling pixels where water was visible, which may have introduced further error. Therefore, the accuracy of radiometrically calibrated water temperatures in the TIR mosaics could have been improved by surveying each instream thermistor location more accurately using real-time kinematic positioning, though doing so would have been more time intensive. Photos of the thermistor placements would have also been helpful in informing adjustments needed to their position in the RGB and TIR mosaics.
Some stakeholders of this study expressed interest in using the airborne TIR imagery to locate possible geothermal inflows to the upper Middle Fork Snoqualmie River, because these inflows would have a higher radiant temperature than the surrounding cold water. However, locating geothermal inflows was unsuccessful because the river’s edges are typically warm because they tend to be shallow and relatively slow or contain eddies, making them thermally indistinguishable from warm water from a geothermal source. Such geothermal features are best detected by performing the TIR survey at night in the fall or winter with a snow-free ground and clear skies.
Float Survey Adjusted Average LTP Comparisons
This study used a novel method of processing float survey data to adjust for diurnal heating and compute a five-point centered moving average, which allowed for improved comparison of the results from this float survey method with the airborne TIR survey methods. The Skykomish River 2020 float survey adjusted average LTPs correlated with the 2020 airborne TIR LTP (fig. 6), and differences in temperature gradient were likely a function of the surveys being performed (1) under different streamflow conditions, which would change the magnitude of effective temperature changes from STFs, and (2) under different radiation and shading conditions, from the changing daily course of the sun.
This difference in temperature gradient was especially notable when comparing the Middle Fork Snoqualmie River 2020 float survey adjusted average LTPs to the 2020 airborne TIR survey LTP between RM 11.96 and RM 3.76, with the float survey done 23 days after the airborne TIR survey (fig. 7A). Interestingly, other Middle Fork Snoqualmie River 2020 float survey segments performed 22 to 25 days after the airborne TIR survey yielded adjusted average LTPs that were similar in temperature gradient to the 2020 airborne TIR LTP. One possible explanation for this discrepancy is that the surrounding topography in the segment from RM 11.96 to RM 3.76 played a bigger role in shading the river in mid-September than in mid-August due to changes in the sun’s ecliptic, and that this difference in topographic shading over time was not as significant in the other segments.
Supporting this explanation is the comparison between LTPs for this same segment on the Middle Fork Snoqualmie River from when the float survey and airborne TIR survey were performed on the same day, Aug. 3, 2021 (fig. 7B). Though this same-day comparison shows a small offset in water temperature between the float survey adjusted average LTP and the airborne TIR survey LTP, this offset is primarily because the two surveys were at different times of the day and under different water temperature conditions. The float survey on Aug. 3, 2021, began at 13:00 Pacific daylight time (PDT), and the adjustments made to downstream points to subtract the estimated temperature increase caused by diurnal heating attempted to achieve a synoptic view, or “snapshot in time,” of water temperature in the surveyed reach, as if all points were measured at 13:00 PDT. The airborne TIR survey of this reach on Aug. 3, 2021, was later in the day (15:04–15:20 PDT), when water temperatures were higher than at 13:00 PDT.
The water temperature offset in the same-day comparison (fig. 7B) was not due to errors associated with the calibration of the sensors used in the float surveys nor the radiometric calibration of the airborne TIR imagery. The radiometric calibration of the TIR imagery relied on the same instream sensors used to verify the accuracy of near-surface and near-bottom temperatures from the float survey. The 2021 Middle Fork Snoqualmie River float survey temperatures were within 0.4 °C of corresponding instream thermistor temperatures. Calibrated radiant temperatures from the 2021 airborne TIR survey of this same segment were within 0.5 °C of corresponding instream thermistor temperatures.
Some differences in profile temperature gradients between the float survey adjusted average LTPs and the airborne TIR survey LTPs can be explained by the float survey courses differing from the river centerlines used to produce the airborne TIR survey LTPs. For example, at the split section of the Skykomish River from RM 11.9 to RM 10.8, the float survey measured the right channel, whereas the river centerline for the airborne TIR LTP was made through the left channel, which passes by Elwell Creek, a source of warmer water. Similarly, spikes in water temperature recorded in the Skykomish River float surveys at RM 7.75 and RM 5.19 seemed to be located at warm eddies in the TIR imagery that were avoided when drawing the river centerline for the airborne TIR LTP.
The float surveys followed a single course longitudinally downstream targeting the thalweg, thus missing STFs close to the banks that may not have had a significant enough effect on mixed temperatures for their localization but may still be important from an aquatic habitat perspective. The float survey water temperature adjustment relied on the average rate of afternoon heating during the float survey at the two in-stream thermistors bounding each survey segment and assumed that each float survey location in between those thermistors heated at that same rate. This assumption was likely invalid for near-bottom readings in deep pools, and for points in between the thermistors that had different characteristics affecting the heat exchange. For example, the two bounding thermistors may have been deployed in a segment where hyporheic flow or high levels of effective shade buffered the diurnal rate of change in water temperature, whereas other locations in between those thermistors may not have had much hyporheic flow or effective shade and would thus have had a higher rate of afternoon heating. The biggest challenge for conducting the float surveys in these steep rivers with cobble and boulder substrates was keeping the sensors and GPS units from becoming damaged or lost during the survey, particularly when going through shallow reaches and rapids. Therefore, backup, or secondary sensors are recommended.
Conclusions
High-resolution airborne thermal infrared (TIR) and true-color red, green, blue (RGB) imagery was effective in profiling late-summer water temperatures in the Skykomish, Snoqualmie, and Middle Fork Snoqualmie Rivers. This imagery was also useful in locating, classifying, and evaluating the interannual persistence of significant thermal features within these rivers. The thermal profiles of radiant water temperatures from the airborne TIR surveys of each river had similar temperature gradients in the 2020 and 2021 surveys. Increasing and decreasing gradients in temperature tended to be nearly parallel over the same reaches, and abrupt changes in temperature were typically identified at the same locations. Plotting the mean temperature, classification, and interannual persistence of significant thermal features (STFs) along the airborne TIR longitudinal stream temperature profiles (LTPs) facilitated interpretations of the general influence of these features on mean river temperatures.
One key advantage of airborne TIR surveys over float surveys is that airborne TIR surveys may precisely locate STFs over long distances, during a short survey duration, and in areas inaccessible to most watercraft. Still, this study showed that float surveys were effective in profiling late-summer water temperatures in the Skykomish and Middle Fork Snoqualmie Rivers, yielding comparable results to the thermal profiles derived from the airborne TIR surveys when adjusted for diurnal heating. Differences in the thermal profiles from the TIR and float surveys were because these surveys were during different streamflow, radiation, and shading conditions. These differences were particularly notable when comparing the Middle Fork Snoqualmie River 2020 float survey adjusted average LTPs to the 2020 airborne TIR LTP for the segment from RM 12.0 to RM 3.8 (from Granite Creek to historical Tanner, Washington). When this segment was float-surveyed on the same day as the 2021 airborne TIR survey, the resulting near-surface and near-bottom adjusted average LTPs were nearly parallel to the LTP resulting from the airborne TIR survey. The consistency between these LTPs supports the validity of this novel method of processing float survey data.
References Cited
Abbe, T.B., and Montgomery, D.R., 1996, Large woody debris jams, channel hydraulics, and habitat formation in large rivers: Regulated Rivers, v. 12, nos. 2–3, p. 201–221, accessed May 22, 2023, at https://doi.org/10.1002/(SICI)1099-1646(199603)12:2/3%3C201::AID-RRR390%3E3.0.CO;2-A.
Adams, T.N., and Sullivan, K., 1989, The physics of forest stream heating—A simple model: Weyerhaeuser Research Report TFW-WQ3-90-007, accessed December 15, 2022, at https://geo.nwifc.org/CMER/PublicDocs/TFWDocs/TFW_WQ3_90_007%20The%20Physics%20of%20Forest%20Stream%20Heating%20A%20simple%20Model.pdf.
Agisoft, 2021, Metashape—Process digital images and generate 3D spatial data, version 1.7.4: Agisoft software release, accessed August 28, 2021, at https://www.agisoft.com/downloads/installer/.
Beauchamp, D.A., 2009, Bioenergetic ontogeny—Linking climate and mass-specific feeding to life-cycle growth and survival of salmon, in Krueger, C.C., and Zimmerman, C.E., eds., Pacific Salmon—Ecology and management of western Alaska’s Populations: American Fisheries Society Symposium 70: Bethesda, Maryland, American Fisheries Society, p. 53–72.
Bethel, J., 2004, An overview of the geology and geomorphology of the Snoqualmie River watershed: King County Department of Natural Resources and Parks Water and Land Resources Division, accessed March 2, 2023, at https://your.kingcounty.gov/dnrp/library/2004/kcr1833.pdf.
Curtis, J.A., Torgersen, C.E., Diabat, M., Mejia, F.H., Marcelli, M.F., Burns, E.R., Wheelock, S.J., and Slotke, A., 2021, Airborne thermal infrared imagery and longitudinal stream temperature profiles, Hat Creek, California, August 2018: U.S. Geological Survey data release, accessed December 15, 2022, at https://doi.org/10.5066/P9DMJYT7.
Dugdale, S.J., 2016, A practitioner’s guide to thermal infrared remote sensing of rivers and streams—Recent advances, precautions and considerations: WIREs Water, v. 3, no. 2, p. 251–268, accessed December 13, 2022, at https://doi.org/10.1002/wat2.1135.
Dugdale, S.J., Bergeron, N.E., and St-Hilaire, A., 2013, Temporal variability of thermal refuges and water temperature patterns in an Atlantic salmon river: Remote Sensing of Environment, v. 136, p. 358–373, accessed December 15, 2022, at https://doi.org/10.1016/j.rse.2013.05.018.
Dugdale, S.J., Bergeron, N.E., and St-Hilaire, A., 2015, Spatial distribution of thermal refuges analysed in relation to riverscape hydromorphology using airborne thermal infrared imagery: Remote Sensing of Environment, v. 160, p. 43–55, accessed December 12, 2022, at https://doi.org/10.1016/j.rse.2014.12.021.
Esri, 2021, ArcGIS Desktop, version 10.8.1: Esri software release, accessed October 4, 2021, at https://www.esri.com/en-us/arcgis/products/arcgis-desktop/overview.
Esri, 2022, ArcGIS Pro, version 3.0.2: Esri software release, accessed September 22, 2022, at https://www.esri.com/en-us/arcgis/products/arcgis-pro/overview.
FLIR Systems, 2020, FLIR ResearchIR Max, version 4.40.11.35: FLIR Systems software release, accessed October 15, 2021, at https://support.flir.com/SwDownload/app/RssSWDownload.aspx?ID=12401.
Fullerton, A.H., Torgersen, C.E., Lawler, J.J., Faux, R.N., Steel, E.A., Beechie, T.J., and Leibowitz, S.G., 2015, Rethinking the longitudinal stream temperature paradigm—Region-wide comparison of thermal infrared imagery reveals unexpected complexity of river temperatures: Hydrological Processes, v. 29, no. 22, p. 4719–4737, accessed December 15, 2022, at https://doi.org/10.1002/hyp.10506.
Fullerton, A.H., Sun, N., Baerwalde, M.J., Hawkins, B.L., and Yan, H., 2022, Mechanistic simulations suggest riparian restoration can partly counteract climate impacts to juvenile salmon: Journal of the American Water Resources Association, v. 58, no. 4, p. 525–546, accessed April 24, 2023, at https://doi.org/10.1111/1752-1688.13011.
Gendaszek, A.S., and Appel, M., 2021, Thermal heterogeneity and cold-water anomalies within the lower Yakima River, Yakima and Benton Counties, Washington: U.S. Geological Survey Scientific Investigations Report 2021–5140, 43 p., accessed December 15, 2022, at https://doi.org/10.3133/sir20215140.
Gippel, C.J., 1995, Environmental hydraulics of large woody debris in streams and rivers: Journal of Environmental Engineering, v. 121, no. 5, p. 388–395, accessed May 22, 2023, at https://doi.org/10.1061/(ASCE)0733-9372(1995)121:5(388).
Herrera Environmental Consultants, 2013, Geomorphic assessment—Middle Fork Snoqualmie River Tanner to Three Forks natural area: King County Department of Natural Resources and Parks, River and Floodplain Management Section, accessed January 13, 2023, at https://your.kingcounty.gov/dnrp/library/water-and-land/flooding/capital-projects/middle-fork-snoqualmie/geomorphic-assessment-characterization-middle -fork-snoqualmie-river-tanner-to-three-forks-natural-area-june-2013.pdf.
Inslee, J., 2018, Executive Order 18-02—Southern Resident killer whale recovery and task force: State of Washington Office of the Governor, accessed January 28, 2023, at https://governor.wa.gov/sites/default/files/exe_order/eo_18-02_1.pdf.
Isaak, D.J., Ramsey, K., Chatel, J.C., Konnoff, D.L., Gecy, R.A., and Horan, D., 2017, Climate change, fish, and aquatic habitat in the Blue Mountains, chap. 5 of Halofsky, J.E., and Peterson, D.L., eds., Climate change vulnerability and adaptation in the Blue Mountains. Gen. Tech. Rep. PNW-GTR-939: Portland, Oregon, U.S. Department of Agriculture, Forest Service, Pacific Northwest Research Station, p. 91–148.
Joy, J., 1994, Snoqualmie River total maximum daily load study: Washington Department of Ecology, no. 94-71, 42 p., accessed December 22, 2022, at https://fortress.wa.gov/ecy/publications/documents/9471.pdf.
Kaje, J., 2009, Snoqualmie watershed water quality synthesis report: Snoqualmie Watershed Forum and King County’s Department of Natural Resources and Parks, 117 p., accessed January 10, 2023, at https://www.govlink.org/watersheds/7/pdf/snoqualmie_water_quality_synthesis_report_body.pdf.
Kubo, J., and leDoux, B., 2016, Hot water and low flow—The summer of 2015 in the Snoqualmie River watershed: Snoqualmie Watershed Forum & King County’s Department of Natural Resources and Parks, 96 p., accessed December 13, 2022, at https://your.kingcounty.gov/dnrp/library/2016/kcr2750/kcr2750-txt.pdf.
Kurylyk, B.L., MacQuarrie, K.T.B., Linnansaari, T., Cunjak, R.A., and Curry, R.A., 2015, Preserving, augmenting, and creating cold-water thermal refugia in rivers—Concepts derived from research on the Miramichi River, New Brunswick (Canada): Ecohydrology, v. 8, no. 6, p. 1095–1108, accessed April 24, 2023, at https://doi.org/10.1002/eco.1566.
Mastin, M.C., Konrad, C.P., Veilleux, A.G., and Tecca, A.E., 2016, Magnitude, frequency, and trends of floods at gaged and ungaged sites in Washington, based on data through water year 2014 (ver 1.1, October 2016): U.S. Geological Survey Scientific Investigations Report 2016–5118, 70 p, accessed March 8, 2023, at https://doi.org/10.3133/sir20165118.
Mantua, N., Tohver, I., and Hamlet, A., 2010, Climate change impacts on streamflow extremes and summertime stream temperature and their possible consequences for freshwater salmon habitat in Washington State: Climatic Change, v. 102, nos. 1–2, p. 187–223, accessed January 28, 2023, at https://doi.org/10.1007/s10584-010-9845-2.
Moore, R.D., Spittlehouse, D., and Story, A., 2005, Riparian microclimate and stream temperature response to forest harvesting—A review: Journal of the American Water Resources Association, v. 41, no. 4, p. 813–834, accessed December 18, 2022, at https://www.researchgate.net/publication/227520556_Riparian_Microclimate_and_Stream_Temperature_Response_to_Forest_Harvesting_A_Review.
Mote, P.W., Li, S., Lettenmaier, D.P., Xiao, M., and Engel, R., 2018, Dramatic declines in snowpack in the western US: Climate and Atmospheric Science, v. 1, 6 p., accessed January 28, 2023, at https://www.nature.com/articles/s41612-018-0012-1.
Onset, 2019, HOBOware Pro—Software for HOBO Dataloggers and Devices, version 3.7.17: Onset software release, accessed February 16, 2021, at https://www.onsetcomp.com/products/software/hoboware.
Onwumere, G., and Batts, D., 2004, Quality assurance project plan—Snoqualmie River total maximum daily load effectiveness evaluation: Washington Department of Ecology, Publication No. 04-03-201, 39 p., accessed January 20, 2023, at https://apps.ecology.wa.gov/publications/documents/0403201.pdf.
RStudio Team, 2021, RStudio—Integrated Development for R, version 1.4.1106 (Tiger Daylily): RStudio software release, accessed February 21, 2021, at https://cran.rstudio.com/ and https://posit.co/download/rstudio-desktop/.
R Core Team, 2019, R—A language and environment for statistical computing, version 3.6.0 (Planting of a Tree): R Foundation for Statistical Computing software release, accessed April 26, 2019, at https://www.r-project.org/ and https://cran.r-project.org/src/base/R-3/.
Restivo, D.E., Diabat, M., Miwa, C., Bright, V.A.L., Seguin, C.M., Boucher, C.D., David, J.E., and Pouley, M., 2023, Water Temperature Mapping of the Skykomish, Snoqualmie, and Middle Fork Snoqualmie Rivers, Washington—Longitudinal Stream Temperature Profiles, Significant Thermal Features, and Airborne Thermal Infrared and RGB Imagery Mosaics: U.S. Geological Survey data release, https://doi.org/10.5066/P9FJCM8N.
Richter, A., and Kolmes, S.A., 2005, Maximum Temperature Limits for Chinook, Coho, and Chum Salmon, and Steelhead Trout in the Pacific Northwest: Reviews in Fisheries Science, v. 13, no. 1, p. 23–49, accessed January 28, 2023, at https://doi.org/10.1080/10641260590885861.
Snohomish County Surface Water Management and the Sustainable Lands Survey Executive Committee [SWM], 2017, Lower Skykomish River Reach-scale Plan: Snohomish County Department of Public Works and the Executive Committee of the Sustainable Lands Strategy, 119 p., accessed January 25, 2023, at https://salishsearestoration.org/images/c/cf/SnoCo_2017_lower_skykomish_reach_scale_plan.pdf.
Solomon, F., and Boles, M., 2002, Snoqualmie Watershed Aquatic Habitat Conditions Report—Summary of 1999-2001 Data: King County Department of Natural Resources and Parks, 80 p., accessed December 15, 2022, at https://your.kingcounty.gov/dnrp/library/2002/kcr1212.pdf.
Stohr, A., Kardouni, J., and Svrjcek, R., 2011, Snoqualmie River Basin temperature total maximum daily load—Water quality improvement report and implementation plan: Washington Department of Ecology, 210 p., accessed December 12, 2022, https://apps.ecology.wa.gov/publications/documents/1110041.pdf.
Sun, N., Yearsley, J., Voisin, N., and Lettenmaier, D.P., 2015, A spatially distributed model for the assessment of land use impacts on stream temperature in small urban watersheds: Hydrological Processes, v. 29, no. 10, p. 2331–2345, accessed December 22, 2022, at https://doi.org/10.1002/hyp.10363.
Svrjcek, R., King, A., Steg, R., Sievers, M., and O’Donnell, J., 2013, Skykomish River Temperature Total Maximum Daily Load Development—Water Quality Study Design (Quality Assurance Project Plan): Washington Department of Ecology, Publication No. 13-03-104, 87 p., accessed December 15, 2022, at https://fortress.wa.gov/ecy/publications/documents/1303104.pdf.
Trimble, 2023a, Applanix POSPac MMS—GNSS/INS Direct Georeferencing software for air, land, and marine applications, version 8.4: Trimble Applanix software release, accessed October 15, 2021, at https://www.applanix.com/products/pospac-mms.htm.
Trimble, 2023b, Inpho—Advanced aerial photogrammetry, version 10.1: Trimble Geospatial software release, accessed October 15, 2021, at https://geospatial.trimble.com/products-and-solutions/trimble-inpho.
Tonolla, D., Wolter, C., Ruhtz, T., and Tockner, K., 2012, Linking fish assemblages and spatiotemporal thermal heterogeneity in a river-floodplain landscape using high-resolution airborne thermal infrared remote sensing and in-situ measurements: Remote Sensing of Environment, v. 125, p. 134–146, accessed January 20, 2023, at https://doi.org/10.1016/j.rse.2012.07.014.
Torgersen, C.E., Faux, R.N., McIntosh, B.A., Poage, N.J., and Norton, D.J., 2001, Airborne thermal remote sensing for water temperature assessment in rivers and streams: Remote Sensing of Environment, v. 76, no. 3, p. 386–398, accessed January 16, 2023, at https://doi.org/10.1016/S0034-4257(01)00186-9.
TWC Product and Technology, 2023a, Weather history for KWACARNA1: TWC Product and Technology database, accessed December 22, 2022, at https://www.wunderground.com/dashboard/pws/KWACARNA1.
TWC Product and Technology, 2023b, Weather history for KWAGOLDB15: TWC Product and Technology database, accessed December 22, 2022, at https://www.wunderground.com/dashboard/pws/KWAGOLDB15.
TWC Product and Technology, 2023c, Weather history for KWAMONRO11: TWC Product and Technology database, accessed December 22, 2022, at https://www.wunderground.com/dashboard/pws/KWAMONRO11.
TWC Product and Technology, 2023d, Weather history for KWANORTH112: TWC Product and Technology database, accessed December 22, 2022, at https://www.wunderground.com/dashboard/pws/KWANORTH112.
TWC Product and Technology, 2023e, Weather history for KWASNOQU73: TWC Product and Technology database, accessed December 22, 2022, at https://www.wunderground.com/dashboard/pws/KWASNOQU73.
U.S. Census Bureau, 2020, Decennial Census of Population and Housing Datasets: U.S. Census Bureau web interface, accessed May 22, 2023, at https://www.census.gov/programs-surveys/decennial-census/data/datasets.html.
U.S. Fish and Wildlife Service, 2022, Environmental conservation online system—FWS-listed U.S. Species by taxonomic group—All animals; U.S. Fish and Wildlife Service database, accessed December 15, 2022, https://ecos.fws.gov/ecp/report/species-listings-by-tax-group?statusCategory=Listed&groupName=All%20Animals.
U.S. Geological Survey (USGS), 2023a, USGS 12134500 Skykomish River Near Gold Bar, WA, in USGS water data for the Nation: U.S. Geological Survey National Water Information System database, accessed March 8, 2023, at https://doi.org/10.5066/F7P55KJN. [Site information directly accessible at https://waterdata.usgs.gov/nwis/uv?site_no=12134500&legacy=1.]
U.S. Geological Survey (USGS), 2023b, USGS 12138160 Sultan River Below Powerplant Near Sultan, WA, in USGS water data for the Nation: U.S. Geological Survey National Water Information System database, accessed March 8, 2023, at https://doi.org/10.5066/F7P55KJN. [Site information directly accessible at https://waterdata.usgs.gov/nwis/uv?site_no=12138160&legacy=1.]
U.S. Geological Survey (USGS), 2023c, USGS 12141300 Middle Fork Snoqualmie River Near Tanner, WA, in USGS water data for the Nation: U.S. Geological Survey National Water Information System database, accessed March 8, 2023, at https://doi.org/10.5066/F7P55KJN. [Site information directly accessible at https://waterdata.usgs.gov/nwis/uv?site_no=12141300&legacy=1.]
U.S. Geological Survey (USGS), 2023d, USGS 12142000 NF Snoqualmie River Near Snoqualmie Falls, WA, in USGS water data for the Nation: U.S. Geological Survey National Water Information System database, accessed March 8, 2023, at https://doi.org/10.5066/F7P55KJN. [Site information directly accessible at https://waterdata.usgs.gov/nwis/uv?site_no=12142000&legacy=1.]
U.S. Geological Survey (USGS), 2023e, USGS 12144500 Snoqualmie River Near Snoqualmie, WA, in USGS water data for the Nation: U.S. Geological Survey National Water Information System database, accessed March 8, 2023, at https://doi.org/10.5066/F7P55KJN. [Site information directly accessible at https://waterdata.usgs.gov/nwis/uv?site_no=12144500&legacy=1.]
U.S. Geological Survey (USGS), 2023f, USGS 12149000 Snoqualmie River Near Carnation, WA, in USGS water data for the Nation: U.S. Geological Survey National Water Information System database, accessed March 8, 2023, at https://doi.org/10.5066/F7P55KJN. [Site information directly accessible at https://waterdata.usgs.gov/nwis/uv?site_no=12149000&legacy=1.]
U.S. Geological Survey (USGS), 2023g, USGS 12144000 SF Snoqualmie River at North Bend, WA, in USGS water data for the Nation: U.S. Geological Survey National Water Information System database, accessed March 8, 2023, at https://doi.org/10.5066/F7P55KJN. [Site information directly accessible at https://waterdata.usgs.gov/nwis/uv?site_no=12144000&legacy=1.]
Vaccaro, J.J., and Maloy, K.J., 2006, A method to thermally profile long river reaches to identify potential areas of ground-water discharge and preferred salmonid habitat: U.S. Geological Survey Scientific Investigations Report 2006–5136, 16 p. [Also available online at https://pubs.usgs.gov/sir/2006/5136/]
Vaccaro, J.J., Keys, M.E., Julich, R.J., and Welch, W.B., 2008, Thermal profiles for selected river reaches in the Yakima River Basin, Washington: U.S. Geological Survey Data Series 342. [Also available online at https://pubs.usgs.gov/ds/342].
Wagner, R.J., Boulger, R.W., Jr., Oblinger, C.J., and Smith, B.A., 2006, Guidelines and standard procedures for continuous water-quality monitors—Station operation, record computation, and data reporting: U.S. Geological Survey Techniques and Methods 1–D3, 51 p. plus 8 attachments; accessed December 15, 2022, at https://pubs.water.usgs.gov/tm1d3.
Washington Department of Ecology, 2007, Modeling the effects of riparian buffer width on effective shade and stream temperature: Washington Department of Ecology, 64 p., accessed December 12, 2022, https://apps.ecology.wa.gov/publications/documents/0703028.pdf.
Washington Department of Ecology, 2020, Fresh water designated uses and criteria, sec. 200 of Water Quality Standards for Surface Waters in the State of Washington: Washington Administrative Code, title 173, pt. II, accessed December 15, 2022, at https://app.leg.wa.gov/WAC/default.aspx?cite=173-201A.
Washington Department of Ecology, 2023, Water temperature mapping in the Snoqualmie and Skykomish River Basins (Study ID WQC-2020-00164): Environmental Information Management System, accessed December 8, 2023, at https://apps.ecology.wa.gov/eim/search/Detail/Detail.aspx?DetailType=Study&SystemProjectId=99972583.
Washington Department of Fish and Wildlife, 2023, Puget Sound indicators—Number of natural origin Chinook salmon on spawning grounds: Puget Sound Partnership web page, accessed May 22, 2023, at https://www.pugetsoundinfo.wa.gov/Indicator/Detail/4/VitalSigns.
Washington State Code Reviser, 1999, Chapter 79.72 RCW Dispositions—Scenic River Systems: Statute Law Committee, accessed January 28, 2023, at https://apps.leg.wa.gov/rcw/dispo.aspx?Cite=79.72.
Wilde, F.D., 2006, Temperature: U.S. Geological Survey Techniques of Water-Resources Investigations, book 9, chap. 6.1, accessed December 22, 2022, at https://doi.org/10.3133/twri09A6.1.
Wuebbles, D.J., Fahey, D.W., Hibbard, K.A., DeAngelo, B., Doherty, S., Hayhoe, K., Horton, R., Kossin, J.P., Taylor, P.C., Waple, A.M., and Weaver, C.P., 2017, Executive summary, in Wuebbles, D.J., D.W. Fahey, K.A. Hibbard, D.J. Dokken, B.C. Stewart, and Maycock, T.K., eds., Climate science special report—Fourth National climate assessment—Volume I: U.S. Global Change Research Program, p. 12–34, accessed January 20, 2023, at https://science2017.globalchange.gov/chapter/executive-summary/.
Yan, H., Sun, N., Fullerton, A., and Baerwalde, M., 2021, Greater vulnerability of snowmelt-fed river thermal regimes to a warming climate: Environmental Research Letters, v. 16, no. 5, 13 p., accessed April 24, 2023, at https://doi.org/10.1088/1748-9326/abf393.
Conversion Factors
Datums
Vertical coordinate information is referenced to the North American Vertical Datum of 1988 (NAVD 88).
Horizontal coordinate information is referenced to the North American Datum of 1983, adjustment 2011, Universal Transverse Mercator Zone 10 North (NAD 1983 [2011] UTM Zone 10N).
Elevation, as used in this report, refers to distance above NAVD 88.
Supplemental Information
Time is given in Pacific daylight time (coordinated universal time minus seven hours).
In this report, river mile refers to a length measured cumulatively from the most downstream point toward the most upstream point along a manually drawn river centerline in the thermal infrared imagery mosaics for either the Skykomish, Snoqualmie, or Middle Fork Snoqualmie River. The river mile length thus represents only the sections of river within the surveyed study area and is not relative to the overall river length outside of the study area nor the commonly used river mile as defined by the USGS National Hydrography Dataset. The river mile distances shown for float survey longitudinal stream temperature profiles are referenced to the corresponding longitudinal stream temperature profiles from that year’s airborne thermal infrared survey to facilitate direct comparison of results.
Discharge values from USGS streamgages are described in this report as having been “recorded,” signifying that the discharge values were computed from recorded river stage values using stage-discharge rating curves that were developed and validated by periodic discharge measurements.
Abbreviations
.sid
seamless image database compression raster
.tif
Tag Image File Format
GPS
global positioning system
GW
groundwater
Hz
Hertz
DEM
digital elevation model
ID
identifier
IMU
inertial measurement unit
LTP
longitudinal stream temperature profile
NV5
NV5 Geospatial, Inc.
RGB
true-color red, green, blue
RM
river mile
SBET
smoothed best estimate of trajectory
STF
significant thermal feature
SWM
Snohomish County Surface Water Management and the Sustainable Lands Strategy Executive Committee
TIR
thermal infrared
Trib
tributary
USGS
U.S. Geological Survey
For information about the research in this report, contact
Director, Washington Water Science Center
U.S. Geological Survey
934 Broadway, Suite 300
Tacoma, Washington 98402
https://www.usgs.gov/centers/washington-water-science-center
Manuscript approved on December 20, 2023
Publishing support provided by the U.S. Geological Survey
Science Publishing Network, Tacoma Publishing Service Center
Edited by Nathan Severance
Layout and design by Luis Menoyo
Illustration support by Joseph Mangano
Disclaimers
Any use of trade, firm, or product names is for descriptive purposes only and does not imply endorsement by the U.S. Government.
Although this information product, for the most part, is in the public domain, it also may contain copyrighted materials as noted in the text. Permission to reproduce copyrighted items must be secured from the copyright owner.
Suggested Citation
Restivo, D.E., Diabat, M., Miwa, C., and Bright, V.A.L., 2024, Comparison of longitudinal stream temperature profiles and significant thermal features from airborne thermal infrared and float surveys of the Skykomish, Snoqualmie, and Middle Fork Snoqualmie Rivers, King and Snohomish Counties, Washington, summer 2020 and 2021: U.S. Geological Survey Scientific Investigations Report 2023–5146, 31 p., https://doi.org/10.3133/sir20235146.
ISSN: 2328-0328 (online)
Study Area
| Publication type | Report |
|---|---|
| Publication Subtype | USGS Numbered Series |
| Title | Comparison of longitudinal stream temperature profiles and significant thermal features from airborne thermal infrared and float surveys of the Skykomish, Snoqualmie, and Middle Fork Snoqualmie Rivers, King and Snohomish Counties, Washington, summer 2020 and 2021 |
| Series title | Scientific Investigations Report |
| Series number | 2023-5146 |
| DOI | 10.3133/sir20235146 |
| Publication Date | February 16, 2024 |
| Year Published | 2024 |
| Language | English |
| Publisher | U.S. Geological Survey |
| Publisher location | Reston, VA |
| Contributing office(s) | Washington Water Science Center |
| Description | Report: viii, 31 p.; Data Release |
| Country | United States |
| State | Washington |
| County | King County, Snohomish County |
| Other Geospatial | Skykomish, Snoqualmie, and Middle Fork Snoqualmie Rivers |
| Online Only (Y/N) | Y |