

Phytoplankton, Taste-and-Odor Compounds, and Cyanotoxin Occurrence in Four Water-Supply Reservoirs in the Triangle Area of North Carolina, April–October 2014
Links
- Document: Report (2.44 MB pdf) , HTML , XML
- Data Release: USGS Data Release - Associated data for the phytoplankton, taste-and-odor compounds, and cyanotoxin occurrence in drinking water supply reservoirs in the Triangle area of North Carolina
- NGMDB Index Page: National Geologic Map Database Index Page (html)
- Download citation as: RIS | Dublin Core
Acknowledgments
Funding for this research was provided by the Triangle Area Water Supply Monitoring Project Steering Committee, which included the following North Carolina municipalities and agencies: Chatham County, Orange County, Town of Apex, Town of Cary, Town of Morrisville, Town of Hillsborough, City of Durham, Orange Water and Sewer Authority. The Triangle J Council of Governments provided collaborative and administrative support.
The authors thank the following U.S. Geological Survey employees for their contributions to this study. Ryan Rasmussen, Cassandra Pfeifle, and Ahmed Rhoni-Aref collected samples. Mary Giorgino and Stephen Harden provided project support and management. Michael Stouder and Richard Kiesling provided invaluable reviews of this report.
Abstract
Prior to 2014, local utilities and State agencies monitored for cyanotoxins and taste-and-odor (T&O) compounds and reported occasional detections in three water-supply reservoirs in Wake County, North Carolina. Comparable data for cyanotoxins and T&O compounds were lacking for other water-supply reservoirs in the Triangle area of North Carolina. This report assesses whether cyanotoxins and T&O compounds occurred in four previously unmonitored North Carolina Triangle area water-supply reservoirs at levels that exceed existing North Carolina and U.S. Environmental Protection Agency recreational and drinking water health advisory, guidance, and criterion levels based on data collected during the peak phytoplankton growth period in 2014. Samples were collected from five sites across the study reservoirs (Cane Creek Reservoir, West Fork Eno River Reservoir, B. Everett Jordan Lake, and University Lake) between April and October 2014 and analyzed for physical characteristics, chemical constituents, phytoplankton communities, cyanotoxins, and T&O compounds.
Lake stratification during the sampling period in 2014 could indicate that the deep zones of the water column, during stratified anoxic conditions, may serve as possible sources of nutrients and metals for algal growth and other biogeochemical processes. Differences in phytoplankton communities were attributed to variability in environmental conditions across the sites and sampling events. Differences generally were greater among sites than among sampling events for phytoplankton communities and environmental conditions.
Phytoplankton community assemblages, within reservoirs, often were dominated by cyanobacteria that contained genera capable of producing T&O compounds and cyanotoxins during summer and fall months. The occurrence and associated biovolumes of potential producers of cyanotoxins and T&O compounds varied across the sites and sampling events. Of 20 samples collected during the study, the T&O compound geosmin and the cyanotoxin microcystin were present in 19 and 18 samples, respectively. While not harmful, the aesthetically displeasing geosmin concentrations periodically exceeded the human detection threshold of 15 nanograms per liter at most sites. The T&O compound 2-methylisoborneol (MIB) was detected in 11 of 20 samples, with concentrations below the human detection threshold of 15 nanograms per liter in all but one sample. The cyanotoxin anatoxin-a was detected in two of the samples. No other cyanotoxins were detected during the study.
In general, results did not indicate the biovolume of any given phytoplankton genera in the study was correlated with increased concentrations of MIB, geosmin, or microcystin. Results from this study indicated that microcystin concentrations in the water-supply reservoirs in the Triangle area were below EPA-recommended recreational level of 8 micrograms per liter, but periodically exceeded the EPA finished-water 10-day health advisory level of 0.3 microgram per liter for bottle-fed infants and preschool-age children. This suggests longer term data collection may be necessary to better understand the magnitude and frequency of cyanotoxin concentrations in these four water-supply reservoirs, particularly those with an elevated risk of exceeding the EPA 10-day health advisory levels in the finished drinking water or those with a higher frequency of T&O compound occurrence.
Introduction
The Triangle area is located within the upper Cape Fear and Neuse River Basins of North Carolina (fig. 1). Four counties within the rapidly developing Triangle area, that include many urban centers like Apex, Cary, and Chapel Hill, has a population that increased by nearly 21 percent between 2010 and 2020 and is expected to increase by another 44 percent by 2040 (North Carolina Office of State Budget and Management, 2021; U.S. Census Bureau, 2021). Rapid population growth is often associated with expanded urban development within watersheds that can alter the hydrology and water quality of nearby surface-water and groundwater resources. To aid in protection of drinking-water supplies in the region, the Triangle Area Water Supply Monitoring Project (TAWSMP), a collaborative partnership between local governments, was established to monitor these water supplies through multiparty efforts. The U.S. Geological Survey (USGS), in cooperation with the TAWSMP Steering Committee, has monitored water-quality constituents and streamflow in streams and reservoirs—for over 30 years—to track water-quality conditions and trends (Garrett and others, 1994).
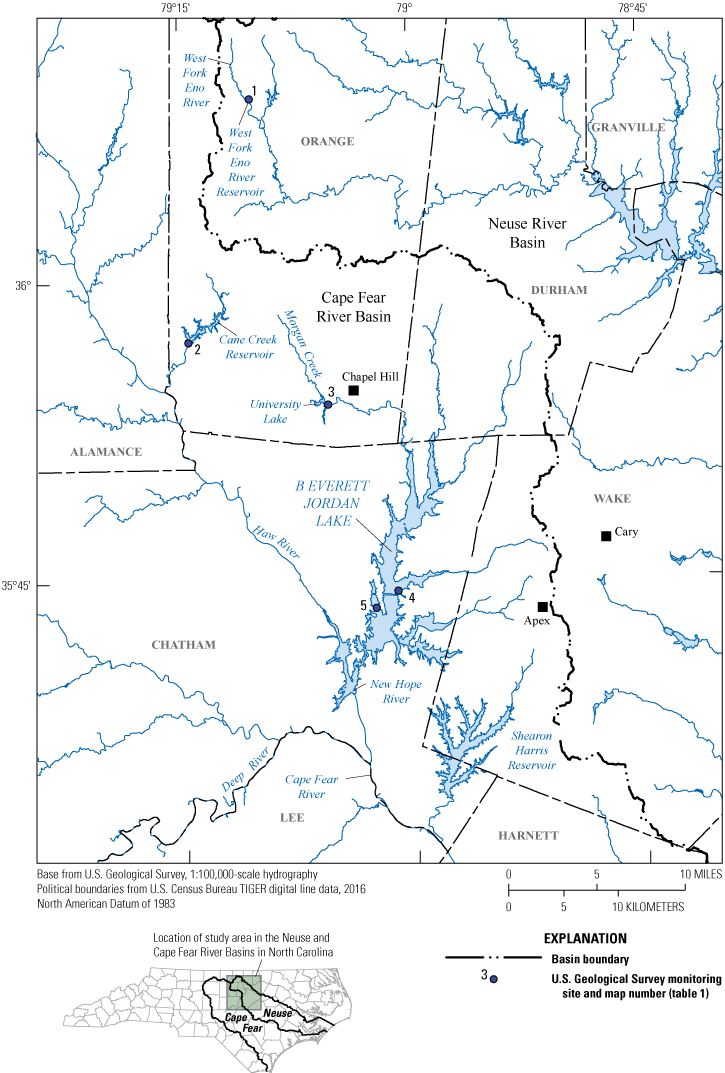
Water-supply reservoirs and U.S. Geological Survey (USGS) water-quality monitoring sites (table 1) in the Triangle Area Water Supply Monitoring Project study area in North Carolina, April–October 2014.
Urban development, like that observed in the Triangle area, has been linked to nutrient over-enrichment of surface-water bodies, causing shifts from healthy, diverse phytoplankton communities towards dominance by potentially harmful communities, such as cyanobacteria (Chorus and Bartram, 1999; Paerl and others, 2011, 2016; Harris and others, 2016; Chorus and Welker, 2021). Nutrient over-enrichment is considered a concern for surface-water quality in the TAWSMP study area, with all surface waters having a ubiquitous designation as “nutrient sensitive” by the North Carolina Department of Environmental Quality (NCDEQ, 2017). Several streams in the TAWSMP study area also are listed as impaired for biological integrity, low dissolved oxygen (DO), high turbidity, or excessive fecal coliform bacteria. Additionally, nutrient enrichment is an issue in water-supply reservoirs in the Triangle area, which range from mesotrophic to highly eutrophic based on the North Carolina Trophic State Index computed from levels of total organic nitrogen, total phosphorus, transparency, and chlorophyll a (NCDEQ, 2013, 2020).
Diverse phytoplankton communities commonly consist of assemblages of the major taxonomic groups, including green algae, diatoms, dinoflagellates, and cyanobacteria. Even under natural conditions, taxonomic composition of phytoplankton communities vary spatially, temporally, and seasonally based on environmental conditions (Wetzel, 2001). Cyanobacteria are a diverse group of single-celled, prokaryotic organisms that exist in a wide range of environments. Cyanobacteria can become dominant in the phytoplankton community because of several environmental competitive advantages, including nitrogen fixation, buoyancy regulation, and higher maximum growth temperatures (Paerl and others, 2011; Harris and others, 2016; Chorus and Welker, 2021). Some cyanobacteria, especially those in the Nostocales order, fix atmospheric nitrogen when nitrogen in water is limited, allowing them to outcompete eukaryotic microalgae (Oliver and Ganf, 2000). Many species of cyanobacteria regulate their buoyancy with gas vesicles, allowing migration through the water column to zones that have better environmentally suitable conditions (for example, greater light or nutrients) (Chorus and Welker, 2021). The adaptability of cyanobacteria enables the group to dominate the phytoplankton community when environmental conditions are optimal for their growth, often resulting in cyanobacteria-dominated blooms (Paerl and Millie, 1996; Chorus and Bartram, 1999; Paerl and others, 2001; Jüttner and Watson, 2007). Cyanobacteria-dominated blooms are aesthetically displeasing, discourage recreation, increase water-treatment costs, and may produce complex mixtures of algal cyanotoxins and taste-and-odor (T&O) compounds (Graham and others, 2010).
Understanding the environmental conditions that favor cyanobacterial dominance and bloom formation has been a focus of research throughout the world because of the concomitant production and release of nuisance and toxic cyanobacterial-derived compounds (Paerl, 1988; Chorus and Bartram, 1999; Downing and others, 2001; Paerl and others, 2001; Jüttner and Watson, 2007; Dodds and others, 2009; Paerl and Huisman, 2009). However, the complex interaction among the physical, chemical, and biological processes within lakes, reservoirs, and large rivers often makes it difficult to identify the primary environmental factors that cause production and release of these cyanobacterial byproducts (Downing and others, 2001). For public drinking-water supplies, certain species of freshwater cyanobacteria that can produce cyanotoxins are of concern because the cyanotoxins target the nervous systems and livers of mammals and adversely affect a range of other organisms. These algal-derived cyanotoxins include microcystins, cylindrospermopsin, anatoxin-a, and saxitoxins. The presence of cyanotoxins in ambient water from multiuse reservoirs, like the ones in this study, produce human health concerns for recreation and consumption.
Currently (2023), recreational guidelines for cyanotoxins in reservoirs in North Carolina are qualitative, not quantitative; however, the U.S. Environmental Protection Agency (EPA) has recommended ambient recreational water-quality criteria (RWQCs) and swimming advisories (SAs) that were developed for microcystin and cylindrospermopsin concentrations (1-day exceedance over a 10-day monitoring period of 8 and 15 micrograms per liter [µg/L], respectively) (EPA, 2019). The EPA also has issued national drinking water age-based health advisories (HAs) for concentrations of the cyanotoxins microcystin and cylindrospermopsin (EPA, 2015a, b). The HAs pertain to cyanotoxin levels in finished drinking water that are less than or equal to levels that could cause adverse human health effects over a 10-day period. The 10-day EPA HAs for microcystin in finished drinking water are 0.3 µg/L for bottle-fed infants and children less than 6 years old, and 1.6 µg/L for all other ages. For cylindrospermopsin, the 10-day EPA HAs are 0.7 and 3.0 µg/L for children under 6, and for all other ages, respectively. The EPA HAs are not federally-enforceable, regulatory limits, but serve as informal technical guidance to assist regulatory agencies and public or community watersystem managers to protect public health from contaminants. In this report, the EPA RWQCs, SAs, and HAs are used as screening tools for the assessment of ambient water quality in public water-supply reservoirs in this study.
Cyanobacteria also produce geosmin and 2-methylisoborneol (MIB), two nontoxic organic compounds responsible for “musty” or “earthy” T&O—that often result in complaints to water utilities about drinking water (Watson and others, 2016). These compounds affect the aesthetic quality of drinking water, at very low levels, because the human detection threshold is approximately 10 to 15 nanograms per liter (ng/L) (Young and others, 1996; Graham and others, 2012). Nearly 70 geosmin-producing cyanobacterial species have been documented, including those from the genera Dolichospermum (formerly known as Anabaena), Nostoc, Lyngbya, Oscillatoria, Phormidium, Planktothrix, Synechococcus, and Aphanizomenon (Taylor and others, 2006; Watson and others, 2016). MIB production has been identified in species from the genera Lyngbya, Oscillatoria, Nostoc, Synechococcus, Planktothrix, and Pseudanabaena (Taylor and others, 2006; Watson and others, 2016). Geosmin and MIB frequently are detected in eutrophic water-supply reservoirs and require more costly water treatment, compared to conventional treatment techniques, to lower T&O levels below human detection (Taylor and others, 2006).
While the existence of ubiquitous nutrient-sensitive waters is well documented in the Triangle area, the effects of nutrient enrichment on phytoplankton communities in Triangle area reservoirs is less well known. Water-supply reservoirs in the Triangle area often experience high levels of phytoplankton, indicated by elevated chlorophyll a concentrations (a pigment found in algae) (NCDEQ, 2013, 2020; Cain and others, 2017; Giorgino and others, 2018). Several lakes (B. Everett Jordan Lake, University Lake, and Cane Creek Reservoir [fig. 1]) in the Triangle area are on the North Carolina 303(d) list of impaired waterways because of exceedances of the State chlorophyll a standard of 40 µg/L and because algal blooms are occasionally observed in reservoirs in the TAWSMP area (NCDEQ, 2019).
Purpose and Scope
Monitoring efforts by the City of Raleigh have shown periodic detections of cyanotoxins and T&O compounds in three water-supply reservoirs located in nearby Wake County, N.C. However, comparable data for cyanotoxins and T&O compounds are lacking for other water-supply reservoirs in the TAWSMP study area. Concerns over harmful algal blooms (HABs) in water-supply reservoirs in the Triangle area warrant further investigation of their frequency and severity. The purpose of this study was to provide an initial assessment of whether cyanotoxins and T&Os occur at levels of concern at four TAWSMP study area water-supply reservoirs from April to October 2014: B. Everett Jordan Lake, Cane Creek Reservoir, University Lake, and West Fork Eno River Reservoir (fig. 1). The occurrence and distribution of cyanotoxins and T&Os had not been determined previously at these locations as part of the TAWSMP program. Although the data collection was limited in scope, the study also involved interpretation of cyanotoxins and T&Os in relation to associated water-quality measurements and phytoplankton characteristics, including species composition and quantity, as indicated by algal cell density and biovolume. Additionally, multivariate statistical analyses were used to characterize phytoplankton communities and examine seasonal variations and spatial differences among study reservoirs. Statistical relations among water-quality variables and phytoplankton assemblages also were investigated. Data associated with this report are available in the data release (Diaz and others, 2024).
Study Area and Study Reservoirs
Sites are located on West Fork Eno River Reservoir in the Neuse River Basin and Cane Creek Reservoir, University Lake, and B. Everett Jordan Lake in the Cape Fear River Basin (fig. 1; table 1). Lake volumes ranged from 2.6 × 10⁶ cubic meters (m3) (University Lake) to 929.6 × 10⁶ m3 (B. Everett Jordan Lake) and ranged in mean depth from 1.5 meters (m) (University Lake) to 5.0 m (B. Everett Jordan Lake) (NCDEQ, 2013, 2020). Study reservoir areas ranged from 204 to 14,300 acres. At the time of the study, reservoir ages ranged from approximately 22 years (West Fork Eno River Reservoir, constructed in 2000) to approximately 90 years (University Lake, constructed in 1932) (NCDEQ, 2013, 2020). Cane Creek Reservoir and University Lake are managed by the Orange Water and Sewer Authority and serve as water supplies for the City of Chapel Hill. B. Everett Jordan Lake was built for flood control and is used for recreational activities and as a water supply for several municipalities (NCDEQ, 2013). West Fork Eno River Reservoir is managed by the Town of Hillsborough, which withdraws the largest amount of water from the system (NCDEQ, 2020). All study reservoirs have been defined as eutrophic (NCDEQ, 2013, 2020) based on the North Carolina Trophic State Index (North Carolina Department of Natural Resources and Community Development, 1983; North Carolina Department of Environment Health and Natural Resources, 1992).
Table 1.
Five water-quality monitoring sites and associated limnological characteristics sampled by U.S. Geological Survey (USGS) for cyanotoxins, taste-and-odor compounds, and phytoplankton, in cooperation with the Triangle Area Water Supply Monitoring Project, North Carolina (NC), during four sampling events from April to October 2014.[Limnological characteristics from North Carolina Department of Environmental Quality (NCDEQ) lake and reservoir assessment reports for the Cape Fear (NCDEQ, 2013) and Neuse (NCDEQ, 2020) River Basins. m3, cubic meter; acre-ft, acre-foot; m, meter; n/a, not available from the National Water Inventory System database]
| Map number (fig. 1) | USGS station number | USGS station name | Abbreviated site name | River basin | Lake volume, in 106 m3 (acre-ft) | Year built | Mean depth, in m | Surface area, in acres | Drainage area, in square miles |
|---|---|---|---|---|---|---|---|---|---|
| 1 | 0208480275 | West Fork Eno River Reservoir at dam near Cedar Grove, NC | WF Eno Res | Neuse | 3.0 (2,432) | 2000 | 4.0 | 204 | 9.44 |
| 2 | 0209684980 | Cane Creek Reservoir at dam near White Cross, NC | Cane Cr Res | Cape Fear | 11.0 (8,917.7) | 1989 | 2.5 | 499 | 31.4 |
| 3 | 0209749990 | University Lake at intakes near Chapel Hill, NC | University Lake | Cape Fear | 2.6 (2,107.8) | 1932 | 1.5 | 205 | 30 |
| 4 | 0209799150 | B.E. Jordan Lake above US Hwy 64 at Wilsonville, NC | Jordan Lake at Hwy 64 | Cape Fear | 929.6 (753,626.7) | 1981 | 5.0 | 14,300 | 285 |
| 5 | 0209801100 | B.E. Jordan Lake at Bells Landing near Griffins Crossroads, NC | Jordan Lake at Bells | Cape Fear | 929.6 (753,626.7) | 1981 | 5.0 | 14,300 | n/a |
Methods
This study was conducted in the Cape Fear River and Neuse River Basins of North Carolina (fig. 1). The five water-quality monitoring sites (from here on referred to as “sites”) used in this study were distributed across four water-supply reservoirs (from here on referred to as “study reservoirs”; fig. 1; table 1), all that serve as drinking water sources for municipalities in the Triangle area. Water-quality measurements and discrete surface-water samples were collected four times between April and October 2014 at the five sites.
Sample Collection and Laboratory Analyses
For each sample, physical properties, nutrients, algae (estimated concentrations from chlorophyll a, and identification and enumeration of species), major ions, metals, T&Os, and cyanotoxins were quantified by using field and laboratory techniques (table 2). Relevant quality-control samples, including field blanks and replicates, were collected. All field parameters were measured directly by USGS personnel (Pfeifle and others, 2017). Physical properties measured in the field, chemical constituents, and analytical methods for all analyses are summarized in table 2. Temperature, DO, pH, and specific conductance data were collected at 1-m depth intervals. Water transparency (Secchi depth) and turbidity were measured directly starting at the water surface. Discrete samples were collected in one of three water-column locations at each reservoir site: composite sample through entire photic zone (photic), grab sample at 1-m below the surface (surface), and grab sample at 1-m above the lake bottom (deep). Photic samples were analyzed for cyanotoxins, T&Os, phytoplankton, nutrient species (ammonia [NH3 plus NH4+], ammonia plus organic nitrogen, nitrate plus nitrite, orthophosphate, and total phosphorus), and chlorophyll a. In accordance with past sampling at these locations, the photic zone was operationally defined as the zone from the surface to the depth equal to twice the Secchi depth and was sampled as vertical composites following protocols described by Oblinger (2004) using a Lab-Line sampler. Surface and deep grab samples were collected using a horizontally oriented Van Dorn sampler. Nutrient species (ammonia [NH3 plus NH4+], ammonia plus organic nitrogen, nitrate plus nitrite, orthophosphate, and total phosphorus) also were analyzed from the deep zone. Total and dissolved iron and manganese samples were collected 1 m from the surface and in the deep zone.
Table 2.
Physical properties measured in the field and chemical constituents analyzed in samples from four water-supply reservoirs by the U.S. Geological Survey (USGS), in cooperation with the Triangle Area Water Supply Monitoring Project, North Carolina, April to October 2014.[NWIS, National Water Information System (USGS, 2021); m, meter; mg/L, milligram per liter; pH, negative log (base 10) of the hydrogen ion activity; USGS, U.S. Geological Survey; µS/cm at 25 °C, microsiemens per centimeter at 25 degrees Celsius; °C, degree Celsius; NTRU, nephelometric turbidity ratio unit; CaCO3, calcium carbonate; NWQL, National Water Quality Laboratory; --, computed or non-NWIS value; SiO2, silicon dioxide; N, nitrogen; ASF, automated segmented flow; DA, (automated) discrete analyzer; P, phosphorus; EPA, U.S. Environmental Protection Agency; SAWSC, USGS South Atlantic Water Science Center; DIN, dissolved inorganic nitrogen; DIP, dissolved inorganic phosphorus; µg/L, microgram per liter; NC-MELR, Meritech in Reidsville, North Carolina; ng/L, nanogram per liter; CA-EEALM, Eurofins Eaton Analytical in Monrovia, California; SPME, solid-phase microextraction; OGRL, USGS Organic Geochemistry Research Laboratory; ELISA, enzyme-linked immunosorbent assays; LC/MS/MS, liquid chromatography tandem mass spectrometry]
| Physical property or constituent (units) | Analyzing entity or location | NWIS parameter code | NWIS method code | Method reference | Methodology |
|---|---|---|---|---|---|
| Transparency, Secchi, (m) | Field | 00078 | SECCH | Hambrook Berkman and Canova (2007) | Secchi disk |
| Dissolved oxygen, (mg/L) | Field | 00300 | LUMIN | USGS (2020) | Electrometry, luminescence quenching |
| pH, in standard units | Field | 00400 | PROBE | Ritz and Collins (2008) | Electrometry, ion-selective electrode |
| Specific conductance, (µS/cm) | Field | 00095 | SC001 | USGS (2019) | Electrometry, Wheatstone bridge |
| Temperature, water, (°C) | Field | 00010 | THM01 | Wilde (2006) | Thermistor |
| Turbidity (NTRU) | Field | 63676 | TS196 | Anderson (2005) | Nephelometry |
| Sampling depth (m) | Field | 00098 | -- | Gibs and others (2012) | Pressure transducer |
| Hardness (mg/L of CaCO3) | NWQL | 00900 | ALGOR | -- | Computed as sum of calcium and magnesium |
| Calcium, filtered (mg/L) | NWQL | 00915 | PLA11 | Fishman (1993) | Atomic emission spectrometry, inductively coupled plasma |
| Magnesium, filtered (mg/L) | NWQL | 00925 | PLA11 | Fishman (1993) | Atomic emission spectrometry, inductively coupled plasma |
| Potassium, filtered (mg/L) | NWQL | 00935 | PLO03 | Clesceri and others (1998b) | Atomic emission spectrometry, inductively coupled plasma |
| Sodium, filtered (mg/L) | NWQL | 00930 | PLA11 | Fishman (1993) | Atomic emission spectrometry, inductively coupled plasma |
| Sodium, fraction of cations (percent) | NWQL | 00932 | ALGOR | -- | Algorithm (percent in equivalents of major cations) |
| Acid neutralizing capacity, (mg/L as CaCO3) | NWQL | 00419 | TT065 | Rounds (2012) | Electrometry, ion-selective electrode, titration, or pH 4.5 |
| Bicarbonate, unfiltered (mg/L as CaCO3) | NWQL | 00450 | ASM09 | Rounds (2012) | Electrometry, ion-selective electrode, incremental titration |
| Chloride, filtered (mg∙L−1) | NWQL | 00940 | IC022 | Fishman and Friedman (1989) | Conductivity, ion-exchange chromatography |
| Fluoride, filtered (mg∙L−1) | NWQL | 00950 | IC003 | Fishman and Friedman (1989) | Conductivity, ion-exchange chromatography |
| Silica, filtered (mg/L as SiO2) | NWQL | 00955 | PLA11 | Fishman (1993) | Atomic emission spectrometry, inductively coupled plasma, digestion |
| Sulfate, filtered (mg/L) | NWQL | 00945 | IC022 | Fishman and Friedman (1989) | Conductivity, ion-exchange chromatography |
| Residue on evaporation at 180 °C, filtered (mg/L) | NWQL | 70300 | ROE10 | Fishman and Friedman (1989) | Gravimetry/evaporation at 180 °C |
| Ammonia plus organic nitrogen, unfiltered (mg/L as N) | NWQL | 00625 | KJ008 | Patton and Truitt (2000) | Colorimetry, ASF, micro-Kjeldahl digestion, acidified |
| Ammonia, filtered (mg/L as N) | NWQL | 00608 | SHC02 | Fishman (1993) | Colorimetry, DA, salicylate-hypochlorite |
| Nitrate plus nitrite, filtered (mg/L as N) | NWQL | 00631 | RED02 | Patton and Kryskalla (2011) | Colorimetry, DA, enzymatic reduction-diazotization, filtered, low-level |
| Orthophosphate, filtered (mg/L as P) | NWQL | 00671 | PHM01 | Fishman (1993) | Colorimetry, DA, phosphomolybdate |
| Phosphorus, unfiltered (mg/L as P) | NWQL | 00665 | CL021 | EPA (1993) | Colorimetry, ASF, alkaline-persulfate digestion, low level |
| Total nitrogen (mg/L as N) | NWQL | 00600 | -- | -- | Algorithm (sum of ammonia, organic nitrogen, nitrate, and nitrite) |
| Organic nitrogen, unfiltered (mg/L as N) | NWQL | 00605 | ALGOR | -- | Computed as total nitrogen minus total inorganic nitrogen |
| Iron, unfiltered, recoverable (µg/L) | NWQL | 01045 | PLA15 | Garbarino and Struzeski (1998) | Atomic emission spectrometry, inductively coupled plasma, digestion |
| Manganese, unfiltered, recoverable (µg/L) | NWQL | 01055 | PLA15 | Garbarino and Struzeski (1998) | Mass spectrometry, inductively coupled plasma, digestion |
| Dissolved inorganic nitrogen (mg/L as N) | SAWSC | -- | -- | -- | Computed as sum of ammonia and nitrate plus nitrite |
| Ratio of total nitrogen to total phosphorus (unitless) | SAWSC | -- | -- | -- | Computed as total nitrogen divided by total phosphorus |
| Ratio of DIN to DIP (unitless) | SAWSC | -- | -- | -- | Computed as DIN divided by orthophosphate |
| Total organic carbon, unfiltered (mg/L) | NWQL | 00680 | COMB9 | Clesceri and others (1998a) | Nondispersive infrared analysis, high temperature combustion |
| Chlorophyll a, filtered (µg/L) | NC-MELR | 70953 | FL008 | Arar and Collins (1997) | Chromatographic-fluorometric method |
| Geosmin, unfiltered (ng/L) | CA-EEALM | 68288 | SM 6040D | Eaton and others (2005) | SPME with gas chromatography and mass spectrometry |
| 2-Methylisoborneol, unfiltered (ng/L) | CA-EEALM | 68289 | SM 6040D | Eaton and others (2005) | SPME with gas chromatography and mass spectrometry |
| Microcystin/nodularin, total, unfiltered (µg/L) | OGRL | -- | -- | Loftin and others (2016) | Abraxis ELISA |
| Cylindrospermopsin, unfiltered (µg/L) | OGRL | -- | -- | Loftin and others (2016) | Abraxis ELISA |
| Saxitoxin, unfiltered (µg/L) | OGRL | -- | -- | Loftin and others (2016) | Abraxis ELISA |
| Anatoxin-a, unfiltered (µg/L) | OGRL | 68287 | -- | Loftin and others (2016) | Direct injection, LC/MS/MS |
| Cylindrospermopsin, unfiltered (µg/L) | OGRL | 52686 | -- | Loftin and others (2016) | Direct injection, LC/MS/MS |
| Domoic acid, unfiltered (µg/L) | OGRL | 52687 | -- | Loftin and others (2016) | Direct injection, LC/MS/MS |
| Microcystin HtyR, unfiltered (µg/L) | OGRL | 52690 | -- | Loftin and others (2016) | Direct injection, LC/MS/MS |
| Microcystin-LA, unfiltered (µg/L) | OGRL | 52688 | -- | Loftin and others (2016) | Direct injection, LC/MS/MS |
| Microcystin-LF, unfiltered (µg/L) | OGRL | 52694 | -- | Loftin and others (2016) | Direct injection, LC/MS/MS |
| Microcystin-LR, unfiltered (µg/L) | OGRL | 63686 | -- | Loftin and others (2016) | Direct injection, LC/MS/MS |
| Microcystin-LW, unfiltered (µg/L) | OGRL | 52695 | -- | Loftin and others (2016) | Direct injection, LC/MS/MS |
| Microcystin-LY, unfiltered (µg/L) | OGRL | 52689 | -- | Loftin and others (2016) | Direct injection, LC/MS/MS |
| Microcystin-RR, unfiltered (µg/L) | OGRL | 52692 | -- | Loftin and others (2016) | Direct injection, LC/MS/MS |
| Microcystin-WR, unfiltered (µg/L) | OGRL | 52691 | -- | Loftin and others (2016) | Direct injection, LC/MS/MS |
| Microcystin-YR, unfiltered (µg/L) | OGRL | 52693 | -- | Loftin and others (2016) | Direct injection, LC/MS/MS |
| Nodularin-R, unfiltered (µg/L) | OGRL | 52696 | -- | Loftin and others (2016) | Direct injection, LC/MS/MS |
| Okadaic acid, unfiltered (µg/L) | OGRL | 52697 | -- | Loftin and others (2016) | Direct injection, LC/MS/MS |
Cyanotoxin samples were transferred to 500-milliliter (mL) high density polyethylene bottles, immediately placed on ice in the field, and shipped frozen overnight to the USGS Organic Geochemistry Research Laboratory in Lawrence, Kansas. Unfiltered sample processing comprised three sequential freeze-thaw cycles to lyse cyanobacterial cells and release cyanotoxins into the dissolved phase (Loftin and others, 2008; Graham and others, 2010). Combined intracellular and extracellular concentrations of five cyanotoxins (microcystin, anatoxin-a, saxitoxin, cylindrospermopsin, and nodularin), including eight microcystin variants, and two biotoxins (domoic and okadaic acid) were quantified by direct injection, liquid chromatography tandem mass spectrometry (LC/MS/MS) (Loftin and others, 2016), with laboratory reporting levels (LRLs) ranging from 0.01 to 0.30 µg/L. Additionally, enzyme-linked immunosorbent assays (ELISA) were used to measure total microcystin and nodularin (detection limit 0.1 µg/L; variant independent), cylindrospermopsin (detection limit 0.5 µg/L), and saxitoxin (detection limit 0.02 µg/L) (table 2) (Loftin and others, 2016). Many of the cyanotoxins have multiple variants (congeners), and ELISA is not specific to individual variants; therefore, reported concentrations potentially include the total of multiple variants of compounds, their degradates, and their precursors (Graham and others, 2012).
Geosmin and MIB were measured at Eurofins Eaton Analytical in Monrovia, California. Phytoplankton samples were analyzed by the contract laboratory Phycotech, Inc. (St. Joseph, Michigan) for taxonomic identification, enumeration, and biovolume estimates. Phytoplankton samples were concentrated on a slide and research-grade microscopes ranging from 40 to 1,000x magnification were used to identify phytoplankton in samples to the most practical taxonomic levels (normally, species or genus level) (Rosen and St. Amand, 2015; Phycotech, Inc., 2022). Over the past few decades, taxonomy of phyto- and periphyton has been going through radical changes, especially in relation to cyanobacteria (Wehr and Sheath, 2003; Walter and others, 2017; Strunecký and others, 2023). Because it was beyond the scope of this study to integrate the provided taxonomic data to the Integrated Taxonomic Information System, taxonomic data are reported as provided by Phycotech, Inc. (Diaz and others, 2024), based on the taxonomic authority used, unless otherwise stated. Chlorophyll a was analyzed at Meritech, Inc., in Reidsville, N.C. Nutrients, major ions, and metals were analyzed at the USGS National Water Quality Laboratory in Denver, Colorado (table 2) and published in Pfeifle and others (2017).
Total nitrogen was reported as the sum of organic nitrogen plus ammonia and nitrate plus nitrite concentrations. When nitrate plus nitrite concentrations were below the LRL of 0.01 milligrams per liter (mg/L), total nitrogen concentration was estimated as less than the sum of organic nitrogen plus ammonia concentration plus 0.01 mg/L (the LRL for nitrate plus nitrite concentrations indicating actual concentrations could be anywhere from 0 to just below 0.01 mg/L). If the estimated total nitrogen concentrations that ranged from 0.52 to 8.9 mg/L in this study were used in statistical analysis, the uncertainty of to the censored value of being from 0 to 0.01 mg/L in that estimated total nitrogen concentration would indicate the total concentrations could have been overestimated by 0 to 1.9 percent, which was considered acceptable uncertainty for this study. Dissolved inorganic nitrogen concentrations were computed as the sum of the nitrate plus nitrite and ammonia concentrations, with a similar process for computation as with total nitrogen when nitrate plus nitrate values were below the LRL.
Quality Assurance and Quality Control
Quality-control samples and collection procedures used in this study are described in chapter A4 of the USGS National Field Manual (U.S. Geological Survey, variously dated). Quality-assurance data for this study are available from Diaz and others (2024). Two field blanks were collected and analyzed during April–October 2014 for geosmin and MIB, and one of the field blanks was also analyzed for cyanotoxins. In all, 19 constituents were analyzed, and 21 blank results were generated. Approximately 95 percent of the blank results were below detection levels, indicating minimal field or laboratory contamination and negligible systemic positive bias during this period. One exception was that the single cyanotoxin blank had a detection of the ELISA-derived total microcystin at a concentration of 0.13 µg/L, but no detection in the LC/MS/MS-derived, nine-variant-specific microcystin analysis that had LRLs ranging from 0.1 to 0.3 µg/L. About 15 percent (3 out of 20 samples) of environmental samples had detectable total microcystin concentrations less than or equal to the ELISA-derived total microcystin level detected in the field blank, and 2 environmental samples had total microcystin concentrations below the LRL of 0.10 µg/L (Diaz and others, 2024). The total microcystin concentration in field blanks represented about 37 percent of the maximum environmental concentration (0.35 µg/L) and 65 percent of the median environmental concentration (0.20 µg/L) (Diaz and others, 2024), indicating potential positive bias and uncertainty for the total microcystin results.
Sampling and analysis variability was assessed with two sets of field replicates analyzed for geosmin, MIB, and cyanotoxins (Diaz and others, 2024). Among these field replicates, there were 42 replicate-result pairs. Paired concentrations with a relative percent difference (RPD; absolute difference multiplied by 100 and divided by the average) less than 25 percent were considered to demonstrate acceptable reproducibility. For microcystin, the RPDs were 12 and 15 percent. All the replicate-result pairs had RPDs less than 25 percent. When used for investigating variance in phytoplankton abundance, RPD values are strongly affected by rare taxa that occur in one sample but are absent from the other; therefore, absolute value logarithmic difference (AVLD) was used to evaluate variances in phytoplankton abundance (cells/mL) between replicate pairs (Graham and others, 2017). AVLD was calculated as the absolute value of the difference between the base-10 logarithm of abundance in each replicate pair represented by A and B, as shown by equation below:
Phytoplankton sampling and analysis variability was assessed with four sets of field replicates (Diaz and others, 2024). Replicate pairs with AVLDs less than 1.0 were considered acceptable for phytoplankton abundance. All replicate-result pairs in this study had AVLDs less than 1.0. Results for replicate pairs indicated acceptable reproducibility for all water-quality constituents measured during the study period.
Statistical Analysis
Dataset sizes that were used to compare individual chemical constituents among sites (sample size of 4 to 5) were limited and represented only 5 months of time. Therefore, results of the univariate statistical tests were considered to have a higher degree of uncertainty, but provided a general screening to identify whether, as a group, differences were observed. Additionally, some chemical constituent values were reported to be below the LRL (for example, nitrate plus nitrite, ammonia, and MIB), so these censored (below LRL) values were ranked below the highest LRL as ties, and the ranks were input into nonparametric Wilcoxon signed-rank and rank-sum tests for comparison among groups (Helsel, 2005; Helsel and others, 2020). Univariate differences between individual chemical constituents in shallow (photic) and deep zone samples (all sites) were determined by nonparametric Wilcoxon signed-rank tests and differences among chemical constituents among sites were evaluated graphically and statistically by Wilcoxon rank-sum tests using Statistical Analysis Software, Inc JMP package (version 14.2.0: Sall and others, 2017). Cyanotoxins, including their individual variants, were not detected in any samples by LC/MS/MS analysis; therefore, statistical analysis of cyanotoxins was limited to investigations of total microcystin (sum of all variants) by ELISA. For investigations of physical property and chemical constituent associations with T&O and cyanotoxins, photic zone samples and measurements were used. Surface samples (top 1-m depth) were used only when measurements from the photic zone were missing.
Phytoplankton taxonomic data and the associated environmental data are difficult to assess using only univariate-based statistical methods because these data are inherently multivariate in character (many genera and multiple environmental factors in each sample). Therefore, in addition to the aforementioned univariate nonparametric comparison test on the small datasets, several more robust multivariate analytical tests were run as routines in Primer 7 v7.0.27 (Clarke and others, 2014) to investigate associations in the data. These multivariate tests were applied to selected environmental, phytoplankton, T&O, and cyanotoxin variables to provide general assessments of the similarities and differences in those variables among sites and sampling events and to determine if certain patterns in environmental conditions and phytoplankton assemblages helped explain the occurrence of T&O and cyanotoxins (Clarke and Warwick, 2001; Clarke and others, 2014; Somerfield and others, 2021).
Because the selected multivariate analyses required all variables in a sample to have a value (no missing data), minor adjustments were required on two samples to retain the rest of the sample data. Prior to multivariate analysis, missing parameter values (August water temperature, pH, specific conductance, and dissolved oxygen at Cane Creek Reservoir and August chloride levels at West Fork Eno River Reservoir) were estimated by using the Primer 7 expectation maximum likelihood algorithm, which assumes a multi-normal distribution model for environmental data (Dempster and others, 1977). Phytoplankton concentration (cells/mL) and biovolume (µm3/mL) were fourth-root transformed and standardized to percent composition prior to analysis. Fourth-root transformations were found to be best prior to analysis to maintain the contribution of taxa that are nearer to zero (presence-absence distinguishment) and prevent dominant species (large outliers) overly influencing the assessment (Anderson and others, 2008). Environmental data were log-transformed and normalized (adjusted data to mean of zero and standard deviation of 1) prior to analysis to allow for comparability of the different scales of measurements between parameter types. Similarity matrices were calculated based on the Bray-Curtis similarity index for taxonomic data and Euclidean distance for environmental data, based on recommendations in Clarke and others (2014) for analyses of these types of data.
Non-metric multidimensional scaling (MDS) ordination overlain with user-defined temporal trajectories were applied to the similarity matrices to explore changes in all phytoplankton and cyanobacteria only assemblages across sites and sampling events. The goodness-of-fit of the MDS, here called stress, is computed as the degree where actual rank order dissimilarity deviates from the modeled regression dissimilarity. Stress below 0.1 corresponds to very good ordination with less chance of misinterpretation, and stress below 0.2 corresponds to good ordination with slightly higher chance of misinterpretation. Generally, as stress increases from 0.2 towards 0.3, the placement of points in the ordination space becomes harder to distinguish from arbitrarily placed points. Therefore, MDS with increasing stress values from 0.2 to 0.3 should be interpreted with increasing levels of caution and skepticism.
Distinguishable groups within phytoplankton and environmental similarity matrices were identified by constrained hierarchical binary divisive clustering (LINKTREE routine in PRIMER) with output from a similarity profile test (SIMPROF routine in PRIMER) as the division stopping rule for statistically significant groups. An analysis of similarity (ANOSIM routine in PRIMER) test was used to determine if categorical (sites, sample events) differences in phytoplankton and environmental similarity matrices were present in the individual similarity matrices. The ANOSIM test is a permutation-based nonparametric a priori Mantel test. ANOSIM determined if similarity existed among categorical data groups (for example, sites or sampling events) within a similarity matrix by computing an R statistic described as the ratio of the within group and between group dissimilarities that can range from −1 to +1 and the associated permutationally derived (9,999 permutations) probability value (p) with significance considered at alpha level (α) of 0.05 for this study. To identify data groups that actually were similar, a secondary pairwise test was conducted, using the same alpha level. The closer the R was to +1, the more the data within a group were similar to each other and dissimilar to data in other groups, in other words, when 2 groups were perfectly separated the R value is equal to 1. For example, data from sampling events in early October were compared to data from sampling events in late October to see how similar the data were. No significant difference was detected between the data within the early October group and late October group; therefore, the two October sampling events were combined and considered a single sampling event. Another nonparametric Mantel test of between two different similarity matrices (RELATE routine in PRIMER; 999 permutations) was applied to phytoplankton, cyanobacteria, and environmental variable resemblance matrices to determine if correlations existed. RELATE output was a Spearman correlation coefficient rho (ρ) and permutationally derived p whereby rejection of the null hypothesis of no relation was an α less than 0.05 (Clarke and Warwick, 2001; Somerfield and others, 2021).
Permutation-based (999 permutations) biota-environment correlation analysis using a modified Mantel test (BIOENV test in the BEST routine) applied to the similarity matrix of the phytoplankton and cyanobacteria and the environmental variable dataset. The BIOENV analysis compared all possible combinations of environmental predictor to determine subsets of environmental variables that best explained the cyanobacterial community patterns in a phytoplankton similarity matrix. Termination criteria were based on the Spearman correlation coefficient rho (ρ) > 0.95 and delta rho (Δρ) < 0.001. The BIOENV analysis compares patterns in environmental variables with a resemblance matrix of species abundances or biomasses among samples to determine which environmental variables best explain differences in community compositions. In the BIOENV analysis, the species resemblance matrix is fixed, and similarity matrices are created with different subsets of environmental variables. By doing this one can determine which combination of environmental variables creates the resemblance matrix whose rank order best matches the rank order of community data among samples (Clarke and Warwick, 2001). Significance level of the test statistic was set as an α level of 0.05 for this study (p < 0.05 considered significant) (Clarke and Gorley, 2006; Clarke and others, 2014).
Principal component analysis (PCA) was conducted on BIOENV-selected environmental factors to better understand how the selected factors explained the observed variation among sites (Clarke and others, 2014). The selected factors, regarded as points in multi-dimensional space, were projected onto the best-fitting 2-dimensional plane using PCA. Output from the PCA includes eigenvalues (variances of each principal component axis), eigenvectors (coefficients for the linear combination of input factors that defines the plane), and principal component scores (coordinates of the samples on the PC axes computed using eigenvector coefficients). A percent variance (from eigenvalues) is computed to quantify the extent that the two principal component axes of the plane provide an accurate representation of the true association between the factors in the original multi-dimensional space.
Recursive partitioning is a nonparametric modeling technique that can select from large input datasets the variables that are most important in explaining the outcome variable. Recursive partitioning was used to investigate which predictor chemical constituents (for example nutrients, major ions, and metals) best explained splits in the response variables of T&Os and cyanotoxin concentrations. The test maximized the difference in the mean concentrations between split nodes with a minimum split size of five data points and creates a decision tree. The recursive partitioning uses a Chi-square automatic interaction detection (CHAID) algorithm to select and sequentially split the best explanatory variables at some “cut value,” creating tree-like branches of explanatory variables, associated with the outcome variable (Kass, 1980).
Results
Spatial (across sites and depths) and temporal (across sampling events) changes in selected environmental, phytoplankton, T&O-compound, and cyanotoxin variables were assessed as part of this study. The results of those assessments were then used to identify relations among environmental conditions, phytoplankton assemblages, and occurrences of T&O compounds and cyanotoxins at the five sites in the study area. Physical property and chemical constituent data for this study are available from Pfeifle and others (2017).
Environmental Variables
When the water near the surface of a lake or reservoir becomes warmer than the deeper cooler waters, thermal layers or stratification can form, producing limited mixing between the upper (epilimnion) and lower (hypolimnion) layers (Wetzel, 2001). This separation of the hypolimnion from the epilimnion can prevent the replenishment of DO and can form an anoxic, reducing environment in the hypolimnion. Nutrient species, such as sediment-bound phosphorus, complexed to metals or organics, can be re-released into the water column in reducing environments and can serve as a potential internal nutrient source. Therefore, sites were evaluated for thermal stratification and stratification of other physical and chemical constituents (figs. 1.1–1.13).
While the sampling depths at the surface zones were relatively consistent among the sites (1 m), depths of the deep zone varied across sites because of changing water levels over time and differing reservoir depths (fig. 1.1). The Cane Creek Reservoir (Cane Cr Res) and West Fork Eno River Reservoir (WF Eno Res) sites were located near their respective dams, resulting in deep-zone depths greater than 10 m, while the B. Everett Jordan Lake at Bells (Jordan Lake at Bells) and B. Everett Jordan Lake at Hwy 64 (Jordan Lake at Hwy 64) sites were located near the middle of the reservoirs with deep zones of 6 m and 8 m, respectively. The University Lake site also had a deep zone depth of about 6 m.
While thermal stratification was present at all sites in June and August, the degree of thermal stratification was less pronounced at the midlake sites in B. Everett Jordan Lake than at the other sites (fig. 1.2). In fact, thermal stratification was observed from April to October in Cane Cr Res, WF Eno Res, and University Lake sites. Specific conductance appeared to respond to the thermal stratification by exhibiting general increases in the deep zone compared to the photic zone (fig 1.3). These differences were especially pronounced in University and WF Eno Res, where greater depths were sampled (fig. 1.1).
For June and August sampling events, most sites had anoxic DO conditions (near 0 mg/L) in the deep zones (exception was Jordan Lake at Bells in August when conditions were hypoxic (below 2 mg/L) and Cane Cr Res that had missing DO measurements for August (fig. 1.4). University Lake and WF Eno Res sites consistently had hypoxic to anoxic conditions from April to October in the deep zones. During June and October sampling events, Cane Cr Res site had the least net loss of DO (loss of 5 to 6 mg/L) in the water column from the photic zone to the deep zone (with a 10-m change in depth). Jordan Lake at Bells and at Hwy 64 had net loss of more than 8 mg/L of DO with a 4- to 6-m change in depth, similar to the net loss at University Lake (7 to 8 mg/L with change in depth of more than 12 m) and WF Eno Res (6 to 8 mg/L with change in depth of more than 16 m). Concentrations of nutrient species and metals increased in the deep sampling zones under depleted DO conditions, resulting in increased specific conductance (figs. 1.3, 1.6–1.13). Overall, increasing depths tended to result in longer and more pronounced thermal stratification at those depths and increasing nutrient and metal concentrations in the deep zones during stratified periods.
The level of chlorophyll a, a pigment found in all phytoplankton, is used as an estimate of algal biomass in the water column and often serves as a regulatory standard. During the study period, five samples at four of the five sampled sites had chlorophyll a concentrations (exception was the WF Eno Res site) greater than the North Carolina State water-quality standard of 40 µg/L, indicating excessive algal production (NCDEQ, 2019). Median chlorophyll a concentrations were similar among sites based on the Wilcoxon rank sum test (table 3.1), and the median concentrations for all samples was 18.1 µg/L (table 2.1). Maximum chlorophyll a concentrations in the photic zone were 18.1 µg/L at WF Eno Res in April/May and June, 44 µg/L at Jordan Lake at Hwy 64 in October, 44.9 µg/L at Cane Cr Res in April/May, 47.9 µg/L at Jordan Lake at Bells in October, and 65 µg/L at University Lake in June (Cain and others, 2017). Elevated chlorophyll a concentrations were reported at these five sites from 2013 to 2016 (Pfeifle and others, 2016a, b, 2017).
Elevated nitrogen and phosphorus concentrations in the photic zone can contribute to increased algal production and may be sourced from internal (release from the lake sediment) or external (tributary inflow) loading. Overall, nitrogen species (total nitrogen, total organic nitrogen, ammonia, and nitrate plus nitrite) had similar concentration ranges among all of the five sites based on Wilcoxon rank sum tests (figs. 1.6–1.9, respectively); however, median total phosphorus concentrations at Cane Cr Res and WF Eno Res were lower than those in Jordan Lake Hwy 64 (fig. 1.10; table 3.1). Median total nitrogen and phosphorus concentrations in the photic zone for all sites were 0.76 and 0.037 mg/L, respectively (table 2.1). However, one of the inorganic, more bioavailable forms of nitrogen (nitrate plus nitrate) and phosphorus (as orthophosphate) were often below detectable levels, especially during the summer and fall sampling events in 2014 (figs. 1.9 and 1.11, respectively); median concentrations were below the LRLs of <0.01 and <0.004 mg/L, respectively. Pfeifle and others (2016b) reported a general trend of low nitrate plus nitrite levels during the summer months at these sites from 2013 to 2015. Statistical trends in seasonal nitrate plus nitrite at these sites for the period of 1989 to 2012 were not computed because greater than 45 percent of the data were censored (Giorgino and others, 2018). In contrast, total organic nitrogen and ammonia were more prevalent than nitrate in the reservoirs during summer and fall, whereby large fractions of the particulate form of organic nitrogen likely existed within the algal cell matrix (Wetzel, 2001).
MDS, overlain with results of the cluster analysis with SIMPROF testing and trajectories based on sampling events over time, was used to determine if distinguishable groupings were present among sites and seasons. Select environmental and response variables also were assessed by using ANOSIM to confirm these groupings. Multivariate examination with MDS and cluster analysis of 29 environmental factors (major ions, nutrients, metals, physical properties), 2 cyanotoxins (anatoxin-a, microcystin), and 2 T&Os (geosmin, MIB) among the 5 sites and 4 sampling events in the photic zone identified that environmental conditions varied by site (spatial factor) and by sampling event or season (figs. 2, 3).
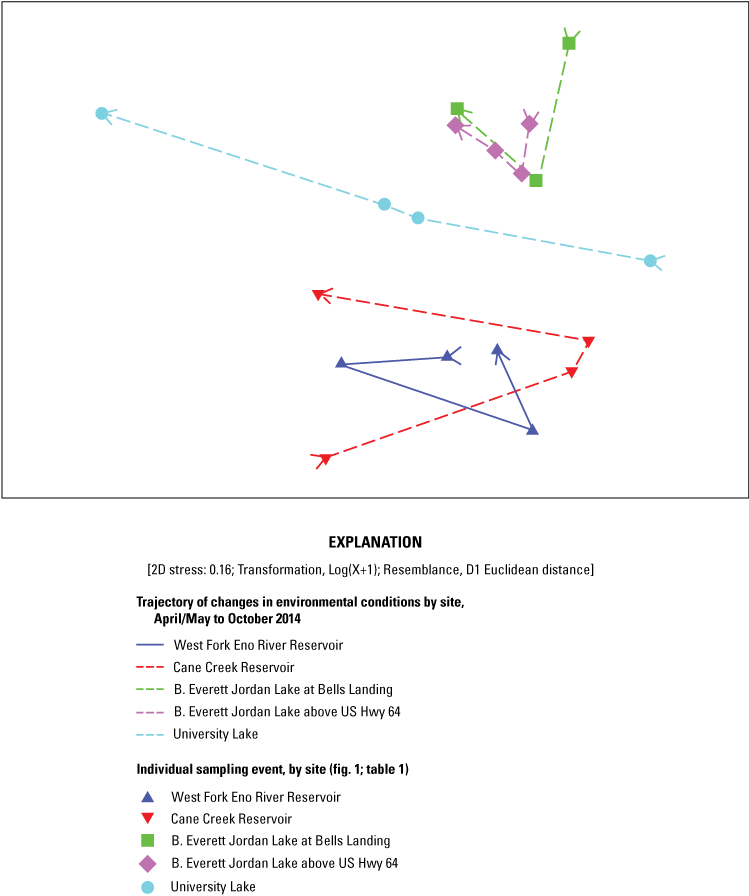
Two-dimensional (2D) nonmetric multidimensional scaling of 33 environmental and response factors, including major ions, nutrients, physical properties, cyanotoxins, and taste-and-odor compounds for 4 water-supply reservoirs in the Triangle Area Water Supply Monitoring Project study area in North Carolina, April–October 2014. [Two-dimensional stress value indicates adequacy of the multivariate ordination, such that as levels increase towards 0.3, the placement of points in the ordination space becomes harder to distinguish from arbitrarily placed points.]
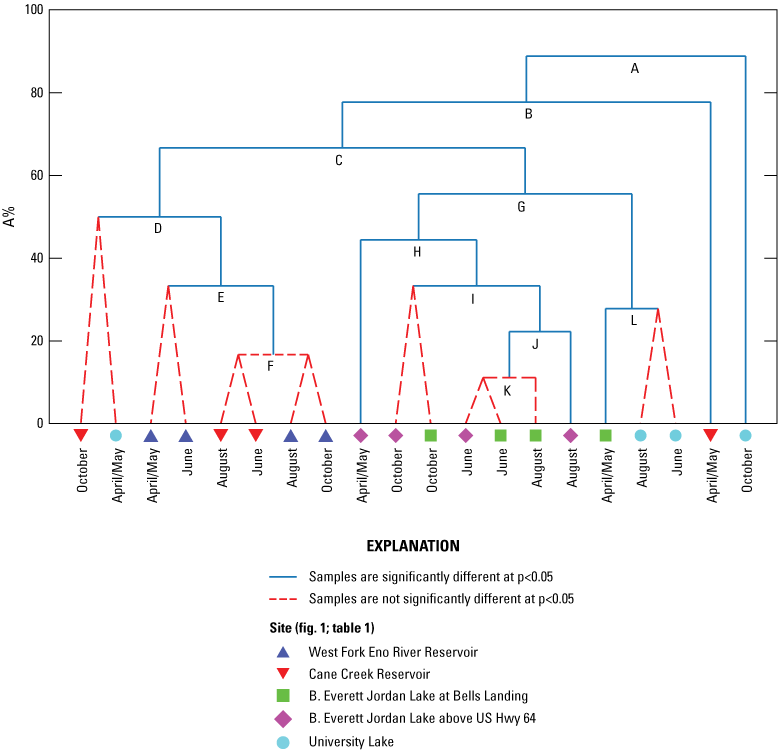
Constrained binary divisive cluster analysis (LINKTREE routine in PRIMER software) of environmental and response variables, plotted as percent dissimilarity (A%) by site and sampling event from four water-supply reservoirs in the Triangle Area Water Supply Monitoring Project study area in North Carolina, April–October 2014, with statistically significant groupings determined by similarity profile test (SIMPROF routine in PRIMER software) (red dotted lines indicate samples that are not significantly different at p < 0.05). [See table 1 and figure 1 for site information and location on West Fork Eno River Reservoir (West Fork Eno River Reservoir at dam near Cedar Grove, NC), Cane Creek Reservoir (Cane Creek Reservoir at dam near White Cross, NC), B. Everett Jordan Lake at Bells Landing (B.E. Jordan Lake at Bells Landing near Griffins Crossroads, NC), B. Everett Jordan Lake above US Hwy 64 (B.E. Jordan Lake above US Hwy 64 at Wilsonville, NC), and University Lake (University Lake at intakes near Chapel Hill, NC).]
As was observed in the Wilcoxon rank-sum tests of individual compound concentrations among sites (table 3.1), multivariate tests on MIB, geosmin, and microcystin patterns indicated they were similar among sites (ANOSIM Global R = −0.024, −0.045, and 0.144, respectively; p = 0.5091, 0.644, and 0.095, respectively) (table 3.2). Anatoxin-a was detected only in WF Eno Res and University Lake in August (0.16 and 0.17 µg/L, respectively), so it was not assessed individually but as part of the four response variables to determine if response variables were similar among sites (Global R = −0.065; p = 0.771). Basic water chemistry (major ions, metals, and physical properties) was different among sites (Global R = 0.421; p = 0.001). Based on pairwise tests, basic water chemistry at the two Jordan Lake sites was similar but was different from that at all other locations. Basic water chemistry in Cane Cr Res was similar to water chemistry in WF Eno Res and University Lake. Nutrient levels indicate similar nutrient conditions among reservoir sites (Global R = 0.071; p = 0.127). Results of ANOSIM tests on all four response variables at all sites among the four sampling events and three seasons (June and August samples were grouped as summer) indicated a difference among sampling events (Global R = 0.246; p = 0.003), where the April/May sampling event was different from the August and October sampling events. Of the individual response variables, only geosmin had seasonal differences (Global R = 0.211; p = 0.021), with the results from the April/May sampling event being different from those of the October and June events. The ANOSIM results indicated seasonal differences for basic water chemistry and nutrients (Global R = 0.229 and 0.192; p = 0.020 and 0.049, respectively), with samples collected during the spring being different from those collected during the summer.
Five environmental variables that best explained the biotic similarity matrix based on the BIOENV results were transparency, organic nitrogen, ammonia, potassium, and sulfate among sites and seasons (rho = 0.886; p = 0.001). To determine how spatial and temporal variation in these environmental factors may contribute to the site differences observed in the MDS, LINKTREE cluster, and ANOSIM analyses, a PCA was conducted on the 5 BIOENV-selected parameters plus 1 Wilcoxon-rank-sum-selected hardness (tables 3.1, 3.2)
The first principal component axis (PC1) mainly was influenced by differences in major ion patterns and accounted for 40.1 percent of the variation among sites and samples. The second PCA (PC2) axis mainly was influenced by nutrients and accounted for an additional 24 percent of the variation, that when combined with PC1, explained 64.1 percent of the cumulative variation.
Grouping of sites along the PC1 axis indicated that water in Jordan Lake sites plotted in the negative region of the PC1 axis, where increased major ion levels were indicated by the direction of the potassium, sulfate, and hardness vectors. Samples from University Lake plotted near the center of the PC1 axis while samples from WF Eno and Cane Cr Res sites clustered along the positive side of the PC1 axis, indicating decreased major ion levels relative to Jordan and University Lake samples (fig. 4; tables 3.3 and 3.4).
Seasonal trajectories that were overlain on the PCA plot indicate a general trend of increasing organic nitrogen and ammonia and decreasing transparency, based on the direction of their vectors relative to the PC2 axis, from June to October for University Lake, Jordan Lake, and Cane Cr Res sites (fig. 4). Samples from WF Eno Res site had a seasonal trajectory that was almost opposite of the trajectory for the other four sites.
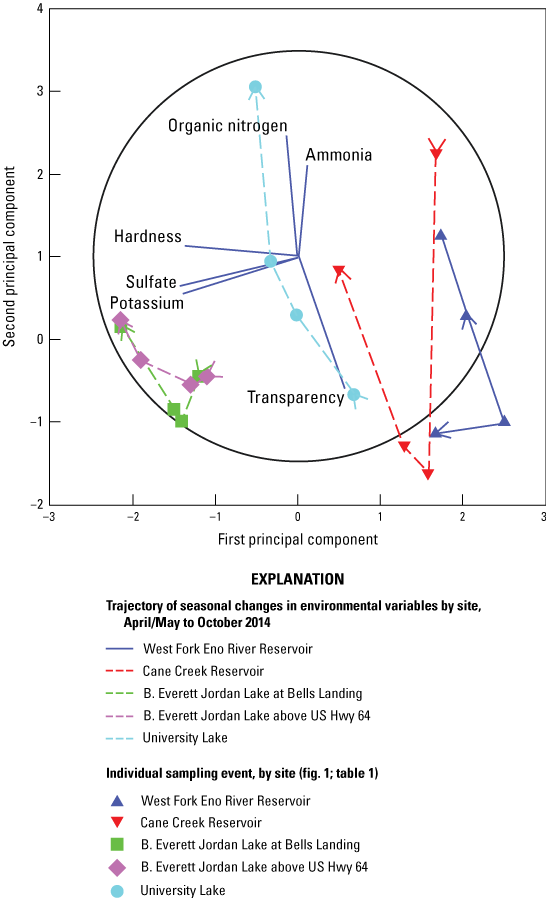
Principal component analysis plot for six selected environmental variables in four water-supply reservoirs in the Triangle Area Water Supply Monitoring Project study area in North Carolina, April–October 2014, that best explained the patterns of environmental conditions among the five sites (derived from BIOENV test in PRIMER software and Wilcoxon rank-sum test). [The circle represents the maximal vector. Ammonia expressed in the figure is the sum of the ammonia (NH3) and ammonium ion ([NH4]+). See table 1 and figure 1 for site information and location on West Fork Eno River Reservoir (West Fork Eno River Reservoir at dam near Cedar Grove, NC), Cane Creek Reservoir (Cane Creek Reservoir at dam near White Cross, NC), B. Everett Jordan Lake at Bells Landing (B.E. Jordan Lake at Bells Landing near Griffins Crossroads, NC), B. Everett Jordan Lake above US Hwy 64 (B.E. Jordan Lake above US Hwy 64 at Wilsonville, NC), and University Lake (University Lake at intakes near Chapel Hill, NC).]
Phytoplankton Assemblages
Phytoplankton enumeration during taxonomic analysis can be expressed as cell density (number of cells in a milliliter of sample water; cells/mL) or biovolume that incorporates cell size (cubic micrometers per milliliter of sample water; µm3/mL). Because phytoplankton cell size can range from less than 1 micrometer (picoplankton) to a few millimeters, biovolume gives a more accurate representation of phytoplankton community biomass than cell density (Hillebrand and others, 1999; Hrycik and others, 2019) and is considered more comparable to biomass estimates such as chlorophyll a concentrations. Phytoplankton taxa data that were classified to at least the genus level were included in analyses. Specifically, cyanobacteria assemblages periodically included picoplankton (less than 1-micrometer spheres) in the Chroococcales order that were not identifiable to genus level and were not included in some of the analyses using biovolumes.
In 2014, total phytoplankton biovolumes and cell densities varied by site and by sampling event among the five study sites (fig. 5; table 4.1). During the April/May sampling event, total biovolumes ranged from 893,633 µm3/mL at Jordan Lake at Bells site April/May to 30,353,863 µm3/mL at Cane Creek Res site. Total cell densities ranged from 50,103 cells/mL at Jordan Lake at Bells site in April/May to 604,664 cells/mL at Jordan Lake at Hwy 64 site in October. On the division level, Cyanophyta (listed as Cyanobacteria in the Integrated Taxonomic Information System, https://www.itis.gov) often were the most abundant by enumeration (cell count) (fig. 5A) and biomass (fig. 5B), especially during the summer months. Seasonal increases in other divisions, including Chlorophyta (green algae), Bacillariophyta (diatoms), Pyrrophyta (dinoflagellates), and Chrysophyta (golden algae), also were noted among the sites and sampling periods, especially in relation to phytoplankton cell densities, but the magnitude and timing of the increases appeared to vary by lake. For example, Cane Cr Res had its greatest Cyanophyta levels in the spring compared to the late summer and compared to maximums in the fall at the other sites (fig. 5; table 4.1). Therefore, a more robust multivariate analysis was needed to assess spatial and temporal differences among phytoplankton communities during the 2014 study period.
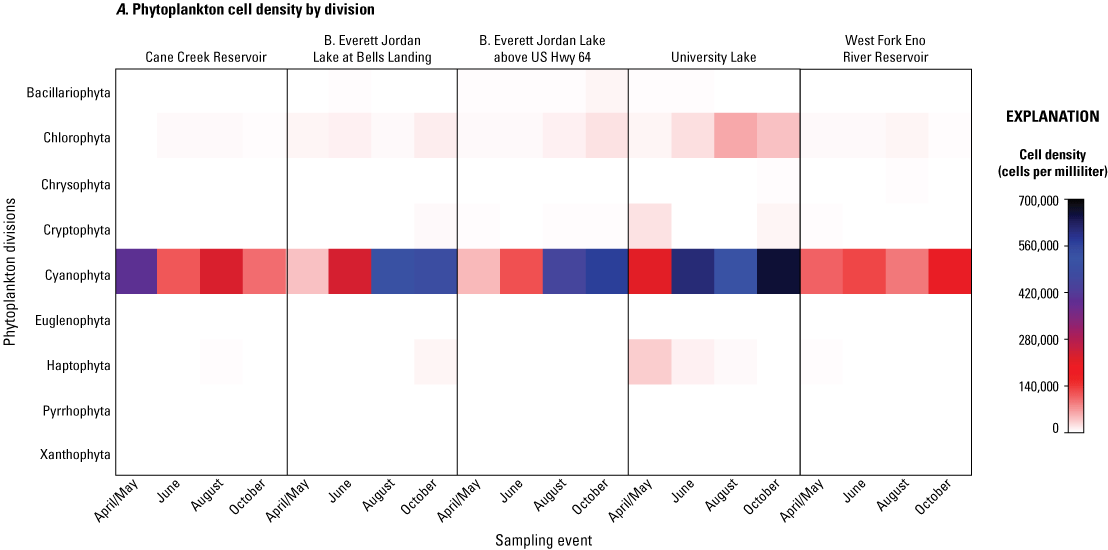
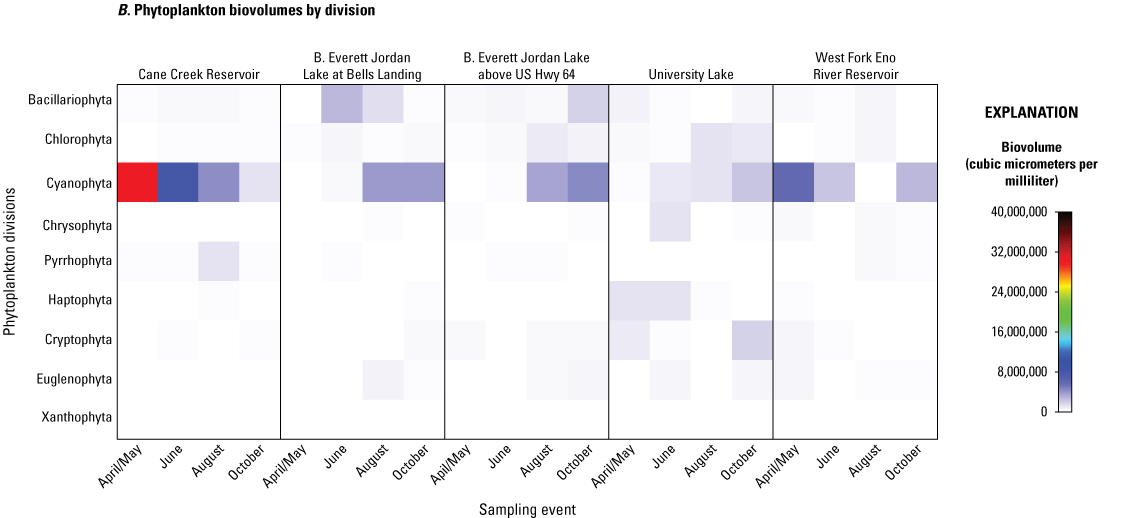
A, Cell densities, in cells per milliliter, and B, biovolumes of phytoplankton, in cubic micrometers per milliliter, by division and sampling event for five sites in four water-supply reservoirs in the Triangle Area Water Supply Monitoring Project study area in North Carolina, April–October 2014. [Taxonomic divisions included in this figure are from the taxonomic identification, enumeration, and biovolume estimates provided by Phycotech, Inc. (2022; St. Joseph, Michigan). See table 1 and figure 1 for site information and location on Cane Creek Reservoir (Cane Creek Reservoir at dam near White Cross, NC), B. Everett Jordan Lake at Bells Landing (B.E. Jordan Lake at Bells Landing near Griffins Crossroads, NC), B. Everett Jordan Lake above US Hwy 64 (B.E. Jordan Lake above US Hwy 64 at Wilsonville, NC), University Lake (University Lake at intakes near Chapel Hill, NC), and West Fork Eno River Reservoir (West Fork Eno River Reservoir at dam near Cedar Grove, NC).]
The phytoplankton community genera were tested by cluster (binary divisive cluster with SIMPROF test as stop rule) and ANOSIM analyses to evaluate similarities among sites and seasons. The test determined that significant differences were observed among sites when analyzed by community mass (biovolume) and enumeration (cell density) (Global R = 0.253 and 0.196, respectively; p = 0.003 and 0.015, respectively) (table 3.2). The associated pairwise test indicated that Cane Cr Res site had different phytoplankton assemblages as compared to Jordan Lake and University Lake sites, and WF Eno Res had different phytoplankton assemblages than Jordan Lake at Hwy 64. Further cluster and ANOSIM analyses were used to test for seasonal changes in phytoplankton assemblages by evaluating sampling event and season against community biovolume and cell density for all five sites, but the results indicated no or weak differences (sampling event: Global R = 0.075 and 0.144, respectively; p = 0.146 and 0.049, respectively) (season: Global R = 0.115 and 0.159, respectively; p = 0.160 and 0.061, respectively).
The next step was to group sites by similarities based on ANOSIM and cluster analyses. Jordan Lake at Bells, Jordan Lake at Hwy 64, and University Lake sites were grouped together, and the same tests were conducted on phytoplankton community biovolume and cell density data (as resemblance matrices). For this subgroup, ANOSIM and cluster analyses indicated that the phytoplankton assemblages in Jordan and University Lake sites in the April/May and June sampling events were different from those in the August and October sampling events for biovolume and cell density (Global R = 0.401 and 0.504, respectively; p = 0.014 and 0.004, respectively) (table 3.2). The Cane Cr Res and WF Eno Res sites formed the second subgroup, and tests on that dataset did not indicate strong seasonal differences in phytoplankton taxa biovolume or cell density (Global R = 0.229 and 0.313, respectively; p = 0.210 and 0.105, respectively).
Further multivariate evaluation was conducted on phytoplankton assemblages, specifically among the cyanobacteria (genera in the Cyanophyta division), to determine linkages among changes in the phytoplankton community and changes in environmental and response variables (cyanotoxins and T&O compounds). To determine how significant a role cyanobacteria played in the changes within phytoplankton assemblages, a biota-environmental correlation analysis (BIOENV test in BEST routine; permutations = 999) was applied to the 5-site phytoplankton genera biovolume dataset (as a resemblance matrix), and the Cyanophyta division was selected as the optimal 1-variable model (out of 9 possible divisions) that explained the complex phytoplankton community patterns (rho = 0.676; p = 0.001). Further relational analysis (RELATE routine) determined that patterns of phytoplankton genera were associated with patterns in environmental conditions (as resemblance matrices) (rho = 0.381; p = 0.006). Therefore, further analysis of the relation between environmental conditions and phytoplankton community are assessed in later sections of this report.
The fact that cyanobacteria explained a large part of the variability in the phytoplankton community assemblage in the multivariate statistical analysis may be attributed to the frequent domination of cyanobacteria (greater than 50 percent of phytoplankton community) over other divisions during the study period. While level of dominance varied by site and season, all five sites exhibited cyanobacteria dominance by cell densities during all sampling events (fig. 5; table 4.1). However, that pattern was not repeated for cyanobacterial total biovolumes. Only Cane Cr Res had cyanobacteria dominating by biovolume for all sampling events, and that biovolume gradually declined from a maximum of 30,042,724 µm3/mL in April/May to an-elevated 1,125,237 µm3/mL in October (from 99 to 68 percent of the total phytoplankton biovolume, respectively).
WF Eno Res had a maximum cyanobacteria total biovolume in the April/May sampling event of 5,776,338 µm3/mL (76 percent of the total phytoplankton biovolume), and cyanobacteria dominated during the June and October sampling events (78 and 81 percent, respectively). WF Eno Res experienced a diverse phytoplankton assemblage in August, however, in which taxa from many other divisions, especially Chlorophyta (green algae) and Bacillariophyta (diatoms), were more abundant than cyanobacteria.
At University Lake, cyanobacteria biovolumes remained relatively low during the April/May and June sampling events compared to other divisions (especially Chlorophyta, Chrysophyta, and Haptophyta), but was the largest part of the phytoplankton community in August (44 percent) even though cyanobacteria never dominated.
Jordan Lake at Bells and Jordan Lake at Hwy 64 had similar phytoplankton assemblage patterns, in April/May and June, in which biovolumes of the Bacillariophyta and Chlorophyta divisions represented a larger percentage of the total phytoplankton community than cyanobacteria (4 to 14 percent of the total biovolume), but cyanobacteria were dominant in the August and October sampling events (56 to 78 percent).
Cyanobacteria genera within the Cyanophyta division in the study reservoirs belonged to one of two orders that have somewhat different environmental behaviors and preferences: Chroococcales, which contain coccoid, spherical bacteria forms that can be unicellular or colonial; or Nostocales, which contain multicellular, filamentous forms with some potential nitrogen fixers (table 4.2; Wehr and Sheath, 2003). Many species of both orders were identified at the five sites during the study period. At the five sites, coccoid cyanobacteria were frequently present during all sampling events and tended to be at biovolumes in the 100,000 µm3/mL range (fig. 6A). Cyanobacteria species in the Chroococcales order in the same family as Synechocystis genus and with similar characteristics of a spherical and nonmotile picoplankton (size less than 1 micron), were unable to be identified to genus by microscopy alone but contributed significantly to the total phytoplankton cell densities (range less than 1 to 68 percent; 75th quartile of 30 percent). However, because of its extremely small size, this cyanobacteria picoplankton had only a minor contribution to total phytoplankton total biovolumes (range 0 to 1 percent; 75th quartile of 0.6 percent). Therefore, the unknown cyanobacteria picoplankton was included in the cell density counts and in the cell density statistical analysis but was omitted in the biovolume counts and analysis. Except for the unidentified cyanobacteria picoplankton, 15 coccoid cyanobacteria genera were identified. Potential cyanotoxin producers, including Aphanocapsa, Microcystis, Snowella, and Woronichinia, were present at the sites. Picoplankton genera Synechococcus and Synechocystis have the potential to produce microcystin. Synechococcus also is capable of producing geosmin and MIB. Synechococcus and Synechocystis were nearly ubiquitously present across sites and sampling event as shown by periods of elevated cell densities (fig. 6A); however, because of their small size, these species had low biovolumes compared to other genera (fig. 6B).
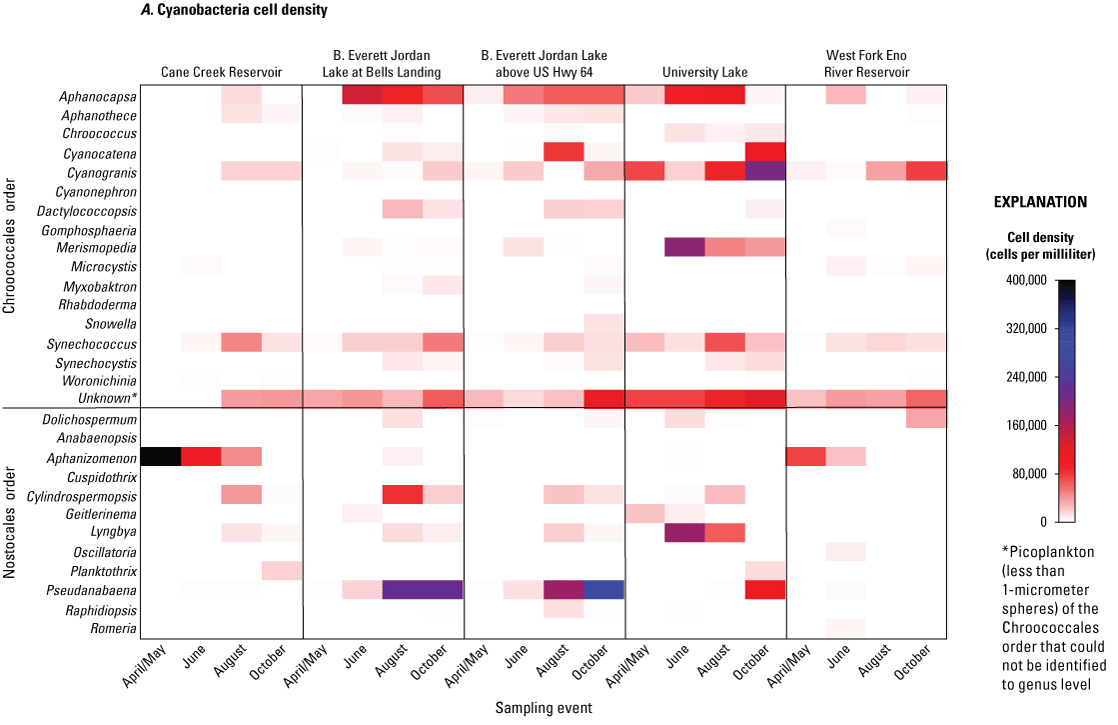
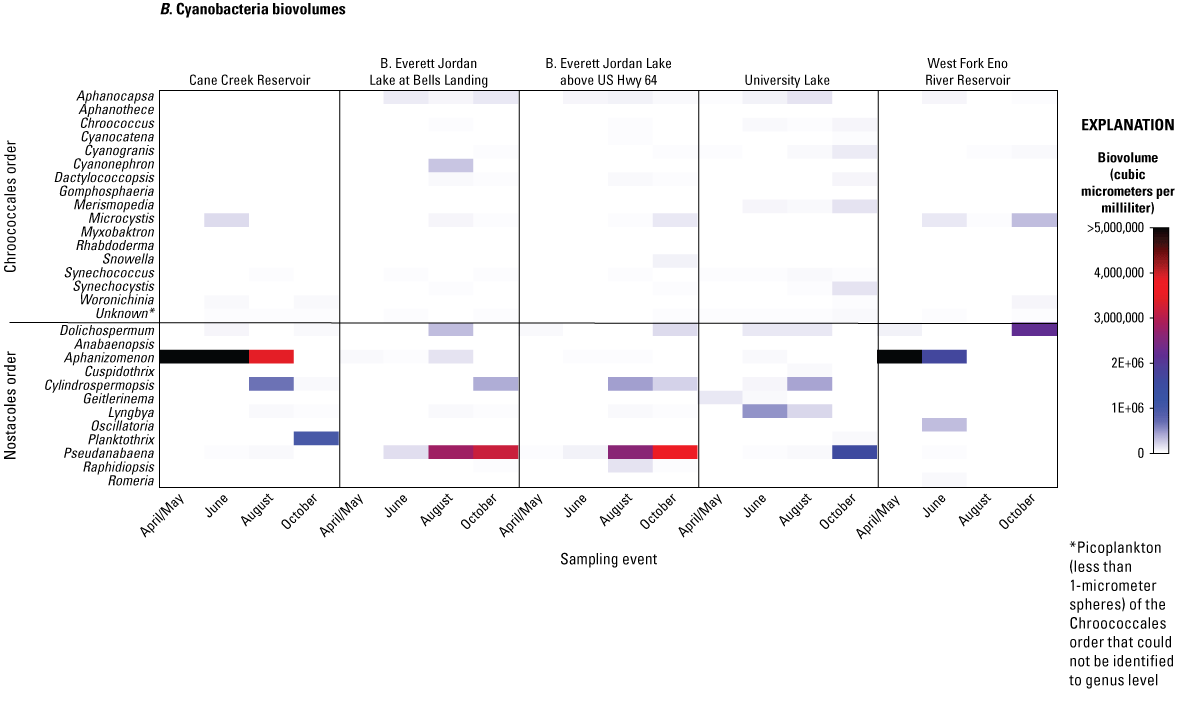
A, Cell densities, in cells per milliliter, and B, biovolumes of cyanobacteria, in cubic micrometers per milliliter, by genus, order, and sampling event for five sites in four water-supply reservoirs in the Triangle Area Water Supply Monitoring Project study area in North Carolina, April–October 2014. [Taxonomic divisions included in this figure are from the taxonomic identification, enumeration, and biovolume estimates provided by Phycotech, Inc. (2022; St. Joseph, Michigan). See table 1 and figure 1 for site information and location on Cane Creek Reservoir (Cane Creek Reservoir at dam near White Cross, NC), B. Everett Jordan Lake at Bells Landing (B.E. Jordan Lake at Bells Landing near Griffins Crossroads, NC), B. Everett Jordan Lake above US Hwy 64 (B.E. Jordan Lake above US Hwy 64 at Wilsonville, NC), University Lake (University Lake at intakes near Chapel Hill, NC), and West Fork Eno River Reservoir (West Fork Eno River Reservoir at dam near Cedar Grove, NC).]
Cyanobacteria in the filamentous form (Nostocales order) were in biovolumes of one to two orders of magnitude greater than those in the coccoid form (Chroccocales order) (table 4.2). Filamentous cyanobacteria included 12 genera that also had species capable of producing cyanotoxins and T&O compounds; these genera included Dolichospermum, Pseudanabaena, Aphanizomenon, Lyngbya, and Cylindrospermopsis (fig. 6B). The occurrences and biovolumes of these five species varied among the sites and seasons.
At Cane Cr Res from April to August, the filamentous Aphanizomenon was the most dominant genus, with an April/May biovolume of about 30,000,000 µm3/mL (99 percent of total biovolume) that decreased gradually to a biovolume of about 3,500,000 µm3/mL (59 percent of total biovolume) during the August sampling event when Cylindrospermopsis was present at a biovolume of about 670,000 µm3/mL (11 percent of total biovolume). During the October sampling event at Cane Cr Res, Planktothrix was the dominant cyanobacteria at a biovolume of about 980,000 µm3/mL (60 percent of total biovolume). Although some Aphanizomenon species are considered a potential producer of geosmin, the cyanotoxin cylindrospermopsin, and anatoxins, this genus is not known to be a producer of microcystin or MIB.
Similar to Cane Cr Res, WF Eno Res site had Aphanizomenon as the most dominant cyanobacteria and total phytoplankton genus, with an April/May biovolume of about 5,700,000 µm3/mL (75 percent of total biovolume) that decreased gradually to a biovolume of about 1,680,000 µm3/mL (59 percent of total biovolume) during the June sampling event (fig. 6B). Cylindrospermopsis was present at all sites in August except for the WF Eno Res site (fig. 6A). Instead, Dolichospermum (biovolume of about 2,100,000 µm3/mL [67 percent of total biovolume]) dominated in the October sampling event at WF Eno Res site. While no abundant filamentous cyanobacteria were present in August at the WF Eno Res site, Woronichinia and Microcystis were the most abundant potential cyanotoxin-producing cyanobacteria at biovolumes of about 68,000 and 310,000 µm3/mL, respectively (2 and 9.5 percent of total biovolume, respectively).
Jordan Lake at Bells and Jordan Lake at Hwy 64 sites had similar filamentous cyanobacteria assemblages. In the April/May sampling event, Pseudanabaena was present at the two sites at low biovolumes of 7,175 and 17,938 µm3/mL (less than 1 and 1.6 percent total biovolume), respectively, increasing to about 160,000 and 82,000 µm3/mL (4.5 and 6.9 percent total biovolume), respectively, in June. At the Jordan Lake sites, Pseudanabaena became the predominant cyanobacteria and total phytoplankton genus in August and October, with biovolumes that ranged from about 2,600,000 to 3,600,000 µm3/mL (46 to 65 percent of total biovolume).
University Lake site had less abundant, more unique, and more diverse cyanobacteria than other sites. The most abundant filamentous cyanobacteria genus changed from Geitlerinema (formerly Oscillatoria) in April/May (about 110,000 µm3/mL; 3.8 percent of total biovolume), to Lyngbya (alternate name: Planktolyngbya) in June (about 510,000 µm3/mL; 12 percent of total biovolume), Cylindrospermopsis in August (about 420,000 µm3/mL; 17 percent of total biovolume), and Pseudanabaena in October (about 1,600,000 µm3/mL; 26.4 percent of total biovolume) (fig. 6B).
To further investigate the complex dynamics of the cyanobacteria community structure over the study period, multivariate analytical techniques were applied to determine if temporal and spatial differences in cyanobacteria species biovolumes were statistically relevant, and, if so, could those differences be attributed to environmental conditions in the reservoirs during sampling events. Results of cluster analysis with SIMPROF and ANOSIM on the resemblance matrix of cyanobacterial species biovolumes and cell densities indicated that cyanobacterial genera varied significantly by site (Global R = 0.198; and R = 0.146; p = 0.026 and p = 0.050, respectively; table 3.2; figs. 6, 7). Associated pairwise tests indicated that Jordan Lake at Hwy 64 was not similar to Cane Cr Res or WF Eno (figs. 6, 7). The ANOSIM test also was used to identify any differences in cyanobacteria biovolumes or cell densities among sampling events for all sites, and results indicated that cyanobacterial community during the April/May sampling event was different from that during the August and October sampling events at all sites (Global R = 0.191 and 0.214; p = 0.015 and 0.012, respectively).
The BEST routine using BIOENV analysis on cyanobacterial biovolume similarity matrix and the 10 variables measured in the photic zone, including nutrient and basic chemistry data, indicated that within-site cyanobacterial community similarities across sampling event and sites were best explained by transparency, total organic nitrogen, total organic carbon, and hardness concentrations (rho = 0.650; p = 0.001). When subsets of the cyanobacterial community were evaluated separately based on the potential for cyanotoxin or T&O production, environmental conditions that best explained within-site variations in potential MIB- and microcystin-producer communities were sulfate, total organic nitrogen, total organic carbon, and hardness (rho = 0.579 and 0.604; p = 0.002 and 0.002, respectively). Environmental conditions that best explained within-site potential geosmin-producer communities included similar variables of total organic nitrogen, total organic carbon, and hardness but replaced sulfate with transparency (rho = 0.651, p = 0.001). This switch from sulfate to transparency as explanatory variables could be because geosmin concentrations tended to be highest in the spring for most sites, when waters had greater transparency (lower chlorophyll a and phytoplankton biomass), and microcystin and MIB tended to be higher in the late summer when stronger stratified, anoxic conditions could release sediment-bound sulfur to the water column.
Taste-and-Odor Compounds and Cyanotoxin Occurrence and Trends
The T&O compound geosmin and the cyanotoxin microcystin were relatively ubiquitous in the samples over the duration of the study (detected in 19 and 18 of 20 samples, respectively; fig. 7). Geosmin concentrations periodically exceeded the human detection threshold of 15 ng/L at all sites except Jordan Lake at Hwy 64. The frequency of total microcystin detections and concentrations may be positively biased, however, as indicated by the detection of microcystin in the blank, which artificially increased the positive bias by about 15 percent, assuming influence on concentrations equal to or less than 0.14 µg/L in 4 of 18 samples with detectable total microcystin. Potentially influenced samples included those collected from Cane Cr Res during April/May and October and both Jordan Lake sites during April/May when detectable total microcystin concentrations ranged from 0.11 to 0.14 µg/L, which represented the sites’ minimum concentrations. Total microcystin results must therefore be interpreted with caution because of the increased uncertainty in the quantitative values, further supporting the need to apply nonparametric ranking techniques in the statistical analyses. The T&O compound MIB was detected in slightly more than half of the samples at concentrations that tended to be below the human detection threshold of about 15 ng/L (11 of 20 samples; fig. 7). Anatoxin-a was detected only during the August sampling event at WF Eno Res and University Lake sites (2 of 20 samples; fig. 7). Limited detections of anatoxin-a restricted further statistical analyses of trends and associative factors. No other tested variant-specific cyanotoxins (cylindrospermopsin, saxitoxin, and nodularin) or biotoxins (domoic acid and okadaic acid) were detected during the study.
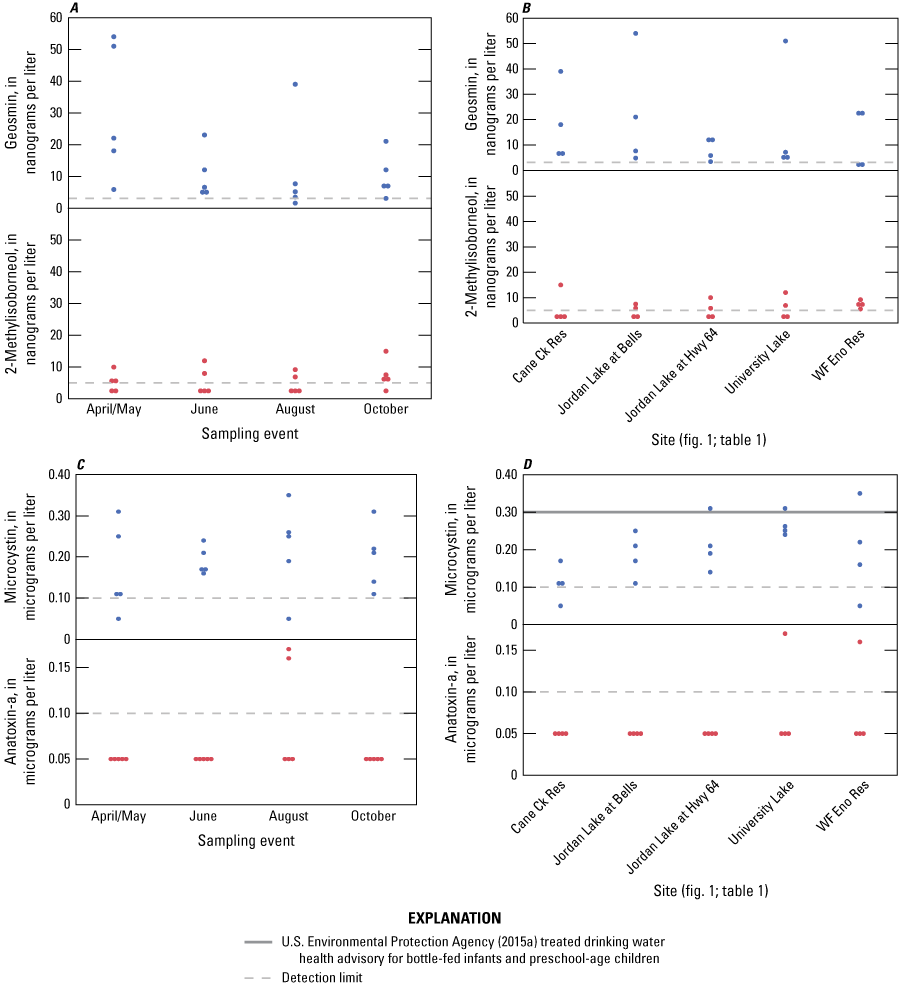
Concentrations of A and B, taste-and-odor compounds and C and D, cyanotoxins, by A and C, sampling event and B and D, site at five water-supply reservoir sites in the Triangle area, North Carolina, 2014. Dashed gray lines indicate limits of detection for respective constituents. Blue and red symbols depict the two different variables on each set of graphs. Solid black line (D) indicates the U.S. Environmental Protection Agency (EPA, 2015a) drinking water 10-day health advisory for bottle-fed infants and preschool-age children for treated drinking water. Concentrations in samples without detections were estimated at 50 percent of the laboratory reporting level. [See table 1 and figure 1 for site information and location on Cane Cr Res (Cane Creek Reservoir at dam near White Cross, NC), Jordan Lake at Bells (B.E. Jordan Lake at Bells Landing near Griffins Crossroads, NC), Jordan Lake at Hwy 64 (B.E. Jordan Lake above US Hwy 64 at Wilsonville, NC), University Lake (University Lake at intakes near Chapel Hill, NC), and WF Eno Res (West Fork Eno River Reservoir at dam near Cedar Grove, NC).]
Maximum geosmin concentrations for this study occurred during the April/May sampling event at Jordan Lake at Bells and University Lake (54 and 51, respectively; fig. 7B). Maximum geosmin concentrations at Cane Cr Res site were collected during the August sampling event (39 ng/L), but geosmin concentrations still exceeded the human threshold level of 15 ng/L during the April/May sampling event (18 ng/L). WF Eno Res site had relatively consistent maximum geosmin concentrations of 22 and 23 ng/L during April/May and June sampling events, respectively, that exceeded the human threshold level. The maximum geosmin concentrations from Jordan Lake at Hwy 64 also were collected during the April/May and August sampling events; however, the concentrations were relatively low (12 ng/L) compared to maximum geosmin concentrations at other sites. Wilcoxon rank-sum tests on geosmin concentrations combined across sites indicated no significant differences among sampling events (chi-squared = 4.547, p = 0.208) or sites (chi-squared = 1.049, p = 0.902).
No significant trends in MIB or microcystin levels were detected across sampling events (chi-squared = 3.954 and 4.721; p = 0.267 and 0.193, respectively; fig. 7) or sites (1.733, and 8.108; p = 0.785 and 0.0877, respectively; fig. 7). Microcystin concentrations were compared to existing EPA guidelines for recreational and drinking water. Microcystin levels remained well below the EPA RWQC and SA for recreational water (8 µg/L) during the study period (EPA, 2019). Three samples had microcystin levels that approached or exceeded the EPA 10-day HA for treated drinking water of 0.3 µg/L for bottle-fed infants and preschool-age children (EPA, 2015b). Even though the samples in this study were not treated drinking water, making a comparison to the HA not applicable, the results of the comparison indicated that a potential exists for microcystin to be present at levels of concern for drinking water utilities.
The BIOENV routine was applied to patterns of cell densities and biovolumes of select genera that have species of potential producers against patterns of microcystin and T&O compounds. Across sites and sample events, no significant BIOENV models for associated genera for MIB production were found, although Synechococcus, Lyngbya, and Oscillatoria biovolumes and Oscillatoria and Pseudanabaena cell densities were selected predictors of MIB concentrations (rho = 0.062 and 0.224; p = 0.792 and 0.518, respectively). Of the potential geosmin-producing genera, the BIOENV model that best explained geosmin concentrations across sites and sampling events selected patterns of Dolichospermum genus biovolumes (rho = 0.386, p = 0.038) and cell densities (rho = 0.352, p = 0.085). Of the potential microcystin-producing genera, BIOENV models for associated genera for microcystin production across sites and sampling events were weak to not significant, but the model output selected cell densities of Aphanocapsa and Synechococcus (average rho = 0.281, p = 0.181) and biovolumes of Aphanocapsa, Microcystis, and Synechococcus (rho = 0.282, p = 0.217).
Spearman’s rank correlation analyses of T&O and cyanotoxin concentrations against biovolumes and cell densities of potential cyanobacteria producers were conducted on sites grouped by ANOSIM pairwise tests to assess if linear relations existed. In the eight samples collected from the two Jordan Lake sites, cell densities and biovolumes of Pseudanabaena correlated the strongest to microcystin concentrations (rho = 0.9701, p < 0.001), followed by Microcystis (rho = 0.9315, p = 0.008), Synechocystis (rho = 0.7952, p = 0.018), and Lyngbya (rho = 0.7401, p = 0.036). In the eight samples collected from Cane Creek and WF Eno Res sites, microcystin concentrations correlated with cell densities and biovolumes of Microcystis (rho = 0.7189, p = 0.045 and rho = 0.7959, p = 0.018, respectively). Microcystin concentrations in four samples from University Lake had the strongest correlation to Pseudanabaena and Synechocystis (rho = 0.8000, p = 0.200), but the sample size was too small to be significant. MIB and geosmin concentrations did not correlate to potential T&O producers at any of the sites (p > 0.05).
Recursive partitioning of geosmin concentrations indicated that total N, total organic N, and total phosphorous were the top explanatory variables for splitting geosmin concentrations, albeit the degree these variables explained geosmin concentrations was relatively weak (R2 = 0.464; fig. 8A). All geosmin concentrations greater than 30 µg/L were associated with total organic N concentrations below 0.64 mg/L; however, two samples with total organic N concentrations below 0.64 mg/L had geosmin concentrations below 10 ng/L, including one nondetection. The second recursive partitioning split indicated that samples with total N greater than or equal to 0.77 mg/L had a mean geosmin concentration of 13.1 ng/L, whereas the mean geosmin concentration was 4.8 ng/L for samples with total N below 0.77 mg/L. Further sampling is necessary to understand how different forms of nitrogen may affect cyanobacteria community composition and production of geosmin and how those dynamics vary across sites and seasons.
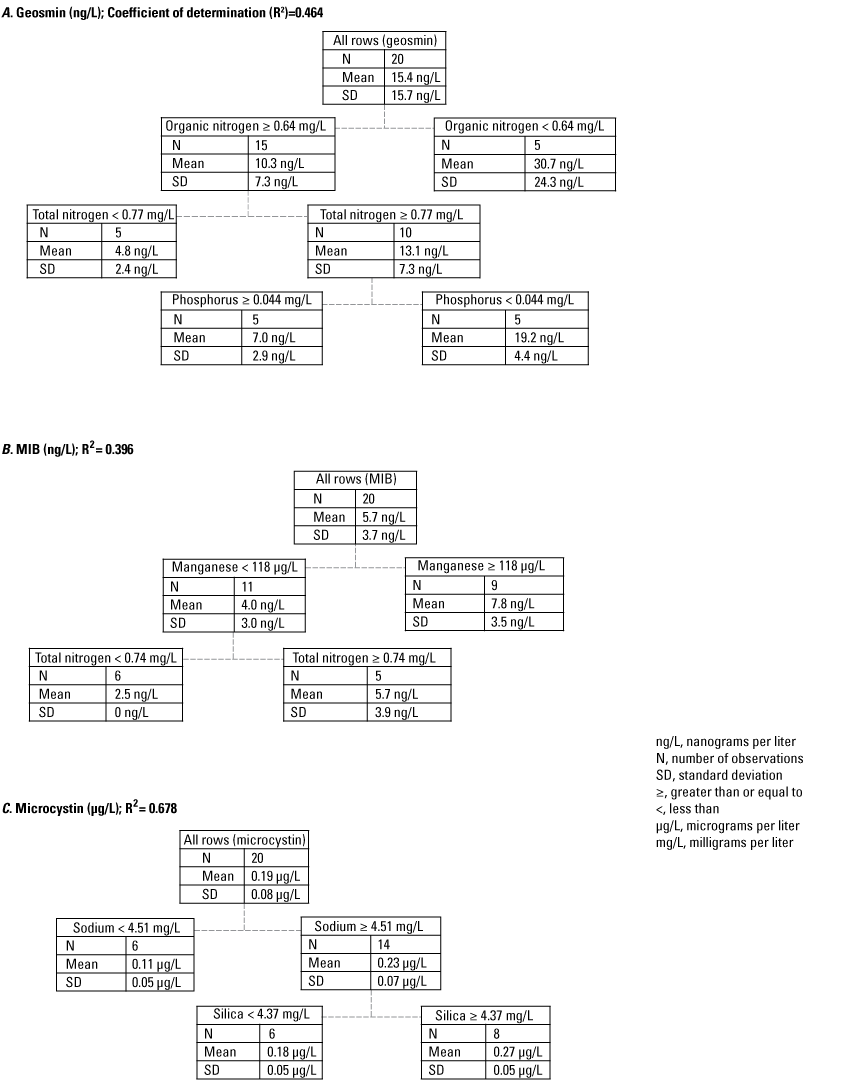
Recursive partitioning splits for concentrations of A, geosmin, B, 2-methylisoborneol (MIB), and C, microcystin for data collected from four water-supply reservoirs in the Triangle area, North Carolina, 2014.
Manganese and total nitrogen were the chemical constituents that best split MIB concentrations in the analysis, where samples with manganese concentrations less than 118 µg/L and total N concentrations less than 0.74 mg/L were associated with undetectable levels of MIB (fig. 8). Microcystin concentrations were best split by sodium and silica, where samples with sodium concentrations greater than or equal to 4.51 mg/L had a mean microcystin concentration of 0.23 µg/L and silica concentrations greater than or equal to 4.37 mg/L had a mean microcystin concentration of 0.27 µg/L (standard deviation = 0.05; fig. 8) and included all samples with microcystin concentrations greater than 0.3 µg/L.
Discussion
This report summarizes results from a 1-year (2014) assessment of phytoplankton communities and T&O and cyanotoxin concentrations across four drinking-water reservoirs in the Triangle area of North Carolina. Despite the limited temporal scope of this study, findings provide an initial assessment of both the co-occurrence of T&O compounds and cyanotoxins and the co-occurrence of T&O and cyanotoxin-producer communities at the sites.
Cyanobacteria and Cyanotoxin Dynamics
Similar to results of previous phytoplankton assessments of reservoirs in the North Carolina Piedmont ecoregion, cyanobacteria frequently dominated the phytoplankton community across all sites and sampling events based on cell densities and composed the majority (greater than 50 percent) of the phytoplankton biovolume in more than half the samples (Touchette and others, 2007; Wiltsie and others, 2018) Discrepancy between the two measurements in this study was attributed to the ubiquitous presence of small coccoidal and picoplankton forms of cyanobacteria that contributed many cells, but small cell sizes produced low biovolumes. Touchette and others (2007) conducted phytoplankton community assessments across 11 North Carolina Piedmont reservoirs, including B. Everett Jordan Lake, and found that total cyanobacteria cell densities were 60–95 percent of the total phytoplankton community across all reservoirs. Similarly, in this study cyanobacteria constituted approximately 76 percent to almost 100 percent of the total phytoplankton community across all samples. Wiltsie and others (2018) conducted a 6-year study at Jordan Lake with data collection at nine locations, including the New Hope River, Morgan Creek, and Haw River inflow dominated zones, which overlapped the current study. Wiltsie and others (2018) also reported that cyanobacteria were the most abundant (highest cell density) phytoplankton in Jordan Lake between 2011 and 2016.
Touchette and others (2007) reported frequent detections of microcystin in samples, indicating microcystin occurrence may be an issue that encompasses reservoirs beyond the specific area of this study. Similar to the results of this study, Wiltsie and others (2018) also reported frequent detections of microcystin throughout B. Everett Jordan Lake across seasons from August 2015 to December 2016 based on passive samplers called Solid Phase Adsorption Toxin Tracking devices (SPATT; MacKenzie and others, 2004). Grab samples were collected and analyzed for dissolved microcystin to corroborate the SPATT concentrations. Samples collected from B. Everett Jordan Lake in 2015–16 (Wiltsie and others, 2018) had a much lower frequency (15 percent) of detectable dissolved (extracellular only) microcystin concentrations than the total (intra- and extracellular forms) microcystin results (100 percent) reported in this 2014 study. Total microcystin concentrations were weakly explained by patterns of the potential microcystin-producing genera of Aphanocapsa, Microcystis, Planktothrix, and Synechococcus metrics, but were linearly correlated with increases in Microcystis, Pseudanabaena, and Synechocystis biovolumes and cell densities at the sites. Wiltsie and others (2018) also reported a multivariate association between dissolved microcystin concentrations and cyanobacteria (all genera) patterns that included Merismopedia, Pseudanabaena, Raphidiopsis, and Aphanothece. Discrepancies between the study described herein and Wiltsie and others (2018) may reflect differences in the targeted form of microcystin between the studies, with Wiltsie and others (2018) targeting the extracellular or released form and this study targeting combined intracellular and extracellular (cells lysed before analysis) forms. Additionally, sampling sites in the Wiltsie and others (2018) study were closer to the more tributary-influenced arms (eight out of nine sites) than the midlake sampling sites used in this study, indicating that Wiltsie and others (2018) reported sites may have been less influenced by lake stratification. Lastly, the possibility exists that the detection rate of microcystin in the study described herein was overestimated by up to 25 percent because of potential positive bias.
Anatoxin-a was detected in 2 of 20 samples collected during this study, neither of which were from B. Everett Jordan Lake. In contrast, Wiltsie and others (2018) reported anatoxin-a in 57 percent of grab samples (n = 69) and 100 percent of SPATT samples (n = 23) from B. Everett Jordan Lake. Cylindrospermopsin also was detected in 10 percent of 63 grab samples and 13 percent of 24 SPATT samples in the Wiltsie and others (2018) study, whereas this cyanotoxin was not detected in this study. Discrepancies between cyanotoxin results reported in Wiltsie and others (2018) and this study are not unexpected, given the differences in sampling periods, spatial coverage of the B. Everett Jordan Lake arms, targeted cyanotoxin fraction (extracellular versus combined, respectively), sample location in the water column, and analytical methods. The results of the two studies could also be indicative of the sporadic nature of some cyanotoxin occurrences. The differences in the results of the two studies do, however, prompt questions regarding the inter-year variability in cyanotoxin dynamics at the sites and further exemplify the limitations of inferences about general trends in cyanotoxin dynamics of the systems based on the data collected from this 4-month study.
In some instances, levels of T&O compounds or cyanotoxins were among the highest measured when the total biovolume of potential producers was simultaneously low relative to other sampling events, suggesting that the biovolume of potential producers was not a reliable predictor of concentrations of T&O compounds or cyanotoxins across sites. Microcystin concentrations were significantly correlated with Microcystis, Pseudanabaena, and Synechocystis biovolumes and cell densities. Geosmin and MIB were not significantly correlated with cyanobacteria biovolumes or cell densities, possibly because in reservoirs with multiple species capable of cyanotoxins or T&O compounds, especially during non-bloom conditions, the most abundant species may not be responsible for the production of cyanotoxins or T&O compounds. Instead, the species that possesses and activates the appropriate synthase gene in the molecular makeup determines the production of these compounds, which was not accounted for in this study (Tillett and others, 2000; Otten and others, 2016). Other explanations for the weak or lack of association could be that the cyanobacteria producer varied by sampling event and site, creating scatter in the analysis, or that benthic cyanobacteria not monitored in this study contributed as a source.
Screening for T&O compounds and cyanotoxins is the most direct way to assess the risk of T&O compounds and cyanotoxins; however, these analyses can be time-consuming and cost prohibitive. If the failure to detect an association between potential producers of T&O compounds and cyanotoxins was because the cyanobacteria were nontoxigenic, an alternative method for assessing the potential for HABs in lieu of direct screening for T&O compounds or cyanotoxins could be to screen for the presence and abundance of genes that can produce T&O compounds or cyanotoxins. Previous studies that have investigated correlations between microcystin-, cylindrospermopsin-, and saxitoxin-producing gene concentrations, and the respective cyanotoxin concentrations have indicated mixed results (Pacheco and others, 2016; Christensen and Khan, 2020). Further investigation would be necessary to determine if screening for genes that produce T&O compounds and cyanotoxins is an appropriate approach for assessing the occurrence and severity of HABs in water-supply reservoirs in the Triangle area. Additionally, future studies may benefit from more frequent sampling (for example, weekly and seasonally) to measure and assess conditions associated with the occurrence of forthcoming HABs (Myer and others, 2020). Long-term data collection may be necessary to inform model development (Park and others, 2021), such as mixing models, which can be used to relate environmental variables and cyanotoxin co-occurrence to human exposure risk (Christensen and others, 2021).
Physical Property and Chemical Constituent Associations with Taste-and-Odor Compounds and Cyanotoxins
The water-supply reservoirs in this study are classified as eutrophic. Chlorophyll a concentrations, which serve as a surrogate of algal production and, when elevated, indicate conditions favorable to HABs (World Health Organization, 2003), generally were below the North Carolina State water-quality standard of 40 µg/L. This was even the case during sampling events where cyanotoxins and T&Os were detected (Cain and others, 2017; NCDEQ, 2017). A study that investigated two modeling approaches for assessing drivers of chlorophyll a variability in Jordan Lake found that nitrogen had a stronger influence on algal growth than phosphorous (Han and others, 2021). In this study, lake stratification in 2014 could indicate that the deep zones, during stratified anoxic conditions, may serve as possible sources for nutrients and metals for algal and other biogeochemical processes. None of the samples collected for chlorophyll a analysis during August were elevated when surface-water temperatures were highest, suggesting that high algal biomass was related to nutrient loading, possibly from internal loading from bottom layers during mixing events or destratification. Results from recursive partitioning could indicate that in some cases, nitrogen-fixing species of cyanobacteria, such as Dolichospermum, may be able to outcompete other phytoplankton under low nitrogen conditions.
Recursive partitioning indicated that higher manganese concentrations were associated with greater MIB concentrations and that greater sodium and silica concentrations were associated with higher microcystin concentrations, suggesting biogeochemical processes may influence MIB and microcystin production. Increases in concentrations of several major ions, including sodium, chloride, magnesium, and calcium, in drinking water sources in the Triangle area were observed during 1989–2013 (Giorgino and others, 2018). The general increase in concentration of these major ions, across the Triangle area, were attributed to increasing urbanization (Giorgino and others, 2018). Whether major ion chemistry represented a direct or indirect influence on cyanobacteria dynamics, that contributed to cyanotoxin and T&O compound production could not be determined because of the short time span of the study. Additionally, the synthetase gene cluster, which varies by cyanotoxin and T&O compound, must be present within the genome of the species cell. In other words, known cyanotoxin-producing genera include toxic strains (those with the specific gene cluster) and nontoxic strains (those without the specific gene cluster) that can be differentiated only by molecular detection methods such as quantitative polymerase chain reaction. Most effective prediction models have incorporated monitoring for specific gene clusters, not only for species abundance, to identify sources and enhance predictive model strength (Francy and others, 2015). Therefore, additional monitoring is necessary to investigate how biogeochemical processes may alter cyanobacterial growth and the gene expression of T&O compounds and cyanotoxins in the cyanobacteria that are present.
Management Implications
Various methods have been tested for reducing cyanobacterial growth in reservoirs (Paerl and others, 2016). Some of these methods attempt to reduce stratification of the water column, which can promote cyanobacterial growth and the occurrence of HABs. In this study, differences in physical parameters and chemical constituents in photic and surface zones of the sites compared to those in deep zones indicate lake stratification was common across sites and sampling events during summer and fall. Lake stratification can result in bed sediment acting as a reservoir for nutrients, ions, and metals. Higher ammonia, phosphorus, iron, and manganese concentrations were measured in samples from the deep zones than in samples from the photic and surface zones, potentially as a result of anoxic/reducing conditions in the deep zones.
To mitigate some of the drinking-water-quality issues associated with lake stratification in the Triangle area, including high levels of dissolved iron and manganese, and proliferation of cyanobacteria and associated T&O, the Town of Cary in partnership with the Town of Apex are evaluating different management techniques to improve water quality and reduce cyanobacteria-derived T&O compounds. A study that used modeling to predict the effects of mixing versus nutrient limitation on cyanobacterial growth (via chlorophyll a concentrations during June–October when cyanobacterial concentrations were historically dominant) in B. Everett Jordan Lake, indicated that nutrient limitation would have a stronger effect on phytoplankton growth than mixing (Han and others, 2021). Harke and others (2016), however, reported that gene pathways allow cyanobacteria to exploit certain nutrient niches and promote blooms, such that changing nutrient concentrations (for example, reducing or increasing phosphorus) may not prevent blooms but simply may change the dominant species.
Results from this study indicate that microcystin concentrations in source-water reservoirs in the Triangle area were common across sites and seasons but were below recreational and swimming criteria levels. Geosmin is nearly ubiquitous across sites and seasons. Other cyanotoxin research in the North Carolina Piedmont reservoirs has supported the relatively cosmopolitan nature of microcystin in the area. Microcystin concentrations were screened in comparison to EPA health advisory levels for treated drinking water and were found to approach or exceed the HA for bottle-fed infants and preschool-age children in 3 of 20 raw water (untreated) samples (fig. 7D). However, discrepancies between cyanotoxin survey results at B. Everett Jordan Lake reported here and results from the study by Wiltsie and others (2018) demonstrate that nondetections of cyanotoxins may be a matter of sample location, sample timing, or sampling and analytical method as opposed to true absence of the cyanotoxins. Longer term data collection or passive samplers may be necessary to better understand the frequency that cyanotoxin concentrations exceed EPA recommendations for drinking water in water-supply reservoirs.
Summary
The Triangle area is located within the upper Cape Fear and Neuse River Basins of North Carolina. Prior to 2014, local utilities and State agencies monitored for cyanotoxins and taste-and-odor (T&O) compounds and reported occasional detections in three water-supply reservoirs in Wake County, N.C. However, comparable data for cyanotoxins and T&O compounds were lacking for other water-supply reservoirs in the nearby Triangle Area Water Supply Monitoring Project (TAWSMP) area. To protect and manage water resources in an area with rapid population growth, the TAWSMP was formed as a collaborative partnership between local governments to monitor Triangle area water supplies through multiparty efforts. The purpose of this study was for the U.S. Geological Survey, in cooperation with the TAWSMP steering committee, to provide an initial assessment of whether cyanotoxins and T&O compounds occur at levels of concern at four, previously unmonitored, water-supply reservoirs in the TAWSMP study area.
Samples were collected from five sites across the four study reservoirs: Cane Cr Res site in Cane Creek Reservoir; WF Eno Res site in West Fork Eno River Reservoir; Jordan Lake at Bells and Jordan Lake at Hwy 64 sites in B. Everett Jordan Lake; and University Lake site in University Lake. Samples were collected four times between April and October 2014 and analyzed for physical characteristics, chemical constituents, phytoplankton communities, cyanotoxins, and T&O compounds.
Median total nitrogen and phosphorus concentrations in the photic zone for all sites were 0.76 and 0.037 milligram per liter, respectively. However, nitrate plus nitrite and phosphorus (as orthophosphate) often were below detectable levels, especially during the summer and fall sampling events in 2014. Overall, nitrogen species (total nitrogen, total organic nitrogen, ammonia, and nitrate plus nitrite) had similar concentration ranges among the five sites based on Wilcoxon rank-sum tests; however, median total phosphorus concentrations at Cane Cr Res and WF Eno Res were lower than those at Jordan Lake at Hwy 64.
Of the 20 samples that were collected during the study, the T&O compound geosmin and the cyanotoxin microcystin were present in 19 and 18 samples, respectively. While not harmful, the aesthetically displeasing geosmin concentrations periodically exceeded the human detection threshold of 15 nanograms per liter at most sites. The T&O compound 2-methylisoborneol (MIB) was detected in 11 of 20 samples, with concentrations below the human detection threshold of 15 nanograms per liter in all but one sample. The cyanotoxin anatoxin-a was detected in two of the samples. No other tested cyanotoxins were detected during the study. Only geosmin had seasonal differences; concentrations in samples collected during April/May were different from those collected during October and June, based on multivariate analysis of all five sites. Correspondingly, seasonal differences in basic water chemistry and nutrients were identified, whereby samples collected during the spring were different from those collected during the summer. Further testing selected transparency, organic nitrogen, ammonia, potassium, and sulfate as the best variables to explain the seasonal variation.
Differences in phytoplankton communities were attributed to variability in environmental conditions across the sites and sampling events. Differences were generally greater among sites than among sampling events for phytoplankton communities and environmental conditions. Multivariate analysis of the phytoplankton community assemblages determined that cyanobacteria division explained a large part of the assemblage variation. This determination may have been attributed to the frequent domination of cyanobacteria (greater than 50 percent of phytoplankton community) over other divisions during the study period. While level of dominance varied by site and season, all five sites exhibited cyanobacteria dominance by cell densities during all sampling events; however, that pattern was not repeated for the biovolume of cyanobacteria. Cyanobacteria community assemblages often contained genera with species capable of producing T&O compounds and cyanotoxins, especially during the summer and fall months. The occurrence and associated biovolumes of potential producers of cyanotoxins and T&O compounds varied across the sites and sampling events.
Multivariate models for associated genera for microcystin production across sites and sampling events were weak to not significant, so Spearman’s rank correlation was applied. In the eight samples collected from the two Jordan Lake sites, cell densities and biovolumes of Pseudanabaena correlated the strongest to microcystin concentrations, followed by Microcystis, Synechocystis, and Lyngbya. In the eight samples collected from Cane Creek and WF Eno Res sites, microcystin concentrations correlated with cell densities and biovolumes of Microcystis. Microcystin concentrations in four samples from University Lake had the strongest correlation to Pseudanabaena and Synechocystis, but input of just four samples was too small to determine significance. MIB and geosmin concentrations did not correlate to potential T&O producers at any of the sites.
In general, results from this study indicate that microcystin concentrations in the water supply-reservoirs in the Triangle area were below EPA-recommended recreational level of 8 micrograms per liter, but levels in the untreated raw water periodically exceeded the EPA finished-water 10-day health advisory level of 0.3 microgram per liter for bottle-fed infants and preschool-age children. This initial assessment suggests that longer term data collection may be necessary to better understand the magnitude and frequency of cyanotoxin concentrations in these four water-supply reservoirs, particularly those with an elevated risk of exceeding the EPA 10-day health advisory levels in the finished drinking water or those with a higher frequency of T&O compound occurrence.
The ubiquitous presence of microcystin co-occurred with the ubiquitous presence of potential T&O-compound- and cyanotoxin-producing genera of cyanobacteria in the reservoirs during the study period. Cyanobacteria communities were relatively diverse in all four reservoirs, however, and varied in type and abundance by season and by reservoir. The community diversity and variability over a short time made it difficult to link a specific genera or species to the episodic occurrence of T&O compounds or to the relatively ubiquitous occurrence of microcystin. The occurrences of T&O compounds and cyanotoxins were associated with variations in certain water chemistry characteristics (for example, total and organic nitrogen, sulfate, and transparency), but the lack of longer term data prevented discerning definitive relations.
Findings from this study indicate that a greater understanding of the seasonal dynamics of cyanobacterial species, which serve as potential sources of cyanotoxins and T&O compounds, is still needed through longer term algal monitoring for evaluating the efficacy of structural and nutrient-reduction strategies. Finally, the addition of molecular techniques could provide potential support in identifying specific cyanobacteria sources of cyanotoxins and T&O compounds, which can also guide nutrient management strategies.
References Cited
Anderson, C.W., 2005, Turbidity: U.S. Geological Survey Techniques of Water-Resources Investigations, book 9, chap. A6.7, accessed August 24, 2021, at https://pubs.water.usgs.gov/twri9A.
Arar, E.J., and Collins, G.B., 1997, Method 445.0—In vitro determination of chlorophyll a and pheophytin a in marine and freshwater algae by fluorescence (rev. 1.2): Cincinnati, Ohio, U.S. Environmental Protection Agency, 21 p., accessed August 25, 2021, at https://cfpub.epa.gov/si/si_public_record_report.cfm?Lab=NERL&dirEntryId=309417.
Cain, J.L., Pfeifle, C.A., and Rasmussen, R.B., 2017, Associated data for surface-water supplies in the Triangle area of North Carolina, water years 2014–15: U.S. Geological Survey data release, accessed August 26, 2021, at https://doi.org/10.5066/F75X274X.
Chorus, I., and Welker, M., eds., 2021, Toxic cyanobacteria in water—A guide to their public health consequences, monitoring and management (2d ed.): London, CRC Press, 858 p., accessed October 3, 2022, at https://doi.org/10.1201/9781003081449.
Christensen, V.G., and Khan, E., 2020, Freshwater neurotoxins and concerns for human, animal, and ecosystem health—A review of anatoxin-a and saxitoxin: Science of the Total Environment, v. 736, article 139515, accessed October 3, 2022, at https://doi.org/10.1016/j.scitotenv.2020.139515.
Christensen, V.G., Stelzer, E.A., Eikenberry, B.C., Olds, H.T., LeDuc, J.F., Maki, R.P., Saley, A.M., Norland, J., and Khan, E., 2021, Cyanotoxin mixture models—Relating environmental variables and toxin co-occurrence to human exposure risk: Journal of Hazardous Materials, v. 415, article 125560, accessed October 3, 2022, at https://doi.org/10.1016/j.jhazmat.2021.125560.
Clesceri, L.S., Greenberg, A.E., and Eaton, A.D., eds., 1998a, High temperature combustion, pt. 5310B of Standard methods for the examination of water and wastewater (20th ed.): Washington, D.C., American Public Health Association, American Water Works Association, and Water Environment Federation, p. 5–20 to 5–21, accessed August 24, 2021, at https://www.standardmethods.org/doi/10.2105/SMWW.2882.104.
Clesceri, L.S., Greenberg, A.E., and Eaton, A.D., eds., 1998b, Metals plasma emission spectroscopy, pt. 3120 of Standard methods for the examination of water and wastewater (20th ed.): Washington, D.C., American Public Health Association, American Water Works Association, and Water Environment Federation, p. 3–37 to 3–43, accessed August 24, 2021, at https://www.standardmethods.org/doi/10.2105/SMWW.2882.047.
Dempster, A.P., Laird, N.M., and Rubin, D.B, 1977, Maximum likelihood from incomplete data via the EM algorithm: Journal of the Royal Statistical Society, Series B, v. 39, no. 1, p. 1–38, accessed November 28, 2023, at https://doi.org/10.1111/j.2517-6161.1977.tb01600.x.
Diaz, J.C., McKee, A.M., and Journey, C.A., 2024, Associated data for the phytoplankton, taste-and-odor compounds, and cyanotoxin occurrence in drinking water supply reservoirs in the Triangle area of North Carolina: U.S. Geological Survey data release, https://doi.org/10.5066/P947PAQ8.
Dodds, W.K., Bouska, W.W., Eitzmann, J.L., Pilger, T.J., Pitts, K.L., Riley, A.J., Schloesser, J.T., and Thornbrugh, D.J., 2009, Eutrophication of U.S. freshwaters—Analysis of potential economic damages: Environmental Science & Technology, v. 43, no. 1, p. 12–19, accessed August 23, 2021, at https://doi.org/10.1021/es801217q.
Downing, J.A., Watson, S.B., and McCauley, E., 2001, Predicting cyanobacteria dominance in lakes: Canadian Journal of Fisheries and Aquatic Sciences, v. 58, no. 10, p. 1905–1908, accessed August 23, 2021, at https://doi.org/10.1139/f01-143.
Eaton, A.D., Clesceri, L.S., Rice, E.W., and Greenberg, A.E., eds., 2005, Standard method 6040 D—Constituent concentration by gas extraction—Solid-phase microextraction (SPMD), pt. 6000, sec. 6040D of Standard methods for the examination of water and wastewater (21st ed.): Washington, D.C., American Public Health Association, American Water Works Association, and Water Environmental Federation, p. 6–19 to 6–22.
Fishman, M.J., ed., 1993, Methods of analysis by the U.S. Geological Survey National Water Quality Laboratory—Determination of inorganic and organic constituents in water and fluvial sediments: U.S. Geological Survey Open-File Report 93–125, 217 p., accessed August 24, 2021, at https://doi.org/10.3133/ofr93125.
Fishman, M.J., and Friedman, L.C., eds., 1989, Methods for determination of inorganic substances in water and fluvial sediments (3d ed.): U.S. Geological Survey Techniques of Water-Resources Investigations, book 5, chap. A1, 545 p., accessed August 24, 2021, at https://doi.org/10.3133/twri05A1.
Francy, D.S., Graham, J.L., Stelzer, E.A., Ecker, C.D., Brady, A.M.G., Struffolino, P., and Loftin, K.A., 2015, Water quality, cyanobacteria, and environmental factors and their relations to microcystin concentrations for use in predictive models at Ohio Lake Erie and inland lake recreational sites, 2013–14: U.S. Geological Survey Scientific Investigations Report 2015–5120, 70 p., accessed September 29, 2021, at https://doi.org/10.3133/sir20155120.
Garbarino, J.R., and Struzeski, T.M., 1998, Methods of analysis by the U.S. Geological Survey National Water Quality Laboratory—Determination of elements in whole-water digests using inductively coupled plasma-optical emission spectrometry and inductively coupled plasma-mass spectrometry: U.S. Geological Survey Open-File Report 98–165, 101 p., accessed August 25, 2021, at https://doi.org/10.3133/ofr98165.
Garrett, R.G., Taylor, J.E., and Middleton, T.L., 1994, Water-quality data for selected North Carolina streams and reservoirs in the Triangle Area Water Supply Monitoring Project, 1988–92: U.S. Geological Survey Open-File Report 94–379, 255 p., accessed October 3, 2022, at https://doi.org/10.3133/ofr94379.
Gibs, J., Wilde, F.D., and Heckathorn, H.A., 2012, Use of multiparameter instruments for routine field measurements: U.S. Geological Survey Techniques of Water-Resources Investigations, book 9, chap. A6, 48 p., accessed August 3, 2021, at https://doi.org/10.3133/twri09A6.8.
Giorgino, M.J., Cuffney, T.F., Harden, S.L., and Feaster, T.D., 2018, Trends in water quality of selected streams and reservoirs used for water supply in the Triangle area of North Carolina, 1989–2013: U.S. Geological Survey Scientific Investigations Report 2018–5077, 67 p., accessed September 3, 2021, at https://doi.org/10.3133/sir20185077.
Graham, J.L., Foster, G.M., Williams, T.J., Kramer, A.R., and Harris, T.D., 2017, Occurrence of cyanobacteria, microcystin, and taste-and-odor compounds in Cheney Reservoir, Kansas, 2001–16: U.S. Geological Survey Scientific Investigations Report 2017–5016, 57 p., accessed September 13, 2021, at https://doi.org/10.3133/sir20175016.
Graham, J.L., Loftin, K.A., Meyer, M.T., and Ziegler, A.C., 2010, Cyanotoxin mixtures and taste-and-odor compounds in cyanobacterial blooms from the midwestern United States: Environmental Science & Technology, v. 44, no. 19, p. 7361–7368, accessed August 23, 2021, at https://doi.org/10.1021/es1008938.
Graham, J.L., Ziegler, A.C., Loving, B.L., and Loftin, K.A., 2012, Fate and transport of cyanobacteria and associated toxins and taste-and-odor compounds from upstream reservoir releases in the Kansas River, Kansas, September and October 2011: U.S. Geological Survey Scientific Investigations Report 2012–5129, accessed August 24, 2021, at https://doi.org/10.3133/sir20125129.
Hambrook Berkman, J.A., and Canova, M.G., 2007, Algal biomass indicators: U.S. Geological Survey Techniques and Methods, book 9, chap. A7.4, accessed August 24, 2021, at https://doi.org/10.3133/twri09A7.4.
Han, Y., Aziz, T.N., Del Giudice, D., Hall, N.S., and Obenour, D.R., 2021, Exploring nutrient and light limitation of algal production in a shallow turbid reservoir: Environmental Pollution, v. 269, article 116210, accessed September 3, 2021, at https://doi.org/10.1016/j.envpol.2020.116210.
Harke, M.J., Davis, T.W., Watson, S.B., and Gobler, C.J., 2016, Nutrient-controlled niche differentiation of western Lake Erie cyanobacterial populations revealed via metatranscriptomic surveys: Environmental Science & Technology, v. 50, no. 2, p. 604–615, accessed September 29, 2021, at https://doi.org/10.1021/acs.est.5b03931.
Harris, T.D., Smith, V.H., Graham, J.L., Van de Waal, D.B., Tedesco, L.P., and Clercin, N., 2016, Combined effects of nitrogen to phosphorus and nitrate to ammonia ratios on cyanobacterial metabolite concentrations in eutrophic Midwestern USA reservoirs: Inland Waters, v. 6, no. 2, p. 199–210, accessed October 3, 2022, at https://doi.org/10.5268/IW-6.2.938.
Helsel, D.R., 2005, More than obvious—Better methods for interpreting nondetect data: Environmental Science & Technology, v. 39, no. 20, p. 419–423, accessed September 29, 2021, at https://doi.org/10.1021/es053368a.
Helsel, D.R., Hirsch, R.M., Ryberg, K.R., Archfield, S.A., and Gilroy, E.J., 2020, Statistical methods in water resources: U.S. Geological Survey Techniques and Methods, book 4, chap. A3, 458 p., accessed September 29, 2021, at https://doi.org/10.3133/tm4a3.
Hillebrand, H., Dürselen, C.D., Kirschtel, D., Pollingher, U., and Zohary, T., 1999, Biovolume calculation for pelagic and benthic microalgae: Journal of Phycology, v. 35, no. 2, p. 403–424, accessed September 30, 2021, at https://doi.org/10.1046/j.1529-8817.1999.3520403.x.
Hrycik, A.R., Shambaugh, A., and Stockwell, J.D., 2019, Comparison of FlowCAM and microscope biovolume measurements for a diverse freshwater phytoplankton community: Journal of Plankton Research, v. 41, no. 6, p. 849–864, accessed September 30, 2021, at https://doi.org/10.1093/plankt/fbz056.
Jüttner, F., and Watson, S.B., 2007, Biochemical and ecological control of geosmin and 2-methylisoborneol in source waters: Applied and Environmental Microbiology, v. 73, no. 14, p. 4395–4406, accessed August 23, 2021, at https://doi.org/10.1128/AEM.02250-06.
Kass, G.V., 1980, An exploratory technique for investigating large quantities of categorical data: Journal of the Royal Statistical Society, Series C (Applied Statistics), v. 29, no. 2, p. 119–127, accessed August 2021 at https://doi.org/10.2307/2986296.
Loftin, K., Meyer, M., Rubio, F., Kamp, L., Humphries, E., and Whereat, E., 2008, Comparison of two cell lysis procedures for recovery of microcystins in water samples from Silver Lake in Dover, Delaware, with microcystin producing cyanobacterial accumulations: U.S. Geological Survey Open-File Report 2008–1341, 10 p., accessed August 24, 2021, at https://doi.org/10.3133/ofr20081341.
Loftin, K.A., Dietze, J.E., Meyer, M.T., Graham, J.L., Maksimowicz, M.M., and Toyne, K.D., 2016, Total cylindrospermopsins, microcystins/nodularins, and saxitoxins data for the 2007 United States Environmental Protection Agency National Lake Assessment: U.S. Geological Survey Data Series 929, 20 p., accessed August 24, 2021, at https://doi.org/10.3133/ds929.
MacKenzie, L., Beuzenberg, V., Holland, P., McNabb, P., and Selwood, A., 2004, Solid phase adsorption toxin tracking (SPATT)—A new monitoring tool that simulates the biotoxin contamination of filter feeding bivalves: Toxicon, v. 44, no. 8, p. 901–918, accessed October 3, 2022, at https://doi.org/10.1016/j.toxicon.2004.08.020.
Myer, M.H., Urquhart, E., Schaeffer, B.A., and Johnston, J.M., 2020, Spatio-temporal modeling for forecasting high-risk freshwater cyanobacterial harmful algal blooms in Florida: Frontiers in Environmental Science, v. 8, no. 202, article 581091, accessed October 3, 2022, at https://doi.org/10.3389/fenvs.2020.581091.
North Carolina Department of Environment Health and Natural Resources, 1992, North Carolina Lake Assessment Report: North Carolina Department of Environment, Health, and Natural Resources, Division of Environmental Management Water Quality Section, Report 92–02, 412 p., accessed May 6, 2022, at https://files.nc.gov/ncdeq/Water%20Quality/Environmental%20Sciences/ISU/NC%20Lake%20Assessment%201992.pdf.
North Carolina Department of Environmental Quality [NCDEQ], 2013, Lake and reservoir assessments Cape Fear River Basin: North Carolina Department of Environmental Quality web page, accessed August 23, 2021, at https://files.nc.gov/ncdeq/Water%20Quality/Environmental%20Sciences/Reports/CapeFearRLakesAssess2013.pdf.
North Carolina Department of Environmental Quality [NCDEQ], 2017, NC surface water quality standards table: North Carolina Department of Environmental Quality web page, accessed June 2, 2023, at https://deq.nc.gov/about/divisions/water-resources/water-planning/classification-standards/surface-water-standards.
North Carolina Department of Environmental Quality [NCDEQ], 2019, North Carolina Integrated Report: North Carolina Department of Environmental Quality web page, accessed May 15, 2023, at https://www.deq.nc.gov/environmental-management-commission/water-quality-committee-meetings/2018/2018ir072519/download.
North Carolina Department of Environmental Quality [NCDEQ], 2020, Lake and reservoir assessments Neuse River Basin: North Carolina Department of Environmental Quality web page, accessed August 23, 2021, at https://files.nc.gov/ncdeq/Water%20Quality/Environmental%20Sciences/Reports/Neuse_2020Lakes.pdf.
North Carolina Office of State Budget and Management, 2021, Population overview, 2020–2040: North Carolina Office of State Budget and Management web page, accessed January 31, 2023, at https://www.osbm.nc.gov/facts-figures/population-demographics/state-demographer/countystate-population-projections.
Oblinger, C.J., 2004, Triangle Area Water Supply Monitoring Project, October 1988 through September 2001, North Carolina—Description of the water-quality network, sampling and analysis methods, and quality-assurance practices: U.S. Geological Survey Open-File Report 2004–1278, 56 p., accessed October 3, 2022, at https://doi.org/10.3133/ofr20041278.
Otten, T.G., Graham, J.L., Harris, T.D., and Dreher, T.W., 2016, Elucidation of taste-and odor-producing bacteria and toxigenic cyanobacteria in a midwestern drinking water supply reservoir by shotgun metagenomic analysis: Applied and Environmental Microbiology, v. 82, no. 17, p. 5410–5420, accessed October 3, 2022, at https://doi.org/10.1128/AEM.01334-16.
Pacheco, A.B.F., Guedes, I.A., and Azevedo, S.M.F.O., 2016, Is qPCR a reliable indicator of cyanotoxin risk in freshwater?: Toxins, v. 8, no. 6, 26 p., accessed October 3, 2022, at https://doi.org/10.3390/toxins8060172.
Paerl, H.W., 1988, Nuisance phytoplankton blooms in coastal, estuarine, and inland waters: Limnology and Oceanography, v. 33, no. 4, pt. 2, p. 823–843, accessed August 23, 2021, at https://doi.org/10.4319/lo.1988.33.4part2.0823.
Paerl, H.W., Fulton, R.S., Moisander, P.H., and Dyble, J., 2001, Harmful freshwater algal blooms, with an emphasis on cyanobacteria: Scientific World Journal, v. 1, p. 76–113, accessed August 23, 2021, at https://doi.org/10.1100/tsw.2001.16.
Paerl, H.W., Gardner, W.S., Havens, K.E., Joyner, A.R., McCarthy, M.J., Newell, S.E., Qin, B., and Scott, J.T., 2016, Mitigating cyanobacterial harmful algal blooms in aquatic ecosystems impacted by climate change and anthropogenic nutrients: Harmful Algae, v. 54, p. 213–222, accessed October 3, 2022, at https://doi.org/10.1016/j.hal.2015.09.009.
Paerl, H.W., Hall, N.S., and Calandrino, E.S., 2011, Controlling harmful cyanobacterial blooms in a world experiencing anthropogenic and climatic-induced change: Science of the Total Environment, v. 409, no. 10, p. 1739–1745, accessed August 23, 2021, at https://doi.org/10.1016/j.scitotenv.2011.02.001.
Paerl, H.W., and Huisman, J., 2009, Climate change—A catalyst for global expansion of harmful cyanobacterial blooms: Environmental Microbiology Reports, v. 1, no. 1, p. 27–37, accessed August 23, 2021, at https://doi.org/10.1111/j.1758-2229.2008.00004.x.
Paerl, H.W., and Millie, D.F., 1996, Physiological ecology of toxic aquatic cyanobacteria: Phycologia, v. 35, no. sup6, p. 160–167, accessed October 3, 2022, at https://doi.org/10.2216/i0031-8884-35-6S-160.1.
Park, Y., Lee, H.K., Shin, J.-K., Chon, K., Kim, S., Cho, K.H., Kim, J.H., and Baek, S.-S., 2021, A machine learning approach for early warning of cyanobacterial bloom outbreaks in a freshwater reservoir: Journal of Environmental Management, v. 288, article 112415, accessed October 3, 2022, at https://doi.org/10.1016/j.jenvman.2021.112415.
Patton, C.J., and Kryskalla, J.R., 2011, Colorimetric determination of nitrate plus nitrite in water by enzymatic reduction, automated discrete analyzer methods: U.S. Geological Survey Techniques and Methods, book 5, chap. B8, 34 p., accessed August 24, 2021, at https://doi.org/10.3133/tm5B8.
Patton, C.J., and Truitt, E.P., 2000, Methods of analysis by the U.S. Geological Survey National Water Quality Laboratory—Determination of ammonium plus organic nitrogen by a Kjeldahl digestion method and an automated photometric finish that includes digest cleanup by gas diffusion: U.S. Geological Survey Open-File Report 00–170, 31 p., accessed August 24, 2021, at https://doi.org/10.3133/ofr00170.
Pfeifle, C.A., Cain, J.L., and Rasmussen, R.B., 2016a, Associated data for surface-water supplies in the Triangle area of North Carolina, water years 2012–13: U.S. Geological Survey data release, accessed September 29, 2021, at https://doi.org/10.5066/F77M061X.
Pfeifle, C.A., Cain, J.L., and Rasmussen, R.B., 2016b, Quality of surface-water supplies in the Triangle area of North Carolina, water years 2012–13: U.S. Geological Survey Open-File Report 2016–1137, 28 p., accessed September 29, 2021, at https://doi.org/10.3133/ofr20161137.
Pfeifle, C.A., Cain, J.L., and Rasmussen, R.B., 2017, Triangle Area Water Supply Monitoring Project, North Carolina—Summary of monitoring activities, quality assurance, and data, October 2013–September 2015: U.S. Geological Survey Open-File Report 2017–1068, 23 p., accessed August 26, 2021, at https://doi.org/10.3133/ofr20171068.
Phycotech, Inc., 2022, Algal taxonomy: Phycotech, Inc., website, accessed August 2, 2022, at https://www.phycotech/Resources/Library/Algal-Taxonomy-Sites.
Ritz, G.F., and Collins, J.A., 2008, pH (ver. 2.0, October 2008), in National field manual for the collection of water-quality data: U.S. Geological Survey Techniques of Water-Resources Investigations, book 9, chapter A6.4, accessed June 5, 2023, at https://doi.org/10.3133/twri09A6.4.
Rosen, B.H., and St. Amand, A., 2015, Field and laboratory guide to freshwater cyanobacteria harmful algal blooms for Native American and Alaska Native Communities: U.S. Geological Survey Open-File Report 2015–1164, 44 p., accessed August 2021 at http://dx.doi.org/10.3133/ofr20151164.
Rounds, S.A., 2012, Alkalinity and acid neutralizing capacity (ver. 4.0, September 2012): U.S. Geological Survey Techniques of Water-Resources Investigations, book 9, chap. A6.6, 43 p., accessed August 3, 2021, at https://doi.org/10.3133/twri09A6.6.
Sall, J., Lehman, A., Stephens, M., and Loring, S., 2017, JMP start statistics—A guide to statistics and data analysis using JMP (6th ed.): Cary, N.C., SAS Institute, Inc., accessed November 27, 2023, at https://support.sas.com/content/dam/SAS/support/en/books/jmp-start-statistics/70199_excerpt.pdf.
Somerfield, P.J., Clarke, K.R., and Gorley, R.N., 2021, A generalised analysis of similarities (ANOSIM) statistic for designs with ordered factors: Austral Ecology, v. 46, no. 6, p. 901–910, accessed October 3, 2022, at https://doi.org/10.1111/aec.13043.
Strunecký, O., Ivanova, A.P., and Mareš, J., 2023, An updated classification of cyanobacterial orders and families based on phylogenomic and polyphasic analysis: Journal of Phycology, v. 59, no. 1, p. 12–51, accessed May 15, 2023, at https://doi.org/10.1111/jpy.13304.
Tillett, D., Dittmann, E., Erhard, M., Von Döhren, H., Börner, T., and Neilan, B.A., 2000, Structural organization of microcystin biosynthesis in Microcystis aeruginosa PCC7806—An integrated peptide–polyketide synthetase system: Chemistry & Biology, v. 7, no. 10, p. 753–764, accessed October 3, 2022, at https://doi.org/10.1016/S1074-5521(00)00021-1.
U.S. Census Bureau, 2021, Metropolitan and micropolitan statistical areas population totals and components of change—2010–2019: U.S. Census Bureau web page, accessed October 18, 2021, at https://www.census.gov/data/tables/time-series/demo/popest/2010s-total-metro-and-micro-statistical-areas.html#par_textimage_1139876276.
U.S. Environmental Protection Agency [EPA], 1993, Method 365.1—Determination of phosphorus by semi-automated colorimetry (rev. 2.0): Cincinnati, Ohio, U.S. Environmental Protection Agency, 16 p., accessed August 24, 2021, at https://www.nemi.gov/methods/method_summary/4823/.
U.S. Environmental Protection Agency [EPA], 2015a, Drinking water health advisory for the cyanobacterial microcystin toxins: U.S. Environmental Protection Agency web page, accessed November 10, 2021, at https://www.epa.gov/sites/default/files/2017-06/documents/microcystins-report-2015.pdf.
U.S. Environmental Protection Agency [EPA], 2015b, Drinking water health advisory for the cyanobacterial toxin cylindrospermopsin: U.S. Environmental Protection Agency web page, accessed November 10, 2021, at https://www.epa.gov/sites/default/files/2017-06/documents/cylindrospermopsin-report-2015.pdf.
U.S. Environmental Protection Agency [EPA], 2019, Recommendations for cyanobacteria and cyanotoxin monitoring in recreational waters (rev. 1): U.S. Environmental Protection Agency web page, accessed November 10, 2021, at https://www.epa.gov/sites/default/files/2019-09/documents/recommend-cyano-rec-water-2019-update.pdf.
U.S. Geological Survey, 2019, Specific conductance: U.S. Geological Survey Techniques and Methods, book 9, chap. A6.3, 15 p., accessed August 24, 2021, at https://doi.org/10.3133/tm9A6.3.
U.S. Geological Survey, 2020, Dissolved oxygen: U.S. Geological Survey Techniques and Methods, book 9, chap. A6.2, 33 p., accessed August 24, 2021, at https://doi.org/10.3133/tm9A6.2.
U.S. Geological Survey, 2021, USGS water data for the Nation: U.S. Geological Survey National Water Information System database, accessed September 21, 2021, at https://doi.org/10.5066/F7P55KJN.
U.S. Geological Survey, [variously dated], National field manual for the collection of water-quality data: U.S. Geological Survey Techniques of Water-Resources Investigations, book 9, 10 chap. (A1–A10), [variously paged]. [Also available at https://pubs.water.usgs.gov/twri9A.]
Walter, J.M., Coutinho, F.H., Dutilh, B.E., Swings, J., Thompson, F.L., and Thompson, C.C., 2017, Ecogenomics and taxonomy of Cyanobacteria phylum: Frontiers in Microbiology, v. 8, article 2132, accessed May 15, 2023, at https://doi.org/10.3389/fmicb.2017.02132.
Watson, S.B., Monis, P., Baker, P., and Giglio, S., 2016, Biochemistry and genetics of taste- and odor-producing cyanobacteria: Harmful Algae, v. 54, p. 112–127, accessed August 23, 2021, at https://doi.org/10.1016/j.hal.2015.11.008.
Wilde, F.D., 2006, Temperature (ver. 2): U.S. Geological Survey Techniques of Water-Resources Investigations, book 9, chap. A6.1, 22 p., accessed August 24, 2021, at https://doi.org/10.3133/twri09A6.1.
Wiltsie, D., Schnetzer, A., Green, J., Vander Borgh, M., and Fensin, E., 2018, Algal blooms and cyanotoxins in Jordan Lake, North Carolina: Toxins, v. 10, no. 2, article 92, 23 p., accessed September 3, 2021, at https://doi.org/10.3390/toxins10020092.
World Health Organization, 2003, Guidelines for safe recreational water environments—Volume 1, coastal and fresh waters: Geneva, World Health Organization, 210 p., accessed September 3, 2021, at https://apps.who.int/iris/handle/10665/42591.
Appendix 1. Sample Depths and Water-Quality Characteristics for Water Samples Collected from the Photic and Deep Zones
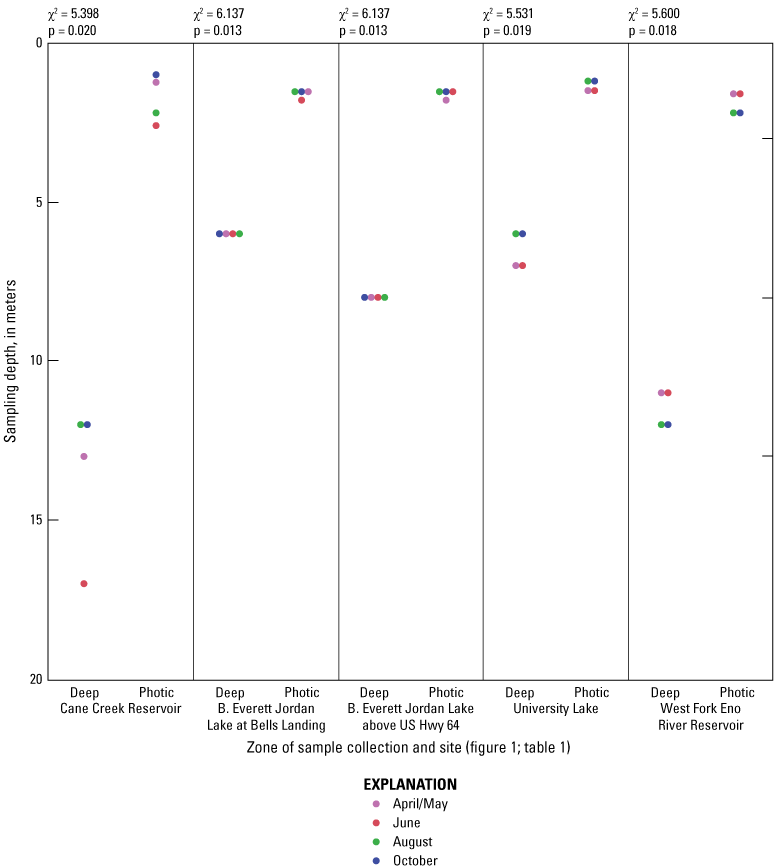
Depth of collection of water samples in the photic and deep zones of four water-supply reservoirs, by sampling event, Triangle area, North Carolina, 2014. [See table 1 for site information on Cane Creek Reservoir (Cane Creek Reservoir at dam near White Cross, NC), B. Everett Jordan Lake at Bells Landing (B.E. Jordan Lake at Bells Landing near Griffins Crossroads, NC), B. Everett Jordan Lake above US Hwy 64 (B.E. Jordan Lake above US Hwy 64 at Wilsonville, NC), University Lake (University Lake at intakes near Chapel Hill, NC), and West Fork Eno River Reservoir (West Fork Eno River Reservoir at dam near Cedar Grove, NC). Numbers above graphs are Wilcoxon signed-rank test results that compared deep to photic zone samples, with an alpha level of 0.05; χ2, chi-squared statistic; p, probability value]
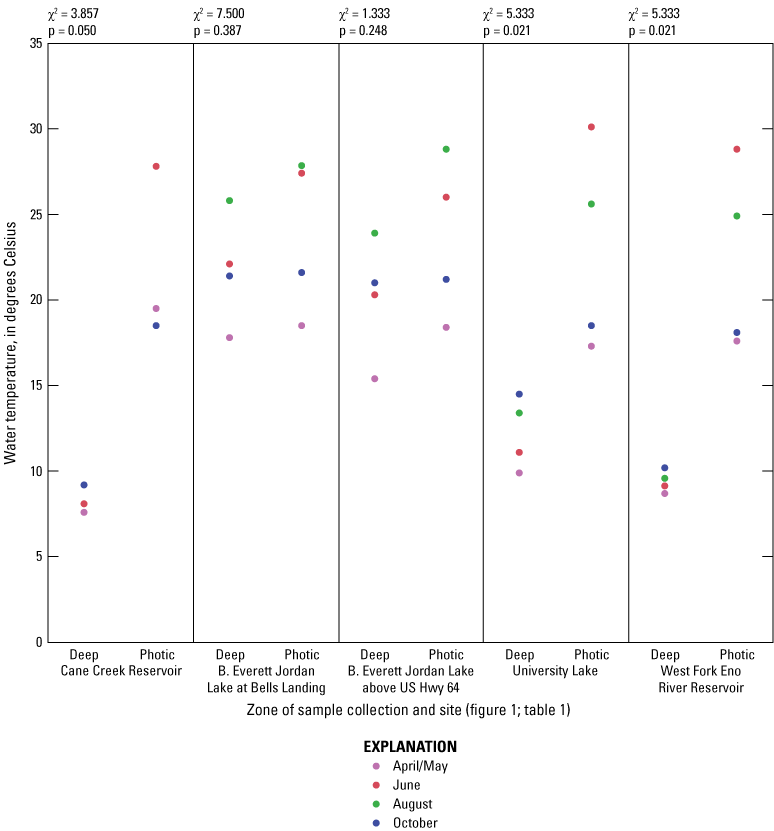
Water temperature measured at 1-meter depth in the photic zone and at a point depth in the deep zone of the reservoir, grouped by site. [See table 1 for site information on Cane Cr Res (Cane Creek Reservoir at dam near White Cross, NC), Jordan Lake at Bells (B.E. Jordan Lake at Bells Landing near Griffins Crossroads, NC), Jordan Lake at Hwy 64 (B.E. Jordan Lake above US Hwy 64 at Wilsonville, NC), University Lake (University Lake at intakes near Chapel Hill, NC), and WF Eno Res (West Fork Eno River Reservoir at dam near Cedar Grove, NC). For specific measurement depths in the deep zone, see figure 1.1. Numbers above boxplots are Wilcoxon signed-rank test results that compared deep to photic zone samples, with an alpha level of 0.05; χ2, chi-squared statistic; p, probability value]
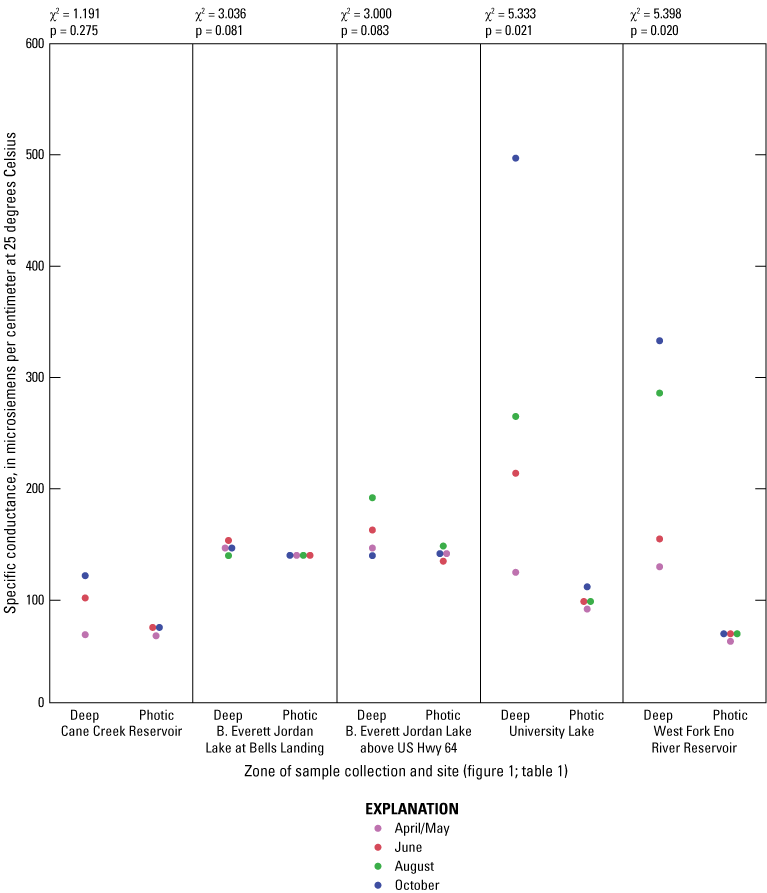
Specific conductance measured at 1-meter depth in the photic zone and at a point depth in the deep zone of the lake, grouped by site. [See table 1 for site information on Cane Cr Res (Cane Creek Reservoir at dam near White Cross, NC), Jordan Lake at Bells (B.E. Jordan Lake at Bells Landing near Griffins Crossroads, NC), Jordan Lake at Hwy 64 (B.E. Jordan Lake above US Hwy 64 at Wilsonville, NC), University Lake (University Lake at intakes near Chapel Hill, NC), and WF Eno Res (West Fork Eno River Reservoir at dam near Cedar Grove, NC). For specific measurement depths in the deep zone, see figure 1.1. Numbers above boxplots are Wilcoxon signed-rank test results that compared deep to photic zone samples, with an alpha level of 0.05; χ2, chi-squared statistic; p, probability value]
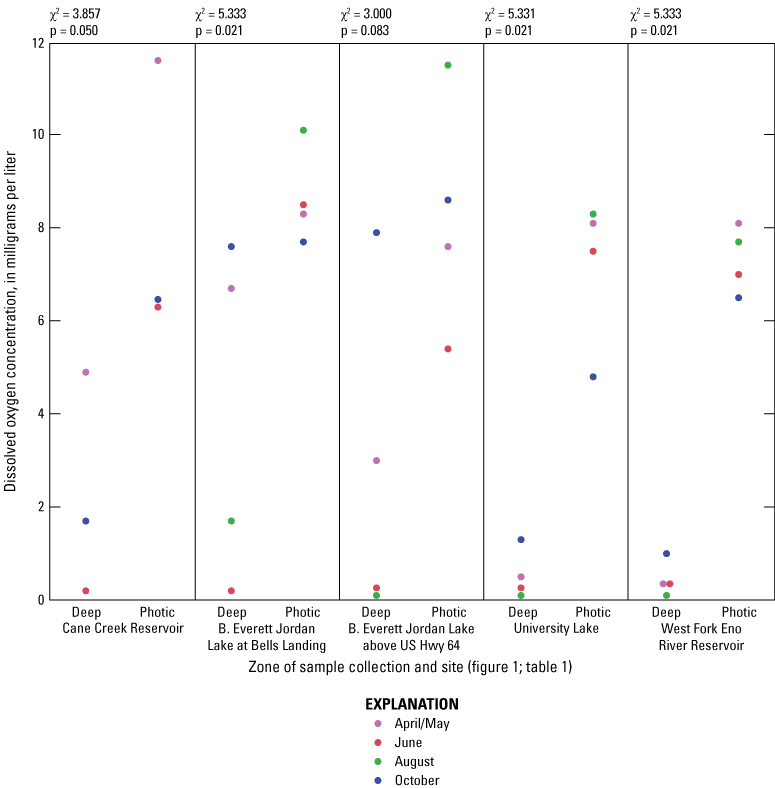
Dissolved oxygen concentration, measured at 1-meter depth in the photic zone and at a point depth in the deep zone of the lake, grouped by site. [See table 1 for site information on Cane Cr Res (Cane Creek Reservoir at dam near White Cross, NC), Jordan Lake at Bells (B.E. Jordan Lake at Bells Landing near Griffins Crossroads, NC), Jordan Lake at Hwy 64 (B.E. Jordan Lake above US Hwy 64 at Wilsonville, NC), University Lake (University Lake at intakes near Chapel Hill, NC), and WF Eno Res (West Fork Eno River Reservoir at dam near Cedar Grove, NC). For specific measurement depths in the deep zone, see figure 1.1. Numbers above boxplots are Wilcoxon signed-rank test results that compared deep to photic zone samples, with an alpha level of 0.05; χ2, chi-squared statistic; p, probability value]
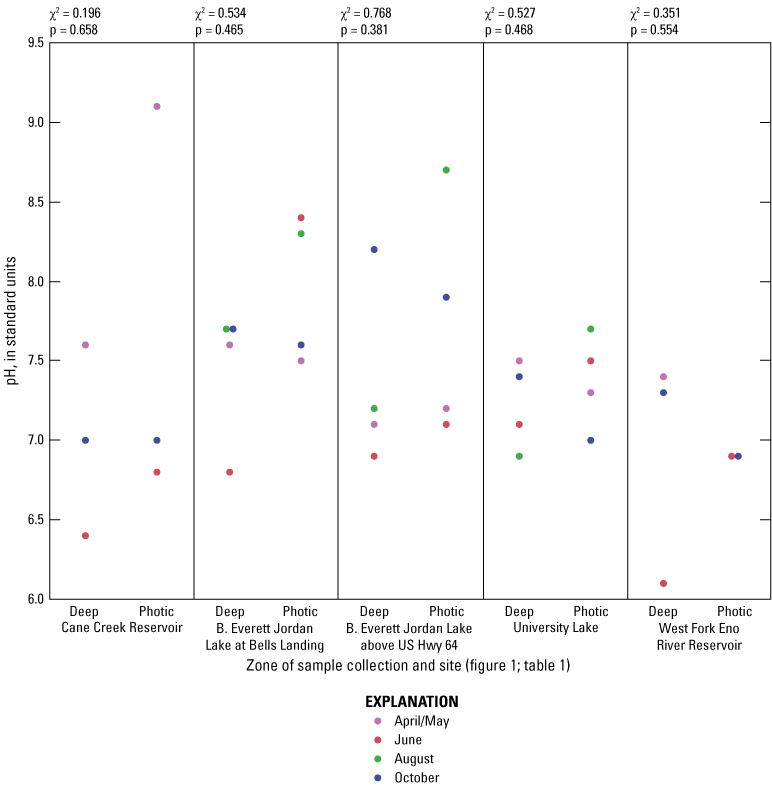
pH, measured at 1-meter depth in the photic zone and at a point depth in the deep zone of the lake, grouped by site. [See table 1 for site information on Cane Cr Res (Cane Creek Reservoir at dam near White Cross, NC), Jordan Lake at Bells (B.E. Jordan Lake at Bells Landing near Griffins Crossroads, NC), Jordan Lake at Hwy 64 (B.E. Jordan Lake above US Hwy 64 at Wilsonville, NC), University Lake (University Lake at intakes near Chapel Hill, NC), and WF Eno Res (West Fork Eno River Reservoir at dam near Cedar Grove, NC). For specific measurement depths in the deep zone, see figure 1.1. Numbers above boxplots are Wilcoxon signed-rank test results that compared deep to photic zone samples, with an alpha level of 0.05; χ2, chi-squared statistic; p, probability value]
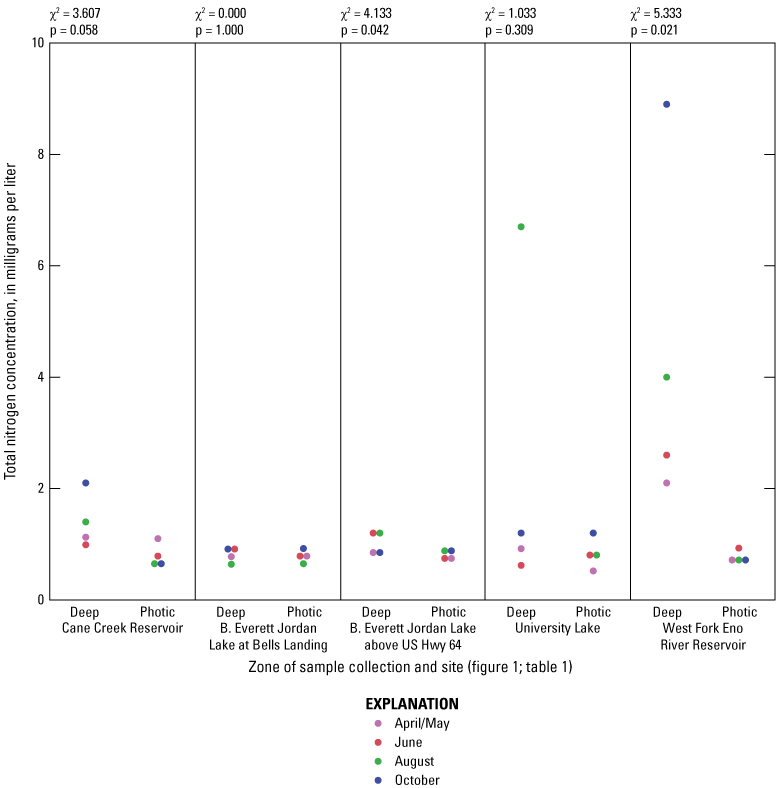
Total (particulate plus dissolved species) nitrogen concentration in the photic and deep zones grouped by site. [See table 1 for site information on Cane Cr Res (Cane Creek Reservoir at dam near White Cross, NC), Jordan Lake at Bells (B.E. Jordan Lake at Bells Landing near Griffins Crossroads, NC), Jordan Lake at Hwy 64 (B.E. Jordan Lake above US Hwy 64 at Wilsonville, NC), University Lake (University Lake at intakes near Chapel Hill, NC), and WF Eno Res (West Fork Eno River Reservoir at dam near Cedar Grove, NC). For specific measurement depths in the deep zone, see figure 1.1. Numbers above boxplots are Wilcoxon signed-rank test results that compared deep to photic zone samples, with an alpha level of 0.05; χ2, chi-squared statistic; p, probability value]
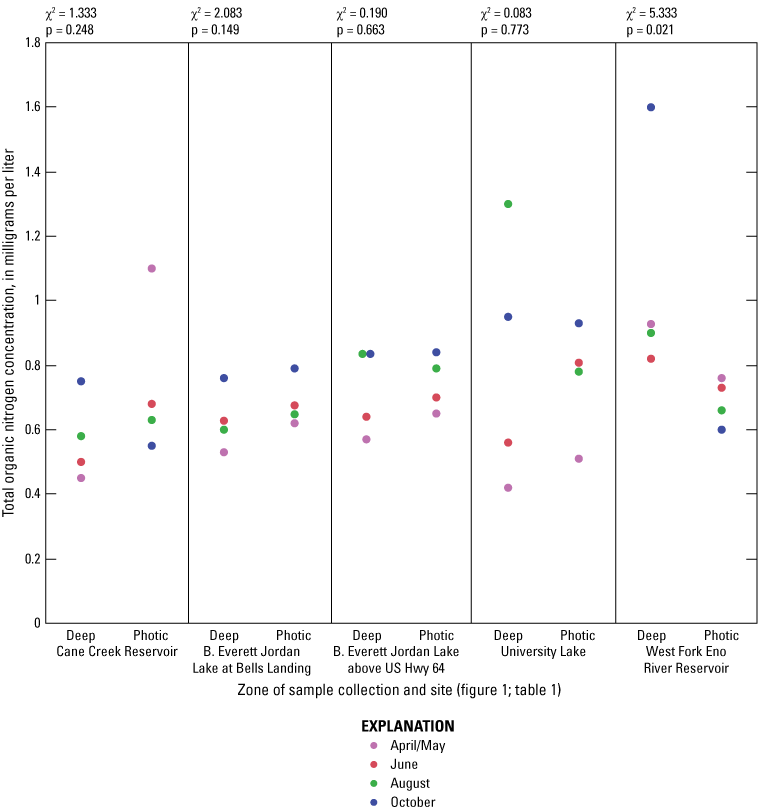
Total (particulate plus dissolved species) organic nitrogen concentration in the photic and deep zones grouped by site. [See table 1 for site information on Cane Cr Res (Cane Creek Reservoir at dam near White Cross, NC), Jordan Lake at Bells (B.E. Jordan Lake at Bells Landing near Griffins Crossroads, NC), Jordan Lake at Hwy 64 (B.E. Jordan Lake above US Hwy 64 at Wilsonville, NC), University Lake (University Lake at intakes near Chapel Hill, NC), and WF Eno Res (West Fork Eno River Reservoir at dam near Cedar Grove, NC). For specific measurement depths in the deep zone, see figure 1.1. Numbers above boxplots are Wilcoxon signed-rank test results that compared deep to photic zone samples, with an alpha level of 0.05; χ2, chi-squared statistic; p, probability value]
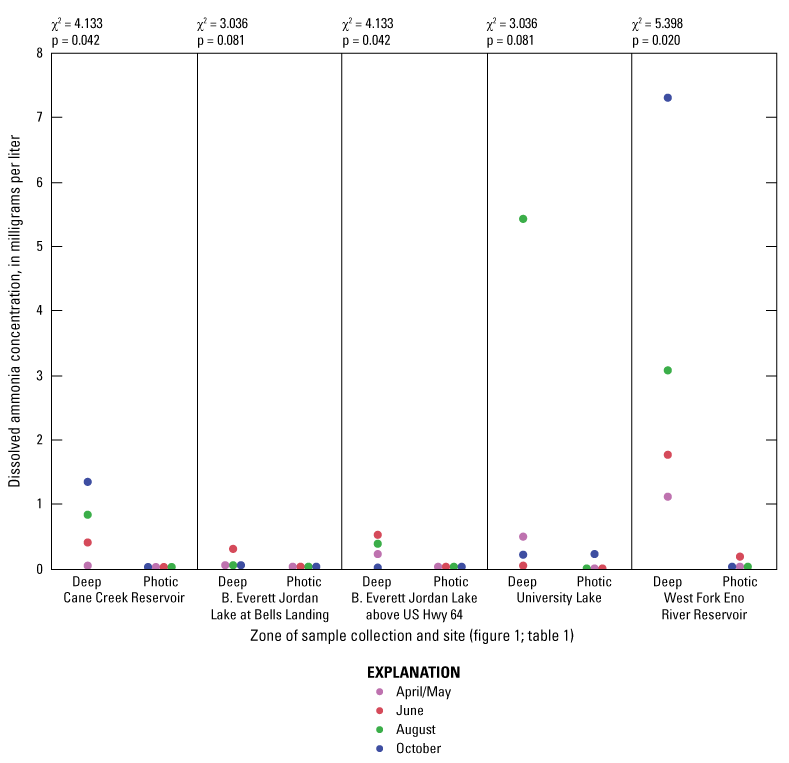
Dissolved ammonia (NH3 plus NH4+) concentration, in the photic and deep zones grouped by site. [See table 1 for site information on Cane Cr Res (Cane Creek Reservoir at dam near White Cross, NC), Jordan Lake at Bells (B.E. Jordan Lake at Bells Landing near Griffins Crossroads, NC), Jordan Lake at Hwy 64 (B.E. Jordan Lake above US Hwy 64 at Wilsonville, NC), University Lake (University Lake at intakes near Chapel Hill, NC), and WF Eno Res (West Fork Eno River Reservoir at dam near Cedar Grove, NC). For specific measurement depths in the deep zone, see figure 1.1. Numbers above boxplots are Wilcoxon signed-rank test results that compared deep to photic zone samples, with an alpha level of 0.05; χ2, chi-squared statistic; p, probability value]
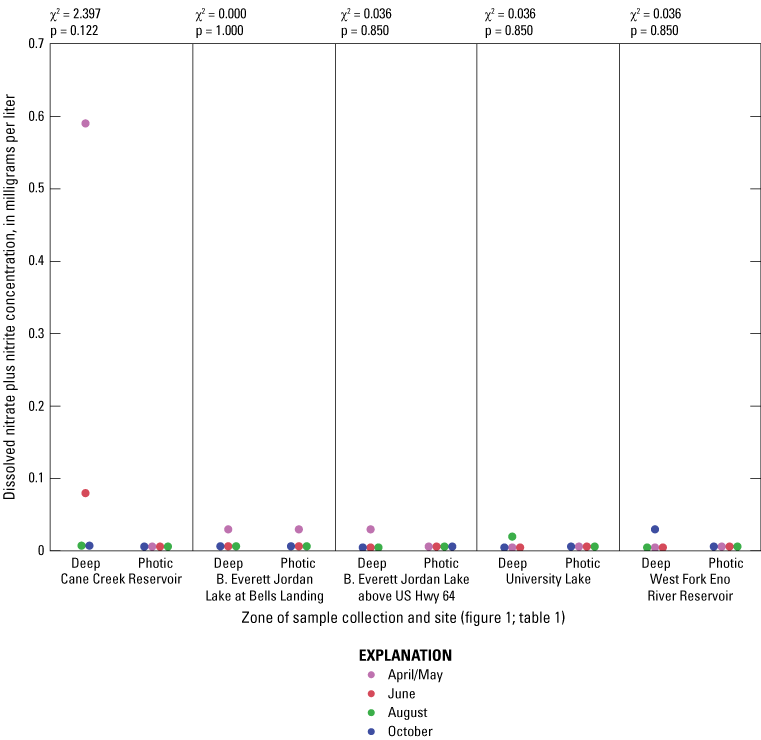
Dissolved nitrate plus nitrite concentration in the photic and deep zones grouped by site. [See table 1 for site information on Cane Cr Res (Cane Creek Reservoir at dam near White Cross, NC), Jordan Lake at Bells (B.E. Jordan Lake at Bells Landing near Griffins Crossroads, NC), Jordan Lake at Hwy 64 (B.E. Jordan Lake above US Hwy 64 at Wilsonville, NC), University Lake (University Lake at intakes near Chapel Hill, NC), and WF Eno Res (West Fork Eno River Reservoir at dam near Cedar Grove, NC). For specific measurement depths in the deep zone, see figure 1.1. Numbers above boxplots are Wilcoxon signed-rank test results that compared deep to photic zone samples, with an alpha level of 0.05; χ2, chi-squared statistic; p, probability value]
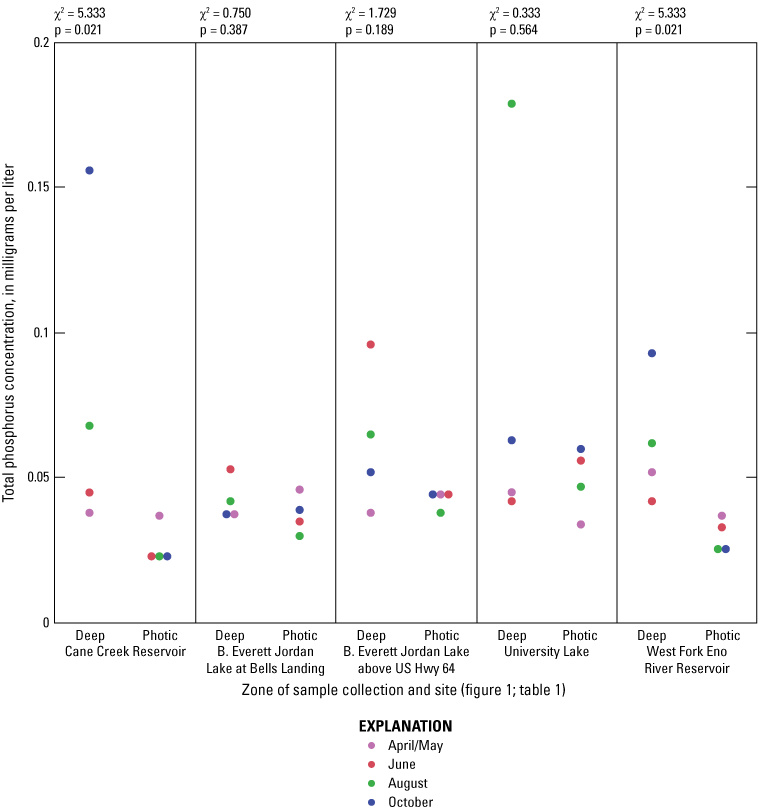
Total (particulate plus dissolved species) phosphorus concentration in the photic and deep zones grouped by site. [See table 1 for site information on Cane Cr Res (Cane Creek Reservoir at dam near White Cross, NC), Jordan Lake at Bells (B.E. Jordan Lake at Bells Landing near Griffins Crossroads, NC), Jordan Lake at Hwy 64 (B.E. Jordan Lake above US Hwy 64 at Wilsonville, NC), University Lake (University Lake at intakes near Chapel Hill, NC), and WF Eno Res (West Fork Eno River Reservoir at dam near Cedar Grove, NC). For specific measurement depths in the deep zone, see figure 1.1. Numbers above boxplots are Wilcoxon signed-rank test results that compared deep to photic zone samples, with an alpha level of 0.05; χ2, chi-squared statistic; p, probability value]
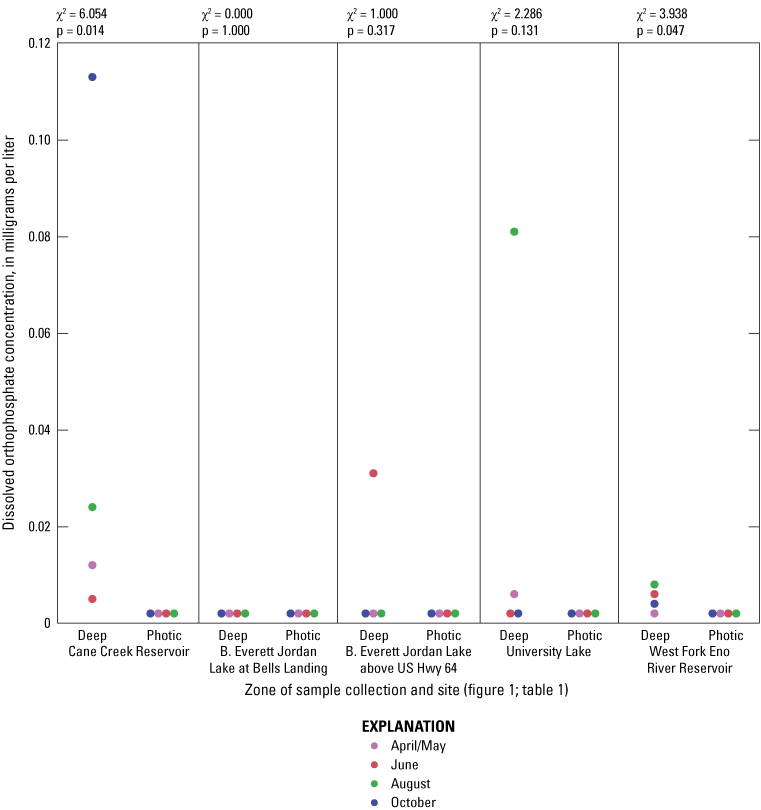
Dissolved orthophosphate concentration, in milligrams per liter, in the photic and deep zones grouped by site with symbol color by sampling event. [See table 1 for site information on Cane Cr Res (Cane Creek Reservoir at dam near White Cross, NC), Jordan Lake at Bells (B.E. Jordan Lake at Bells Landing near Griffins Crossroads, NC), Jordan Lake at Hwy 64 (B.E. Jordan Lake above US Hwy 64 at Wilsonville, NC), University Lake (University Lake at intakes near Chapel Hill, NC), and WF Eno Res (West Fork Eno River Reservoir at dam near Cedar Grove, NC). For specific measurement depths in the deep zone, see figure 1.1. Numbers above boxplots are Wilcoxon signed-rank test results that compared deep to photic zone samples, with an alpha level of 0.05; χ2, chi-squared statistic; p, probability value]
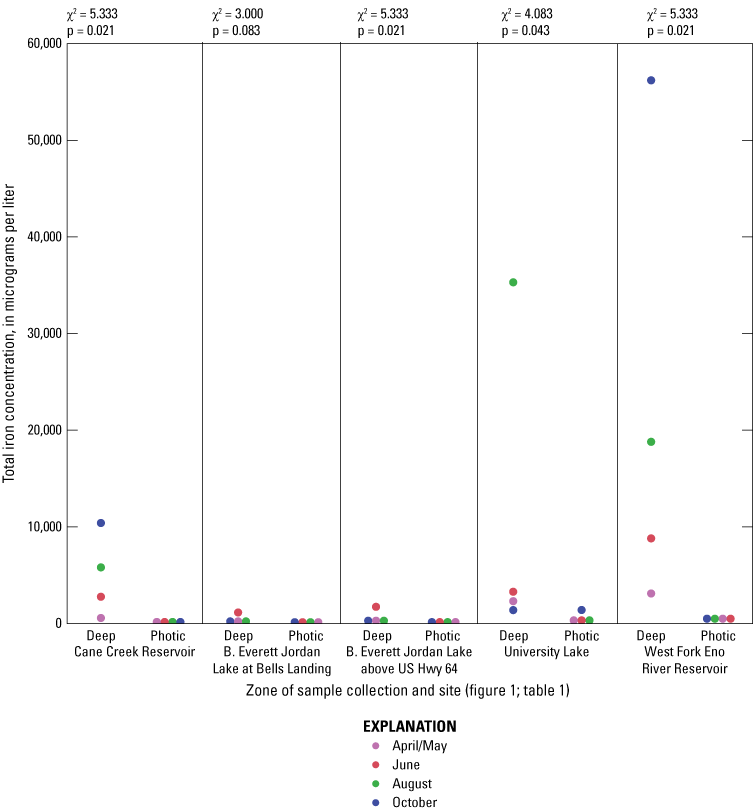
Total (particulate and dissolved species) iron concentration collected at 1-meter depth in the photic zone and at a point depth in the deep zone of the lake, grouped by site. [See table 1 for site information on Cane Cr Res (Cane Creek Reservoir at dam near White Cross, NC), Jordan Lake at Bells (B.E. Jordan Lake at Bells Landing near Griffins Crossroads, NC), Jordan Lake at Hwy 64 (B.E. Jordan Lake above US Hwy 64 at Wilsonville, NC), University Lake (University Lake at intakes near Chapel Hill, NC), and WF Eno Res (West Fork Eno River Reservoir at dam near Cedar Grove, NC). For specific measurement depths in the deep zone, see figure 1.1. Numbers above boxplots are Wilcoxon signed-rank test results that compared deep to photic zone samples, with an alpha level of 0.05; χ2, chi-squared statistic; p, probability value]
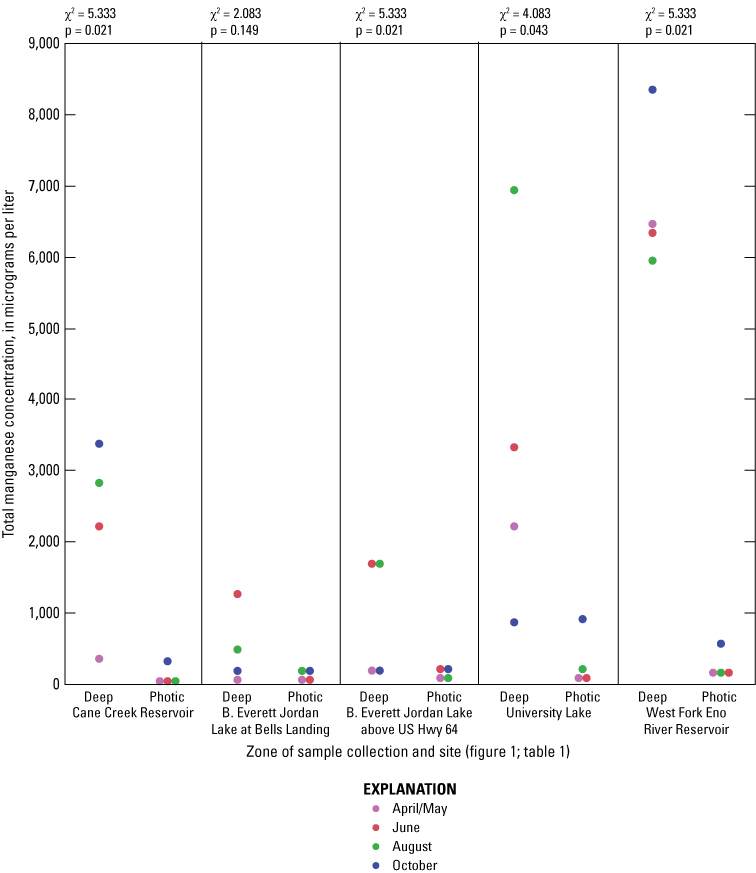
Total (particulate and dissolved species) manganese concentration, collected at 1-meter depth in the photic zone and at a point depth in the deep zone of the lake, grouped by site. [See table 1 for site information on Cane Cr Res (Cane Creek Reservoir at dam near White Cross, NC), Jordan Lake at Bells (B.E. Jordan Lake at Bells Landing near Griffins Crossroads, NC), Jordan Lake at Hwy 64 (B.E. Jordan Lake above US Hwy 64 at Wilsonville, NC), University Lake (University Lake at intakes near Chapel Hill, NC), and WF Eno Res (West Fork Eno River Reservoir at dam near Cedar Grove, NC). For specific measurement depths in the deep zone, see figure 1.1. Numbers above boxplots are Wilcoxon signed-rank test results that compared deep to photic zone samples, with an alpha level of 0.05; χ2, chi-squared statistic; p, probability value]
Appendix 2. Summary Statistics of Physical Properties, Chemical Constituents, and Taste-and-Odor Compounds
Table 2.1.
Summary statistics of physical properties and chemical constituents measured in surface-water samples from four drinking water-supply reservoirs in the Triangle area of North Carolina, 2014. (Data published in Pfeifle and others, 2017.)[photic, composite sample through entire photic zone; surface, grab sample at 1 meter below the surface; deep, grab sample at 1 meter above the lake bottom; SD, standard deviation; m, meter; °C, degree Celsius; µS/cm at 25 °C, microsiemens per centimeter at 25 degrees Celsius; mg/L, milligram per liter; pH, negative log (base 10) of the hydrogen ion activity; CaCO3, calcium carbonate; N, nitrogen; <, less than; P, phosphorus; SiO2, silicon dioxide; µg/L, microgram per liter; NTRU, nephelometric turbidity ratio unit; ng/L, nanogram per liter]
Appendix 3. Nonparametric Analysis of Variance, Analysis of Similarity, and Principal Components Analysis of Environmental Variables
Table 3.1.
Wilcoxon rank-sum one-way and Wilcoxon each pair (pairwise) results that compare environmental variables among five sites in four drinking water-supply reservoirs in the Triangle area of North Carolina sampled four times from April to October 2014. (Data published in Pfeifle and others, 2017.)[See table 1 for site information on Cane Cr Res (Cane Creek Reservoir at dam near White Cross, NC), Jordan Lake at Bells (B.E. Jordan Lake at Bells Landing near Griffins Crossroads, NC), Jordan Lake at Hwy 64 (B.E. Jordan Lake above US Hwy 64 at Wilsonville, NC), University Lake (University Lake at intakes near Chapel Hill, NC), and WF Eno Res (West Fork Eno River Reservoir at dam near Cedar Grove, NC). --, not reported when rank-sum test is not significant; bold font indicates significant rank-sum test results; DIP, dissolved inorganic phosphorus; Sites with different Wilcoxon pairwise test letters are statistically different (alpha = 0.05) such that A > B > C; >, greater than]
| Variable | Wilcoxon rank-sum chi-squared statistic | Wilcoxon rank-sum probability value | Wilcoxon each pair test (used only when rank-sum test indicated difference) and reservoir (table 1) | ||||
|---|---|---|---|---|---|---|---|
| Jordan Lake at Hwy 64 | Jordan Lake at Bells | University Lake | Cane Cr Res | WF Eno Res | |||
| Water temperature | 0.662 | 0.956 | -- | -- | -- | -- | -- |
| Turbidity | 0.615 | 0.961 | -- | -- | -- | -- | -- |
| Transparency | 4.682 | 0.321 | -- | -- | -- | -- | -- |
| Specific conductance | 16.015 | 0.003 | A | A | B | C | C |
| Hardness | 13.614 | 0.009 | A | A | AB | BC | C |
| Dissolved oxygen | 2.971 | 0.563 | -- | -- | -- | -- | -- |
| Dissolved oxygen saturation | 1.679 | 0.795 | -- | -- | -- | -- | -- |
| Total nitrogen (TN) | 1.853 | 0.763 | -- | -- | -- | -- | -- |
| Organic nitrogen | 2.078 | 0.721 | -- | -- | -- | -- | -- |
| Ammonia | 3.262 | 0.515 | -- | -- | -- | -- | -- |
| Nitrate plus nitrite | 1.390 | 0.846 | -- | -- | -- | -- | -- |
| Dissolved inorganic nitrogen (DIN) | 3.225 | 0.521 | -- | -- | -- | -- | -- |
| Total phosphorus (TP) | 11.929 | 0.019 | A | AB | AB | B | B |
| Orthophosphate (DIP) | 0.000 | 1.000 | -- | -- | -- | -- | -- |
| TN:TP ratio | 15.343 | 0.004 | C | BC | C | A | B |
| DIN:DIP ratio | 3.225 | 0.521 | -- | -- | -- | -- | -- |
| Total iron | 11.229 | 0.024 | B | B | AB | AB | A |
| Total manganese | 6.300 | 0.178 | -- | -- | -- | -- | -- |
| Chlorophyll a | 5.390 | 0.250 | -- | -- | -- | -- | -- |
| Geosmin | 1.049 | 0.902 | -- | -- | -- | -- | -- |
| 2-Methylisoborneol | 1.733 | 0.785 | -- | -- | -- | -- | -- |
| Total microcystin | 8.108 | 0.088 | -- | -- | -- | -- | -- |
| Anatoxin-a | 3.171 | 0.530 | -- | -- | -- | -- | -- |
Table 3.2.
Analysis of Similarity (ANOSIM) test results that compare environmental variables among five sites in four water-supply reservoirs in the Triangle area of North Carolina sampled four times from April to October 2014. (Data published in Pfeifle and others, 2017.)[See table 1 for site information on Cane Cr Res (Cane Creek Reservoir at dam near White Cross, NC), Jordan Lake at Bells (B.E. Jordan Lake at Bells Landing near Griffins Crossroads, NC), Jordan Lake at Hwy 64 (B.E. Jordan Lake above US Hwy 64 at Wilsonville, NC), University Lake (University Lake at intakes near Chapel Hill, NC), and WF Eno Res (West Fork Eno River Reservoir at dam near Cedar Grove, NC). Sampling events occurred in the spring (April/May), summer (June and August), and fall (October). Global R, statistic that is the ratio of the within group and between group dissimilarities that can range from −1 to +1 a; p-value, probability value; ≠, statistically different at alpha = 0.05 for pairwise test; NA, not applicable because ANOSIM test showed no statistical difference; T&O, taste and odor]
Table 3.3.
Eigenvector coefficients determined from the principal component analysis (PCA) of the six selected environmental factors among five sites in four water-supply reservoirs in the Triangle Area Water Supply Monitoring Project study area in North Carolina, sampled four times from April to October 2014. (Data published in Pfeifle and others, 2017.)[Type, type of environmental variable; PC, principal component; (XX%), percentage of variance of eigenvalues of each principal component]
Table 3.4.
Principal component scores as determined from the principal component analysis of six selected environmental factors among five sites in four water-supply reservoirs in the Triangle Area Water Supply Monitoring Project study area in North Carolina, sampled four times from April to October 2014. (Data published in Pfeifle and others, 2017.)[See table 3.3 for associated eigenvector coefficients used to compute scores and for the six selected environmental factors. See table 1 for site information on Cane Cr Res (Cane Creek Reservoir at dam near White Cross, NC), Jordan Lake at Bells (B.E. Jordan Lake at Bells Landing near Griffins Crossroads, NC), Jordan Lake at Hwy 64 (B.E. Jordan Lake above US Hwy 64 at Wilsonville, NC), University Lake (University Lake at intakes near Chapel Hill, NC), and WF Eno Res (West Fork Eno River Reservoir at dam near Cedar Grove, NC). Score X, principal component score for principal component axis x]
| Site (table 1; fig. 1) | Sampling event | Score 1 | Score 2 | Score 3 | Score 4 | Score 5 |
|---|---|---|---|---|---|---|
| Cane Cr Res | April/May | 1.68 | 2.24 | −2.39 | −0.356 | −0.810 |
| Cane Cr Res | June | 1.57 | −1.62 | −0.190 | −0.981 | 0.646 |
| Cane Cr Res | August | 1.28 | −1.29 | −0.008 | −0.153 | 0.749 |
| Cane Cr Res | October | 0.487 | 0.841 | 1.23 | 1.81 | 0.015 |
| Jordan Lake at Bells | April/May | −1.21 | −0.446 | 0.973 | −0.005 | −1.01 |
| Jordan Lake at Bells | June | −1.42 | −0.994 | 0.027 | −0.124 | −0.056 |
| Jordan Lake at Bells | August | −1.51 | −0.851 | −0.063 | 0.333 | 0.100 |
| Jordan Lake at Bells | October | −2.16 | 0.153 | −0.399 | −0.269 | −0.020 |
| Jordan Lake at Hwy 64 | April/May | −1.11 | −0.454 | 1.11 | −0.478 | −0.799 |
| Jordan Lake at Hwy 64 | June | −1.30 | −0.553 | −0.344 | 0.052 | −0.267 |
| Jordan Lake at Hwy 64 | August | −1.91 | −0.252 | −0.613 | −0.455 | 0.141 |
| Jordan Lake at Hwy 64 | October | −2.16 | 0.234 | −0.849 | −0.402 | −0.169 |
| University Lake | April/May | 0.677 | −0.671 | −0.011 | 2.09 | −0.093 |
| University Lake | June | −0.023 | 0.293 | −0.875 | 0.134 | 0.895 |
| University Lake | August | −0.336 | 0.942 | −0.728 | 0.846 | 0.865 |
| University Lake | October | −0.520 | 3.06 | 1.57 | −0.734 | 1.03 |
| WF Eno Res | April/May | 2.04 | 0.275 | −0.856 | 0.199 | −0.829 |
| WF Eno Res | June | 1.73 | 1.25 | 1.65 | −0.600 | −0.652 |
| WF Eno Res | August | 2.50 | −1.00 | −0.056 | −0.442 | 0.181 |
| WF Eno Res | October | 1.67 | −1.15 | 0.815 | −0.466 | 0.083 |
Appendix 4. Total Biovolumes and Cell Densities of Phytoplankton Taxonomic Divisions
Table 4.1.
Division summary of phytoplankton biovolumes and cell densities within four water reservoirs in the Triangle Area Water Supply Monitoring Project study area in North Carolina, April–October 2014. (Data published in Diaz and others, 2024.)[Taxonomic divisions included in this table are from the taxonomic identification, enumeration, and biovolume estimates provided by Phycotech, Inc. (2022; St. Joseph, Michigan). µm3/mL, cubic micrometer per milliliter of sample water; cells/mL, number of cells per milliliter of sample water]
Table 4.2.
Genus and order summary of cyanobacteria biovolumes and cell densities within four water reservoirs in the Triangle Area Water Supply Monitoring Project study area in North Carolina, April–October 2014. (Data published in Diaz and others, 2024.)[C, Chroccocales order that contain coccoid, spherical bacteria forms that can be unicellular or colonial; N, Nostacales order that contain multicellular, filamentous forms with some potential nitrogen fixers; Taxonomic genera and orders included in this table are from the taxonomic identification, enumeration, and biovolume estimates provided by Phycotech, Inc. (2022; St. Joseph, Michigan). µm3/mL, cubic micrometer per milliliter of sample water; cells/mL, number of cells per milliliter of sample water]
Conversion Factors
U.S. customary units to International System of Units
International System of Units to U.S. customary units
Temperature in degrees Celsius (°C) may be converted to degrees Fahrenheit (°F) as follows: °F = (1.8 × °C) + 32.
Supplemental Information
Specific conductance is given in microsiemens per centimeter at 25 degrees Celsius (µS/cm at 25 °C).
Concentrations of chemical constituents in water are given in milligrams per liter (mg/L), micrograms per liter (µg/L), or nanograms per liter (ng/L).
Phytoplankton enumeration during taxonomic analysis can be expressed as cell density (number of cells in a milliliter of sample water; cells/mL) or biovolume that incorporates cell size (cubic micrometers per milliliter of sample water; µm3/mL).
Abbreviations
>
greater than
≥
greater than or equal to
<
less than
µm
micrometer
AVLD
absolute value logarithmic difference
DO
dissolved oxygen
ELISA
enzyme-linked immunosorbent assays
EPA
U.S. Environmental Protection Agency
HA
health advisory
HABs
harmful algal blooms
LC/MS/MS
liquid chromatography-tandem mass spectrometry
LRL
laboratory reporting level
MDS
nonmetric multidimensional scaling
MIB
2-methylisoborneol
n
number of samples
NCDEQ
North Carolina Department of Environmental Quality
PCA
principal components analysis
RPD
relative percent difference
RWQC
ambient recreational water quality criteria
SA
swimming advisory
SPATT
Solid Phase Adsorption Toxin Tracking
T&O
Taste-and-odor compound
TAWSMP
Triangle Area Water Supply Monitoring Project
USGS
U.S. Geological Survey
For more information about this publication, contact
Director, South Atlantic Water Science Center
U.S. Geological Survey
1770 Corporate Drive, Suite 500
Norcross, GA 30093
For additional information, visit
https://www.usgs.gov/centers/sawsc
Publishing support provided by
Lafayette Publishing Service Center
Disclaimers
Any use of trade, firm, or product names is for descriptive purposes only and does not imply endorsement by the U.S. Government.
Although this information product, for the most part, is in the public domain, it also may contain copyrighted materials as noted in the text. Permission to reproduce copyrighted items must be secured from the copyright owner.
Suggested Citation
Journey, C.A., McKee, A.M., and Diaz, J.C., 2024, Phytoplankton, taste-and-odor compounds, and cyanotoxin occurrence in four water-supply reservoirs in the Triangle area of North Carolina, April–October 2014: U.S. Geological Survey Scientific Investigations Report 2024–5001, 63 p., https://doi.org/10.3133/sir20245001.
ISSN: 2328-0328 (online)
Study Area
| Publication type | Report |
|---|---|
| Publication Subtype | USGS Numbered Series |
| Title | Phytoplankton, taste-and-odor compounds, and cyanotoxin occurrence in four water-supply reservoirs in the Triangle area of North Carolina, April–October 2014 |
| Series title | Scientific Investigations Report |
| Series number | 2024-5001 |
| DOI | 10.3133/sir20245001 |
| Publication Date | April 01, 2024 |
| Year Published | 2024 |
| Language | English |
| Publisher | U.S. Geological Survey |
| Publisher location | Reston, VA |
| Contributing office(s) | South Atlantic Water Science Center |
| Description | Report: viii, 63 p.; Data Release |
| Country | United States |
| State | North Carolina |
| Other Geospatial | Triangle area |
| Online Only (Y/N) | Y |