

Simulation of Groundwater and Surface Water Interaction and Lake Resiliency at Crystal Lake, City of Crystal Lake, Illinois
Links
- Document: Report (3.84 MB pdf) , HTML , XML
- Data Releases:
- USGS data release - GFLOW groundwater flow model of Crystal Lake, City of Crystal Lake, Illinois
- USGS data release - Seepage Meter Data Collected at Crystal Lake, City of Crystal Lake, Illinois, 2020
- Database: USGS National Water Information System database —USGS Water Data for the Nation
- NGMDB Index Page: National Geologic Map Database Index Page (html)
- Download citation as: RIS | Dublin Core
Abstract
The U.S. Geological Survey, in cooperation with the City of Crystal Lake, Illinois, started a study to increase understanding of groundwater and surface-water interaction between the glacial aquifer and the city’s namesake lake, Crystal Lake, and the effect of higher and lower precipitation conditions on groundwater and lake levels. The results from this study could be used by the city and others to aid in lake management strategies. This report describes the hydrologic lake budget and each of the budget components, which are then used in the construction, calibration, and application of a regional groundwater flow model. The flow model is used to simulate the shallow groundwater flow system and the lake responses to increased and decreased precipitation under the current weir elevation and the proposed lowered weir elevation.
Using the program groundwater flow analytic element model (GFLOW), a two-dimensional, steady-state model was constructed. The model was calibrated by matching target water levels and stream base flows by adjusting model input parameters. A sensitivity analysis was completed by adjusting the parameters within reasonable ranges and noting the magnitude of changes in model calibration targets. Potential effects of extended wet and dry periods (within historical ranges and published predicted ranges) were evaluated by adjusting precipitation, groundwater recharge, and discharge at Crystal Lake culvert outlet in the model and comparing the resulting simulated lake stage and water budgets to stages and water budgets from the calibrated model.
Model results under average, wet, and dry conditions with a lowered weir of 1 foot at the Crystal Lake culvert outlet indicate minor changes in the simulated lake-water budgets and associated lake levels and groundwater elevation contours; however, simulations with an increased outflow at the Crystal Lake culvert outlet decreased the lake water levels by as much as 1.87 feet and also decreased the groundwater levels surrounding the lake by about 1–2 feet during average and wet conditions.
Introduction
Lake level management and stormwater management is a growing concern for many municipalities and land use planners as population increases along with changes in weather and climate. Additionally, more than 20 percent of all National Flood Insurance Program claims come from outside areas of highest risk (Federal Emergency Management Agency, 2019). This percentage could increase as precipitation is projected to increase in rainfall intensity and totals according to the 2018 National Climate Assessment (Reidmiller and others, 2018). The U.S. Geological Survey (USGS), in cooperation with the City of Crystal Lake, Illinois, completed a study to increase the understanding of the groundwater and surface-water interaction between the glacial aquifer and the city’s namesake lake, Crystal Lake, and the effect of higher and lower precipitation conditions on groundwater and lake levels. As part of this study, a hydrologic lake budget was developed, and the budget components were used in the construction, calibration, and application of a regional groundwater flow model.
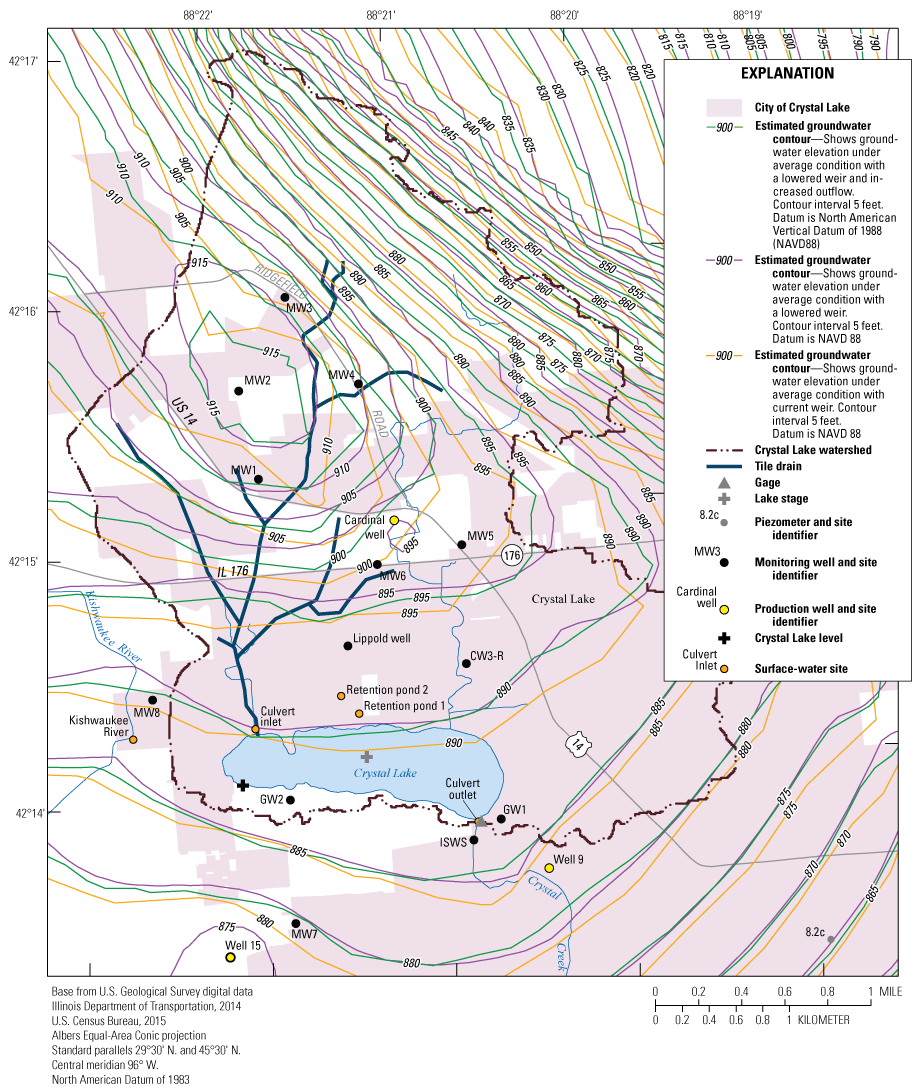
Crystal Lake is a 233-acre natural, glacially formed lake in southeastern McHenry County, Ill., 50 miles northwest from Chicago (Sasman, 1957). Figure 1 shows the study area and the water-level test points included in the model for Crystal Lake. Figure 2 shows Crystal Lake, the watershed boundary, monitoring wells, tile drain extent, and the culvert inlet/outlet for Crystal Creek. Several reports dating as far back as 1911 have been published concerning Crystal Lake water levels and water quality (Sasman, 1957). Sasman (1957) concluded that the primary controls on lake levels in 1957 were precipitation and evaporation and recommended lowering the culvert outlet weir by 1–2 feet (ft) to establish a new maximum lake level and shoreline configuration. Bauer Engineering, Inc. (1975), further investigated the local geology, watershed, hydrology, surrounding utilities, water use, and water quality with a focus on management of quantity and quality as it pertains to land use and planning. That 1975 report recommended retaining the open space north of the lake to maximize recharge to the lake.
This study quantifies the total contribution of groundwater flow into and out of the lake and includes direct measurements of hydrologic properties such as groundwater and surface-water elevation measurements, surface-water discharge, and groundwater seepage. These measurements were used to inform and develop a two-dimensional groundwater model to complement the City of Crystal Lake’s surface-water model. The groundwater model tests the lake and groundwater-level responses to average, wet, and dry steady-state conditions at the current (2020) and proposed weir elevations. The results of the current study provide information that can be used by the City of Crystal Lake and others to aid in lake management strategies such as modifying water-level control structures on the lake.
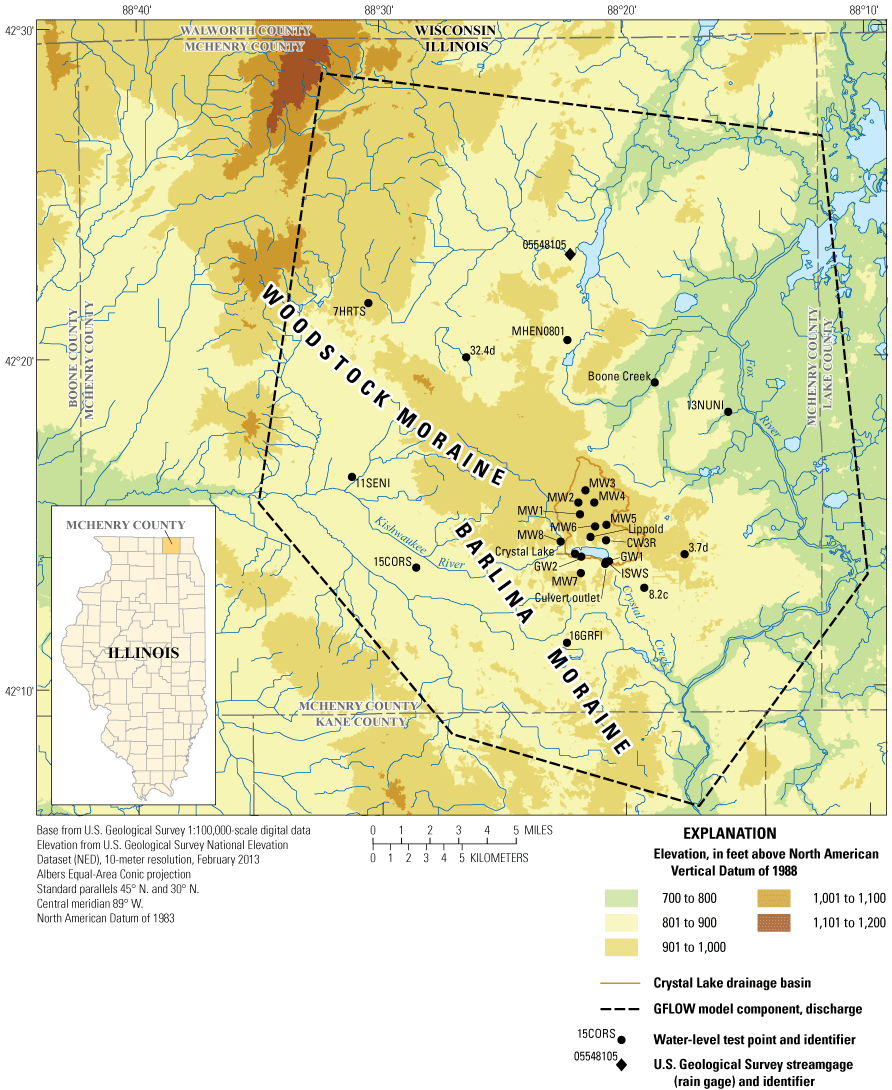
Study area included in the model for Crystal Lake, locations of local and county water-level test points, topography, and model extent, City of Crystal Lake, McHenry County, Illinois.
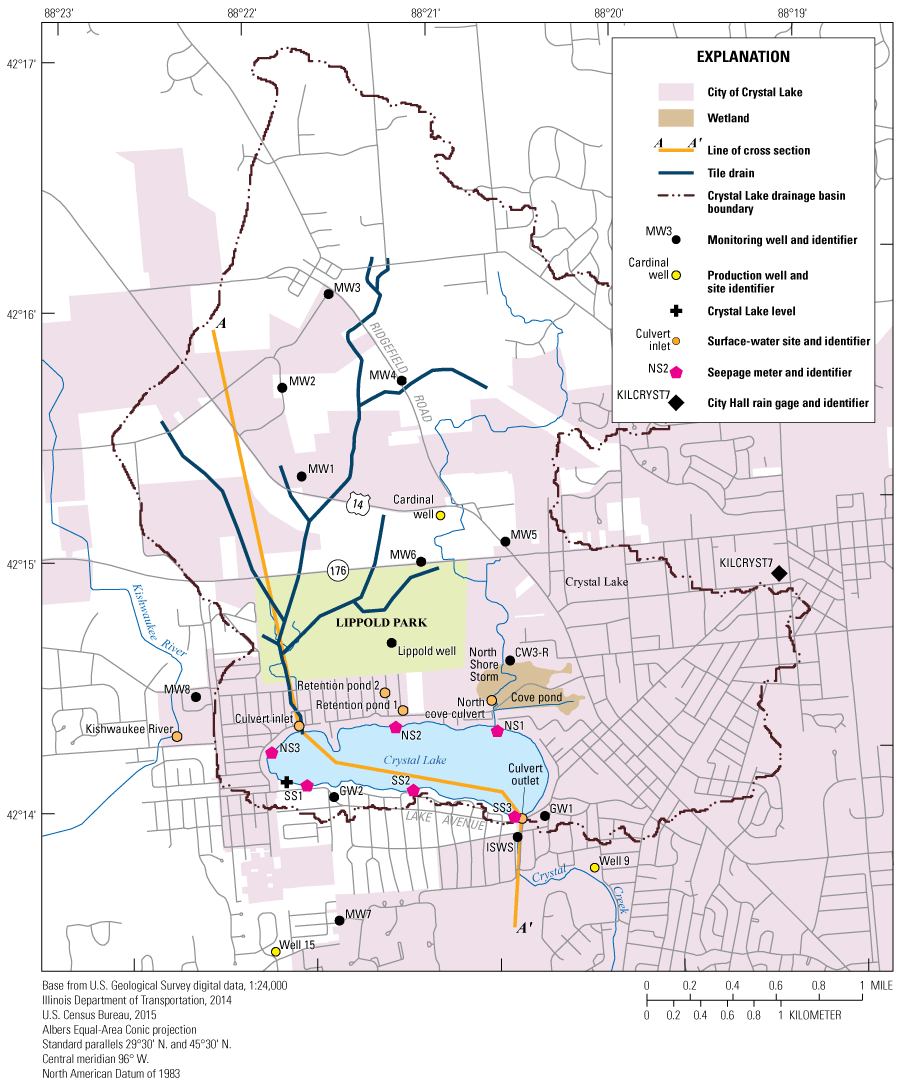
Location of Crystal Lake watershed, local groundwater monitoring wells and surface-water features, and Crystal Creek in the City of Crystal Lake, McHenry County, Illinois.
Purpose and Scope
This report describes the conceptual model of the hydrologic system at Crystal Lake and the construction, calibration, and simulation results of a two-dimensional, steady-state, groundwater flow model of the shallow glacial aquifer system near Crystal Lake. A regional groundwater flow analytical element model (GFLOW) model was developed initially to estimate and refine the hydrogeologic parameters (base elevation, hydraulic conductivity [Kh], and recharge) to calibrate to water levels and flow near Crystal Lake for average, wet, and dry conditions. Three calibrated models of the Crystal Lake study area were used to simulate the current weir elevation conditions for average, wet, and dry conditions. Simulations of average, wet, and dry conditions were repeated but with a lowered (by 1 ft) weir elevation and again with the lowered weir and increased outflow at the culvert outlet into Crystal Creek. The results of the lake levels, lake water budget, and surrounding groundwater elevation changes were compared to describe the effects of the climate conditions and the potential infrastructure changes. The model inputs and outputs use the International System Units (metric) system. Results and figures presented in this report are in U.S. customary units for cooperator preference and convenience.
Physical Setting
Crystal Lake is in southeastern McHenry County, Ill. The watershed of Crystal Lake generally follows the topography and totals about 6 square miles (fig. 1). The topography north and northeast of the lake rises gently and ranges from 901 to 950 ft in elevation, and Crystal Lake is within the 900-ft contour (USGS, 2022). Crystal Lake is an oblong shape about 1,500-ft wide by 6,800-ft long and covers about 233.2 acres (10,158,192 square feet [ft2]) and is connected to the shallow glacial aquifer in the outwash deposits of glacial drift (Sasman, 1957).
The glacial drift deposits consist of outwash and tills of variable thicknesses that range from less than 50 ft to more than 500 ft in northern Illinois (Curry and others, 1997). Crystal Lake itself is within the outwash deposits (Sasman, 1957) of the Pleistocene Henry Formation of Mason Group, which is about 40–60 ft thick (Meyer and others, 2013). North of Crystal Lake, the Henry Formation of Mason Group generally rises towards the Woodstock Moraine elevations and extends across much of McHenry County and ranges in thickness from 1 to 200 ft. These glacial drift deposits overlie the Silurian and Ordovician bedrock of the Ancell Group (Kolata, 2005).
Crystal Lake has historically been classified as a seepage lake where groundwater enters the lake generally along the northern shoreline and exits along the southern shoreline (Sasman, 1957; Bauer Engineering, Inc., 1975). Seepage lakes can be either perched above the water table or are well-connected to the regional groundwater flow system. Drainage lakes have a surface-water inlet into the lake and an outlet that flows from the lake. Water levels within a drainage lake tend to have reduced water-level fluctuation compared to seepage lakes because the amount of water leaving through the outlet stream increases or decreases as water levels increase or decrease (Juckem and others, 2014). Crystal Lake is well-connected to the regional groundwater flow system (Sasman, 1957; Bauer Engineering, Inc., 1975), and the lake stage represents the water level in the aquifer. Precipitation and evaporation affect the lake water levels in the absence of direct pumping, stormwater drainage, or direct surface-water inputs or outputs by the exchange of groundwater with the lake (Sacks and others, 1998). Crystal Lake, however, has a surface-water inlet (from tile drains) and a surface-water outlet (culvert outlet into Crystal Creek) similar to a drainage lake; therefore, Crystal Lake is a flow-through lake because it has features of a seepage and drainage lake and a gradient that follows the groundwater table. Fluctuating lake water levels have been a concern since the 1950s (Bauer Engineering, Inc., 1975) and have fluctuated 1–4 ft with an average of 2.5 ft (Sasman, 1957). Lake-level decreases of less than 6 ft expose the broad flat shoreline along the southeast shore of the lake, giving the perception of large water-level fluctuations (Sasman, 1957).
Crystal Lake has an inlet (culvert inlet) that drains tile drains north of the lake from Lippold Park to beyond Ridgefield Road (fig. 2). A culvert outlet connects a spillway weir on the southeast end of the lake and is the only surface-water outflow from the lake into Crystal Creek. Crystal Creek is a small, modified outlet that carries water from Crystal Lake, surrounding groundwater, stormwater runoff, and wastewater treatment plant discharges into the Fox River (fig. 1). The current elevation of the culvert outlet weir is 890.70 ft. The City of Crystal Lake is planning to lower the weir elevation by about 1 ft to 889.70 ft; the weir lowering will lower the lake elevation for managing lake fluctuations and surrounding groundwater during wet and dry periods. Wetland areas northeast of Crystal Lake (Cove Pond and North Shore Storm) drain through natural seepage and through direct connections into Crystal Lake (fig. 2). Additional stormwater management systems manage conveyance of the groundwater and stormwater runoff from retention pond 1 and retention pond 2 and were installed in 2019–20 to drain the groundwater within the community immediately north of the lake. The City of Crystal Lake installed a pressure transducer that measures the water level within the storm sewer conveyance pipe south of the lake near Lake Avenue, and there is a consistent presence of measurable water that does not go dry between precipitation events (City of Crystal Lake, written commun., June 4, 2021) indicating that the lake recharges the groundwater to the south.
Data Sources
Several sources of data were used to inform the conceptual site model and to develop the groundwater model (table 1). Geologic data used in this study include a surficial geologic map, glacial drift thickness map, and the aquifer sensitivity map of McHenry County, Illinois (Curry, 2005a; Curry, 2005b; Curry and others, 1997). These maps were used to estimate the distribution and properties of glacial sedimentary deposits. Lake bathymetric data were provided by consultants for the Crystal Lake Park District (CLPD; Hey and Associates, written commun., February 9, 2021). Values published by AECOM for Kh were available for wells screened at shallow (less than 40 ft below ground surface), intermediate (from about 41 to 114 ft below ground surface), and deep (greater than 115 ft) well depths within the sand and gravel aquifer of McHenry County (AECOM, 2009). An average regional Kh of the shallow glacial aquifer system of 21.65 feet per day (ft/d) from the McHenry County network of groundwater monitoring wells installed and tested by AECOM (2009) was considered as a starting point for the groundwater model input. Data sourced from the City of Crystal Lake, Christopher B. Burke Engineering, Ltd (CBBEL), and USGS applied in the groundwater model are available in a separate data release (Gahala, 2024).
Table 1.
List of data used in model, sources, and description for Crystal Lake groundwater analytical element model (GFLOW) to simulate the average, wet, and dry conditions, City of Crystal Lake, Illinois.| Parameter | Source | Description |
|---|---|---|
| Geology and elevation data | Curry, 2005a, 2005b; Curry and others, 1997 | Surficial geology, glacial drift thickness map, aquifer sensitivity map. |
| Lake geometry | Hey and Associates, written commun. February 9, 2021, Google Earth, 2021 | Bathymetry data. |
| Hydraulic conductivity | AECOM, 2009 | Single-well aquifer test from selected monitoring wells open to the sand and gravel aquifer throughout McHenry County groundwater network. |
| Groundwater levels near Crystal Lake | City of Crystal Lake, written commun. June 4, 2021 | Periodic (select wells since 2007). |
| Countywide groundwater levels | U.S. Geological Survey, 2021 | Real-time McHenry County groundwater network since 2010. |
| Groundwater levels | U.S. Geological Survey, 2021 | Synoptic (November 12, 2020). |
| Surface-water inflow and outflow | Christopher B. Burke Engineering, Ltd (CBBEL), written commun., Nov. 21, 2021; | Rainfall-runoff sanitary, storm and flood modeling software, rainfall-runoff Sanitary, Storm and Flood modeling software (XP-SWMM). |
| Lake-stage discharge estimates (at culvert outlet) | CBBEL, written commun., November 21, 2021 | Estimated transient stage-discharge rates from rainfall-runoff modeling software, XP-SWMM. |
| Surface-water discharge measurements | U.S. Geological Survey, 2021 | Culvert inlet, culvert outlet, two retention ponds. |
| Recharge | Soil Water Balance Model 1980–2011 (Trost and others, 2018) | Regional soil water balance model from 1980 to 2011. |
| Precipitation | Weather Underground, 2021; U.S. Geological Survey streamgage Nippersink Creek above Wonder Lake (05548105) (U.S. Geological Survey, 2021) | Crystal Lake City Hall--KILCRYST7 2020; U.S. Geological Survey streamgage Nippersink Creek above Wonder Lake (05548105) for 2012 (dry) and 2017 (wet). |
| Evaporation | Roberts and Stall, 1967 | Value estimated from Rockford, Ill.: 28.18 inches. |
| Production wells near Crystal Lake | City of Crystal Lake, written commun. August 27, 2021; Illinois State Geological Survey, 2021 | Daily rates provided from city or on ILWATER database. |
| Base flow | Barlow and others, 2015 | Groundwater Toolbox version 1.3.1, hydrograph separation methods applied to Boone Creek [05549000]. |
| Lakebed resistance | Seepage meter (October and November 2020), data in appendix 1; Gahala and Soderstrom, 2024 | U.S. Geological Survey measurement of groundwater seepage into and out of the lake. |
Periodic water-level data collected since 2007 from monitoring wells surrounding Crystal Lake were provided by the City of Crystal Lake, and lake water levels were provided by consultants of the CLPD (City of Crystal Lake, written commun., June 4, 2021; Jeremy Husnik, Hey and Associates, Inc., written commun., February 2021) (table 2). Lake levels at Crystal Lake are measured from a stilling well and a pressure transducer that records the water level every 4 hours. Hydrographs were reviewed to obtain minimum, maximum, and average groundwater and lake water levels for use in the groundwater model. Table 2 presents the minimum, maximum, and average water-level elevations, and the period of record of each monitoring point considered in this study as provided by the City of Crystal Lake to the USGS (Christopher E. Burke Engineering, Ltd [CBBEL], written commun., November 2019; Jeremy Husnik, Hey and Associates, Inc., written commun., February 2021). In general, the hydrograph fluctuations were consistent with regional groundwater elevation fluctuations observed from nearby real-time shallow monitoring wells from the McHenry County Groundwater Monitoring Well Network (MCGMN; Gahala, 2017), which have been collecting continuous (15-minute interval) water level data since 2009. The lake hydrograph reflected similar fluctuations in response to wet and dry years where lake levels declined by about 3 ft reaching a minimum of 888.13 ft in December 2012 and a maximum of 892.28 ft in July 2017 (fig. 3). The 2012 year represents a dry year, whereas the 2017 year represents a wet year in this study and were the extremes tested in the groundwater model. Water levels from selected wells in the MCGMN (USGS, 2020, 2021) were also used in this study. USGS water-level elevation data were collected from sites established and surveyed using the methods described in Rydlund and Densmore (2012). On November 12, 2020, USGS made synoptic water-level measurements of the surveyed monitoring wells, Crystal Lake stilling well, and surface-water locations (table 2). Water levels were measured manually with a calibrated electronic measuring tape following procedures described in Cunningham and Schalk (2011). Water-level data can be accessed on the USGS National Water Information System database (USGS, 2021).
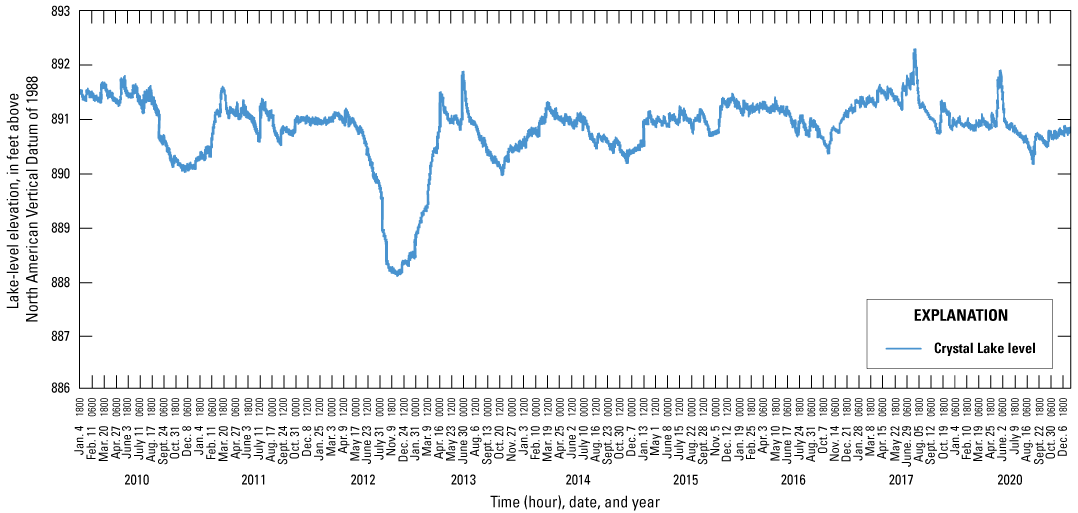
Crystal Lake hydrograph of historical lake levels collected every 4 hours, 2010–20, City of Crystal Lake, Illinois.
Minimum, maximum, and average surface-water inflow and outflow for the 2020 calendar year, 2017 wet year, and 2012 dry year, were calculated from daily data simulated using a rainfall-runoff Sanitary, Storm and Flood modeling software, XP-SWMM (version 2018.2.1; Innovyze, 2023) provided by CBBEL consultants for the City of Crystal Lake and provided to the USGS (table 3). Simulated lake-stage discharge estimates for the Crystal Lake culvert outlet were also provided by CBBEL for the current weir elevation and the lowered weir elevation (CBBEL, written commun., November 21, 2021). These transient lake-stage discharge estimates were modified to steady-state estimates presented in section “Description of the GFLOW Model for Crystal Lake.” Surface-water discharge was measured using methods of Turnipseed and Sauer (2010) on November 12, 2020, at the Crystal Lake culvert inlet and culvert outlet and two recently (2019–20) installed retention basins (retention pond 1 and retention pond 2) that circumvent the natural groundwater system and flow directly into the lake (fig. 1; table 4). Discharge measurements were compared to the ranges of discharge data simulated with the XP-SWMM rainfall-runoff software provided by CBBEL (CBBEL, written commun., November 2021; table 3, table 4).
Table 2.
Well construction details, water-level elevation minimums, maximums, and averages for the period of record for monitoring wells near City of Crystal Lake, and from the monitoring wells included in the groundwater model throughout McHenry County, Illinois.[Data are from the U.S. Geological Survey (USGS) National Water Information System database (USGS, 2021) and City of Crystal Lake; IL, Illinois; NAVD 88, North American Vertical Datum of 1988; NA, not applicable; —, not available; NM, not measured]
| USGS station name (short name in parentheses; fig. 2) | USGS station number | Measuring point height (top of casing) | Land surface elevation, in feet above NAVD 88 | Total well depth, in feet | USGS November 12, 2020, water- level elevation, in feet above NAVD 88 | City of Crystal Lake water-level records | ||||
|---|---|---|---|---|---|---|---|---|---|---|
| Water-level elevation, in feet above NAVD 88 | Period of record | Number of observations | ||||||||
| Minimum | Maximum | Average | ||||||||
| 44N07E-36.4h (MW1) | 421516088215201 | −0.29 | 922.72 | 19.45 | 906.33 | 913.71 | 918.70 | 916.30 | Sept. 2010 to Dec. 2018 | 30 |
| 44N07E-25.5c (MW2) | 421537088215601 | −0.4 | 927.70 | 19.44 | 910.16 | 915.81 | 928.21 | 926.34 | Sept. 2010 to Dec. 2018 | 29 |
| 44N07E-25.5g (MW3) | 421559088213901 | −0.29 | 925.69 | 19.06 | 912.74 | 919.09 | 926.93 | 923.02 | Sept. 2010 to Dec. 2018 | 29 |
| 44N07E-25.1d (MW4) | 421537088211701 | −0.29 | 923.37 | 19.29 | 917.89 | 907.81 | 927.30 | 911.38 | Sept. 2010 to Dec. 2018 | 29 |
| 44N08E-31.5e (MW5) | 421457088204701 | −0.49 | 911.39 | 19.33 | 901.1 | 900.20 | 914.10 | 903.19 | Sept. 2010 to Dec. 2018 | 30 |
| 44N08E-31.8e (MW6) | 421453088211501 | −0.35 | 906.68 | 19.90 | 901.9 | 890.50 | 898.70 | 893.25 | Sept. 2010 to Dec. 2018 | 30 |
| 44N07E-36.2b (Lippold well) | 421434088212701 | 1.72 | 903.53 | 11.22 | 898.36 | 895.72 | 902.64 | 899.31 | May 2005 to Oct. 2017 | 98 |
| 44N08E-6.4c (GW1) | 421350088204201 | 1.85 | 890.76 | 26.00 | 886.34 | 886.10 | 892.22 | 889.29 | Jan. 2007 to Oct. 2017 | 88 |
| 44N07E-1.4d (GW2) | 421358088215011 | 3.23 | 894.77 | 24.62 | 888.65 | 883.60 | 892.78 | 886.71 | Jan. 2007 to Oct. 2017 | 88 |
| 44N08E-6.6b (ISWS) | 421345088205201 | 0.76 | 890.60 | 18.00 | 886.58 | 880.18 | 889.89 | 885.67 | Sept. 1950 to Sept. 2017 | 820 |
| 44N08E-31.5a (CW3-R) | 421428088204901 | 1.83 | 899.42 | 18.32 | 892.96 | — | — | — | — | — |
| 43N07E-12.4h (MW7) | 421329088215201 | 0.75 | 896.90 | 20.95 | 890.59 | — | — | — | — | — |
| 43N07E-2.2h (MW8) | 421427088224101 | 1.7 | 901.01 | 21.41 | 890.8 | — | — | — | — | — |
| Crystal Lake West at Crystal Lake, IL (lake levels) | 421404088220501 | 2.25 | 890.49 | 7 | 890.76 | 888.1 | 892.3 | 890.9 | Jan. 2010 to Feb. 2021 | 12,401 |
| North Cove Culvert at Crystal Lake, IL (north cove culvert) | 421416088205601 | NA | 892.82 | NA | 891.79 | — | — | — | — | — |
| Crystal Lake Culvert Inlet at Crystal Lake, IL (culvert inlet) | 421420088215901 | NA | 895.39 | NA | 893.39 | — | — | — | — | — |
| Retention Pond at East End Ave at Crystal Lake, IL (retention pond 1) | 421418088212501 | NA | 893.92 | NA | 892.67 | — | — | — | — | — |
| Retention Pond at Greenfield Rd, Crystal Lake, IL (retention pond 2) | 421422088213101 | NA | 896.55 | NA | 895.71 | — | — | — | — | — |
| Kishwaukee R AB Ballard RD at Crystal Lake, IL (Kishwaukee River) | 05437933 | NA | 896.25 | NA | 889.49 | — | — | — | — | — |
| Crystal Creek at Crystal Lake, IL (culvert outlet) | 05550010 | NA | 893.43 | NA | 890.12 | — | — | — | — | — |
| 45N6E-23.7d1 (7HRTS) | 422142088303101 | NA | 924.30 | 62.3 | 886.37 | 881.59 | 893.96 | 888.42 | Feb. 2009 to Dec. 2020 | 4327 |
| 44N6E-22.4c1 (11SENI) | 421626088311401 | NA | 830.55 | 75.4 | 825.7 | 824.31 | 826.87 | 826.87 | Feb. 2009 to Dec. 2020 | 4326 |
| 45N7E-32.4d (32.4d) | 422002088263001 | NA | 900* | 30.4 | NM | 869.78 | 876.35 | 873.06 | May 2000 to Dec. 2020 | 24 |
| 45N7E-25.7a (MHEN0801) | 422032088222001 | NA | 862.82 | 103.3 | 828.85 | 824.05 | 828.84 | 825.92 | Sept. 2009 to Dec. 2020 | 4130 |
| 44N8E-11.3d1 (13NUNI) | 421820088154501 | NA | 785.65 | 113.0 | 738.55 | 736.48 | 740.68 | 738.16 | Feb. 2009 to Dec. 2020 | 4327 |
| 43N8E-3.7d (3.7d) | 421402088173501 | NA | 920* | 58.7 | NM | 877.99 | 877.99 | 879.95 | Apr. 2000 to Dec. 2020 | 28 |
| 43N7E-23.1d1 (16GRFI) | 421122088222701 | NA | 879.46 | 99.0 | 860.29 | 855.71 | 855.71 | 860.73 | Feb. 2009 to Dec. 2020 | 4327 |
| 43N6E-01.3b1 (15CORS) | 421341088283701 | NA | 851.14 | 55.1 | 841.33 | 839.27 | 845.41 | 842.32 | Feb. 2009 to Dec. 2020 | 4325 |
| 43N8E-8.2c (8.2c) | 421301088191501 | NA | 900* | 46.1 | NM | 874.21 | 874.18 | 878.58 | June 2000 to Dec. 2020 | 33 |
Table 3.
Crystal Lake rainfall-runoff modeling software (XP-SWMM model) surface-water inflow and outflow estimates for the years 2020 (average), 2017 (wet), and 2012 (dry) conditions, at Crystal Lake, City of Crystal Lake, Illinois.[Values in the table are rounded for presentation; however, unrounded values are used in the model input and outputs and conversion from International System of Units (metric) used by the groundwater flow analytical element model (GFLOW) model (Gahala, 2024). USGS, U.S. Geological Survey; ft3/d, cubic foot per day; -, not available]
| USGS station short name (table 2) | Minimum (ft3/d) | Maximum (ft3/d) | Average (ft3/d) | |
|---|---|---|---|---|
| Retention pond 1 (inflow) | - | - | - | |
| Retention pond 2 (inflow) | - | - | - | |
| Northshore cove culvert (inflow) | 0 | 146,400 | 789 | |
| Culvert inlet (inflow) | 19,000 | 2,745,000 | 121,100 | |
| Overland flow (runoff; inflow) | 0 | 5,076,000 | 75,700 | |
| North cove culvert (inflow) | 0 | 3,887,000 | 45,200 | |
| Culvert outlet (outflow) | 1,555 | 4,384,000 | 226,600 | |
| Total surface-water inflow | 19,000 | 11,850,000 | 242,800 | |
| Total surface-water outflow | 1,555 | 4,384,000 | 226,400 | |
| Northshore cove culvert (inflow) | 0 | 120,000 | 888 | |
| Culvert inlet (inflow) | 19,000 | 1,355,000 | 136,800 | |
| Overland flow (runoff; inflow) | 0 | 4,885,000 | 85,550 | |
| North cove culvert (inflow) | 0 | 804,000 | 25,210 | |
| Culvert outlet (outflow) | 1,555 | 2,687,000 | 249,700 | |
| Total surface-water inflow | 19,000 | 7,165,000 | 248,500 | |
| Total surface-water outflow | 1,555 | 2,687,000 | 249,700 | |
| Northshore cove culvert (inflow) | - | - | 41 | |
| Culvert inlet (inflow) | 19,000 | 610,800 | 29,660 | |
| Overland flow (runoff; inflow) | 0.00 | 1,627,000 | 27,780 | |
| North cove culvert (inflow) | 0.00 | 402,700 | 1,457 | |
| Culvert outlet (outflow) | 1,555 | 483,700 | 57,620 | |
| Total surface-water inflow | 19,000 | 2,641,000 | 58,940 | |
| Total surface-water outflow | 1,555 | 483,700 | 57,620 | |
Table 4.
Discharge measurements by the U.S. Geological Survey at inflows and outflow of Crystal Lake, City of Crystal Lake, Illinois, November 12, 2020.[USGS, U.S. Geological Survey; IVE, interpolated variance estimator; ISO, International Organization for Standardization; dry, no water present; NM, not measured; —, not applicable]
| USGS station short name (table 2) | USGS surface-water discharge measurement, in cubic feet per day | IVE error, in percent | ISO error, in percent |
|---|---|---|---|
| Retention pond 1 (inflow) | 12,100 | 54 | 7 |
| Retention pond 2 (inflow) | 72,600 | 41 | 11 |
| Northshore cove culvert (inflow) | dry | dry | dry |
| Culvert inlet (inflow) | 159,000 | 7.1 | 6 |
| Overland flow (runoff; inflow) | NM | — | — |
| North cove culvert (inflow) | 33,700 | 7.6 | 3.1 |
| Culvert outlet (outflow) | 127,000 | 6.8 | 2.6 |
| Total surface-water inflow | 277,000 | — | — |
| Total surface-water outflow | 150,000 | — | — |
Regional recharge values were derived from a Soil-Water-Balance (SWB) model for the glacial aquifer system from 1980 to 2011 (Trost and others, 2018). The regional recharge estimates for McHenry County are provided in table 5 for average, wet, and dry years analyzed within Trost and others (2018; “subgrid10” in Trost, 2018). The SWB model estimated recharge for years 1980 to 2011 does not include the same years in which data were available for Crystal Lake; however, analog years reflecting average, wet, and dry conditions were chosen based on precipitation data from a climate station in Rockford, Ill. (National Weather Service, 2021), water levels at the Illinois State Water Survey climate monitoring well, and comparisons to the simulated recharge results from the SWB (table 5).
Precipitation values were calculated by summing daily precipitation data from available nearby rain gage data used in the groundwater model for the years 2020, 2017, 2012 that reflected average, wet, and dry conditions, respectively. Precipitation data for 2020 are from Crystal Lake City Hall – KILCRYST7 (Weather Underground, 2021), and precipitation data for years 2017 and 2012 are from Nippersink Creek above Wonder Lake (station number 05548105; USGS, 2021). Two different rain gage sources were warranted to fill in data gaps for wet and dry years. The precipitation recorded by City Hall—KILCRYST7 in 2017 was anomalously low compared to the USGS rain gage, and 2012 data were not complete at the KILCRYST7 rain gage.
The lake-groundwater interaction in GFLOW simulates lake-stage from a water balance calculation using the following parameters: precipitation, overland flow, stage-flow, and evapotranspiration. The GFLOW model applies evapotranspiration only to the lake boundaries and not elsewhere in the model; therefore, lake evaporation estimates were obtained from a previous publication (table 1 of Roberts and Stall, 1967) based on pan evaporation data in a nearby Rockford station and applied in the model.
Table 5.
Regional recharge estimates derived from the Soil-Water Balance Model for the glacial aquifer system for McHenry County region for average, wet, and dry years (“subgrid10” in Trost [2018]).[—, not determined]
Precipitation from National Weather Service (2021).
Production wells are north and south of the lake and extract water from the sand and gravel aquifer, potentially limiting the amount of groundwater flow into the lake and downgradient from the lake (table 1; City of Crystal Lake, written comm., August 27, 2021; Illinois State Geological Survey, 2021).
Base flow is the part of flow supplied by groundwater discharging to surface water. Base flow was quantified at Boone Creek (station number 05549000) from the hydrograph separation method using the Groundwater Toolbox version 1.3.1 (Barlow and others, 2015). Seepage measurements directly measure the discharge of groundwater into and out of the lake. A seepage study along the northern and southern shorelines of Crystal Lake was also completed the week of October 21 through October 23, 2020, and November 4 and 5, 2020. Seepage meter design and methods adhered similarly to those described in Rosenberry and LaBaugh (2008). The details and results are provided in a data release (Gahala and Soderstrom, 2024; app. 1). The seepage data are used to estimate the rate of groundwater entering and exiting Crystal Lake and to calculate the lakebed resistance parameter for the groundwater model. Lakebed resistance is the thickness of the lakebed sediment divided by the vertical hydraulic conductivity (Kv) as measured from the water-level reading in the minipiezometer during the seepage-meter tests and is measured in days. Large thickness increases the days of resistance and potentially separates the lake from inputs of groundwater or recharge to groundwater; therefore, a smaller range in thicknesses from 1–2 ft was evaluated and tested within the model to obtain the optimal resistance, and the thickness was refined during the calibration process. Similarly, streambed resistance was initially set to 1 day for all the streams in the model, and the resistance was increased or decreased to improve model calibration to target base-flow values.
Development of the Conceptual Model
The following describes the conceptualization of the hydrologic system at Crystal Lake and forms the framework for the model development and reduces the groundwater system into important component parts. This essential simplification characterizes the aquifer, identifies hydrologic sources and sinks, and identifies hydrologic boundaries in the area of interest.
Crystal Lake is a flow-through lake that resides in the thin (thickness ranging from 0 to 60 ft) glacial aquifer of sand and gravel deposits that overlays fine-grained deposits (clay-rich till deposits) beneath the lake. General thicknesses and extent of sand and gravel deposits and clay-rich till deposits were estimated from well logs available on the Illinois Water and Related Wells interactive map (Illinois State Geological Survey, 2021a). The clay-rich till deposits are considered the base (bottom) of the glacial aquifer (and are the base of the groundwater model; fig. 4). The lake is bounded to the north and northwest by the Woodstock Moraine and by the Barlina Moraine to the southwest and resides along the drainage-divide of the Kishwaukee River Basin and the Fox River Basin (Sasman, 1957; Curry, 2005a; Meyer and others, 2013; fig. 1). Precipitation falls on the largely open land surface and quickly infiltrates the sand and gravel to the water table, becoming part of the groundwater. Some areas north of Crystal Lake have fine-grained materials that favor surface-water collection into wetlands such as Cove Pond (fig. 2). Groundwater flows from higher to lower potential and discharges into surface-water features. Specifically, at Crystal Lake, the groundwater flows from the north and discharges (groundwater in) along the northern shoreline through the sand, gravel, and cobble lakebed sediment, and the lake water recharges the groundwater (groundwater out) along the southern shoreline. Groundwater continues to flow south from the lake towards surface-water features (fig. 4). Some parts of the naturally discharging groundwater along the northern shoreline have been circumvented by drainage tiles and retention ponds which direct flow into Crystal Lake at an increased rate. Crystal Lake drains through one surface-water location, Crystal Creek, which discharges at a rate typically equal to or greater than the surficial input of the tile drainage. Overland flow—where the land surface is sealed with cement or infrastructure, preventing infiltration to the water table—also adds water to the lake from diverted stormwater and runoff as estimated from the XP-SWMM rainfall-runoff surface-water model provided by CBBEL (table 3). Evaporation removes water from the lake. Production wells north and south of the lake, extracting water from the glacial aquifer, potentially limit the amount of groundwater flow into the lake increasing the hydraulic gradient south of the lake.
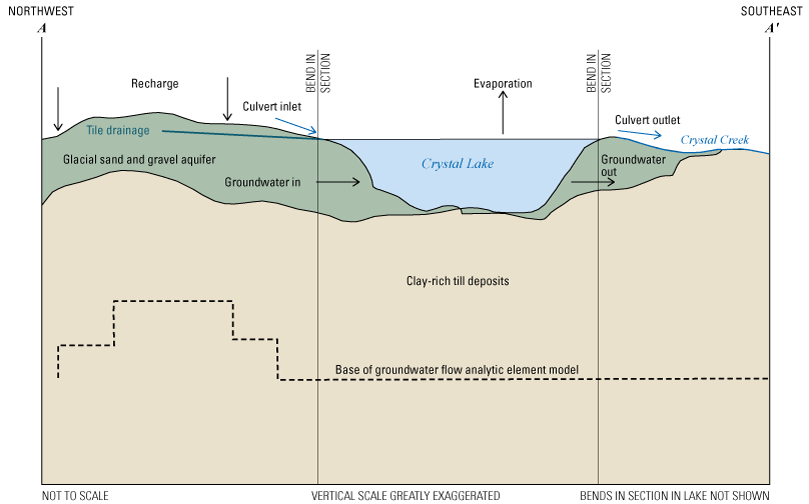
Hydrologic components and conceptual site model of Crystal Lake and watershed in the City of Crystal Lake, Illinois. Line of cross section shown in figure 2.
Description of the Two-Dimensional Model
A two-dimensional analytic element groundwater flow model, GFLOW (version 2.2.3), was used to simulate the groundwater system and interaction with surface water (Crystal Lake; Haitjema, 1995; Haitjema, LLC, 2018). Haitjema (1995) provides detailed methods and concepts of the mathematics. An analytical element model provides a simplified version of a hydrologic system in that it assumes an infinite aquifer extent and does not require a grid with finite perimeter boundaries. To further understand the differences between the analytical element method and the finite-difference/finite-element numerical modeling techniques, refer to Haitjema (1995), Hunt and others (1998, 2003)22, and Hunt (2006).
To construct an analytic element model, the modeler enters the features important for controlling groundwater flow such as surface-water bodies, streams, and wells. These are entered as linesinks that are mathematical elements or strings of elements. Inhomogeneities are elements that are added to incorporate any geologic complexity within the nearfield that are relevant to the site conditions. Each element will have an analytic solution to the groundwater flow equation, and these are added together to form a solution for any location in the model. In GFLOW, the analytical elements are two-dimensional and simulate steady-state conditions.
Three separate models were created for each condition: average conditions (2020), wet (2017) conditions, and dry (2012) conditions (referred hereafter simply as average, wet, and dry conditions). Model parameters for each condition were input into the GFLOW software and adjustments to regional Kh, inhomogeneities (base elevation and [or] Kh), recharge, lakebed, and streambed resistance were made to improve closer matches to test points specific to each condition. The target test points for the average conditions model include average water levels calculated from the historical data provided by the City of Crystal Lake and from the synoptic water-level survey completed on November 12, 2020, at monitoring wells (where averages were not available from the records kept by the City of Crystal Lake), average lake-water levels, and regional selected groundwater monitoring wells from the MCGMN (table 2); average base flow at Boone Creek; and average simulated outflow at the culvert outlet from Crystal Lake into Crystal Creek (table 3). Test points for the wet conditions model include maximum water levels observed at monitoring wells near Crystal Lake and maximum lake level from the period of record (table 2; fig. 3), high median water levels observed in MCGMN from the period of record, maximum base flow at Boone Creek, and maximum simulated outflow at culvert outlet from Crystal Lake into Crystal Creek. Test points for the dry conditions model include minimum water levels observed at monitoring wells near Crystal Lake and lake level of the period of record (table 2), low median water levels observed in MCGMN period of record, minimum base flow at Boone Creek, and minimum simulated outflow at the culvert outlet for dry year 2012 (table 3).
Description of the GFLOW Model for Crystal Lake
The model area (fig. 1) includes the regional major stream and surface-water features that inform the analytical element model to simulate the natural boundaries (groundwater divides), thereby improving model accuracy. The streams and lakes were constructed as linesinks, illustrated in fig. 5, by applying a Python script developed by Leaf and others (2021) that automatically populates the stream and lake elevations, depths, widths, and estimated streambed resistance based on the National Hydrography Dataset (version 2; McKay and others, 2012). Streams and lakes farther from Crystal Lake were simulated as farfield linesinks (blue) for which the stream or lake elevation is fixed and no resistance between the groundwater and surface water is simulated (fig. 5). The farfield linesinks in the model constrain the water levels along the nearfield linesinks, allowing the model to directly simulate the natural groundwater divides closer to the study area, Crystal Lake. The nearfield includes linesinks (brown) for lakes and streams within the drainage basins of the Kishwaukee River and the Fox River Basins surrounding Crystal Lake (fig. 5). Nearfield elements were simulated with finer discretization than the farfield elements to simulate groundwater flow patterns more precisely in the study area. The nearfield streams and tributaries were simulated as routed linesinks that incorporate stream width, depth, and resistance to calculate groundwater discharge and base flow in relation to simulated hydraulic head values, or the hydraulic head difference between groundwater and surface-water levels. Resistance in the nearfield linesinks simulate the streambed-sediment thickness divided by the Kv in units of days. Low resistance corresponds to increased connectivity of the stream to groundwater whereas high resistance further disconnects the stream from the groundwater. Resistance was adjusted in nearfield linesinks entering and exiting Crystal Lake (culvert inlet and culvert outlet) to reduce residuals of simulated flow. The resistance applied at the remaining nearfield linesinks extending beyond Crystal Lake were adjusted during the calibration process to achieve the least calculated error among the simulated linesinks and low residuals.
Farfield and nearfield linesinks and elements in the groundwater flow analytical element model (GFLOW).
Model development included referenced estimations for the elevation of the base of the aquifer, Kh, and recharge rate. The model base was set to an elevation of 615 ft above North American Vertical Datum of 1988 and is based on the geologic log (Illinois State Geological Survey, 2021b) from a monitoring well within the MCGMN (station number 421914088125301) (Gahala, 2017), which can be accessed in the USGS National Water Information System (NWIS) database (USGS, 2021) and generally represents the minimum elevation of the top of the bedrock (not included in the model). In two-dimensional models, the base elevation of the single layer corresponds to the Kh. The base elevation can be raised to affect the transmissivity or flow within that layer, and the Kh can be locally adjusted to reflect geologic conditions and simulate a better fit of the water levels. The model base elevation was raised by applying inhomogeneities in areas north of the lake from 615 ft up to 869.42 ft to represent the higher elevations of the glacial sand and gravel aquifer that is directly connected to the lake. The model base was also raised near the headwaters of the several tributaries to the Kishwaukee River Basin (820.21 ft). The average Kh applied in the model was initially 21.65 ft/d and adjusted during the calibration process.
Regional recharge was derived from the SWB model for the glacial aquifer system from 1980 to 2011 (Trost and others, 2018). The average recharge rate of 6.70 inches per year (in/yr) was applied to the initial model set up. Adjustments within the reported standard deviation for the average conditions were applied to the model to achieve calibration. The regional recharge was adjusted for wet conditions within the standard deviation to achieve wet model calibrations to match water levels and surface-water outflows. Likewise, recharge was adjusted for dry conditions within standard deviations until minimal residuals were simulated for water levels and surface-water outflow. Recharge to the lake is equal to the precipitation minus the evaporation of the lake.
The lake-water budget and interactions between groundwater and surface water at Crystal Lake were simulated following the GFLOW instructional document “Modeling Lake-Groundwater interactions in GFLOW” (Haitjema, 2012). Simulations of the lake-water budget required inputs of precipitation, evaporation, surface-water inflows and outflows, and overland flow. Precipitation for average, wet, and dry conditions were used for each model (table 5). The Roberts and Stall (1967) evapotranspiration rate of 28.18 in/yr (from Rockford) was applied for the years 2020, 2017 wet conditions, and 2012 dry conditions to simulate groundwater flow volumes and flow patterns surrounding the lake. A single value was input into the model because scant information on lake evaporation in response to wet or dry conditions was available. Additionally, sensitivity analysis (as described in section “Sensitivity and Uncertainty Analysis”) did not show substantial effect of evaporation on lake levels, surface-water outflows, or groundwater inflow or outflows. As this is a flow-through lake, the groundwater inflow would increase to compensate for any losses because of increased evaporation.
Crystal Lake was simulated with closed strings of routed linesinks along the perimeter of the lake and lake-water budget linesinks (lake elements). The linesinks are given a width and resistance parameter to account for the lake bottom resistance. Lake bottom thickness was initially estimated to be between 1 and 10 ft based on potential settling of fine-grained sediment at the bottom of the lake. Larger lake bottom thicknesses reduce the connection of the lake to the groundwater, and smaller lake bottom thicknesses increase the connection. Crystal Lake is a flow-through lake and is well connected to the surrounding aquifer; this was confirmed during the initial model calibration indicating poorer water level matches with larger lake bottom thicknesses. The lake bottom thickness, therefore, was estimated as either 1 or 2 ft, and the lakebed Kv from the seepage-meter analysis had an average Kv of 0.08 ft/d along the northern shoreline and 0.06 ft/d along the southern shoreline (Gahala and Soderstrom, 2024; app. 1). From the seepage-meter results, the lakebed resistance ranged from 13 to 33 days with an average of 22 days in the model. This range in lakebed resistance was further tested during the model calibration. The width of the lake was measured at its average narrow length of 1,476 ft.
An inlet and outlet stream were also added to the lake within the model. The inlet stream (culvert inlet) was added as a linesink and represents the average tile drainage inflow plus the average inflow of additional inputs from the North Cove culvert and Cove Pond as simulated with XP-SWMM provided by CBBEL (written comm., July 2021). The inflow volume was added as “end inflow” in the model. Overland flow values were also provided for average, wet, and dry conditions by CBBEL (written comm., July 2021). The culvert outlet weir elevation (surface-water outflow) from the lake at Crystal Creek was set to the current weir elevation of 890.70 ft. Average surface-water outflow (discharge) values into Crystal Creek for 2020 average conditions, wet (2017), and dry (2012) conditions were provided by CBBEL (Scott Griffith, written commun., November 2021; table 3) and were used to create calibration targets in the model.
The “lake package” within the model also requires a stage-area table. Lake stage, area, and volume data were obtained from the bathymetric data provided by the CLPD (Hey and Associates, written commun., February 9, 2021). The depth of the lake is the average lake stage (890.90 ft) minus the elevation of the bottom of the lake (849.90 ft) plus the lake bottom thickness (2 ft) so that the total lake depth is 43 ft. The lake package within the model also requires a lake-stage discharge table (flow values for a range of lake stages) for the Crystal Lake culvert outlet. There were no direct measurements of lake stage and discharge data; therefore, lake-stage discharge was estimated from the average 2020 culvert outlet outflow data derived from the XP-SWMM estimates for the GFLOW model (table 3). The average lake stage of 890.9 ft (table 2) was assigned to the average culvert outlet outflow of 226,610 cubic feet per day (ft3/d; table 3) and a steady-state, lake-stage discharge curve of hypothetical discharge rates above the average lake-stage elevation were increased by 35,315 ft3/d beginning after the lake stage of 891.08 ft. Closer to the average lake-stage elevation, the discharge was increased at about half that of the 35,315 ft3/d increment to create the steady-state stage-discharge curve. Too large of discharge increases for small lake-stage changes would cause the GFLOW model to be unstable as the model simulates steady-state conditions and transient conditions are unable to be solved. An additional lake-stage discharge table with slightly increased discharge rates was created for simulating the lowered weir scenarios based on reported XP-SWMM (CBBEL, written commun., November 12, 2021) simulations of increased discharge with a lowered weir (table 6). The values for the increased stage-discharge were derived by starting with the discharge rate of 317,835 ft3/d estimated at 892.39 ft in the previous lake-stage discharge table and then added 35,315 ft3/d for each lake-stage increment. Of note, the lake stage-discharge curves in each table start with the discharge of 0 at an elevation of 889.11 ft; however, the actual lake stage for which the discharge is equal to 0 is 890.68 ft. The steady-state model required a broader range in lake-stage increments for the model to iterate the discharge value between the stage elevations, allowing the model to converge on a stable solution.
Table 6.
Lake-stage discharge values and increased lake stage-discharge values applied at culvert outlet of Crystal Lake, City of Crystal Lake, Illinois.[Values presented in this table are rounded for presentation; however, unrounded values are used in the model input and outputs and conversion from International System Units (metric) used by the groundwater flow analytical element model (GFLOW) model (Gahala, 2024). foot; ft3/d, cubic foot per day]
One production well (Cardinal well) north of the lake had an extraction rate of 8,662.5 ft3/d (Illinois State Geological Survey, 2021a). Two production wells are south of the lake, well 9 and well 15 (fig. 2). Well 9 is about 1,700 ft southeast of the lake at a depth of 203 ft with an extraction rate of 22,137 ft3/d. Well 15 is about 4,200 ft southwest of the lake at a depth of 137 ft with an extraction rate of 105,875 ft3/d (City of Crystal Lake, written commun., August 27, 2021). The extraction well depths are for context of depth within the sand and gravel aquifer but were simulated as fully penetrating in the model.
Of interest in this study was an understanding of groundwater flow patterns surrounding Crystal Lake under average conditions and groundwater flow pattern responses under wet and dry scenarios. Model scenarios were simulated for average, wet, and dry conditions with a lowered weir elevation from the current elevation of 890.70 ft to 889.70 ft to simulate lake and groundwater responses in each climate condition. It is important to emphasize that the model is a steady-state simulation, meaning that the simulations represent the results that would be obtained provided there were no change in the inputs and outputs and the system were allowed enough time (typically years) to equilibrate; therefore, results may exceed expected responses during short-term wet or dry conditions The model results may best be viewed as providing general patterns and long-term averages of groundwater and surface-water interactions under the simulated scenario conditions.
Model Calibration
Three GFLOW models were manually calibrated to the average, wet, and dry conditions under the current weir elevation. Groundwater flow directions and elevations are affected by surface-water features that intersect the water table, aquifer thickness, Kh, transmissivity, recharge, and pumping effects. Previous studies and direct measurements from this study informed the initial input values for Kh, recharge, base flow, and evapotranspiration. These input values, along with the lakebed and streambed resistance also were adjusted during the model calibration process so that the sum of squared differences between simulated and target values of groundwater levels and base flows were minimized.
During model development, it was apparent that the groundwater levels north of Crystal Lake were uniquely and uniformly sensitive to Kh and, relatedly, transmissivity. Decreasing the Kh, which typically increases the water level, resulted in simulated water levels that were too low in monitoring wells north of Crystal Lake, whereas water levels in monitoring wells at greater distances had simulated water levels that were too high. This indicated that the base of the aquifer would need to be raised to be consistent with the geology and topography north of Crystal Lake. In the model, inhomogeneities were added to increase the base and reduce the transmissivity calculated by the model in these areas, thereby improving the match to observed water level and base-flow targets. Additionally, the Kh within the largest inhomogeneity (dashed purple polygon in fig. 5) was adjusted from the regional 14.76 ft/d to 6.56 ft/d.
There were no direct measurements of streambed thickness or Kv; however, parameter sensitivity assessments demonstrated that the model results were not sensitive to changes in streambed resistance within reasonable ranges (between 0 and 10 days). The resistance value for most streams was fixed at 1 day during calibration as it resulted in the least amount of error; however, Crystal Lake inflow (culvert inlet) representing the tile drainage into the lake was adjusted to have a resistance of 5 to obtain improved calibration to target flow, and Crystal Creek was adjusted to a resistance of 3 (reflecting the longer flat gradient of the stream) to improve matches to target flow. The tile drainage system is designed to lower the water table north of Crystal Lake and would have low resistance to connecting to the groundwater during higher water tables but higher resistance during lower water tables. The tile drains are not mapped throughout the model extent because the linesinks would interfere with the needed inhomogeneities and no elevation data are available for the tile drain laterals. Instead, all inflow is simulated at the culvert inlet, and model calibration indicated that increasing the resistance at the tile drain represented by the culvert inlet improved matches to the target inflow values.
XP-SWMM simulated average discharge values at the outlet to Crystal Creek provided by CBBEL (written commun., November 3, 2021) for the average year 2020, wet year of 2017, and dry year of 2012 were targeted in the simulated GFLOW model to achieve optimal model calibration. Model calibration also considered a lake balance error of less than 1 percent and lake levels for average, wet, and dry conditions as calibration targets.
The effectiveness of model calibration was also evaluated quantitatively by comparison of scatter plots of measured and simulated hydraulic groundwater heads and lake levels and flows for the average, wet, and dry models (fig. 6). Residuals for the simulated versus observed groundwater heads and lake levels and Crystal Creek streamflow for average, wet, and dry conditions indicated generally low residuals (points plotted near the line of zero residuals); however, the residuals for Boone Creek flows were generally undersaturated, particularly during wet conditions. The average of the differences in measured and simulated hydraulic heads are quantified with root mean square error (RMSE), absolute mean error (AME), and mean error (ME) to evaluate model performance. In addition to reducing residuals (differences between observed and simulated values) of nearfield water levels, the simulated lake levels and culvert outlet discharge values were also used as calibration targets. After the calibration of the average conditions model, the Kh, resistance, and inhomogeneities were fixed in the wet and dry conditions models and were each calibrated by adjusting the recharge and precipitation to achieve minimal differences between simulated and observed values, and lower RMSE, AME, and ME. Table 7 lists the final parameters, and the calibration results for the average conditions (2020), wet conditions (2017), and dry conditions (2012).
Simulated groundwater heads, lake levels, and simulated base flow in relation to target values, Crystal Lake, City of Crystal Lake, Illinois.
Table 7.
Final calibrated parameter inputs and calibration results for the average year (2020), wet year (2017), and dry year (2012) in groundwater model for Crystal Lake, City of Crystal Lake, Illinois.[Values presented in the table are rounded for presentation; however, unrounded values are used in the model input and outputs and conversion from International System Units (metric) used by the groundwater flow analytical element model (GFLOW) model (Gahala, 2024). ft/d, foot per day; ft3/d, cubic foot per day; Kh, hydraulic conductivity]
The PEST (parameter estimation) tool within GFLOW was applied to verify the manual calibration parameters for linesinks, Kh, and model aquifer base elevation. The PEST results indicated lower residuals were achieved with slightly higher Kh, at 17.81 ft/d, and a corresponding increase in recharge would be needed for the average, wet, and dry conditions; however, the simulated lake levels were slightly too high from the target lake levels (table 7) for the average, wet, and dry conditions. The lake stage is the focal point of this model and the manually calibrated model simulated lake levels closer to the target lake levels; therefore, the manually calibrated model was retained for simulating the effects of a lowered weir and increased outflows during average, wet, and dry conditions.
Sensitivity and Uncertainty Analysis
A model is a simplification of the natural world and contains uncertainty because of limitations associated with available data, conceptualization of the hydrogeologic system, and mathematical representation of complex processes. Sensitivity tests evaluate the importance of each of the model input parameters on the outcome of the model. Sensitivity of the model was analyzed by changing the calibrated Kh, recharge, and lakebed resistance by increments within regional and historical ranges. For sensitivity analysis, the Kh was adjusted to the lowest and highest values measured from the slug tests and the model outputs of lake levels, lake balance error, minimum and maximum water level, and deviations from calibration test points were noted (table 8). Additionally, sensitivity was also assessed by removing the added inhomogeneities with base elevation changes, lowering the weir elevation by 2 and 4 ft, and testing the sensitivity of the outlet flow data at the culvert outlet from Crystal Lake. Changes in the RMSE, AME, ME and target water levels and target stream outflow at Crystal Creek and Boone Creek base flows are provided in table 8. The results of the sensitivity analysis indicated the model is sensitive to the parameters of Kh and recharge, as shown by the larger percent differences between observed and simulated outflow and lake levels from the average conditions model between low to high input values. The inhomogeneities that adjust the model base also account for 44 percent of the simulated outflow and would reduce the lake level by 1.28 ft and result in a large negative mean error (−9.19 ft) indicating a low bias in the simulated test points. The sensitivity analysis for the weir elevation changes of 1, 2, and 4 ft shows the lake elevation decreases by 0.03, 0.10, and 0.23 ft, at each respective weir elevation change; however, this does not account for any associated increase in the lake-stage discharge rates. The model responses to the two versions of the lake-stage discharge data (table 6) at the culvert outlet for the average, wet, and dry conditions are also included in table 7. The increased lake-stage discharge values (current and lowered weir elevations) have the greatest effect on changes in lake levels, decreasing the lake level by 0.82–1.71 ft. Overall, lake levels and lake-balance error were sensitive to recharge, Kh, inhomogeneities, and increased lake-stage discharge at the culvert outlet.
Table 8.
Parameter sensitivity and uncertainty analysis results tested in groundwater model for Crystal Lake, City of Crystal Lake, Illinois, for simulation of groundwater/surface-water interaction.[Values in table are rounded for presentation; however, unrounded values are used in the model input and outputs and conversion from International System Units (metric) used by the groundwater flow analytical element model (GFLOW) model (Gahala, 2024). ft/d, feet per day; m/d, meters per day; %, percent; Kh, hydraulic conductivity; R, recharge; E, evapotranspiration; P, precipitation]
Uncertainty analysis entails adjusting the input parameters within the expected uncertainty of the input values and evaluating the changes in the model output. Table 8 lists the range of possible parameter values for hydraulic conductivity, recharge, evapotranspiration, and precipitation as moderately low to moderately high values. The effect of these upper and lower bounds on the simulated flow and lake level provides the range of uncertainty and associated error for each parameter.
The analytical element model GFLOW was chosen for its simplicity and suitability for simulating the groundwater/surface-water interactions for estimating the amount of water moving through each component of the hydrologic cycle, identifying sources of water entering the lake and other areas of interest, and evaluating the hydrologic stressors (such as wet or dry weather conditions) and infrastructure changes (lowering of weir elevation). The steady-state groundwater/surface-water flow system was simulated using the wet-year and dry-year values to evaluate effects on groundwater elevations, lake stage, and water budgets during extreme climate conditions. Potential effects of extended wet and dry conditions were evaluated by adjusting precipitation and recharge in the model. Steady-state models will simulate each scenario to its equilibrium point. The steady-state model will simulate wet conditions as elevated groundwater and surface water relative to average or dry conditions if input conditions remained unchanged for an indefinite period. Likewise, simulation of dry conditions depicts water elevations if dry conditions persisted indefinitely. Reality is much more dynamic; nevertheless, the steady-state simulations provide a general depiction of groundwater flow directions and lake-level responses to changes in water budget components of the hydrologic cycle. The effects of lowering the weir by 1 ft, and then increasing the outflow at the culvert outlet were evaluated for the average conditions, wet conditions, and dry conditions. The lake-water budget and groundwater contours are presented and discussed in the subsequent subsections. The model and associated files are archived in a separate data release (Gahala, 2024).
Simulations of Lake Resiliency
The following sections detail the results from the simulations of average, wet, and dry conditions to evaluate the lake-level and groundwater-level changes. Lake resiliency is assessed under current weir elevations and projected lowering of weir elevation by 1 ft. Lake-water budgets and groundwater contours are presented for three simulations under average, wet, and dry conditions. The first simulation is current weir elevation with current estimated surface-water inflows and outflows. The second simulation for each climate scenarios does not include an increase in surface-water outflow because the projected surface-water outflow for steady-state conditions is unknown; therefore, the simulations of lake-water budgets and groundwater contours without increasing the surface-water outflow is presented to fully understand the effect of the increased surface-water outflow on lake stage and surrounding groundwater levels. The third simulation includes the lowered weir by 1 ft and increased surface-water outflow for each climate condition.
Simulations of Average Conditions
The simulated lake-water budget for the average conditions and lowered weir and increased outflow scenarios are provided in table 9. The lake-water budget for the average conditions with the current weir elevation indicates that surface-water inflow (22 percent) and surface-water outflow (33 percent) are the largest components of the lake-water budget contributing to the simulated lake area and stage. Precipitation (13 percent), overland flow (11 percent), and evaporation (10 percent) are the next largest components of the lake-water budget. Groundwater contributes 4 percent to the inflow into the lake, and 7 percent of lake water exits the lake as groundwater outflow. Under the scenario of the culvert outlet weir lowered by 1 ft and the outflow consistent with current conditions, the lake-water budget largely remains the same, but the simulated lake area decreased slightly; this corresponded to a slight increase of groundwater outflow from the lake and a slight lake level decrease by 0.07 ft. The average conditions with a lowered weir and increased outflow lowered the lake area by 3.33 acres and decreased the lake stage by 1.21 ft compared to average conditions with current weir elevation. The lake-water budget determined the increase in surface-water outflow was balanced by increasing groundwater inflow (2.87 in/yr) and decreasing the groundwater outflow by about 3.83 in/yr. The percentage of each lake-water budget component was generally the same with surface-water inflows and outflows the largest contribution to lake area and stage.
Table 9.
Simulated lake-water budgets for the average conditions with current weir elevation, lowered weir, and lowered weir with increased outflow scenarios in Crystal Lake, City of Crystal Lake, Illinois.[NAVD 88, North American Vertical Datum of 1988; %, percent; —, not applicable
Figure 7 shows groundwater elevation contours (in feet) for the scenarios of (1) average conditions with current weir (orange contours), (2) average conditions with lowered weir (purple contours), and (3) average conditions with lowered weir and increased outflow (green contours). Groundwater flow is perpendicular to the contours. The groundwater contours in each simulation indicate flow directions from some monitoring wells farthest north from Crystal Lake may not be flowing towards the lake. Groundwater that discharges to the lake enters from areas north of the lake from the Lippold well area up near IL Route 176 at MW6 (421453088211501), whereas groundwater contours in the area north of U.S. Highway 14 (MW2 and MW1) and along Ridgefield Rd (MW3, MW4) show that the groundwater flow direction may not always flow toward the lake, but instead flows radially toward the Kishwaukee River Basin, southeast or north along a topographically and hydrologically elevated area (fig. 7). This occurred under all scenarios and during calibration and sensitivity testing.
Groundwater elevations simulated under average conditions with current weir, lowered weir, and lowered weir with increased outflow at Crystal Lake, City of Crystal Lake, Illinois.
Comparing the groundwater contour configurations between the average conditions with the current weir and the average conditions with a lowered weir shows the groundwater contours near the lake have small shifts northwards in the 890-ft contour at the culvert outlet of Crystal Lake and the 885-ft contour along Crystal Creek shifts southwards, indicating a slight increase in the surface-water elevations along Crystal Creek. Contours north of the lake are generally the same at the 895 ft-contour and farther north. The average conditions with a lowered weir and increased outflow show a larger shift northward (decreasing water levels) of the 890-ft contour and 895-ft contour. The lake level decreases by 1.21 ft and groundwater elevation decreases at the Lippold well at the 895-ft contour. The decreasing groundwater elevation appears to stop north of Lippold well beyond IL-176, indicating the lateral extent at which the lowered weir and increased outflow may affect the groundwater north of Crystal Lake.
Simulations of Wet Conditions
The lake-water budget during wet conditions determined a similar percentage distributed for components that contribute to the simulated lake area and lake stage (table 10) as the average conditions. The simulated wet conditions indicated the lake area of 243.59 acres at a stage of 891.96 ft. Surface-water inflow and outflow remain the primary components of the lake-water budget. During the simulated wet conditions, the component of groundwater increased from 4 to 7 percent compared to average conditions, while the groundwater outflow decreased from 7 to 4 percent. This corresponded to an increase in the surface-water outflow from 33 to 37 percent indicating the excess groundwater entering the lake was diverted primarily out through the surface-water outlet (taking the path of least resistance). Lowering the weir by 1 ft decreased the lake area by 0.94 acres and lowered the lake stage by a tenth of a foot to 891.86 ft. Lowering the weir and increasing the outflow at the culvert outlet decreased the lake area by 12.61 to 230.98 acres and decreased the lake stage by 1.87 to 890.09 ft compared to wet conditions with the current weir elevation. The lake-water budget determined the surface-water outflow comprised much of the water flowing out of the lake, while groundwater outflow decreased to 2 percent of the total lake-water budget. Lowering the weir and the increased flow appears to decrease the lake level and lake area to levels observed during average conditions.
Table 10.
Simulated lake-water budgets for the wet conditions with the current weir, lowered weir, and lowered weir with increased outflow scenarios in Crystal Lake, City of Crystal Lake, Illinois.[NAVD 88, North American Vertical Datum of 1988; %, percent; —, not applicable
The groundwater contours representing the groundwater elevations for the simulated wet conditions with the current weir elevation show the 890 ft-contour farther down Crystal Creek, indicating higher groundwater and surface-water levels (fig. 8). Lowering the weir shifts the 890-ft contour slightly northward along Crystal Creek, indicating a decrease in groundwater and surface-water levels. For the wet conditions with a lowered weir and increased outflow, the 890-ft contour shifted farther north across the lake, and the 895-ft contour north of the lake shifted more towards the Lippold well, indicating a decrease in groundwater elevation especially just north of the lake. A similar shift of the 890-ft contour and the 895-ft contour was simulated during the 2020 average conditions with a lowered weir and increased outflow, potentially supporting the consistent lake-stage between average and wet conditions with the lowering of the weir and increased flow.
Groundwater elevations simulated under wet conditions for current weir elevation, lowered weir, and lowered weir with increased outflow at Crystal Lake, City of Crystal Lake, Illinois.
The simulated groundwater outflow decreases during wet conditions and increases during dry conditions. This appears paradoxical as one might expect the groundwater outflow to increase during wet conditions and decrease during dry conditions. This decrease in groundwater outflow during wet conditions and increase during dry conditions could be because of the relatively lower horizontal hydraulic gradient (0.001) between the lake and groundwater levels south of the lake than between the lake and the groundwater levels north of the lake (0.002), reducing the amount of groundwater that discharges south of lake. Instead, excess water tends to drain out through the surface-water outlet (culvert outlet), taking the path of least resistance.
Simulation of Dry Conditions
The simulation of dry conditions indicated that the lake levels decreased primarily by recharging the groundwater, as shown by the increase in groundwater outflows in the lake-water budget (table 11). The lake-water budget shows little changes in the water budget components between the dry conditions with the current weir and the dry conditions with lowered weir and increased outflow. The simulated lake-stage elevations changed by 0.08 ft from the dry conditions with the current weir elevation to dry conditions with the lowered weir and increased outflow. This is expected because an increase in the surface-water outflow would not likely affect the lake stage because the simulated lake stage during dry conditions was simulated to be below the weir elevation of 889.70 ft.
Table 11.
Simulated lake-water budgets for dry conditions model, lowered weir, and lowered weir with increased outflow at Crystal Lake, in City of Crystal Lake, Illinois.[NAVD 88, North American Vertical Datum of 1988; %, percent]
Figure 9 shows the groundwater elevation contours simulated under dry conditions for current weir elevation, lowered weir, and lowered weir with increased outflow at Crystal Lake. Dry conditions with the current weir elevation showed the lake level of 889.30 ft during dry conditions, a 1.64 ft decrease from average conditions with the current weir elevation and is consistent with historical lake-level lows. Lowering the weir did not alter the lake level, but the lake area did decrease slightly by 0.02 acre.
Groundwater elevations simulated under dry conditions for current weir elevation, lowered weir, and lowered weir with increased outflow at the City of Crystal Lake, McHenry County, Illinois.
Simulation of lowering the weir and increasing the outflow decreased the lake elevation by 0.08 ft and the lake area by 0.19 acre. This decrease was mainly from groundwater outflow. Surface-water inflow and outflow largely remained the same during the dry periods because the elevation of the simulated lake level is slightly less than the current weir elevation (890.70 ft) greatly reducing the amount of surface water exiting at the weir. During dry periods, the horizontal hydraulic gradient increases between the lake level and the groundwater levels south of the lake. As surface-water outflow decreased its effect on the water budget, the groundwater outflow (lake water recharging to groundwater) increased to recharge the groundwater south of the lake. The ability of the surface-water inflows and outflows to modify the lake levels is greatly reduced when precipitation and recharge are decreased, indicating they are important drivers of the lake-water budget and account for a substantial component of lake volume. Lowering the weir by 1 ft was simulated to decrease the lake level slightly, but the change is consistent with historical lows.
Overall, the simulation results indicate a lowered weir without increased outflow did not have a substantial effect on the lake levels or surrounding groundwater elevations near the lake; however, lowering the weir and increasing the outflow at culvert outlet reduces the lake level elevations as much as 1.87 ft under average, wet, or dry scenarios compared to average, wet, or dry conditions when the weir was not lowered. The lowered weir elevation with increased outflow under average and wet conditions also indicated the groundwater levels north and immediately south of the lake decrease about 1–2 ft (table 12).
Table 12.
Simulated water-level changes between current weir elevation and lowered weir with increased outflow for average, wet, and dry conditions at Crystal Lake, Illinois.| Test point short name (table 2) | Water-level changes between current weir and lowered weir with increased outflow1 | ||
|---|---|---|---|
| Average conditions, in feet | Wet conditions, in feet | Dry conditions, in feet | |
| 7HRTS | 0.00 | 0.00 | 0.00 |
| 11SENI | 0.00 | 0.00 | 0.00 |
| 32.4d | 0.01 | 0.00 | 0.00 |
| MHEN0801 | 0.01 | 0.00 | 0.00 |
| 13NUNI | 0.01 | 0.00 | 0.00 |
| 3.7d | 0.08 | 0.10 | 0.00 |
| 16GRFI | 0.02 | 0.02 | 0.00 |
| 15CORS | 0.00 | 0.00 | 0.00 |
| MW8 | 0.21 | 0.06 | 0.01 |
| MW2 | 0.12 | 0.19 | 0.01 |
| MW1 | 0.27 | 0.41 | 0.02 |
| MW7 | 0.61 | 0.92 | 0.02 |
| GW2* | 1.05 | 1.64 | 0.06 |
| MW3 | 0.09 | 0.13 | 0.00 |
| Lippold well* | 0.92 | 1.42 | 0.06 |
| MW4 | 0.21 | 0.31 | 0.01 |
| MW6* | 0.74 | 1.11 | 0.04 |
| GW1* | 0.95 | 1.31 | 0.13 |
| CW3-R* | 0.96 | 1.47 | 0.05 |
| MW5 | 0.66 | 0.97 | 0.04 |
| ISWS* | 0.97 | 1.33 | 0.14 |
| Crystal Lake | 1.19 | 1.87 | 0.08 |
| 8.2c | 0.11 | 0.15 | −0.01 |
The simulation of the increased outflow at the culvert outlet indicated the lake stage, lake-water budgets, and the surrounding groundwater appeared to be affected by the higher outflow at the culvert outlet as indicated by the decrease in lake and groundwater levels surrounding the lake. The GFLOW model shows that the lowered weir and increased outflow could affect the lake levels and groundwater elevations near the lake for average and wet conditions. The lowered weir and increased outflow indicate the lake stage is maintained to average conditions during wet periods. Dry conditions did not show substantial change in water levels, and this is logical because the lower precipitation and lake levels will have lower surface-water inflow and outflows, naturally.
Assumptions and Limitations
The two-dimensional groundwater flow model was assumed to be appropriate for this study application because the aquifer in the area of interest is thin (less than 60 ft) and is highly connected to the lake. This thin upper aquifer is assumed to be laterally extensive with uniform Kh except for added inhomogeneities that locally raise the base of the aquifer resulting in a decrease in transmissivity. Steady-state conditions are also assumed appropriate for the purpose of this modeling effort because of the relatively high Kh in the study area and connection of the aquifer to the lake, which naturally dampens any transient stresses. These assumptions have subsequent limitations in the model, specifically in understanding any three-dimensional flow and transient responses to short-duration stresses such as episodic flooding and drought or the short-term response of the lake water levels to lowering the weir. One assumption in the model was the elevation of the model base (615 ft), which was determined from a single geologic well log from a deep monitoring well to represent a known minimum elevation for top of bedrock. The actual minimum top of bedrock elevation may be lower than 615 ft within the study area.
A limitation of the model is also from the source of recharge data from a regional soil water balance model for analog average, wet, and dry years may also limit the accuracy of the model. The percentage of precipitation that makes it to recharge was similar for the average (17 percent) and dry (16 percent) years but much higher for the wet (28 percent) year. It is expected that recharge would increase during wet conditions, but the percentage of recharge to precipitation should not have an outsized increase. The PEST-calibrated model indicated improved consistency in recharge to precipitation percentages with the slightly increased Kh and corresponding increase in recharge. The simulations between the PEST-calibrated model and the manual calibration did not have any substantial differences in groundwater elevations or lake budgets, indicating that this higher-than-expected recharge during wet conditions did not affect the model outputs.
Another limitation of the model is the lack of historical and directly measured surface-water discharge data for the inflows or outflow of Crystal Lake, which potentially increases the overall uncertainty of the groundwater model; however, the consistency between the simulated surface-water discharge and measured surface-water discharge supports the application of the XP-SWMM values in the groundwater model. Additional periodic and episodic measurements of surface-water discharge into and out of Crystal Lake may improve the XP-SWMM rainfall-runoff surface-water model and this GFLOW model. Likewise, there were no measured lake-stage discharge values available for this study for the outflow at the culvert outlet. The lake-stage discharge estimates provided by CBBEL for the current and lowered weir at the culvert outlet into Crystal Creek were likely transient values that the GFLOW steady-state model was not able to simulate. The lack of long-term, direct measurements for lake-stage discharge values for the current weir elevation may be a substantial data gap. The sensitivity of this data gap was assessed by simulating average, wet, and dry scenarios with the increased steady-state stage-discharge values. Confirmation of the simulated stage-discharge estimates may also improve the uncertainty of the model as the slightly larger increases in stage-discharge corresponded to decreases in groundwater levels surrounding the lake.
Lastly, evapotranspiration is an important water budget component that can affect lake water levels. Evapotranspiration rates for wet or dry conditions were not adjusted in the simulations because of lack of direct evapotranspiration data available. The evapotranspiration rate was instead held constant to the Roberts and Stall (1967) value, and this may increase the uncertainty of the model scenarios. Although the sensitivity analysis did not indicate large effects on lake levels, additional data-collection techniques for estimating lake evaporation specific to Crystal Lake could potentially reduce the uncertainty of this model parameter.
Summary and Conclusions
The U.S. Geological Survey, in cooperation with the City of Crystal Lake, Illinois, started a study to increase understanding of groundwater and surface-water interaction between the glacial aquifer and the city’s namesake lake, Crystal Lake, and the effect of higher and lower precipitation conditions on groundwater and lake levels. The results from this study could be used by the city and others to aid in lake management strategies. This report provides an evaluation of the groundwater/surface-water interaction and hydrologic framework for Crystal Lake. The hydrologic framework is incorporated into a steady-state two-dimensional groundwater and surface-water computer model to quantify the effects on groundwater and surface-water levels when reducing the elevation of the outlet weir by 1 foot (ft) and evaluates the effects on groundwater levels during average, wet, and dry climate conditions.
The groundwater analytical element model (GFLOW) was chosen for its simplicity and suitability for simulating the groundwater/surface-water interactions for estimating the amount of water moving through each component of the hydrologic cycle, identifying sources of water entering the lake and other areas of interest, and evaluating the hydrologic stressors (such as wet or dry weather conditions) and infrastructure changes (lowering of weir elevation). The simulation results indicate a lowered weir without increased outflow did not have a substantial effect on the lake levels or surrounding groundwater elevations near the lake; however, lowering the weir and increased outflow reduces the lake level elevations by as much as 1.87 ft under average, wet, or dry scenarios compared to average, wet, or dry conditions when the weir was not lowered. The simulations with a lowered weir elevation with increased outflow under average and wet conditions also indicated the groundwater levels north and immediately south of the lake would decrease about 1–2 ft.
The simulation of the increased outflow at the culvert outlet indicated the lake stage, lake-water budgets, and the surrounding groundwater appeared to be affected by the higher outflow at the culvert outlet as indicated by the decrease in lake and groundwater levels surrounding the lake. It is unknown if or by how much the lowered weir would increase the steady-state, surface-water discharge, but the GFLOW model indicates that a moderate increase could affect the lake levels and groundwater elevations near the lake at least for average and wet conditions. The lowered weir and increased outflow indicate the lake stage is maintained to average conditions during wet periods. Dry conditions did not show substantial change in water levels, and this is logical because the lower precipitation and lake levels would have lower surface-water inflow and outflows, naturally.
Seepage-Meter Groundwater Discharge
The results of the seepage tests, seepage rates, and averages are provided in table 1.1. Seepage rates ranged from -0.08 to 0.51 feet per day (ft/d) along the northern shoreline with an average seepage of 0.06 ft/d. Seepage rates along the southern shoreline ranged from −0.28 to 0.12 ft/d with an average loss of −0.08 ft/d.
Table 1.1.
Seepage meter results at Crystal Lake, City of Crystal Lake, Illinois, October 28–30 and November 4–5, 2020.[ft, foot; ml, milliliter; ml/min, milliliter per minute; ft3/d, cubic foot per day; -, not determined; EF, equipment failure; small meter, 5-gallon pail; numbers in parentheses are negative values]
| Location (fig. 2) | Test number | Distance from shoreline (ft) | Start volume (ml) | End volume (ml) | Volume change (ml) | Discharge to barrels (ml/min) | Discharge to barrels (ft3/d) | Seepage flux (ft/d) | Average discharge to barrels per location (ft3/d) | Average seepage flux (ft/d) | Average (flux) seepage (ft/d) |
|---|---|---|---|---|---|---|---|---|---|---|---|
| NS1 | 1 | 10 | 1,000 | 930 | EF | - | - | - | 0.19 | 0.20 | 0.06 |
| NS1 | 2 | 10 | 1,000 | 1,160 | 160 | 2.67 | 0.14 | 0.05 | |||
| NS1 | 3 | 20 | 1,000 | 870 | EF | - | - | - | |||
| NS1 | 4 | 20 | 1,000 | 1,120 | 120 | 2.00 | 0.10 | 0.04 | |||
| NS1 | 5 (small meter) | 15 | 0 | 400 | 400 | 6.67 | 0.34 | 0.51 | |||
| NS2 | 1 | 10 | 1,000 | 1,170 | 170 | 2.83 | 0.14 | 0.05 | 0.17 | 0.06 | |
| NS2 | 2 | 10 | 1,000 | 1,220 | 220 | 3.67 | 0.19 | 0.06 | |||
| NS2 | 3 | 22 | 1,000 | 1,180 | 180 | 3.00 | 0.15 | 0.05 | |||
| NS2 | 4 | 22 | 1,000 | 1,350 | 350 | 5.83 | 0.30 | 0.10 | |||
| NS2 | 5 | 31 | 1,000 | 1,260 | 260 | 4.33 | 0.22 | 0.08 | |||
| NS2 | 6 | 31 | 1,000 | 930 | EF | - | - | - | |||
| NS2 | 7 (small meter) | 10 | 1,000 | 1,020 | 20 | 0.33 | 0.02 | 0.03 | |||
| NS3 | 1 | 10 | 1,000 | 950 | (50) | (0.83) | (0.04) | (0.01) | (0.08) | (0.05) | |
| NS3 | 2 | 20 | 1,000 | 830 | (170) | (2.83) | (0.14) | (0.05) | |||
| NS3 | 3 | 20 | 1,000 | 1,130 | 130 | 2.17 | 0.11 | 0.04 | 0.09 | 0.03 | |
| NS3 | 4 | 10 | 1,000 | 1,100 | 100 | 1.67 | 0.08 | 0.03 | |||
| NS3 | 5 | 15 | 1,000 | 1,160 | 160 | 2.67 | 0.14 | 0.05 | |||
| NS3 | 6 | 10 | 1,000 | 1,030 | 30 | 0.50 | 0.03 | 0.01 | |||
| NS3 | 7 (small meter) | 20 | 1,000 | 940 | (60) | (1.00) | (0.05) | (0.08) | |||
| SS1 | 1 | 10 | 1000 | 820 | (180.0) | (3.00) | (0.15) | (0.05) | (0.06) | (0.02) | (0.08) |
| SS1 | 2 | 10 | 1000 | 990 | (10.0) | (0.17) | (0.01) | (0.00) | |||
| SS1 | 3 | 10 | 1000 | 1560 | EF | - | - | - | |||
| SS1 | 4 | 10 | 1000 | 960 | (40.0) | (0.67) | (0.03) | (0.00) | |||
| SS1 | 5 | 20 | 1000 | 1000 | - | - | - | - | |||
| SS1 | 6 | 20 | 1000 | 1010 | 10.0 | 0.17 | 0.01 | 0.00 | |||
| SS1 | 7 (small meter) | 10 | 1000 | 1170 | EF | - | - | - | |||
| SS2 | 1 | 11 | 1000 | 140 | (860.0) | (14.33) | (0.73) | (0.25) | (0.49) | (0.21) | |
| SS2 | 2 | 11 | 1000 | 80 | (920.0) | (15.33) | (0.78) | (0.27) | |||
| SS2 | 3 | 11 | 1000 | 1630 | EF | ||||||
| SS2 | 4 | 17 | 1000 | 200 | (800.0) | (13.33) | (0.68) | (0.24) | |||
| SS2 | 5 | 17 | 1000 | 530 | (470.0) | (7.83) | (0.40) | (0.14) | |||
| SS2 | 6 | 17 | 1000 | 790 | (210.0) | (3.50) | (0.18) | (0.06) | |||
| SS2 | 7 (small meter) | 11 | 1000 | 780 | (220.0) | (3.67) | (0.19) | (0.28) | |||
| SS3 | 1 | 14 | 1000 | 420 | (580.0) | (9.67) | (0.49) | (0.17) | (0.16) | (0.06) | |
| SS3 | 2 | 14 | 1000 | 870 | (130.0) | (2.17) | (0.11) | (0.04) | |||
| SS3 | 3 | 14 | 1000 | 1000 | 0.00 | 0.00 | 0.00 | 0.00 | 0.03 | 0.04 | |
| SS3 | 4 | 22 | 1000 | 1020 | 20.0 | 0.33 | 0.02 | 0.01 | |||
| SS3 | 5 | 22 | 1000 | 900 | (100.0) | (1.67) | (0.08) | (0.03) | |||
| SS3 | 6 | 22 | 1000 | 870 | (130.0) | (2.17) | (0.11) | (0.04) | |||
| SS3 | 7 (small meter) | 22 | 1000 | 1090 | 90.0 | 1.50 | 0.08 | 0.12 |
The minipiezometer indicated hydraulic head differences of groundwater flowing (groundwater level greater than surface-water level) into the lake along the northern shoreline at NS1 and NS2 (table 1.2). Lake water recharging to the groundwater was indicated by the lake level being higher than the groundwater level and occurred primarily at SS2 and SS3. NS3 and SS3 had mixed conditions of groundwater recharge and discharge from the lake. The distribution of groundwater entering along the northern shoreline and exiting along the southern shoreline is primarily central and east, with the western end showing mixed flow directions.
Table 1.2.
Vertical hydraulic conductivity as measured from the minipiezometer and seepage meter data at Crystal Lake, City of Crystal Lake, Illinois, October 28–30 and November 4–5, 2020.[Numbers in parentheses are negative values. —, not applicable
| Location (fig. 2) | Piezometer reading, in feet | Piezometer depth, in feet | Gain (G) or loss (L) | Vertical hydraulic conductivity of sediment, in feet per day | Average vertical hydraulic conductivity of sediments of north shore and south shore measurements, in feet per day |
|---|---|---|---|---|---|
| NS1 | 0.35 | 0.5 | G | 0.28 | 0.08 |
| NS2 | 0.55 | 0.5 | G | 0.06 | |
| NS3 | 0.3 | 0.5 | L | (0.08) | |
| NS3 | 0.3 | 0.5 | G | 0.05 | |
| SS1 | 0.52 | 0.5 | L | (0.02) | (0.06) |
| SS2 | 0.5 | 0.5 | L | (0.21) | |
| SS3 | 0.6 | 0.5 | L | (0.05) | |
| SS3 | 0.6 | 0.5 | G | 0.03 |
References Cited
Barlow, P.M., Cunningham, W.L., Zhai, T., and Gray, M., 2015, U.S. Geological Survey Groundwater Toolbox, a graphical and mapping interface for analysis of hydrologic data (version 1.0)—User guide for estimation of base flow, runoff, and groundwater recharge from streamflow data: U.S. Geological Survey Techniques and Methods, book 3, chap. B10, 27 p., accessed August 2021 at https://doi.org/10.3133/tm3B10.
Bauer Engineering, Inc., 1975, Crystal Lake watershed resources management study: Chicago, Ill., Bauer Engineering, Inc., [variously paged], accessed January 2022 at https://www.crystallakeparks.org/upload/BauerReport-WatershedResourceManagementStudy-min.pdf.
Cunningham, W.L., and Schalk, C.W., comps., 2011, Groundwater technical procedures of the U.S. Geological Survey: U.S. Geological Survey Techniques and Methods 1–A1, 151 p. [Also available at https://pubs.usgs.gov/ tm/1a1/.]
Curry, B.B., 2005a, Surficial geology of Crystal Lake quadrangle—McHenry and Kane Counties, Illinois: Illinois State Geological Survey, Illinois Geologic Quadrangle Map, IGQ Crystal Lake-SG, 3 sheets, scale 1:24,000. [Also available at https://resources.isgs.illinois.edu/maps/surficial-geology-crystal-lake-quadrangle-mchenry-and-kane-counties-illinois.]
Curry, B.B., 2005b, Drift thickness of Crystal Lake quadrangle—McHenry and Kane Counties, Illinois: Illinois State Geological Survey, Illinois Geologic Quadrangle Map, IGQ Crystal Lake-DT, 1 sheet, scale 1:24,000. [Also available at https://resources.isgs.illinois.edu/maps/drift-thickness-crystal-lake-quadrangle-mchenry-and-kane-counties-illinois.]
Curry, B.B., Berg, R.C., and Vaiden, R.C., 1997, Geologic mapping for environmental planning, McHenry County, Illinois (Aquifer sensitivity, plate 3): Illinois State Geological Survey, Circular 559. [Also available at https://www.ideals.illinois.edu/items/43499.]
Federal Emergency Management Agency, 2019, Fact sheet—Flood plain management, insurance and rebuilding: Federal Emergency Management Agency, release number FS DR–4438–OK 004, 5 p., accessed July 5, 2019, at https://www.fema.gov/press-release/20210318/fact-sheet-flood-plain-management-insurance-and-rebuilding.
Gahala, A.M., 2017, Hydrogeology and water quality of sand and gravel aquifers in McHenry County, Illinois, 2009–14, and comparison to conditions in 1979 (ver. 1.1, August 2022): U.S. Geological Survey Scientific Investigations Report 2017–5112, 91 p., accessed June 2022 at https://doi.org/10.3133/sir20175112.
Gahala, A.M., 2024, GFLOW groundwater flow model of Crystal Lake, City of Crystal Lake, Illinois: U.S. Geological Survey data release, https://doi.org/10.5066/P97BTQZO.
Gahala, A.M., and Soderstrom, C.M., 2024, Seepage meter data collected at Crystal Lake, City of Crystal Lake, Illinois—2020: U.S. Geological Survey data release, https://doi.org/10.5066/P92MVOLW.
Google Earth, 2021, Hello, Earth—Google Earth™ Pro: Google website, accessed March 2021 at https://earth.google.com/web/.
Haitjema, H.M., 1995, Analytic element modeling of groundwater flow: San Diego, Calif., Academic Press, 394 p. [Also available at https://doi.org/10.1016/B978-0-12-316550-3.X5000-4.]
Haitjema, H.M., 2012, Modeling lake-groundwater interactions in GFLOW: Haitjema, LLC, 13 p., accessed September 14, 2012, at http://www.haitjema.com/documents/ModelinglakegroundwaterinteractionsinGFLOW.pdf.
Haitjema, LLC, 2018, GFLOW (ver. 2.2.3, January 24, 2018): Haitjema, LLC, software release, accessed February 2021 at http://www.haitjema.com/.
Hunt, R.J., 2006, Ground water modeling applications using the analytic element method: Groundwater, v. 44, no. 1, p. 5–15. [Also available at https://doi.org/10.1111/j.1745-6584.2005.00143.x.]
Hunt, R.J., Anderson, M.P., and Kelson, V.A., 1998, Improving a complex finite-difference ground water flow model through the use of an analytic element screening model: Groundwater, v. 36, no. 6, p. 1011–1017. [Also available at https://doi.org/10.1111/j.1745-6584.1998.tb02108.x.]
Hunt, R.J., Haitjema, H.M., Krohelski, J.T., and Feinstein, D.T., 2003, Simulating ground water-lake interactions—Approaches and insights: Groundwater, v. 41, no. 2, p. 227–237. [Also available at https://doi.org/10.1111/j.1745-6584.2003.tb02586.x.]
Illinois State Geological Survey, 2021a, Illinois Water and Related Wells Map (ILWATER) [interactive map]: Illinois State Geological Survey digital data, accessed March 2021 at https://isgs.illinois.edu/ilwater.
Illinois State Geological Survey, 2021b, WAUC-08-13 log: Illinois State Geological Survey digital data, accessed January 2021 at https://maps.isgs.illinois.edu/vxs/mchenry/logs/WAUC-08-13.pdf.
Innovyze, 2023, XPSWMM (ver. 2018.2.1): Innovyze software release, accessed August 2023 at https://innovyze.com/products/stormwater-sewer-flood-modeling/xpswmm/.
Juckem, P.F., Fienen, M.N., and Hunt, R.J., 2014, Simulation of groundwater flow and interaction of groundwater and surface water on the Lac du Flambeau Reservation, Wisconsin: U.S. Geological Survey Scientific Investigations Report 2014–5020, 43 p., accessed September 2021 at https://doi.org/10.3133/sir20145020.
Kolata, D.R., 2005, Bedrock geology of Illinois: Illinois State Geological Survey, Illinois Map 14, 1:500,000, accessed January 24, 2024, at https://ngmdb.usgs.gov/Prodesc/proddesc_87181.htm.
Leaf, A.T., Fienen, M.N., and Reeves, H.W., 2021, SFRmaker and Linesink‐maker—Rapid construction of streamflow routing networks from hydrography data: Groundwater, v. 59, no. 5, p. 761–771. [Also available at https://doi.org/10.1111/gwat.13095.]
McKay, L., Bondelid, T., Dewald, T., Johnston, J., Moore, R., and Rea, A., 2012, NHDPlus version 2—User guide: NHDPlus, 181 p., accessed July 28, 2021, at https://nhdplus.com/NHDPlus/NHDPlusV2_documentation.php.
Meyer, S.C., Lin, Y.-F., Abrams, D.B., and Roadcap, G.S., 2013, Groundwater simulation modeling and potentiometric surface mapping, McHenry County, Illinois: ISWS Contract Report; No. CR-2013-06, Illinois State Water Survey, Prairie Research Institute, variously paged.[Also available at https://www.ideals.illinois.edu/items/50129.]
National Weather Service, 2021, Climate—Rockford, Ill. area monthly summarized data years 1988 to 2012: National Oceanic and Atmospheric Administration, National Weather Service database, accessed August 4, 2021, at https://www.weather.gov/wrh/Climate?wfo=lot.
Reidmiller, D.R., Avery, C.W., Easterling, D.R., Kunkel, K.E., Lewis, K.L.M., Maycock, T.K., and Stewart, B.C., eds., 2018, Impacts, risks, and adaptation in the United States—Fourth national climate assessment, volume II: Washington, D.C., U.S. Global Change Research Program, 1,515 p., accessed June 2021 at https://nca2018.globalchange.gov/.
Roberts, W.J., and Stall, J.B., 1967, Lake evaporation in Illinois: Illinois State Water Survey, Report of Investigation 57, 48 p. [Also available at https://www.ideals.illinois.edu/items/108156.]
Rosenberry, D.O., and LaBaugh, J.W., 2008, Field techniques for estimating water fluxes between surface water and ground water: U.S. Geological Survey Techniques and Methods, book 4, chap. D2, 128 p. [Also available at https://doi.org/10.3133/tm4D2.]
Rydlund, P.H., Jr., and Densmore, B.K., 2012, Methods of practice and guidelines for using survey-grade global navigation satellite systems (GNSS) to establish vertical datum in the United States Geological Survey: U.S. Geological Survey Techniques and Methods, book 11, chap. D1, 102 p. with appendixes. [Also available at a https://doi.org/10.3133/tm11D1.]
Sacks, L.A., Swancar, A., and Lee, T.M., 1998, Estimating ground-water exchange with lakes using water-budget and chemical mass-balance approaches for ten lakes in ridge areas of Polk and Highlands Counties, Florida: U.S. Geological Survey Water-Resources Investigations Report 98–4133. [Also available at https://doi.org/10.3133/wri984133.]
Sasman, R.T., 1957, The water level problem at Crystal Lake, McHenry County: Illinois State Water Survey, Report of Investigation 32, 27 p. [Also available at https://www.isws.illinois.edu/pubdoc/ri/iswsri-32.pdf.]
Trost, J.J., 2018, Soil-Water-Balance (SWB) model used to simulate potential groundwater recharge for the glacial aquifer system east of the Rocky Mountains, 1980–2011: U.S. Geological Survey data release, accessed December 5, 2022, at https://doi.org/10.5066/F7XW4HRJ.
Trost, J.J., Roth, J.L., Westenbroek, S.M., and Reeves, H.W., 2018, Simulation of potential groundwater recharge for the glacial aquifer system east of the Rocky Mountains, 1980–2011, using the Soil-Water-Balance model: U.S. Geological Survey Scientific Investigations Report 2018–5080, 51 p., accessed December 5, 2022, at https://doi.org/10.3133/sir20185080.
Turnipseed, D.P., and Sauer, V.B., 2010, Discharge measurements at gaging stations: U.S. Geological Survey Techniques and Methods, book 3, chap. A8, 87 p., accessed September 30, 2021, at https://doi.org/10.3133/tm3A8.
U.S. Geological Survey [USGS], 2020, Groundwater Watch: U.S. Geological Survey web page, accessed December 2020 at https://groundwaterwatch.usgs.gov/countymap.asp.
U.S. Geological Survey [USGS], 2021, USGS water data for the Nation: U.S. Geological Survey National Water Information System database, accessed January 11, 2021, at https://doi.org/10.5066/F7P55KJN.
U.S. Geological Survey [USGS], 2022, topoBuilder (ver. 1.2.0): U.S. Geological Survey web application, accessed December 15, 2022, at https://topobuilder.nationalmap.gov/.
Weather Underground, 2021, City Hall—KILCRYST7: TWC Product and Technology LLC digital data, accessed November 10, 2021, at https://www.wunderground.com/dashboard/pws/KILCRYST7/table/2020-11-4/2020-11-4/monthly.
Appendix 1. Seepage-Meter Data Collection and Data Analysis
Conversion Factors
U.S. customary units to International System of Units
Datum
Vertical coordinate information is referenced to the North American Vertical Datum of 1988 (NAVD 88).
Horizontal coordinate information is referenced to the North American Datum of 1983 (NAD 83).
Elevation, as used in this report, refers to distance above the vertical datum.
Abbreviations
AME
absolute mean error
CBBEL
Christopher B. Burke Engineering, Ltd
CLPD
Crystal Lake Park District
GFLOW
groundwater flow analytical element model
Kh
hydraulic conductivity
Kv
vertical hydraulic conductivity
MCGMN
McHenry County Groundwater Monitoring Network
ME
mean error
PEST
parameter estimation
RMSE
root mean square error
SWB
Soil-Water-Balance
USGS
U.S. Geological Survey
XP-SWMM
rainfall-runoff Sanitary, Storm and Flood modeling software
For more information about this publication, contact:
Director, USGS Central Midwest Water Science Center
405 N Goodwin Ave
Urbana, IL 61801
217–328–8747
For additional information, visit: https://www.usgs.gov/centers/cm-water
Publishing support provided by the Rolla Publishing Service Center
Disclaimers
Any use of trade, firm, or product names is for descriptive purposes only and does not imply endorsement by the U.S. Government.
Although this information product, for the most part, is in the public domain, it also may contain copyrighted materials as noted in the text. Permission to reproduce copyrighted items must be secured from the copyright owner.
Suggested Citation
Gahala, A.M., Bristow, E.L.D., Sharpe, J.B., Metcalf, B.G., and Matson, L.A., 2024, Simulation of groundwater and surface-water interaction and lake resiliency at Crystal Lake, City of Crystal Lake, Illinois: U.S. Geological Survey Scientific Investigations Report 2024–5007, 43 p., https://doi.org/10.3133/sir20245007.
ISSN: 2328-0328 (online)
Study Area
| Publication type | Report |
|---|---|
| Publication Subtype | USGS Numbered Series |
| Title | Simulation of groundwater and surface-water interaction and lake resiliency at Crystal Lake, City of Crystal Lake, Illinois |
| Series title | Scientific Investigations Report |
| Series number | 2024-5007 |
| DOI | 10.3133/sir20245007 |
| Publication Date | February 28, 2024 |
| Year Published | 2024 |
| Language | English |
| Publisher | U.S. Geological Survey |
| Publisher location | Reston, VA |
| Contributing office(s) | Central Midwest Water Science Center |
| Description | Report: vii, 43 p.;3 Data Releases; Database |
| Country | United States |
| State | Illinois |
| Other Geospatial | Crystal Lake |
| Online Only (Y/N) | Y |
| Additional Online Files (Y/N) | N |