

Evaluation of Sensors for Continuous Monitoring of Harmful Algal Blooms in the Finger Lakes Region, New York, 2019 and 2020
Links
- Document: Report (10.2 MB pdf) , HTML , XML
- Data Releases:
- USGS data release - Field data for an evaluation of sensors for continuous monitoring of harmful algal blooms in the Finger Lakes, New York, 2019 and 2020
- USGS data release - Phytoplankton data from Owasco, Seneca, and Skaneateles Lakes, Finger Lakes region, New York, 2019–2020 (ver. 2.1, June 2023)
- NGMDB Index Page: National Geologic Map Database Index Page (html)
- Download citation as: RIS | Dublin Core
Abstract
In response to the increasing frequency of cyanobacterial harmful algal blooms (CyanoHABs) in the Finger Lakes region of New York State, a pilot study by the U.S. Geological Survey, in collaboration with the New York State Department of Environmental Conservation, was conducted to enhance CyanoHAB monitoring and understanding. High-frequency sensors were deployed on open water monitoring-station platforms at Seneca Lake in 2019–20, at Owasco Lake in 2019–20, and at Skaneateles Lake in 2019. One of the goals of this study was to evaluate the ability of in-place sensors to make representative measurements of dissolved organic matter, nutrients, and algal pigments (as indicators of phytoplankton biomass) while collecting routine field parameters (water temperature, specific conductance, pH, dissolved oxygen, turbidity, weather, and light) to provide additional information about environmental conditions.
Despite challenges like power issues and sensor fouling, the sensors performed well overall. However, correlation analyses between sensor readings and laboratory measurements revealed variable performance. Results indicate the relation between the fluorescent dissolved organic matter sensor and laboratory-measured dissolved organic carbon was weak at all study lakes. The nitrate sensors can be sensitive to ambient temperature and have a substantial power requirement, and the relation between sensor- and laboratory-measured nitrate values differed among lakes. The orthophosphate sensors, which were complex and prone to data loss, yielded results that were difficult to interpret because orthophosphate detections are rare in the study lakes. The multichannel fluorometer was also complex to use and required several unique procedures for its operation.
Chlorophyll measurements from the fluorometers correlated moderately well with laboratory-measured chlorophyll-a, although relations with total phytoplankton biovolume were weaker. Relations between phycocyanin concentration measurements from the dual-channel fluorometers and cyanobacterial biovolume were not significant; however, the cyanobacterial biovolume correlation was moderately strong with chlorophyll contribution from cyanobacteria measurements from the multichannel fluorometer. Of all collected parameters, water temperature was among the strongest correlated with chlorophyll-a, total phytoplankton biovolume, and cyanobacterial biovolume.
Stepwise regression analysis was used to identify the best parameters for modeling variance in laboratory measures of phytoplankton biomass. This analysis included factors such as chlorophyll fluorescence, pH, water temperature, and others, which varied by lake. Overall, the models had limited explanatory power for chlorophyll-a and other biovolumes, possibly due to the absence of CyanoHABs at the open-water monitoring locations. Multivariate models did not outperform simple fluorescence-based models. Notably, turbidity was a more significant indicator of cyanobacterial biovolume variability than phycocyanin from dual-channel fluorometers.
The study concludes that while single and multivariate models based on sensor data are useful, they did not explain any more variance than fluorescence-based models. Broader data collection, including more CyanoHAB events, is necessary to refine these models. Integrating machine learning could leverage large, complex datasets to improve CyanoHAB predictions, thereby enhancing the management and understanding of these blooms.
Introduction
Phytoplankton are cornerstone organisms in aquatic ecosystems because they serve as the foundation of the food web and as primary producers that use carbon dioxide to generate oxygen. The composition and growth of phytoplankton communities depend on many variables, including the availability of sunlight, carbon dioxide, and nutrients. Mass proliferation of certain types of phytoplankton can substantially affect human health, aquatic ecosystems, and the economy (Hudnell, 2010; Sanseverino and others, 2016). One phenomenon of particular interest is cyanobacterial harmful algal blooms (CyanoHABs), which can produce a variety of toxins and taste- and odor-causing compounds; these compounds are of concern in waterbodies that supply drinking water and that are used for recreation (Boyer, 2007; Graham and others, 2008). Greater concentrations of cyanobacterial toxins (hereafter referred to as “cyanotoxins”) have caused illness and death of humans and animals throughout the United States (Yoo and others, 1995; Hudnell, 2008; Trevino-Garrison and others, 2015; Graham and others, 2017). Early detection and preventative management are increasingly important because global CyanoHAB concentrations have increased in the past several decades (Wang and others, 2009; Winter and others, 2011; O’Neil and others, 2012, Trevino-Garrison and others, 2015; Taranu and others, 2015; Favot and others, 2023; Gorney and others, 2023). One such area where CyanoHABs have increased in recent decades is the Finger Lakes region of central New York, particularly in 2017 when all 11 Finger Lakes experienced open water, shoreline, or both types of CyanoHABs (Boyer, 2007; New York State Department of Environmental Conservation [NYSDEC], 2018, 2020).
CyanoHABs in the Finger Lakes are commonly isolated, ephemeral, or spatially heterogeneous, so monitoring and quantifying risk to public health through traditional discrete grab sampling may not reliably capture elevated concentrations of phytoplankton biomass, cyanotoxins, or other parameters of interest (Prestigiacomo and others, 2023; Kraus and others, 2017, Ho and Michalak, 2015). The U.S. Geological Survey (USGS) started a CyanoHAB advanced monitoring pilot study, in collaboration with the NYSDEC, to advance the state of monitoring and understand CyanoHABs in the Finger Lakes. The pilot study consisted of a series of studies between 2018 and 2020 to assess a range of traditional and innovative monitoring approaches and technologies. The objectives of the assessment were to inform future monitoring strategies and increase the understanding of factors related to CyanoHAB proliferation in New York State using a multi-tiered approach, including water-quality sensors.
After preliminary discrete sampling and study design initiatives in 2018, the USGS deployed three monitoring station platforms in open water at Seneca Lake, Owasco Lake, and Skaneateles Lake in 2019, and in Seneca Lake and Owasco Lake in 2020 (fig. 1). The platforms were designed to help evaluate a large suite of high-frequency sensors (that is, sensors deployed in the natural environment that take measurements at frequencies of minutes to hours). The goal was to evaluate the ability of sensors to take representative measurements of dissolved organic matter (DOM), nutrients, and algal pigments (as indicators of phytoplankton biomass). Routine water-quality parameters (water temperature, specific conductance, pH, dissolved oxygen, turbidity, and weather and light) were collected to help interpret more novel sensor results. Leveraging information from high-frequency sensor data is a monitoring approach that can provide a high-resolution (spatially and [or] temporally dense) representation of physiochemical and biological conditions and trends that are important for assessing spatiotemporal dynamics and for identifying early indicators of potentially harmful algal blooms (Downing and others, 2017; Foster and others, 2022).
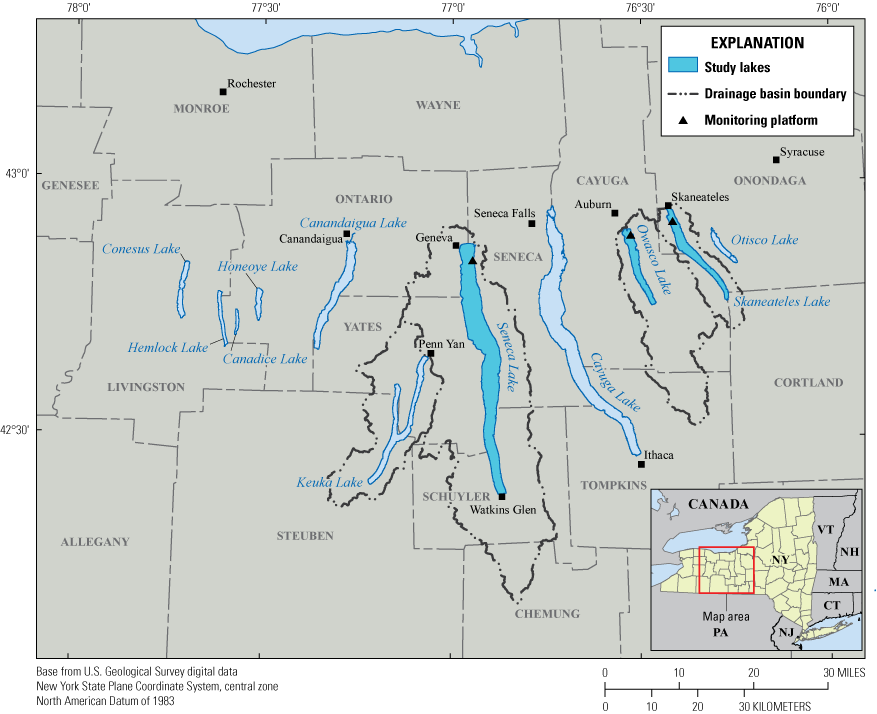
Map showing the Finger Lakes region, New York.
Purpose and Scope
The purpose of this report is to present the results of a USGS study, done in cooperation with NYSDEC, to evaluate sensors used for continuous monitoring of CyanoHABs, in three of the Finger Lakes of central New York State: Seneca Lake (USGS site 425027076564401), Owasco Lake (USGS site 425327076313601), and Skaneateles Lake (USGS site 425606076251601). Data were collected in Seneca, Owasco, and Skaneateles Lakes in 2019, and in Seneca and Owasco Lakes in 2020. The goal was to evaluate the ability of sensors to make representative measurements of DOM, nutrients, and algal pigments (as indicators of phytoplankton biomass); more routinely collected parameters (water temperature, specific conductance, pH, dissolved oxygen, turbidity, and weather and light) also were collected to help evaluate the sensors. Correlations were explored between sensor data and laboratory-measured discrete sample data to evaluate sensor performance, and to identify important variables for estimating phytoplankton biomass and cyanobacterial abundance. The results from the technology evaluations may help to identify the most informative and cost-effective monitoring strategies using sensors and to inform future monitoring and management efforts in the Finger Lakes and throughout New York State. All data discussed in this report are available in USGS data releases (Johnston and others, 2023; Perkins and others, 2021) or the National Water Information System (NWIS; USGS, 2016).
Technology Evaluation Disclaimer
The USGS evaluates various monitoring technologies, such as sensors and systems, to determine their suitability for current or future use in USGS monitoring. These technology evaluations are performed by USGS staff, who adhere to specific protocols, criteria, and quality-assurance (QA) procedures. The USGS does not aim to rank or compare technologies; determine regulatory compliance; identify technologies as acceptable or not; or determine “best available technologies” in any form. The USGS does not certify that a technology will always operate as demonstrated and makes no expressed or implied guarantee as to the performance of the technology. The end user is solely responsible for complying with all applicable Federal, State, and local requirements.
Description of Study Area
The Finger Lakes are important recreational, drinking water, and economic resources for New York State (Halfman, 2016, NYSDEC, 2019). The Finger Lakes region encompasses 11 narrow north-south oriented glacial lakes in western New York, south of Lake Ontario (fig. 1). About 35 percent of New York is in the Finger Lakes drainage basin, which covers about 23,310 square kilometers (km2) and all or part of 14 counties. In recent decades (since the 2000’s), CyanoHAB frequency has increased in several of the Finger Lakes (NYSDEC, 2020). In 2017, all 11 Finger Lakes experienced open water or shoreline CyanoHABs, even those historically characterized by low concentrations of nutrients and chlorophyll-a (NYSDEC, 2018). Previous studies on the Finger Lakes and other lakes in New York State have documented the spatiotemporal heterogeneity of CyanoHABs and cyanotoxins within and among lakes (Halfman, 2016; NYSDEC, 2019; Smith and others, 2019; Prestigiacomo and others 2023; Gorney and others 2023). The three advanced monitoring pilot study lakes were chosen, in part, because they represent a continuum of trophic states, from oligotrophic (low nutrient concentrations) to mesotrophic (moderate nutrient concentrations) (Callinan, 2001; Halfman, 2016; NYSDEC, 2019).
Of the 11 Finger Lakes, Seneca Lake is the largest in surface area (about 175 km2) and the deepest (maximum depth is about 200 meters [m]). Seneca Lake has a volume of about 15,500 million cubic meters and a drainage area of about 1200 km2. Owasco Lake is the sixth largest Finger Lake in surface area (about 30 km2), has a maximum depth of about 50 m, and has a volume of about 780 million cubic meters. The Owasco Lake drainage area is about 470 km2. Skaneateles Lake is the fifth largest Finger Lake in surface area (about 40 km2), has a maximum depth of about 90 m, and has a volume of about 1,600 million cubic meters. The Skaneateles Lake drainage area is about 150 km2 (Callinan, 2001). Land use in the drainage basins of all three lakes is primarily agricultural. Contemporary data indicate that Seneca and Owasco Lakes are mesotrophic, and that Skaneateles Lake is oligotrophic (NYSDEC, 2019).
Monitoring-Station Platform Design
A monitoring-station platform was deployed in each of the study lakes (fig. 2). The platform infrastructure supported monitoring instrumentation, an electronic datalogger, telemetry equipment, and a power supply system.
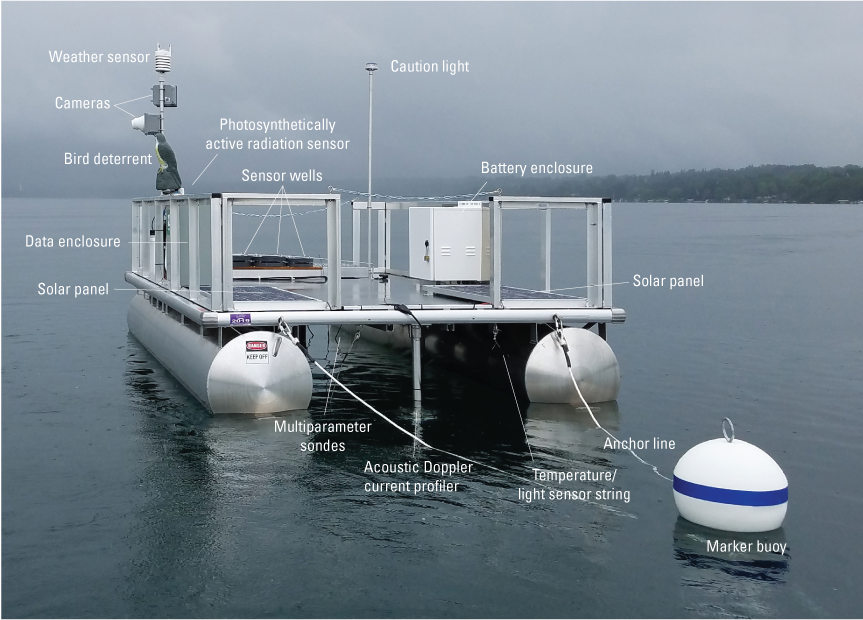
Annotated photograph of monitoring-station platform. Photograph by Elizabeth Nystrom, U.S. Geological Survey.
Platform Infrastructure
The monitoring-station platforms were 2.4- by 3.7-m aluminum utility service barges. Each barge had two 58-centimeter diameter, 3.7-m long pontoons; an attached aluminum superstructure with a nonslip flat work area; 0.6-m high aluminum railings; and a 1.2- by 0.9-m cut-out area at one end of the work barge (fig. 3). For visibility during low-light conditions, the full superstructure of each platform was wrapped with reflective tape, and a solar-powered amber caution light (triggered by an ambient light sensor) was installed on a pole. Above-water instrumentation was bolted to the platform railing or mounted on aluminum poles; in-water (referred to as “in-place”) instrumentation was suspended from cables or deployed in wells (fig. 3).
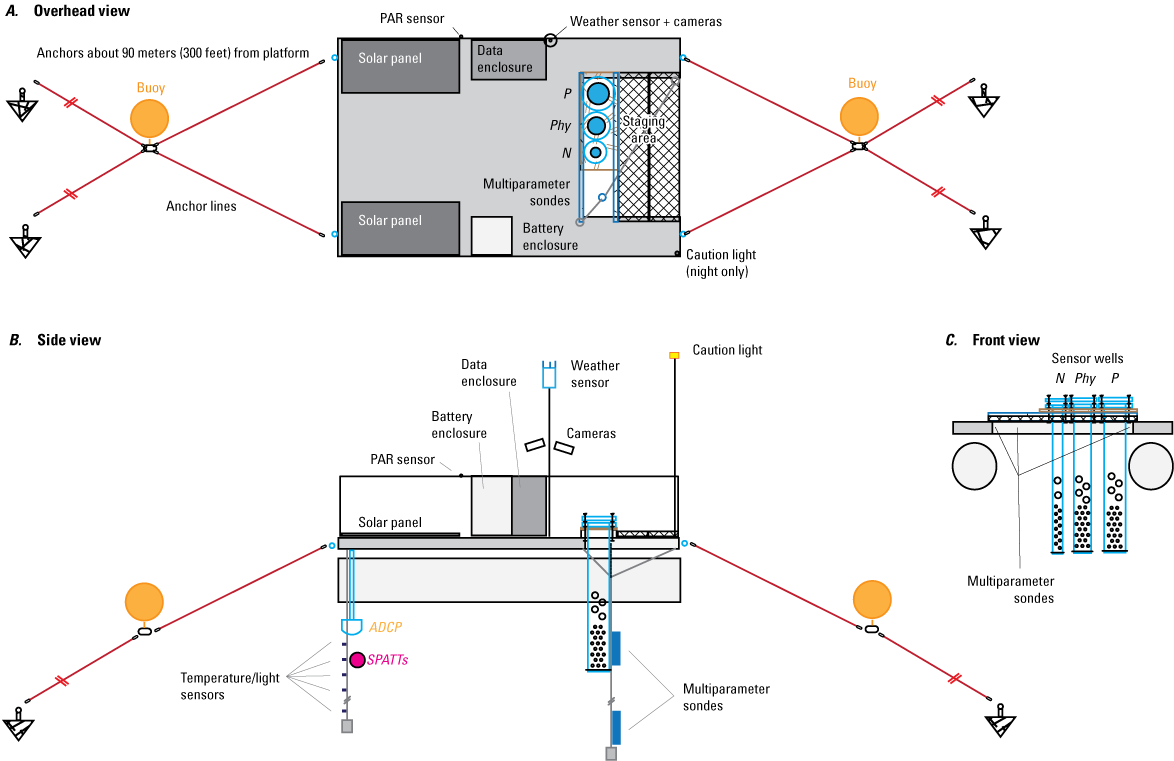
Diagrams showing a monitoring-station platform schematic. A, Overhead view; B, Side view; C, Front view. PAR, photosynthetically active radiation sensor; N, nitrate sensor; Phy, phytoplankton classification sensor; P, orthophosphate sensor; ADCP, acoustic Doppler current profiler; SPATTs, Solid Phase Adsorption Toxin Tracking samplers.
The in-place instruments that were deployed through to the full depth of the water column—multiparameter sondes at near surface, mid-, and near bottom depths; and temperature/illumination sensors at depths of 1-m increments—were suspended from the platform on two 48-millimeter (mm) stainless-steel wire ropes to capture physiochemical and biological changes in the water column (table 1; Hamre and others, 2018). The multiparameter sondes were attached to the wire rope with shuttles made from aluminum bar and stainless-steel tubing clamps (fig. 4); the data cables for the multiparameter sondes were then attached to the wire rope with plastic zip ties. The temperature/illumination sensors were attached to a separate wire rope using large plastic washers and plastic zip ties (fig. 5) that held the sensors in the proper orientation. Attachment points for the temperature/illumination sensors were established and marked along the length of the wire rope with layers of electrical tape. The slight increase in rope diameter from the tape prevented the temperature/illumination sensors from moving (and served to indicate any movement). The multiparameter sondes and temperature/illumination sensor ropes were suspended from opposite ends of the platform to prevent entanglement, and each was weighted with a small concrete weight of about 2.3 kilograms to keep the ropes straight.
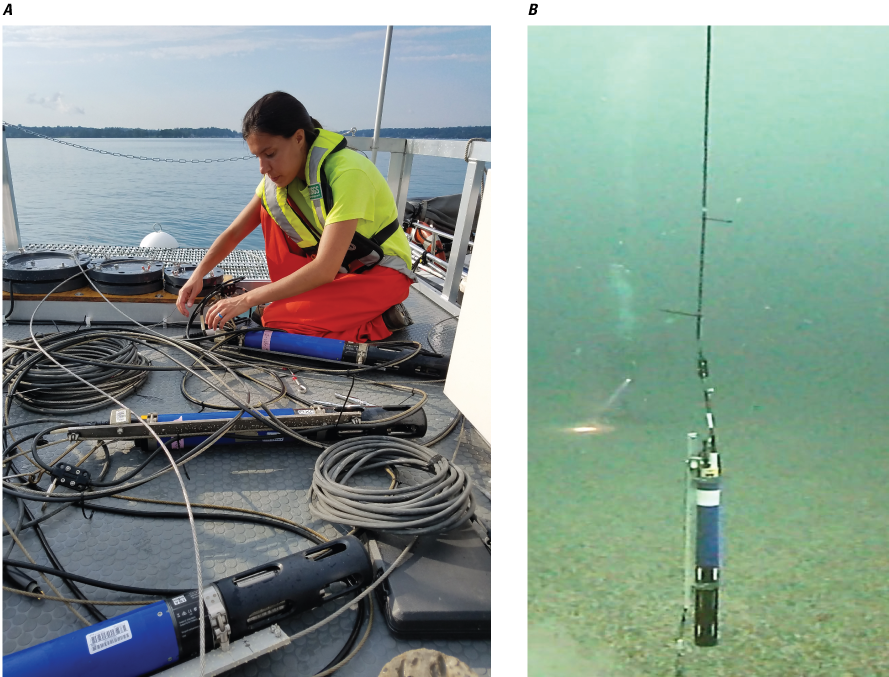
Photographs of multiparameter sondes. A, Sondes with suspension cable, shuttles, and data cables on a platform deck; photograph by Elizabeth Nystrom, U.S. Geological Survey (USGS). B, A deployed sonde; photograph by USGS.
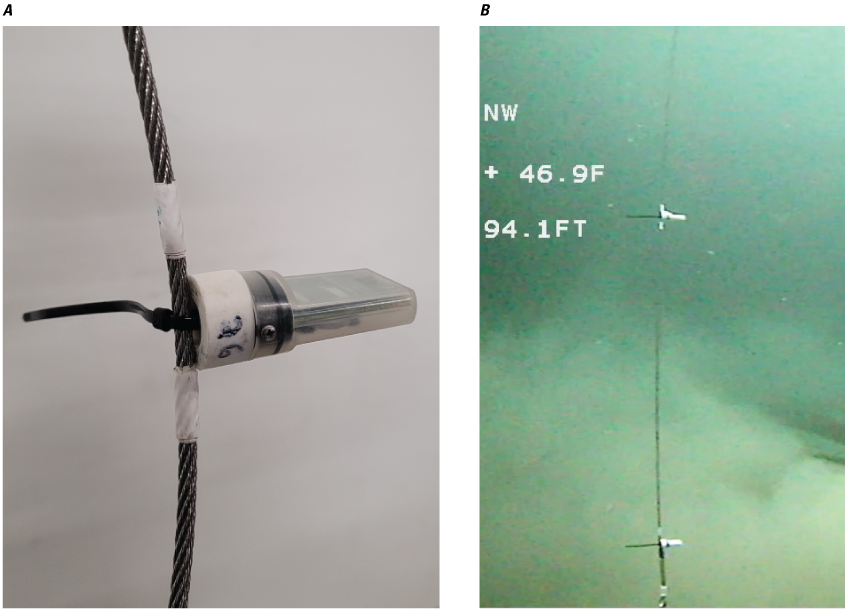
Photographs of temperature and illumination sensors. A, Sensors attached to a suspension cable; photograph by Elizabeth Nystrom, U.S. Geological Survey (USGS). B, Underwater sensors; photograph by USGS.
The orthophosphate, phytoplankton classification, and nitrate sensors were deployed in wells at the open end of the platforms at a fixed depth of about 1 m (fig. 3). The wells were covered with a staging area, constructed out of 76.2-mm aluminum channel and 19-mm (nominal) marine plywood, to support the sensor wells. The sensor wells were constructed of schedule-80 polyvinyl chloride (PVC) pipe and stainless-steel fittings. Each 1.5-m long well was sized to closely match the diameter of the instrument it housed, and many holes were drilled into each well to allow water circulation. A 12.7-mm stainless-steel bolt was installed across the bottom end of each well to prevent instrumentation loss, and a flange was attached to the top of each well to attach to the staging area of the platform. Holes were cut into the staging area of the platform to match the outer diameter of the wells, and stainless-steel bolts were fixed to the staging area to match the bolt holes in the well flanges. This well design made the sensor wells removable (fig. 6) and allowed trailering and towing (by boat) of the platforms to the deployment locations (fig. 7). The wells were then lowered using additional washers and nuts to fix them into place. Additional washers and nuts were stacked on the fixed bolts to support a lid on each well and to provide a gap for the cable to exit from each well. Wing nuts were used to secure the lids to allow access to instrumentation without tools. A locking bar was installed across the tops of the well lids to prevent unauthorized access to the wells (fig. 8).
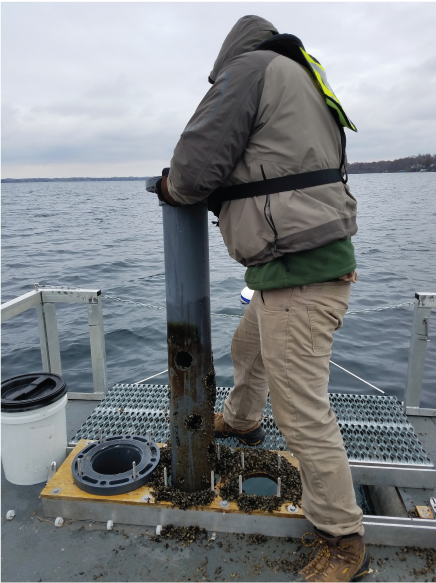
Photograph of sensor well removal and cleaning dreissenid mussels off a sensor well; photograph by Elizabeth Nystrom, U.S. Geological Survey.
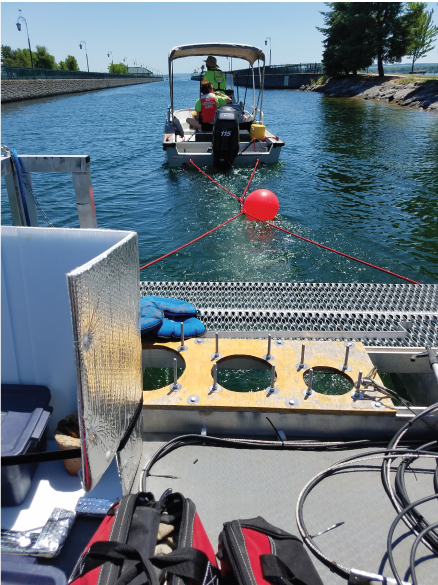
Photograph of towing the Owasco Lake platform out for deployment, June 9, 2020; photograph by Elizabeth Nystrom, U.S. Geological Survey.
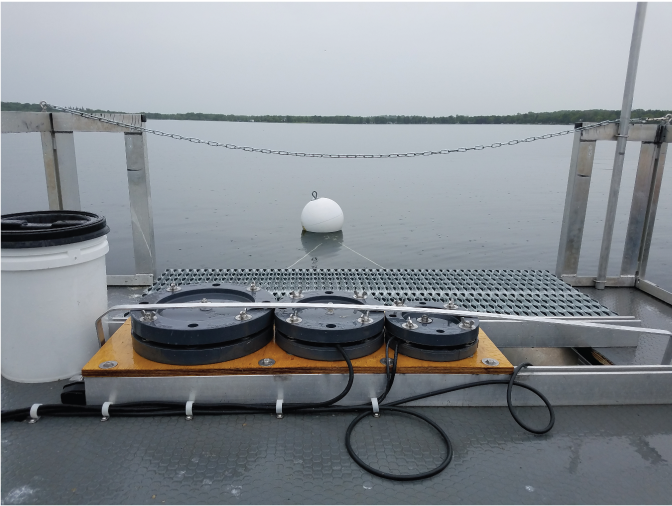
Photograph of assembled sensor well lids; photograph by Elizabeth Nystrom, U.S. Geological Survey.
The platforms were anchored in a generally north-south orientation, using four 130-pound steel pyramid anchors with 9.5-mm braided, abrasion-resistant nylon rope. Nylon rope was chosen for its elasticity and because, in case of accidental detachment, it would sink and not cause a navigation hazard. In rough water conditions, the ropes stretched to act like shock absorbers and reduced jarring to the instrumentation. Each anchor rope extended about 90 m diagonally away from a corner of the platform, and the cross of ropes and a buoy attachment point were about 3 m from the end of the platform (fig. 3). The geometry of the anchor ropes was designed to keep the platforms in a consistent location and to prevent platform twisting. Under most wind conditions, each platform would have support from at least two anchor ropes. The anchor ropes were deployed before platform placement and were marked with a buoy when platforms were not in the water. Once the platforms were towed to the deployment location by boat, the anchor ropes were connected to stainless-steel eye bolts connected directly to the aluminum superstructure of the platform. The anchor ropes were connected using stainless-steel quick connects; all rope ends used thimbles to prevent abrasion and wear.
A bird deterrent (a plastic peregrine falcon) was attached to each platform at the data enclosure (fig. 2). The platform deployed at Owasco Lake had additional bird deterrents made of flexible wires in an umbrella-type shape on its railings and superstructure to try to keep the surface clean.
Data Collection and Power Systems
A Campbell Scientific (Logan, Utah) CR1000 datalogger connected to a Raven RV-50 series cellular modem were used to log and transmit data respectively. Data were collected using SDI-12, RS–232, and Modbus communication protocols, or were measured directly using differential analog ports on the CR1000. Additionally, data were logged internally within the instrumentation as a backup when applicable or when sensors could not be interfaced with the CR1000 (for example, the temperature/illumination sensors). In 2019, the CS I/O port of the CR1000 was connected to the RS–232 port of the cellular modem by way of a Campbell SC105 adapter; in 2020, the COM3 port of the CR1000 was wired to the RS–232 port of the cellular modem. The datalogger and telemetry equipment were housed in the unvented data enclosure (fig. 3) on the platform superstructure. The data enclosures on each platform were unvented to prevent moisture entry and condensation. In 2020, a solar shade/reflector was added to the data enclosures to reduce internal temperatures.
The power supply system for each platform included two 100-watt solar panels, a charge regulator, two 108 amp-hour batteries, and a small fuse panel. The solar panels were mounted flat on the platform superstructure, and the batteries were housed in a vented enclosure that was separate from the data enclosure.
Sensor Instrumentation
Instrumentation was selected to provide physiochemical and biological information related to the processes and effects in natural waters that potentially relate to CyanoHAB formation (table 2). Platform sensors, parameters, and deployment dates are detailed in table 3.
Table 2.
Water-quality and meteorological parameters and the information provided for monitoring for harmful algal blooms.Table 3.
Sensors and parameters deployed at each Finger Lake with dates of sensor deployment.[Deployment dates are given in month/day/year and are the dates the sensor was put into the water and taken out of the water for a given year and do not include dates of missing data. Additional ancillary parameters collected are not included in this table. PC, phycocyanin; fDOM, fluorescent dissolved organic matter; PE, phycoerythrin; grn/brn, green/brown; ND, not deployed; PAR, photosynthetically active radiation]
Multiparameter Sonde
YSI Inc. EXO2 multiparameter sondes were equipped with sensors for measurement of water temperature in degrees Celsius (°C), specific conductance in microsiemens per centimeter at 25 degrees Celsius, turbidity in formazin nephelometric units, pH in pH units, dissolved oxygen in milligrams per liter (mg/L), fluorescent dissolved organic matter (fDOM) in micrograms per liter (μg/L) as quinine sulfate equivalents (QSE) and in relative fluorescence units (RFU), chlorophyll (fluorescence) in µg/L and RFU, and phycocyanin (fluorescence) in µg/L and RFU. RFU is a measure of sensor response based on a percentage of the operating range of the sensor (0–100 percent) and is not directly tied to a quantitative value like concentration units. A centralized antifouling wiper was programmed to clean each sensor before every measurement. This instrument was chosen because of its wide use throughout the USGS to collect data recommended for studies that focus on phytoplankton biomass and community composition (Foster and others, 2022). All parameters were measured and recorded at 15-minute intervals. The instruments were deployed free hanging from the platform at near surface, mid-, and near bottom depths (table 1; fig. 3; fig. 4). Specification for the EXO2 sondes and individual sensors are detailed in YSI Inc. (2021) and are abridged in table 4.
Table 4.
Sensor and laboratory measurement specifications.[LOQ, limit of quantification; °C, degree Celsius; ±, plus or minus; n/a, not applicable; µS/cm at 25 °C, microsiemen per centimeter at 25 °C; FNU, formazin nephelometric unit; RFU, relative fluorescence unit; µg/L, microgram per liter; QSE, quinine sulfate equivalent; mg/L, milligram per liter; lm/ft2, lumen per square foot; m/s, meter per second; °, degree; in., inch; µmol/m2/s, micromole per square meter per second; N, nitrogen; P, phosphorus; µm3/mL, cubic micrometer per milliliter.]
Nitrate Sensors
At different periods, two different types of nitrate sensors were used during the study: the s::can nitro::lyser II and the Hach Company Nitratax plus sc. The sensors were switched mid-study because of sensor malfunction and loss of data.
S::can nitro::lyser II.—The s::can nitro::lyser II is an ultraviolet nitrate sensor with a 15 mm optical pathlength. The measured value is reported in units of milligrams per liter as nitrogen (mg/L as N). The sensor has integrated compensations for turbidity and DOM. The pathlength is mechanically cleaned with an antifouling wiper before each measurement. This instrument was chosen because of its previous use by the USGS in low nitrogen systems (USGS, 2016). The instrument was deployed inside the sensor well, as described in the “Platform Infrastructure” section, at the near-surface depth (table 1; fig. 3). The sensor recorded measurements at 5-minute intervals. The lower detection limit of the sensor is 0.0 mg/L, and accuracy is 2 percent plus one optical pathlength. Complete specifications for the nitro::lyser II are detailed in s::can (2011) and abridged in table 4.
Hach Company Nitratax plus sc.—The Hach Nitratax plus sc is an ultraviolet nitrate sensor with a 2 mm optical pathlength. The measured value is reported in units of milligrams per liter as nitrogen (mg/L as N). The sensor contains a two-beam absorption photometer with integrated compensation for turbidity. The measuring window is mechanically cleaned with an antifouling wiper before each measurement. This instrument was chosen for its ease of use and durability, as demonstrated in other studies; its measuring range; and its availability to rent from the USGS Hydrologic Instrumentation Facility. The instrument was deployed inside the sensor well, as described in the “Platform Infrastructure” section, at the near-surface depth (table 1; fig. 3). Sensors recorded measurements at 15-minute intervals. The lower detection limit of this sensor is 0.1 mg/L, and the accuracy is 3 percent plus 0.5. Complete specifications for the Nitratax are detailed in Hach Company (2023) and abbreviated in table 4. It should be noted, as of April 30, 2023, the Nitratax plus sc was discontinued by the manufacturer with an updated version available.
Orthophosphate Sensor
The Sea-Bird Scientific HydroCycle PO4 is a wet chemical sensor that measures soluble reactive phosphate. The measured value is reported in milligrams per liter as phosphorus (mg/L as P). A copper screen and a 5–10 micrometer (µm; 7.5 µm average) polyethylene filter are used to mitigate the fouling of the sensor’s internal optics. This instrument was chosen because of its ability to be deployed in place, its self-contained design, its ability to run on direct current power, and its previous use by the USGS. The instrument was deployed inside the sensor well, as described in the “Platform Infrastructure” section, at the near surface depth and sampled at 120-minute intervals (table 1; fig. 3). The waste generated by the HydroCycle-PO4 was collected in a dedicated vessel on the monitoring platform. This approach ensured that none of the waste, which is a byproduct of the phosphate measurement process, was discharged into the surrounding environment. Although the total chemical reaction time of the sensor is about 12 minutes, a longer measurement interval was used to extend the life of reagent cartridges and intake filters, and to reduce power consumption. Specifications for the HydroCycle PO4 are detailed in Sea-Bird Scientific (2019) and condensed in table 4. It should be noted that as of October 1, 2022, sale of and service for the HydroCycle PO4 was discontinued by the manufacturer.
Phytoplankton Classification Sensor
The Turner Designs PhytoFind is a multichannel fluorometer that processes fluorescence data from three optical sensors to provide estimates of total chlorophyll concentration in micrograms per liter (µg/L). PhytoFind also estimates the percent contribution relative to the whole phytoplankton population sampled from three groups: phycoerythrin-containing phytoplankton (such as cryptophytes and some cyanobacteria; reported as “mixed phytoplankton group”), phycocyanin-containing phytoplankton (such as cyanobacteria; reported as “cyanobacteria group”), and all other chlorophyll-containing phytoplankton (such as chlorophytes and diatoms; reported as “green and brown phytoplankton group”). A fourth optical fluorescence sensor provides integrated compensation for DOM, which is known to interfere with optical measurements (Downing and others, 2012; Bertone and others, 2019). This instrument was chosen to provide information on phytoplankton population dynamics. Additionally, this instrument was chosen to gain insight into the efficacy of another multichannel fluorometer, similar to the bbe Moldaenke GmbH FluoroProbe (bbe Moldaenke GmbH, 2023), which has been used extensively apart from this study by the NYSDEC (Prestigiacomo and others, 2022; Gorney and others, 2023). The PhytoFind was deployed inside the sensor well, as described the “Platform Infrastructure” section, at the near-surface depth, and sampled at 5-minute intervals (table 1; fig. 3). Specifications for the PhytoFind are detailed in Turner Designs, Inc., (2021) and abbreviated in table 4.
Temperature and Illumination Sensor
The HOBO UA–002–64 is a small, two-channel temperature and relative light level data logger. Water temperature is reported in degrees Celsius (°C) and relative light level (wavelength range from about 150 to 1,200 nanometers) in lumens per square meter (lux). This instrument was chosen because of its affordability, self-contained power and logging, and proven ruggedness as demonstrated in other monitoring programs. The instruments were deployed for use in a “temperature string” (fig. 3). The temperature strings were deployed free hanging from the platform at 1-meter intervals below the water surface (fig. 5), totaling 30 sensors at Seneca Lake, 26 at Owasco Lake, and 31 at Skaneateles Lake. Sensors recorded measurements at 15-minute intervals. Specifications for the UA–002–64 are detailed in Onset Computer Corporation (2018) and are abridged in table 4.
Photosynthetically Active Radiation Sensor
The LI–COR, Inc., LI–190R measures photosynthetically active radiation (PAR; wavelength range from about 400 to 700 nanometers) in micromoles of photons per square meter per second (µmol/m2/s). This instrument was chosen because of its wide use throughout the USGS to collect ancillary PAR data. The instrument was attached to the platform handrail, about 1.2 m above the water surface (fig. 3). The sensor recorded measurements at 15-minute intervals. Specifications for the LI–190R are detailed in LI–COR, Inc. (2023) and are abbreviated in table 4.
Weather Sensor
The Vaisala Weather Transmitter WTX536 is a multiparameter weather sensor that measures air pressure in millibars (mbar), air temperature in degrees Celsius (°C), relative humidity in percent, precipitation in inches, wind speed in meters per second, and wind direction in degrees (°). This instrument was chosen to provide information about meteorological conditions to help contextualize changes in water quality. The instrument was set atop a mast on the platform, about 2.1 m above the water surface (fig. 3). The sensor recorded measurements at 15-minute intervals. Specifications for the WTX536 are detailed in Vaisala (2022) and are abbreviated in table 4.
Methods
A combination of moored, continuous water-quality sensor data and discrete water-quality samples were collected. Data were collected generally from June to November 2019 at Seneca, Owasco, and Skaneateles Lakes, and generally from June to October 2020 at Seneca and Owasco Lakes. The data publication source depends on the data collection methods, which are described in the following subsections. A summary of general specifications for sensor and laboratory measurements is given in table 4.
Sensor Data
Many sensors were operated in accordance with USGS protocols and guidance. However, some modifications were required, particularly for sensors that: (1) incorporated emerging technologies, (2) were used strictly to provide ancillary data, or (3) were sensors for which standard USGS protocols and guidance do not exist or are not applicable. Data collection protocols and modifications from standard USGS approaches are described in this section.
Multiparameter Sonde Measurements—Water Temperature, Specific Conductance, Dissolved Oxygen, pH, Turbidity, Fluorescent Dissolved Organic Matter, Chlorophyll Fluorescence, and Phycocyanin Fluorescence
Multiparameter sonde data (water temperature, specific conductance, dissolved oxygen, pH, turbidity, fDOM, chlorophyll fluorescence, and phycocyanin fluorescence) were collected in accordance with USGS national protocols and guidelines, some of which were still in development during the data collection period (Wagner and others, 2006; Foster and others, 2022; Booth and others, 2023). All data collected using multiparameter sondes are available through the USGS National Water Information System (NWIS; USGS, 2016).
Nutrient Sensor Measurements
Nitrate sensor data were collected in accordance with USGS national protocols and guidelines (Wagner and others, 2006; Pellerin and others, 2013). At the Seneca Lake platform, the s::can nitro::lyser II was used from May 24 to September 5, 2019, and the Hach Company Nitratax plus sc from August 5 to October 20, 2020. At Owasco Lake platform, the nitro::lyser II was used from May 14 to June 19, 2019, and the Nitratax from June 11 to October 22, 2020. Data are available through NWIS (USGS, 2016). Skaneateles Lake did not have a nitrate sensor deployed.
The orthophosphate sensor used wet chemistry to measure orthophosphate concentration. Because of this approach, standard USGS protocols for determining fouling, calibration drift error, or both (Wagner and others, 2006) are not applicable to the orthophosphate sensor (Peake, 2022). Therefore, data collection methods were modified in accordance with manufacturer instructions (Sea-Bird Scientific, 2019). The instrument is factory calibrated but periodically runs an automated calibration-validation cycle using onboard standard. All readings from the orthophosphate sensor used in this study are associated with qualitative metadata, such as data quality indicators and other quality-control test values, that are used to aid in the determination of data validity. Data are available through NWIS (USGS, 2016).
Multichannel Fluorometer Measurements—Phytoplankton Community Composition and Total Chlorophyll
USGS protocols and guidance for determining fouling, calibration drift error, or both (Wagner and others, 2006; Foster and others, 2022) are not applicable to the multichannel fluorometer used in this study for two reasons. First, the instrument is factory-calibrated, so no calibration functions are available. Second, because of the use of deconvolution algorithms that process data from multiple fluorescence sensors, the interference(s) affecting one fluorescence channel could affect all parameters (Johnston and others, 2022). For these reasons, data collection methods were modified in accordance with manufacturer instructions (Turner Designs, Inc., 2021). In place of calibration-drift checks in standard(s) of known concentration(s), sensor function was verified by comparing instrument readings of chlorophyll in the solid reference standard cap (part numbers 2380–900, 2300–901 and 2300–902) from before and after the deployment. Interference from fouling was assessed by comparing instrument readings of chlorophyll in the solid reference standard cap from before and after the fluorescence sensors on the instrument were cleaned. The DOM blank correction feature of the instrument was enabled, when necessary, as described in Turner Designs, Inc., (2021).
The complex nature of the multichannel fluorometer led to methodological inconsistencies in 2019 related to the unique procedures described above. Moreover, the application and effects of site-specific compensations for DOM—even in clear systems—were not fully understood because the instrument was new. As a result, the data collected during 2019 did not meet the data-quality goals of this study and were not published or considered in this report. The 2020 data are available in Johnston and others (2023).
Water Temperature and Illumination Sensor Measurements
Currently (2024), no USGS guidance exists for using illumination sensors. Although standards exist for water-temperature data, measurements from the combined water temperature and illumination sensor were collected as ancillary data to provide estimates of water temperature and light conditions vertically through the water column at a finer resolution than the resolution of the multiparameter sondes. Furthermore, the water temperature accuracy of the HOBO UA–002–64 is outside the 0.2 °C criterion specified in Wagner and others (2006). Data were collected following manufacturer instructions (Onset Computer Corporation, 2018). The data are available in Johnston and others (2023).
Photosynthetically Active Radiation Sensor Measurements
Currently (2024), no USGS guidance exists for using PAR sensors. Measurements from the PAR sensor were collected as ancillary data to estimate light conditions—in the wavelength range used by plants for photosynthesis—above the water surface. Data were collected following manufacturer instructions (LI–COR, Inc., 2023). The data are available in Johnston and others (2023).
Weather Sensor Measurements—Air Temperature, Precipitation, Wind Speed and Direction
Currently (2024), no USGS guidance exists for using meteorological sensors. Although some guidance exists for precipitation data, data from many USGS weather gages are considered “operational” (that is, ancillary) and assist with the evaluation of other data measured at these locations (USGS, 2005, 2023). Data were collected following manufacturer instructions (Vaisala, 2022). The data are available in Johnston and others (2023).
Discrete Sample Data
Discrete water-quality samples were collected about every 2 weeks: from June to November 2019 at Seneca, Owasco, and Skaneateles Lakes, and from June to October 2020 at Seneca and Owasco Lakes. Samples were collected at near surface, mid-, and near bottom depths in the water column (table 1). Sample water was collected using a vertical 8-liter PVC Van Dorn sampler suspended and lowered from a boat-mounted davit with a metered reel and then transferred to an 8-liter fluoropolymer churn. Sampled water was then homogenized and split into sample bottles before additional processing and preservation (fig. 9). This report focuses on the constituents collected that are most closely related to the continuous sensor data: nitrate, orthophosphate, dissolved organic carbon (DOC), chlorophyll-a, and phytoplankton identification and enumeration.
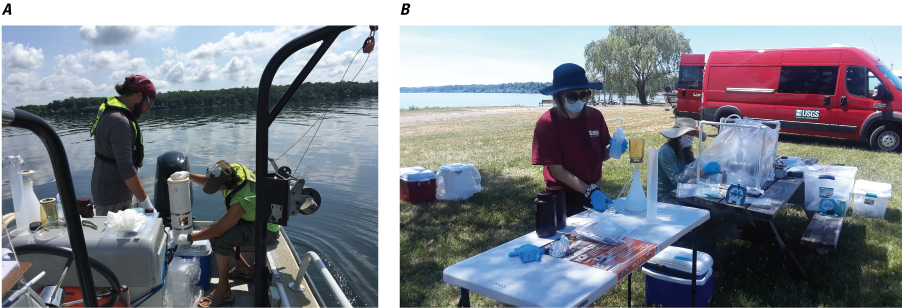
Photographs of discrete sampling. A, field crew using a Van Dorn sampler and churn to collect and homogenize water-quality samples; B, samples for chlorophyll-a being filtered and processed in the field; photograph by U.S. Geological Survey.
Nutrients, Dissolved Organic Carbon, and Chlorophyll-a
Nitrate, orthophosphate, DOC, and extracted chlorophyll-a samples were collected according to methods detailed in the National Field Manual for the Collection of Water Quality Data (USGS, variously dated). Samples were analyzed by the USGS National Water Quality Laboratory in Denver, Colo., and data are available in NWIS (USGS, 2016).
Nitrate (mg/L as N; analyzed as “nitrate plus nitrite” and for all samples in this study, nitrite [determined separately according to Fishman (1993)] was 0.01 mg/L as N or less and therefore constituted a trivial part of the total relative to nitrate), orthophosphate (mg/L as P), and DOC (mg/L) samples were filtered using a 45-µm capsule filter. Nitrate and orthophosphate samples were collected into 125-milliliter high-density polyethylene amber bottles. DOC samples were collected into 125-milliliter baked amber glass bottles before preservation to <2.0 pH with sulfuric acid. Nutrient and DOC samples were shipped on water ice to the laboratory. Nitrate plus nitrite samples were analyzed colorimetrically by enzymatic reduction using an automated discrete analyzer, as described in Patton and Kryskalla (2011). Orthophosphate samples were analyzed by discrete analyzer phosphomolybdate formation and colorimetry, as described in Fishman (1993). DOC was analyzed by high-temperature combustion oxidation and nondispersive infrared spectroscopy as described in Standard Methods for the Examination of Water and Wastewater 5310–B (Standard Methods Committee, 2014).
For chlorophyll-a sample collection, water was transferred from the churn directly into 1-liter amber high-density polyethylene bottles then homogenized and filtered onto 47-mm diameter glass fiber filters with a 0.3 µm pore size (fig. 9). Filters were kept frozen in the dark and sent to the USGS National Water Quality Laboratory on dry ice. Chlorophyll-a samples were analyzed following the methods and procedures in Arar and Collins (1997) using the non-acidification approach.
QA and quality-control (QC; together, QA/QC) samples were collected, as sequential replicates, to evaluate the variability resulting from sample collection and processing techniques or temporal changes resulting from shifting environmental conditions (Mueller and others, 2015). Relative percent difference (RPD) was used to quantify differences in analytical concentrations and could not be calculated if one, or both, sample(s) from the replicate pair were not analyzed or were associated with a censored value (that is, less than the laboratory reporting limit) (Zar, 1999). RPD was calculated using the following equation:
where Median RPDs less than 20 percent were considered to meet QA/QC criteria.Phytoplankton Identification and Enumeration
Phytoplankton samples were collected in 250-mL high-density polyethylene bottles and preserved with glutaraldehyde to a concentration of 0.25 percent by volume and analyzed for identification and enumeration by PhycoTech, Inc., Saint Joseph, Mich. Glutaraldehyde was used to preserve the fluorescence properties of the algae. Identification and enumeration using microscopy was conducted using N-(2-Hydroxypropyl)methacrylamide mounted slides with fluorescence enabled microscopy, a count threshold of 400 natural units, and a size range of detection from 0.9 µm to 25 mm. Phytoplankton were enumerated to the lowest possible taxonomic level, which was at least the genus level for most organisms. To correctly identify and enumerate the taxa present, which may vary by several orders of magnitude in size, counts were made at multiple magnifications ranging from 200 to 1000´ (PhycoTech, 2018). Random microscope fields were counted to a minimum of 400 natural units (colonies, filaments, or single cells) of all observed organisms (PhycoTech, 2018). Individuals from each species were then counted, and the average cell dimensions recorded for biovolume calculations. Phytoplankton data, sample processing and analysis methods, and QA protocols are detailed in PhycoTech (2018). The phytoplankton data are available in Perkins and others (2021).
Absolute value logarithmic difference (AVLD) was used to estimate differences in phytoplankton and cyanobacterial biovolume, in cubic micrometers per milliliter (µm3/mL), between replicate pairs. AVLD was used because RPD is sensitive to the rare taxa found in one of the samples and not the other. AVLD is calculated using the following equation:
whereA and B
are biovolume (µm3/mL) in each replicate pair (Francy and others, 2015).
Data Synthesis
All sensor- and laboratory-measured data were compiled using R statistical software (R Core Team, 2023) to facilitate synthesis of the data. The size and breadth of the total dataset collected for this study made it necessary to use a tool with more power and flexibility than traditional spreadsheet software. R was chosen for its ability to handle large and complex datasets, numerous existing packages for data manipulation, and reproducible framework. During compilation, timestamps for all sensor measurements were rounded to the nearest sensor-specific recording interval (typically 5 or 15 minutes) to adjust for any negligible drift in instrument clocks. To improve indexing, timestamps for all sensor-measured and laboratory-measured data were snapped to a 15-minute time grid, and a “position” column was created; “top” was assigned to all measurements made at (or nearest to) the near-surface depth and those above the water surface; “middle” was assigned to all measurements made at (or nearest to) mid-depth; and “bottom” was assigned to all measurements made at (or nearest to) the near-bottom depth. In addition to these measures, removal of communication error codes (for example, −99999), replicate samples, and other minor format manipulations were required to produce the final dataset used for analysis and interpretation. The dataset file is available in Johnston and others (2023).
Sensor and corresponding laboratory measurements of nutrients, DOC, chlorophyll-a, total phytoplankton biovolume, and cyanobacterial biovolume were evaluated through correlation analysis to assess the capability of the sensors to make representative measurements. Two laboratory-measured values collected at Owasco Lake on July 15, 2020 (mid-depth and near-bottom depths), were excluded from this and further analyses in this report because of substantial discrepancy between the laboratory-measured phytoplankton biovolume and sensor measurements collected on the same occasion. Two commonly used correlation measures, Pearson’s linear correlation coefficient (r) and Spearman’s rank correlation coefficient (ρ), were used to reveal the degree of linear or monotonic association between sets of data. Coefficient of determination (R2) was used to describe the amount of variance explained by the linear relation (Helsel and others, 2020; Rousso and others, 2020; Drasovean and Murariu, 2021; Prestigiacomo and others, 2022). For the fluorescence sensors, we assume fluorescence increases when the fluorophore—in this study, chlorophyll and fDOM—increases (monotonic; ρ); however, the relations are not always linear (r and regression; Foster and others, 2022; Booth and others, 2023). Correlations were considered to be statistically significant when probability values (p-values) were less than or equal to 0.05.
Correlation analyses were done on the overall dataset and by lake. Preliminary analyses were done to assess the variability of the relation between sensor- and laboratory-measured conditions across depth for each study lake because some sensor measurements were made at multiple depths, whereas others were strictly at, near, or above the water surface. Chlorophyll and fDOM measurements were made at each depth in each lake. Visual inspection of bivariate plots and correlation analyses indicated differences between lakes, but not within lakes, when comparing sensor data to laboratory data (table 5; table 6). The strength of the overall linear and monotonic relations within lakes did not vary substantially across depths ranges. Based on these observations, all data collected at multiple depths in a lake were combined for the analysis documented in this report. The combination of these data facilitated a larger number and range of observations that may better define the relations of interest.
Table 5.
Correlations between sensor-measured fluorescent chlorophyll and laboratory-measured chlorophyll-a.[All values are significant. r, Pearson's linear correlation coefficient; ρ, Spearman's rank correlation coefficient]
Table 6.
Correlations between sensor-measured fluorescent dissolved organic matter (fDOM) and laboratory-measured dissolved organic carbon (DOC).[All Spearman’s rank correlation coefficient (ρ) values for Seneca and Owasco Lakes are significant. NA, not applicable because sensor measurements were not available, r, Pearson's linear correlation coefficient]
Many studies have used regression models with one or more independent variables (such as sensor measurements) to improve estimations of phytoplankton abundance or other parameters associated with CyanoHABs (Fornarelli and others, 2013; Francy and others, 2015; Rousso and others, 2020; Prestigiacomo and others, 2022). Considering the breadth of sensor measurements available in this study, and their relation to the physiochemical and biological factors known to affect phytoplankton biomass, varying degrees of association were expected. Thus, stepwise regression analyses were used to identify the model(s) that explained the most variance (as indicated by R2) in laboratory-measured chlorophyll-a, total phytoplankton biovolume, and cyanobacteria biovolume compared to linear regressions with individual phytoplankton fluorometers.
Stepwise regression analysis was done using the Real Statistics Resource Pack add-on for Microsoft Excel (release 8.5; Zaiontz, 2023). Stepwise is a type of multiple linear regression used to select one, or a combination, of independent variables by forward-adding and backward-deleting, based on a desired significance level. The initial model is stepped forward with the addition of another variable, and so on. Through the stepping process, addition of new variables may reduce the explanatory power of previous variables. All variables are checked against the specified significance level (α) throughout the process; for these analyses, α=0.05. If the variable is not statistically significant in the model, then it is removed. Adding and deleting of variables occurs until an optimized model is established (Daghighi, 2017). For the resource package used, an equal number of observations for all variables was required by the functions used in these analyses; because of this, the dataset was limited to those timestamps where all independent (that is, sensor measurements) and dependent (that is, laboratory measurements from discrete samples) variables were present. There were many instances when one or more missing independent variables—caused by instrument malfunction or maintenance activities—resulted in the omission of an entire row of observations, emphasizing the importance of operating and maintaining complex monitoring stations, to ensure the continuity and utility of all data being collected. Measurements from the PhytoFind and nitrate sensors were not included in the stepwise analyses because of sample sizes of less than 22 observations because of data loss. Stepwise regressions were done using the overall dataset and by lake. In total, 66 of 147 possible observations were available. Skaneateles Lake was excluded from this analysis because discrete samples were only collected during August through October 2019.
Time Series Data Quality Assurance and Quality Control
Time-series analyses for all sensor data were done using the Aquarius Time-Series web-based software application (Aquatic Informatics, Inc., 2023). Fouling and calibration drift corrections were applied following standard USGS protocols and guidance (Wagner and others, 2006; Foster and others, 2022; Booth and others, 2023) where applicable or otherwise specified below. Telemetered data were verified against available log files and data gaps were filled when necessary. Periods of missing time-series data during the period of record were mainly attributed to equipment malfunction, insufficient power supply, or both. The exact periods varied by parameter; however, general instances of the key issues are listed below:
-
• In 2019, at Owasco Lake, data from the near-surface multiparameter sonde were not recorded during the end of August to beginning of September because the daisy chaining feature of the instrument malfunctioned.
-
• In 2019, at Seneca Lake, data from the mid-depth multiparameter sonde were not recorded during November until the end of deployment because the daisy chaining feature of the instrument malfunctioned.
-
• In 2019, at Owasco Lake, data from the nitrate sensor (nitro::lyser II) were not recorded during mid-June until the end of the deployment because the external controller malfunctioned and getting repairs or replacements was challenging.
-
• In 2019, at Seneca Lake, data from nitrate sensor (nitro::lyser II) were not recorded during early September until the end of the deployment because the external controller malfunctioned and getting repairs or replacements was challenging.
Outliers or “spikes” (that is, instantaneous values that depart substantially from adjacent data points) were removed from the data set judiciously; most outliers or spikes were due to equipment malfunction, occurrence(s) during site visits, or when collocated data indicated otherwise stable physiochemical conditions at the monitoring location.
Sensor-Specific Analysis Protocols
Some modifications to standard data analysis protocols were required for sensors incorporating emerging technology or sensors for which USGS protocols do not exist. Data analysis protocols for such sensors are described in this section.
Orthophosphate Sensor
All values measured by the orthophosphate sensor at Seneca Lake (2019–20), Owasco Lake (2019), and Skaneateles Lake (2019) were below the 0.002 mg/L as P minimum detection limit of the instrument. All measured values reported by the orthophosphate sensor at Owasco Lake in 2020 were below the 0.002 mg/L as P minimum detection limit of instrument, except for 11 time-series values. Using the Adjustable Trim edit tool in Aquarius, all values below the detection limit were replaced with “0.002” mg/L as P. Additionally, affected values were tagged with the qualifier, “Actual value is known to be less than reported value.”
In addition to time-series analysis in Aquarius, internal metadata were reviewed using the manufacturer’s software, Cycle Host. Explanations and guidance on QC review of the data and metadata provided by the HydroCycle PO4 are described in the user manual (Sea-Bird Scientific, 2019). The following data were deleted because of abnormalities observed in the QC data plots (fig. 10), which indicated the reagents did not mix with the water sample (typically caused by pinching of the waste line of the instrument; 1/16-inch inner diameter tubing):
-
Seneca Lake platform (2019)—November 12 to 14, and 16 to 17, 2019.
-
Seneca Lake platform (2020)—September 21 to October 19, 2020.
-
Owasco Lake platform (2019)—September 12 to November 18, 2020.
-
Owasco Lake platform (2020)—September 3 to 21, 2020.
-
Skaneateles Lake platform (2019)—November 9 and from 12 to 18, 2019.
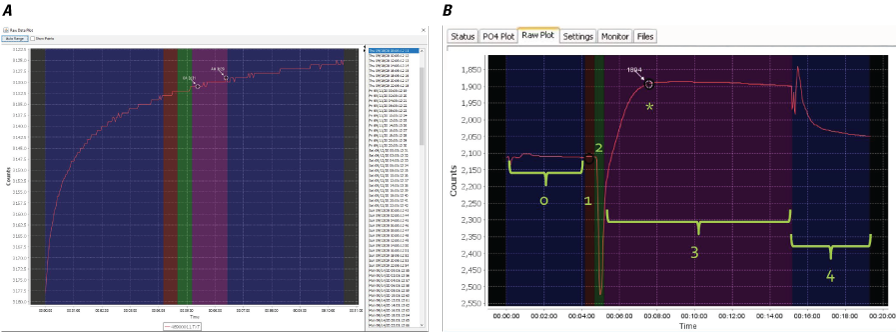
Screenshots showing diagnostic quality control (QC) plots for the Sea-Bird Scientific HydroCycle PO4. A, Abnormal result indicating issues with reagent reactions; photograph by U.S. Geological Survey; B, Normal result as provided by the instrument manual (Sea-Bird Scientific, 2019).
Overall, the orthophosphate sensor is complex to operate and maintain, and determining sensor’s performance is difficult. Nearly all sensor measurements were below the minimum detection limit; however, orthophosphate was rarely detected in laboratory-measured discrete samples, which aligns with the below minimum detection values reported by the HydroCycle PO4. Loss of data was primarily attributed to damage (typically as pinching) of the waste line of the sensor, which required a site visit to identify and remedy.
Phytoplankton Classification Sensor
When analyzing data from the multichannel fluorometer, it is important to consider that the reported chlorophyll concentration and percent chlorophyll contributions per phytoplankton group are estimates and not associated with a specified accuracy by the manufacturer. The results from the instrument are assumed to demonstrate relative stability when measured inside the solid reference standard cap.
Seneca Lake platform (2020).—Fouling- and sensor-verification checks did not indicate changes in instrument readings of chlorophyll that exceeded the criteria described in Foster and others (2022). In addition to reasons described in the “Time Series Data Quality Assurance and Quality Control” section, the period August 24 to October 5, 2020, was removed from the time-series record because of a malfunction of the antifouling wiper parking outside the intended position, which resulted in variable interference to the fluorescence sensors. This interference was evident by irregular fluctuations in the time-series data (most pronounced in the integrated fDOM sensor data) and by documentation made at a site visit during which the issue was resolved (fig. 11).
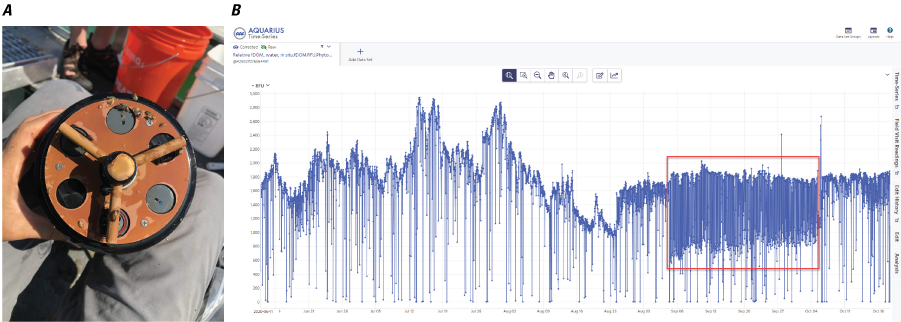
Incorrect parking of the anti-fouling wiper of the PhytoFind. A, photograph of PhytoFind wiper parking incorrectly during a site visit; B, screenshot showing a graph of an example of erratic time-series data (outlined by the red box) from the fluorescent dissolved organic matter (fDOM) sensor of the PhytoFind, resulting from the wiper parking incorrectly; photograph by U.S. Geological Survey.
Owasco Lake platform (2020).—Fouling checks did not indicate changes in instrument readings of chlorophyll that exceeded the criteria described in Foster and others (2022). Sensor verification checks indicated a change of 27.8 percent in instrument readings of chlorophyll during the deployment, which exceeds the calibration correction threshold described in Foster and others (2022); however, the recalibration or application of calibration drift corrections using standard methods are not applicable to this multichannel fluorometer as described above. In addition to reasons described in the “Time Series Data Quality Assurance and Quality Control” section, the period from August 10 to 24, 2020, was removed from the time-series record because of a malfunction with the antifouling wiper parking outside the intended position, resulting in variable interference to the fluorescence sensors. This interference was indicated by irregular fluctuations in the time-series data and was documented during a site visit during which the issue was resolved. During the deployments at Seneca and Owasco Lakes, frequent (that is, multiple occurrences per day) downward outliers were present in the time-series record of fDOM RFU measurements. Neither comparison with the fDOM sensor on the multiparameter sonde nor consultation with the manufacturer established confidence in the observed spikes. These outliers can affect the fDOM blank correction applied to all parameters reported by the multichannel fluorometer. Following the recommended best practices discussed in Foster and others (2022), specific guidelines for identifying erroneous spikes in the multichannel fluorometer data were developed for this project.
A variety of statistical methods for detecting outliers exist, and one method is to set an outlier bound at either two or three standard deviations from the mean (Thompson, 1935; Ahn and James, 1999). The outlier bound for these data was set at two standard deviations from the mean of a rolling 24-hour interval. This outlier detection was applied programmatically using R statistical software. In addition to the edits described above, all reported parameters from the multichannel fluorometer that were associated with flagged outliers in the time-series record of fDOM RFU measurements (2.3 percent for Seneca Lake and 1.7 percent for Owasco Lake) were also removed from the record.
Overall, the multichannel fluorometer is complex to operate and can require unique procedures to acquire integrated, site-specific corrections. Methods for verification and maintenance are also unique, and require a detailed understanding of the instrument, its function, and accessories or else risk reduced data quality. Moreover, outliers generated by the fDOM sensor on board the instrument can affect all reported measurements. Based on these data, the percentage of fDOM outliers was about 2 percent of the total data collected at Seneca Lake and Owasco Lake and may indicate a systematic error with the instrument rather than random error caused by environmental conditions. More data are required to determine the cause of fDOM outliers.
Water Temperature and Illumination Sensor
No fouling or calibration drift corrections were applicable to the water-temperature and illumination data measured by the combined sensor. Water-temperature data were verified by comparison with collocated water-temperature data from the near surface multiparameter sonde, such that the near surface combined sensor reading was verified and then used to verify the sensor reading at the next lower depth, iterating down the temperature string. Illumination data from the combined sensors were verified by comparison with collocated PAR data from the LI–COR LI–190R at near surface depths, then iterated down the string, as described for water temperature, assuming light reduction farther down the string. In addition to equipment malfunction, water temperature and illumination data from the combined sensor deployed at 15 m depth in Owasco Lake were removed from the time-series record for the periods from September 3 to 21, 2020, and October 5 to 22, 2020, because of an unexplained shift of about 0.5 °C for water temperature and about 1 lux for illumination, in comparison with adjacent sensors. Additional support for determining this period as related to sensor malfunction was provided by illumination overnight readings greater than 0 lux. Many other smaller periods of only illumination data at each study lake were removed from the record when comparisons with adjacent sensors indicated departures from expected trends (that is, decreasing illumination with increasing depth). Overall, the combined water-temperature and illumination sensors performed well; however, drift is more frequently observed in illumination measurements (as compared to adjacent combined sensors) than water-temperature measurements. Additionally, the lack of integration into the datalogger makes identifying issues less timely—requiring a site visit—than if data were telemetered.
Photosynthetically Active Radiation Sensor
No fouling or calibration drift corrections were applicable to PAR data measured by the sensor on the platform. PAR data were verified by comparison with illumination data from the combined sensors in the water near the surface, which were presumed to have relative correlation. Gaps in data were not frequent or long in duration; however, they did occur briefly at times across all lakes and years except for the data from Owasco Lake in 2020. Gaps in data were almost always associated with global power issues on the platform affecting the datalogger and telemetry equipment. Although the PAR sensor itself was not dependent on platform battery power, communication with the datalogger and (or) transmission of the data can be interrupted by power problems. Overall, the PAR sensor functioned well. PAR data were deleted on only two occasions: mid-August 2019 at Owasco Lake (about 24 hours) and Skaneateles Lake (about 40 hours), when PAR values were 0 µmol/m2/s despite near-surface illumination data from the combined sensor indicating fluctuations.
Weather Sensor
No fouling or calibration drift corrections were applicable to air temperature, precipitation, wind direction, and wind speed. Air temperature data were verified by comparison with collocated, near-surface water-temperature data from the multiparameter sonde and from the combined water-temperature and illumination sensor, which were presumed to have relative correlation. Precipitation, wind, and air temperature data were verified by comparison with corresponding precipitation, wind, and air temperature data recorded at the other lake platforms. Overall, the weather sensor functioned well, and gaps in data were almost always associated with global power issues on the monitoring-station platforms.
Discrete Sample Quality Assurance and Quality Control
Between 2019 and 2020, a total of 147 environmental samples and 15 replicates (that is, a single replicate from each lake and depth for each year sampled), or about 10 percent of overall samples, were collected and analyzed. Equipment blanks were collected at the beginning of each field season. Nutrients, DOC, and chlorophyll-a were not detected in any blank samples. All analytes with comparable sensor technologies, and discussed herein, had median RPD values of less than 10 percent; nitrate plus nitrite: median RPD=1.8 percent, n=15 replicate pairs; orthophosphate: median RPD=1.4 percent, n=1 replicate pair; dissolved organic carbon: median RPD=1.8 percent, n=14 replicate pairs; and chlorophyll-a: median RPD=7.9 percent, n=13 replicate pairs (2 replicate pairs had one or both values below 0.1 μg/L and were censored). No analytes had RPD values greater than 20 percent, except for chlorophyll-a, which had 3 of 13 replicate pairs with RPD values ranging from 23.7 to 29.5 percent. Absolute differences in concentration between those three chlorophyll-a pairs ranged from 0.14 to 1.24 µg/L. Calculation of RPD for orthophosphate replicate pairs was limited to a single pair, because concentrations of all other replicate pairs were less than the laboratory reporting limit of 0.008 mg/L as P. The AVLDs for phytoplankton across all replicate pairs ranged from 0.14 to 0.86 (median AVLD: 0.25, n=15 replicate pairs) for total biovolume and 0.11 to 0.61 (median AVLD: 0.26, n=15 replicate pairs) for cyanobacterial biovolume, respectively. No result pairs for either total or cyanobacterial biovolume had AVLDs greater than 1. All data were considered of acceptable quality for the purposes of this report.
Lessons Learned
The design, construction, and maintenance of a complex environmental monitoring gage requires specialized knowledge in engineering, instrumentation specifications, and appropriate maintenance procedures. Many lessons about platform design, sensor instrumentation, and field methods were learned over the course of the advanced monitoring pilot study and a few are in the next sections for consideration by those doing similar efforts.
Platform Design
Each platform deployed in the three study lakes held 40 separate instruments, generated greater than 200 time series, and collected greater than 10,000 data points per day. Most of the data were logged within a datalogger and transmitted in near real time, but some were logged internally by the sensors. All 40 instruments outputting a substantial amount of data posed several challenges. Substantial power was needed to run that many sensors; two 100-watt solar panels connected to two 108 amp-hour batteries were used to power each platform. Issues that affected the power system included extended periods of cloud cover, cold temperatures, reduced hours of sunlight late in the year, the effects of bird droppings on the solar panels, and increased battery drain because of malfunctioning equipment. The frequency of cloud cover and cold weather generally increased in the fall months of October and November. Additional solar panels were required in situations where sufficient power supply was an issue.
Excessive heat within the data enclosure was a problem that may have caused malfunction of some instrumentation and telemetry. The heat shield that was added to the enclosure in 2020 reduced these observed effects. The use of dissimilar metals (primarily aluminum and stainless steel) on the platform led to problems from galvanic corrosion; sacrificial anodes placed on the platforms and near aluminum/stainless steel connection points mitigated this issue.
Wave action in the lakes created challenging conditions as well. Working on the platforms in such conditions was difficult because of erratic platform movement and water splashing across the deck while collecting discrete samples and working with sensitive electronic instrumentation. In addition, movement of the instrumentation in the PVC wells was of concern, and securing them to prevent jarring movement was important. Anchor lines with good elasticity helped reduce some movement in the platforms. An additional measure to reduce wave effects on the instrumentation would be to deploy them closer to the center of the platform as opposed to the end of the platform.
Sensor Instrumentation
The original design of the platforms used a metal “cage” to house the nitrate sensor, orthophosphate sensor, and multichannel fluorometer (fig. 12). Each sensor was secured to a side of the cage, and the cage was suspended from a cut-out in the platform deck. The design was changed before deployment in 2019 to PVC wells secured to the platform deck. The wells held the sensors more securely in wave action and provided easier access for service visits. However, the larger surface area for fouling increased the amount of cleaning required.
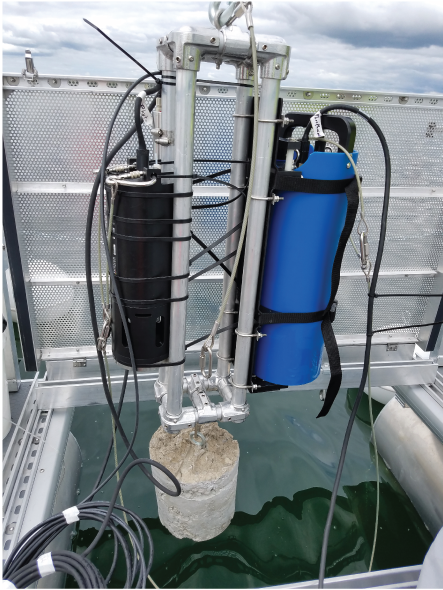
Photograph of a metal cage used initially to deploy the nitrate sensor, orthophosphate sensor, and phytoplankton sensor before it was replaced by polyvinyl chloride (PVC) wells; photograph by U.S. Geological Survey.
The daisy chaining feature of the multiparameter sondes was used to deploy them at multiple depths. Daisy chaining the sondes together with the same cables allowed for shorter cable lengths and thus a reduced chance of cable entanglement. However, successful operation of the daisy chaining feature depended on powering up each sonde in a specific order and the uninterrupted function of each sonde. If power was interrupted at the platform and the sondes could not be repowered in the prescribed manner, then a malfunction would occur, affecting the other sondes. Although daisy chaining improved cable management, it contributed to substantial loss of real-time sensor data. In 2020, each sonde was cabled independently, which resulted in reduced data loss. Aside from this issue, the multiparameter sonde performed well overall.
The nitro::lyser II nitrate sensor was deployed in the beginning of the study; however, the external controller did not function as expected likely because of high temperatures and jarring movement from wave action. Additionally, the controller had a high power requirement, which led to increased drain on the power system, eventually leading to lost nitrate data and lost data from other sensors. The increased power requirement of the nitro::lyser II controller was confounded by the 5-minute recording interval programmed in the measurement settings. In 2020, the Nitratax was used at a 15-minute recording interval, which resulted in improved performance of the gage power system and facilitated a more complete dataset. Overall, nitrate sensors are sensitive to the ambient temperature and have a substantial power requirement. Appropriate model selection for ambient and in-place conditions is crucial for reducing nitrate-sensor data loss and potentially other sensors dependent on the same power source.
The orthophosphate instrument cable and waste line were susceptible to physical damage, such as pinching and (or) abrasion, and was the primary cause of lost data. This issue was obscured by limitations of the telemetry configuration and not having the available QC metadata available remotely; thus, identifying issues required a site visit. Users of this instrument could run the cable and waste line through a flexible conduit to protect them. A consideration for deployment in deep lakes is that if the waste line is too long, the instrument may not be able to pump out the waste, resulting in data loss. Based on the high number of nondetects reported by the orthophosphate sensor, orthophosphate may need to be monitored less in Seneca, Owasco, and Skaneateles Lakes, especially considering the complex nature and maintenance required for the current (2024) generation of in-place, wet chemical sensors.
The combined water temperature and illumination sensors were deployed in 1-meter intervals throughout the water column, all attached to the same wire cable. At each site, sensors totaled between 26 and 31, depending on the lake depth at the platform. In 2019, the sensors were cleaned every few weeks; and about halfway through the deployment period, the sensors were swapped, and the data were downloaded. The data from the combined water temperature and illumination sensors were also not telemetered, and thus malfunctions (such as the sensors ceasing to make measurements) were not discovered until the only download attempt of the deployment was made. This practice resulted in large periods of missing data. In 2020, the entire string of sensors was swapped out every 2 weeks. Swapping the sensors and downloading data more frequently facilitated a more complete dataset.
Field Methods
In 2019, one field crew performed gage and sensor maintenance and collected discrete samples in single site visits, occurring at 4- to 8-week intervals as is common for most USGS monitoring stations. This initial schedule was enacted because fouling was not expected to be prolific in these clear freshwater lakes; however, heavy fouling from dreissenid mussels (such as Dreissena bugensis and D. polymorpha) occurred, particularly at the near-surface locations (fig. 13). In 2020, to facilitate more frequent sensor cleanings, a separate crew made site visits every 2 weeks to clean and swap sensors and troubleshoot other platform issues as needed. In addition, copper-based, anti-fouling components were added to the infrastructure and instrumentation where appropriate. Increased anti-fouling measures and frequency of site visits improved the quality (a reduction in the effects of fouling) and quantity (sensor malfunctions resolved promptly) of the data collected.
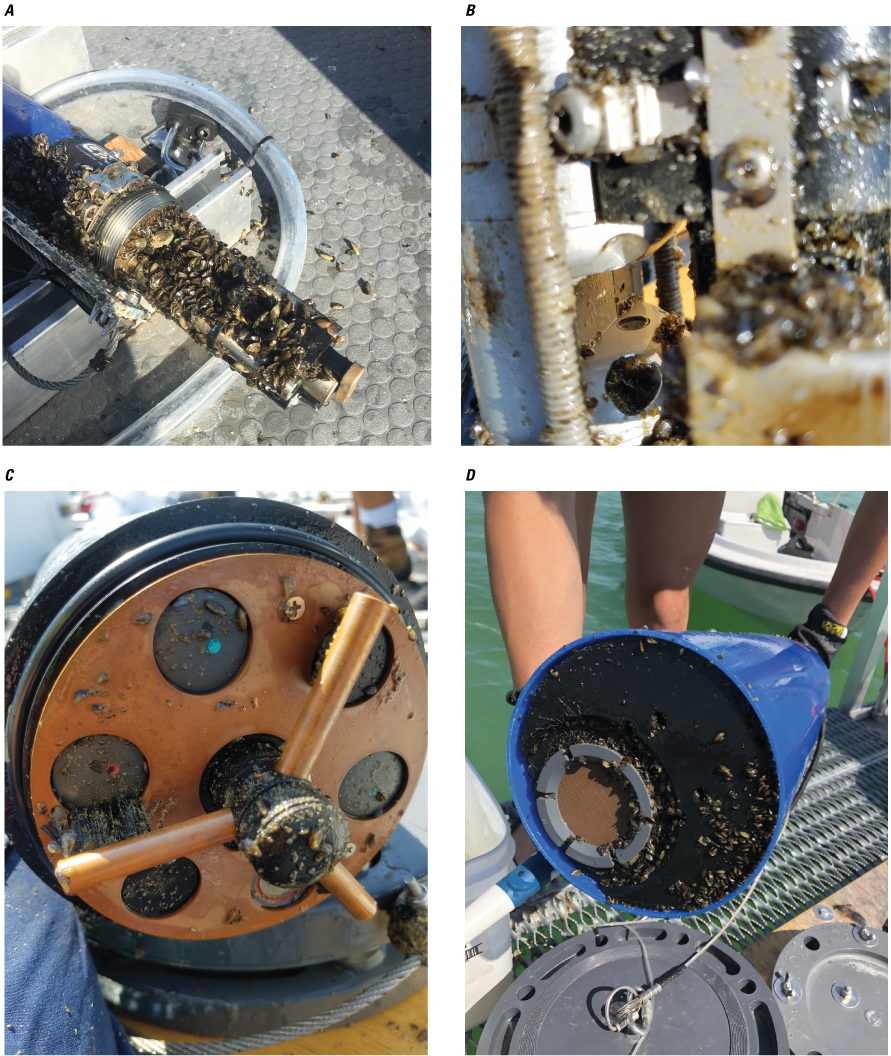
Photographs of sensor fouling over 2- to 3-month deployments. A, EXO2 multiparameter sonde covered in dreissenid mussels. B, Nitro::lyser II nitrate sensor fouled by dreissenid mussels, slime and algae. C, PhytoFind phytoplankton classification sensor fouled by dreissenid mussels and slime. D, HydroCycle PO4 orthophosphate sensor fouled by dreissenid mussels; photograph by U.S. Geological Survey.
Sensor Performance and Evaluation Discussion
This section discusses the results of correlation analyses between sensor and corresponding laboratory measurements, collectively and by lake. Additionally, for laboratory measures of phytoplankton biomass, stepwise regressions were developed using all available sensor measurements. These regression models were compared to individual fluorescence sensors to assess their ability to explain the variance in chlorophyll-a, total phytoplankton biovolume, and cyanobacteria biovolume better than the individual fluorescence sensors alone.
Nitrate
The overall monotonic relation between sensor-measured and laboratory-measured concentrations of nitrate was strong (ρ=0.87, p-value<0.05; n=24), and 78 percent of the variation between values was explained by linear regression (r=0.88, p-value<0.05, R2=0.78). Although the number of observations in Seneca Lake (n=13) and Owasco Lake (n=11) was small, the differences between the locations were indicated by the slope of their respective linear regressions (fig. 14). A single high laboratory-measured value at Seneca Lake likely has a strong effect on the overall relation; however, the reason to exclude the measurement from the dataset is not clear. In general, nitrate values were underestimated relative to laboratory measurements at Seneca Lake, and 64 percent of the variation in the relation was explained with linear regression. Sensor-measured nitrate concentrations ranged from 0.24 to 0.50 mg/L as N, with median value of 0.29 mg/L as N, whereas laboratory-measured nitrate concentrations ranged between 0.05 and 1.19 mg/L as N, with a median value of 0.20 mg/L as N. Sensor-measured nitrate values were more consistent with laboratory measurements at Owasco Lake, and 88 percent of the variation in the relation was explained with linear regression. Sensor-measured nitrate concentrations ranged from 0.58 to 1.19 mg/L as N, with median value of 0.67 mg/L as N, whereas laboratory-measured nitrate concentrations ranged from 0.58 to 1.21 mg/L as N, with a median value of 0.75 mg/L as N (fig. 14). Results from this study indicate that nitrate sensors performed well in the study lakes but suggests that the relation between sensor- and laboratory-measured nitrate values may vary among lakes. Additional observations are needed to further define the relationships between sensor- and laboratory-measured concentrations of nitrate at both Seneca Lake and Owasco Lake.
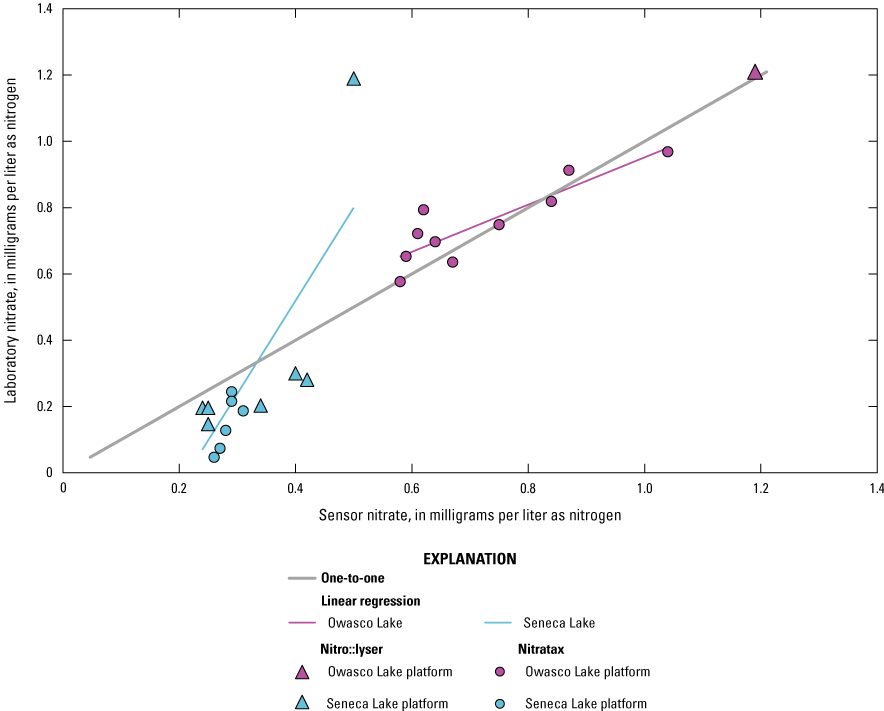
Scatterplot showing sensor-measured nitrate concentrations, from the s::can nitro::lyser II (triangles) and the Hach Nitratax plus sc (circles), related to laboratory-measured nitrate concentrations at Seneca and Owasco lakes for 2019 and 2020.
Orthophosphate
The relation between sensor- and laboratory-measured concentrations of orthophosphate could not be evaluated based on the results of this study. Orthophosphate was rarely detected by sensor measurements or laboratory analyses in any of the lakes sampled during 2019 and 2020. Only 3.4 percent (5 out of 147; not including replicates) of discrete-sample measurements were above the minimum detection limit (that is, limit of detection: 0.004 mg/L as P): 4 samples from Seneca Lake and 1 sample from Owasco Lake. Just one sample (0.7 percent) was above the reporting limit (that is, limit of quantification: 0.008 mg/L as P) and equaled 0.012 mg/L as P; collected from the near-bottom sampling depth at Owasco Lake on June 27, 2019. All samples with detectable orthophosphate were collected from the near-bottom sampling depth at Seneca and Owasco Lakes. The laboratory data support the time-series data measured by the orthophosphate sensor, which were nearly all below the minimum detection limit of the instrument (0.002 mg/L as P). The lower detection limit of the sensor may have resulted in some detections of orthophosphate that were not reported in laboratory analyses. Less than 1 percent of sensor measurements (11 out of 1,454) were above the detection limit, and all were at Owasco Lake in October 2020. Results from this study indicate the orthophosphate sensor did not experience the challenges reported in other types of environments in these low-turbidity systems (Peake, 2022); however, concentrations were too low to conduct a meaningful comparison of sensor- and laboratory-measured concentrations.
Dissolved Organic Matter
Although not a direct comparison like nitrate and orthophosphate, many studies have used sensor measurements of fDOM as a proxy for DOC, which is an important regulator of the ecology and biogeochemistry of global ecosystems (Downing and others, 2009; Pellerin and others, 2012; Hoffmeister and others, 2020; Toming and others, 2020). The relation between sensor-measured fDOM (µg/L as QSE) and laboratory-measured DOC (mg/L) was confounded by the limited range of DOC concentrations observed. Overall, laboratory-measured concentrations of DOC ranged from 1.31 to 3.43 mg/L, with a median value of 2.24 mg/L. EXO2 sensor-measured fDOM ranged from 2.00 to 20.1 µg/L as QSE, with median value of 8.21 µg/L as QSE. Owasco Lake had the largest range of fDOM, from 7.20 to 20.1 µg/L as QSE, whereas Seneca Lake had a moderate range (from 5.00 to 11.4 µg/L as QSE), and Skaneateles Lake had the smallest range (from 2.00 to 4.03 QSE; fig. 15). It is important to acknowledge that although sensor-measured fDOM data used in this study were collected using USGS protocols and guidelines available during the study period (that is, Wagner and others [2006]), sensor-measured fDOM data were raw measured values. Corrections for water temperature, turbidity, and inner matrix (that is, effects from constituents in the water on the sensor measurements), such as those described in Booth and others (2023), were not applied because of lack of available supporting data as well as high water clarity and low suspended solids concentrations in the study lakes. Correlation analysis indicated that the monotonic relation between fDOM and DOC was statistically significant at Seneca (ρ=−0.31, p-value<0.05; n=57) and Owasco Lakes (ρ=−0.60, p-value<0.05; n=55), but not at Skaneateles Lake (ρ=−0.27, p-value=0.35; n=14). The linear relation between fDOM and DOC was marginally statistically significant at Owasco Lake (r=0.27, p-value=0.04, R2=0.08). Although the linear association in Owasco Lake was statistically significant, only 8 percent of the variation in the relation between fDOM and DOC was explained. The linear relation at Seneca and Skaneateles Lakes was not significant. The differences in relation by lake may be attributable to the composition of the DOC pool or other physiochemical conditions within each lake, rather than variations in instrument function or calibration, given the relative consistency in the relation across depths within each lake.
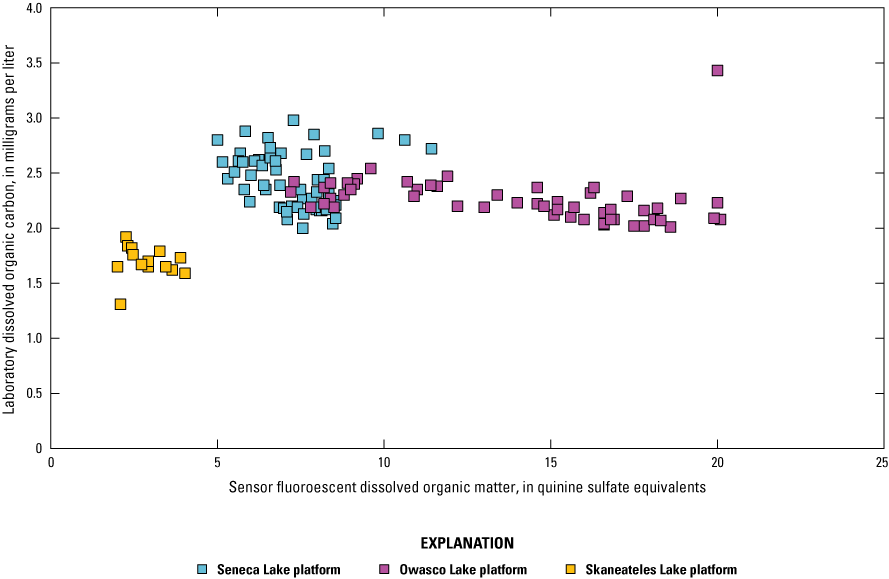
Scatterplot showing sensor-measured fluorescent dissolved organic matter concentrations related to laboratory-measured dissolved organic carbon concentrations.
Phytoplankton Biomass
When evaluating measurements from phytoplankton fluorescence sensors against laboratory-measurements associated with phytoplankton biomass, it is important to consider that the reported values from the sensors are estimates and are not associated with a specified accuracy by the manufacturer. The results from the sensors used in this study were assumed to have relative correlation with the discrete sample analyses.
Another consideration is the relation of the different types of laboratory analyses that are indicative of phytoplankton biomass. Although chlorophyll has become the measurement of choice for many studies and monitoring programs as a proxy for phytoplankton biomass, the relation between laboratory-measured chlorophyll-a and phytoplankton abundance or biovolume can vary substantially (Canfield and others, 2019). In this study, the monotonic relation between laboratory measurements of chlorophyll-a and total phytoplankton biovolume was strong (ρ=0.80, p-value<0.05; n=145); however, only 25 percent of the variation was explained by linear regression (r=0.50, p-value<0.05, R2=0.25). Chlorophyll-a concentrations ranged from 0.05 to 14.60 µg/L, with median value of 1.40 µg/L, whereas total phytoplankton biovolume ranged from 3,810 to 5,202,979 µm3/mL, with a median value of 147,860 µm3/mL (fig. 16). These ranges suggest CyanoHABs may not have been substantially present in the sampling locations at the open-water monitoring stations on study lakes during the study period, except for one open-water surface bloom (dominated by Microcystis spp.) observed at Owasco Lake during August 2020 (table 7, fig. 17). Despite the lack of observed open-water phytoplankton accumulations during most of the study period, nearshore CyanoHABs were reported during 2019 and 2020 at Seneca, Owasco, and Skaneateles Lakes (NYSDEC, 2023; Halfman and others, 2023). The relation between chlorophyll-a and phytoplankton biovolume improved when Seneca and Skaneateles Lakes were considered separately (R2=0.52 and 0.49, respectively), but the relation in Owasco Lake remained weak (R2=0.25). These among-lake differences may be attributed to phytoplankton community composition and (or) dominance by a single taxon (that is, a single taxon comprising greater than 50 percent of total biovolume). About 54 percent of samples collected had communities without a single dominant taxon. Across all three study lakes, when communities were dominated by a single taxon, it tended to be diatom genera (42 of 67 samples). Cyanobacteria only dominated phytoplankton biovolume in 11 samples (4 from Seneca Lake and 7 from Owasco Lake; all samples where cyanobacteria were dominant were collected between July and October in both 2019 and 2020). Dominant cyanobacterial taxa included Microcystis, Aphanocapsa, and Pseudanabaena, all of which are known to have cyanotoxin producing strains (Graham and others, 2008). Substantial variability in community composition was observed over time and within and among lakes (fig. 17; table 7). Given that phytoplankton communities are often diverse and dynamic, interpretations of how fluorescence sensor measurements represent laboratory measurements globally are difficult. In addition to other considerations discussed in Foster and others (2022), the relatively narrow range of laboratory-measured chlorophyll-a and phytoplankton biovolume concentrations, and lack of occurrence of open-water CyanoHABs during the study period limits the ability to fully assess sensor performance in this study.
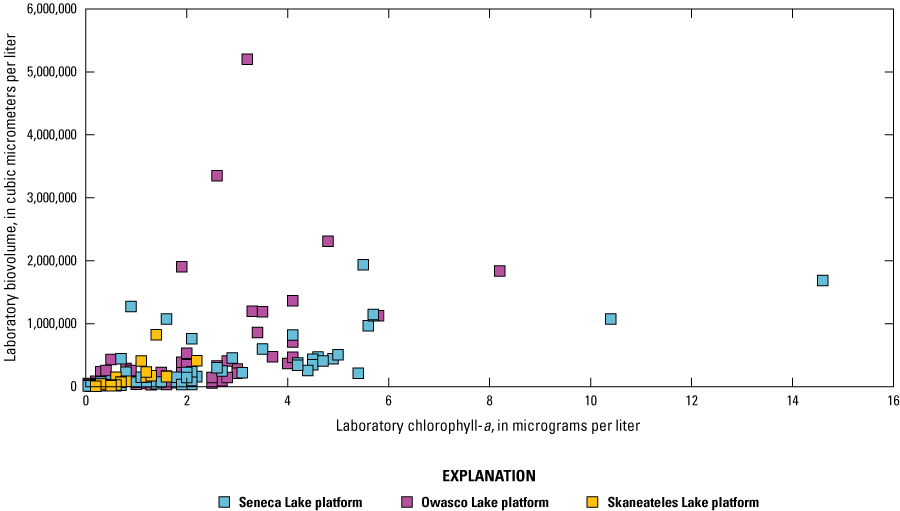
Scatterplot showing laboratory-measured chlorophyll-a concentrations related to laboratory-measured total phytoplankton biovolume.
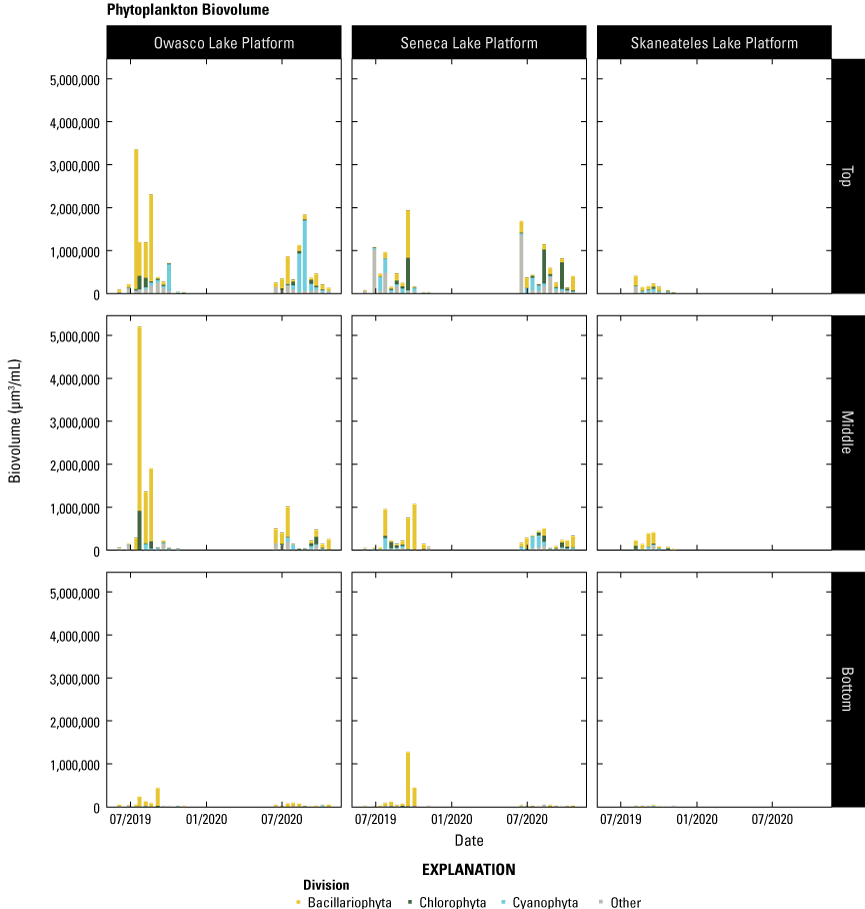
Graphs showing phytoplankton community biovolume in cubic micrometers per milliliter (µm3/mL) at three different sampling depths in the water column at Owasco Lake, Seneca Lake, and Skaneateles Lake in 2019 and 2020. Biovolume is measured by traditional microscopic analysis. Taxa are grouped by divisions: (1) Cyanophyta (cyanobacteria); (2) Chlorophyta (chlorophytes; green algae); (3) Bacillariophyta (diatoms); (4) Other (all other phytoplankton).
Table 7.
Dominant (relative biovolume greater than 50 percent) cyanobacteria taxa, by sampling depth, as determined from laboratory-measured phytoplankton identification and enumeration samples at Seneca Lake, Owasco Lake and Skaneateles Lake. Samples where no one taxon was dominant are not shown.[Data are available in Perkins and others, 2021 Dates are given in year-month-day; µm3/mL, cubic micrometer per liter]
Chlorophyll
Chlorophyll was measured by two instruments in this study: the dual-channel fluorometer on a multiparameter sonde and a multichannel fluorometer. The relation between each sensor and related laboratory measurements is discussed; however, the sensors are not directly compared, in accordance with guidance from the USGS Office of Acquisitions and Grants (OAG)/Ethics when discussing instrument performance in publications by USGS authors. The reader should be able to discern similarities and differences between the two instruments based on the data and analyses provided.
The overall monotonic relation between the dual-channel chlorophyll fluorometer and laboratory-measured concentrations of chlorophyll-a was relatively strong (ρ=0.73, p-value<0.05; n=134); however, only 50 percent of the variation was explained with linear regression (r=0.71, p-value<0.05, R2=0.50). Sensor-measured chlorophyll concentrations ranged from −0.50 to 13.5 µg/L, with a median value of 0.90 µg/L (reported values less than 0 are possible from the EXO Total Algae sensor—typically a result of sensor calibration procedures); laboratory-measured chlorophyll-a concentrations ranged from 0.05 to 14.6 µg/L, with a median value of 1.30 µg/L (fig. 18). Generally, laboratory-measured chlorophyll-a values tended to be slightly higher than values from the dual-channel fluorometer. The laboratory-measured median was about 1.4 times higher than the sensor-measured median, and the laboratory maximum was about 1.1 times higher than the sensor maximum. The dual-channel fluorometer explained the most variance in laboratory-measured chlorophyll-a concentrations in Seneca Lake (R2=0.60) but did not explain as much in Owasco (R2=0.33) and Skaneateles (R2=0.38) Lakes. These differences by lake may be in large part attributed to the phytoplankton community composition or physicochemical conditions within the lakes, rather than variations in instrument function or calibration, as supported by the relative consistency across the depths at each lake.
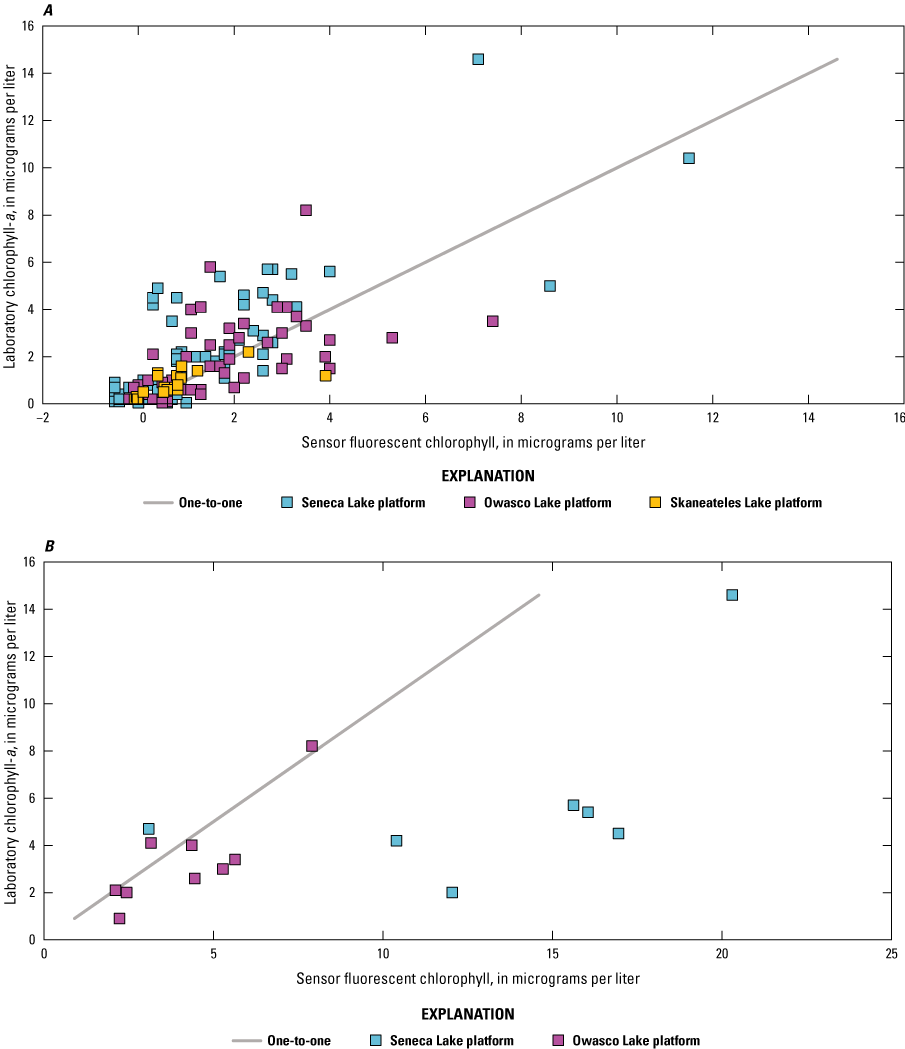
Scatterplots showing sensor-measured chlorophyll concentrations related to laboratory-measured chlorophyll-a concentrations. A, EXO2 Total Algae-Phycocyanin sensor; B, PhytoFind phytoplankton classification tool.
The overall monotonic relation between chlorophyll concentration measurements from the multichannel fluorometer and laboratory-measured concentrations of chlorophyll-a was moderately strong (ρ=0.65, p-value<0.05; n=16). However, the multichannel fluorometer only explained 44 percent of the variation in laboratory-measured chlorophyll-a values (r=0.66, p-value<0.05, R2=0.44). Sensor-measured chlorophyll concentration ranged from 2.11 to 20.3 µg/L, with a median value of 5.46 µg/L, whereas laboratory-measured chlorophyll-a concentrations ranged from 0.05 to 14.6 µg/L, with a median value of 1.50 µg/L (fig. 18). Generally, the sensor measurements tended to be higher than measurements from the laboratory; sensor median was about 3.6 times higher than the laboratory median, and sensor maximum was about 1.4 times higher than the laboratory maximum. The relation between the sensor-measured and the corresponding laboratory-measured chlorophyll-a concentrations is different in Seneca Lake and Owasco Lakes. The multichannel fluorometer explained more than 2 times the variance in laboratory-measured chlorophyll-a values at Owasco Lake (R2 = 0.70) than at Seneca Lake (R2 = 0.31). Moreover, the multichannel fluorometer at Seneca Lake generally overestimated chlorophyll-a, relative to the fluorometer at Owasco Lake. The overestimation at Seneca Lake is likely attributed to the generally larger biovolumes of phytoplankton in the green/brown and mixed target groups of the sensor (Johnston and others, 2022; fig. 17; table 7). Although the number of observations is small, the multichannel fluorometer performed better in samples where cyanobacteria were dominant, as observed by Johnston and others (2022). For example, in Owasco Lake, sensor measurements of chlorophyll were within 10 percent of laboratory-measured values when cyanobacteria were dominant (n=2). More data are needed to establish additional confidence in these relationships.
Overall, the amount of variance in laboratory-measured chlorophyll-a explained by fluorescence sensor measurements differed among lakes and by sensor. Both the dual-channel and multichannel fluorometers demonstrated the ability to explain about 60 percent of the variance in laboratory-measured chlorophyll-a at Seneca Lake and Owasco Lake, respectively. However, the amount of variance explained ranged between about 30 and 60 percent, depending on lake and sensor. Although relatively good relations between sensor- and laboratory-measured chlorophyll-a values were observed in this study, the sample size and range are small, and using site-specific relations may increase the overall amount of variance explained by the sensor(s) (Rousso and others, 2020; Prestigiacomo and others, 2023).
Phytoplankton Biovolume
Total phytoplankton biovolume.—Although not a direct comparison, chlorophyll can be used as a proxy for phytoplankton biomass (Foster and others, 2022). Chlorophyll measured by the dual-channel and multichannel fluorometers were compared to laboratory-measured total phytoplankton biovolume. The overall monotonic relation between chlorophyll concentration measurements from the dual-channel fluorometer and laboratory-measured total phytoplankton biovolume was moderately strong (ρ=0.61, p-value<0.05; n=136); however, only 14 percent of the variation in phytoplankton biovolume was explained by sensor-measured chlorophyll (r=0.38, p-value<0.05, R2=0.14) (fig. 19). The linear relation with dual-channel fluorometer measurements was weaker for total phytoplankton biovolume (all r values about 0.20 less) than for chlorophyll-a overall and in individual lakes. By lake, the dual-channel fluorometer explained more variance in laboratory-measured total phytoplankton biovolume in Seneca Lake (R2=0.32) than Owasco (R2=0.09) and Skaneateles (R2=0.20) Lakes, similar to what was observed for chlorophyll-a.
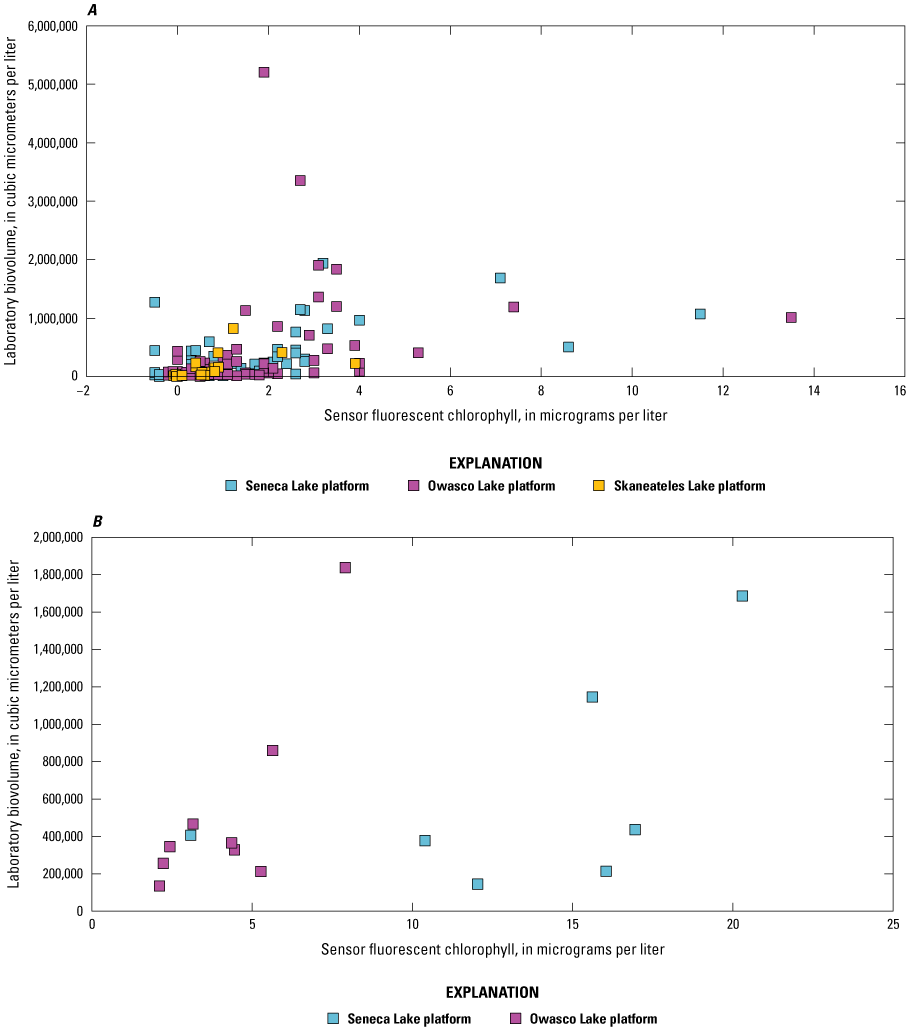
Scatterplots showing sensor-measured chlorophyll concentrations related to laboratory-measured total phytoplankton biovolume. A, EXO2 Total Algae-Phycocyanin sensor; B, PhytoFind phytoplankton classification tool.
The overall monotonic and linear relations between chlorophyll concentration measurements from the multichannel fluorometer and laboratory-measured total phytoplankton biovolume were not statistically significant (ρ=0.39, p-value=0.13; n=16); (r=0.42, p-value=0.09, R2=0.18) (fig. 19). Although not statistically significant, the multichannel fluorometer explained 18 percent of the variance in total phytoplankton biovolume values, similar to the amount of variance explained by the dual-channel fluorometer. As observed for chlorophyll, the relation between sensor- and laboratory-measures of phytoplankton biovolume in Seneca and Owasco Lakes were different. The multichannel fluorometer explained more than 2 times the variance in total phytoplankton biovolume at Owasco Lake (R2=0.67) than in Seneca Lake (R2=0.29). As explained above, the difference between lakes is likely attributed to differences in phytoplankton community composition, such as generally larger abundances of phytoplankton in the green/brown and mixed target groups of the sensor at Seneca Lake and more samples dominated by cyanobacteria at Owasco Lake (Johnston and others, 2022; fig. 17; table 7). As noted for the sensor- and laboratory-measured chlorophyll-a relations, more data are needed to establish additional confidence in the relations for both the dual-channel and multichannel fluorometers.
Cyanobacterial biovolume.—Although not a direct comparison, the cyanobacterial pigment phycocyanin can be used as a proxy for cyanobacterial biomass (Foster and others, 2022). Phycocyanin fluorescence measured by the dual-channel and multichannel fluorometers were compared to laboratory-measured cyanobacterial biovolume. The monotonic and linear relations between phycocyanin concentration measurements from the dual-channel fluorometer and laboratory-measured cyanobacterial biovolume were not statistically significant (ρ=0.10, p-value=0.27; r=0.04, p-value=0.34; n=134). The relations did not vary meaningfully by lake, which is different from the relations between the dual-channel fluorometer and chlorophyll-a and total phytoplankton biovolume. Phycocyanin concentration measurements from the dual-channel fluorometer ranged between −0.60 and 0.85 µg/L (reported values less than 0 are possible from the EXO2 Total Algae-Phycocyanin sensor), whereas laboratory-measured cyanobacterial biovolume ranged many orders of magnitude, from 145 and 1,636,996 µm3/mL (fig. 20). Based on these results, the phycocyanin concentration measurements from the dual-channel fluorometer may not be sensitive to changes in phycocyanin-containing phytoplankton (such as, cyanobacteria) across the range encountered in the study lakes, which may explain why differences in relations among lakes were not observed.
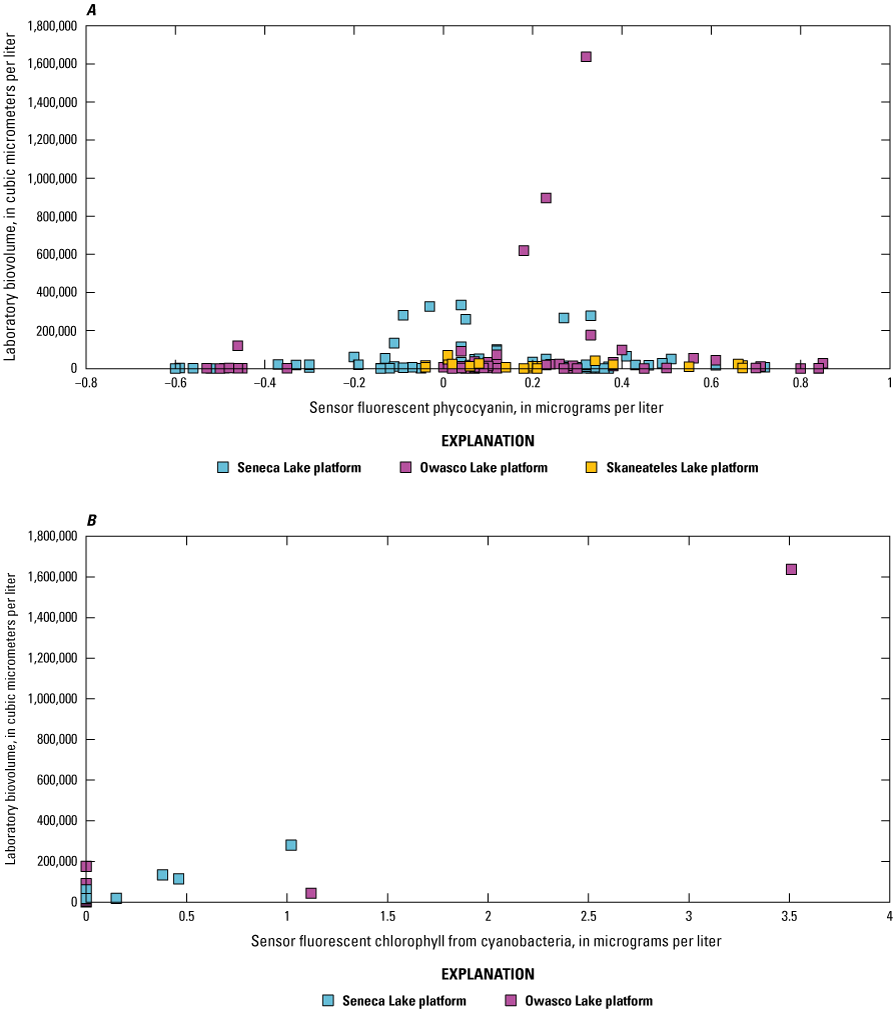
Scatterplots showing A, phycocyanin concentrations measured by the EXO Total Algae-Phycocyanin sensor related to laboratory-measured cyanobacterial biovolume; B, chlorophyll concentration contributed by cyanobacteria measured by the PhytoFind phytoplankton classification tool related to laboratory-measured cyanobacterial biovolume.
The overall monotonic relation between measurements of chlorophyll concentration contributed by cyanobacteria from the multichannel fluorometer and laboratory-measured cyanobacterial biovolume was moderate (ρ=0.58, p-value<0.05; n=16), but 88 percent of the variation in cyanobacterial biovolume was explained by the sensor (r=0.94, p-value<0.05, R2=0.88) (fig. 20). The amount of variance explained by the sensor is strongly influenced by 6 of the 16 observations in which the sensor measured chlorophyll concentration contributions by cyanobacteria. Ten of the 16 observations were zero, in contrast to the laboratory measurements of cyanobacterial biovolume, which ranged from 1,018 to 175,571 µm3/mL in those same 10 observations. The multichannel fluorometers did make non-zero measurements in conditions where cyanobacteria were dominant; one at each lake; Aphanocapsa (58 percent of total phytoplankton biovolume) at Seneca Lake, and Microcystis (88 percent of total phytoplankton biovolume) at Owasco Lake.
Identification of Important Variables
Variables from unique sensors (that is, when measurements in different units from the same individual sensor were highly correlated, only the variable with the strongest correlation is discussed herein) indicating the strongest monotonic relation were similar between laboratory-measured chlorophyll-a and total phytoplankton biovolume (table 8; table 9). Water temperature (collectively measured through to the full depth of the lakes by the multiparameter sonde and the combined water-temperature/illumination sensor) had the strongest monotonic relation for chlorophyll-a, total phytoplankton biovolume, and cyanobacterial biovolume (table 8; table 9; table 10). This is attributed to the effects of water temperature on the rate of photosynthesis in phytoplankton—warmer water generally leads to higher rates of photosynthesis and growth. As such, seasonal maxima in phytoplankton biomass are often observed during the warmest months of the year (fig. 17; Raven and Geider, 1988; Falkowski and Raven, 1997).
Linear associations varied depending on phytoplankton biomass indicator; however, one or more measurements from the multichannel fluorometer were the most strongly correlated variable for chlorophyll-a, total phytoplankton biovolume, and cyanobacterial biovolume. Although the range and number of observations is small, the instrument capability of detecting and measuring fluorescence signals from multiple phytoplankton pigments may be useful in improving estimations of phytoplankton biomass over the use of single-pigment instruments. Water temperature also had a strong linear association with chlorophyll-a and cyanobacterial biovolume but not total phytoplankton biovolume. The differences in linear relationships may be attributed to the phytoplankton biovolume peak occurring in the spring when the water is cooler, as opposed to the cyanobacterial peak, which typically occurs in the warmer summer months (fig. 17). For cyanobacterial biovolume, sensor-measured turbidity was also among the most strongly correlated variables (table 10). This relation is likely attributed to the very clear conditions in these lake systems and the cyanobacterial contribution to the total suspended particles in the water column. Strong relations between cyanobacteria and sensor-measured turbidity have been noted in New York lakes (Prestigiacomo and others, 2023) and elsewhere (Melendez-Pastor and others, 2019; Rome and others, 2021), including lakes with cyanobacterial communities dominated by Aphanocapsa (Magalhães and others, 2019). Some sensor measurements were collected at multiple depths throughout the water column, whereas others were collected at, near, or above the water surface; correlation analyses using only data from near the water surface did not substantially change the variables most strongly correlated with chlorophyll-a, total phytoplankton biovolume, or cyanobacterial biovolume.
Table 8.
Correlation analysis for sensor-measured parameters and laboratory-measured chlorophyll-a; data collected from all lakes and depths.[Highest three correlated parameters from unique sensors are in bold (and noted with footnote b) for each correlation. Chl, chlorophyll; fDOM, fluorescent dissolved organic matter; PAR, photosynthetically active radiation; PC, phycocyanin; QSE, micrograms per liter as quinine sulfate equivalent; RFU, relative fluorescence units; Spec.Cond., specific conductance; Temp., temperature; µg/L, micrograms per liter.]
Table 9.
Correlation analysis for sensor-measured parameters and laboratory-measured total phytoplankton biovolume; data collected from all lakes and depths.[Highest three correlated parameters from unique sensors are in bold for each correlation. Chl, chlorophyll; fDOM, fluorescent dissolved organic matter; PAR, photosynthetically active radiation; PC, phycocyanin; QSE, micrograms per liter as quinine sulfate equivalent; RFU, relative fluorescence units; Spec.Cond., specific conductance; Temp., temperature; µg/L, micrograms per liter.]
Table 10.
Correlation analysis for sensor-measured parameters and laboratory-measured cyanobacterial biovolume; data collected from all lakes and depths.[Highest three correlated parameters are in bold for each correlation. Chl, chlorophyll; fDOM, fluorescent dissolved organic matter; PAR, photosynthetically active radiation; PC, phycocyanin; QSE, micrograms per liter as quinine sulfate equivalent; RFU, relative fluorescence units; Spec.Cond., specific conductance; Temp., temperature; µg/L, micrograms per liter.]
Stepwise regression analysis.—Stepwise regression analysis for laboratory-measured chlorophyll-a indicated the inclusion of pH (p-value=<0.001) and relative fluorescence of chlorophyll (RFU) measured by the dual-channel fluorometer (p-value=<0.001) as independent variables. The resulting model was able to explain 49 percent of the variance in laboratory-measured chlorophyll-a (R2=0.49; n=65) (fig. 21). The multivariate model, which incorporated pH and relative chlorophyll fluorescence, explained about the same amount of variance as the single-variable model using the chlorophyll concentration variable from the dual-channel fluorometer (R2=0.50, n=134). Additionally, the multivariate model considering only pH, explained six percent more variance than the single-variable model using total chlorophyll concentration measurements from the multichannel fluorometer (R2=0.43, n=16). Since some sensors were only deployed at the near-surface location, an analysis of only data collected near the water surface was performed. The resulting model included relative fluorescence of chlorophyll (RFU) measured by the dual-channel fluorometer (p-value=<0.001), dissolved oxygen (p-value=<0.001), turbidity (p-value=0.001), illumination measured by the combined sensor (p-value=<0.001), and PAR (p-value=0.005), and explained 40 percent more of the variance in laboratory-measured chlorophyll-a (R2=0.89; n=26) than the overall model. However, the number of variables included may result in overfitting and poor performance with new data (Cawley and Talbot, 2010). When the two variables with a p-value greater than or equal to 0.001 were removed (PAR and turbidity), the resulting model explained about 10 percent less of the variance in laboratory-measured chlorophyll-a than the overall model. The variables that explained the most difference in laboratory-measured chlorophyll-a concentrations varied by lake. The Seneca Lake model included relative fluorescence of chlorophyll (RFU) measured by the dual-channel fluorometer (p-value=<0.001); this model explained 8 percent more variance than the overall model (fig. 21). The Owasco Lake model included fDOM measured by the multiparameter sonde (p-value=<0.001) and turbidity (p-value=0.008); this model explained 20 percent more variance than the overall model (fig. 21). Many studies have found nutrient measurements (many as laboratory measurements) to have the most explanatory power in chlorophyll-a models (Jones and Bachmann, 1978; Phillips and others, 2008; Jones and others, 2020; Yuan and Jones, 2020; Huang and others, 2022). In our study lakes, sensor-measured nitrate and orthophosphate were not significantly correlated with discrete observations of laboratory-measured chlorophyll-a. Sensors only measured bioavailable forms of nutrients, rather than total nutrients, which may explain the lack of relation; bioavailable nutrients may cycle very rapidly in healthy phytoplankton and microbial communities, which may account for the apparent lack of association.
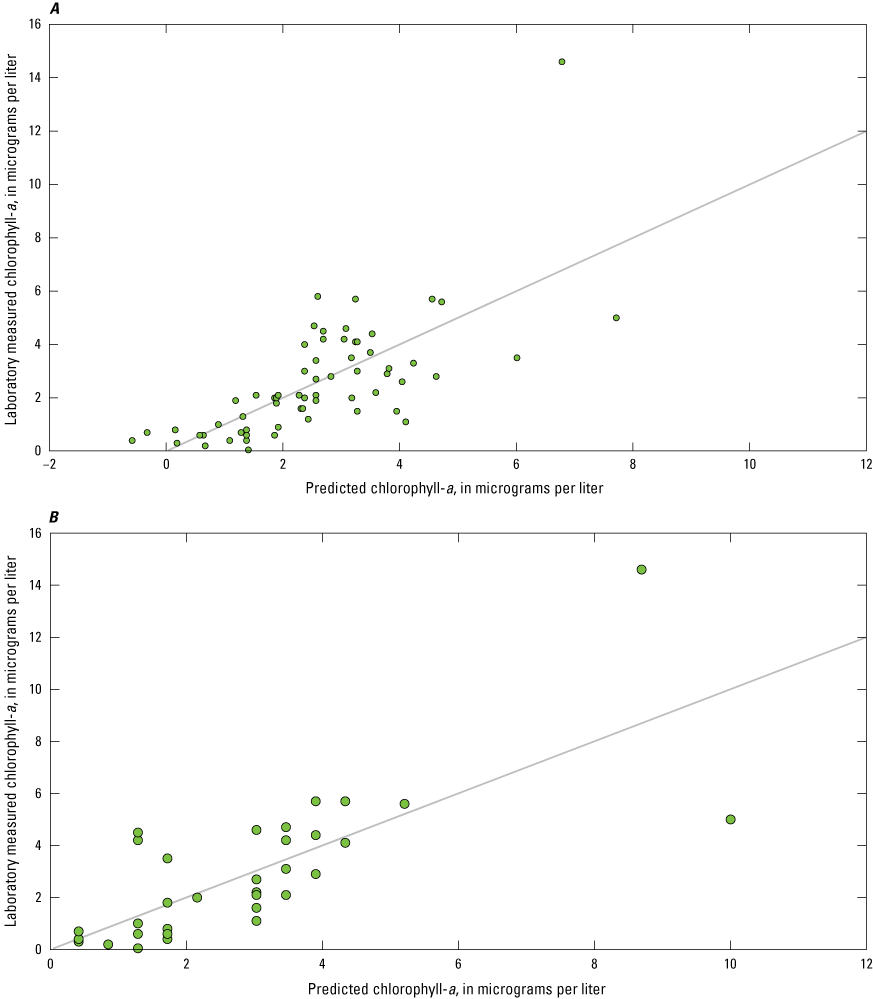
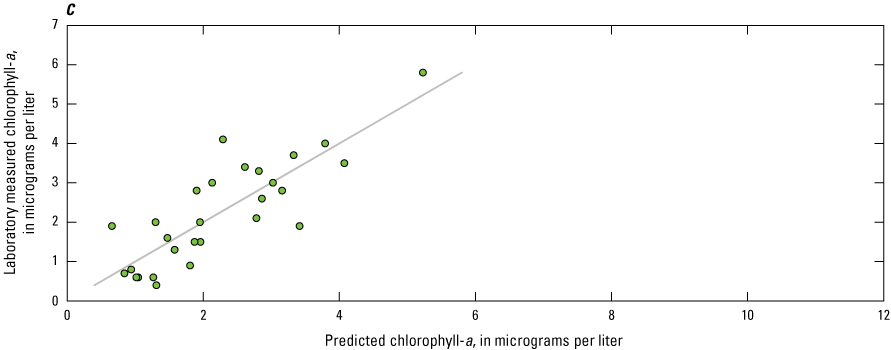
Scatterplots showing predicted chlorophyll-a concentrations by stepwise regression models related to laboratory-measured chlorophyll-a concentrations. A, All lake data; B, Seneca Lake data only; C, Owasco Lake data only.
Stepwise regression analysis for laboratory-measured total phytoplankton biovolume indicated the inclusion of relative fluorescence of chlorophyll (p-value=<0.001), illumination measured by the combined water temperature/illumination sensor (p-value = <0.001), and wind speed (p-value=0.04) as independent variables. The overall model explained 41 percent of the variance in laboratory-measured total phytoplankton biovolume (R2=0.41; n=66) (fig. 22). The multivariate model, which incorporated relative fluorescence of chlorophyll, illumination, and wind speed, explained about 25 percent more variance than the single-variable models using the chlorophyll concentration measurements from the dual channel fluorometer (R2=0.14, n=136) and the total chlorophyll concentration measurements from the multichannel fluorometer (R2=0.18, n=16). When only data from sensors deployed near the top of the water column were included in the analysis, the relative fluorescence of chlorophyll measured by the dual-channel fluorometer (p-value=0.002) and illumination measured by the combined water temperature/illumination sensor (p-value=0.03) were the only variables that entered into the model. The near-surface model explained two percent less of the variance in laboratory-measured total phytoplankton biovolume (R2=0.39; n=28) than the overall model. The variables that explained the most difference in laboratory-measured phytoplankton biovolume concentrations varied by lake. The Seneca Lake model included relative fluorescence of chlorophyll measured by the dual-channel fluorometer (p-value=<0.001); this model explained 6 percent more variance than the overall model (fig. 22). The resulting model for Owasco Lake included relative fluorescence of chlorophyll measured by the dual-channel fluorometer (p-value=0.01) and illumination measured by the combined water temperature/illumination sensor (p-value=<0.001); this model explained about 10 percent more variance than the overall model (fig. 22). Similar to chlorophyll-a., sensor-measured nitrate and orthophosphate were not significantly correlated with laboratory-measured total phytoplankton biovolume.
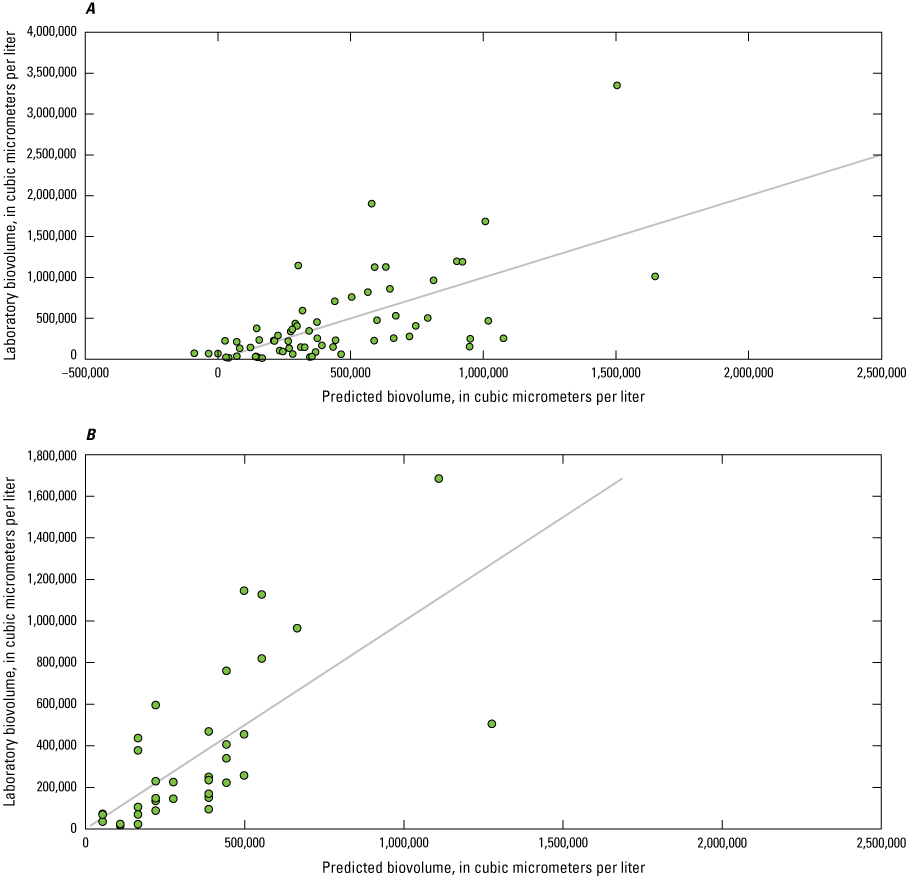
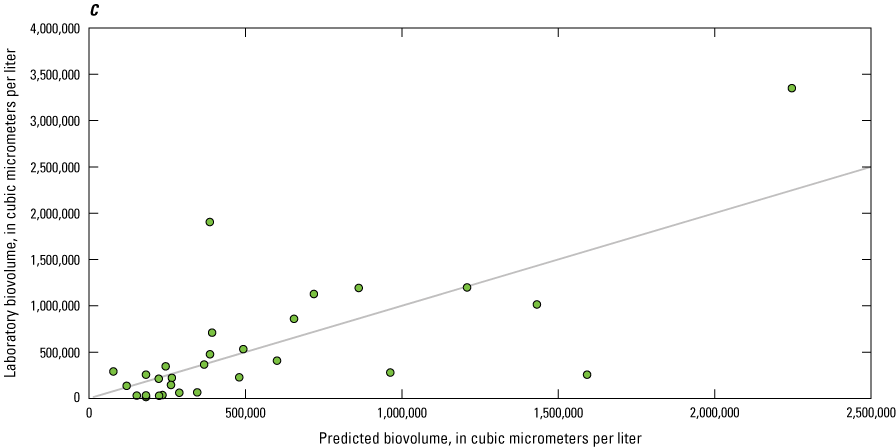
Scatterplots showing predicted total phytoplankton biovolume by stepwise regression models related to laboratory-measured total phytoplankton biovolume. A, All lake data; B, Seneca Lake data only; C, Owasco Lake data only.
Stepwise regression analysis for laboratory-measured cyanobacterial biovolume indicated the inclusion of turbidity (p-value=<0.001), relative fluorescence of fDOM (p-value=0.04), wind direction (p-value = 0.01) and precipitation (p-value=0.01) as independent variables. The overall model explained 40 percent of the variance in laboratory-measured cyanobacterial biovolume (R2=0.40; n=66) (fig. 23). The overall model explained about 40 percent more variance than the model based on phycocyanin concentration measurements from the dual-channel fluorometer (R2=<0.01; n=136), and 48 percent less variance than the model based on chlorophyll concentration measurements from the multichannel fluorometer (R2=0.88; n=16). When only data from sensors deployed near the top of the water column were included in the analysis, turbidity was the only variable that entered the model (p-value=0.002). However, the model explained nine percent less of the variance in cyanobacterial biovolume (R2=0.31; n=28) than the overall model. The variables that explained the most difference in laboratory-measured phytoplankton biovolume concentrations varied by lake. The Seneca Lake model included water temperature measured by the multiparameter sondes (p-value=0.002); this model explained 15 percent less variance than the overall model (fig. 23). The Owasco Lake model included turbidity (p-value=0.002) and wind direction (p-value=0.04); this model explained 5 percent more variance than the overall model (fig. 23).
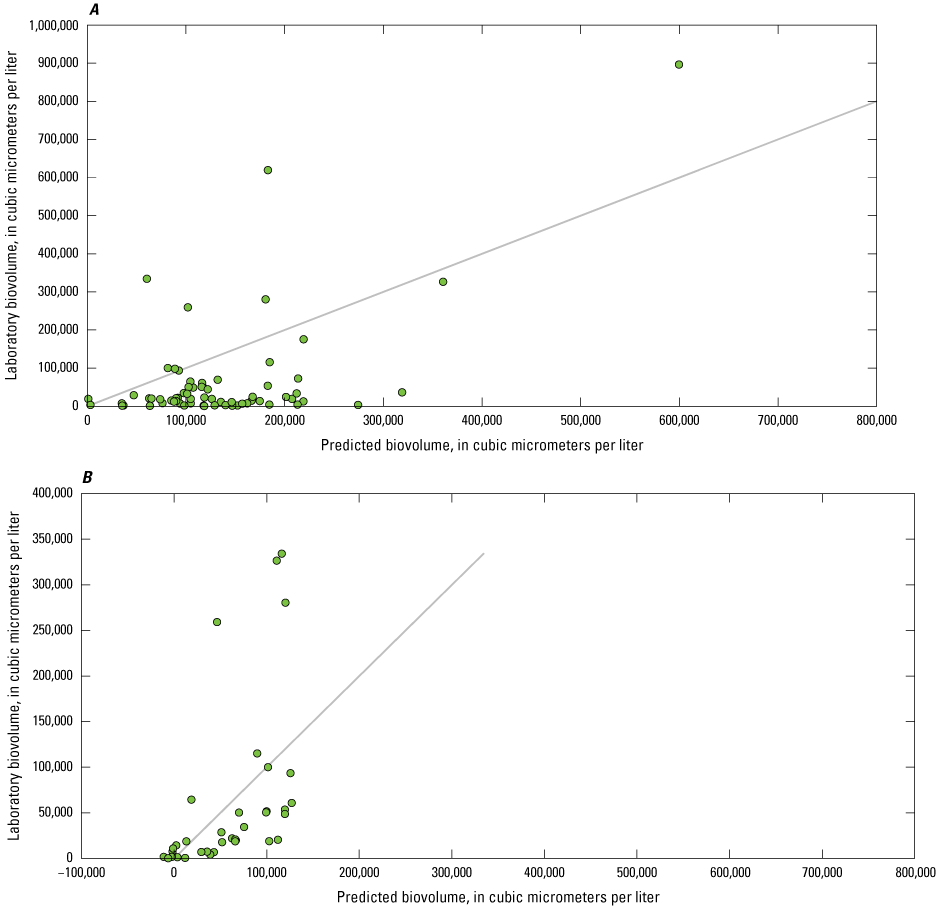
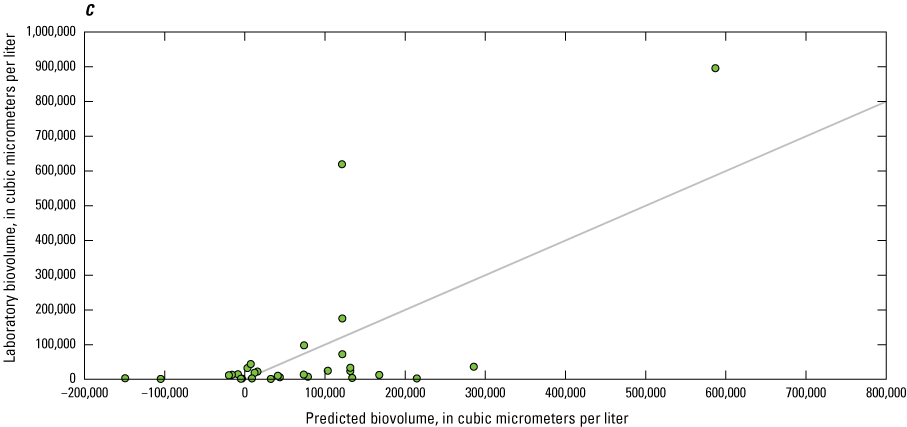
Scatterplots showing predicted cyanobacterial biovolume by stepwise regression models related to laboratory-measured cyanobacterial biovolume. A, All lake data; B, Seneca Lake data only; C, Owasco Lake data only.
Many studies have found turbidity to be highly correlated with measures of cyanobacterial biovolume or abundance; however, it is not among the most commonly used variables in predictive models (Rousso and others, 2020). As observed for chlorophyll-a and phytoplankton biovolume, nutrient measurements were not statistically correlated with cyanobacterial biovolume, likely for many of the same reasons as described for chlorophyll-a. Similar to chlorophyll, total nutrient measurements tend to have a substantial amount of explanatory power in cyanobacteria models. When included with one or more other variables (such as, water temperature and secchi disk depth), more than 50 percent of the variation in cyanobacterial biovolume or abundance is typically explained (Rousso and others, 2020). Many of these models are based on discrete nutrient or other analyte measurements, rather than sensor-based measurements. While models with discrete measurements may have more explanatory power, estimates of cyanobacterial abundance or biovolume cannot be estimated in near-real time—an advantage afforded by sensors.
Overall, the explanatory power of basic regression models for laboratory-measured chlorophyll-a, total phytoplankton biovolume and cyanobacterial biovolume as described in this report were weak. Models derived from data from all lakes explained less than half of the variance in laboratory-measured values. For chlorophyll-a, the overall multivariate model did not explain any more variance than single-variable models based on fluorescence measurements. The overall multivariate model for total phytoplankton biovolume did have substantially more explanatory power (greater than 20 percent more variance explained) than single-variable models based on fluorescence measurements. For cyanobacterial biovolume, the overall multivariate model had much stronger (about 40 percent stronger) explanatory power than phycocyanin measurements from the dual-channel fluorometer. In fact, the analysis indicated that turbidity was a much more significant indicator of the variability in cyanobacterial biovolume than phycocyanin measurements from the dual-channel fluorometer, by several orders of magnitude. Measurements of chlorophyll concentration contributed from cyanobacteria from the multichannel fluorometer had strong explanatory power based on results from this study; however, the number of observations and range of conditions encountered were small, and results should be considered preliminary.
Limiting analyses to data collected from near the water surface only and lake-specific analyses did not indicate substantial differences (plus or minus about 20 percent) in explanatory power over the models developed with the overall dataset, suggesting regional models for the Finger Lakes may be useful. However, high explanatory power (that is, relatively high R2) does not necessarily represent a high level of model accuracy (Cawley and Talbot, 2010; Rousso and others, 2020), and additional research is needed to develop the best possible models to estimate chlorophyll-a, total phytoplankton biovolume, and cyanobacterial biovolume in the Finger Lakes. In addition, CyanoHABs generally did not occur at the open-water monitoring locations within Seneca, Owasco, and Skaneateles Lakes during this study, limiting the range of conditions encompassed by this study. Models developed for predicting CyanoHABs elsewhere typically have ranges in chlorophyll-a concentrations or measures of the cyanobacterial community that are orders of magnitude greater than those observed during this study. For example, the chlorophyll-a concentrations observed in this study never exceeded 15 µg/L, compared to other studies worldwide in which ranges can exceed 100,000 µg/L (Rousso and others, 2020; Chorus and Welker, 2021). Data collected over a wider range of conditions that represent a larger number of CyanoHAB events are required to better define the relations between sensor- and laboratory-measured data, and to develop more complex data-driven models for predicting CyanoHABs (such as time-lagged or artificial neural networks), which may provide greater insights than traditional linear modeling approaches (Rousso and others, 2020).
Informing Future Monitoring and Research Approaches
Sensor data can provide valuable insights on physiochemical and biological conditions affecting natural waters. From near real-time information to the facilitation of high-resolution representation of trends in multiple timescales through continuous time-series, sensor data can overcome the shortfalls of traditional discrete sampling, which can miss ephemeral events. However, such sensors can be costly to obtain, operate and maintain, and may require diverse technical expertise to verify sensor function, identify outlier data from valid observations, and apply corrections for interferences and (or) calibration drift. While many in-place and external environmental sensors can produce measurements equivalent to (or representative of) laboratory measurements, those specifically targeting phytoplankton biomass or other measures associated with CyanoHABs commonly demonstrate variability because of the many interferences that can affectt their measurements (Choo and others, 2018; Foster and others, 2022).
Although chlorophyll has become the measurement of choice for many studies and monitoring programs as a proxy for phytoplankton biomass, community composition and abundance or biovolume—particularly regarding cyanobacteria—remain an important measurement for researchers and managers in light of specific concerns about taste-and-odor compounds, cyanotoxins, and (or) changing population dynamics (Canfield and others, 2019; Foster and others, 2019; Linz and others, 2023). Based on this and other studies, chlorophyll is generally not a good variable for modeling cyanobacteria abundance (Bowling and others, 2016; Johnston and others, 2022). Recent studies have demonstrated improvements in sensor-based characterizations of cyanobacteria dynamics, in addition to chlorophyll concentrations, with the use of multichannel fluorescence sensors over the more widely used single- and dual-channel models (Chaffin and others, 2018; Johnston and others, 2022). Furthermore, additional improvements were observed when custom calibrations and (or) correction models were employed (Kring and others, 2014; Prestigiacomo and others, 2022).
Remote sensing techniques have also demonstrated efficacy and become increasingly popular as a strategy to expand the spatial range of CyanoHABs study from in-place sensor observations (Rousso and others, 2020). However, these strategies also have limitations, such as interference from clouds and weather, satellite movement, processing and storage of data, and limit of vision to the surface layer (Bosse and others, 2019). The limit of vision to the surface layer may be the most important, because not all CyanoHABs are present at or near the water surface; temperature-induced changes in stratification and seasonal mixing can result in downward transport of cyanobacteria and associated toxins into deeper waters (Hamre and others, 2018; Reinl and others, 2021). In-place sensors, like the ones deployed in this study, can assist in characterizing the spatio-temporal variability in the vertical structure of cyanobacteria that remote sensing may miss (Bosse and others, 2019).
With all these observing system technologies available, establishing relations between those data and laboratory measurements to determine real-time or future measures of CyanoHABs may be challenging, especially those comparable across locations and conditions. Artificial intelligence and machine learning techniques have the potential to improve estimations and predictions of phytoplankton biomass and CyanoHABs based on their ability to handle large and complex datasets, identify non-linear relationships between variables, and adapt to changing environmental conditions (Ye and others; 2014; Rousso and others, 2020). Machine learning algorithms can identify patterns in the data and learn over time (artificial neural networks), enabling accurate predictions and detection of subtle changes in the environment. Additionally, incorporating multiple data sources (such as satellite imagery, in-place data, weather data, and citizen science observations) is more feasible, allowing for the potential identification of a more focused subset of key variables and types of data collection that could achieve study or regulatory objectives at reduced cost (Cruz and others, 2021; Cao and others, 2022). With the limitations of sensor data and remote sensing well documented the incorporation of artificial intelligence and machine learning techniques into laboratory-based studies or monitoring programs may improve our understanding of the dynamics of phytoplankton biomass and CyanoHABs, enable more timely and effective management of these important phenomena, and push forward to the next-generation of CyanoHABs science.
Summary
Harmful algal blooms, particularly cyanobacterial harmful algal blooms (CyanoHABs), are an increasing problem globally, affecting drinking water supplies and recreational resources through the production of a variety of toxins and taste- and odor-causing compounds. Because early detection and preventative management have become increasingly important, many State and governmental agencies have implemented monitoring strategies to better understand factors related to the development and decline of CyanoHABs.
In New York State, the U.S. Geological Survey (USGS), in collaboration with the New York State Department of Environmental Conservation, started the CyanoHAB advanced monitoring pilot study to monitor and understand CyanoHABs in the Finger Lakes region. The Finger Lakes provide important recreational, drinking water, and economic resources for New York State, and have reported CyanoHABs in increased frequency during recent decades (since the 2000’s). The advanced monitoring pilot study consisted of a series of studies, done between 2018 and 2020, to assess a range of traditional and innovative monitoring approaches and technologies with the goal of informing future monitoring strategies and improving the understanding of CyanoHABs in New York State.
The USGS deployed three monitoring-station platforms in open water at Seneca Lake, Owasco Lake, and Skaneateles Lake in 2019, and in Seneca Lake and Owasco Lake in 2020. The platforms were designed to support a large suite of high-frequency sensors and allow for evaluating the sensors’ ability to make representative measurements of dissolved organic matter, nutrients, and algal pigments (as indicators of phytoplankton biomass). Other, more-routine measurements (water temperature, specific conductance, pH, dissolved oxygen, turbidity, and weather and light) were collected to help interpret the more-novel sensor results. The leveraging of information from high-frequency sensor data can provide high-resolution information about physiochemical and biological conditions and trends that traditional discrete grab sampling may not reliably capture.
The monitoring-station platforms were constructed out of aluminum pontoon utility service barges. Instruments were deployed through to the full depth of the water column (multiparameter sondes at near-surface, mid-, and near-bottom depths; and temperature/illumination sensors at 1-meter increment depths) to capture physiochemical and biological changes throughout the water column. The orthophosphate, phytoplankton classification, and nitrate sensors were deployed in wells at the open end of the platforms; the weather and light sensors were affixed to the platforms above the water surface.
Many sensors were operated and analyzed in accordance with USGS protocols and guidance; however, some modifications were required for orthophosphate, phytoplankton classification (multichannel fluorometer), combined water temperature and illumination, photosynthetically active radiation (PAR), and weather sensors that either incorporated emerging technologies or where standard USGS protocols and guidance do not exist or are not applicable. Biweekly, multidepth discrete samples were also collected and analyzed for nutrients, dissolved organic carbon (DOC), chlorophyll-a, total phytoplankton biovolume, and cyanobacterial biovolume.
All sensor- and laboratory-measured data were compiled using R statistical software because the size and breadth of the total dataset collected for this study made it necessary to use a tool with more power and flexibility than traditional spreadsheet software. Paired sensor and laboratory measurements were evaluated through correlation analysis to reveal monotonic (Spearman’s rank correlation coefficient [ρ]) and linear (Pearson’s linear correlation coefficient [r]) relationships. Correlations were statistically significant when probability values (p-values) were less than or equal to 0.05. Relations between sensor readings and laboratory measurements collected through to the depth of the water columns did not vary substantially, so all data collected at multiple depths were combined, which facilitated a larger number and range of observations. Stepwise regression analyses were used to identify model(s) that explained the most variance in laboratory measurements (indicated by the coefficient of determination [R2]), because many studies have used regression models to improve estimations of CyanoHABs.
Overall, the sensors used to collect routine parameters performed well, demonstrating relative stability in accordance with standard calibration criteria. However, malfunction of the daisy chaining feature of the multiparameter sonde did cause loss of data in 2019. Two nitrate sensors were used and demonstrated relative stability in accordance with standard calibration criteria. However, the s::can nitro::lyser II had more issues than the other nitrate sensor, specifically the external controller malfunctioned. The Nitratax plus sc performed well during its use in the study lakes.
The orthophosphate sensor was complex to operate and maintain because of the wet-chemistry required, and determining sensor function was difficult; nearly all sensor measurements were below the minimum detection limit. Loss of data was primarily attributed to damage (typically as pinching) of the waste line of the sensor, which required a site visit to remedy—adding to the already increased maintenance time required. The multichannel fluorometer was also complex to operate and can require unique procedures to acquire integrated, site-specific corrections. Instrument stability was difficult to determine on the basis of its use of multiple fluorescence sensor measurements to calculate the reported values. One instrument indicated relative stability on the basis of total chlorophyll measurements alone using solid reference standards; however, the other indicated potential drift of 27.8 percent during the 4-month deployment based on the same method. Additionally, two issues resulted in loss of data: (1) malfunction of the anti-fouling wiper parking over the sensors, and (2) outlier values generated by the florescent dissolved organic matter (fDOM) sensor, which affected all reported measurements. R was used to identify and remove outliers, defined as two times the standard deviation of adjacent values. Removal of the outliers resulted in the loss of about 2 percent of the total record at Seneca Lake and Owasco Lake. The combined water temperature and illumination sensors performed well; however, drift is more frequently observed in illumination measurements than water temperature measurements. Lack of integration into the datalogger and telemetry equipment made identifying issues less timely, because a site visit was required to identify problems. The PAR and weather sensors performed well, and were only affected by global power issues on the monitoring-station platforms.
A total of 147 discrete samples and 15 replicates (that is, a single replicate from each lake and depth for each year sampled, or about 10 percent of total samples) were collected and analyzed. All analytes were associated with median relative percent difference (RPD) values of less than 10 percent. No RPD values for any analyte were greater than 20 percent for any replicate pair except chlorophyll-a, which had 3 of 13 replicate pairs associated with RPD values ranging from 23.7 to 29.5 percent. Calculating RPD for orthophosphate replicate pairs was limited to a single pair because concentrations of all other environmental samples and paired replicates were less than the reporting limit of 0.008 milligram per liter as phosphorus. The absolute value logarithmic differences (AVLDs) for phytoplankton across all replicate pairs ranged from 0.14 to 0.86 (median AVLD=0.25, n=15 replicate pairs) for total biovolume and 0.11 to 0.61 (median AVLD=0.26, n=15 replicate pairs) for cyanobacterial biovolume, respectively. No result pairs for either total or cyanobacterial biovolume had AVLDs greater than 1 and were considered of acceptable quality for the purposes of this report.
Each platform deployed in the three study lakes held 40 separate instruments, generated over 200 time series, and collected greater than 10,000 data points per day, which posed several challenges and resulted in many lessons learned. Issues stemming from the platform design included large power requirements, effects from excessive heat in the data enclosure, galvanic corrosion from use of dissimilar metals, and wave action. These issues were mitigated by additional solar panels, a heat shield within the data enclosure, sacrificial anodes, and anchor lines with good elasticity. Polyvinyl chloride wells held the sensors more securely in wave action than a suspended metal cage and provided easier access. However, the larger surface area for fouling increased the amount of cleaning required. Daisy chaining the multiparameter sondes together allowed for shorter cable lengths and reduced tangling during maintenance; however, power issues resulted in malfunctions that were mitigated by using separate cables. The external controller of the nitro::lyser II nitrate sensor frequently malfunctioned because of high temperatures and jarring movement from wave action. Nitrate sensors are generally sensitive to ambient temperature and have a substantial power requirement, so appropriate model selection is important. For the orthophosphate sensor, the instrument cable and waste line were susceptible to physical damage, such as pinching and (or) abrasion, and was the primary cause of lost data. Users of this instrument could consider running the cable and waste line through a flexible conduit to protect them. Increased anti-fouling measures and frequency of site visits improved the quality and quantity of the sensor data, taking into account the unexpected heavy fouling from dreissenid mussels.
Correlation analyses between sensor measurements and related laboratory measurements were performed collectively and by lake. The overall monotonic relation between sensor-measured and laboratory-measured concentrations of nitrate was strong (ρ=0.87, p-value less than [<] 0.05; n=24), and 78 percent of the variation in the values was explained by linear regression (r=0.88, p-value<0.05, R2=0.78). In general, nitrate values were underestimated relative to laboratory-measurements at Seneca Lake, and 64 percent of the variation in values was explained by linear regression. Nitrate values were more consistent with laboratory-measurements at Owasco Lake, and 88 percent of the variation in values was explained by linear regression. Results from this study not only indicate that nitrate sensors performed well in the study lakes but also suggest that the relation between sensor- and laboratory- measured nitrate values may vary among lakes. The relation between sensor- and laboratory-measured concentrations of orthophosphate (in milligrams per liter as phosphorus) could not be evaluated given that orthophosphate was rarely detected by sensor measurements or laboratory analyses in any of the three lakes during the study. Only 4 percent (6 out of 147; 4 from Seneca Lake and 2 from Owasco Lake) of discrete-sample measurements and <0.1 percent (11 out of 1,454; Owasco Lake in October 2020) of sensor measurements were above the method detection limits. Results from this study indicate the orthophosphate sensor did not experience the challenges reported in other types of environments in these low-turbidity systems; however, concentrations were too low to conduct a meaningful comparison of sensor- and laboratory-measured concentrations. The relation between raw, sensor-measured fDOM (in micrograms per liter as quinine sulfate equivalent) and laboratory-measured concentrations of DOC (in milligrams per liter) was difficult to determine in this study, owing to the limited range of DOC concentrations observed. The monotonic relation between fDOM and DOC was statistically significant at Seneca Lake (ρ=−0.31, p-value<0.05; n=57) and Owasco Lake (ρ=−0.60, p-value<0.05; n=55) but was not statistically significant at Skaneateles Lake (ρ=−0.27, p-value=0.35; n=14). The linear relation between fDOM and DOC was marginally significant at Owasco Lake (r=0.27, p-value=0.04, R2=0.08). Although the linear association in Owasco Lake was statistically significant, only 8 percent of the variation in the relation between fDOM and DOC was explained. The linear relation at Seneca and Skaneateles Lakes was not significant.
Correlations, as a metric for sensor performance for phytoplankton fluorometers, are confounded by the lack of accuracy specifications and the variable relationship between laboratory measures themselves. In this study, the monotonic relation between laboratory measurements of chlorophyll-a and total phytoplankton biovolume was strong (ρ=0.80, p-value<0.05; n=147); however, only 25 percent of the variation in values was explained by linear regression (r=0.50, p-value<0.05, R2=0.25). The range observed in these measures was particularly narrow and indicates a lack of substantial phytoplankton accumulation at the open-water monitoring locations for all three study lakes during the project duration, although nearshore CyanoHABs were reported during that time at Seneca, Owasco, and Skaneateles Lakes. The relations differed between lakes; linear regression explained 52 percent of the variance in the values at Seneca Lake, 49 percent at Skaneateles Lake, and 25 percent at Owasco Lake. These differences may be attributed to phytoplankton community composition and (or) dominance, which tended to be diatom genera (41 of 67 samples). Cyanobacteria was dominant in 11 samples and included Aphanocapsa, Microcystis, and Pseudanabaena. Overall, the lack of CyanoHABs observed in this study further limited the ability to fully assess the performance of sensor measurements for cyanobacteria indicators. The amount of variance in laboratory-measured chlorophyll explained by sensor measurements differed in varying degrees between the lakes and by sensor. Both the dual-channel and multichannel fluorometers demonstrated the ability to explain about 45 percent of the variance in laboratory-measured chlorophyll-a by linear regression, and about 15 percent of the variation in laboratory total phytoplankton biovolume, collectively. However, the relationships differed across the study lakes individually. For cyanobacterial biovolume, the phycocyanin measurements from the dual-channel fluorometer were insignificant and did not differ meaningfully by lake. These results indicate that the dual-channel fluorometer may not be sensitive to changes in cyanobacteria. The multichannel fluorometer results were mixed, explaining 88 percent of the variation in cyanobacterial biovolume by linear regression; however, 10 of the 16 observations were zero, in contrast to the laboratory measurements of cyanobacterial biovolume, which ranged from 1,018 to 175,571 cubic micrometers per milliliter in those same 10 observations. Even though the sensor performance indicated by these results is possible, the sample size and range are relatively small, and the development of site-specific relationships may improve the overall amount of variance explained by the sensor(s).
Correlation analyses performed with all the parameters collected indicated water temperature (collectively measured through to the full depth of the lakes by the multiparameter sonde and the combined water temperature/illumination sensor) was among the highest related monotonically for all laboratory measurements (chlorophyll-a, total phytoplankton biovolume, and cyanobacterial biovolume). Linear relations differed overall; however, one or more measurements from the multichannel fluorometer were the highest for chlorophyll-a, total phytoplankton biovolume, and cyanobacterial biovolume. Although the range and number of observations is small, the use of signals from multiple phytoplankton pigments by the instrument may be useful in improving estimations of phytoplankton biomass and abundance over the use of single sensor measurements. Water temperature was highly correlated linearly as well for chlorophyll-a and cyanobacterial biovolume, however not for total phytoplankton biovolume. Also, for cyanobacteria, sensor-measured turbidity was among the highest correlated linearly, attributed to the clear conditions in these systems, whereas cyanobacteria contribute substantially to the total suspended particles in the water column. Analyses of sensor measurements from the top position only did not indicate substantial changes to the most highly correlated variables using all the data collectively.
Stepwise regression analysis was used to identify which of all the parameters could be used in model(s) that explained the most variance in the laboratory measures of phytoplankton biomass compared to linear regressions with the individual phytoplankton fluorometers. One or more of the variables of chlorophyll fluorescence, pH, water temperature, fDOM, turbidity, measures of light, precipitation, wind speed and direction were incorporated into regression models, varying by lake, near surface measurements only, or using all data. The explanatory power of stepwise regression models for laboratory-measured chlorophyll-a, total phytoplankton biovolume and cyanobacterial biovolume was weak, explaining less than half the variance in the laboratory measurements. For chlorophyll, the difference in explanatory power of the multivariate stepwise regression was negligible compared to linear regressions using only single fluorometer measurements. However, the stepwise regression did have substantially more explanatory power (greater than 20 percent) than linear regression using only single fluorometer measurements for laboratory-measured total phytoplankton biovolume. For cyanobacterial biovolume, the stepwise regression explained about 40 percent more variance than the model based on phycocyanin concentration measurements from the dual-channel fluorometer. In fact, the analysis indicated that turbidity was a much more significant indicator of the variability in cyanobacterial biovolume than phycocyanin measurements from the dual-channel fluorometer, by several orders of magnitude. Multichannel fluorometer measurements of chlorophyll concentration contributed from cyanobacteria have strong explanatory power based on these results; however, the number of observations and range was small. Analyzing the data by top location and by lake did not indicate substantial differences (plus or minus 20 percent) in explanatory power over models developed with all data combined (especially in consideration that a higher R2 does not necessarily represent a higher level of accuracy). The inability to develop models with explanatory power greater than 50 percent was directly related to the lack of substantial accumulations of CyanoHABs at the open-water monitoring locations within Seneca, Owasco, and Skaneateles Lakes during this study. Models developed for predicting CyanoHABs typically have ranges greater than those observed during this study and explanatory power greater than 50 percent (when R2 was used to assess model performance). In terms of chlorophyll, for example, these ranges can exceed 100,000 micrograms per liter. In this study, the maximum chlorophyll observed was 14.6 micrograms per liter.
In all, sensor data can provide valuable insights on physiochemical and biological conditions affecting natural waters, overcoming the shortfalls of traditional discrete sampling, which can miss ephemeral events. However, such sensors can be costly to obtain, to operate and maintain, and require diverse technical expertise to verify sensor function, identify outlier data from valid observations, and apply corrections for interferences and (or) calibration drift. Although many sensors can produce measurements representative of laboratory measurements, those specifically targeting phytoplankton biomass, or other measures associated with HABs, commonly demonstrate variability because of the many interferences that can affect their measurements. Although chlorophyll has become the measurement of choice for many studies as a proxy for phytoplankton biomass, community composition and abundances—particularly with regard to cyanobacteria—remain an important issue. However, based on this and other studies, chlorophyll is generally not a good variable for modeling cyanobacteria abundance. Also supported by the results of this study, other recent studies have demonstrated improvements in sensor-based characterizations of cyanobacteria dynamics, in addition to chlorophyll concentrations, with the use of multichannel fluorescence sensors over the more widely used single- and dual-channel models. Furthermore, additional improvements were observed when custom calibrations and (or) correction models were employed. Many observing system technologies are available, including remote sensing, and in the age of artificial intelligence, machine learning techniques have the potential to improve estimations and predictions of phytoplankton biomass and CyanoHABs, owing to their ability to handle large and complex datasets from diverse sources, identify non-linear relationships between variables, and adapt to changing environmental conditions. With the limitations of sensor data (and remote data) well documented, incorporating artificial intelligence and machine learning techniques into laboratory-based studies or monitoring programs may improve our understanding of the dynamics of CyanoHABs and push forward to the next generation of HAB science.
Acknowledgments
The authors are grateful for the outstanding effort put forth by U.S. Geological Survey field crews who executed a rigorous schedule and performed their duties following standard protocols, all during the global COVID–19 pandemic and social distancing.
References Cited
Ahn, H., and James, R.T., 1999, Outlier detection in phosphorus dry deposition rates measured in South Florida: Atmospheric Environment, v. 33, no. 30, p. 5123–5131, accessed February 1, 2023, at https://doi.org/10.1016/S1352-2310(99)00165-X.
Aquatic Informatics, Inc., 2023, Aquarius—Analytics software for the natural environment: Aquatic Informatics web page, accessed January 26, 2023, at https://aquaticinformatics.com/products/aquarius-environmental-water-data-management/.
Arar, E.J., and Collins, G.B., 1997, Method 445.0—In vitro determination of chlorophyll a and pheophytin a in marine and freshwater algae by fluorescence (rev. 1.2, September 1997): U.S. Environmental Protection Agency, 22 p., accessed June 23, 2020, at https://cfpub.epa.gov/si/si_public_record_report.cfm?Lab=NERL&dirEntryId=309417.
bbe Moldaenke GmbH, 2023, FluoroProbe—Yellow substances and automatic turbidity correction: bbe Moldaenke GmbH web page, accessed January 25, 2023, at https://www.bbe-moldaenke.de/en/products/chlorophyll/details/fluoroprobe.html.
Bertone, E., Chuang, A., Burford, M.A., and Hamilton, D.P., 2019, In-situ fluorescence monitoring of cyanobacteria—Laboratory-based quantification of species-specific measurement accuracy: Harmful Algae, v. 87, article 101625, 14 p., accessed December 19, 2020, at https://doi.org/10.1016/j.hal.2019.101625.
Booth, A., Fleck, J., Pellerin, B.A., Hansen, A., Etheridge, A., Foster, G.M., Graham, J.L., Bergamaschi, B.A., Carpenter, K.D., Downing, B.D., Rounds, S.A., and Saraceno, J., 2023, Field techniques for fluorescence measurements targeting dissolved organic matter, hydrocarbons, and wastewater in environmental waters—Principles and guidelines for instrument selection, operation and maintenance, quality assurance, and data reporting: U.S. Geological Survey Techniques and Methods, book 1, chap. D11, 41 p., accessed February 1, 2023, at https://doi.org/10.3133/tm1D11.
Bosse, K.R., Sayers, M.J., Shuchman, R.A., Fahnenstiel, G.L., Ruberg, S.A., Fanslow, D.L., Stuart, D.G., Johengen, T.H., and Burtner, A.M., 2019, Spatial-temporal variability of in situ cyanobacteria vertical structure in Western Lake Erie—Implications for remote sensing observations: Journal of Great Lakes Research, v. 45, no. 3, p. 480–489, accessed February 1, 2023, at https://doi.org/10.1016/j.jglr.2019.02.003.
Bowling, L.C., Zamyadi, A., and Henderson, R.K., 2016, Assessment of in situ fluorometry to measure cyanobacterial presence in water bodies with diverse cyanobacterial populations: Water Research, v. 105, p. 22–33, accessed February 1, 2023, at https://doi.org/10.1016/j.watres.2016.08.051.
Boyer, G.L., 2007, The occurrence of cyanobacterial toxins in New York lakes—Lessons from the MERHAB-Lower Great Lakes program: Lake and Reservoir Management, v. 23, no. 2, p. 153–160. [Also available at https://doi.org/10.1080/07438140709353918.]
Callinan, C.W., 2001, Water Quality Study of the Finger Lakes: Part A: Synoptic Water Quality Investigation: Technical Reports (Water Resources), SUNY Brockport, published by New York State Department of Environmental Conservation, issued on 2001-07-01, accessed February 1, 2023, at https://soar.suny.edu/handle/20.500.12648/2600.
Canfield, D.E., Jr., Bachmann, R.W., Hoyer, M.V., Johansson, L.S., Søndergaard, M., and Jeppesen, E., 2019, To measure chlorophyll or phytoplankton biovolume—An aquatic conundrum with implications for the management of lakes: Lake and Reservoir Management, v. 35, no. 2, p. 181–192, accessed February 1, 2023, at https://doi.org/10.1080/10402381.2019.1607958.
Cao, H., Han, L., and Li, L., 2022, A deep learning method for cyanobacterial harmful algae blooms prediction in Taihu Lake, China: Harmful Algae, v. 113, article 102189, 10 p., accessed February 1, 2023, at https://doi.org/10.1016/j.hal.2022.102189.
Cawley, G.C., and Talbot, N.L.C., 2010, On over-fitting in model selection and subsequent selection bias in performance evaluation: Journal of Machine Learning Research, v. 11, p. 2079–2107. [Also available at https://www.jmlr.org/papers/volume11/cawley10a/cawley10a.pdf.]
Chaffin, J.D., Kane, D.D., Stanislawczyk, K., and Parker, E.M., 2018, Accuracy of data buoys for measurement of cyanobacteria, chlorophyll, and turbidity in a large lake (Lake Erie, North America)—Implications for estimation of cyanobacterial bloom parameters from water quality sonde measurements: Environmental Science and Pollution Research International, v. 25, p. 25175–25189, accessed February 1, 2023, https://link.springer.com/article/10.1007/s11356-018-2612-z.
Choo, F., Zamyadi, A., Newton, K., Newcombe, G., Bowling, L., Stuetz, R., and Henderson, R.K., 2018, Performance evaluation of in situ fluorometers for real-time cyanobacterial monitoring. H2Open Journal, v. 1, no. 1, p. 26–46, accessed February 1, 2023, at https://doi.org/10.2166/h2oj.2018.009.
Chorus, I., and Welker, M., eds., 2021. Toxic cyanobacteria in water (2d ed.): Boca Raton, Fla., CRC Press (on behalf of the World Health Organization), 839 p., accessed February 1, 2023, at https://doi.org/10.1201/9781003081449.
Cruz, R.C., Reis Costa, P., Vinga, S., Krippahl, L., and Lopes, M.B., 2021, A review of recent machine learning advances for forecasting harmful algal blooms and shellfish contamination: Journal of Marine Science and Engineering, v. 9, no. 3, 17 p., accessed February 1, 2023, at https://doi.org/10.3390/jmse9030283.
Daghighi, A., 2017. Harmful algae bloom prediction model for western Lake Erie using stepwise multiple regression and genetic programming.: Cleveland, Ohio, Cleveland State University, M.S. thesis, 116 p., accessed February 1, 2023, at https://engagedscholarship.csuohio.edu/etdarchive/964.
Drasovean, R., and Murariu, G., 2021, Water quality parameters and monitoring soft surface water quality using statistical approaches, chap. 11 of Ahmed, I., and Summers, J.K., eds., Promising techniques for wastewater treatment and water quality assessment: London, IntechOpen, 217 p., accessed February 1, 2023, at https://doi.org/10.5772/intechopen.97372.
Downing, B.D., Boss, E., Bergamaschi, B.A., Fleck, J.A., Lionberger, M.A., Ganju, N.K., Schoellhamer, D.H., and Fujii, R., 2009, Quantifying fluxes and characterizing compositional changes of dissolved organic matter in aquatic systems in situ using combined acoustic and optical measurements: Limnology and Oceanography—Methods, v. 7, no. 1, p. 119–131, accessed February 1, 2023, at https://doi.org/10.4319/lom.2009.7.119.
Downing, B.D., Pellerin, B.A., Bergamaschi, B.A., Saraceno, J.F., and Kraus, T.E.C., 2012, Seeing the light—The effects of particles, dissolved materials, and temperature on in situ measurements of DOM fluorescence in rivers and streams: Limnology and Oceanography—Methods, v. 10, no. 10, p. 767–775. [Also available at https://doi.org/10.4319/lom.2012.10.767.]
Downing, B.D., Bergamaschi, B.A., and Kraus, T.E.C., 2017, Synthesis of data from high-frequency nutrient and associated biogeochemical monitoring for the Sacramento–San Joaquin Delta, northern California: U.S. Geological Survey Scientific Investigations Report 2017–5066, 28 p., accessed February 1, 2023, at https://doi.org/10.3133/sir20175066.
Favot, E.J., Holeton, C., DeSellas, A.M., and Paterson, A.M., 2023, Cyanobacterial blooms in Ontario, Canada—Continued increase in reports through the 21st century: Lake and Reservoir Management, v. 39, no. 1, p. 1–20, accessed February 1, 2023, at https://doi.org/10.1080/10402381.2022.2157781.
Fishman, M.J., 1993, Methods of analysis by the U.S. Geological Survey National Water Quality Laboratory—Determination of inorganic and organic constituents in water and fluvial sediments: U.S. Geological Survey Open-File Report 93–125, 217 p. [Also available at https://doi.org/10.3133/ofr93125.]
Fornarelli, R., Galelli, S., Castelletti, A., Antenucci, J.P., and Marti, C.L., 2013, An empirical modeling approach to predict and understand phytoplankton dynamics in a reservoir affected by interbasin water transfers: Water Resources Research, v. 49, no. 6, p. 3626–3641, accessed February 1, 2023, at https://doi.org/10.1002/wrcr.20268.
Foster, G.M., Graham, J.L., and King, L.R., 2019, Spatial and temporal variability of harmful algal blooms in Milford Lake, Kansas, May through November 2016: U.S. Geological Survey Scientific Investigations Report 2018–5166, 36 p., accessed February 1, 2023, at https://doi.org/10.3133/sir20185166.
Foster, G.M., Graham, J.L., Bergamaschi, B.A., Carpenter, K.D., Downing, B.D., Pellerin, B.A., Rounds, S.A., and Saraceno, J.F., 2022, Field techniques for the determination of algal pigment fluorescence in environmental waters—Principles and guidelines for instrument and sensor selection, operation, quality assurance, and data reporting: U.S. Geological Survey Techniques and Methods, book 1, chap. D10, 34 p., accessed February 1, 2023, at https://doi.org/10.3133/tm1D10.
Francy, D.S., Graham, J.L., Stelzer, E.A., Ecker, C.D., and Brady, A.M.G., Struffolino, P., and Loftin, K.A., 2015, Water quality, cyanobacteria, and environmental factors and their relations to microcystin concentrations for use in predictive models at Ohio Lake Erie and inland lake recreational sites, 2013–14: U.S. Geological Survey Scientific Investigations Report 2015–5120, 58 p., 2 app., accessed February 1, 2023, at https://doi.org/10.3133/sir20155120.
Gorney, R.M., June, S.G., Stainbrook, K.M., and Smith, A.J., 2023, Detections of cyanobacteria harmful algal blooms (cyanoHABs) in New York State, United States (2012–2020): Lake and Reservoir Management, v. 39, no. 1, p. 21–36, accessed February 1, 2023, at https://doi.org/10.1080/10402381.2022.2161436.
Graham, J.L., Loftin, K.A., Ziegler, A.C., and Meyer, M.T., 2008, Cyanobacteria in lakes and reservoirs—Toxin and taste-and-odor sampling guidelines (ver. 1.0, September 2008): U.S. Geological Survey Techniques of Water-Resources Investigations, book 9, chap. A7.5, 65 p., accessed May 20, 2021, at https://doi.org/10.3133/twri09A7.5.
Graham, J.L., Dubrovsky, N.M., and Eberts, S.M., 2017, Cyanobacterial harmful algal blooms and U.S. Geological Survey science capabilities (ver. 1.1, December 2017): U.S. Geological Survey Open-File Report 2016–1174, 12 p. [Also available at https://doi.org/10.3133/ofr20161174.]
Hach Company, 2023, NITRATAX sc user manual: Hach Company manual DOC023.54.03211, 38 p., accessed February 1, 2023, at https://www.hach.com/asset-get.download-en.jsa?id=7639982966.
Halfman, J.D., 2016, Water quality of the eight eastern Finger Lakes, New York: 2005–2016: Geneva, N.Y., Hobart and William Smith Colleges, Finger Lakes Institute report, , 52 p., accessed April 15, 2020, at http://people.hws.edu/halfman/Data/2016%20FL-WQ-Update.pdf.
Halfman, J.D., Shaw, J.A., Dumitriu, I., and Cleckner, L.B., 2023, Meteorological and limnological precursors to cyanobacterial blooms in Seneca and Owasco Lakes, New York, USA: Water (Basel), v. 15, no. 13, 26 p., accessed February 1, 2023, at https://doi.org/10.3390/w15132363.
Hamre, K.D., Lofton, M.E., McClure, R.P., Munger, Z.W., Doubek, J.P., Gerling, A.B., Schreiber, M.E., and Carey, C.C., 2018, In situ fluorometry reveals a persistent, perennial hypolimnetic cyanobacterial bloom in a seasonally anoxic reservoir: Freshwater Science, v. 37, no. 3, p. 483–495, accessed February 1, 2023, at https://doi.org/10.1086/699327.
Helsel, D.R., Hirsch, R.M., Ryberg, K.R., Archfield, S.A., and Gilroy, E.J., 2020, Statistical methods in water resources: U.S. Geological Survey Techniques and Methods, book 4, chap. A3, 458 p. [Also available at https://doi.org/10.3133/tm4A3. Supersedes USGS Techniques of Water-Resources Investigations, book 4, chap. A3, version 1.1.]
Ho, J.C., and Michalak, A.M., 2015, Challenges in tracking harmful algal blooms—A synthesis of evidence from Lake Erie: Journal of Great Lakes Research, v. 41, no. 2, p. 317–325, accessed February 1, 2023, at https://doi.org/10.1016/j.jglr.2015.01.001.
Hoffmeister, S., Murphy, K.R., Cascone, C., Ledesma, J.L.J., and Köhler, S.J., 2020, Evaluating the accuracy of two in situ optical sensors to estimate DOC concentrations for drinking water production: Environmental Science—Water Research & Technology, v. 6, no. 10, p. 2891–2901, accessed February 1, 2023, at https://doi.org/10.1039/D0EW00150C.
Huang, H., Wang, W., Lv, J., Liu, Q., Liu, X., Xie, S., Wang, F., and Feng, J., 2022, Relationship between chlorophyll a and environmental factors in lakes based on the random forest algorithm: Water (Basel), v. 14, no. 19, 11 p., accessed February 1, 2023, at https://doi.org/10.3390/w14193128.
Hudnell, H.K., 2010, The state of U.S. freshwater harmful algal blooms assessments, policy and legislation: Toxicon, v. 55, no. 5, p. 1024–1034, accessed February 1, 2023, at https://doi.org/10.1016/j.toxicon.2009.07.021.
Hudnell, H.K., ed., 2008, Cyanobacterial harmful algal blooms—State of the science and research needs, v 619 of Back, N., Lajtha, A., Paoletti, R., Cohen, I.R., and Lambris, J.D., eds., Advances in Experimental Medicine and Biology: New York, Springer, 949 p. [Also available at https://doi.org/10.1007/978-0-387-75865-7.]
Johnston, B.D., Gifford, S.R., Savoy, P.R., Finkelstein, K.M., and Stouder, M.D., 2023, Field data for an evaluation of sensors for continuous monitoring of harmful algal blooms in the Finger Lakes, New York, 2019 and 2020: U.S. Geological Survey data release, https://doi.org/10.5066/P9046YOS.
Johnston, B.D., Graham, J.L., Foster, G.M., and Downing, B.D., 2022, Technical note—Performance evaluation of the PhytoFind, an in-place phytoplankton classification tool: U.S. Geological Survey Scientific Investigations Report 2022–5103, 36 p., accessed February 1, 2023, at https://doi.org/10.3133/sir20225103.
Jones, J.R., and Bachmann, R.W., 1978, Trophic status of Iowa lakes in relation to origin and glacial geology: Hydrobiologia, v. 57, no. 3, p. 267–273, accessed February 1, 2023, at https://doi.org/10.1007/BF00014580.
Jones, J.R., Thorpe, A.P., and Obrecht, D.V., 2020, Limnological characteristics of Missouri reservoirs—Synthesis of a long-term assessment: Lake and Reservoir Management, v. 36, no. 4, p. 412–422, accessed February 1, 2023, at https://doi.org/10.1080/10402381.2020.1756997.
Kraus, T.E.C., Bergamaschi, B.A., and Downing, B.D., 2017, An introduction to high-frequency nutrient and biogeochemical monitoring for the Sacramento–San Joaquin Delta, northern California: U.S. Geological Survey Scientific Investigations Report 2017–5071, 41 p., accessed February 1, 2023, at https://doi.org/10.3133/sir20175071.
Kring, S.A., Figary, S.E., Boyer, G.L., Watson, S.B., and Twiss, M.R., 2014, Rapid in situ measures of phytoplankton communities using the bbe FluoroProbe—Evaluation of spectral calibration, instrument intercompatibility, and performance range: Canadian Journal of Fisheries and Aquatic Sciences, v. 71, no. 7, p. 1087–1095, accessed February 1, 2023, at https://doi.org/10.1139/cjfas-2013-0599.
LI–COR, Inc., 2023, LI–190R quantum sensor: LI–COR, Inc., web page, accessed January 25, 2023, at https://www.licor.com/env/products/light/quantum.html.
Linz, D.M., Sienkiewicz, N., Struewing, I., Stelzer, E.A., Graham, J.L., and Lu, J., 2023, Metagenomic mapping of cyanobacteria and potential cyanotoxin producing taxa in large rivers of the United States: Scientific Reports, v. 13, no. 1, 13 p., accessed February 1, 2023, at https://doi.org/10.1038/s41598-023-29037-6.
Magalhães, A.A. de J.; Luz, L.D. da; and Aguiar, T.R. de, Jr., 2019, Environmental factors driving the dominance of the harmful bloom‐forming cyanobacteria Microcystis and Aphanocapsa in a tropical water supply reservoir: Water Environment Research, v. 91, no. 11, p. 1466–1478, accessed February 1, 2023, at https://doi.org/10.1002/wer.1141.
Melendez-Pastor, I., Isenstein, E.M., Navarro-Pedreño, J., and Park, M.-H., 2019, Spatial variability and temporal dynamics of cyanobacteria blooms and water quality parameters in Missisquoi Bay (Lake Champlain): Water Supply, v. 19, no. 5, p. 1500–1506, accessed February 1, 2023, at https://doi.org/10.2166/ws.2019.017.
Mueller, D.K., Schertz, T.L., Martin, J.D., and Sandstrom, M.W., 2015, Design, analysis, and interpretation of field quality-control data for water-sampling projects: U.S. Geological Survey Techniques and Methods, book 4, chap. C4, 54 p., accessed February 1, 2023, at https://doi.org/10.3133/tm4C4.
New York State Department of Environmental Conservation [NYSDEC], 2018, Harmful algal bloom action plan Owasco Lake: New York State Department of Environmental Conservation report, 115 p., accessed February 1, 2023, at https://www.dec.ny.gov/docs/water_pdf/owascohabplan.pdf.
New York State Department of Environmental Conservation [NYSDEC], 2019, 2018 Finger Lakes water quality report— Summary of historic Finger Lakes data and the 2017–2018 citizens Statewide lake assessment program: New York State Department of Environmental Conservation report, 87 p, accessed February 1, 2023, at https://www.dec.ny.gov/docs/water_pdf/2018flwqreport.pdf.
New York State Department of Environmental Conservation [NYSDEC], 2020, Harmful algal blooms by county 2012–2019: New York State Department of Environmental Conservation report, 25 p., accessed February 1, 2023, at https://www.dec.ny.gov/docs/water_pdf/habsextentsummary.pdf.
New York State Department of Environmental Conservation [NYSDEC], 2023, Division of Water monitoring data portal [Owasco Lake, Seneca Lake, lake_habs_status, 2012 to 2022]: New York State Department of Environmental Conservation database, accessed May 19, 2023, at https://nysdec.maps.arcgis.com/apps/webappviewer/index.html?id=692b72ae03f14508a0de97488e142ae1.
Patton, C.J., and Kryskalla, J.R., 2011, Colorimetric determination of nitrate plus nitrite in water by enzymatic reduction, automated discrete analyzer methods: U.S. Geological Survey Techniques and Methods, book 5, chap. B8, 34 p. [Also available at https://doi.org/10.3133/tm5B8.]
Pellerin, B.A., Saraceno, J.F., Shanley, J.B., Sebestyen, S.D., Aiken, G.R., Wollheim, W.M., and Bergamaschi, B.A., 2012, Taking the pulse of snowmelt—In situ sensors reveal seasonal, event and diurnal patterns of nitrate and dissolved organic matter variability in an upland forest stream: Biogeochemistry, v. 108, nos. 1–3, p. 183–198, accessed February 1, 2023, at https://doi.org/10.1007/s10533-011-9589-8.
Pellerin, B.A., Bergamaschi, B.A., Downing, B.D., Saraceno, J.F., Garrett, J.D., and Olsen, L.D., 2013, Optical techniques for the determination of nitrate in environmental waters—Guidelines for instrument selection, operation, deployment, quality assurance, and data reporting: U.S. Geological Survey Techniques and Methods 1–D5, 37 p., accessed January 25, 2023, at https://doi.org/10.3133/tm1D5.
Phillips, G., Pietiläinen, O.P., Carvalho, L., Solimini, A., Lyche Solheim, A., and Cardoso, A.C., 2008, Chlorophyll–nutrient relationships of different lake types using a large European dataset: Aquatic Ecology, v. 42, no. 2, p. 213–226, accessed February 1, 2023, at https://doi.org/10.1007/s10452-008-9180-0.
PhycoTech, 2018, General technical approach: PhycoTech, Inc., report, 17 p., accessed February 1, 2023, at https://www.phycotech.com/Portals/0/PDFs/GenTech.pdf.
O’Neil, J.M., Davis, T.W., Burford, M.A., and Gobler, C.J., 2012, The rise of harmful cyanobacteria blooms—The potential roles of eutrophication and climate change: Harmful Algae, v. 14, p. 313–334. [Also available at https://doi.org/10.1016/j.hal.2011.10.027.]
Onset Computer Corporation, 2018, HOBO Pendant temperature/light data logger (UA-002-xx) manual: Onset Computer Corporation manual, 4 p., accessed January 25, 2023, at https://www.onsetcomp.com/sites/default/files/resources-documents/9556-M%20UA-002%20Manual.pdf.
Peake, C.S., 2022, Verification of multiple phosphorus analyzers for use in surface-water applications: U.S. Geological Survey Open-File Report 2022–1100, 23 p., accessed January 25, 2023, at https://doi.org/10.3133/ofr20221100.
Perkins, S.R., Stouder, M.D.W., and Beaulieu, K., 2021, Phytoplankton data from Owasco, Seneca, and Skaneateles Lakes, Finger Lakes region, New York, 2019–2020 (ver. 2.1, June 2023): U.S. Geological Survey data release, accessed July 1, 2023, at https://doi.org/10.5066/P9TP9T1D.
Prestigiacomo, A.R., June, S.G., Gorney, R.M., Smith, A.J., and Clinkhammer, A.C., 2022, An evaluation of a spectral fluorometer for monitoring chlorophyll a in New York State lakes: Lake and Reservoir Management, v. 38, no. 4, p. 318–333, accessed January 25, 2023, at https://doi.org/10.1080/10402381.2022.2129525.
Prestigiacomo, A.R., Gorney, R.M., Hyde, J.B., Davis, C., and Clinkhammer, A.C., 2023, Patterns and impacts of cyanobacteria in a deep, thermally stratified, oligotrophic lake: AWWA—Water Science, v. 5, no. 2, accessed January 25, 2023, at https://doi.org/10.1002/aws2.1326.
Raven, J.A., and Geider, R.J., 1988, Temperature and algal growth: New Phytologist, v. 110, no. 4, p. 441–461, accessed January 25, 2023, at https://doi.org/10.1111/j.1469-8137.1988.tb00282.x.
R Core Team, 2023, R—A language and environment for statistical computing: Vienna, Austria, R Foundation for Statistical Computing software release, accessed January 25, 2023, at https://www.R-project.org/.
Reinl, K.L., Brookes, J.D., Carey, C.C., Harris, T.D., Ibelings, B.W., Morales‐Williams, A.M., de Senerpont Domis, L.N., Atkins, K.S., Isles, P.D.F., Mesman, J.P., North, R.L., Rudstam, L.G., Stelzer, J.A.A., Venkiteswaran, J.J., Yokota, K., and Zhan, Q., 2021, Cyanobacterial blooms in oligotrophic lakes—Shifting the high‐nutrient paradigm: Freshwater Biology, v. 66, no. 9, p. 1846–1859, accessed January 25, 2023, at https://doi.org/10.1111/fwb.13791.
Rome, M., Beighley, E.R., and Faber, T., 2021. Sensor-based detection of algal blooms for public health advisories and long-term monitoring: Science of the Total Environment, v. 767, article 144984, 11 p., accessed January 25, 2023, at https://doi.org/10.1016/j.scitotenv.2021.144984.
Rousso, B.Z., Bertone, E., Stewart, R., and Hamilton, D.P., 2020, A systematic literature review of forecasting and predictive models for cyanobacteria blooms in freshwater lakes: Water Research, v. 182, article 115959, 26 p., accessed January 25, 2023, at https://doi.org/10.1016/j.watres.2020.115959.
Sanseverino, I., Conduto, D., Pozzoli, L., Dobricic, S., and Lettieri, T., 2016, Algal bloom and its economic impact: European Commission, Joint Research Centre Technical Report, 48 p., accessed February 27, 2023, at https://doi.org/10.2788/660478.
Sea-Bird Scientific, 2019, Hydrocycle PO4—Discontinued: Sea-Bird Scientific web page, accessed February 6, 2023, at https://www.seabird.com/hydrocycle-po-discontinued/product-downloads?id=54721314201.
Smith, Z.J., Martin, R.M., Wei, B., Wilhelm, S.W., and Boyer, G.L., 2019, Spatial and temporal variation in paralytic shellfish toxin production by benthic Microseira (Lyngbya) wollei in a freshwater New York lake: Toxins, v. 11, no. 1, 18 p.,accessed February 27, 2023, at https://doi.org/10.3390/toxins11010044.
Standard Methods Committee of the American Public Health Association, American Water Works Association, and Water Environment Federation [Standard Methods Committee], 2014, Persulfate-ultraviolet or heated-persulfate oxidation method, in Total organic carbon, sec. 5310 of Aggregate organic constituents in water and wastewater, part 5000 of Standard methods for the examination of water and wastewater (23d ed.): Washington, D.C., American Public Health Association.
Taranu, Z.E., Gregory‐Eaves, I., Leavitt, P.R., Bunting, L., Buchaca, T., Catalan, J., Domaizon, I., Guilizzoni, P., Lami, A., McGowan, S., Moorhouse, H., Morabito, G., Pick, F.R., Stevenson, M.A., Thompson, P.L., and Vinebrooke, R.D., 2015, Acceleration of cyanobacterial dominance in north temperate‐subarctic lakes during the Anthropocene: Ecology Letters, v. 18, no. 4, p. 375–384, accessed February 27, 2023, at https://doi.org/10.1111/ele.12420.
Thompson, W.R., 1935, On a criterion for the rejection of observations and the distribution of the ratio of deviation to sample standard deviation: Annals of Mathematical Statistics, v. 6, no. 4, p. 214–219, accessed February 27, 2023, at https://doi.org/10.1214/aoms/1177732567.
Toming, K., Kotta, J., Uuemaa, E., Sobek, S., Kutser, T., and Tranvik, L.J., 2020, Predicting lake dissolved organic carbon at a global scale: Scientific Reports, v. 10, no. 1, 8 p., accessed February 27, 2023, at https://doi.org/10.1038/s41598-020-65010-3.
Trevino-Garrison, I., DeMent, J., Ahmed, F.S., Haines-Lieber, P., Langer, T., Ménager, H., Neff, J., Merwe, D., van der, and Carney, E., 2015, Human illnesses and animal deaths associated with freshwater harmful algal blooms—Kansas: Toxins, v. 7, no. 2, p. 353–366, accessed February 27, 2023, at https://doi.org/10.3390/toxins7020353.
Turner Designs, Inc., 2021, PhytoFind in situ algal classification: Turner Designs, Inc., web page, accessed May 18, 2021, at https://www.turnerdesigns.com/phytofind-algal-classification.
U.S. Geological Survey [USGS], [variously dated], National field manual for the collection of water-quality data, section A of Handbooks for water-resources investigations: U.S. Geological Survey Techniques of Water-Resources Investigations, book 9, 10 chap. (A0–A8, A10), accessed October 20, 2016, at https://water.usgs.gov/owq/FieldManual/.
U.S. Geological Survey [USGS], 2005, Collection, quality assurance, and presentation of precipitation data (revised December 2009): U.S. Geological Survey Office of Surface Water Technical Memorandum 2006.01, 29 p., accessed January 25, 2023, at https://water.usgs.gov/admin/memo/SW/OSW_2006-01_Revised_02122010.pdf.
U.S. Geological Survey [USGS], 2016, USGS water data for the Nation: U.S. Geological Survey National Water Information System database, accessed March 22, 2023, at https://doi.org/10.5066/F7P55KJN.
U.S. Geological Survey [USGS], 2023. Does the USGS provide precipitation data?: U.S. Geological Survey web page, accessed January 25, 2023, at https://www.usgs.gov/faqs/does-usgs-provide-precipitation-data#:~:text=The%20USGS%20collects%20precipitation%20data%20at%20about%203%2C400,our%20preci pitation%20equipment%20is%20infrequently%20calibrated%20and%20tested.
Wagner, R.J., Boulger, R.W., Jr., Oblinger, C.J., and Smith, B.A., 2006, Guidelines and standard procedures for continuous water-quality monitors—Station operation, record computation, and data reporting: U.S. Geological Survey Techniques and Methods book 1, chap. D3, 51 p. plus 8 attachments, accessed January 25, 2023, at https://doi.org/10.3133/tm1D3.
Wang, C., Huang, Y., He, S., Lin, Y., Wang, X., and Kong, H., 2009, Variation of phytoplankton community before an induced cyanobacterial (Arthrospira platensis) bloom: Journal of Environmental Sciences (China), v. 21, no. 12, p. 1632–1638. [Also available at https://doi.org/10.1016/S1001-0742(08)62466-3.]
Winter, J.G., DeSellas, A.M., Fletcher, R., Heintsch, L., Morley, A., Nakamoto, L., and Utsumi, K., 2011, Algal blooms in Ontario, Canada—Increases in reports since 1994: Lake and Reservoir Management, v. 27, no. 2, p. 107–114, accessed February 27, 2023, at https://doi.org/10.1080/07438141.2011.557765.
Ye, L., Cai, Q., Zhang, M., and Tan, L., 2014, Real-time observation, early warning and forecasting phytoplankton blooms by integrating in situ automated online sondes and hybrid evolutionary algorithms: Ecological Informatics, v. 22, p. 44–51, accessed February 27, 2023, at https://doi.org/10.1016/j.ecoinf.2014.04.001.
Yuan, L.L., and Jones, J.R., 2020, Rethinking phosphorus–Chlorophyll relationships in lakes: Limnology and Oceanography, v. 65, no. 8, p. 1847–1857, accessed February 27, 2023, at https://doi.org/10.1002/lno.11422.
YSI Inc., 2021, EXO2 multiparameter sonde: YSI Inc., web page, accessed May 14, 2021, at https://www.ysi.com/EXO2.
Vaisala, 2022, Weather transmitter WXT530 series: Vaisala web page, accessed January 25, 2023, at https://www.vaisala.com/en/products/weather-environmental-sensors/weather-transmitter-wxt530-series.
Zaiontz, C., 2023, Real Statistics Resource Pack for Microsoft Excel (Version 8.5) [Software]. Accessed on February 24, 2023, at https://www.real-statistics.com/free-download/real-statistics-resource-pack/.
Conversion Factors
Datums
Vertical coordinate information is referenced to the North American Vertical Datum of 1988 (NAVD 88).
Horizontal coordinate information is referenced to the North American Datum of 1983 (NAD 83).
Supplemental Information
Photosynthetic photon flux density is given in micromoles per square meter per second (µmol/m2/s).
Illumination is measured in lumens per square meter (lux).
Concentrations of chlorophyll and chlorophyll-a are given in micrograms per liter (µg/L).
Concentrations of chemical constituents in water are given in either milligrams per liter (mg/L) or micrograms per liter (µg/L).
Phytoplankton biovolume is given in cubic micrometers per milliliter (µm3/mL).
Specific conductance is given in microsiemens per centimeter at 25 degrees Celsius (µS/cm at 25 °C).
Abbreviations
ρ
Spearman’s rank correlation coefficient
AVLD
absolute value logarithmic difference
CyanoHAB
cyanobacterial harmful algal bloom
DOC
dissolved organic carbon
DOM
dissolved organic matter
fDOM
fluorescent dissolved organic matter
HAB
harmful algal bloom
HDPE
high-density polyethylene
NWIS
National Water Information System
NYSDEC
New York State Department of Environmental Conservation
p-value
probability value
PAR
photosynthetically active radiation
PVC
polyvinyl chloride
r
Pearson’s linear correlation coefficient
R2
coefficient of determination
RFU
relative fluorescence unit
RPD
relative percent difference
QA
quality assurance
QC
quality control
QSE
quinine sulfate equivalent
USGS
U.S. Geological Survey
For more information about this publication, contact:
dc_ny@usgs.gov, USGS New York Water Science Center
425 Jordan Road
Troy, NY 12180–8349
For additional information, visit:
https://www.usgs.gov/centers/ny-water
Publishing support provided by the
Pembroke and Rolla Publishing Service Centers
Disclaimers
Any use of trade, firm, or product names is for descriptive purposes only and does not imply endorsement by the U.S. Government.
Although this information product, for the most part, is in the public domain, it also may contain copyrighted materials as noted in the text. Permission to reproduce copyrighted items must be secured from the copyright owner.
Suggested Citation
Johnston, B.D., Finkelstein, K.M., Gifford, S.R., Stouder, M.D., Nystrom, E.A., Savoy, P.R., Rosen, J.J., and Jennings, M.B., 2024, Evaluation of sensors for continuous monitoring of harmful algal blooms in the Finger Lakes region, New York, 2019 and 2020: U.S. Geological Survey Scientific Investigations Report 2024–5010, 54 p., https://doi.org/10.3133/sir20245010.
ISSN: 2328-0328 (online)
Study Area
| Publication type | Report |
|---|---|
| Publication Subtype | USGS Numbered Series |
| Title | Evaluation of sensors for continuous monitoring of harmful algal blooms in the Finger Lakes region, New York, 2019 and 2020 |
| Series title | Scientific Investigations Report |
| Series number | 2024-5010 |
| DOI | 10.3133/sir20245010 |
| Publication Date | March 26, 2024 |
| Year Published | 2024 |
| Language | English |
| Publisher | U.S. Geological Survey |
| Publisher location | Reston, VA |
| Contributing office(s) | New York Water Science Center |
| Description | Report: vii, 54 p.; 2 Data Releases |
| Country | United States |
| State | New York |
| Other Geospatial | Finger Lakes Region |
| Online Only (Y/N) | Y |
| Additional Online Files (Y/N) | N |