

A Conceptual Site Model of Contaminant Transport Pathways from the Bremerton Naval Complex to Sinclair Inlet, Washington, 2011–21
Links
- Document: Report (36.5 MB pdf) , HTML , XML
- Data Releases:
- USGS data release - MODFLOW-NWT model to simulate the groundwater flow system at Puget Sound Naval Shipyard, Naval Base Kitsap, Bremerton, Washington
- USGS data release - Particulate mercury isotope results, fiber optic thermal survey data, and nearshore surface sediment results at the Bremerton Naval Complex, Washington, USA, 2020-21
- Version History: Version History
- NGMDB Index Page: National Geologic Map Database Index Page (html)
- Download citation as: RIS | Dublin Core
Acknowledgments
This study and report were funded through U.S. Navy Military Interdepartmental Purchase Request N4425A-20-MP-001GS. The Center for Transformative Environmental Monitoring Program provided rental equipment and technical support for the fiber optic distributed temperature sensing survey.
The U.S. Geological Survey’s (USGS) Hydrologic Remote Sensing Branch also provided technical support for the fiber optic distributed temperature sensing survey. USGS hydrologist Steve Cox designed the pore-water sampler and provided technical expertise to the project. USGS team members included Julia David, Lisl Fasser, James Foreman, Cameron Marshall, and Jen McLean. Additional USGS field support was provided by Sarah Dunn, Leland Fuhrig, Alex Headman, Thomas Jetson, Eric Rader, Dan Restivo, Alison Tecca, and Andrew Spanjer.
Abstract
Historical activities on the Bremerton Naval Complex (BNC) in Puget Sound, Washington, have resulted in Sinclair Inlet sediments with elevated concentrations of contaminants, including organic contaminants such as polychlorinated biphenyls and trace elements including mercury. Six U.S. Geological Survey–U.S. Navy datasets have been collected since the last major assessment, in 2013, of soil and groundwater contaminant transport pathways and mercury loading estimates from the BNC to Sinclair Inlet. These include:
-
(1) mercury isotope analysis to support sourcing of mercury in Sinclair Inlet;
-
(2) mercury sampling within the dry dock systems;
-
(3) nearshore thermal surveys to identify potential groundwater discharge locations to Sinclair Inlet;
-
(4) time-series monitoring in nearshore wells to understand the inland extent and dynamics of the tidal mixing zone;
-
(5) tidal studies of mercury in nearshore monitoring wells in an area of contaminated fill material called Site 1; and
-
(6) a spatial survey of trace elements and other parameters in nearshore monitoring wells, pore water, seeps, surface water, and sediment along unwalled shorelines in the western part of the BNC.
The results were incorporated into an updated Conceptual Site Model and used to update contaminant load estimates from the terrestrial BNC to Sinclair Inlet. The results from these studies provide data to the U.S. Navy to support prioritization of on-going remediation actions to manage contamination on the BNC that reduce potential impacts to Sinclair Inlet sediment, surface water, and fish and shellfish tissue.
Mercury isotope analysis of surface sediments and particulate material indicated that a similar industrial mercury profile is present throughout Puget Sound, including terrestrial and marine BNC samples and in other Sinclair Inlet sediments and persists across regions with low and elevated mercury concentrations. Two sources of mercury at the BNC are Sites 1 and 2 subsurface soils/fill material, with total mercury concentrations in particulates collected from the bottom of monitoring wells drilled in these materials ranging from 18,000 to 44,000 nanograms per gram (as compared to the Washington State Marine Sediment Cleanup Screening Level of 590 nanograms per gram).
Contaminants are transported from the terrestrial BNC to Sinclair Inlet via three primary pathways, (1) stormwater outfalls, (2) dry dock discharges, and (3) direct discharge along unwalled shorelines.
Previous loading estimates (based on filtered total mercury) ranked stormwater outfalls, particularly outfall PSNS015 in Site 2 soils, as the largest soil and groundwater contaminant transport pathway from the terrestrial BNC to Sinclair Inlet. Updated loading estimates in this report suggest that the dry dock systems may be a larger pathway of mercury from the terrestrial BNC to Sinclair Inlet than previously thought, within the same order of magnitude as the PSNS015 storm-drain system.
Trace-element loads via direct shoreline discharge are difficult to estimate due to the large and dynamic tidal mixing zone of groundwater and seawater in the nearshore along unwalled shorelines. However, current best estimated ranges suggest that direct shoreline discharge is one of the three main pathways and may contribute smaller mercury loads than the stormwater and the dry dock systems. Along unwalled shorelines, direct groundwater discharge of terrestrial contaminants may be less important than recirculating seawater in the nearshore mixing zone that can extract contaminants from nearshore subsurface material. Total estimated mercury loads from the terrestrial BNC to Sinclair Inlet range from approximately 40 to 200 grams of filtered total mercury per year and a minimum of 70–350 grams of particulate total mercury per year, for a minimum total of 110–525 grams of whole (filtered plus particulate) total mercury per year. Data gaps are identified that, if filled, would further refine the Conceptual Site Model and contaminant loading estimates from the terrestrial BNC to Sinclair Inlet.
Introduction
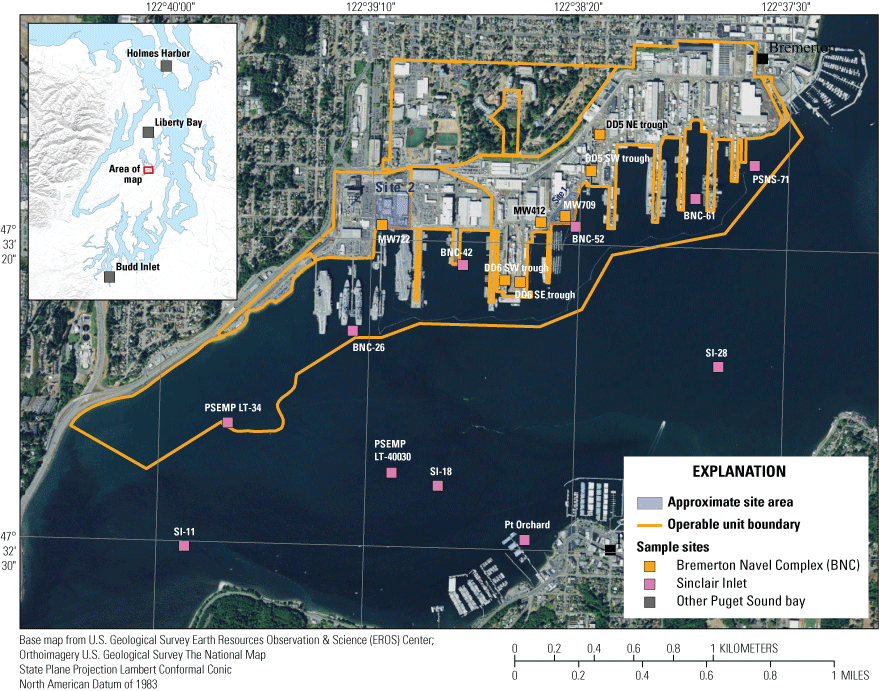
The Bremerton Naval Complex (BNC) is located near the city of Bremerton, Washington, on the shoreline of Sinclair Inlet in Puget Sound (fig. 1). Historical and on-going activities on the BNC have resulted in Sinclair Inlet sediments with elevated concentrations of organic compounds such as polychlorinated biphenyls and trace elements including mercury (Malins and others, 1982; U.S. Navy, 2017a; CH2M, 2018). Mercury, particularly methylmercury, is toxic to aquatic biota and humans who consume it. The BNC also has been named the Puget Sound Naval Shipyard and Intermediate Maintenance Facility and Naval Base Kitsap Bremerton. Remedial investigations have been completed for different areas, called Operable Units (OUs), on the terrestrial (or uplands) BNC and in the marine waters off the BNC (fig. 2) under the Comprehensive Environmental Response, Compensation, and Liability Act. Each OU has a separate cleanup process relevant to the contaminants of concern. Soil mercury concentrations were highest in two terrestrial areas adjacent to unwalled shorelines (Sites 1 and 2) measured during the Remedial Investigation process (U.S. Navy, 2002). Site 2 is in the western part of OU B—Terrestrial (OUBT) and soil mercury concentrations ranged from 6.6 to 31 milligrams per kilogram (mg/kg) for 42 samples collected as deep as 12 meters (m) below ground. Site 1 is in the central part of OUBT and soil mercury concentrations were as high as 75 mg/kg. Elevated levels of contaminants, including mercury, also were measured in soil (mercury as high as 35.6 mg/kg) and groundwater (mercury as high as 32.2 micrograms per liter [μg/L]) in OU NSC, east adjacent to Site 2 (fig. 2). The waters in some nearshore monitoring wells in Sites 1 and 2 and along the unwalled shoreline in Operable Unit A (OU A; fig. 2) contained elevated concentrations of mercury and other trace elements such as arsenic, copper, nickel, and zinc. The source of these trace elements in the well water is presumed to be the contaminated soil/fill material in which the wells are completed. The waters in these nearshore wells have a reported range of specific conductivities indicating that many of them are within the groundwater/surface-water mixing zone.
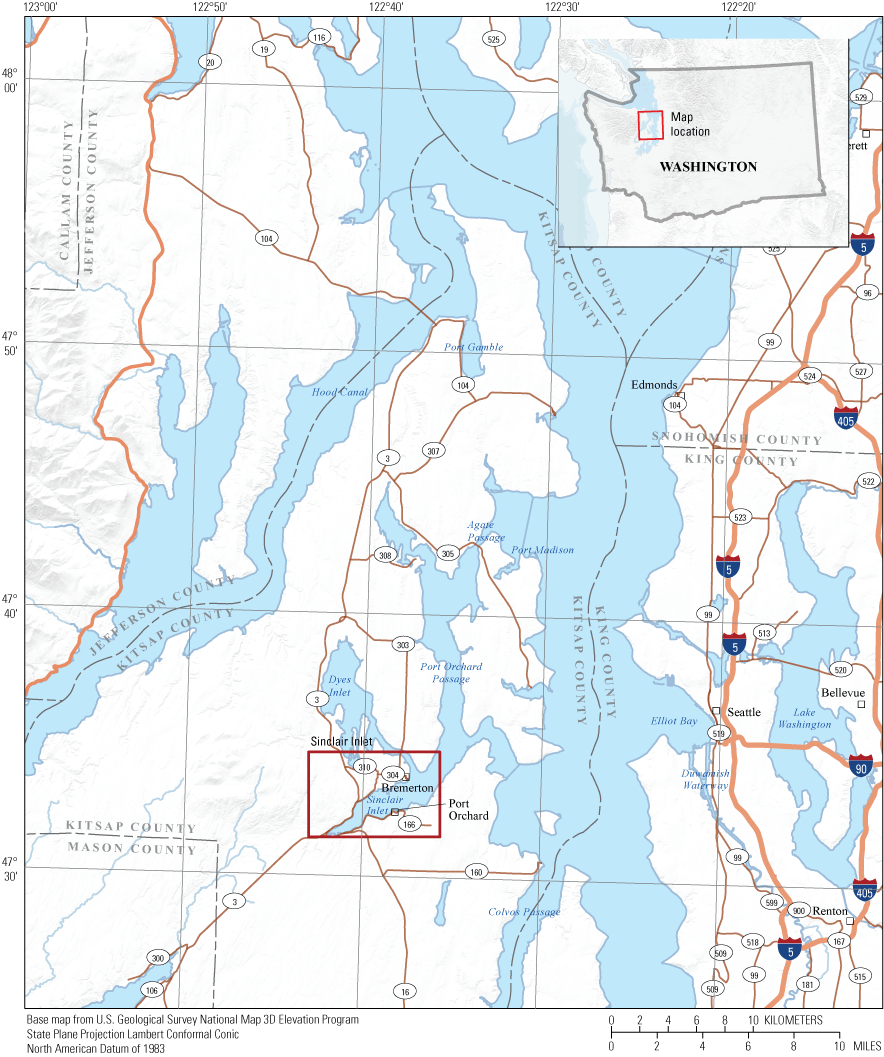
Bremerton Naval Complex (BNC) near the city of Bremerton, Washington, on the shoreline of Sinclair Inlet, Puget Sound, Washington.
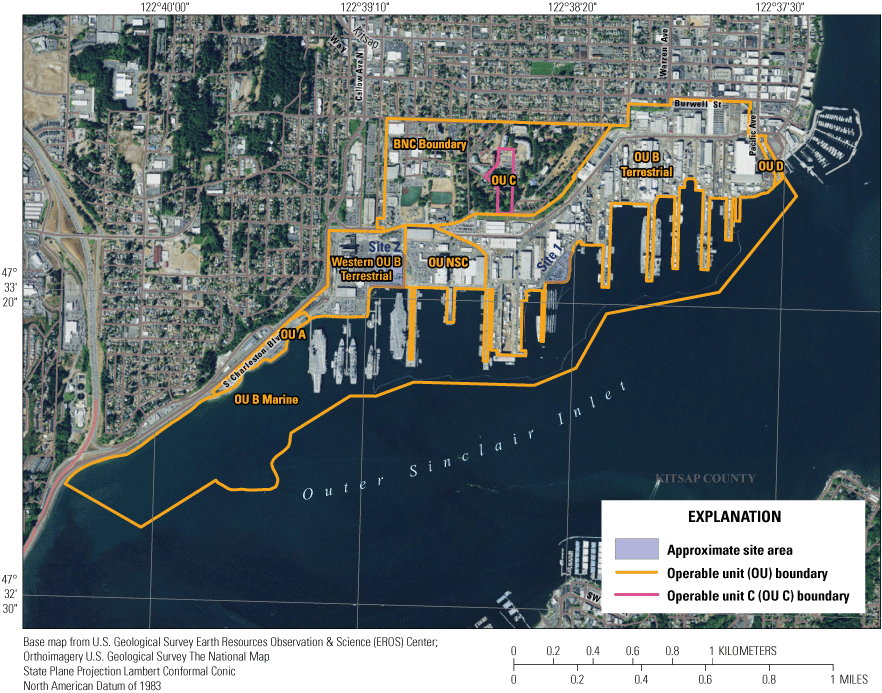
Locations of Operable Units, Bremerton Naval Complex, Puget Sound, Washington.
The final Record of Decision for the marine waters—OU B Marine (U.S. Navy and others, 2000)—included remedial actions such as isolating a considerable volume of contaminated sediment to result in reductions of polychlorinated biphenyl concentrations in fish tissue by placing dredge spoils from navigational and cleanup dredging in a covered confined aquatic disposal pit created in 2001. Remedial actions to manage contamination on the terrestrial BNC also have been completed on an Operable Unit basis (fig. 2; OU A; OU B Terrestrial; OU C; OU D; OU NSC) through Operable Unit-specific Records of Decision (U.S. Navy and others, 1996, 1997, 2004, 2005; U.S. Navy, 2007). Areas of contaminated subsurface soil and fill material remain in place on the terrestrial BNC, such as in Sites 1 and 2 in OUBT, OU NSC, and in nearshore areas of OU A, and in most locations have been paved over to minimize exposure and transport pathways.
Paulson and others (2012, 2013) assessed sources and sinks of mercury to Sinclair Inlet, including watershed sources, atmospheric deposition, exchange with Puget Sound, and the BNC. Mercury load estimates were calculated for filtered total mercury (FTHg) rather than for whole total mercury (WTHg = FTHg + particulate-bound total mercury [PTHg]), because there were limited PTHg data available and because only about 1 percent of the total mass of solids depositing in Sinclair Inlet had been quantified. As part of these and other previous studies conducted through 2013, three primary pathways were identified as having the capability to transport chemicals of concern from the terrestrial landscape of the BNC to the Sinclair Inlet marine environment after remediation, thus having the potential to contribute to the contamination of marine sediment as well as possible impacts to surface water and fish and shellfish tissue. The three pathways are (1) stormwater, (2) the dry dock systems, and (3) direct discharge of groundwater along unwalled shorelines (U.S. Navy and others, 2000).
The largest stormwater drain system on the BNC, PSNS015, passes through the soils of Site 2 and discharges to Sinclair Inlet (fig. 3). The 1.2-m diameter main line pipe runs perpendicular to the shoreline, with a complex network of side arms that drains a 0.41 square kilometer (km2) area (Paulson and others, 2012). During high tides, it serves as a conduit for landward seawater transport into the contaminated soils. Preferential extraction of mercury from Site 2 soils may occur through geochemical processes such as complexation with chloride in the seawater (Grassi and Netti, 2000). Extracted mercury is transported to Sinclair Inlet through the stormwater drain system and along the unwalled shoreline when the water level in Sinclair Inlet declines below the water level in the stormwater drain system (Paulson and others, 2012; Conn and others, 2018). Grab samples of water from main line vaults in 2009 included elevated mercury concentrations up to 144 nanograms per liter (ng/L) FTHg (Paulson and others, 2012). Conductivity was low in this high-mercury sample and the sample was presumed to be stormwater. Using this single value and extrapolated stormwater flow values, PSNS015 was identified as one of the largest estimated loads of filtered total mercury from the BNC to Sinclair Inlet (Paulson and others, 2012, 2013). Estimated loads were low in the remaining stormwater outfalls, based on low measured mercury concentrations in a single sample at each of 2 of the remaining 23 major outfalls on the BNC, and the smaller flows relative to the PSNS015 outfall.
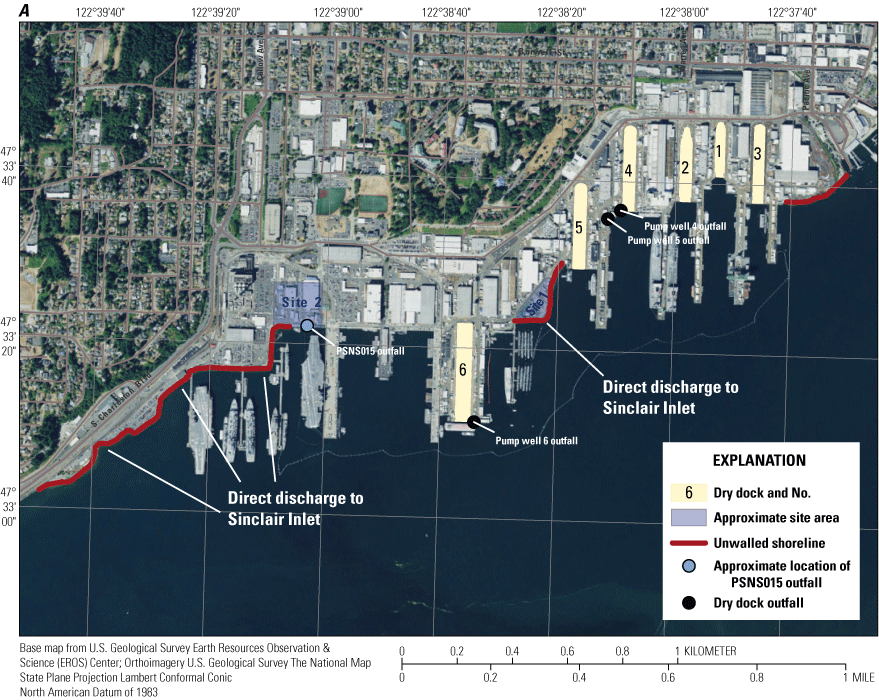
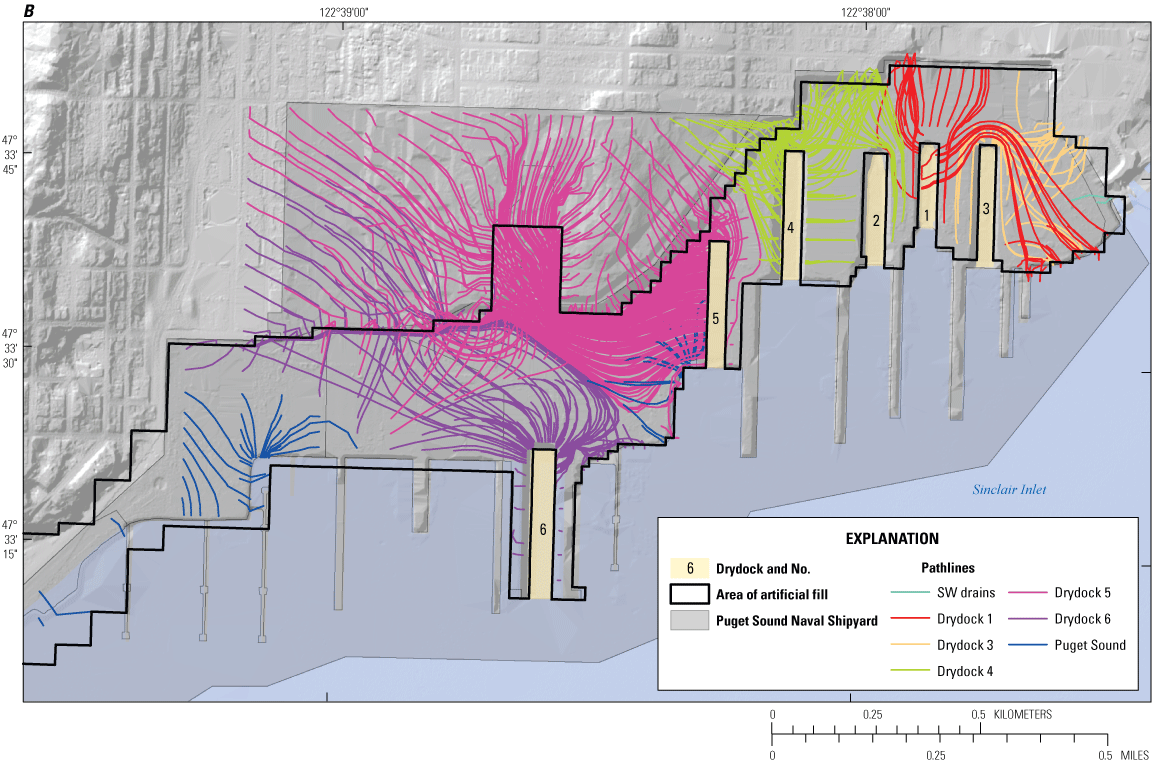
Known contaminated soils (Sites 1 and 2), stormwater and dry dock outfall locations, and unwalled shoreline segments where direct discharge may be occurring (A), and a particle tracking map representing groundwater flow lines, Bremerton Naval Complex, Washington (B). Figure 3B modified from Jones and others (2016).
The BNC contains six dry docks for the purpose of ship docking, maintenance, and repair (fig. 3). A series of pump systems keeps the docks dry while in use. As the dry docks are below ground surface and the pump wells are as deep as 13 m below ground surface, the pumping results in a zone of groundwater-level depression that captures most of the groundwater that would otherwise flow to Sinclair Inlet (Prych, 1997; Jones and others, 2016). Jones and others (2016) predicted the capture zone of the pumps through a groundwater particle-tracking simulation (fig. 3B). The pump systems discharge to Sinclair Inlet at three locations—one outfall serving Dry Dock 6 and two alternating outfalls—one at Dry Dock 4 and one at Dry Dock 5—that serve Dry Docks 1 through 5 (fig. 3). The water discharged to Sinclair Inlet through the dry dock pump systems is a mix of seawater and groundwater and the flow rates are highly variable depending on how many and the types of ships docked, special servicing and repairs, and precipitation. Variable concentrations of filtered total mercury (typically less than 10 ng/L) and mercury on particulates (up to 18 mg/kg) previously were measured in samples collected from the pump wells, although the source of mercury was not identified (Paulson and others, 2012). The dry docks were the second largest estimated filtered total mercury load from the BNC to Sinclair Inlet after stormwater outfall PSNS015 (Paulson and others, 2013). Data are needed to understand the sources of mercury in the dry dock pump wells.
In areas outside of the capture zone of the dry dock pump systems, there may be direct discharge of groundwater along unwalled shorelines (fig. 3), some of which are adjacent to contaminated subsurface materials (Site 1, Site 2, and OU A nearshore soils and fill material). Active remediation of groundwater was deemed not necessary during the Remedial Investigation (U.S. Navy, 2002). It was determined that the calculated chemical fluxes would have “very limited potential adverse future impacts on marine water and sediment of Sinclair Inlet” because it was assumed that (1) there would be negligible sorption of groundwater chemicals to marine sediments so sediment concentrations would never approach sediment management standards, (2) groundwater mixing in the inlet was instantaneous and dilution would keep water column concentrations well below water-quality criteria, and (3) the terrestrial source of contaminants would be depleted over time.” The results of the rolling trend analysis for long-term monitoring in OU A and western OUBT wells showed that, for most detected contaminants of concern, the concentration trend from 2006 through 2021 either exhibited a stable trend or an increasing trend, but in all cases, recent concentrations do not substantially differ from concentrations reported since monitoring began in 2002, including concentrations of various trace elements above the Remediation Goals or Compliance Criteria (table 1; fig. 4; U.S. Navy, 2017b; EA Engineering, Science, and Technology, Inc., PBC, 2022). Data are needed to assess the validity of the Remedial Investigation assumptions to better understand the role of direct discharge along unwalled shorelines in transporting trace elements from the terrestrial BNC to Sinclair Inlet. Groundwater discharge loads previously have not been estimated; therefore, contaminant loads from direct discharge previously have not been estimated.
Table 1.
Trace-element concentrations in nearshore monitoring wells measured by the U.S. Navy as part of its Long-Term Monitoring Program, Bremerton Naval Complex, Washington, 2021.[Data are from EA Engineering, Science, and Technology, Inc., PBC (2022). Locations of wells are shown in figure 4. Copper, nickel, and zinc results are for dissolved samples for OUBT wells; all other results are for “total” (unfiltered) samples. Reported concentrations are from a single sample. Goal or criteria exceedances are in bold (U.S. Navy 2017b). Abbreviations: ng/L, nanogram per liter; μg/L, microgram per liter. na, not analyzed]
Value is filtered total mercury from Paulson and others (2013).
Value is from the Remedial Investigation sampling (U.S. Navy, 2002).
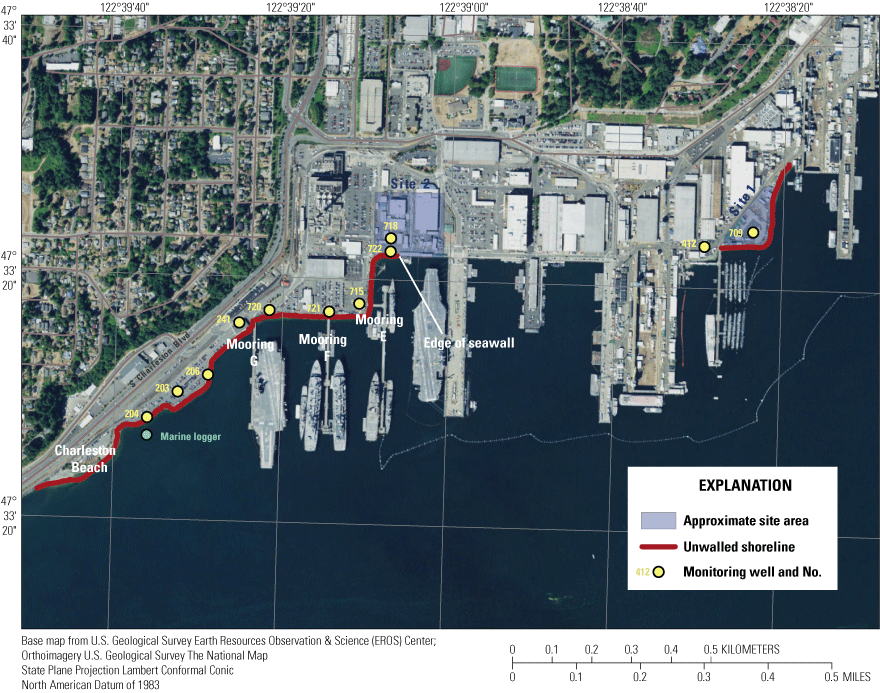
Aerial view of the western and central parts of the Bremerton Naval Complex with locations of 11 nearshore monitoring wells instrumented with U.S. Geological Survey (USGS) conductivity-temperature-depth sensors and one water level-temperature logger (Marine logger) in Sinclair Inlet, Washington.
Since the initial filtered total mercury load estimates (Paulson and others, 2012, 2013), the USGS, in collaboration with the U.S. Navy, has collected more than 200 samples for mercury and other parameters in stormwater (Conn and others, 2018) and the dry dock systems and nearshore environments (“Mercury in Sediments and in the Dry Dock system” and “Groundwater/Surface-Water Interactions along Unwalled Shorelines” in this publication and Opatz and others, 2023). Furthermore, the U.S. Navy has provided updated flow rates for the dry dock systems and the USGS has published a groundwater-flow model (Jones and others, 2016) and has published the model input and output files (Jones and others, 2024), including groundwater discharge estimates to Sinclair Inlet. This new information is integrated with the previous data to provide updated load estimates of FTHg as well as new estimates of PTHg to estimate WTHg.
FTHg in nanograms per liter is defined as all chemical forms of mercury in the filtrate passing through a filter of nominal pore size. A 0.7-µm nominal pore size quartz fiber filter (QFF) was used in previous USGS and U.S. Navy investigations and was used in three of the tasks described in this report—the mercury isotope sampling (task 1), the dry dock sampling (task 2), and the 2018–19 tidal studies in Site 1 soils (task 5). Results from the 2021 nearshore sampling at OU A and western OUBT (task 6) used a 0.45-µm nominal pore size cellulose nitrate filter to directly compare to the nominal pore size used in Clean Water Act regulatory standards as well as to other parameters in the study (for example, total suspended solids [TSS], trace elements, and dissolved organic carbon [DOC]). PTHg, in nanograms per liter, is defined as all chemical forms of mercury captured on the filter. Total mercury in an unfiltered water sample (WTHg, in nanograms per liter) is the sum of the filtered and particulate fractions:
Furthermore, total mercury (THg) on suspended solids [reported as milligram per kilogram (mg/kg)], is the particulate fraction divided by TSS, reported as milligram per liter, mg/L:
Similarly, filtered methylmercury (FMeHg, in nanogram per liter [ng/L]) is defined as methylmercury in the filtrate passing through a filter with either a 0.7- or 0.45-µm nominal pore size. Particulate methylmercury (PMeHg, in nanogram per liter) is defined as all chemical forms of mercury captured on the filter. Methylmercury in an unfiltered water sample (WMeHg, in nanogram per liter) is the sum of the filtered and particulate fractions:
Total and methylmercury measured in a solids sample are reported as STHg and SMeHg, respectively, in milligrams per kilogram.
In addition to measuring total and methylmercury in samples, the isotopes of mercury can be measured, and their ratios provide detailed information about mercury sources (Eckley and others, 2020). In the environment, mercury isotopes can undergo mass dependent fractionation, which is induced by physical, chemical, and biological transformations of mercury. In addition, mercury isotopes also can undergo mass independent fractionation, which typically records photochemical induced reactions including reduction and demethylation. These mass dependent and independent fractionations allow for information regarding mercury sources and transformations to be deciphered. Mercury stable isotope ratios of 202-mercury (202-Hg) have been used to track industrial-derived, non-point source runoff, and atmospheric deposition sources to the environment (Kwon and others, 2020; Tsui and others, 2020). Other mercury isotopes have been used to identify different mercury processes, including photochemical processing within the water column, denoted by 199-mercury (199-Hg), and long-range atmospheric transport, denoted by 200-mercury (200-Hg; Kwon and others, 2020; Tsui and others, 2020). The measurement of different mercury isotope ratios has allowed for the development of source apportionment models (Lepak and others, 2015; Janssen and others, 2021a) within aquatic systems as well as a diagnostic tool for contaminated site assessment (Reinfelder and Janssen, 2019; Janssen and others, 2021b).
The primary objective of the report is to update the Conceptual Site Model (Paulson and others, 2012, 2013) regarding hydrogeochemical processes occurring in the nearshore tidal mixing zone along unwalled shorelines that influence contaminant transport from the BNC to Sinclair Inlet. The information is used to better understand the role of direct discharge along unwalled shorelines in transporting terrestrially derived, legacy contaminants to the marine nearshore environment relative to the two other major soil and groundwater contaminant pathways: dry dock discharges and stormwater outfalls.
This was accomplished through six tasks:
-
(1) analysis of new (2018–19) and archived (2008–09) sediments from the BNC and Sinclair Inlet for mercury isotopes to support sourcing of mercury in Sinclair Inlet;
-
(2) sampling to identify the source of mercury within the dry dock wells in 2018;
-
(3) nearshore thermal surveys to identify potential groundwater discharge locations to Sinclair Inlet in 2020;
-
(4) time-series monitoring in nearshore wells to understand groundwater/surface-water interactions and the inland extent of the tidal mixing zone in 2018–19 and 2020–21;
-
(5) tidal studies of mercury and other parameters in two nearshore monitoring wells in Site 1 soils in 2018–19; and
-
(6) a spatial survey of trace elements and other parameters in nearshore monitoring wells, pore water, seeps, surface water and sediment along OU A and western OUBT in 2021.
Methods
Field Sample Collection
Task 1.—Mercury Isotope Sampling
Twenty-four environmental samples of new (2018–19) or archived (2008–09) particulate samples from the terrestrial BNC or surface sediment from Sinclair Inlet (OU B Marine and outer Sinclair Inlet) or representative bays in Puget Sound (table 2; fig. 5) were collected as described in Opatz and others (2023). The three representative bays are similar to Sinclair Inlet in size, depth, and geometry. Briefly, surface (0–2 centimeters [cm]) bed-sediment samples were collected by a boat-deployed box corer into plastic or glass containers. Particulate material was collected from floor troughs in Dry Docks 5 and 6 using a plastic spatula into plastic jars. Particulate material was collected from the bottom of monitoring wells (MW) 709, 412, and 722, which are in contaminated fill material, by lowering pre-cleaned polyethylene tubing to the bottom of the well and pumping the slurry into a jar. After settling, overlying water was decanted and the remaining particulate material was shipped for analysis. Samples were shipped frozen to the USGS Mercury Research Laboratory (MRL) in Middleton, Wisconsin. Samples were lypholized and homogenized prior to mercury concentration and mercury stable isotope analyses.
Table 2.
Total mercury and methylmercury concentrations and mercury stable isotope ratios in 2018–19 and archived 2008–09 sediment samples from the Bremerton Naval Complex and Sinclair Inlet, Bremerton, Washington.[Location: SI, OU B Marine or outer Sinclair Inlet; Bay, Representative Bay; BNC, Terrestrial Bremerton Naval Complex. Sample site short name: Location shown in figure 5. DD, dry dock; MW, monitoring well, PSEMP LT, Puget Sound Ecosystem Monitoring Program – Long-Term sampling site. Sample date: YYYY-MM-DD, year-month-day. Abbreviations and symbols: δ202 average, natural abundance mercury isotope '202-Hg', ratio relative to a reference standard (NIST 3133); Δ199 average, natural abundance mercury isotope '199-Hg', ratio data; na, not analyzed; ng/g, nanogram per gram; dw, dry weight. See Opatz and others, 2023 for method details and quality control information]
Mercury isotope sampling locations from the Bremerton Naval Complex and Sinclair Inlet, Bremerton, Washington.
Task 2.—Dry Dock Sampling
Twenty-six water samples were collected in November 2018 from within the dry dock system to identify the source of mercury previously measured in pump well samples. The pump well water is a composite of groundwater, seawater, and, when a nuclear ship is in dock, cooling water (recirculated Sinclair Inlet seawater). Drainage relief tunnels along the east and west walls of the dry docks drain water seeping from the walls (table 3; fig. 6A) into the pump well and out to Sinclair Inlet through the drainage system (fig. 6B). When Sinclair Inlet seawater is circulated through a nuclear ship in dock as non-contact cooling water, the water, called auxiliary seawater, also is collected in the wet well and pumped back out to Sinclair Inlet (fig. 6B). In a separate system called the process water collection system (fig. 6B), floor troughs along the east and west walls of the dry docks drain water that accumulates in the dry docks themselves, including precipitation, process water during ship maintenance activities, and floor seep water. This process water is passed through sand traps before typically being discharged to the City of Bremerton, although on rare high flow or turbidity occasions (see fig. 6B) it is discharged directly to Sinclair Inlet.
Table 3.
Total mercury concentrations in the dry dock systems, Bremerton Naval Complex and Sinclair Inlet, Washington, November 2018.[Abbreviations: μS/cm, microsiemens per centimeter at 25 degrees Celsius; mg/L, milligram per liter; ng/L, nanogram per liter; mg/kg, milligram per kilogram dry weight. –, not analyzed; Dates are presented as YYYY-MM-DD, year, month, day]
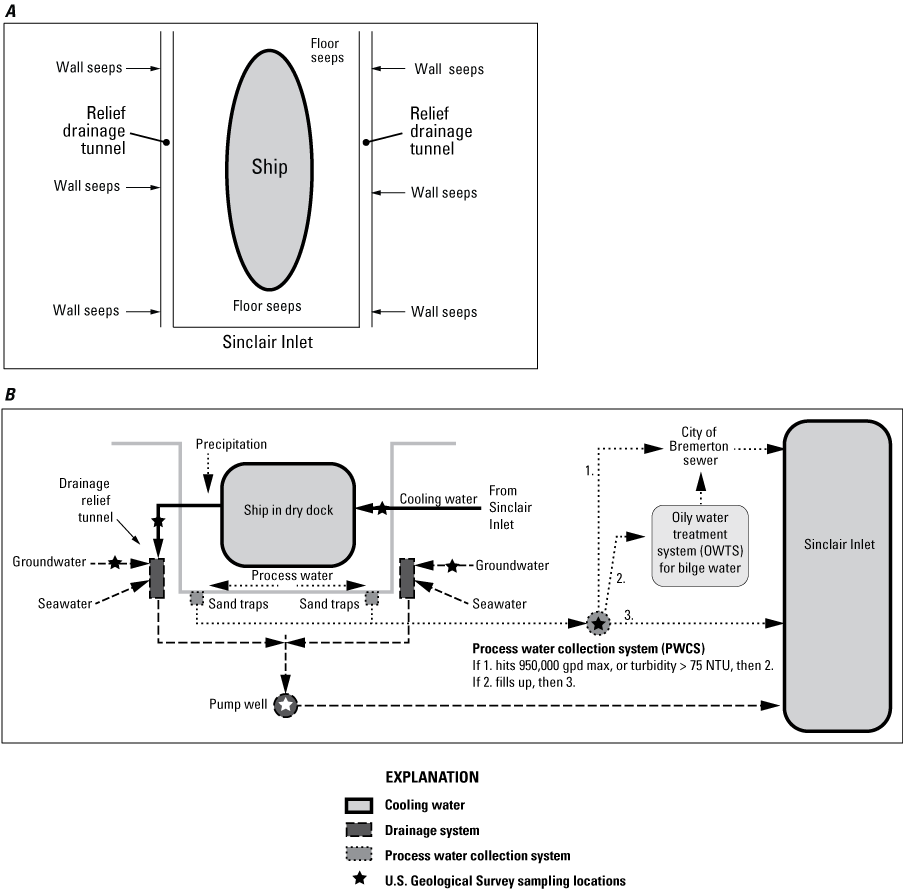
Aerial (A) and transverse (B) dry dock flow diagrams and U.S. Geological Survey sampling locations.
Grab samples for specific conductance, TSS, and mercury (table 3) were collected into polyethylene terephthalate glycol (PETG) bottles from wall seeps of the drainage relief tunnels in Dry Docks 5 and 6, one floor seep in Dry Dock 6, the pump wells for Dry Docks 4 and 6, the cooling water intake and auxiliary seawater for Dry Dock 6, process water from Dry Docks 3, 5, and 6 (all shown in fig. 6) and drainage water from Dry Dock 1+2+3 (not shown in fig. 6). Samples were stored on ice until further processing at the USGS Washington Water Science Center (WAWSC) in Tacoma, Washington (see section, “Field Processing”).
Task 3.—Thermal Surveys
Thermal surveys were conducted along the western unwalled shoreline of the BNC from Charleston Beach to the edge of the seawall to identify cold-water locations that may indicate groundwater discharge locations for potential contaminant sampling in the task 6 spatial survey (fig. 7). The OU A part of the unwalled shoreline was surveyed with a georeferenced fiber-optic distributed temperature sensing (FO-DTS) cable from July 30 to August 7, 2020 (fig. 7A). This data collection window targeted daytime negative low tides coincident with high daytime air temperatures (up to 28 degrees Celsius [°C] on August 4, 2020) to maximize temperature differentials between cold discharging groundwater and warm receiving surface water. The daytime negative low tides ranged from approximately −3 to −5 feet (ft) NAVD 88. Elevations are presented in ft NAVD 88 in this report, where elevations in Mean Lower Low Water are elevations in NAVD 88 plus approximately 2.5 ft. Temperature was recorded every 15 minutes at 1.01 m spacing along the 1,500 m Sensornet Oryx DTS FO-DTS cable. Cable deployment configuration was an out-and-back U-shape with approximately 2 m distance between the parallel cable lengths. The cable was geolocated with a global positioning system every 45 m to maintain constant elevation during cable deployment. The elevations were approximately −2.5 to −7.5 ft NAVD 88 on the outbound cable and approximately −3.5 to −8.5 ft NAVD 88 on the return cable.
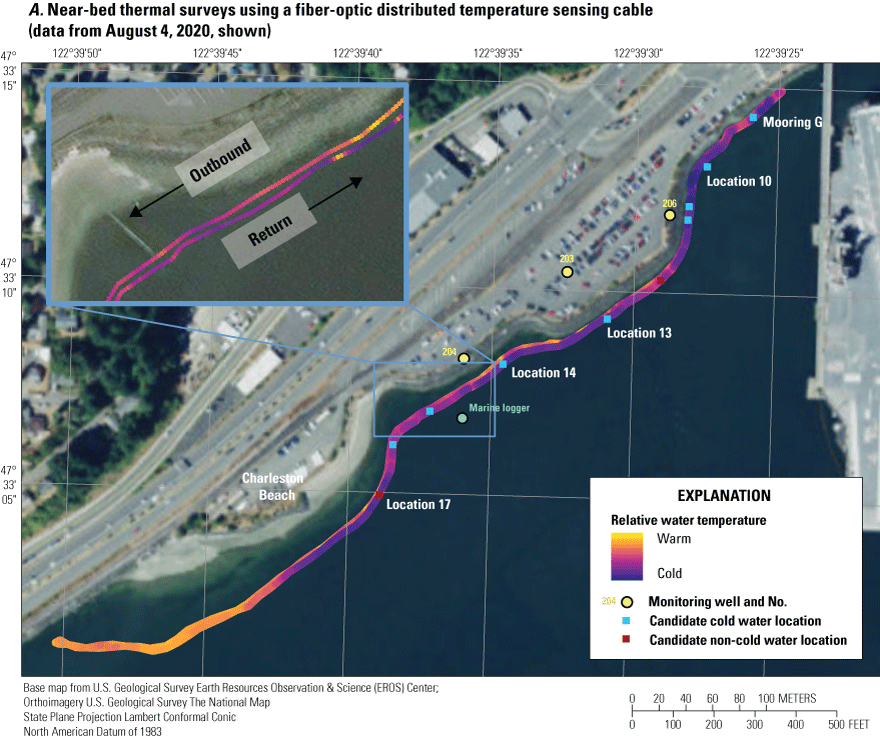
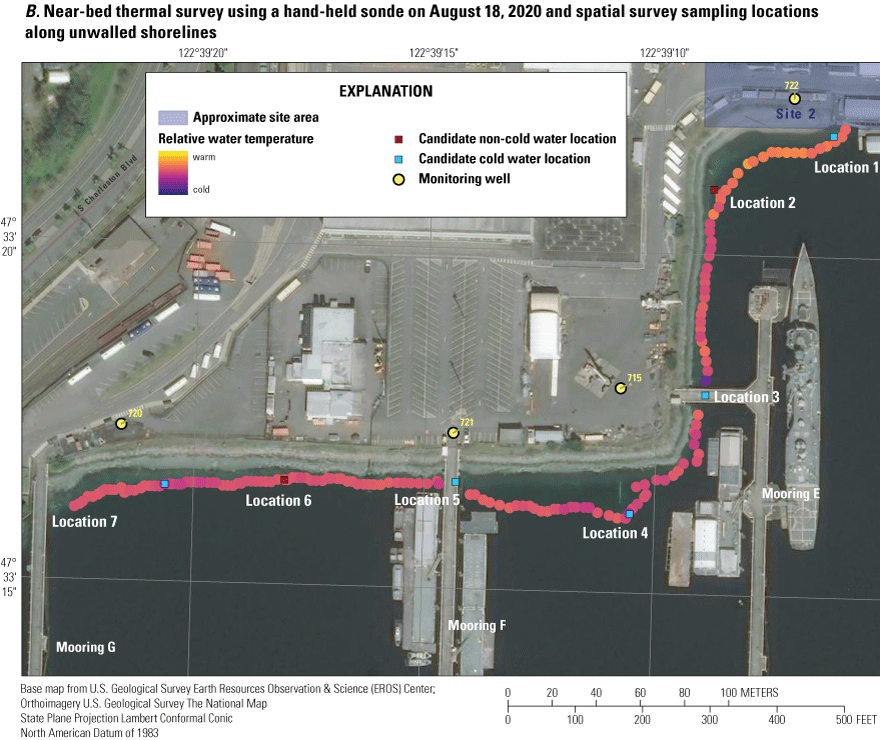
Near-bed thermal surveys using (A) a fiber-optic distributed temperature sensing cable (data from August 4, 2020, shown) and (B) a hand-held sonde on August 18, 2020, Sinclair Inlet, Washington, and spatial survey sampling locations along unwalled shorelines. Labeled locations were selected for water-quality sampling in the 2021 spatial survey. Multiple types of samples may have been collected at a single location, including porewater (PW), seep (Seep), surface water (SW), and sediment (Sed). Unlabeled candidate locations were not selected for water-quality sampling.
The FO-DTS could not be deployed in the western OUBT portion because of shipyard piers and spill-containment buoys. Instead, during a negative low tide on August 18, 2020, a georeferenced temperature survey with a calibrated multi-parameter sonde (600XLM, YSI, Inc.) was conducted on foot from the westernmost pier (Mooring G) to the edge of the seawall (fig. 7B). Approximately 150 survey points and nearbed water temperature measurements at 10-foot spacings were made at elevations ranging from approximately −2.5 to −6 ft NAVD 88. Additional method details, the original data files, and quality assurance and control procedures for both thermal surveys are available in Opatz and others (2023).
Task 4.—Time-Series Data Collection in Nearshore Monitoring Wells
To support the tidal studies (task 5), two monitoring wells in Site 1 soils—MW709 and MW412 (table 4; fig. 4)—were instrumented with internally logging sensors for 15-minute data collection of water level, water temperature, and specific conductance from June 2018 to February 2019. Two instruments were in each well—one approximately 2 ft above the bottom of the well (“bottom”) and one on a float to remain approximately 1 ft below the water surface (“surface”) regardless of the tidally fluctuating water level in the wells. Field deployment details and quality assurance methods are included in Opatz and others (2019).
To support the nearshore spatial survey (task 6), nine nearshore wells in OU A and western OUBT were monitored for time-series water level, water temperature, and specific conductance from June 2020 through October or November 2021 (table 4; fig. 4). A tenth instrument was deployed in the Sinclair Inlet nearshore and recorded water level and water temperature over the same data collection period (“Marine Logger”). An Aqua TROLL 200 (In Situ, Fort Collins, Colorado) was located approximately 2 ft above the bottom of each well. Although the time-series data are assigned to the “surface” station ID at each well (table 4), the instrument was located near the bottom of the well. At the “Marine Logger” site, a Rugged TROLL 100 (In Situ, Fort Collins, Colorado) was installed approximately 0.25 ft above the sediment-water interface near Charleston Beach (−6.5 ft NAVD 88; fig. 4). Parameters were internally logged every 15 minutes and site visits occurred approximately every 3 months to download data and clean and inspect the instrumentation. Pressure was corrected to local atmospheric pressure from a BaroTROLL (In Situ, Fort Collins, Colorado) installed in the MW203 vault. Records were analyzed and approved per USGS methods (Wagner and others, 2006; Cunningham and Schalk, 2011; U.S. Geological Survey, 2017) and are published in NWIS (U.S. Geological Survey, 2022).
Table 4.
Location and construction information for the marine logger and nearshore monitoring wells used for time-series and discrete water-quality data collection, Bremerton Naval Complex, Sinclair Inlet, Washington.[Locations of wells are shown in figure 4. The measuring point from which water level is measured is the top of the polyvinyl chloride casing for the wells and is the steel plate on the bed sediment surface for the marine logger. The time-series instrument was located approximately 2 feet above the bottom of each of the wells but assigned to the “surface” station ID. Discrete water-quality samples were collected approximately 1 foot below water surface from “surface” sites and approximately 2 feet above the bottom of the well from “bottom” sites. Abbreviations: USGS, U.S. Geological Survey; ID, identification; --, no data; ft, feet; NAVD 88, North American Vertical Datum of 1988; YYYY-MM-DD, year, month, day]
Task 5.—Tidal Studies in Two Monitoring Wells in Site 1 Soils, 2018–19
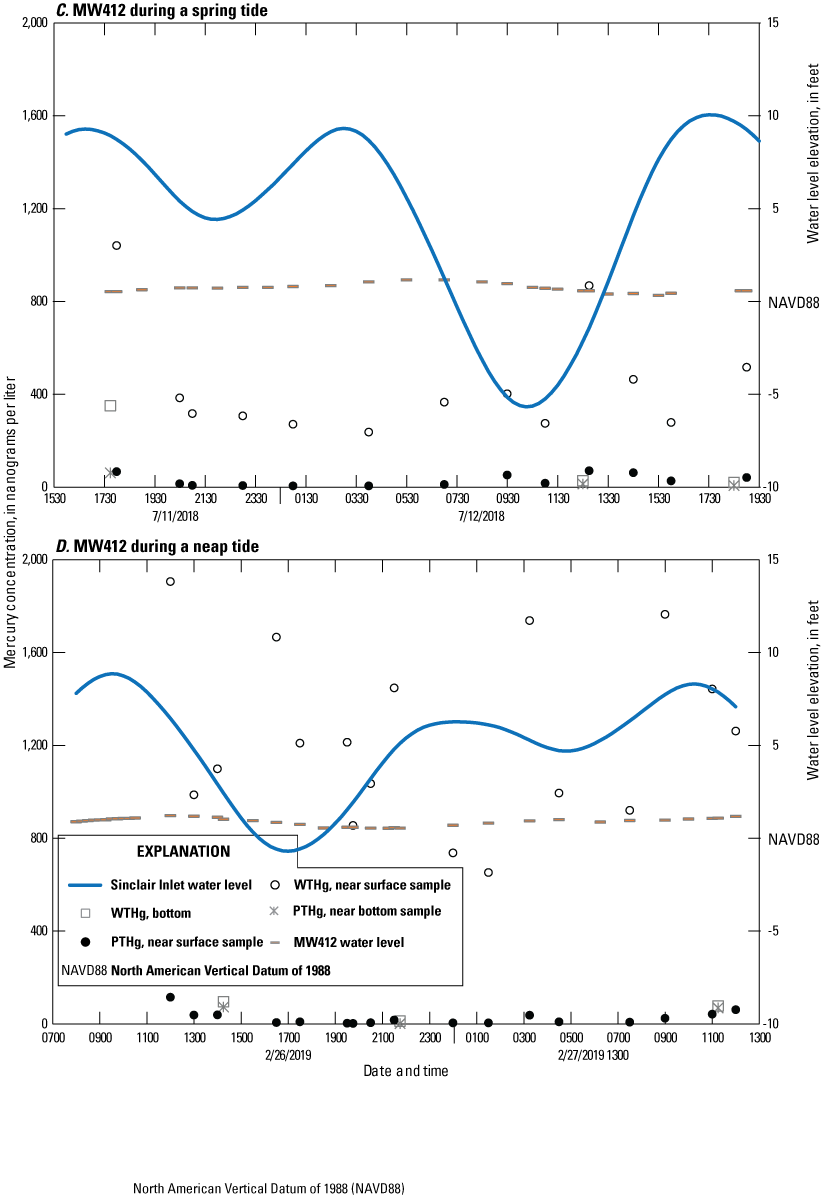
Two sets of 25-hour tidal studies—one during a spring tide and one during a neap tide—were conducted at wells MW709 and MW412 in Site 1 soils (table 4; fig. 4). The goal was to better understand tidally driven mercury concentrations in this area of the BNC where some of the groundwater appears to be captured by the dry dock systems while some may be outside of the capture zone and instead discharge directly to Sinclair Inlet. Hourly water samples were collected on July 11–12, 2018, over a 15-ft spring tidal differential from just below the water surface in both wells for specific conductance, mercury, and TSS. Three samples from near the bottom of the well also were collected. The water level was periodically measured to keep the sampling port just below the water surface. Prior to the first sample collection, the well was purged and field parameters, including water temperature and specific conductance, were monitored using a calibrated sonde until readings stabilized (consecutive readings were within 3 percent of each other). The 25-hour tidal studies were repeated on February 26–27, 2019, during a 9-ft neap tidal differential. Specific conductance was recorded on-site; TSS and mercury bottles were stored on ice until processing at the WAWSC (see section, “Field Processing”). In total, 81 samples were analyzed.
Task 6.—Spatial Survey of Trace Elements and Other Parameters along Unwalled Shorelines of Operable Unit A and Western Operable Unit B-Terrestrial, 2021
A spatial survey of nearshore groundwater, pore water, overlying surface water, seeps, and sediment along the unwalled shorelines of OU A and western OUBT was conducted in 2021 to better understand the potential transport of terrestrial contaminants to Sinclair Inlet via groundwater. The sampling windows targeted maximum groundwater discharge to the nearshore, presumed to be during the negative low tides, and occurred on March 30–April 1, April 26–29, May 24–27, June 8, and June 10, 2021. The groundwater locations included the nine wells in OU A and western OUBT that were instrumented for time-series data collection during the same time period (MW204, MW203, MW206, MW241, MW720, MW721, MW715, MW722, and MW718; table 4; fig. 4). The nearshore locations included 10 locations identified during the thermal surveys as cold-water discharge locations or adjacent non-cold-water locations selected for comparison purposes (locations 1, 2, 3, 5, 6, 7, 10, 13, 14, and 17; table 5; figs. 7A and 7B). A porewater sample was collected at each of the 10 nearshore sites and, in some cases, additional samples, including overlying surface water, seeps, additional pore water, and sediment, also were collected (table 5). One nearshore location and an adjacent groundwater well were concurrently sampled on each day over 11 days plus pre-sampling in-field method testing and 2 days of follow-up repeat sampling. In total, 49 water samples and 5 sediment samples were collected from the 19 locations (tables 4 and 5), including approximately 10 percent quality-control samples (see section, “Quality Assurance and Control”).
Table 5.
Summary of nearshore sampling locations used in the spatial survey of trace elements and other parameters along unwalled shorelines, Sinclair Inlet, Washington, 2021.[Locations of nearshore sampling sites are shown in figures 7A and 7B. Sediment samples were collected on May 25–26, 2021. Abbreviations: ID, identification number; USGS; U.S. Geological Survey; ft, feet; NAD 83, North American Datum of 1983; NAVD 88, North American Vertical Datum of 1988. Water sample collection date: YEAR-MONTH-DAY. Type of sample collected: PW, pore water; SW, surface water; FD, field duplicate; EB, pore water equipment blank; Sed, surface sediment; --, no sample collected; near, closer to shore than the primary sampling location; far, farther offshore than the primary sampling location; deep, pore water collected 3 feet below the sediment-water interface (as compared to 8 inches for the primary pore-water samples)]
At each groundwater well, two water-level measurements were taken upon arrival, then two sampling ports were deployed—one approximately 1 ft below the water surface (to sample a freshwater layer, if present) and the other approximately 2 ft above the bottom of the well (to sample the seawater layer, if present). The sampling ports were made of slotted Teflon attached to Teflon tubing that was attached to peristaltic pump tubing on the land surface. Well water was purged through both ports at a low-flow rate [approximately 100 milliliters per minute (mL/min) to purge 4 to 11 liter (L) total from each port]. While purging, field parameters of pH, oxidation-reduction potential, water temperature, dissolved oxygen, specific conductance, and turbidity were monitored using a calibrated multi-parameter sonde (In Situ AquaTroll 600, Fort Collins, Colorado) until readings stabilized (consecutive readings were within 3 percent of each other).
Samples for chemical analysis were collected by low-flow peristaltic pump (approximately 100 mL/min) to reduce the potential to induce flow from other locations within the sand pack surrounding the well screen. Unfiltered samples were collected per USGS field collection protocols (U.S. Geological Survey, 2002, 2006; Lewis and Brigham, 2004) for field sulfide and total iron (Chemetrics, Midland, Virginia), radon, trace elements (arsenic, cadmium, chromium, copper, lead, manganese, nickel, and zinc), including a separate PETG bottle for mercury, and TSS. Filtered samples were collected through a pre-conditioned 0.45-µm filter into bottles for trace elements (arsenic, cadmium, chromium, copper, lead, manganese, nickel, and zinc); cations (calcium, magnesium, sodium, iron, manganese, and potassium); anions (chloride, silica, sulfate, and fluoride); alkalinity, DOC, and stable isotopes of water. Stable isotopes of hydrogen and oxygen in water samples can be used to better understand groundwater/surface-water interactions, such as the relative proportion of a water sample comprised of groundwater versus surface water. Results are reported as the relative difference between isotopes—δ(2H/1H) and δ(18O/16O) in parts per thousand (or per mil), where a negative value indicates that the sample is depleted in the heavy isotope relative to the international measurement standard (Révész and Coplen, 2008a, 2008b).
Concurrent with groundwater sampling, nearshore sampling occurred via a boat and floating pontoon. At each candidate groundwater discharge location (figs. 7A and 7B), hydraulic gradient was repeatedly measured in the 2 hours leading up to low tide using a manometer board to confirm groundwater discharge to the nearshore (that is, a positive hydraulic gradient) per USGS methods (Rosenberry and LaBaugh, 2008). Once a positive hydraulic gradient was confirmed, a custom direct-push stainless steel pore-water sampler (fig. 8) was installed approximately 8 in. below the sediment-water interface within a target bed-surface elevation range of 0 ±10 ft NAVD 88. The pore-water sampling depth of 8 in. below the sediment-water interface targeted existing forms of mercury (and other parameters) presumably sourced from the terrestrial environment rather than from overlying water. The target vertical elevation band encompassed the elevations of cold-water locations identified during the thermal surveys (generally from 0 to −10 ft NAVD 88) and historical sediment trace-element concentration exceedances in intertidal sediments near Charleston Beach (generally from −2.5 to +8.5 ft NAVD 88; CH2M, 2020). The exact location of each sampling location was determined by substrate suitability—a cobble- and boulder-free area of mostly silt and fine sediment was needed to push the pore-water sampler to the desired depth and attain a surface seal with a compressible foam seal to reduce potential inflow of surface water at the sediment-water interface. The horizontal coordinates and vertical elevation of each nearshore location were determined using a Trimble R8 GPS receiver with a Trimble survey controller handheld device. Data were collected using the real-time kinematic method. Real time corrections were obtained using a MiFi jetpack to access the Washington State Reference Network Puget Region SubNet per Rydlund and Densmore (2012).
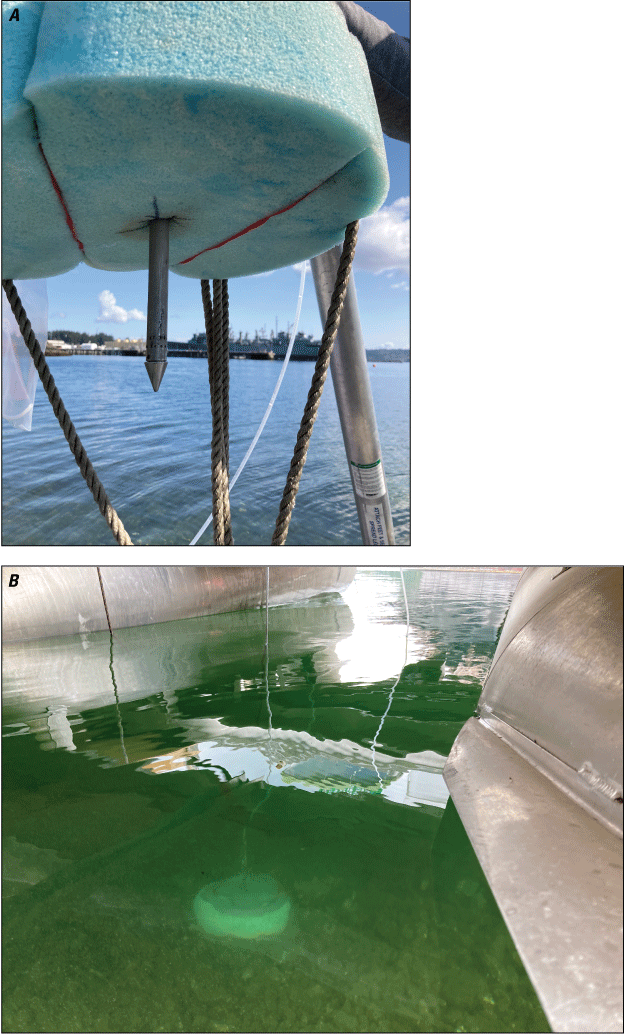
Photographs of (A) custom pore-water sampler with foam surface seal (B) installed in the nearshore to collect pore water from 8 inches below the sediment-water interface. The sampler was designed in 2021 by Steve Cox, U.S. Geological Survey.
Pore water was pumped through Teflon tubing inserted into the stainless-steel sampler at a low flow rate (less than 100 mL/min) to purge (less than 500 milliliters [mL]), measure field parameters, and collect water samples for chemical analysis. Unfiltered water samples were collected for radon and mercury. Filtered water samples were collected through a pre-conditioned 0.45-µm filter for trace elements, cation, anions, alkalinity, DOC, and stable isotopes of water. At three nearshore locations (nearshore locations 1, 6, and 10), samples of overlying surface water also were collected via peristaltic pump. Opportunistic samples of visible seeps were collected at four locations—at the edge of the seawall and under each of the three piers (nearshore locations 1, 3, 5, and 7). At two locations (nearshore locations 1 and 7), two additional porewater samples were collected along a transect perpendicular to the shoreline (targeting −10 ft and +10 ft NAVD 88). At one location (nearshore location 17), a deep pore water sample was collected from 3 ft below the sediment-water interface in addition to the 8-inch-deep sample. Five sediment samples were collected by a hand-push corer into perfluoroalkoxy (PFA) jars for total and methylmercury analysis, WhirlPak bags for analysis of grain size and organic carbon, and Whirl-Pak bags for further processing at the WAWSC laboratory before analysis for trace elements and ions. Due to the coarse nearshore substrate, sediment samples were only able to be collected at nearshore locations 1, 2, and 7.
Field Processing
During the nearshore spatial survey, field processing per USGS methods (U.S. Geological Survey, 2018) occurred in a mobile laboratory at the field site. Alkalinity was determined using the inflection-point method. Bottles for radon were shipped overnight to the USGS National Water Quality Laboratory (NWQL) for immediate analysis. Filtered and unfiltered water samples for trace elements analysis were acidified to pH <2 with nitric acid. Filtered samples for DOC were acidified to pH <2 with sulfuric acid. The sample bottles were stored in sealed bags on ice and transported to the WAWSC for any additional processing before shipping.
For dry dock sampling, tidal studies, and spatial survey, unfiltered water samples for mercury were processed at the WAWSC in a laminar-flow hood for mercury (Lewis and Brigham, 2004). Briefly, the samples were filtered through a filter held in a Savillex PFA filtering tower assembly into a 250- or 500-mL PFA or PETG bottle for FTHg or FMeHg analysis. The filtrate was 2 percent acidified with 6 molar hydrochloric acid within 6 hours of sample collection. The filters were transferred to PFA petri dishes and stored frozen for PTHg analysis. The process was repeated for FMeHg and PMeHg when applicable. Bottles were stored in the dark at room temperature and shipped to the USGS MRL for analysis.
The TSS was measured for dry dock sampling, tidal studies, and the spatial survey at the WAWSC. An aliquot was filtered gravimetrically through a 0.4-µm pore-size, 47-millimeter (mm) diameter, Nuclepore polycarbonate filter and determined to a precision of 0.001 milligram (mg), (Huffman and others, 2012).
For the nearshore survey, Whirl-pak bags of sediment for grain size and organic carbon analysis were shipped to the USGS Pacific Coastal Marine Science Center (Santa Cruz, CA). Sediment samples for analysis of trace elements and ions (arsenic, cadmium, calcium, chromium, copper, iron, lead, magnesium, manganese, nickel, potassium, sodium, and zinc) were dried at the WAWSC before shipping to AGAT Laboratories, Calgary, Canada. Samples of filtered water were shipped to the USGS Reston Stable Isotope Laboratory for analysis of stable isotopes of oxygen and hydrogen in the water molecule.
Analytical Methods
At the MRL, FTHg was determined using U.S. Environmental Protection Agency (EPA) method 1631, revision E (Environmental Protection Agency, 2002) that includes oxidation, purge and trap, desorption, and cold vapor atomic fluorescence spectrometry. FMeHg was measured using a modified version of EPA method 1630 (Environmental Protection Agency, 1998), which included distillation pre-treatment followed by ethylation, gas chromatography separation, and analysis by isotope dilution inductively coupled plasma mass spectrometry (ICP-MS; Jackson and others, 2009). The method detection limits for FTHg and FMeHg were approximately 0.05 and 0.04 ng/L, respectively.
Filters for PTHg analysis were prepared by oxidation with 5-percent bromine monochloride (weight per volume percentage) and heated for 5 days at 50°C (Olund and others, 2004) prior to analysis using cold vapor atomic fluorescence spectrometry (Environmental Protection Agency, 2002). Filters for PMeHg were prepared by distillation coupled to ethylation, gas chromatography separation, and ICP-MS detection (DeWild and others, 2004; Jackson and others, 2009). The method reporting limit was approximately 0.05 ng mercury per filter for PTHg and 0.04 ng methylmercury per filter for PMeHg.
STHg was determined by atomic adsorption following direct combustion (Environmental Protection Agency, 1998). SMeHg was determined by distillation, gas chromatography separation, and speciated isotope dilution mass spectrometry (Jackson and others, 2009). Sediment and particulate samples for mercury stable isotopes were digested in concentrated aqua regia (3:1 hydrochloric and nitric acids) for 8 hours at 90°C. After digestion, samples were filtered to remove any remaining particulate material and diluted to a final acid content of 10 percent (weight per volume).
Mercury stable isotope analysis was performed using a multicollector ICP-MS using operating protocols outlined elsewhere (Yin and others, 2016; Janssen and others, 2019). Mercury stable isotope values are reported in δ notation (for example, δ202Hg) for mass dependent fractionation and Δ notation (for example, Δ199Hg or Δ200Hg) for mass independent fractionation following standard nomenclature (Blum and Bergquist, 2007).
At the NWQL, 222Radon was determined by Standard Method D5072-98 (American Society for Testing and Materials, 1998). Dissolved organic carbon was determined by Standard Method 5310B (American Public Health Association, 1992). Major ions were determined by ion chromatography or inductively coupled plasma chromatography (Fishman and Friedman, 1989). Trace elements were determined by ICP-MS (Garbarino and others, 2006).
Stable isotopes of water were determined at the USGS Reston Stable Isotope Laboratory in Reston, Virginia, using an isotope-ratio mass spectrometer (Révész and Coplen, 2008a, 2008b).
Sediment samples were analyzed for grain-size analysis and carbon contents at the USGS Pacific Coastal and Marine Science Center sediment laboratory and for elements at AGAT Laboratories as described in Opatz and others (2023).
Quality Assurance and Control and Data Management
Equipment selection and cleaning, preparation for sampling, and sample collection and processing procedures were in accordance with USGS protocols (U.S. Geological Survey, 2018), including those for low-level mercury (Lewis and Brigham, 2004). Sondes were calibrated each morning before use per manufacturer guidelines. Time-series instruments were calibration-checked at the WAWSC prior to and following deployment. The instruments were operated and maintained per USGS protocols, including in-field cleaning and calibration checks (Wagner and others, 2006; U.S. Geological Survey, 2017). Field notes, field parameters, and laboratory results were reviewed by WAWSC personnel.
Quality-control samples for the tidal studies and spatial survey were collected at approximately 10 percent frequency, including equipment blanks, field blanks, and field replicates, in addition to laboratory quality control samples, including laboratory blanks and replicates, and spike and reference samples. Quality-control results were acceptable for mercury isotopes and sediment grain size, sediment organic carbon, and sediment trace-element analyses, as described in Opatz and others (2023). Quality control results for dry dock sampling, Site 1 tidal studies, and the spatial survey are summarized below and presented in appendix 1.
The MRL participates in inter-laboratory comparisons for testing for total mercury in water through the biennial USGS Standard Reference Sample project and the annual external National Atmospheric Deposition Program Precipitation Chemistry Quality Assurance assessment (Wetherbee and Martin, 2020). Performance in the USGS Standard Reference Sample project during the study period (2018–2022) was acceptable—the MRL result was less than 10 percent different from the Most Probable Number. Results from the Precipitation Chemistry Quality Assurance assessment also yielded acceptable results. Internal quality-control samples also met acceptance criteria, including mean analytical blanks for FTHg and PTHg (<0.04 ng/L), mean distillation blanks for FMeHg and PMeHg (<0.01 ng/L), and mean combustion blanks for STHg and SMeHg (<0.03 and <0.01 ng/g, respectively). Spike recoveries ranged from 90 to 110 percent. Reference materials (Certified reference materials SQC-1238, International Atomic Energy Agency [IAEA]-158, IAEA-405, and IAEA-456) recoveries ranged from 75 to 110 percent. The difference between laboratory duplicates was less than 10 percent. Mean on-going check of calibration ranged from 98 to 108 percent. Secondary standard (National Institute of Standards and Technology RM8610) and certified reference material (National Research Council of Canada MESS-4) for mercury stable isotope measurements were within measured ranges reported in the literature (Lepak and others, 2015).
The USGS National Water Quality Laboratory (NWQL) quality-control sample results indicated acceptable performance of analyses for trace elements, major ions, 222radon, and DOC. The NWQL participates in the USGS Standard Reference Sample project and results were within 10 percent of the Most Probable Number during the study period for major ions and elements except for one chromium sample (−12 percent) and one copper sample (−18 percent). The NWQL also participates in the USGS Inorganic Blind Sample Project where double-blind samples are submitted for analysis throughout the year and are deemed acceptable if the results fall within ±2 Quality Control Units (QCUs) of the target value. During the study period, results for most ions and elements were within ±2 QCUs, with a few exceptions (about five fluoride samples, one potassium sample, one copper sample, and two nickel samples). Percent recoveries in approximately 50 spike samples during the study period were from 80 to 120 percent with a few exceptions—fluoride recoveries appeared high biased, ranging from 100 to 152 percent; one exceedance each for potassium (filtered: 301 percent at the lowest concentration standard), silica (filtered: 68 percent), cadmium (filtered: 158 percent at the lowest concentration standard), chromium (filtered: 285 percent; unfiltered: 329 percent, both at the lowest concentration standard), copper (filtered: 79 percent at the lowest concentration standard), manganese (filtered: 15.4 percent), and three unfiltered nickel samples (78, 126, and 127 percent). Results from blind blank samples (approximately 48 samples from October 2020 to September 2021) were 0 to 2 false positives. Instrumentation blanks, Continuous Calibration Verifications, and 3rd Party Checks were acceptable for 222radon and DOC during the study period. These laboratory quality control results were deemed acceptable, and no additional censoring was applied to the data in the report.
Although the laboratory quality control results for chromium were acceptable, chromium results from this study are not reported, owing to apparent saltwater matrix interference. Saltwater samples were diluted by the analytical laboratory prior to analysis, and the reporting levels for the resulting analyses were too high to provide meaningful information.
The USGS Reston Stable Isotope Laboratory intersperses two international measurement standards for stable isotopes of water (Vienna Standard Mean Ocean Water and Standard Light Antarctic Precipitation) and local laboratory isotopic reference waters into analytical runs. Samples are re-run if they do not meet acceptable criteria (precision and accuracy ±1 per mil [‰], and memory between sample containers is less than detection: ±1 ‰) so all transmitted laboratory data have met acceptable criteria.
A 0.7-µm nominal pore size QFF was used in the mercury isotope sampling (task 1), the dry dock sampling (task 2), and the 2018–19 tidal studies in Site 1 soils (task 5). These results compare directly to results from previous USGS and Navy investigations, which used a 0.7-µm nominal pore size QFF. Results from the 2021 nearshore sampling at OU A and western OUBT (task 6) used a 0.45-µm nominal pore size cellulose nitrate filter to directly compare to Clean Water Act regulatory standards as well as to other parameters in the study (for example, TSS, trace elements, and DOC).
Horizontal and vertical location data were reviewed to meet a Level IV survey for real-time positioning (table 11 in Rydlund and Densmore, 2012; see additional details in Opatz and others, 2023).
Data used in this report are publicly available in the USGS National Water Information System (U.S. Geological Survey, 2022) by station ID (tables 2–5). This includes:
-
• Discrete water-quality data from task 1 except the mercury isotope results;
-
• Discrete water-quality data from task 2, the dry dock sampling;
-
• Time-series data from task 4 from the OU A and western OUBT wells and the marine logger. The Site 1 well time-series data are available in Opatz and others (2019);
-
• Discrete water-quality data from task 5, the tidal studies at wells MW709 and MW412; and
-
• Discrete water-quality data from task 6, the nearshore spatial survey, except the sediment results.
The remaining datasets are publicly available in Opatz and others (2023), including:
Mercury in Sediments and in the Dry Dock System
Mercury Concentrations and Isotopes in Sediments
Mercury concentrations in archived sediments from Sinclair Inlet (“SI” in table 2 and figure 5, including samples from both OU B Marine and outer Sinclair Inlet) ranged from 272 to 1,170 ng/g dw (dry weight) (median = 758 ng/g dw). The mercury concentrations measured in the three Puget Sound representative bays (fig. 5) were from 30.1 to 176 ng/g dw (“Bay” sites in table 2), reflecting lower mercury concentrations than “SI” samples and samples collected on the terrestrial BNC (“BNC” sites in table 2). Total mercury concentrations in particulate material from Dry Docks 5 and 6 were variable, reaching values as low as 16 ng/g dw. Total mercury concentrations were highest in particulate material collected from the bottom of monitoring wells MW722, MW412, and MW709 (18,000–44,000 ng/g dw, table 2).
Methylmercury in sediments represented less than 1 percent of the total mercury pool present in OUB Marine and Sinclair Inlet sediments. Methylmercury concentrations reached a high of 5.32 ng/g in marine sediments at PSEMP LT-40030 and 142 ng/g in particulate material from well MW412. Methylmercury concentrations generally were high when total mercury concentrations were high in sediments and particulate material (table 2). Methylmercury concentrations in Puget Sound representative bays were lower than hotspots within the terrestrial BNC, but methylmercury made up a larger percentage of the total mercury ranging from 1.6 to 2.2 percent. All samples were candidates for mercury stable isotope analysis with the exception of two low mercury concentration samples from the southwestern corner of Dry Dock 6 and sediment from Holmes Harbor.
Mercury stable isotopes measured across all sediments and particulate material ranged from −0.87 to 0.18 ‰ for δ202Hg and −0.04 to 0.19 ‰ for Δ199Hg (table 2; fig. 9). No discernible Δ200Hg was measured in samples (Opatz and others, 2023). Isotope values were similar between Sinclair Inlet samples (average δ202Hg = −0.48 ± 0.07 ‰ and average Δ199Hg = 0.03 ± 0.04 ‰, 1 standard deviation), including OU B Marine and outer sampling locations, and samples collected at other Puget Sound Inlets (table 2; fig. 9). Archived sediments from the terrestrial BNC (average δ202Hg = −0.45 ± 0.03 ‰ and average Δ199Hg = 0.03 ± 0.03 ‰) were similar to Sinclair Inlet and Puget Sound representative bays, but δ202Hg outliers were measured in particulate material collected from Dry Dock 6 and monitoring well MW412. Isotope values of δ202Hg from Dry Dock 6 were 0.42 ‰ lower than the average values for the Sinclair Inlet and Puget Sound Bays whereas material from monitoring well MW412 was 0.63 ‰ higher. These deviations from the uniform δ202Hg values observed at all other sites may indicate a different Hg source. The sample collected from Dry Dock 6 was from the southeastern floor drain (“DD6 SE trough”), which collects all particulates washed off the dry dock and may not be representative of the legacy contamination measured in the sediments. Particulates from well MW412 correspond to the highest mercury concentrations observed in these samples (table 2) and may relate to the original (unprocessed) source material or a different Hg source on-site that was not represented in the sediment samples (fig. 10).
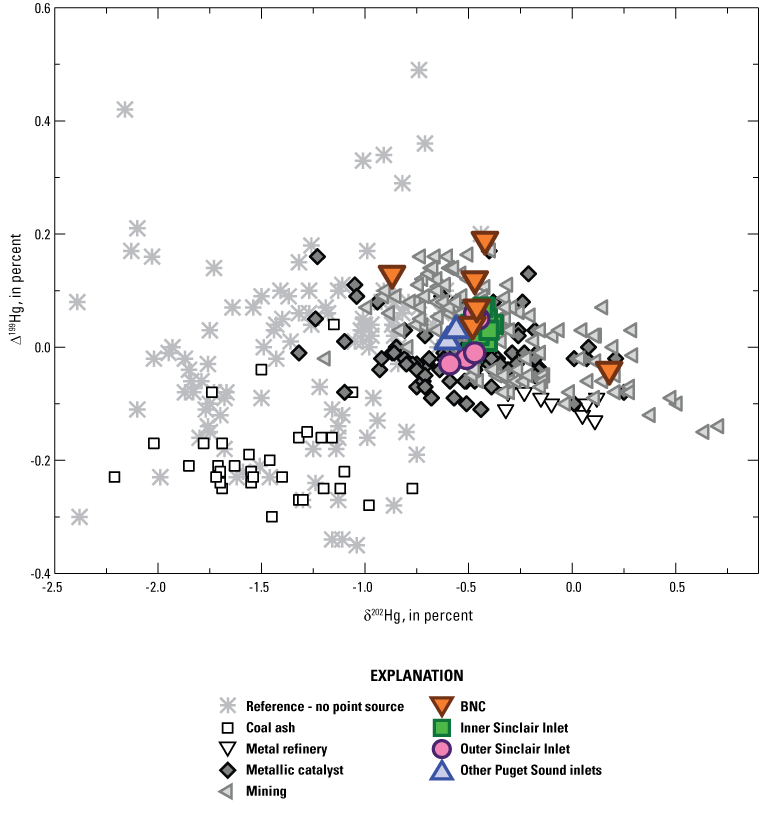
Mercury stable isotope biplot (δ202Hg, Δ199Hg) comparing sediments and suspended particulate material collected in the Bremerton Naval Complex (BNC) and Sinclair Inlet, Bremerton, Washington, to contaminated sediments summarized in Eckley and others (2020; gray symbols).
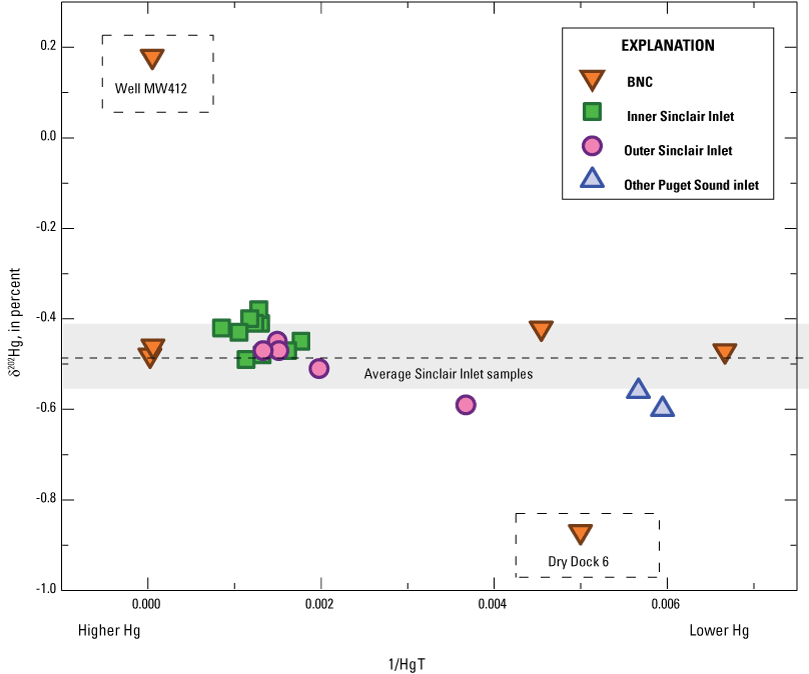
Comparison of δ202Hg to inverse mercury concentrations in sediments and suspended particulate material. One standard deviation is denoted by the gray bar.
Mercury stable isotope values (δ202Hg and Δ199Hg) collected from this study overlap with literature measurements of contaminated sediments, including those collected from sites of metallic mercury catalyst usage, metal refining, mercury and gold mining, and paper mill activity (Eckley and others, 2020; fig. 9). The sediments or particulate material at BNC, Sinclair Inlet, or the Puget Sound representative bays do not overlap with most of literature values absent of direct point source inputs (termed Reference-No point source; fig. 9), typically regions outside of direct points sources fall below a δ202Hg of −1 and have a larger range of Δ199Hg. This comparison indicates that mercury in BNC, Sinclair Inlet, and the larger Puget Sound is derived from industrial discharges of mercury. Despite the wide range of mercury concentrations measured in this study, the isotope values for δ202Hg were nearly constant, with the exception of Dry Dock 6 SE Trough and well MW412, suggesting that an industrial mercury profile is present in the region (fig. 10). These data demonstrate that mercury from industrial or urban discharges dominate the region and little mercury input is received from overland runoff (wetland or forested regions) or direct deposition (atmospheric precipitation). Lastly, low Δ199Hg values (average across all samples 0.04 ±0.05, 1 standard deviation) indicate that little photochemical processing occurred within the samples, with the exception of particulates from Dry Dock 5 (0.19 and 0.12‰) and Dry Dock 6 (0.13 ‰) and support the conclusion that little post-processing occurred between suspended particulate material release and sedimentation.
Mercury in the Dry Dock System
WTHg concentrations in Dry Dock 6 system in the pump well ranged from 3.26 to 11.0 ng/L (table 3). The specific conductance (37,000–38,000 µS/cm) indicated a mix of mostly seawater with some groundwater (approximately 19 percent). Percentage of groundwater was calculated assuming a two end-member mixing model, with seawater specific conductance of 46,500 µS/cm (Cooling Water Intake value) and a groundwater specific conductance of 500 µS/cm (for example, MW206, see table 6). Mercury concentrations were low (WTHg <5 ng/L) in the seawater component (Cooling Water Intake and Auxillary Seawater), which is consistent with previous measurements of Sinclair Inlet seawater (1.09 ng/L, Strivens and others, 2018). Mercury concentrations also were low (WTHg <5 ng/L) in four of the six sampled seeps in Dry Dock 6. The two seeps with elevated mercury concentrations were in the northwest (WTHg = 14.3 ng/L) and northeast (WTHg = 51.5 ng/L) sections of the drainage relief tunnels. TSS also were elevated in these samples (about 12 mg/L) and specific conductance was about 10,000 µS/cm, indicating primarily (>75 percent) groundwater composition.
WTHg concentrations in the Dry Dock 1-5 system in Dry Dock 4 pump well were 12.9 and 13.2 ng/L, mostly bound to particulates (table 3). Particulate mercury was elevated (30.5 ng/L) in a sample of drainage water from Dry Docks 1–3 and additional sampling is needed to identify if there are sources of mercury-laden particulates in Dry Docks 1, 2, or 3. Mercury was elevated (WTHg = 53.7 ng/L) in one seep on the mid-west side of Dry Dock 5 mostly in the filtrate. Mercury concentrations were low (WTHg from 3.29 to 8.04 ng/L) in the three samples from the Process Water system.
Groundwater/Surface-Water Interactions along Unwalled Shorelines
Cold-Water Locations in the Nearshore Identified by Thermal Surveys
The two nearshore thermal surveys—FO-DTS survey and sonde walk—identified approximately 10–15 cold-water locations as candidate sampling locations for the 2021 nearshore spatial survey (figs. 7A and 7B). Adjacent non-cold-water locations also were identified for comparison (figs. 7A and 7B). FO-DTS data from August 1 through 4, 2020, were visualized using the USGS DTSGUI-v1.0.0 (https://code.usgs.gov/water/espd/hgb/DTSGUI/tree/v1.0.0) in figure 11. The x-axis represents distance along the cable; here the cable entered the water near the western-most pier (Mooring G) at 55 m and ran south along the OU A shoreline to Charleston Beach at 550 m. The y-axis represents time with temperature data collected every 15 minutes. This 4-day window captured extreme negative low tides (for example, approximately −5 ft NAVD 88 at 1145 on August 4, 2020) coincident with high daytime air temperatures (for example, up to 28 °C) on August 4, 2020, to maximize temperature differentials between cold discharging groundwater and warm receiving surface water. Vertical dark blue bands in figure 11 indicate potential groundwater discharge locations as persistent cold temperatures regardless of tide or time of day. This also is indicated on the bottom bar (temperature statistics) by areas with low maximum water temperatures and low standard deviations. For example, a zone of at least three cold-water locations was indicated along a protected, north-facing shoreline adjacent from well MW206 (fig. 7A—Location 10 and two additional unnamed candidate cold-water locations). Well MW206 (the red square on the parking lot inset in fig. 11) was the only nearshore well that contained fresh water/low specific conductance. There may be subsurface structures, as well as the protected north-facing shoreline orientation, limiting inland seawater movement in this area, resulting in groundwater discharge. A visible seep in the rip rap along this section was noted during cable deployment in July and retrieval in August.
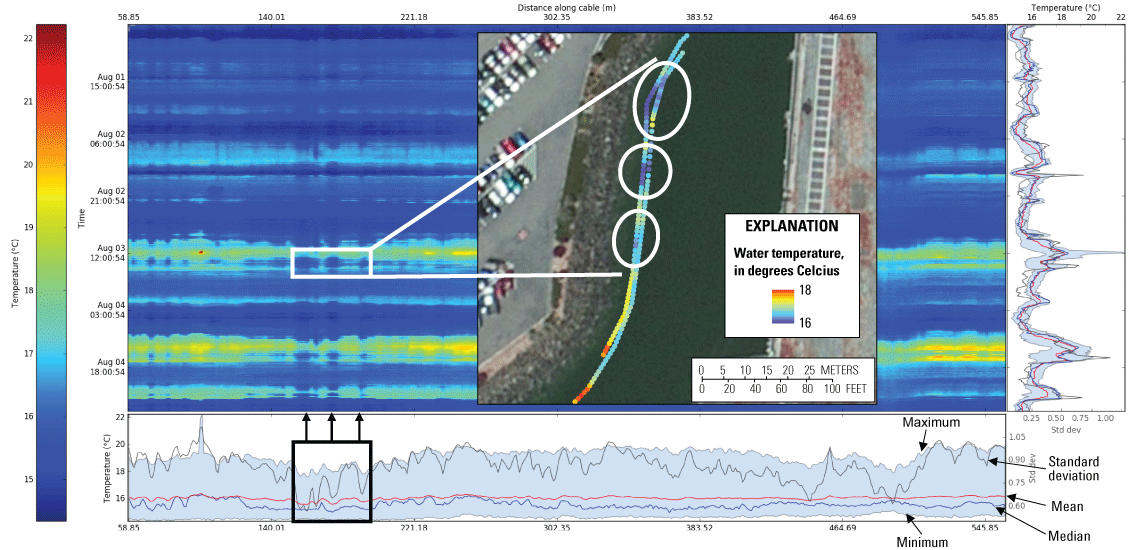
Example output from the U.S. Geological Survey (USGS) DTSGUI identifying persistent cold-water locations. DTSGUI— A python program to process and visualize fiber‐optic distributed temperature sensing data.
Other candidate cold-water locations identified by the FO-DTS survey included two broad areas on either side of the outfall pipe (near the USGS marine logger) in the inlet just north of Charleston Beach, one zone along a steep rip-rap ledge just before the cable exited the water by the truck inspection gate, and a few other locations where cold water was more prominent in the deeper cable (approximately −8.5 ft NAVD 88) than the shallower cable (approximately −4.5 ft NAVD 88; fig. 7A). In total, eight candidate cold-water locations were identified along the OU A shoreline and two additional non-cold water locations were identified for comparison purposes (fig. 7A).
The sonde walk during low tide on August 18, 2020, identified cold-water locations along the western OUBT shoreline including under piers (fig. 7B, for example, Locations 3 and 5). Two visible seeps were noted—one at the edge of the seawall and one under Mooring E. In total, five candidate cold-water locations were identified along the western OUBT shoreline and two additional non-cold water locations were identified for comparison purposes (fig. 7B).
The shoreline along OU A was steeper with large riprap, other than the section near Charleston Beach, as compared to the western OUBT. However, the cable was able to be at similar vertical elevations along OU A (approximately −2.5 to −8.5 ft NAVD 88) as compared to the shoreline along OUBT (−1 to −6 ft NAVD 88).
Tidal Fluctuations of Water Level, Temperature, and Specific Conductance in Nearshore Wells
The 11 monitored nearshore wells were approximately 10 (MW720) to 150 ft (MW412) from the shoreline (table 4; fig. 4). The screened intervals were 9.5 to 20 ft long (table 4) and generally encompassed the range of Sinclair Inlet water-level elevations—the bottom of the screened interval ranged from −4 to −14 ft NAVD 88; the top ranged from approximately 0 to +14 ft NAVD 88; Sinclair Inlet water-level elevations ranged from approximately −6 to +12 ft NAVD 88 (table 4).
Site 1 Wells
The two monitored wells near Site 1 soils had varying characteristics despite being in close proximity (450 ft from each other and similar distances from the shoreline). Water levels in well MW709 fluctuated up to 5 ft and the mean level was centered on the mean water level in Puget Sound (fig. 12A). In contrast, water-level fluctuations in well MW412 were smaller (up to 3 ft) and the water level was approximately 3 ft lower than the water level in well MW709 (fig. 12A). One hypothesis is that well MW412 is within the capture zone of the Dry Dock 6 pump system, while well MW709 is outside of dry dock influence and may directly exchange with Sinclair Inlet along the unwalled shoreline. This hypothesis is consistent with subsurface particle tracking model results (see fig. 3B, modified from Jones and others [2016]).
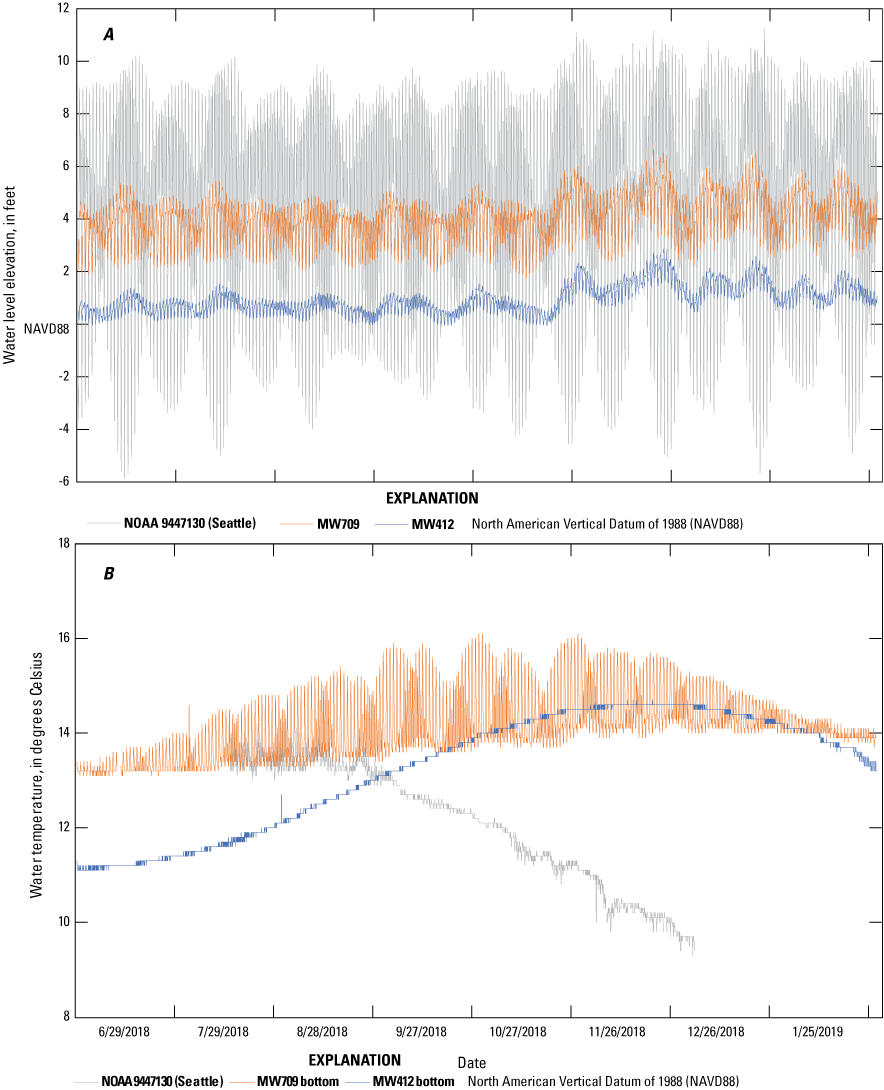
Water-level elevation (A), water temperature (B), and specific conductance and daily precipitation (C) in Site 1 monitoring wells 709 and 412 as compared to Puget Sound, Washington, 2018–19. Puget Sound data from NOAA Station 9447130. Daily precipitation data from the Kitsap Public Utility District streamgage.
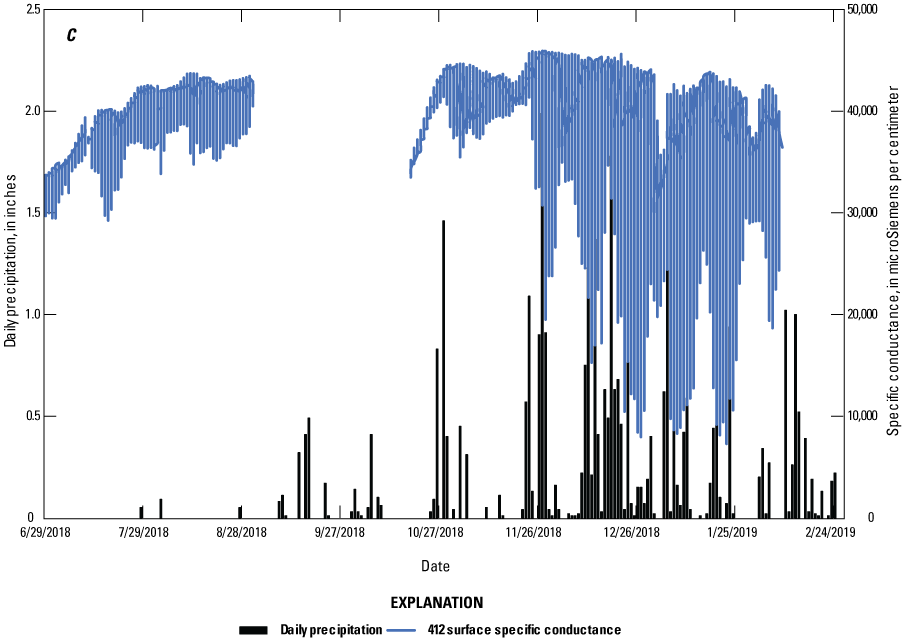
The time-series water temperature data (fig. 12B) also indicate different connectivity with Sinclair Inlet between the two wells. The water temperature near the bottom of well MW709 had a tidal signal and ranged from 13 to 16 °C over the 8 months of monitoring. The water temperature near the bottom of well MW412 had no tidal signal and was colder than well MW709, ranging from 11 to 14.5 °C, especially in the summer months, indicative of groundwater influence. Further, there was a surface freshwater lens in well MW412 during the winter months, coincident with precipitation recharge events (fig. 12C) whereas the water in well MW709 was seawater year-round (collected over the same period but was outside of acceptable criteria for publication).
Western BNC Wells
The nine nearshore OU A and western OUBT monitoring wells also were tidally influenced, although to varying degrees not directly related to distance from shoreline. Maximum sub-daily water-level fluctuations ranged from 3.89 to 11.2 ft (table 6; fig. 13; app. 2). There appeared to be high hydraulic connectivity between Sinclair Inlet and the monitoring wells based on tidal oscillations in the wells that were typically less than 4 hours behind Sinclair Inlet tidal oscillations. Well MW722 appeared the most connected to Sinclair Inlet as indicated by a large water-level elevation range (table 6; fig. 13; app. 2), seawater composition (fig. 14; app. 3), a large seasonal range of temperatures that tracked with Sinclair Inlet (highest temperatures in late summer and lowest annual temperatures in late winter) and sub-daily temperature tidal oscillations (fig. 15). MW720 also appeared well connected to Sinclair Inlet with a large tidal signal in water-level elevation and temperature (table 6; figs. 13–15; app. 2–3).
Table 6.
Ranges of water elevation, specific conductance, and water temperature in nine nearshore monitoring wells, western Bremerton Naval Complex, Washington, 2020–21.[Location of monitoring wells are shown in figure 4. Abbreviations: ft, feet; NAVD 88, North American Vertical Datum of 1988; μS/cm, microsiemens per centimeter at 25°C; °C, degrees Celsius; YYYY-MM-DD, year, month, day]
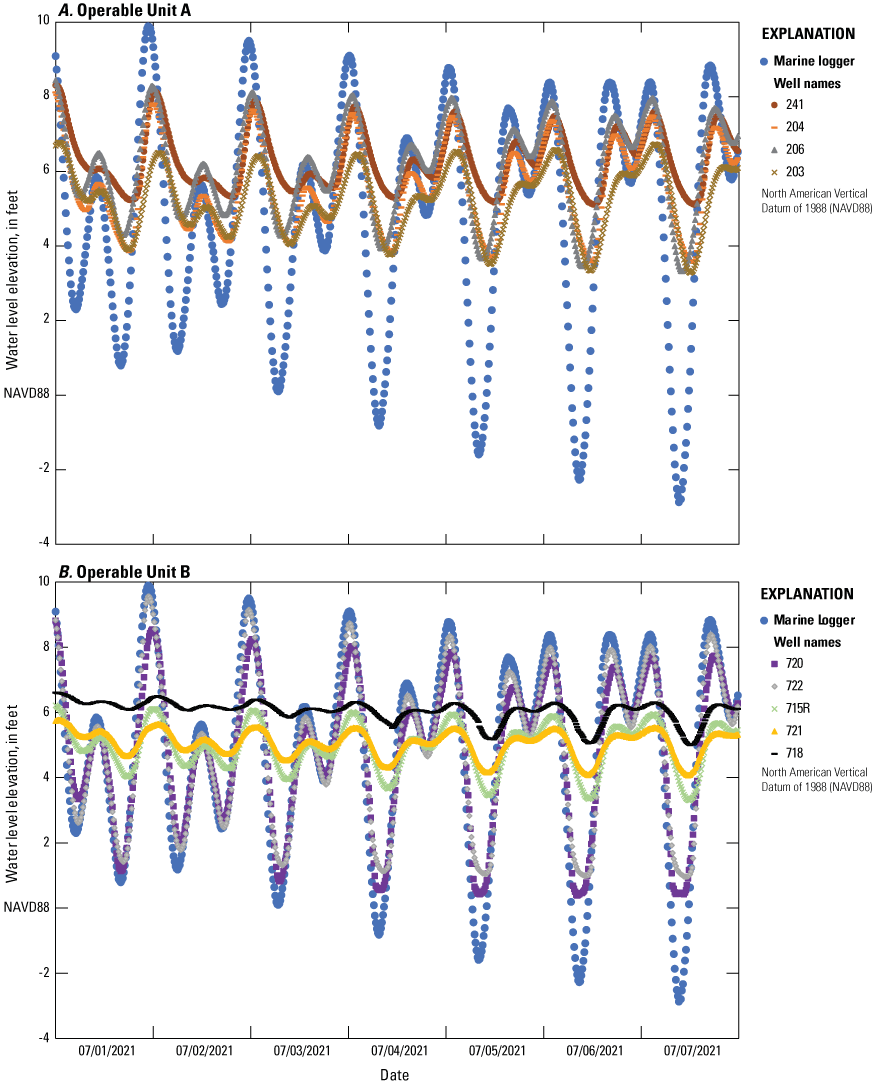
Example of tidal water-level elevation in Operable Unit A (A), and western Operable Unit B–Terrestrial (B) nearshore wells compared to Sinclair Inlet (“Marine logger”), Bremerton Naval Complex, Washington, July 1–8, 2021. Individual well plots over 15-month period of record are shown in appendix 2. Location of wells are shown in figure 4.
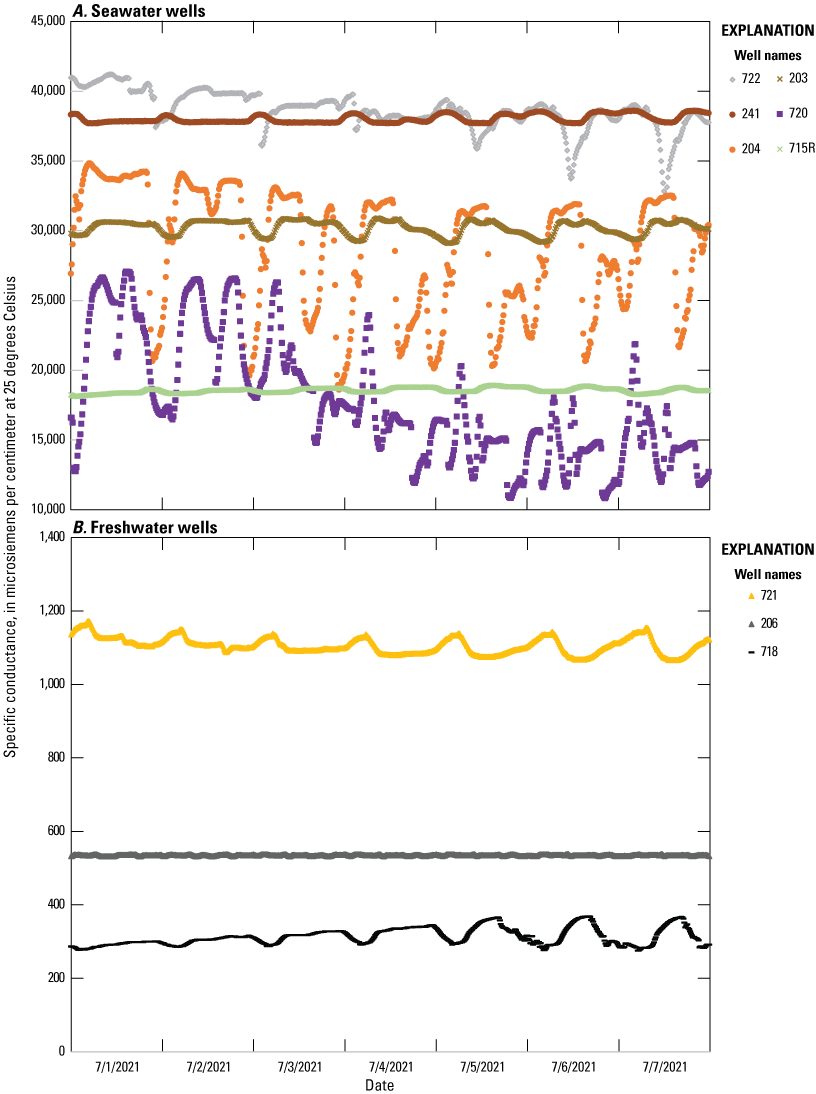
Example of specific conductance in primarily (A) seawater wells and (B) freshwater wells compared to Sinclair Inlet (typically 40,000–45,000 microsiemens per centimeter), Bremerton Naval Complex, Washington, July 1–8, 2021. Individual well plots over entire 15-month period of record are shown in appendix 3. Location of wells are shown in figure 4.
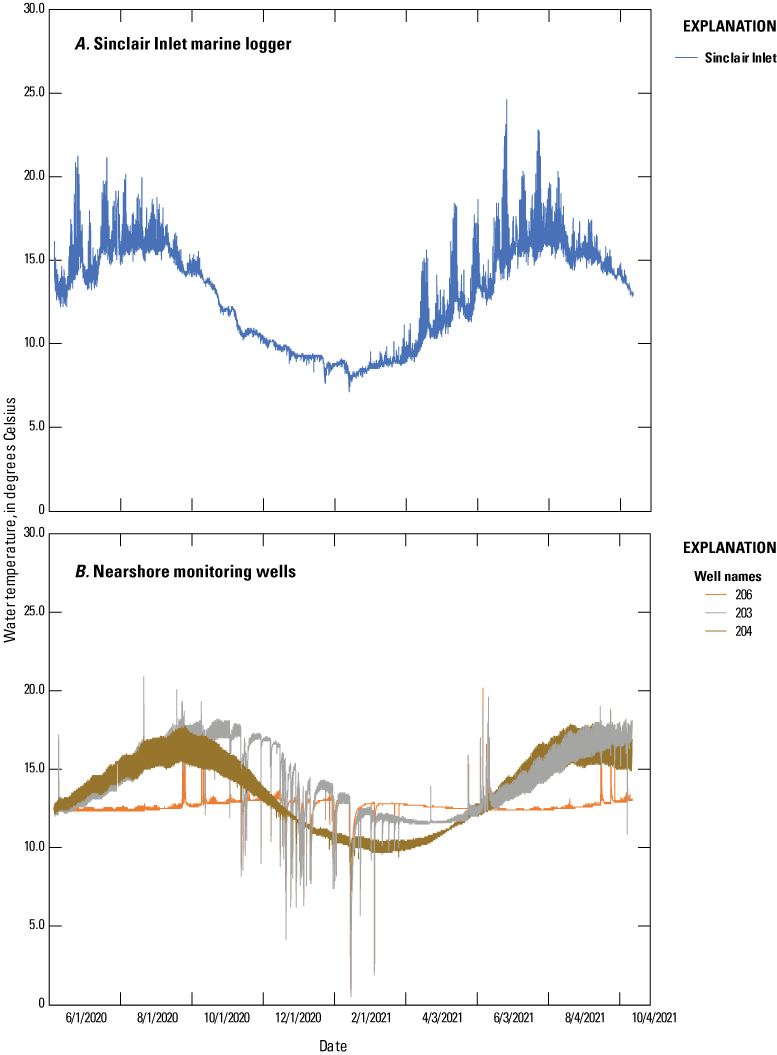
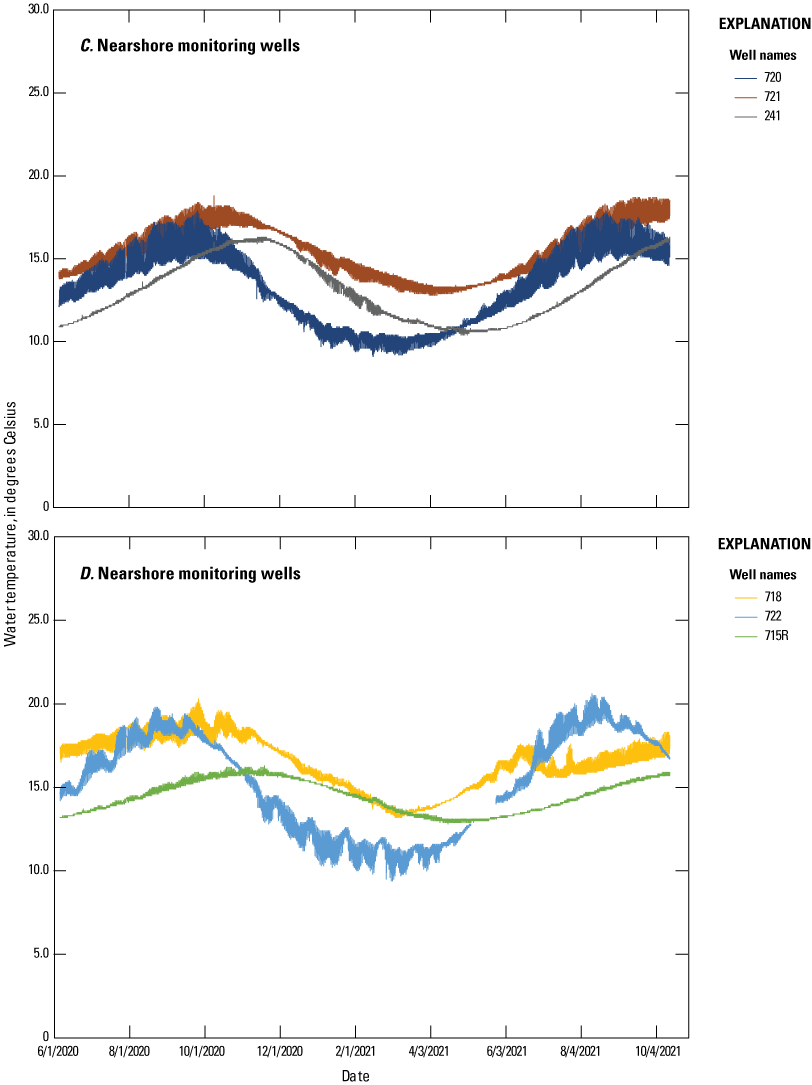
Water temperature in (A) Sinclair Inlet marine logger and (B–D) nearshore monitoring wells, Bremerton Naval Complex, Washington, June 2020–October 2021.
In addition to MW722 and MW720, four other wells contained seawater, with specific conductance values ranging from 22,800 to 44,300 µS/cm—MW715, MW241, MW204, and MW203 (table 6; fig. 14; app. 3). Three wells—MW718, MW721, and MW206—were either brackish or freshwater (specific conductance <2,500 µS/cm) despite their proximity to the shoreline. MW718 is the farthest inland well and was selected, in part, to be representative of an upland freshwater well. MW206 is a similar distance from the shoreline as adjacent seawater wells (MW203 and MW204), so there may be a physical subsurface barrier at that location limiting seawater mixing in the nearshore. The water temperature time series supported this—the temperature in MW206 was not tidally driven and instead remained constant at around 13 °C other than precipitation-derived pulses owing to the nature of the well construction that allowed parking lot runoff into the well during the period of monitoring (fig. 15). MW203 and MW206 were impacted by surface runoff directly into the well owing to the vented cap during the data-collection period, evident in all three time-series parameters (fig. 15; app. 2–3).
Mooring infrastructure also may be buffering seawater exchange, which may explain the brackish instead of seawater conditions in MW721. Further, there was a more delayed seasonal temperature lag in MW241, MW721, and MW715, each of which are behind moorings, as compared to MW720 and MW722. However, MW241 was full seawater despite the long seasonal temperature lag and minimal sub-daily tidal variation. Another anomaly was MW206, which had a large tidal influence in the water-level elevation (about 6 ft range) but was freshwater (low specific conductance and a constant temperature year-round).
The time-series data for these nearshore wells indicate that the conditions in these wells are spatially heterogeneous and represent rapidly changing conditions in nearshore tidally influenced artificial fill rather than steady-state groundwater conditions. The groundwater/surface-water mixing zone along the unwalled shorelines of the BNC extends at least 100 ft inland, likely farther inland in some places (estimated up to 700 ft inland in some areas during the Remedial Investigation). Conditions are highly variable spatially and temporally owing to tidal exchange, seasonal precipitation, and surface and subsurface infrastructure such as moorings and buried material that may limit seawater connectivity or may provide preferential flow paths from the BNC to Sinclair Inlet.
Mercury Concentrations in Site 1 Monitoring Wells over Spring and Neap Tidal Cycles, 2018–19
The water in the monitoring wells in Site 1 soils (MW709 and MW412) was seawater during the 2018–19 tidal studies, indicating that the groundwater/surface-water mixing zone extends inland at least 150 ft along this unwalled shoreline. This is consistent with the time-series results (see fig. 12 and section, “Tidal Fluctuations of Water Level, Temperature, and Specific Conductance in Nearshore Wells”). The near-surface and near-bottom water in MW709 was seawater throughout the 25-hour spring and neap tidal studies (fig. 16A–16B; table 7). There was fresh groundwater in the near-surface samples of MW412, especially during spring and neap ebb tides when the Sinclair Inlet water level declined below the water level in the well (figs. 16C–16D). MW709 is located on the Site 1 outcropping while MW412 is located approximately 450 ft west of MW709 and may be more buffered from direct seawater exchange because of its proximity to the Z Street pier. MW412 also appears to be within the pumping zone of Dry Dock 6 (fig. 3), which may explain the consistently lower water level and smaller water-level fluctuation in MW412 as compared to MW709 (figs. 12, 16A–16D).
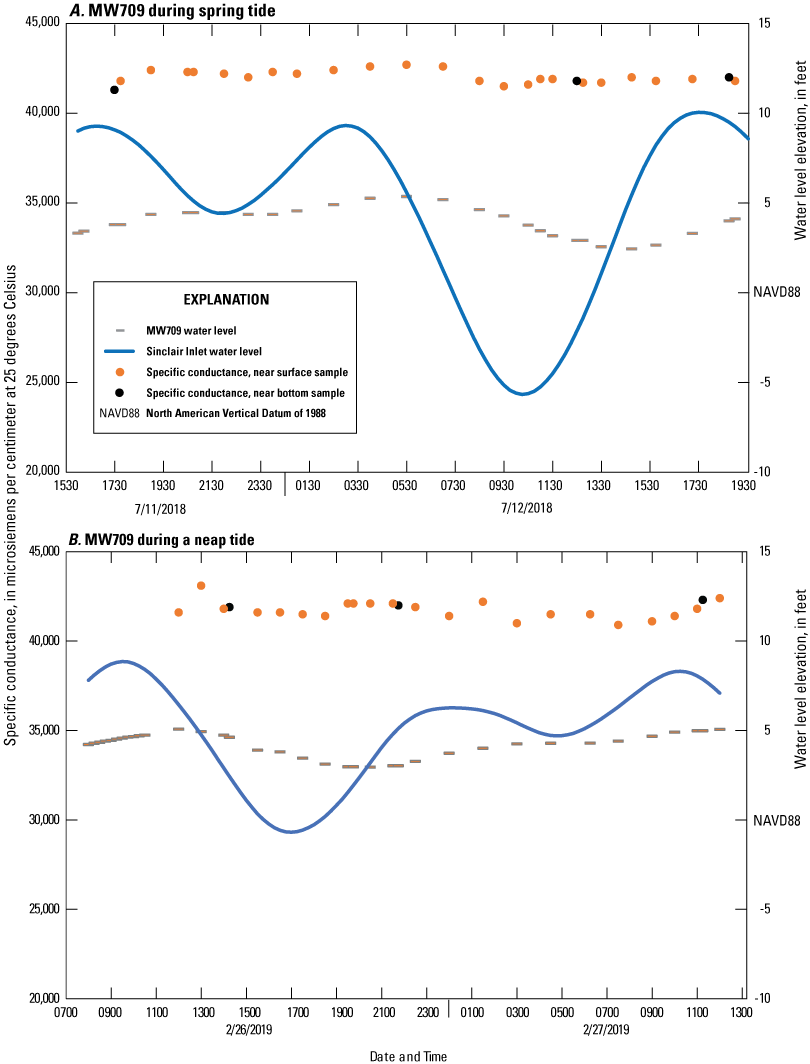
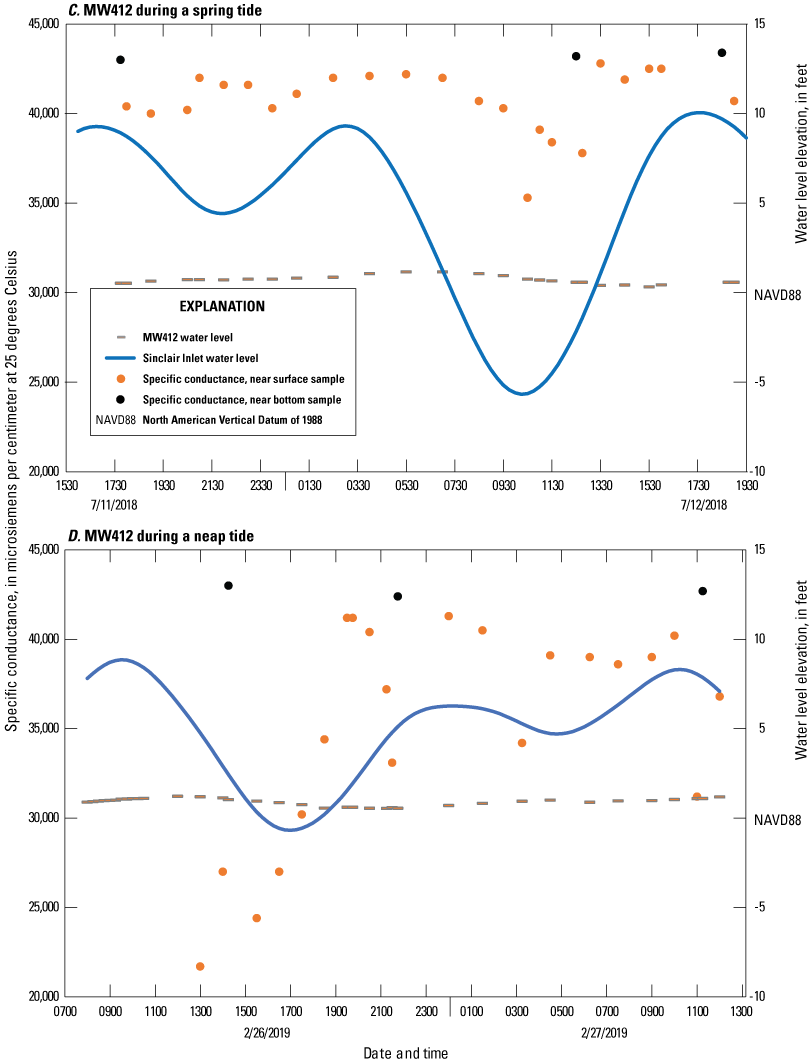
Specific conductance and water level compared to the Sinclair Inlet water level in MW709 during a spring tide (A), MW709 during a neap tide (B), MW412 during a spring tide (C), and MW412 during a neap tide (D).
Table 7.
Mercury concentrations, specific conductance, and total suspended solids in spring and neap tidal studies in MW709, Bremerton Naval Complex, Washington, 2018–19.[Location of MW709 is shown in figure 4. Sample time is given as HHMM, 24-hour hour, minute. Abbreviations: FTHg, filtered total mercury; PTHg, particulate total mercury; WTHg, whole total mercury; THg, total mercury; TSS, total suspended solids. μS/cm, microsiemens per centimeter at 25 degrees Celsius; mg/L, milligram per liter; mg/kg, milligram per kilogram; ng/L, nanogram per liter; YYYY-MM-DD, year-month-day]
Concentrations of WTHg in MW709 generally were less than 50 ng/L during the tidal studies except for spikes during ebb tides up to 965 ng/L (figs. 17A–17B; table 7). The spikes at the beginning and end of each study were mostly due to an increase in PTHg concentrations (for example, PTHg = 948 ng/L or 98 percent of the WTHg concentration in the first near-bottom sample during the spring tidal study). The high concentrations in the samples near the beginning of each study may have been impacted by particulates stirred up from the bottom of the well during purging and sampler installation. However, elevated PTHg concentrations (250 and 72.6 ng/L) also were measured in the near-bottom final spring and neap samples, respectively, when the sampling port had not moved during the 25 hours of sampling. Further, elevated WTHg concentrations up to 212 ng/L were measured during ebb tide in the middle of the spring study, primarily as FTHg (174 ng/L). Other than this spike for a few hours during the spring ebb tide, concentrations of FTHg in MW709 were less than 40 ng/L and typically 15–25 ng/L throughout spring and neap tidal studies.
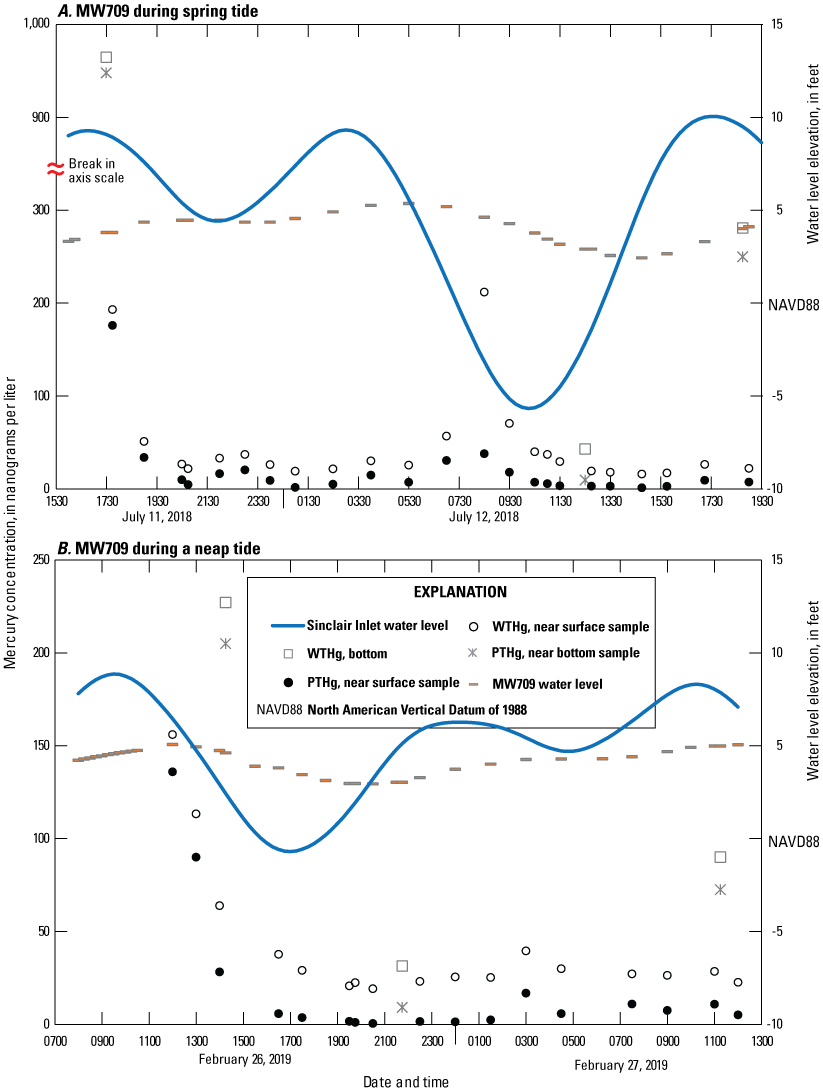
Whole total mercury (WTHg) and particulate total mercury (PTHg) and water-level elevation (feet, NAVD88) compared to the Sinclair Inlet water level in MW709 during a spring tide (A), MW709 during a neap tide (B), MW412 during a spring tide (C), and MW412 during a neap tide (D). The difference between WTHg and PTHg equals the filtered total mercury (FTHg) concentration in nanograms per liter (ng/L).
It is hypothesized that during large negative ebb tides, inland seawater containing elevated mercury extracted from contaminated soils drains past MW709 to Sinclair Inlet. This tidally driven change in subsurface hydraulic gradient also may stir up contaminated particulates in the bottom of the well. This resulted in elevated mercury in the near surface samples primarily as FTHg and elevated mercury in the near bottom of the well primarily as PTHg. The high FTHg spike in the near surface samples occurred during a 15 ft tidal differential, when Sinclair Inlet water levels were approximately 10 ft lower than the water level in the well during maximum ebb (fig. 17A). This high-mercury draining phenomenon did not appear to occur during the neap tidal study, which included an 8-ft tidal differential when the Sinclair Inlet water levels were approximately 4 ft lower than the water level in the well during ebb (fig. 17B; FTHg <40 ng/L). The maximum FTHg concentration in MW709 during the July 2018 ebb (174 ng/L) was less than one-half of the maximum measured during the ebb of the November 2011 tidal study (496 ng/L; Paulson and others, 2013).
Mercury concentrations and partition between filtered and particulate phases in MW412 differed from that in MW709 during the tidal studies. WTHg concentrations in MW412 were very high (figs. 17C–D; table 8). WTHg concentrations in the near surface samples ranged from 238 to 1,040 ng/L and 653 to 1,910 ng/L during the spring and neap tidal studies, respectively. These high concentrations were mostly in the filtered form (percent PTHg of WTHg <15 percent). WTHg concentrations were lower in the near-bottom samples than in the near-surface samples, ranging from 21 to 351 and 13 to 96 ng/L during the spring and neap tidal studies, respectively, with larger contributions from the particulate fraction (percent PTHg of WTHg ranged from 18 to 89 percent). The surface concentrations were high throughout both tidal studies, regardless of tidal stage. Soil boring analysis during the Remedial Investigation identified high-mercury soils in the upper layers at MW412 (up to 75.4 mg/kg at a depth interval of 5–7 “ft,” the units presumed to be “ft below ground surface”; U.S. Navy, 2002). Mercury concentrations were low in deep soil layers (less than 0.5 mg/kg at depth intervals from 10 to 27 ft). This high mercury band appears to be approximately 8–10 ft vertically higher than the water level in the well during 2018–19 but may be indicative of high mercury shallow soils near MW412 that are the source of the high-mercury near-surface water in MW412.
Table 8.
Mercury concentrations, specific conductance, and total suspended solids in and neap tidal studies in MW412, Bremerton Naval Complex, Washington, 2018–19.[Location of MW412 is shown in figure 4. Sample date: Format presented as YYYY-MM-DD, year, month, day; Sample time as HHMM, 24-hour hour, minute. Abbreviations: FTHg, filtered total mercury; PTHg, particulate total mercury; WTHg, whole total mercury; THg, total mercury; TSS, total suspended solids. na, not analyzed. μS/cm, microsiemens per centimeter at 25 degrees Celsius; mg/L, milligram per liter; mg/kg, milligram per kilogram; ng/L, nanogram per liter]
Trace Elements and Other Parameters Along Unwalled Shorelines, 2021
During negative low tides in spring 2021, 58 environmental and quality-control samples were collected from groundwater wells, seeps, nearshore pore water, surface water, and sediment for a large suite of field parameters, stable isotopes of water, major ions, and trace elements to better understand groundwater/surface-water interactions along unwalled shorelines of the BNC, including the transport of terrestrial contaminants to Sinclair Inlet via direct discharge. Nearshore locations were selected for pore water sampling only if a positive hydraulic gradient was measured to indicate groundwater discharge to surface water in the nearshore. Nearshore hydraulic gradients were tidally driven and often only positive in the 1–2 hours prior to and including low tide. Hydraulic gradients along the western shoreline adjacent to OU A (fig. 7A, location numbers 10–17) were minimally positive, typically with 10 mm or less of positive hydraulic gradient. Hydraulic gradients along the northern shoreline adjacent to western OUBT (fig. 7B, location numbers 1–7) were more strongly positive, including under the piers, ranging from +10 to +165 mm. The largest hydraulic gradient was measured at nearshore location 2 (+165 mm). The high hydraulic gradients under the piers and in nearshore location 2 suggest high permeability and hydraulic conductivity in these nearshore areas allowing marine water to infiltrate into the terrestrial soils during high tides and then subsequently drain as a mixture of marine water and groundwater from the terrestrial soils to Sinclair Inlet during low tides.
Table 9.
Summary of water sample results of field parameters from the nearshore spatial survey, Bremerton Naval Complex, Washington, 2021.[Abbreviations: uS/cm, microSiemens per centimeter at 25 degrees Celsius; mg/L, milligrams per liter; mg/L CaCO3, milligrams per liter as calcium carbonate; TSS, total suspended solids; naf, not analyzed for; YYYY-MM-DD, year-month-day; HHMM, 24-hour hour, minute]
Table 10.
Summary of water sample results of dissolved organic carbon, radon, stable isotopes of water, and major ions from the nearshore spatial survey, Bremerton Naval Complex, Washington, 2021.[Abbreviations: mg/L, milligrams per liter; <, less than; E, estimated because too much sample volume was added to bottle. Percent groundwater was calculated from a stable isotope binary mixing model (see text and fig. 16). Major ions were determined on 0.45 um filtered samples. See table 8 for sample date and time.]
Table 11.
Summary of water sample results of arsenic, cadmium, copper, lead and nickel from the nearshore spatial survey, Bremerton Naval Complex, Washington, 2021.[Abbreviations: µg/L, microgram per liter; naf, not analyzed for; <, less than; –, no applicable criteria; Exceedances in bold (for arsenic, if a filtered sample exceeded the unfiltered criteria, it was also bolded). See table 8 for sample date and time.]
Table 12.
Summary of water sample results of zinc and mercury from the nearshore spatial survey, Bremerton Naval Complex, Washington, 2021.[Abbreviations: µg/L, microgram per liter; ng/L, nanogram per liter; naf, not analyzed for; nd, not determined; <, less than; –, no applicable criteria; Exceedances in bold (for arsenic, if a filtered sample exceeded the unfiltered criteria, it was also bolded). See table 8 for sample date and time.]
At the targeted nearshore elevation (final sampling elevations ranged from −4 to −12 ft NAVD 88), the seabed substrate typically was composed of sands underlying varying amounts of gravel, cobble, and riprap material. At locations with a steep shoreline and cobble and riprap substrate (common along the OU A shoreline), the pore water sampler was installed in a sandy spot between cobbles to ensure a flat seal on the sediment-water interface. Pore water sampler installation was easier in locations with a gradual slope and sandy substrate, including at Charleston Beach (Location 17) and under the piers (Locations 3, 5, and 7). Location 2 contained silts and clays, and Location 1 had unconsolidated gravel over silts and clays. The custom pore water sampler (fig. 8) was successfully installed and used for pore water sampling at 10 nearshore locations of the BNC shoreline.
Characterization of Groundwater and Surface-Water End Members
Field and laboratory parameters indicated a range of conditions in the nearshore samples (tables 9–10). Two wells—MW206 and MW718—were used as groundwater end members characterized by low (more negative) values of stable isotopes of water, low specific conductance (<1,000 μS/cm), low DOC, low concentrations of major ions, including calcium, magnesium, potassium, sodium, chloride, fluoride, manganese, and sulfate, and high silica concentrations (complete results available at U.S. Geological Survey, 2022). The stable isotope ratios of these two wells are consistent with regional Puget Sound groundwater stable isotope ratios (fig. 18; table 4.1). The three surface-water samples were used as seawater end members and were characterized by high (least negative) values of stable isotopes of water, high specific conductance, high concentrations of major ions, and low silica concentrations. The other water samples—pore water, seeps, and the remaining groundwater well samples—were a mix of these two end members. Stable isotopes of water were used to define a two end-member mixing model (fig. 18) and calculate the percentage of groundwater in each sample (fig. 19). Specific conductance, silica, and sulfate correlated well to the stable isotope model and also could have been used. The percentage of groundwater was calculated as:
per Phillips and Gregg (2001), using δ18O values (tables 9–10), whereδ18O sample
is the 18O ratio in the sample, per mil;
δ18O surface water
is the 18O ratio in the surface-water end member, the average of the three surface-water samples, per mil; and
δ18O groundwater
is the 18O ratio in the groundwater end member, the average of the four fresh groundwater samples, per mil.
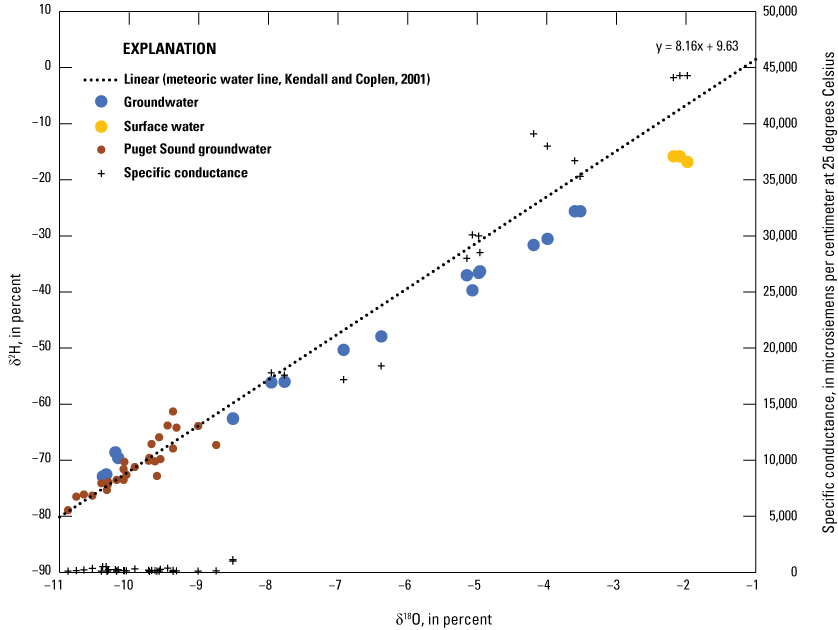
Groundwater and surface-water end members in this study characterized by stable isotopes of water and specific conductance. Regional Puget Sound groundwater values were retrieved from the U.S. Geological Survey National Water Information System (U.S. Geological Survey, 2022) and are compiled in appendix 4.
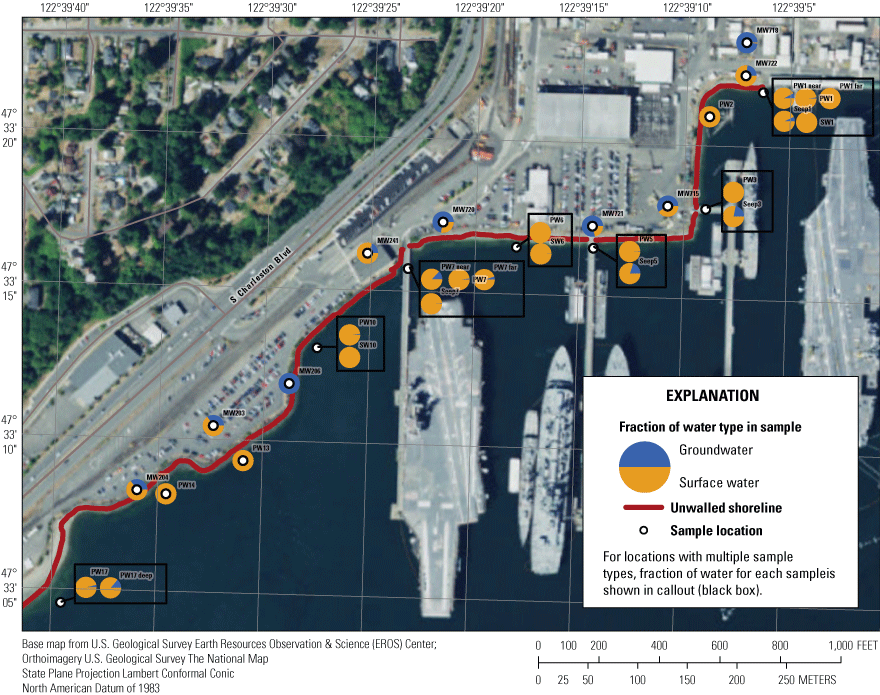
Proportions of groundwater versus surface water in nearshore samples based on stable isotope composition. Results from the near bottom samples in monitoring wells are shown (near surface results were similar. Proportions determined per Phillips and Gregg (2001; see text for equation). MW, monitoring well; SW, surface water; PW, porewater; PW near, porewater sub-location closer to shore than the primary PW location; PW far, porewater sub-location farther offshore than the primary PW location.
One of the two groundwater end member wells—MW718—is the farthest inland well (approximately 130 ft from the shoreline) and had been selected for the study because it was previously known to be upland of the saltwater mixing zone and could potentially serve as an inland reference well. It is unclear why the other groundwater end member well—MW206—does not have salt water because it is one of the closest wells to the shoreline (about 30 ft, tables 2 and 6). The other OU A wells—MW204, MW203, and MW241—were primarily seawater (17.6–37.5 percent groundwater) as was MW722 (23.3 and 25.7 percent groundwater). In contrast, MW720, MW721, and MW715 were majority groundwater (52.5–78.5 percent groundwater).
Many of the pore water and seep samples resembled seawater, with less than 2 percent groundwater contribution (table 10; fig. 19). The samples with the greatest groundwater contribution (>10 percent) included Seep 3, Seep 5, PW17 deep, and PW 7 near. Samples with 2–10 percent groundwater included Seep 1, PW17, PW7 far, and PW1 near. All other samples had less than 2 percent groundwater contribution. The areas with highest groundwater discharge, therefore, appear to be under the piers, at the edge of the seawall, and at Charleston Beach. These are areas where cold water or seeps were found during the thermal studies, positive hydraulic gradients, or high percent groundwater contribution based on stable isotopes of water data. It is hypothesized that pier and seawall infrastructure or the fill material in which they are located may provide preferential flow paths between the terrestrial subsurface and Sinclair Inlet.
Concentrations of Trace Elements in Water and Sediment Samples
Concentrations of trace elements in many water samples were low or non-detectable (tables 11–12). Arsenic was the most frequently detected trace element in the spatial survey (fig. 20). Arsenic was detected in unfiltered groundwater samples at concentrations greater than the Criteria/Remediation Goal of 5 μg/L in MW203, MW241, and MW722. Concentrations were highest in MW203 (approximately 50 μg/L), primarily in the dissolved or colloidal fraction (<0.45 um). Arsenic also was elevated in three nearshore Location 7 filtered seep and pore water samples (23.7–37.2 μg/L; table 11). The two Location 7 sediment samples exceeded Washington State Marine Sediment Cleanup Objectives and Screening Levels (Washington State Department of Ecology, 2013) for arsenic (521–553 µg/g; table 13). Although sediment samples were not collected from under the other two piers, arsenic was detected in unfiltered seep samples from both, including one elevated concentration (Location 5 unfiltered seep = 27.2 µg/L). The particulates in these unfiltered seep samples may represent resuspended fine surface sediment. The deep pore water sample at Charleston Beach (Location 17) was slightly elevated for arsenic (6.4 µg/L). Arsenic concentrations were low (<5 µg/L) in many other groundwater and nearshore water samples. Arsenic concentrations were low at the other two sediment samples (Locations 1 and 2) although “Sed 1 near” (28.9 μg/g) was greater than the Puget Sound Natural Background level (11 μg/g). The results suggest that there is an arsenic hotspot near MW241 and nearshore Location 7 (fig. 20) where arsenic concentrations are elevated in groundwater, seep, pore water, and sediment samples. Offshore of MW203, which had the highest groundwater concentrations of arsenic, the nearest porewater sample (PW13) was less than detection for arsenic (seep and sediment samples were not collected).
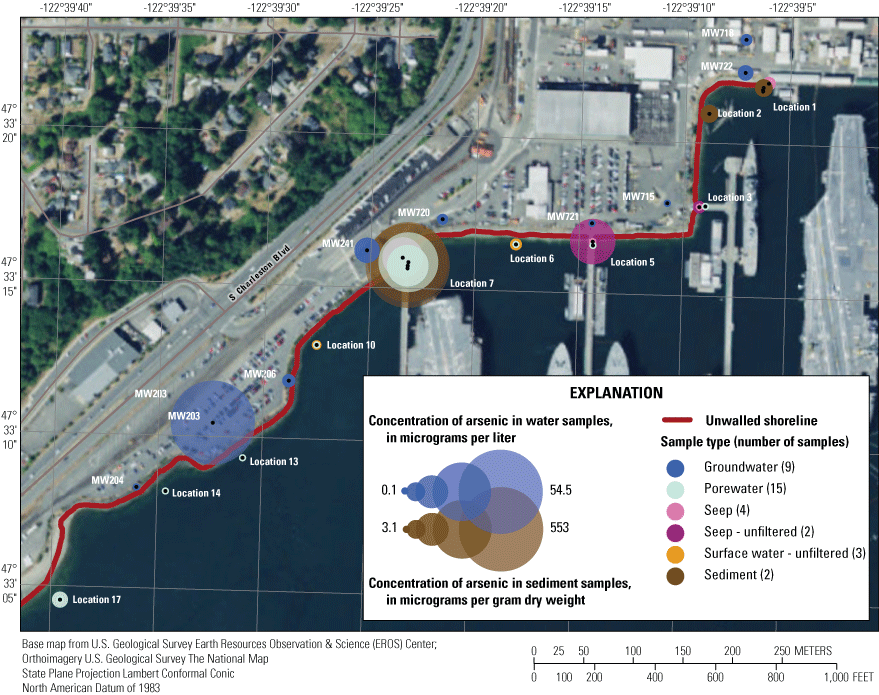
Areal distribution of arsenic concentrations in nearshore samples, Bremerton Naval Complex, Sinclair Inlet, Washington, 2021. Water sample results are from 0.45-μm filtered samples unless noted as unfiltered. Results from the near water surface samples in monitoring wells are shown (near bottom results were similar). Sediment results are from surface grabs (0–10 cm).
Table 13.
Field and laboratory parameters, and trace elements from sediment samples from the nearshore spatial survey, Bremerton Naval Complex, Washington, 2021.[Abbreviations: ng/g, nanogram per gram; μg/g, microgram per gram; μm, micrometer; <, less than; %, percent; –, not applicable. Inorganic results are presented as dry weight concentrations. Exceedances in bold. Natural background and cleanup criterion: Washington State Department of Ecology, 2013; complete results available in Opatz and others (2023)]
Cadmium was detected in a single nearshore sample (unfiltered Seep 5 = 1.03 µg/L) and was not detected or detected at low levels (<2.5 µg/L) in the well samples (table 11). Sediment cadmium concentrations were low (<1.5 µg/g; table 13).
Copper exceeded the Remediation Goal or Compliance Criteria in MW204, MW720, and MW722 (17.3–60.0 µg/L; table 11) and was primarily in the dissolved or colloidal form (<0.45 µm) in groundwater. Copper was not detected in any nearshore filtered water samples but was detected in nearshore sediment and particulate samples (fig. 21). Copper was measurable in the two unfiltered seep samples (Seep 5 = 106 µg/L; Seep 3 = 11.2 µg/L). Because copper was not detected in the corresponding filtered pore water sample, the copper in these unfiltered pore water samples is hypothesized to be particulate-bound to nearshore sediment particulates in the unfiltered sample rather than from a terrestrial source. Sediments at nearshore Location 7 exceeded Washington State Marine Sediment Cleanup Objectives and Screening Levels (Washington State Department of Ecology, 2013) for copper (783–1,120 µg/g; table 13). Copper concentrations were greater than Puget Sound Natural Background in sediments at Locations 1 and 2. The results indicate the copper is present in the dissolved or colloidal form in terrestrial samples (nearshore monitoring wells) but in the particulate form in nearshore samples (unfiltered seeps and sediment near Moorings G and F). It is unknown if this is due to different sources of copper in the terrestrial versus nearshore marine environments, or because of partition and sorption affinity to particulates during transport from the terrestrial to the marine environment.
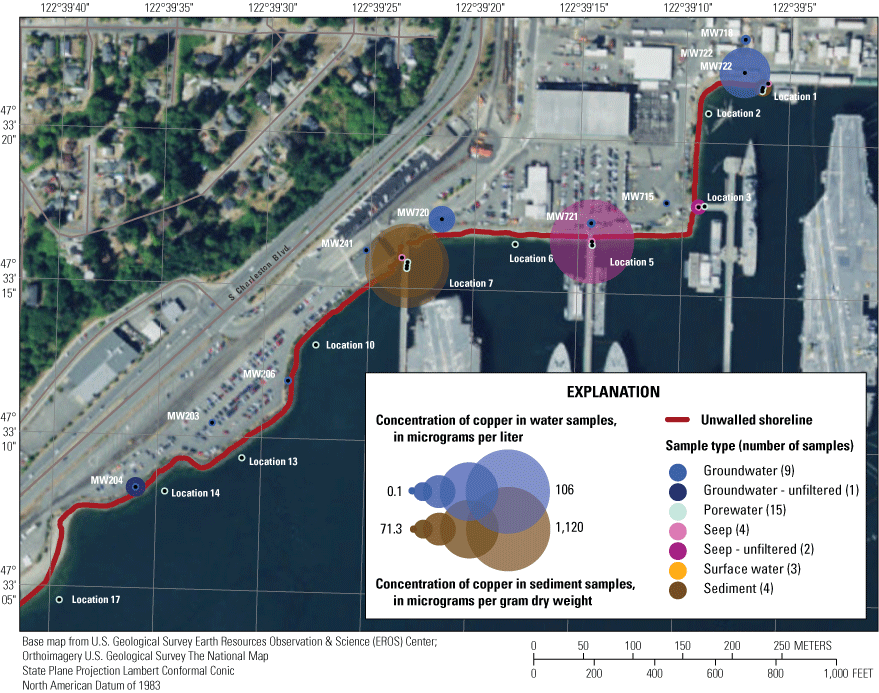
Area distribution of copper concentrations in nearshore samples, Bremerton Naval Complex, Sinclair Inlet, Washington, 2021. Water results are from 0.45-µm filtered samples unless noted as unfiltered. Results from the near water surface samples in monitoring wells are shown (near bottom results were similar). Sediment results are from surface grabs (0–10 centimeters).
Lead concentrations were not detected or low (<2 µg/L) in all groundwater, seep, pore water, and surface-water samples (table 11) with the exception of the two unfiltered seep samples (Seep 5 = 72.1 μg/L; Seep 3 = 8.68 µg/L). Lead was detected in the five sediment samples ranging from 137 µg/g at Location 1 near to 614 µg/g in the field duplicate of location Sed7 near, all of which exceed Puget Sound Natural Background of 21 μg/g (table 13).
Nickel was detected slightly greater than the Remediation Goal or Compliance Criteria in MW204 and MW241 (surface sample only, table 11). Nickel was detected in one filtered nearshore sample (PW17 deep = 8.1 µg/L). The highest concentration was in an unfiltered seep sample (Seep 5 = 53.1 µg/L). Nickel was detected in the five sediment samples ranging from 42.1 µg/g at Sed2 to 140 µg/g at Sed7 (table 13). The Sed7 samples exceeded Puget Sound Natural Background of 50 μg/g.
Zinc was detected at concentrations greater than the Remediation Goal or Compliance Criteria in MW204, MW241 (surface sample only), MW720, and MW722 (table 11). Zinc was detected in four nearshore samples, including the highest measured concentrations (filtered water from PW6 = 934 µg/L and unfiltered water from Seep 5 = 609 µg/L). Blank results indicated no contamination of zinc or other trace elements due to sampling equipment. Zinc was detected in the five sediment samples at concentrations greater than Puget Sound Natural Background, including exceedances at nearshore Location 7 of Washington State Marine Sediment Cleanup Objectives and Screening Levels (3,090–5,610 µg/g; table 13; Washington State Department of Ecology, 2013). The results suggest a zinc hotspot near Mooring G with elevated concentrations in groundwater, seeps, pore water, and sediment (fig. 22).
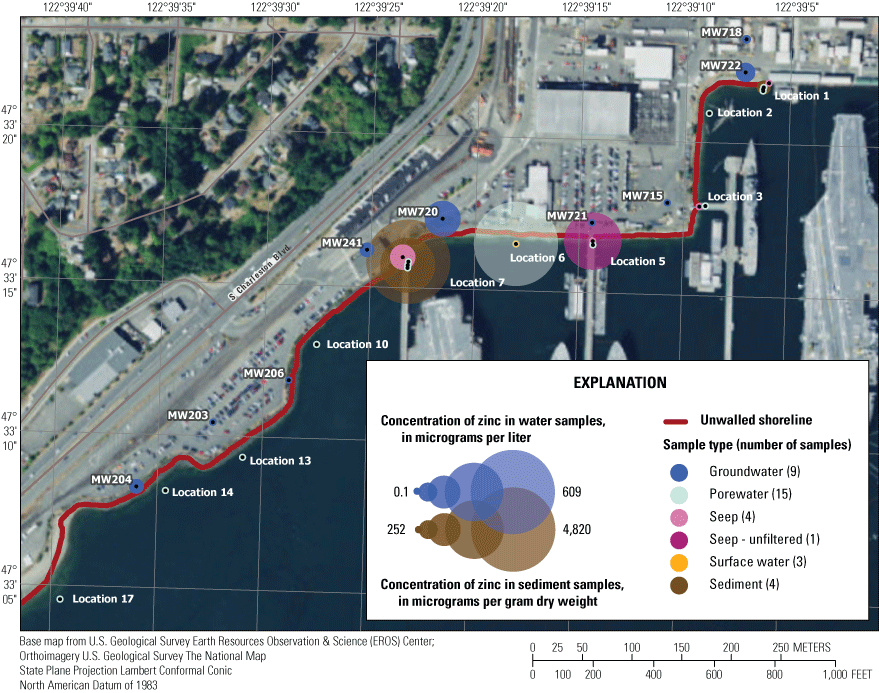
Areal distribution of zinc concentrations in nearshore samples, Bremerton Naval Complex, Sinclair Inlet, Washington, 2021. Water results are from 0.45-µm filtered samples unless noted as unfiltered. Results from the near water-surface samples in monitoring wells are shown (near bottom results were similar). Sediment results are from surface grabs (0–10 centimeters).
Whole total mercury (WTHg) exceeded the OUBT Compliance Criteria of 25 ng/L in MW720 (54.8–55.2 ng/L), MW718 (93.1 ng/L in the bottom sample), and MW722 (1,020–1,030 ng/L). Total mercury in the other wells ranged from 0.411 to 12.3 ng/L (table 12). In contrast to the trace elements above, in which the “total” or whole-water chemical concentration was determined by the analysis of an unfiltered water sample, whole-water total mercury (WTHg) was calculated as the sum of FTHg and PTHg, where FTHg is all chemical forms of mercury in the filtrate passing through a 0.45-µm nominal pore size filter and PTHg is defined as all chemical forms of mercury captured on the filter. Owing to the low analytical detection levels, FTHg was detected in all nearshore water samples (except PW7 near), ranging from 0.21 ng/L in a surface-water sample to 153 ng/L in Seep 1. Both nearshore samples that exceeded the 25 ng/L groundwater criteria were at Location 1 (Seep 1 = 153 ng/L FTHg; SW1 = 67.6 WTHg; table 12). Total mercury was detected in the five sediment samples, including exceedances at Locations 1 and 2 (840–1,300 ng/g; table 13). The current study’s mercury results provide additional data that there is a mercury hotspot adjacent to Site 2 soils in the nearshore area by Location 1 at the edge of the seawall (fig. 23) where there were elevated concentrations in well water, seep, porewater, surface water, and sediment samples. Two additional samples in the vicinity of nearshore Location 1 had elevated mercury—Seep 3 (13 ng/L) and sediment at Location 2 (840 ng/g).
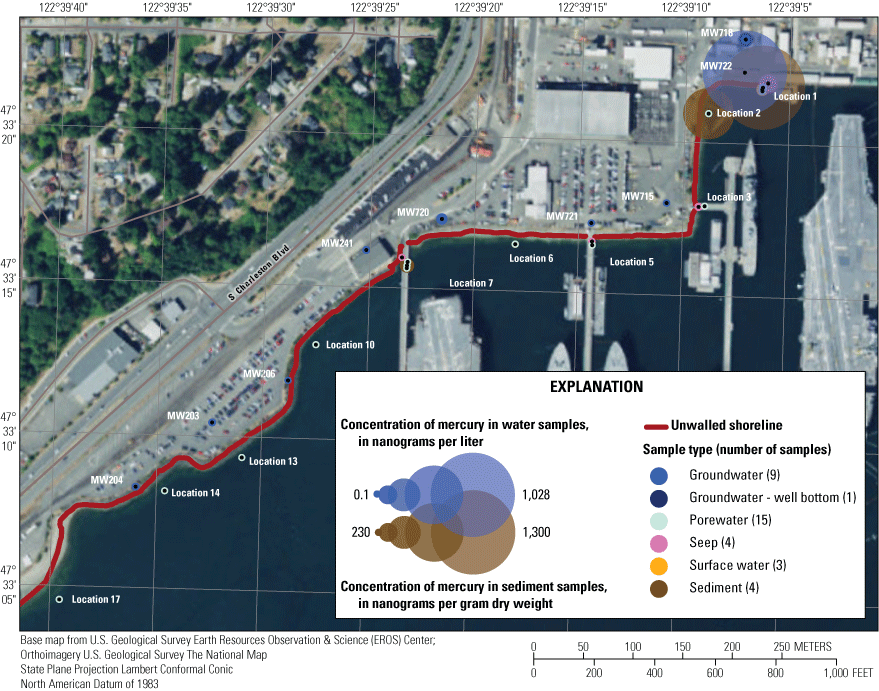
Areal distribution of mercury concentrations in nearshore samples, Bremerton Naval Complex, Sinclair Inlet, Washington, 2021. Water results are whole total mercury (sum of filtered total mercury and particulate total mercury results). In exception, seep and pore water results were analyzed for filtered total mercury only, therefore the whole total mercury value is equal to or greater than the reported value. Water results from the near water surface samples in monitoring wells are shown (near bottom results were similar). In exception, MW718 bottom result also is shown because it was higher than the surface sample. Sediment results are from surface grabs (0–10 centimeters).
Methylmercury was not detected along OU A (wells or nearshore samples) and was frequently detected in OUBT (table 12). Methylmercury concentrations in OUBT wells ranged from <0.04 to 0.58 ng/L (filtered) and <0.008 to 0.217 ng/L (particulate), with the highest concentration in the bottom of MW715 (WMeHg = 0.797 ng/L), which had strongly reducing conditions (−188 millivolt oxidation-reduction potential) and the highest well DOC concentrations (3.30 and 5.30 mg/L), iron concentrations (1170 and 2110 mg/L), and manganese concentrations (541 and 584 mg/L). Methylmercury was detected in all four seep samples (filtered = 0.06–0.22 ng/L) and in pore water at nearshore Locations 1, 2, and 5 (filtered = 0.04–0.42 ng/L). Methylmercury also was detected in the surface-water sample at Location 1 (WMeHg = 0.371 ng/L). Filtered methylmercury contributed between 0.01 (MW722 bottom) and 37 percent (PW5) of the filtered total mercury concentration. Previous investigations have found that biogeochemical characteristics determine the presence of and levels of methylmercury, including DOC concentrations, oxidation-reduction conditions, presence of terminal electron acceptors such as iron and sulfate, and the capability of the microbial community to methylate by containing methylation genes (Paulson and others, 2018; Bravo and Cosio, 2020). Methylmercury was detected in the five nearshore sediment samples ranging from 0.17 ng/g in Sed7 to 0.99 ng/g in Sed1 near, representing less than 0.2 percent of the total mercury sediment concentration (table 13).
Vertical Stratification in Monitoring Wells
In previous investigations, vertical stratification was measured in some BNC monitoring wells and stormwater vaults as a freshwater lens above the saltwater wedge (for example, Paulson and others; 2013; Conn and others, 2018). In some of these samples, chemical concentrations differed between freshwater and seawater samples collected from the same location, hypothesized to be due to preferential extraction of trace elements such as mercury by the chloride ions in seawater. This was the motivation for sampling both near the water surface and near the bottom of the monitoring wells in the current study. No vertical stratification was observed through field parameters such as specific conductance although there were some vertical differences in redox conditions, as indicated by low dissolved oxygen and low (more negative) oxidation-reduction potential in the bottom of the wells as compared to the water surface, especially in MW241, MW720, and MW715 (table 9). There was minimal stratification of trace-element concentrations between the near-surface and near-bottom well samples (tables 11-12). Some small differences were observed in MW241 (elevated nickel and zinc in the near-surface samples) and there was elevated PTHg in MW718 bottom.
Partition between Dissolved and Particulate Fractions in Water Samples
Particulate-bound total mercury (PTHg) contributed from 20 to 87 percent of the WTHg concentration in monitoring well samples (table 12). Most WTHg in surface-water samples was in the particulate form (75–97 percent). Particulate-bound methylmercury (PMeHg) contributed 16 to 27 percent of the WMeHg in monitoring well samples and 68 percent in a surface-water sample. The other trace elements (tables 11–12) were primarily present in the dissolved or <0.45-µm colloidal fraction (75–100 percent of the unfiltered sample concentration) with a few exceptions for copper and nickel. This may be due, in part, to the differences in sample analysis between mercury (particulates on a filter) and the other trace elements (unfiltered water samples).
Updated Conceptual Site Model and Mercury Loading Estimates
There are three likely primary soil and groundwater contaminant transport pathways from the terrestrial BNC to Sinclair Inlet—stormwater outfalls, dry dock discharges, and direct shoreline discharge (groundwater discharge and recirculating seawater). Paulson and others (2013) estimated FTHg loads from these and other sources to Sinclair Inlet. Mercury load estimates for the three primary pathways are updated below, based on new mercury concentration data and either existing or new discharge data (table 14) since Paulson and others (2013). This includes updated FTHg load estimates and first-time estimates of PTHg and WTHg loads (table 15; app. 5). Loads are estimated by multiplying a concentration value by an annual discharge value. For stormwater, the single (average) discharge value used in Paulson and others (2013) was used here, too, and multiplied by the minimum and maximum measured mercury concentrations to provide a range of possible loads. For dry docks, the average discharge value was selected (from table 14) and multiplied by the minimum and maximum measured mercury concentrations to provide a range of possible loads. For direct shoreline discharge, the minimum estimated discharge value was from the steady-state groundwater discharge model and represented groundwater discharge only (Jones and others, 2016; Jones and others, 2024). A maximum value discharge from shoreline discharge value was estimated as four times the groundwater discharge estimate, as a rough accounting for potential recirculating seawater, described below. There is high uncertainty with this maximum shoreline discharge value.
Groundwater discharge values were available for 209 model cells along the BNC shoreline, so loads were calculated on a cell-by-cell basis, using measured groundwater contaminant concentrations at the closest cell and linearly extrapolating concentrations between wells. For all three major soil and groundwater contaminant transport pathways, both discharge and mercury concentrations may be highly temporally variable due to tides, precipitation, dry dock operations, etc. Selecting a single value such as a mean or median will not capture the range of possible instantaneous loads. It is important to understand the timing and duration of high loading events, for example, during negative low tides when the water level in Sinclair Inlet falls below the groundwater level and water (fresh groundwater and recirculating seawater) carries contaminants to Sinclair Inlet via the PSNS015 stormwater outfall and along unwalled shorelines. Discharge of contaminants through the dry dock systems is expected to occur consistently throughout the year as the dry dock pump systems operate nearly continuously. Therefore, the loading estimates presented are current best estimates only. The results from this study demonstrate the spatial and temporal variability in loads, indicating the value of additional sampling at select locations that could improve our understanding of the range and timing of loads.
Table 14.
Annual discharge estimates from stormwater, dry docks, and direct discharge, Bremerton Naval Complex, Washington.[Abbreviations: m3/d, cubic meters per day; na, not available; YYYY, year; M[M]/YYYY, month-year]
| Pathway | Average discharge estimate (m3/d) |
Range of discharge (m3/d) |
Reference |
|---|---|---|---|
| PSNS15 fresh stormwater | 864 | na | Used in Paulson and others (2013) |
| PSNS15 tidal flushing | 3,370 | na | Used in Paulson and others (2013) |
| All other stormwater outfalls | 769 | na | Used in Paulson and others (2013) |
| Dry Docks 1–5 | 13,800 | na | Used in Paulson and others (2013) |
| 12,100 | 4,920–27,600 | 2Measurements taken (1/2017–11/2018) | |
| 13,800 | 8,710–23,100 | 2Measurements taken (1/2019–12/2021) | |
| Dry Dock 6 | 17,300 | na | Used in Paulson and others (2013) |
| Dry Dock 6 (no cooling water) | 19,000 | 14,400–31,000 | 2Measurements taken (1/2017–11/2018) |
| 18,100 | 13,600–22,300 | 2Measurements taken (1/2019–12/2021) | |
| Dry Dock 6 (with cooling water) | 49,200 | 42,800–58,000 | 2Measurements taken (1/2017–11/2018) |
| 34,600 | 25,000–57,500 | 2Measurements taken (1/2019–12/2021) | |
| Calculated Dry Dock 6 cooling water | 30,200 | na | 2Measurements taken (1/2017–11/2018) |
| 16,400 | na | 2Measurements taken (1/2019–12/2021) | |
| 1Process water discharge (Dry Docks 1–6) |
568 | na | 2Measurements taken (1/2017–11/2018) |
| 541 | na | 2Measurements taken (1/2019–12/2021) | |
| Groundwater – all | 536 | na | Used in Paulson and others (2013) |
| 365 | na | Jones and others (2024) | |
| Groundwater – OUA + western OUB Terrestrial | 538 | na | Prych (1997) |
| 336 | na | Jones and others (2024) | |
| Groundwater – OU A | 188 | na | Jones and others (2024) |
| Groundwater – Western OUB Terrestrial (except vicinity of Site 2) | 114 | na | Jones and others (2024) |
| Groundwater – Vicinity of Site 2 | 33.5 | na | Jones and others (2024) |
| Groundwater – Vicinity of Site 1 | 21.6 | na | Jones and others (2024) |
| Groundwater – rest of BNC (walled) | 7 | na | Jones and others (2024) |
| Intertidal saltwater cell – all | unknown | na | na |
Table 15.
Summary of mercury loading estimates to Sinclair Inlet from the Bremerton Naval Complex, Washington.[See appendix tables 5.1–5.2, table 14, table 16 and “Updated Conceptual Site Model and Mercury Loading Estimates” for more details. Values notated with “minimum” have limited or missing data. Abbreviations: FTHg, filtered total mercury; PTHg, particulate total mercury; WTHg, whole total mercury; nd, not determined; <, less than; ~, about]
| Pathway | Sub-pathway | Estimated mercury loads (grams per year) | |||
|---|---|---|---|---|---|
| FTHg (Paulson and others, 2012, 2013) |
FTHg (this report) |
PTHg (this report) |
WTHg (this report) |
||
| Stormwater | PSNS015 | 119 | 0.7–77 | 0.2–188 | 1.3–231 |
| All other stormwater | <1 | 0.14–4.2 (minimum) | unknown | 0.27–23 (minimum) | |
| Stormwater Total | 120 | 1–82 (minimum) | 0.2–188 (minimum) | 1.6–254 (minimum) | |
| Dry Docks | Dry Docks 1–5 | 3.2–26 | 16–21 | 46–50 | 65–67 |
| 1Dry Dock 6 | 8.2–14 | ~14–63 | ~16–48 | ~28–112 | |
| Dry Docks Total | 11–40 | ~30–84 | ~62–98 | ~93–179 | |
| Direct Discharge2 | Vicinity of Site 2 | 0.6–2.5 | 7.0–28 | 4.7–19 | 11–45 |
| Rest of western OUBT and OU A | 0.3–1.2 | 0.5–2 | 1.8–7.3 | 1.1–4.5 | |
| Vicinity of Site 1 | “Significant release possible” | 0.15–7.3 | 0.01–40 | 0.17–41 | |
| Rest of BNC | nd | 0.013–0.15 | 0.003–0.34 | 0.025–0.29 | |
| Direct Discharge Total | nd | ~7.7–38 (highly uncertain) |
~6.5–67 (highly uncertain) |
~12–91 (highly uncertain) |
|
| BNC Total | “140 + Capture Zone GW” | ~39–204 | ~69–353 (minimum) | ~107–524 (minimum) | |
Mercury in recirculating seawater used as cooling water was subtracted from this report's Dry Dock 6 load estimates.
Direct discharge estimates have the most uncertainty of the three pathways because the Intertidal Seawater Cell volumes have not been quantified. Discharge ranges in this report were determined using Jones and others (2024) as minimum; and 4 times the value in Jones and others (2024) as maximum to estimate the addition of the intertidal saline cell.
Stormwater
The data from Conn and others (2018) indicate that mercury in PSNS015 is associated with tidal flushing, not with fresh stormwater. The single high mercury concentration in a freshwater sample from 2009 was not confirmed in the follow-up 2011–12 sampling. The additional data indicate that the FTHg estimate of 119 grams per year (g/yr) by Paulson and others (2013) from the PSNS015 outfall is a maximum load estimate; updated estimates are approximately 1–77 g/yr (table 15; app. 5). Adding the paired PTHg data, WTHg load estimates ranged from 0.5 to 2.2 g/yr for the fresh stormwater component and approximately 1–230 g/yr from tidal flushing. There is still high uncertainty in these loading estimates owing to a lack of tidal flow data for PSNS015, and, also, as with any non-continuous sampling, uncertainty around whether these measured concentrations captured the full range of mercury concentrations in the storm-drain system that may be present under different tidal and seasonal conditions.
The remaining BNC stormwater outfalls were estimated in Paulson and others (2013) to have negligible mercury loads based on four samples. A 2010–13 Navy survey collected 2–11 samples from each of 13 of the BNC stormwater systems for a suite of metals including mercury (Brandenberger and others, 2018). Total recoverable mercury maximum concentrations exceeded 25 ng/L in 4 of the 13 systems, including PSNS015 (346 ng/L) and maximum concentrations from 26.5 to 80.6 ng/L in the other 3 systems. These maximum concentrations are higher than the data in Paulson and others (2013). Mercury monitoring, including particulate mercury and bi-directional flow data for all 24 of the stormwater outfalls, is needed. That, in combination with periodic sampling from seaward vaults during ebb tides, could reduce uncertainty in these loading estimates.
Dry Docks
The measured FTHg concentrations in the pump wells for Dry Docks 1–5 and 6 were similar to those reported in Paulson and others (2013; table 15; app. 5). The average annual discharge estimate for Dry Docks 1–5 provided by the U.S. Navy from January 2019 through December 2021 (Duy Pham, U.S. Navy, written commun., June 10, 2022) was the same as the value used in Paulson and others (2013)—13,800 cubic meter per day (m3/d, or 3.21 million gallons per day (Mgal/d), range=1.31–7.25 Mgal/d). Therefore, the estimated FTHg loads are similar: 3.2–26 g/yr (Paulson and others, 2013) versus 16–21 g/yr (this study). PTHg and WTHg load estimates were not calculated in Paulson and others (2013) and are estimated in this study to range from 46 to 50 and 65 to 67 g/yr, respectively (table 15; app. 5). This suggests that most mercury discharged to Sinclair Inlet from Dry Docks 1–5 is in particulate form although there is high uncertainty because this is based on only two particulate samples. There were two samples with elevated mercury from the Dry Docks 1–5 system—drainage water from Dry Docks 1–3 with elevated particulate mercury (PTHg = 31.4 ng/L) and a wall seep sample along the midwest wall with elevated filtered total mercury (FTHg = 51.5 ng/L). Mercury was low (WTHg <10 ng/L) in the remaining samples contributing to the Dry Docks 1–5 pump well Additional sampling for filtered and particulate total mercury in various locations, including repeat sampling of the drainage water from Dry Docks 1–3 and new and different wall seeps contributing to Dry Docks 1–5, could refine these values.
Recent annual average discharge estimates provided by the Navy for Dry Dock 6 were differentiated between two conditions—with cooling water (recirculated Sinclair Inlet seawater) and without cooling water. The “without cooling water” discharge estimates for both periods (January 2017 through November 2018 and January 2019 through December 2021) were similar to the value used by Paulson and others (2013)—19,000, 18,100, and 17,300 m3/d, respectively (table 14), or approximately 4.5 Mgal/d (2019–21 range = 3.6–5.9 Mgal/d). From 2017 and 2021, Dry Dock 6 was operating under the “without cooling water” condition approximately 52 percent of the time (Duy Pham, U.S. Navy, written commun., July 1, 2022). The other 48 percent of the time it was operating under “with cooling water” condition, which approximately doubles the discharge (2019–21 average = 34,600 m3/d or 9.1 Mgal/d, range = 6.6–15.2 Mgal/d). All dry dock pump well samples were collected when cooling water was contributing, therefore load estimates were calculated with the “with cooling water” discharge value. Updated FTHg loads were higher than those in Paulson and others (2013), 16–67 g/yr in this study versus 8.2–14 g/yr in Paulson and others (2013), owing to a slightly higher range of measured mercury concentrations and the higher discharge value. PTHg and WTHg load estimates were not calculated in Paulson and others (2013) and are estimated in this study to range from 25 to 72 g/yr and 41–140 g/yr, respectively (table 15; app. 5). The data indicate that filtered and particulate forms of total mercury are contributing to the WTHg load discharged from Dry Dock 6 to Sinclair Inlet. There were two wall seeps from Dry Dock 6 with elevated mercury in both filtered and particulate forms—a northeast seep (WTHg = 51.5 ng/L) and a northwest seep (WTHg = 14.3 ng/L). Mercury was low (WTHg <10 ng/L) in the remaining samples contributing to the Dry Dock 6 pump well.
Approximately 10–30 percent of the total mercury from Dry Dock 6 is recirculated Sinclair Inlet seawater, estimated at WTHg = 13–26 g/yr, based on measured concentrations from the Cooling Water Intake and Auxillary Seawater (table 3) and the difference between the discharge with and without cooling water (16,400 m3/d). Therefore, the Dry Dock 6 whole total mercury load estimates from the BNC are approximately 28–112 g/yr (table 15; app. 5).
The two seep samples with elevated WTHg greater than 50 ng/L were from tunnels adjacent to the area between Dry Docks 6 and 5. The elevated mercury concentrations in the northeast seep of Dry Dock 6 and midwest seep of Dry Dock 5 may have originated from contaminated soils/fill material in the area between Dry Docks 6 and 5 and were transported via groundwater to the dry dock pump systems. A sample of drainage water from Dry Docks 1–3 had elevated particulate mercury (30.5 ng/L) and additional sampling is needed to identify if there are sources of mercury-laden particulates in Dry Docks 1, 2, or 3 that are contributing to the Dry Dock 1–5 mercury load to Sinclair Inlet. No other mercury pathways were identified from the dry dock component sampling. Process water load estimates were low, ranging from 0.2 to 0.7 g/yr for FTHg and 0.7 to 2 g/yr for WTHg (app. 5).
These updated estimates suggest that the Dry Dock systems (WTHg about 94–180 g/yr) may be a larger pathway of mercury from the BNC to Sinclair Inlet than previously thought (Paulson and others, 2012; 2013) and may be on the same order of magnitude as the PSNS015 storm-drain system (WTHg about 1–270 g/yr). Similar to the storm-drain system, there is uncertainty with the dry dock loading estimates because the mercury concentrations and discharge rates will vary depending on how many and the types of ship in dock and special servicing and repair activities.
Direct Discharge Along Shorelines
A key assumption during remedial investigations was that chemical concentrations in groundwater decrease to ambient seawater concentrations by the time groundwater reaches the discharge point to Sinclair Inlet surface water. In the current study, elevated levels of some trace elements, such as arsenic, zinc, and mercury, were measured in nearshore monitoring wells, shoreline seeps, and marine porewater above Remediation Goals or Compliance Criteria for groundwater. These samples were collected from within the dynamic groundwater-marine water nearshore mixing zone (fig. 24) where fresh groundwater discharge (FGD) interacts with both a shallow intertidal saltwater cell (ISC) and a deep saltwater wedge (DSW) and the shape of the mixing zone varies under different tidal and precipitation conditions. The BNC nearshore monitoring wells rarely represented fresh groundwater, and, more typically, represented saline water within the groundwater-marine water nearshore mixing zone. Marine water preferentially extracts some chemicals such as mercury from subsurface materials to salt water through complexation to chloride ions (Grassi and Netti, 2000). On the BNC, concentrations of arsenic, copper, zinc, and mercury exceeded criteria, and were 2–50 times higher in a saltwater well (MW722) as compared to a nearby freshwater well (MW718), both of which are near Site 2 soils. When exceedances of criteria occurred in monitoring wells, it was within saltwater wells. Concentrations of trace elements in the fresh and brackish wells (MW206, MW718, and MW721) were low, with the exception of PTHg in the bottom of MW718 (80.7 ng/L) and are the best indicators of nearshore groundwater concentrations from the study. Concentrations of trace elements in the Sinclair Inlet seawater samples also were low.
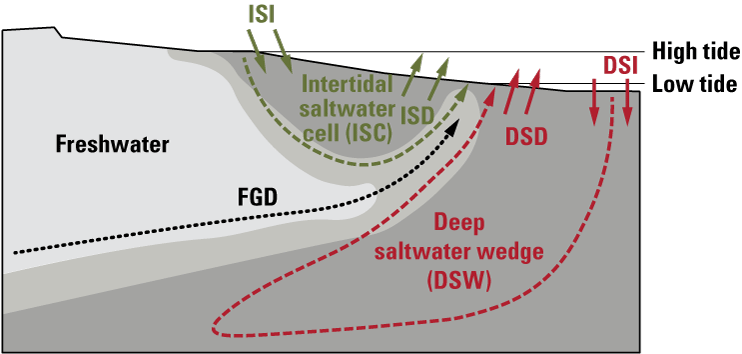
Groundwater/surface-water interactions in the nearshore (from Abarca and others, 2013), including deep saltwater discharge (DSD), deep saltwater infiltration (DSI), fresh groundwater discharge (FGD), intertidal saltwater discharge (ISD), and intertidal saltwater infiltration (ISI).
Therefore, for some chemicals, such as mercury, the major transport mechanism in the nearshore likely is ISC rather than FGD (fig. 24). During each high tide, the ISC infiltrates nearshore contaminated subsurface materials, extracts contaminants, and carries them back to Sinclair Inlet on the subsequent low tide. Concurrently, fresh groundwater discharge generally is moving from areas of higher hydraulic head (uplands) to areas of lower hydraulic head (Sinclair Inlet), per steady-state model simulations (for example, Jones and others, 2016). As the fresh groundwater passes through contaminated subsurface materials, it also extracts contaminants, albeit less efficiently than seawater for some chemicals, and the contaminants are further diluted with clean seawater during transport to Sinclair Inlet. For example, at the mercury hotspot near the edge of the seawall, WTHg concentrations decreased from greater than 1,000 ng/L in well MW722 to 153 ng/L in Seep 1 to 1–11 ng/L in nearshore pore water.
In shorelines where direct discharge is occurring, it is difficult to estimate chemical loads because the discharge estimates need to account for both the FGD and discharge associated with the ISC (fig. 24). A steady-state groundwater model was updated for the BNC (Jones and others, 2016) and, while it does not account for the ISC or other tidal dynamics, provides the best estimates of steady-state groundwater discharge. Total direct discharge (FGD + ISC) can be estimated with manual field measurements of seepage over tidal cycles, coupled with geochemical tracers of groundwater and seawater. For example, Rosenberry and others (2013) measured highly variable seepage rates in a Puget Sound intertidal zone ranging from −217 cm/d during flood tides to +300 cm/d during ebb tides. The authors concluded that “volumes of water and associated nutrients and chemicals that flow across the sediment-water interface each day are much larger than previously thought [Simonds and others, 2008], resulting in a substantially larger mixing volume in the pore waters beneath the broad intertidal zone that covers more than 4.6 km2 of bed in Lynch Cove.”
Manual field seepage measurements have not been made in the nearshore of the BNC but may by as highly variable over tidal cycles as those measured in nearby Lynch Cove given the coarse substrate along the BNC shoreline. To estimate trace element fluxes to Sinclair Inlet, an estimate of the ISC volume discharged to Sinclair Inlet during ebb tides is needed (that is, volume per ebb × 706 ebb per year). It is not appropriate to use a net discharge value (that is, subtract the flood tide volume) because when multiplied by a chemical concentration the load would falsely indicate that chemicals are being loaded back into the nearshore during each flood tide, when instead they are diluted in Sinclair Inlet and each flood tide contains relatively clean seawater. The groundwater discharge estimates from Jones and others (2024), therefore, represent a minimum possible discharge. In the absence of measured discharge data, an initial estimate of the range of possible volumes discharged during ebbs along the unwalled shoreline from Charleston Beach to the edge of the seawall ranges from essentially no discharge where seepage rates are close to 0 cm/d to more than 11,000 m3/d, or more than 30 times the estimate of steady-state groundwater discharge for that shoreline (336 m3/d; Jones and others, 2024). This range is based on approximately 1,000 m of shoreline length, approximately 15 m of intertidal height and linearly variable seepage rates from 0 cm/d during slack tide to 300 cm/d during max ebb tide. A hypothetical exercise using variable rates from 0 to a maximum of 35 cm/d during max ebb (within the average measured range in nearby Hood Canal; Rosenberry and others, 2013) results in discharges, and therefore, chemical loads, nearly four times higher than those determined using a net value (table 16).
Estimated mercury loads (table 15) and other trace element loads (table 17) were estimated using the Jones and others (2024) discharge as the minimum and four times the Jones and others (2024) discharge as an estimated maximum. There is very large uncertainty with these numbers—they should be considered rough estimates for demonstration purposes only. Actual site-specific fluxes could be determined with manual field measurements such as those used in Simonds and others (2008) and Rosenberry and others (2013) coupled with a quantitative determination of intertidal area along the unwalled BNC shoreline. Uncertainty would still exist, as it is difficult to adequately characterize the temporal variability in the flux rates.
Table 16.
Hypothetical examples of two scenarios with the same net daily total discharge resulting in different daily ebb volumes and therefore different chemical loads discharged to Sinclair Inlet, Bremerton Naval Complex, Washington.[Abbreviations: cm/d, centimeter per day; m2, square meter; m3, cubic meter; μg/L, microgram per liter; g, gram]
Table 17.
Trace elements loading estimates to Sinclair Inlet from direct shoreline discharge, Bremerton Naval Complex, Washington.[Minimum load is based on Jones and others (2024) discharge estimates. Maximum load is based on four times the Jones and others (2024) discharge estimates to account for the unknown and likely highly variable contribution from the intertidal saltwater cell. Abbreviations: g/yr, grams per year; unk, unknown]
Using these highly uncertain estimates based on the described assumptions, the volume of direct discharge along unwalled shorelines (<0.5 Mgal/d) is minor compared to stormwater (about 1.3 Mgal/d), Dry Docks 1–5 (about 3.5 Mgal/d), and Dry Dock 6 without cooling water (about 4.8 Mgal/d). Based on the concentration results from the select nearshore sampling locations in this study, multiplied by the estimated discharges, mercury loads (table 15, app. 5) from direct discharges (WTHg about 12–90 g/yr) are estimated to be third largest after stormwater (WTHg about 1–270 g/yr) or the dry dock systems (WTHg about 94–180 g/yr). Loads of other trace elements via direct discharge generally are an order of magnitude higher than mercury loads because concentrations are an order of magnitude higher. For example, estimated loads along OU A and western OUBT are 860–3,460 g/yr of filtered arsenic; 1,230–5,000 g/yr of filtered copper; 760–3,100 g/yr of filtered nickel; and 16,200–67,000 g/yr of filtered zinc (table 17).
Data Gaps
Some nearshore locations warrant additional study to better quantify the spatial and temporal variability of discharge and contaminant concentrations. These are:
-
• The edge of the seawall adjacent to Site 2 soils where elevated mercury has been measured in groundwater, pore water, seeps, surface water, and sediment (nearshore Location 1);
-
• Under piers, where seeps were visible and elevated concentrations of some trace elements were detected; in particular, delineation of the arsenic and zinc hot spots around Mooring G/nearshore Location 7/MW241;
-
• Charleston Beach, where some trace elements were measured from deep (3 ft) porewater and there have been sediment lead exceedances measured in the past; and
-
• The unwalled shoreline adjacent to Site 1 soils (offshore from MW709).
These areas have elevated concentrations of one or more trace elements and evidence of high discharge (presence of seeps and large measured hydraulic gradients discharging to Sinclair Inlet). Current concentrations of trace elements other than mercury are unknown near Site 1 soils, such as in MW709, MW412, or the adjacent nearshore environment. The extent of the contaminated sediment (and fill material) in the nearshore is unknown (distance inland, depth of contaminated sediment, spatial heterogeneity). Recirculating seawater through contaminated sediments, resuspension of nearshore bed sediment, and physical sloughing of shoreline material all may contribute to elevated trace-elements concentrations in these nearshore areas. The annual long-term monitoring sampling results indicate that all nearshore wells, even those behind seawalls, such as 392R, 380, and 410R, contained seawater (EA Engineering, Science, and Technology, Inc., PBC, 2022). Therefore, these groundwater/surface-water interaction discussions and implications may be relevant not just for unwalled shorelines, but also for walled shorelines along the BNC. Additional nearshore porewater and sediment sampling coupled with geophysical tools to better quantify site-specific tidal discharge and the extent of the ISC would help identify any other nearshore areas with high discharge and elevated trace-elements concentrations.
Other data gaps identified in this study include:
-
• Stormwater: Comprehensive monitoring of all BNC stormwater outfalls for concentrations of mercury, including PTHg, and other contaminants and measurements of bi-directional flow;
-
• MW709: Redeveloping MW709 to determine if the high-mercury particulates at the bottom of the well persist;
-
• Copper: Additional sampling to determine the source of copper as there have been copper exceedances reported by the U.S. Navy in the dry dock system in addition to those exceedances measured in monitoring wells reported here;
-
• More data targeting Sites 1 and 2 to determine if a relation exists between methylmercury and field parameters, including oxidation-reduction potential and DOC that could be used to predict if freshwater mercury concentrations will methylate in response to redox conditions in the hyporheic zone; and
-
• MW206: A follow-up nearshore study to assess metals flux to the nearshore by MW206 where there were multiple cold-water locations and a visible seep observed during the thermal studies, and, unusually, MW206 was the only nearshore well that contained all fresh water and no seawater.
The data gaps that have the most impact on the Conceptual Site Model at this time likely are (1) seepage rates/discharge volumes for the intertidal saltwater cell, especially adjacent to Sites 1 and 2 soils, and (2) comprehensive stormwater monitoring of concentrations and bi-directional flows.
Summary
Six U.S. Geological Survey and U.S. Navy datasets are presented and incorporated into an updated Conceptual Site Model of soil and groundwater contaminant transport pathways from the terrestrial Bremerton Naval Complex (BNC) to Sinclair Inlet. Mercury isotope analysis of surface sediments and particulate material indicated that a similar industrial mercury profile is present throughout Puget Sound and persists across regions with both low and elevated mercury concentrations. Mercury isotope ratios of particulate samples collected from the terrestrial BNC overlap with values observed in sediments from OUB Marine and outer Sinclair Inlet as well as two reference Puget Sound locations.
Two known sources of mercury on the terrestrial BNC are Sites 1 and 2 subsurface soils/fill material. Other fill areas also may have elevated contaminant concentrations. Contaminants are transported from the terrestrial BNC to Sinclair Inlet via three primary pathways:
Previous loading estimates (based on filtered total mercury [FTHg]; Paulson and others, 2012, 2013) ranked stormwater outfalls, in particular outfall PSNS015 which is in Site 2 soils, as the largest soil and groundwater contaminant transport pathway from the terrestrial BNC to Sinclair Inlet. Updated loading estimates in this report suggest that the dry dock systems may be a larger pathway of mercury from the terrestrial BNC to Sinclair Inlet than previously thought, within the same order of magnitude as the PSNS015 storm-drain system. The source(s) of mercury to the dry dock systems remains unknown but new data indicate groundwater pathways to Dry Docks 5 and 6 from the area between Dry Docks 5 and 6. Elevated mercury concentrations were measured in MW412, located between Dry Docks 5 and 6. Further, mercury isotope analysis of particulates from this well were unique and may relate to original (unprocessed) source material. Elevated particulate mercury also was measured in a sample of drainage water from Dry Docks 1–3.
Trace element loads via direct shoreline discharge are difficult to estimate due to uncertainty around the recirculating seawater discharge value. However, current best estimated ranges suggest that direct shoreline discharge is one of the three main pathways and may contribute smaller mercury loads than the stormwater and the dry dock systems.
A previous modeling exercise (Jones and others, 2016) indicated that most of Site 1 is outside of the capture zone of the dry dock systems; therefore, direct discharge of contaminants along the unwalled shoreline, while currently unquantified, is likely. The monitoring well (MW709) is seawater year-round and contains elevated mercury, especially in the particulate form (particulate total mercury [PTHg] up to 948 nanograms per liter [ng/L]). Further, groundwater modeling indicates steady-state discharge along the unwalled shoreline adjacent to Site 1 (21.6 cubic meters per day [m3/d]).
The mercury at Site 2 is transported to Sinclair Inlet via the PSNS015 storm-drain system and direct shoreline discharge near the edge of the seawall with elevated concentrations in groundwater, seeps, porewater, and nearshore sediment. Arsenic and zinc concentrations were elevated in groundwater, pore water, seeps, and sediment in the area in and around the westernmost pier, Mooring G. Thermal surveys along unwalled shorelines indicate that piers may be a preferential flow path of terrestrially derived contaminants to Sinclair Inlet. Along unwalled shorelines, the role of direct groundwater discharge may be less important than the role of recirculating seawater in the nearshore mixing zone. Elevated trace element concentrations were measured in seawater rather than fresh water in the nearshore monitoring wells.
Total estimated mercury loads from the terrestrial BNC to Sinclair Inlet range from approximately 40–200 g FTHg/yr and a minimum of 70–355 g PTHg/yr, for a minimum total of 110–525 g WTHg/yr. Additional data that could improve these estimates include, among others: (1) comprehensive stormwater outfall monitoring for contaminant concentrations and bi-directional flows and (2) seepage rates/discharge volume estimates of the recirculating seawater cell along unwalled shorelines, in particular, adjacent to Sites 1 and 2 soils. The results from these studies provide data to the Navy to support prioritization of on-going remediation actions to manage contamination on the BNC to reduce potential impacts to Sinclair Inlet sediment, surface water, and fish and shellfish tissue.
References Cited
Abarca, E., Karam, H., Hemond, H.F., Harvey, C.F., 2013, Transient groundwater dynamics in a coastal aquifer: the effects of tides, the lunar cycle, and the beach profile, Water Resources Research, 49: 2473-2488, accessed October 16, 2022, at https://doi.org/10.1002/wrcr.20075.
American Public Health Association, 1992, Standard Methods Committee of the American Public Health Association, American Water Works Association, and Water Environment Federation, 5310 total organic carbon in Lipps, W.C., Baxter, T.E., and Braun-Howland, E., eds., Standard Methods for the Examination of Water and Wastewater: Washington, D.C., APHA Press, accessed May 23, 2022, at https://www.standardmethods.org/doi/full/10.2105/SMWW.2882.104.
American Society for Testing and Materials, 1998, Standard test method for radon in drinking water: Web page, ASTM D5072-98, accessed May 22, 2022, at https://doi.org/10.1520/D5072-98.
Blum, J.D., and Bergquist, B.A., 2007, Reporting of variations in the natural isotopic composition of mercury: Analytical and Bioanalytical Chemistry, v. 388, p. 353–359, accessed July 14, 2022, at https://doi.org/10.1007/s00216-007-1236-9.
Brandenberger, J.M., Metallo, D., Rupert, B., Johnston, R.K., Gebhart, C., and Strivens, J., 2018, Non-dry dock stormwater monitoring report for Puget Sound Naval Shipyard, Bremerton, Washington, 2010–2013: U.S. Department of Energy, prepared by Pacific Northwest National Laboratory, Report PNNL-27900, 92 p.
Bravo, A.G., and Cosio, C., 2020, Biotic formation of methylmercury—A bio–physico–chemical conundrum: Limnology and Oceanography, v. 65, no. 5, p. 1010–1027, accessed July 15, 2022, at https://doi.org/10.1002/lno.11366.
Conn, K.E., Paulson, A.J., Dinicola, R.S., and DeWild, J.F., 2018, Tidal flushing of mercury from the Bremerton Naval Complex through the PSNS015 stormwater drain system to Sinclair Inlet, Kitsap County, Washington, 2011–12: U.S. Geological Survey Scientific Investigations Report 2018–5087, 23 p. [Also available at https://doi.org/10.3133/sir20185087.]
Cunningham, W.L., and Schalk, C.W., comps., 2011, Groundwater technical procedures of the U.S. Geological Survey: U.S. Geological Survey Techniques and Methods, book 1, chap. A1, 151 p., accessed February 26, 2022, at https://doi.org/10.3133/tm1A1.
DeWild, J.F., Olund, S.D., Olson, M.L., and Tate, M.T., 2004, Methods for the preparation and analysis of solids and suspended solids for methylmercury: U.S. Geological Survey Techniques and Methods, book 5, chap. A7, accessed July 12, 2022, at https://doi.org/10.3133/tm5A7.
Eckley, C.S., Gilmour, C.C., Janssen, S., Luxton, T.P., Randall, P.M., Whalin, L., and Austin, C., 2020, The assessment and remediation of mercury contaminated sites—A review of current approaches: Science of the Total Environment, v. 707, p. 136031, accessed July 12, 2022, at https://doi.org/10.1016/j.scitotenv.2019.136031.
Environmental Protection Agency, 1998, Method 7473 (SW-846): Mercury in solids and solutions by thermal decomposition, amalgamation, and atomic absorption spectrophotometry: Washington, D.C., accessed May 22, 2022, at https://www.epa.gov/sites/default/files/2015-07/documents/epa-7473.pdf.
Environmental Protection Agency, 1998, Method 1630—Methyl mercury in water by distillation, aqueous ethylation, purge and trap, and cold vapor atomic fluorescence spectrometry: Washington D.C., U.S. Environmental Protection Agency draft report, 55 p., accessed on May 22, 2022, at https://www.epa.gov/sites/default/files/2015-08/documents/method_1630_1998.pdf.
Environmental Protection Agency, 2002, Method 1631, Revision E—Mercury in water by oxidation, purge and trap, and cold vapor atomic fluorescence spectrometry: Washington, D.C., U.S. Environmental Protection Agency report 4303, EPA-821-R-02-019, 45 p., accessed May 22, 2022, at https://www.epa.gov/sites/default/files/2015-08/documents/method_1631e_2002.pdf.
Fishman, M.J., and Friedman, L.C., 1989, Methods for determination of inorganic substances in water and fluvial sediments: U.S. Geological Survey Techniques of Water-Resources Investigations, book 5 chap. A1, 545 p., accessed August 2, 2022, at https://doi.org/10.3133/twri05A1.
Garbarino, J.R., Kanagy, L.K., and Cree, M.E., 2006, Determination of elements in natural water, biota, sediment, and soil samples using collision/reaction cell inductively coupled plasma-mass spectroscopy: U.S. Geological Survey Techniques and Methods, book 5, chap. B1, 88 p., accessed August 2, 2022, at https://pubs.usgs.gov/tm/2006/tm5b1/PDF/TM5-B1.pdf.
Grassi, S., and Netti, R., 2000, Sea water intrusion and mercury pollution of some coastal aquifers in the province of Grosseto (Southern Tuscany, Italy): Journal of Hydrology, v. 237, no. 3-4, p. 198–211, accessed August 9, 2022, at https://doi.org/10.1016/S0022-1694(00)00307-3.
Huffman, R.L., Wagner, R.J., Toft, J., Cordell, J., DeWild, J.F., Dinicola, R.S., Aiken, G.R., Krabbenhoft, D.P., Marvin-DiPasquale, M., Stewart, A.R., Moran, P.W., and Paulson, A.J., 2012, Mercury species and other selected constituent concentrations in water, sediment, and biota of Sinclair Inlet, Kitsap County, Washington, 2007–10: U.S. Geological Survey Data Series 658, 64 p., accessed July 12, 2022, at https://pubs.usgs.gov/ds/658/.
Jackson, B., Taylor, V., Baker, R.A., and Miller, E., 2009, Low-level mercury speciation in freshwaters by isotope dilution GC-ICP-MS: Environmental Science and Technology, v. 43, no. 7, p. 2463–2469, accessed July 16, 2022, at https://doi.org/10.1021/es802656p.
Janssen, S.E., Hoffman, J.C., Lepak, R.F., Krabbenhoft, D.P., Walters, D., Eagles-Smith, C.A., Peterson, G., Ogorek, J.M., DeWild, J.F., Cotter, A., Pearson, M., Tate, M.T., Yeardley, R.B., Jr., and Mills, M.A., 2021a, Examining historical mercury sources in the Saint Louis River estuary—How legacy contamination influences biological mercury levels in Great Lakes coastal regions: Science of the Total Environment, v. 779, p. 146284, accessed July 16, 2022, at https://doi.org/10.1016/j.scitotenv.2021.146284.
Janssen, S.E., Lepak, R.F., Tate, M.T., Ogorek, J.M., DeWild, J.F., Babiarz, C.L., Hurley, J.P., and Krabbenhoft, D.P., 2019, Rapid pre-concentration of mercury in solids and water for isotopic analysis: Analytica Chimica Acta, v. 1054, p. 95–103, accessed July 16, 2022, at https://doi.org/10.1016/j.aca.2018.12.026.
Janssen, S.E., Tate, M.T., Krabbenhoft, D.P., DeWild, J.F., Ogorek, J.M., Babiarz, C.L., Sowers, A.D., and Tuttle, P.L., 2021b, The influence of legacy contamination on the transport and bioaccumulation of mercury within the Mobile River Basin: Journal of Hazardous Materials, v. 404, p. 124097, accessed July 16, 2022, at https://doi.org/10.1016/j.jhazmat.2020.124097.
Jones, J.L., Johnson, K.H., Frans, L.M., and Wright, E.E. 2024, MODFLOW-NWT model to simulate the groundwater flow system at Puget Sound Naval Shipyard, Naval Base Kitsap, Bremerton, Washington: U.S. Geological Survey data release, accessed February 2, 2024, at https://doi.org/10.5066/P94FCYGV.
Jones, J.L., Johnson, K.H., and Frans, L.M., 2016, Numerical simulation of groundwater flow at Puget Sound Naval Shipyard, Naval Base Kitsap, Bremerton, Washington: U.S. Geological Survey Open-File Report 2016–1135, 35 p., accessed August 9, 2022, at https://doi.org/10.3133/ofr20161135.
Kendall, C. and Coplen, T.B., 2001, Distribution of oxygen-18 and deuterium in river waters across the United States, Hydrological Processes, v. 15, p. 1363–1393, accessed August 10, 2022, at https://doi.org/10.1002/hyp.217.
Kwon, S.Y., Blum, J.D., Yin, R., Tsui, M.T.-K., Yang, Y.H., and Choi, J.W., 2020, Mercury stable isotopes for monitoring the effectiveness of the Minamata Convention on Mercury: Earth-Science Reviews, v. 203, p. 103111, accessed July 16, 2022, at https://doi.org/10.1016/j.earscirev.2020.103111.
Lepak, R.F., Yin, R., Krabbenhoft, D.P., Ogorek, J.M., DeWild, J.F., Holsen, T.M., and Hurley, J.P., 2015, Use of stable isotope signatures to determine mercury sources in the Great Lakes: Environmental Science and Technology Letters, v. 2, no. 12, p. 335–341, accessed July 16, 2022, at https://doi.org/10.1021/acs.estlett.5b00277.
Lewis, M.E., and Brigham, M.E., 2004, Low-level mercury: U.S. Geological Survey Techniques of Water-Resources Investigations, book 9, chap. A5, section 5.6.4.B, 26 p., accessed July 14, 2022, at https://pubs.er.usgs.gov/publication/twri09A5.
Olund, S.D., DeWild, J.F., Olson, M.L., and Tate, M.T., 2004, Methods for the preparation and analysis of solids and suspended solids for total mercury: U.S. Geological Survey Techniques and Methods, book 5, chap A8, 23 p. accessed August 3, 2022, at https://pubs.er.usgs.gov/publication/tm5A8.
Opatz, C.C., Conn, K.E., Janssen, S.E., and Headman, A.O., 2023, Particulate mercury isotope results, fiber optic thermal survey data, and nearshore surface sediment results at the Bremerton Naval Complex, Washington, USA, 2020-21: U.S. Geological Survey data release, accessed March 3, 2023 at https://doi.org/10.5066/P9K9P8G2.
Opatz, C.C., Peterson, N.T., Conn, K.E., and Huffman, R.L., 2019, Groundwater and tidal time-series data, Bremerton Naval Complex, Bremerton Washington: U.S. Geological Survey data release, accessed May 22, 2022, at https://doi.org/10.5066/P9IKD5FW.
Paulson, A.J., Conn, K.E., and DeWild, J.F., 2013, Improved estimates of filtered total mercury loadings and total mercury concentrations of solids from potential sources to Sinclair Inlet, Kitsap County, Washington: U.S. Geological Survey Scientific Investigations Report 2013–5081, 36 p., accessed May 15, 2022, at https://doi.org/10.3133/sir20135081.
Paulson, A.J., Dinicola, R.S., Noble, M.A., Wagner, R.J., Huffman, R.L., Moran, P.W., and DeWild, J.F., 2012, Sources and sinks of filtered total mercury and concentrations of total mercury of solids and of filtered methylmercury, Sinclair Inlet, Kitsap County, Washington, 2007–10: U.S. Geological Survey Scientific Investigations Report 2012–5223, 94 p., accessed May 15, 2022, at https://doi.org/10.3133/sir20125223.
Paulson, A.J., Marvin-DiPasquale, M.C., Moran, P.W., DeWild, J.F., Stewart, A.R., Toft, J., Agee, J.L., Kakouros, E., Kieu, L.H., Carter, B., Sheibley, R.W., Cordell, J., and Krabbenhoft, D.P., 2018, Mercury methylation and bioaccumulation in Sinclair Inlet, Kitsap County, Washington: U.S. Geological Survey Scientific Investigations Report 2018–5063, 63 p., 1 appendix, accessed May 15, 2022, at https://doi.org/10.3133/sir20185063.
Phillips, D.L., and Gregg, J.W., 2001, Uncertainty in source partitioning using stable isotopes: Oecologia, v. 127, no. 2, p. 171–179, accessed July 16, 2022, at https://doi.org/10.1007/s004420000578.
Prych, E.A., 1997, Numerical simulation of ground-water flow paths and discharge locations at Puget Sound Naval Shipyard, Bremerton, Washington: U.S. Geological Survey Water-Resources Investigations Report 96–4147, 48 p., accessed August 2, 2022, at https://pubs.er.usgs.gov/publication/wri964147.
Reinfelder, J.R., and Janssen, S.E., 2019, Tracking legacy mercury in the Hackensack River estuary using mercury stable isotopes: Journal of Hazardous Materials, v. 375, p. 121–129, accessed July 16, 2022, at https://doi.org/10.1016/j.jhazmat.2019.04.074.
Révész, K., and Coplen, T.B., 2008a, Determination of the δ(2H/1H) of water—RSIL lab code 1574: U.S. Geological Survey Techniques and Methods, book 10, chap. C1, 27 p., accessed May 22, 2022, at https://doi.org/10.3133/tm10C1.
Révész, K., and Coplen, T.B., 2008b, Determination of the δ(18O/16O) of water—RSIL lab code 489: U.S. Geological Survey Techniques and Methods, book 10, chap. C2, 28 p., accessed May 22, 0222, at https://doi.org/10.3133/tm10C2.
Rosenberry, D.O., and LaBaugh, J.W., 2008, Field techniques for estimating water fluxes between surface water and ground water: U.S. Geological Survey Techniques and Methods, book 4, chap. D2, 128 p., accessed May 22, 2022, at https://pubs.usgs.gov/tm/04d02/.
Rosenberry, D.O., Sheibley, R.W., Cox, S.E., Simonds, F.W., and Naftz, D.L., 2013, Temporal variability of exchange between groundwater and surface water based on high-frequency direct measurements of seepage at the sediment-water interface: Water Resources Research, v. 49, no. 5, p. 2975–2986, accessed September 27, 2022, at https://doi.org/10.1002/wrcr.20198.
Rydlund, P.H., Jr., and Densmore, B.K., 2012, Methods of practice and guidelines for using survey-grade global navigation satellite systems (GNSS) to establish vertical datum in the United States Geological Survey: U.S. Geological Survey Techniques and Methods, book 11, chap. D1, 102 p. with appendixes, accessed September 28, 2022, at https://doi.org/10.3133/tm11D1.
Simonds, F.W., Swarzenski, P.W., Rosenberry, D.O., Reich, C.D., and Paulson, A.J., 2008, Estimates of nutrient loading by ground-water discharge into the Lynch Cove area of Hood Canal, Washington: U.S. Geological Survey Scientific Investigations Report 2008–5078, 55 p., accessed August 27, 2022, at https://doi.org/10.3133/sir20085078.
Skahill, B.E. and LaHatte, C., 2007, Hydrological simulation program–Fortran modeling of the Sinclair-Dyes Inlet watershed for the Puget Sound Naval Shipyard & Intermediate Maintenance Facility environmental investment project–FY 2007 Report. Vicksburg, Mississippi, U.S. Army Engineer Research and Development Center, Waterways Experiment Station, Report to the U.S. Navy Puget Sound Naval Shipyard and Intermediate Maintenance Facility Environmental Division.
Strivens, J.E., Johnston, R.K., Schlafer, N., and Brandenberger, J.M., 2018, ENVVEST ambient monitoring program—In-progress summary 2009–2017: PNNL-28116, prepared for the Puget Sound Naval Shipyard and Intermediate Maintenance Facility under Project ENVVEST by the PNNL Marine Sciences Laboratory: Sequim, Washington, 64 p.
Tsui, M.T.-K., Blum, J.D., and Kwon, S.Y., 2020, Review of stable mercury isotopes in ecology and biogeochemistry: Science of the Total Environment, v. 716, p. 135386, accessed May 22, 2022, at https://doi.org/10.1016/j.scitotenv.2019.135386.
U.S. Geological Survey, 2002, Processing of water samples (edited by Wilde, F.D.): U.S. Geological Survey Techniques of Water-Resources Investigations, book 9; chap A5, accessed May 18, 2022, at https://doi.org/10.3133/twri09A5.
U.S. Geological Survey, 2006, Collection of water samples: U.S. Geological Survey Techniques of Water-Resources Investigations, book 9, chap. A4, accessed May 18, 2022, at https://doi.org/10.3133/twri09A4.
U.S. Geological Survey, 2017, Office of Groundwater Technical Memorandum 2017.03, Procedures for processing, approving, publishing, and auditing time-series records for water data, accessed August 9, 2022, at https://water.usgs.gov/osw/time-series-guidance/.
U.S. Geological Survey, 2018, General introduction for the National Field Manual for the Collection of Water-Quality Data (ver. 1.1, June 2018): U.S. Geological Survey Techniques and Methods, book 9, chap. A0, 4 p., accessed May 9, 2022, at https://doi.org/10.3133/tm9A0. [Supersedes USGS Techniques and Methods, book 9, chap. A0, version 1.0.]
U.S. Geological Survey, 2022, USGS water data for the Nation: U.S. Geological Survey National Water Information System database, accessed May 22, 2022, at https://doi.org/10.5066/F7P55KJN.
Wagner, R.J., Boulger, R.W., Jr., Oblinger, C.J., and Smith, B.A., 2006, Guidelines and standard procedures for continuous water-quality monitors—Station operation, record computation, and data reporting: U.S. Geological Survey Techniques and Methods, book 1, chap. D3, 51 p. + 8 attachments, accessed May 18, 2022, at https://pubs.water.usgs.gov/tm1d3.
Washington State Department of Ecology, 2013, Sediment Management Standards, Chapter 173-204 WAC, Washington State Department of Ecology Publication 13-09-055, 151 p., accessed August 9, 2022, at https://apps.ecology.wa.gov/publications/SummaryPages/1309055.html.
Wetherbee, G.A., and Martin, R., 2020, External quality assurance project report for the National Atmospheric Deposition Program’s National Trends Network and Mercury Deposition Network, 2017–18: U.S. Geological Survey Scientific Investigations Report 2020–5084, 31 p., accessed May 22, 2022, at https://doi.org/10.3133/sir20205084.
Yin, R., Krabbenhoft, D.P., Bergquist, B.A., Zheng, W., Lepak, R.F., and Hurley, J.P., 2016, Effects of mercury and thallium concentrations on high precision determination of mercury isotopic composition by Neptune Plus multiple collector inductively coupled plasma mass spectrometry: Journal of Analytical Atomic Spectrometry, v. 31, no. 10, p. 2060–2068.
Appendix 1. Quality Control Results from Dry Dock Sampling, Site 1 Tidal Studies, and Spatial Survey, Bremerton Naval Complex, Washington, 2018–21
Table 1.1.
Quality control results for dry dock sampling, Bremerton Naval Complex, Washington, 2018.[Abbreviations: USGS, U.S. Geological Survey; RPD, relative percent difference; –, not analyzed for; <, less than; ng/l, nanograms per liter; mg/l, milligrams per liter; µS/cm at 25 °C, microsiemens per centimeter at 24 degrees Celsius; °C, degrees Celsius; FNU, formazin nephelometric units; YYYY-MM-DD, year-month-day; HHMM, 24-hour hour, minute]
Table 1.2.
Quality control results for Site 1 tidal studies, Bremerton Naval Complex, Washington, 2018–19.[Abbreviations: USGS, U.S. Geological Survey; RPD, relative percent difference; –, not analyzed for; <, less than; ng/l, nanograms per liter; mg/l, milligrams per liter; µS/cm at 25 °C, microsiemens per centimeter at 24 degrees Celsius; °C, degrees Celsius. Sample collection data shown as YYYY-MM-DD, year, month, day. Sample collection time shown as HHMM, 24-hour hour, minute]
Table 1.3.
Quality control results for solids, cations, and alkalinity in the nearshore spatial survey, Bremerton Naval Complex, Washington, 2021.[Abbreviations: USGS, U.S. Geological Survey; RPD, relative percent difference; –, not analyzed for; <, less than; R, not detected above reporting level, value shown is reporting level; mg/l, milligrams per liter; YYYY-MM-DD, year-month-day; HHMM, 24-hour hour, minute]
Table 1.4.
Quality control results for anions and other inorganics in the nearshore spatial survey, Bremerton Naval Complex, Washington, 2021.[Abbreviations: USGS, U.S. Geological Survey; RPD, relative percent difference; –, not analyzed for; <, less than; R, not detected above reporting level, value shown is reporting level; mg/l milligrams per liter; µg/l, micrograms per liter; YYYY-MM-DD, year-month-day; HHMM, 24-hour hour, minute]
Table 1.5.
Quality control results for inorganics in the nearshore spatial survey, Bremerton Naval Complex, Washington, 2021.[Abbreviations: USGS, U.S. Geological Survey; RPD, relative percent difference; –, not analyzed for; <, less than; R, not detected above reporting level, value shown is reporting level; µg/l, micrograms per liter; ng/l, nanograms per liter; YYYY-MM-DD, year-month-day; HHMM, 24-hour hour, minute]
Table 1.6.
Quality control results for the nearshore spatial survey, Bremerton Naval Complex, Washington, 2021.[Abbreviations: USGS, U.S. Geological Survey; RPD, relative percent difference; –, not analyzed for; <, less than; R, not detected above reporting level, value shown is reporting level; µg/l, microograms per liter; YYYY-MM-DD, year-month-day; HHMM, 24-hour hour, minute]
Table 1.7.
Quality control results for methylmercury, organic carbon, radon and stable isotopes of water in the nearshore spatial survey, Bremerton Naval Complex, Washington, 2021.[Abbreviation: USGS, U.S. Geological Survey; RPD, relative percent difference; –, not analyzed for; <, less than; R, not detected above reporting level, value shown is reporting level; ng/l, nanograms per liter; mg/l, milligrams per liter; pCi/l, picocurie per liter; YYYY-MM-DD, year-month-day; HHMM, 24-hour hour, minute]
Appendix 2. Water-Level Elevation in the Sinclair Inlet Marine Logger and Nearshore Monitoring Wells, Bremerton Naval Complex, Washington, June 2020–October 2021
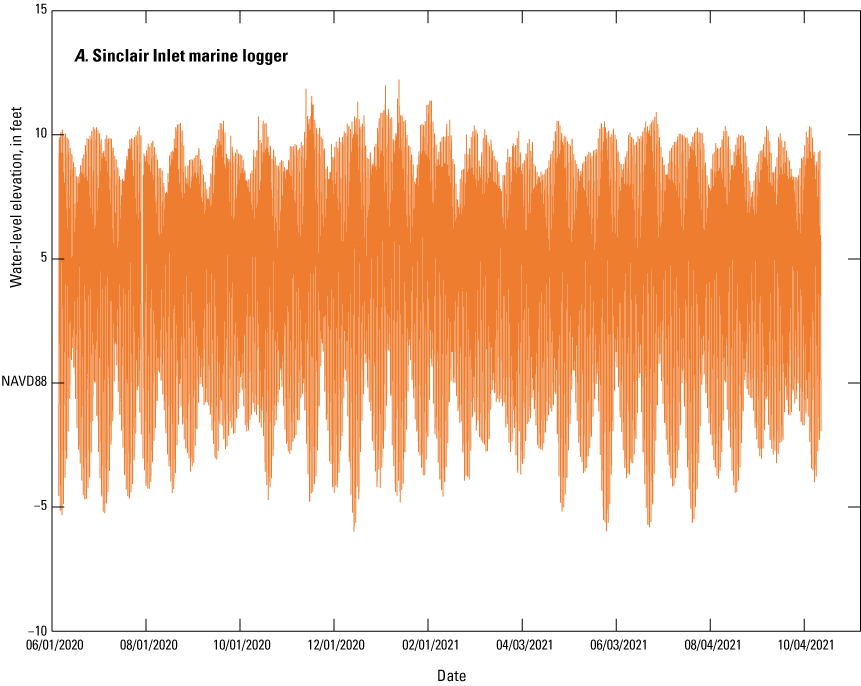
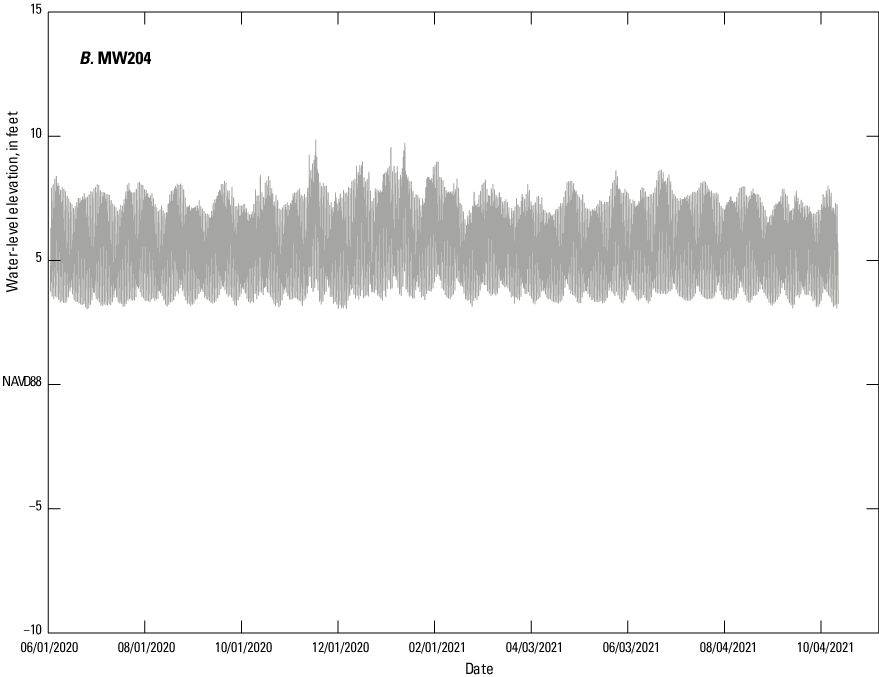
Water level elevation in (A) the Sinclair Inlet marine logger and (B) MW204, Bremerton Naval Complex, Washington, June 2020–October 2021. North American Vertical Datum of 1988 (NAVD88).
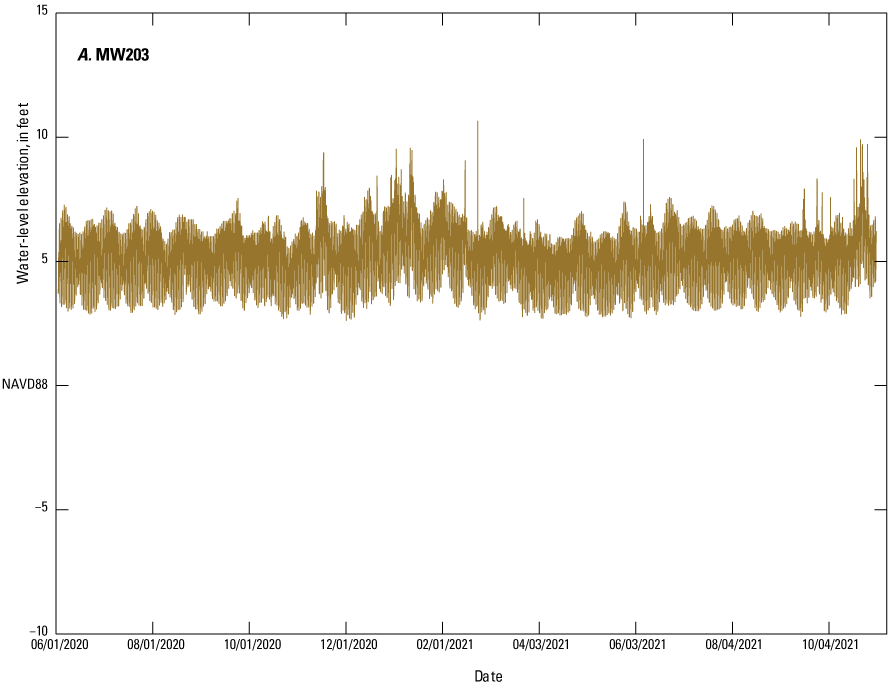
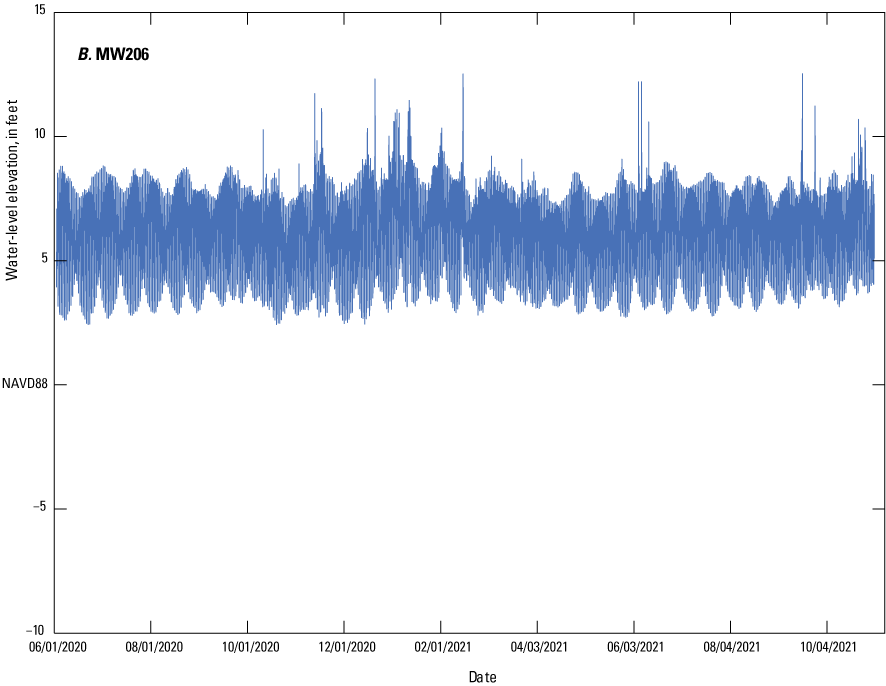
Water level elevation in (A) MW203 and (B) MW206, Bremerton Naval Complex, Washington, June 2020–October 2021. North American Vertical Datum of 1988 (NAVD88).
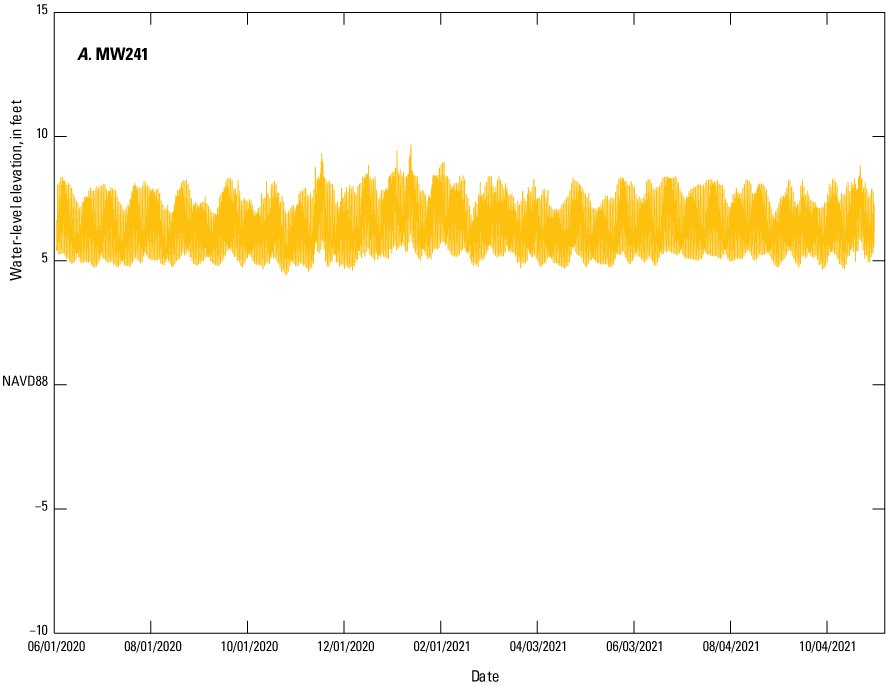
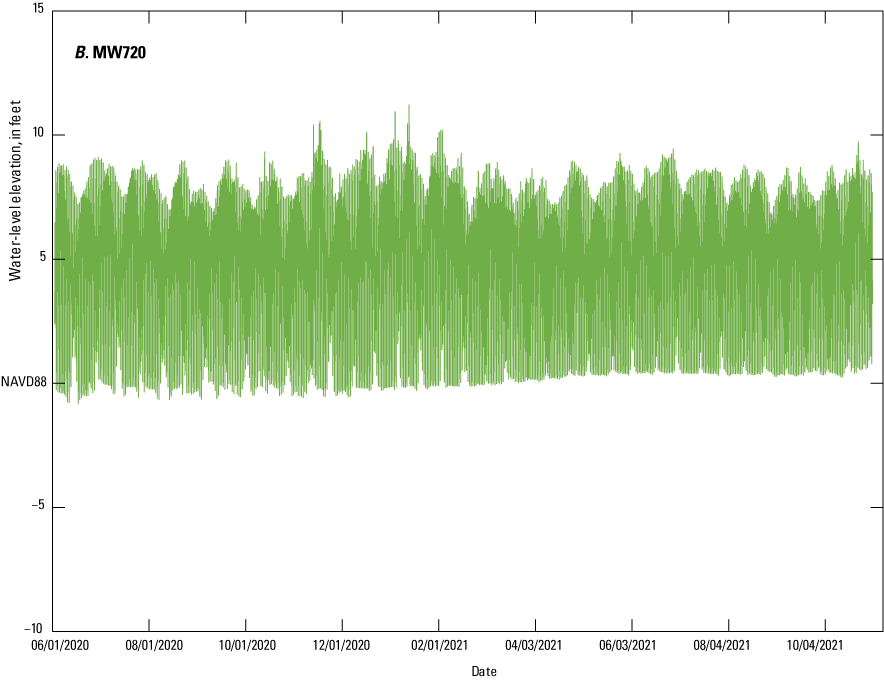
Water level elevation in (A) MW241 and (B) MW720, Bremerton Naval Complex, Washington, June 2020–October 2021. North American Vertical Datum of 1988 (NAVD88).
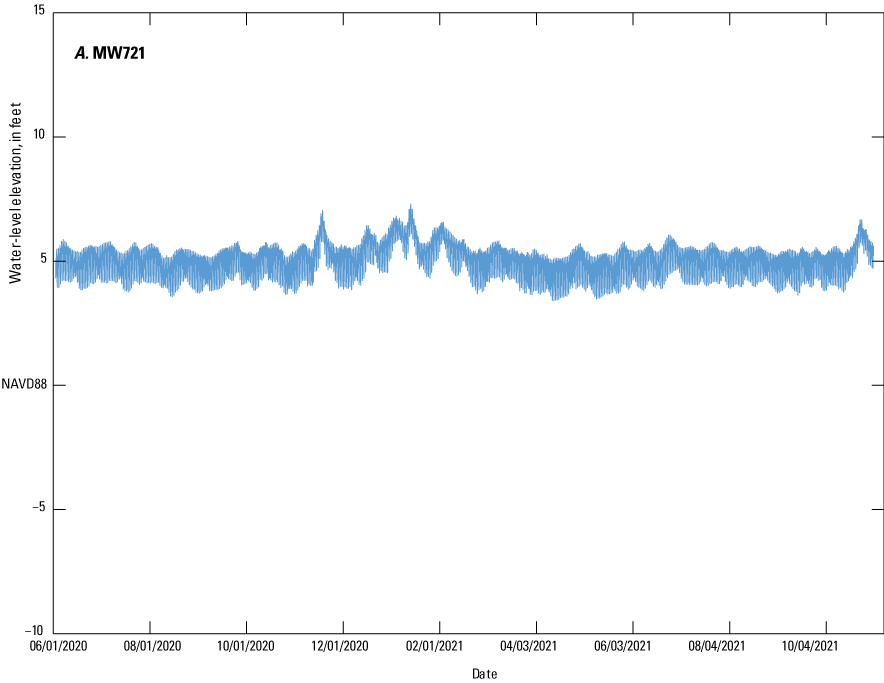
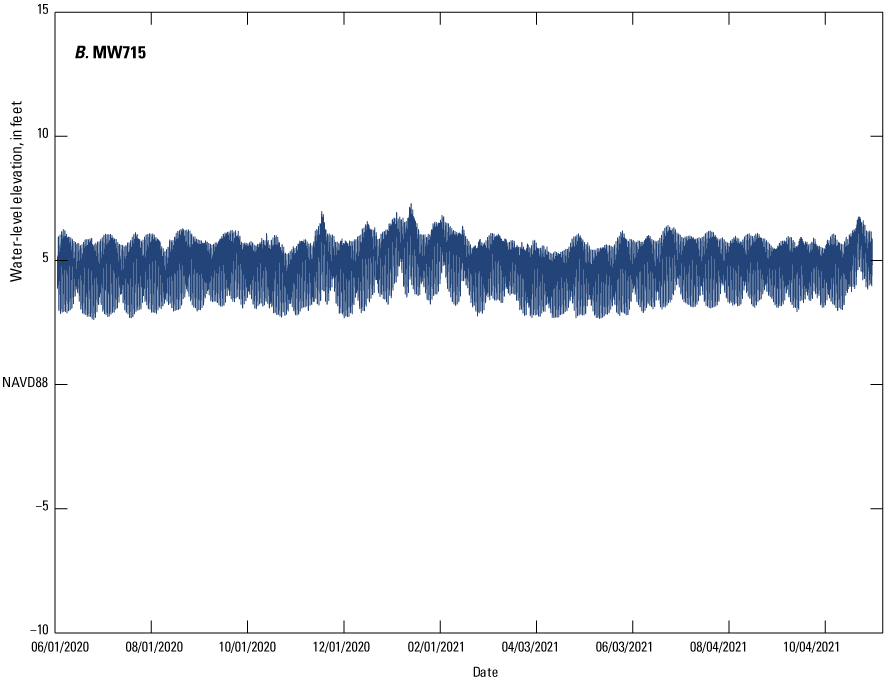
Water level elevation in (A) MW721 and (B) MW715, Bremerton Naval Complex, Washington, June 2020–October 2021. North American Vertical Datum of 1988 (NAVD88).
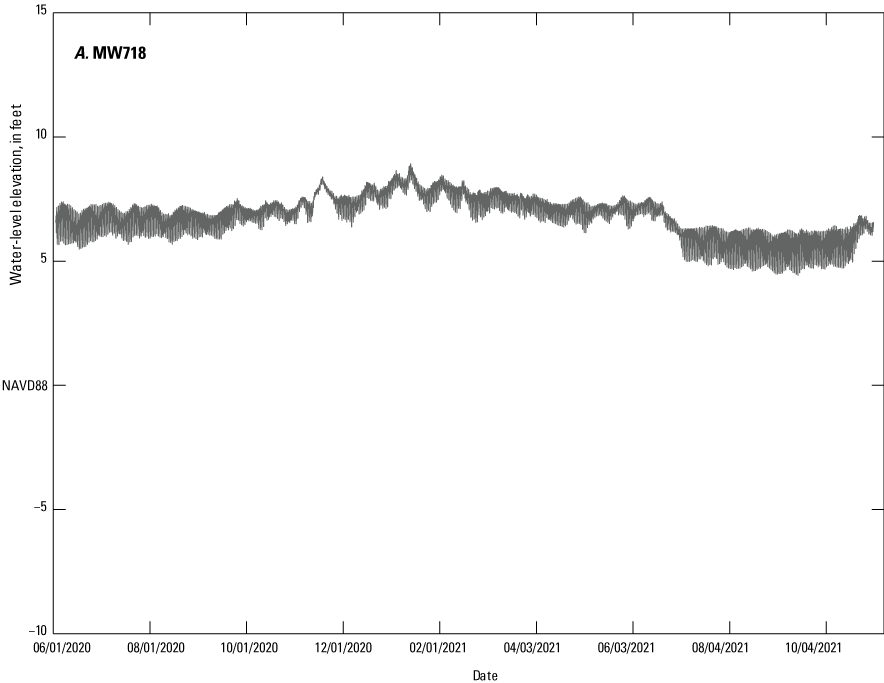
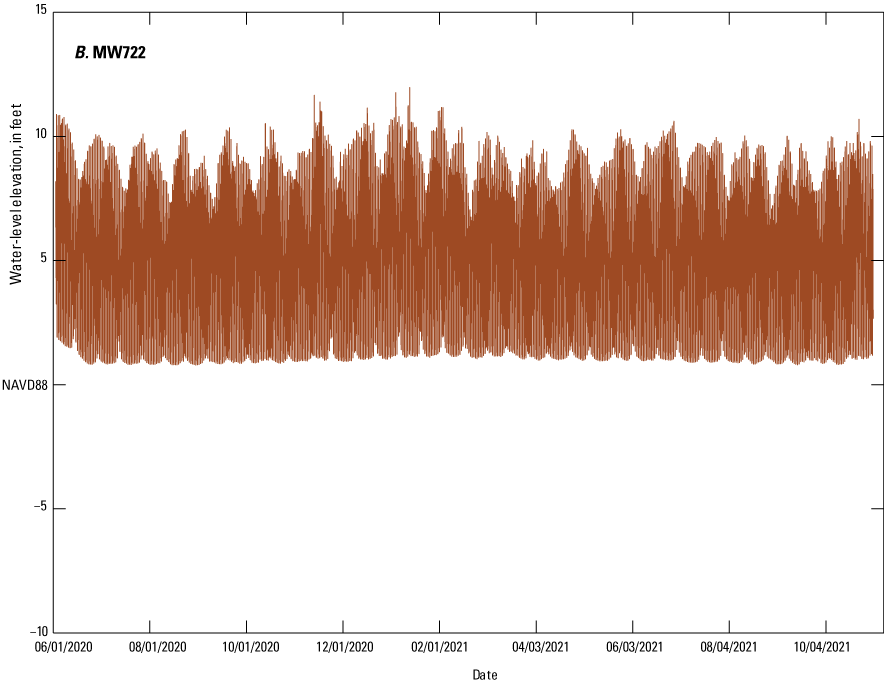
Water level elevation in (A) MW718 and (B) MW722, Bremerton Naval Complex, Washington, June 2020–October 2021. North American Vertical Datum of 1988 (NAVD88).
Appendix 3. Specific Conductance in Nearshore Monitoring Wells, Bremerton Naval Complex, Washington, June 2020–October 2021
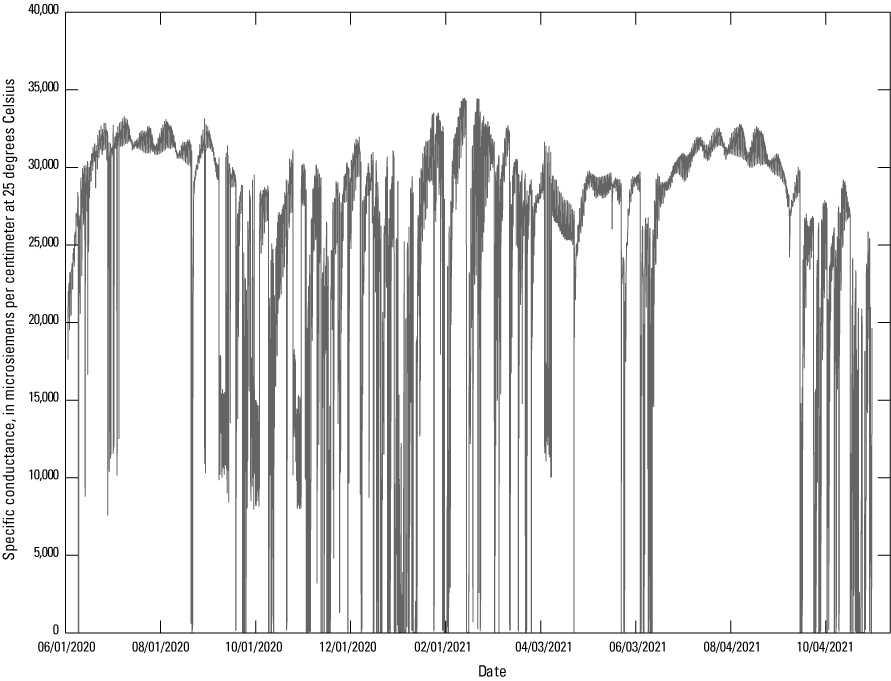
Specific conductance in MW203, Bremerton Naval Complex, Washington, June 2020–October 2021.
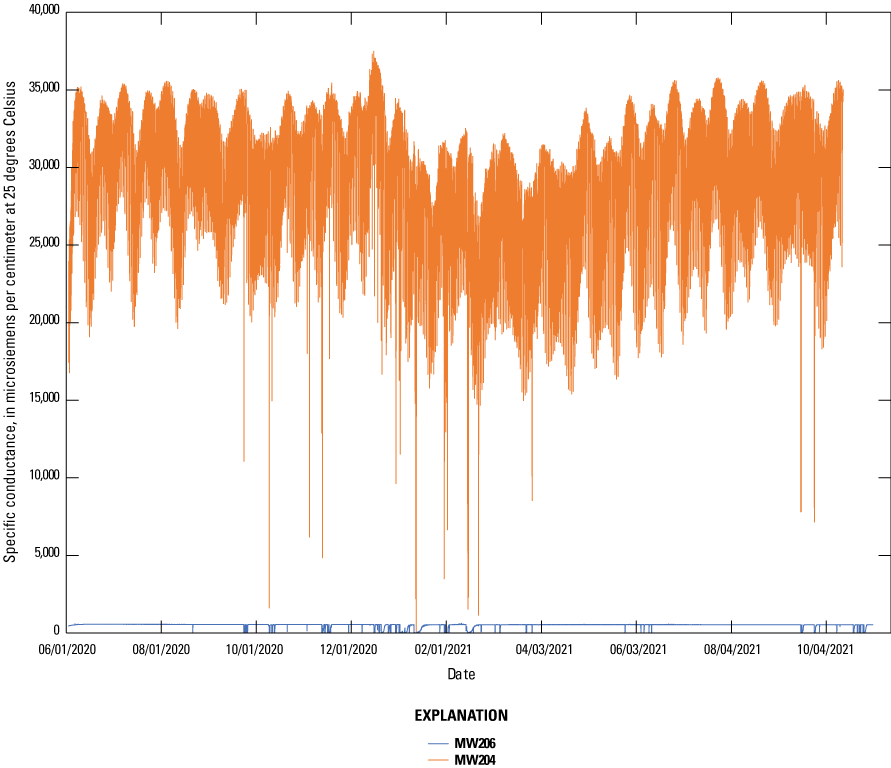
Specific conductance in MW204 and MW206, Bremerton Naval Complex, Washington, June 2020–October 2021.
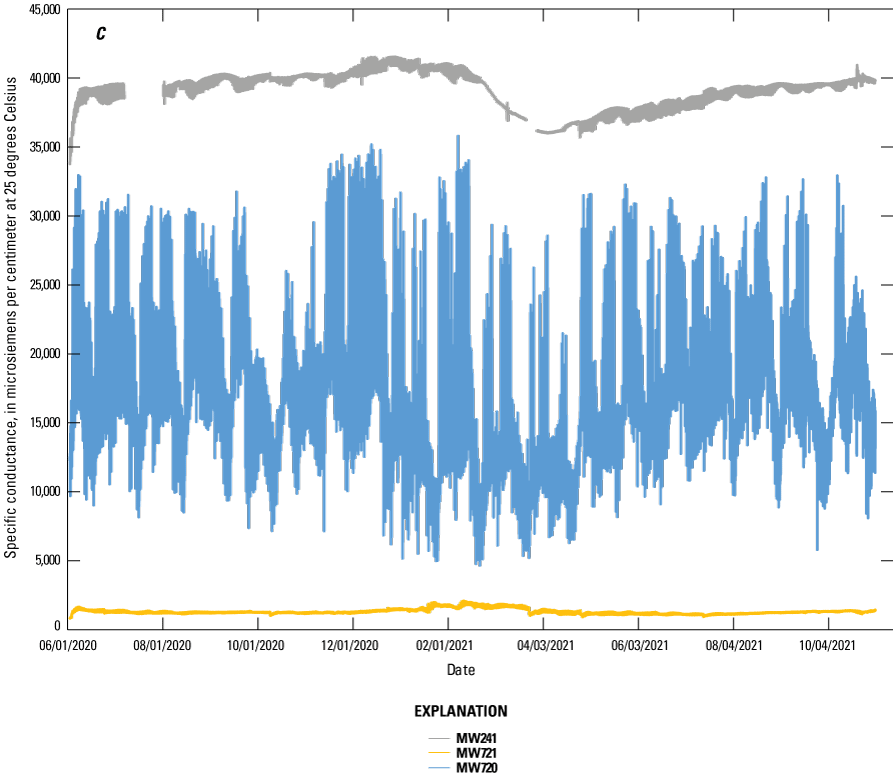
Specific conductance in MW241, MW720, and MW721, Bremerton Naval Complex, Washington, June 2020–October 2021.
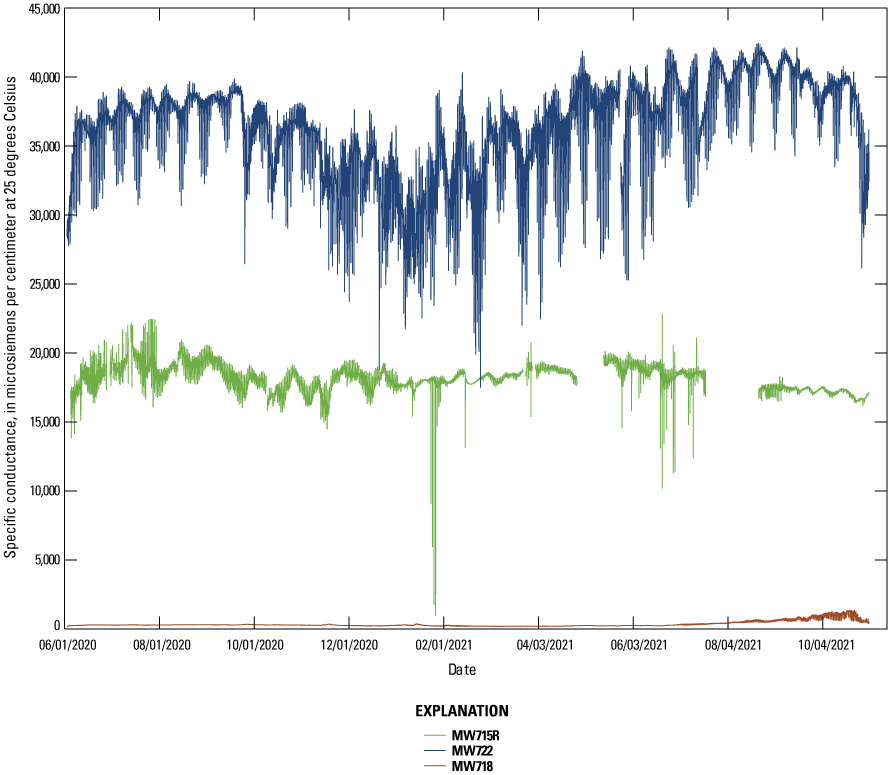
Specific conductance in MW722, MW715, and MW718, Bremerton Naval Complex, Washington, June 2020–October 2021.
Appendix 4. Stable Isotopes of Water and Specific Conductance for Puget Sound Groundwater Samples, Retrieved from the U.S. Geological Survey National Water Information System
Table 4.1.
Stable isotopes of water and specific conductance for Puget Sound groundwater samples, Washington, 2016.[Abbreviations: USGS, U.S. Geological Survey; YYYY-MM-DD, year-month-day; µS/cm at 25 °C, microsiemens per centimeter at 25 degrees Celsius. Data were retrieved from the U.S. Geological Survey National Water Information System (U.S. Geological Survey, 2022).]
Appendix 5. Mercury Concentrations and Loading Estimates to Sinclair Inlet from Stormwater, Dry Docks, and Direct Shoreline Discharge, Bremerton Naval Complex, Washington
Table 5.1.
Mercury concentrations in Stormwater, Dry Docks, and Direct Shoreline Discharge, Bremerton Naval Complex, Washington.[Abbreviations: FTHg, filtered total mercury; PTHg, particulate total mercury; WTHg, whole total mercury; ng/L, nanograms per liter; na, not available; <, less than]
| Pathway | Sub-pathway | Mercury concentration reference | Measured concentrations | |||||
|---|---|---|---|---|---|---|---|---|
| Number of FTHg samples | FTHg (ng/L) | Number of PTHg samples | PTHg (ng/L) | Number of WTHg samples | WTHg (ng/L) | |||
| Stormwater | PSNS015 stormwater | Paulson and others, 2012 | 1 | 144 | na | na | na | na |
| Conn and others, 2018 | 23 | 0.59–9.0 | 3 | 0.60–4.82 | 3 | 1.72–7.12 | ||
| PSNS015 tidal flushing | Paulson and others, 2012 | 1 | 58.8 | na | na | na | na | |
| Conn and others, 2018 | 33 | 0.37–60 | 29 | <0.05–151 | 29 | 0.634–186 | ||
| All other stormwater outfalls | Paulson and others, 2012; Paulson and others, 2013 | 4 | 1.56–2.85 | 4 | 1.15–3.58 | 3.65 | 2.71–6.50 | |
| Brandenberger and others, 2018 | 57 | 0.50–15.1 | na | na | 67 | 0.96– 80.6 | ||
| Dry Docks | Dry Docks 1–5 (pump well) | Paulson and others, 2012 | 7 | 0.63–4.16 | 18 | 15.2–17.6 | na | na |
| This study | 2 | 3.06–4.09 | 2 | 9.07–9.82 | 2 | 12.9–13.2 | ||
| Dry Dock 6 (pump well) | Paulson and others, 2012 | 4 | 0.97–2.38 | 17 | 12.43–11.5 | na | na | |
| Dry Dock 6 (pump well) with cooling water | This study | 6 | 1.30–5.31 | 6 | 1.96–5.69 | 6 | 3.26–11.0 | |
| Recirculating seawater (cooling water) contributing to Dry Dock 6 | This study | 2 | 0.33–0.66 | 2 | 1.47–3.99 | 2 | 2.13–4.32 | |
| Dry Dock 6 (without cooling water) | This study | na | na | na | na | na | na | |
| Process Water | This study | 3 | 1.00–3.55 | 3 | 2.29–4.49 | 3 | 3.29–8.04 | |
| Direct Discharge | OU A + Western OU B Terrestrial (excluding the vicinity of Site 2) | Paulson and others, 2013 | 10 | 1.4–6 | na | na | na | na |
| This study | 14 | 0.33–23.4 | 14 | 0.081–41.0 | 14 | 0.411–55.2 | ||
| Vicinity of Site 2 | Paulson and others, 2013 | 5 | 72–702 | na | na | na | na | |
| This study | 4 | 11.9–628 | 4 | 10.1–426 | 4 | 22.0–1028 | ||
| Vicinity of Site 1 | Paulson and others, 2013 | 10 | 1.07–31 | na | na | na | na | |
| This study | 43 | 14.2–174 | 43 | 0.558–948 | 43 | 16.1–965 | ||
| Rest of BNC | Paulson and others, 2013 (OUBT-724) | 23 | 3.78–10.8 | 6 | 0.93–24.7 | 3 | 7.29–20.7 | |
Table 5.2.
Mercury Loading Estimates to Sinclair Inlet from Stormwater, Dry Docks, and Direct Shoreline Discharge, Bremerton Naval Complex, Washington.[Stormwater and Dry Dock loads were estimated by multiplying the estimated average discharge by either the minimum or maximum measured mercury concentration. Direct discharge loads were estimated on a cell-by-cell basis from the Jones and others (2024) model by multiplying the minimum estimated average discharge by the minimum measured mercury concentration for the minimum load and the maximum estimated average discharge by the maximum measured mercury concentration for the maximum load. See table 14 for explanation of discharge estimates and “Updated Conceptual Site Model and Mercury Loading Estimates” for explanation of concentration estimates. Abbreviations: m3/d, cubic meters per day; g/yr, grams per year; na, not available; <, less than; ~, about]
| Pathway | Sub-pathway | Discharge reference | Estimated average discharge (m3/d) | Estimated loads | Comments | ||
|---|---|---|---|---|---|---|---|
| FTHg loads (g/yr) | PTHg loads (g/yr) | WTHg loads (g/yr) | |||||
| Stormwater | PSNS015 stormwater | Paulson and others, 2013, taken from Skahill and LaHatte 2007 | 864 | 46 | na | na | None |
| 0.2–2.8 | 0.2–1.5 | 0.5–2.2 | |||||
| PSNS015 tidal flushing | Paulson and others, 2013 | 3370 | 73 | na | na | Discharge is highly uncertain; extrapolated from 3.5 hours | |
| 0.5–74 | <0.1–186 | 0.8–229 | |||||
| All other stormwater outfalls | Paulson and others, 2013, taken from Skahill and LaHatte 2007; Brandenberger and others, 2018 | 769 | 0.4–0.8 | 0.3–1.0 | 0.8–1.8 | PTHg and WTHg loads were not reported in Paulson tables, but are estimated here | |
| 0.14–4.2 | na | 0.27–22.6 | FTHg and WTHg concentrations and loads listed here were reported as dissolved and total recoverable mercury, respectively, in Brandenberger and others (2018) | ||||
| Dry Docks | Dry Docks 1–5 (pump well) | Paulson and others, 2013 | 13,800 | 3.2–26 | na | na | None |
| 1Measurements taken (1/2019–12/2021) | 13,800 | 16–21 | 46–50 | 65–67 | |||
| Dry Dock 6 (pump well) | Paulson and others, 2012 | 17,300 | 8.2–14 | na | na | None | |
| Dry Dock 6 (pump well) with cooling water | 1Measurements taken (1/2019–12/2021) | 34,600 | 16–67 | 25–72 | 41–140 | Used average discharge with cooling water versus without cooling water since all measured mercury concentrations were when cooling water was contributing to pump well. | |
| Recirculating seawater (cooling water) contributing to Dry Dock 6 | 1Measurements taken (1/2019–12/2021) | 16,400 | 2.0–4.0 | 8.8–24 | 13–26 | Estimated average discharge = “with cooling water” minus “without cooling water” | |
| Dry Dock 6 (without cooling water) | 1Measurements taken (1/2019–12/2021) | 18,100 | ~14–63 | ~16–48 | ~28–112 | Subtracted cooling water load from DD6 with cooling water load | |
| Process Water | 1Measurements taken (1/2019–12/2021) | 541 | 0.2–0.7 | 0.5–0.9 | 0.6–2 | None | |
| Direct Discharge | OU A + Western OU B Terrestrial (excluding the vicinity of Site 2) | Paulson and others, 2013 | 518 | 0.3–1.2 | na | na | “Zone of direct discharge” in Paulson and others, 2012 and 2013 |
| Jones and others, 2024 | 2302–1,210 | 0.5–2 | 1.8–7.3 | 1.1–4.5 | |||
| Vicinity of Site 2 | Paulson and others, 2013 | <86 | 0.6–2.5 | na | na | None | |
| Jones and others, 2024 | 233.5–134 | 7.0–28 | 4.7–19 | 11–45 | |||
| Vicinity of Site 1 | Paulson and others, 2013 | unknown | “Significant release possible” | None | |||
| Jones and others, 2024 | 221.6–86.4 | 0.15–7.3 | 0.01–40 | 0.17–41 | |||
| Rest of BNC | Jones and others, 2024 | 27–28 | 0.013–0.15 | 0.003–0.34 | 0.025–0.29 | None | |
Ranges determined using Jones and others (2024) as minimum and 4 times the value in Jones and others (2024) as maximum to estimate the addition of the intertidal saline cell.
Conversion Factors
International System of Units to U.S. customary units
U.S. customary units to International System of Units
Temperature in degrees Celsius (°C) may be converted to degrees Fahrenheit (°F) as follows:
°F = (1.8 × °C) + 32.
Datums
Vertical coordinate information is referenced to the North American Vertical Datum of 1988 (NAVD 88).
Horizontal coordinate information is referenced to the North American Datum of 1983 (NAD 83).
Altitude, as used in this report, refers to distance above the vertical datum.
Supplemental Information
Specific conductance is given in microsiemens per centimeter at 25 degrees Celsius (µS/cm at 25 °C).
Concentrations of chemical constituents in water are given in either milligrams per liter (mg/L), micrograms per liter (µg/L), or nanograms per liter (ng/L).
Concentrations of chemical constituents in sediment are given in either milligrams per kilogram (mg/kg), micrograms per gram (µg/g), or nanograms per gram (ng/g).
Activities for radioactive constituents in water are given in picocuries per liter (pCi/L).
Abbreviations
‰
part per thousand (or per mil)
δ
ratio of stable isotopes for mass dependent fractionation
Δ
ratio of stable isotopes for mass independent fractionation
199-Hg
stable isotope 199 of mercury
200-Hg
stable isotope 200 of mercury
202-Hg
stable isotope 202 of mercury
BNC
Bremerton Naval Complex
DOC
dissolved organic carbon
EPA
U.S. Environmental Protection Agency
FGD
fresh groundwater discharge
FMeHg
filtered methylmercury
FO-DTS
fiber optic distributed temperature sensing
FTHg
filtered total mercury
ICP-MS
inductively coupled plasma mass spectrometry
ISC
inter-tidal saltwater cell
MRL
U.S. Geological Survey Mercury Research Laboratory
MW
monitoring well
NWQL
U.S. Geological Survey National Water Quality Laboratory
OU
Operable Unit
OU A
Operable Unit A
OUBT
Operable Unit B - Terrestrial
PETG
polyethylene terephthalate glycol
PFA
perfluoroalkoxy
PMeHg
particulate methylmercury
PTHg
particulate total mercury
QCU
quality control unit
QFF
quartz fiber filter
SMHg
sediment methylmercury
STHg
sediment total mercury
THg
total whole mercury
TSS
total suspended solids
USGS
U.S. Geological Survey
WAWSC
U.S. Geological Survey Washington Water Science Center
WMeHg
whole methylmercury
WTHg
whole total mercury
For information about the research in this report, contact
Director, Washington Water Science Center
U.S. Geological Survey
934 Broadway, Suite 300
Tacoma, Washington 98402
https://www.usgs.gov/centers/washington-water-science-center
Manuscript approved on February 1, 2024
Publishing support provided by the U.S. Geological Survey
Science Publishing Network, Tacoma Publishing Service Center
Edited by Linda S. Rogers (contractor), Jeff Suwak, and Vanessa Ball
Illustration support by Luis Menoyo
Layout and design by Luis Menoyo
Disclaimers
Any use of trade, firm, or product names is for descriptive purposes only and does not imply endorsement by the U.S. Government.
Although this information product, for the most part, is in the public domain, it also may contain copyrighted materials as noted in the text. Permission to reproduce copyrighted items must be secured from the copyright owner.
Suggested Citation
Conn, K.E., Janssen, S.E., Opatz, C.C., and Bright, V.A.L., 2024, A conceptual site model of contaminant transport pathways from the Bremerton Naval Complex to Sinclair Inlet, Washington, 2011–21 (ver. 1.1): U.S. Geological Survey Scientific Investigations Report 2024–5011, 111 p., https://doi.org/10.3133/sir20245011.
ISSN: 2328-0328 (online)
Study Area
| Publication type | Report |
|---|---|
| Publication Subtype | USGS Numbered Series |
| Title | A conceptual site model of contaminant transport pathways from the Bremerton Naval Complex to Sinclair Inlet, Washington, 2011–21 |
| Series title | Scientific Investigations Report |
| Series number | 2024-5011 |
| DOI | 10.3133/sir20245011 |
| Publication Date | March 26, 2024 |
| Year Published | 2024 |
| Language | English |
| Publisher | U.S. Geological Survey |
| Publisher location | Reston, VA |
| Contributing office(s) | Washington Water Science Center, Upper Midwest Water Science Center |
| Description | Report: x, 111 p.; 2 Data Releases |
| Country | United States |
| State | Washington |
| Other Geospatial | Sinclair Inlet |
| Online Only (Y/N) | Y |