

Development of a Hydrogeologic Visualization Model for Western Sarpy County, Nebraska
Links
- Document: Report (2.63 MB pdf) , HTML , XML
- Dataset: USGS dataset Datasets of altitude of the top of the Dakota Sandstone, top of the Pennsylvanian-age units, and water-level in western Sarpy County, Nebraska
- Database: USGS National Water Information System USGS water data for the nation
- NGMDB Index Page: National Geologic Map Database Index Page (html)
- Download citation as: RIS | Dublin Core
Acknowledgments
The authors would like to thank the Papio-Missouri River Natural Resources District, the Nebraska Natural Resources Commission, and the Nebraska Department of Natural Resources for providing funding and support for this study. The authors would like to specifically thank Paul Woodward (formerly with Papio-Missouri River Natural Resources District) for providing guidance throughout the study’s duration and for providing pertinent data and feedback during the process of developing this hydrogeologic visualization tool.
Abstract
Population in western Sarpy County, Nebraska, has steadily increased over the last several decades and has led to increased groundwater use for domestic purposes. To meet the increase in demand, the Papio-Missouri River Natural Resources District is seeking a more comprehensive understanding of available sources of groundwater in western Sarpy County. Additionally, elevated groundwater nitrate plus nitrite as nitrogen concentrations were detected, indicating the need to better understand the groundwater quality of the area. Although the general geology of the area is known, the area does not have detailed information on the extent of the various aquifers, particularly the Dakota aquifer. To characterize these aquifers, the Papio-Missouri River Natural Resources District invested in airborne electromagnetic surveys of the area to better understand the subsurface geology. Although these surveys improved understanding of the groundwater systems in the area, the Papio-Missouri River Natural Resources District wanted to integrate the subsurface information with available water-quality and groundwater-level data.
In response, the U.S. Geological Survey, in cooperation with the Papio-Missouri River Natural Resources District, the Nebraska Natural Resources Commission, and the Nebraska Department of Natural Resources, assembled geologic, hydrogeologic and nitrate plus nitrite as nitrogen information for the selected area into a three-dimensional visualization computer software package called GeoScene3D. The completed GeoScene3D project was assembled to provide a visualization of the groundwater systems and associated water-quality results in Sarpy County and to provide the Papio-Missouri River Natural Resources District managers with information that can be used to make more informed groundwater resource-planning decisions in the future. This report details the development of a three-dimensional model created within GeoScene3D to visualize the subsurface, particularly the Dakota Sandstone in western Sarpy County.
Introduction
The Papio-Missouri River Natural Resources District (PMRNRD) manages surface water and groundwater for more than 750,000 people (Papio-Missouri River Natural Resources District, 2018) in eastern Nebraska. Since 1992, the U.S. Geological Survey (USGS) has been working with the PMRNRD to monitor groundwater quality in the district. Sarpy County is at the southern end of the PMRNRD boundary (fig. 1). The Sarpy County population has grown at a faster percentage rate between 2010 (159,720) and 2020 (190,604) than any other county in Nebraska (U.S. Census Bureau, 2021). The demand for groundwater in western Sarpy County for municipal, commercial, and domestic use has increased with the growing population. To meet these demands, the PMRNRD is seeking to use all available sources of groundwater in western Sarpy County.
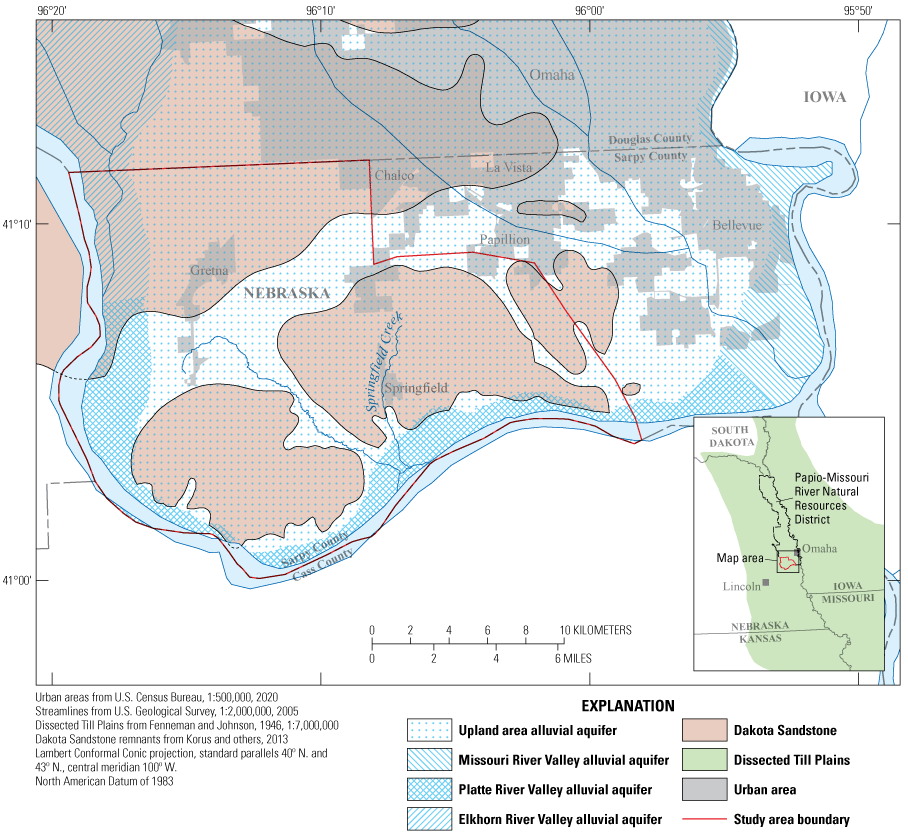
Study area with focus on the Dakota Sandstone in western Sarpy County, Nebraska.
Although eastern Sarpy County is heavily urbanized, western Sarpy County is primarily rural but has become more urbanized during the last 20 years (Dewitz and U.S. Geological Survey, 2021). Much of western Sarpy County is not served by a public water system, and most residents and companies use private wells.
In 2012, the PMRNRD sampled a large number of domestic wells in south-central Sarpy County to assess nitrate plus nitrite as nitrogen (hereinafter referred to as “nitrate”) concentrations in the area. This sampling effort led to a review of registered wells across all of Sarpy County, and it was determined that between 1992 and 2012 the number of domestic wells drilled in the glacial till and Dakota Sandstone of Sarpy County had increased substantially. Elevated groundwater nitrate concentrations were detected throughout the area, indicating the need to better understand the quality of groundwater in western Sarpy County with regards to increasing domestic use (U.S. Geological Survey, 2021b).
According to Verstraeten and Ellis (1995), the groundwater resources in Sarpy County consist of five main aquifers: the Elkhorn River Valley alluvial aquifer, Missouri River Valley alluvial aquifer, Platte River Valley alluvial aquifer, Upland area alluvial aquifers, and the Dakota aquifer, which is composed of the Dakota Sandstone (fig. 1). Increases in municipal, domestic, and commercial users have the potential to stress the groundwater system in western Sarpy County; however, the aquifer primarily used for new wells in the area (Dakota aquifer) has not been mapped in detail.
The general geology of western Sarpy County is glacial till overlying Dakota Sandstone and Pennsylvanian-age units (McGuire and others, 2012), but the extents of these geologic systems have not been determined. The glacial till and Dakota Sandstone potentially contain aquifer-bearing materials; however, erosion and deposition associated with continental glaciation have resulted in complex, discontinuous aquifers within these geologic units. Test holes have been drilled in western Sarpy County to better understand localized geology (University of Nebraska, 2022). Cross sections have been developed using these test holes, but because of the discontinuous nature of the geology, the cross sections cannot be extrapolated over large areas (Condra and Scherer, 1939; Korus and others, 2012).
The primary aquifer of interest for expanding groundwater use in western Sarpy County is the Dakota aquifer; secondary aquifers of interest are the Upland area alluvial aquifers. The spatial extent and thickness of the Dakota Sandstone in Nebraska have been generally mapped, but localized variations needed to be investigated (Burchett and Carlson, 1966; Leonard and others, 1983). In 2017, to better understand the stratigraphy and hydrogeology of the western Sarpy County area, the PMRNRD arranged for airborne electromagnetic (AEM) surveys of the area to be completed (Cannia and others, 2017, Nebraska Department of Natural Resources, 2017). The PMRNRD determined that they wanted to incorporate the AEM data into a visualization tool that would allow PMRNRD staff to easily interact with the AEM data and integrate the data with other hydrogeologic and groundwater-quality data. In 2017, the PMRNRD and the USGS began a cooperative agreement through the Nebraska Natural Resources Commission and the Nebraska Department of Natural Resources Water Sustainability Fund program to develop a hydrogeologic visualization model of western Sarpy County using GeoScene3D (I-GIS, 2021).
Purpose and Scope
The purpose of this report is to describe the development of a three-dimensional (3D) model created with GeoScene3D (I-GIS, 2021) to visualize the subsurface, particularly the Dakota Sandstone, in western Sarpy County (fig. 1). This 3D model incorporates geologic, groundwater-level, and water-quality data and can be used by PMRNRD managers and staff to (1) identify areas where groundwater and surface water are hydrologically connected, (2) visually understand existing (and potential) areas of groundwater-quality concern, and (3) identify areas where additional groundwater-level and water-quality monitoring will be beneficial to the PMRNRD. A corresponding USGS data release includes raster and contour files of the top of the Dakota Sandstone and the top of the Pennsylvanian-age units that support the GeoScene3D model (Cherry and others, 2023).
Study Area Description
Sarpy County, which is in eastern Nebraska, is about 640 square kilometers (fig. 1). The major population centers within the county include the communities of Bellevue, Gretna, La Vista, Papillion, and Springfield. Most of the population resides in the eastern part of the county. Sarpy County is bounded by the Elkhorn River (northwest), the Platte River (south and southwest), and the Missouri River (east). The Elkhorn River flows into the Platte River in the northwestern corner of the county, and the Platte River eventually flows into the Missouri River at the southeastern boundary of the county (fig. 1).
Sarpy County is part of the Dissected Till Plains physiographic section of the Central Lowland province (Fenneman, 1938, fig. 1). The two highest areas are in the western and northeastern parts of the county. The elevation ranges from about 400 meters (m) above the North American Vertical Datum of 1988 (NAVD 88) in the western part of the county just to the east of the Elkhorn River and slopes downwards to a low point of about 293 m above NAVD 88 in the Missouri River Valley at the confluence of the Platte River (fig. 1). The physiographic features are defined by nearly flat river valleys bordered by steep bluffs and escarpments and gently rolling uplands. The uplands consist of rolling ridges and valleys formed by glacial erosion and depositions. The glacial till is overlain by aeolian loess in varying degrees of thickness (Burchett and Carlson, 1966).
The climate of Sarpy County is continental and temperate with large seasonal variations in temperature and precipitation, and most of the annual precipitation falls from April through September. The climate is characterized by moderate precipitation of 77 centimeters per year and daily average temperatures that range from −11.1 to 30.9 degrees Celsius (High Plains Regional Climate Center, 2010).
Most of the soil in Sarpy County consists of silt loams (Verstraeten and Ellis, 1995). These soils are generally well draining but have been eroded in many places because of cultivation (Bartlett, 1975). The creek and river bottoms range from clay to sand. A small part of the land is too steep for cultivation.
Geologic Setting
The surficial Quaternary-age Pleistocene and Holocene geologic units in eastern Nebraska consist of complex sequences of clay, silt, till, sand, and gravel overlying bedrock units. These materials are capped by loess deposits in many locations throughout eastern Nebraska. The geologic and hydrogeologic features from Verstraeten and Ellis (1995), Jorgensen and others (1993), Helgesen and others (1993), McGuire and others (2012), and Miller and Appel (1997) are summarized in figure 2. The surficial deposits are predominantly glacial (clay, silt, and gravel), alluvial (clay, silt, sand, and gravel), and eolian (wind deposited silt) deposits of Quaternary age. These deposits are unconsolidated and range from relatively permeable sand and gravel to poorly permeable silts and clays.
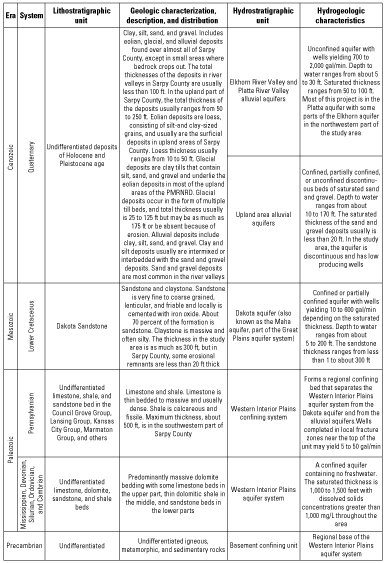
Description of hydrogeologic units, western Sarpy County, Nebraska (modified from Verstraeten and Ellis [1995], Jorgensen and others [1993], Helgesen and other [1993] McGuire and others [2012], and Miller and Appel [1997]). [ft, foot; PMRNRD, Papio-Missouri River Natural Resources District; gal/min, gallon per minute; mg/L, milligram per liter]
The surficial deposits directly overlay consolidated bedrock that consists of sedimentary rocks of Cretaceous and Pennsylvanian age (fig. 2). The rocks of Cretaceous age consist primarily of massive to interbedded sandstone/sand with ironstone and shale; some zones are argillaceous to slightly sandy and are collectively known as the Dakota Sandstone (Condra and Reed, 1959). In eastern Nebraska, the Dakota Sandstone reflects a complex pattern of deposition and erosion consistent with the alluvial, deltaic, and shoreline sedimentary environments of the eastern margin of the Cretaceous Western Interior seaway (Karl, 1976). The Dakota Sandstone makes up the oldest Cretaceous-age rock in western Sarpy County and is covered by Quaternary-age alluvium and glacial till except where the Dakota Sandstone crops out along the bluffs near the Platte River to the south (Burchett and others, 1975).
Unexposed older sedimentary rocks of Mississippian, Devonian, Silurian, Ordovician, and Cambrian ages consist mostly of dolomite, limestone, shale, and sandstone. Most rocks that compose the confining unit of Paleozoic age in the PMRNRD are Pennsylvanian in age. They are generally impermeable shale and dense limestone. None of these formations can be considered a significant source of water (Verstraeten and Ellis, 1995). Undifferentiated igneous, metamorphic, and sedimentary rocks form the basement units (Verstraeten and Ellis, 1995). Within these bottom units lies the Western Interior Plains aquifer system, which is a confined saline aquifer with a large (1,000–1,500 feet thick) saturated thickness (Jorgensen and others, 1993).
The geologic history relevant to this study began 112 million years ago during the Early Cretaceous period when the deposition of the Dakota Sandstone occurred. During this deposition, the environment was a coast/estuary system bisected by meandering rivers. As the mouth of the rivers rose with the formation of the Cretaceous seaway, the river gradients dropped, causing sediment deposition. The point of deposition slowly moved eastward as the seaway rose, and the Dakota Sandstone Formation was deposited along the coast (Condra and Scherer, 1939). The repeated advance and retreat of glaciers, which began about 2 million years ago, resulted in a complex framework of largely Pleistocene-age sediments overlying the Dakota Sandstone (Wayne, 1985). The patterns that formed the shape of the current Dakota Sandstone are related to erosional episodes including glaciation, fluvial processes, and recent erosion in the Platte River, Buffalo Creek, and Springfield Creek drainages (Wayne, 1985). In Sarpy County, the Dakota Sandstone is discontinuous (fig. 1). The overlying Quaternary layers are thin or absent (Verstraeten and Ellis, 1995; McGuire and others, 2012), making the Dakota Sandstone an important groundwater resource.
Groundwater Conditions
Regional groundwater flow conditions in this area are generally west to east, but local groundwater flow is variable and often follows surface topography (Verstraeten and Ellis, 1995; McGuire and others, 2012). Four main aquifers are in use in western Sarpy County, three surficial and one bedrock (Verstraeten and Ellis, 1995; McGuire and others, 2012). The focus of this study is the bedrock aquifer (Dakota aquifer), which is throughout Sarpy County but is discontinuous in some areas. The surficial aquifers consist of the Elkhorn River Valley and Platte River Valley alluvial aquifers and the Upland area alluvial aquifers (Verstraeten and Ellis, 1995; McGuire and others, 2012).
The Elkhorn River Valley and Platte River Valley alluvial aquifers are generally less than 30 m thick and consist of undifferentiated alluvial deposits. The alluvial aquifers are typically unconfined and recharge primarily from precipitation infiltration. Wells in these aquifers can yield from 700 to several thousand gallons per minute (Verstraeten and Ellis, 1995).
The Upland area alluvial aquifers are made up of undifferentiated glacial deposits (Wayne, 1985; Verstraeten and Ellis, 1995). The Upland area alluvial aquifers are layers of sand and gravel that are interspersed between layers of glacial till and silt. These aquifers are as much as 60 m thick and are confined, partially confined, or unconfined depending on the permeability of the overlying till. The Upland area alluvial aquifers are recharged primarily from precipitation infiltration (Verstraeten and Ellis, 1995). The streams and rivers in Sarpy County have varying degrees of connectivity to the Upland area alluvial aquifers depending on location. The Upland area alluvial aquifers can be recharged or can discharge to connected streams depending on temporal streamflow and groundwater-level conditions (Cannia and others, 2017). In some locations, the Upland area alluvial aquifers are connected to the Dakota aquifer (Verstraeten and Ellis, 1995; Cannia and others, 2017).
The Dakota aquifer is part of the Great Plains aquifer system and is as much as 45 m thick. The Great Plains aquifer system is part of the Lower Cretaceous aquifer system, which is one of the most extensive in the United States and underlies 94 percent of Nebraska (Miller and Appel, 1997; Gosselin and others, 2001). In areas where the Dakota aquifer is dominated by sandstone and sand, the unit is a productive aquifer (fig. 2). In areas where it is dominated by shale and clay, it acts as a confining unit. The primary sources of recharge are precipitation infiltration and inflow from hydraulically connected aquifers (Miller and Appel, 1997; Gosselin and others, 2001).
Previous Studies
Several groundwater and geologic studies have been completed in Sarpy County (Verstraeten and Ellis, 1995; Korus and others, 2012; McGuire and others, 2012; Cannia and others, 2017; Hobza and Flynn, 2021). These studies have primarily been groundwater-quality focused. Nitrate is a common groundwater contaminant throughout Nebraska, and the PMRNRD has been monitoring nitrate concentrations extensively since 1992 by sampling domestic, irrigation, municipal, and monitoring wells. Verstraeten and Ellis (1995) reviewed groundwater-quality data to describe the water quality of the principal aquifers in the PMRNRD. Their report stated that the highest nitrate concentrations were in the Upland area alluvial aquifers and the Dakota aquifer. They also tested for several pesticides, but none were detected at concentrations greater than the U.S. Environmental Protection Agency (EPA) maximum contaminant level (MCL) for drinking water (U.S. Environmental Protection Agency, 2022). McGuire and others (2012) and Hobza and Flynn (2021) also examined groundwater quality and groundwater age in the primary and secondary bedrock aquifers in the area. Groundwater-recharge dates ranged from older than 1940 in samples from wells screened in the Missouri River Valley alluvial aquifer to as recent as the early 1980s in samples from wells screened in the Dakota aquifer (McGuire and others, 2012). Hobza and Flynn (2021) detected mixed-age (older and modern, post-1950) and modern-age water in the Dakota aquifer in western Sarpy County, which was younger than water from other Dakota aquifer samples taken outside of Sarpy County. During 2012, the USGS, in cooperation with the PMRNRD, sampled domestic wells and determined that many of the wells screened in the Dakota aquifer had elevated nitrate values (greater than 5 milligrams per liter [mg/L]) and some had nitrate values that exceeded the EPA nitrate MCL (10 mg/L) for drinking water (U.S. Geological Survey, 2021b; U.S. Environmental Protection Agency, 2022).
In 2017, an AEM survey was completed in western Sarpy County to improve understanding of the extent, thickness, and characteristics of the Dakota Sandstone, overlying Quaternary-age units, and other bedrock units of Pennsylvanian age or older. The AEM data were collected in a grid near the communities of Springfield and Gretna, and lines were collected about every 300 m (Cannia and others, 2017). The PMRNRD requested these surveys to improve the understanding of the hydrogeologic framework so that they could better manage the drinking water supplies in that area.
To illustrate the geologic units in eastern Nebraska, geologic cross sections were created from test-hole and other borehole data. One of these cross sections was developed for a section near the western boundary of Sarpy County. These cross sections were developed primarily to characterize the unconsolidated Quaternary deposit and the bedrock deposits directly below them (Korus and others, 2012).
Hydrogeologic Data Compilation
Datasets from multiple sources were used to develop the 3D visualization model for western Sarpy County. These datasets included the land surface, AEM surveys, stratigraphic logs from test holes, lithologic data from selected registered wells, groundwater-level measurements, and nitrate sampling results. All data inputs included horizontal and vertical spatial reference information so that the inputs could be properly represented in GeoScene3D (I-GIS, 2021). These datasets were examined for relevance; then, each dataset was formatted for GeoScene3D. Formatting for GeoScene3D consisted of converting the datasets into either point shapefiles or ASCII files and then converting the georeferenced information to a standard projection. All datasets were converted from their original horizontal spatial coordinate reference system to the Nebraska State Plane Coordinate System (National Oceanic and Atmospheric Administration, 1995), in meters, referenced to the North American Datum of 1983. This horizontal spatial reference coordinate system was specifically designed for the State of Nebraska to minimize scale distortions. All data inputs were converted from their original vertical datum to NAVD 88. A 10-m digital elevation model (DEM) was downloaded from the USGS National Map (U.S. Geological Survey, 2021a) to use as a standard vertical reference for all datasets. The following sections describe all other individual datasets and how they were processed.
Airborne Electromagnetic Surveys
AEM surveys are a method for measuring electrical resistivity in subsurface material. Lower electrical resistivity generally corresponds to subsurface materials with higher porosity and smaller grain sizes, whereas higher electrical resistivity generally corresponds to subsurface materials with larger grain sizes. These measurements can be affected by the presence of clays, dissolved solids, or other more conductive materials. When these AEM surveys are used in conjunction with data from lithologic logs, the two data sources can be used to identify and characterize different subsurface geologic formations (Hobza and Steele, 2020).
AEM surveys are usually done using either time-domain electromagnetic systems or frequency-domain electromagnetic systems. The AEM surveys in Sarpy County used a time-domain electromagnetic system called SkyTEM304M (SkyTEM, 2022). For this system, a helicopter with a large wire loop with multiple turns attached to the underside by a long cable is flown. An electrical current is passed through the wire loop, creating an electromagnetic field. This field is turned off and on, and the electromagnetic response of subsurface materials is measured by receiver coils connected to the loop. These measured magnetic responses are recorded and can be used to create a model of subsurface resistivity. A more indepth explanation of these methods is documented in Fitterman and Labson (2005) and Cannia and others (2017).
The AEM data collection for Sarpy County was completed in 2016 (Cannia and others, 2017). Individual flight lines were 16–20 kilometers (km) in length for east-west lines and 13–16 km for north-south lines. North-south lines were stationed about 1 km apart whereas east-west lines were stationed about 200–250 m apart (fig. 3). These lines were positioned in areas identified as of primary concern for the PMRNRD in relation to water quality and quantity (Cannia and others, 2017). A few additional AEM flight lines were flown in the northwestern part of the study area near Gretna, but the distance between these lines was much greater (1.77 km in the east-west direction and 1.62 km in the north-south direction). Flight lines in the northwestern part of the study area were less dense because development of additional domestic wells was less prevalent in that area, and the area has more urban-related flight obstructions.
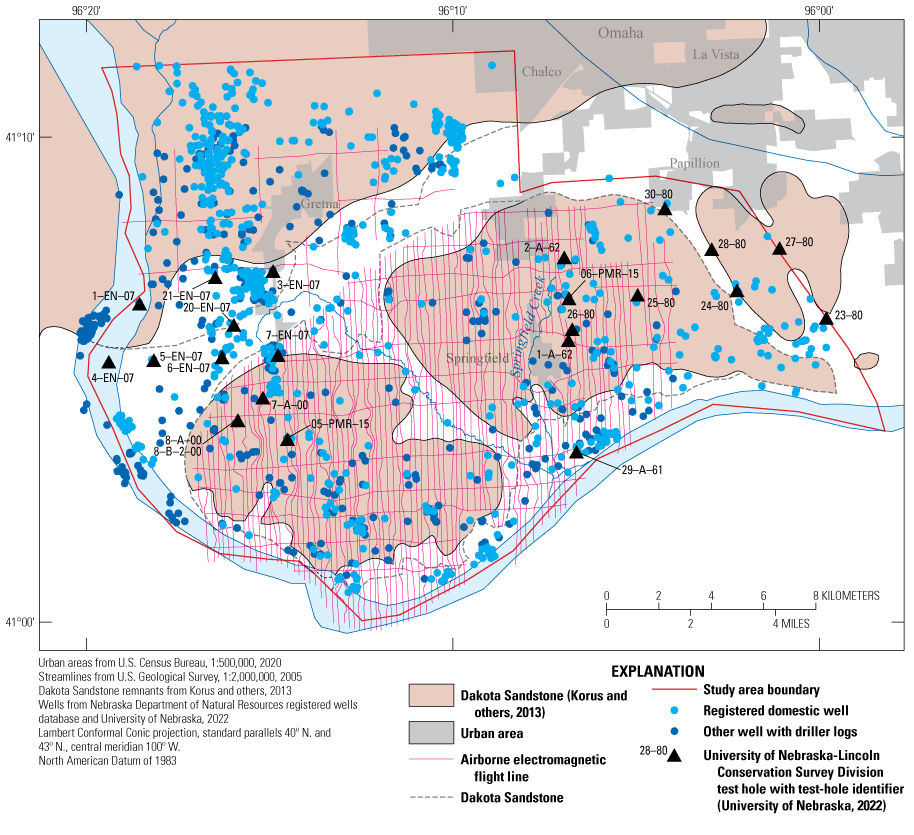
Extent of Dakota Sandstone as estimated using airborne electromagnetic flight line survey data, test holes, and driller logs from selected wells in western Sarpy County, Nebraska.
Digital Elevation Model
A 10-m DEM of the area was downloaded from the USGS National Map web service (U.S. Geological Survey, 2021a). This DEM was then converted to an ASCII file and uploaded in GeoScene3D.
Geologic Test Holes
The University of Nebraska Conservation and Survey Division (CSD) drills test holes around the State of Nebraska to provide detailed lithologic and stratigraphic information (University of Nebraska, 2022). Of these CSD test holes, 23 are within the study area (table 1 and fig. 3). These test holes were used by Cannia and others (2017) to compare resistivity values to collocated test-hole data to guide AEM interpretation.
Table 1.
Lithostratigraphic and hydrostratigraphic units and descriptions, western Sarpy County, Nebraska.[ID, identifier; L., Lower; SS, Sandstone; *, indicates the bottom of the test hole]
Data from University of Nebraska (2022).
In addition to these test holes, driller logs for wells registered with the Nebraska Department of Natural Resources (Nebraska Department of Natural Resources, 2021) were compiled and inspected. Driller logs tend to be less detailed than CSD test-hole logs, but in many cases, the driller logs provide adequate descriptions of the various materials detected during well installation. Most of the driller logs were associated with domestic wells, but logs for other wells (irrigation, industrial, commercial, observational, monitoring, geothermal, and livestock) also were used (fig. 3). Any well logs that had sufficient information for identifying individual stratigraphic layers and that were from wells in or near the study area were input into GeoScene3D (I-GIS, 2021).
Groundwater-Level Data
Groundwater-level data in the study area were limited and temporally disconnected because systematic groundwater-level monitoring in the area is minimal. The data available were downloaded from the USGS National Water Information System (NWIS) database (U.S. Geological Survey, 2021b). The measurement dates for the groundwater levels in NWIS ranged from January 8, 2020, to August 23, 2021 (table 2).
Table 2.
Groundwater-level measurements collected from January 2020 through August 2021 (U.S. Geological Survey, 2021b) in western Sarpy County, Nebraska.[Dates are given in month/day/year format. USGS, U.S. Geological Survey; NGVD 29, National Geodetic Vertical Datum of 1929; NAD 83, North American Datum of 1983; N/A, not available]
The USGS used the available groundwater measurements in NWIS and a 10-m DEM (U.S. Geological Survey, 2021a) to create an interpolated water surface for western Sarpy County for input into GeoScene3D (I-GIS, 2021). Because groundwater-level data were not spatially comprehensive or precisely associated with the aquifer(s) being measured, the resulting interpolated water surface should be considered a generalized estimate. Because all the groundwater-level data were much coarser than the 10-m DEM (U.S. Geological Survey, 2021a) incorporated into GeoScene3D, adjustments to the groundwater level at land surface in stream valleys and other low-lying areas were needed.
Groundwater-level altitude for each groundwater-level measurement was calculated by subtracting depth to water, in meters, from land surface altitude at the well, in meters, from the project DEM. An additional source of groundwater-level data in western Sarpy County was created by establishing a network of DEM control points where the groundwater level was interpreted to be at land surface based on aerial photography (Esri, 2021). The network of DEM control points was established within the Platte River Valley at river, pond, and sand pit lake locations. Additional control points were added near the edge of the Platte River Valley for tributaries to the Platte River, including Buffalo and Springfield Creeks. The 5-m groundwater-level contours were manually drawn in ArcGIS (Esri, 2017) using the groundwater-level measurements and DEM control points as guides. The contours and groundwater-level measurements were converted to a raster of the groundwater-level surface using the Topo to Raster command in the ArcGIS toolbox (Esri, 2017). The resulting raster was checked against the project DEM to ensure that the groundwater-level surface did not exceed the DEM in locations other than the Platte River Valley or at the lower end of major drainages. It should be noted that localized errors in the groundwater-level surface are likely because of the temporal variation of the groundwater-level measurements, uncertainty about the aquifer measured, and in some cases, the large distances between known groundwater levels. If additional groundwater-level data become available in the future, those data could be used to refine the current (2024) groundwater-level surface, which was incorporated into GeoScene3D (I-GIS, 2021).
Nitrate Sample Results in Groundwater
Samples have been collected by the USGS for nitrate analysis at various wells within the study area. The samples considered in this study were collected between July 29, 1992, and September 26, 2020 (U.S. Geological Survey, 2021b). Only wells that had well depth information were included for this report so that each result could be associated with a specific geologic layer. If a well was sampled more than once, the most recent sample result was retrieved. The data for the selected samples were compiled and incorporated into GeoScene3D (I-GIS, 2021) to show nitrate levels in reference to the various geologic layers (fig. 4). Most of these samples were collected from domestic wells. The wells were color coded in GeoScene3D to identify various magnitudes of nitrate concentrations. Wells with concentrations greater than the EPA MCL of 10 mg/L were coded as red, wells with concentrations of greater than 7.5–10 mg/L were coded as orange, wells with concentrations of greater than 5–7.5 mg/L were coded as yellow, and wells with concentrations of 0–5 mg/L were coded as green (fig. 4). Additional nitrate sample results for wells that had insufficient well-construction information may be available in NWIS (U.S. Geological Survey, 2021b) by searching for wells in Sarpy County.
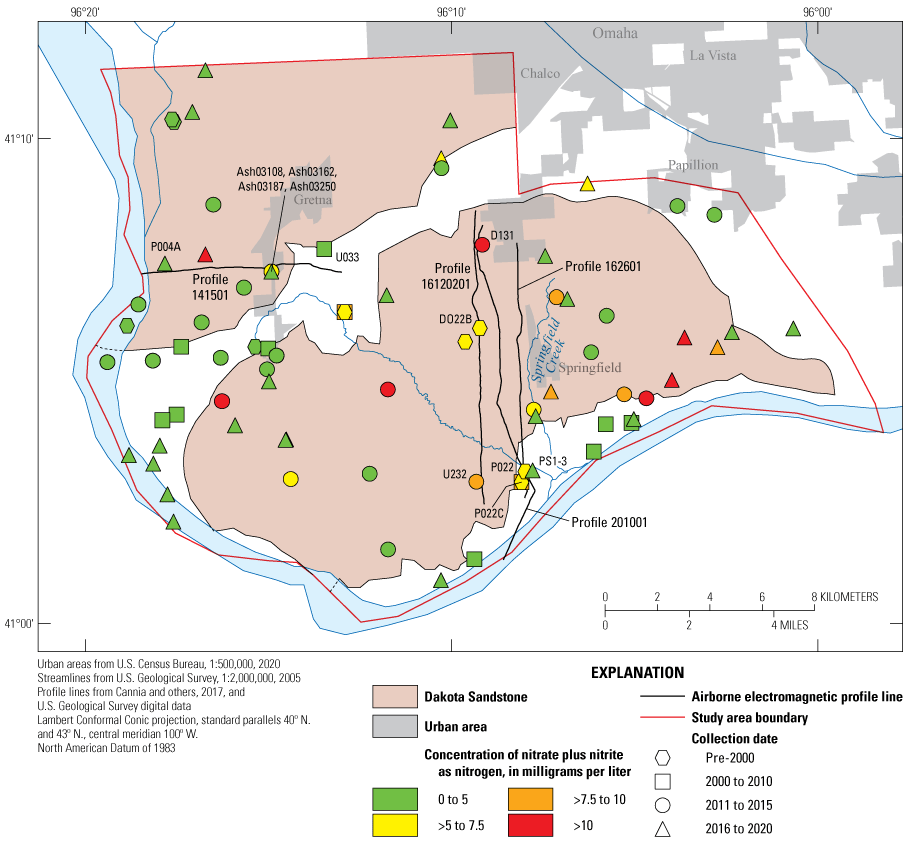
Profile lines and locations of selected nitrate samples collected from 1992 through 2020 by the U.S. Geological Survey in western Sarpy County, Nebraska.
Method to Interpolate Hydrogeologic Data
A hydrogeologic 3D visualization program called GeoScene3D (I-GIS, 2021) was used to create a 3D model of hydrogeologic data in western Sarpy County. The interpreted AEM layers, CSD test-hole data, and selected logs of lithologic data from registered wells were all loaded into GeoScene3D to guide the creation of stratigraphic layer files in western Sarpy County for the top of the Dakota Sandstone and the top of the Pennsylvanian-age units. The published AEM data were the primary data source used for building the GeoScene3D program because they provided the best spatial coverage of the datasets available.
Control points signifying the top of specified layers (Dakota Sandstone and Pennsylvanian-age units) were determined from the data loaded into GeoScene3D (I-GIS, 2021). Surfaces were then generated from the points using an inverse-distance-weighted (IDW) interpolation tool in GeoScene3D (I-GIS, 2021). This GeoScene3D tool was programmed to only include data that were within 200 m from the grid cell of interest, using an exponent of 2 to allow for creation of a smoothed stratigraphic surface throughout most of the study area. The interpolation was limited to the extent of the AEM, test-hole, and selected registered well data so the generated surface would not be affected by the lack of data near the edges or outside of the study area. Surfaces did not cover the entire study area because of the lack of data in some areas, particularly in the northwestern corner and eastern edge of the study area (fig. 3). The initial version of the top of the Dakota Sandstone and the top of the Pennsylvanian-age units generated by GeoScene3D were exported to ArcGIS (Esri, 2017) for additional processing to extrapolate the surfaces to areas outside the extent of the AEM data and to remove artifacts in the GeoScene3D surface.
The artifacts in the GeoScene3D-created surface (I-GIS, 2021) included sinks that exceeded 6 m in depth. In the authors’ judgement, depressions of this size are highly unlikely based on available AEM and lithologic data. These sinks were likely results from poor differentiation of contact points in some of the well-log data. The layers were exported as grids from GeoScene3D and imported to ArcGIS so these artifacts could be identified and corrected. In ArcGIS, these grids were converted into contour-line datasets, with a 3-m contour interval, using the ArcGIS Spatial Analyst Contour tool (this tool and other ArcGIS tools mentioned hereinafter are available in ArcGIS Desktop, version 10.5 [Esri, 2017]). The problematic depressions were manually removed by deleting the related contours. After the depressions were removed, the ArcGIS Spatial Analyst Topo to Raster tool (Esri, 2017) was used to convert the contour-line files back into ArcGIS grid files (hereinafter referred to as “base grids”).
Some areas required additional processing because the AEM data did not extend far enough to determine the exact boundaries. The largest of these areas were the northwestern region of the study area and along the eastern boundary of the study area (fig. 3). According to the AEM data and previous publications, the Dakota Sandstone has two primary remnants in Sarpy County (Burchett and others, 1975; Korus and others, 2013; Cannia and others, 2017). Between these two remnants are smaller disconnected remnants (Cannia and others, 2017), but AEM survey data for that area are limited (fig. 3) and test-hole data between the remnants also are sparse. The extents of the remnants were delineated based on the AEM and test-hole data, where available, and in areas where AEM data were absent, the Nebraska Groundwater Atlas (Korus and others, 2013) was used to define the extent. No effort was made to delineate the smaller disconnected remnants towards the northeast because of lack of data; therefore, in that area, the Dakota Sandstone was assumed to be absent. The grid spatial footprint generally extended beyond the edges of the extent defined by Korus and others (2013), and the southern remnant was not separated into eastern and western sections as Korus and others (2013) had indicated (fig. 3). The spatial extents differed because the GeoScene3D grid (I-GIS, 2021) was able to incorporate AEM data, which allowed for a more detailed characterization of the Dakota Sandstone in western Sarpy County.
The ArcGIS IDW Spatial Analyst tool was used to create grids (hereinafter referred to as “secondary grids”) for the top of the Dakota Sandstone and the top of the Pennsylvanian-age units for the areas that were outside the extent of the GeoScene3D (I-GIS, 2021) base grid. The base-grid cells near these areas were used to guide interpolation. These grid cells were converted into points using the ArcGIS Raster to Point Conversion tool (Esri, 2017). The ArcGIS Raster to Point tool creates individual points at the center of each grid cell. Each point was assigned a value based on the corresponding grid cell value. The point files were input into the IDW Spatial Analyst tool in ArcGIS (Esri, 2017) along with any CSD test-hole or selected registered well altitudes of the top of the Dakota Sandstone or top of the Pennsylvanian-age units to create “secondary grids.” The values of the secondary-grid cells were assigned by the IDW tool based on altitudes of the points (base grids, CSD test holes, and selected registered wells) and the distances of the new secondary-grid cells to those points. For this tool, the points nearest to the new cells have the most effect. The distance exponent was set to 2, meaning that points twice as far away were four times less influential. The IDW tool was programmed to use only the 12 nearest points for its analysis. If a grid cell was more than 200 m from a test hole or AEM survey point, then the extent of the Dakota Sandstone as defined by Korus and others (2013; figs. 1 and 3) was used to determine if that grid cell was within the Dakota Sandstone extent boundary.
After the secondary grids were created, they were then merged with the base grids using ArcGIS. They were merged by first converting both grid files to point files and using the ArcGIS merge feature within the Data Management tool (Esri, 2017). For the new grid, secondary-grid values were used only if a base-grid value did not previously exist. This merged point dataset was then converted back into a grid using the ArcGIS “point to raster” conversion tool (Esri, 2017). This new grid was then compared to a 10-m DEM (U.S. Geological Survey 2021a). For grid cells for the top of the Dakota Sandstone and the top of the Pennsylvanian-age units, if the altitude was above that of the land surface (DEM altitude), then the cell value was set equal to that of the land surface. After the grids were compared to the DEM, they were then compared to one another. If the cell values for the top of the Pennsylvanian-age units were greater than the cell values for the top of the Dakota Sandstone, then the Dakota Sandstone was considered not present and grid cell values were set to null. Null values were primarily in stream and river valley areas where the Dakota Sandstone had been eroded away. After the altitude checks were completed, grids for the top of the Dakota Sandstone and the top of the Pennsylvanian-age units were converted into ASCII-raster files and were imported back into GeoScene3D (I-GIS, 2021) as stratigraphic surfaces.
The final grids for the top of the Dakota Sandstone and Pennsylvanian-age units also were used to create contour shapefiles of the altitude of the top of the Dakota Sandstone and Pennsylvanian-age units using the ArcGIS Spatial Analyst Contour tool (Esri, 2017) with a 3-m interval. The grid and contour files were visually inspected to ensure that the data were reasonable and complete. These datasets are available for download as a USGS data release (Cherry and others, 2023).
Hydrogeologic Visualization Products
The primary goal of this project was to generate a 3D model of western Sarpy County from land surface to the top of the Pennsylvanian-age units to provide a visualization tool that can be used by water resource managers to understand the hydrogeology of the area. The 3D model was generated using the interpolated top of the Dakota Sandstone and Pennsylvanian-age units (Cherry and others, 2023), a generalized 2020 groundwater-level surface (Cherry and others, 2023), AEM layers, lithologic and stratigraphic data from CSD test-hole data, lithologic data from selected registered wells, and water-quality data. The GeoScene3D (I-GIS, 2021) visualization program was designed to allow users to interact with the 3D model and available datasets to create cross sections (hereinafter referred to as “profiles”) through areas of interest and visualize the dynamics that may be present. In this section, we have highlighted four AEM profile lines from GeoScene3D (fig. 4); the direction of the profile lines corresponds to the AEM data acquisition direction. The geospatial contour shapefiles for the top of the Dakota Sandstone and the top of Pennsylvanian-age units and the generalized groundwater level for 2020 are available for download as a USGS data release (Cherry and others, 2023).
Hydrogeologic Profile 16120201
Just west of the community of Springfield is a south to north profile of about 11,500 m along AEM line 16120201 (figs. 4 and 5). Groundwater flow is generally north to south, and the groundwater level is generally 5–10 m above the top of the Dakota Sandstone. A small stream is fed by groundwater around 2,300 m on the profile line (fig. 5). The vadose zone in the northern section consists of less permeable glacial till (nonaquifer and marginal aquifer in fig. 5), whereas in the southern section, the vadose zone consists of more permeable aquifer and coarse aquifer material. The more permeable vadose zone in the southern part of the profile allows for a higher likelihood of nitrate contamination to the aquifer, which may be the reason for the elevated nitrate concentration (8.36 mg/L) in well U232 (fig. 5). The most recent nitrate sample results from a well (DO22B) drilled upgradient from U232, beneath the less permeable glacial till, had a lower nitrate concentration (6.2 mg/L) than U232 (fig. 5).
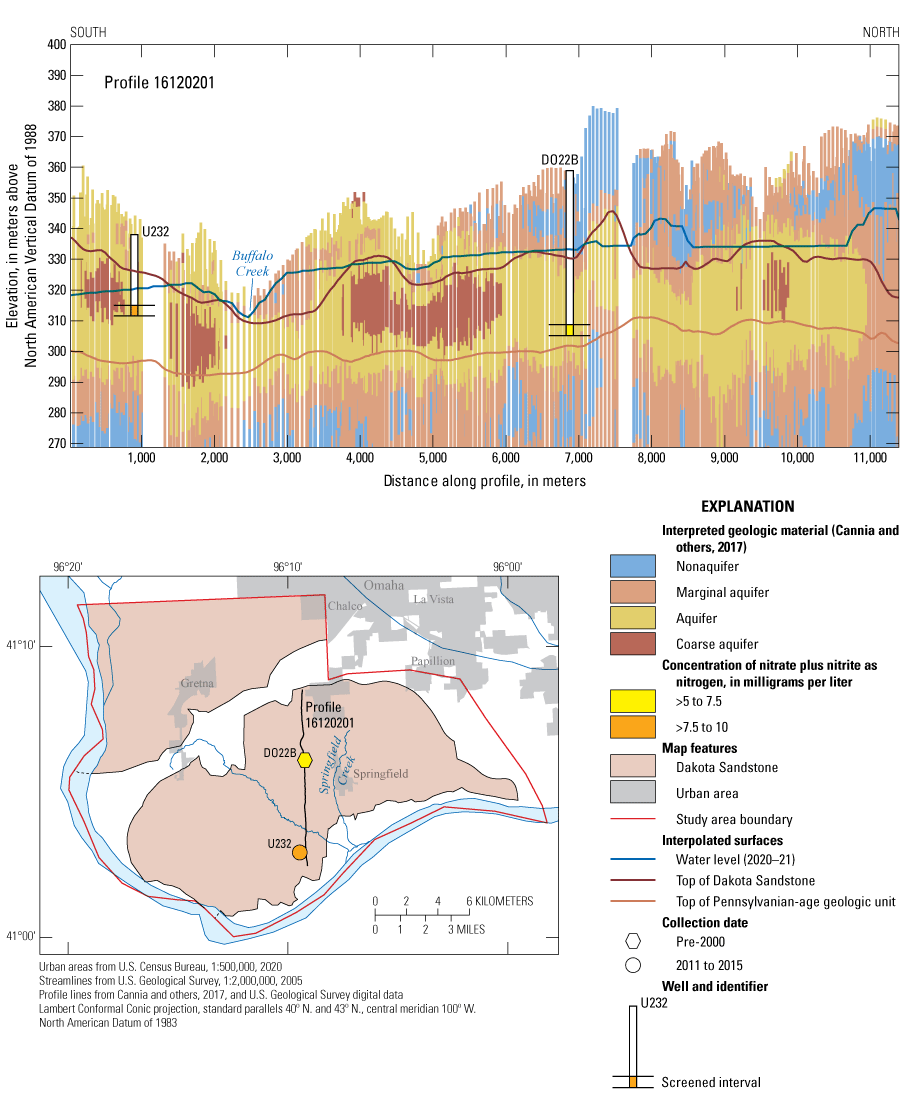
A selected GeoScene3D profile for line 16120201 in western Sarpy County, Nebraska. The profile shows aquifer classification based on airborne electromagnetic survey interpretation, nitrate (nitrate plus nitrite as nitrogen) concentration results (U.S. Geological Survey, 2021b) from sampled wells, and interpolated surfaces of water level and the top of the Dakota Sandstone and Pennsylvanian-age units.
Hydrogeologic Profile 201001
Profile 201001 stretches about 14,000 m from north to south in the eastern third of the study area (figs. 4 and 6). The north boundary begins just west of Papillion, and it traverses south; the southwestern segment of the profile covers a part of the Platte River Valley. Groundwater flow in this area is generally north to south towards the Platte River Valley. The groundwater level ranges from 5 m below the top of the Dakota Sandstone to 10 m above it. Along this profile, the Dakota Sandstone is consistently around 25 m thick until it approaches the Platte River Valley alluvium (about 9,200 m along the profile) where it has been eroded and is not present. The Quaternary-age deposits along this profile are more permeable than the previous profile (fig. 5) and become thin in the stream valleys (for example near 1,200 m, 3,800 m, and 4,400 m in fig. 6). Another detail of interest that can be observed in this profile is a small stream (not shown in fig. 6) intersecting the groundwater level around the 6,500-m location. The profile indicates that the tributary has eroded some of the Dakota Sandstone in that area. Within the Platte River Valley segment of this profile, the AEM data indicate that the alluvial aquifer in this area has a coarse layer that is as thick as 20 m in some places. Based on visual inspections of other profiles within the Platte River Valley, there seems to be fine and coarse material throughout the area. Surficial coarse material is present to the south (about 10,500 to 11,500 m), indicating likely interaction between the Platte River Valley alluvial aquifer and Platte River surface water, especially during higher streamflows.
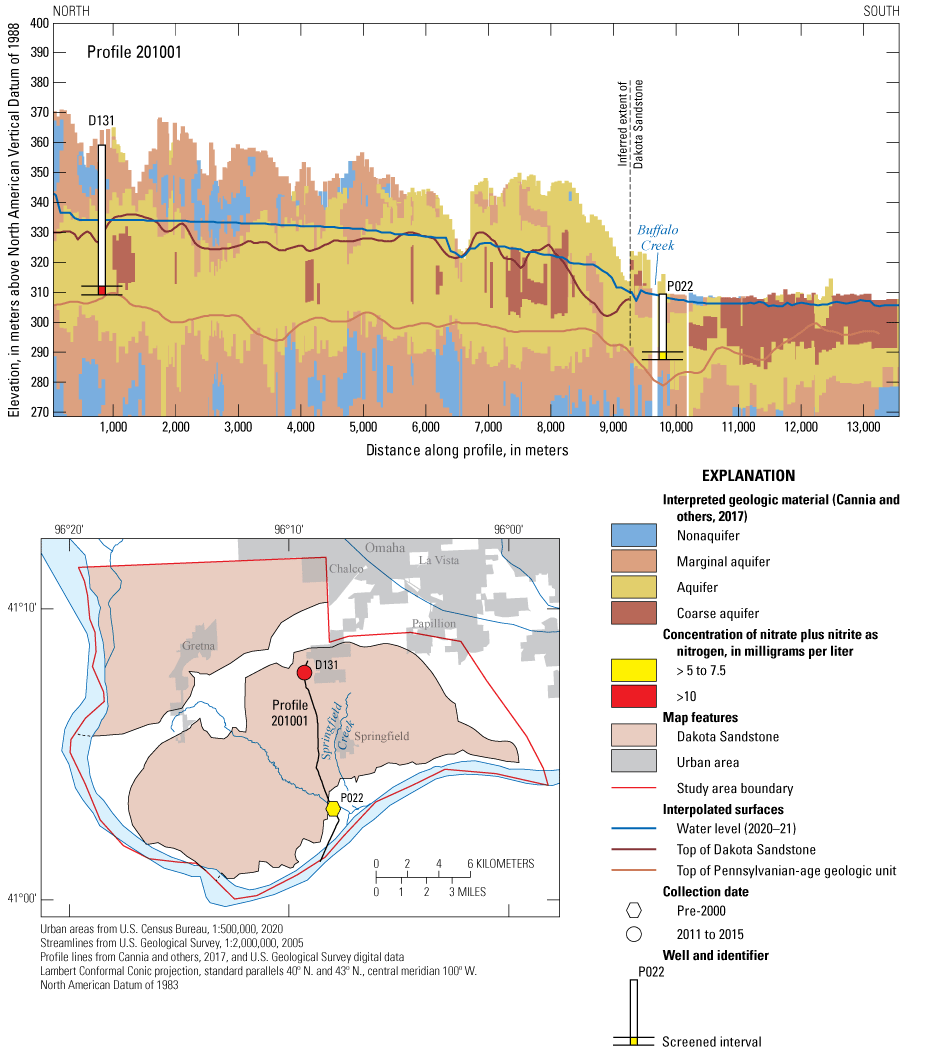
A selected GeoScene3D profile for line 201001 in western Sarpy County, Nebraska. The profile shows aquifer classification based on airborne electromagnetic survey interpretation, nitrate (nitrate plus nitrite as nitrogen) concentration results (U.S. Geological Survey, 2021b) from sampled wells, and interpolated surfaces of water level and the top of the Dakota Sandstone and Pennsylvanian-age units.
Two wells with nitrate sample results are near profile 201001. The well near Papillion (D131) had high nitrate concentrations (12.0 mg/L). Because this well is screened in the Dakota aquifer and the overlying vadose zone is composed of low-permeability units, this may be an area of the Dakota aquifer that could be investigated further. The well towards the southern end of the profile (P022) is screened in the Platte River Valley alluvial aquifer and had a lower nitrate concentration of 6.7 mg/L. The vadose zone in this area has a thin low-permeability layer, which indicates that this may be an area susceptible to surface contamination. The lack of high nitrate concentrations in this well indicates that the thickness of low-permeability layers in the vadose zone is not the only predictive factor for nitrate concentrations but that other factors such as land use and geochemical conditions may be important.
Hydrogeologic Profile 162601
Profile 162601 is about 10,000 m and runs north to south from the southern end of Papillion to near the southern border of Sarpy County. A part of this hydrologic profile underlies the Papillion area (figs. 4 and 7). The groundwater level along this profile is generally 5–10 m above the top of the Dakota Sandstone. Groundwater flow in this area is generally north to south towards the Platte River Valley. At the Platte River Valley, the groundwater level is within 5 m of the surface. At the northern end of the profile, the vadose zone consists of a substantial amount (30–35 m) of less permeable glacial till. Where it is present, the Dakota aquifer in that area is therefore more protected from infiltration of surface contaminants. Towards the southern end of the profile, the Dakota Sandstone is not present, and the Platte River Valley alluvium directly overlies Pennsylvanian-age units. Both wells with nitrate information near this profile (P022 and P022C) are screened within the Platte River Valley alluvial aquifer. Nitrate concentrations in these wells are elevated (from 5 to 10 mg/L) but are not above the EPA MCL. At these well locations, little low-permeability material is in the vadose zone to prevent surface contamination into the groundwater. Coarse surficial material to the south of these wells indicates that, like profile 201001, water within the Platte River Valley alluvial aquifer may be mixing with Platte River surface water, especially during high streamflow events.
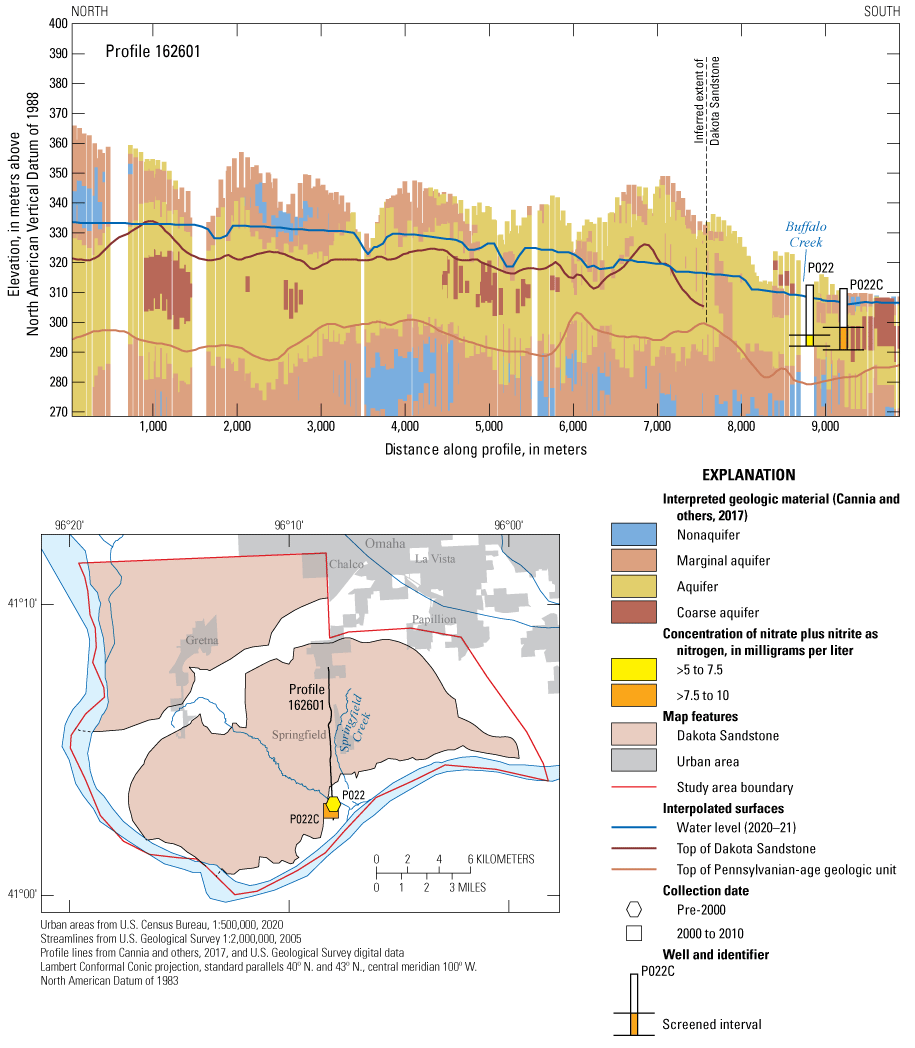
A selected GeoScene3D profile for line 162601 in western Sarpy County, Nebraska. The profile shows aquifer classification based on airborne electromagnetic survey interpretation, nitrate (nitrate plus nitrite as nitrogen) concentration results (U.S. Geological Survey, 2021b) from sampled wells, and interpolated surfaces of water level and the top of the Dakota Sandstone and Pennsylvanian-age units.
Hydrogeologic Profile 141501
Profile 141501 is about 7,800 m long, oriented west to east, and follows AEM line 141501. The profile starts within the Platte River Valley and extends to about 2,500 m east of Gretna, Nebraska, into the loess uplands (figs. 4 and 8). Part of this profile intersected with the town of Gretna, so the AEM coverage was less dense than most of the other profiles, which were rural. Groundwater flow in this area is generally east to west towards the Platte River Valley. Within the Platte River Valley, the groundwater level is within 2–3 m of the surface.
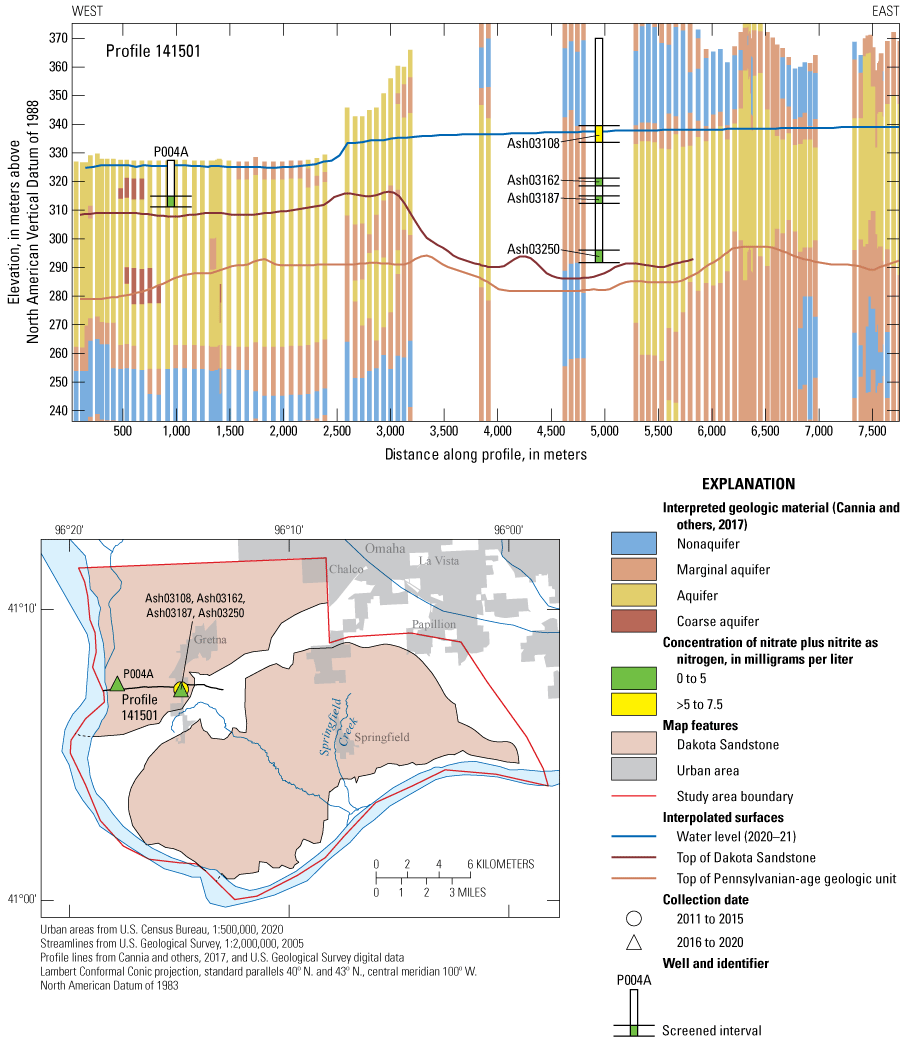
A selected GeoScene3D profile for line 141501 in western Sarpy County, Nebraska. The profile shows aquifer classification based on airborne electromagnetic survey interpretation, wells with nitrate (nitrate plus nitrite as nitrogen) concentration results, and interpolated surfaces of water level and the top of the Dakota Sandstone and Pennsylvanian-age units.
At the western end of the profile (from 0 to about 3,000 m in fig. 8), the Dakota Sandstone is overlain by the Platte River Valley alluvial aquifer. Farther east along the profile (near 3,250 m in fig. 8), the Dakota Sandstone thins out as the profile line moves towards the eroded southern edge of the northern primary remnant (inset map in fig. 8). The Dakota Sandstone eventually disappears completely around 5,800 m (fig. 8). As the profile moves east away from the Platte River Valley and up into the loess hills, the Quaternary deposits thicken and transition from Platte River alluvial to Upland alluvial. Beginning around 3,800 m, the Quaternary layer is overtopped by a sizeable amount (about 30–40 m) of nonaquifer material (likely glacial till and eolian loess). Nitrate sample results from a well cluster just outside of Gretna (well identifiers Ash03108, Ash03162, Ash03187, and Ash03250) indicate that nitrate levels are not greater than 5.3 mg/L, which likely is related to the large amount of nonaquifer material in the upper segment of this profile. Sample results from another well outside of Gretna, Nebr., about 750 m north of the profile line and about 2 km east of the well cluster (U033; fig. 4) also had low nitrate concentrations (less than 0.05 mg/L). Based on the AEM interpretation, the Dakota aquifer is not present in the area of U033, which indicates this well was screened in the Upland area alluvial aquifers. Although it is not within the Dakota aquifer, the AEM data indicate that the Dakota aquifer and Upland area alluvial aquifers are connected in this area. One well near this profile (P004A; fig. 8) is screened in the Platte River Valley alluvial aquifer and also had low nitrate concentrations (less than 0.05 mg/L). The AEM data indicate that the Platte River alluvial aquifer is connected to the Dakota aquifer in this area.
These profiles provide examples of how the GeoScene3D (I-GIS, 2021) model of western Sarpy County can provide groundwater managers with a tool to integrate detailed hydrogeologic, groundwater-level, and water-quality information. This model could be used to select areas for future groundwater studies, such as targeting areas where the Dakota aquifer is absent or where the Dakota aquifer is intersecting surface water features. The model could be used to identify areas that are more susceptible to contamination, such as where the Quaternary-age deposits are thin or more permeable. The model can allow users to visualize what wells may be affected by changes in surrounding water uses by examining flow paths. If contaminant concerns exist, such as high nitrate concentrations, the model could be used to guide further investigation and mitigation efforts. Also, new data can be added into the model to enhance understanding of the groundwater resources in western Sarpy County.
Summary
Development in western Sarpy County, Nebraska, has steadily increased over the last several decades and has led the Papio-Missouri River Natural Resources District to seek additional development of groundwater resources. These newly developed areas are not currently served by public water systems; instead, private wells are being drilled to provide potable water. These additional wells have the potential to stress the aquifer systems, and some groundwater-quality results indicate potential issues with high nitrate plus nitrite as nitrogen (hereinafter referred to as “nitrate”) concentrations. Although the general geology of the area is understood, the area does not have detailed information on the extent of the Upland area alluvial aquifers or the Dakota aquifer. Within this specific area of the county, the Dakota aquifer consists of two primary remnants and other smaller disconnected remnants.
To better characterize the Upland area alluvial and the Dakota aquifers, the Papio-Missouri River Natural Resources District (PMRNRD) invested in airborne electromagnetic (AEM) surveys to better understand the subsurface geology of the area. The PMRNRD determined that they wanted to incorporate the AEM data into a visualization tool that would allow PMRNRD staff to easily interact with the AEM data and integrate the data with other hydrogeologic and groundwater-quality data. The U.S. Geological Survey (USGS), in cooperation with the PMRNRD, the Nebraska Natural Resources Commission, and the Nebraska Department of Natural Resources, assembled geologic and available groundwater-level and quality information into a three-dimensional visualization computer software package called GeoScene3D. This tool allows users to visualize the subsurface by integrating geologic, groundwater-level, and water-quality data.
Datasets from multiple sources were used to develop the western Sarpy County GeoScene3D project. These datasets included AEM surveys, test-hole stratigraphic and lithologic data, driller-recorded lithologic data from selected registered wells, groundwater-level measurements, and nitrate sampling results. AEM data consisted of individual flight lines, which were 16–20 kilometers (km) in length for east-west lines and 13–16 km in length for north-south lines. North-south lines were stationed about 1 km apart whereas east-west lines were stationed about 200–250 meters apart. Flight lines in the northwestern part of the study area were less dense because development of new domestic wells is less prevalent in that area, and that area has more urban-related flight obstructions.
Lithologic descriptions from the University of Nebraska Conservation Survey Division test-hole database and driller logs were used to guide the development of the geologic surfaces for the top and bottom of the Dakota aquifer within GeoScene3D. GeoScene3D and ArcGIS interpolation tools were used to create the final geologic surfaces. A groundwater-level surface was developed for the GeoScene3D project using USGS and PMRNRD measurements from the USGS National Water Information System database. Nitrate samples collected by the USGS at various wells within the study area were compiled and incorporated into GeoScene3D to document nitrate levels in reference to the various geologic materials and surfaces. The geologic surfaces were used to create grids and contour files, which are available as a USGS data release.
The completed GeoScene3D project will help PMRNRD managers to better understand the groundwater systems in Sarpy County. It may be used to select areas for future groundwater studies, identify areas that are more susceptible to contamination, visualize flow paths to determine what wells may be affected by changes in surrounding water and land uses, or focus mitigation efforts for areas with contaminated groundwater. As new data become available, they can be added into the GeoScene3D project to improve understanding of groundwater resources in the area.
References Cited
Burchett, R.R., and Carlson, M.P., 1966, Twelve maps summarizing the geologic framework of southeastern Nebraska: University of Nebraska-Lincoln, Conservation Survey Division Report of Investigations no. 1, 18 p., accessed September 2022 at https://digitalcommons.unl.edu/conservationsurvey/426/.
Burchett, R.R., Reed, E.C., Dreeszen, V.H., and Prichard, G.E., 1975, Bedrock geologic map showing thickness of overlying Quaternary deposits, Fremont quadrangle and part of Omaha quadrangle, Nebraska: U.S. Geological Survey Miscellaneous Investigations Series Map I–905, scale 1:250,000, accessed September 2022 at https://doi.org/10.3133/i905.
Cannia, J.C., Abraham, J.D., and Asch, T.H., 2017, Hydrogeologic framework of selected areas in Sarpy County, Nebraska: Papio-Missouri River Natural Resources District, prepared by Aqua Geo Frameworks, 148 p., accessed August 2020 at http://www.enwra.org/aem2016.html.
Cherry, M.L., Schaepe, N.J., and Flynn, A.T., 2023, Datasets of altitude of the top of the Dakota Sandstone, top of the Pennsylvanian-age units, and water-level in western Sarpy County, Nebraska: U.S. Geological Survey data release, https://doi.org/10.5066/P9Z7PW1K.
Condra, G.E., and Reed, E.C., 1959, The geological section of Nebraska [with current revisions by E.C. Reed]: Lincoln, Nebr., University of Nebraska–Lincoln, Conservation and Survey Division, Nebraska Geological Survey Bulletin 14A, 86 p., accessed September 2022 at https://digitalcommons.unl.edu/conservationsurvey/670/.
Condra, G.E., and Scherer, O.J., 1939, Upper carboniferous formations in the Lower Platte Valley: Lincoln, Nebr., University of Nebraska, Conservation and Survey Division, Nebraska Geological Survey Paper 16, 18 p., accessed September 2022 at https://digitalcommons.unl.edu/conservationsurvey/554/.
Dewitz, J., and U.S. Geological Survey, 2021, National Land Cover Database (NLCD) 2019 products (ver. 2.0, June 2021): U.S. Geological Survey data release, accessed May 2022 at https://doi.org/10.5066/P9KZCM54.
Esri, 2017, ArcGIS Desktop, version 10.5: Redlands, Calif., Esri software, accessed May 15, 2022, at https://www.esri.com/en-us/home.
Esri, 2021, World imagery: Esri digital data [provided by Maxar, vivid advanced imagery 0.5-meter resolution], accessed July 2021 at http://goto.arcgisonline.com/maps/World_Imagery.
Fenneman, N.M., and Johnson, D.W., 1946, Physiographic divisions of the conterminous U. S.: U.S. Geological Survey shapefile, 1:7,000,000 scale, accessed May 2022 at https://water.usgs.gov/GIS/metadata/usgswrd/XML/physio.xml.
Gosselin, D.C., Harvey, F.E., and Frost, C.D., 2001, Geochemical evolution of ground water in the Great Plains (Dakota) Aquifer of Nebraska—Implications for the management of a regional aquifer system: Groundwater, v. 39, no. 1, p. 98–108. [Also available at https://doi.org/10.1111/j.1745-6584.2001.tb00355.x.]
Helgesen, J.O., Leonard, R.B., and Wolf, R.J., 1993, Hydrology of the Great Plains aquifer system in Nebraska, Colorado, Kansas, and adjacent areas: U.S. Geological Survey Professional Paper 1414–E, 92 p., accessed June 2022 at https://doi.org/10.3133/pp1414E.
High Plains Regional Climate Center, 2010, Historical climate data summaries: High Plains Regional Climate Center digital data, accessed May 2022 at https://hprcc.unl.edu/onlinedataservices.php.
Hobza, C.M., and Flynn, A.T., 2021, Groundwater quality and age of secondary bedrock aquifers in the glaciated portion of eastern Nebraska, 2016–18: U.S. Geological Survey Scientific Investigations Report 2021–5055, 42 p., accessed May 2022 at https://doi.org/10.3133/sir20215055.
Hobza, C.M., and Steele, G.V., 2020, Interpretation of hydrogeologic data to support groundwater management, Bazile Groundwater Management Area, northeast Nebraska, 2019—A case demonstration of the Nebraska Geocloud (ver. 1.1, December 15, 2020): U.S. Geological Survey Scientific Investigations Report 2020–5113, 46 p., accessed May 2022 at https://doi.org/10.3133/sir20205113.
I-GIS, 2021, GeoScene3D: Aarhus, Denmark, I-GIS software release, accessed September 2021 at https://geoscene3d.com/Software/GeoScene3D.
Jorgensen, D.G., Helgesen, J.O., and Imes, J.L., 1993, Regional aquifers in Kansas, Nebraska, and parts of Arkansas, Colorado, Missouri, New Mexico, Oklahoma, South Dakota, Texas, and Wyoming—Geohydrologic framework: U.S. Geological Survey Professional Paper 1414–B, 72 p., accessed July 2022 at https://doi.org/10.3133/pp1414B.
Karl, H.A., 1976, Depositional history of Dakota Formation (Cretaceous) sandstones, southeastern Nebraska: Journal of Sedimentary Research, v. 46, no. 1, p. 124–131. [Also available at https://doi.org/10.1306/212F6ED3-2B24-11D7-8648000102C1865D.]
Korus, J.T., Divine, D.P., Hanson, P.R., and Dillon, J.S., 2012, Three geologic cross sections across portions of eastern Nebraska showing Quaternary lithologic units and stratigraphy of uppermost bedrock: Lincoln, Nebr., University of Nebraska, Conservation and Survey Division Correlations and Cross Sections 18, 16 p., accessed June 2018 at https://digitalcommons.unl.edu/conservationsurvey/46/.
Leonard, R.B., Signor, D.C., Jorgensen, D.G., and Helgesen, J.O., 1983, Geohydrology and hydrochemistry of the Dakota aquifer, central United States: Journal of the American Water Resources Association, v. 19, no. 6, p. 903–912. [Also available at https://doi.org/10.1111/j.1752-1688.1983.tb05939.x.]
McGuire, V.L., Ryter, D.W., and Flynn, A.T., 2012, Altitude, age, and quality of groundwater, Papio-Missouri River Natural Resources District, eastern Nebraska, 1992 to 2009: U.S. Geological Survey Scientific Investigations Report 2012–5036, 68 p., accessed January 2022 at https://doi.org/10.3133/sir20125036.
Miller, J.A., and Appel, C.L., 1997, Ground water atlas of the United States—Segment 3, Kansas, Missouri, Nebraska: U.S. Geological Survey Hydrologic Atlas 730–D, 24 p. [Also available at https://doi.org/10.3133/ha730D.]
National Oceanic and Atmospheric Administration, 1995, State Plane Coordinate System of 1983: National Oceanic and Atmospheric Administration Manual NOS NGS 5, 119 p., accessed May 2022 at https://geodesy.noaa.gov/library/pdfs/NOAA_Manual_NOS_NGS_0005.pdf.
Nebraska Department of Natural Resources, 2017, WSF 2017 annual report # 4140—P-MRNRD Sarpy County aquifer mapping—WSF: Nebraska Department of Natural Resources Water Sustainability Fund online progress report, 3 p., accessed May 2022 at https://nrc.nebraska.gov/sites/nrc.nebraska.gov/files/doc/WSF%202017%20AR%204140.pdf.
Nebraska Department of Natural Resources, 2021, Registered groundwater wells data retrieval: Nebraska Department of Natural Resources digital data, accessed March 2021 at https://nednr.nebraska.gov/dynamic/Wells/Wells.
Papio-Missouri River Natural Resources District, 2018, Papio-Missouri River Natural Resources District groundwater management plan, volume 1: Papio-Missouri River Natural Resources District, prepared by Olsson Associates in association with FYRA Engineering, 72 p., accessed April 2022 at https://www.papionrd.org/wp-content/uploads/2018/03/180209-P-MRNRD-170724-Final_GMP_Vol-I-adopted_180208.pdf.
SkyTEM, 2022, Transient Electromagnetic (TEM) Systems descriptions: SkyTEM web page, accessed February 2022 at https://skytem.com/tem-systems/.
University of Nebraska, 2022, Nebraska statewide test-hole database: University of Nebraska, School of Natural Resources Conservation and Survey Division digital data, accessed July 2022 at https://snr.unl.edu/csd/geology/testholes.aspx.
U.S. Census Bureau, 2020, 2020 cartographic boundary file (shapefile), current place for Nebraska, 1:500,000: U.S. Census Bureau digital data, accessed September 2022 at https://www2.census.gov/geo/tiger/GENZ2020.
U.S. Census Bureau, 2021, QuickFacts: U.S. Census Bureau digital data, accessed October 2021 at https://www.census.gov/quickfacts/fact/table/US/PST045221.
U.S. Environmental Protection Agency, 2022, National Primary Drinking Water Regulations: U.S. Environmental Protection Agency web page, accessed April 2022 at https://www.epa.gov/ground-water-and-drinking-water/national-primary-drinking-water-regulations.
U.S. Geological Survey, 2005, Streams and waterbodies of the United States, 1:2,000,000 scale: National Atlas of the United States, accessed September 2021 at https://earthexplorer.usgs.gov/.
U.S. Geological Survey, 2021a, The National Map—Data delivery: U.S. Geological Survey web page, accessed September 2021 at https://www.usgs.gov/the-national-map-data-delivery.
U.S. Geological Survey, 2021b, USGS water data for the Nation: U.S. Geological Survey National Water Information System database, accessed September 2021 at https://doi.org/10.5066/F7P55KJN.
Verstraeten, I.M., and Ellis, M.J., 1995, Reconnaissance of ground-water quality in the Papio-Missouri River Natural Resources District, eastern Nebraska, July through September 1992: U.S. Geological Survey Water-Resources Investigations Report 94–4197, 90 p., accessed May 2022 at https://doi.org/10.3133/wri944197.
Wayne, W.J., 1985, Drainage patterns and glaciations in eastern Nebraska: Institute for Tertiary-Quaternary Studies-TER-QUA Symposium Series, v. 1, p. 111–117, accessed November 2021 at https://digitalcommons.unl.edu/geosciencefacpub/562.
Conversion Factors
Datum
Vertical coordinate information is referenced to the North American Vertical Datum of 1988 (NAVD 88) or the National Geodetic Vertical Datum of 1929 (NGVD 29).
Horizontal coordinate information is referenced to the North American Datum of 1983 (NAD 83).
Altitude, as used in this report, refers to distance above the vertical datum.
Supplemental Information
Concentrations of chemical constituents in water are given in milligrams per liter (mg/L).
Abbreviations
3D
three dimensional
AEM
airborne electromagnetic
CSD
Conservation and Survey Division
DEM
digital elevation model
EPA
U.S. Environmental Protection Agency
IDW
inverse-distance weighted
MCL
maximum contaminant level
NWIS
National Water Information System
PMRNRD
Papio-Missouri River Natural Resources District
USGS
U.S. Geological Survey
For more information about this publication, contact:
Director, USGS Nebraska Water Science Center
5231 South 19th Street
Lincoln, NE 68512
402–328–4100
For additional information, visit: https://www.usgs.gov/centers/ne-water
Publishing support provided by the
Rolla and Reston Publishing Service Centers
Disclaimers
Any use of trade, firm, or product names is for descriptive purposes only and does not imply endorsement by the U.S. Government.
Although this information product, for the most part, is in the public domain, it also may contain copyrighted materials as noted in the text. Permission to reproduce copyrighted items must be secured from the copyright owner.
Suggested Citation
Schaepe, N.J., Cherry, M.L., Flynn, A.S., and Hobza, C.M., 2024, Development of a hydrogeologic visualization model for western Sarpy County, Nebraska: U.S. Geological Survey Scientific Investigations Report 2024–5016, 23 p., https://doi.org/10.3133/sir20245016.
ISSN: 2328-0328 (online)
Study Area
| Publication type | Report |
|---|---|
| Publication Subtype | USGS Numbered Series |
| Title | Development of a hydrogeologic visualization model for western Sarpy County, Nebraska |
| Series title | Scientific Investigations Report |
| Series number | 2024-5016 |
| DOI | 10.3133/sir20245016 |
| Publication Date | May 24, 2024 |
| Year Published | 2024 |
| Language | English |
| Publisher | U.S. Geological Survey |
| Publisher location | Reston, VA |
| Contributing office(s) | Nebraska Water Science Center |
| Description | Report: vii; 23 p.; Dataset; Database |
| Country | United States |
| State | Nebraska |
| County | Sarpy County |
| Online Only (Y/N) | Y |