

Hydrologic Study of Green Infrastructure in Poorly Drained Urbanized Soils at RecoveryPark, Detroit, Michigan, 2014–21
Links
- Document: Report (3.8 MB pdf) , HTML , XML
- Dataset: USGS National Water Information System database —USGS water data for the Nation
- Data Releases:
- USGS data release - Select pipe-flow monitoring data from RecoveryPark in Detroit, MI (2015–2021)
- USGS data release - Select pipe-flow monitoring data from RecoveryPark in Detroit, MI (2015–2016)
- NGMDB Index Page: National Geologic Map Database Index Page (html)
- Download citation as: RIS | Dublin Core
Acknowledgments
This work was funded through the U.S. Environmental Protection Agency Great Lakes Restoration Initiative and Office of Research and Development Interagency Agreements DW–14–95795201 and DW–14–95831101. The City of Detroit measured pipe flow and provided combined sewer system access. The City of Detroit also assisted by providing water from fire hydrants and measuring flow from the hydrants during a dye-tracer study. Gary Wozniak, chief executive officer, and George Gardiner both of the RecoveryPark project helped us locate and maintain instrumentation.
The authors recognize the myriad contributions and service of their colleague Stephanie Beeler, who passed away during this study. The authors also would like to acknowledge assistance from U.S. Geological Survey colleagues Angela Brennan, Bill Selbig, Rob Darner, and Charles Hart, who all assisted with field and data-collection efforts.
Abstract
Uncontrolled stormwater runoff volume is a legacy stressor on sewer-system capacity that is further compromised by the effects of aging infrastructure. Green stormwater infrastructure (GSI) has been used in a variety of designs and configurations (for example, bioretention) with the goal of increasing evapotranspiration and infiltration in the local water cycle. In practice, GSIs have variable effectiveness in reducing runoff volume.
An urban residential site near Detroit, Michigan, called RecoveryPark was monitored for 8 years before and after GSI construction to evaluate how effectively the GSI reduced volumes of stormwater flowing to Detroit’s Water Resource Recovery Facility through combined sewer systems. In addition to the GSI, the study site included an urban farm where salad crops were grown in hoop houses. The monitoring approach was to characterize the urban water cycle through high-frequency measurements of inflows and outflows. Datasets included meteorological data, soils and sediment characteristics, groundwater levels, flows within the combined sewer system, and soils and water chemistry with specific focus on the disposition of road salt.
Although land cover within the RecoveryPark sewershed was high-density residential in the 1950s, the sewershed included only one residence within the 8.74-acre sewershed during this study. Measurements of annual precipitation at the site exceeded long-term annual averages by more than 10 inches during 3 of the 8 years of study. Potential evapotranspiration was often greater than the measured precipitation that averaged 28–34 inches per year. As compared to underlying clay-rich sediments, soils data indicated relatively permeable sediments near land surface with estimated hydraulic conductivity of 0.75 inches per hour; however, these values decreased with increasing depth. Groundwater-level data revealed increases in groundwater storage as indicated by increases in seasonal groundwater levels and development of a groundwater mound adjacent to the GSI. These increases in groundwater levels were directly adjacent to swales designed to infiltrate stormwater and only became evident after installing the GSI.
Flows within the combined sewer system included rainwater, septic effluent, groundwater infiltration, leakage from water-supply lines, and release of water stored in abandoned foundations. Dry-weather flows (no rain fell within the prior 3 days) averaged 7–10 gallons per minute, which were much greater than flows estimated by septic outflow alone. A set of estimated water budgets were compiled, and results showed large discrepancies in unaccounted flows. To further examine these discrepancies, dye-tracing within the combined sewer system helped examine the sources of water by relating flow volumes to drainage area. For one of the monitoring sites within the combined sewer system along the southeast side of the study area, flows estimated by dye concentrations were more than 10 percent greater than those measured by standard methods. Through peak-flow-regression analysis, a minimum of 2.4 million gallons of water per year were infiltrated or lost to evapotranspiration because of GSI construction. After site modifications were made by excavating gravel drains to improve drainage characteristics, estimated stormwater volumes within the combined sewer system returned to near preconstruction levels. The GSI was effectively bypassed to address slow infiltration rates and standing water; the bypass all but eliminated the potential benefits of volume reduction.
Late in the project, a water-quality study was added to examine the transport of road salt and associated chloride within the GSI and the combined sewer system. Continuous specific conductance was used as a surrogate for chloride concentrations to estimate that 2,790 pounds of dissolved chloride passed through the sewershed during the winter months of late 2020 through early 2021. These data were collected after GSI modification, therefore most, if not all, of the chloride was transported directly to Detroit’s Water Resource Recovery Facility via the combined sewer system. Mixing diagrams using chloride and bromide concentrations of road salt, potable water, rainwater, groundwater, and water from the combined sewer system confirmed that water within the combined sewer system is a mix of these sources. The poor condition of the combined sewer system pipes and resulting unaccounted inflows added to the challenge of accurately monitoring and identifying sources and sinks of water within the RecoveryPark sewershed.
Our research results suggest that—along with clear and quantifiable objectives—the catchment and site conditions should be well-characterized before determining the GSI design. In addition, the work presented in this report provides implications and lessons learned for effectiveness and future studies of GSI in urban settings. These efforts can be improved through increased communication between stakeholders, use of high-quality soils in GSI that have suitable hydraulic characteristics, redundant data-collection networks for critical data streams, and focusing meteorological-data collection within the GSI to obtain relevant evapotranspiration data.
Introduction
Stormwater in urban settings presents many challenges as an uncontrolled input to urban water cycles. The effects of wet-weather flows on infrastructure are multifold but generally center on lack of capacity in the present sewer infrastructure, which was designed and constructed assuming a stationary climate regime. Increasingly unpredictable storm depths and degraded infrastructure increase inputs from inflow, infiltration, and wet-weather runoff, thereby decreasing capacity of the system. The primary hazard associated with these circumstances is overwhelmed combined sewer systems (systems that collect and combine stormwater, domestic sewage, and industrial wastewater). When combined sewer systems are overwhelmed, streets may become flooded which limits ingress and egress at the neighborhood levels and severs transportation networks. If the sewer system is pressurized, septic flows may back up into basements. In addition to economic losses related to floods and degradation of infrastructure, urban flooding also can degrade water quality in receiving waters. Overflows may include untreated sewage and runoff from streets which may have far-reaching effects on aquatic ecosystem structure and function.
Within the past decade, many Great Lakes cities, including Duluth, Minnesota; Green Bay, Wisconsin; Chicago, Illinois; Detroit, Michigan; Buffalo, New York; and Cleveland, Ohio, have committed hundreds of millions of dollars to upgrade gray (engineered, hard infrastructure) stormwater and sewerage conveyance systems (U.S. Environmental Protection Agency [EPA], 2023a). One common management response in these cities is the design and installation of stormwater control measures (SCMs) that include green infrastructure. Green infrastructure is designed to reduce or retard runoff to create intentional reductions of stormwater runoff in the local drainage basin through increasing infiltration, detention, and evapotranspiration. Specifically, the design goals of green stormwater infrastructure (GSI) are to increase infiltration opportunities and leverage soil ecosystem services (for example, plant-root uptake of soil water and subsequent evapotranspiration) toward storage (detention, retention) and to delay peak flows into gray infrastructure (EPA, 2023b). Even though green infrastructure is intended to mitigate stormwater-driven system malfunction and contribute ancillary benefits in ongoing urban renewal, there is a general lack of understanding the hydrologic effects of these benefits at scale and with respect to climate variability (see, for example, Conley and others, 2022; Wang and others, 2023; and Ying and others, 2022). Given the close coupling between GSI and landscape characteristics (for example, soils, topography, and impervious surface connectivity), the implementation scale contributes to effectively controlling stormwater runoff volume (Barker and others, 2019). In 2014, the U.S. Geological Survey (USGS), in cooperation with the EPA Great Lakes Program Office and Office of Research and Development, began studies to characterize the hydrology at urban sites in Detroit, Mich.; Cincinnati and Cleveland, Ohio; Omaha, Nebraska; Buffalo, N.Y.; and Gary, Indiana. The overall objective of these studies was to document stormwater-volume reduction attributed to GSI in different soils, meteorological conditions, and hydrologic settings.
This report summarizes data collected at RecoveryPark in Detroit, Mich., from 2014 through 2021. RecoveryPark is a sparsely populated residential neighborhood with a high proportion of vacant land that was reused as an urban farm. The City of Detroit’s Storm Water Management Program Plan at the site included implementing green infrastructure to reduce flows into their combined sewer system, which is the predominant wastewater architecture (City of Detroit, 2021). Dry- and wet-weather flows were conveyed to the Detroit Water Resource Recovery Facility (operated by the Great Lakes Water Authority) and discharged into the tributaries of or directly into the nearby Detroit River. During high flows when the volume capacity of the combined sewer system infrastructure is exceeded, the outfall threshold is overcome, and untreated wastewater and stormwater is discharged directly into local rivers.
Part of the farm design concept at RecoveryPark was to reduce stormwater runoff by retaining rainfall and snowmelt onsite. To achieve this goal, the area was retrofit with green infrastructure such as swales, bioretention, and infiltration basins. The hydrologic study at RecoveryPark included several phases: (1) a “preconstruction” period before implementation of SCMs from 2014 to 2016 (2) a “postconstruction” period in 2017; and (3) a “postmodification” period from 2018 to 2021 when modifications were made to the GSI to improve drainage and eliminate standing water. There was a gap in data collection of about 6 months from late 2016 to early 2017 during construction when pipe-flow monitors were removed, and no data were collected to avoid instrument damage.
We monitored or measured components of the local hydrologic cycle and related water-quality constituents including: meteorology (air temperature, humidity, rainfall, wind speed, wind direction, net solar radiation, and potential evapotranspiration [PET]); groundwater (water level, temperature, and specific conductance); soils (texture and infiltration rates); water chemistry (chloride and bromide); and volumetric pipe flow in the combined sewer system pipe network in the local sewershed. Hydrologic data were examined to estimate volumes of stormwater— which would have otherwise discharged into the combined sewer system—that were intercepted or treated by the SCMs as green infrastructure. Preconstruction site characterization data are presented in Hoard and others (2019a, b16) and will only be summarized here.
Description of Study Area
RecoveryPark is within an urban-residential area about 2.5 miles (mi) northeast of downtown Detroit, Mich. (fig. 1). The RecoveryPark study area is defined as the six-block area bounded by East Kirby Street on the north, Farnsworth Street on the south, St. Aubin Street on the west, and Chene Street on the east. Frederick Street extends from west to east through the center of the study area. As described in Sugrue (2014), residential development in this region began in the late 1800s and underwent rapid urbanization during the contemporaneous expansion of Detroit as an industrial center. In the 20th century, Detroit went through several economic downturns, leading to widespread demolition of blighted homes and businesses. Demolition activity accelerated during the 2008 subprime mortgage crisis, leaving much of the area as vacant land. The combined sewer system was installed in the 1920s during residential development and was largely constructed of brick and vitrified clay pipe (Pieschek, 2017). This system was still in place during this study.
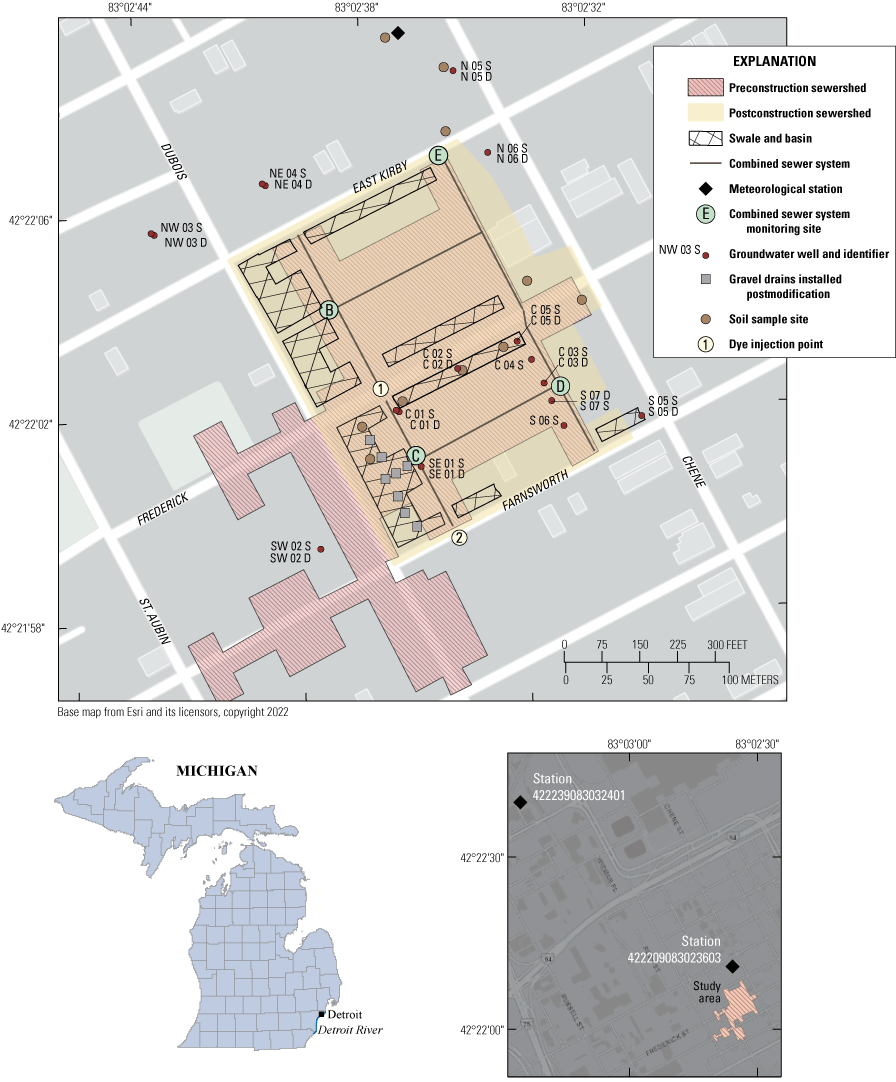
RecoveryPark study area, Detroit, Michigan.
In 2014, field reconnaissance by the authors documented housing density at less than one house per acre. Site visits and examination of aerial photographs confirmed only one active sanitary connection remained in the study area. Based on observations of inflow and infiltration into the local system, much of the combined sewer system remained in disrepair. Compromised sections of the combined sewer system were identified by the municipal sewer authority in 2016 and subsequently lined with polyvinyl chloride. Pieschek (2017) gives additional details about the combined sewer system conditions at RecoveryPark. As part of the current study, topography was analyzed using light detecting and ranging (commonly known as lidar) and field surveys to determine that the sewershed area was 8.40 acres before construction of GSI and hoop houses and increased to 8.74 acres postconstruction.
Preconstruction site characterization data are presented in Hoard and others (2019a) and will only be summarized here. The terrain near RecoveryPark is characterized by gently sloping to flat topography that slopes to the southeast at a gradient of less than 1 foot per mile (ft/mi), with elevation of the land surface ranging from 627 to 633 feet (ft) above mean sea level. This area is within the Detroit River catchment, with the river approximately 2.5 mi to the south-southeast. Water-surface elevation of the Detroit River averages from 570 to 575 ft above mean sea level near RecoveryPark. The humid continental climate of southeastern Michigan is strongly affected by the Great Lakes (National Weather Service Forecast Office, 2017). Monthly daily mean air temperatures range from 25.5 °Fahrenheit (F; −3.6 °Celsius [C]) in January to 73.6 °F (23.1 °C) in July. Precipitation averages about 35 inches per year (in/yr) and is evenly distributed throughout the year.
As reported in Hoard and others (2019a), soil textural classes at the study area range from fine sandy loam to silty clay loam, with permeable loam lenses interspersed among less-permeable horizons of lacustrine silty clays. Urbanization has changed the native soils, leaving behind complex soil profiles characterized by human-transported soil materials of varying textural class and quality. Soil sampling and groundwater well installation revealed cut-and-fill soils as backfill along with construction and demolition debris. The average infiltration rate within the surficial soils at RecoveryPark measured by Hoard and others (2019a) was 0.75 inches per hour (in/hr). Saturated hydraulic conductivities decline with depth of measurement from 0.35 in/hr at 10 in. below land surface and slowing to 0.035 in/hr at 24 in. below land surface.
Unconsolidated surficial deposits and bedrock geology of the Detroit area are summarized by Mozola (1969) and Howard (2016). The unconsolidated deposits are dominated by glacial, lacustrine, and glacio-fluvial sediments consisting of clay- and silt-sized sediments with thicknesses ranging from about 100 to 150 ft. Beneath the unconsolidated deposits, low permeability limestones and shales of Devonian age serve as the limiting factor for deep drainage within this urbanized hydrologic system.
Methods
As part of a larger Great Lakes-wide project, one of the goals of these studies was to use standardized methods and reporting metrics among sites in Detroit, Mich.; Gary, Ind.; and Buffalo, N.Y. The approach used in these studies was to characterize the urban water cycle through high-frequency measurements of inflows and outflows. Data collection started before implementing SCMs, and for RecoveryPark these data are presented in Hoard and others (2019a, b16). In this report, the focus is on the hydrology of RecoveryPark after SCM implementation.
The 8-year study of hydrology at RecoveryPark from 2014 through 2021 includes three periods of data collection. To better describe the series of events that included site development, site characterization, and data-collection approaches, a timeline of events is shown in figure 2. The preconstruction period began in 2014 with site characterization and groundwater wells and monitoring equipment installation. Site conditions reflected an urban setting with poor infrastructure and scant capacity to treat or reduce stormwater flows. Construction of SCMs started at RecoveryPark in late 2016 and included the removal of the surface soils, addition of hoop houses for growing crops (mainly lettuce, carrots, and tomatoes), placement of imported soils inside the hoop houses, excavation of swales, and upgrading infrastructure to provide water and electricity to the new urban farm. Storm drains were installed upgradient of curb cuts and at least one curb cut was blocked with sandbags. The sandbags were intended to reduce or eliminate standing water and prevent surface runoff from flowing into the swale. The postconstruction period began in early 2017 after all site construction was completed. In late 2018 and in early 2019, modifications were made to part of the landscape by replacing soils from a small area in one swale with coarse gravel to establish a direct conduit to the underdrain to reduce or eliminate standing water. For the purposes of this report, the preconstruction period was 2014–August 2016; the postconstruction period was from April 2017 to mid-2018; and the postmodification period was from mid-2018 to 2021. A dye-tracer study was performed in late 2018 to evaluate sources and sinks of water within the combined sewer system. In late 2019, water-quality sampling from combined sewer system and groundwater wells was initiated to evaluate the potential influences of road salt on runoff and groundwater chemistry. Data collection ended in February 2021.
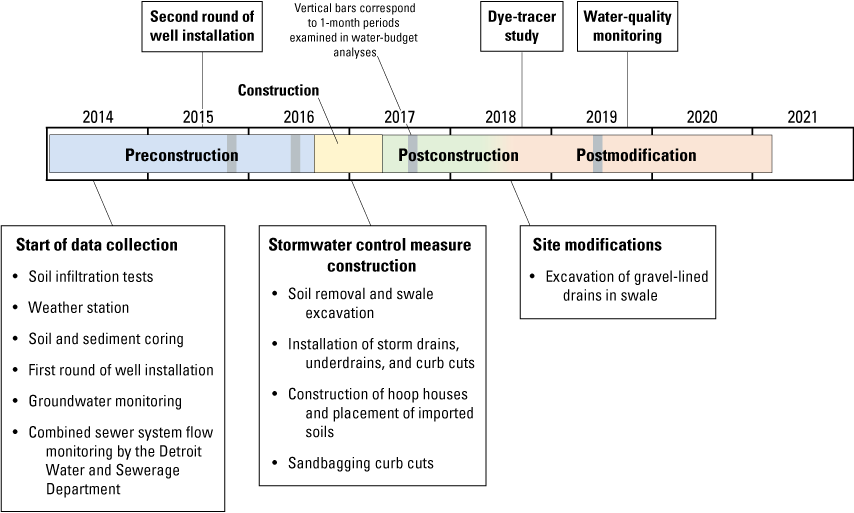
Timeline of events at RecoveryPark in Detroit, Michigan, 2014–21.
Meteorological conditions were monitored at two separate locations near the study area (fig. 1): USGS station 422239083032401 operated at a nearby offsite location from 2014 to 2017 and USGS station 422209083023603 operated about 225 ft north-northwest of combined sewer system site E from 2017 to 2021. Meteorological data were collected through Campbell Scientific ET107 weather stations and included precipitation, wind speed, wind direction, air temperature, relative humidity, and net solar radiation. PET was calculated using these data and the Penman-Monteith equation. Calibration and maintenance of the instruments were done at least once per year following manufacturer’s specifications.
Work that started in 2014 included an exploratory groundwater well drilling program to collect and characterize soil-sediment cores at four locations shown in figure 1; a direct push probing machine was used to reach target depths of about 20 ft below land surface. Within each core hole, 1-in. polyvinyl chloride casing and 5-ft well screens were installed. Nested pairs of shallow and deep wells were installed at select locations to examine vertical gradients and differences in water-level response to rainfall events with respect to well depth. A second round of drilling added more wells to fill in data-collection gaps. A subset of wells was installed alongside known combined sewer system pipes to evaluate the extent leaking pipes might interact with the groundwater system. Target well depths were selected to coincide with the depth of combined sewer system, which ranged from 14 to 18 ft below land surface. Wells were outfitted with pressure transducers that recorded water levels every 15 minutes. Field crews visited the site every 6 to 8 weeks to download data, manually measure water levels in each well, and recalibrate the water-level reading instruments as necessary. Specific conductance and temperature of groundwater were measured in a subset of wells selected based on location within the sewershed and the availability of data-collection sondes. Regular calibration checks of the specific conductance readings were done with known standards during field visits.
Pipe flow within the combined sewer system was measured at several locations in and around the study area by the Detroit Water and Sewerage Department (DWSD)(Hoard and others, 2024). Measurements were made through a combination of velocity and stage sensors installed within the pipes behind v-notch weirs. The manufacturer Teledyne ISCO reports accuracies that exceeded the needs at RecoveryPark (Teledyne ISCO, 2021, p. 1–8). Instrument calibration was done before installation then additional field calibration was done by faculty and staff at Lawrence Technological Institute (Pieschek, 2017) and by staff at DWSD. Calibration checks revealed inconsistent data quality at some sites. For this report the flow data from sites B and E were found to have consistent quality while site D had greater uncertainty (Hoard and others, 2024) (fig. 1). In particular, the results in this report focus on flow conditions at site E as the downgradient outlet for the entire sewershed. Although we also identified other combined sewer system sites (referred to as sites A, F, and G; not shown in fig. 1), these sites were not included in this study because they were outside of the sewershed and (or) did not provide usable data.
Records of pipe flows were examined to understand the ranges of flow and expected gains and losses through the sewer system; however, even after several years of data collection, it was still unclear where and how water was entering the combined sewer system during extended periods without rainfall or runoff. As a result, a dye-tracer study (Hoard and others, 2024) was done to assess flow data from the pipe-flow meters, evaluate segments of sewer pipes where water may be entering or leaving the combined sewer system, and improve understanding of how different areas of the sewershed contributed proportions of water. Before, during, and after the dye-tracer study, pipe flow was monitored through DWSD’s velocity and stage system along with fluorescence, chloride, pH, dissolved oxygen, specific conductance, and temperature. Two tracers were used in this study: rhodamine (fluorescent) dye that was injected at two different upgradient locations and chloride that was already present in the source and combined sewer system waters. Five data-collection points within the combined sewer system were outfitted for this study, including sites 1 and 2 (upgradient dye injection sites), sites B and D (intermediate sites), and site E (downgradient outflow site; fig. 1). Two separate tests were done. The first was done with dye injection at site 1 and downgradient monitoring at combined sewer system sites B and E. The second was done with dye injection at site 2 and downgradient monitoring at combined sewer system sites D and E. Each of the five sites included a data logger set to record fluorescence, pH, dissolved oxygen, temperature, and specific conductance at 15-second intervals. Before each test, a nearby hydrant was tapped for potable water and a calibrated dye injection site was established. While flow of water from the hydrants was maintained at 20 gallons per minute (gal/min), a 20-percent rhodamine dye solution was injected at a concentration of 1,000 parts per million and flow rate of 2.35×10⁻⁵ cubic feet per second (about 0.01 gal/min). Before the test, all equipment was cleaned and calibrated using standard techniques recommended by the manufacturers and the USGS National Field Manual (USGS, 2018).
To start the tests, the combined sewer system was primed with water from nearby fire hydrants. Flow of water was directed towards one of two upgradient storm drains at site 1 during dye-tracer test 1 or at site 2 during dye-tracer test 2. Flow was regulated through a flowmeter installed on the discharge hose and remained at approximately 20 gal/min during the test. Data collection at all sites started approximately 30 minutes before the dye injection to establish pretest flow and water-quality conditions. Data collection continued for at least 30 minutes after the dye injection ended, hydrants were shut off, and tracer concentrations returned to pretest conditions. Discrete water samples were collected from the combined sewer system with a peristaltic pump equipped with a flow-through chamber. One set of samples was taken before the test started, another set during the middle of the test when water-quality readings stabilized, and another set of samples after the test ended. Analyses of dissolved chloride and bromide in water were done at the USGS National Water Quality Laboratory in Denver, Colorado, using methods described in Fishman and Friedman (1989).
In late 2019, sediment and water samples were collected to evaluate potential influences of road salt on soil conditions and water quality. Several publications, including Snodgrass and others (2017), Beak and others (2020), and Minnesota Pollution Control Agency (2023) report that stormwater runoff may have negative consequences on the quality of groundwater and receiving surface-water bodies. Potential sources of contamination in urban stormwater include deicing chemicals (for example, road salt containing sodium chloride, calcium chloride, and brine solutions); particulate dust and fines that wash off from adjacent paved areas as suspended sediment; lawn fertilizers, herbicides, and pesticides applied seasonally to surrounding lawns, cultivated areas, or both; pathogens (for example, bacteria) from pets, birds, and urban wildlife; dumping of trash; and vehicle discharges of gasoline, oil, grease, antifreeze, and dust from brake linings (Masoner and others, 2019). Chloride contamination of aquifers and surface waters from road salt is recognized as a problem throughout the northern United States as reported by Mullaney and others (2009) and Corsi and others (2015). An ancillary effect of road salt is to increase the sodium absorption ratio (SAR), which alters soil physical properties through clay dispersion and swelling of expandable clays. An elevated SAR may result in decreased aggregate stability, decreased hydraulic conductivity, and surface crusting within the SCMs themselves, thereby reducing the infiltration projected through SCM installation. Chloride was selected for this study because it is a conservative constituent that does not readily react with other compounds, water samples for chloride analysis are easy to collect, and the cost for chemical analysis was low.
Soils in and around the SCMs were sampled in 2020 for chloride, sodium, calcium, and magnesium to examine chloride and SARs. Samples were collected using a hand-held auger and were sent to A&L Great Lakes Laboratories, Inc. in Fort Wayne, Ind., for analysis. Water samples were obtained from combined sewer system access points at sites B and E, six groundwater wells (C 01 S, C 01 D, C 02 D, N 06 S, and N 06 D), and standing water from within one swale during or soon after snowmelt events. Water samples were analyzed for dissolved chloride, bromide, and iodide to evaluate potential influences of road salt on water quality and the ability of SCMs to reduce salt concentrations. Chloride, bromide, and iodide are natural elements in the environment, but ratios of chloride to bromide and chloride to iodide have been used in many hydrologic studies to examine mixing relations between distinct water types (Davis and others, 1998). Wells were purged and sampled using techniques described in the National Field Manual for the Collection of Water-Quality Data (USGS, 2018). Some of the groundwater wells yielded only small amounts of water; therefore, all water in the well casing was evacuated from the well on the first day of each sampling event and, after the groundwater level recovered to the prior water level, water was sampled with a bailer on the following day. All samples were filtered through a 0.45-micron capsule filter. Water level, air temperature, water temperature, and specific conductance were measured with a water-quality sonde calibrated to established standards at the time of sample collection. All analyses were done by the USGS National Water Quality Laboratory in Denver, Colo. In addition to water sampling, specific conductance probes were installed in 2020 at combined sewer system sites B and E to monitor water quality on a continuous basis. Specific conductance data from these probes were recorded at 10-minute intervals. Calibration of sensors adhered to the guidelines described in USGS (2019).
A sample of road salt was collected from Chene Street immediately after a local snowfall event and was ground to a fine powder, dissolved in distilled, deionized water, then submitted for analysis to obtain concentrations of chloride, sodium, bromide, and iodide. The City of Detroit Department of Public Works (City of Detroit, 2019) only applies salt on major thoroughfares (including Chene Street) but may also apply salt on side streets in the case of an emergency or snowfalls greater than 6 in.
Results
Results in this report focus on understanding the hydrologic system at RecoveryPark during three phases of site development and documenting stormwater volume reductions related to GSI installation. Meteorological data provide estimates of inputs from precipitation and losses from PET. Additionally, characteristics of impervious surfaces, groundwater dynamics, and results from a dye-tracer study within the combined sewer system help support four water budgets that describe hydrologic changes incurred because of the GSI constructed at the study site. Finally, estimates of chloride loading from road salt are provided to add insight into the fate of chemical constituents used in urban land-use practices. Data obtained from the meteorological stations, soil sampling, and groundwater wells are available through the USGS National Water Information System database at https://doi.org/10.5066/F7P55KJN (USGS, 2024). Flow data from the combined sewer system monitoring sites and dye tracer study are available at https://doi.org/10.5066/P9FP21N9 (Hoard and others, 2024).
Precipitation Forcing and Evapotranspiration Losses
Throughout the study period (2014 through 2021), meteorological data collected at RecoveryPark indicated that precipitation was generally greater than long-term average conditions recorded at Detroit Airport from 2000 to 2022 by National Weather Service (2022). Three of the 8 years have incomplete records, but of the 5 years that are complete, 4 of them are well above the long-term average. Annual precipitation exceeded long-term averages by more than 10 in/yr during 2016, 2018, and 2020. The City of Detroit and surrounding suburbs experienced flooding of roads and infrastructure during those years. Potential evapotranspiration followed seasonal patterns with maximum PET of about 5 inches per month (in/mo) in June, July, and August and minimum PET of about 2 in/mo in December, January, and February. Annual PET averaged about 28–34 in/yr. These PET values were estimated based on point measurements made at the weather stations and include losses from not only the GSI but also turf, other flora, and impervious surfaces.
Meteorological data and estimates of PET shown in table 1 indicate that precipitation is the primary source of water that enters the combined sewer system and PET has the greatest potential to remove large volumes of water from the system. For RecoveryPark, precipitation forcing controls not only the amount of actual evapotranspiration that can happen, but also the amount of pipe flow within the combined sewer system. The PET estimated for RecoveryPark includes potential losses from evaporation and transpiration by plants. The vegetation within the preconstruction period and areas outside the RecoveryPark area could be described as “urban prairie” with thick grasses, shrubs, invasive or pioneer plants, and some of the remaining ornamental shrubbery. Postconstruction, the swales and much of the surrounding area within the RecoveryPark sewershed were seeded with turf grasses. The seeding had varied success and parts of the sewershed were not fully vegetated.
Table 1.
Long-term average annual conditions at Detroit Airport and RecoveryPark in Detroit, Michigan, 2014–21.[USGS, U.S. Geological Survey; in., inches; °F, degree Fahrenheit; PET, potential evapotranspiration; NA, not available]
Detroit weather data covering years 2000 through 2022 obtained from the National Weather Service (2022).
Partial record for 2014 included only December; 2017 included January through September 30; 2021 included January through August 24.
PET values for Detroit were estimated from Sanford and Selnick (2013) and are reported as estimates of actual (as opposed to potential) evapotranspiration.
Mitigating Impervious Surfaces
Impervious surfaces were the primary agent in generating direct runoff. In the case of a directly connected impervious area, runoff was routed to the sewer system. Before construction of SCMs, the total impervious area was approximately 29 percent of the RecoveryPark sewershed, including roads, sidewalks, alleys, and residential housing (Hoard and others, 2019a; table 2). Overall, impervious surfaces were in poor condition because of numerous potholes, gaps, and cracks. These depressions interrupted connectivity between impervious surfaces and adjacent pervious area, including turf within the right of way or sewer inlets. Cracked or broken pavement also increased median depression depth across the study area and may have incrementally increased the depth of initial abstraction though this was not measured explicitly.
Table 2.
Estimated land cover for the RecoveryPark sewershed 2011, 2017, and 2020, Detroit, Michigan.[<, less than; SCM, stormwater control measure]
Postconstruction and postmodification landcover was estimated from aerial imagery from Google Earth, July 5, 2017, and April 2, 2020, respectively.
As described in Bell and others (2016).
Only one residential house was present in the sewershed throughout the study period, making up less than 1 percent of the land cover before and after construction of the SCMs (table 2); however, construction of hoop houses added about 30,000 square feet (ft2) of impervious roof cover adding 8 percent to the total impervious area. Yet, this part of total impervious area was buffered and thereby disconnected from street surfaces and sewer inlets because they were typically surrounded by pervious area, which itself had a measured infiltration rate of about 0.75 in/hr. Direct runoff from the hoop houses drained to vegetated conveyance swales, decreasing the volume that would have otherwise moved as overland flow toward streets and storm drains. Although the percentage of total imperviousness was similar pre- and postconstruction, construction changes to the site decreased directly connected impervious area from 18 to 11 percent. Calculated ratios of unmitigated impervious to total imperviousness (as described by Bell and others [2016]) decreased from 0.38 to 0.33 from preconstruction to postconstruction periods, which could be attributed to installation of swales and rain gardens, removal of concrete, and subsequent tillage of formerly paved alleys.
In the postconstruction phase, farm operators observed that drawdown times in swales and rain gardens were more than 48 hours after the end of a given rainfall event. Standing water degraded aesthetics and may have attracted mosquitos and other unwanted animal life. In response, swales were modified by reconnecting swale basin inverts to the sewer system (depicted as shaded squares within the swale in the southwest part of the sewershed on fig. 1). Reconnection was done by replacing the low-permeability soils overlying the underdrain with gravel at selected locations. This change marks the beginning of the postmodification period. With this modification, runoff that was previously treated through infiltration and redistribution by the SCMs now flowed directly into the combined sewer system. Additionally, direct evaporation of standing water was reduced or eliminated. This action had the effect of further decreasing the ratio of unmitigated impervious to total imperviousness to 0.18 (table 2), thereby potentially depleting the conveyance capacity of the combined sewer system.
Farm development also decreased tree canopy cover. Preconstruction aerial photography from June 2011 provided an estimated 23 percent tree cover (not pictured). By comparison, this cover was reduced to 9 percent in the postconstruction period. Trees provide significant reduction in stormwater runoff through evapotranspiration and enhanced infiltration as demonstrated by Selbig and others (2022). Additional benefits of trees include interception and potentially improving GSI performance (Berland and others, 2017).
Schematic drawings of the combined sewer system depicting preconstruction, postconstruction, and postmodification flow of water are shown in figure 3. Flow within the combined sewer system when there is no runoff is referred to as dry-weather flow (DWF) in this report following the usage of the EPA’s Reference Guide for Estimating Infiltration and Inflow (EPA, 2014). Similarly, the term rainfall-derived infiltration and inflow (RDII) is used to describe the part of water flow in the combined sewer system during rainfall and the recession period after a rainfall event.
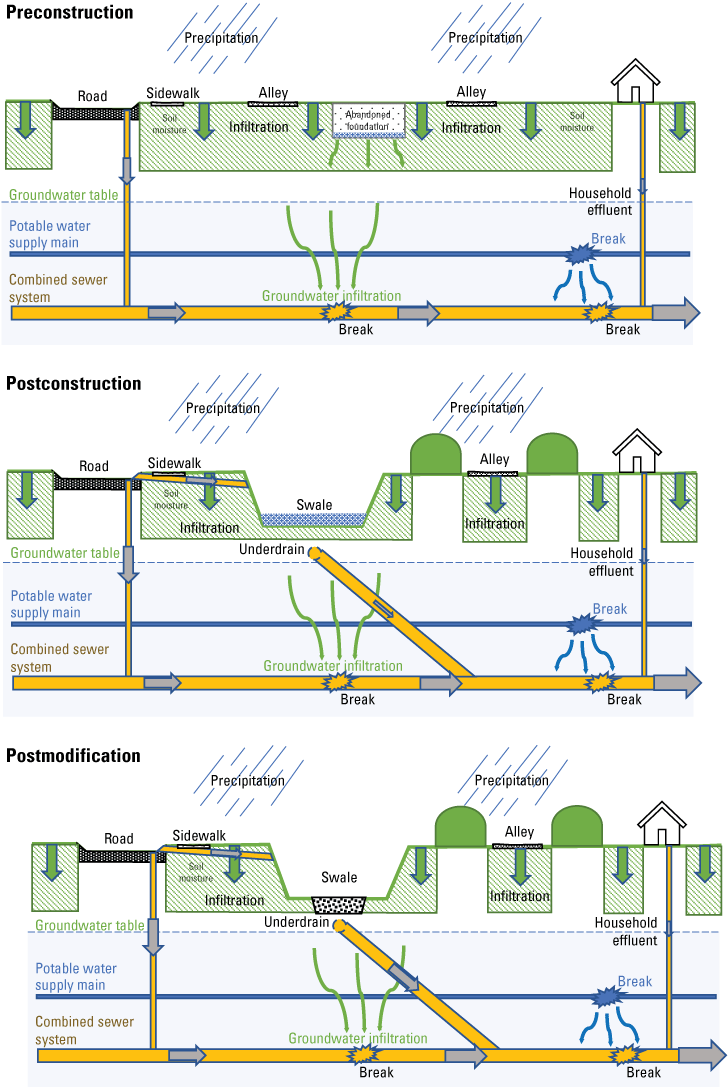
Stormwater and dry-weather flow schematics of the combined sewer system at RecoveryPark during preconstruction, postconstruction, and postmodification study periods.
For all three study periods, precipitation was the primary source of water in the combined sewer system and may have entered the system as RDII; however, DWF (which includes septic effluent from the lone house in the study area and leaky water mains) also provided a relatively large volume of water as compared to other sources. For the postconstruction period, rainwater was directed into the GSI, and evapotranspiration and infiltration decreased the amount of water flowing to the combined sewer system. Postmodification, water was still directed to the GSI, but infiltrated directly into the combined sewer system through the gravel excavations, diminishing the benefit of evapotranspiration and infiltration into soils and groundwater.
Groundwater Dynamics
Potentiometric surfaces were generated for two periods that included water-level data from deep monitoring wells during preconstruction and postconstruction periods (fig. 4). These surfaces were interpolated between the available wells using an inverse-distance weighting approach (Isaaks and Srivastava, 1989) and reflect the estimated elevation of the site’s groundwater. Before construction at RecoveryPark, higher groundwater elevations were observed in the southwest part of the sewershed near the intersection of Farnsworth and Dubois Streets (fig. 4A); thus, groundwater flowed away from the southwest part of the sewershed in several directions. Groundwater levels postconstruction shown in figure 4B revealed higher groundwater levels around the center of the RecoveryPark sewershed. Specifically, water levels at wells C 01 D, C 02 D, and SE 01 D (wells closest to the swales along Frederick and Dubois Streets) were higher than water levels in surrounding wells, presumably because of focused groundwater recharge in and around the SCMs.
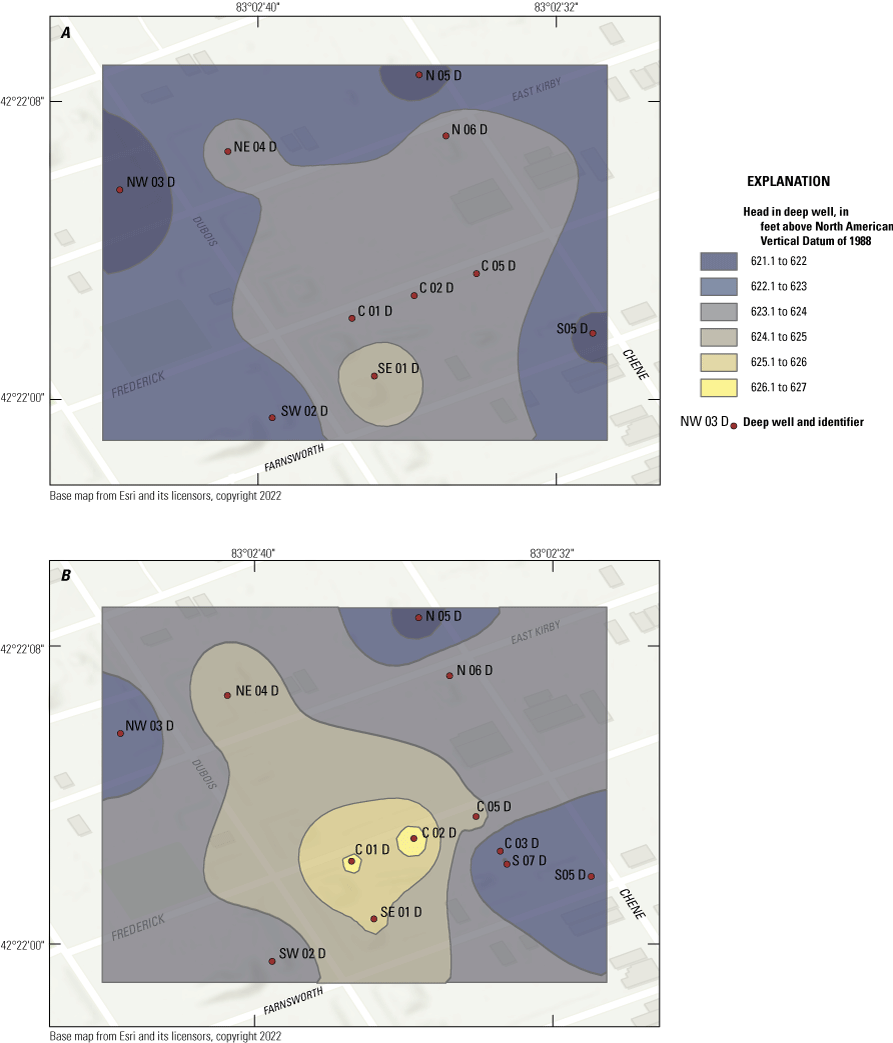
Interpolated water-level surfaces for deep wells at RecoveryPark in Detroit, Michigan, for, A, preconstruction conditions, July 1, 2016, and B, postconstruction conditions, July 1, 2018.
Comparison of water levels within pairs of nested wells that are screened at different depths can be used to determine the vertical direction of groundwater flow. Vertical gradients in nested wells installed at RecoveryPark were consistently downward indicating groundwater recharge conditions. Typical of groundwater conditions elsewhere, groundwater levels were higher in early spring and lower during late summer to early fall. The elevation of the combined sewer system pipes ranged from 14 to 18 ft below land surface, which, for most of the study period, was below water levels in shallow and deep wells. Unless the sewer pipes experienced a surge in pressure because of blockage or large precipitation events, the hydraulic gradient was from groundwater into the combined sewer system, rather than from the sewers into groundwater. For deep wells C 01 D and NW 03 D (downgradient of SCMs installed at RecoveryPark), the annual maximum water levels each spring remained consistent during the study period; however, the annual minimum water levels each winter increased through the study period (fig. 5). This indicates that water was added to groundwater storage at these locations.
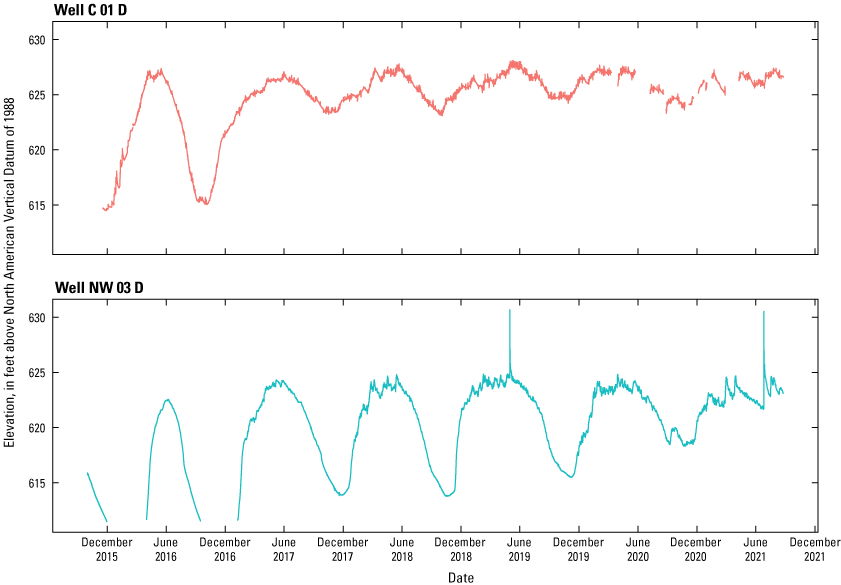
Groundwater levels in wells C 01 D and NW 03 D from 2015 through 2021 at RecoveryPark in Detroit, Michigan.
Groundwater often contains a wide variety of compounds that, depending on physicochemical conditions, dissociate into cations and anions and are thereby conductive. Specific conductance was used as a general indicator of water quality, which varied widely across the site and was typically in the range of 1,000 to 1,200 microsiemens per centimeter (μS/cm). Yet, groundwater near wells C 01 S, C 01 D, and C 02 S had specific conductance values that averaged 2,370 μS/cm (for 2 samples), 3,270 μS/cm (for 9 samples), and 2,170 μS/cm (for 4 samples), respectively. In comparison, specific conductance of groundwater from a 58-well network that included observation wells and drinking water wells sampled in southeast Michigan in the late 1990s averaged about 900 μS/cm with a maximum conductance of 3,150 μS/cm (Blumer and others, 1998, 1999). Water samples were not analyzed for a complete suite of cations and anions, so the causes of these anomalous specific conductance values are unclear; however, past land use practices may have contributed to elevated solutes in groundwater. Specific conductance of groundwater in shallow wells responded to larger precipitation events. This was illustrated by a decline in specific conductance during the event and subsequent increase or rebound back to prerainfall event levels after a short time. There was no similar conductivity response in deep wells where sediment depth likely buffered the screened well area from shallow infiltrated rainfall.
Specific conductance measured in 16 samples from combined sewer system site E averaged about 650 μS/cm, ranged from about 320 to 1,400 μS/cm, and was generally lower than that of groundwater. The specific conductance values of waters within the combined sewer system are relatively low in comparison to onsite groundwater and may reflect dilution from rainwater or potable water sources, including leaky water mains. Although there are no site-specific data regarding specific conductance of residential effluent at RecoveryPark, published values from another urban area (Denver, Colo.) ranged from 620 to 1,444 μS/cm (Conn and others, 2006).
Flow Within the Combined Sewer System and Stormwater Volume Reduction
Flow rates (Hoard and others, 2024) and volumes at combined sewer system sites B, D, and E were proportional to drainage areas for the respective monitoring locations (fig. 6; drainage areas for each combined sewer system site are provided in table 3). Percent impervious surface, land cover, and cultural disturbances (for example, dumping of trash and construction debris, lawn mowing, and compaction of soils) likely altered local runoff conditions thereby affecting pipe flow at each location. Pieschek (2017) qualitatively evaluated the condition of the combined sewer system pipes and reported that the pipes were in poor condition including cracks, holes, missing bricks, and visible soil, meaning that the degree of inflow and outflow could have varied widely across the area and during this study. Because of these unknown pipe conditions, the influences on pipe flow rates could not be determined. Instead, multiple lines of observation are provided to make general statements about the direction and persistence of fluxes as unwanted inputs to the combined sewer system.
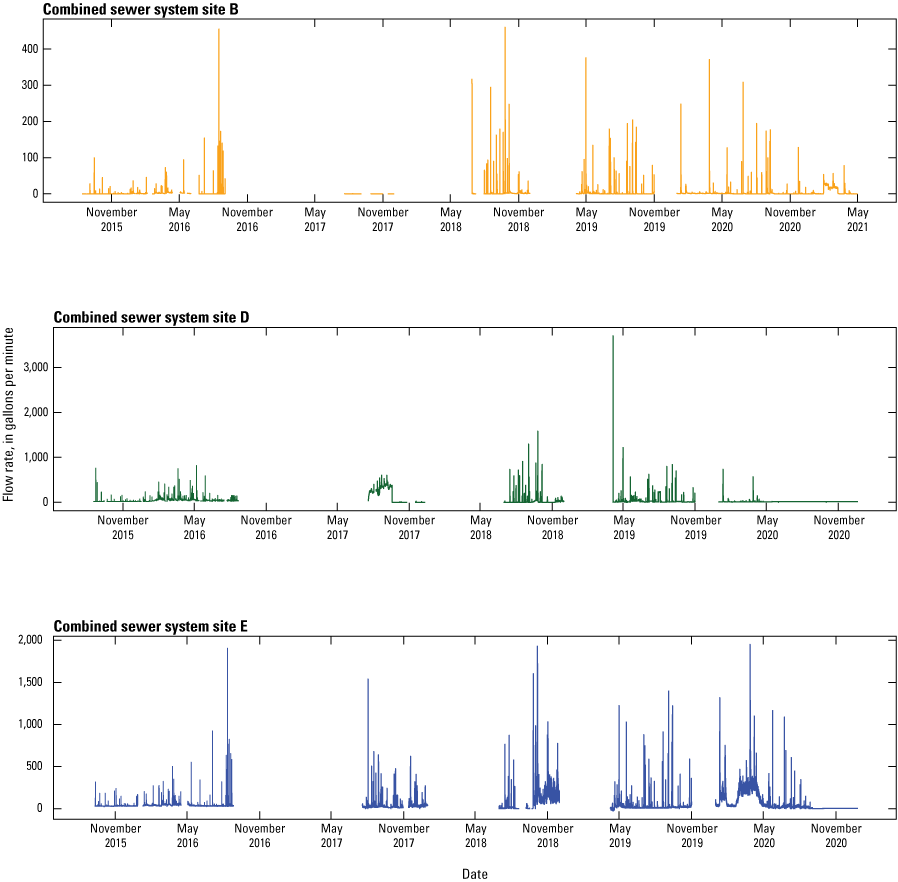
Pipe flow measured at combined sewer system sites B, D, and E, RecoveryPark in Detroit, Michigan.
Table 3.
Estimated contributions of water to combined sewer system monitoring sites based on flow measured by Detroit Water and Sewerage Department and the dye-tracer study, RecoveryPark in Detroit, Michigan.[DWSD, Detroit Water and Sewerage Department; ft2, square foot; gal, gallon]
Dry-weather flow at site E consistently ranged from about 7 to 10 gal/min, which is far more than the estimated typical household use from a single house of about 300 gallons per day (gal/day) or 0.21 gal/min (EPA, 2018). In residential and urban settings, it is common to see diurnal patterns in pipe flow resulting from increased sanitary sewage inputs during early morning or late afternoon usage; however, the records from combined sewer system site E do not show such patterns. Pieschek (2017) attributed high DWFs to a leaking water main where potable water was leaking into the combined sewer system. As noted in Hoard and others (2019a), groundwater inflow, leaky water mains, storage and slow release of water in abandoned foundations, and poorly sealed sewer connections remaining from improperly demolished buildings also may have contributed water to the combined sewer system.
Dry-weather flows tended to be larger during the spring months when there were higher precipitation and snowmelt inputs and lower losses to evapotranspiration. Dry-weather flows became smaller during the summer when there were rainfall events of variable intensity and depths and the highest evapotranspiration losses of the year. This is likely in part because of the combination of more runoff events during the spring season rains and slow infiltration into thawing soils. Other possibilities include lower evapotranspiration rates during senescence before spring leaf-out, higher groundwater levels contributing water through compromised sections of sewer pipes, and (or) release of water stored in foundations of abandoned residences.
Pipe flow at site E responded quickly to RDII (fig. 6). The poor condition of combined sewer system pipes and clogging from sediment and debris impeded stormwater flow as indicated by sporadic and abrupt changes in flow with time that, in some cases, cleared after a major flow event. Additionally, Pieschek (2017) cited irregularly shaped pipes as a cause of flow-measurement problems within the combined sewer system. Flow measurements using stage as an input variable require level water surfaces, but irregularly shaped pipes may thwart such conditions.
Hoard and others (2019a) used hydrograph-separation methods to estimate the DWF component of the pipe-flow record as described in Lyne and Hollick (1979). This analysis is repeated here with additional postconstruction and postmodification data to add a quantitative understanding of the rain amount needed to initiate flow as RDII within the combined sewer system. Base-flow separation was done for three periods corresponding to preconstruction, postconstruction, and postmodification periods. Peak unit flows (normalized flows as one unit of rainfall equivalent to one unit of flow) were calculated at combined sewer system site E by comparing rainfall amounts in a segmented regression analysis (fig. 7).
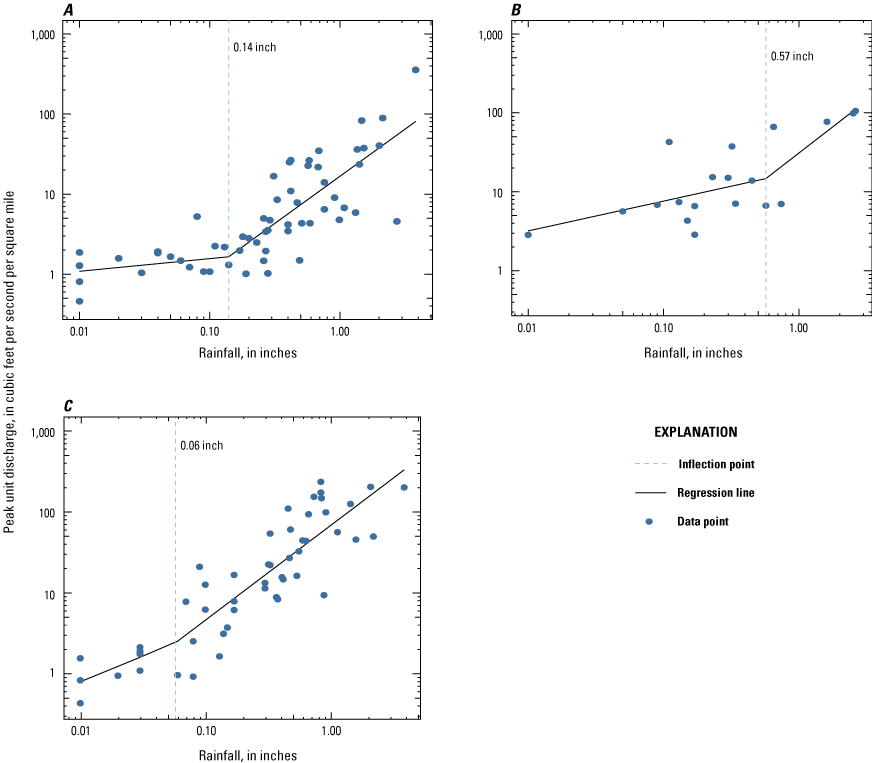
Relation between peak unit discharge and rainfall at RecoveryPark in Detroit, Michigan, for A, preconstruction, B, postconstruction, and C, postmodification study periods.
During smaller precipitation events, most of the precipitation infiltrated into the ground, was directed towards GSI (after construction), or was held as surface storage; however, with larger or prolonged precipitation events, infiltration and storage capacity at the surface was exceeded and flow was initiated in the combined sewer system. This threshold is represented by an inflection point and change in slope of the regression lines and is emphasized with vertical dashed lines on figure 7. For the preconstruction period (fig. 7A), flow in the combined sewer system did not happen until a threshold of approximately 0.14 in. of rain was exceeded in a 24-hour (hr) period. Once the rainfall for an event exceeded this threshold, the peak unit flow increased proportionally as rainfall volumes increased. Postconstruction, the inflection point shown on figure 7B shifted to the right, indicating that the amount of rain within a 24-hr period required to produce flow in the combined sewer system increased to 0.57 in. Postmodification, when the connection between the swale and the underdrain was enhanced, the unit precipitation-pipe flow relation changed such that the precipitation required to initiate flow in the combined sewer system was only 0.06 in. This quantified a decrease in the original intent of SCMs performance, which was to detain and control runoff generated from the sewershed catchment area. The postmodification value of 0.06 in. documents that changes made to the SCMs postmodification decreased the SCMs’ ability to reduce stormwater flows and peak runoff characteristics were returned to near preconstruction conditions. Note that for all three study periods, precipitation exceeded observed pipe flow by more than a three-to-one ratio, indicating that there were other sinks of water in addition to the combined sewer system.
The volume of stormwater removed from the combined sewer system at each stage of the construction process was estimated through calculations using the peak-unit flows. For preconstruction conditions, 0.14 in. of rain was multiplied by the area of the sewershed (8.40 acres), resulting in an estimated volume of 31,900 gallons (gal). This value represents the volume of rain that infiltrated or was retained as surface storage before flow was initiated in the combined sewer system. Postconstruction, the area of the sewershed increased to 8.74 acres and, combined with the estimate of 0.57 in. of rain within a 24-hr period, the infiltrated or stored volume increased to 135,300 gal (a difference of 103,400 gal). During the study period, rainfall of 0.57 in. within a 24-hr period was exceeded on average 23 times per year. The difference between pre- and postconstruction flow within the combined sewer system represents an estimated annual volume of approximately 2.4 million gal. Rainfall events between 0.14 and 0.57 in. within a 24-hr period were not included in this estimate; therefore, the estimated value of 2.4 million gal represents the minimum amount of rainfall diverted from the combined sewer system by the GSI. Postmodification, the inflection point decreased to 0.06 in.; thus, excavation of the gravel-lined drains in the swale rerouted an estimated annual volume of 2.4 million gal of stormwater back into the combined sewer system. Even though the estimated volumes of water are presented as single numbers flowing from the entire site, it is likely that infiltration was unevenly distributed throughout the site because not all swales were modified with gravel drains. Uncertainty within these estimates was not quantified; however, we acknowledge that poor records of flow within the combined sewer system and the small number of data points available for analysis likely contribute to an uncertainty of 20–25 percent.
Pieschek (2017) used the EPA Stormwater Calculator version 1.1 (Rossman, 2014) to estimate volume reductions at the study site because of GSI implementation and the addition of hoop houses. Modeling results using the calculator and other modeling approaches indicated a runoff volume reduction of as much as 80 percent. Pieschek (2017) concluded that these estimates may be influenced by several limitations of the calculator as applied to the RecoveryPark study area, including no option to include underdrains in bioretention simulations, no ability to link green infrastructure in series, and no option to change the ponding depth within the GSI to greater than 12 in. (design specifications at RecoveryPark included a ponding depth of 36 in.). More research into the effects of these limitations is warranted but was beyond the scope of this study.
Dye-Tracer Study
The dye-tracer study done on September 25, 2018, was planned for a period when only DWF was anticipated within the combined sewer system and no rain fell three days prior; however, about 1.5 in. of rain fell before and during the test. This resulted in higher flows at the beginning of the tests in the morning followed by flow recession and lower flows during the afternoon. This was an unplanned opportunity to study the system under a variety of conditions within a single testing period.
Flow and dye breakthrough curves (Hoard and others, 2024) within the combined sewer system are shown in figure 8. As described above, flow displayed in figure 8A decreased at all monitoring sites as the day progressed and was higher during test 1 (shown as a beige-shaded area in fig. 8) as compared to test 2 (green-shaded area in fig. 8). Dilution from stormwater in the combined sewer system caused decreases in dye concentration as the dye moved downgradient between monitoring sites (fig. 8B). At individual sites, dye concentrations increased with time because of constant dye injection rates but decreasing flow rates. For selected periods, inconsistent flow data at sites B and D were estimated based on dye concentrations and recession characteristics observed at other sites and are shown as red dots on figure 8A.
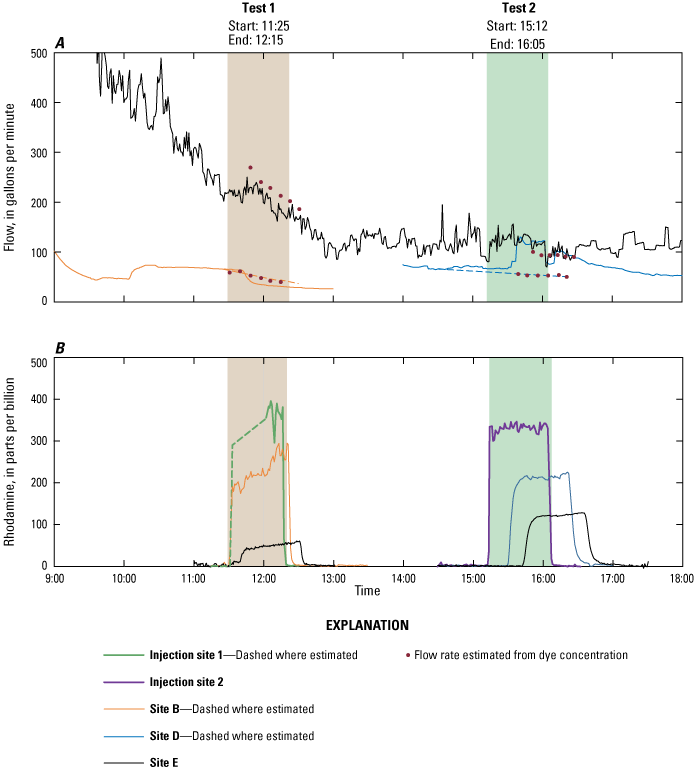
A, flow rates and B, rhodamine dye concentrations during two dye-tracer tests at RecoveryPark in Detroit, Michigan, September 25, 2018.
Estimated sewershed contributing areas, measured pipe flow volumes, and estimated pipe flow volumes from dye concentrations were compared to evaluate measured flow rates during the tests (table 3). Sewershed contributing areas for each monitoring site were estimated based on results of Pieschek (2017), visual examination of the combined sewer system lines in comparison to locations of storm drains, and examination of 2021 lidar data. For test 1, the volume measured at site B and the flow estimated by dye concentrations were consistent with the percentage of Site E sewershed and ranged from 21 to 26 percent. Measured volumes of water at site E were similar to that estimated by dye concentrations. For test 2, the volume measured at site D was similar to the percentage of sewershed contributing area; however, the flow volumes estimated by the dye-tracer study were at least 9 percent greater than what would be expected by area of contributing sewershed, indicating pipe flow meter error or additional sources of water that could not be explained by contributions of runoff to the combined sewer system alone.
Water Budgets
Four water budgets were developed to examine how stormwater partitioned in the system in response to changes in site conditions (table 4). Each water budget provides estimated volumes of precipitation, potable water supply, PET, DWF, and total pipe flow at combined sewer system monitoring location E for 1-month periods. Warm-season precipitation was used as the forcing for this analysis. Of specific interest were volumes of stormwater that would have otherwise flowed to the DWSD wastewater treatment plant or directly into the Detroit River through combined sewer system overflows. Water budgets for October 15 to November 15, 2015, and June 1 to July 1, 2016, are updated from Hoard and others (2019a) and demonstrate seasonal differences in the preconstruction water balance. The period August 1 to September 1, 2017, represents postconstruction conditions and June 1 to July 1, 2019, represents postmodification conditions. These 1-month periods were selected because they provided the most consistent pipe flow data with consistent data streams with few-to-no gaps in pipe flow data and minimal influence of blockage.
Table 4.
Estimated water budgets for the sewershed draining to site E, RecoveryPark in Detroit, Michigan, during selected 1-month periods.[Percent (%) is calculated as a percentage of total inflows. ft3, cubic foot; NA, not applicable]
For the four periods, the primary water input was precipitation; for three out of the four periods, the largest output was PET (table 4). For the postconstruction period, pipe flow measured at site E exceeded PET. The difference between input and output terms produced unaccounted flows where outflows consistently exceeded inflows. Excess outflows were attributed to leaky water infrastructure; storage and subsequent slow release of water in abandoned foundations; changes in soil moisture and groundwater storage; and measurement error. For the water budgets for June 1–July 1, 2016, and June 1–July 1, 2019, calculated PET was much greater than the actual evapotranspiration of 16–24 in/yr as estimated by Sanford and Selnick (2013) for the Detroit area (table 1). These periods correspond to early summer when actual evapotranspiration is likely at its maximum.
Chloride Sampling
Twenty-two samples of soil were obtained from 11 locations in and around the RecoveryPark study area. Five sampling locations were from within the SCMs, and six sampling locations were from reference areas outside of the SCMs (fig. 1; tables 5, 6). Chloride concentrations in soil samples ranged from 3 to 158 ppm. Comparison of chloride concentrations in soil samples from fall 2020 and spring 2021 shows that chloride concentrations decreased among SCM sites and reference sites during these two periods (fig. 9). Chloride within soils in the SCMs averaged 46.4 ppm in fall and 12.0 ppm in spring; chloride within soils in reference samples averaged 15.0 ppm in fall and 5.3 ppm in spring. SARs at these same sampling locations ranged from 0.1 to 0.6; however, SARs were more variable between sampling events and higher in samples obtained from soils within the SCMs. The average SAR within the SCM soil samples was 0.36 and 0.34 in fall and spring samples, respectively. SARs in the reference soil samples were 0.10 and 0.12 in fall and spring, respectively.
Table 5.
Chemical data from soil samples collected at RecoveryPark in Detroit, Michigan.[USGS, U.S. Geological Survey; equiv, equivalent; ppm, part per million; SAR, sodium absorption ratio; μS/cm, microsiemens per centimeter; GI, green infrastructure; <, less than]
Table 6.
Chemical data from water and road samples collected at RecoveryPark in Detroit, Michigan.[Dates are given in month/day/year. Times are given in hours:minutes (military). °C, degree Celsius; mg/L, milligram per liter; µS/cm, microsiemens per centimeter; CaCO3, calcium carbonate; SAR, sodium absorption ratio; --, not done; <, less than; e, estimated]
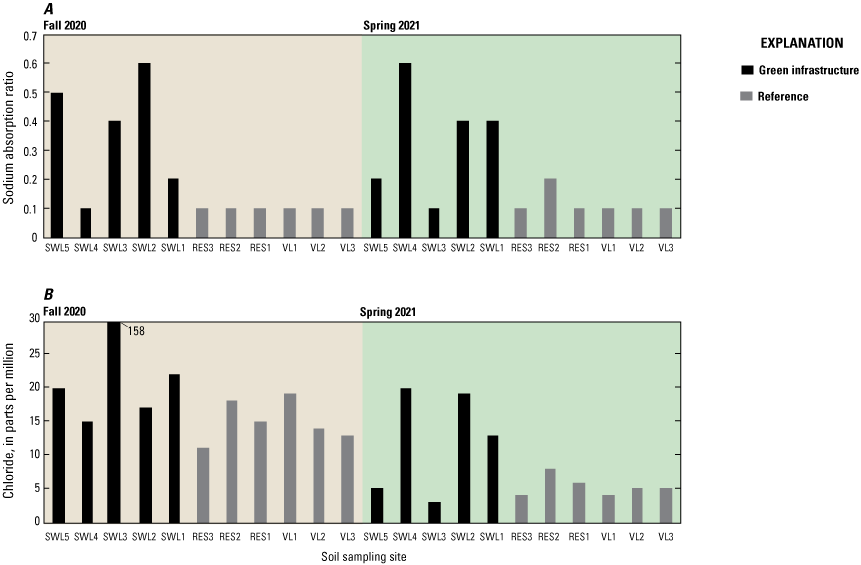
Results of soil sampling for A, sodium absorption ratio, and B, chloride samples obtained at RecoveryPark in Detroit, Michigan.
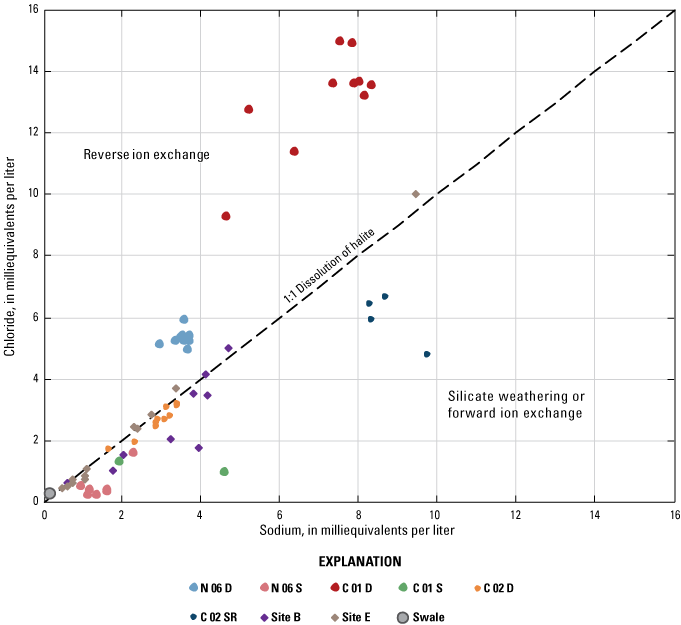
Over the course of this study, 77 water samples were obtained, including 32 samples of water from the combined sewer system, 44 samples from groundwater, and 1 sample from standing water within a swale (table 6). Analytical results of sodium and chloride concentrations (in milligrams per liter [mg/L]) were converted to milliequivalents per liter and plotted to evaluate whether the source of chloride and sodium was halite (the primary mineral in road salt made of equal amounts of sodium and chloride) or from other sources (fig. 10). If halite was the primary source of chloride and sodium, data points should lie along the 1:1 line. Most of the combined sewer system samples and some of the groundwater samples lie along the halite 1:1 line indicating that halite derived from road salt is likely the primary source of chloride in these samples. Analyses from wells N 06 D and C 01 D, however, plotted away from the halite 1:1 line. Historical land uses and waste-disposal practices are likely sources of excesses or deficiencies in chloride, sodium, or both that caused the data points to deviate away from the line.
Comparison of sodium and chloride concentrations in water samples collected at RecoveryPark in Detroit, Michigan.
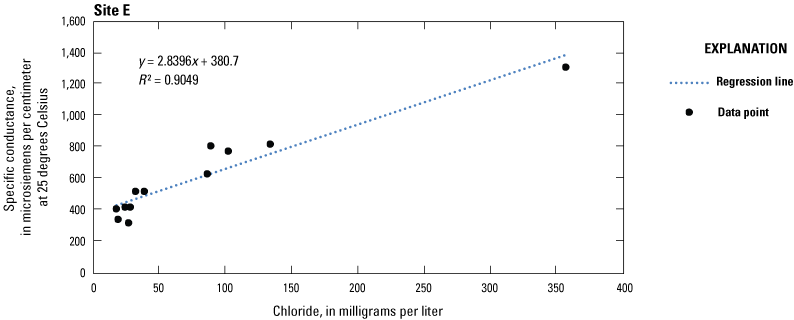
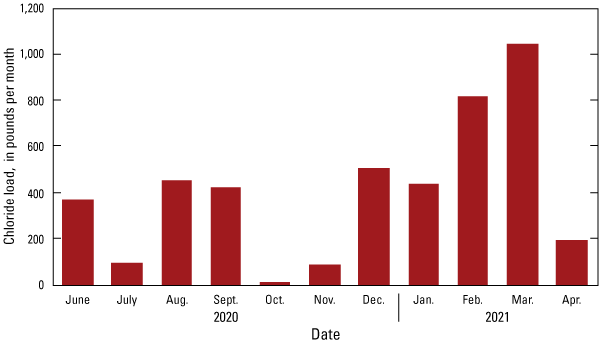
Chloride concentrations determined from discrete water samples were used to develop a regression with specific conductance to facilitate estimates of monthly average chloride concentrations and loads (fig. 11). Our approach to collecting these samples focused on periods of runoff during or immediately after snowmelt events and did not include combined sewer system samples collected during DWF; thus, other potential sources of chloride were not evaluated. Using this regression equation between chloride and specific conductance, an estimated 2,790 pounds (lbs) of chloride passed through combined sewer system site E from December 2020 through March 2021 (fig. 12). All samples were collected postmodification, therefore most, if not all, of the chloride ended up at Detroit’s wastewater treatment plant rather than infiltrating through the SCMs, binding to chemically active soil surfaces, or otherwise mixing with groundwater.
Regression of chloride and specific conductance for water samples obtained at combined sewer system site E, RecoveryPark in Detroit, Michigan.
Estimated chloride load passing through combined sewer system site E, June 2020 through April 2021, RecoveryPark in Detroit, Michigan.
Mixing curves using chloride and bromide as tracers (as described by Davis and others [1998]) were developed between end members of precipitation, road salt, potable water, and groundwater for water samples collected at RecoveryPark (fig. 13). Curves shown on figure 13 were generated using the most dilute samples as a beginning end member then sequentially adding small amounts of water that had the highest concentration until the computed concentration was the same as the most concentrated sample. Chloride and bromide data for precipitation were obtained from Davis and others (1998). Samples of potable water were obtained from the hydrants during the dye test and were analyzed for the same constituents.
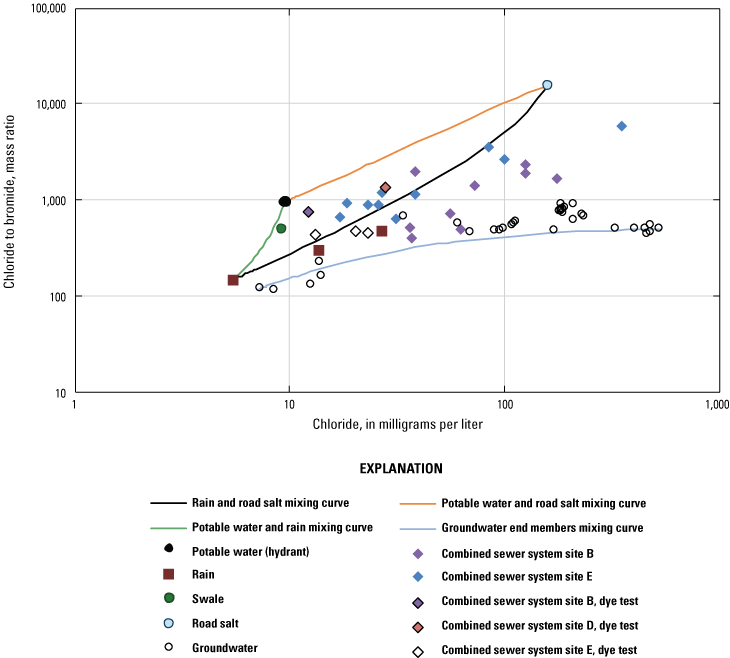
Mixing diagram of water samples collected at RecoveryPark in Detroit, Michigan.
Groundwater had the highest concentrations of chloride and bromide. Bromide concentrations were several times higher in groundwater than other samples; therefore, groundwater samples typically had lower chloride to bromide (Cl:Br) ratios than other samples. Combined sewer system sites B and E had intermediate chloride concentrations; samples from the swale, potable water, and rain had the lowest chloride concentrations. Bromide concentrations in samples other than groundwater had similar concentrations. The highest average Cl:Br ratio (15,850) from all samples was obtained from the sample of road salt that had high concentration of chloride relative to bromide concentration, which was at the detection level of less than 1 mg/L. The second highest Cl:Br ratios were measured in samples from the combined sewer system.
Based on these mixing relations, road salt appeared to be a major source of chloride in the combined sewer system during the winter months from December through March. Groundwater had high concentrations of chloride and bromide as compared to other samples, but with bromide being much higher in groundwater samples than others, groundwater is a likely source (rather than a sink) of water in the combined sewer system. Samples obtained during the dye test are mixtures of precipitation and potable water. Although not included here, a mixing diagram of chloride and iodide showed similar relations.
Implications of the Hydrologic Study of Green Infrastructure in Poorly Drained Urbanized Soils at RecoveryPark
This study of the hydrologic system at RecoveryPark focused on collecting data to improve understanding of complex interactions between runoff, infiltration, evapotranspiration, and flow within well-developed soils, clay-rich sediments, the GSI, and the combined sewer system. The primary objective of the study was to evaluate how GSI installations reduce stormwater volumes; however, several outcomes suggest potential improvements to GSI construction, project management, and future study.
-
1. Several site-design modifications were made without the researchers’ knowledge, which led to changes in the hydrologic function of the swales. The study approach and monitoring strategy would have benefitted from more frequent meetings between the landowner, private consultants, DWSD, EPA, and USGS to share updates of site activities, review study objectives in relation to those activities, and discuss major project milestones.
-
2. Infiltration measurements made in existing, high-quality surficial soils with high hydraulic conductivities at RecoveryPark supported infiltration and construction of SCMs, but the swales were constructed within underlying clay sediments that had low hydraulic conductivity. During construction, we observed that sediments in and around the SCMs were compacted to accommodate site-design specifications. Standing water and slow infiltration rates in at least two swales required modification of as-built designs that resulted in reducing the effectiveness of SCMs. Specifically, the installation of gravel drains within one of the swales provided a direct path to the combined sewer system; thereby site drainage characteristics returned to preconstruction measurements. Alternatively, the SCMs could have been sized such that the slowly permeable soils had more area to infiltrate stormwater at prevailing infiltration rates. For future implementation of green infrastructure at the scale of RecoveryPark, a better understanding of hydraulic characteristics of soils and sediments beneath surficial soils would benefit design and construction leading to improved infiltration of stormwater.
-
3. Unidentified sources and sinks of water made monitoring and understanding of the hydrologic system difficult. Water budgets estimated for four different periods included large unaccounted outflows. Although some of the degraded infrastructure was improved by lining the combined sewer system pipes with polyvinyl chloride, not all pipes were in good condition. Cracks and other failures within the combined sewer system pipes likely contributed to unaccounted flows of water into or out of the combined sewer system. Additionally, the abandoned residential neighborhood surrounding RecoveryPark was characterized by large amounts of trash, debris, and sediment that likely influenced flow conditions and water chemistry within the unsaturated zone, the groundwater system, and the combined sewer system. Consideration of drainage pipe conditions in urban areas would improve the ability to accurately measure flows and support reliable data collection.
-
4. Data collection and the resulting records for combined sewer system pipe flows were inconsistent. As noted above, accurate and consistent flow data were critical to the understanding of the hydrologic system at RecoveryPark, and redundant data collection instrumentation and more focus on timely calibration and checks of the instrumentation would have benefited analysis and interpretation of results.
-
5. For this study, weather stations were placed where there was minimal opportunity for vandalism and not within the GSI. Weather stations located within the GSI would provide more accurate estimates of onsite meteorological conditions (specifically with regards to PET).
Summary
During an 8-year study of the hydrologic system at RecoveryPark, flow derived from dry-weather flows (which may have included sanitary effluent, infiltrating groundwater, potable water from leaky supply pipes, and water released from storage on the surface and from abandoned building foundations) and stormwater were characterized using a variety of methods. The main objective of this work was to evaluate how efficiently green stormwater infrastructure (GSI) reduces stormwater values reaching Detroit’s Water Resource Recovery Facility. Construction of the urban farm at RecoveryPark included hoop houses and repair of some paved surfaces. Because this new construction and land use created more impervious area, swales were incorporated into the site design to collect runoff and reduce peak stormwater flows. Land-use changes after the construction of GSI demonstrated an increase in impervious area because of hoop house construction, but precipitation that fell on the hoop houses was routed into the new GSI.
Annual precipitation measured at the site during several years of the study was higher than long-term average for the Detroit metropolitan area, and potential evapotranspiration was often greater than the measured precipitation. The analysis of flows within the combined sewer system for the RecoveryPark sewershed showed that dry-weather flows ranged from 7 to 10 gallons per minute. Through peak-flow regression analyses, construction of GSI at RecoveryPark had the potential to remove an estimated 103,400 gallons each time rainfall met or exceeded 0.57 inches (in.) within a 24-hour (hr) period. The meteorological data collected at the site indicate that 0.57 in. within a 24-hr period was exceeded on average 23 times per year, representing an average annual volume reduction of about 2.4 million gallons. As determined through a series of water budgets and flow schematics, the potential benefits of volume reduction were nearly eliminated after site modifications were made to address slow infiltration rates and standing water.
Changes in groundwater after GSI construction included increases in storage as demonstrated by mounding of groundwater adjacent to GSI and increases in seasonal groundwater storage in the sediments near two wells. As a general indicator of water quality, specific conductance values in groundwater were variable because of prior land-use practices.
To evaluate unaccounted flows in the combined sewer system, a dye-tracer study revealed that flow volumes estimated by direct measurement and dye concentrations had consistent relations between flow and contributing drainage areas; however, data collected along the southeast part of the sewershed area provided greater flow estimates from the dye concentrations than measured by direct methods and could explain some of these discrepancies in unaccounted flows.
Water chemistry focused on understanding road salt fate in and around the GSI. Halite was the main source of chloride in water samples obtained from the combined sewer system during winter months. Results from two groundwater wells suggested that halite was not the primary source of chloride and (or) sodium, and, without additional water-quality data, we conclude that historical land uses may have been a likely the source of chloride and (or) sodium excesses or deficiencies. During winter months (December 2020 through March 2021), the estimated chloride load derived from road salt passing through combined sewer system site E was 2,790 pounds. A mixing diagram using end members of road salt, rainwater, potable water, septic effluent, and groundwater demonstrated that water samples obtained from the combined sewer system contained variable mixtures of each and road salt was the primary contributor of chloride to the combined sewer system.
This study gained insights into the design, implementation, and monitoring of GSI in urban settings that are underlain by poorly permeable sediments. These insights are presented as a series of “implications of study” to consider in future studies and include:
-
1. Holding regular and frequent meetings with project stakeholders and project partners.
-
2. Using existing, high-quality surficial soils with high hydraulic conductivities in site designs instead of placing the GSI in lower conductivity sediments. The GSI also could have been expanded in size to accommodate the low infiltration rates.
-
3. Determining the influence of degraded infrastructure and surface conditions on monitoring and understanding of the hydrologic system. In the case of RecoveryPark, degraded infrastructure was a likely contributor to large unaccounted flows. Similarly, surficial conditions (for example, trash piles, debris, and sediment) have the capacity to influence flow conditions within the combined sewer system.
-
4. Collecting more consistent and perhaps redundant data of flow at the combined sewer system sites likely would have benefited analysis and interpretation of results.
-
5. Placing weather stations within the GSI would have allowed more accurate estimates of onsite meteorological conditions, specifically with regards to potential evapotranspiration.
References Cited
Barker, A., Clay, G., Morrison, R., Payne, S., Gilchrist, A., Rothwell, J., and Tantanasi, I., 2019, Understanding Green Infrastructure at Different Scales: A Signposting Guide, University of Manchester, Manchester, UK: accessed September 9, 2019 at https://doi.org/10.13140/RG.2.2.26366.95045.
Beak, D., Borst, M., Acree, S., Ross, R., Forshay, K., Ford, R., Huang, J., Su, C., Brumley, J., Chau, A., and Richardson, C., 2020, The influence of stormwater management practices and wastewater infiltration on groundwater quality—Case studies: U.S. Environmental Protection Agency report, EPA/600/R–20/143, 206 p.
Bell, C.D., McMillan, S.K., Clinton, S.M., and Jefferson, A.J., 2016, Hydrologic response to stormwater control measures in urban watersheds: Journal of Hydrology, v. 541, p. 1488–1500. [Also available at https://doi.org/10.1016/j.jhydrol.2016.08.049.]
Berland, A., Shiflett, S.A., Shuster, W.D., Garmestani, A.S., Goddard, H.C., Herrmann, D.L., and Hopton, M.E., 2017, The role of trees in urban stormwater management: Landscape and Urban Planning, v. 162, p. 167–177. [Also available at https://doi.org/10.1016/j.landurbplan.2017.02.017.]
City of Detroit, 2019, Street Maintenance: accessed September 9, 2019, at https://detroitmi.gov/departments/department-public-works/street-maintenance.
City of Detroit, 2021, Green Stormwater Infrastructure Projects: City of Detroit web page, accessed December 29, 2021, at https://detroitmi.gov/departments/water-and-sewerage-department/dwsd-projects/green-stormwater-infrastructure-projects.
Conley, G., McDonald, R.I., Nodine, T., Chapman, T., Holland, C., Hawkins, C., and Beck, N., 2022, Assessing the influence of urban greenness and green stormwater infrastructure on hydrology from satellite remote sensing: Science of the Total Environment, v. 817, p. 152723. [Also available at https://doi.org/10.1016/j.scitotenv.2021.152723.]
Conn, K.E., Barber, L.B., Brown, G.K., and Siegrist, R.L., 2006, 2006, Occurrence and fate of organic contaminants during onsite wastewater treatment: Environmental Science & Technology, v. 40, no. 23, p. 7358–7366. [Also available at https://doi.org/10.1021/es0605117.]
Corsi, S.R., De Cicco, L.A., Lutz, M.A., and Hirsch, R.M., 2015, River chloride trends in snow-affected urban watersheds—Increasing concentrations outpace urban growth rate and are common among all seasons: Science of the Total Environment, v. 508, p. 488–497. [Also available at https://doi.org/10.1016/j.scitotenv.2014.12.012.]
Davis, S.N., Whittemore, D.O., and Fabryka-Martin, J., 1998, Uses of chloride/bromide ratios in studies of potable water: Ground Water, v. 36, no. 2, p. 338–350. [Also available at https://doi.org/10.1111/j.1745-6584.1998.tb01099.x.]
Fishman, M.J., and Friedman, L.C., eds., 1989, Methods for determination of inorganic substances in water and fluvial sediments: U.S Geological Survey Techniques of Water-Resources Investigations 05-A1, 560 p. [Also available at https://doi.org/10.3133/twri05A1.]
Hoard, C.J., Haefner, R.J., and Shuster, W.D., 2024, Select pipe-flow monitoring data from RecoveryPark in Detroit, MI (2015–2021): U.S. Geological Survey data release, accessed January 30, 2024, at https://doi.org/10.5066/P9FP21N9.
Hoard, C.J., Haefner, R.J., Shuster, W.D., Pieschek, R.L., and Beeler, S., 2019a, Full water-cycle monitoring in an urban catchment reveals unexpected water transfers (Detroit MI, USA): Journal of the American Water Resources Association, v. 56, no. 1, p. 82–99. [Also available at https://doi.org/10.1111/1752-1688.12814.]
Hoard, C.J., Haefner, R.J., Shuster, W.D., Pieschek, R.L., and Beeler, S., 2019b, Select pipe-flow monitoring data from RecoveryPark in Detroit, MI (2015–2016): U.S. Geological Survey data release, accessed January 22, 2024, at https://doi.org/10.5066/P96GBEXW.
Howard, J.L., 2016, Quaternary Geologic Map of the Detroit, Michigan Quadrangle and Surrounding Areas: Application of Magnetic Susceptibility and Other Geophysical Methods: Final Report U.S. Geological Survey Grant # G15AC00176 accessed August 27, 2022, at https://bpb-us-e1.wpmucdn.com/s.wayne.edu/dist/e/34/files/2019/02/16EDMAPreport-1ukpd5g.pdf.
Masoner, J.R., Kolpin, D.W., Cozzarelli, I.M., Barber, L.B., Burden, D.S., Foreman, W.T., Forshay, K.J., Furlong, E.T., Groves, J.F., Hladik, M.L., Hopton, M.E., Jaeschke, J.B., Keefe, S.H., Krabbenhoft, D.P., Lowrance, R., Romanok, K.M., Rus, D.L., Selbig, W.R., Williams, B.H., and Bradley, P.M., 2019, Urban stormwater—An overlooked pathway of extensive mixed contaminants to surface and groundwaters in the United States: Environmental Science & Technology, v. 53, no. 17, p. 10070–10081. [Also available at https://doi.org/10.1021/acs.est.9b02867.]
Minnesota Pollution Control Agency, 2023, Minnesota stormwater manual: Minnesota Pollution Control Agency web page, accessed February 17, 2023, at https://stormwater.pca.state.mn.us/index.php?title=Common_pollutants_of_concern_and_sources_in_stormwater_runoff.
Mozola, A.J., 1969, Geology for land and groundwater development in Wayne County, Michigan: Michigan Department of Environmental Quality Geological Survey Division Report of Investigation, v. 3, p. 16. [Also available at https://www.michigan.gov/documents/deq/GIMDL-RI03_362876_7.pdf.]
Mullaney, J.R., Lorenz, D.L., and Arntson, A.D., 2009, Chloride in groundwater and surface water in areas underlain by the glacial aquifer system, northern United States: U.S. Geological Survey Scientific Investigations Report 2009–5086, 41 p. [Also available at https://doi.org/10.3133/sir20095086.]
National Weather Service Forecast Office, 2017, NOWData—NOAA Online Weather Data: National Oceanic and Atmospheric Administration, accessed September 9, 2018, at http://w2.weather.gov/climate/xmacis.php?wfo=dtx.
National Weather Service Forecast Office, 2022, NOWData—NOAA Online Weather Data: National Oceanic and Atmospheric Administration, accessed October 10, 2022 at https://www.weather.gov/wrh/Climate?wfo=dtx.
Pieschek, R.L., 2017, Hydrologic modeling to quantify the effects of green infrastructure in an urban environment: Southfield, Mich., Lawrence Technological University Master’s thesis, 141 p., available through the Lawrence Technological University library at https://ltu.on.worldcat.org/oclc/984754535.
Rossman, L.A., 2014, National Stormwater Calculator user’s guide version 1.1: U.S. Environmental Protection Agency web page, accessed October 10, 2023, at https://nepis.epa.gov/Adobe/PDF/P100HD4J.pdf.
Sanford, W.E., and Selnick, D.L., 2013, Estimation of evapotranspiration across the conterminous United States using a regression with climate and land-cover data: Journal of the American Water Resources Association, v. 49, no. 1, p. 217–230. [Also available at https://doi.org/10.1111/jawr.12010.]
Selbig, W.R., Loheide, S.P., II, Shuster, W., Scharenbroch, B.C., Coville, R.C., Kruegler, J., Avery, W., Haefner, R., and Nowak, D., 2022, Quantifying the stormwater runoff volume reduction benefits of urban street tree canopy: Science of the Total Environment, v. 806, p. 151296. [Also available at https://doi.org/10.1016/j.scitotenv.2021.151296.]
Snodgrass, J.W., Moore, J., Lev, S.M., Casey, R.E., Ownby, D.R., Flora, R.F., and Izzo, G., 2017, Influence of modern stormwater management practices on transport of road salt to surface waters: Environmental Science & Technology, v. 51, no. 8, p. 4165–4172. [Also available at https://doi.org/10.1021/acs.est.6b03107.]
Teledyne ISCO, 2021, Signature Flow Meter Installation and Operation Guide Bubbler Manual #69-4333-004 of Assembly #60-4334-005: accessed September 9, 2022, at https://www.teledyneisco.com/en-us/Water_/Flow%20Meter%20Documents/Manuals/Signature%20BUBBLER%20Flowmeter%20User%20Manual.pdf.
U.S. Environmental Protection Agency [EPA], 2014, Guide for estimating infiltration and inflow: U.S. Environmental Protection Agency web page, accessed April 24, 2023 at https://www3.epa.gov/region1/sso/pdfs/Guide4EstimatingInfiltrationInflow.pdf.
U.S. Environmental Protection Agency [EPA], 2018, Water sense: How we use water: U.S. Environmental Protection Agency web page, accessed September 14, 2023, at https://www.epa.gov/watersense/how-we-use-water.
U.S. Environmental Protection Agency [EPA], 2023a, Economics of Green Infrastructure: U.S. Environmental Protection Agency web page, accessed September 14, 2023, at https://www.epa.gov/green-infrastructure/economics-green-infrastructure.
U.S. Environmental Protection Agency [EPA], 2023b, Green infrastructure design and implementation: U.S. Environmental Protection Agency web page, accessed September 14, 2023, at https://www.epa.gov/green-infrastructure/green-infrastructure-design-and-implementation.
U.S. Geological Survey [USGS], 2018, General introduction for the “National Field Manual for the Collection of Water-Quality Data” (ver. 1.1, June 2018): U.S. Geological Survey Techniques and Methods, book 9, chap. A0, 4 p. [Also available at https://doi.org/10.3133/tm9A0.] [Supersedes USGS Techniques and Methods, book 9, chap. A0, version 1.0.]
U.S. Geological Survey [USGS], 2019, Specific conductance: U.S. Geological Survey Techniques and Methods, book 9, chap. A6.3, 15 p. [Also available at https://doi.org/10.3133/tm9A6.3.] [Supersedes USGS Techniques of Water-Resources Investigations, book 9, chap. A6.3, version 1.2.]
U.S. Geological Survey [USGS], 2024, USGS water data for the Nation: U.S. Geological Survey National Water Information System database, accessed February 24, 2024, at https://doi.org/10.5066/F7P55KJN.
Wang, M., Liu, M., Zhang, D., Qi, J., Fu, W., Zhang, Y., Rao, Q., Bakhshipour, A.E., and Tan, S.K., 2023, Assessing and optimizing the hydrological performance of grey-green infrastructure systems in response to climate change and non-stationary time series: Water Research, v. 232, p. 119720. [Also available at https://doi.org/10.1016/j.watres.2023.119720.]
Ying, J., Zhang, X., Zhang, Y., and Bilan, S., 2022, Green infrastructure—Systematic literature review: Economic Research Journal, v. 35, no. 1, p. 343–366. [Also available at https://doi.org/10.1080/1331677X.2021.1893202.]
Conversion Factors
U.S. customary units to International System of Units
Temperature in degrees Celsius (°C) may be converted to degrees Fahrenheit (°F) as follows:
°F = (1.8 × °C) + 32.
Temperature in degrees Fahrenheit (°F) may be converted to degrees Celsius (°C) as follows:
°C = (°F – 32) / 1.8.
Datums
Vertical coordinate information is referenced to the North American Vertical Datum of 1988 (NAVD 88). Stage at Detroit River was measured and reported by the National Oceanic and Atmospheric Administration using the International Great Lakes Lake Datum of 1986 (IGLD–85; https://www.ngs.noaa.gov/TOOLS/IGLD85/igld85.shtml).
Supplemental Information
Specific conductance is given in microsiemens per centimeter at 25 degrees Celsius (µS/cm at 25 °C).
Concentrations of chemical constituents in water are given in milligrams per liter (mg/L).
Abbreviations
Cl:Br
ratio of chloride to bromide
DWF
dry-weather flow
DWSD
Detroit Water and Sewerage Department
EPA
U.S. Environmental Protection Agency
GSI
green stormwater infrastructure
PET
potential evapotranspiration
ppm
parts per million
RDII
rainfall-derived infiltration and inflow
SAR
sodium absorption ratio
SCM
stormwater control measure
USGS
U.S. Geological Survey
For more information about this publication, contact:
Director, USGS Upper Midwest Water Science Center
1992 Folwell Avenue
St. Paul, MN, 55108
For additional information, visit: https://www.usgs.gov/centers/uppermidwest-water-science-center
Publishing support provided by the Rolla Publishing Service Center
Disclaimers
Any use of trade, firm, or product names is for descriptive purposes only and does not imply endorsement by the U.S. Government.
Although this information product, for the most part, is in the public domain, it also may contain copyrighted materials as noted in the text. Permission to reproduce copyrighted items must be secured from the copyright owner.
Suggested Citation
Haefner, R.J., Hoard, C.J., and Shuster, W., 2024, Hydrologic study of green infrastructure in poorly drained urbanized soils at RecoveryPark, Detroit, Michigan, 2014–21: U.S. Geological Survey Scientific Investigations Report 2024–5018, 29 p., https://doi.org/10.3133/sir20245018.
ISSN: 2328-0328 (online)
Study Area
| Publication type | Report |
|---|---|
| Publication Subtype | USGS Numbered Series |
| Title | Hydrologic study of green infrastructure in poorly drained urbanized soils at RecoveryPark, Detroit, Michigan, 2014–21 |
| Series title | Scientific Investigations Report |
| Series number | 2024-5018 |
| DOI | 10.3133/sir20245018 |
| Publication Date | April 15, 2024 |
| Year Published | 2024 |
| Language | English |
| Publisher | U.S. Geological Survey |
| Publisher location | Reston, VA |
| Contributing office(s) | Michigan Water Science Center, Upper Midwest Water Science Center |
| Description | Report: viii, 29 p.; Dataset; 2 Data Releases |
| Country | United States |
| State | Michigan |
| City | Detroit |
| Online Only (Y/N) | Y |
| Additional Online Files (Y/N) | N |