

Status and Understanding of Groundwater Quality in the Mojave Basin Domestic-Supply Aquifer Study Unit, 2018: California GAMA Priority Basin Project
Links
- Document: Report (14.6 MB pdf) , HTML , XML
- NGMDB Index Page: National Geologic Map Database Index Page (html)
- Download citation as: RIS | Dublin Core
Acknowledgments
The authors thank the following agencies for their support: State Water Resources Control Board, Mojave Water Agency, and the Lahontan Region Water Quality Control Board. We especially thank the site owners and water purveyors for their generosity in allowing the U.S. Geological Survey (USGS) to collect samples from their wells. We thank Anna Garcia of the Mojave Water Agency and Scott Hynek and Mark Brigham of the USGS for providing thoughtful reviews of this report. For consistent presentation of results from the California Groundwater Ambient Monitoring and Assessment Program Priority Basin Project (GAMA-PBP), parts of this report were written following a template originally developed by Landon and others (2010).
Funding for this work was provided by the California State Water Resources Control Board Groundwater Ambient Monitoring and Assessment Program and by USGS Cooperative Matching Funds.
Abstract
Groundwater quality in the western part of the Mojave Desert in San Bernardino County, California, was investigated in 2018 as part of the California State Water Resources Control Board Groundwater Ambient Monitoring and Assessment Program Priority Basin Project. The Mojave Basin Domestic-Supply Aquifer study unit (MOBS) region was divided into two study areas—floodplain and regional—to assess differences between the two major aquifers used for drinking water supply in the area. This assessment characterized the quality of ambient groundwater and not the quality of treated drinking water.
The study included three components: (1) a status assessment, which characterized the quality of groundwater resources used for domestic drinking-water supply in the floodplain and regional study areas; (2) a brief understanding assessment, which evaluated factors that could potentially affect the quality of groundwater used by domestic wells in the region; and (3) a comparative assessment between the groundwater resources used by domestic wells and public-supply wells in the two study areas. The domestic-well assessment was based on data collected by the U.S. Geological Survey from 48 domestic wells in January–May 2018. The public-supply assessment was based on data for samples from 322 public-supply wells in 2008–18, either collected by the U.S. Geological Survey or compiled from the California State Water Resources Control Boards Division of Drinking Water publicly available database.
Concentrations of water-quality constituents in ambient groundwater were compared to regulatory and non-regulatory benchmarks typically used by the State of California and Federal agencies as health-based or aesthetic standards for public drinking water. Relative concentrations, defined as the measured concentration divided by the benchmark concentration, were classified as high (greater than 1.0), moderate (greater than 0.5 for inorganic constituents or 0.1 for organic and special-interest constituents, and not high), or low (concentrations lower than moderate). The floodplain and regional study areas were divided into 15 and 35 grid cells, respectively, and grid-based methods were used to compute the areal proportions of the two study areas with high, moderate, or low relative concentrations of individual constituents and classes of constituents.
For the domestic-supply assessment, one or more inorganic constituents with health-based benchmarks were detected at high relative concentrations in 58 percent of the regional study area and 13 percent of the floodplain study area. The inorganic constituents with health-based benchmarks detected at high relative concentrations in the regional study area were arsenic, chromium and hexavalent chromium, fluoride, adjusted gross alpha particle activity, uranium, molybdenum, strontium, and nitrate; only arsenic was detected at high relative concentrations in the floodplain study area. One or more inorganic constituents with secondary maximum contaminant level benchmarks were detected at high concentrations in 15 and 6.7 percent of the regional and floodplain study areas, respectively. The constituents detected at high relative concentrations in the regional study area were total dissolved solids, chloride, sulfate, and iron; only total dissolved solids and sulfate were detected at high relative concentrations in the floodplain study area.
Organic constituents were not detected at moderate or high relative concentrations in either the regional or floodplain study areas. Volatile organic compounds were detected at low relative concentrations in 21 and 27 percent of the regional and floodplain study areas, respectively, and pesticides were detected at low relative concentrations in 9.1 and 20 percent of the regional and floodplain study areas, respectively. The only individual organic constituent detected in more than 10 percent of either study area was the trihalomethane trichloromethane. Total coliform bacteria were detected in 15 and 27 percent of the grid wells in the regional and floodplain study areas, respectively.
The greater prevalence of high relative concentrations of many inorganic constituents in the regional study area compared to the floodplain area likely indicates the greater diversity of geologic material at depth in aquifer material and generally finer-grained alluvium compared to the floodplain study area combined with generally older groundwater that has had more contact time with aquifer materials. In general, trace element concentrations (1) increased with increasing groundwater age, (2) increased with distance from recharge sources in the mountains, and (3) increased with closer proximity to some types of geological units. In general, groundwater from domestic wells in the floodplain study area is young, with most samples containing a component of modern groundwater based on tritium and unadjusted carbon-14 activities, whereas groundwater from domestic wells in the regional study area generally is old, with most samples having unadjusted carbon-14 ages of 5,000–40,000 years.
Public-supply wells in MOBS generally were deeper than domestic wells and presumably are in contact with older, more weathered alluvium that may have more mobile trace elements, such as arsenic or uranium. However, only 26 percent of the public-supply regional study area had high relative concentrations of inorganic constituents, compared to 58 percent for the domestic regional study area. The percentages of the public-supply and domestic floodplain study areas with high relative concentrations of inorganic constituents were 11 and 13 percent, respectively. The ages of groundwater used by public-supply and domestic wells in each study area were similar, which was not expected given the greater depth of the public-supply wells. Three potential factors may contribute to these results: (1) greater spatial footprint of domestic well network, which may result in domestic wells pumping groundwater from fractured bedrock or mineralized areas not used by public-supply wells; (2) greater pumping rates in public-supply wells, resulting in more water being withdrawn from coarse-grained, heterogeneous alluvium than finer-grained layers, which may have higher concentrations of (or more mobile) inorganic constituents; and (3) a greater degree of well management with public-supply wells, which may include pausing use of or decommissioning wells if treating or blending water is not feasible to lower constituent concentrations.
Introduction
Groundwater provides about 40 to 60 percent of the water used for domestic and public drinking-water supply in California (Dieter and others, 2018; California Department of Water Resources, 2023a). The California Groundwater Ambient Monitoring and Assessment Program Priority Basin Project (GAMA-PBP) is a cooperative project between the California State Water Resources Control Board (SWRCB; http://waterboards.ca.gov/gama/). and the U.S. Geological Survey (USGS; https://ca.water.usgs.gov/gama/). The primary objective of the GAMA-PBP is to assess the water quality in groundwater resources used for public and domestic drinking water supplies.
The first phase of the GAMA-PBP characterized groundwater resources in California used for public drinking-water supply (Belitz and others, 2003; California State Water Resources Control Board, 2003). From 2004 to 2012, the GAMA-PBP assessed groundwater quality in 35 study units statewide, representing more than 90 percent of the groundwater resources used for public supply statewide (Belitz and others, 2015). Groundwater basins composed of unconsolidated sediments and highland areas at the margins of and outside of groundwater basins were prioritized for sampling based on well distribution, population served, and vulnerability to contamination (Belitz and others, 2003).
The second phase of the GAMA-PBP that began in 2012 has focused on characterizing the quality of groundwater resources used for domestic drinking-water supply (Shelton and Tejeda, 2024). Approximately 2 million California residents rely on privately owned domestic groundwater wells or small community systems serving fewer than 25 people for their drinking water (California State Water Resources Control Board, 2015). Because drinking water from domestic-supply wells is not regulated under the California Safe Drinking Water Act (California State Water Resources Control Board, 2015), which only applies to public drinking-water systems, comprehensive water-quality monitoring is not required by homeowners for their own private wells, and comparatively little is known regarding the status and vulnerability of domestic groundwater resources statewide. A high priority for the SWRCB is to better understand where communities reliant on domestic-supply wells might be vulnerable to water-quality degradation because these communities may need to be connected to public-supply systems in the future (California State Water Resources Control Board, 2019a).
Groundwater basins and areas outside of basins were prioritized for inclusion in the statewide assessment of groundwater used for domestic supply based on the estimated number and density of households with domestic wells (Johnson and Belitz, 2015). The Upper Mojave River Valley groundwater basin (California Department of Water Resources, 2020) was identified as a high priority area for assessment (Shelton and Tejeda, 2024). The Mojave Basin Domestic-Supply Aquifer study unit (MOBS; fig. 1) was the eighth domestic well assessment study unit sampled for the GAMA-PBP. MOBS is in the western part of the Mojave Desert (fig. 1) and includes the high priority Upper Mojave River Valley groundwater basin; MOBS also includes the Middle, and Lower Mojave River Valley, El Mirage, and Harper Valley groundwater basins (fig. 2; California Department of Water Resources, 2020) to facilitate comparison with prior public-supply aquifer assessments in the Mojave Basin (Mathany and Belitz, 2009; Dawson and Belitz, 2012). MOBS was divided into two study areas (floodplain study area and regional study area; fig. 2) on the basis of prior hydrogeologic characterizations of the region (Stamos and others, 2001).
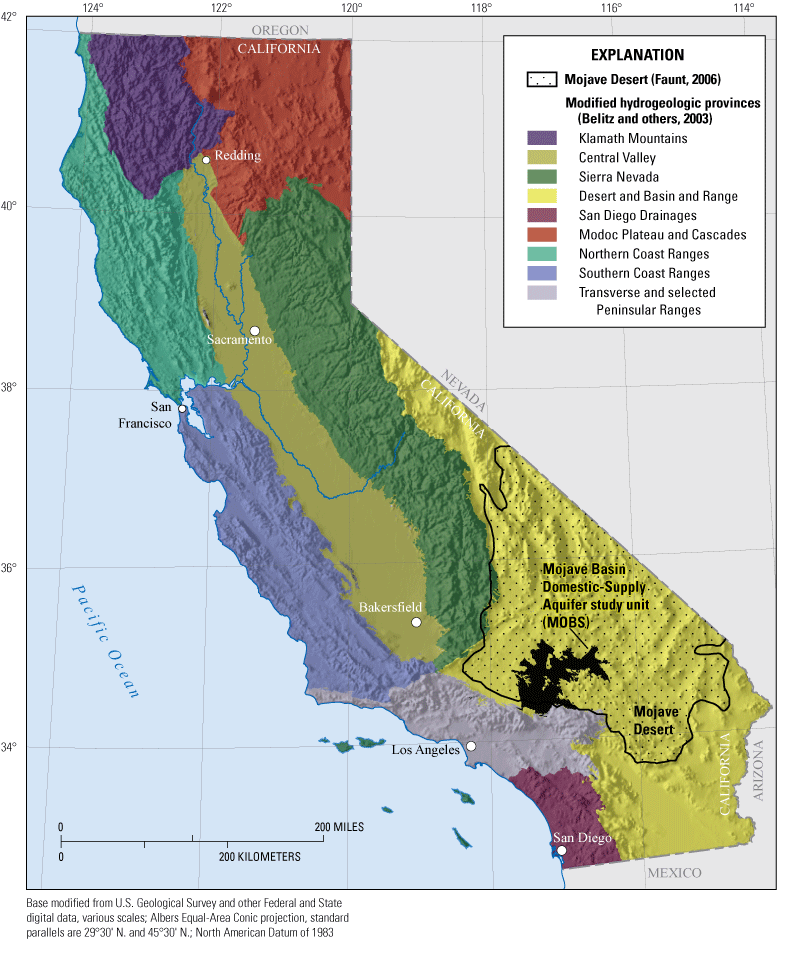
Hydrogeologic provinces of California and the location of the Mojave Basin Domestic-Supply Aquifer study unit, California Groundwater Ambient Monitoring and Assessment Program Priority Basin Project.
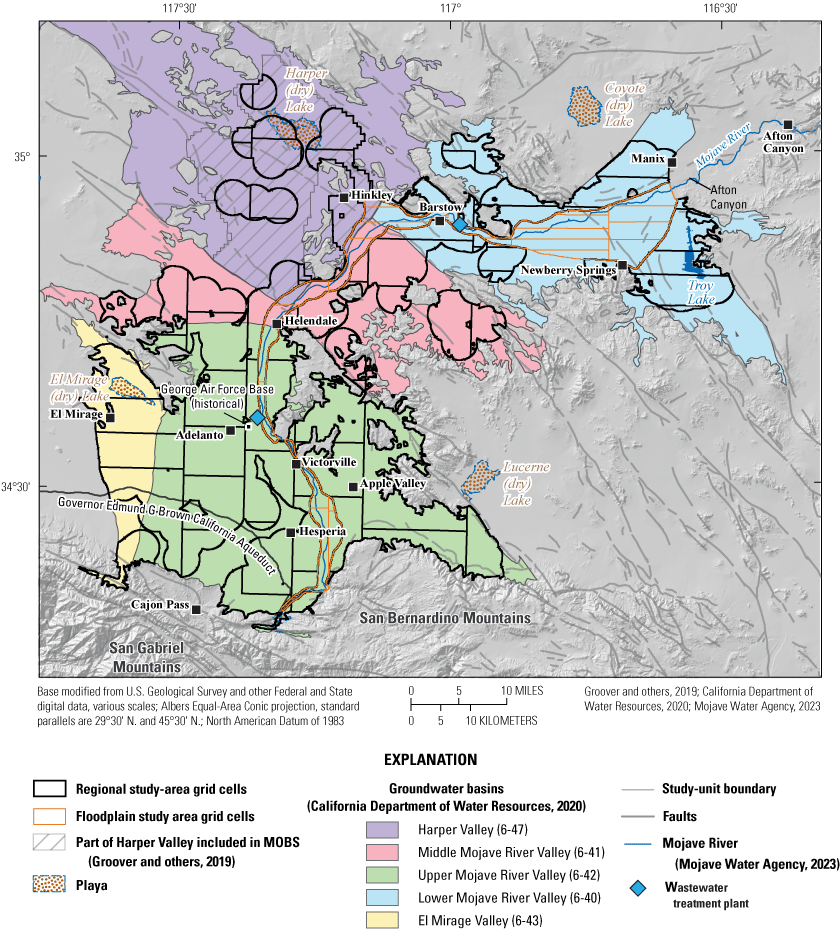
Boundaries of the Mojave Basin Domestic-Supply Aquifer study unit (MOBS), the floodplain and regional study areas, and California Department of Water Resources designated groundwater basins that overlap with the study-unit boundaries, California Groundwater Ambient Monitoring and Assessment Priority Basin Project, January–May 2018.
The data collected for GAMA-PBP assessments are designed to be used in three types of groundwater resource assessments: (1) a status assessment that synoptically characterizes the quality of a defined groundwater resource at the time of data collection, (2) an understanding assessment of the natural and anthropogenic factors that affect groundwater quality, and (3) a trends assessment of changes in groundwater quality through time (Belitz and others, 2003). The GAMA-PBP study framework was modeled after the USGS National Water Quality Assessment Program (Hirsch and others, 1988). Sampling protocols were designed to obtain representative samples of aquifer water. Therefore, groundwater quality results are indicative of the ambient resource and not finished drinking water, which can be treated, blended with waters from different sources or altered by interactions with conveyance systems such as corrosion from pipes (Belitz and others 2003, 2016). The assessments provided by the GAMA-PBP are specific to the depth zones in aquifers that provide drinking-water resources for public or domestic supply. Domestic-supply wells typically draw from shallower parts of aquifers than public-supply wells do, but the domestic-supply and public-supply wells may draw from the same depths of the aquifer in some areas.
The purposes of this report are to provide (1) a status assessment of the quality of groundwater pumped by domestic and state-registered small water systems (referred to as “domestic” groundwater in this report), (2) a limited understanding assessment of the natural and anthropogenic factors that affect groundwater quality and the sources and ages of groundwater used by domestic wells, and (3) a comparative assessment of the groundwater resources used for domestic and public supply in the same area. A comprehensive understanding assessment was not included in this report because of the extensive understanding assessment provided in Izbicki and others (2023a) that used the MOBS dataset. A trends assessment is beyond the scope of this report.
The status assessment was designed to provide a statistically representative characterization of groundwater quality used for domestic supply at the study-area scale. A stratified, random, grid-based design was used to select wells for sampling and aggregate data for calculating aquifer-scale proportions for different water-quality constituents (Belitz and others, 2003, 2010, 2015). Aquifer-scale proportion refers to the areal proportion of the groundwater resource having a defined level of quality. To define classifications for groundwater quality for which to calculate aquifer-scale proportions, measured concentrations of water-quality constituents were compared to Federal and State regulatory and non-regulatory benchmarks (California State Water Resources Control Board Division of Drinking Water, 2022a,b,c; U.S. Environmental Protection Agency, 2018, 2019; Norman and others, 2018).These benchmarks are typically used to evaluate the quality of drinking water delivered by public-supply systems. Groundwater quality is defined in terms of relative concentrations, which is the ratio of the measured concentration to the benchmark level. The status assessment for domestic supply is based on data from 48 domestic wells sampled by the USGS for the MOBS study in January–May 2018 (Groover and others, 2019; Fram, 2020). In addition to these 48 “grid” wells, 11 “understanding” wells were sampled to provide additional data for understanding of processes that may affect groundwater quality. The understanding assessment in this report was limited to preliminary evaluation of sources and age of groundwater recharge to domestic wells using isotopic and age-dating tracers results, and brief discussions of factors that may affect the concentrations of selected constituents in the grid wells.
The comparative assessment of domestic- and public-supply aquifer systems is an evaluation of differences between the depth, groundwater age, and location characteristics of domestic and public-supply wells within the MOBS study unit and a comparison of water quality, as summarized by aquifer-scale proportions, in the groundwater resources used for domestic and public-supply in the two study areas. Aquifer-scale proportions for water-quality data from the public-supply wells were computed using the spatially weighted approach described by Belitz and others (2010) for the same grid cell networks used for the domestic well computations in the “Status and Understanding Assessments” section. The public-supply assessment used data from samples collected from 322 public-supply wells by the USGS (Mathany and Belitz, 2009; Jurgens and others, 2018; U.S. Geological Survey, 2022), or by water agencies for regulatory compliance sampling (California State Water Resources Control Board, 2019b).
Hydrogeologic Setting
MOBS is in the western part of the Mojave Desert and covers 3,400 square kilometers (km2) between 65 and 175 kilometers (km) northeast of Los Angeles in the Desert hydrogeologic province (fig. 1) described by Belitz and others (2003). The study unit includes the Upper, Middle, and Lower Mojave River Valley groundwater basins; the El Mirage Valley groundwater basin; and part of the Harper Valley groundwater basin (fig. 2; California Department of Water Resources, 2020). The Harper Valley groundwater basin was clipped to the extent of a regional groundwater flow model (Stamos and others, 2001) designed to model groundwater recharged from the Mojave River. Altitudes range between 550 and 1,190 meters (m), and precipitation ranges from 10 centimeters per year (cm/yr) near Barstow to 102 cm/yr (Stamos and others, 2001) in the higher altitudes of the San Bernardino and San Gabriel Mountains on the southern boundary of the study unit (fig. 2). Most precipitation in the study unit falls during winter months, and there is no summer monsoon season.
Land use in the study unit is primarily natural (undeveloped), and outside of a handful of cities, the area is sparsely populated. There are several large cities (population greater than 70,000) in the study unit, including Victorville, Hesperia, Apple Valley, and Barstow (fig. 2). Septic tanks in many parts of the study unit are responsible for substantial recharge to the water table compared to predevelopment (pre-1930) conditions (Stamos and others, 2001). Recent efforts have focused on converting some densely populated communities from septic tanks to centralized sewers (Mojave Water Agency, written comm., 2019). Two large wastewater-treatment plants in the study unit discharge treated wastewater to the Mojave River: (1) near the George Air Force Base (historical) and (2) near Barstow (fig. 2; Stamos and others, 2001).
MOBS is internally drained, with several ephemeral streams that flow from south to north. The Mojave River (fig. 2), the largest of these streams, extends about 180 km from the San Bernardino and San Gabriel Mountains south of Victorville through Afton Canyon (fig. 2) to the terminus of the river in Soda (dry) Lake northeast of the study unit (not shown; Thompson, 1929). The Mojave River typically is dry along most of its reach, flowing on average once every 5–7 years (Lines, 1996; Stamos and others, 2001), except where groundwater discharge maintains perennial streamflow near Victorville and at Afton Canyon (fig. 2). Groundwater recharge in the study unit occurs due to: (1) intermittent flows in the Mojave River, (2) precipitation in the San Bernardino and San Gabriel Mountains, which flows into the study area through local stream channels, (3) artificial recharge near Victorville, and (4) natural withdrawals from older storage (Stamos and others, 2001). There are no perennial streams in the study unit, and groundwater is the only dependable source of water supply. Groundwater is pumped from two aquifers: (1) a limited extent but highly permeable floodplain aquifer and (2) a widely available but relatively less permeable regional aquifer.
Bedrock in the study unit has been eroded through time and transported into structural basins to form alluvial aquifers, which are pumped for water supply. Bedrock composition varies substantially, and rock types include granitic rock, various types and grades of metamorphic rocks, including metasedimentary and metavolcanic rocks, and volcanic rock in the northeastern part (fig. 3; Dibblee, 1967; Jennings and others, 2010; Groover and Izbicki, 2019). The Pelona Schist (Ehlig, 1958, 1968; Dawson and Jacobson, 1989) is present in the San Gabriel Mountains south of the study unit. Alluvium eroded from the Pelona Schist is transported into the study unit as part of Sheep Creek fan (fig. 3) and forms much of the shallow regional aquifer in the El Mirage Valley groundwater basin (fig. 2). Data collected by Groover and Izbicki (2018a) indicate that traces of the Pelona Schist, which has higher concentrations of naturally occurring chromium in primary mineral grains compared to other rocks in much of the study unit, may be present in older deposits of the Mojave River (ancestral Mojave River deposits; fig. 3).
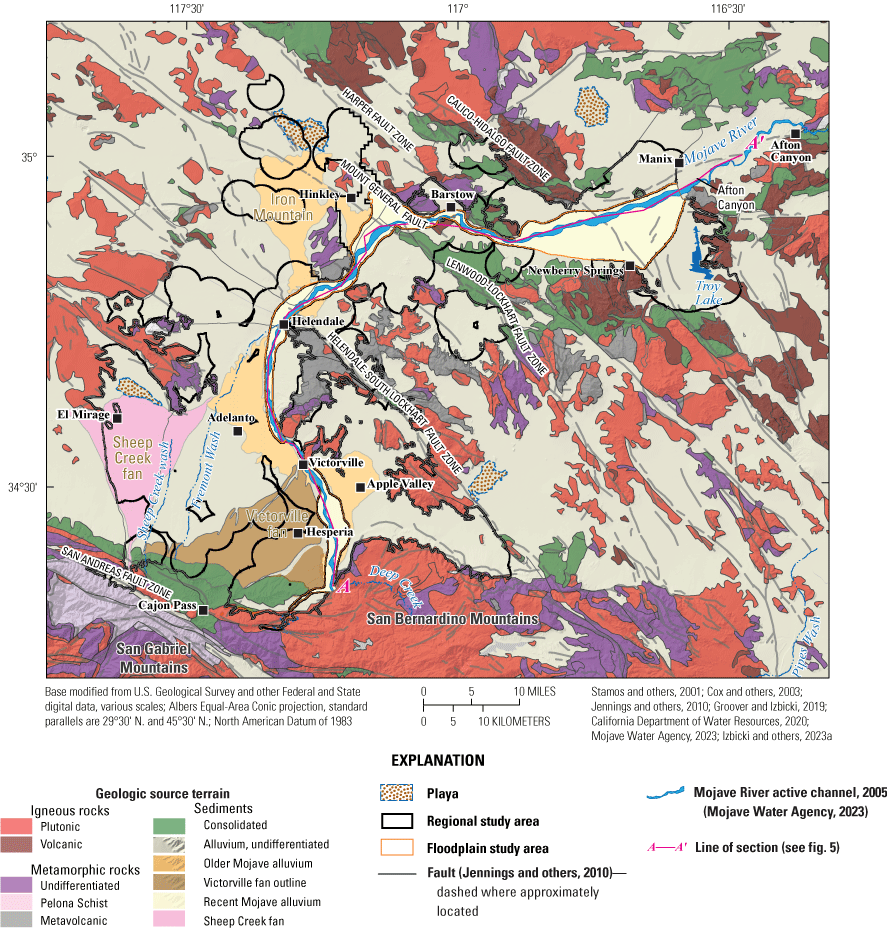
Simplified geologic map of the western Mojave Desert region showing the Mojave Basin Domestic-Supply Aquifer study unit, California Groundwater Ambient Monitoring and Assessment Priority Basin Project.
The most productive aquifer in the study unit is the floodplain aquifer, which is hydraulically connected to the Mojave River (Stamos and others, 2001; California Department of Water Resources, 2020). The floodplain aquifer is commonly between 0.8 to 2.0 km wide, assumed to be less than 60 m (200 feet) thick, and is underlain and surrounded by the regional aquifer (Stamos and others, 2001). The floodplain aquifer is composed of predominately course-grained granitic alluvium deposited by the Mojave River, interspersed with fine-grained overbank or lacustrine deposits (fig. 4; Huff and others, 2002; Cox and others, 2003). The depositional history of the floodplain aquifer is complex (Cox and others, 2003; Miller and others, 2018; Miller and others, 2020) and poorly understood in many areas. Before the onset of widespread pumping, water levels in much of the floodplain aquifer were near land surface, and groundwater discharge maintained perennial streamflow along some reaches of the Mojave River, especially upgradient from fault zones that impede groundwater flow (Thompson, 1929; Lines, 1996; Stamos and others, 2001). During present-day (2020) conditions, shallow, fine-grained deposits within the floodplain of the Mojave River between Adelanto and Helendale (fig. 2) limit infiltration of treated municipal wastewater discharges, which results in sustained streamflow throughout this zone (Lines, 1996).
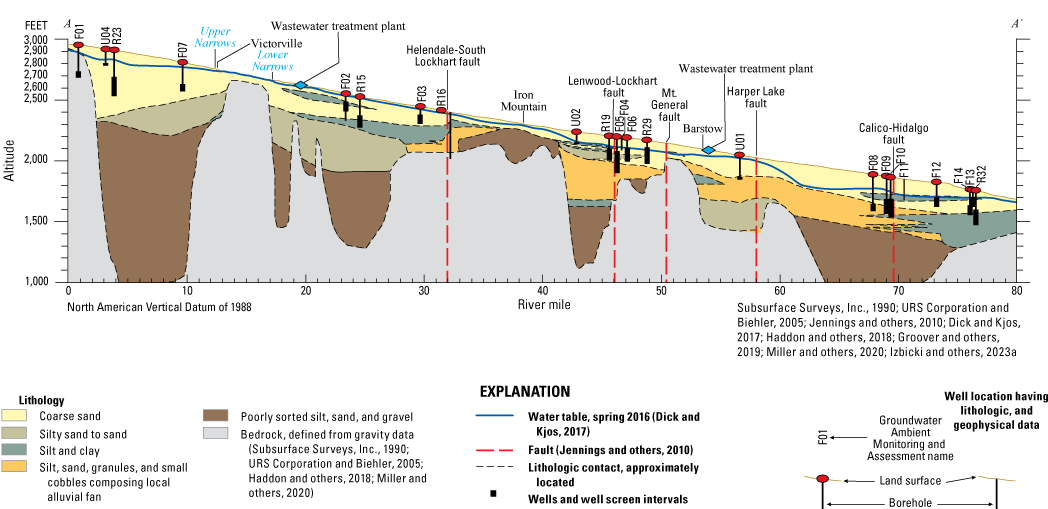
Geologic cross section underlying thalweg of the Mojave River, Mojave Basin Domestic-Supply Aquifer study unit, California Groundwater Ambient Monitoring and Assessment Program Priority Basin Project, January–May 2018.
The regional aquifer is composed of older Mojave River deposits (Pliocene to Pleistocene; Cox and others, 2003; Miller and others, 2018; Miller and others, 2020), fine-grained lacustrine deposits (Enzel and others, 2003), alluvium eroded from the San Bernardino Mountains, San Gabriel Mountains, local desert mountains, and undifferentiated basin-fill alluvium. In many areas, the thickness of the regional aquifer primarily is defined on the basis of regional gravity data (Subsurface Surveys, Inc., 1990; URS Corporation and Biehler, 2005; Surko, 2006; Haddon and others, 2018; Miller and others, 2020). Older Mojave River alluvium within the regional aquifer covers a large area between Cajon Pass in the southwest and Barstow (Cox and others, 2003). The regional aquifer includes the Victorville fan near Victorville (Meisling and Weldon, 1989). The Victorville fan was deposited by streams draining the San Bernardino and San Gabriel Mountains before the fan was beheaded by erosion from westward draining streams along the San Andreas fault zone. The Victorville fan contains material eroded from the Pelona Schist (Groover and Izbicki, 2019) and is considered part of the ancestral Mojave River deposits for the purposes of this study. The regional aquifer also includes the Sheep Creek fan west of the Victorville fan and areas away from the Mojave River. In many areas, the geologic contact between the floodplain aquifer and the regional aquifer is difficult to define.
MOBS is crossed by five major fault zones: (1) Helendale-South Lockhart, (2) Lenwood-Lockhart, (3) Mount General, (4) Harper, and (5) Calico-Hidalgo fault zones (figs. 3, 4). The fault zones formed in response to uplift of the Transverse Ranges and formation of the eastern California shear zone (Dokka and Travis, 1990; Miller, 2017). Some of these fault zones form partial barriers to groundwater flow where they cross the floodplain aquifer, causing vertical groundwater flow upgradient from the fault zones (Lines, 1996; Miller and others, 2018). The effects of the fault zones on groundwater flow in the regional aquifer are less known but may be similar to the effects in the floodplain aquifer.
Groundwater recharge to the floodplain aquifer is from infiltration of water from the Mojave River, and flow in the river is largely derived from winter precipitation near Cajon Pass in the San Gabriel and San Bernardino Mountains south of Victorville (Izbicki, 2004; Izbicki and Michel, 2004; Miller and others, 2018). Downstream reaches of the floodplain aquifer may receive some recharge by discharge from storage in the regional aquifer (Lines, 1996; Izbicki, 2004; Izbicki and Michel, 2004). Most of the groundwater recharge to the regional aquifer is from infiltration of water from streams other than the Mojave River that drain snowmelt and local precipitation from the San Bernardino and San Gabriel Mountains or other high-elevation areas surrounding the study unit (Izbicki, 2004, 2007; fig. 2). Some groundwater in the regional aquifer is thousands of years old and represents recharge during a wetter climate than currently exists in the region (Izbicki and Michel, 2004).
Groundwater flow in the floodplain aquifer generally follows the outline of the Mojave River floodplain along its course from the San Bernardino and San Gabriel Mountains to the terminus of the Mojave River at Soda (dry) Lake (not shown; Stamos and others, 2001; Izbicki, 2004; Izbicki and Michel, 2004). Some groundwater discharges from the floodplain aquifer into the regional aquifer and flows toward playa lake terminuses at Harper (dry) Lake, Coyote (dry) Lake, and Troy Lake (fig. 2), where before the onset of widespread pumping, wetland vegetation and artesian conditions were maintained (Thompson, 1929). Groundwater mixing occurs between the floodplain aquifer and the regional aquifer at bedrock constrictions near Victorville and Afton Canyon (fig. 4; Stamos and others, 2001; Izbicki, 2004). Additional groundwater mixing between the floodplain aquifer and the regional aquifer may occur at fault zones, which form partial barriers to flow in the floodplain aquifer at the margins of the floodplain aquifer because of hydraulic management of pumping and artificial recharge in the aquifer and the influence of pumping near the edges of the floodplain aquifer.
The study unit was initially divided into a floodplain study area that follows the modeled outline of the floodplain aquifer (Stamos and others, 2001) and a regional study area that includes the regional aquifer in the rest of the El Mirage, Upper Mojave River Valley, Middle Mojave River Vally, Lower Mojave River Valley, and clipped Harper Valley groundwater basins (fig. 2). The assessed part of the regional study area was limited to collective area within 3-km radius buffers drawn around locations of domestic wells (fig. 5; Groover and others, 2019). The floodplain study area was divided into 15 grid cells of 29 square kilometers (km2) each, whereas the regional study area was divided into 35 grid cells of 85 km2 each (fig. 5; table 1). All but three wells sampled in MOBS are completed in alluvium of the floodplain aquifer along the Mojave River or in the alluvium of the regional aquifer around and below the floodplain aquifer; the remaining three wells (R06, R20, and R21) are most likely completed in fractured bedrock beneath the alluvium in the regional study area.
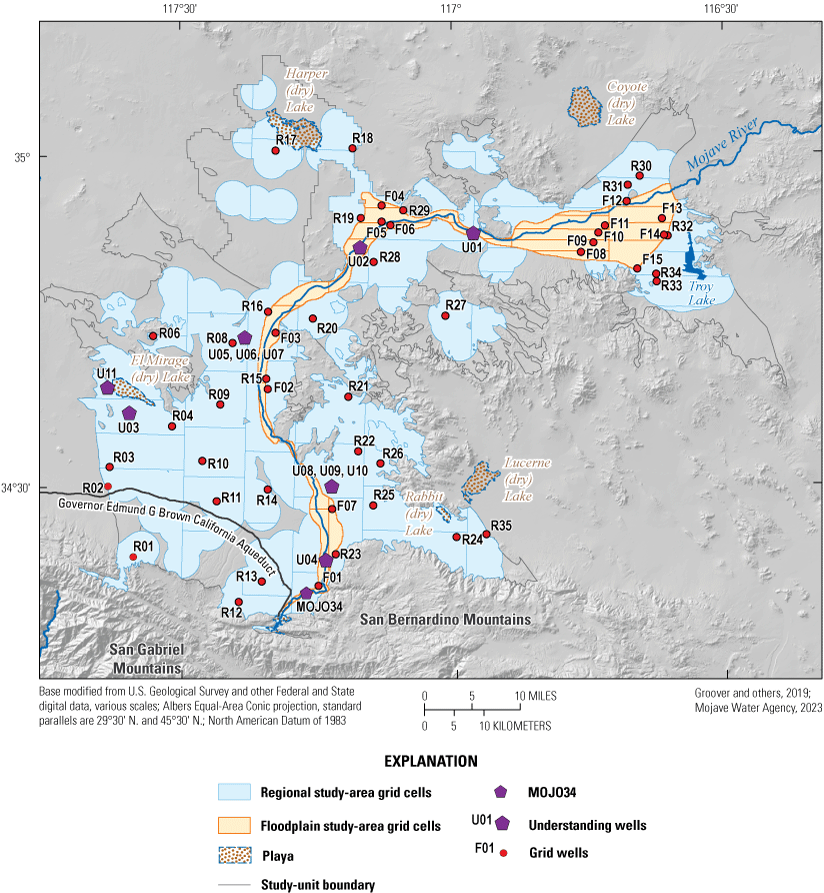
Study-area grid cells, grid wells, and understanding wells sampled in the Mojave Basin Domestic-Supply Aquifer assessment study unit, California Groundwater Ambient Monitoring and Assessment Priority Basin Project, January–May 2018.
Table 1.
Study areas with number of cells, grid wells, and understanding wells, Mojave Basin Domestic-Supply Aquifer study unit, California Groundwater Ambient Monitoring and Assessment Priority Basin Project, January–May 2018 (Groover and others, 2019).[km2, square kilometers]
Previous Investigations
Groundwater quality in the area was first described in reconnaissance by Thompson (1929) and was most recently described by Dawson and Belitz (2012), Metzger and others (2015), Wright and others (2015), and Izbicki and others (2023a). Concentrations of trace elements in regional groundwater in the study unit are controlled by silicate weathering, which is due to long contact times between groundwater and aquifer materials (Izbicki and others, 2008; Manning and others, 2015; Wright and others, 2015). Some recent work has linked naturally occurring trace elements in groundwater, such as chromium and vanadium, to weathering of minerals eroded and transported from rocks in upland drainages (Izbicki and others, 2008; Wright and Belitz, 2010). Regional and national-scale studies also have linked high concentrations of arsenic in groundwater to the geologic composition of aquifers, as well as to other geochemical factors such as pH and concentrations of competing ions (Welch and others, 1988; Welch and others, 2000; Bowell and others, 2014).
Groundwater in the floodplain aquifer generally has lower prevalence of high concentrations of total dissolved solids (TDS), trace elements, and nutrients compared to the regional aquifer (Dawson and Belitz, 2012; Metzger and others, 2015; Izbicki and others, 2023a71). Groundwater in the floodplain aquifer generally is young, has near-neutral pH, and is highly oxygenated (Metzger and others, 2015; Izbicki and others, 2023a). Groundwater in the regional aquifer also is oxygenated but, in contrast to the floodplain aquifer, generally is old (recharged as much as 20,000 years before present) and has alkaline pH that increases with distance from the floodplain aquifer and the mountain front (Izbicki, 2004; Izbicki and Michel, 2004; Metzger and others, 2015). Nitrate concentrations above the California State Water Resources Control Board Division of Drinking Water maximum contaminant level (MCL-CA) have been documented in the floodplain aquifer near Barstow (Lahontan Regional Water Quality Control Board, 2018), and moderate to high TDS (from 500 to more than 1,000 milligrams per liter, mg/L) concentrations have been documented in some areas of the floodplain aquifer (Metzger and others, 2015). Fewer data are available in the regional aquifer; however, trace element concentrations in groundwater generally are higher in the regional aquifer than in the floodplain aquifer and have been linked to higher natural abundances of easily weathered trace-element-bearing minerals in regional aquifer alluvium compared to the floodplain (Izbicki and others, 2008; Izbicki and others, 2023a) in some areas. Previous data regarding organic constituents are limited to the GAMA-PBP public-supply assessment study unit in the area (Mathany and Belitz, 2009; Dawson and Belitz, 2012).
The study unit includes four locations known to have point sources of contamination that may have the potential to affect shallow groundwater quality: (1) hexavalent chromium from natural sources near El Mirage (Izbicki, 2008; Izbicki and others, 2008; Izbicki and others, 2012); (2) hexavalent chromium from anthropogenic sources in Hinkley (Izbicki and others, 2023a; Izbicki, 2023); (3) volatile organic compounds (VOCs) at the George Air Force Base (historical) near Victorville (Air Force Civil Engineer Center, 2014); and (4) perchlorate from anthropogenic sources near Barstow (Lahontan Regional Water Quality Control Board, 2012; fig. 2). Nitrate derived from agricultural activities (dairy operations and crop fertilizers) and wastewater discharges near Adelanto and Barstow (fig. 2) also is of concern in the study unit (Izbicki, 2008; SCS Engineers, 2017; Lahontan Regional Water Quality Control Board, 2018). The sampling design for the GAMA-PBP is intended to characterize ambient groundwater quality at the study-area scale and not to characterize the extent of contamination from particular point sources (Belitz and others, 2003).
As part of the first phase of GAMA-PBP, the Mojave Basin Public-Supply study unit (MOJO) was sampled in 2008 (Mathany and Belitz, 2009). The MOJO study unit consisted of the Upper, Middle, and Lower Mojave River groundwater basins (fig. 2). The MOBS study unit also included part of the Harper Valley groundwater basin that forms a branch of the regional groundwater flow system related to the Mojave River (fig. 2; Stamos and others, 2001; Groover and others, 2019). The Harper Valley groundwater basin was included in the Borrego Valley, Central Desert, and Low-Use Basins of the Mojave and Sonoran Deserts public-supply study unit (Mathany and others, 2012; Parsons and others, 2014). The MOJO study unit was defined as a single study area and therefore used a single set of grid cells (not shown; Mathany and Belitz, 2009) rather than the separate grid cells defined for the regional and floodplain study areas of the MOBS study unit (fig. 2).
The MOJO study determined that overall, inorganic constituents with health-based benchmarks were present at concentrations above benchmarks in 28 percent of the study unit (Mathany and Belitz, 2009; Dawson and Belitz, 201228). In particular, arsenic, boron, fluoride, gross alpha-particle activity, molybdenum, strontium, and vanadium were detected at concentrations above health-based benchmarks (Mathany and Belitz, 2009). VOCs were not detected at concentrations greater than health-based benchmarks, but solvents were detected at concentrations greater than one-tenth of benchmark concentrations in 4 percent of the study unit (Dawson and Belitz, 2012). Factors that most strongly correlated with groundwater quality in the MOJO were the age and pH of groundwater and TDS concentrations (Dawson and Belitz, 2012; Wright and others, 2015).
Methods
This section describes the methods used for (1) defining groundwater quality using established benchmarks, (2) assembling the datasets used for the assessments and selecting constituents for evaluation in the assessments, and (3) calculating aquifer-scale proportions. Samples collected from MOBS grid wells followed protocols described by Mathany and Belitz (2009) and Groover and others (2019). Samples collected from MOBS understanding wells were collected following procedures described by Mathany and Belitz (2009) and U.S. Geological Survey (2015).
All published and quality-assured data collected for the GAMA-PBP are available through the USGS National Water Information System (NWIS) web interface (https://waterdata.usgs.gov/ca/nwis/; U.S. Geological Survey, 2022), the USGS GAMA-PBP web tool (https://ca.water.usgs.gov/projects/gama/water-quality-results/; Jurgens and others, 2018), and the SWRCB’s GAMA groundwater information system (https://gamagroundwater.waterboards.ca.gov/gama/gamamap/public/; California State Water Resources Control Board, 2019b). Data collected for MOBS also are available in tabulated format in Groover and others (2019; https://doi.org/10.5066/P9C7U6DW).
Groundwater Quality Defined as Relative Concentrations
Groundwater quality was categorized using relative concentrations, which are defined as the ratio of a constituent’s measured concentration in groundwater to the concentration of a regulatory or non-regulatory water-quality benchmark used to evaluate drinking-water quality. Relative concentrations can only be computed for constituents with water-quality benchmarks; therefore, water-quality constituents without benchmarks were not included in the status assessment. Using relative concentrations allows evaluation and inter-comparison of a wide array of organic and inorganic constituents at concentrations that often range several orders of magnitude (Toccalino and others, 2004; Rowe and others, 2007; Toccalino and Hopple, 2010).
Regulatory and non-regulatory benchmarks typically are used to evaluate treated drinking water distributed by public-supply systems. The use of water-quality benchmarks developed to meet the health- and aesthetic-based standards for public-supply sources provides context to evaluate domestic-supply sources for the purposes of this study. The water-quality constituents measured for this study were compared to benchmarks established by the U.S. Environmental Protection Agency (EPA), the California State Water Resources Control Board Division of Drinking Water (SWRCB-DDW), and the USGS. The benchmarks used for each constituent in this study were selected in the following order of priority:
-
1. Regulatory, human-health based maximum contaminant levels (MCLs) set by the SWRCB-DDW and EPA (MCL-CA and MCL-US, respectively), EPA action levels (AL), and SWRCB-DDW treatment technique levels (TT-CA; U.S. Environmental Protection Agency, 2018; California State Water Resources Control Board Division of Drinking Water, 2022a). An MCL benchmark is called MCL-US if the MCL-US and MCL-CA are the same value and MCL-CA if the MCL-CA is lower than the MCL-US or no MCL-US exists.
-
2. Aesthetic-based levels set by the SWRCB-DDW (secondary maximum contaminant levels, SMCL; California State Water Resources Control Board Division of Drinking Water, 2022b) were used. For constituents with recommended and upper SMCL levels, the values for the upper levels were used to calculate relative concentrations.
-
3. Non-regulatory, human-health based levels set by USGS, EPA, and SWRCB-DDW (in order of priority): U.S. Environmental Protection Agency lifetime health advisory levels (HAL-US) or SWRCB-DDW response levels (RL-CA), whichever is lower; U.S. Environmental Protection Agency human-health benchmarks for pesticides (HHBP-US); and USGS health-based screening levels (HBSLs; Norman and others, 2018; California State Water Resources Control Board Division of Drinking Water, 2022c; U.S. Environmental Protection Agency, 2018, 2019). The HHBP-US and HBSL benchmarks may have cancer and non-cancer thresholds, and the cancer threshold are presented as ranges. With the exception of hexavalent chromium, the lowest value was used. For hexavalent chromium the highest value, the noncancer HBSL of 20 micrograms per liter (µg/L), was used.
Relative concentrations were classified as low, moderate, or high categories for calculation of aquifer-scale proportions. Relative concentration values greater than 1.0 (constituent concentration or value greater than a benchmark) were defined as “high” for all constituents. For inorganic constituents (trace elements, nutrients, radiological constituents, and inorganic constituents with SMCL benchmarks), relative concentration values greater than 0.5 and less than or equal to 1.0 (constituent concentration or value is greater than one-half of the benchmark but less than the benchmark) were defined as “moderate” and relative concentration values less than or equal to 0.5 (constituent concentration or value is less than one-half the benchmark) were defined as “low.” For organic and special-interest constituents, relative concentration values greater than 0.1 and less than or equal to 1.0 were defined as “moderate,” and relative concentration values less than or equal to 0.1 were defined as “low.” Low relative concentrations of inorganic, organic, and special-interest constituents included non-detections and values less than moderate concentrations.
The “special-interest” class of constituents in GAMA-PBP studies has historically included constituents that the State of California was actively considering for an MCL-CA at the beginning of GAMA-PBP in 2003 (Belitz and others, 2003). Perchlorate is a trace inorganic compound and received an MCL-CA in 2007 (California State Water Resources Control Board, 2017). However, perchlorate is still classified as a constituent of special interest for the purposes of this study and is evaluated in a manner similar to the organic constituents for consistency with previous reports.
The SWRCB-DDW notification level (NL-CA) is a non-regulatory, health-based advisory level that is associated with the RL-CA and functions as an early warning indicator for certain contaminants without regulatory benchmarks (California State Water Resources Control Board Division of Drinking Water, 2022c). The NL-CA can range from 6 to 100 times less than the RL-CA and has a similar function to that of the low-to-moderate boundary in the relative concentration classification system described previously; therefore, if a constituent has an NL-CA, then the value of the NL-CA is used as the low-to-moderate threshold for the relative concentration classification instead of the benchmark multiplied by 0.1 (for organic constituents) or 0.5 (for inorganic constituents).
In this study, if the measured constituent concentration was greater than the NL-CA and less than or equal to a corresponding non-regulatory, health-based primary benchmark value (the RL-CA or HAL-US, whichever is lower), the constituent was considered present at a moderate relative concentration. Boron and vanadium were the only detected constituents with NL-CA values for which relative concentration thresholds were affected by this modification to the relative concentration classification system; for example, although the primary benchmark for boron is the HAL-US of 5,000 µg/L, the low-to-moderate concentration boundary is the NL-CA of 1,000 µg/L and not 2,500 µg/L (one-half the HAL-US).
Data Collected for Domestic-Supply Assessment
This report section describes methods used to select wells for the MOBS domestic-supply assessment, the scope of the water-quality data collected for the study, quality-control methods used for the water-quality results, and methods used for evaluation of groundwater-age tracer results. The selection of constituents for discussion in the status assessment is also described.
Grid Wells
Detailed descriptions of grid-cell delineation and well selection for MOBS are provided in Groover and others (2019). Briefly, each study area was divided into equal-area grid cells (table 1; fig. 5; Scott, 1990), and the objective was to sample one domestic well in each cell (“grid wells”). Because the purpose of the GAMA-PBP domestic aquifer studies is to evaluate groundwater resources used for domestic drinking-water supply, only areas in which domestic wells were likely to exist were included in the gridded area. Areas containing wells in the study unit were identified using locations of domestic wells with well-completion reports in the California Department of Water Resources online database (Stork and others, 2019; California Department of Water Resources, 2023b), listed in the records of the local water authority (Mojave Water Agency; written commun., October 2017), or catalogued in USGS NWIS (U.S. Geological Survey, 2022). To decrease the likelihood of targeting wells that were destroyed or nonfunctional because of declining water levels, wells from NWIS were limited to only wells that were sampled or had a water level measured since 1975, and wells from the well-completion report database were limited to only wells drilled since 1975. A 3-km buffer was drawn around the location of each domestic wells, and the collective areas inside the buffers were defined as the resources used by domestic wells in each study area and divided into grid cells. Areas outside those buffered areas but within the study-unit boundaries were excluded from the study. These criteria defined an area of 3,404 km2 (2,967 km2 for the regional study area and 437 km2 for the floodplain study area), out of the potential 4,680 km2 total area of MOBS (table 1; fig. 5).
Wells were selected from lists of candidate domestic wells in each grid cell. Priorities were given to wells registered with San Bernardino County (not shown) as a small-systems supply well (defined as serving fewer than 25 people and having between 5 and 14 service connections; California State Water Resources Control Board, 2015) and existing wells in NWIS to facilitate future analysis of water-quality trends as part of another phase of the GAMA-PBP. Wells that met study-area criteria were randomly sorted in each grid cell. If no small-systems or existing wells in NWIS were available in a grid cell, a randomly sorted list of well-completion reports was used to canvass wells in a grid cell.
A target list of candidate domestic wells was taken into the field, and door-to-door canvassing was done, beginning with the well nearest to a random point in the grid cell (to ensure random selection of wells). If the target list yielded no viable wells for which permission to sample could be obtained, other wells identified by door-to-door canvassing were considered if the well owner could provide documentation of the well depth. Grid wells were sampled in 48 of 50 grid cells (fig. 5). The USGS grid cells and grid wells were named with an alphanumeric Groundwater Ambient Monitoring and Assessment Program (GAMA) identification number, which contains information about the study area and grid cell (Groover and others, 2019). A prefix identifies the study area containing the grid, and a numeric suffix identifies the cell number of the well site (table 2); for example, the sampled well in cell 14 of the floodplain study area is referred to as “F14.” Similarly, status assessment wells in the regional study area are identified with a prefix of “R,” and understanding wells in the understanding assessment are identified with a prefix of “U” (table 2).
Table 2.
Nomenclature and well-construction information for grid and understanding wells sampled in the Mojave Basin Domestic-Supply Aquifer study unit, California Groundwater Ambient Monitoring and Assessment Priority Basin Project, January–May 2018.[Well construction data from Groover and others (2019). Well-construction information, in feet below land surface. Groundwater basin names: 6-40, Lower Mojave River Valley; 6-41, Middle Mojave River Valley; 6-42 Upper Mojave River Valley; 6-43, El Mirage Valley; 6-47, Harper Valley (California Department of Water Resources, 2020). Abbreviations: ft below LSD, feet below land-surface datum; USGS, U.S. Geological Survey; mm/dd/yyyy, month/day/year; E, estimated; na, not available]
Sites are identified by an abbreviated form of the Groundwater Ambient Monitoring and Assessment Program identification number assigned to the sites (Groover and others, 2019). The prefix "S8_MOBS_" has been dropped from the identification numbers for the floodplain and regional study area wells, and the prefix "S8_MOBSU_" has been dropped from the identification numbers for the understanding wells.
Samples collected from MOBS grid wells were analyzed for 364 constituents in a variety of constituent classes, including field parameters, inorganic constituents (major ions, nutrients, trace elements, including hexavalent chromium, and the special-interest constituent, perchlorate), radiological constituents, organic constituents (VOCs and pesticides), isotopic tracers, and microbial indicators. Collection procedures, analytical methods, and quality-control data for most constituent classes are described in Groover and others (2019) and pesticides are described in Fram (2020).
Understanding Wells
In addition to the water-quality data obtained from samples collected at grid wells, water-quality data were obtained from samples collected at 11 understanding wells, most of which were selected to represent potential endmembers of groundwater affected by anthropogenic sources of nitrate. Although an understanding assessment is not included in this report, the understanding well data are presented so that they will be available for future studies. Ten of the understanding well sites were monitoring wells: U01, located near a wastewater treatment plant discharge; U02, located downgradient from agricultural fields; U03, located in a perched waterbody beneath a field treated with dairy wastewater (Izbicki, 2008); U04, located near the headwaters of the Mojave River in the floodplain aquifer; U05-U07, three wells in a nested monitoring site in a sparsely populated part of the regional study area; and U08-U10, three wells from a nested monitoring site used to monitor septic discharges (Schroeder and others, 1993; fig. 5). Understanding well U11, a domestic well completed in carbonate bedrock northwest of Victorville (fig. 5), was initially intended to be part of the grid well dataset, but the well could not sustainably pump at a rate required to provide a sufficient quantity of sampled water for analysis of all grid well constituent classes. Radiological constituents were added to GAMA-PBP trends sampling of public-supply well MOJO-34 (fig. 5; Mathany and Belitz, 2009).
Selection of Constituents for Status Assessment
Although 364 water-quality constituents were analyzed in samples from MOBS grid wells, only a subset of these constituents is discussed in this report. All constituents with benchmarks were considered in the status assessment, and constituents were selected for discussion if they were present at high or moderate relative concentrations in a sample from any grid well or if they were an organic or special-interest constituent with a detection frequency of 10 percent or greater, regardless of concentration. Three microbial indicators (total coliform bacteria, Escherichia coli, and Enterococci) were only tested for “presence” or “absence” and were discussed in the status assessment if they were present in at least one well in the study areas. These criteria identified 17 inorganic, 1 special interest, 1 organic, and 2 microbial indicator constituents for discussion in the status assessment (table 3). An additional 20 organic constituents and 21 inorganic constituents were detected but either did not have benchmarks, were only present at low relative concentrations for inorganic constituents, or were only present at low relative concentrations and had detection frequencies of less than 10 percent for organic constituents (table 4). Aquifer-scale proportions are not presented for water-quality constituents only detected at low relative concentrations because the proportion of the aquifer having low concentration or nondetection for those constituents was 100 percent. Tabulation of all constituents analyzed in groundwater samples collected in MOBS is provided in Groover and others (2019) and Fram (2020).
Table 3.
Benchmark types, values, and reporting limits for inorganic constituents that were detected at high or moderate concentrations or for organic and special-interest constituents that were detected in 10 percent or more of grid well samples, Mojave Basin Domestic-Supply Aquifer study unit, California Groundwater Ambient Monitoring and Assessment Priority Basin Project, January–May 2018.[A measured concentration greater than the benchmark concentration is defined as a high relative concentration. For most constituents, a measured concentration greater than or equal to half (inorganic constituents) or one-tenth (organic and special-interest constituents) the benchmark concentration but less than the benchmark concentration is defined as a moderate relative concentration. Exceptions are described in the footnotes. Benchmark type: MCL-US, EPA maximum contaminant level; HAL-US, EPA lifetime health advisory level; HBSL, USGS health-based screening level; MCL-CA, SWRCB-DDW maximum contaminant level; RL-CA, SWRCB-DDW response level; SMCL-CA, SWRCB-DDW secondary maximum contaminant level; NL-CA, SWRCB-DDW notification level; TT-CA, SWRCB-DDW treatment technique level. Benchmark units: µg/L, micrograms per liter; mg/L, milligrams per liter; pCi/L, picocuries per liter. Other abbreviations: EPA, U.S. Environmental Protection Agency; SWRCB-DDW, California State Water Resources Control Board Division of Drinking Water; USGS, U.S. Geological Survey; na, not available]
Maximum contaminant level benchmarks are listed as MCL-US when the MCL-US and MCL-CA are identical, and as MCL-CA when the MCL-CA is lower than the MCL-US or no MCL-US exists. Sources of benchmarks: California State Water Resources Control Board Division of Drinking Water (2022a, 2022b, 2022c2122), U.S. Environmental Protection Agency (2018), Norman and others (2018).
Reporting levels and reporting level types are listed in Groover and others (2019). For inorganic constituents, the reporting level is the minimum concentration that is reported as a detection. For organic constituents, the reporting level may either be the minimum concentration that is reported as a detection or the reporting level applied to nondetections (generally twice the minimum concentration that is reported as a detection; Foreman and others, 2021).
The low-to-moderate concentration boundary for boron is the SWRCB-DDW notification level (NL-CA) of 1,000 µg/L and not half of the listed benchmark.
The low-to-moderate concentration boundary for vanadium is the SWRCB-DDW notification level (NL-CA) of 50 µg/L and not half of the listed benchmark.
Adjusted gross alpha particle activity is computed by subtracting the measured uranium activity from the measured gross alpha particle activity.
Because perchlorate is classified as a special-interest constituent, the low-to-moderate concentration boundary for perchlorate is one-tenth of the MCL-CA, rather than one-half.
The MCL-US benchmark for trihalomethanes is for the sum of trichloromethane, bromodichloromethane, dibromochloromethane, and tribromomethane.
Determination of violations of the benchmarks for microbial constituents requires repeat sampling (California State Water Resources Control Board, 2019c), which was not done for this study. The TT-CA for Enterococci is part of the California Ground Water Rule which incorporates the text of the Federal Ground Water Rule (§64430 in California State Water Resources Control Board Division of Drinking Water, 2022a).
Table 4.
Benchmark types, values, and reporting limits for constituents that were detected in grid wells only at low relative concentrations or were detected and did not have benchmarks, and for organic constituents, were detected in less than 10 percent of grid wells, Mojave Basin Domestic-Supply Aquifer study unit, California Groundwater Ambient Monitoring and Assessment Priority Basin Project, January–May 2018.[A measured concentration greater than the benchmark concentration is defined as a high relative concentration. For most constituents, a measured concentration greater than or equal to half (inorganic constituents) or one-tenth (organic and special-interest constituents) the benchmark concentration but less than the benchmark concentration is defined as a moderate relative concentration. Exceptions are described in the footnotes. Benchmark type: MCL-CA, SWRCB-DDW maximum contaminant level; MCL-US, EPA maximum contaminant level; AL-US, EPA action level; SMCL-CA, SWRCB-DDW secondary maximum contaminant level; HAL-US, EPA lifetime health advisory level; HHBP, EPA human-health benchmark for pesticides; None, no benchmark available. Benchmark units: µg/L, micrograms per liter; mg/L, milligrams per liter; pCi/L, picocuries per liter; mg/L as CaCO3, mg/L as calcium carbonate; ng/L, nanograms per liter. Other abbreviations: SWRCB-DDW, California State Water Resources Control Board Division of Drinking Water; EPA, U.S. Environmental Protection Agency; USGS, U.S. Geological Survey; na, not available]
Maximum contaminant level benchmarks are listed as MCL-US when the MCL-US and MCL-CA are identical and as MCL-CA when the MCL-CA is lower than the MCL-US or no MCL-US exists. Sources of benchmarks: California State Water Resources Control Board Division of Drinking Water (2022a, 2022b, 2022c2122); Norman and others (2018); U.S. Environmental Protection Agency (2018, 2019134).
Reporting levels and reporting level types are listed in Groover and others (2019). For inorganic constituents, the reporting level is the minimum concentration that is reported as a detection. For organic constituents, the reporting level may either be the minimum concentration that is reported as a detection, or the reporting level applied to nondetections (generally twice the minimum concentration that is reported as a detection; Foreman and others, 2021).
Age-Dating and Geochemical Tracers
The radiological isotopes of hydrogen (tritium) and carbon (carbon-14) can be used to determine the age (time since recharge or isolation from the atmosphere) of groundwater, help locate sources of recharge, and help identify geologic controls on the movement of groundwater (Clark and Fritz, 1997). Tritium and carbon-14 are naturally occurring but also were produced in large quantities to the atmosphere beginning in 1952 because of the atmospheric testing of nuclear weapons. In this report, tritium is used to identify presence of modern groundwater, water recharged since approximately 1952, and carbon-14 is used to estimate the age of pre-modern groundwater.
Use of tritium as a tracer of young groundwater is complicated because the Mojave River did not flow during much of the 1950s and 1960s (see hydrograph for USGS streamgage 10262500; U.S. Geological Survey, 2022), which indicates that water with the large tritium excess from nuclear testing is largely missing from the aquifer (Izbicki and Michel, 2004; Warden and others, 2023). Nevertheless, tritium does provide some indicator of the age of groundwater pumped by domestic and public-supply wells. Lindsey and others (2019) used tritium alone to classify groundwater samples into three age categories: (1) pre-modern, (2) mixed, and (3) modern. Following the method of Lindsey and others (2019), samples with tritium activities less than 0.13 tritium units (TU) for samples collected in 2018 and less than 0.23 TU for samples collected in 2008 were classified as pre-modern, samples with tritium activities greater than 0.86 TU for samples collected in 2018 and greater than 1.52 TU for samples collected in 2008 are classified as modern, and all other samples are classified as mixed. However, samples classified as pre-modern may contain a small fraction of modern water, and samples classified as modern may contain a small fraction of pre-modern water.
Carbon-14 activities are used to determine the age of groundwater ranging from recent to 30,000 years before present (Clark and Fritz, 1997). For this study, carbon-14 activities were not corrected for geochemical reactions or mixing that may have removed or added carbon as groundwater moved from the point of recharge to the aquifer locations where the water was sampled. Uncorrected carbon-14 ages are useful for qualitative comparisons between samples (Wright and others, 2015). Izbicki and Michel (2004) found that corrected carbon-14 ages for samples from the Mojave River groundwater basin were 0 to 2,500 years younger than the uncorrected carbon-14 ages. Uncorrected carbon-14 ages were estimated using the standard equation for radioactive decay (Clark and Fritz, 1997).An initial carbon-14 activity () value of 84 percent modern carbon (pmC) was assumed following Izbicki and Michel (2004). Samples with carbon-14 activities greater than 84 pmC were assumed to be dominated by modern recharge, and no attempt was made to estimate carbon-14 age. Unadjusted carbon-14 ages in this report (table 5) are used for relative comparison of groundwater ages between wells.
Table 5.
Selected water-quality data, geochemical and age-dating tracer results, septic tank densities, and inferred aquifer sources for samples from grid and understanding wells, Mojave Basin Domestic Aquifer study unit, California Groundwater Ambient Monitoring and Assessment Program Priority Basin Project, January–May 2018[Water-quality data and measured tracer data available from Groover and others (2019) and U.S. Geological Survey (2022). Aquifer sources: Classification into floodplain or regional aquifer source is based on well location (fig. 5) and water stable isotope data. Regional aquifer source is separated into north and south at approximately the latitude of El Mirage (dry) Lake (fig. 5). Wells located in the regional study area, but with stable isotope compositions consistent with the floodplain aquifer are classified as floodplain, inferred. Wells in Lower Mojave River Valley (fig. 5) with aquifer source of floodplain or floodplain, inferred are at the end of the floodplain in the study unit. Understanding wells considered to be affected by nitrate source endmembers are labeled with those sources: wastewater treatment plant (wwtp) discharge, septic tank (septic) discharge, recharge beneath field with dairy waste application (dairy waste), or agricultural irrigation (ag) recharge. Water-type classification based on Piper (1944) and Landon and others (2010), reported as "major cations : major anions": Ca, calcium; Na, sodium; Mg, magnesium; HCO3, bicarbonate; SO4, sulfate; Cl, chloride; mixed, either no dominant cation or no dominant anion. Other abbreviations: >, less than; TU, tritium units; pmC, percent modern Carbon, mg/L, milligrams per liter; tanks/km2, density of septic tanks in tanks per square kilometer within a 500-meter radius of the site; na, not available]
Tritium activities reported with an "R" remark code in Groover and others (2019) are reported as nondetections less than the maximum value reported with an "R" code. Tritium activities in pCi/L in Groover and others (2019) have been converted to tritium activities in TU.
Carbon-14 activities reported in Groover and others (2019) in percent modern have been converted to Carbon-14 activities in percent modern Carbon (Plummer and others, 2004).
Uncorrected carbon-14 ages were computed using the standard equation for radioactive decay (Clark and Fritz, 1997), assuming an initial carbon-14 activity of 84 pmC (Izbicki and Michel, 2004). Ages are not computed for samples with uncorrected carbon-14 activities greater than 84 pmC; these samples are defined as "Modern" age.
Mean septic tank density within a 500-meter radius of the well computed from U.S. Census Bureau (1992).
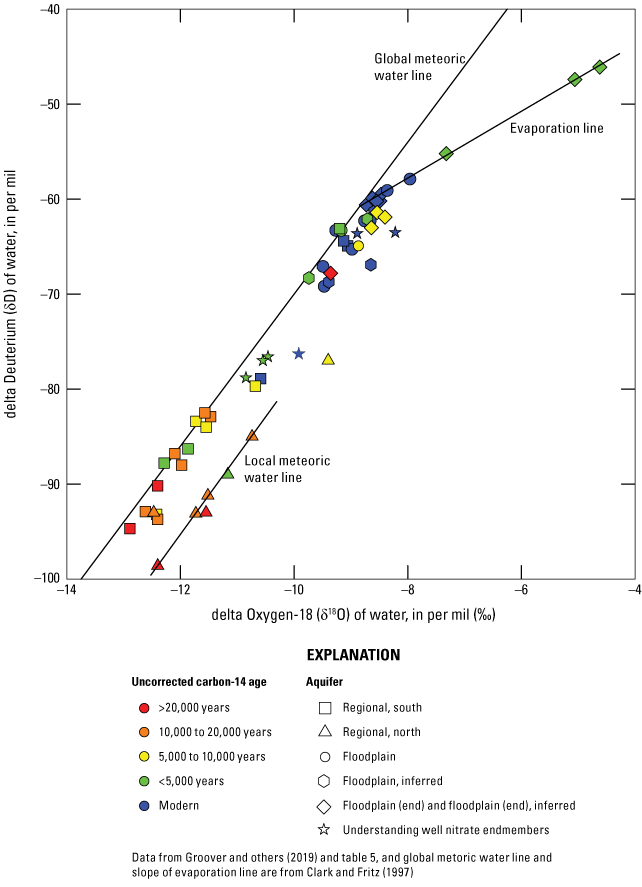
Water stable isotope values of delta oxygen-18 (δ18O-H2O) and delta deuterium (δD-H2O) and uncorrected carbon-14 ages from grid and understanding wells, Mojave Basin Domestic-Supply Aquifer study unit, California Groundwater Ambient Monitoring and Assessment Priority Basin Project, January–May 2018. Abbreviations: >, greater than; <, less than.
Isotope tracers used in this report included the stable isotopic ratios of oxygen (δ18O-H2O) and hydrogen (deuterium, or δD) in water, and the isotopic ratio of strontium-87 to strontium-86 (87Sr/86Sr) in dissolved strontium. Stable isotope ratios in water are report in Groover and others (2019), and strontium isotope date are available in NWIS (U.S. Geological Survey, 2022); both are also listed in table 5 for convenience.
The major-ion compositions of MOBS samples were categorized into different water types on a Piper diagram (Piper, 1944; Landon and others, 2010; table 5). The Piper diagram was plotted using the Piper plot macro in SigmaPlot 14.5 (Systat Software, Inc., 2022).
Quality-Control Samples and Quality Assurance
In addition to collection of environmental samples, several types of quality-control samples were collected. Collection and evaluation of quality-control samples, in addition to strict sample collection, processing, and analysis procedures, comprised the quality-assurance program for the MOBS study.
Quality-control samples collected in coordination with environmental samples from grid wells in MOBS included blank, replicate, and spike samples (spike samples are water samples spiked with known amounts of organic constituents). Quality-control samples for grid wells were collected following procedures described by Mathany and Belitz (2009). Groover and others (2019) discussed quality-assurance data for inorganics and VOC data specific to MOBS, whereas Bennett (2020) evaluated study reporting levels for trace-element data that included MOBS wells. Fram (2020) discussed quality assurance of pesticide sample data, including data collected for MOBS. Quality-control samples for understanding wells included pump blanks collected before field sampling, a field pump blank collected between two sample sites, and a field replicate sample (all collected following procedures described by U.S. Geological Survey, 2015).
Calculation of Aquifer-Scale Proportions for the Domestic Supply Assessment
A grid-based statistical approach was used to calculate the areal proportion of the floodplain and regional aquifer study areas in MOBS having high, moderate, and low relative concentrations for selected water-quality constituents or classes of constituents (“aquifer-scale proportions”; Belitz and others, 2010). Non-detections were included in the low relative concentration class. Aquifer-scale proportions were calculated for individual water-quality constituents, and for classes of constituents. The computations for classes of constituents used the highest relative concentration for any constituent in the class to represent the class. Aquifer-scale proportions for high relative concentrations were calculated as the percentage of grid wells in a study area having high relative concentrations for a given constituent (equation [eq.] 1):
whereis the aquifer-scale proportion for high relative concentrations in the study area,
is the number of grid wells in the study area with a high relative concentration value for a given water-quality constituent, and
is the number of grid wells in the study area that have data for a given water-quality constituent.
Aquifer-scale proportions for moderate relative concentrations, detections of organic constituents at any concentration, and presence of microbial indicators were calculated similarly by replacing terms using the superscript “high” in eq. 1 with terms using the superscripts “moderate,” “detection,” or “present,” respectively.
Compilation of Data and Calculation of Aquifer-Scale Proportions for Public-Supply Wells
The results from the GAMA-PBP public-supply study unit in the Mojave region in 2008 (MOJO; Dawson and Belitz, 2012) could not be compared directly to the results from this study; therefore, groundwater quality in public-supply wells was reassessed for this study. The 2008 study did not include inorganic, isotopic, and age-dating constituents for all sampled wells, and it was designed with one grid-cell network (Mathany and Belitz, 2009; Dawson and Belitz, 2012) rather than the two grid-cell networks used in this study (floodplain and regional study areas; fig. 5). For MOJO grid cells in which the well sampled by the GAMA-PBP was not analyzed for inorganic constituents, Dawson and Belitz (2012) randomly selected one public-supply well with data in the SWRCB-DDW database for samples collected during 2005–08 to represent each grid cell. They used the resulting dataset of one well per cell to calculate aquifer-scale proportions for the groundwater resource used for public supply with moderate and high relative constituent concentrations and constituent classes.
For this study, water quality in groundwater resources used for public supply in the floodplain and regional study areas was reassessed using the same grid-cell networks as used for the MOBS study and using a larger dataset to represent the public-supply wells. Water-quality data for public-supply wells were compiled from the following sources: (1) wells in the SWRCB-DDW database located in MOBS grid cells and having data for samples collected between 2008 and 2018 (California State Water Resources Control Board, 2019b); (2) GAMA-PBP data collected between 2008 and 2018; and (3) all public-supply wells sampled by USGS projects other than the GAMA-PBP between 2008 and 2018 (U.S. Geological Survey, 2022). The GAMA-PBP data included samples collected during the original assessment in 2008 for MOJO grid wells and MOJO understanding wells MOJOU-01 and MOJOU-06 (Mathany and Belitz, 2009), samples collected from a subset of MOJO grid wells in 2011 and 2018 for monitoring of groundwater-quality trends (Jurgens and others, 2018; U.S. Geological Survey, 2022), and samples collected from well LUBU-03 (Wright and others, 2015). Reassessment with the larger dataset of public-supply wells was necessary because the MOJO grid wells were located in only 10 of 15 floodplain study area grid cells and 18 of 33 regional study area grid cells, and this coverage was considered insufficient for representation of the entire study area. Expanding the dataset to include wells sampled by other USGS projects and wells with data in the SWRCB-DDW dataset increased the coverage to up to 13 of 15 floodplain study area grid cells and up to 24 of 33 regional study area grid cells.
Datasets were checked for duplicate wells by comparing USGS site identifiers between the NWIS (U.S. Geological Survey, 2022) and GAMA-PBP (Jurgens and others, 2018) databases and by comparing public-supply well codes compiled in the USGS datasets (U.S. Geological Survey, 2022; Jurgens and others, 2018; field not publicly available) to those in the SWRCB-DDW dataset (California State Water Resources Control Board, 2019b). Public-supply wells were assigned to MOBS grid cells based on the latitudes and longitudes provided with the data; no additional verification of locations was done for this study. If wells had location information from USGS and SWRCB-DDW, the USGS location was used.
Many of the 322 public-supply wells located in the MOBS grid cells were sampled more than once for some constituents during 2008–18. For each constituent at each well, the data from the sample collected closest to the midpoint of the sampling period for the corresponding domestic-supply assessment (that is, the midpoint of sampling from January–May 2018 for the MOBS study) was selected. This method prioritized selection of samples measured as close in time as possible to the domestic-supply assessment, without excluding wells for which only considerably older or more recent data were available.
Some adjustments to inorganic constituent parameters from the SWRCB-DDW dataset (California State Water Resources Control Board, 2019b) were done to compare the data with those collected by the USGS (U.S. Geological Survey, 2022; Jurgens and others, 2018). These adjustments included the following: converting nitrate concentrations to nitrate as nitrogen concentrations, calculating adjusted gross alpha-particle activity (following procedures described in Groover and others, 2019), converting specific conductance values to TDS concentrations for wells without TDS data, and reviewing the data for inconsistencies in reported units and removing results with uncertain reporting units. For all inorganic constituents, except the special-interest constituent perchlorate, the reporting levels used in the SWRCB-DDW dataset had concentrations below the boundary between concentrations classified as moderate and low relative concentrations; thus, aquifer-scale proportions computed for the combined public-supply well dataset were directly comparable to those computed from the MOBS grid well dataset. The reporting level for perchlorate in the SWRCB-DDW dataset is 4 µg/L; therefore, the aquifer-scale proportions for moderate relative concentrations of perchlorate in public-supply wells are minimum values.
The reporting levels for organic constituents in the SWRCB-DDW dataset are generally several orders of magnitude higher than the reporting levels for the same constituents in the GAMA-PBP dataset (Landon and others, 2010). The combined SWRCB-DDW and GAMA-PBP dataset was re-censored to the most common SWRCB-DDW reporting level for each constituent. Only organic constituents analyzed for both the MOJO and MOBS GAMA-PBP studies, and for which data are commonly compiled in the SWRCB-DDW dataset, were included in the compilation. Because of the large number of VOCs analyzed but not detected, the compilation for VOCs was further limited to only those reported as detected in at least one sample in any of the data sources. The only pesticides detected in MOJO wells at concentrations greater than a SWRCB-DDW reporting level were metolachlor and dieldrin (Mathany and Belitz, 2009), but neither were analyzed during the MOBS study; therefore, metolachlor and dieldrin were not included in the combined public-supply well dataset. A total of 208 public-supply wells had data for either simazine or atrazine or both, and all results were nondetections relative to the SWRCB-DDW reporting levels Simazine and atrazine were reported as detected at low concentrations by Mathany and Belitz (2009), but the concentrations were below the SWRCB-DDW reporting levels.
The number of public-supply wells per cell varied from 1 to 32, and to reduce spatial bias caused by this uneven distribution of wells per cell, aquifer-scale proportions for the public-supply data were computed for the selected constituents and constituent classes using spatially weighted calculations to decluster the data (eq. 2; Isaaks and Srivastava, 1989; Belitz and others, 2010) in each study area. The spatially weighted method for calculating aquifer-scale proportions was used because the objective was to determine proportions on an areal basis for comparison with the results from the domestic well assessment. If spatial weighting were not used, cells with greater numbers of wells would contribute more than cells with fewer wells to the computed proportions.
whereis the high relative concentration aquifer-scale proportion for the study area,
is the number of wells in a particular cell () of the study area with a high relative concentration value for a given water-quality constituent,
Wc
is the number of wells in a particular cell () in the study area with data for a given water-quality constituent,
N
is the number of grid cells in the study area with at least one well with data for a given water-quality constituent.
This approach calculates the proportion of wells in each grid cell with high relative concentration groundwater for a given water-quality constituent and then averages these proportions across all cells with data in the study-area grid network. Spatially weighted aquifer-scale proportions for moderate relative concentrations were calculated similarly. Spatially weighted aquifer-scale proportions for low relative concentrations of constituents or constituent classes were not calculated for the public-supply dataset because of the differences in reporting levels between data obtained from USGS (U.S. Geological Survey, 2022) and SWRCB-DDW (California State Water Resources Control Board, 2019b).
Status and Understanding Assessments
The discussion of the status and understanding assessment for groundwater quality in MOBS is divided into three parts: (1) description of the sources and age of groundwater used for domestic drinking water supplies, (2) results for inorganic and special-interest constituents, and (3) results for organic constituents and microbial indicators. Results for aquifer-scale proportion calculations are presented for individual constituents and constituent classes that were detected in a grid well at moderate or high relative concentrations or had detection frequencies greater than 10 percent in either study area for organic or special-interest constituents. Brief understanding assessments are presented for selected constituents. Because the MOBS domestic well dataset consists of one well per grid cell, the aquifer-scale proportion of moderate or high concentrations of a constituent in a study area is the same value as the detection frequency of moderate or high concentrations of the constituent in the grid wells in that study area (eq. 1).
Sources and Age of Groundwater used for Domestic Drinking Supplies
Previous studies in the area have shown the primary source of groundwater recharge to the floodplain aquifer is from infiltration of streamflow from the Mojave River that originated as winter precipitation near Cajon Pass (fig. 2; Lines, 1996; Stamos and others, 2001; Izbicki and Michel, 2004). This source of recharge is identifiable using stable isotopes of water (Izbicki, 2004). Air masses that contribute precipitation near Cajon Pass have not been uplifted over the higher mountains; therefore, precipitation condenses at lower altitude and warmer temperature than precipitation in the surrounding San Gabriel and San Bernardino Mountains, creating a distinctive isotopically heavy signature with δ18O-H2O of approximately −10 to −8 per mil (fig. 6; Izbicki, 2004). Other sources of recharge to the floodplain aquifer are (1) discharge from regional wastewater treatment plants serving the Victorville and Barstow areas, (2) septic discharge and irrigation return in rural and agricultural area along the floodplain aquifer, and (3) managed recharge of imported water from the Governor Edmund G Brown California Aqueduct in spreading areas located on the floodplain (Lines, 1996; Stamos and others, 2001; Izbicki and Michel, 2004).
The regional aquifer surrounds and underlies the floodplain aquifer. The regional aquifer is primarily recharged by infiltration of intermittent streamflow from precipitation in the San Gabriel and San Bernardino Mountains on the south side of the study area and in the desert mountain ranges on the west, north, and east sides of the study area (Izbicki, 2004). Recharge to the regional aquifer is less than recharge to the floodplain aquifer during present-day (2020) climatic conditions. Recharge from intermittent streams other than the Mojave River is distinguishable from recharge from the Mojave River using water stable isotopes. In general, groundwater in the regional aquifer has lighter (more negative) stable isotopic compositions than groundwater in the floodplain aquifer because the runoff is from precipitation that condensed at higher elevations in the mountains than the elevation of Cajon Pass, or because the recharge is from precipitation in the past when the climate was considerably wetter and cooler than the current climate (Izbicki, 2004; Izbicki and Michel, 2004). Much of the groundwater in the regional aquifer corresponding to the MOBS regional study area is old (recharged more than 10,000 years before present; Kulongoski and others, 2003; Izbicki, 2004; Izbicki and Michel, 2004; Wright and others, 2015; fig. 6). Groundwater pumping in the regional aquifer exceeds groundwater recharge resulting in water level decline (Hardt, 1971).
Stable isotope data and location were used to identify whether wells were likely pumping groundwater from the floodplain or regional aquifer. This classification by geochemical characteristics may not be the same as the original assignment of the wells to the floodplain or regional study area. The boundary between the floodplain and regional study areas was based on the estimated extent of the floodplain aquifer from Stamos and others (2001) and may not correspond exactly to the hydrologic boundaries at the locations and depths of individual wells. All floodplain study area wells had δ18O-H2O values greater than −10 per mil, consistent with pumping groundwater from the floodplain aquifer that receives recharge from the Mojave River (table 5; fig. 6; Izbicki, 2004). Five regional study area wells with δ18O-H2O values greater than −10 per mil and locations less than 400 meters from the boundary between the floodplain and regional study areas (R15, R16, R19, R23, and R29) were assumed to be pumping groundwater from the floodplain aquifer. Five regional study area wells near the eastern end of the Lower Mojave groundwater basin that had δ18O-H2O greater than −10 per mil (R30, R31, R32, R33, R34) were assumed to be pumping groundwater recharged to the regional aquifer from the floodplain aquifer (table 5; Hardt, 1971; Stamos and others, 2001; Izbicki, 2004). Three regional study area wells with δ18O-H2O values greater than −10 per mil and locations near the San Gabriel Mountains and more than 6 kilometers west of the Mojave River (R12, R13, and R14) were assumed to be pumping groundwater from the regional aquifer, despite their stable isotope compositions, because of recharge from intermittent streams on the flanks of the San Bernardino and San Gabriel Mountains (Izbicki, 2007).
The stable isotopes of hydrogen and oxygen in water and groundwater ages from domestic wells sampled for MOBS (fig. 6) show patterns similar to those found in previous studies of groundwater in the Mojave groundwater basins (Izbicki, 2004; Izbicki and Michel, 2004; Metzger and others, 2015). Groundwater in the floodplain aquifer mostly has modern carbon-14 ages (blue circles in fig. 6). A few wells in the floodplain aquifer between Victorville and Barstow have uncorrected carbon-14 ages up to 2,600 years old (F03, R15, R29). Groundwater from the floodplain aquifer that has recharged into the regional aquifer in the Lower Mojave River Valley groundwater basin at the eastern end of the study unit ranges in age from modern to greater than 20,000 years old, demonstrating the long flow paths and low amounts of recharge in this area (Izbicki, 2004; Izbicki and Michel, 2004). Groundwater from three wells (F13, F14, R32) at the eastern end of the Lower Mojave River Valley groundwater basin have stable isotope compositions on an evaporation line extending from the global meteoric water line near the composition of unevaporated groundwater from Lower Mojave River Valley groundwater basin (Izbicki, 2004). Izbicki (2004) used the stable isotopes to also distinguish groundwater derived from wastewater discharge and from imported water, but the MOBS dataset has too few samples to distinguish contributions from those endmembers to the floodplain aquifer groundwater samples.
Groundwater in the regional aquifer has two distinct stable isotopic trends (fig. 6). Most samples have stable isotopic compositions on the global meteoric water line (Clark and Fritz, 1997) between δ18O-H2O of −13 to −10 per mil, and a subset of samples form a parallel line offset to the right of the global line. Samples on the global meteoric water line are located in the southern part of the study unit and are recharged by runoff derived from precipitation on the San Gabriel and San Bernardino Mountains (Izbicki, 2004). Samples on the offset line are located farther away from the San Gabriel and San Bernardino Mountains and are likely recharged by runoff from the mountainous areas on the north, east, and west sides of the study unit (Izbicki, 2004). This offset line defines a local meteoric water line for precipitation formed under different climatic conditions that precipitation that lies along the global meteoric water line (Clark and Fritz, 1997; Izbicki, 2004). Most of the wells in the regional aquifer have groundwater with uncorrected carbon-14 ages of 5,000 to greater than 20,000 years. Most of the wells with younger groundwater are located close to the primary source of recharge, the San Gabriel and San Bernardino Mountains. Groundwater in the regional aquifer with δ18O-H2O lighter than −11 per mil is generally more than 10,000 years old (fig. 6). These light isotopic values are lighter than most current precipitation in the mountains around the study unit and indicate recharge from precipitation in a climate regime that was wetter and colder than the current climate (Izbicki, 2004). Well R18 near Hinkley has stable isotopic composition between the Mojave River and the local meteoric water line and may indicate evaporation of ancestral Mojave River water rather than locally derived recharge (Izbicki and others, 2023b).
Inorganic and Special-Interest Constituents
Of the 42 inorganic and special-interest constituents analyzed by the GAMA-PBP, 38 were detected in samples from one or more MOBS grid wells (tables 3, 4; Groover and others, 2019). Of the 38 detected constituents, 12 constituents with health-based benchmarks and 5 constituents with secondary maximum contaminant level benchmarks were detected at moderate to high relative concentrations (table 3; fig. 7). The remaining 21 inorganic constituents detected in grid wells (Groover and others, 2019) were either present only at low relative concentrations or did not have established benchmarks for comparison (table 4).
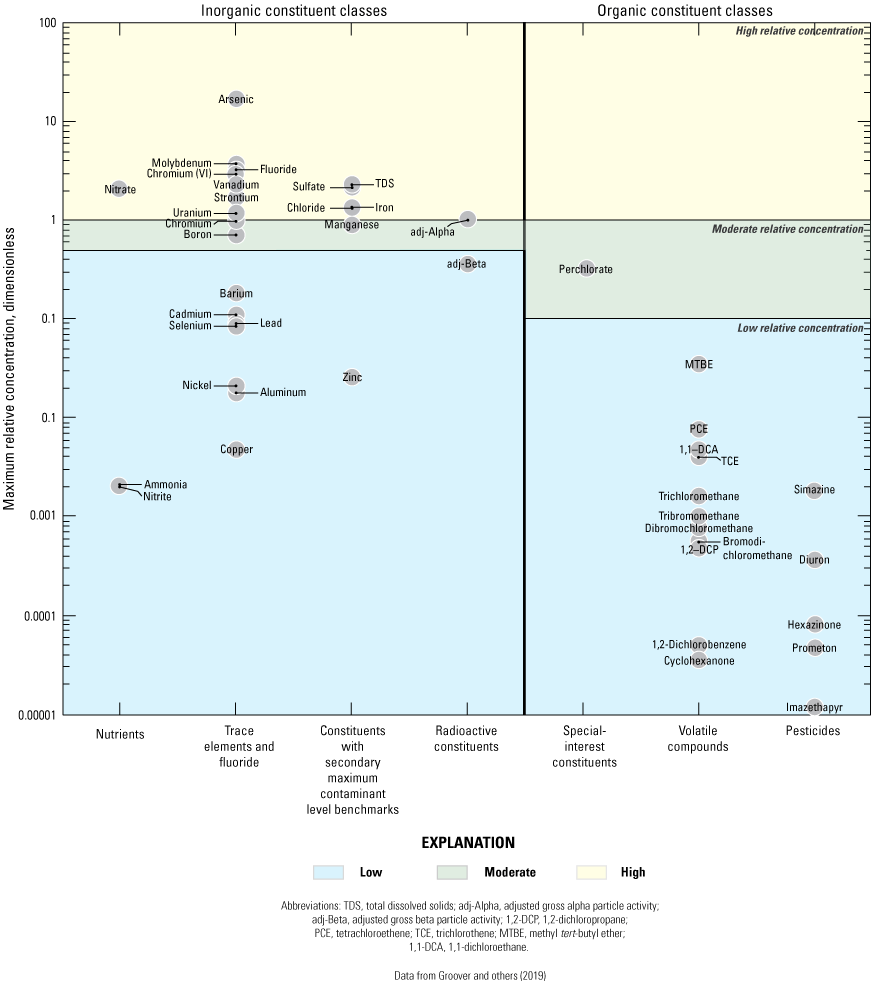
Maximum relative concentrations of inorganic and organic constituents detected in grid wells by constituent class, Mojave Basin Domestic-Supply Aquifer study unit, California Groundwater Ambient Monitoring and Assessment Program Priority Basin Project, January–May 2018 (Groover and others, 2019).
High relative concentrations of inorganic constituents with health-based benchmarks were more prevalent in the regional study area than in the floodplain study area: 58 percent of the regional study area had high concentrations of one or more constituent compared to 13 percent of the floodplain study area (table 6). The inorganic constituents with MCL benchmarks detected at high relative concentrations in the regional study area were arsenic, chromium, fluoride, adjusted gross alpha, uranium, and nitrate; only arsenic was also detected at high relative concentrations in the floodplain study area (table 7). The inorganic constituents with non-regulatory health-based benchmarks detected at high concentrations in the regional study area were hexavalent chromium, molybdenum, and strontium; none were detected at high relative concentrations in the floodplain study area.
One or more inorganic constituents with SMCL benchmarks were present at high concentrations in 15 and 6.7 percent of the regional and floodplain study areas, respectively, and moderate concentrations of one or more SMCL constituents were present in 27 percent of both study areas (table 6). The inorganic constituents with SMCL benchmarks detected at high relative concentrations in the regional study area were TDS, chloride, sulfate, and iron; only TDS and sulfate were detected at high relative concentrations in the floodplain study area (table 7).
Table 6.
Detection frequencies and aquifer-scale proportions for constituent classes detected in domestic-supply and public-supply wells in the Mojave Basin Domestic-Supply Aquifer study unit study area, California Groundwater Ambient Monitoring and Assessment Priority Basin Project.[Domestic wells: Aquifer-scale proportions calculated for dataset of 15 grid wells in the floodplain study area and 33 in the regional study area (eq. 1; data from Groover and others, 2019). Public-supply wells: Aquifer-scale proportions calculated using spatial weighting (eq. 2; data from California State Water Resources Control Board, 2019b; U.S. Geological Survey, 2022). Percentages detected are not provided for organic constituents in the public-supply well study areas because the reporting limits for data from California State Water Resources Control Board Division of Drinking Water (SWRCB-DDW) are not the same as reporting limits for data from the U.S. Geological Survey. Abbreviations: SMCL, secondary maximum contaminant level; nc, not calculated; na, not available]
For domestic assessment, floodplain study area has 15 wells and 15 cells, and regional study area has 33 wells and 33 cells. All wells have data for all constituents.
Any inorganic constituent with a health-based benchmark includes trace elements, radiological constituents, nutrients, and the special-interest constituent perchlorate. For public-supply assessment, only wells with data for nitrate and arsenic are included in the calculation of aquifer-scale proportion for concentration categories for any inorganic constituent with a health-based benchmark.
Table 7.
Detection frequencies and aquifer-scale proportions in domestic wells and public-supply wells for constituents detected at moderate and high relative concentrations in domestic wells, Mojave Basin Domestic-Supply Aquifer study unit, California Groundwater Ambient Monitoring and Assessment Priority Basin Project, January–May 2018.[Domestic wells: Aquifer-scale proportions calculated for dataset of 15 grid wells in the floodplain study area and 33 in the regional study area (eq. 1; data from Groover and others, 2019). Public-supply wells: Aquifer-scale proportions calculated using spatial weighting (eq. 2; data from California State Water Resources Control Board, 2019b; U.S. Geological Survey, 2022). Percentages detected are not provided for organic constituent classes because the reporting limits for data from the California State Water Resources Control Board Division of Drinking Water (SWRCB-DDW) are not the same as reporting limits for data from the U.S. Geological Survey (USGS). Abbreviations: SMCL, secondary maximum contaminant level; nc, not calculated; na, not available]
The study-area scale aquifer-scale proportion results presented in table 6 cannot be combined to yield the study-unit scale results presented in Groover and Goldrath (2019). The study-unit level results in Groover and Goldrath (2019) were computed as detection frequencies of high and moderate relative concentrations of constituents or classes of constituents in the MOBS grid well dataset, without regard to study area. However, detection frequency in the 48 grid wells is not equivalent to aquifer-scale proportion at the study unit level because the grid cells in the floodplain and regional study areas are not the same size. The aquifer-scale proportion for high relative concentrations of a constituent or class of constituents at the study-unit scale would be computed as the area-weighted combination of the aquifer-scale proportions at the study-area scale (see appendix B of Fram and Belitz, 2012). Study-unit scale aquifer-scale proportion results are not presented in this report.
Arsenic
Arsenic was the constituent most commonly detected at concentrations above benchmark concentration (table 6). Arsenic was detected at concentrations above the MCL-US of 10 µg/L in 36 percent of the regional study area and in 13 percent of the floodplain study area (table 6; fig. 8A). Concentrations in MOBS grid wells ranged from less the reporting limit of 0.05–172 µg/L (Groover and others, 2019). Most domestic wells with high or moderate relative concentrations of arsenic were distributed in the regional aquifer north of the approximate latitude of Victorville (R04, R08, R10, R17, R18, R20, R22, R28; fig. 8A). These wells generally have uncorrected carbon-14 ages greater than 10,000 years, pH values greater than 7.8, and oxic or suboxic oxidation-reduction (redox) conditions (table 5; Groover and others, 2019). Elevated arsenic concentrations in oxic, alkaline, old groundwater in the regional aquifer indicate increased solubility of arsenic in alkaline conditions resulting from silicate weathering along long groundwater flow paths (Welch and others, 1988, 2000; Izbicki and Michel, 2004; Bowell and others, 2014; Wright and others, 2015; Izbicki and others, 2023a). Some domestic wells with high or moderate relative concentrations of arsenic were located near the terminus of the floodplain aquifer east of Barstow (F13, F15, R30, R31, R33, R34; fig. 8A). These wells generally have uncorrected carbon-14 ages between 5,000 and 10,000 years, pH greater than 7.8, and alkaline suboxic or oxic conditions. The stable isotopic compositions of these groundwater samples are similar to the stable isotopic composition of modern groundwater in the floodplain aquifer (table 5; Izbicki, 2004). Low rates of groundwater recharge and depletion of the modern groundwater in the floodplain aquifer by pumping may result in domestic wells extracting groundwater that is older than normally considered representative of the floodplain aquifer.
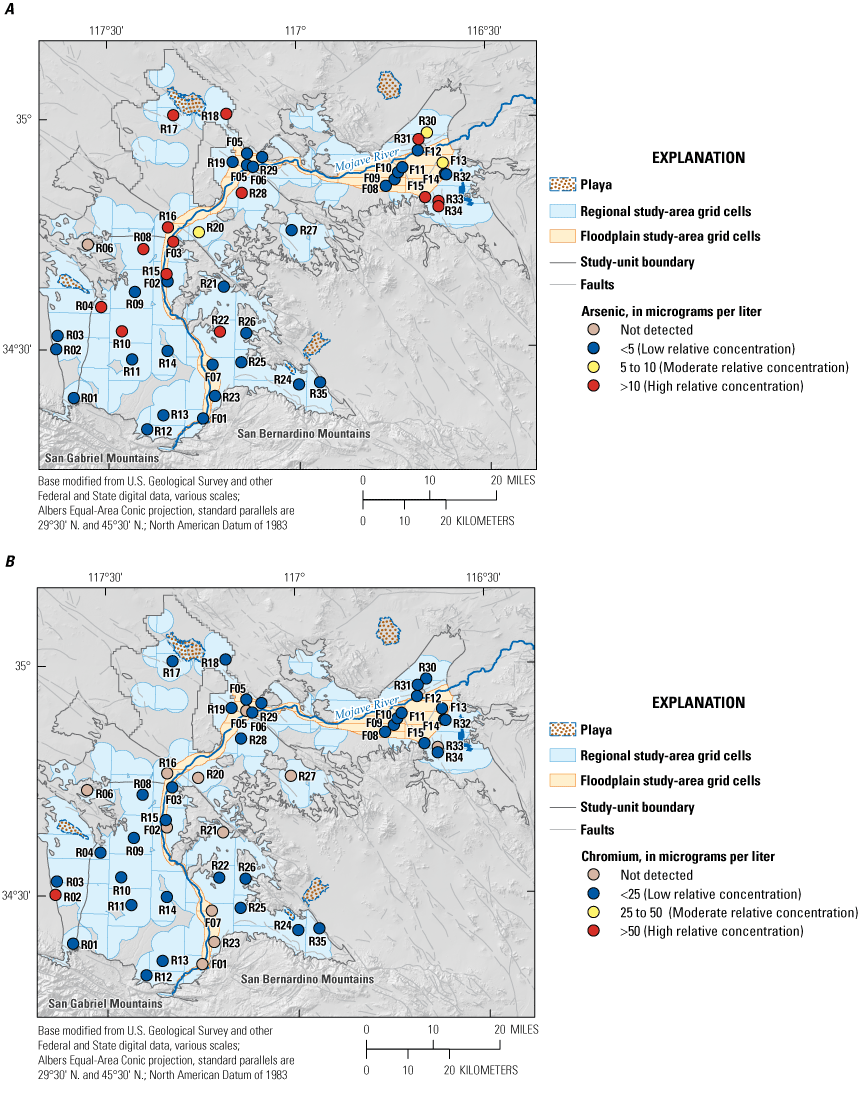
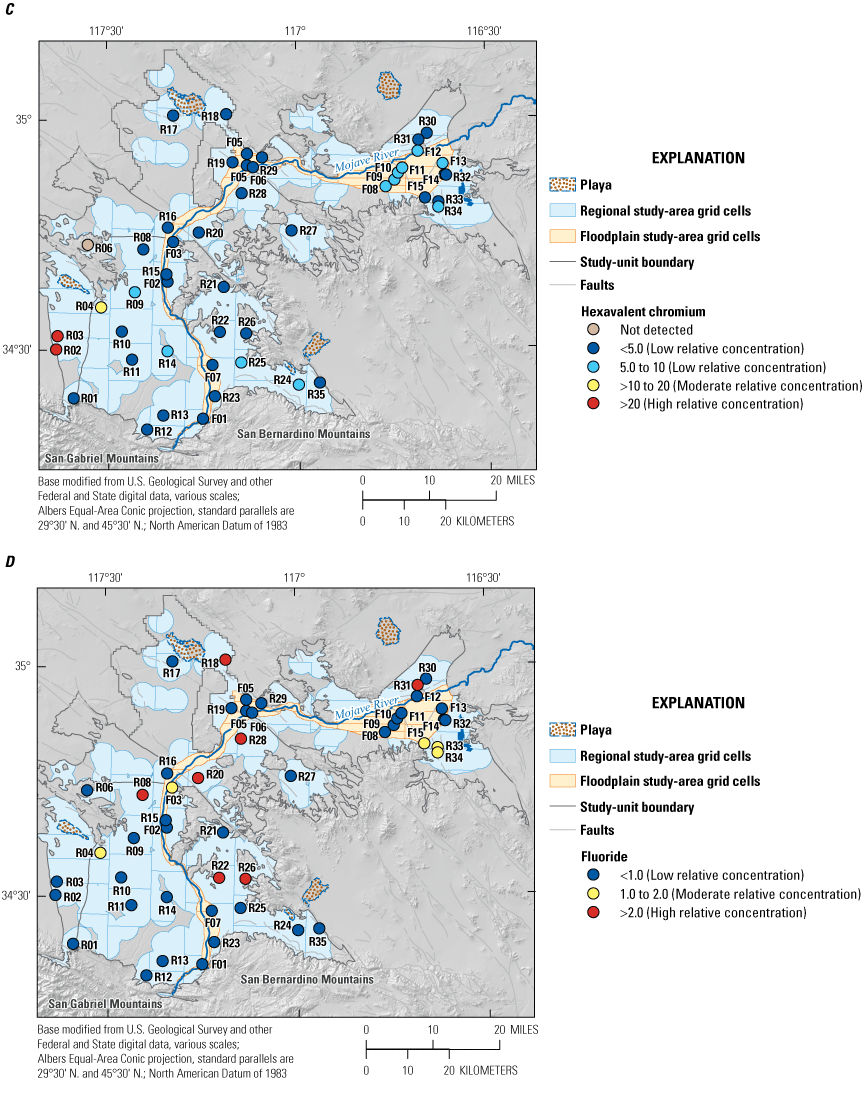
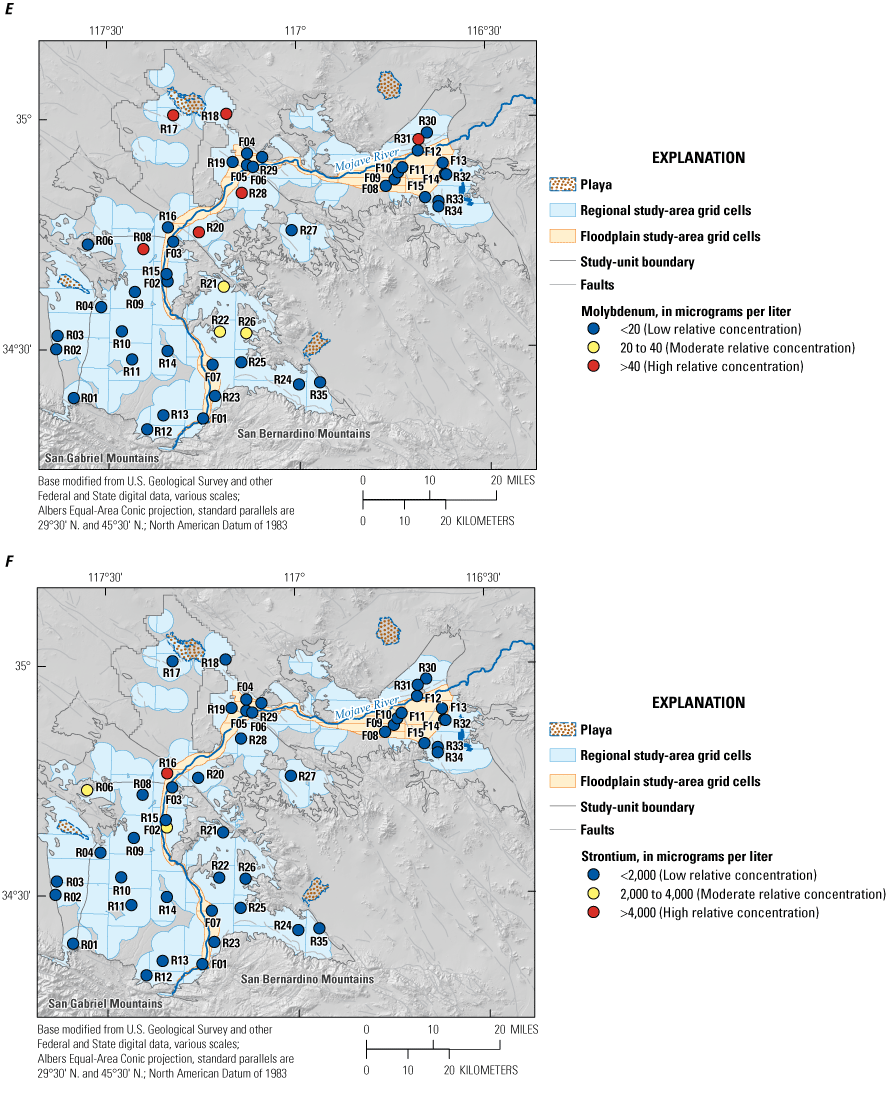
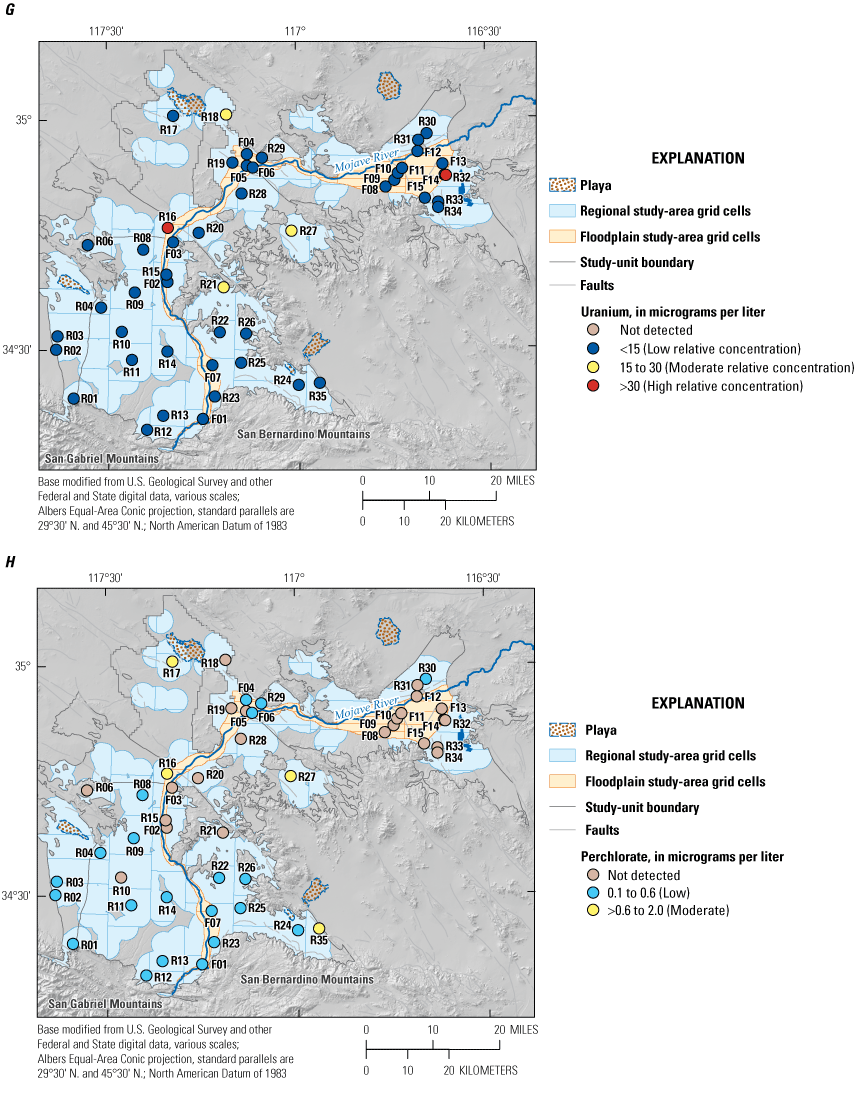
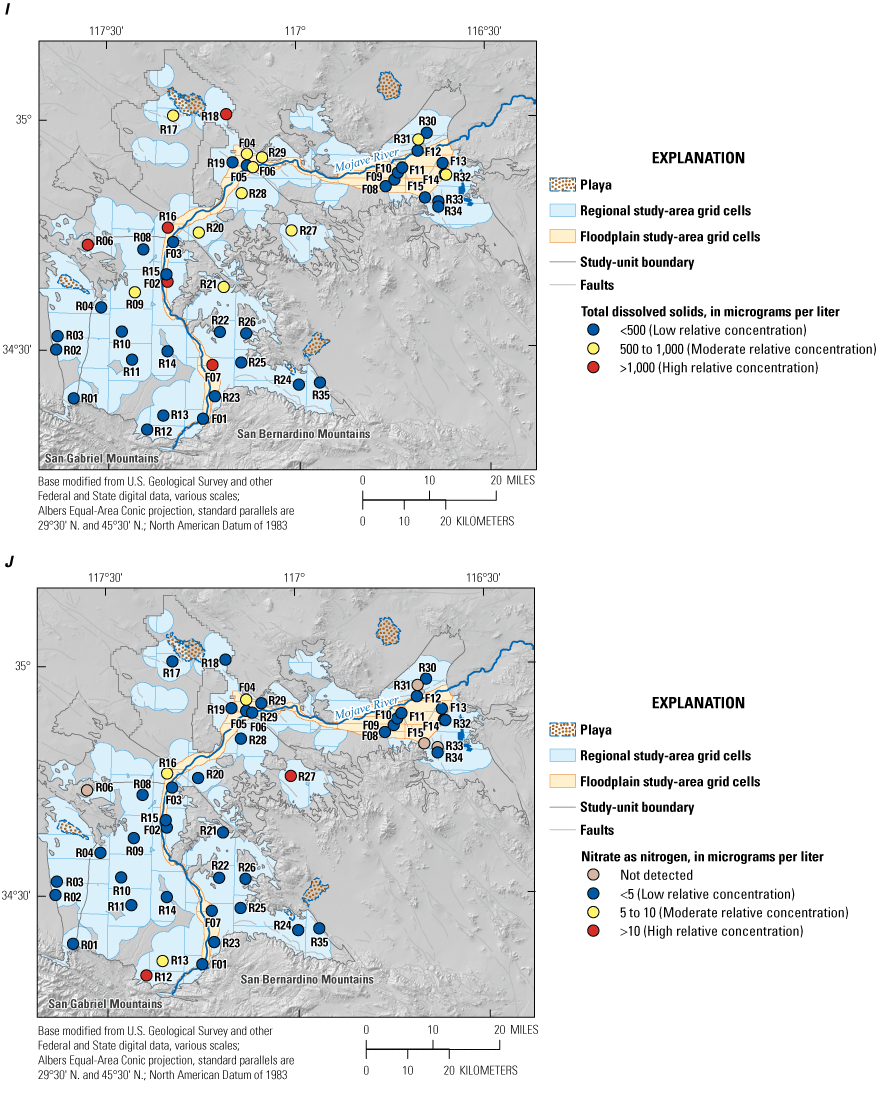
Concentrations of selected inorganic constituents in domestic-supply wells, Mojave Basin Domestic-Supply Aquifer study unit, California Groundwater Ambient Monitoring Assessment Priority Basin Project, January–May 2018. A, arsenic; B, chromium; C, hexavalent chromium; D, fluoride; E, molybdenum; F, strontium; G, uranium; H, perchlorate; I, total dissolved solids; and J, nitrate (as nitrogen; Detection limits are listed in table 3). Abbreviations: <, less than; >, greater than.
A few wells with high or moderate relative concentrations of arsenic were located in or adjacent to the floodplain aquifer between Adelanto and Helendale (F03, R15, R16; fig. 8A). These wells generally had younger ages (modern to 1,800 years) compared to other wells with high or moderate arsenic concentrations (table 5). Izbicki and Michel (2004) and Izbicki and others (2023a) also identified greater prevalence of elevated arsenic concentrations in groundwater containing modern recharge in this segment of the floodplain aquifer and suggested that redox changes related to recharge of treated wastewater in this segment may increase arsenic solubility.
Chromium and Hexavalent Chromium
Both chromium and hexavalent chromium were analyzed for this study. Hexavalent chromium comprises nearly all the chromium in groundwater used for drinking water supplies in California (Izbicki and others, 2015a). Chromium was detected at high relative concentrations in 3.0 percent of the regional study area, and hexavalent chromium was detected at high and moderate concentrations in 6.1 and 3.0 percent, respectively, of the regional study area. Neither chromium nor hexavalent chromium were detected at high or moderate concentrations in the floodplain study area (table 7). All detections at moderate and high relative concentrations were in wells located in the El Mirage Valley groundwater basin west of Victorville (figs. 8B, 8C). High dissolved chromium concentrations in groundwater in El Mirage Valley groundwater basin were observed by Izbicki and others (2008), who attributed much of the chromium to natural sources in sediment eroded from the Pelona Schist to the south. Groover and Izbicki (2019) determined high chromium concentrations in sediment in the area were related to geologic sources. Groover and Izbicki (2019) observed traces of Pelona Schist minerals in alluvium deposited by the ancestral Mojave River (fig. 3) and indicated that chromium concentrations in sediment increase with the age of the deposit.
Although all wells in the floodplain aquifer had low relative concentrations of hexavalent chromium, the segment near the terminus east of Barstow has concentrations of 5–9 µg/L compared to concentrations less than 5 µg/L in the rest of the floodplain aquifer (fig. 8C). Chromium concentrations in surficial alluvium did not increase along the active channel of the Mojave River (Groover and Izbicki, 2019); however, the floodplain aquifer is thought to be thinner east of Barstow (Cyr and others, 2015). Domestic wells may penetrate older, finer-grained sediments beneath the modern floodplain aquifer (fig. 4). The slightly elevated hexavalent chromium concentrations may indicate local geologic sources of sediment (Izbicki and others, 2023a), such as the presence of volcanic rock to the north and south (fig. 3).
Domestic wells sampled near Hinkley for this study (R19, F04, and F05) all had low relative concentrations of hexavalent chromium, and 70 domestic wells in the Hinkley area sampled by Izbicki and others (2023b) also all had low relative concentrations of hexavalent chromium. The Hinkley Valley contains an area where hexavalent chromium concentrations are elevated above natural background levels due to contamination from the Pacific Gas and Electric Company (PG&E) compressor site in Hinkley (Izbicki, 2023). The apparent contradiction between presence of a well-known contamination plume and absence of moderate and high relative concentrations of hexavalent chromium in the sampled domestic wells illustrates an important feature of the GAMA-PBP design. A feature like the Hinkley hexavalent chromium contamination site that only covers a small proportion of the assessed area has a low probability of being sampled in this stratified, randomized design (Belitz and others, 2010).
Other Trace Elements
High relative concentrations of fluoride were detected in 21 percent of the regional study area and were not detected in the floodplain study area (fig. 8D; table 7). The Desert hydrogeologic province has greater abundance of groundwater with high relative concentrations of fluoride because of the presence of source rocks, primarily sediments derived from granitic rocks, containing fluoride-bearing minerals and geochemical conditions conducive to fluoride solubility (Edmunds and Smedley, 2013; Wright and others, 2015; McMahon and others, 2020; Harkness and Jurgens, 2022).
Molybdenum was detected at high relative concentrations, greater than the HAL-US of 40 µg/L, in 18 percent of the regional study area; there were no detections at high or moderate relative concentrations in the floodplain study area (fig. 8E). High and moderate relative concentrations of molybdenum generally were associated with alkaline pH values, oxic conditions, and uncorrected carbon-14 ages greater than 5,000 years (R08, R17, R18, R20, R21, R22, R26, R28, R31; table 5), as found in a previous study of public-supply wells in the Mojave groundwater basin (Wright and others, 2015). These conditions favor dissolution or desorption of molybdenum from molybdenum-bearing aquifer materials (Smedley and Kinniburgh, 2017). Molybdenum concentrations generally are greatest in organic-rich sedimentary rocks and in granitic rocks (Smedley and Kinniburgh, 2017). In MOBS, high and moderate relative concentrations of molybdenum commonly occur in wells that also have high or moderate relative concentrations of fluoride (compare fig. 8D to fig. 8E; Groover and others, 2019), indicating that alluvium derived from granitic rocks common in the surrounding mountains (fig. 3) may be a dominant source of the molybdenum.
Strontium was detected at concentrations greater than the HAL-US of 4,000 µg/L in 3.0 percent of the regional study area; there were no detections at high relative concentrations in the floodplain study area (table 7; fig. 8F). The three wells with moderate or high relative concentrations of strontium (F02, R06, R16) were located north and northwest of Victorville near outcrops of the Paleozoic Oro Grande Formation, a metasedimentary unit containing marble, hornfels, schist, and quartzite (Dibblee, 1967; fig. 3). Because of the proximity to these outcrops, the sediments in this area may contain a greater proportion of carbonate than sediments derived from other rock types. Carbonates generally contain higher concentrations of strontium because strontium substitutes for calcium in mineral structures (Reimann and Caritat, 1998).
Uranium was detected at high relative concentrations in 6.0 percent of the regional study area and was not detected at high relative concentrations in the floodplain study area (table 7; fig. 8G). Wells near the San Bernardino and San Gabriel Mountains had low relative concentrations of uranium (fig. 8G) despite the presence of sediment derived from rocks with elevated uranium contents (U.S. Geological Survey, 2016; Groover and Izbicki, 2019; Smith and others, 2019117). Low uranium concentrations in wells in this area may be related to low bicarbonate concentrations (Groover and others, 2019; Izbicki and others, 2023a). Uranium sorbed to granitic sediment can be mobilized in groundwater with high bicarbonate concentrations due to formation of soluble uranium-bicarbonate complexes (Jurgens and others, 2010).
Groover and Izbicki (2019) showed uranium sorbed on iron and manganese oxides in Mojave alluvium is highly mobile in response to changes in groundwater redox, and mobility was highest in fine-grained deposits. The two wells with high relative concentrations of uranium, R16 and R32 (fig. 8G), appear to be screened in fine-grained deposits (fig. 4) that may be more susceptible to mobilization of uranium as groundwater chemistry changes. Both wells contained modern groundwater as indicated by presence of detectable tritium (table 5).
Perchlorate
The special-interest constituent perchlorate was not detected at high relative concentrations but was detected at moderate concentrations (greater than one-tenth of the MCL-CA of 6 µg/L) in 6.1 percent of the regional study area (table 7; fig. 8H). Low relative concentrations were detection in 64 percent of the regional study area and in 27 percent of the floodplain study area.
Perchlorate has both natural and anthropogenic sources to groundwater. Perchlorate is naturally present in precipitation and can accumulate in soils and unsaturated zones, particularly in more arid conditions (Böhlke and others, 1997; Parker and others, 2008; Jackson and others, 2015). Most known sites of perchlorate contamination from anthropogenic sources are associated with manufacture, use, or disposal of rocket fuels, explosives, pyrotechnics or flares, or with application of Chilean nitrate fertilizers (Böhlke and others, 2005; Sturchio and others, 2012). Flushing of natural perchlorate salts from the unsaturated zone by irrigation or septic recharge also may increase the prevalence of perchlorate in groundwater over that expected from natural processes (Jackson and others, 2010; Fram and Belitz, 2011). Lybrand and others (2013) found that perchlorate was positively correlated with nitrate concentrations in soil samples from the Mojave Desert area and inferred that perchlorate and nitrate are naturally occurring in the soils.
The broad distribution of low concentrations of perchlorate (0.1–0.6 µg/L; fig. 8H) is consistent with the predicted probability of detecting perchlorate at these low concentrations during natural conditions in the Mojave Desert area (Fram and Belitz, 2011) and with other studies finding widespread detections of low concentrations of perchlorate from natural sources in groundwater in arid environments (Parker and others, 2008; Jackson and others, 2015). The two wells with moderate or high concentrations of perchlorate (R16 and R27; fig. 8H) also had detections of VOCs and pesticides and had elevated nitrate concentrations (Groover and others, 2019) consistent with presence of sources of anthropogenic influence on the groundwater quality (Fram and Belitz, 2011). Identification of specific sources of anthropogenic perchlorate is beyond the scope of this report.
A cluster of wells (F04, F06, R29) immediately west of Barstow (fig. 8H) also have low concentrations of perchlorate consistent with naturally occurring perchlorate. In 2010, high concentrations of perchlorate were detected in groundwater near a former pyrotechnics manufacturing site near Barstow (Lahontan Regional Water Quality Control Board, 2012). Although these wells are near the perchlorate contamination site in Barstow, the wells are upgradient in the highly permeable floodplain aquifer; therefore, perchlorate from the contamination site likely did not contribute to the detections in these wells.
Total Dissolved Solids
The SMCL constituent most commonly present at moderate or high relative concentrations was TDS (table 7). TDS was detected at high and moderate relative concentrations in 12 and 27 percent of the regional study area, respectively. TDS was detected at high and moderate relative concentrations in 6.7 and 20 percent of the floodplain study area, respectively. All wells with high or moderate relative concentrations of chloride or sulfate also had high or moderate relative concentrations of TDS (Groover and others, 2019). Most grid wells with high or moderate relative concentrations of TDS were located north of the approximate latitude of Victorville (fig. 8I).
Unlike most other inorganic constituents commonly detected at moderate or high relative concentrations, TDS was present at high and moderate relative concentrations in wells with modern-age groundwater and in wells with groundwater having uncorrected carbon-14 ages greater than 10,000 years (high: F02, R06, R16, R18, R25; moderate: F04, F06, F14, R09, R17, R20, R21, R27, R28, R29, R31, R32; table 5). TDS concentrations in grid-well samples also were not related in a simple manner to the major ion composition. The major-ion composition of groundwater from MOBS grid wells is summarized with a Piper diagram (Piper, 1944, Hem, 1985; fig. 9). The MOBS wells display a wide range of major ion compositions similar to the range observed in Mojave public-supply wells (Wright and others, 2015). The anion composition of MOBS grid wells generally had increasing proportions of sulfate or sulfate and chloride relative to the proportion of bicarbonate as the concentration of TDS increased (fig. 9).
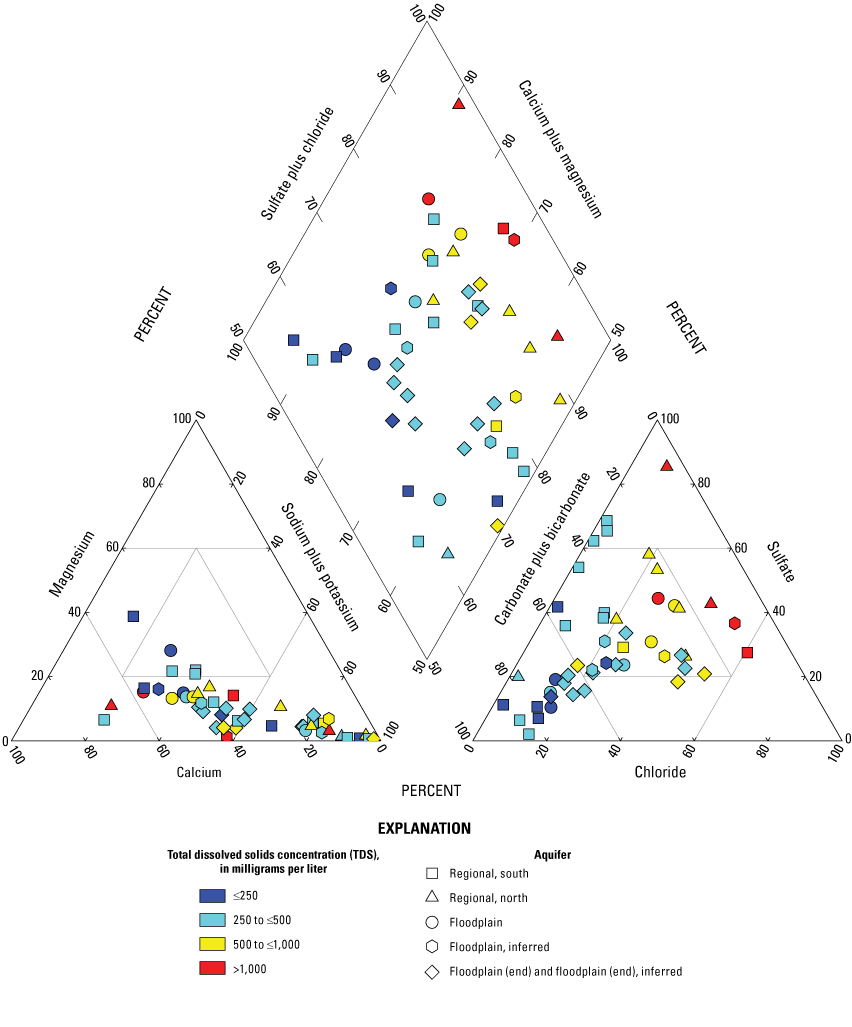
Ionic composition of groundwater from grid and understanding wells, Mojave Basin Domestic-Supply Aquifer study unit, California Groundwater Ambient Monitoring and Assessment Program Priority Basin Project, January–May 2018 (Piper, 1944; Groover and others, 2019). Abbreviations: ≤, less than or equal to; >, greater than.
As groundwater travels through aquifer materials, cation exchange, mineral dissolution and precipitation, and oxidation-reduction reactions can cause changes in the dissolved ion composition of the groundwater. One common pattern of evolution of groundwater chemistry along long aquifer flow paths (travel times of thousands of years) is the cation composition evolving from a mixture of sodium, calcium, and magnesium toward the sodium apex of the Piper cation ternary (Hem, 1985; Drever, 1997). This pattern is observed in groundwater from Mojave and other desert basins (Wright and others, 2015), and in the MOBS dataset, older groundwater generally is characterized as a sodium-type groundwater (table 5). However, there was no systematic relation between TDS and the cation composition of MOBS grid wells (fig. 9). The lack of relation between groundwater evolution and TDS demonstrates the complexity of the geology in MOBS and indicates that multiple sources of salinity may contribute to groundwater used by domestic wells. The geologic composition of aquifers supplying water to domestic wells in the regional aquifer is highly varied; composition of this aquifer most likely consists of alluvium from surrounding rock outcrops and Miocene and older river and lake deposits (Cox and others, 2003; Stamos and others, 2003; Izbicki, 2008; Miller and others, 2020; Izbicki and others, 2023a). The regional aquifer is interrupted by multiple strike-slip and normal fault zones that juxtapose geologic units with different rock compositions and chemistry next to each other (fig. 3; Glazner and others, 2002; Stamos and others, 2003; Langenheim and others, 2019; Miller and others, 2020).
The importance of local geology as a source of TDS to groundwater is supported by strontium isotope data. The isotopic composition of dissolved strontium (87Sr/86Sr) can be used as a tracer of the sources of dissolved inorganic constituents in groundwater (Faure and Powell, 1972; Clark and Fritz, 1997; Bataille and Bowen, 2012). Rocks and geologic materials with higher 87Sr/86Sr ratios are referred to as “radiogenic” because of the accumulation of radiogenic 87Sr, whereas rocks and geologic material with lower 87Sr/86Sr ratios, closer to mantle values, are referred to as “non-radiogenic.” Strontium is an exchangeable cation similar to calcium, and strontium weathered from rock and minerals may exchange rapidly with strontium in groundwater. Consequently, the 87Sr/86Sr composition of water from wells is indicative of the 87Sr/86Sr composition of rocks and geologic materials the water has interacted with and the rates of dissolution of strontium-bearing minerals in those materials (Faure and Powell, 1972; Nimz, 1995; Johnson and DePaolo, 1997; McNutt, 2000; Bataille and Bowen, 2012).
In general, groundwater from MOBS wells south of the approximate latitude of El Mirage (dry) Lake has more radiogenic 87Sr/86Sr ratios than groundwater from MOBS wells to the north (fig. 10). This pattern follows the isotopic composition of the sources of alluvium: the San Gabriel and San Bernardino Mountains contain rocks that generally have more radiogenic strontium isotopic compositions than most rocks in the desert mountain ranges in the northern half of the study unit (DePaolo, 1981; Glazner and O’Neil, 1989; Miller and others, 1996; Bataille and Bowen, 2012; Cecil and others, 2019; Stone and others, 2021). Strontium isotopic compositions in the wells in the floodplain aquifer are most radiogenic near the San Gabriel and San Bernardino Mountains, and are less radiogenic downstream, indicating dissolution of, or equilibration with, strontium-bearing minerals from the local alluvium as water moves along flowpaths of increasing distance from the San Gabriel and San Bernadino Mountains.
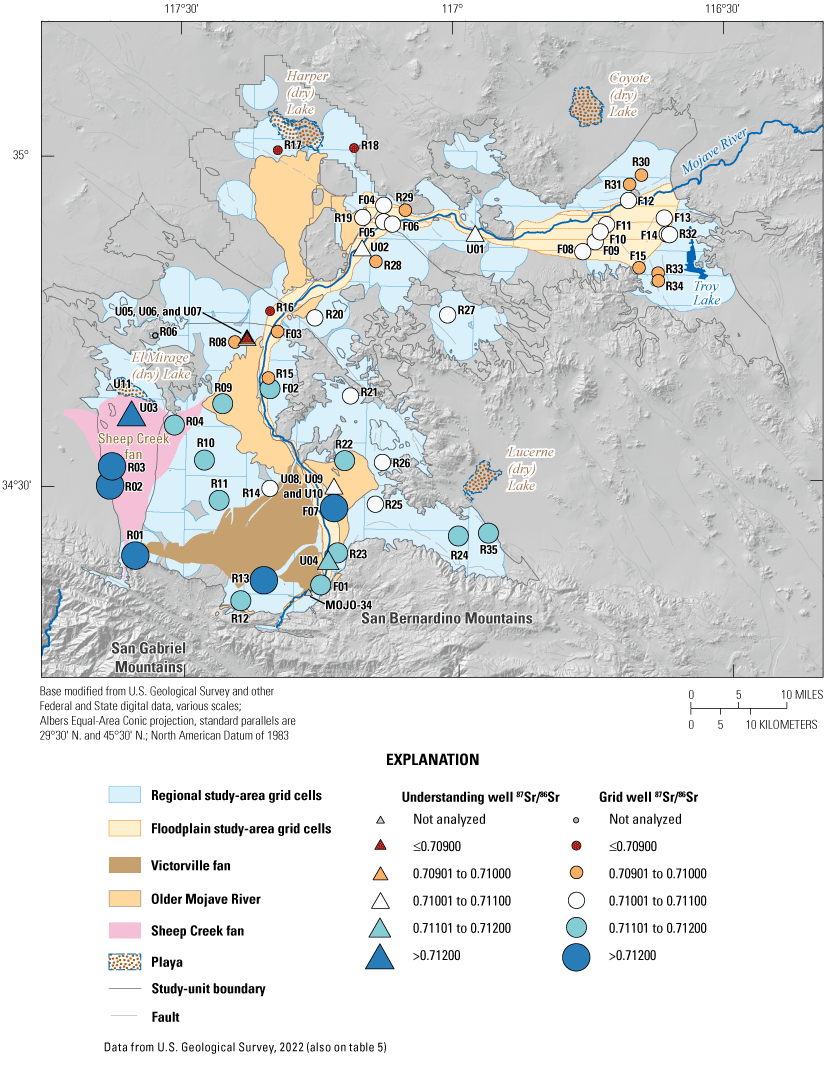
Strontium-87/strontium-86 (87Sr/86Sr) isotope ratios and simplified geology of the Mojave Basin Domestic-Supply Aquifer study unit, California Groundwater Monitoring and Assessment Program Priority Basin Project, January–May 2018. Abbreviations: ≤, less than or equal to; >, greater than.
Nitrate
Nitrate was detected at high relative concentration (greater than the MCL-US of 10 mg/L) in 6.1 percent of the regional study area and was not detected at high relative concentrations in the floodplain study area (table 7; fig. 8J). Moderate relative concentrations of nitrate were detection in 6.1 and 6.7 percent of the regional and floodplain study areas, respectively. Five grid wells had high or moderate concentrations of nitrate and did not appear to have spatial patterns relative to study-area boundaries or nearby geology (F04, R12, R13, R16, R27; fig. 8J).
Nitrate has natural and anthropogenic sources to groundwater. Nationally, nitrate concentrations in groundwater greater than about 1 mg/L generally indicate presence of anthropogenic sources, although most groundwater unaffected by anthropogenic sources has lower concentrations (Dubrovsky and others, 2010). In this study, nitrate concentrations in groundwater with uncorrected carbon-14 age greater than 5,000 years, no detectable tritium, and no detections of volatile organic compounds ranged from less than the detection limit of 0.04 to 1.3 mg/L (table 5; Groover and others, 2019). Nitrate in these old groundwater samples is assumed to be natural in origin, and therefore this range is inferred to be representative of natural background concentrations of nitrate in groundwater used for domestic supply in MOBS. The understanding wells sampled to represent groundwater potentially affected by anthropogenic nitrate sources had nitrate concentrations above this natural background concentration (U01, U02, U03, U08, U09 and U10; table 5).
Stable isotopic compositions of nitrate were analyzed for this study (Groover and others, 2019) and stable isotopic compositions of nitrate have been used to identify anthropogenic inputs of nitrate and biogeochemical processes affecting nitrate concentrations in hydrologic systems (Kendall and others, 2008). However, the nitrate in the understanding wells sampled to represent groundwater potentially affected by anthropogenic nitrate sources, the nitrate in grid wells with natural background concentrations of nitrate, and the nitrate in grid wells with moderate and high relative concentrations of nitrate all had similar ranges of stable isotopic compositions of nitrate (not shown; Groover and others, 2019), indicating that the stable isotopic composition of nitrate was not a simple tracer for identifying anthropogenic sources of nitrate in the MOBS study unit. The results of this study indicate anthropogenic sources of nitrate do affect some domestic wells; however, the detailed hydrologic studies needed to use stable isotopic compositions of nitrate to identify sources of nitrogen to and processes affecting nitrogen in specific wells were beyond this scope of this study.
Umari and others (1995) and Stamos and others (2001) estimated that infiltration from septic tanks and seepage pits accounted for 18 to 33 percent of areal recharge to groundwater aquifers in the region in 1990. The 1990 U.S. Census included data regarding the distribution of households with septic tanks (U.S. Census Bureau, 1992); more recent data were not available at the time this report was published. Estimated septic tank density within a 500-meter radius of MOBS grid wells ranged from 0 to 127 tanks per square kilometer (tanks/km2; table 5). Septic disposal systems are intended to convert organic nitrogen waste to ammonia, then to nitrate, and ultimately to nitrogen gas; however, the hydrologic and biogeochemical conditions in the Mojave Desert region generally result in conversion of only 5 to 10 percent of septic nitrate, with much of the remaining nitrate deposited in the unsaturated zone of the aquifer system (Izbicki and others, 2015b). Recharge may transport this septic nitrate to the groundwater system. All five grid wells with moderate or high relative concentrations of nitrate have modern groundwater or groundwater with uncorrected carbon-14 ages less than 5,000 years and have estimated septic tank densities of 0.2 to 5.1 tanks/km2 (median 3.1 tanks/km2; table 5). However, the 16 grid wells with nitrate concentrations less than 1.3 mg/L and modern groundwater or groundwater with uncorrected carbon-14 ages less than 5,000 years have similar estimated septic tank densities of 0.3 to 7.6 tanks/km2 (median 3.4 tanks/km2; table 5). The lack of clear relation between nitrate concentrations and estimated septic tank densities may be related to the spatial resolution of the septic tank density data used in this study. The septic tank densities are estimated from U.S. Census Bureau (1992) at the scale of census blocks and are not based on mapping of point locations of septic tanks. Although the results from this study are suggestive of a contribution from septic nitrate to groundwater used by domestic wells in the MOBS study unit, more detailed sampling would be required to evaluate the potential for a contribution of septic nitrate to individual wells.
Organic and Microbial Indicator Constituents
Neither VOCs nor pesticides were detected at high or moderate relative concentrations in MOBS study unit grid wells (fig. 7). VOCs were detected at low relative concentrations in 21 percent of the regional study area and in 27 percent of the floodplain study area (table 6; fig. 11A). VOCs classified as trihalomethanes were the most commonly detected organic constituent class, followed by solvents (table 6). Nine different VOCs were detected in grid wells (tables 3, 4; fig. 7).
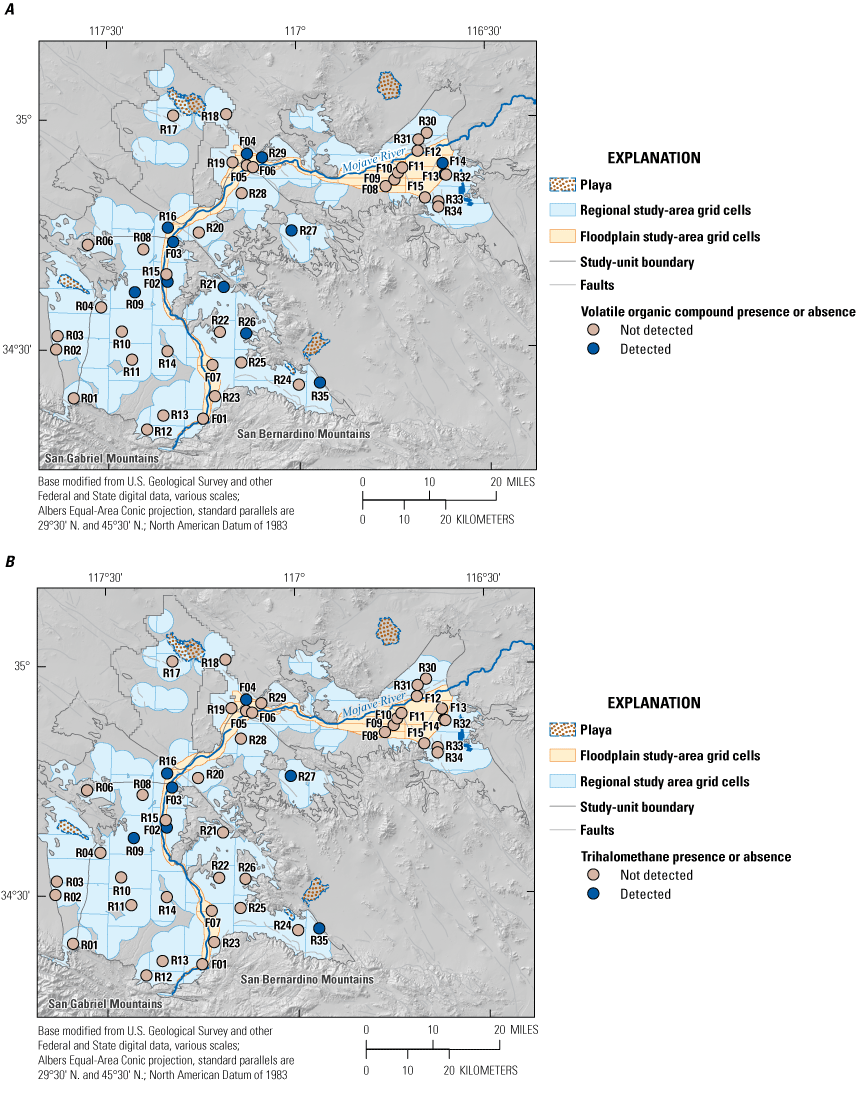
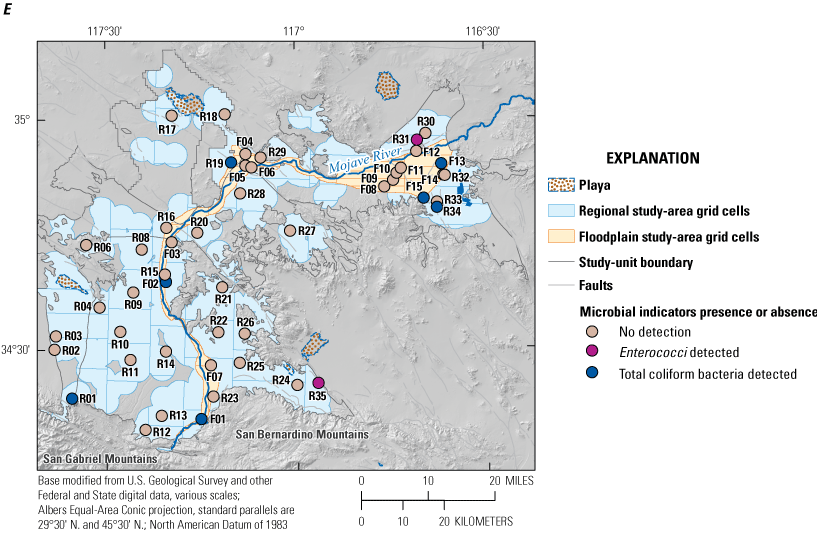
Detections of selected organic constituent classes and microbial indicator constituents in grid wells, Mojave Basin Domestic-Supply Aquifer study unit, California Groundwater Ambient Monitoring and Assessment Priority Basin Project, January–May 2018. A, any volatile organic compound (VOC); B, trihalomethanes; C, VOC solvents; D, any pesticide; and E, microbial indicator constituents.
Trihalomethanes are formed by reactions between chemicals used for disinfection of drinking water and wastewater and organic matter present in water or solid materials (Zogorski and others, 2006). The most commonly detected trihalomethane was trichloromethane, and 3 of the 7 grid wells with trichloromethane detections also had detections of one to three brominated trihalomethanes (Groover and others, 2019). Trichloromethane was detected in 12 percent of the regional study area and 20 percent of the floodplain study area (table 7). Well R35 had detections at low relative concentrations of all four trihalomethanes (trichloromethane, bromodichloromethane, dibromochloromethane, and tribromomethane) and also had the highest ratio of bromide to chloride measured in MOBS samples (Groover and others, 2019). Disinfection of water containing bromide results in formation of brominated trihalomethanes (Ivahnenko and Barbash, 2004). Trihalomethanes may be detected in groundwater either because of recharge of treated water or wastewater from septic systems, leakage from treated water distribution systems, landscape use of treated water, or wastewater discharge (Ivahnenko and Barbash, 2004; Zogorski and others, 2006), or due to disinfection of wells. Shock chlorination (often carried out by pouring bleach down a well) is a recommended procedure for treating bacterial contamination and odor problems in domestic drinking-water supply wells (U.S. Centers for Disease Control and Prevention, 2006).
One or more solvents were detected at low relative concentrations in 15 percent of the regional study area and were not detected in the floodplain study area (table 6; fig. 11C). The most frequently detected solvent was tetrachloroethene (PCE; Groover and others, 2019). Well R09 had detections of four solvents at low relative concentrations and is in an area that may have been settled since the 1940s (based on historical aerial photographs, not shown); therefore, the solvents detected in the groundwater may be from legacy activities. Well R09 is about 5 km from the George Air Force Base (historical; fig. 11C) where there has been extensive remediation of groundwater contaminated by the solvent trichloroethene (Air Force Civil Engineer Center, 2014). However, water-level maps show that well R09 is upgradient from the remediation site (Dick and Kjos, 2017; U.S. Geological Survey, 2023), and the mapped contaminated plume does not extend in the direction of the well (Air Force Civil Engineer Center, 2014).
Five pesticides with water-quality benchmarks were detected at low concentrations in 20 percent of the floodplain study area and 9.1 percent of the regional study area (table 6, fig. 11D). Pesticides were not detected at moderate or high relative concentrations (fig. 7), and no individual pesticide constituents were detected in more than 10 percent of grid wells (table 4; Groover and others, 2019). All five detected pesticides were herbicides.
Grid wells in both study areas were sampled for the presence or absence of microbial indicators, including total coliform bacteria, Escherichia coli (E. coli), and Enterococci. Repeat sampling of wells required to evaluate microbial indicator results with benchmarks (California State Water Resources Control Board Division of Drinking Water, 2022a) was not done for this study. These microbial indicator constituents are used as indicators of potential contamination of water supplies from human or animal waste (California State Water Resources Control Board, 2019c). Coliform bacteria are ubiquitous in soils and surface water but are also present in the digestive tracts of warm-blooded animals. Enterococci and E.coli are more specific indicators of potential fecal contamination than are total coliform bacteria (California State Water Resources Control Board, 2019c). E. coli was not detected in the MOBS grid wells. Total coliform bacteria were detected in 27 percent of the floodplain study area grid wells and there were no Enterococci detections (table 7; fig. 11E). Total coliform bacteria and Enterococci were detected in 9 and 6 percent of grid wells in the regional study area, respectively (table 7; fig. 11E).
Comparative Assessment
The spatial distribution of public-supply wells was not the same as the distribution of the domestic wells sampled for MOBS (compare fig. 5 to fig. 12); therefore, direct comparisons between datasets on a spatial basis may not be reasonable. Wells used for public drinking-water supply in MOBS generally are in areas where groundwater is readily and easily pumped from aquifers. Data from these public-supply wells most likely do not show the small-scale variations in water quality observed in domestic wells on the margins of aquifers in the study unit. However, wells used in this comparison represent groundwater pumped from public-supply wells in the study unit and a statistically representative snapshot of groundwater pumped for domestic well users. Domestic and state-small registered systems in grid cells on the margins of the study unit were included in the data comparison, even in cells where public-supply wells were not present. Public-supply wells were assigned to grid cells on the basis of locations provided, with no consideration of well depth or of proximity to the boundary between the floodplain and regional aquifers. Well depths were not available for all public-supply wells. Deep wells within the areal footprint of the floodplain aquifer may penetrate the regional aquifer beneath the floodplain aquifer. Wells near the boundaries may pump mixtures of water from the two aquifers.
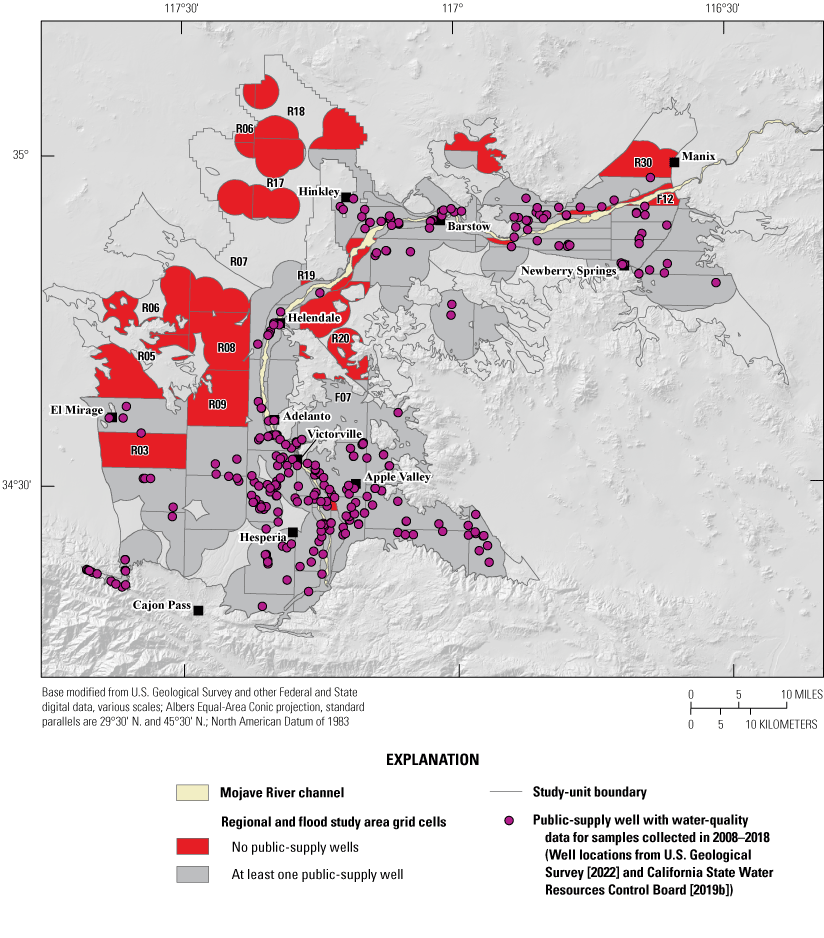
Public-supply wells used for comparison with Mojave Basin Domestic-Supply Aquifer (MOBS) study-unit data and the floodplain and regional study-area boundaries from MOBS, California Groundwater Ambient Monitoring and Assessment Priority Basin Project, January–May 2018.
The public-supply assessment used water-quality data from 322 public-supply wells located in 25 regional study area grid cells and 13 floodplain study area grid cells (fig. 12); however, not all wells had data for all constituents. Nitrate data were available for the most wells: 212 regional study area and 85 floodplain study area wells (tables 6, 7). Trace elements with MCL benchmarks, nitrate, perchlorate, SMCL constituents, and VOCs generally had data for samples from approximately 170–180 wells in 22–24 regional study area grid cells and 75–85 wells in 11–13 floodplain study area grid cells (table 7; fig. 12). About 150 wells had data for uranium, in part because public-supply wells with gross alpha particle activities below a screening threshold level do not need to be analyzed for uranium as an individual constituent separate from gross alpha particle activity (California State Water Resources Control Board Division of Drinking Water, 2022a). About 200 wells had data for boron and vanadium, trace elements with California Notification Level benchmarks, but only the 32 wells sampled by GAMA-PBP had data for molybdenum and strontium (table 7), trace elements with health-based, nonregulatory HAL-US benchmarks (tables 3, 4). Aquifer-scale proportions for constituents having data in fewer than 20 regional study area grid cells and 9 floodplain study area cells are not considered statistically reliable representations of the water-quality conditions in those study areas.
Well Depth and Groundwater Age
The depths of public-supply and domestic wells in the study unit were characterized using well-depth data compiled for the domestic wells sampled for MOBS (table 2) and 51 public-supply wells sampled for MOJO (Mathany and Belitz, 2009) or with well-depth data available from the USGS NWIS (U.S. Geological Survey, 2022). Public-supply wells in the floodplain study area, with a median well depth of 374 feet (ft) and a maximum well depth of 650 ft below land surface, generally are deeper than domestic wells sampled for MOBS, which have a median well depth of 210 ft below land surface and a maximum well depth of 332 ft below land surface (fig. 13). Like domestic wells in MOBS, public-supply wells are deeper in the regional study area than in the floodplain study area, reflecting the generally greater depths to water in the regional aquifer. Public-supply wells in the regional study area have a median well depth of 530 ft and a maximum well depth of 1,130 ft below land surface compared to domestic wells sampled for MOBS, which have a median well depth of 300 ft below land surface and a maximum well depth of 620 ft below land surface (fig. 13).
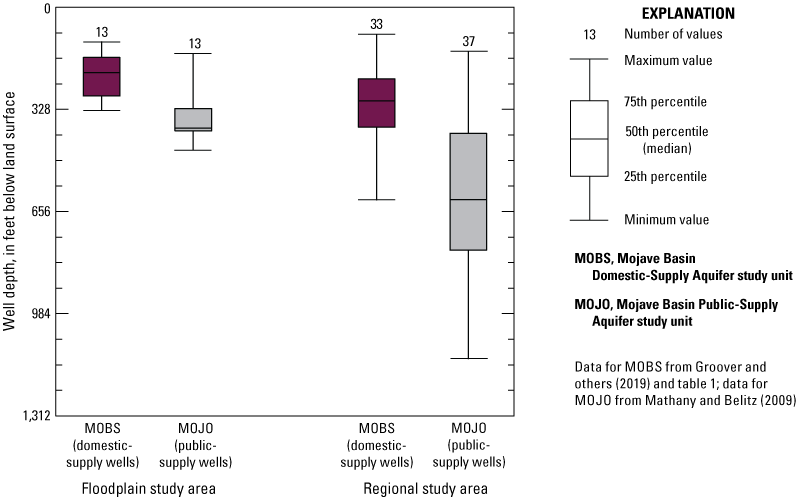
Differences in well depth (in feet below land surface) between domestic wells and public-supply wells sampled as part of the California Groundwater Ambient Monitoring Assessment Priority Basin Project, for wells in the Mojave Basin Domestic-Supply Aquifer study unit, 2008–18.
The difference in depths between public-supply and domestic wells in the floodplain and regional study areas indicates that there may be a difference in the age of the groundwater pumped by the two types of wells because groundwater age generally increases with depth in the aquifer system. Because many wells in MOBS (fig. 6) and MOJO (Wright and others, 2015) have uncorrected carbon-14 ages that are between 1,000 and 40,000 years, groundwater age comparisons would ideally be made using uncorrected carbon-14 ages. However, only half of the MOJO wells were sampled for carbon-14. The available carbon-14 data indicate minimal difference between domestic and public-supply wells. In the floodplain study area, both well types have median carbon-14 values of about 85 pmC and in the regional study area, both well types have median carbon-14 values of about 37 pmC (fig. 14).
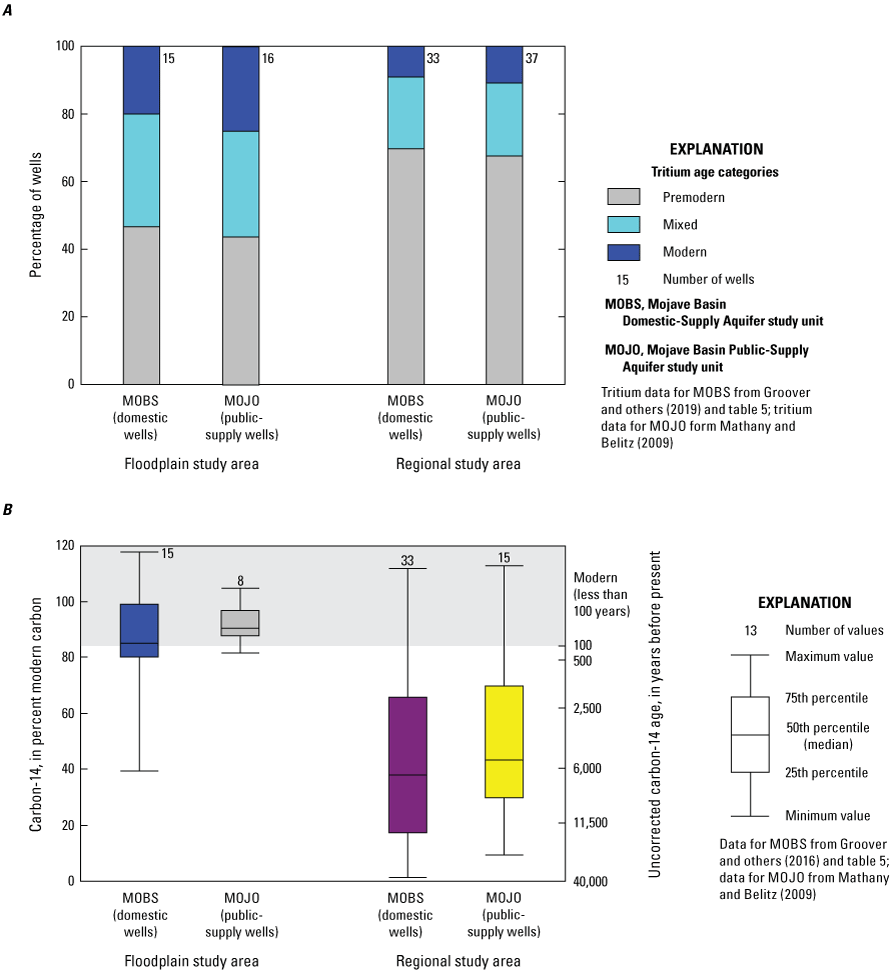
A, Tritium age categories; and B, carbon-14 concentrations in domestic wells and public-supply wells sampled as part of the California Groundwater Ambient Monitoring Assessment Priority Basin Project, for wells in the Mojave Basin Domestic-Supply Aquifer study unit, 2008–18.
All MOJO and MOBS wells were sampled for tritium (table 5; Mathany and Belitz, 2009). Following the method of Lindsey and others (2019), samples were classified as modern, mixed or premodern (see “Methods” section). Wells in the regional study area have a greater proportion of pre-modern ages than wells in floodplain study area, and there is minimal difference in age classifications between the public-supply and domestic wells (fig. 14).
Similar groundwater ages between domestic and public-supply wells were not expected given that domestic wells generally are shallower than public-supply wells (fig. 13). Because public-supply wells are deeper and have longer well-screen intervals than domestic wells sampled for MOBS, the public-supply wells may pump groundwater from a mixture of aquifer sediment types compared to shallower domestic wells. Older sediment at depth in the floodplain aquifer generally is finer grained (Huff and others, 2002; Cox and others, 2003; Stamos and others, 2003; Clark and others, 2009) than shallower alluvium; consequently, in wells screened throughout long intervals, shallower aquifer lithologic units may contribute proportionally more water to the well than deeper aquifer lithologic units. Thus, the age of groundwater extracted by public-supply wells in the floodplain aquifer may be more similar to the age of groundwater extracted by the shallower domestic wells.
The relation between well depth and groundwater age in the regional aquifer may have spatial patterns related to proximity to the floodplain aquifer. Domestic wells on the margins of the regional study area further from the floodplain aquifer may be pumping groundwater that is greater than 10,000 years old that is present at shallower levels in the aquifer system. In contrast, most of the public-supply wells that are in the regional aquifer are located in the more heavily used areas closer to the floodplain aquifer.
Water Quality
Heterogeneity in aquifer sediments (lithology) and pumping may result in differences in water quality between public-supply wells with long well screens and domestic wells with short well screens. Groundwater from finer-grained sediment horizons may have higher concentrations of some naturally occurring trace elements leaching into groundwater due to desorption from secondary mineral surfaces (Groover and Izbicki, 2018b) and weathering of primary mineral grains. Interbedded coarse-grained intervals and fine-grained intervals (fig. 15) may result in redox boundaries at interval contacts, resulting in higher concentrations of some trace elements dissolving into groundwater due to changes in water chemistry. Additionally, large-capacity pumps installed in public-supply wells are designed to pump large volumes of water and, as a result, may withdraw more water from coarse-grained intervals in heterogeneous aquifers compared to domestic wells. Domestic well placement and construction generally are less optimized for high pumping rates, and lower pumping rates may result in these wells obtaining a greater proportion of groundwater from finer-grained layers with different water chemistry to sustain water levels.
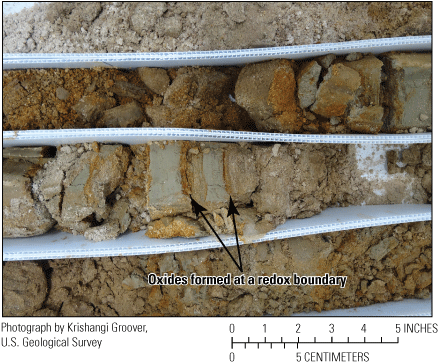
Sediment core from the floodplain aquifer near Barstow, California. Note red oxide layers that have formed between the gray silt and clay horizons and the interbedded river sand horizons. (Photograph by Krishangi Groover, U.S. Geological Survey, September 2015)
Stable isotopes of oxygen and hydrogen in water were available for public-supply wells sampled for the GAMA-PBP MOJO study unit (Mathany and Belitz, 2009; U.S. Geological Survey, 2022). The MOJO public-supply wells (not shown) have similar ranges in isotope values to those observed in the MOBS domestic wells (fig. 6) and in previous studies of the stable isotope systematics of groundwater in the Mojave groundwater basins (Izbicki, 2004). The primary difference is that the local meteoric water line to the right of the global meteoric water line is not as well-defined in the public-supply well dataset (not shown; Mathany and Belitz, 2009; U.S. Geological Survey, 2022). In the domestic well dataset, the local meteoric water line to the right of the global meteoric water line is formed by wells from the northern part of the study unit (fig. 6; table 5; Groover and others, 2019). Many of the parts of the regional aquifer on the northern side of the study unit did not have public-supply wells available to be sampled by the GAMA-PBP public-supply assessment study (fig. 12).
Comparison of inorganic data by constituent class and relative concentrations indicates that the large contrast between groundwater quality in the floodplain and regional study areas detected in MOBS domestic wells also is present in the public-supply wells (table 6; figs. 16A, B). There are two notable differences between the water quality in the domestic and public-supply wells. In the floodplain study area, the public-supply wells have greater prevalence of high or moderate relative concentrations of iron or manganese compared to the domestic wells. In the regional study area, the domestic wells have greater prevalence of high or moderate relative concentrations of trace elements.
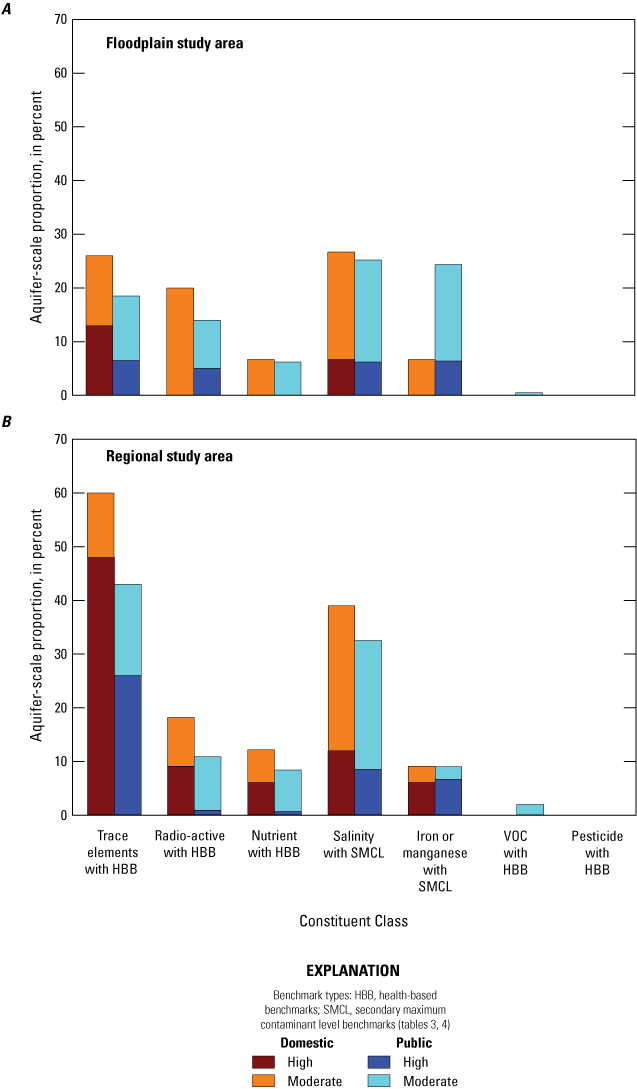
Comparison between domestic wells and public-supply wells of percent moderate and percent high relative concentrations for inorganic constituent classes in the A, floodplain and B, regional study areas, Mojave Basin Domestic-Supply Aquifer study unit, California Groundwater Ambient Monitoring Assessment Priority Basin Project, 2008–18. Abbreviation: VOC, volatile organic compound. Data from table 6.
The greater prevalence of high and moderate relative concentrations of iron and manganese in public-supply wells in the floodplain study area may be an artifact of sample collection protocols or may indicate a difference in the composition of the groundwater pumped by domestic and public-supply wells.
Most samples from public-supply and domestic wells in the floodplain aquifer have dissolved-oxygen concentrations greater than 0.5 mg/L (Mathany and Belitz, 2009; Groover and others, 2019), and iron and manganese have low solubilities in oxic conditions. Groundwater with dissolved-oxygen concentrations less than 0.5 mg/L was found in two locations: in some public-supply wells and some domestic wells in the Lower Mojave River Valley groundwater basin at the eastern end of the study unit, and in some public-supply wells between Victorville and Helendale (locations on fig. 2; data not shown; Mathany and Belitz, 2009; Wright and others, 2015; Groover and others, 2019; table 5).
All the public-supply wells sampled by USGS that had dissolved-oxygen concentrations less than 0.5 mg/L also had low relative concentrations of iron and manganese (Mathany and Belitz, 2009; U.S. Geological Survey, 2022); these anoxic conditions would favor dissolution of iron and manganese oxides present in the aquifer sediments. Many of the SWRCB-DDW public-supply wells with moderate or high relative concentrations of iron or manganese were located in the floodplain aquifer between Victorville and Helendale, where public-supply wells sampled by USGS had dissolved-oxygen concentrations less than 0.5 mg/L (locations on fig. 2; data not shown; Mathany and Belitz, 2009; Wright and others, 2015). However, dissolved-oxygen concentrations were not available in the SWRCB-DDW dataset (California State Water Resources Control Board, 2019b).
Trace element data from the USGS used in this report (U.S. Geological Survey, 2022) are from filtered water samples, whereas trace element concentration data compiled in the SWRCB-DDW dataset (California State Water Resources Control Board, 2019b) may be from filtered or unfiltered water samples. Comparison of data for samples from wells sampled by USGS and with data in the SWRCB-DDW dataset indicates iron and manganese concentrations commonly are greater in the SWRCB-DDW samples, which likely demonstrates the contribution of particulates to the total concentration (Levy and Fram, 2021). Of the 75 public-supply wells in the floodplain aquifer with manganese data in the SWRCB-DDW dataset, 27 percent had high or moderate relative concentrations of manganese (California State Water Resources Control Board, 2019b); of the 12 public-supply wells in the floodplain aquifer with manganese data in the USGS dataset, 8.3 percent had high or moderate relative concentrations of manganese (U.S. Geological Survey, 2022). Based on the available data, it is not possible to determine whether the difference in frequency of high and moderate relative concentrations of manganese was due to contributions from particulates to samples in the SWRCB-DDW dataset or due to the smaller number of wells sampled by the USGS not including zones of the public-supply aquifer represented in the larger set of wells in the SWRCB-DDW dataset.
If the greater prevalence of high and moderate relative concentrations of iron and manganese in the public-supply aquifer of the floodplain study area compared to the domestic-supply aquifer is not an artifact of differences in sample collection protocols between data from the USGS and SWRCB-DDW datasets, then we hypothesize that the difference in prevalence of high and moderate relative concentrations of iron and manganese could be related to differences in the depths of public-supply and domestic-supply wells. Public-supply wells in the floodplain aquifer are screened to greater depths than domestic wells (fig. 13), and consequently, may be screened in finer-grained alluvium that lies beneath the coarse sand near the surface in which many of the domestic wells are screened (fig. 4; Stamos and others, 2001; Huff and others, 2002). This finer-grained alluvium at depth has higher concentrations of iron and manganese oxides (fig. 15), and is more weathered (Groover and others, 2023), which may allow for greater mobility of trace elements in groundwater (Groover and Izbicki, 2019). Alternative explanations could include higher concentrations of organic carbon in aquifer sediments associated with ancestral lake and overbank deposits; however, data from Morrison and others (2018) indicated even seemingly reduced blue or black silt and clay in the floodplain aquifer has low concentrations of organic carbon (less than 1 percent).
The greater prevalence of moderate and high relative concentrations of trace elements in domestic wells compared to public-supply wells in the regional study area is mostly caused by greater prevalence of high and moderate relative concentrations of arsenic, fluoride, and molybdenum (table 7). This greater prevalence of high relative concentrations of trace elements in domestic wells may partially be due to well location; some of the grid cells represented by a domestic well with high relative concentration of arsenic, fluoride, or molybdenum did not contain any public-supply wells with data for those trace elements (compare fig. 5 to fig. 12). The greater prevalence of high relative concentrations of trace elements in domestic wells compared to public-supply wells may also partially be caused by differences in the characteristics of domestic and public-supply wells. Because domestic wells commonly pump at lower rates than public-supply wells, they can be screened in less productive aquifer materials, for example, finer-grained sediments that may have groundwater with higher concentrations of trace elements.
The greater prevalence of moderate and high concentrations of trace elements in domestic wells in the regional study area also could be due to regulation of public-supply wells, which may be taken offline if constituents exceed health-based benchmarks such as MCLs, whereas domestic well owners may be unaware of water-quality concerns in their well or unable to switch to a different source of water. MOBS wells in five of the eight regional study-area grid cells with no public-supply wells exceeded benchmarks for one or more inorganic constituents.
Organic constituents were not widely detected in either MOBS grid wells or in the public-supply dataset. There were no organic constituents detected at high relative concentrations in either dataset. No organic constituents were detected at moderate concentrations in the MOBS grid wells, and VOCs were detected at moderate concentrations in 2.0 and 0.5 percent of the public-supply regional and floodplain study areas, respectively (table 6; fig. 16). The organic constituents detected at moderate concentrations in the public-supply regional study area were the solvent PCE and the trihalomethane trichloromethane; only PCE was detected at moderate concentration in the public-supply floodplain study area. Detection frequencies at any concentration were not calculated for the public-supply dataset because of the difference between the reporting limits in the SWRCB-DDW and GAMA-PBP datasets would have required re-computing the MOBS results for comparison.
Summary
The California Groundwater Ambient Monitoring and Assessment Program Priority Basin Project (GAMA-PBP) investigated water quality in groundwater resources used by domestic drinking water supply wells in the groundwater basins of the western Mojave Desert. The GAMA-PBP is a cooperative project between the California State Water Resources Control Board and the U.S. Geological Survey (USGS). This report provided (1) a description of the hydrologic setting of the groundwater basins of the western Mojave Desert, (2) an assessment of the status of water quality in groundwater used by domestic wells, (3) a brief assessment of factors that may affect groundwater quality in domestic wells, and (4) a comparison between the groundwater resources used by domestic and public-supply wells. This study characterized the quality of ambient groundwater and not the quality of treated drinking water.
The Mojave Basin Domestic-Supply Aquifer study unit (MOBS) included five California Department of Water Resources alluvial groundwater basins, the Upper, Middle, and Lower Mojave Valley groundwater basins, and the El Mirage Valley and Harper Valley groundwater basins, and was divided into two study areas on the basis of previous hydrogeologic characterization of the region: the floodplain study area corresponding to the floodplain aquifer along the Mojave River and the regional study area corresponding to the surrounding regional aquifer. The study used a stratified, randomized grid-based design to select domestic wells for sampling and to aggregate data from public-supply wells. The floodplain and regional study areas each were divided into equal-area grid cells. The domestic-well assessments were based on data collected by the USGS in January–May 2018 from 48 domestic wells sampled in 15 of the 15 grid cells in the floodplain study area and 33 of the 35 grid cells in the regional study area. Eleven other wells were sampled to provide additional data for evaluation of factors affecting groundwater quality. Samples from grid wells were analyzed for field parameters, major ions, trace elements, nutrients, radiological constituents, volatile organic compounds (VOCs), pesticides, microbial indicators, age-dating tracers, and stable isotopes. The public-supply assessment was based on data for samples from 322 public-supply wells in 2008–18, either collected by the USGS or compiled from the California State Water Resources Control Boards Division of Drinking Water publicly available database.
Concentrations of water-quality constituents in ambient groundwater were compared to regulatory and non-regulatory benchmarks typically used by the State of California and Federal agencies as health-based or aesthetic standards for public drinking water. Relative concentrations, defined as the measured concentration divided by the benchmark concentration, were classified as high (greater than 1.0), moderate (greater than 0.5 for inorganic constituents or 0.1 for organic and special-interest constituents, and not high), or low (concentrations lower than moderate). The primary metric for presenting water-quality results was aquifer-scale proportion: the areal proportion of each study area characterized by high or moderate relative concentrations or detections of individual constituents or classes of constituents in domestic wells or in public-supply wells. Aquifer scale proportions for groundwater used by domestic wells were computed as detection frequencies in each study area because the dataset consisted of one well per grid cell; spatial weighting was used to decluster the data for computation of aquifer scale proportions for groundwater used by public-supply wells.
Water-quality data were examined in three different ways: a Status Assessment examined the concentrations of inorganic and organic constituents in comparison to both regulatory and non-regulatory benchmarks; an Understanding Assessment combined information on geology, regional hydrology, and isotopic data from MOBS to assess factors that influence the source and movement of groundwater to domestic drinking water aquifers in the study unit; and a Comparative Assessment was done to evaluate differences in water quality between domestic groundwater wells sampled in MOBS and public-supply groundwater wells sampled in the Mojave Basin Public-Supply Aquifer study unit (MOJO).
For the domestic-supply assessment, one or more inorganic constituents with health-based benchmarks were detected at high relative concentrations in 58 percent of the regional study area and 13 percent of the floodplain study area. The inorganic constituents with detected at high relative concentrations in the regional study area were arsenic, chromium and hexavalent chromium, fluoride, adjusted gross alpha particle activity, uranium, molybdenum, strontium, and nitrate; only arsenic was detected at high relative concentrations in the floodplain study area. One or more inorganic constituents with secondary maximum contaminant level benchmarks were detected at high concentrations in 15 and 6.7 percent of the regional and floodplain study areas, respectively. The constituents detected at high relative concentrations in the regional study area were total dissolved solids, chloride, sulfate, and iron; only total dissolved solids and sulfate were detected at high relative concentrations in the floodplain study area.
Organic constituents were not detected at moderate or high relative concentrations in either the regional or floodplain study areas. Volatile organic compounds were detected at low relative concentrations in 21 and 27 percent of the regional and floodplain study areas, respectively, and pesticides were detected at low relative concentrations in 9.1 and 20 percent of the regional and floodplain study areas, respectively. The only individual organic constituent detected in more than 10 percent of either study area was the trihalomethane trichloromethane. Total coliform bacteria were present in 15 and 27 percent of the grid wells in the regional and floodplain study areas, respectively.
The greater prevalence of high relative concentrations of many inorganic constituents in the regional study area compared to the floodplain area likely indicates the greater diversity of geologic material at depth in aquifer material and generally finer-grained alluvium compared to the floodplain study area combined with generally older groundwater that has had more contact time with aquifer materials. In general, trace element concentrations (1) increased with increasing groundwater age; (2) increased with distance from recharge sources in the mountains; and (3) increased with increasing proximity to some rock outcrops. In general, groundwater from domestic wells in the floodplain study area is young, with most samples containing a component of modern groundwater based on tritium and unadjusted-14 activities, whereas groundwater from domestic wells in the regional study area generally is old, with most samples having unadjusted carbon-14 ages of 5,000–40,000 years.
Public-supply wells in MOBS generally were deeper than domestic wells and presumably are in contact with older, more weathered alluvium that may have more mobile trace elements, such as arsenic or uranium. However, only 26 percent of the public-supply regional study area had high relative concentrations of inorganic constituents, compared to 58 percent for the domestic regional study area. The percentages of the floodplain study area with high relative concentrations of inorganic constituents, 11 and 13 percent, respectively, were similar. The ages of groundwater used by public-supply and domestic wells in each study area were similar, which was not expected given the greater depth of the public-supply wells. Three potential factors may contribute to these results: (1) greater spatial footprint of domestic well network, which may be pumping groundwater from fractured bedrock or mineralized areas; (2) greater pumping rates in public-supply wells, resulting in more water being withdrawn from coarse-grained, heterogeneous alluvium than finer-grained layers, which may have higher concentrations of (or more mobile) inorganic constituents; and (3) a greater degree of well management with public-supply wells, which may include pausing use of or decommissioning wells if treating or blending water is not feasible to lower constituent concentrations.
References Cited
Air Force Civil Engineer Center, 2014, Final revised proposed plan, Operable Unit 1, Site CG070, former George Air Force Base (AFB), California: Air Force Civil Engineer Center, Report to Lahontan Regional Water Quality Control Board and U.S. Environmental Protection Agency, accessed January 23, 2020, at https://www.afcec.af.mil/Portals/17/documents/BRAC/George/AFD-140501-094.pdf.
Bataille, C.P., and Bowen, G.J., 2012, Mapping 87Sr/86Sr variations in bedrock and water for large scale provenance studies: Chemical Geology, v. 304–305, p. 39–52. [Available at https://doi.org/10.1016/j.chemgeo.2012.01.028.]
Belitz, K., Dubrovsky, N.M., Burow, K., Jurgens, B.C., and Johnson, T., 2003, Framework for a ground-water quality monitoring and assessment program for California: U.S. Geological Survey Water-Resources Investigations Report 2003–4166, 78 p. [Available at https://doi.org/10.3133/wri034166.]
Belitz, K., Fram, M.S., and Johnson, T.D., 2015, Metrics for assessing the quality of groundwater used for public supply, Calif., USA—Equivalent population and area: Environmental Science & Technology, v. 49, no. 14, p. 8330–8338. [Available at https://doi.org/10.1021/acs.est.5b00265.]
Belitz, K., Jurgens, B.C., and Johnson, T.D., 2016, Potential corrosivity of untreated groundwater in the United States: U.S. Geological Survey Scientific Investigations Report 2016–5092, 16 p. [Available at https://doi.org/10.3133/sir20165092.]
Belitz, K., Jurgens, B., Landon, M.K., Fram, M.S., and Johnson, T., 2010, Estimation of aquifer scale proportion using equal-area grids—Assessment of regional scale groundwater quality: Water Resources Research, W11550, v. 46, no. 11, 14 p. [Available at https://doi.org/10.1029/2010WR009321.]
Bennett, G.L. V, 2020, Updated study reporting levels (SRLs) for trace-element data collected for the California Groundwater Ambient Monitoring and Assessment (GAMA) Program Priority Basin Project, October 2009–October 2018: U.S. Geological Survey Scientific Investigations Report 2020–5034, 24 p. [Available at https://doi.org/10.3133/sir20205034.]
Böhlke, J.K., Ericksen, G.E., and Revesz, K., 1997, Stable isotope evidence for an atmospheric origin of desert nitrate deposits in northern Chile and southern California, U.S.A: Chemical Geology, v. 136, nos. 1–2, p. 135–152. [Available at https://doi.org/10.1016/S0009-2541(96)00124-6.]
Böhlke, J.K., Sturchio, N.C., Gu, B., Horita, J., Brown, G.M., Jackson, W.A., Batista, J., and Hatzinger, P.B., 2005, Perchlorate isotope forensics: Analytical Chemistry, v. 77, no. 23, p. 7838–7842. [Available at https://doi.org/10.1021/ac051360d.]
Bowell, R.J., Alpers, C.N., Jamieson, H.E., Nordstrom, D.K., and Majzlan, J., 2014, The environmental geochemistry of arsenic—An overview: Reviews in Mineralogy & Geochemistry, v. 79, p. 1–16. [Available at https://doi.org/10.2138/rmg.2014.79.1.]
California Department of Water Resources, 2020, California's groundwater: California Department of Water Resources Bulletin 118, accessed June 6, 2023, at https://water.ca.gov/Programs/Groundwater-Management/Bulletin-118.
California Department of Water Resources, 2023a, Groundwater: California Department of Water Resources website, accessed February 9, 2023, at https://water.ca.gov/Water-Basics/Groundwater.
California Department of Water Resources, 2023b, Online System for Well Completion Reports (OSWCR) well completion reports dataset: California Department of Water Resources website, accessed February 9, 2023, at https://data.cnra.ca.gov/dataset/well-completion-reports.
California State Water Resources Control Board, 2003, A comprehensive groundwater quality monitoring program for California: Assembly Bill 599, Report to the Governor and Legislature, March 2003, 121 p., accessed February 16, 2021, at https://www.waterboards.ca.gov/publications_forms/publications/legislative/docs/2003/ab599.pdf.
California State Water Resources Control Board, 2015, A guide for private domestic well owners: California State Water Resources Control Board Groundwater Ambient Monitoring and Assessment Program, 22 p., accessed August 15, 2022, at https://www.waterboards.ca.gov/water_issues/programs/gama/docs/wellowner_guide.pdf.
California State Water Resources Control Board, 2017, Groundwater information sheet— Perchlorate: California State Water Resources Control Board, Division of Water Quality, GAMA Program, 10 p., accessed September 6, 2023, at https://www.waterboards.ca.gov/water_issues/programs/gama/docs/coc_perchlorate.pdf.
California State Water Resources Control Board, 2019a, Human right to water portal: California State Water Resources Control Board website, accessed December 2020 at https://www.waterboards.ca.gov/water_issues/programs/hr2w/.
California State Water Resources Control Board, 2019b, GAMA Groundwater information system: California State Water Resources Control Board Groundwater Ambient Monitoring and Assessment Program, accessed December 2020 at https://gamagroundwater.waterboards.ca.gov/gama/gamamap/public/Default.asp.
California State Water Resources Control Board, 2019c, Groundwater information sheet—Bacteria indicators: California State Water Resources Control Board, Division of Water Quality, GAMA Program, 7 p., accessed October 5, 2021, at https://www.waterboards.ca.gov/gama/docs/coc_bacteria_indicators.pdf.
California State Water Resources Control Board Division of Drinking Water, 2022a, Domestic water quality and monitoring regulations: California Code of Regulations, Title 22, Division 4, Chapter 15, Article 4, §64431, Chapter 15, Article 5.5 §64444, Chapter 15, Article 3 §64421–64427, Chapter 15, Article 3.5, §64430, and Chapter 15.5, Article 2, §64533, accessed December 30, 2022, at http://ccr.oal.ca.gov/.
California State Water Resources Control Board Division of Drinking Water, 2022b, Domestic Water Quality and Monitoring Regulations, Secondary Maximum Contaminant Levels: California Code of Regulations, Title 22, Division 4, Chapter 15, Article 16, §64449. [Available at http://ccr.oal.ca.gov/.]
California State Water Resources Control Board Division of Drinking Water, 2022c, Drinking water notification and response levels—An overview: California State Water Recourses Control Board. [Available at https://www.waterboards.ca.gov/drinking_water/certlic/drinkingwater/documents/notificationlevels/notification_response_level_overview_2022_11_01.pdf.]
Cecil, M.R., Ferrer, M.A., Riggs, N.R., Marsaglia, K., Kylander-Clark, A., Ducea, M.N., and Stone, P., 2019, Early arc development recorded in Permian-Triassic plutons of the northern Mojave Desert region, California, USA: Geological Society of America Bulletin, v. 131, nos. 5–6, p. 749–765. [Available at https://doi.org/10.1130/B31963.1.]
Clark, D.A., Izbicki, J.A., Johnson, R.D., Land, M.T., 2009, Data from a thick unsaturated zone underlying two artificial recharge sites along Oro Grande Wash in the western part of the Mojave Desert, near Victorville, San Bernardino County, California, 2001–2006: U.S. Geological Survey Data Series 438, 93 p. [Available at https://doi.org/10.3133/ds438.]
Cox, B.F., Hillhouse, J.W., and Owen, L.A., 2003, Pliocene and Pleistocene evolution of the Mojave River, and associated tectonic development of the Transverse Ranges and Mojave Desert, based on borehole stratigraphy studies and mapping of landforms and sediments near Victorville, California, in Enzel, Y., Wells, S.G., and Lancaster, N., eds., Paleoenvironments and paleohydrology of the Mojave and southern Great Basin deserts: Boulder, Colo., Geological Society of America Special Paper 368, 42 p. [Available at https://doi.org/10.1130/0-8137-2368-X.1.]
Cyr, A.J., Miller, D.M., and Mahan, S.A., 2015, Paleodischarge of the Mojave River, southwestern United States, investigated with single-pebble measurements of 10Be: Geosphere, v. 11, no. 4, p. 1158–1171. [Available at https://doi.org/10.1130/GES01134.1.]
Dawson, B.J.M., and Belitz, K., 2012, Status of groundwater quality in the California Desert Region, 2006–2008—California GAMA Priority Basin Project: U.S. Geological Survey Scientific Investigations Report 2012–5040, 110 p. [Available at https://doi.org/10.3133/sir20125040.]
Dawson, M.R., and Jacobson, C.E., 1989, Geochemistry and origin of mafic rocks from the Pelona, Orocopia, and Rand Schists, southern California: Earth and Planetary Science Petters, v. 92, p. 371–385, accessed April 24, 2023, at https://doi.org/10.1016/0012-821X(89)90061-7.
DePaolo, D.J., 1981, A neodymium and strontium isotopic study of the Mesozoic calc-alkaline granitic batholiths of the Sierra Nevada and Peninsular Ranges, California: Journal of Geophysical Research, v. 86, no. B11, p. 10470–10488. [Available at https://doi.org/10.1029/JB086iB11p10470.]
Dibblee, T.W., Jr., 1967, Areal geology of the western Mojave Desert, California: U.S. Geological Survey Professional Paper 522, 153 p. [Available at https://doi.org/10.3133/pp522.]
Dick, M.C., and Kjos, A., 2017, Regional water table (2016) in the Mojave River and Morongo groundwater basins, southwestern Mojave Desert, California: U.S. Geological Survey Scientific Investigations Map 3391, scale 1:170,000. [Available at https://doi.org/10.3133/sim3391.]
Dieter, C.A., Maupin, M.A., Caldwell, R.R., Harris, M.A., Ivahnenko, T.I., Lovelace, J.K., Barber, N.L., and Linsey, K.S., 2018, Estimated use of water in the United States in 2015: U.S. Geological Survey Circular 1441, 65 p. [Available at https://doi.org/10.3133/cir1441.]
Dokka, R.K., and Travis, C.J., 1990, Role of the eastern California shear zone in accommodating Pacific-North American plate motion: Geophysical Research Letters, v. 17, no. 9, p. 1323–1326. [Available at https://doi.org/10.1029/GL017i009p01323.]
Dubrovsky, N.M., Burow, K.R., Clark, G.M., Gronberg, J.M., Hamilton, P.A., Hitt, K.J., Mueller, D.K., Munn, M.D., Nolan, B.T., Puckett, L.J., Rupert, M.G., Short, T.M., Spahr, N.E., Sprague, L.A., Wilber, W.G., 2010, The quality of our Nation’s waters—Nutrients in the Nation’s streams and groundwater, 1992–2004: U.S. Geological Survey Circular 1350, 174 p. [Available at http://pubs.usgs.gov/circ/1350.]
Edmunds, W.M., and Smedley, P.L., 2013, Fluoride in natural waters, in Selinus, O., ed., Essentials of medical geology: Dordrecht, Springer. [Available at https://doi.org/10.1007/978-94-007-4375-5_13.]
Ehlig, P.L., 1968, Causes of distribution of Pelona, Rand, and Orocopia Schist along the San Andreas and Garlock faults, in Dickinson, W.R.., and Grantz, A., eds., Proceedings of conference on geologic problems of San Andreas fault system: Stanford, Calif., Stanford University Publications in the Geological Sciences, v. 11, p. 294–306.
Enzel, Y., Wells, S.G., and Lancaster, N., 2003, Late Pleistocene lakes along the Mojave River, southeast California, in Enzel, Y., Wells, S.G., and Lancaster, N., eds., Paleoenvironments and paleohydrology of the Mojave and southern Great Basin Deserts: Boulder, Colo., Geological Society of America Special Paper 368, p. 61–77. [Available at https://doi.org/10.1130/0-8137-2368-X.61.]
Faunt, C.C., 2006, Deserts of the southwestern United States, for the Death Valley regional ground-water flow system study, Nevada and California: U.S. Geological Survey data release, accessed September 13, 2023, at https://water.usgs.gov/lookup/getspatial?sir045205_deserts_sw.
Faure, G., and Powell, J.L., 1972, Strontium isotope geology: Berlin, Springer-Verlag, 188 p. [Available at https://doi.org/10.1007/978-3-642-65367-4.]
Foreman, W.T., Williams, T.L., Furlong, E.T., Hemmerle, D.M., Stetson, S.J., Jha, V.K., Noriega, M.C., Decess, J.A., Reed-Parker, C., and Sandstrom, M.W., 2021, Comparison of detection limits estimated using single- and multi-concentration spike-based and blank-based procedures: Talanta, v. 228, no. 122139. [Available at https://doi.org/10.1016/j.talanta.2021.122139.]
Fram, M.S., 2020, Pesticide constituent data from the California Groundwater Ambient Monitoring and Assessment Program Priority Basin Project (GAMA-PBP), August 2013–May 2018, schedule 2437 constituents: U.S. Geological Survey data release, available at https://doi.org/10.5066/P9IYH6ZY.
Fram, M.S., and Belitz, K., 2011, Probability of detecting perchlorate under natural conditions in deep groundwater in California and the southwestern United States: Environmental Science & Technology, v. 45, no. 4, p. 1271–1277. [Available at https://doi.org/10.1021/es103103p.]
Fram, M.S., and Belitz, K., 2012, Status and understanding of groundwater quality in the Tahoe-Martis, Central Sierra, and Southern Sierra study units, 2006–2007—California GAMA Priority Basin Project: U.S. Geological Survey Scientific Investigations Report 2011–5216, 222 p. [Available at https://doi.org/10.3133/sir20115216.]
Glazner, A.F., and O’Neil, J.R., 1989, Crustal structure of the Mojave Desert, California—Inferences from Sr and O isotopic studies of Miocene volcanic rocks: Journal of Geophysical Research, v. 94, no. B6, p. 7861–7870. [Available at https://doi.org/10.1029/JB094i0B6p07861.]
Glazner, A.F., Walker, J.D., Bartley, J.M., and Fletcher, J.M., 2002, Cenozoic evolution of the Mojave block of southern California, in Glazner, A.F., Walker, J.D., and Bartley, J.M., eds., Geologic evolution of the Mojave Desert and Southwestern Basin and Range: Boulder, Colo., Geological Society of America Memoir, v. 195, p. 19–41. [Available at https://doi.org/10.1130/0-8137-1195-9.19.]
Groover, K.D., and Goldrath, D.A., 2019, Groundwater quality in shallow aquifers in the western Mojave Desert, California: U.S. Geological Survey Fact Sheet 2019–3033, 4 p. [Available at https://doi.org/10.3133/fs20193033.]
Groover, K.D., and Izbicki, J.A., 2018a, Field portable X-ray fluorescence and associated quality control data for the western Mojave Desert, San Bernardino County, California: U.S. Geological Survey data release, available at https://doi.org/10.5066/P9CU0EH3.
Groover, K.D., and Izbicki, J.A., 2018b, Trace element concentrations in alluvium of the Mojave River floodplain (abs.), in Miller, D.M., ed., Against the current—The Mojave River from sink to source: The 2018 Desert Symposium Field Guide and Proceedings, April 2018, accessed May 1, 2024, at https://www.desertsymposium.org/publications/2018_Against_the_current.pdf.
Groover, K.D., and Izbicki, J.A., 2019, Selected trace-elements in alluvium and rocks, western Mojave Desert, southern California: Journal of Geochemical Exploration, v. 200, p. 234–248. [Available at https://doi.org/10.1016/j.gexplo.2018.09.005.]
Groover, K.D., Goldrath, D.A., Bennett, G.L., Johnson, T.D., and Watson, E.E., 2019, Groundwater-quality data in the Mojave Basin Shallow Aquifer Study Unit, 2018—Results from the California GAMA Priority Basin Project: U.S. Geological Survey data release, available at https://doi.org/10.5066/P9C7U6DW.
Groover, K.D., Izbicki, J.A., Benzel, W., Morrison, J., and Foster, A.L., 2023, Chromium in minerals and selected aquifer materials, chap. C of Natural and anthropogenic (human-made) hexavalent chromium, Cr(VI), in groundwater near a mapped plume, Hinkley, California: U.S. Geological Survey Professional Paper 1885-C, 49 p. [Available at https://doi.org/10.3133/pp1885C.]
Haddon, E.K., Miller, D.M., Langenheim, V.E., Liu, T., Walkup, L.C., and Wan, E., 2018, Initiation and rate of slip on the Lockhart and Mt. General faults in southern Hinkley Valley, California, in Miller, D.M., ed., Against the current—The Mojave River from sink to source: The 2018 Desert Symposium Field Guide and Proceedings, April 2018, accessed May 1, 2024, at https://www.desertsymposium.org/publications/2018_Against_the_current.pdf.
Hardt, W.F., 1971, Hydrologic analysis of Mojave River basin, California, using electric analog model: U.S. Geological Survey Open File Report 72–157, 84 p. [Available at https://doi.org/10.3133/ofr72157.]
Harkness, J.S., and Jurgens, B.C., 2022, Effects of imported recharge on fluoride trends in groundwater used for public supply in California: Science of The Total Environment, v. 830, no. 154782. [Available at https://doi.org/10.1016/j.scitotenv.2022.154782.]
Hem, J.D., 1985, Study and interpretation of the chemical characteristics of natural water: U.S. Geological Survey Water Supply Paper 2254, 263 p. [Available at https://doi.org/10.3133/wsp2254.]
Hirsch, R.M., Alley, W.M., and Wilber, W.G., 1988, Concepts for a national water-quality assessment program: U.S. Geological Survey Circular 1021, 42 p. [Available at https://doi.org/10.3133/cir1021.]
Huff, J.A., Clark, D.A., and Martin, P., 2002, Lithologic and ground-water data for monitoring sites in the Mojave River and Warren Valley basins, San Bernardino County, California, 1992–1998: U.S. Geological Survey Open-File Report 2002–354, 15 p. [Available at https://doi.org/10.3133/ofr02354.]
Ivahnenko, T., and Barbash, J.E., 2004, Chloroform in the hydrologic system—Sources, transport, fate, occurrence, and effects on human health and aquatic organisms: U.S. Geological Survey Scientific Investigations Report 2004–5137, 34 p. [Available at https://doi.org/10.3133/sir20045137.]
Izbicki, J.A., 2004, Source and movement of ground water in the western part of the Mojave Desert, southern California, USA: U.S. Geological Survey Water-Resources Investigations Report 2003–4313, 36 p. [Available at https://doi.org/10.3133/wri034313.]
Izbicki, J.A., 2007, Physical and temporal isolation of mountain headwater streams in the western Mojave Desert, southern California: Journal of the American Water Resources Association, v. 43, no. 1, p. 26–40. [Available at https://doi.org/10.1111/j.1752-1688.2007.00004.x.]
Izbicki, J.A., 2008, Chromium concentrations, chromium isotopes, and nitrate in the unsaturated zone and at the water-table interface, El Mirage, California: Transmittal memo to the Lahontan Regional Water Quality Control Board, accessed January 23, 2020, at https://www.waterboards.ca.gov/lahontan/publications_forms/available_documents/molycorp_elmirage1208.pdf.
Izbicki, J.A., 2023, Natural and anthropogenic (human-made) hexavalent chromium, Cr(VI), in groundwater near a mapped plume, Hinkley, California: U.S. Geological Survey Professional Paper 1885, variously paged. [Available at https://doi.org/10.3133/pp1885.]
Izbicki, J.A., and Michel, R.L., 2004, Movement and age of ground water in the western part of the Mojave Desert, southern California, USA: U.S. Geological Survey Water-Resources Investigations Report 2003–4314, 42 p. [Available at https://doi.org/10.3133/wri034314.]
Izbicki, J.A., Ball, J.W., Bullen, T.D., and Sutley, S.J., 2008, Chromium, chromium isotopes and selected trace elements, western Mojave Desert, USA: Applied Geochemistry, v. 23, no. 5, p. 1325–1352. [Available at https://doi.org/10.1016/j.apgeochem.2007.11.015.]
Izbicki, J.A., Bullen, T.D., Martin, P., and Schroth, B., 2012, Delta Chromium-53/52 isotopic composition of native and contaminated groundwater, Mojave Desert, USA: Applied Geochemistry, v. 27, no. 4, p. 841–853. [Available at https://doi.org/10.1016/j.apgeochem.2011.12.019.]
Izbicki, J.A., Flint, A.L., O’Leary, D.R., Nishikawa, T., Martin, P., Johnson, R.D., and Clark, D.A., 2015b, Storage and mobilization of natural and septic nitrate in thick unsaturated zones, California: Journal of Hydrology, v. 524, p. 147–165. [Available at https://doi.org/10.1016/j.jhydrol.2015.02.005.]
Izbicki, J.A., Groover, K.D., and Seymour, W., 2023a, Arsenic, chromium, uranium, and vanadium in rock, alluvium, and groundwater, Mojave River and Morongo groundwater basins, southern California: U.S. Geological Survey Scientific Investigations Report 2023–5089, 96 p. [Available at https://doi.org/10.3133/sir20235089.]
Izbicki, J.A., McCleskey, R.B., Burton, C.A., Clark, D.A., and Smith, G.A., 2023b, Groundwater chemistry and hexavalent chromium, Chapter E of Natural and anthropogenic (human-made) hexavalent chromium, Cr(VI), in groundwater near a mapped plume, Hinkley, California: U.S. Geological Survey Professional Paper 1885-E, 63 p. [Available at https://doi.org/10.3133/pp1885E.]
Izbicki, J.A., Wright, M.T., Seymour, W.A., McCleskey, R.B., Fram, M.S., Belitz, K., Esser, B.K, 2015a, Cr(VI) occurrence and geochemistry in water from public-supply wells in California: Applied Geochemistry, v. 63, p. 203–217. [Available at https://doi.org/10.1016/j.apgeochem.2015.08.007.]
Jackson, W.A., Böhlke, J.K., Gu, B., Hatzinger, P.B., and Sturchio, N.C., 2010, Isotopic composition and origin of indigenous natural perchlorate and co-occurring nitrate in the southwestern United States: Environmental Science & Technology, v. 44, no. 13, p. 4869–4876. [Available at https://doi.org/10.1021/es903802j.]
Jackson, W.A., Böhlke, J.K., Andraski, B.J., Fahlquist, L., Bexfield, L., Eckardt, F.D., Gates, J.B., Davila, A.F., McKay, C.P., Rao, B., Sevanthi, R., Rajagopalan, S., Estrada, N., Sturchio, N., Hatzinger, P.B., Anderson, T.A., Orris, G., Betancourt, J., Stonestrom, D., Latorre, C., Li, Y., and Harvey, G.J., 2015, Global patterns and environmental controls of perchlorate and nitrate co-occurrence in arid and semi-arid environments: Geochimica et Cosmochimica Acta, v. 164, p. 502–522. [Available at https://doi.org/10.1016/j.gca.2015.05.016.]
Johnson, T.D., and Belitz, K., 2015, Identifying the location and population served by domestic wells in California: Journal of Hydrology—Regional Studies, v. 3, p. 31–86. [Available at https://doi.org/10.1016/j.ejrh.2014.09.002.]
Johnson, T.M., and DePaolo, D.J., 1997, Rapid exchange effects on isotope ratios in groundwater systems—1. Development of a transport-dissolution-exchange model: Water Resources Research, v. 33, no. 1, p. 187–195. [Available at https://doi.org/10.1029/96WR02714.]
Jurgens, B.C., Fram, M.S., Belitz, K., Burow, K.R., and Landon, M.K., 2010, Effects of groundwater development on uranium—Central Valley, California, USA: Groundwater, v. 48, no. 6, p. 913–928. [Available at https://doi.org/10.1111/j.1745-6584.2009.00635.x.]
Jurgens, B.C., Jasper, M., Nguyen, D.H., and Bennett, G.L., 2018, USGS CA GAMA-PBP Groundwater-quality results—Assessment and Trends: U.S. Geological Survey web page, accessed June 1, 2022, at https://doi.org/10.5066/P91WJ2G1.
Kendall, C., Elliott, E.M., and Wankel, S.D., 2008, Tracing anthropogenic inputs of nitrogen to ecosystems, chap. 12 in Michner, R., and Lajtha, K., eds., Stable isotopes in ecology and environmental science (2d ed.): Wiley Online Books, p. 375–450, accessed September 10, 2023, at https://doi.org/10.1002/9780470691854.ch12.
Kulongoski, J.T., Hilton, D.R., and Izbicki, J.A., 2003, Helium isotope studies in the Mojave Desert, California—Implications for groundwater chronology and regional seismicity: Chemical Geology, v. 202, nos. 1–2, p. 95–113. [Available at https://doi.org/10.1016/j.chemgeo.2003.07.002.]
Lahontan Regional Water Quality Control Board, 2012, Barstow groundwater perchlorate contamination: Lahontan Regional Water Quality Control Board fact sheet, accessed August 21, 2019, at: https://www.waterboards.ca.gov/lahontan/water_issues/programs/nitrate_perchlorate_information/docs/perchlorlate/factsheet0412.pdf.
Lahontan Regional Water Quality Control Board, 2018, Nitrate status report, Soapmine Rd, 1993 to 2002: Lahontan Regional Water Quality Control Board staff letter, accessed August 21, 2019, at https://documents.geotracker.waterboards.ca.gov/regulators/deliverable_documents/2936705648/Response%20to%20Questions%20Raised%20at%20January%202018%2 0WB%20Meeting.pdf.
Landon, M.K., Belitz, K., Jurgens, B.C., Kulongoski, J.T., and Johnson, T.D., 2010, Status and understanding of groundwater quality in the central-eastside San Joaquin Basin, 2006—California GAMA Priority Basin project: U.S. Geological Survey Scientific Investigations Report 2009–5266, 97 p. [Available at https://doi.org/10.3133/sir20095266.]
Langenheim, V.E., Morita, A.Y., Martin, A.J., Jordan, J., and Haddon, E.K., 2019, Gravity data of the Hinkley area, southern California: U.S. Geological Survey data release, available at https://doi.org/10.5066/P9FV5LG5.
Levy, Z.F., and Fram, M.S., 2021, Status and understanding of groundwater quality in the northern Sierra Nevada foothills domestic-supply aquifer study units, 2015–17—California GAMA Priority Basin Project: U.S. Geological Survey Scientific Investigations Report 2021–5019, 120 p. [Available at https://doi.org/10.3133/sir20215019.]
Lindsey, B.D., Jurgens, B.C., and Belitz, K., 2019, Tritium as an indicator of modern, mixed, and premodern groundwater age: U.S. Geological Survey Scientific Investigations Report 2019–5090, 18 p. [Available at https://doi.org/10.3133/sir20195090.]
Lines, G.C., 1996, Ground-water and surface-water relations along the Mojave River, southern California: U.S. Geological Survey Water-Resources Investigations Report 95–4189, 43 p. [Available at https://doi.org/10.3133/wri954189.]
Lybrand, R.A., Michalski, G., Graham, R.C., and Parker, D.R., 2013, The geochemical associations of nitrate and naturally formed perchlorate in the Mojave Desert, California, USA: Geochmica et Cosmochimica Act, v. 104, p. 136–147, accessed April 23, 2023, at https://doi.org/10.1016/j.gca.2012.10.028.
Manning, A.H., Mills, C.T., Morrison, J.M., and Ball, L.B., 2015, Insights into controls on hexavalent chromium in groundwater provided by environmental tracers, Sacramento Valley, California, USA: Applied Geochemistry, v. 62, p. 186–199. [Available at https://doi.org/10.1016/j.apgeochem.2015.05.010.]
Mathany, T.M., and Belitz, K., 2009, Groundwater quality data in the Mojave study unit, 2008—Results from the California GAMA Program: U.S. Geological Survey Data Series 440, 81 p. [Available at https://doi.org/10.3133/ds440.]
Mathany, T.M., Wright, M.T., Beuttel, B.S., and Belitz, K., 2012, Groundwater-quality data in the Borrego Valley, Central Desert, and Low-Use Basins of the Mojave and Sonoran Deserts study unit, 2008–2010—Results from the California GAMA Program: U.S. Geological Survey Data Series 659, 100 p. [Available at https://doi.org/10.3133/ds659.]
McMahon, P.B., Brown, C.J., Johnson, T.D., Belitz, K., and Lindsey, B.D., 2020, Fluoride occurrence in United States groundwater: Science of The Total Environment, v. 732, no. 139217. [Available at https://doi.org/10.1016/j.scitotenv.2020.139217.]
McNutt, R.H., 2000, Strontium isotopes, in Cook, P., and Herczeg, A.L., eds., Environmental tracers in subsurface hydrology: Boston, Dordrecht, London, Kluwer Academic Publishers, p. 233–260. [Available at https://doi.org/10.1007/978-1-4615-4557-6_8.]
Meisling, K.E., and Weldon, R.J., 1989, Late Cenozoic tectonics of the northwestern San Bernardino Mountains, southern California: Geological Society of America Bulletin, v. 101, p. 106–128. [Available at https://pubs.geoscienceworld.org/gsa/gsabulletin/article/101/1/106/182199/Late-Cenozoic-tectonics-of-the-northwestern-San.]
Metzger, L.F., Landon, M.K., House, S.F., and Olsen, L.D., 2015, Mapping selected trace elements and major ions, 2000–2012, Mojave River and Morongo Groundwater Basins, Southwestern Mojave Desert, San Bernardino County, California: U.S. Geological Survey data release, available at https://doi.org/10.5066/F7Q23X95.
Miller, D.M., 2017, The late Cenozoic eastern California shear zone after 25 years of study, in Reynolds, R.E., ed., ECSZ does it—Revisiting the eastern California shear zone: The 2017 Desert Symposium Field Guide and Proceedings, April 2017, accessed May 1, 2024, at https://www.desertsymposium.org/publications/2017_ECSZ_does_it.pdf.
Miller, D.M., Langenheim, V.E., and Haddon, E.K., 2020, Geologic map and borehole stratigraphy of Hinkley Valley and vicinity, San Bernardino County, California: U.S. Geological Survey Scientific Investigations Map 3458, 23 p., 2 sheets, scale 1:24,000. [Available at https://doi.org/10.3133/sim3458.]
Miller, D.M., Reynolds, R.E., Groover, K.D., Buesch, D.C., Brown, H.J., Cromwell, G.A., Densmore, J., Garcia, A.L., Hughson, D., Knott, J.R., and Lovich, J., 2018, Against the current—The Mojave River from sink to source—The 2018 Desert Symposium field trip road log: The 2018 Desert Symposium Field Guide and Proceedings, April 2018, accessed May 1, 2024, at https://www.desertsymposium.org/publications/2018_Against_the_current.pdf.
Miller, J.S., Glazner, A.F., and Crowe, D.E., 1996, Muscovite-garnet granites in the Mojave Desert—Relation to crustal structure of the Cretaceous arc: Geology, v. 24, no. 4, p. 335–338. [Available at https://pubs.geoscienceworld.org/gsa/geology/article/24/4/335/206508/Muscovite-garnet-granites-in-the-Mojave-Desert.]
Mojave Water Agency, 2023, Geospatial library: Mojave Water Agency website, accessed February 8, 2023, at https://www.mojavewater.org/data-maps/geospatial-library/.
Morrison, J.M., Benzel, W.M., Holm-Denoma, C.S., and Bala, S., 2018, Grain size, mineralogic, and trace-element data from field samples near Hinkley, California: U.S. Geological Survey data release, available at https://doi.org/10.5066/P9HUPMG0.
Nimz, G.J., 1995, Lithogenic and cosmogenic tracers in catchment hydrology: Lawrence Livermore National Laboratory UCRL-ID-119659, 44 p. [Available at https://doi.org/10.2172/67738.]
Norman, J.E., Toccalino, P.L., and Morman, S.A., 2018, Health-based screening levels for evaluating water-quality data (2d ed.): U.S. Geological Survey web page, accessed June 6, 2022, at https://doi.org/10.5066/F71C1TWP.
Parker, D.R., Seyfferth, A.L., and Reese, B.K., 2008, Perchlorate in groundwater—A synoptic survey of “pristine” sites in the coterminous United States: Environmental Science & Technology, v. 42, no. 5, p. 1465–1471. [Available at https://doi.org/10.1021/es7021957.]
Parsons, M.C., Hancock, T.C., Kulongoski, J.T., and Belitz, K., 2014, Status of groundwater quality in the Borrego Valley, Central Desert, and low-use basins of the Mojave and Sonoran Deserts study unit, 2008–2010—California GAMA Priority Basin Project: U.S. Geological Survey Scientific Investigations Report 2014–5001, 88 p. [Available at https://doi.org/10.3133/sir20145001.]
Piper, A.M., 1944, A graphic procedure in the geochemical interpretation of water analyses: EOS, Transactions American Geophysical Union, v. 25, no. 6, p. 914–928. [Available at https://doi.org/10.1029/TR025i006p00914.]
Plummer, N., Bexfield, L.M., Anderholm, S.K., Sanford, W.E., and Busenberg, E., 2004, Geochemical characterization of ground-water flow in the Santa Fe Group aquifer system, Middle Rio Grande Basin, New Mexico: U.S. Geological Survey Water-Resources Investigations Report 2003–4131, 395 p. [Available at https://doi.org/10.3133/wri034131.]
Reimann, C., and Caritat, P., 1998, Chemical elements in the Environment: Berlin, Germany, Springer-Verlage, 398 p. [Available at https://doi.org/10.1007/978-3-642-72016-1.]
Rowe, B.L., Toccalino, P.L., Moran, M.J., Zogorski, J.S., and Price, C.V., 2007, Occurrence and potential human-health relevance of volatile organic compounds in drinking water from domestic wells in the United States: Environmental Health Perspectives, v. 115, no. 11, p. 1539–1546. [Available at https://doi.org/10.1289/ehp.10253.]
Schroeder, R.A., Martin, P.M., and Bohlke, J.K., 1993, Chemical, isotopic, and microbiological evidence for denitrification during transport of domestic wastewater through a thick unsaturated zone in the Mojave Desert, San Bernardino County, California: U.S. Geological Survey Open File Report 93–414, 10 p. [Available at https://doi.org/10.3133/ofr93414.]
Scott, J.C., 1990, Computerized stratified random site-selection approaches for design of a ground-water-quality sampling network: U.S. Geological Survey Water-Resources Investigations Report 90–4101, 109 p. [Available at https://doi.org/10.3133/wri904101.]
SCS Engineers, 2017, Final report—City of Adelanto waste water treatment plant: Report to Lahontan Regional Water Quality Control Board, WDID no. 6B369805001, accessed January 23, 2020, at https://documents.geotracker.waterboards.ca.gov/esi/uploads/geo_report/4989120721/WDR100026851.PDF.
Shelton, J.L., and Tejeda, E., 2024, California Groundwater Ambient Monitoring and Assessment (GAMA) Program Priority Basin Project—Domestic-supply assessment: U.S. Geological Survey Fact Sheet 2024–3002, 2 p. [Available at https://doi.org/10.3133/fs20243002.]
Smedley, P.L., and Kinniburgh, D.G., 2017, Molybdenum in natural waters—A review of occurrence, distributions, and controls: Applied Geochemistry, v. 84, p. 387–432, accessed April 23, 2023, at https://doi.org/10.1016/j.apgeochem.2017.05.008.
Smith, D.B., Solano, F., Woodruff, L.G., Cannon, W.F., and Ellefsen, K.J., 2019, Geochemical and mineralogical maps, with interpretation, for soils of the conterminous United States: U.S. Geological Survey Scientific Investigations Report 2017–5118. [Available at https://doi.org/10.3133/sir20175118.]
Stamos, C.L., Cox, B.F., Izbicki, J.A., and Mendez, G.O., 2003, Geologic setting, geohydrology and groundwater quality near the Helendale fault in the Mojave River Basin, San Bernardino County, California: U.S. Geological Survey Water-Resources Investigations Report 2003–4069, 44 p. [Available at https://doi.org/10.3133/wri034069.]
Stamos, C.L., Martin, P., Nishikawa, T., and Cox, B.F., 2001, Simulation of ground-water flow in the Mojave River basin, California: U.S. Geological Survey Water-Resources Investigations Report 2001–4002, 129 p. [Available at https://doi.org/10.3133/wri014002.]
Stone, P., Brown, H.J., Cecil, M.R., Fleck, R.J., Vazquez, J.A., and Fitzpatrick, J.A., 2021, Geochronologic, isotopic, and geochemical data from pre-Cretaceous plutonic rocks in the Lane Mountain area, San Bernardino County, California: U.S. Geological Survey Open-File Report 2021–1094, 74 p. [Available at https://doi.org/10.3133/ofr20211094.]
Stork, S.V., McGregor, A.M., Balkan, M., Arroyo-Lopez, J., Borkovich, J.G., Lor, V., Peng, S., and Jasper, M., 2019, Attributed California water supply well completion report data for selected areas, derived from CA WCR OSCWR data: U.S. Geological Survey data release, available at https://doi.org/10.5066/P9R1V41Q.
Sturchio, N.C., Hoaglund, J.R., III, Marroquin, R.J., Beloso, A.D., Jr., Heraty, L.J., Bortz, S.E., and Patterson, T.L., 2012, Isotopic mapping of groundwater perchlorate plumes: Groundwater, v. 50, no. 1, p. 94–102. [Available at https://doi.org/10.1111/j.1745-6584.2011.00802.x.]
Systat Software, Inc., 2022, SigmaPlot for graphing data visualization (ver. 14.5, July 2022): Systat Software, Inc., accessed July 18, 2022, at https://systatsoftware.com/sigmaplot/.
Thompson, D.G., 1929, The Mohave Desert region, California—A geographic, geologic, and hydrologic reconnaissance: U.S. Geological Survey Water Supply Paper 578, 759 p. [Available at https://doi.org/10.3133/wsp578.]
Toccalino, P.L., and Hopple, J.A., 2010, The quality of our Nation’s waters—Quality of water from public-supply wells in the United States, 1993–2007—Overview of major findings: U.S. Geological Survey Circular 1346, 58 p., accessed February 3, 2022, at https://doi.org/10.3133/cir1346.
Toccalino, P.L., Norman, J.E., Phillips, R.H., Kauffman, L.J., Stackelberg, P.E., Nowell, L.H., Krietzman, S.J., and Post, G.B., 2004, Application of health-based screening levels to ground-water quality data in a state-scale pilot effort: U.S. Geological Survey Scientific Investigations Report 2004–5174, 64 p. [Available at https://doi.org/10.3133/sir20045174.]
Umari, A.M., Martin, P.M., Schroeder, R.A., Duell, L.F., Jr., and Fay, R.G., 1995, Potential for ground-water contamination from movement of wastewater through the unsaturated zone, upper Mojave River Basin, California: U.S. Geological Survey Water-Resources Investigations Report 93–4137, 117 p. [Available at https://doi.org/10.3133/wri934137.]
U.S. Census Bureau, 1992, Census of population and housing, 1990—Summary tape file 3A: Washington, D.C., U.S. Census Bureau, machine-readable data, accessed May 1, 2024, at https://www.census.gov/data/datasets/1990/dec/summary-file-3.html.
U.S. Centers for Disease Control and Prevention, 2006, Rural water supplies and water-quality issues, chap. 8 in Healthy housing reference manual: Atlanta, Ga., U.S. Department of Health and Human Services accessed February 7, 2024, at http://www.cdc.gov/nceh/publications/books/housing/housing_ref_manual_2012.pdf.
U.S. Environmental Protection Agency, 2018, 2018 Edition of the drinking water standards and health advisories: Washington, D.C., U.S. Environmental Protection Agency EPA 822-F-18-001, 20 p. [Available at https://www.epa.gov/system/files/documents/2022-01/dwtable2018.pdf.]
U.S. Environmental Protection Agency, 2019, Human health benchmarks for pesticides website: U.S. Environmental Protection Agency, accessed November 2019 at https://iaspub.epa.gov/apex/pesticides/f?p=HHBP:home.
U.S. Geological Survey, 2015, National field manual for the collection of water-quality data: U.S. Geological Survey Techniques of Water-Resources Investigations Book 09, chaps. A1–A9, variously paginated. [Available at https://doi.org/10.3133/twri09.]
U.S. Geological Survey, 2016, National geochemical database: U.S. Geological Survey database, accessed September 9, 2020, at https://mrdata.usgs.gov/#geochemistry.
U.S. Geological Survey, 2022, USGS water data for the Nation: U.S. Geological Survey National Water Information System database, accessed February 4, 2022, at https://doi.org/10.5066/F7P55KJN.
U.S. Geological Survey, 2023, Mojave water-level studies: U.S. Geological Survey website, accessed April 23, 2023, at https://ca.water.usgs.gov/mojave/mojave-water-levels.html.
Warden, J.G., Izbicki, J.A., Sültenfuß, J., Scheiderich, K., and Fitzpatrick, J., 2023, Environmental tracers of groundwater source, age, and geochemical evolution, chap. F of Izbicki, J.A., Natural and anthropogenic (human-made) hexavalent chromium, Cr(VI), in groundwater near a mapped plume, Hinkley, California: U.S. Geological Survey Professional Paper 1885-F, 74 p. [Available at https://doi.org/10.3133/pp1885F.]
Welch, A.H., Lico, M.S., and Hughes, J.L., 1988, Arsenic in groundwater of the western United States: Groundwater, v. 26, no. 3, p. 333–347. [Available at https://doi.org/10.1111/j.1745-6584.1988.tb00397.x.]
Welch, A.H., Westjohn, D.B., Helsel, D.R., and Wanty, R.B., 2000, Arsenic in ground water of the United States—Occurrence and geochemistry: Groundwater, v. 38, no. 4, p. 589–604. [Available at https://doi.org/10.1111/j.1745-6584.2000.tb00251.x.]
Wright, M.T., and Belitz, K., 2010, Factors controlling the regional distribution of vanadium in groundwater: Groundwater, v. 48, no. 4, p. 515–525. [Available at https://doi.org/10.1111/j.1745-6584.2009.00666.x.]
Wright, M.T., Fram, M.S., and Belitz, K., 2015, Geochemical conditions and the occurrence of selected trace elements in groundwater basins used for public drinking-water supply, desert and basin and range hydrogeologic provinces, 2006–11—California GAMA Priority Basin Project: U.S. Geological Survey Scientific Investigations Report 2014–5173, 48 p. [Available at https://doi.org/10.3133/sir20145173.]
Zogorski, J.S., Carter, J.M., Ivahnenko, T., Lapham, W.W., Moran, M.J., Rowe, B.L., Squillace, P.J., and Toccalino, P.L., 2006, Volatile organic compounds in the Nation’s ground water and drinking-water supply wells: U.S. Geological Survey Circular 1292, 101 p., accessed November 18, 2020, at https://doi.org/10.3133/cir1292.
Conversion Factors
Temperature in degrees Celsius (°C) may be converted to degrees Fahrenheit (°F) as follows:
°F = (1.8 × °C) + 32.
Temperature in degrees Fahrenheit (°F) may be converted to degrees Celsius (°C) as follows:
°C = (°F − 32) / 1.8.
Datum
Vertical coordinate information is referenced to the North American Vertical Datum of 1988 (NAVD 88).
Horizontal coordinate information is referenced to North American Datum of 1983 (NAD 83).
Altitude, as used in this report, refers to distance above the vertical datum.
Supplemental Information
Specific conductance is given in microsiemens per centimeter at 25 degrees Celsius (µS/cm at 25 °C).
Concentrations of chemical constituents in water are given in either milligrams per liter (mg/L), micrograms per liter (µg/L), or nanograms per liter (ng/L).
Activities for radiological constituents in water are given in picocuries per liter (pCi/L).
Concentrations of tritium are presented in tritium units (TU). 1 TU equals 3.19 pCi/L.
Carbon-14 data are expressed as percent modern carbon (pmC).
Results for measurements of stable isotopes of an element (with symbol E) in water, solids, and dissolved constituents commonly are expressed as the relative difference in the ratio of the number of the less abundant isotope (iE) to the number of the more abundant isotope of a sample with respect to the measurement of a standard reference material.
Abbreviations
87Sr/86Sr
isotopic ratio of strontium-87 to strontium-86
δD
delta deuterium in water
δ18O-H2O
delta oxygen-18 in water
E. coli
Escherichia coli
EPA
U.S. Environmental Protection Agency
GAMA
Groundwater Ambient Monitoring and Assessment Program
GAMA-PBP
Groundwater Ambient Monitoring and Assessment Program Priority Basin Project
HAL-US
U.S. Environmental Protection Agency lifetime health advisory level
HBSL
health-based screening level
HHBP-US
U.S. Environmental Protection Agency human-health benchmarks for pesticides
MCL
maximum contaminant level
MCL-CA
California State Water Resources Control Board Division of Drinking Water maximum contaminant level
MCL-US
U.S. Environmental Protection Agency maximum contaminant level
MTBE
methyl tert-butyl ether
MOBS
Mojave Basin Domestic-Supply Aquifer study unit
MOJO
Mojave Basin Public-Supply Aquifer study unit
NL-CA
California State Water Resources Control Board Division of Drinking Water (SWRCB-DDW) notification level
NWIS
National Water Information System
PCE
tetrachloroethene
RL-CA
California State Water Resources Control Board Division of Drinking Water (SWRCB-DDW) response level
SMCL
secondary maximum contaminant level
SWRCB
California State Water Resources Control Board
SWRCB-DDW
California State Water Resources Control Board Division of Drinking Water
TDS
total dissolved solids
USGS
U.S. Geological Survey
VOC
volatile organic compound
For more information concerning the research in this report, contact the
Director, California Water Science Center
U.S. Geological Survey
6000 J Street, Placer Hall
Sacramento, California 95819
https://www.usgs.gov/centers/ca-water/
Publishing support provided by the Science Publishing Network,
Sacramento Publishing Service Center
Disclaimers
Any use of trade, firm, or product names is for descriptive purposes only and does not imply endorsement by the U.S. Government.
Although this information product, for the most part, is in the public domain, it also may contain copyrighted materials as noted in the text. Permission to reproduce copyrighted items must be secured from the copyright owner.
Suggested Citation
Groover, K.D., Fram, M.S., and Levy, Z.F., 2024, Status and understanding of groundwater quality in the Mojave Basin Domestic-Supply Aquifer study unit, 2018—California GAMA Priority Basin Project: U.S. Geological Survey Scientific Investigations Report 2024–5019, 62 p., https://doi.org/10.3133/sir20245019.
ISSN: 2328-0328 (online)
Study Area
| Publication type | Report |
|---|---|
| Publication Subtype | USGS Numbered Series |
| Title | Status and understanding of groundwater quality in the Mojave Basin Domestic-Supply Aquifer study unit, 2018—California GAMA Priority Basin Project |
| Series title | Scientific Investigations Report |
| Series number | 2024-5019 |
| DOI | 10.3133/sir20245019 |
| Publication Date | May 14, 2024 |
| Year Published | 2024 |
| Language | English |
| Publisher | U.S. Geological Survey |
| Publisher location | Reston, VA |
| Contributing office(s) | California Water Science Center |
| Description | x, 62 p. |
| Country | United States |
| State | California |
| Online Only (Y/N) | Y |