

Characterization of the Water Resources of the Pamunkey River Watershed in Virginia—A Review of Water Science, Management, and Traditional Ecological Knowledge
Links
- Document: Report (32.9 MB pdf) , HTML , XML
- Download citation as: RIS | Dublin Core
Acknowledgments
The authors thank the Pamunkey Indian Tribe for their assistance and guidance with report preparation and for their openness and collaborative spirit. The authors thank Chief Robert Gray for educating us on specific issues facing the Pamunkey Indian Tribe. The authors also thank Pamunkey Tribe administrator, Rebecca Hill; Pamunkey Tribal Council member, Allyson Gray; and retired Pamunkey Tribe Natural Resources and Environmental Director, Warren Taylor for educating us on issues facing the Pamunkey Indian Tribe, Reservation, and the Pamunkey River.
The authors thank Elaine Rush for helping prepare this report; Erik Kaseloo for providing technical assistance during interviews; and Nina Brundle, Sky Kincaid, and Liz Buikema for summarizing this report into a digital storytelling product.
Jason Sorenson and Brent Trickett of the U.S. Geological Survey and Joseph Morina of Virginia Commonwealth University are thanked for their thoughtful reviews that have improved this report.
Abstract
In central Virginia, the Pamunkey Indian Tribe and Reservation are facing increasingly complex water resource issues related to quantity and quality. Documentation of surface-water, groundwater, water quality, land subsidence, sea-level rise, and river ecology issues in the Pamunkey River watershed and incorporation of traditional ecological knowledge into these research topics may improve understanding of the water resources broadly. This report summarizes the relevant traditional ecological knowledge and scientific literature to elucidate gaps in the total combined knowledge of a suite of water science topics concerning the Pamunkey River watershed. This suite of water science topics includes some of the issues that the Pamunkey Indian Tribe and Reservation are facing within the watershed: fragmentation of streams and management of streamflow, flooding, degrading water quality, groundwater extraction, relative sea-level rise, rapid changes in ecosystems, loss of ecological and biological diversity, and climate change. Gaps in total combined knowledge are pervasive throughout each of these water resource topics. Identifying these knowledge gaps can help inform future research and management strategies.
Introduction
The Pamunkey Indian Tribe is one of the oldest, well-known, and prominent groups of people native to North America. The Tribe’s well-known and prominent status comes in part from the widely known Pamunkey Indians, Powhatan and Pocahontas, who were some of the first people to interact with Europeans (Moretti-Langholtz, 2005). Although only recently becoming a federally recognized Indian Tribe as of January 28, 2016 (Bureau of Indian Affairs, 2015), their history and relationship with the Pamunkey River, knowledge of its functions, and connection to the entire ecosystem throughout time is a precious and invaluable resource.
The riparian habitats, woods, waters, and wetlands of the Pamunkey River are critical to tribal health, economics, culture, and identity (R. Gray, Chief, Pamunkey Indian Tribe, oral commun., 2022). The fate of the river and the fate of the Tribe are inextricably linked, which is why stewardship of the Pamunkey River is crucial (J.H. Langston, Pamunkey Indian Tribe, Elder, oral commun., 2022).
For millennia, ancestral Pamunkey Indians used the river for travel, commerce, cultural activities, and sustenance (R. Hill). They collected clay for ceramics manufacturing from its banks; fished its waters for anadromous shad, herring, sturgeon, and other species; collected mussels, oysters, and clams from its bed; trapped turtles, muskrat, mink, beaver, and otter along its shores; hunted waterfowl; and gathered plants for food and medicinal purposes from its wetland habitats (W. Taylor, Pamunkey Indian Tribe member and retired Natural Resources and Environmental Director, oral commun., 2022). In upland and riparian forested habitat, they hunted deer, rabbits, and other game and collected a variety of nuts, fruits, and berries (W. Taylor, Pamunkey Indian Tribe member and retired Natural Resources and Environmental Director, oral commun., 2022).
The Pamunkey River and watershed were very different at the beginning of the Holocene Epoch, about 12,000 years ago, than they are today. Sea level along the mid-Atlantic coast was about 50 feet (ft) below sea levels in the early 21st century (Nienhuis and others, 2023; Riggs and others, 2011). Consequently, the flow of the Pamunkey River would have been unidirectional and would lack tidal influence, tidal freshwater marshes, and tidal freshwater forested wetlands (Riggs and others, 2011). By about 3,500 years ago, sea level had risen to within about 10 ft of its present level, resulting in the contemporary coastal systems Pamunkey Indians experience today (Riggs and others, 2011). The changing climate of the Holocene had profound impacts on the availability and seasonality of game, fish, and vegetation for hunting, fishing, and gathering. During this transitional ecological period, Indigenous populations began to gather food and resources less from terrestrial, sylvan environments and more from productive wetlands and estuarine environments associated with rising sea levels (Egghart, 2009). Also, around this period, Native Americans in eastern Virginia began to purposely modify local forest environments using fire, especially in floodplain settings (Egghart, 2009).
Native lifeways in eastern Virginia changed greatly around the 10th through the 11th century Common Era; these changes included increases in village size and the use of tropical cultigens, such as maize, beans, and squash in agriculture (Egghart, 2009). This period also saw the rise of ranked and politically complex societies in eastern Virginia.
The Pamunkey Indian Reservation is approximately 1,600 acres and is on a peninsula in the tidal Pamunkey River in King William County, Virginia (R. Gray, Pamunkey Indian Tribe, Chief, oral commun., 2022). The reservation is home to more than 30 tribal families, a fish hatchery, the Pamunkey Indian Museum and Cultural Center, and some important ceremonial sites (R. Gray, Pamunkey Indian Tribe, Chief, oral commun., 2022). Members of the Pamunkey Indian Tribe have a strong connection to, and respect for, water resources because they have harvested Alosa sapidissima (Wilson, 1811) (American shad), Alosa chrysochloris (Rafinesque, 1820) (river herring), and other river-dependent resources from the Pamunkey River throughout their history.
Purpose and Scope
Natural resources observations from the Pamunkey Indian Tribe have not been formally documented, and the findings of relevant scientific studies from other agencies and groups are not readily available for Tribal leaders to apply to management decisions.
This report provides a comprehensive review of the scientific literature about the water resources of the Pamunkey River and the Pamunkey Indian Tribe’s traditional ecological knowledge. This report also identifies gaps in scientific and traditional understanding and what the ongoing and emerging issues are pertaining to the Pamunkey River, its resources, and the people that live and depend on it.
The data and gaps in scientific and traditional ecological knowledge presented by this report are summarized by a geonarrative that allows for easy user access on an open platform (Brundle, 2023).
Description of Study Area
The Pamunkey River is in central Virginia (fig. 1). The Pamunkey River watershed and neighboring Mattaponi River watershed converge at the Town of West Point, Virginia, to form the York River, which drains into the Chesapeake Bay and then to the Atlantic Ocean. The Pamunkey River watershed comprises the Pamunkey River, its two major tributaries, the North and South Anna rivers, the Little River, which is a tributary of the North Anna River, and many smaller tributaries to these streams. Lake Anna is an impoundment on the North Anna River, created by a 100-ft tall earthen dam built in 1972, that stores approximately 487,000 acre-feet of water (U.S. Army Corps of Engineers, 2022); it is used for cooling water that has been heated at a nuclear energy facility and for many different recreational activities.
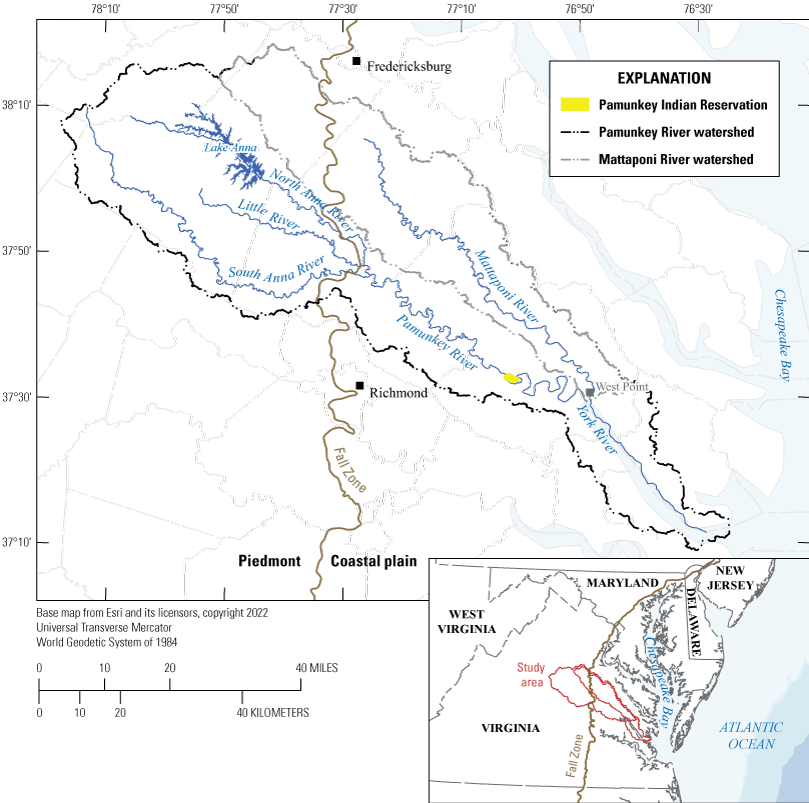
Map showing the York, Pamunkey, and Mattaponi rivers and their watershed boundaries in east-central, Virginia.
The Pamunkey River watershed flows southeasterly, encompasses approximately 1,470 square miles (mi2), and has a minimum and maximum elevation of −2.62 ft and 1,810 ft above the North American Vertical Datum of 1988 (NAVD 88), respectively (U.S. Geological Survey, 2021). The Pamunkey River is a tidal river, meaning downstream sections of the river are influenced by ocean tides, which can change or affect flow directions and pathways, water chemistry, and ecology.
The Pamunkey Indian Reservation is in the tidal section of the Pamunkey River, where the river has large meanders (fig. 1). Elevations of the Pamunkey Indian Reservation can be seen from lidar data measured in 2011 (fig. 2; U.S. Geological Survey, 2021). The elevations of the reservation range from approximately −2 to 16 ft, with large parts of the reservation land close to sea level that have low relief (Milligan and others, 2019).
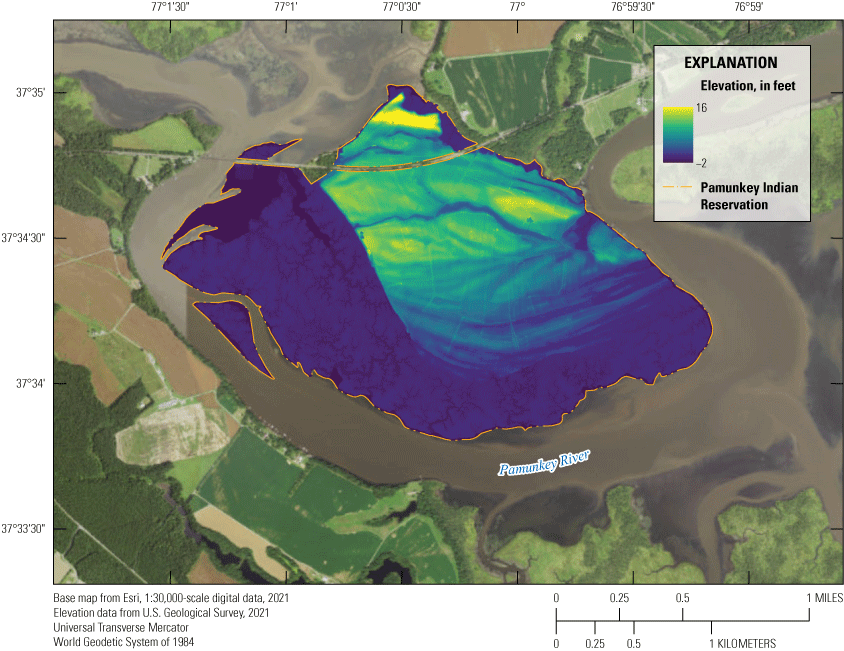
Map showing the Pamunkey Indian Reservation in King William County, Virginia. Elevations within the reservation range from −2 to 16 feet above average sea level, in feet above the North American Vertical Datum of 1988.
The Pamunkey River watershed spans multiple distinct geologies, which provide underlying resources that have evolved throughout time. The Pamunkey River watershed’s geology and rich landscape, which has evolved throughout time, contains many unique features that humans have interacted with and used to support their communities.
The Pamunkey River watershed includes two physiographic provinces that are separated by the Fall Zone (fig. 1). Physiographic provinces are large areas that are defined by the same general geomorphological features, such as physical landforms, processes, underlying geology, and climate. The Fall Zone, in the Eastern United States, refers to the location that separates the Piedmont physiographic province (Piedmont) in the west and the Coastal Plain physiographic province (Coastal Plain) in the east (Virginia Department of Conservation and Recreation, 2021). The Piedmont is between the Blue Ridge Mountains and the flat Coastal Plain and is known for its rolling hills. It is generally characterized by thick layers of soil underlain by saprolite, which is underlain by harder, resistant metamorphic and igneous rocks (Virginia Department of Conservation and Recreation, 2021). Within the Pamunkey River watershed, the Piedmont consists of crystalline rock and small areas of siliciclastic rock near the downstream ends of South Anna and Little rivers (Ator and others, 2005). The Piedmont has gone through cycles of deposition, uplift, deformation, and erosion (Virginia Department of Conservation and Recreation, 2021). The Coastal Plain is the region between the Fall Zone and the Atlantic coast. In Virginia, the Coastal Plain is broadly characterized by a low-relief, terraced landscape that has soft, unconsolidated alluvial sands, marine clays, silt, fossiliferous shells, and terrace gravels. Most river valleys in the Coastal Plain are estuarine where Holocene sea-level rise (SLR) created tidal sections of the streams (Virginia Department of Conservation and Recreation, 2021).
The melting and reformation of glaciers over time raised and lowered global sea levels and played an important role in the landscape evolution of the Pamunkey River. When glaciers were forming, global sea levels would fall, causing the Pamunkey River to down cut and erode Coastal Plain sediments to reach its outlet. When glaciers melted and global sea levels rose, older valley walls eroded. Flooding of the river over time eventually created estuaries (Gilmer and Berquist, 2015).
Land use in the Pamunkey River watershed is revealed through a 1-meter resolution land-use dataset from 2018 (Chesapeake Bay Program, 2023). The dataset shows that most of the watershed is forested, and the second- and third-most abundant land-use types are pasture and cropland, respectively (table 1). Pasture and cropland usage (for agriculture purposes) within the Pamunkey River watershed sums to 15.5 percent of the total area or approximately 227 mi2. This total includes agricultural plots on the Pamunkey Indian Reservation where Tribal members lease their land to others to cultivate, grow, and harvest crops, including corn, soybeans, and other vegetables. As of 2018, 2.6 percent of the watershed has impervious cover. Though a small percentage of the total, this represents over 38 mi2 of impervious cover within the watershed. Most of the impervious area comprises roads, commercial and industrial areas, sidewalks, and driveways. Because the human population increased throughout the Pamunkey River watershed from 2010 through 2020 and increases are expected to continue in the future (U.S. Census Bureau, 2022), additional impervious cover will probably be constructed.
Table 1.
Characterization of land use in the Pamunkey River watershed. Data from Chesapeake Bay Program (2023).Surface Water
The hydrologic characteristics of the Pamunkey River are important to understand because of the implications that they have on the riverine and estuarine environments, the ecosystem, human uses (for example, agriculture, water supply, and others), health, and safety. The timing and intensity of storms, potential flood risks, flow alterations caused by dams, and surface-water withdrawals all contribute to the hydrology of the Pamunkey River.
Hydrology
To understand surface-water hydrology, an understanding of the climate and meteorological patterns is a prerequisite. For this reason, the Pamunkey Indian Tribe have operated and maintained a meteorological station on their reservation since 2018, which measures precipitation accumulation, soil moisture, temperature and salinity, air temperature, wind speed and direction, relative humidity, solar radiation, and leaf wetness (W. Taylor, Pamunkey Indian Tribe member and retired Natural Resources and Environmental Director, oral commun., 2022). This meteorological station could eventually provide an understanding of hydrologic changes over time if this station continues to operate, but the datasets currently generated by the meteorological station as of 2023 are not long enough to provide historical context, or potential extreme or anomalous events. Continued operation of this monitoring station could enhance studies that evaluate meteorological data or model conditions throughout the Chesapeake Bay and support understanding of anomalies and trends at the scale of the Chesapeake Bay watershed. These studies generally predict increases in air temperature and precipitation and diverse changes to the physical riverine landscape and sediment and nutrient transport (Murphy and others, 2022; Ryberg and others, 2018; Rice and others, 2017; Najjar and others, 2009). There is a gap in climate and meteorological knowledge at the watershed scale for the Pamunkey and York river watersheds. However, traditional ecological knowledge suggests that in the Pamunkey River watershed, extreme events, like hurricanes with intense winds and precipitation, have been more frequent over the past 15 to 20 years (J.H. Langston, Pamunkey Indian Tribe, Elder, oral commun., 2022; T. Langston, Pamunkey Indian Tribe, Elder, oral commun.; J. Krigsvold, Pamunkey Indian Tribe, Elder, oral commun., 2022).
The U.S. Geological Survey (USGS) has computed the daily mean discharge and annual peak discharge, that is the maximum instantaneous discharge each year, of the Pamunkey River since 1941 and continues to compute these streamflow metrics. Data from USGS station number 01673000, Pamunkey River near Hanover, Virginia, allows for a basic understanding of the hydrology of the Pamunkey River (fig. 3; U.S. Geological Survey, 2022a). The average daily mean discharge from 1941 through 2021 was 986 cubic feet per second (ft3/s), and the minimum and maximum values were 13 and 39,300 ft3/s, respectively. Others have noted interseasonal and interannual discharge and periods of drought and flood vary greatly (Milligan and others, 2019; Hershner and others, 2009). Hershner and others (2009) reported that annual precipitation for the York River watershed was moderately correlated with the average annual discharge in the Pamunkey River (Hershner and others, 2009); however, the authors also found that annual precipitation was not closely correlated with annual streamflow yield in the Pamunkey River. Hershner and others (2009) suggest changes in groundwater storage and alterations to streamflow delivery from infrastructure might contribute to these variables not being correlated (Hershner and others, 2009).
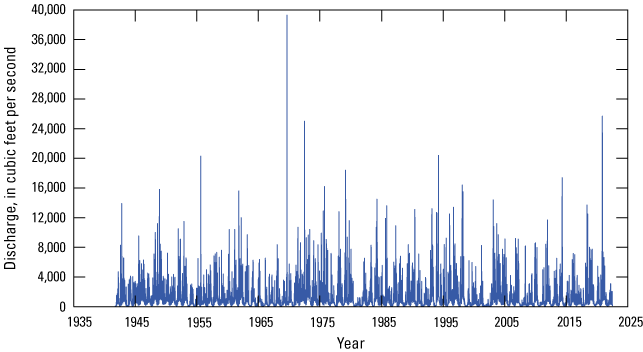
Graph showing the daily mean discharge of the Pamunkey River from 1941 through 2021. Data were acquired from U.S. Geological Survey station number 01673000 Pamunkey River near Hanover, Virginia (U.S. Geological Survey, 2022a).
Annual peak discharges for water years (for example, water year 1970 was from October 1, 1969 through September 30, 1970) 1942 through 2021 (fig. 4), do not show a distinguishable pattern. The average annual peak discharge from water years 1942 through 2021 was 10,505 ft3/s, and the minimum and maximum annual peak discharges over the same period were 1,790 and 40,300 ft3/s, respectively. Hershner and others (2009) calculated that peak discharge occurred on average once every 370 days from 1940 through 2006 on the Pamunkey River. Hershner and others (2009) assert that peak discharges were likely quelled after large reservoirs that regulate or divert flow began to be built in 1972. Since publication of Hershner and others (2009), annual peak discharge values from subsequent years are available, and from water years 2010 through 2021, peak discharges do not appear to be quelled, and the most recent water year, 2021, had the third largest peak discharge on record. Peak discharge measurements from future decades and a more thorough analysis of potential changes in peak discharge over time would be needed to evaluate if a statistically significant difference has occurred.
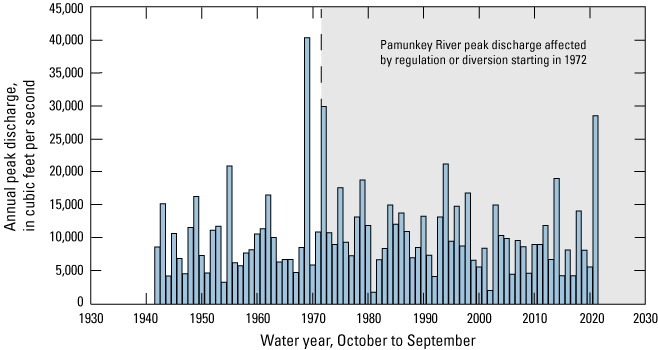
Graph showing annual peak discharge for the Pamunkey River from water years 1942 through 2021. Data acquired from U.S. Geological Survey station number 01673000 Pamunkey River near Hanover, Virginia (U.S. Geological Survey, 2022a).
The annual minimum 7-day moving average of daily mean discharge values from 1942 through 2021 were calculated to understand low-flow conditions over time in the Pamunkey River (fig. 5). More lower low-flow magnitudes were observed before 1972 than after, which is when major dam construction occurred in the watershed. Low flows calculated by the same annual minimum 7-day moving average of the daily mean discharge values were used by Hershner and others (2009); however, these authors only considered the period 1970 through 2007 and did not consider much data before the major dam installations in the 1970s. However, Hershner and others (2009) show that periods of the lowest low flows from 1970 through 2007 did not have particularly low amounts of annual precipitation and they hypothesized that low flows from 1970 through 2007 might potentially be caused by periods of seasonal drought (Hershner and others, 2009). The Pamunkey River watershed experienced drought from 1999 to 2002, which could help explain some of the low-flow conditions during that period. A complete understanding of how interannual drought and intra-annual seasonal drought might be affecting the Pamunkey River remains a gap in knowledge.
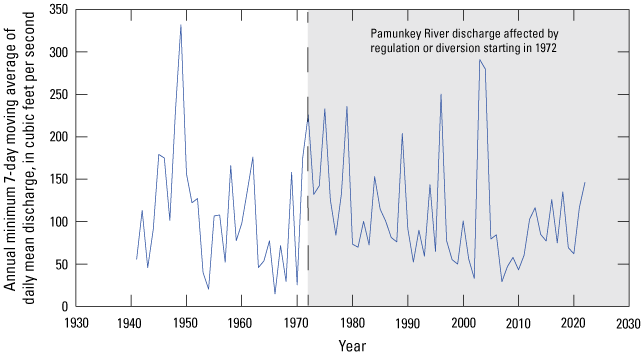
Graph showing the annual minimum 7-day moving average of daily mean discharge for the Pamunkey River from 1942 through 2021. Data acquired from U.S. Geological Survey station number 01673000 Pamunkey River near Hanover, Virginia (U.S. Geological Survey, 2022a).
Flood Risk
Many areas in the Pamunkey River watershed are at risk of flooding, and this flooding poses a major threat to the Pamunkey Indian Reservation. Flood risk locations as of 2021, estimated by the Federal Emergency Management Agency (FEMA) (fig. 6), show many areas throughout the Pamunkey River watershed as low and high risk and some areas as medium and very-high risk. However, most of the Pamunkey Indian Reservation is classified as a special flood hazard area (SFHA) (Federal Emergency Management Agency, 2021). FEMA defines an SFHA as an area having special flood, mudflow, or flood related erosion hazards. These SFHAs require adherence to the National Flood Insurance Program’s floodplain management regulations and need flood insurance.
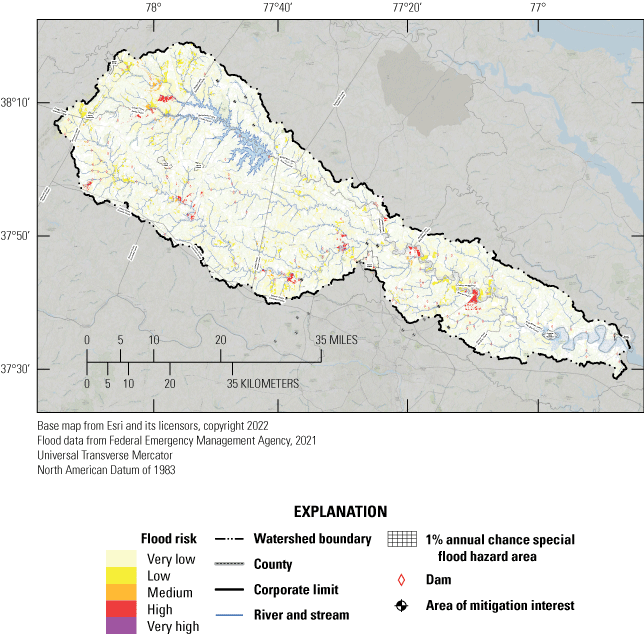
Map showing areas of flood risk in the Pamunkey River watershed.
The Pamunkey Indian Tribe and Reservation are sovereign, but enforcement of floodplain management regulations and access to purchase flood insurance is complicated. The SFHA area on the Pamunkey Indian Reservation (fig. 7) includes all the forested wetland areas adjacent to the Pamunkey River and extends landward to the developed parts of the reservation where there are structures and agricultural plots. Estimates indicate that every year these areas have a 1-percent chance to experience flood, mudflow, or flood related erosion hazards (Federal Emergency Management Agency, 2021). Some of the most vulnerable locations on the reservation are along the shoreline, where homes and the Pamunkey Indian Tribe’s fish hatchery are located. Additionally, Williams Creek at King William County Route 673 – Pocahontas Trail, the only ingress and egress point on the reservation, is included in the SFHA. Pamunkey Tribal members have experienced many occasions where flooding has restricted access to and from the reservation, and flooding has been happening more often in the past 15 to 20 years (K. Moore, Pamunkey Indian Tribe, Elder, oral commun., 2022). When recalling some of the extreme flood events that have occurred in the past 15 to 20 years, and the damage that they caused on the Pamunkey Indian Reservation, one Tribal Elder said, “Events like these show you how vulnerable the reservation is and how much more severe the weather and its impacts are having” (K. Moore, Pamunkey Indian Tribe, Elder, oral commun., 2022).
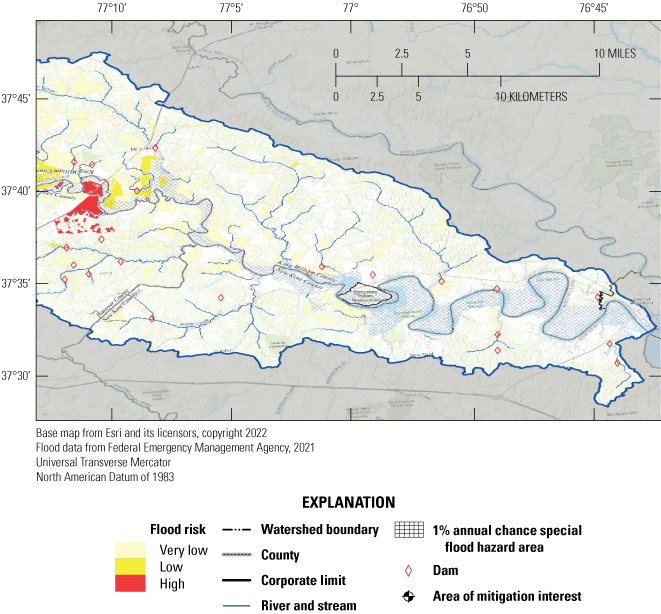
Map showing flood risk areas in the Lower Pamunkey River and the Pamunkey Indian Reservation.
The most recent FEMA Flood Risk Report published in May 2021 quantified the dollar-loss estimates from multiple size floods in the Pamunkey Indian Reservation at $0 (Federal Emergency Management Agency, 2021). This $0 estimate for the Pamunkey Indian Reservation is inconsistent when comparing it to locations throughout the Pamunkey River watershed that also have a diverse suite of residential and agricultural uses and the potential for disruption. This is due to the methodology of the flood-estimate calculation, which FEMA notes has many shortcomings, including not having reliable elevation measurements for the “first floor” of each building (Federal Emergency Management Agency, 2022).
Dams
According to the U.S. Army Corps of Engineers National Inventory of Dams, 184 dams within the Pamunkey River watershed (fig. 8) meet the following criteria: (1) dams where downstream flooding will likely result in loss of human life; (2) dams where downstream flooding would likely result in disruption of access to critical facilities, damage to those facilities, and would require difficult mitigation efforts; and (3) dams that meet or exceed specific height and size parameters regardless of their potential risk to human life and economics (U.S. Army Corps of Engineers, 2022). Most of the dams within the Pamunkey River watershed are on tributaries of the Pamunkey River: the North Anna River, South Anna River, and Little River. Dams in the Pamunkey River watershed are mostly small low-head dams used for consistency of water supply and irrigation. Dams can cause potentially large changes to a stream’s hydrology, water quality, connectivity, geomorphology, and ecology and may create a barrier to aquatic organism movement (Poff and others, 2007; Santucci and others, 2005). No dams are directly on the Pamunkey River main stem; however, the North Anna River has a dam that creates Lake Anna, and the South Anna River has two dams: the Ashland Mill Dam (fig. 9) and the Ashland Water-Supply Dam.
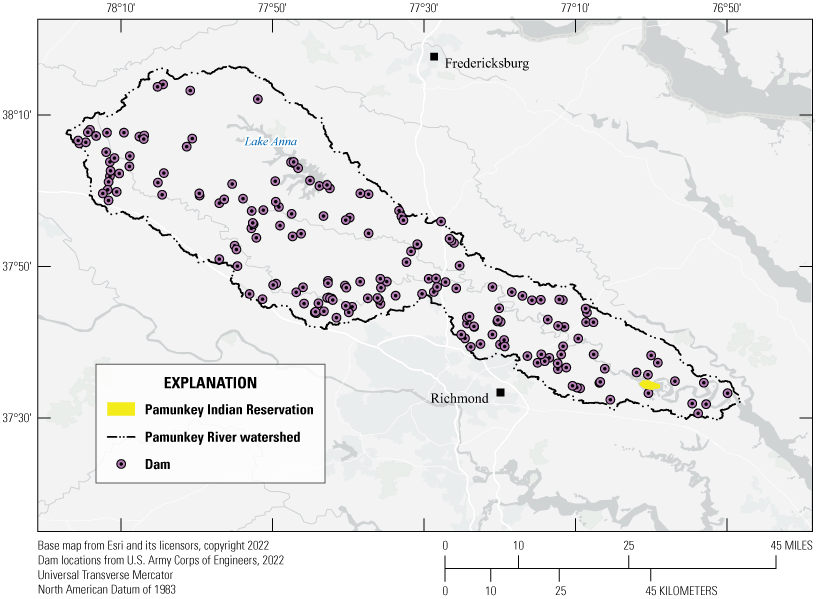
Map showing dam locations in the Pamunkey River watershed.
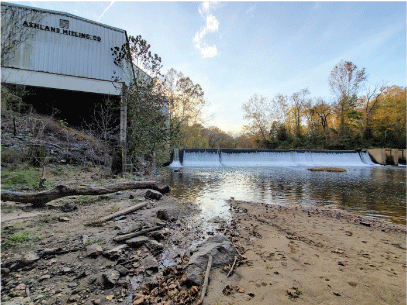
Photograph of the Ashland Mill Dam on the South Anna River, near Ashland, Virginia. Photograph by Brendan Foster, U.S. Geological Survey.
The North Anna Nuclear Power Plant (NANPP) uses water from Lake Anna for cooling. According to the owner and operator of NANPP, Dominion Energy, at full operation, approximately 2 million gallons of water pass through the facility per minute (Dominion Energy, 2022). After use, the water is discharged into ponds where it has an opportunity to cool after being heated by NANPP. Although the water being used is not necessarily consumed and is eventually returned to the North Anna River, the timing of discharges and temperatures when the water is returned to the North Anna River might be altered and could potentially have ecological effects. Historical water temperature measurements in the northernmost arm of Lake Anna from August 1984 through August 2011 showed an increasing trend, which appeared to become more variable year-to-year from 2000 through 2011 (Via, 2012).
The two dams on the South Anna River, the Ashland Mill Dam and the Ashland Water-Supply Dam, have been recognized by the Virginia Department of Wildlife Resources (DWR) as being barriers to fish passage. The Ashland Mill Dam is a 13-ft dam near the downstream end of the South Anna River. The Virginia DWR have asserted two potential actions to improve fish passage at this location: install a fishway or remove the dam. The Virginia DWR estimates that improvements to fish passage at the Ashland Mill Dam would reopen 9 miles of native spawning habitat for fish, such as Alosa sapidissima (Wilson, 1811) (American shad), Dorosoma cepedianum (Lesueur, 1818) (hickory shad), Alosa aestivalis (Mitchill, 1814) (blueback herring), Alosa pseudoharengus (Wilson, 1811) (alewife), Morone saxatilis (Walbaum, 1792) (striped bass), and Anguilla rostrata (Lesueur, 1817) (American eel) (Virginia Department of Wildlife Resources, 2022). Upstream from the Ashland Mill Dam is Ashland Water-Supply Dam, which is a 3-ft tall low-head dam. The Virginia DWR estimates that creating a simple notch in this dam would reopen 28 miles of stream for fish movement (Virginia Department of Wildlife Resources, 2022).
One Pamunkey Tribal Elder said, “All of the dams [in the Pamunkey River watershed] including the ones for Lake Anna are bound to be impacting the fish. We used to have herrings in this river, and we barely have any at all anymore. The herrings and the shad used to go all the way up [to the top of the watershed] to spawn. So, the dams had to have affected the fish some” (T. Langston, Pamunkey Indian Tribe, Elder, oral commun., 2022).
Withdrawals
Surface water is withdrawn from the Pamunkey River watershed for commercial, industrial, agricultural, municipal, and power generation uses. The Virginia Department of Environmental Quality (VDEQ) has reported the withdrawals of surface water in 2021 (Virginia Department of Environmental Quality, 2022b; table 2). The NANPP withdrew the largest amount of surface water in 2021 at 1,855 million gallons per day (Mgal/d). According to Dominion Energy, the operator of the NANPP, all the water withdrawn to cool the plant was returned to Lake Anna, and thus the NANPP had no consumptive use (Dominion Energy, 2023). The three largest surface-water withdrawals for consumptive use in 2021 were from New Kent County at 16.24 Mgal/d, Spotsylvania County at 11.93 Mgal/d, and Hanover County at 5.14 Mgal/d.
Table 2.
Total surface-water withdrawals for localities within the Pamunkey River watershed in Virginia in 2021.[Virginia Department of Environmental Quality, 2022b. Mgal/d, million gallons per day]
The most immediate effect that surface-water withdrawals can have on a stream is that the water being withdrawn is no longer in the stream to support biological communities and ecological function. Surface-water withdrawals can also potentially change the water level of the stream and alter flow regimes and geomorphology. Over time, these alterations can have profound effects on an entire ecosystem. Evaluation of the full suite of potential impacts that withdrawals of surface water might be having on the Pamunkey River remains a gap in knowledge.
Surface-Water Quality
The water-quality of the Pamunkey River watershed affects the health of aquatic life, recreational opportunities, the quality of drinking water, and conditions in downstream waters. Monitoring data are collected throughout the watershed to assess water-quality conditions. Based on a 2022 assessment, the VDEQ identify bacteria as one of the most common causes of impairment throughout the Pamunkey River watershed (Virginia Department of Environmental Quality, 2022a). Bacteria are a potential threat to human health and safety and they also adversely affect the stream ecosystem. A plan to improve bacterial conditions, referred to as the total maximum daily load (TMDL), was written in 2014 by Virginia Department of Environmental Quality for the 20 impaired stream segments totaling about 100 miles of streams in the Pamunkey River watershed (Virginia Department of Environmental Quality, 2014).
In addition to the Virginia TMDL for bacteria, a plan to reduce nitrogen, phosphorus, and sediment delivered to the tidal Chesapeake Bay was set in place by the U.S. Environmental Protection Agency in 2010 for the entire Chesapeake Bay watershed (U.S. Environmental Protection Agency, 2010). Nitrogen, phosphorus, and sediment are naturally occurring and vital components to the health of aquatic and terrestrial ecosystems. However, anthropogenic changes to the landscape, such as urbanization and agriculture, have caused excess nutrients and sediment to enter rivers and streams. A Pamunkey Indian Tribal Elder who was born on the reservation and fished the surrounding waterways his entire life commented that agricultural runoff has caused large water-quality impacts on the Pamunkey River (G. Miles, Pamunkey Indian Tribe, Elder, oral commun., 2022). Excess nutrients in streams can lead to eutrophication—excess plant and algal growth (Dalu and others, 2019). Eutrophication can lead to decreases of dissolved oxygen in water, which can potentially create a hypoxic environment that is not habitable to most aquatic plants and animals (D’Anglada and others, 2018). Enrichment of nitrogen and phosphorus in rivers and streams is among the greatest water-quality issues for aquatic ecosystems worldwide (Dodds and Smith, 2016) and eutrophication is among the leading causes of impairment for freshwater and coastal marine ecosystems in the world (Chislock and others, 2013). Excess sediment in rivers and streams is a leading pollutant worldwide (Walling, 2009), causing degradation to benthic macroinvertebrate and fish communities and contributing to the impairment of overall ecosystem health. Additionally, nutrients and heavy metals have an affinity to attach to sediment, allowing these pollutants to move throughout rivers and streams (Loperfido, 2014).
Changes in nutrient and sediment conditions over time are influenced by a variety of factors that have complex local and regional interactions. Nutrient loads in streams reflect the amount of nitrogen and phosphorus applied to the landscape and factors affecting the movement of these nutrients from the landscape to streams. Common sources of nutrients in the Pamunkey River watershed include atmospheric deposition and naturally occurring deposition of weathered minerals, fertilizer, manure, and biosolids (Chesapeake Bay Program, 2020). Nutrients and sediment naturally cycle through watersheds with periods of storage and transport; however, land-use practices, such as agriculture and urban development, can accelerate the processes driving these cycles. Nutrient and sediment transport are also affected by climatic conditions, which are increasingly more difficult to predict. Nutrients and sediment transport is usually expressed in terms of load or the mass of the constituent that gets transported through a cross-section of the river or stream. The transport of a material’s mass is strongly influenced by the amount of flow. For example, material would not move as much during periods of prolonged drought as they would during periods of large storms; therefore, loads are normalized by their respective flow to compare all nutrient loads over time in a meaningful way and are referred to as “flow-normalized” or “flow-adjusted” loads.
Stream conditions throughout the nontidal, upstream reaches of the Pamunkey River watershed affect the receiving tidal sections of the Pamunkey and York river watersheds. Dissolved oxygen and water clarity in tidal streams are affected by local watershed conditions and what is delivered from upstream. Management practices are being used throughout the Chesapeake Bay watershed, including the Pamunkey River watershed, to reduce the delivery of nutrients and sediment to streams; however, the effectiveness of these practices and their effect on delivered and transported loads, especially at the major watershed scale, is uncertain (Ator and others, 2020).
This section discusses the surface-water quality of the Pamunkey River watershed in two separate subsections. The first subsection discusses the surface-water quality of the upstream non-tidal sections of the Pamunkey River watershed, and the second subsection discusses the surface-water quality of the tidal Pamunkey and York river watersheds. For the purpose of summarizing surface-water quality in the Pamunkey River watershed, the non-tidal Pamunkey River watershed is defined as the Pamunkey River watershed upstream from USGS monitoring station 01673000 near Hanover, Virginia, and represents the contributions of the 1,078 mi2 upstream from this location. The tidal Pamunkey and York river watersheds are defined as the Pamunkey and York river watersheds downstream from the Chesapeake Bay Program monitoring stations TF4.2 and TF4.4 (fig. 10). Although the surface-water quality section is discussed in separate subsections to differentiate between the non-tidal and tidal parts of the watersheds, the whole watershed system is inextricably linked and each part of the watershed has a profound effect on the other.
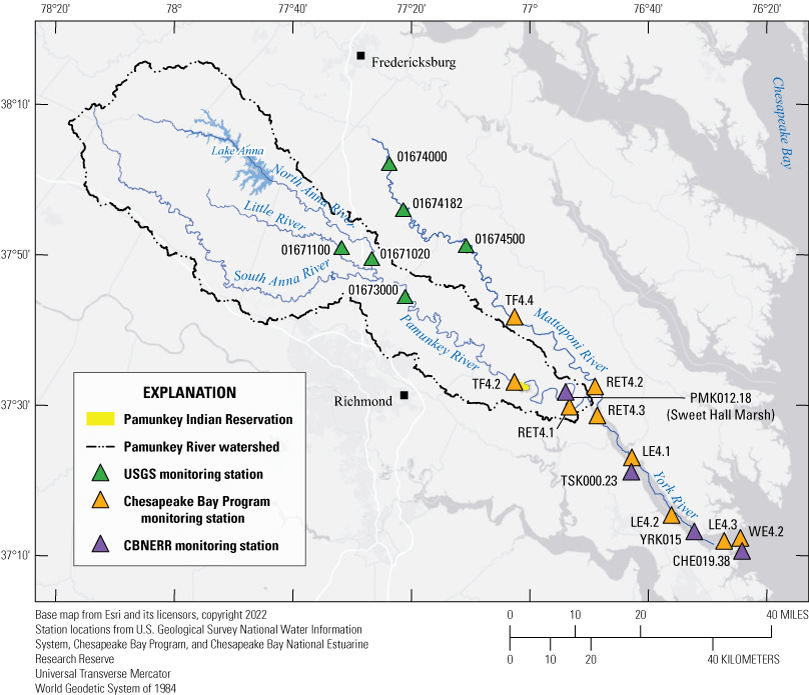
Map showing water-quality monitoring stations throughout the Pamunkey, Mattaponi, and York river watersheds. USGS, U.S. Geological Survey; CBNERR, Chesapeake Bay National Estuarine Research Reserve. USGS, U.S. Geological Survey; CBNERR, Chesapeake Bay National Estuarine Research Reserve.
Non-Tidal Surface-Water Quality
About 333 miles of non-tidal streams and 18 lake parts in the Pamunkey River watershed have impaired water-quality conditions. Most of these impairments are caused by excessive amounts of bacteria; however, some impairments are caused by concerning levels of dissolved oxygen, pH, toxic contaminants, and metals (Virginia Department of Environmental Quality, 2022c; fig. 11a, fig. 11b). The following sections describe the bacteria, nutrients, and sediment conditions monitored throughout the non-tidal waters of the Pamunkey River watershed. Bacteria conditions are summarized from multiple non-tidal monitoring stations. Nitrogen, phosphorus, and sediment conditions are summarized from a single non-tidal monitoring station: the Pamunkey River near Hanover, Va. (USGS station ID 01673000; fig. 10). This station is part of a 123-station non-tidal stream monitoring network that allows conditions in nearby rivers and throughout the Chesapeake Bay watershed to be compared.
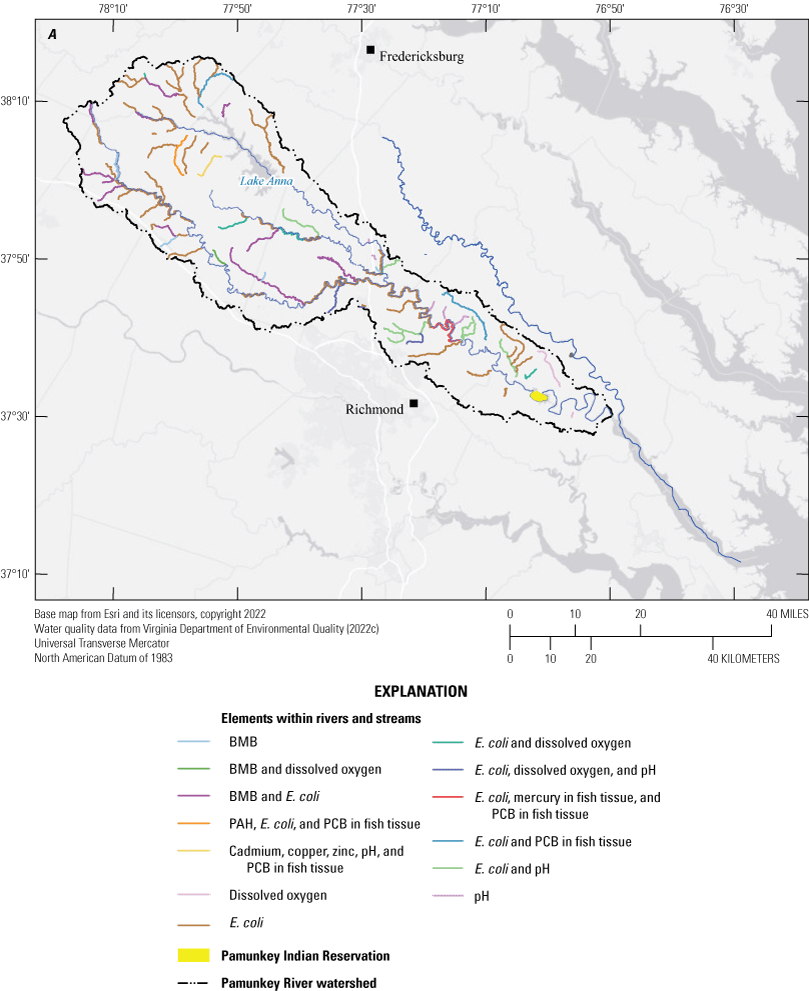
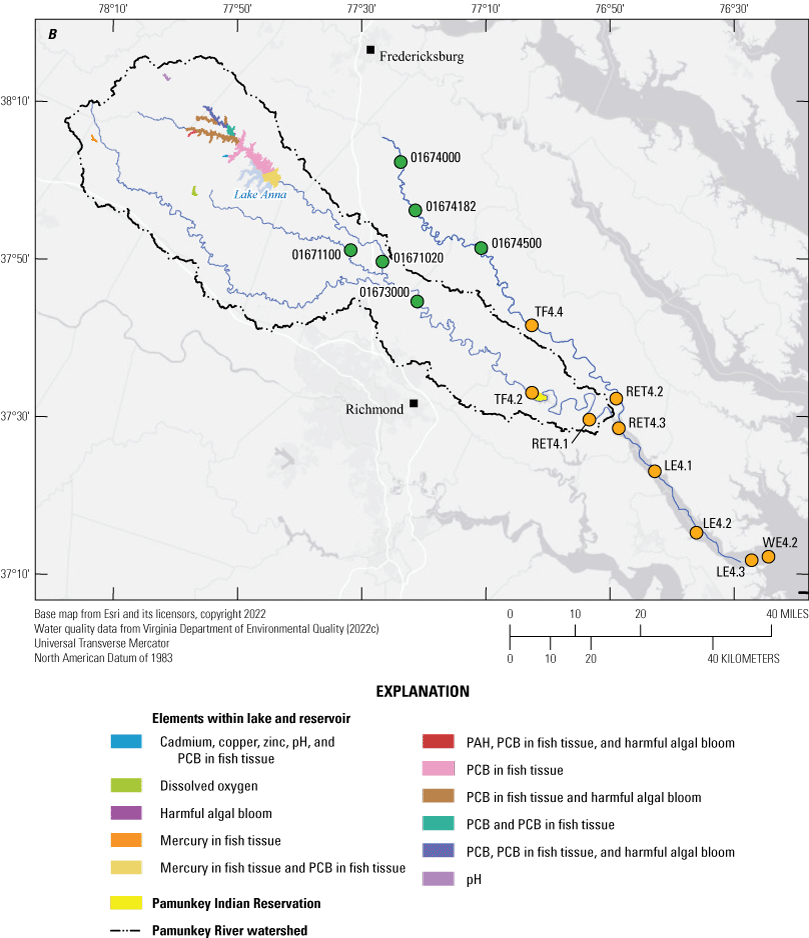
Map showing impairment types in A, stream segments, geographic boundaries, and bioassessment types within the Pamunkey River watershed as of 2022 and in B, lake parts, geographic boundaries, and bioassessment types within the Pamunkey River watershed as of 2022. BMB, benthic macroinvertebrates bioassessments; E. coli, Escherichia coli (Migula, 1895; Castellani and Chalmers, 1919); PAH, benzo[a]pyrene polycyclic aromatic hydrocarbon; PCBs, polychlorinated biphenyl.
Escherichia coli
Bacteria are ubiquitous single-celled organisms naturally present in rivers, streams, and lakes. Certain types of bacteria, however, have the potential to cause sickness and disease in humans. Escherichia coli (E. coli) is a common type of bacteria found in fecal matter and the gastrointestinal tract of warm-blooded animals that can be harmful to humans. E. coli is monitored in rivers, streams, and lakes throughout Virginia to inform the public for their safety. Seventy-six stream segments totaling about 312 miles were recently listed as being impaired by bacteria (Virginia Department of Environmental Quality, 2022c). Fecal matter is discharged throughout the Pamunkey River watershed by point and non-point sources. Point sources that have been permitted for fecal bacteria control in the Pamunkey River watershed include 2 juvenile correction centers, 6 wastewater treatment plants, a hospital, an industrial park, 3 domestic areas, and 3 urban areas (Virginia Department of Environmental Quality, 2022c). Non-point sources of fecal bacteria include residential sewage (septic systems), sanitary sewer system overflows, biosolids, fertilizer applications, pet waste, and wildlife, grazing in riparian and shorelines zones, sewage discharge in unsewered areas, and runoff from forests; agricultural and urban areas were also noted sources of fecal contamination (Virginia Department of Environmental Quality, 2022c).
In 2014, the VDEQ developed a TMDL to address bacterial impairment in the Pamunkey River watershed; the TMDL aims to do this by reducing fecal discharges over time. Monitored bacteria levels were used to create models that can estimate bacterial levels, and continued monitoring allows for refinement and verification of these models over time. The VDEQ computes the bacterial TMDL as the sum of the waste load allocations from permitted direct sources, load allocations from non-permitted and diffuse sources, and a margin of safety to account for uncertainty in processes such as wildlife contributions, and becomes the amount of pollutant that can be assimilated by the receiving waterbody while maintaining water quality standards (Virginia Department of Environmental Quality, 2014). In 2014, 20 stream segments, totaling about 100 miles, were listed as impaired because of E. coli contamination, and in 2022, 76 stream segments, totaling about 312 miles, were listed as impaired because of E. coli contamination. Bacterial impairment in the non-tidal Pamunkey River watershed has continued through 2022 (Virginia Department of Environmental Quality, 2022a). Because of the continued bacterial impairment throughout the Pamunkey River watershed, continued bacterial monitoring and refinement of bacterial models could ensure public safety and support evaluation of the success or failure of potential reductions in fecal discharge allocations.
Nitrogen
From 2016 through 2020, the average annual load of total nitrogen carried by the non-tidal Pamunkey River was about 1.5 million pounds (Mason and others, 2021). Atmospheric deposition and agricultural fertilizer are the largest estimated sources of nitrogen in this watershed; each account for about 30 percent of the delivered total nitrogen load (Ator, 2019). After normalizing by watershed area, the 5-year average load (about 2.2 pounds per acre) was lower than 90 percent of non-tidal monitoring stations reporting total nitrogen throughout the Chesapeake Bay watershed. The non-tidal part of the neighboring Mattaponi River had about the same average load over this time (Mason and others, 2021).
Flow-normalized total nitrogen load was about 5 percent higher in 2020 than 1985 (Mason and others, 2021; fig. 12). This change does not represent an increasing trend because of the statistical uncertainty of the results. However, these same loads were about 6 percent higher in 2020 than 2011, representing an increasing trend over this 10-year period. This 6-percent increase of total nitrogen was higher than increases in load at over 70 percent of the 123 non-tidal monitoring network stations that monitor total nitrogen throughout the Chesapeake Bay. The non-tidal Mattaponi River experienced a 10-percent increase in total nitrogen load from 2011 through 2020 (Mason and others, 2021).
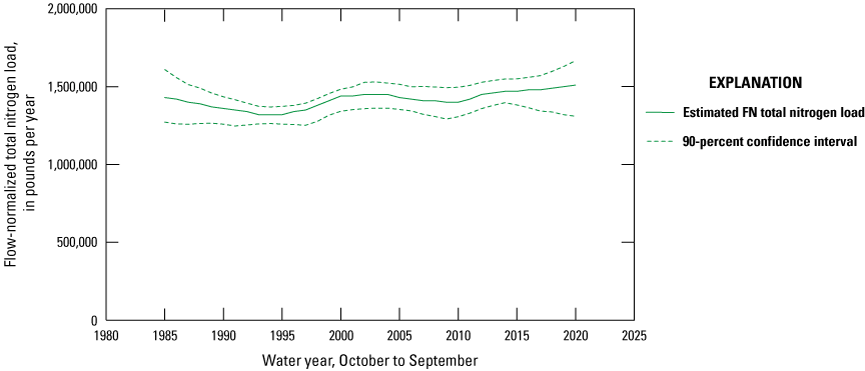
Graph showing flow-normalized total nitrogen loads for the non-tidal Pamunkey River for water years 1985 through 2020. Data acquired from Mason and others (2021) at U.S. Geological Survey station 01673000 Pamunkey River near Hanover, Virginia. FN, flow normalized.
The total estimated amount of nitrogen in the non-tidal Pamunkey River watershed decreased by about 3.7 million pounds from 1985 through 2020, representing a reduction of 27 percent (Chesapeake Bay Program, 2020; fig. 13). These changes were primarily caused by reductions in atmospheric deposition and, since the early 2000s, agricultural fertilizer. The Clean Air Act of 1963 (Public Law 88–206, 77 Stat. 392) and its multiple amendments have had transformative effects on the amount of nitrogen released to the atmosphere. Atmospheric nitrogen in the United States peaked in 1980 but has shown marked declines since 1995 when the Clean Air Act Amendment of 1990 (Public Law 101–549) became effective (U.S. Environmental Protection Agency, 2017a). Nitrogen fixation, that is plants converting atmospheric nitrogen into ammonia, was slightly higher in 2020 than 1985, which might reflect increases in crop yields over time. Fertilizer applied to turf grass also increased from 1985 through 2020, likely due to urbanization. Manure, septic systems, and point sources were all small inputs of nitrogen since 1985 (Chesapeake Bay Program, 2020).
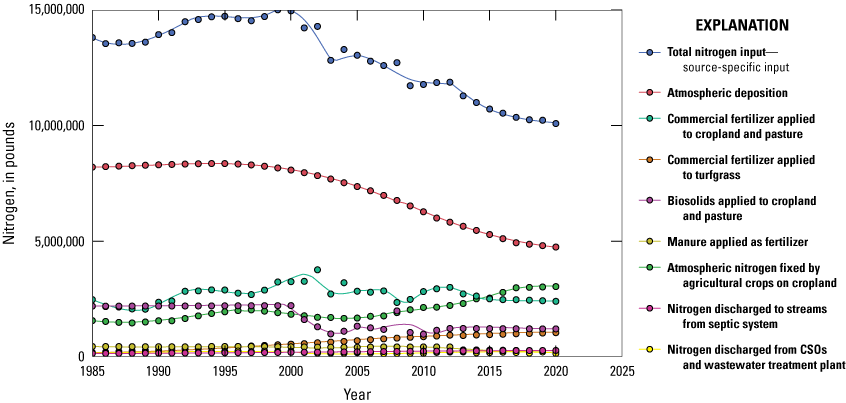
Graph showing the estimated total and source-specific nitrogen inputs in the Pamunkey River watershed from 1985 through 2020 upstream from U.S. Geological Survey station 01673000 Pamunkey River near Hanover, Virginia. CSO, combined sewer outlet.
The decline in watershed nitrogen inputs since 1985 has not resulted in measured decreases in total nitrogen loads delivered in the Pamunkey River near Hanover, Va. Most nitrogen inputs are not delivered to streams, they are retained in the landscape. From 1985 through 2020, only 11 percent of the total nitrogen inputs within the watershed have been delivered to streams and transported downstream to the tidal Pamunkey River (Mason and others, 2021; Ator, 2019). Delivery of nitrogen from landscape to stream varies by input type. Point sources, like wastewater discharge and combined sewer outlets (CSOs), have direct pathways to streams, while non-point sources, like atmospheric deposition and fertilizer applications, may take complex pathways of varying temporal scales to be delivered to streams. Nitrogen fixation has increased from 1985 through 2020, and nitrogen removal by crops also increased (Chesapeake Bay Program, 2020). The amount of manure applied to agricultural lands has decreased from 1985 through 2020 and represents about 3 percent of the total nitrogen inputs within the watershed (Chesapeake Bay Program, 2020); however, manure is estimated to account for about 10 percent of the delivered load (Ator, 2019). This disparity suggests that manure might have more direct pathways to being delivered to streams than other nitrogen inputs. Across the Chesapeake Bay watershed, groundwater-flow pathways are the primary delivery mechanism of nitrogen as nitrate (Terziotti and others, 2017); however, the ratio of nitrate to total nitrogen that is transported throughout the Chesapeake Bay watershed is lower than in most other watersheds in Virginia (Moyer and Langland, 2020). The Pamunkey River watershed generally did not have high nitrate concentrations in its groundwater (McFarland, 2010); however, some estimates suggest that residence time for nitrate in shallow groundwater within the Pamunkey River watershed, and throughout the Chesapeake Bay watershed, might be one or two decades (Terziotti and Hopple, 2018; Phillips, 2007), underscoring the importance of long-term monitoring to evaluate and better understand this delivery pathway.
Predicted changes in climatic conditions are expected to affect nitrogen fate and transport (Ator and others, 2020). The Pamunkey River watershed is predicted to become warmer and wetter. Warmer temperatures may increase releases of nitrogen from organic matter and facilitate mobilization of nitrogen in soil, potentially promoting delivery to streams (Lintern and others, 2020). Wetter conditions will directly impact changes in total nitrogen load. Studies throughout the Chesapeake Bay watershed have shown a direct relation between streamflow and total nitrogen load (Shenk and others, 2021). Wetter conditions may also lead to more frequent use of CSOs, which might increase the delivery of nitrogen to streams (U.S. Environmental Protection Agency, 2008). However, warmer and wetter conditions may drive the chemical process of denitrification, which reduces nitrate to dinitrogen gas (Chanat and Yang, 2018). Denitrification could plausibly increase in the future thereby decreasing nitrogen loads (Pilegaard, 2013).
Knowledge of the changes in nitrogen sources over time is useful to begin to understand their effects on the trend in total nitrogen load and to evaluate where efforts aimed at reducing nitrogen to streams would be most impactful. From 1985 through 1999, total nitrogen inputs generally increased, but they have decreased from 2000 through 2020 (Chesapeake Bay Program, 2020). The lack of a long-term trend in total nitrogen load (Mason and others, 2021) does not seem to be explained by our understanding of source-specific inputs (Chesapeake Bay Program, 2020) and outputs (Ator, 2019) over time. Groundwater pathways are a key delivery mechanism that provide nitrogen as nitrate to streams throughout the Chesapeake Bay (Ator and Denver, 2012; Lizarraga, 1997), and in the Pamunkey and York river watersheds, groundwater nitrate concentrations are highest above the Fall Zone (Greene and others, 2005; Terziotti and others, 2017). Residence times, that is, the amount of time groundwater takes to be delivered to a stream, are about 10 years throughout the Chesapeake Bay but can vary greatly depending on underlying geology and soils. Gaps in knowledge remain of nitrogen cycling and dynamics throughout the Pamunkey River watershed over time, and the effects land-use changes and best management practices have at reducing nitrogen delivery to meet TMDL benchmarks.
Phosphorus
Phosphorus binds to soil particles, and the highest concentrations of soil phosphorus are above the Fall Zone in the Pamunkey River watershed. This area is especially rich in phosphorus because of the combination of underlying crystalline rock, which is a natural source of phosphorus, and fertilizer and manure applications (Ator and others, 2011). Mineral phosphorus in the non-tidal Pamunkey River watershed is estimated to account for about 35 percent of the delivered total phosphorus load, and fertilizer and manure account for about 30 and 20 percent, respectively (Ator, 2019).
From 2016 through 2020, the average annual load of total phosphorus in the non-tidal Pamunkey River was about 180,000 pounds (Mason and others, 2021). Mineral phosphorus, agricultural fertilizer, and manure were the largest estimated sources of phosphorus in this watershed, constituting 37, 29, and 20 percent of the delivered total phosphorus load, respectively (Ator, 2019). After normalizing by watershed area, the 5-year average load (about 0.26 pounds per acre) in the Pamunkey River was lower than 69 percent of 5-years average loads in the Chesapeake Bay watershed non-tidal monitoring station network. The non-tidal part of the neighboring Mattaponi River had a similar average load over this time of about 0.2 pounds per acre (Mason and others, 2021).
Flow-normalized total phosphorus load at the Pamunkey River near Hanover, Va., was about 54 percent higher in 2020 than 1985 (Mason and others, 2021; fig. 14). This change represents a statistically significant increasing trend over this 35-year period. Flow-normalized total phosphorus load was about 5 percent lower in 2020 than 2011, representing a decreasing trend over this10-year period. This 5-percent decrease was lower than over half of the decreases in load at the 123 station non-tidal network monitoring total phosphorus throughout the Chesapeake Bay. The Mattaponi River experienced a 6-percent increase over 2011–20 (Mason and others, 2021). The decreasing trend in phosphorus in the non-tidal Pamunkey River and the increasing trend in the Mattaponi River over 2011–20 present an interesting difference and a gap in knowledge on changes throughout these non-tidal watersheds and potential downstream responses in the York River.
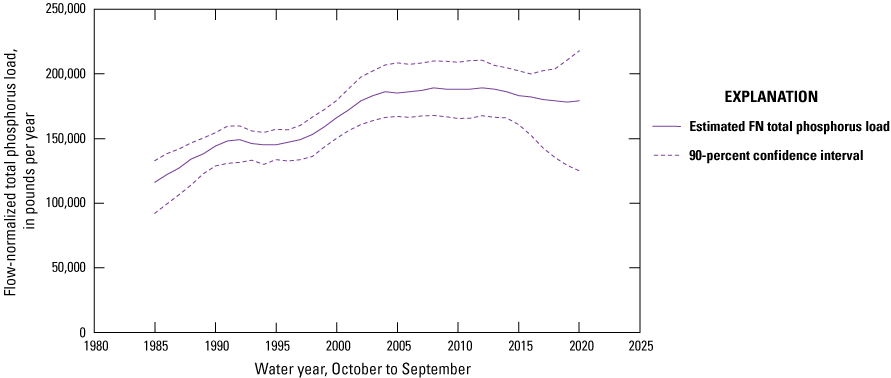
Graph showing flow-normalized total phosphorus loads from the non-tidal Pamunkey River for water years 1985 through 2020. Data acquired from Mason and others (2021) for U.S. Geological station number 01673000 Pamunkey River near Hanover, Virginia. FN, flow normalized.
The total estimated amount of phosphorus in the non-tidal Pamunkey River watershed decreased by about 900,000 pounds from 1985 through 2020, a change of 35 percent (Chesapeake Bay Program, 2020; fig. 15). Rates of atmospheric phosphorus deposition were estimated to be unchanged from 1985 through 2020 (Chesapeake Bay Program, 2020). Like nitrogen, phosphorus coming from fertilizer applied to turf grass increased from 1985 through 2020, likely because of urbanization. Manure, CSOs, and wastewater treatment plant discharge have been small inputs of phosphorus since 1985 (Chesapeake Bay Program, 2020).
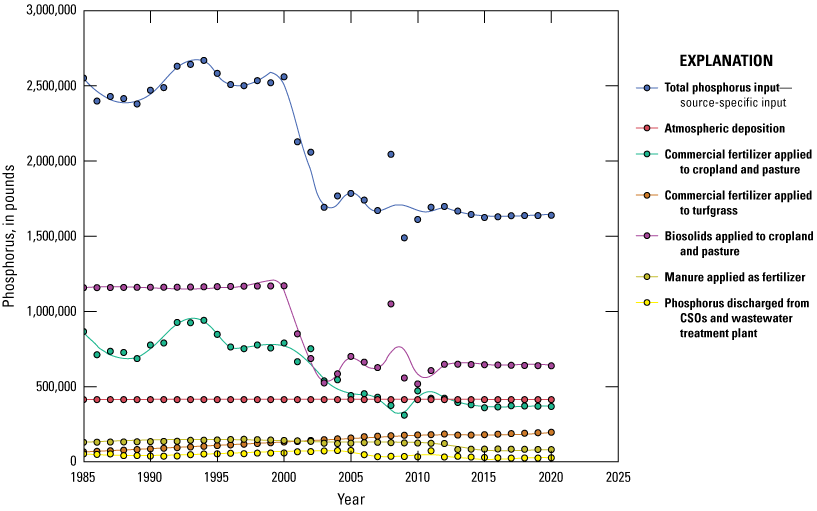
Graph showing estimated total and source-specific phosphorus inputs in the Pamunkey River watershed from 1985 through 2020 upstream from U.S. Geological Survey station 01673000 Pamunkey River near Hanover, Virginia. CSO, combined sewer outlet.
The decline in watershed phosphorus inputs since 1985 has not resulted in decreased total phosphorus loads delivered to the Pamunkey River near Hanover, Va. Most phosphorus inputs are not delivered to streams, rather they are retained in the landscape. From 1985 through 2020, only 8 percent of the total phosphorus inputs within the watershed have been delivered to streams and transported downstream to the tidal Pamunkey River (Mason and others, 2021; Ator, 2019). Delivery of phosphorus from landscape to stream varies by input type. Like nitrogen delivery, point sources of phosphorus, like wastewater discharge and CSOs, have direct pathways to streams, but non-point sources, like biosolids and fertilizer applications, may have complex pathways to streams that take varying amounts of time to get there. The amount of manure applied to agricultural lands has decreased from 1985 through 2020 and represents about 6 percent of the total phosphorus inputs within the watershed (Chesapeake Bay Program, 2020); however, manure is estimated to account for about 20 percent of the delivered phosphorus load (Ator, 2019). This disparity suggests that manure might have more direct pathways to being delivered to streams.
Predicted warmer and wetter conditions in the Pamunkey River watershed are expected to affect phosphorus fate and transport (Ator and others, 2020). Warmer temperatures interact with phosphorus like they do with nitrogen; warmer temperatures may increase releases of phosphorus from organic matter and facilitate increases in phosphorus mobilization and delivery to streams (Lintern and others, 2020). Wetter conditions have been linked to increases in phosphorus loads that are attributed to increases in erosion and sediment transport caused by wetter conditions (Lintern and others, 2020; Vidon and others, 2018; Najjar and others, 2010). Wetter conditions might also lead to more frequent use of CSOs, which might increase the delivery of phosphorus to streams (U.S. Environmental Protection Agency, 2008).
From 1985 through 2000, total phosphorus inputs were generally stable at around 2.5 million pounds per year, and then showed a marked decline from 2001 through 2003. From 2003 through 2020, total phosphorus inputs have generally remained stable at about 1.7 million pounds per year (Chesapeake Bay Program, 2020). Although the long-term trend in total phosphorus load is increasing, annual loads have generally remained consistent since 2003 (Mason and others, 2021). From 2011 through 2020 there is a decreasing trend in total phosphorus load; however, the cause remains a gap in knowledge.
Targeted and more measured fertilizer and manure applications could be useful at reducing phosphorus loads because estimates suggest that the current type of applications exceed crop needs in the watershed (Ator and others, 2011). With focused and concerted effort, reducing soil phosphorus is possible but might take 10 years or more (Kleinman and others, 2011). Any management actions to reduce total phosphorus loads might be ineffective unless targeted and more measured fertilizer and manure applications are made (Jarvie and others, 2013; Sharpley and others, 2013). All of the potential responses to changes in management actions remain a gap in knowledge.
Suspended Sediment
Sediment originates in the uplands from a variety of sources, such as agricultural and urban areas and forests, roads, gullies, and mines (Langland and Cronin, 2003). Delivery of sediment to streams throughout the Chesapeake Bay watershed is controlled by natural fluvial processes and bank erosion, and anthropogenic factors, such as agriculture and urbanization. Eroded sediments are stored (for example, in a floodplain) and transported, repeatedly, until ultimately being discharged from a watershed into a receiving downstream waterbody (Noe and others, 2020). Residence times, that is, the amount of time sediment is stored before being remobilized, vary greatly depending on the size of the stream or river. Older sediment stored in the Chesapeake Bay’s tributary watersheds, often termed “legacy sediment,” is thought to be the substantial excess supply of sediment created by landscape disturbances (for example, agriculture and urbanization) and alterations (for example, dam installations) after European settlement in North America (Miller and others, 2019). Anthropogenic landscape disturbances and alterations have continued and have added to the excess sediment stored in these watersheds that are available to be remobilized. These landscape disturbances have caused disruption to the native dynamic equilibrium of streambank erosion and floodplain deposition (storage) unique to each watershed (Wohl, 2015).
From 2016 through 2020, the average annual suspended-sediment load for the non-tidal Pamunkey River was about 99 million pounds (Mason and others, 2021). Erosion of stream channels and agricultural areas were the largest estimated sources of suspended sediment in this watershed, comprising 45 and 35 percent of the total delivered suspended-sediment load, respectively (Ator, 2019). After normalizing by watershed area, this 5-year average load from 2016 through 2020 (about 135 pounds per acre) was lower than 80 percent of non-tidal monitoring stations reporting suspended sediment throughout the Chesapeake Bay watershed. The average load over this time in the non-tidal part of the neighboring Mattaponi River was 50 pounds per acre, which was substantially less than the Pamunkey River (Mason and others, 2021).
Flow-normalized suspended-sediment loads at the Pamunkey River near Hanover, Va., (USGS station 01673000) were about 34 percent higher in 2020 than 1985 (Mason and others, 2021; fig. 16). Flow-normalized suspended-sediment loads were about 16 percent lower in 2020 than 2011, representing a decreasing trend over this 10-year period. This 16 percent decrease in load was higher than the decrease in loads of 88 percent of the non-tidal network monitoring suspended sediment throughout the Chesapeake Bay watershed. The Mattaponi River experienced a 25-percent increase in suspended-sediment load from 2011 through 2020, representing a significant increasing trend (Mason and others, 2021).
The decreasing trend in suspended sediment in the non-tidal Pamunkey River and increasing trend in the Mattaponi River from 2011 through 2020 is identical to the trends in total phosphorus in these rivers over the same period. Phosphorus binds to soil particles, which might help explain these matching trend directions in suspended sediment and total phosphorus; however, a complete understanding of both sediment and phosphorus fate and transport remains a gap in knowledge.
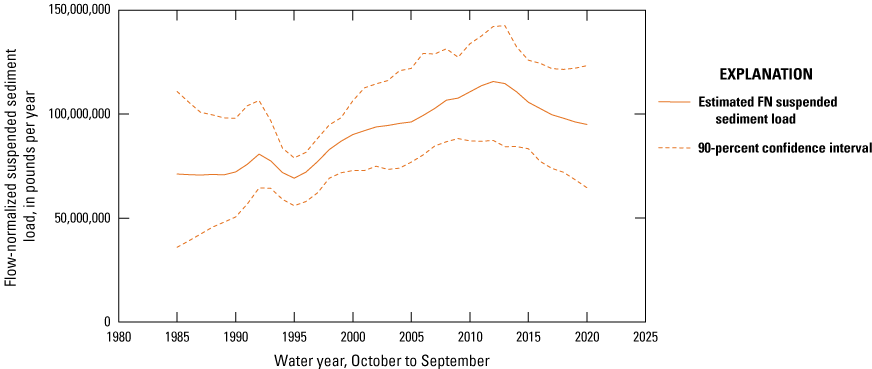
Graph showing flow-normalized suspended-sediment loads for the non-tidal Pamunkey River from water years 1985 through 2020. Data acquired from Mason and others (2021) for U.S. Geological Survey station number 01673000 Pamunkey River near Hanover, Virginia. FN, flow normalized.
Land use, changes in climate conditions, and management actions further influence sediment dynamics. Models have estimated that average sediment yields from urban areas could potentially be 70 times greater than agricultural areas (Brakebill and others, 2010); however, agricultural areas account for 69 percent of the total sediment delivered to the Chesapeake Bay. This disparity is thought to be because agricultural areas are widespread throughout the watershed, whereas urban areas, although intensive sediment contributors, represent smaller total areas of the watershed (Brakebill and others, 2019). Predicted changes in precipitation accumulation and intensity because of climate change could influence sediment fate and transport; however, more research is needed to evaluate these potential changes. Upstream best management practices (BMPs), implemented throughout the Chesapeake Bay watershed, have been estimated by models to meaningfully reduce sediment loads (Sekellick and others, 2019); however, trends in monitored (observed) sediment loads downstream are not consistent with those predicted reductions (Chesapeake Bay Program Integrated Trends Analysis Team, 2021). One explanation for this unobserved reduction is that active storage in streams and rivers is delaying the effects of the BMPs from being observed at downstream monitoring locations (Noe and others, 2020). The complex phenomena of sediment transport and fate in rivers remains a large gap in knowledge. Measured suspended-sediment load differs from model estimates of this load. Understanding why these differences are present and how to reconcile them remains a gap in knowledge.
Tidal Surface-Water Quality
The tidal reaches of the lower Pamunkey and York rivers have been monitored for decades and continue to be monitored by the Chesapeake Bay Program, the National Estuarine Research Reserve System, the Virginia VDEQ, and others. Understanding the water quality of the tidal Pamunkey and York rivers is complicated because of the influence of the tides that flow upstream in these rivers and other estuarian processes.
Nutrient and sediment conditions, and measures of dissolved oxygen and water clarity, are summarized from multiple tidal monitoring stations on the York and lower Pamunkey and Mattaponi rivers. These stations are part of a 139-station network that represent tidal water-quality conditions throughout the Chesapeake Bay. To determine trends in nutrients and sediment, and other constituents of concern over time in the tidal Pamunkey and York rivers, some analysts have used a generalized additive model approach (Chesapeake Bay Program Integrated Trends Analysis Team, 2021). The generalized additive model was used because of the complex hydrodynamics of estuaries, where sediment and nutrients may move upstream or downstream, make estimating loads extremely difficult; however, estimating concentrations of nutrients and sediment over time has shown to provide a reliable understanding of movement of these constituents in these complex flow environments.
Nitrogen
The average total nitrogen concentration in the tidal Pamunkey River from the most recent 2 years (2020 through 2021) is about 0.7 milligrams per liter (mg/L) (Murphy and others, 2022). This concentration was higher than the concentrations of about half the stations in the 139-station tidal monitoring network (Murphy and others, 2022; fig. 17). From 2012 through 2021, the total nitrogen concentration in the tidal Pamunkey River increased by 0.013 mg/L (Murphy and others, 2022). This increase was higher than the increase at about 75 percent of stations in the tidal monitoring network throughout the Chesapeake Bay reporting total nitrogen from 2012 through 2021. The tidal part of the neighboring Mattaponi River observed a small 0.008 mg/L increase in total nitrogen concentration over the same period (Murphy and others, 2022).
Atmospheric deposition and agricultural fertilizer are the largest estimated sources of nitrogen in the tidal Pamunkey River watershed; each account for about 30 percent of the delivered total nitrogen load. Nitrogen fixing crops also make a large contribution of nitrogen at about 20 percent. (Ator, 2019).
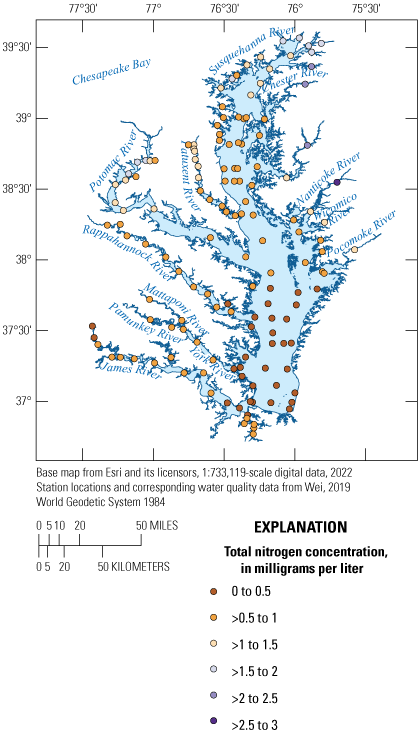
Map showing 2-year mean total nitrogen concentrations throughout the 139-station Chesapeake Bay tidal monitoring network from 2020 through 2021. Data from Murphy and others (2022).
Total nitrogen concentration in the tidal Pamunkey River was about 2 percent higher in 2021 than 1994 (Murphy and others, 2022). This 2-percent change represents a 0.014 mg/L increase in total nitrogen concentration over this 27-year period. This 2-percent long-term increase was higher than the increase at about 90 percent of stations in the tidal monitoring network. Throughout the entire tidal York River watershed, total nitrogen concentration was about 6 percent higher in 2021 than 1994. Throughout the 139-station tidal monitoring network, total nitrogen concentration decreased by about 27 percent (Murphy and others, 2022), making these small increases throughout the tidal York and Pamunkey river watersheds dissimilar to changes observed throughout tidal rivers and streams throughout the Chesapeake Bay.
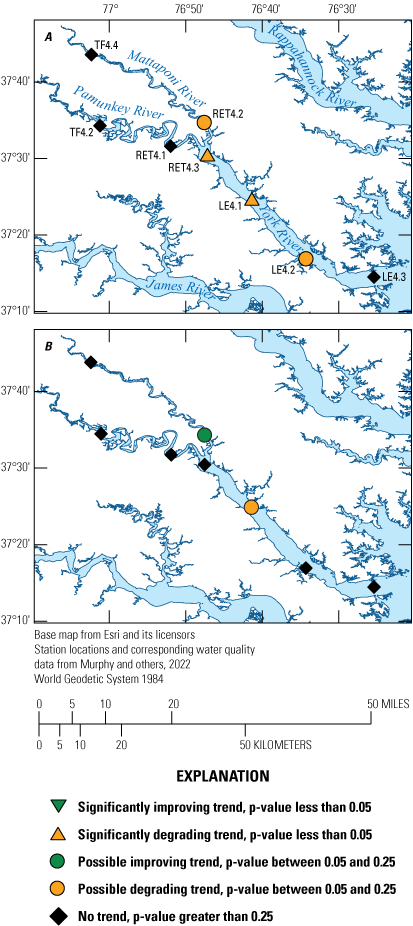
From 2012 through 2021, no decreasing (improving) trends in total nitrogen were found throughout the tidal York, Pamunkey, and Mattaponi rivers. Mostly no short term (2012 through 2021) trends were found either except for in downstream segments of the York River, which had significant increasing (degrading) trends (Murphy and others, 2022; fig. 18). The long-term period from 1994 through 2021 mostly exhibited no trends except for the persistent degrading trend in the mesohaline segment of the York River and a degrading trend in the tidal freshwater of the Mattaponi River (Murphy and others, 2022). Salinity classifications and extents discussed in the nitrogen and phosphorus sections are explained in the salinity section.
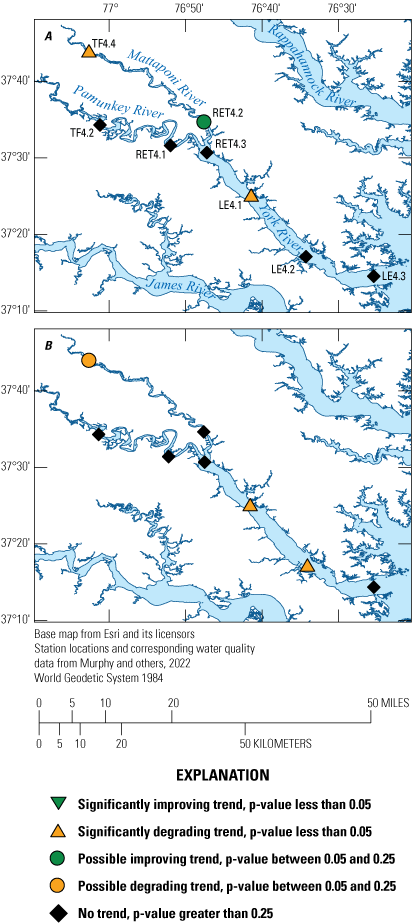
Graphs showing total nitrogen concentration trend likelihoods for the tidal reaches of the York, Pamunkey, and Mattaponi rivers from A, 1994 through 2021 and B, 2012 through 2021.
Overall, total nitrogen concentrations throughout the tidal reaches of the York, Pamunkey, and Mattaponi rivers were fairly constant over the short (2012 through 2021) and long (1994 through 2021) term with the exceptions of stations LE4.2 in the mesohaline segment of the York River, which resulted in no trend in the long term and a significant degrading trend likelihood in the short term, and station TF4.4, which changed from a long-term possible degrading trend likelihood to a significant degrading trend likelihood (Murphy and others, 2022).
Station LE4.1 had a significant degrading trend likelihood in total nitrogen in the short (2012 through 2021) and long (1994 through 2021) term. Although the mesohaline segment of the York River has experienced degrading total nitrogen conditions over time, the concentrations were generally low compared to other tidal streams and rivers throughout the Chesapeake Bay (Murphy and others, 2022).
Phosphorus
The average total phosphorus concentration in the tidal Pamunkey River from the most recent 2 years (2020 through 2021) is 0.08 mg/L. This concentration was higher than the total phosphorus concentrations of about 86 percent of the stations in the tidal monitoring network during the same 2020 through 2021 period (Murphy and others, 2022; fig. 19). From 2012 through 2021, total phosphorus concentrations decreased in the tidal Pamunkey River by 0.001 mg/L (Murphy and others, 2022). This decrease from 2012 through 2021 was higher than the total phosphorus concentrations reported by about 56 percent of stations in the tidal monitoring network throughout the Chesapeake Bay. Although this decrease was greater than the decreases of more than half of tidal monitoring stations over this recent 10 year period (2012 through 2021), average total phosphorus concentrations remained relatively high when compared to the other tidal monitoring stations throughout the Chesapeake Bay. The tidal part of the Mattaponi River observed a 0.005 mg/L decrease over the same period (Murphy and others, 2022). Mineral phosphorus, agricultural fertilizer, and urban land were the largest estimated sources of phosphorus in the tidal York River watershed: mineral phosphorus and agricultural fertilizer each accounted for about 35 percent of the delivered load and urban land accounted for about 20 percent of the delivered total phosphorus load (Ator, 2019).
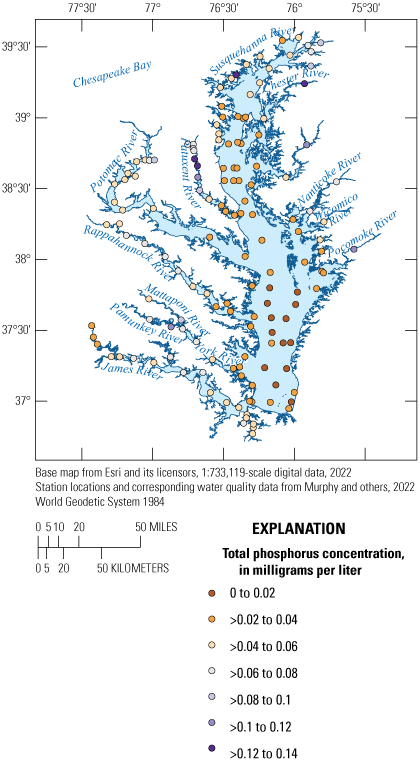
Map showing 2-year mean total phosphorus concentrations throughout the 139-station Chesapeake Bay tidal monitoring network from 2020 through 2021.
Total phosphorus concentrations in the tidal Pamunkey River were about 5 percent higher in 2021 than in 1985 (Murphy and others, 2022). This 5-percent increase represents about a 0.004 mg/L increase over this 36-year period, which was higher than the total phosphorus values reported by about 85 percent of stations in the tidal monitoring network throughout the Chesapeake Bay. Throughout the entire tidal York River watershed, average total phosphorus concentration was about 14 percent higher in 2021 than 1985. Throughout the 139-station tidal monitoring network, the average total phosphorus concentration decreased by about 24 percent (Murphy and others, 2022), which makes the increases and relatively high average concentrations of total phosphorus throughout the tidal York River watershed dissimilar to changes observed in the tidal rivers and streams throughout the Chesapeake Bay.
From 2012 through 2021, the tidal York, Pamunkey, and Mattaponi rivers had mostly no trends in total phosphorus. However, the mesohaline segment of the York River had a possible degrading likelihood trend in total phosphorus at the same location where total nitrogen conditions were degrading and a possible improving total phosphorus trend in the oligohaline segment of the Mattaponi River (Murphy and others, 2022; fig. 20). No improving long-term (1985 through 2021) trends were estimated throughout the tidal York, Pamunkey, and Mattaponi rivers. Degrading long-term trends were estimated for the oligohaline and mesohaline segments of the York and Mattaponi rivers, and no trends were at any other locations (Murphy and others, 2022; fig. 20).
Maps showing total phosphorus concentration trend likelihoods for the tidal York, Pamunkey, and Mattaponi rivers from A, 1985 through 2021 and B, 2012 through 2021.
Overall, total phosphorus concentrations over time throughout the York, Pamunkey, and Mattaponi rivers increased by about 14 percent from 1985 through 2021, which differs from the decrease of about 24 percent for all tidal monitoring stations of streams and rivers in the Chesapeake Bay watershed. Station LE4.1showed a degrading long-term and short-term trend in total phosphorus, just as it did with total nitrogen.
Suspended Sediment
From water years 1985 through 2018, suspended-sediment loads in the tidal York, Pamunkey, and Mattaponi rivers showed an increasing trend, but this trend was not statistically significant (Chesapeake Bay Program Integrated Trends Analysis Team, 2021). This increasing trend, however, represents an estimated annual increase in suspended sediment of about 320,000 pounds per year over this 33-year period. The Chesapeake Assessment Scenario Tool model estimates suspended-sediment inputs for the York River are primarily from channel sources, such as shorelines and streambed and bank erosion (Chesapeake Bay Program Integrated Trends Analysis Team, 2021). Point sources, like wastewater treatment plant discharge, septic systems, and CSOs, produced a small fraction of the sediment estimated to be delivered in the tidal York, Pamunkey, and Mattaponi rivers. A significant decrease in suspended-sediment load delivery from 1985 through 2018 was estimated by the Chesapeake Assessment Scenario Tool with a p-value less than 0.01 (Chesapeake Bay Program Integrated Trends Analysis Team, 2021).
Transport of suspended sediment in the tidal Pamunkey and York rivers is complex because these tidal rivers have immense trapping and remobilization capabilities. The average age of sediment stored in-channel is assumed to be 1 year or less (Gellis and others, 2017); however, the average age of sediment in these tidal rivers might be exponentially older because they might be stored and remobilized many times before reaching the Chesapeake Bay. Like the non-tidal suspended-sediment estimations, novel approaches to understanding the sediment dynamics within the tidal York, Pamunkey, and Mattaponi rivers and throughout the Chesapeake Bay continue to be developed and are needed to resolve large discrepancies between loads estimated from direct measurements and loads estimated from large sediment transport models. Continued monitoring and modelling efforts could reconcile these differences.
Salinity
The lower parts of the Pamunkey River are tidally influenced, so salty ocean water travels upstream from the Atlantic Ocean and Chesapeake Bay into the York River and eventually into the Pamunkey River. One of the earliest evaluations of the extent of the tidally influenced parts of the Pamunkey River estimated that those parts extend 42 nautical miles upstream from the river mouth (Raney and Massman, 1953). The saline lower Pamunkey River has created a unique riverine environment over time. These environments include a unique ecology of flora and fauna that have adapted over time to these tidally influenced sections of river.
Because of many factors, such as SLR, climate change, and urbanization, salinity concentrations in the Pamunkey River and the extent of the tidal influence might change. When higher-salinity water is rapidly introduced to freshwater rivers, it stresses the local ecology that has come to depend on freshwater over a long period of time. One study modelled changes in salinity concentrations and distributions for the York River under multiple SLR and discharge scenarios and predicted large increases in mean salinity concentrations and greater upstream distributions of saline water (Rice and others, 2011) for all SLR scenarios.
Rising sea levels within the Pamunkey River estuary will be coupled with rising levels of salinity encroaching into freshwater habitats, which is also a concern. Although drought, storm surge, surface-water withdrawal, and dams can all contribute to periodic exposures of tidal freshwater habitats to salinity pulses, up-estuary movement of the salt front associated with increased SLR will be more chronic and pervasive. Tidal freshwater flows around the Pamunkey Indian Reservation, and oligohaline conditions prevail a couple miles downstream from the reservation (fig. 21). Researchers speculate that sufficient saltwater intrusion into tidal freshwater emergent wetland ecosystems might result in changes in biogeochemical cycling and carbon mineralization, which would result in increased sulfate reduction and decreased methanogenesis. Although these conditions might occur with saltwater intrusion, their direction and magnitude of change are exceptionally complex to predict and are dependent on the interactions of dynamic microbial communities and available carbon resources (Dang and others, 2018; Berrier and others, 2022).
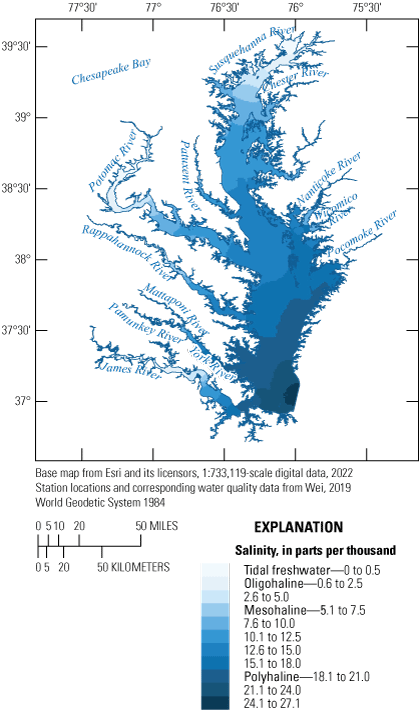
Map showing mean salinity concentrations, in parts per thousand, at the water surface level throughout the Chesapeake Bay watershed from 1985 through 2018.
In forested wetlands along the Mattaponi and Pamunkey River estuaries, tree species richness tended to decline moving downstream from freshwater forested wetlands to wetlands experiencing oligohaline conditions (Noe and others, 2021). On the Pamunkey River, in tidal forested wetlands experiencing low levels of porewater salinity (rarely over 1.5 parts per thousand [ppt]), trees died at a high level, which resulted in these forested wetlands slowly transitioning to oligohaline marsh (Noe and others, 2021).
Dissolved Oxygen
The amount of dissolved oxygen in aquatic environments is a well-known indicator of water quality and a measure of the oxygen available to living aquatic organisms. Aquatic insects, fishes, mollusks, crustaceans, and so on, have different oxygen demand requirements. Some experts have asserted that a minimum dissolved oxygen concentration of 5 mg/L is needed for suitable habitat for Chesapeake Bay’s flora and fauna (Chesapeake Bay Program, 2022). The U.S. Environmental Protection Agency created multiple criteria for dissolved oxygen conditions in 2003 for the Chesapeake Bay that include magnitude, frequency, and duration (U.S. Environmental Protection Agency, 2003a; U.S. Environmental Protection Agency, 2003b) and has subsequently refined and revised those criteria from 2004 through 2010, which are summarized in Tango and Batiuk (2013) and in 2017 (U.S. Environmental Protection Agency, 2017b). The State of Virginia also has dissolved oxygen criteria based on the specific environment within Virginia (for example, tidal or non-tidal rivers and streams, lakes and reservoirs, and if thermal stratification in a lake or reservoir is present) (Virginia State Water Control Board, 2022a) and criteria for waterbodies that drain to the Chesapeake Bay specifically (Virginia State Water Control Board, 2022b). To simplify these many criteria, Zhang and others (2018) created a metric called dissolved oxygen attainment deficit, which is a percentage that ranges from 0 to −100 percent, where 0 percent deficit means that all criteria were met and that dissolved oxygen conditions for ecological communities were good, and non-zero values represents the extent that dissolved oxygen criteria were not met and ecological conditions need improvement.
The tidal Pamunkey River has generally met these dissolved oxygen criteria from 1985 through 2021, although dissolved oxygen conditions were poor enough to cause some criteria to not be met in both the oligohaline and tidal freshwater segments for a short period around 1995 (Zhang and others, 2018; fig. 22). In the tidal Mattaponi River, the tidal freshwater segment has generally met dissolved oxygen criteria, whereas the oligohaline segment has not met the dissolved oxygen criteria over time except for the period 1992 through 1999 (Zhang and others, 2018).
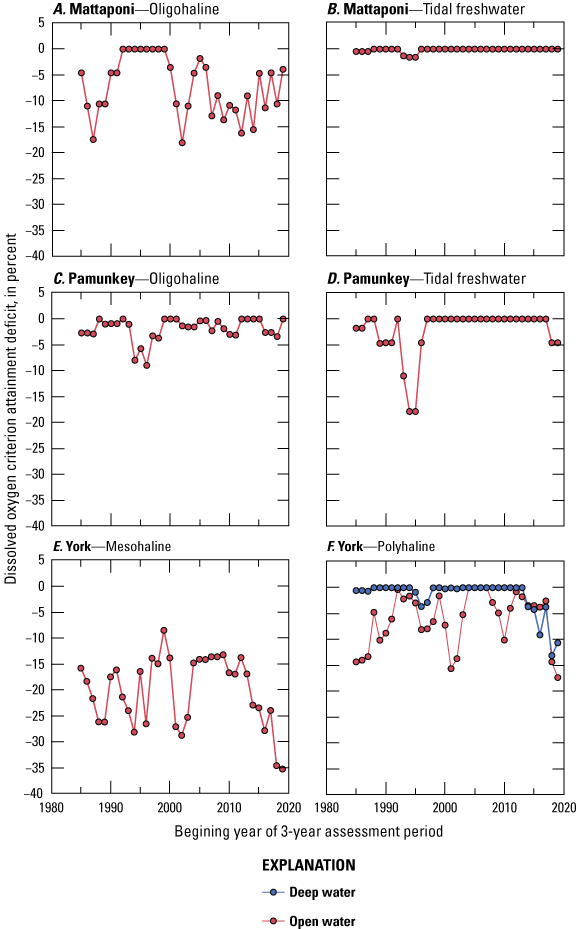
Graphs showing the dissolved oxygen criterion attainment deficit from 1985 through 2021 throughout the A, oligohaline Mattaponi; B, tidal freshwater Mattaponi; C, oligohaline Pamunkey; D, tidal freshwater Pamunkey; E, mesohaline York; and F, polyhaline York rivers. Data from Zhang and others (2018).
The mesohaline segment of the York River had the worst dissolved oxygen attainment deficit over time in the York River watershed; deficits ranged from about −8 to −35 percent (Zhang and others, 2018). The poor dissolved oxygen condition in the mesohaline segment of the York River is unsurprising because this segment of river has also been identified as having issues with increased nutrient and sediment loadings over time.
The polyhaline (fig. 21) segment of the York River, near its mouth, is sufficiently deep that it has dissolved oxygen criteria for open water and deep water habitats, defined in (U.S. Environmental Protection Agency, 2003b). The open-water attainment deficit has ranged from 0 to about −18 percent (Zhang and others, 2018). The dissolved oxygen conditions in the deep water of the polyhaline York River have generally been good enough over time to meet all criteria. The attainment deficits in this deep water were around zero from 1985 through 2013; however, from 2014 through 2021, the deep water of the polyhaline York River began to accrue an attainment deficit. The most recent 3-year assessment period (2019 through 2021) had the worst dissolved oxygen attainment deficit throughout the mesohaline and polyhaline York River since 1985 (Zhang and others, 2018).
Dissolved oxygen concentrations are affected by sediment and nutrient loads. Excess sediment and nutrients can lead to eutrophication, which can potentially promote hypoxic or anoxic conditions. Anoxic conditions can release more nutrients from bottom sediments and exacerbate negative ecological impacts. Healthy and diverse aquatic plant and animal communities depend on satisfactory dissolved oxygen levels. This fact underscores the importance of accurately estimating sediment and nutrient loads and characterizing the plant and animal communities throughout the entire York River watershed.
Water Clarity
Secchi disk depth is a measure of water clarity. Secchi disk depth can be determined when a standardized Secchi disk is submerged, and the depth at which the disk is no longer visible is measured. The Secchi disk depth is reduced with increased suspended sediment, algae, and other clarity reducing material, such as organic matter and calcium carbonate. The Secchi disk depth also provides a coarse indicator of general water quality.
Most of the long-term Secchi disk depth trends from 1985 through 2021 were degrading throughout the York, Pamunkey, and Mattaponi rivers. In the long term, the oligohaline and upper mesohaline York and Mattaponi rivers had no trends; while, the oligohaline Pamunkey River had a significantly improving long-term trend (Murphy and others, 2022; figure 23a). From water years 2012 through 2021, the only significant trend for Secchi disk depth was an improvement in clarity in the oligohaline section of the Mattaponi River. No other significant trends were found in the York River watershed in the most recent 10 years; however, possible degrading trends were found in the mesohaline and polyhaline sections of the York River (fig. 23b).
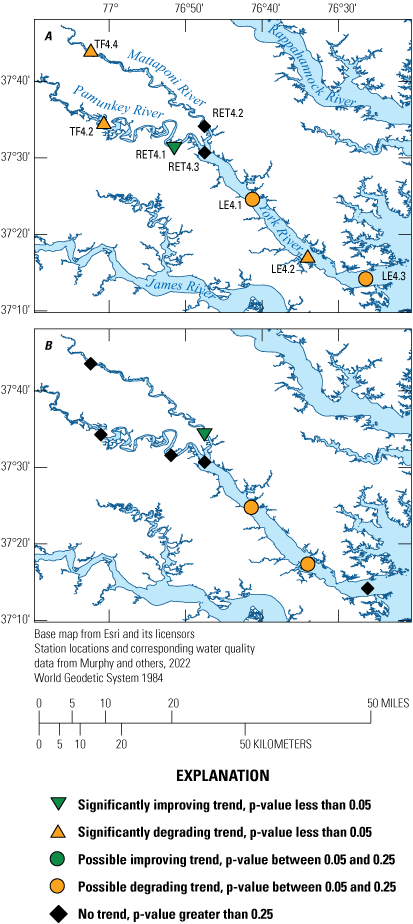
Maps showing Secchi disk depth trend likelihoods for the tidal York, Pamunkey, and Mattaponi rivers from A, 1985 through 2021 and B, 2012 through 2021.
Changes in water clarity in the Pamunkey River over time have been observed by Pamunkey Tribal Elders. “The water used to be a whole lot cleaner, it’s been degrading for a long time and the water clarity has been noticeably worse in the past 15 to 20 years” (T. Langston, Pamunkey Indian Tribe, Elder, oral commun., 2022). “I used to be able to see the fish in my net 3 to 4 ft deep in the water but now the clarity of the water isn’t good enough to see them like that anymore” (G. Miles, Pamunkey Indian Tribe, Elder, oral commun., 2022). Data support the Pamunkey Tribal Elders’ observations. For example, in the tidal freshwater Pamunkey River, station TF4.2 is right at the Pamunkey Indian Reservation, and the average Secchi disk depth at this station over the past 2 years is about 0.5 meters whereas observations in 1985 were sometimes over 1 meter (Murphy and others, 2022).
Water Temperature
Water temperature is one of the most fundamental water-quality parameters because it has a major influence on the habitat of aquatic organisms, biological activity and growth, and water chemistry reactions. In the long term (1985 through 2021) and short term (2012 through 2021), water temperature is increasing throughout the tidal York, Pamunkey, and Mattaponi rivers, representing significant degrading trends (Murphy and others, 2022, fig. 24). Climate models predict that air temperatures will become warmer in the future (Najjar and others, 2009), and as air temperatures rise, so do water temperatures. Generally, as more heat is introduced into a system (and temperatures become higher), it increases the rate of chemical reactions. Warmer water holds less dissolved oxygen. This is an important relation to consider as temperatures have been increasing over the past several decades and are expected to continue to increase in the future.
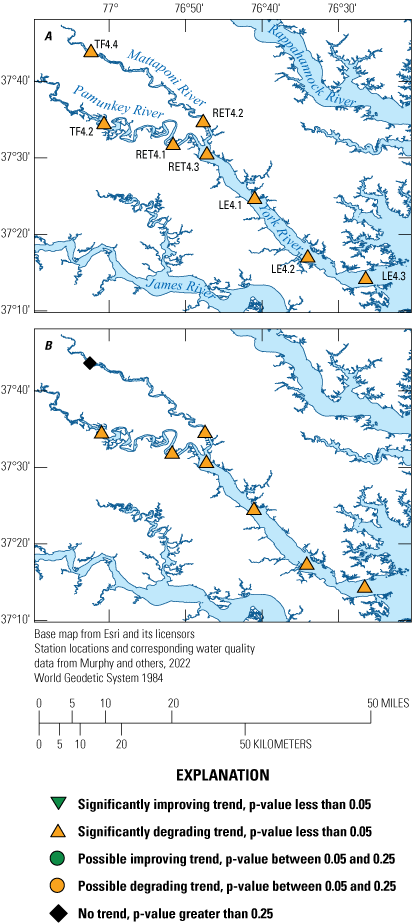
Maps showing water temperature trend likelihoods for the York, Pamunkey, and Mattaponi rivers from A, 1985 through 2021 and B, 2012 through 2021.
Linking Non-Tidal and Tidal Surface-Water Quality
Nitrogen
No long-term trends in total nitrogen have been found in the tidal or non-tidal Pamunkey River or much of the York River (Mason and others, 2021; Murphy and others, 2022). The total nitrogen load exported to the Chesapeake Bay from the York River was approximately 200 million pounds over the last 33 years (1985 through 2018). This amount represents an overall decline of approximately 21,000 pounds per year over this period. About 65 percent of this total nitrogen load was estimated to originate from the tidal York River watershed (Chesapeake Bay Program Integrated Trends Analysis Team, 2021). Significant nitrogen reductions from wastewater treatment facilities (Lyerly and others, 2014) and atmospheric deposition (U.S. Environmental Protection Agency, 2017a) drove the overall nitrogen reduction over time.
In the most recent decade (2012 through 2021), the non-tidal Pamunkey River had a slight trend in increased nitrogen, which is associated with degradation, and the tidal section had no trend. Analysis of data collected from the upper and lower sections of the York River did not indicate significant trends; however, the middle section of the York River had significant degrading trends. Throughout the non-tidal and tidal York River watershed, in the most recent decade, total nitrogen conditions generally degraded slightly; however, total nitrogen loads and concentrations throughout this watershed were generally low compared to other streams and rivers throughout the Chesapeake Bay. The most recent (2012 through 2021) degrading conditions in the non-tidal Pamunkey River and possible degrading conditions in the tidal Mattaponi River might contribute to the degrading conditions downstream in the middle portion of the York River or elsewhere.
Population throughout the York River watershed is expected to increase in the future, and natural lands are expected to continue to be developed into urban areas to support this population growth. The effects of these land-use changes are observable in load source attribution over time. From 1985 to 2019, total nitrogen loads exported by the York River watershed from agricultural lands decreased by about 20 percent, from natural lands by 7 percent, from streambed and bank erosion by about 2 percent, and from wastewater treatment facilities by about 26 percent. Over the same period, total nitrogen loads exported by the York River watershed from developed areas increased by about 84 percent and increased from septic systems by about 83 percent (Chesapeake Bay Program Integrated Trends Analysis Team, 2021). With warmer and wetter conditions predicted throughout the entire York River watershed, one estimate predicts a decrease in total nitrogen loads primarily because of denitrification in upland areas and an increase in crop, plant, and tree growth driven by these warmer temperatures. These predicted reductions of total nitrogen loads were estimated to be greater than the increases in total nitrogen loads because of predicted increased runoff from wetter conditions (Ator and others, 2022).
Many BMPs have been implemented throughout the York, Pamunkey, and Mattaponi river watersheds from 1985 through 2019, including tillage, commodity and cover crops, pasture management, forest buffer and tree planting, stormwater management, agricultural nutrient management, and urban nutrient management (Chesapeake Bay Program Integrated Trends Analysis Team, 2021). Over this period, 17,432 ft of streams have been restored, and 3,856 animal waste management systems have been treated. Although completed BMPs are far below their planned levels for 2025, the effects of those that have been implemented can be modelled to evaluate their potential effects. Models that incorporate these BMPs predict total nitrogen loads in 2019 to be slightly higher than 2009 levels but lower than 1985 levels. In the non-tidal and tidal Pamunkey and York rivers, we see 2019 loads slightly higher than 2009 loads, but they are also substantially higher than 1985 loads (Chesapeake Bay Program Integrated Trends Analysis Team, 2021). This disagreement between the expected effects of BMP implementation and calculated loads remains unresolved.
Understanding the sources that deliver nitrogen to streams to be transported downstream relies heavily on models. However, disagreements between models and observed nitrogen being delivered and transported can exist (Hyer and others, 2016). Monitoring geochemical tracers, such as isotopes, over time could help reveal sources of nitrogen being delivered and transported and aid in evaluating BMP effectiveness and future decision making about BMP implementation type and implementation location. Similarly, groundwater is an important delivery pathway of nitrogen; however, knowledge of watershed scale, or better, groundwater residence times would further improve understanding of how each source of nitrogen is cycled throughout the watershed (Hyer and others, 2016).
A complete understanding of nitrogen cycling, effectiveness of BMPs, fate and transport, and exported total nitrogen loads over time is lacking. There are many factors explained throughout the non-tidal and tidal surface-water quality sections that aim to provide an understanding of the input sources of nitrogen, delivery mechanisms to streams, fate and transport, source-specific loads exported downstream, and changes in nitrogen loads predicted from changing climatic conditions. Further impediments to understanding nitrogen are the complex interactions between the factors driving each of these nitrogen cycling and confounding factors from anthropogenic changes or management activities. As reductions in total nitrogen loads are aimed for to meet TMDL benchmarks, continued monitoring and modelling of nitrogen will be imperative to improve understanding, as will reconciling differences between monitored data and model estimations, accurately sourcing nitrogen being delivered and exported, and evaluating if TMDL benchmarks are being met.
Phosphorus
A long-term degrading trend in total phosphorus was present in the non-tidal Pamunkey River (Mason and others, 2021) but no long-term trends were in the tidal Pamunkey River. The York River, downstream from the Pamunkey River, however, had significant degrading long-term trends of total phosphorus (Murphy and others, 2022). The total amount of phosphorus exported out of the York River and into the Chesapeake Bay over the past 33 years (1985 through 2018) was about 15 million pounds, representing an overall decline of about 880 pounds per year over that period (Chesapeake Bay Program Integrated Trends Analysis Team, 2021). About equal contributions of the total phosphorus came from the non-tidal and tidal parts of the watershed. This reduction of total phosphorus was largely driven by reductions from point sources in the tidal part of the York River watershed (Chesapeake Bay Program Integrated Trends Analysis Team, 2021). Lyerly and others (2014) have attributed some of these reductions in phosphorus to upgrades in wastewater treatment facilities and the phosphorus detergent ban in 1987.
In the most recent decade (2010 through 2020), the non-tidal Pamunkey River had a decreasing (improving) trend in total phosphorus, and the tidal Pamunkey River had no trends. In the York River, over the same period, generally no trends were found. Throughout the entire York River watershed, in the most recent decade, total phosphorus conditions generally stayed constant, and loads, yields, and concentrations throughout this watershed were close to the median values when compared to streams and rivers throughout the Chesapeake Bay.
The largest sources of phosphorus estimated to have been delivered from the York River to the Chesapeake Bay were from streambeds, streambanks, and wastewater facilities. Since 1985, models estimate that delivered phosphorus from agriculture, natural areas, streambeds and banks, and wastewater facilities have all declined by 55, 7, 13, and 74 percent, respectively. Phosphorus from developed areas over this period was estimated to have increased by 101 percent (Chesapeake Bay Program Integrated Trends Analysis Team, 2021).
Many BMPs have been implemented throughout the York, Pamunkey, and Mattaponi river watersheds from 1985 through 2019, as previously mentioned (Chesapeake Bay Program Integrated Trends Analysis Team, 2021). Models that incorporate these BMPs predict total phosphorus loads in 2019 and 2009 to be significantly lower than 1985 levels; however, the loads in 2019 and 2009 were higher than in 1985 (Chesapeake Bay Program Integrated Trends Analysis Team, 2021). This disagreement between the expected effects of BMPs and calculated loads remains unresolved.
Because phosphorus binds to soil particles, phosphorus delivery to streams is inextricably linked to sediment delivery; most phosphorus delivered to the Chesapeake Bay is attached to sediment (Zhang and others, 2015). Soils have a finite capacity to store phosphorus, once capacity is reached, phosphorus is transported via shallow soils and groundwater (Staver and Brinsfield, 2001). Manure and fertilizer applications have exceeded crop needs in the York River watershed, especially in the non-tidal York River watershed (Chesapeake Bay Program Integrated Trends Analysis Team, 2021).
No natural chemical processes remove phosphorus from streams and rivers. However, reducing phosphorus could be achieved by optimizing phosphorus applications to not produce excess phosphorus, mitigating soil erosion, and continuing efforts to manage wastewater and stormwater (Chesapeake Bay Program Integrated Trends Analysis Team, 2021). Since the early 2000s, substantial reductions in phosphorus from agricultural manure, fertilizers, and biosolids were estimated throughout the York River watershed (Ator, 2019; Chesapeake Bay Program Integrated Trends Analysis Team, 2021) and it is plausible that those reductions have resulted in observed improvements in total phosphorus loads in the non-tidal Pamunkey River in the past decade and plateauing of total phosphorus loads in the tidal Pamunkey and York rivers. Large increases in phosphorus delivery from developed lands have been estimated for 1985 through 2018, and these increases from land development are expected to continue into the future.
A complete understanding of phosphorus cycling, effectiveness of BMPs, fate and transport, predicted effects from changes in climatic conditions, and exported total phosphorus loads throughout the York River watershed is lacking but is useful to improve phosphorus conditions. Furthermore, phosphorus has an affinity to bind with sediment, which also makes understanding sediment dynamics crucial. Continued efforts to improve models, especially at the tributary scale, will help close the gap in our knowledge of phosphorus fate and transport and might provide insights into residence times which will further aid mitigation efforts. Continued monitoring, modeling, and analyses of phosphorus will be important to improve understanding of phosphorus conditions, as will help reconcile differences between monitored data and models. Closing gaps in knowledge would help guide nutrient management strategies and improve evaluations of TMDL benchmarks.
Suspended Sediment
A long-term increasing (degrading) trend in suspended sediment was estimated for the non-tidal and tidal York, Pamunkey, and Mattaponi rivers (Mason and others, 2021; Murphy and others, 2022). Approximately 14 billion pounds of sediment has been exported from the York River watershed into the Chesapeake Bay over the last 33 years (1985 through 2018), representing an average annual increase of about 1 million pounds per year over the same period (Chesapeake Bay Program Integrated Trends Analysis Team, 2021). About 75 percent of the suspended sediment delivered to the Chesapeake Bay came from contributions in the tidal York River watershed.
Shorelines and streambeds/stream banks were the primary sources of suspended sediment from 1985 through 2018, despite estimated decreases over this period by 1 and 24 percent, respectively (Chesapeake Bay Program Integrated Trends Analysis Team, 2021). Sediment delivery from agricultural areas was also estimated to have decreased by approximately 53 percent. The overall increase in suspended-sediment loads was estimated to be driven primarily by increases in developed areas; developed areas increased by 43 percent from 1985 through 2018 (Chesapeake Bay Program Integrated Trends Analysis Team, 2021).
Impervious urban areas have expanded over time (Chesapeake Bay Program, 2023) throughout the Pamunkey and York river watersheds and are estimated to be contributing to the increase in suspended-sediment delivery, but other types of developments may also contribute significantly. One Pamunkey Tribal Elder noted that river-front homes were extensively built throughout the watershed in his lifetime, which usually also meant that riparian forests were cleared so that those homes could have views of the river. He has also witnessed increased stream bank erosion in these areas throughout his life (T. Langston, Pamunkey Indian Tribe, Elder, oral commun., 2022).
In the most recent 10-year period, the non-tidal Pamunkey River had a decreasing (improving) trend in suspended-sediment loads, whereas the non-tidal Pamunkey and tidal York rivers had relatively constant loads (Mason and others, 2021; Chesapeake Bay Program Integrated Trends Analysis Team, 2021). Throughout the York River watershed, in the most recent decade, suspended-sediment conditions generally remained constant, but loads, yields, and concentrations throughout this watershed were low compared to other streams and rivers throughout the Chesapeake Bay.
Many BMPs have been implemented throughout the York, Pamunkey, and Mattaponi river watersheds from 1985 through 2019, as previously mentioned (Chesapeake Bay Program Integrated Trends Analysis Team, 2021). Models that incorporate these BMPs predict suspended-sediment loads to decrease steadily over time from 1985 to 2019; however, the loads in 2019 and 2009 were higher than in 1985 (Chesapeake Bay Program Integrated Trends Analysis Team, 2021). This disagreement between the expected effects of BMPs and calculated loads from measured data remains unresolved.
Modeled estimates of erosion in upland areas, streambank, and subsequent tributary loading are variable throughout the York River watershed, but suspended-sediment concentrations are usually higher in the Piedmont physiographic province upstream from the Fall Zone (Brakebill and others, 2010). The naturally erosive conditions in this area are exacerbated by agricultural, urban, and other developed land uses (Gellis and others, 2005; Brakebill and others, 2010). A novel approach from Noe and others (2022) asserts a mass balance for sediment flux throughout the Chesapeake Bay watershed. Results from this approach suggest the non-tidal Pamunkey River watershed had a net loss of sediment, that is, more suspended sediment being mobilized and transported downstream than being trapped and stored in floodplains.
A complete understanding of suspended-sediment fate and transport, residence times, effectiveness of BMPs, and predicted effects from changes in climatic conditions remains lacking throughout the York River watershed. One recent effort by Noe and others (2022) attempted to understand sediment and nutrient dynamics of streambank and floodplain geomorphic changes and watershed material budgets in the Chesapeake Bay watershed. This method and published results provide a conceptual framework to begin to understand and estimate the amount of sediment and nutrients that are transported and stored and the resulting flux of these materials. Modeled and monitored estimates of suspended loads are higher than those allocated by the Chesapeake Bay TMDL. Continued efforts to monitor suspended sediment and improve model estimations are needed to close the gaps in knowledge regarding suspended-sediment conditions over time throughout the York River watershed. Reconciling differences in expected reductions in suspended-sediment loads from BMPs and observed long-term increases would provide insights into geomorphic processes and BMP effectiveness. Having accurate estimates of sediment load going to the Chesapeake Bay and for the entire York River watershed would facilitate better evaluations of whether TMDL benchmarks are being met.
Groundwater
Groundwater and surface water are connected in many ways and can be thought of as the same water resource taking different pathways as they move through the water cycle. Many human activities within the Pamunkey River watershed, such as direct human consumption and agriculture, are possible because of groundwater. Populations are expected to increase in the future (U.S. Census Bureau, 2022), and the demand for groundwater resources is also expected to increase to support this population expansion (Virginia Department of Environmental Quality, 2015). Extraction of groundwater has the potential to affect flow direction and pathways, lead to compaction of sediments in the aquifer system, and alter pressure and salt gradients far from the point of extraction (McFarland and Bruce, 2006). Many people throughout the Pamunkey River watershed and surrounding watersheds, including the Pamunkey Indian Tribe, use groundwater as their drinking water, making the availability and quality of groundwater resources essential to steward in the future. This section discusses the hydrologic conditions for groundwater movement in the Coastal Plain Physiographic Province and near the Pamunkey Indian Reservation; summarizes the current understanding of groundwater resources and quality in this area and the surrounding region; and discusses the potential threats to use, availability, and quality.
Hydrogeology
In the part of the Coastal Plain Physiographic Province in Virginia, groundwater flows through regionally extensive aquifers, in between the grains of saturated, permeable sedimentary layers. Less permeable sediments that restrict groundwater flow are designated as confining units, and indistinct transition areas are termed confining zones (McFarland, 2015). Precipitation that infiltrates the land surface and percolates to the water table facilitates groundwater recharge. Most groundwater in unconfined aquifers is discharged to nearby streams, but a small amount will travel downward and recharge deeper aquifers. In confined aquifers, groundwater flows primarily east towards large withdrawal centers and primary discharge areas along large rivers and the Atlantic Coast (McFarland, 2015). Groundwater levels have declined by about −1 to −2 feet per year (ft/yr) as groundwater withdrawals have increased over the past century. Small individual domestic wells are prevalent throughout the Coastal Plain, but withdrawals from these wells probably result in only small and localized groundwater declines (McFarland, 2015).
Aquifers in the Pamunkey River watershed include the unconfined surficial aquifer, and the confined Yorktown-Eastover, Piney-Point, Aquia, and Potomac aquifers, and all are separated by confining units (Masterson and others, 2015). According to McFarland and Bruce (2006), all of the aquifers that are present in the Pamunkey River watershed are also present at the Pamunkey Indian Reservation except for the Yorktown-Eastover aquifer. Before extensive groundwater pumping, groundwater in the Coastal Plain generally flowed from the Fall Zone towards the coast (McFarland and Bruce, 2006). Groundwater withdrawals throughout the part of the Coastal Plain Physiographic Province in Virginia began accelerating in the 1930s and further accelerated from the 1950s through about 1970. Withdrawal rates from about 1970 through 2010 have remained substantially higher than withdrawal rates in the first half of the 20th century (Heywood and Pope, 2009; Eggleston and Pope, 2013). The major pumping centers throughout Virginia alter the pre-development groundwater-flow pathways. In post-development conditions, groundwater flow in most aquifers, especially the Potomac, is generally radially inward and downward, towards large withdrawal centers (McFarland, 2015; Masterson and others, 2016b; fig. 25). Groundwater movement shown in figure 25 is a reasonable approximation of the current conditions throughout the York and Pamunkey river watersheds. The small domestic wells shown at two depths in figure 25 represent the Pamunkey Indian Tribe’s average well depths before 2019 (shallow depth in Piney Point aquifer) and from 2020 to present (deeper depth in Potomac aquifer). All pumping wells shown in figure 25 represent pumping conditions in the general area along cross section A to A’ and do not represent the actual number of wells.
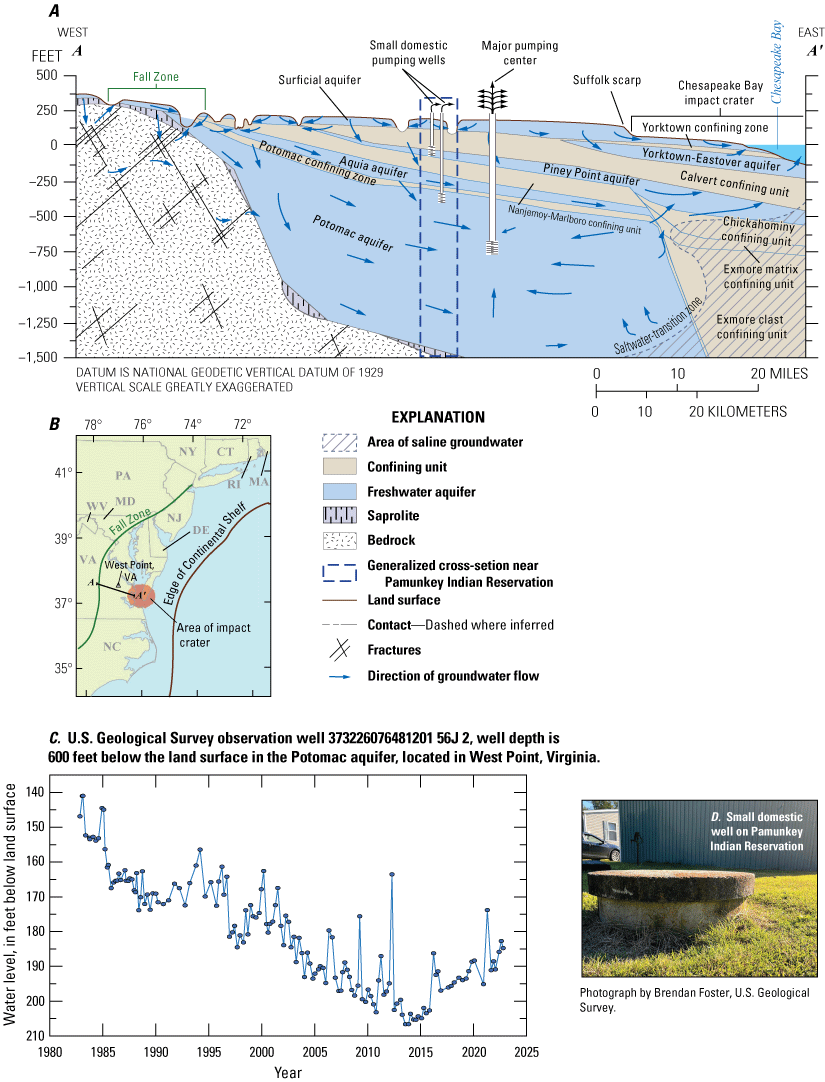
Figure showing A, a generalized hydrogeologic cross section and the directions of groundwater flow in the Virginia Coastal Plain under current conditions. Pumping wells shown are representative of the pumping condition in this general area and do not represent the actual number of wells near cross-section A-A’. Cross-section A–A’ includes the impact crater in the Chesapeake Bay. Unsaturated zone in surficial aquifer is not represented. Figure modified from McFarland and Bruce (2006) and Masterson and others (2016b). B, Graph showing groundwater levels from 1982 through 2022 from U.S. Geological Survey groundwater monitoring well 373226076481201 56J 2 in West Point, Virginia (U.S. Geological Survey, 2022a). C, photograph showing a private domestic well on the Pamunkey Indian Reservation.
Withdrawals
Groundwater levels in the lower Pamunkey River watershed declined by more than an estimated 1 ft per year on average from 1900 through 2000, which was likely due to anthropogenic withdrawals for industrial and manufacturing uses and municipal drinking-water supply (Masterson and others, 2015). Groundwater has been withdrawn from the Pamunkey River watershed for many anthropogenic uses for at least the last two centuries; however, rates of withdrawal throughout Virginia’s Coastal Plain have increased rapidly throughout most of the 20th century and remained high from about the 1970s through 2010 (Eggleston and Pope, 2013; Heywood and Pope, 2009; fig. 26) These large withdrawals have led to aquifer groundwater-level declines, compaction and subsidence, reversal of groundwater flow from a seaward to landward direction, and increased potential for saltwater intrusion (McFarland, 2010). When groundwater withdrawals in confined aquifers exceed the rate at which groundwater is recharged and water levels decline, the aquifer system can become compacted and may permanently lose storage volume and groundwater-flow pathways may be altered (McFarland, 2010).
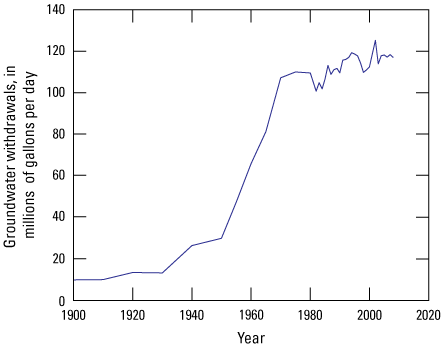
Graph showing increased groundwater withdrawal rates over time from Virginia Coastal Plain aquifers from 1900 to 2008. Modified from Eggleston and Pope (2013).
In recent years (2010 through 2019), groundwater withdrawals in the Virginia Coastal Plain have been reduced. Total groundwater withdrawals sharply reduced around 2010, and withdrawals from 2010 through 2019 have been sustained at around 2010 levels (Virginia Department of Environmental Quality, written commun., 2022; fig. 27). Groundwater withdrawals are reported only when greater than 10,000 gallons per day during any month or greater than 1 million gallons per month for crop irrigation. Current total groundwater withdrawal rates in the Virginia Coastal Plain remain high overall when compared to rates in the early 1900s; however, the recent reductions starting around 2010, driven primarily by reduced pumping in the industrial and manufacturing sectors (Virginia Department of Environmental Quality, written commun., 2022), could address the declining groundwater levels in the Coastal Plain and potentially contribute to quell aquifer compaction and subsequent subsidence.
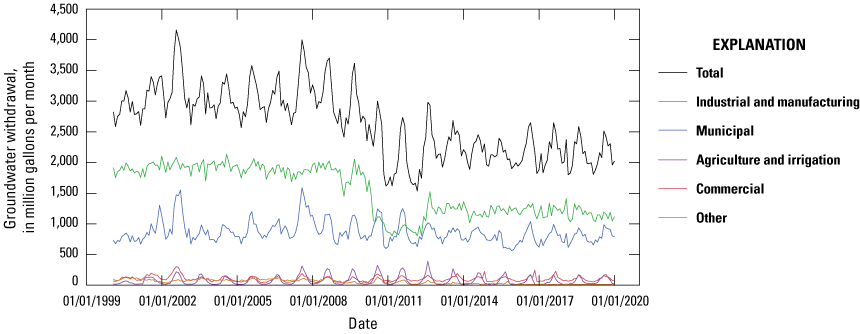
Graph showing reported source-specific monthly withdrawal of groundwater in the Virginia Coastal Plain from 2000 through 2019. Data acquired from Virginia Department of Environmental Quality (2022c).
Groundwater withdrawals for the localities within the Pamunkey River watershed in the year 2021 ranged from 16.79 to 0.27 Mgal/d (Virginia Department of Environmental Quality, 2022b; table 3). Total withdrawals from King William County were the largest in the Pamunkey River watershed. Most of the groundwater withdrawn in King William County is done by the WestRock Company’s paper mill, approximately 10 miles east of the Pamunkey Indian Reservation. The WestRock Company’s paper mill pumps millions of gallons per day from the Potomac aquifer.
Demand for groundwater resources throughout the York River watershed is estimated to increase by 50 percent from 2010 to 2040 (Virginia Department of Environmental Quality, 2015), which can potentially affect the availability and use of these groundwater resources in the future. The large current groundwater demand in the York River watershed and projected increases, underscores the importance of monitoring these resources so that they might be managed equitably. Mitigating the consequences of large withdrawals could account for the prioritization of health and resource considerations for the future.
Table 3.
Total groundwater withdrawals for localities within the Pamunkey River watershed in Virginia in 2021. Data from Virginia Department of Environmental Quality (2022b).[Mgal/d, million gallons per day]
Discrete and continuous measurements of water-level depths below the land surface in and around the York River watershed are monitored by the USGS and others groundwater monitoring wells; many of the wells are operated in cooperation with VDEQ. Within the York River watershed, 37 groundwater monitoring wells are currently monitored by the USGS as of 2022 (fig. 28). Water levels at three selected groundwater monitoring wells, in the Potomac aquifer throughout the York River watershed, have declined by an average rate of −1.5 ft/yr for the past 50 to 60 years (fig. 29), with rates ranging throughout the watershed between −1.1 to −2 ft/yr. Observed rates of decline were larger the closer the wells were to the major pumping center in the watershed. The measured rate of groundwater decline at these wells generally agrees with estimates produced by Eggleston and Pope (2013), who estimated an average rate of decline between −0.75 to −1.5 ft/yr, and Masterson and others (2015), who estimated an average rate of decline between −1 to −2 ft/yr.
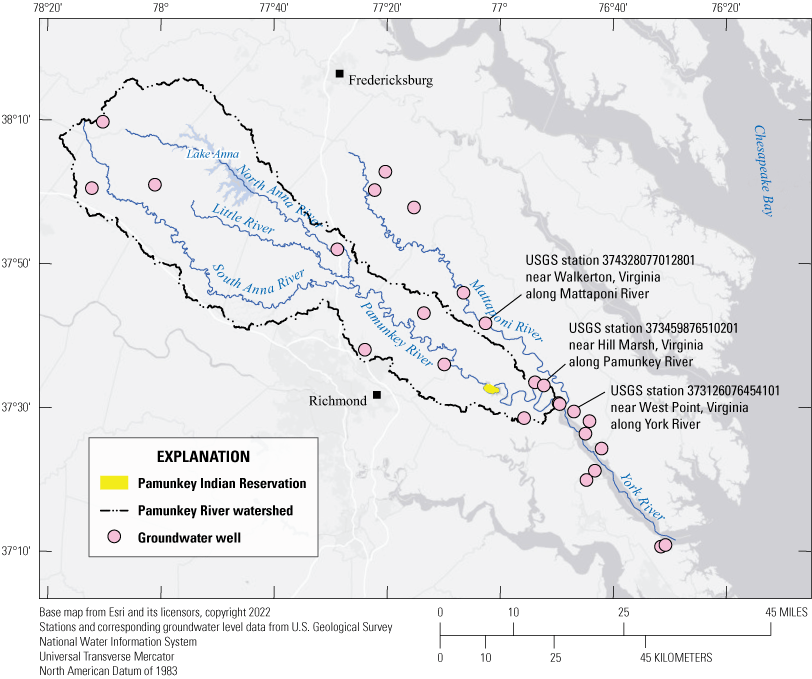
Maps showing U.S. Geological Survey groundwater monitoring station well locations in and around the York River watershed. The three wells with at least 50 years of data (U.S. Geological Survey, 2022a) are highlighted and extend longitudinally landward from around the confluence of the Pamunkey and Mattaponi rivers. USGS, U.S. Geological Survey.
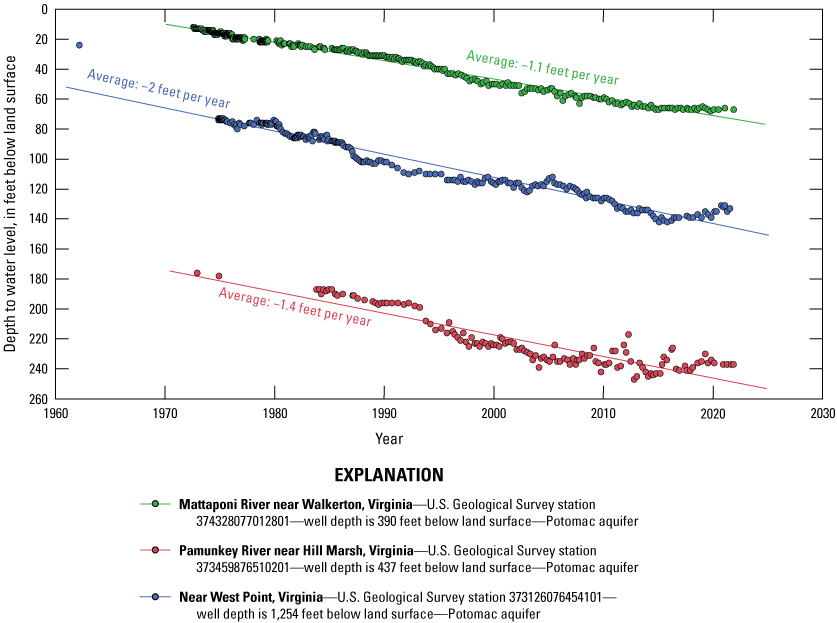
Graph showing groundwater-level measurements at three U.S. Geological Survey groundwater monitoring wells with at least 50 years of data. These wells extend longitudinally landward from around the confluence of the Pamunkey and Mattaponi rivers, in the York River watershed from 1962 through 2021. Data from U.S. Geological Survey (2022a).
Two groundwater monitoring wells are near the Pamunkey Indian Reservation. One is approximately 8 miles upstream from the reservation near the Pamunkey River, and one is about 8 miles downstream near the Pamunkey River. The USGS groundwater monitoring well 373737077083201, about 8 miles upstream from the reservation and 35 ft deep in the Piney Point aquifer, has been measuring depth to water level continuously at a 15-minute interval since 2008 with discrete measurements dating back to 1978 (U.S. Geological Survey, 2022a). The data from this well do not appear to have a long-term upward or downward trend, but a cyclical pattern is present, with seemingly large year-to-year variability. This well’s shallow depth might provide insights into seasonal groundwater variation and periods of drought. Further investigation would be needed to understand the groundwater dynamics at and around this location.
The multiple-depth groundwater monitoring well about 8 miles downstream from the Pamunkey Indian Reservation, includes USGS groundwater monitoring wells 373523076523402 through 373523076523405. Measurements are collected at four different depths to evaluate water levels in the Piney Point and Aquia aquifers and two different depths in the Potomac aquifer. These wells have been measuring water-level depth continuously at a 15-minute interval since 2020 and limited discrete measurements before 2020 (U.S. Geological Survey, 2022a). Although only recently installed, these wells will provide insights into groundwater dynamics in the future, especially because they are close to a large pumping center near West Point, Virginia.
The groundwater dynamics underneath the Pamunkey Indian Reservation are complex and influenced by many factors. Large pumping centers throughout the Coastal Plain influence deep, confined, regional aquifers, like the Potomac aquifer (McFarland, 2010). Groundwater availability underneath Pamunkey Indian Reservation lands is largely affected by forces external to the reservation. Continued groundwater monitoring at current groundwater monitoring wells throughout the Chesapeake Bay and in and around the York and Pamunkey river watersheds is necessary to provide the data for the Tribe, scientists, and regulators to evaluate the availability of groundwater resources over time, recognize patterns in groundwater levels, observe periods of potential drought, and provide information about how groundwater withdrawals throughout the region are affecting the Pamunkey Indian Tribe at the local scale.
A few well-established groundwater models have been created to provide insights into the groundwater dynamics of the Coastal Plain physiographic province of Virginia (Robinson and Reay, 2005; Heywood and Pope, 2009; Masterson and others, 2016b). Notably, the model created by Heywood and Pope (2009) uses spatial and numerical methods to predict changes in regional groundwater levels in the Coastal Plain physiographic province of Virginia and has the capability to evaluate different scenarios for future proposed pumping and the responses to each individual aquifer. This model is used by VDEQ to predict future groundwater levels in response to changes in pumping and provides an essential and foundational tool to begin evaluating groundwater in this region. More recently, Masterson and others (2016b) created a numerical model to simulate groundwater conditions throughout each hydrogeologic section and aquifer. Their model estimates hydrologic budgets at all depths, water levels, and storage and predicts future hydrologic conditions under different climatic scenarios. Overall, these groundwater models are extremely useful tools to estimate hydrogeologic conditions and have demonstrated a degree of accuracy when comparing model outputs to monitored data from groundwater monitoring wells. As future climatic and anthropogenic changes complicate our ability to accurately model groundwater systems, efforts aimed at improving the accuracy and reliability of groundwater models and additional efforts in model verification and validation could provide vital information to the Pamunkey Indian Tribe and residents throughout this region about the future availability and use of the groundwater resources.
Groundwater Quality
In the Pamunkey River watershed, the Potomac aquifer is the deepest aquifer and generally possesses better water quality, based on direct measurements, than surface and shallow aquifers (McFarland, 2010). Surficial and shallow aquifers close to the land surface are more susceptible to contamination from non-point source pollutants, such as agricultural runoff, leaking septic systems and other underground storage tanks, stormwater, and so on. Multiple confining layers may help compartmentalize potential influxes of pollutants, thereby providing some protection to deeper aquifers. Groundwater in deep aquifers, like the Potomac aquifer, can move extremely slowly (Pope and others, 2020), meaning pollutants that reach these deep aquifers could potentially persist for long periods. Groundwater pumping, especially large or intense pumping, has changed groundwater-flow directions towards major pumping centers (McFarland, 2010; Masterson and others, 2016b). Another major and well-known threat, caused by groundwater pumping near a coast, is saltwater intrusion into aquifers (McFarland, 2017). Although landward saltwater intrusion in Virginia is much less compared to saltwater intrusion in other States along the Atlantic Coastal Plain, such as North Carolina, Delaware, and New Jersey, there could potentially be a delayed response in intrusion to the vast amount of groundwater withdrawals in Virginia over the past century (Masterson and others, 2016b). For the Pamunkey Indian Tribe, “Everyone here on the reservation is on well and septic systems. So, the quality of our water is an issue [especially because] we’re all drinking groundwater” (R. Gray, Pamunkey Indian Tribe, Chief, oral commun., 2022).
All residents of the Pamunkey Indian Tribe have a well and are using groundwater for drinking water and all other residential and commercial uses (R. Gray, Pamunkey Indian Tribe, Chief, oral commun., 2022). New wells were constructed in 2020 because the quality of water pumped from them before 2020 was determined to not be sufficient for human consumption. The old wells were approximately 40 to 100 ft below the land surface and were pumping water from the Piney Point aquifer, whereas the new wells were drilled to approximately 280 ft below (fig. 25) the land surface to reach the Potomac aquifer, where water-quality was determined to be sufficient for human consumption. Tribal Elders noted that water from the prior shallow wells had a bad odor and taste, which forced many to purchase expensive filtration systems and others to stop using the water from their wells altogether (T. Langston, Pamunkey Indian Tribe, Elder, oral commun., 2022). The new wells in the Potomac aquifer are expected to provide water safe for human consumption to the Pamunkey Indian Tribe because the Potomac aquifer is known to have minimal contamination and known to have protection from multiple confining units (McFarland, 2010). Anthropogenic contamination has not been detected yet in the Potomac aquifer in this part of the Coastal Plain. However, two potential contamination sources to the aquifer include anthropogenic sources and saltwater intrusion combined with downward flow gradients caused by major pumping centers (Masterson and others, 2016b). Long-term monitoring of groundwater quality can inform users about water-quality concerns, inform users about health concerns related to groundwater quality, and provide insights on the movement of pollutants.
Land Subsidence and Sea-Level Rise
One of the most immediate concerns expressed by The Pamunkey Indian Tribe is relative sea-level rise (RSLR) (R. Gray, Pamunkey Indian Tribe, Chief, oral commun., 2022; G. Miles, Pamunkey Indian Tribe, Elder, oral commun., 2022), that is the combination of land subsidence and of sea-level rise. Aquifer compaction because of groundwater withdrawal leads to land subsidence, and warming global temperatures are driving increases in global sea levels. The effects of RSLR can have profound effects at the local scale, including for the people of the Pamunkey Indian Tribe. This section discusses land subsidence, sea-level rise, their combined effects, the drivers of RSLR, the impacts to the landscape, changes in hydrologic conditions, and predicted changes from RSLR in the future.
Land Subsidence
Land subsidence is the vertical sinking of the land mass at often large spatial scales. The primary driver of subsidence in the southern Chesapeake Bay region is groundwater withdrawal from aquifers, which when combined with gravitational compaction, leads to a loss of volume in aquifers and the subsequent loss of volume and net elevation in aquifers (Poland, 1984; Galloway and Burbey, 2011). More than half of the RSLR observed in the southern Chesapeake Bay region is caused by subsidence, and more than half of the subsidence in this area is caused by aquifer compaction from groundwater withdrawals (Eggleston and Pope, 2013; Karegar and others, 2017). Subsidence rates in the southern Chesapeake Bay region are the highest on the eastern seaboard, ranging from −1.1 to −4.8 millimeter per year (mm/yr), and local rates of subsidence in the York River estuary range from −2.8 to −3.8 mm/yr (Eggleston and Pope, 2013; Mitchell and others, 2017; fig. 30).
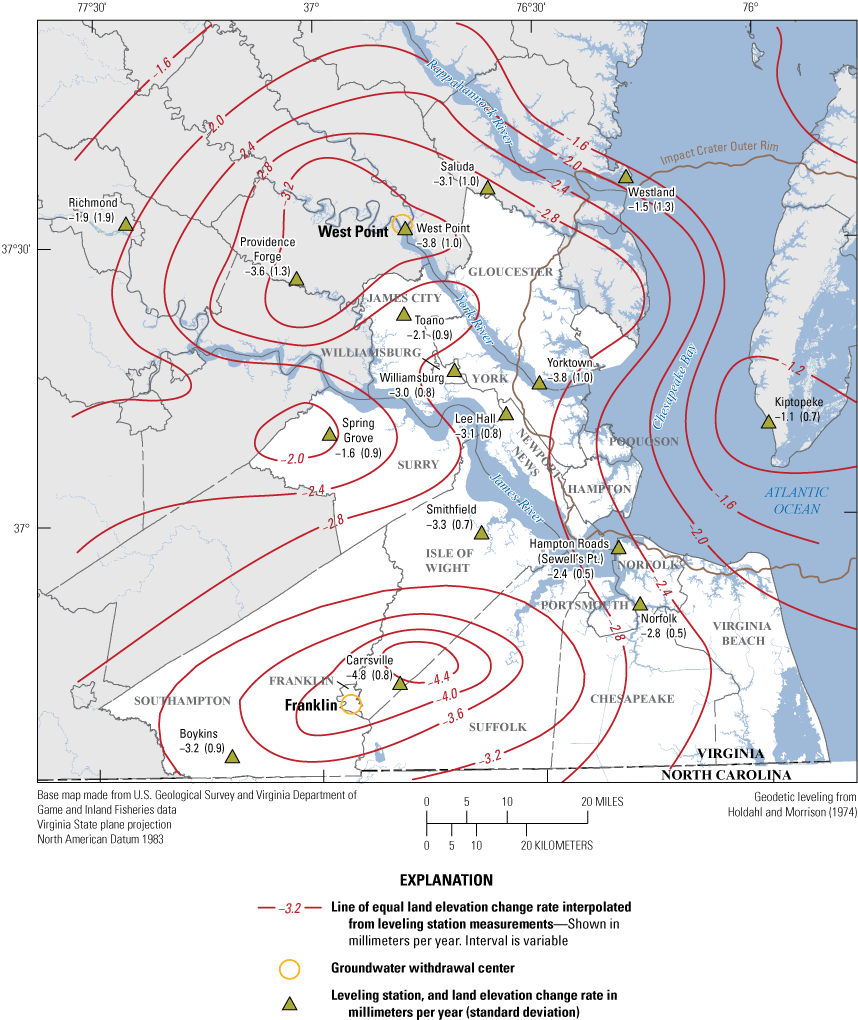
Map showing land elevation change rates from 1940 through 1971.Contours indicate lines of equal land elevation change rate, in millimeters per year, and negative elevation change rates indicate subsidence. Values in parentheses are standard deviations. Figure from Eggleston and Pope (2013).
The Pamunkey Indian Reservation lies approximately 10 mi west of West Point, Virginia; West Point is a focal point of subsidence within the southern Chesapeake Bay region. In the 1970s, subsidence was measured at West Point by leveling; the measured rate, −3.76 mm/yr, was among the highest measured rates in the Chesapeake Bay at that time (Holdahl and Morrison, 1974). Because the Pamunkey Indian Reservation is close to the subsidence epicenter at West Point, it has relatively high rates of subsidence—most recently estimated to be approximately−3.2 mm/yr (Eggleston and Pope, 2013; Milligan and others, 2019; fig. 30).
Groundwater withdrawal is often used for private wells on individual residences, municipalities, and industry within municipalities, with a high degree of spatial variability, as is much of the southern Chesapeake Bay region. Compared to other causes of subsidence, groundwater withdrawal is an easier cause to study and address. When subsidence is caused by groundwater withdrawal, reducing or managing withdrawal rates and recharging aquifers have been successful methods of quelling subsidence (Galloway and Burbey, 2011). Because of spatial variability of groundwater withdrawals in Virginia and variability in municipality management efforts, resultant rates of RSLR also vary considerably throughout the region. Subsidence from aquifer compaction, because of groundwater withdrawal, is affecting the Pamunkey Indian Reservation at a regional scale, that is, major groundwater withdrawal focal points throughout the Coastal Plain of Virginia and Maryland have the largest effects on the groundwater levels and subsidence observed directly on the Pamunkey Indian Reservation. In the future, cooperation between large groundwater users; tribal, State, and local governments; and other stake holders will be crucial to continue quelling subsidence.
Other drivers of subsidence, like the glacial isostatic adjustment, contribute to some degree to local subsidence in the southern Chesapeake Bay region. Other potential drivers of subsidence include bedrock dissolution, drainage and degradation of organic soils, settling of disturbed soils, volcanic disturbances, tectonic motions, and settling of the impact crater in the Chesapeake Bay; however, there is no evidence that these potential drivers are contributing to local subsidence significantly (Eggleston and Pope, 2013).
In addition to land subsidence’s contribution to RSLR, land subsidence can also lead to greater nuisance flooding and extreme flooding associated with storm surges (Karegar and others, 2017). In the southern Chesapeake Bay, the relatively shallow topographic relief of coastal areas, such as those of the Pamunkey Indian Reservation, mean frequent or permanent inundation will eventually cause large monetary damages and displace hundreds of thousands of people from their homes (Eggleston and Pope, 2013). Rising water levels, coupled with subsidence, will push groundwater levels upwards, damaging private and municipality infrastructure and exacerbating precipitation-driven flooding (Eggleston and Pope, 2013).
The Pamunkey Tribal Elders are very aware of these threats and have been experiencing them firsthand. Pamunkey Tribal Elder, Grover Miles, said “I have witnessed it. The reservation is sinking, and I can prove it to you. Forty-five years ago, I dug a well for my parents. It was 38-ft deep. If you go anywhere on the reservation today, you will hit water at 10 ft. And for the past 15 years, as soon as the tide rises, I’ve got water in my back field, which didn’t happen prior to 15 years ago” (G. Miles, Pamunkey Indian Tribe, Elder, oral commun., 2022).
High-resolution monitoring of groundwater levels and subsidence signals at the local scale in and around the Pamunkey River watershed will be important in making informed decisions regarding aquifer management. As rates of SLR will increase because of elevation loss caused by subsidence, it is important that subsidence rates be incorporated when calculating local rates of RSLR and determining vulnerability of the Pamunkey Indian Tribe, Reservation, and its water resources to SLR and climate disruption. The USGS and partner agencies are currently measuring vertical land motion and subsidence in many ways, including with global positioning system benchmarks and extensometers throughout Virginia and a new extensometer installed at West Point, Virginia, in 2023 (U.S. Geological Survey, 2022b). In concert with these land-motion monitoring activities, continued monitoring of the groundwater monitoring well network throughout the York River watershed and throughout Virginia and neighboring States can provide the data necessary for scientists to analyze and interpret future changes in RSLR.
Sea-Level Rise
Although the rates of SLR have been highly variable over the last 18,000 years, sea level has been steadily rising along the Atlantic Coast of the United States since that time (Riggs and others, 2011). Some of the highest rates of SLR in the contiguous United States are in the Chesapeake Bay region, where they are twice the average global rate per year (Eggleston and Pope, 2013). On a global scale, SLR is driven by thermal expansion of water in the oceans, coupled with melting landlocked ice sheets, which add volume to ocean waters (Pilkey and Pilkey, 2019). On a regional scale, many complex and interacting factors contribute to SLR. Subsidence from aquifer-system compaction because of groundwater extraction, isostatic adjustment of the Laurentide Ice Sheet’s glacial forebulge, changes in surface- and deep-water current circulation such as the Gulf Stream (Atlantic Meridional Overturning Current), and gravitational redistribution of land-based glacial meltwater are all factors that contribute to regional and local SLR along the Atlantic Coast (Strain, 2014; Pilkey and Pilkey, 2019).
Sea level has been rising along the coasts of the contiguous United States, including coastal Virginia, for the past century (Sweet and others, 2022; Ezer and Atkinson, 2015; fig. 31). Higher sea levels amplify the impacts of flooding, storm surges, high tides, wetland loss, and coastal erosion (Sweet and others, 2022; Eggleston and Pope, 2013). Climate change contributes to the SLR experienced today and the SLR that will come in the decades and centuries in the future (Reidmiller and others, 2018; Hall and others, 2019). However, even if drastic mitigations were taken to limit the rise in average global air temperatures, the oceans will continue to respond to historical and current atmospheric conditions, and sea levels will continue to rise in the future (Fox-Kemper and others, 2021). This reality stresses the importance of gaining a better understanding of the extent these impacts will have in the Pamunkey River watershed now and in the future.
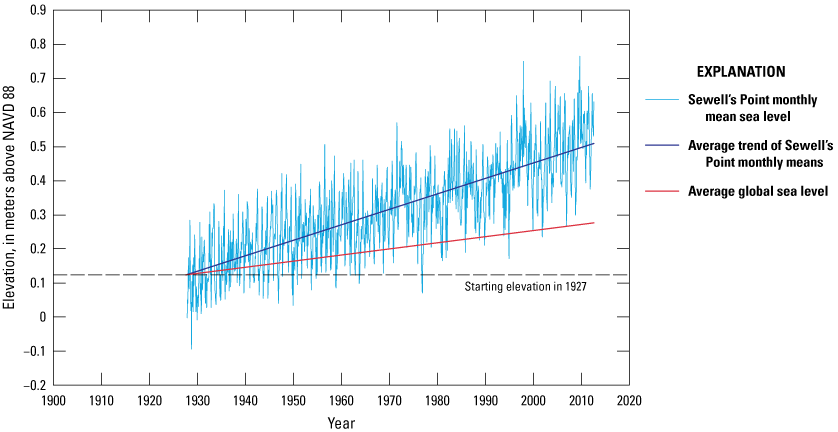
Graph showing monthly mean sea levels at Sewells Point in Norfolk, Virginia, at National Oceanic and Atmospheric Administration station 8638610 (National Oceanic and Atmospheric Administration, 2022); the global average sea-level rise rate of 1.8 millimeters per year is also shown as a comparison (Bindoff and others, 2007). Land subsidence contributes to the high rate of sea-level rise at Sewells Point relative to the average global sea-level rise. Figure modified from Eggleston and Pope (2013). NAVD 88, North American Vertical Datum of 1988.
A 3-ft rise in sea level by 2100 is plausible in coastal Virginia (Riggs and others, 2011; Pilkey and Pilkey, 2019; Sweet and others, 2022). The maximum expected rise by 2100 is 6 ft, and some researchers suggest as much as 10 ft (Pilkey and Pilkey, 2019; Sweet and others, 2022); these estimates do not include the effects from land subsidence, erosion, or future construction. Any of these estimates (fig. 32) will have substantial repercussions for the Pamunkey Indian Tribe and Reservation, such as submergence of parts of the Pamunkey Indian Reservation; displacement of people; alteration of ecosystems; disruption of normal business; and loss of or damages to homes, buildings, infrastructure, agricultural lands, and culturally important lands.
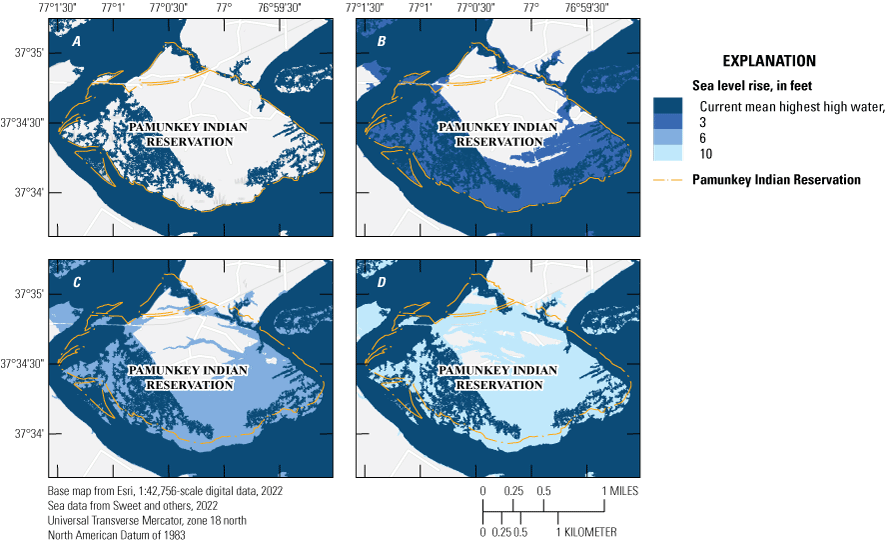
Maps showing sea level rise scenarios and their potential impacts to the Pamunkey Indian Reservation. A, current mean higher high water (MHHW)—the average of the higher high water height of each tidal day observed over the National Tidal Datum Epoch.; B, a 3-foot rise on top of MHHW; C, a 6-foot rise on top of MHHW; and D, a 10-foot rise on top of MHHW.
The Pamunkey Tribal Elders are very concerned about their land being completely submerged under water in the future. They made estimates of how soon they think the reservation will be completely under water that ranged from 30 to 100 years (W. Cook, Pamunkey Indian Tribe, Elder, oral commun., 2022; J. Krigsvold, Pamunkey Indian Tribe, Elder, oral commun., 2022; T. Langston, Pamunkey Indian Tribe, Elder, oral commun., 2022; G. Miles, Pamunkey Indian Tribe, Elder, oral commun., 2022). Tribal Elders have noted that “There are a lot of places both on the reservation and throughout the surrounding counties that used to be dry all the time and now they are wet all the time. Especially in the last 15 years, it’s been happening really fast” (J.H. Langston, Pamunkey Indian Tribe, Elder, oral commun., 2022; T. Langston, Pamunkey Indian Tribe, Elder, oral commun., 2022; G. Miles, Pamunkey Indian Tribe, Elder, oral commun., 2022).
The predicted impacts to the Pamunkey Indian Tribe and Reservation from RSLR are many and could have profound effects on the Tribe’s ability to continue to inhabit the current reservation lands. Observations made by the Pamunkey Tribal Elders indicate impacts from RSLR have already started with notable increases in the amount of land that has become submerged or permanently inundated, shoreline erosion, and increases in flood frequency and magnitude. Monitoring RSLR could support health, safety, and preservation of the Pamunkey Indian Tribe and Reservation.
River Ecology
The Pamunkey River watershed supports a diverse estuarine habitat, including riparian tidal wetlands ranging from tidal freshwater to polyhaline and many species of submerged aquatic vegetation (SAV). These riverine and wetland habitats in turn support a great deal of biota, including macrobenthic organisms, fin fish, insects, amphibians, reptiles, mammals, and birds. The flora and fauna that rely on these habitats are critical for maintaining ecological integrity and provide many ecosystem services.
Riparian
The Pamunkey River watershed supports vast riparian areas, which are water-dependent lands adjacent to streams and a transition zone between streams and uplands. They maintain important physical, biological, and ecological functions by facilitating interactions between land, air, water, and vegetation (Klapproth and Johnson, 2009). Riparian areas provide for a disproportionally large amount of biodiversity. Additionally, these ecosystems are critical for maintaining geomorphological integrity of stream banks and channels and protecting streams from upland pollutant runoff, thus buffering adjacent aquatic habitat from erosion, disturbance, and nutrient loading from upland sources (Newson and Sear, 2001; Klapproth and Johnson, 2009).
Development of urban and agricultural land threatens riparian ecosystems and those ecosystems for which they provide a buffer. Riparian zone restoration targeting for the York River watershed revealed that across the 7,780 miles of shoreline in the watershed, 248 miles would benefit water quality and habitat based on adjacent upland land uses (Newson and Sear, 2001).
Wetlands
National Wetland Inventory 2016 surveys in the Pamunkey River watershed tally over 46,000 acres of wetlands (fig. 33). The Pamunkey River watershed also contains tidal freshwater marsh and forest, brackish marsh communities, and salt-marsh communities (U.S. Fish and Wildlife Service, 2016). In addition to providing many ecosystem services critical for human populations, tidal wetlands provide important habitat for a wide array of biota. High rates of primary productivity give tidal wetlands on the Pamunkey River an important foundational role in trophic webs, providing food for lower-level organisms, such as mollusks, crabs, and fish. Tidal wetlands also provide critical nursery habitat for many ecologically and economically important anadromous fish and blue crabs, and habitat for many bird species, including migratory waterfowl (Perry and Atkinson, 2009; Mitchell and others, 2017). Additionally, wetlands provide ecosystem functions that are critical to the human populations living in the York River watershed, including water filtration, floodwater abatement, wave attenuation, and shoreline protection.
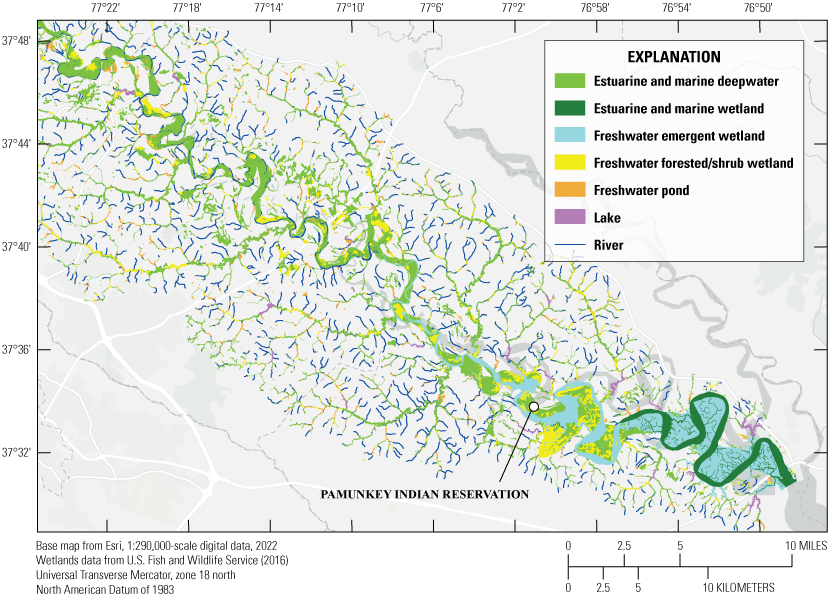
Map showing wetland types in the Pamunkey River watershed.
In addition to human disturbance and development, tidal wetlands throughout the York River estuary are threatened by climate disruption and SLR. The National Oceanic and Atmospheric Administration tide gage on the York River estimates local SLR to be 4.93±0.34 mm/yr (National Oceanic and Atmospheric Administration, 2021). Compounded with relatively high rates of local subsidence, some estimates ranging from 2.8 to 3.8 mm/yr, local rates of relative sea-level rise (RSLR) will be even higher (Eggleston and Pope, 2013; Mitchell and others, 2017).
Many factors contribute to rates of marsh elevation change, which makes predicting elevation change rates for individual marshes challenging. If wetlands in the York River estuary cannot stay above local RSLR, stress from increased salinity and inundation might cause succession between marsh types, and sometimes, loss of wetland acreage entirely (Neubauer, 2011; Ensign and others, 2014). Mitchell and others (2017) quantified marsh acreage change between the 1970s and 2009, and found that wetland acreage decreased by 2.7 percent in the York River estuary during their study period with 20 centimeters of SLR. Spatial patterns of loss varied based on multiple interacting factors, and marshes in some areas expanded with SLR (Kirwan and others, 2016a; Mitchell and others, 2017).
Wetlands, along with the biota that inhabit them, vary along a salinity gradient of the Pamunkey River estuary (Perry and Atkinson, 2009). Salinity levels in the Pamunkey River estuary range from tidal freshwater in the upriver stretches to polyhaline in the downstream reaches (Perry and Atkinson, 2009; Raey, 2009). Four Chesapeake Bay National Estuarine Research Reserve (CBNERR) monitoring locations on the York and Pamunkey river estuaries are positioned along the salinity gradient to capture water quality conditions over varying salinity levels throughout the estuary (fig. 10) and provide useful data on salinity levels, marsh types, vegetation communities, and where changes have occurred over time (Chesapeake Bay National Estuarine Research Reserve, 2022). Site PMK012.18 is in tidal freshwater, TSK000.23 in oligohaline, YRK015 in mesohaline, and CHE019.38 in polyhaline.
In their natural state, coastal ecosystems are resilient and can keep pace with SLR by vertical accretion of sediments and lateral migration (Riggs and others, 2011; Buchanan and others, 2022). However, when sediment inputs are reduced or migration pathways are not available, tidal wetlands are imperiled and potentially converted to open water (Buchanan and others, 2022). Wetland habitats currently compose about 55 percent of the total land in the Pamunkey Indian Reservation (fig. 34). The wetland habitats on the reservation are dominated by tidal freshwater forested wetlands and tidal freshwater herbaceous emergent wetlands. Downstream from the Pamunkey Indian Reservation, tidal freshwater forested wetlands might be transitioning to tidal oligohaline emergent marshes under current SLR conditions (Noe and others, 2021). Tidal freshwater emergent marshes might also be transitioning to tidal oligohaline emergent marshes in the York River estuary (Perry and Atkinson 2009). Even if a sufficient sediment supply and migratory pathways allowing lateral movement were available (Buchanan and others, 2022), Tribal wetlands would still suffer a net loss of territory. Wetlands will also be lost on the reservation in areas where current infrastructure precludes lateral migration.
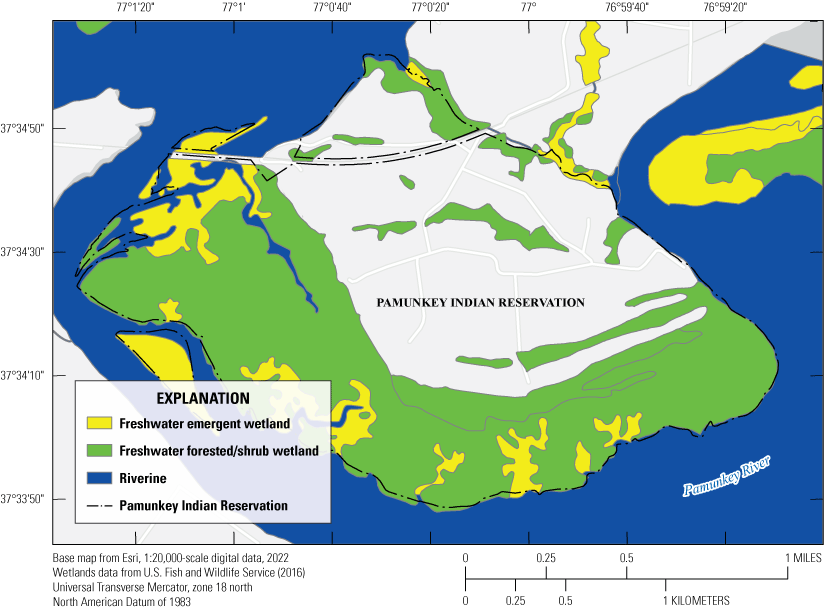
Map showing wetland types within the Pamunkey Indian Reservation.
Increased RSLR will not only have deleterious impacts to Tribal wetlands but will also cause the intertidal zone to elevate into upland habitats, which could cause increased erosion in areas not typically exposed to wave energy and currents. In addition, increased RSLR has the potential to convert areas that are currently low-lying upland habitat into non-tidal wetland habitat by elevating the current water table closer to the soil surface (Pilkey and Pilkey, 2019). Elevated groundwater levels caused by RSLR might also cause drinking water to become contaminated with saline water (Pilkey and Pilkey, 2019).
Wetland ecosystems rely on complex sediment accumulation dynamics to maintain elevation and keep pace with SLR (Goodwin and others, 2001; Ensign and others, 2014). Coastal wetlands around the Chesapeake Bay vary in their ability to maintain equilibrium with rising water levels (Kirwan and others, 2016b). Many marsh complexes around the Chesapeake Bay are monitored for surface-elevation change, but relatively few have been monitored for geodetic signatures of subsidence. Although some marshes may have positive surface-elevation trends suggesting a positive response to SLR, undetected subsidence could negate those positive trends. If coastal wetlands experience inundation and salinity beyond the tolerances of their vegetation communities, those communities will either die out entirely and become mud flats or be succeeded by alternate marsh types (Goodwin and others, 2001; Ensign and others, 2014).
Tidal Freshwater
The Pamunkey Indian Reservation is in the tidal freshwater zone of the Pamunkey River (salinity less than 0.5 ppt), and according to the 2016 National Wetland Inventory, the Reservation contains 530 acres of tidal freshwater forested wetland and over 80 acres of tidal freshwater marshes (U.S. Fish and Wildlife Service, 2016). The Pamunkey River watershed has more than 21,000 acres of tidal freshwater forested wetlands and more than 5,000 acres of tidal freshwater marshes. Tidal freshwater forests are at the heads of estuaries and often at the limits of tidal influence (Ensign and others, 2014). In the York River watershed, tidal forests consist primarily of canopy communities dominated by either ash, blackgum, maple, or sweetgum (Rheinhardt and Hershner, 1992). Ash-blackgum swamps are dominated by Fraxinus L. species (spp.) (ash), Nyssa sylvatica (blackgum), and Acer rubrum L. (red maple) (Rheinhardt and Hershner, 1992). Maple-sweetgum forests are dominated by red maple, Liquidambar styracifula L. (sweetgum), and ash (Rheinhardt and Hershner, 1992). Community composition variance in tidal freshwater forested wetlands is possibly related to tidal range combined with hummock-hollow topography and resultant flooding regime (Rheinhardt and Hershner, 1992; Duberstein and others, 2013). Tidal forests, because of their position at the heads of estuaries, often have little room to migrate landward in the face of SLR because of natural and manmade barriers. The high canopy dominance of Fraxinus L. spp. in many of the forested wetlands on the Pamunkey also put them at particular risk of the destructive invasive Agrilus planipennis (emerald ash borer beetle). Studies done in the tidal freshwater forests at Jug Bay, Maryland, forests that have similar community composition to the ash-maple swamps of the Pamunkey, suggest that because ash makes up a large part of the canopy community’s composition and because of ash’s relatively poor regeneration characteristics, large-scale loss of ash will substantially alter these habitats (Jacobsen, 2020). These factors, combined with tidal forested freshwater wetlands relative scarcity compared to other wetland types, put these types of wetlands in a particularly vulnerable position (Jacobsen, 2020).
Tidal freshwater marshes are at the head of the Pamunkey River estuary and, without the stress of saline conditions, are home to a great diversity of plants and animals (Perry and Atkinson, 2009). Perry and Atkinson (1997) document 56 macrophyte species at the CBNERR site at Sweet Hall Marsh; these species in particular provide dominant coverage at this site: Peltandra virginica L. (green arrow arum), Carex stricta Lam. (uptight sedge), Leersia oryzoides L. (rice cutgrass), Persicaria punctata E. (dotted smartweed), and Persicaria arifolia L. Haraldson (halberdleaf tearthumb) (Perry and Atkinson, 1997).
Oligohaline
The Pamunkey River watershed contains approximately 5,300 acres of oligohaline marsh (salinity between 0.5–5 ppt). Perry and Atkinson (2009) studied vegetation communities at the CBNERR sites along the Pamunkey and York rivers and found saline concentrations greater than 15 ppt can occur and create oligohaline conditions around the previously freshwater Sweet Hall Marsh (Perry and Atkinson, 2009; Raey, 2009).
Although freshwater macrophytes are still dominant, studies at Sweet Hall Marsh after Perry and Atkinson (1997) have shown increases of salt-tolerant species that did not previously exist there (Perry and Atkinson, 2009). This more recent growth of halophytes at Sweet Hall Marsh would suggest that this area is where salinity and inundation, because of SLR, are creating conditions somewhat more tolerable to salt-marsh species.
Sweet Hall Marsh is experiencing changes in community composition not only because of saltwater intrusion, but also because of the introduction of Phragmites australis Cav. (common reed). Recent genetic studies have shown that, alongside stands of native Phragmites, hybridized stands of Phragmites containing genetic material of introduced and native species have colonized, which may be especially adept at outcompeting other native marsh emergent vegetation (Wu and others, 2015). Introduced Phragmites might adjust community composition and result in loss of suitable habitat of bird species that use these wetlands (Browne and Hecnar, 2007).
Mesohaline and Polyhaline
Downstream reaches along the York River are mesohaline (salinity between 5–18 ppt) and polyhaline (salinity greater than 18 ppt) and support marshes of salt-tolerant species that are not supported upstream as freshwater species are. CBNERR sites Taskinas Creek, Catlett Islands, and Goodwin Islands are in saline conditions; Taskinas Creek and Catlett islands support brackish conditions, and Goodwin Islands support high-salinity conditions (Perry and Atkinson, 1997; Perry and Atkinson, 2009; Raey, 2009). Goodwin Islands are dominated by halophytes, such as Spartina alterniflora L. (saltmarsh cordgrass), Distichlis spicata L. (desert saltgrass), and Spartina patens (Aiton) Muhl. (saltmeadow cordgrass). In addition to supporting many of the same dominant halophytes as Goodwin Islands, Taskinas Creek and Catlett islands support more facultative halophytes, such as Spartina cynosuroides (L.) Roth (big cordgrass) (Perry and Atkinson, 2009).
The shift in emergent macrophyte communities that have been observed in recent years at Sweet Hall Marsh is consistent with predicted saltwater intrusion and subsequent marsh succession after upriver shift of the salinity gradient as sea levels rise (Neubauer, 2011; Ensign and others, 2014). Sweet Hall Marsh is downstream from the Pamunkey Indian Reservation, but as sea levels continue to rise, the salinity gradient is predicted to continue to push upriver, resulting in greater levels of tidal inundation. Introduced species of emergent vegetation capable of outcompeting native species might also alter macrophyte community composition and habitat. These factors might alter tidal wetland communities and change the ecosystem functionality and services provided by these ecosystems, including their critical roles as habitat for ecologically and economically important species.
Submerged Aquatic Vegetation
SAV is a critical component of the ecology of the Chesapeake Bay and its tributaries. Different species of SAV grow throughout the York River estuary, and their distribution is based on salinity tolerances (fig. 35) (Moore and others, 2009). One of the most important ecosystem functions of SAV and adjacent mud and sand flats is to provide nursery habitat for several ecologically and economically important species, such as blue crabs and anadromous fish (Stockhausen and Lipcius, 2003; Lipcius and Ralph, 2011; Moore and others, 2009). However, turbidity, sedimentation, nutrient loading, and competition with invasive species all threaten SAV in the York River estuary (Moore and others, 2009).
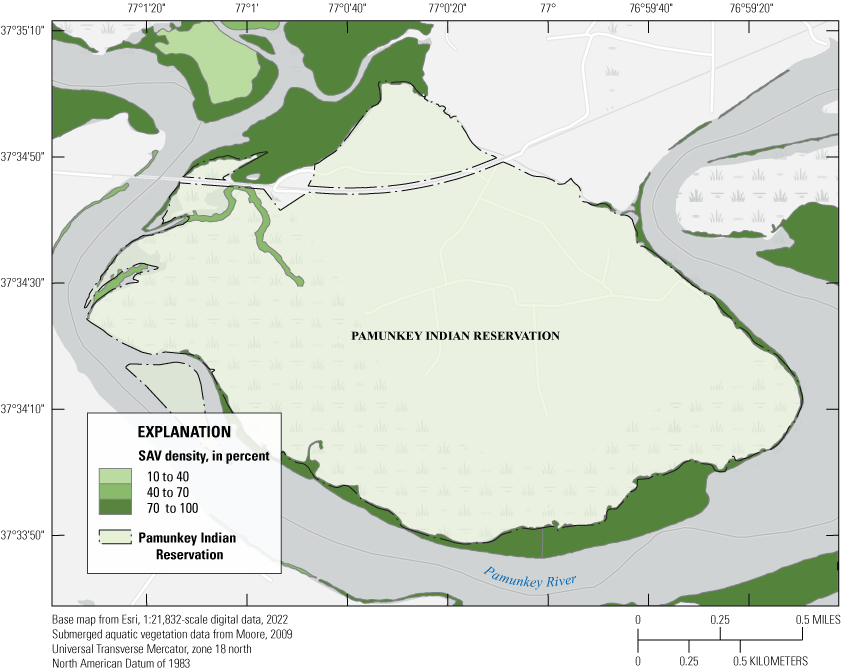
Map showing submerged aquatic vegetation along the Pamunkey River. SAV, submerged aquatic vegetation.
Zostera marina L. (eelgrass) is a polyhaline seagrass that grows only near the mouth of the York River in high-salinity waters and is the only seagrass species found in the Chesapeake Bay (Moore and others, 2009). Ruppia maritima L. (widgeon-grass) grows throughout the salinity gradient, from tidal freshwater to polyhaline conditions (Moore and others, 2009). Stuckenia pectinata (L.) Börner (sago pondweed) and Potamogton perfoliatus L. (redhead grass) are found in brackish waters of lower salinities (Moore and others, 2009). Freshwater SAV in the York River watershed grows in areas with little-to-no salinity, and communities are dominated by Vallisneria americana Michx. (watercelery), the invasive Hydrilla verticillata (L.f.) Royle (waterthymes), and Myriophyllum spicatum L. (Eurasian watermilfoil) (Moore and others, 2009). Macroalgae (seaweeds) are not dominant in the York River estuary, but in areas of excess nutrient loading, macroalgae may outcompete eelgrass (Moore and others, 2009). Waterthymes spread rapidly, can outcompete native SAV, and is abundant in freshwater and oligohaline segments of the York and Pamunkey rivers (Orth and others, 2006; Moore and others, 2009).
SAV is important because it provides habitat for a multitude of aquatic fauna, but need a certain level of water quality to thrive. Sediment and nutrients from anthropogenic stressors played a major role in a large-scale loss of SAV in the York River estuary that reached its minimum in the 1980s (Stockhausen and Lipcius, 2003). Although high-resolution empirical data on current stocks of SAV in the upriver segments of the Pamunkey River is lacking, Tribal members have pointed out a major decline in water clarity, which studies have suggested correlates with lower abundance of SAV (Henderson, 2021).
Fishes
There is no record of the names given to different types of fish by indigenous peoples of this region, nor were any systematic biological surveys of the York River watershed conducted by early European colonists. Early European writings (circa 1624); however, describe some coastal Virginia fishes, like Alosa pseudoharengus (alewife) and Alosa aestivalis (blueback herring), collectively called river herring, and Acipenseridae (sturgeon), which were very familiar to colonists recently arrived from England. Other fish species had no old-world equivalents and were generally ignored (Jenkins and Burkhead, 1994). Even less is known about the relationship between indigenous people and the fish they likely harvested, but several types, including sturgeon, river herring, and Alosinae spp. (shad), were—and still are—culturally significant to the Pamunkey Indian Tribe and other Tribes that live along Virginia’s coastal rivers (G. Miles, Pamunkey Indian Tribe, Elder, oral commun., 2022).
Before the start of the 19th century, the fish assemblage of the tidal Pamunkey River could be separated into two categories of native (that is, original) species. The first of these groups was dominated by perhaps 30 resident species of Cyprinidae (minnows), Catostomidae (suckers), Centrarchidae (sunfishes) and other less common taxa. All fishes in this category completed their entire life cycle within the tidal Pamunkey River. They were common but probably never abundant. Most were small, measuring less than 15 centimeters in length and lived for only a few years. A few native species like Lepisosteus osseus (Linnaeus, 1758) (longnose gar) and Amia calva (Linnaeus, 1766) (bowfin) lived longer and grew larger, but neither make an appetizing food source (Jenkins and Burkhead, 1994).
The other category of indigenous fish species was migratory (diadromous) and included: Alosinae (shads), river herrings, striped bass, American eel, and Acipenser oxyrinchus (Mitchill, 1815) (Atlantic sturgeon). They moved annually and predictably between the Atlantic Ocean and coastal rivers like the Pamunkey River to spawn (anadromous) or to live as adults (catadromous) in riverine freshwater habitats. Some, like Morone americana (Gmelin, 1789) (white perch) and Perca flavescens (Mitchill, 1814) (yellow perch), are considered semi-migratory and move seasonally within the Pamunkey River. Historically, adult river herrings, that is, alewife and blueback herring, left the ocean early each spring to enter the Pamunkey River in large schools that numbered in the hundreds of thousands each year. Because these river herring spawning runs were seasonally predictable and involved huge numbers of fish, densely packed in relatively shallow water, they were depended upon by indigenous peoples and early European fishers as an abundant source of high-quality protein. A significant proportion of adult river herring die after spawning, and their carcasses contribute marine-derived nutrients that accelerate primary production in coastal freshwater rivers and marshes during spring months (Jenkins and Burkhead, 1994).
During the 19th century, the advent of highly efficient fishing methods increased harvesting and increased pollution. Furthermore, the construction of hundreds of low-head dams caused dramatic declines in populations of native migratory fishes, including Atlantic sturgeon, American shad, blueback herring, and alewife (Klauda and others, 1991; Atlantic States Marine Fisheries Commission, 1999). Despite substantial recovery efforts in Virginia and elsewhere, including harvest moratoria on river herrings, that is, alewife and blueback herring; hatchery propagation for American shad; and listing of Atlantic sturgeon under the Endangered Species Act (16 U.S.C. 1531-1544), there is little evidence of restoration success. Consequently, the culturally significant and economically valuable fisheries once supported by these species are no longer an important feature of Tribal life (Jenkins and Burkhead, 1994).
In response to a growing interest in recreational angling throughout the 20th century, natural resource agencies stocked a variety of non-native fishes in some Virginia rivers (Hewitt and others, 2009). Compared to native fishes, most of the introduced species were large, long lived, predatory, and broadly tolerant of environmental conditions. For example, some natives of the Mississippi River, like the Pylodictis olivaris (Rafinesque, 1818) (flathead catfish) and Ictalurus furcatus (Valenciennes in Cuvier and Valenciennes, 1840) (blue catfish), have become widely established and numerically dominant in their new freshwater rivers, including the Pamunkey River (Hilling and others, 2021). The ecological effects that abundant, non-indigenous predator fishes have on native (resident and migratory) Pamunkey River fishes are difficult to quantify. However, the potential for impacts is substantial, especially when combined with aquatic habitat loss from pollution, dams, and other migration impediments; SLR; and salinity intrusion within the upper York River watershed.
Pamunkey Tribal Elders have witnessed a dramatic shift in the fish assemblages within the Pamunkey River watershed in a relatively short amount of time. Two Pamunkey Tribal Elders recall that when they were younger, they fished mainly for river herring, that is, alewife, blueback herring, American shad, striped bass, and Ictalurus punctatus (Rafinesque, 1818) (channel catfish) (T. Langston, Pamunkey Indian Tribe, Elder, oral commun., 2022; G. Miles, Pamunkey Indian Tribe, Elder, oral commun., 2022). Grover has been commercially fishing the Pamunkey River every year for the past 66 years and said, “We’ve lost herrings. There are very few herrings now. We also used to fish for White Perch but now there’s not enough to fish for them” (G. Miles, Pamunkey Indian Tribe, Elder, oral commun., 2022; K. Moore, Pamunkey Indian Tribe, Elder, oral commun., 2022). Multiple Tribal Elders also noted that when they were younger, they would easily be able to catch over 100 hundred American shad, but in recent years, they would be lucky to catch 10 (T. Langston, Pamunkey Indian Tribe, Elder, oral commun., 2022; G. Miles, Pamunkey Indian Tribe, Elder, oral commun., 2022). They also noted that in recent years, the fish that they catch are overwhelmingly blue catfish. “The Blue Catfish are eating everything, they’re changing the environment” (K. Moore, Pamunkey Indian Tribe, Elder, oral commun., 2022). Pamunkey Tribal Elders attribute these losses in native fish populations to several factors including overfishing, the introduction of non-native species, rivers and their tributaries being fragmented from dams and other infrastructure, and poor water quality (G. Miles, Pamunkey Indian Tribe, Elder, oral commun., 2022; T. Langston, Pamunkey Indian Tribe, Elder, oral commun., 2022).
The fish communities supported by the Pamunkey River have changed substantially over time, and this change has hindered the ability of the Pamunkey Indian Tribe to fish as a primary means of income. Most of the Tribal Elders noted that the fishery is currently not in a state where they are able to fish as a sole source of income but would like to see it recover to a point where that would be possible for future generations (G. Miles, Pamunkey Indian Tribe, Elder, oral commun., 2022; T. Langston, Pamunkey Indian Tribe, Elder, oral commun., 2022; K. Moore, Pamunkey Indian Tribe, Elder, oral commun., 2022).
Freshwater Mussels
Freshwater mussels (Unionidae [Rafinesque, 1820]) are important contributors to biological diversity in Virginia’s streams and rivers, though they live a mostly hidden existence within riverine sediments. Limited surveys of the tidal Pamunkey River have documented at least 10 unionidae species, like Elliptio congaraea (Lea, 1831) (Carolina slabshell) and Lasmigona subviridis (Conrad, 1835) (green floater) (Brian Watson, Virginia Department of Wildlife Resources, oral commun., 2022). Some taxa, like the ubiquitous Elliptio complanata (Lightfoot, 1786) (eastern elliptio), are common, but most (80 percent) known freshwater mussel species in the Pamunkey River are threatened by habitat loss, pollution, salinity intrusion, and introduced predators (Brian Watson, Virginia Department of Wildlife Resources, oral commun., 2022).
Freshwater mussels tell an important story about the interconnectedness of the Pamunkey River ecosystem. Most unionidae mussels produce parasitic larvae called glochidia that must latch onto the gills of a host fish to survive (Jones, 2015). Some glochidia, like those of the Pyganodon implicata (Say, 1829) (alewife floater), will attach only to migratory fish, such as blueback herring and alewife (New York Natural Heritage Program, 2021), which are also in severe decline in many coastal rivers for many of the same reasons (Limburg and Waldman, 2009). For this reason, conservation efforts for rare freshwater mussels may also depend on successful management of native fish populations (Brian Watson, Virginia Department of Wildlife Resources, oral commun., 2022). Mussels are efficient filter feeders that can increase light penetration into otherwise turbid waters, like oysters do in saline parts of the York River watershed. Increased filtration of water allows better light penetration, which might result in the production of more SAV, which in turn provides critical habitat for juvenile fish, including host fish species, in tidal freshwater reaches of the Pamunkey River.
Land-use throughout the York and Pamunkey rivers estuary has changed considerably, impacting riparian and fluvial geomorphology, riparian and benthic habitat, and the flora and fauna that depend upon those habitats. Freshwater mussel (unionidae) survivability is at great risk because of their environmental sensitivity and the degrading habitat. Unionidae have been shown to be reliable indicators of habitat health (Simmions and Reed, 1973; Lees, 2005) because of their sensitivity to environmental impacts. Simmons and Reed’s 1973 study of macrobenthic communities, in particular, demonstrated the suitability of unionidae as environmental indicators in the North Anna and Pamunkey rivers.
The North Anna River watershed was the site of extensive pyrite mining from 1885 to 1920 (Simmions and Reed, 1973). The acidified tailings from the extensive mining operations were found to have caused considerable negative impacts on water quality, including erosion, increased sedimentation, and loss of aquatic life and vegetation. As of 1973, fin fish populations were reduced by 65 percent and macrobenthic organisms were reduced by 40 to 60 percent: freshwater mussels composed 30 percent of this macrobenthic reduction (Simmions and Reed, 1973). Subsequent efforts to repopulate mussels in the North Anna River downstream from the confluence with Contrary Creek have been unsuccessful (Simmions and Reed, 1973).
Although impoundments are generally considered harmful to biodiversity, the dam creating Lake Anna was shown to create a downstream recovery zone for macrobenthic fauna, including unionidae, that were unable to reestablish on the North Anna downstream from its confluence with Contrary Creek before the impoundment’s construction (Simmions and Reed, 1973; Lees, 2005). The complete absence of unionidae in the North Anna River downstream from its confluence with Contrary Creek before impoundment construction, despite the presence of insect and fin fish species, suggested that freshwater mussels are more sensitive indicators of environmental conditions and habitat suitability (Simmions and Reed, 1973; Lees, 2005).
Freshwater mussels are easily impacted by several anthropogenic land-use changes, including: (1) water acidification and habitat destruction from mining, (2) erosion and sedimentation, (3) impoundments cutting off fish species critical for mussel-larval life stages and distribution, and (4) impervious surface and agricultural runoff increasing to sedimentation and nutrient loading (Lees, 2005). Lees’ 2005 study of unionidae richness in the Pamunkey River watershed incorporated geographic information system data to assess land-use impacts on mussel distribution, and sampling the same locations, compared his results with the number of species found in a study by Riddick (1973). Compared with the 10 mussel species identified by Riddick in 1973 at Pamunkey River survey sites, only 4 species remained at the Pamunkey River survey sites in 2005 (Lees, 2005). Low abundance and species richness of unionidae in the Pamunkey River seem associated with agriculture and cropland, high abundance of silt, and lack of pebble/cobble substrate (Lees, 2005). Freshwater mussels seem to be recolonizing the area downstream from the Lake Anna impoundment, apparently confirming predictions by previous studies that the reservoir acts as a buffer of sediments and pollutants and helps improve downstream habitat quality (Simmions and Reed, 1973; Lees, 2005). The lower Pamunkey River was reported to be devoid of unionidae, possibly because of salinity fluctuations (Lees, 2005). Although mussels are repopulating some areas of the Pamunkey and York rivers, there exists an overall loss of diversity. Increased levels of sedimentation in the Pamunkey River, largely attributed to agricultural land use and associated nutrient loading, will continue to create conditions challenging for mussel recovery (Langland and others, 2006; Raey, 2009). Tribal members interviewed recalled seeing mussel shells on the eastern bank of the Pamunkey Indian Reservation and better water quality around the reservation during their youths, but not anymore. This anecdotal evidence supports recent studies that describe the loss of unionidae in the York River watershed because of increased sedimentation and decreased water quality (J. Krigsvold, Pamunkey Indian Tribe, Elder, oral commun., 2022; K. Moore, Pamunkey Indian Tribe, Elder, oral commun., 2022).
Land-use changes throughout the Pamunkey River watershed that are sources of erosion, runoff, and sedimentation, such as agriculture and other development, are likely contributing to the negative effects observed in its watershed ecology and habitat. These effects could be further compounded with the loss of freshwater mussel diversity, not only because of the importance unionidae play in Tribal culture and food sovereignty, but also because of the role unionidae have in maintaining water quality and ecological integrity and the lower habitat quality that their absence will bring.
Summary
The current scientific understanding of multiple aspects of the water resources throughout the Pamunkey River watershed is synthesized by this report. Traditional ecological knowledge from Pamunkey Tribal Elders was documented to gain a more complete understanding of these resources. Gaps in overall knowledge about each facet of the water resources were identified. This report emphasizes the vital importance of incorporating traditional ecological knowledge to better understand water resources, contextualizing scientific findings beyond monitoring periods of a specific investigation, and understanding the benefits that could occur when traditional ecological knowledge and published scientific literature are combined. This report is summarized in the following numbered points in each section:
Surface Water
-
1. The Pamunkey River is characterized by highly variable daily, seasonal, and annual discharges (Milligan and others, 2019; Hershner and others, 2009).
-
2. River discharge throughout the Pamunkey River watershed is managed by 184 dams (U.S. Army Corps of Engineers, 2022). Most of the dams are for consistency of drinking water supply and agriculture, but also impact fish passage and alter the hydrology and geomorphology.
-
3. The Federal Emergency Management Agency’s flood risk assessment in 2021 categorized the Pamunkey Indian Reservation as a special flood hazard area. These areas have special flood, mudflow, or flood related erosion hazards and require adherence to the National Flood Insurance Program’s floodplain management regulations and the purchase of flood insurance (Federal Emergency Management Agency, 2021).
-
4. Surface-water withdrawals are made for anthropogenic uses throughout the Pamunkey River watershed and are expected to increase as the population increases (Virginia Department of Environmental Quality, 2015). Although a non-consumptive user, the North Anna Nuclear Power Plant withdraws a very large amount of surface water (Virginia Department of Environmental Quality, 2022b).
-
5. Current hydrologic analyses in the Pamunkey River watershed are rudimentary, but thorough; however, robust hydrologic analyses are absent. Potential impacts of dams within the Pamunkey River watershed have not been fully assessed but carry many implications for hydrology, geomorphology, fish passage, water quality, and ecology. Surface-water use throughout the entire State of Virginia has been quantified by permits from the Virginia Department of Environmental Quality since 2011. Future surface-water use is expected to increase, although future availability of these resources is less certain. Potential impacts because of increased use have not been fully investigated.
Surface-Water Quality
-
1. Bacterial impairment is pervasive throughout the Pamunkey River watershed in streams, rivers, and lakes, and impairment is becoming more pervasive over time (Virginia Department of Environmental Quality, 2014; Virginia Department of Environmental Quality, 2022c). Other watershed impairments include: (1) harmful algal blooms, (2) dissolved oxygen, (3) pH, (4) benthic macroinvertebrates, (5) Benzo[a]pyrene, Benzo[b]fluoranthene, and Benzo[k]fluoranthene, (6) cadmium, zinc, copper, mercury in fish tissue, (7) polychlorinated biphenyl in fish tissue, and (8) polychlorinated biphenyl in water (Virginia Department of Environmental Quality, 2022c).
-
2. Since 1985, no trends in total nitrogen have been found in the tidal or non-tidal Pamunkey River or much of the York River (Mason and others, 2021; Murphy and others, 2022). The total nitrogen load exported out of the York River (from the York, Pamunkey and Mattaponi river watersheds) and into Chesapeake Bay was approximately 200 million pounds from 1985 through 2018, which is lower than most rivers and streams that drain into the Chesapeake Bay. This value represents an overall decline of approximately 21,000 pounds per year over this period, which was a small amount that was not statistically significant. About 65 percent of the total nitrogen load was estimated to have originated from contributions of the tidal parts of the York River watershed (Chesapeake Bay Program Integrated Trends Analysis Team, 2021). The small total nitrogen reduction over time is associated with substantial reductions of nitrogen inputs from wastewater treatment facilities (Lyerly and others, 2014) and atmospheric deposition (U.S. Environmental Protection Agency, 2017a). Many best management practices (BMPs) have been implemented throughout the York, Pamunkey, and Mattaponi river watersheds; however, the expected total nitrogen load reductions from these management activities have not been observed (Chesapeake Bay Program Integrated Trends Analysis Team, 2021). A comprehensive understanding of nitrogen cycling, effectiveness of BMPs, fate and transport, effects of anthropogenic changes, climate change effects, and exported total nitrogen loads over time could provide evidence to better understand nitrogen cycling and effects of management practices. As efforts to reduce total nitrogen loads to meet total maximum daily loads (TMDL) continue, continued monitoring and modeling of nitrogen will be imperative to improve understanding of nitrogen cycling, transport, fate, and load delivery, as will reconciling differences between monitored data and model estimations. Accurately quantifying nitrogen sources being delivered and exported and evaluating if TMDL benchmarks are truly met could reveal where best management practices have been effective or not and aid regulators and managers in prioritizing efforts aimed at reducing nitrogen export.
-
3. The non-tidal Pamunkey River watershed had a long-term increasing (degrading) trend in total phosphorus, but the tidal Pamunkey River had no long-term trends. Downstream reaches of the York River, however, showed significant degrading long-term trends in total phosphorus (Mason and others, 2021; Murphy and others, 2022). The total amount of phosphorus exported to the Chesapeake Bay from the York River over the past 33 years (1985 through 2018) was about 15 million pounds, which was an average amount when compared with other rivers and streams that drain into the Chesapeake Bay. The non-tidal and tidal parts of the York River watershed contributed about an equal part of the total phosphorus load exported into the Chesapeake Bay. This total load declined by about 880 pounds per year over the same period (Chesapeake Bay Program Integrated Trends Analysis Team, 2021). The overall reduction of the total was largely driven by phosphorus reductions from point sources in the tidal part of the York River watershed (Chesapeake Bay Program Integrated Trends Analysis Team, 2021). Lyerly and others (2014) have attributed some of these reductions in phosphorus to upgrades of wastewater treatment facilities and the phosphorus detergent ban in 1987. Because phosphorus binds to soil particles, the fate of phosphorus delivery to streams is inextricably linked to sediment delivery; most phosphorus delivered to the Chesapeake Bay is attached to sediment (Zhang and others, 2015). Furthermore, manure and fertilizer applications, especially in the non-tidal York River watershed, have exceeded crop needs (Chesapeake Bay Program Integrated Trends Analysis Team, 2021). Soils have a finite capacity to store phosphorus, after which excess phosphorus is transported via shallow soils and groundwater (Staver and Brinsfield, 2001). Many BMPs have been implemented throughout the York, Pamunkey, and Mattaponi river watersheds from 1985 through 2019 (Chesapeake Bay Program Integrated Trends Analysis Team, 2021). Models that incorporate these BMPs predicted total phosphorus loads in 2019 and 2009 to be significantly lower than 1985 levels; however, the calculated loads during this period were higher than in 1985 (Chesapeake Bay Program Integrated Trends Analysis Team, 2021). This disagreement between the expected effects of BMPs and calculated loads remains unresolved. A complete understanding of phosphorus cycling, effectiveness of BMPs, fate and transport, predicted effects from changes in climatic conditions, and exported total phosphorus loads throughout the York River watershed could reveal the causes of these disagreements and potentially a way to rectify them. The affinity of phosphorus to bind with sediment makes understanding sediment dynamics crucial. Continued efforts to improve models, especially at the tributary scale, will help close the gap in our knowledge of phosphorus fate and transport and might provide insights into residence times, which will further aid BMP decision making. Continued monitoring and modelling of phosphorus will be important to improve understanding of phosphorus conditions, as will reconciling differences between monitored data and models. Evaluating sources of phosphorus being delivered and exported will guide nutrient management strategies and help to evaluate if TMDL benchmarks are being met.
-
4. A long-term increasing (degrading) trend in suspended sediment was estimated for the non-tidal and tidal York, Pamunkey, and Mattaponi rivers (Mason and others, 2021; Murphy and others, 2022). Approximately 14 billion pounds of sediment have been exported from the York River watershed and into the Chesapeake Bay over the last 33 years (1985 through 2018), representing an average annual increase of about 1 million pounds per year over the same period (Chesapeake Bay Program Integrated Trends Analysis Team, 2021). About 75 percent of the suspended sediment delivered to the Chesapeake Bay came from contributions of the tidal York River watershed. Shorelines, streambeds, and stream banks were the primary sources of suspended sediment from 1985 through 2018, despite estimated decreases over this period by 1 percent for shorelines and 24 percent for streambeds and stream banks (Chesapeake Bay Program Integrated Trends Analysis Team, 2021). Sediment delivery from agricultural areas was also estimated to have decreased by approximately 53 percent. The overall increase in suspended-sediment loads was estimated to be driven primarily by increases in developed areas, which increased by 43 percent from 1985 through 2018 (Chesapeake Bay Program Integrated Trends Analysis Team, 2021). Soil erosion in upland areas, streambank erosion, and tributary loading are variable throughout the York River watershed, but suspended-sediment concentrations are usually higher in the Piedmont physiographic province, upstream from the Fall Zone (Brakebill and others, 2010). The naturally erosive conditions in this area are exacerbated by agricultural, urban, and other developed land uses (Gellis and others, 2005; Brakebill and others, 2010). A novel approach from Noe and others (2022) asserts a mass balance for sediment flux throughout the Chesapeake Bay watershed. Results from this study suggest the non-tidal Pamunkey River watershed had a net loss of sediment, that is, more suspended sediment was mobilized and transported downstream than trapped and stored in floodplains. A complete understanding of suspended-sediment fate and transport, residence times, effectiveness of BMPs, and predicted effects from changes in climatic conditions throughout the York River watershed could reveal insights to better understand and quantify these processes Recent efforts to understand the sediment and nutrient dynamics of streambank and floodplain geomorphic changes and watershed material budgets in the Chesapeake Bay watershed has provided a conceptual framework to begin to understand and estimate the amount of sediment and nutrients that are transported and stored and the resulting flux of these materials (Noe and others, 2022). Like nitrogen and phosphorus, reductions in suspended-sediment delivered to the Chesapeake Bay are intended to meet TMDL benchmarks. Continued efforts to monitor suspended sediment and improve model estimations are needed to close the gaps in knowledge regarding suspended-sediment conditions over time throughout the York River watershed. Reconciling the differences between expected reductions in suspended-sediment loads from BMP implementations and observed long-term increases would provide insights into geomorphic processes and BMP effectiveness. Accurately estimating sediment loads going to the Chesapeake Bay and trapping over time for the entire York River watershed would make understanding whether TMDL benchmarks are being met easier.
-
5. Rising levels of salinity in the freshwater habitats of Pamunkey River watershed, potentially due in part to sea-level rise, is a concern. Drought, storm surge, surface-water withdrawal, and dams can all also contribute to periodic salinity pulses in tidal freshwater habitats. Upstream movement of the salt front is predicted to become more chronic and pervasive with increased sea-level rise, which is observed currently and predicted to continue in the future. Tidal forested wetlands are transitioning to oligohaline marshes because of increased salinity (Noe and others, 2021).
-
6. Dissolved oxygen conditions throughout the York River degraded from 2019 through 2021 resulting in the most violations of U.S. Environmental Protection Agency dissolved oxygen criterion since 1985 (Zhang and others, 2018).
-
7. Secchi disk depth measurements over time (since 1985) indicate water clarity has degraded in the tidal freshwater Pamunkey and Mattaponi rivers and in the mesohaline and polyhaline parts of the York River. Areas near the confluence of the Pamunkey and Mattaponi rivers, however, have been improving or exhibiting no trend. Since 2012, possible degrading trends in Secchi disk depth were found in the mesohaline York River and a significant improving trend in the tidal freshwater Mattaponi River. No trends in Secchi disk depth since 2012 were found in the polyhaline York River, the tidal freshwater Pamunkey river, or the upstream part of the tidal freshwater area of the Mattaponi River. Pamunkey Tribal Elders have noted degrading water clarity conditions over time, especially in the past 15 to 20 years, throughout the Pamunkey and York rivers. Further investigation into the causes of degrading water clarity in the tidal Pamunkey River could reveal information about how to approach methods of improvement.
-
8. Water temperature has significantly increased throughout the York, Pamunkey, and Mattaponi rivers since 1985. These warming temperatures align with climate model predictions and are expected to continue in the future.
Groundwater
-
1. Groundwater levels in the Potomac aquifer, in and around the York River watershed, have generally been decreasing for at least the past 50 years because of large amounts of groundwater withdrawals throughout the Coastal Plain. The rates of groundwater-level decreases were greatest near major withdrawal centers. Some groundwater-level recovery has been observed after substantial reductions in total groundwater withdrawals since 2010.
-
2. Groundwater withdrawals within the Pamunkey River watershed in 2021 ranged from 16.79 to 0.27 million gallons per day (Virginia Department of Environmental Quality, 2022b; table 3). Total withdrawals from King William County were the largest of all counties in the Pamunkey River watershed. Most of the groundwater withdrawn in King William County comes from the WestRock Company’s Paper Mill, approximately 10 miles east of the Pamunkey Indian Reservation, which pumps millions of gallons per day from the Potomac aquifer. Large pumping operations cause groundwater to flow radially inward and downward towards these large pumping epicenters.
-
3. Demand for groundwater resources throughout the York River watershed is estimated to increase by 50 percent from 2010 to 2040 (Virginia Department of Environmental Quality, 2015), which could potentially further threaten the availability and use of groundwater resources in this area. The large current groundwater demand in the York River watershed and projected increases underscores the importance of monitoring these resources so that they might be managed equitably. Mitigating the consequences of these large withdrawals requires that the health and preservation of these resources are prioritized in the future.
-
4. Saltwater intrusion in Virginia aquifers has been minimal when compared to other States along the North Atlantic Coastal Plain; however, intrusion in Virginia could simply have a delayed response, and future monitoring could indicate if a response is detected.
-
5. Withdrawal of groundwater can cause aquifer compaction, which is one of the primary drivers of subsidence in the southern Chesapeake Bay region.
-
6. Groundwater models such as the ones in Heywood and Pope (2009) and Masterson and others (2016a) are excellent tools to model regional groundwater levels in the southern Chesapeake Bay region. These models have the capability of predicting changes in groundwater levels based on groundwater pumping and predicting groundwater levels in the future.
-
7. The groundwater dynamics underneath the Pamunkey Indian Reservation are complex and influenced by many factors. The primary influences for deep, confined, regional aquifers like the Potomac aquifer come from large pumping centers throughout the Coastal Plain (McFarland, 2010). Groundwater availability underneath the Pamunkey Indian Reservation lands is largely affected by pumping groundwater from outside the reservation. Continued groundwater monitoring at current groundwater monitoring wells throughout the Chesapeake Bay and in and around the York and Pamunkey river watersheds is necessary to provide the data for the Tribe, scientists, and regulators to evaluate the availability of groundwater resources over time, recognize patterns in groundwater levels, observe periods of potential drought, and provide information about how groundwater withdrawals throughout the region are affecting the Pamunkey Indian Tribe at the local scale.
Land Subsidence and Sea-Level Rise
-
1. One of the most immediate concerns in the Pamunkey River watershed and for the Pamunkey Indian Tribe and Reservation is relative sea-level rise (RSLR), that is the combination of land subsidence and sea-level rise.
-
2. Rates of subsidence in the southern Chesapeake Bay region are among the highest on the Atlantic seaboard. West Point, Virginia, is a subsidence epicenter, having calculated rates of subsidence of about −3.2 millimeters per year. (Eggleston and Pope, 2013; Milligan and others, 2019). Subsidence in this region is primarily because of groundwater extraction and subsequent compaction of sediment in aquifers; subsidence is less influenced by glacial isostatic adjustment.
-
3. Land subsidence can lead to greater nuisance flooding and extreme flooding associated with storm surges (Karegar and others, 2017).
-
4. The U.S. Geological Survey and partner agencies are currently measuring vertical land motion and subsidence in many ways, including with global positioning system benchmarks and extensometers throughout Virginia and a new extensometer to measure aquifer-system compaction in West Point, Virginia (U.S. Geological Survey, 2022b). In concert with these land motion monitoring activities, continued monitoring of the network of groundwater monitoring wells throughout the York River watershed and throughout Virginia and neighboring States will provide the data necessary for scientists to analyze and interpret future changes in RSLR.
-
5. Some of the highest rates of sea-level rise in the United States are in the Chesapeake Bay region, where they are twice the yearly average global rate (Sweet and others, 2022; Eggleston and Pope, 2013). With 3 feet of net sea-level rise estimated by 2100 (Riggs and others, 2011; Pilkey and Pilkey, 2019; Sweet and others, 2022), coupled with low-topographic relief on the Pamunkey Indian Reservation, sea-level rise to this extent would mean large-scale loss of land and damages or loss of homes, infrastructure, and normal business operations for Tribal members, in particular.
-
6. Higher sea levels amplify the impacts of flooding, storm surges, high tides, wetland loss, and coastal erosion (Sweet and others, 2022; Eggleston and Pope, 2013). Sea-level rise impacts are even greater when combined with land subsidence effects.
-
7. Continued monitoring of water levels by the National Oceanographic and Atmospheric Administration tide gages are essential to tracking, warning, and mitigating the impacts of RSLR. At the watershed scale, additional efforts to track biological indicators of RSLR, including monitoring plant and animal species abundance, diversity, and distribution could provide evidence of the extent and magnitude of potential RSLR.
-
8. RSLR’s predicted impacts on the Pamunkey Indian Tribe and Reservation are many and are estimated to have profound effects on the Tribe’s ability to continue to inhabit the current reservation lands. Before the predicted submergence of the Pamunkey Indian Reservation, RSLR might cause enough disruptions in the Pamunkey Indian Tribe’s day-to-day lives and normal business operations that relocation could be the only option. The Pamunkey Tribal Elders indicate RSLR has already impacted their Reservation; notable increases in the amount of land that has become submerged or permanently inundated, shoreline erosion, and increases in flood frequency and magnitude have all been observed. Closely monitoring RSLR could support the health, safety, and preservation of the Pamunkey Indian Tribe and Reservation.
River Ecology
-
1. The York River watershed supports a diverse range of habitats, including upland forest, riparian forest, submerged aquatic vegetation and mudflat, and wetland, ranging from tidal freshwater forest to salt marsh along the estuarine salinity gradient (Newson and Sear, 2001; Klapproth and Johnson, 2009).
-
2. The York River watershed provides critical habitat to a multitude of ecologically and economically important species, many of which are sensitive to environmental alteration and degradation.
-
3. Environmental and anthropogenic drivers at the watershed scale control the quality and suitability of riverine and riparian habitat for biota in the Pamunkey River watershed and directly impact the water resources available on the Pamunkey Indian Reservation and the livelihoods of those living there.
-
4. Changes in land use, sea-level rise, high rates of subsidence, and climate disruption will all play a role in dictating habitat availability and suitability in the future.
-
5. The freshwater-oligohaline threshold is currently at Sweet Hall Marsh, an area that was considered tidal freshwater as recently as 1997 (Perry and Atkinson, 1997) and where salt-tolerant macrophyte species are becoming more dominant than freshwater species (Wu and others, 2015).
-
6. Biological invasions pose a substantial risk to the ecological health, function, and integrity of the riparian, wetland, and aquatic resources found throughout the Pamunkey River watershed (Newson and Sear, 2001).
-
7. Over the next few years, the impacts of the Agrilus planipennis (Fairmaire, 1888) (emerald ash borer) to Fraxinus (ash) dominated forested habitats along the Pamunkey River could be devastating (Jacobsen, 2020).
-
8. Habitat availability and suitability in the Pamunkey River watershed will continue to be impacted by human development, sea-level rise, subsidence, invasive species, and climate disruption (Eggleston and Pope, 2013; Mitchell and others, 2017).
-
9. Although considerable geospatial data pertaining to current habitat type and extent in the watershed is available, predicting how habitat will change given many externalities is difficult. Future efforts to improve understanding and incorporate externalities could provide regulators and managers information on how different habitats could be affected based on how resources are managed.
-
10. Salinity beyond the tolerances of native dominant plant communities in tidal wetlands will result in different wetland type or loss of wetland habitat completely (Goodwin and others, 2001; Ensign and others, 2014).
-
11. Complex interactions among many environmental drivers dictate the ability of tidal wetlands to keep pace with rising water levels, which makes predicting the spatial extent of potential wetland loss because of sea-level rise difficult (Neubauer, 2011; Ensign and others, 2014; Mitchell and others, 2017). Additionally, little work in the Pamunkey River watershed has been done to model potential avenues of wetland retreat based on elevation change rates, adjacent land slope, and natural and manmade barriers.
-
12. Although salinity gradient data exist for the Pamunkey and York rivers, Sweet Hall Marsh appears to be the current area along the salinity gradient where the freshwater macrophyte species are being outpaced by salt-tolerant species (Wu and others, 2015).
-
13. The rate at which salinity concentrations will move upstream is uncertain; therefore, the timeline and severity of impacts on habitat is currently unknown. When considering future habitat degradation, the effects of invasive species make any predictions more complicated.
-
14. Predicting the speed and severity of forest canopy thinning is challenging because of emerald ash borers prominence, invasive Phragmites homogenizing marsh habitat, Hydrilla outcompeting native submerged aquatic vegetation, and the riverine habitat being degraded by Ictalurus furcatus (Valenciennes in Cuvier and Valenciennes, 1840) (blue catfish) eating mollusk and submerged aquatic vegetation. Future efforts to better understand these ecological dynamics over time would provide a more complete ecosystem understanding of the water resources at the larger system and watershed scales.
-
15. There are significant data gaps pertaining to the stability of habitat in the Pamunkey River watershed, and continued monitoring of in-stream, riparian, and wetland habitats could help resource managers best prepare and manage for predicted habitat loss and degradation in the future.
-
16. The seasonality and predictability of anadromous migratory fish species, such as Alosa sapidissima (Wilson, 1811) (American shad), Alosa aestivalis (Mitchill, 1814) (blueback herring), Alosa pseudoharengus (Wilson, 1811) (alewife), Morone saxatilis (Walbaum, 1792) (striped bass), and Acipenser oxyrinchus (Mitchill, 1815) (Atlantic sturgeon), coupled with the semi-migratory Morone americana (Gmelin, 1789) (white perch) and Perca flavescens (Mitchill, 1814) (yellow perch), made these species economically important and significant to historical and contemporary Pamunkey Indian Tribal culture.
-
17. Overharvesting, habitat degradation, degrading water quality, and the construction of hundreds of low-head dams have decimated populations of native migratory fishes over the past few centuries (Jenkins and Burkhead, 1994).
-
18. Nearly one-third of all fish species in the Pamunkey River watershed are introduced non-native species. Some of these introduced species, such as blue catfish and Pylodictis olivaris (Rafinesque, 1818) (flathead catfish), are large, long lived, predatory, and able to tolerate a broad range of environmental conditions. These fish have become widely established and numerically dominant in the Pamunkey River.
-
19. The burgeoning populations of invasive blue catfish, flathead catfish, and Channa argus (Cantor, 1842) (northern snakeheads) could have deleterious impacts on native shad and sturgeon restoration efforts in the York and Pamunkey River watersheds.
-
20. Substantial recovery efforts in Virginia and elsewhere, including harvest moratoria on river herrings, hatchery propagation of American shad, and listing Atlantic sturgeon under the Endangered Species Act (16 U.S.C. 1531-1544), have resulted in little evidence of restoration success. Consequently, the culturally significant and economically valuable fisheries once supported by these species are no longer an important feature of tribal life (Jenkins and Burkhead, 1994).
-
21. The ecological effects of abundant, non-indigenous predators on native resident and migratory Pamunkey River fishes are potentially significant, especially when coupled with other anthropogenic perturbations occurring in the Pamunkey River and its watershed.
-
22. Quantifying fish abundance and diversity and evaluating how these communities are changing over time throughout the entire watershed would provide insights on ecological health and condition at the watershed scale. With the introduction and emergence of non-native fish species, the composition of fishes has changed drastically. Investigations are also needed to identify why restoration efforts of native fishes, such as harvesting moratoria, hatchery propagation, and listing species under the Endangered Species Act, have not been successful. Development of a practical and science-based fisheries management plan to maximize ecosystem function and services could reveal a clear path towards an improved fishery.
-
23. Freshwater mussels (Unionidae [Rafinesque, 1820]) provide many benefits to the ecosystem. Because of their environmental sensitivity, mussels have been shown to be reliable indicators of environmental health within aquatic ecosystems (Simmions and Reed, 1973; Lees, 2005).
-
24. Since the 1970s, freshwater mussel biodiversity has decreased by 60 percent in the Pamunkey River watershed (Lees, 2005).
-
25. The freshwater mussel species currently found in the Pamunkey River are threatened by habitat loss, pollution, salinity intrusion, and introduced predators (Brian Watson, Virginia Department of Wildlife Resources, oral commun., 2022).
-
26. Because of their unique life histories, most freshwater mussels require a host fish species to progress through their life cycles. Conservation efforts for freshwater mussels will depend on successful management of native fish populations (Brian Watson, Virginia Department of Wildlife Resources, oral commun., 2022).
-
27. Freshwater mussels throughout the Pamunkey River watershed are not completely understood. Additional surveys throughout the watershed could enhance understanding of changes in abundance and diversity over time. Evaluation of thresholds in water and habitat quality for the freshwater mussels that include host fish species could further enhance understanding of mussels throughout the watershed.
References Cited
Atlantic States Marine Fisheries Commission, 1999, Amendment 1 to the interstate fishery management plan for shad and river herring: Washington, D.C, Atlantic States Marine Fisheries Commission Fisheries Management Report No. 35, accessed December 4, 2022, at https://www.nrc.gov/docs/ML0701/ML070170114.pdf.
Ator, S.W., Schwarz, G.E., Sekellick, A.J., and Bhatt, G., 2022, Predicting near-term effects of climate change on nitrogen transport to Chesapeake Bay: Journal of the American Water Resources Association, v. 58, no. 4, p. 578–596, accessed December 1, 2022, at https://doi.org/10.1111/1752-1688.13017.
Ator, S.W., Blomquist, J.D., Webber, J.S., and Chanat, J.G., 2020, Factors driving nutrient trends in streams of the Chesapeake Bay watershed: Journal of Environmental Quality, v. 49, no. 4, p. 812–834, accessed December 1, 2022, at https://doi.org/10.1002/jeq2.20101.
Ator, S.W., 2019, SPARROW model inputs and simulated streamflow, nutrient and suspended sediment loads in streams of the Northeast Region of the United States, 2012 base year: U.S. Geological Survey data release, accessed November 4, 2022, at https://doi.org/10.5066/P9NKNVQO.
Ator, S.W., and Denver, J.M., 2012, Estimating contributions of nitrate and herbicides from groundwater to headwater streams, Northern Atlantic Coastal Plain, United States: Journal of the American Water Resources Association, v. 48, no. 6, p. 1075–1090, accessed October 4, 2022, at https://doi.org/10.1111/j.1752-1688.2012.00672.x.
Ator, S.W., Brakebill, J.W., and Blomquist, J.D., 2011, Sources, fate, and transport of nitrogen and phosphorus in the Chesapeake Bay watershed—An empirical model: U.S. Geological Survey Scientific Investigations Report 2011–5167, 27 p., accessed November 21, 2022, at https://pubs.usgs.gov/sir/2011/5167/.
Ator, S.W., Denver, J.M., Krantz, D.E., Newell, W.L., and Martucci, S.K., 2005., A surficial hydrogeologic framework for the Mid-Atlantic Coastal Plain: U.S. Geological Survey Professional Paper 1680, https://pubs.usgs.gov/pp/2005/pp1680/.
Berrier, D.J., Neubauer, S.C., and Franklin, R.B., 2022, Cooperative microbial interactions mediate community biogeochemical responses to saltwater intrusion in wetland soils: FEMS Microbiology Ecology, v. 98, no. 3, accessed November 4, 2022, at https://doi.org/10.1093/femsec/fiac019.
Bindoff, N.L., Willebrand, J., and Artale, V., Cazenave, A, Gregory, J.M., Gulev, S., Hanawa, K., Quéré, C. Le, Levitus, S., Nojiri, Y., Shum, C.K., Talley, L.D. and Unnikrishnan, A.S., 2007, Observations—Oceanic climate change and sea level, in Solomon, S.D., Qin, M., Manning, Z., Chen, M., Marquis, K.B., Averyt, M. Tignor, and Miller, H.L. eds., Climate change 2007—The physical science basis—Contribution of working group I to the Fourth Assessment Report of the Intergovernmental Panel on climate change: New York, N.Y., Cambridge University Press, accessed December 1, 2022, at https://www.ipcc.ch/site/assets/uploads/2018/02/ar4-wg1-chapter5-1.pdf.
Brakebill, J.W., Ator, S.W., and Sekellick, A.J., 2019, Input and predictions from a suspended-sediment SPARROW model CBSS_V2 in the Chesapeake Bay watershed: US Geological Survey data release, accessed November 4, 2022, at https://www.sciencebase.gov/catalog/item/5bb4bba1e4b08583a5d903f6.
Brakebill, J.W., Ator, S.W., and Schwarz, G.E., 2010, Sources of suspended-sediment flux in streams of the Chesapeake Bay watershed—A regional application of the SPARROW Model: Journal of the American Water Resources Association, v. 46, no. 4, p. 757–776, accessed November 4, 2022, at https://onlinelibrary.wiley.com/doi/10.1111/j.1752-1688.2010.00450.x.
Browne, C.L., and Hecnar, S.J., 2007, Species loss and shifting population structure of freshwater turtles despite habitat protection: Biological Conservation, v. 138, no. 3–4, p. 421–429, accessed November 4, 2022, at https://doi.org/10.1016/j.biocon.2007.05.008.
Brundle, N., 2023, Understanding the Pamunkey River—A review of water science, management, and Traditional Ecological Knowledge: Virginia Commonwealth University and U.S. Geological Survey geonarrative, accessed December 1, 2023, at https://storymaps.arcgis.com/stories/6ec5ed77b2ee4f899a4fde7a5fa0b3af.
Buchanan, M.K., Kulp, S.K., and Strauss, B., 2022, Resilience of U.S. coastal wetlands to accelerating sea level rise: Environmental Research Communications, v. 4, no. 6, p. 061001, accessed October 4, 2022, at https://doi.org/10.1088/2515-7620/ac6eef.
Bureau of Indian Affairs, 2015, Petition #323—Pamunkey Indian Tribe, Virginia—Final determination for Federal acknowledgement of the Pamunkey Indian Tribe: Federal Register vol. 80, no. 130., accessed December 2, 2023, at https://www.bia.gov/as-ia/ofa/323-pamunk-va.
Chanat, J.G., and Yang, G., 2018, Exploring drivers of regional water-quality change using differential spatially referenced regression—A pilot study in the Chesapeake Bay watershed: Water Resources Research, v. 54, no. 10, p. 8120–8145, accessed November 4, 2022, at https://doi.org/10.1029/2017WR022403.
Chesapeake Bay National Estuarine Research Reserve, 2022, CBNERR-VA monitoring: Virginia Institute of Marine Science web page, accessed July 15, 2022, at https://www.vims.edu/cbnerr/monitoring/index.php.
Chesapeake Bay Program, 2020, Chesapeake assessment and scenario tool—Version 2019: Chesapeake Bay Program Office web page, accessed October 4, 2022, at https://cast.chesapeakebay.net/.
Chesapeake Bay Program, 2022, Dissolved oxygen—Learn how much oxygen the Bay’s living creatures need to survive, and what happens when low-oxygen areas form: Chesapeake Bay Program Office web page, accessed December 1, 2022, at https://www.chesapeakebay.net/discover/ecosystem/dissolved-oxygen.
Chesapeake Bay Program Integrated Trends Analysis Team, 2021, York Tributary summary—A summary of trends in tidal water quality and associated factors 1985-2018: Chesapeake Bay Program Partnership, accessed October 4, 2022, at https://cast-content.chesapeakebay.net/documents/TribSummaries_YorkTributaryTrendsSummary2021-06-07.pdf.
Chislock, M.F., Doster, E., Zitomer, R.A., and Wilson, A.E., 2013, Eutrophication—Causes, consequences, and controls in aquatic ecosystems: Nature Education Knowledge, v. 4, no. 4, p. 10., accessed November 28, 2022, at https://www.wilsonlab.com/publications/2013_NE_Chislock_et_al.pdf.
D’Anglada, L., Gould, C., Thur, S., Lape, J., Backer, L., Bricker, S., Clyde, T., Davis, T., Dortch, Q., Duriancik, L., Emery, E., Evans, M.A., Fogarty, L., Friona, T., Garrison, D., Graham, J., Handy, S., Johnson, M.-V., Lee, D., Lewitus, A., Litaker, W., Loeffler, C., Lorenzoni, L., Malloy, E.H., Makuch, J., Martinez, E., Meckley, T., Melnick, R., Myers, D., Ramsdell, J., Rohring, E., Rothlisberger, J., Ruberg, S., and Ziegler, T., 2018, Harmful algal blooms and hypoxia in the United States—A report on interagency progress and implementation: Washington, D.C., National Oceanic and Atmospheric Administration, accessed, May, 11, 2022, at https://cdn.coastalscience.noaa.gov/page-attachments/research/FINAL_USEC%20signed%20-%20Progress%20and%20Implementation%20Report_HABHRCA.pdf.
Dalu, T., Wasserman, R.J., Magoro, M.L., Froneman, P.W., and Weyl, O.L.F., 2019, River nutrient water and sediment measurements inform on nutrient retention, with implications for eutrophication: Science of The Total Environment, v. 684, p. 296–302, accessed November 4, 2022, at https://www.sciencedirect.com/science/article/abs/pii/S004896971932193X?via%3Dihub.
Dodds, W., and Smith, V., 2016, Nitrogen, phosphorus, and eutrophication in streams: Inland Waters, v. 6, no. 2, p. 155–164, accessed October 4, 2022, at https://doi.org/10.5268/IW-6.2.909.
Dominion Energy, 2023, Dominion 2022 water withdrawal monitoring report: Dominion Energy web page, accessed February 27, 2023, at https://www.dominionenergy.com/projects-and-facilities/nuclear-facilities/north-anna-power-station.
Dominion Energy, 2022, Waste heat treatment facility: Dominion Energy web page, accessed December 1, 2022, at https://www.dominionenergy.com/projects-and-facilities/nuclear-facilities/north-anna-power-station/waste-heat-treatment-facility.
Duberstein, J.A., Krauss, K.W., Conner, W.H., Bridges, W.C., Jr., and Shelburne, V.B., 2013, Do hummocks provide a physiological advantage to even the most flood tolerant of tidal freshwater trees?: Wetlands, v. 33, no. 3, p. 399–408, accessed September 5, 2022, at https://doi.org/10.1007/s13157-013-0397-x.
Egghart, C., 2009, A study in environmental change, human land use and its effects along the Lower James River: Richmond, Va., Virginia Commonwealth University, master’s thesis, 140 p., accessed September 6, 2022, at https://doi.org/10.25772/HWN3-WW94.
Eggleston, J., and Pope, J., 2013, Land subsidence and relative sea-level rise in the southern Chesapeake Bay region: U.S. Geological Survey Circular 1392, 30 p., accessed November 4, 2022, at https://doi.org/10.3133/cir1392.
Ensign, S.H., Hupp, C.R., Noe, G.B., Krauss, K.W., and Stagg, C.L., 2014, Sediment accretion in tidal freshwater forests and oligohaline marshes of the Waccamaw and Savannah Rivers, USA: Estuaries and Coasts, v. 37, no. 5, p. 1107–1119, accessed December 1, 2022, at https://doi.org/10.1007/s12237-013-9744-7.
Federal Emergency Management Agency, 2022, Hazus flood technical manual–Hazus 5.1: Federal Emergency Management Agency technical manual, accessed May 17, 2022, at https://www.fema.gov/sites/default/files/documents/fema_hazus-flood-model-technical-manual-5-1.pdf.
Ezer, T., and Atkinson, L.P., 2015, Sea level rise in Virginia—Causes, effects and response: Virginia Journal of Science, v. 66, no. 3, 15 p., accessed December 1, 2022, at https://digitalcommons.odu.edu/vjs/vol66/iss3/8.
Federal Emergency Management Agency, 2021, Flood risk report—Pamunkey watershed 02080106: Report Number 01, 109 p., accessed April 7, 2022, at https://msc.fema.gov/portal/advanceSearch#searchresultsanchor using FEMA Flood Map Service Center search criteria—Virginia; King William County; and King William County All Jurisdictions.
Fox-Kemper, B., Hewitt, H.T., Xiao, C., Aðalgeirsdóttir, G., Drijfhout, S.S., Edwards, T.L., Golledge, N.R., Hemer, M., Kopp, R.E., Krinner, G., Mix, A., Notz, D., Nowicki, S., Nurhati, I.S., Ruiz, L., Sallée, J.B., Slangen, A.B.A., and Yu, Y., 2021, Ocean, cryosphere and sea level change, in Climate change 2021—The physical science basis: Cambridge, United Kingdom, Cambridge University Press, p. 1211–1362, accessed May 15, 2022, at https://www.ipcc.ch/report/ar6/wg1/downloads/report/IPCC_AR6_WGI_FullReport.pdf.
Galloway, D.L., and Burbey, T.J., 2011, Review—Regional land subsidence accompanying groundwater extraction: Hydrogeology Journal, v. 19, no. 8, p. 1459–1486, accessed October 4, 2022, at https://doi.org/10.1007/s10040-011-0775-5.
Gellis, A.C., Myers, M.K., Noe, G.B., Hupp, C.R., Schenk, E.R., and Myers, L., 2017, Storms, channel changes, and a sediment budget for an urban-suburban stream, Difficult Run, Virginia, USA: Geomorphology, v. 278, p. 128–148, accessed November 4, 2022, at https://doi.org/10.1016/j.geomorph.2016.10.031.
Gellis, A.C., Banks, W.S.L., Langland, M.J., and Martucci, S. K., 2005, Summary of suspended-sediment data for streams draining the Chesapeake Bay Watershed, water years 1952–2002: Reston, Va., US Geological Survey Scientific Investigations Report 2004-5056, 59 p., accessed November 4, 2022, at https://doi.org/10.3133/sir20045056.
Gilmer, A.K., and Berquist, C.R., Jr., 2015, Geologic map of the Tunstall quadrangle, Virginia: Virginia Division of Geology and Mineral Resources Publication 182, scale 1:24,000, accessed May 15, 2022, at https://energy.virginia.gov/commerce/ProductDetails.aspx?productID=2986.
Goodwin, P., Mehta, A.J., and Zedler, J.B., 2001, Tidal wetland restoration—An introduction: Journal of Coastal Research, v. 27, p. 1–6, accessed June 15, 2022, at https://www.jstor.org/stable/25736161.
Greene, E.A., LaMotte, A.E., and Cullinan, K.A., 2005, Ground-water vulnerability to nitrate contamination at multiple thresholds in the Mid-Atlantic Region using spatial probability models: U.S. Geological Survey Scientific Investigations Report 2004-5118, 24 p., accessed July 17, 2022, at https://doi.org/10.3133/sir20045118.
Hall, J.A., Weaver, C.P., Obeysekera, J., Crowell, M., Horton, R.M., Kopp, R.E., Marburger, J., Marcy, D.C., Parris, A., Sweet, W.V., Veatch, W.C., and White, K.D., 2019, Rising sea levels—Helping decision-makers confront the inevitable: Coastal Management, v. 47, no. 2, p. 127–150, accessed November 4, 2022, at https://www.tandfonline.com/doi/abs/10.1080/08920753.2019.1551012.
Henderson, R., 2021, Water clarity at the river-estuary transition zone—A comparative study of the James, Mattaponi, and Pamunkey sub-estuaries: Richmond, Va., Virginia Commonwealth University, master’s thesis, 37 p., accessed August 31, 2022, at https://doi.org/10.25772/BN0C-7K23.
Hershner, C., Mitchell, M., Bilkovic, D.M., Herman, J.D., and Center for Coastal Resources Management, Virginia Institute of Marine Science, 2009, York River water budget: Virginia Institute of Marine Science, William and Mary, accessed May 2, 2022, at https://doi.org/10.21220/V56S39.
Hewitt, A., Ellis, J., and Fabrizio, M.C., 2009, Fisheries of the York River system, in Moore, K.A., and Reay, W.G., eds., A site profile of the Chesapeake Bay National Estuarine Research Reserve in Virginia: Gloucester Point, Va.,Virginia Institute of Marine Science Special Scientific Report No. 149, p. 95–106, accessed July 15, 2022, at https://coast.noaa.gov/data/docs/nerrs/Reserves_CBV_SiteProfile.pdf.
Heywood, C.E., and Pope, J.P., 2009, Simulation of groundwater flow in the Coastal Plain aquifer system of Virginia: U.S. Geological Survey Scientific Investigations Report 2009–5039, 115 p., accessed November 4, 2022, at https://pubs.usgs.gov/sir/2009/5039/.
Hilling, C.D., Jiao, Y., Bunch, A.J., Greenlee, R.S., Schmitt, J.D., Orth, D.J., 2021, Growth dynamics of invasive blue catfish in four subestuaries of the Chesapeake Bay, USA: North American Journal of Fisheries Management, v. 41, no. S1, p. 167–179, accessed December 1, 2023, at https://doi.org/10.1002/nafm.10506.
Holdahl, S.R., and Morrison, N.L., 1974, Regional investigations of vertical crustal movements in the U.S., using precise relevelings and mareograph data: Tectonophysics, v. 23, no. 4, p. 373–390, accessed November 4, 2022, at https://doi.org/10.1016/0040-1951(74)90073-0.
Hyer, K.E., Denver, J.M., Langland, M.J., Webber, J.S., Böhlke, J.K., Hively, W.D., and Clune, J.W., 2016, Spatial and temporal variation of stream chemistry associated with contrasting geology and land-use patterns in the Chesapeake Bay watershed—Summary of results from Smith Creek, Virginia; Upper Chester River, Maryland; Conewago Creek, Pennsylvania; and Difficult Run, Virginia, 2010–2013: U.S. Geological Survey Scientific Investigations Report 2016–5093, 211 p., accessed, November 4, 2022, at https://doi.org/10.3133/sir20165093.
Jacobsen, A., 2020, Emerald ash borer in the ash (Fraxinus spp.)-dominated tidal swamps of the Lower Patuxent River, Maryland: Northeastern Naturalist, v. 27, no. 4, p. 817–840, accessed August 31, 2022, at https://doi.org/10.1656/045.027.0419.
Jarvie, H.P., Sharpley, A.N., Spears, B., Buda, A.R., May, L., and Kleinman, P.J.A., 2013, Water quality remediation faces unprecedented challenges from “legacy phosphorus”: Environmental Science & Technology, v. 47, p. 8997–8998, accessed October 3, 2022, at https://doi.org/10.1021/es403160a.
Jones, J.W., 2015, Freshwater mussels of Virginia (Bivalvia: Unionidae)—An introduction to their life history, status and conservation: Virginia Journal of Science, v. 66, no. 3, p. 309–331, accessed December 1, 2023, at https://doi.org/10.25778/3baj-mq15.
Karegar, M.A., Dixon, T.H., Malservisi, R., Kusche, J., and Engelhart, S.E., 2017, Nuisance flooding and relative sea-level rise—The importance of present-day land motion: Scientific Reports, v. 7, no. 11197, accessed November 4, 2022, at https://www.nature.com/articles/s41598-017-11544-y.
Kirwan, M.L., Temmerman, S., Skeehan, E.E., Guntenspergen, G.R., and Fagherazzi, S., 2016a, Overestimation of marsh vulnerability to sea level rise: Nature Climate Change, v. 6, no. 3, p. 253–260, accessed September 1, 2022, at https://www.nature.com/articles/nclimate2909.
Kirwan, M.L., Walters, D.C., Reay, W.G., and Carr, J.A., 2016b, Sea level driven marsh expansion in a coupled model of marsh erosion and migration: Geophysical Research Letters, v. 43, no. 9, p. 4366–4373, accessed September 1, 2022, at https://doi.org/10.1002/2016GL068507.
Klapproth, J.C., and Johnson, J.E., 2009, Understanding the science behind riparian forest buffers—Effects on water quality: Virginia Cooperative Extension Publication 420-151, 20 p., accessed September 1, 2022, at http://hdl.handle.net/10919/48062.
Klauda, R.J., Fischer, S.A., Hall, L.W., Jr., and Sullivan, J.A., 1991, American shad and hickory shad, in Funderburk, S.L., Mihursky, J.A., Jordan, S.J., and Riley D. eds., Habitat requirements for Chesapeake Bay living resources (2nd ed.), accessed December 4, 2022, at https://books.google.com/books?id=gkUSAAAAYAAJ&printsec=frontcover&source=gbs_ge_summary_r&cad=0#v=onepage&q&f=false.
Kleinman, P., Sharpley, A., Buda, A., McDowell, R., and Allen, A., 2011, Soil controls of phosphorus in runoff—Management barriers and opportunities: Canadian Journal of Soil Science, v. 91, no. 3, p. 329–338, accessed November 4, 2022, at https://doi.org/10.4141/cjss09106.
Langland, M.J., Raffensperger, J.P., Moyer, D.L., Landwehr, J.M., and Schwarz, G.E., 2006, Changes in streamflow and water quality in selected nontidal basins in the Chesapeake Bay watershed, 1985–2004: U.S. Geological Survey Scientific Investigations Report 2006-5178, 75 p., 12 app. (on CD), accessed June 7, 2022, at https://pubs.usgs.gov/sir/2006/5178/.
Langland, M.J., and Cronin, T., eds., 2003, A summary report of sediment processes in Chesapeake Bay and watershed: U.S. Geological Survey Water-Resources Investigations Report 2003–4123, 109 p., accessed November 4, 2022, at https://pubs.er.usgs.gov/publication/wri034123.
Lees, W.R., 2005, An investigation of the changes of species richness and distribution of the unionidae (Bivalvia: Molusca) within the Pamunkey Watershed: Richmond, Va., University of Richmond, master’s thesis, Paper 662, 56 p., 1 app., accessed May 20, 2022, at https://scholarship.richmond.edu/cgi/viewcontent.cgi?article=1668&context=masters-theses.
Limburg, K.E., Waldman, J.R., 2009, Dramatic declines in North Atlantic diadromous fishes: BioScience, v. 59, no. 11., p. 955–965, accessed December 1, 2023, at https://doi.org/10.1525/bio.2009.59.11.7.
Lintern, A., McPhillips, L., Winfrey, B., Duncan, J., and Grady, C., 2020, Best management practices for diffuse nutrient pollution—Wicked problems across urban and agricultural watersheds: Environmental Science & Technology, v. 54, no. 15, p. 9159–9174, accessed November 4, 2022, at https://doi.org/10.1021/acs.est.9b07511.
Lipcius, R., Ralph, G.M., 2011, Evidence of source-sink dynamics in marine and estuarine species, in Liu J., Hull V., Morzillo A.T., Wiens J.A., eds., Sources, sinks and sustainability: Cambridge, United Kingdom, Cambridge University Press, Cambridge Studies in Landscape Ecology, p.361–381, accessed December 1, 2022, at https://doi.org/10.1017/CBO9780511842399.019.
Lizarraga, J.S., 1997, Estimation and analysis of nutrient and suspended-sediment loads at selected sites in the Potomac River Basin, 1993-95: U.S. Geological Survey Water Resources Investigation Report 97-4154, 23 p., accessed November 4, 2022, at https://pubs.usgs.gov/wri/1997/4154/report.pdf.
Loperfido, J.V., 2014, Surface water quality in streams and rivers—Scaling and climate change: Comprehensive Water Quality and Purification, Earth Systems and Environmental Sciences, p. 87–105., accessed November 4, 2022, at https://doi.org/10.1016/B978-0-12-382182-9.00064-5.
Lyerly, C.M., and Hernandez Cordero, A.L., Foreman, K.L., Phillips, S.W., Dennison, W.C., 2014, New insights—Science-based evidence of water quality improvements, challenges, and opportunities in the Chesapeake: Annapolis, Md., p. 47., accessed December 1, 2022, at https://ian.umces.edu/pdfs/ian_report_438.pdf.
Mason, C.A., Soroka, A.M., Moyer, D.L., and Blomquist, J.D., 2021, Nitrogen, phosphorus, and suspended-sediment loads and trends measured at the Chesapeake Bay River input monitoring stations—Water years 1985-2020: U.S. Geological Survey data release, accessed May 5, 2022, at https://doi.org/10.5066/P93PZGMM.
Masterson, J.P., Pope, J.P., Fienen, M.N., Monti, J., Jr., Nardi, M.R., and Finkelstein, J.S., 2016a, Documentation of a groundwater flow model developed to assess groundwater availability in the Northern Atlantic Coastal Plain aquifer system from Long Island, New York, to North Carolina (ver. 1.1, December 2016): U.S. Geological Survey Scientific Investigations Report 2016–5076, 70 p., accessed November 4, 2022, at https://doi.org/10.3133/sir20165076.
Masterson, J.P., Pope, J.P., Fienen, M.N., Monti, J., Jr., Nardi, M.R., and Finkelstein, J.S., 2016b, Assessment of groundwater availability in the Northern Atlantic Coastal Plain aquifer system from Long Island, New York, to North Carolina: U.S. Geological Survey Professional Paper 1829, 76 p., accessed November 4, 2022, at https://doi.org/10.3133/pp1829.
Masterson, J.P., Pope, J.P., Monti, J.J., Nardi, M.R., Finkelstein, J.S., and McCoy, K.J., 2015, Hydrogeology and hydrologic conditions of the Northern Atlantic Coastal Plain aquifer system from Long Island, New York, to North Carolina (ver. 1.1, September 2015): U.S. Geological Survey Scientific Investigations Report 2013-5133, 76 p., accessed August 19, 2022, at https://doi.org/10.3133/sir20135133.
McFarland, E.R., 2017, Hydrogeologic framework and hydrologic conditions of the Piney Point aquifer in Virginia: U.S. Geological Survey Scientific Investigations Report 2017–5041, 63 p., 2 pl., and 1 CD-ROM, accessed June 31, 2022, at https://doi.org/10.3133/sir20175041.
McFarland, E.R., 2015, A conceptual framework and monitoring strategy for movement of saltwater in the Coastal Plain aquifer system of Virginia: U.S. Geological Survey Scientific Investigations Report 2015–5117, 30 p., accessed June 31, 2022, at https://doi.org/10.3133/sir20155117.
McFarland, E.R., 2010, Groundwater-quality data and regional trends in the Virginia Coastal Plain, 1906–2007: U.S. Geological Survey Professional Paper 1772, 86 p., 14 pls., https://pubs.usgs.gov/pp/1772/.
McFarland, E.R., and Bruce, T.S., 2006, The Virginia Coastal Plain Hydrogeologic Framework: U.S. Geological Survey Professional Paper 1731, 118 p., 25 pls., accessed November 4, 2022, at https://pubs.water.usgs.gov/pp1731/.
Miller, A., Baker, M., Boomer, K., Merritts, D., Prestegaard, K., and Smith, S., 2019, Legacy sediment, riparian corridors, and total maximum daily loads: Edgewater, Md., Scientific and Technical Advisory Committee Publication 19–001, 64 p., accessed November 4, 2022, at https://www.chesapeake.org/pubs/399_Miller2019.pdf.
Milligan, D.A., Hardaway, C.S., Jr., and Wilcox, C.A., 2019, Pamunkey Indian Reservation shoreline management plan: Virginia Institute of Marine Science, College of William and Mary, accessed June 5, 2022, at https://doi.org/10.25773/fsaf-rz10.
Mitchell, M., Herman, J., Bilkovic, D.M., and Hershner, C., 2017, Marsh persistence under sea-level rise is controlled by multiple, geologically variable stressors: Ecosystem Health and Sustainability, v. 3, no. 10, p. 1–16, accessed June 5, 2022, https://doi.org/10.1080/20964129.2017.1396009.
Moore, K.A., Orth, R.J., and Wilcox, D.J., 2009, Assessment of the abundance of submersed aquatic vegetation (SAV) communities in the Chesapeake Bay and its use in SAV management, in Yang, X., eds., Remote Sensing and geospatial technologies for coastal ecosystem assessment and management: Berlin, Springer, Lecture Notes in Geoinformation and Cartography, accessed August 21, 2022, at https://doi.org/10.1007/978-3-540-88183-4_10.
Moretti-Langholtz, D., 2005, A study of Virginia Indians and Jamestown—The first century: National Park Service report, accessed December 1, 2023, at https://www.nps.gov/parkhistory/online_books/jame1/moretti-langholtz/index.htm.
Moyer, D.L., and Langland, M.J., 2020, Nitrogen, phosphorus, and suspended-sediment loads and trends measured at the Chesapeake Bay Nontidal Network stations—Water years 1985-2018 (ver. 2.0, May 2020): U.S. Geological Survey data release, accessed November 4, 2022, at https://doi.org/10.5066/P931M7FT.
Murphy, R.R., Keisman, J., Harcum, J., Karrh, R.R., Lane, M., Perry, E.S., Zhang, Q., 2022, Nutrient improvements in Chesapeake Bay—Direct effect of load reductions and implications for coastal management: Environmental Science & Technology, v. 56, p. 260–270, accessed December 1, 2022, at https://doi.org/10.1021/acs.est.1c05388.
National Oceanic and Atmospheric Administration, 2021, U.S. linear relative seal level trends and 95% confidence intervals: National Oceanic and Atmospheric Administration web page, accessed October 4, 2022, at https://tidesandcurrents.noaa.gov/sltrends/mslUSTrendsTable.html.
Najjar, R.G., Pyke, C.R., Adams, M.B., Breitburg, D., Hershner, C., Kemp, M., Howarth, R., Mulholland, M.R., Paolisso, M., Secor, D., Sellner, K., Wardrop, D., and Wood, R., 2010, Potential climate-change impacts on the Chesapeake Bay: Estuarine, Coastal and Shelf Science, v. 86, no. 1, p. 1–20, accessed November 4, 2022, at https://doi.org/10.1016/j.ecss.2009.09.026.
Najjar, R.G., Patterson, L., and Graham, S., 2009, Climate simulations of major estuarine watersheds in the Mid-Atlantic region of the United States: Climatic Change, v. 95, no. 1–2, p. 139–168, accessed November 4, 2022, at https://link.springer.com/article/10.1007/s10584-008-9521-y.
National Oceanic and Atmospheric Administration, 2022, NOAA tides and currents: Center for Operational Oceanographic Products and Services website, accessed December 31, 2022, at https://tidesandcurrents.noaa.gov.
Neubauer, S.C., 2011, Ecosystem responses of a tidal freshwater marsh experiencing saltwater intrusion and altered hydrology: Estuaries and Coasts, v. 36, no. 3, p. 491–507, accessed August 5, 2022, at https://link.springer.com/article/10.1007/s12237-011-9455-x.
Newson, M., and Sear, D., 2001, Geomorphological procedures and river restoration—Science, survey and sustainability, in Nijland, H.J., and Cals, M.J.R., River restoration in Europe—Practical approaches, Conference on River Restoration, Proceedings: Wageningen, Netherlands, Institute for Inland Water Management and Waste Water Treatment, p. 251–254, accessed August 21, 2022, at https://doi.org/10.13140/RG.2.1.4381.0803.
Nienhuis, J.H., Kim, W., Milne, G.A., Quock, M., Slangen, A.B.A., Törnqvist, T.E., 2023, River deltas and sea-level rise: Annual Review of Earth and Planetary Sciences, v. 51, no. 1, p. 79–104, accessed December 12, 2023, at https://doi.org/10.1146/annurev-earth-031621-093732.
New York Natural Heritage Program, 2021, Alewife floater, in Perkins, K., Online conservation guide for Utterbackiana implicata: New York Natural Heritage Program web page, accessed March 20, 2024, at https://guides.nynhp.org/alewife-floater/.
Noe, G.B., Bourg, N.A., Krauss, K.W., Duberstein, J.A., and Hupp, C.R., 2021, Watershed and estuarine controls both influence plant community and tree growth changes in tidal forested freshwater wetlands along two U.S. Mid-Atlantic rivers: Forests, v. 12, no. 9, p. 1–22, accessed September 1, 2022, at https://doi.org/10.3390/f12091182.
Noe, G.B., Cashman, M.J., Skalak, K., Gellis, A., Hopkins, K.G., Moyer, D., Webber, J., Benthem, A., Maloney, K., Brakebill, J., Sekellick, A., Langland, M., Zhang, Q., Shenk, G., Keisman, J., and Hupp, C., 2020, Sediment dynamics and implications for management—State of the science from long-term research in the Chesapeake Bay watershed, USA: WIREs. Water, v. 7, no. 4, p. 1–28, accessed November 5, 2022, at https://doi.org/10.1002/wat2.1454.
Noe, G.B., Hopkins, K.G., Claggett, P.R., Schenk, E.R., Metes, M.J., Ahmed, L., Doody, T.R., and Hupp, C.R., 2022, Streambank and floodplain geomorphic change and contribution to watershed material budgets: Environmental Research Letters, v. 17, no. 064015, 15 p., accessed November 4, 2022, at https://doi.org/10.1088/1748-9326/ac6e47.
Orth, R.J., Bieri, J., Fishman, J.R., Harwell, M.C., Marion, S.R., Moore, K.A., Nowak, J.F., and Montfrans, J.V., 2006, A review of technologies using adult plants and seeds to transplant Eelgrass (Zostera marina l.), in Treat, S.F., and Lewis, R.R. III, eds., Seagrass restoration—Success, failure, and the costs of both—Mote Marine Laboratory, Sarasota, Fla., March 11–12, 2003, Guidebook: Valrico, Fla., p. 1–17., accessed July 15, 2022, at https://studylib.net/doc/13358208/seagrass-restoration--success--failure--and-the-costs-of-.
Perry, J.E., and Atkinson, R.B., 1997, Plant diversity along a salinity gradient of four marshes on the York and Pamunkey rivers in Virginia: Castanea, v. 62, no. 2, p. 112–118, accessed July 15, 2022, at https://www.vims.edu/people/perry_je/pubs/1997PerryAtkinson-Castanea.pdf.
Perry, J.E., and Atkinson, R.A., 2009, York River tidal marshes, in Moore, K.A. and Reay, W.G., eds., A site profile of the Chesapeake Bay National Estuarine Research Reserve in Virginia: Gloucester Point, Va., The Virginia Institute of Marine Science, College of William and Mary, p. 39–47, accessed July 15, 2022, at https://coast.noaa.gov/data/docs/nerrs/Reserves_CBV_SiteProfile.pdf.
Phillips, S.W., ed., 2007, Synthesis of U.S. Geological Survey science for the Chesapeake Bay ecosystem and implications for environmental management: U.S. Geological Survey Circular 1316, 63 p., accessed October 30, 2023, at https://pubs.usgs.gov/circ/circ1316/circular1316.pdf.
Pilegaard, K., 2013, Processes regulating nitric oxide emissions from soils: Philosophical Transactions of the Royal Society of London. Series B, Biological Sciences, v. 368, no. 1621, p. 1–8, accessed July 15, 2022, at https://royalsocietypublishing.org/doi/10.1098/rstb.2013.0126.
Poff, N.L., Olden, J.D., Merritt, D.M., and Pepin, D.M., 2007, Homogenization of regional river dynamics by dams and global biodiversity implications: Proceedings of the National Academy of Sciences of the United States of America, v. 104, no. 14, p. 5732–5737, accessed October 4, 2022, at https://www.pnas.org/doi/10.1073/pnas.0609812104.
Pope, J.P., Masterson, J.P., DeSimone, L.A., and Starn, J.J., 2020, Statistical summaries of simulated groundwater residence times for the 10 regional aquifers of the Northern Atlantic Coastal Plain aquifer system, at a 1 square-mile grid resolution: U.S. Geological Survey data release, accessed November 4, 2022, at https://doi.org/10.5066/P91F9JTO.
Raey, W.G., 2009, Water quality within the York River Estuary: Journal of Coastal Research, v. 57, p. 27–39, accessed July 15, 2022, at https://www.jstor.org/stable/25737720.
Raney, E.C., and Massman, W.H., 1953, The fishes of the tidewater section of the Pamunkey River, Virginia: Journal of the Washington Academy of Sciences, v. 43, no. 12, p. 424–432, accessed September 5, 2022, at https://scholarworks.wm.edu/vimsarticles/1767.
Rheinhardt, R.D., and Hershner, C., 1992, The relationship of below-ground hydrology to canopy composition in five tidal freshwater swamps: Wetlands, v. 12, no. 3, p. 208–216, accessed June 15, 2022, at https://www.researchgate.net/publication/234079992_The_relationship_of_below-ground_hydrology_to_canopy_composition_in_five_tidal_freshwater_swamps.
Rice, K.C., Bennett, M.R., and Shen, J., 2011, Simulated changes in salinity in the York and Chickahominy Rivers from projected sea-level rise in Chesapeake Bay: U.S. Geological Survey Open-File Report 2011-1193, 31 p., accessed August 11, 2022, at https://pubs.usgs.gov/of/2011/1191/pdf/ofr20111191.pdf.
Rice, K.C., Moyer, D.M., and Mills, A.L., 2017, Riverine discharges to Chesapeake Bay—Analysis of long-term (1927–2014) records and implications for future flows in the Chesapeake Bay basin: Journal of Environmental Management, v. 204, part 1, p. 246–254, accessed June 15, 2023, at https://doi.org/10.1016/j.jenvman.2017.08.057.
Robinson, M.A., and Reay, W.G., 2005, Ground water flow analysis of a Mid-Atlantic outer coastal plain watershed, Virginia, U.S.A: Ground Water, v. 40, no. 2, p. 123–131, accessed November 4, 2022, at https://doi.org/10.1111/j.1745-6584.2002.tb02497.x.
Ryberg, K.R., Blomquist, J.D., Sprague, L.A., Sekellick, A.J., and Keisman, J., 2018, Modeling drivers of phosphorus loads in Chesapeake Bay tributaries and inferences about long-term change: Science of the Total Environment, v. 616–617, p. 1423–1430, accessed June 15, 2023, at https://doi.org/10.1016/j.scitotenv.2017.10.173.
Santucci, V.J. Jr., Gephard, S.R., Pescitelli, G.S., 2005, Effects of multiple low-head dams on fish, macroinvertebrates, habitat, and water quality in the Fox River, Illinois: North American Journal of Fisheries Management, v. 25, no. 3, p. 975–992, accessed October 4, 2022, at https://doi.org/10.1577/M03-216.1.
Sekellick, A.J., Devereux, O.H., Keisman, J.L., Sweeney, J.S., and Blomquist, J.D., 2019, Spatial and temporal patterns of best management practice implementation in the Chesapeake Bay watershed, 1985–2014: Reston, Va.: U.S. Geological Survey, accessed November 4, 2022, at https://pubs.er.usgs.gov/publication/sir20185171.
Sharpley, A., Jarvie, H.P., Buda, A., May, L., Spears, B., and Kleinman, P., 2013, Phosphorus legacy—Overcoming the effects of past management practices to mitigate future water quality impairment: Journal of Environmental Quality, v. 42, no. 5, p. 1308–1326, accessed November 4, 2022, at https://doi.org/10.2134/jeq2013.03.0098.
Shenk, G., Bhatt, G., Tian, R., Cerco, C., Bertani, I., and Linker, L., 2021, Modeling climate change effects on Chesapeake water quality standards and development of 2025 planning targets to address climate change: Annapolis, Md., Chesapeake Bay Program Modeling Workgroup Report 328–21, 145 p., accessed October 4, 2022, at https://www.chesapeakebay.net/channel_files/42671/p6modeldocumentation_climatechangedocumentation_(5).pdf.
Simmions, G.M., and Reed, J.R., 1973, Mussels as indicators of biological recovery zone: Journal-Water Pollution Control Federation, v. 45, no. 12, p. 2480–2492, accessed September 5, 2022, at https://eurekamag.com/research/027/003/027003633.php.
Staver, K.W., and Brinsfield, R.B., 2001, Agriculture and water quality on the Maryland eastern shore—Where do we go from here?—Long-term solutions to accelerated eutrophication must provide mechanisms for redistributing nutrients flowing into concentrated animal-producing regions: Bioscience, v. 51, no. 10, p. 859–868, accessed December 1, 2022, at https://doi.org/10.1641/0006-3568(2001)051[0859:AAWQOT]2.0.CO;2.
Stockhausen, W.T., and Lipcius, R.N., 2003, Simulated effects of seagrass loss and restoration on settlement and recruitment of Blue Crab postlarvae and juveniles in the York River, Chesapeake Bay: v. 72, no. 2, p. 409–422., accessed September 5, 2022, at https://scholarworks.wm.edu/cgi/viewcontent.cgi?article=2515&context=vimsarticles.
Strain, D., 2014, The Antarctic connection—New research shows that polar ice sheets could become a big contributor to sea level rise, in Come high Water—Sea level rise and Chesapeake Bay: Chesapeake Quarterly, v. 13, nos. 2–3., p. 4–7 accessed October 4, 2022, at https://www.chesapeakequarterly.net/sealevel/main1/.
Sweet, W.V., Hamlington, B.D., Kopp, R.E., Weaver, C.P., Barnard, P.L., Bekaert, D., Brooks, W., Craghan, M., Dusek, G., Frederikse, T., Garner, G., Genz, A.S., Krasting, J.P., Larour, E., Marcy, D., Marra, J.J., Obeyseeram, J., Osler, M., Pendleton, M., Roman, D., Schmied, L., Veatch, W., White, K.D., and Zuzak, C., 2022, Global and regional sea level rise scenarios for the United States—Updated mean projections and extreme water level probabilities along U.S. coastlines: Silver Spring, Md., National Oceanic and Atmospheric Administration, National Ocean Service, NOAA Technical Report NOS 01., 111 p., accessed August 31, 2022, at https://oceanservice.noaa.gov/hazards/sealevelrise/sealevelrise-tech-report.html.
Tango, P.J., and Batiuk, R.A., 2013, Deriving Chesapeake Bay water quality standards: Journal of the American Water Resources Association, v. 49, no. 5, p. 1007–1024, accessed November 4, 2022, at https://doi.org/10.1111/jawr.12108.
Terziotti, Silvia, Capel, P.D., Tesoriero, A.J., Hopple, J.A., and Kronholm, S.C., 2017, Estimates of nitrate loads and yields from groundwater to streams in the Chesapeake Bay watershed based on land use and geology: U.S. Geological Survey Scientific Investigations Report 2017–5160, 20 p., accessed November 4, 2022, at https://doi.org/10.3133/sir20175160.
Terziotti, S., and Hopple, J.A., 2018, Datasets and metadata for estimates of nitrate loads and yields from groundwater to streams in the Chesapeake Bay watershed based on land use and geology: U.S. Geological Survey data release, accessed November 4, 2022, at https://doi.org/10.5066/F79G5KP4.
U.S. Fish and Wildlife Service, 2016, National wetlands inventory: U.S. Fish and Wildlife Service web page, accessed August 5, 2022, at https://www.fws.gov/wetlands/.
U.S. Army Corps of Engineers, 2022, National inventory of dams: U.S. Army Corps of Engineers web page, accessed June 21, 2022, at https://nid.usace.army.mil/#/.
U.S. Census Bureau, 2022, Population estimates program: U. S. Census Bureau web page, accessed September 5, 2022, at https://www.census.gov/quickfacts/fact/table/louisacountyvirginia,spotsylvaniacountyvirginia,carolinecountyvirginia,hanovercountyvirginia,newkentcount yvirginia,kingwilliamcountyvirginia/PST045221.
U.S. Environmental Protection Agency, 2017a, National Emissions Inventory (NEI) data: U.S. Environmental Protection Agency web page, accessed October 4, 2022, at https://www.epa.gov/air-emissions-inventories/2017-national-emissions-inventory-nei-data.
U.S. Environmental Protection Agency, 2017b, Ambient water quality criteria for dissolved oxygen, water clarity and chlorophyll-a for the Chesapeake Bay and its tidal tributaries: Annapolis, Md., U.S. Environmental Protection Agency Region III Chesapeake Bay Program Office, EPA 903-R-17-002, accessed December 1, 2022, at https://d18lev1ok5leia.cloudfront.net/chesapeakebay/documents/2017_Nov_ChesBayWQ_Criteria_Addendum_Final.pdf.
U.S. Environmental Protection Agency, 2010, Chesapeake Bay total maximum daily load for nitrogen, phosphorus and sediment: U.S. Environmental Protection Agency report, accessed December 1, 2021, at https://www.epa.gov/chesapeake-bay-tmdl/chesapeake-bay-tmdl-document.
U.S. Environmental Protection Agency, 2008, A screening assessment of the potential impacts of climate change on combined sewer overflow (CSO) mitigation in the Great Lakes and New England regions: Washington, D.C., EPA/600/R-07/033F, p. 39, accessed October 4, 2022, at https://ofmpub.epa.gov/eims/eimscomm.getfile?p_download_id=472009.
U.S. Environmental Protection Agency, 2003a, Ambient water quality criteria for dissolved oxygen, water clarity and chlorophyll-a for the Chesapeake Bay and its tidal tributaries: Annapolis, Md., U.S. Environmental Protection Agency Region III Chesapeake Bay Program Office EPA 903-R-03-002, accessed December 1, 2022, at https://d18lev1ok5leia.cloudfront.net/chesapeakebay/2003_ambient_water_quality_criteria.pdf.
U.S. Environmental Protection Agency, 2003b, Technical support document for identification of Chesapeake Bay designated sses and attainability: Annapolis, Md., U.S. Environmental Protection Agency Region III Chesapeake Bay Program Office EPA 903–R–004, accessed December 1, 2022, at https://d38c6ppuviqmfp.cloudfront.net/content/publications/cbp_13218.pdf.
U.S. Geological Survey, 2022a, USGS water data for the Nation: U.S. Geological Survey National Water Information System database, accessed December 31, 2022, at http://dx.doi.org/10.5066/F7P55KJN.
U.S. Geological Survey, 2022b, Land subsidence on the Virginia Coastal Plain: U.S. Geological Survey web page, accessed December 1, 2022, at https://www.usgs.gov/centers/virginia-and-west-virginia-water-science-center/science/land-subsidence-virginia-coastal#:~:text=USGS%20scientists%20are% 20monitoring%20land%20subsidence%20across%20the,factor%20in%20the%20land%20subsidence%20affecting%20the%20area.
U.S. Geological Survey, 2021, 3D Elevation Program 1-meter resolution digital elevation model (published 20211221): U.S. Geological Survey web page, accessed October 23, 2019, at https://www.usgs.gov/the-national-map-data-delivery.
Reidmiller, D.R., Avery, C.W., Easterling, D.R., Kunkel, K.E., Lewis, K.L.M., Maycock, T.K., and Stewart, B.C., eds., 2018, Impacts, risks, and adaptation in the United States—Fourth National Climate Assessment, Volume II: U.S. Global Change Research Program, 1,515 p., accessed September 31, 2022, at https://doi.org/10.7930/NCA4.2018.
Via, W.S., 2012, Assessing striped bass habitat in Lake Anna, VA—Testing for Coutant's Temperature-Oxygen Squeeze: Oregon State University, capstone project for fisheries management certificate, 34 p., accessed August 31, 2022, at https://library.oregonstate.edu/.
Vidon, P., Karwan, D.L., Andres, A.S., Inamdar, S., Kaushal, S., Morrison, J., Mullaney, J., Ross, D.S., Schroth, A.W., Shanley, J.B., and Yoon, B., 2018, In the path of the Hurricane—Impact of Hurricane Irene and Tropical Storm Lee on watershed hydrology and biogeochemistry from North Carolina to Maine, USA: Biogeochemistry, v. 141, no. 3, p. 351–364, accessed August 31, 2022, at https://doi.org/10.1007/s10533-018-0423-4.
Virginia Department of Conservation and Recreation, 2021, Overview of the physiography and vegetation of Virginia: Virginia Department of Conservation and Recreation, 59 p., accessed June 5, 2022, at https://www.dcr.virginia.gov/natural-heritage/natural-communities/document/ncoverviewphys-veg.pdf.
Virginia Department of Environmental Quality, 2022a, 2022 Integrated report: Virginia Department of Environmental Quality web page, accessed July 13, 2022, at https://www.deq.virginia.gov/our-programs/water/water-quality/assessments/integrated-report.
Virginia Department of Environmental Quality, 2022b, Virginia annual water resources Report: Virginia Department of Environmental Quality Annual Report, 52 p., accessed November 21, 2022, at https://www.deq.virginia.gov/home/showpublisheddocument/16528/638053236953670000.
Virginia Department of Environmental Quality, 2022c, Water quality, watershed, assessment, and water permitting datasets—Implementation (IP) watershed and total maximum daily load (TMDL) datasets: Virginia Department of Environmental Quality web page, accessed October 4, 2022, at https://geohub-vadeq.hub.arcgis.com/pages/Water%20Datasets.
Virginia Department of Environmental Quality, 2015, Commonwealth of Virginia State water resources plan: Virginia Department of Environmental Quality Memorandum accessed October 4, 2022, at https://www.deq.virginia.gov/home/showpublisheddocument/8227/637534969441500000.
Virginia Department of Environmental Quality, 2014, E. coli TMDL development for the Pamunkey River and tributaries, VA: Virginia Department of Environmental Quality, prepared by MapTech, Inc., 90 pages, five appendixes, accessed October 4, 2022, at https://www.deq.virginia.gov/home/showdocument?id=11004&t=637692061026930000.
Virginia Department of Wildlife Resources, 2022, Potential fish passage projects in Virginia, accessed June 15, 2022, at https://dwr.virginia.gov/fishing/fish-passage/.
Walling, D.E., 2009, The impact of global change on erosion and sediment transport by rivers—Current progress and future challenges: The United Nations World Water Assessment Programme, 26 p., accessed November 4, 2022, at https://unesdoc.unesco.org/ark:/48223/pf0000185078.
Virginia State Water Control Board, 2022a, Numerical criteria for dissolved oxygen, pH, and maximum temperature, section 50–chapter 260 of State Water Control Board: Virginia Administrative Code, title 9, accessed December 1, 2022, at https://law.lis.virginia.gov/admincode/title9/agency25/chapter260/section50/.
Virginia State Water Control Board, 2022b, Criteria to protect designated uses from the impacts of nutrients and suspended sediment in the Chesapeake Bay and its tidal tributaries, section 185–chap. 260 of State Water Control Board: Virginia Administrative Code, title 9, accessed December 1, 2022, at https://law.lis.virginia.gov/admincode/title9/agency25/chapter260/section185/.
Wei, A., 2019, Chesapeake Bay mean surface salinity 1985-2018: Chesapeake Bay Program, accessed July 13, 2022, at https://www.chesapeakebay.net/what/maps/chesapeake-bay-mean-surface-salinity-1985-2018.
Wohl, E., 2015, Legacy effects on sediments in river corridors: Earth-Science Reviews, v. 147, p. 30–53, accessed November 4, 2022, at https://doi.org/10.1016/j.earscirev.2015.05.001.
Wu, C.A., Murray, L.A., and Heffernan, K.E., 2015, Evidence for natural hybridization between native and introduced lineages of Phragmites australis in the Chesapeake Bay watershed: American Journal of Botany, v. 102, no. 5, p. 805–812, accessed September 5, 2022, at https://doi.org/10.3732/ajb.1500018.
Zhang, Q., Murphy, R.R., Tian, R., Forsyth, M.K., Trentacoste, E.M., Keisman, J., and Tango, P.J., 2018, Chesapeake Bay’s water quality condition has been recovering—Insights from a multimetric indicator assessment of thirty years of tidal monitoring data: Science of the Total Environment, v. 637–638, p. 1617–1625, accessed December 1, 2022, at https://doi.org/10.1016/j.scitotenv.2018.05.025.
Zhang, Q., Brady, D.C., Boynton, W.R., and Ball, W.P., 2015, Long-term trends of nutrients and sediment from the nontidal Chesapeake watershed—An assessment of progress by river and season: Journal of the American Water Resources Association, v. 51, no. 6, p. 1534–1555, accessed December 1, 2022, at https://doi.org/10.1111/1752-1688.12327.
Conversion Factors
U.S. customary units to International System of Units
Temperature in degrees Fahrenheit (°F) may be converted to degrees Celsius (°C) as follows:
°C = (°F – 32) / 1.8.
Datum
Horizontal coordinate information is referenced to the North American Datum of 1983 (NAD 83).
Vertical coordinate information is referenced to the World Geodetic System of 1984 (WGS 1984), and to the North American Vertical Datum of 1988 (NAVD 88), and to the National Geodetic Vertical Datum of 1929 (NGVD 1929). Elevation, as used in this report, refers to vertical distance above or below the specified vertical datum.
Supplemental Information
Concentrations of chemical constituents in water are given in either milligrams per liter (mg/L) or micrograms per liter (µg/L).
Abbreviations
BMP
best management practice
CBNERR
Chesapeake Bay National Estuarine Research Reserve
CSO
combined sewer outlet
FEMA
Federal Emergency Management Agency
NANPP
North Anna Nuclear Power Plant
ppt
parts per thousand
RSLR
relative sea-level rise
SAV
submerged aquatic vegetation
SFHA
special flood hazard area
SLR
sea-level rise
TMDL
total maximum daily load
USGS
U.S. Geological Survey
VDEQ
Virginia Department of Environmental Quality
Virginia DWR
Virginia Department of Wildlife Resources
For more information about this report, contact:
Director, Virgnia and West Virginia Water Science Center
U.S. Geological Survey
1730 East Parham Road
Richmond, VA 23228
https://www.usgs.gov/centers/virginia-and-west-virginia-water-science-center
Publishing support provided by the Baltimore Publishing Service Center.
Visual Information Specialist-Sarah Lighter
Editor-Brent Trickett
Disclaimers
Any use of trade, firm, or product names is for descriptive purposes only and does not imply endorsement by the U.S. Government.
Although this information product, for the most part, is in the public domain, it also may contain copyrighted materials as noted in the text. Permission to reproduce copyrighted items must be secured from the copyright owner.
Suggested Citation
Foster, B.M., Lopez, R., Crawford, E.R., Cook, W., Krigsvold, J., Langston, J.H., Langston, T., Miles, G., Moore, K., Garman, G.C., Rice, K.C., and Jastram, J.D., 2024, Characterization of the water resources of the Pamunkey River watershed in Virginia—A review of water science, management, and traditional ecological knowledge: U.S. Geological Survey Scientific Investigations Report 2024–5024, 64 p., https://doi.org/10.3133/sir20245024.
ISSN: 2328-0328 (online)
Study Area
| Publication type | Report |
|---|---|
| Publication Subtype | USGS Numbered Series |
| Title | Characterization of the water resources of the Pamunkey River watershed in Virginia—A review of water science, management, and traditional ecological knowledge |
| Series title | Scientific Investigations Report |
| Series number | 2024-5024 |
| DOI | 10.3133/sir20245024 |
| Publication Date | July 08, 2024 |
| Year Published | 2024 |
| Language | English |
| Publisher | U.S. Geological Survey |
| Publisher location | Reston, VA |
| Contributing office(s) | Virginia and West Virginia Water Science Center |
| Description | ix, 64 p. |
| Country | United States |
| State | Virginia |
| Other Geospatial | Pamunkey River Watershed |
| Online Only (Y/N) | Y |
| Additional Online Files (Y/N) | N |