

Simulation of Hydrodynamics and Water Temperature in a 21-Mile Reach of the Upper Illinois River, Illinois, 2020–22
Links
- Document: Report (2.6 MB pdf) , HTML , XML
- Dataset: USGS National Water Information System database - USGS water data for the Nation
- Data Release: USGS data release - Hydrodynamic and water-temperature model of a 21-mile reach of the upper Illinois River, Illinois (ver. 1.1, October 2024)
- Version History: Version History (2.7 KB txt)
- NGMDB Index Page: National Geologic Map Database Index Page (html)
- Download citation as: RIS | Dublin Core
Acknowledgments
The authors acknowledge the U.S. Army Corps of Engineers for funding support of the Fox River at Dayton, Illinois, streamgage and providing stage, water-surface elevation, and temperature time-series data for various Illinois River stations. Funding support for the collection of water-temperature time series at Starved Rock and Seneca water-quality monitoring stations were provided by the Illinois Environmental Protection Agency with additional funding of water-temperature data at Seneca provided by Exelon Generation Company.
The authors also acknowledge current and former U.S. Geological Survey employees including Marian Domanski for early development of the CE-QUAL-W2 model, Kyle Hix for model geometry development, and the Next Generation Water Observing System harmful algal blooms field team for water-temperature profile data used in model calibration.
Abstract
This report describes the development of a CE-QUAL-W2 river hydrodynamics and temperature model of a 21-mile reach of the Illinois River including a 3-mile reach of a major tributary, the Fox River. Model outputs consist of streamflow, water velocity, water-surface elevation, and water-temperature time series that can be used to simulate summer conditions in years with and without extensive development of harmful algal blooms (HABs). These analyses may provide a better understanding of some complex factors contributing to HAB development along the Illinois River. Such an understanding may provide more accurate HAB timing and location predictions and may help determine potential mitigating activities to prevent or limit the size and duration of HABs.
Using the observed and simulated hydrodynamic conditions in the Illinois River study reach, it was possible to compare and contrast streamflow, velocity, and temperature conditions in years with varying HAB distributions. Occurrences of extensive HABs were documented in the study reach in June 2020 and June 2021, but only a small HAB restricted to the Marseilles Lock and Dam pool occurred in the summer of 2022. The objective then was to find similarities in site conditions between 2020 and 2021 that may contrast with the conditions in 2022. Among the 3 years included in the study, the variability in simulated water temperature exceeded variability in observed streamflow and simulated velocities. The longest period of water temperatures greater than 27 degrees Celsius (°C) in the selected locations in June of the three analysis years was in the second half of June 2022, yet no study-area wide HAB was documented in 2022. Simulations indicated that after warm water temperatures were established in the reach in June 2022, a cooling period broke up the warming period. This period of cooling was greater in magnitude and duration downstream from the location of a localized HAB perhaps limiting the spread of the bloom.
Residence times differed substantially in segments representing different channel features; values ranged from 0.28 to 17.3 (days per 500 meters of channel) between the main stem and backwater areas, respectively. Variation in average June residence times was also greater among different channel features than among different years in the study period. The HABs in 2020 and 2021 at Starved Rock Dam were documented when water temperatures were about 26 °C. River backwater areas at some locations did attain these temperatures 2 to 3 days before the conditions in the main stem. Residence times in the backwater areas, however, generally exceeded 9 days, thus limiting the exchange of water carrying algal biomass into the main channel.
Hydrodynamic model calibration involved adjusting model parameters until observed and simulated daily water-surface elevations, daily streamflows, discrete velocities, and channel areas were similar. Temperature calibration was done with near-surface continuous time-series data and discrete vertical profile temperatures. Observed and simulated water temperatures generally were within 1 °C at all monitoring locations.
Introduction
The Illinois River serves as an important commercial conduit and a means of recreation between its mouth at the Mississippi River at Grafton, Illinois, and Lake Michigan at Chicago, Ill. (fig. 1). Along its length are seven locks and dams to maintain a navigable channel. The Illinois River Basin is about 28,906 square miles (mi2; Healy, 1979), and nutrient inputs to this waterway are substantial and diverse, with point-source contributions from the large urban Chicago metropolitan area and nonpoint runoff from the intensive agricultural areas along its length (Terrio and others, 2015). In the past decade, multiple instances of excess algal growth resulted in a substantial amount of decomposing organic matter that lowered dissolved oxygen and could result in the production of toxin-producing cyanobacteria blooms (Illinois Environmental Protection Agency, 2023). Such harmful algal blooms (HABs) have created poor water quality within reaches of the upper Illinois River, posing health risks, use limitations, and increased water treatment costs to adjacent communities. The U.S. Environmental protection Agency (EPA) health advisory limits for microcystin are 0.3–1.6 micrograms per liter (µg/L) for drinking water and 8 µg/L for recreation (U.S. Environmental Protection Agency, 2022a); cyanotoxin concentrations much greater than those limits have been detected in the Illinois River in recent years (2020, 2021) and are known to occur regionally (Illinois Environmental Protection Agency, 2023).
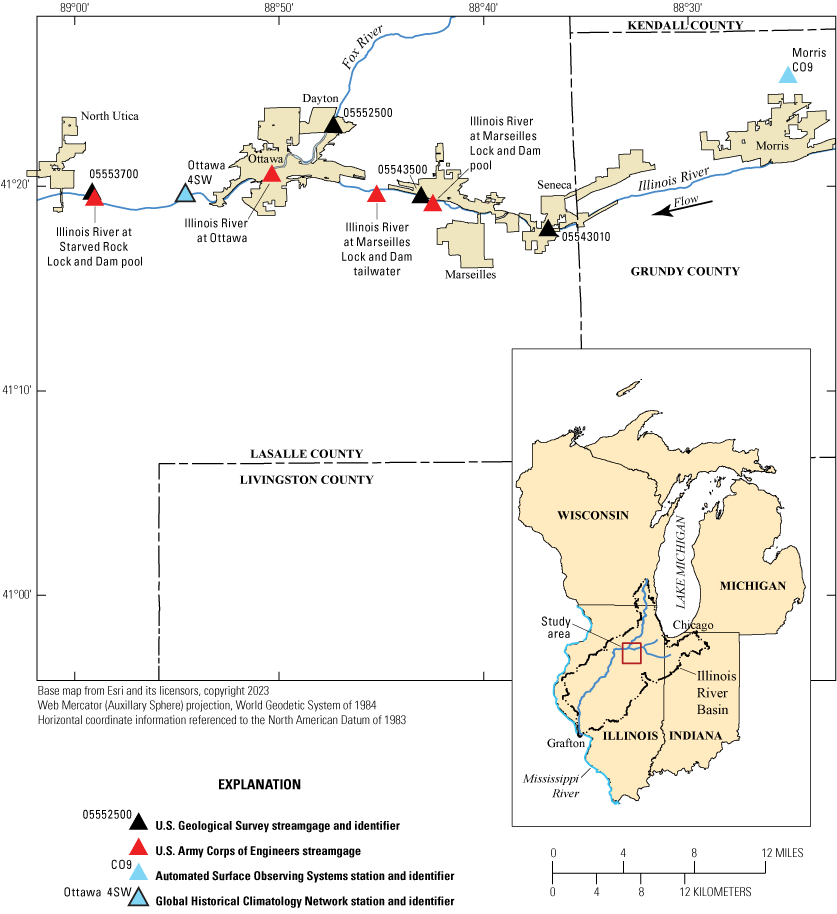
The Illinois River Basin and study area.
HABs have been documented along parts of the upper Illinois River most recently in June 2018, June 2020, and June 2021 (Illinois Environmental Protection Agency, 2023) and in a localized area through much of the summer of 2022 (Steven Butler, Illinois Natural History Survey, written commun., 2023). In response to reoccurring HABs, the U.S. Geological Survey (USGS) and the Illinois Environmental Protection Agency established several continuous water-quality monitoring streamgages along the upper Illinois River to serve as sentinel gages to warn of potential HABs and to provide water-quality data for characterizing potentially harmful conditions (U.S. Geological Survey, 2021b). Monitoring, reporting, and documentation of HABs in the State of Illinois are done by the Illinois Environmental Protection Agency and Illinois Department of Public Health; these entities promote awareness of HABs and disseminate precautionary measures (Illinois Environmental Protection Agency, 2023).
Numerous segments of the Fox River (fig. 1), a tributary to the Illinois River, also have a variety of water-quality impairments including low dissolved oxygen, excessive algal growth, and higher than recommended nutrient concentrations. These impairments have led to sections of the Fox River in Wisconsin and Illinois being listed on the EPA Section 303-(d) list of the 1972 Clean Water Act, which identifies waters affected by low water quality and pollutants causing or expected to cause water-quality violations within each State’s waterways (U.S. Environmental Protection Agency, 2022b).
The specific physical, chemical, and ecological conditions under which HABs form in the Illinois River are not well understood. Although widespread HABs were observed in the upper reaches of the Illinois River in June 2020 and June 2021, only a localized algal bloom was reported in 2022. The environmental conditions under which HABs form are complex but commonly characterized by warm temperatures and high nutrient concentrations (Summers and others, 2022). An analysis of the streamflow and water-temperature conditions during the years of widespread HAB occurrences and the year of localized HAB development may provide insight into understanding the subtle differences in the physical conditions present in both cases. The development of a hydrodynamic and water-temperature model (water temperature is a component of the hydrodynamic model so it will hereafter be referred to as a “hydrodynamic model”) of a selected reach of the upper Illinois River, supported by extensive field data collection efforts, provides the opportunity to quantify and explore the effects of subtle differences in hydrodynamic characteristics on HABs.
In 2021, the USGS began a project to develop and calibrate a hydrodynamic model of a selected reach of the Illinois River that includes the Fox River confluence. Streamgage locations define the upstream end of the model reach at Seneca, Ill., (USGS station 05543010) and the downstream end at Starved Rock Lock and Dam (USGS station 05553700; fig. 1). The model inputs were obtained from existing streamgages and meteorological stations along the reach. Model outputs consist of streamflow, water velocity, water-surface elevation, and water-temperature time series that can be used to simulate summer periods in years with and without extensive HAB development. These analyses may provide a better understanding of how selected physical factors affect the development and timing of HABs within the Illinois River. Such an understanding may provide more accurate HAB timing and location predictions and may help determine potential mitigating activities to prevent or limit the size and duration of HABs.
Site Description
The study area is a 21-mile (mi) reach of the Illinois River between the Starved Rock Lock and Dam operated by the U.S. Army Corps of Engineers (USACE) (U.S. Army Corps of Engineers, 2022; river mile 231) at the downstream extent and the USGS streamgage at Seneca, Ill. (USGS station 05543010; U.S. Geological Survey, 2022c; river mile 252; see fig. 1) at the upstream extent. The drainage area at Starved Rock Lock and Dam is 11,056 mi2 whereas the drainage area at Seneca is 8,215 mi2. The confluence of the Illinois River and a major tributary, the Fox River (drainage area of 2,660 mi2), is within the study reach. The Illinois municipalities of Seneca, Marseilles, Ottawa, and North Utica are along the banks of the Illinois River within this reach (fig. 1). The study reach contains two locks and dams, which are operated by the USACE. The Marseilles Lock and Dam, near Marseilles, is about 5 mi downstream from the upstream end of the study reach. The Starved Rock Lock and Dam near North Utica is at the downstream boundary of the study reach (fig. 1).
The upper reach of the Illinois River receives inputs from two contrasting drainage areas: the greater Chicago area, with highly urbanized metropolitan and industrial areas, and the rural, row-crop agricultural area in northeastern Illinois and northwestern Indiana. Upstream from North Utica, Ill., land cover of the Illinois River Basin is 55.6 percent agriculture, 29.5 percent developed, 8.2 percent forest, 4.8 percent wetlands, and 1.8 percent open water (Dewitz and U.S. Geological Survey, 2021).
Purpose and Scope
This report describes the development, calibration, and sensitivity analysis of a hydrodynamic model of a 21-mi reach of the Illinois River. The model domain also includes a 3-mi reach of a major tributary, the Fox River. The model is two dimensional, is laterally averaged, and provides output information in the longitudinal (streamwise) and vertical (water column) axes. The model was calibrated to observed water-surface elevation, streamflow, velocity, channel area, and water-temperature data for January 1, 2021, through December 31, 2022, and model performance was validated for January 1, 2020, through December 31, 2020. As part of the sensitivity analyses, the model was used to determine changes from base condition water temperature resulting from changes in streamflow, projected changes in air temperature, and selected water-temperature calibration parameters. Model results allow for location-specific comparisons of hydraulic and vertical water-temperature characteristics within the study reach during multiple documented periods of HAB occurrences.
Model Development and Calibration
The upper Illinois River hydrodynamic model was developed using CE-QUAL-W2 (version 4.5; Wells, 2023), a two-dimensional (simulates in the longitudinal and vertical dimensions), laterally averaged hydrodynamic and water-quality model for rivers, lakes, and estuaries. The hydrodynamic computations of the model can be used to predict water-surface elevation, streamflow, velocity, channel area, and water temperature. In addition, the model can simulate numerous water- and sediment-quality constituents including nutrients, organic matter, dissolved oxygen, bacteria, phytoplankton, and macrophytes. Model data preparation for this study included development of channel geometry and computational grid; development of hydrologic, meteorologic, and air- and water-temperature time series; specification of initial conditions including boundary conditions, hydraulic parameters, and kinetic parameters; and simulation of hydraulic and water-temperature characteristics with depth at multiple locations within the study reach.
Topographic and Bathymetric Data
Model geometry for the Illinois River model was developed using a digital elevation model (DEM) incorporating Illinois River bathymetry and surrounding terrain. The base DEM used in this study was developed from a quality level 2+ survey with light detection and ranging (known as lidar) flown in April 2018 by GRW Aerial Surveys Incorporated and is available through the USGS 3D Elevation Program website (U.S. Geological Survey, 2021a). The USACE Rock Island District Operations Division maintains bathymetric depth grids for each of the navigation pools along the Illinois River. These depth grids cover almost all of the navigation channel and many of the side channels along the Illinois River. The depth grids consist of the latest surveys for each part of the river, dating between 1999 and 2017. The base DEM was supplemented with the USACE bathymetric survey data of the Illinois River (John Burant, USACE, written commun., 2021) and the compiled terrain data within the study site are available in Ament and Heimann (2024). Vector polylines were drawn to depict model segment boundaries and polygons of segment extents of wetted channel areas determined from satellite imagery. The DEM and vector spatial files were used in a QGIS version 3.18 (QGIS Development Team, 2021) with an associated plug in (Bernstein, 2019) to develop a required model input table of segment areas and associated 0.5-meter (m) depth intervals.
Model Input Datasets
Model input included hydrologic (water-surface elevations and streamflow), meteorologic (air temperature, dew-point temperature, cloud cover, wind speed, and wind direction), and water-temperature datasets. The time interval of the datasets varied depending on availability and ranged from 15-minute to hourly data.
Hydrologic Data
Hydrologic data used as boundary condition inputs and for calibrating the hydrodynamic model included water-surface elevation and streamflow time series at selected streamgage locations (table 1; fig. 1) within the study reach. Time series at the USGS streamgages were at 15-minute collection intervals (U.S. Geological Survey, 2022a, b, c). Water-surface elevation time-series collection intervals at the USACE streamgages at the Illinois River at Marseilles and Starved Rock were 30 minutes, whereas the time series at the Illinois River at Ottawa were daily (U.S. Army Corps of Engineers, 2022). In addition to streamflow and water-surface elevation data, the USGS streamgages at Marseilles (station 05543500) and Fox River at Dayton (station 05552500) included velocity and channel area data associated with discrete streamflow measurements that also were used for model calibration.
Table 1.
Description of streamgages used in study. Site information from U.S. Geological Survey (2021b) and U.S. Army Corps of Engineers (2022).[Station locations are shown in figure 1. Latitude and longitude are given in degrees (°), minutes (′), and seconds (″). Present refers to the time of publication (2024). USGS, U.S. Geological Survey; NAD 83, North American Datum of 1983; Ill., Illinois; NA, not applicable]
The timing and magnitude of peak flows are important in HAB analyses because they are highly correlated with sediment and nutrient delivery and transport. For example, an exceptionally dry spring period may limit runoff and nutrient transport after crop fertilization ultimately limiting instream nutrient availability for the formation of HABs; however, extended dry periods after intense storms may increase the potential for the development of HABs (U.S. Environmental Protection Agency, 2013). Annual mean streamflows during the analysis period at the Illinois River at Marseilles streamgage indicated that 2020 had the highest annual mean streamflow (13,700 cubic feet per second [ft3/s]; based on water year of October 1 to September 30) of the three analysis years (2020–22) and exceeded the long-term (1920–2022) mean of 10,900 ft3/s. The annual mean streamflow for 2021 (8,022 ft3/s) was less than the long-term mean and 2022 (10,900 ft3/s) was near the long-term mean. In addition, the daily mean streamflow data for the study period generally varied little from the long-term daily median values (fig. 2). Large and notable exceptions existed in the winter and spring of 2020, dispersed moderate short-term (generally less than 2 weeks) high flows in each season of 2021, and moderate late winter and early spring high flows in 2022 at the Marseilles and Fox River at Dayton streamgages.
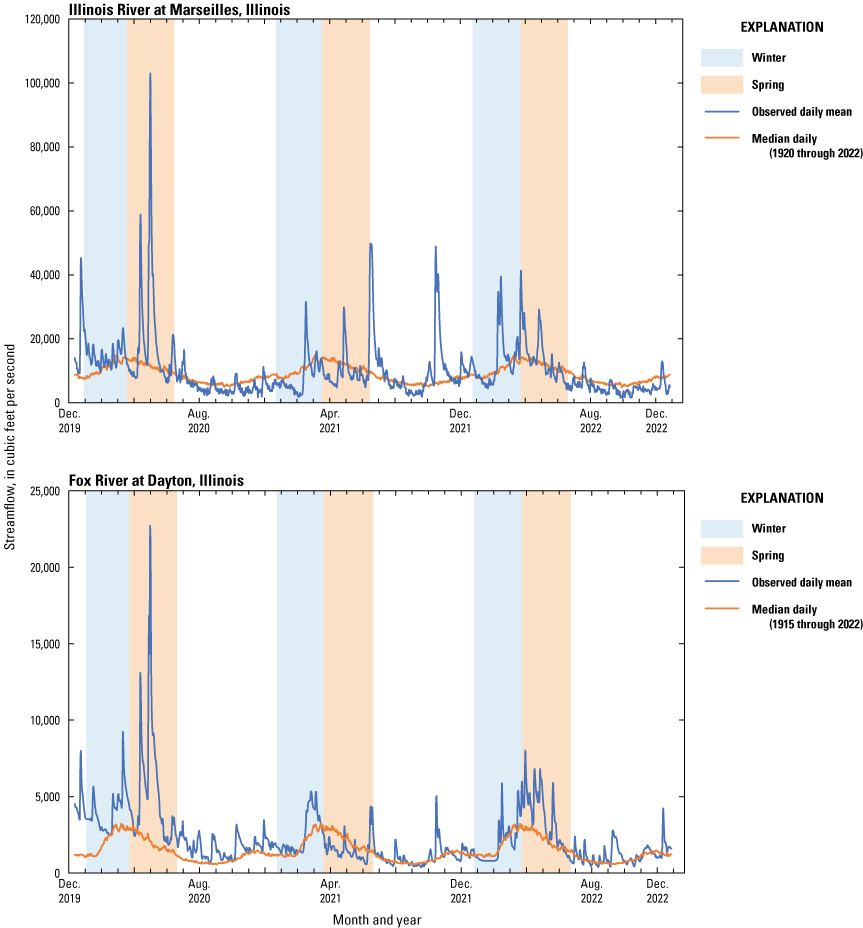
Daily mean streamflow during the study period at the Illinois River at Marseilles, Illinois (U.S. Geological Survey station 05543500), and Fox River at Dayton, Illinois (U.S. Geological Survey station 05552500), streamgages. Data from U.S. Geological Survey (2022a, b).
Meteorologic Data
Meteorologic data used in the hydrodynamic model included air-temperature, dew-point temperature, cloud-cover, wind-speed, and wind-direction time series that were obtained from the Automated Surface Observing Site station C09 at Morris Municipal Airport, Morris, Ill., (fig. 1; Iowa State University, 2023) and were available at 20-minute intervals throughout the 2020–22 analysis period. The qualitative Automated Surface Observing Site cloud-cover parameters of “clear,” “scattered,” “broken,” “overcast,” and “vertical visibility” were converted to numerical values for use in CE-QUAL-W2 using values of 0 for clear, 3 for scattered, 6 for broken, 8 for overcast, and 10 for vertical visibility. Hourly short wave solar radiation data were computed by CE-QUAL-W2 using the numerical values for ASOS cloud cover parameters. Daily air-temperature data used in determining water temperature time series for the Fox River at Dayton were obtained from the Global Historical Climatology Network daily data for station Ottawa 4SW (National Centers for Environmental Information, 2023a). Projections of future changes in monthly mean temperatures at Ottawa, Ill., used in the model sensitivity analyses were obtained from the U.S. Climate Resilience Toolkit Climate Explorer (U.S. Federal Government, 2023). These projections used the representative concentration pathway with 4.5 megawatts per square meter (RCP 4.5; vanVuuren and others, 2011) for the year 2075.
The monthly mean air temperatures during the January 2020 to December 2022 study period were similar to the long-term (1980–2010) monthly mean temperatures at the Morris, Ill., monitoring location (National Centers for Environmental Information, 2023b; fig. 3). The greatest deviations from the long-term normals were in the months of January (2020 and 2022) and February (2021) and outside of the expected HAB development period. Monthly precipitation was more variable during the study period compared to the long-term monthly mean precipitation (1980–2010), with several spring months of each year having substantially greater precipitation than the long-term monthly average (fig. 3).
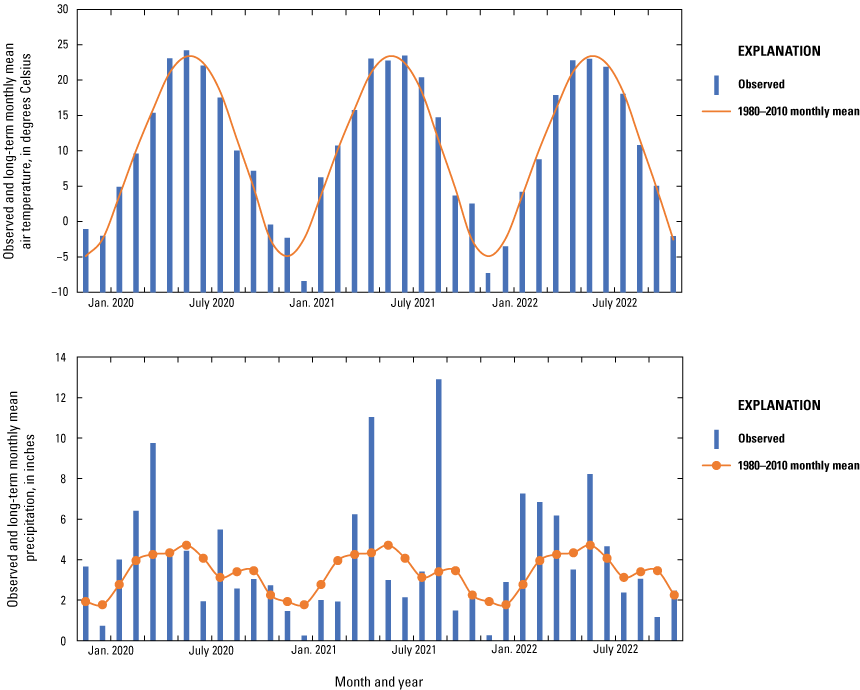
Observed monthly mean air temperature and precipitation at Morris, Illinois, during the study period compared to the long-term (1980–2010) monthly mean values. Data from Data Iowa State University (2023).
Water-Temperature Data
Continuous and discrete water-temperature data were used for model development, calibration, and validation. Continuous data were collected in 15-minute intervals at Seneca (U.S. Geological Survey, 2022c) and Starved Rock (U.S. Geological Survey, 2022d) stations and every 30 minutes at the Marseilles Lock and Dam pool (John Brammier, USACE, written commun., 2022; fig. 1; table 1). The Seneca time-series data were used as the upstream model boundary condition, whereas the Starved Rock time series were used for model calibration and validation at a fixed near-surface (0.5 m) depth. Additional discrete temperature profile data were collected by USGS personnel near Seneca and Ottawa, Ill., and used for model calibration with depth. The discrete profile data were collected at multiple locations within the study reach between May 22, 2022, and July 15, 2022. Water-temperature time-series data were unavailable for the Fox River and, therefore, water temperatures were developed using a regression model with observed air temperature, daily mean streamflow, water temperature, and day of year normalized to 0–2π (fig. 4) as variables. This relation was developed using 97 observed air and water-temperature data pairs collected at the Fox River at Dayton, Ill. (USGS station 05552500) streamgage between 1986 and 1997, daily mean flow at the Fox River at Dayton streamgage, and daily air-temperature time-series data from the Ottawa 4SW weather station (National Centers for Environmental Information, 2023a). The resulting predicted input water-temperature time series for the Fox River and the observed time series for the Illinois River at Seneca were similar (fig. 5).
Table 2.
Description of temperature stations used in study. Site information from U.S. Geological Survey (2021b) and U.S. Army Corps of Engineers (2022).[Station location is shown in figure 1. Latitude and longitude are given in degrees (°), minutes (′), and seconds (″). Present refers to the time of publication (2024); USGS, U.S. Geological Survey; NAD 83, North American Datum of 1983; Ill., Illinois; NA, not applicable]
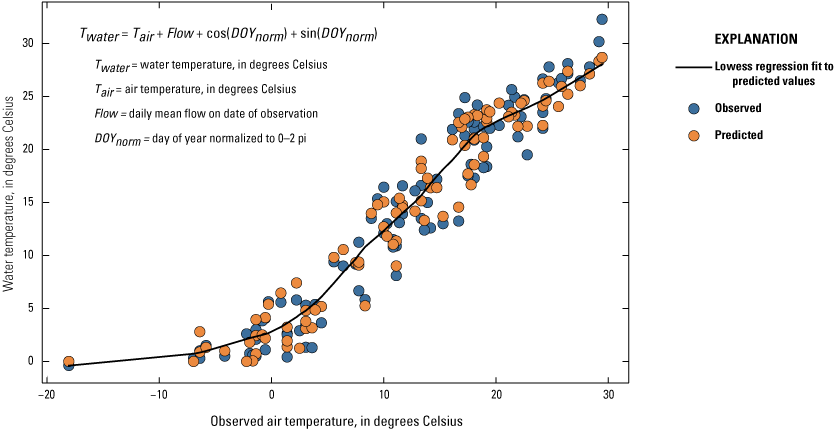
Relation between air temperature and water temperature at the Fox River at Dayton, Illinois (U.S. Geological Survey station 05552500). Data from U.S. Geological Survey (2022a).
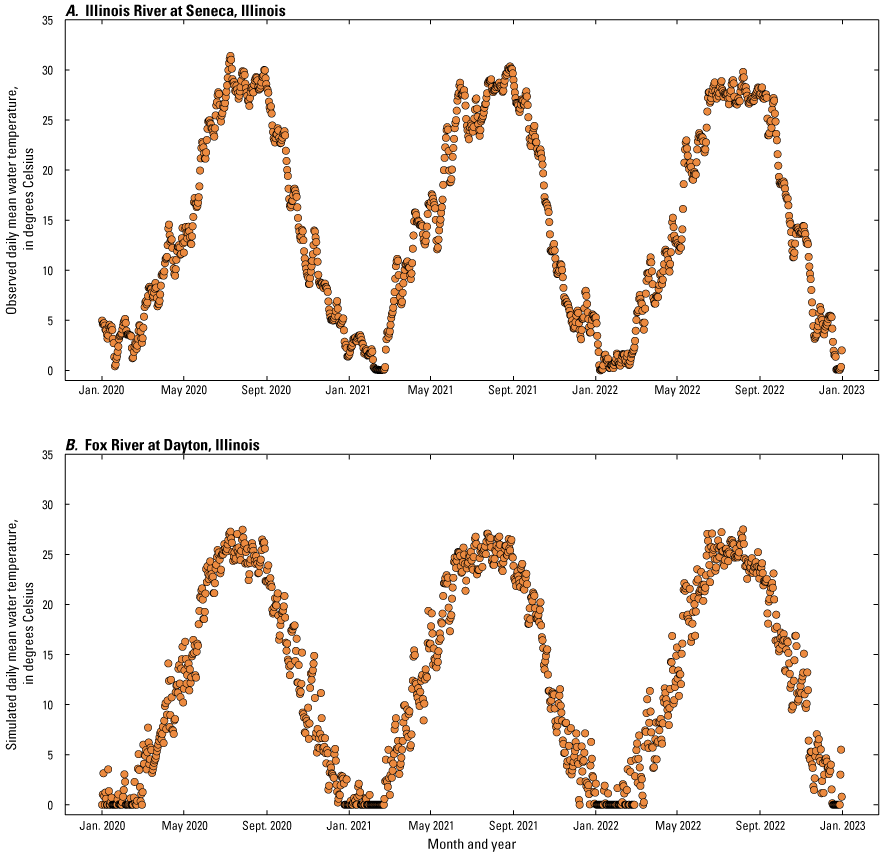
Daily mean water temperatures during the study period. A, Observed water temperatures at the Illinois River at Seneca, Illinois (U.S. Geological Survey station 05543010). B, Estimated daily mean water temperatures at the Fox River at Dayton, Illinois (U.S. Geological Survey station 05552500). Data from U.S. Geological Survey (2022a, c).
Hydrodynamic Modeling
The CE-QUAL-W2 model geometry represents a 21-mi reach of the Illinois River and a 3-mi reach of the Fox River in the study area (fig. 6). Geometry components in the model include waterbodies, branches, segments, and layers. A waterbody includes one or more branches or river sections of homogenous characteristics. The Illinois River study reach is “stair stepped” in that the reach slope is controlled by the Marseilles and Starved Rock Lock and Dam structures and the river upstream from each of these primary structures is represented as a separate waterbody in the model (fig. 6). The Fox River reach, the numerous side channels and backwater areas, and the main stem reaches of the waterbody are designated as separate branches within the model. A branch was further divided into a series of longitudinal model segments oriented in the direction of river flow. The Marseilles dam-controlled waterbody has 4 branches, and the Starved Rock waterbody has 17 branches including the Fox River and numerous side channels and backwater areas in addition to the main stem. Segment lengths generally were 500 m except those in small branches that needed to conform to the requirement of a minimum of three segments. The final model geometry consisted of 2 waterbodies, 21 branches, and 164 segments (fig. 6), with segments having as many as 72 active 0.5-m vertical layers.
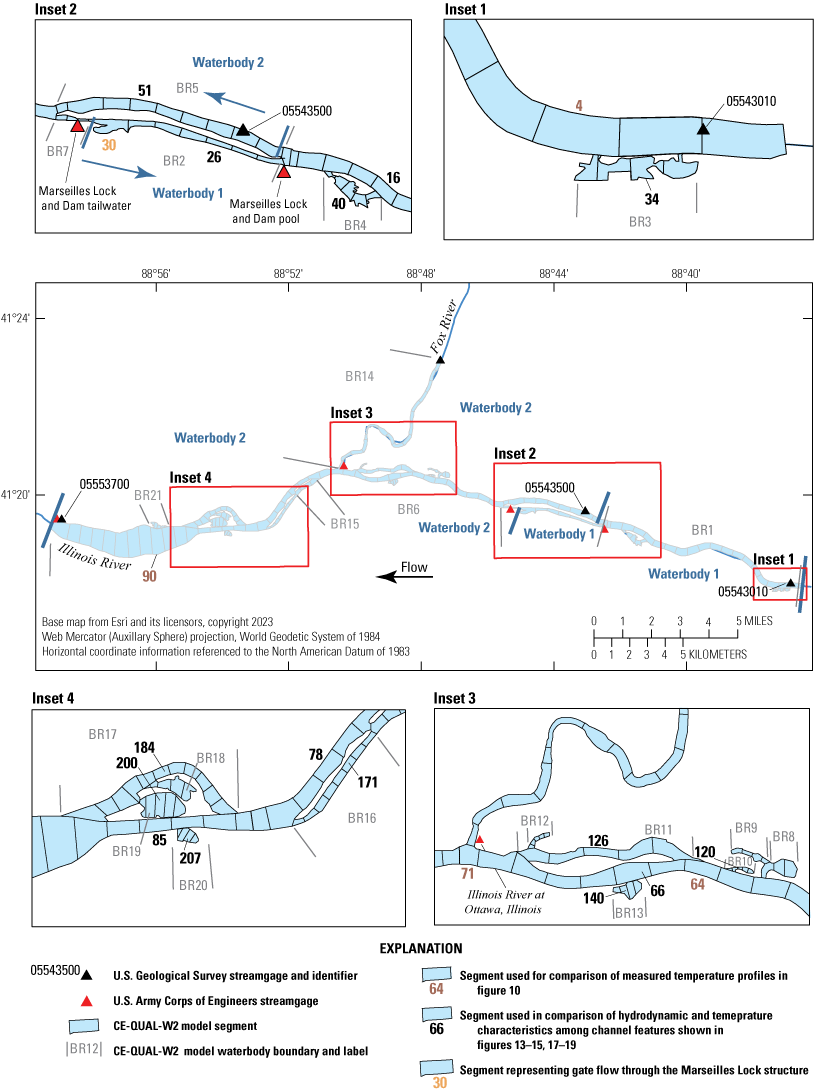
CE-QUAL-W2 model geometry of the upper Illinois River study reach.
The length of longitudinal segments (generally 500 m) and depth/thickness of segment layers (0.5 m) were selected to provide a sufficient representation of channel geometry while providing reasonable run times. Run times for a 3-year simulation period, using an Intel Core i9 3.0 gigahertz, 18-core processor with 128 gigabytes of memory, were about 45 minutes.
The CE-QUAL-W2 model runtime interval varied from 1 to 100 seconds with higher run times used during numerically stable conditions and finer run time increments automatically assigned during otherwise numerically unstable conditions. Simulated 15-minute data were used in the calibration of instantaneous observed streamflow, velocity, channel area, and temperature profile data. Simulated daily mean time-series results were used in the calibration and validation of observed continuous water-surface elevation, streamflow, and temperature time series.
Hydrodynamic Model Parameters
In addition to the required model geometry files, many required initial conditions, boundary condition time series, and model parameters were specified to simulate water-surface elevation, streamflow, velocity, and temperatures in each model segment. Initial estimates for water-surface elevation, slope, and water temperature at each segment were specified. Boundary condition time series at the upstream model segments of the Fox River and Illinois River included streamflow and water temperature. Time series for simulating system wide analyses included air temperature, solar radiation, wind speed, wind direction, and cloud cover. Additional specified model parameters used in determining heat exchange and hydraulic characteristics included longitudinal and vertical eddy viscosity, longitudinal eddy diffusivity, and bottom friction. Recommended or default values were used for most starting parameters. Any parameters modified for this specific application are discussed in the “Hydrodynamic Model Calibration” section of this report.
Streamflows through the Marseilles and Starved Rock Dam structures were simulated in the model by specifying the dynamic weir formula option of gate simulation at the corresponding model segment locations. The dynamic weir formula used in the model is:
whereis simulated dam outflow at time t;
α1
is an empirical parameter;
β1
is an empirical parameter;
Δh
is Zu−Zsp, in meters;
Zu
is the simulated pool water-surface elevation, in meters; and
Zsp
is the theoretical spillway crest elevation of dynamic weir.
Zsp initially was set to Zobst but was modified during calibration using the following equation:
whereZobst
is the observed water-surface elevation from the USACE stage gage at the Marseilles Dam pool at time t;
Qtobs
is the observed total streamflow from the USGS streamgage below the dam and lockage flows at time t;
Qtmax
is the maximum observed streamflow during the 2021 through 2022 calibration period;
x
is an adjustment coefficient initially set to 1 and adjusted iteratively during calibration; and
y
is a constant initially set to 0 and adjusted iteratively during the 2021 through 2022 calibration period.
The complex lock operation at the Marseilles Lock and Dam is represented by a streamflow time series in the CE-QUAL-W2 model. The gate structure in the Marseilles Lock is depicted in the model at the downstream face of segment 30 (fig. 6, inset 2). Gate operations in the model are simplified by using a discretized daily mean computed flow time series to regulate flow between segment 30 and the downstream segment. The daily mean lock flow is calculated by the USGS using a USACE-supplied number of lock operations per day and a developed rating table between number of lockages and streamflow to compute a time series of daily mean lockage flows. In this way, the gate is continuously open in the model, but the flow is highly regulated as a result of lock operations and the representative flow time series. The resulting computed water-surface elevation at the segment downstream from the lock gate was compared to the observed water-surface time series at the USACE stage gage at this location (fig. 6, inset 2) during model calibration.
Water temperature is an important model variable and is included in all CE-QUAL-W2 hydrodynamic model applications because of its effects on water density and hydraulic characteristics. The hydrodynamic role of water temperature, while important, is secondary in this study to the objective of assessing the specific role of water temperature as a physicochemical characteristic in the development of HABs.
Hydrodynamic Model Calibration
Model calibration involves the adjustment of model parameters until simulated and observed data are within an acceptable threshold. Hydrodynamic model calibration involved adjusting model parameters until observed and simulated daily water-surface elevations, daily streamflows, and the observed and simulated streamflows, velocities, and channel areas associated with discrete streamflow measurements were similar. The period of January 1, 2021, through December 31, 2022, was used for model calibration, and the model output parameters were validated using an independent dataset for the period of January 1, 2020, through December 31, 2020. The 2021–22 period was selected for calibration because of additional temperature profiles and algal community data collected in the reach during this period. Calibration of time-series data including streamflow, water-surface elevation, and temperature was assessed using three goodness of fit metrics, including the mean absolute error (MAE), the root mean square error (RMSE), and the Nash-Sutcliffe model efficiency (NSE). The MAE is the arithmetic average of the absolute error between simulated and observed values (Moriasi and others, 2015), has a range of 0 to infinity (∞), and the units are the same as the time-series data. The MAE was determined by the following equation:
wheren
is the number of observations;
i
is the specific observation;
y
is the simulated value; and
x
is the observed value.
At the Marseilles Lock and Dam, the model calibration process involved matching simulated and observed dam pool water-surface elevations, simulated and observed dam outflows, and simulated and observed lock tailwater water-surface elevations. The calibration steps of the Marseilles Dam pool water-surface elevation time series and dam outflows were:
-
1. running an initial model simulation using the USACE observed pool water-surface elevation time series for Zobs in equation 1 and an x value of 1 and y value of 0 in equation 2;
-
2. comparing simulated pool water-surface elevations to the observed values at the USACE streamgage at the Marseilles pool;
-
3. modifying the x and y parameters in equation 6 to recompute the Zsp time series and rerunning the model until the simulated pool water-surface elevation hydrograph approximated the observed values;
-
4. adjusting α1 and β1 parameters in equation 1 until the simulated streamflow time series matched the observed streamflow time series;
-
5. iteratively checking simulated and observed pool water-surface elevations and making minor adjustments to y in equation 2; and
-
6. checking simulated and observed streamflows and making minor adjustments to α1 and β1 to confirm agreement with both sets of streamflow and water-surface elevation time series.
The 2021 through 2022 calibration results of simulated water-surface elevation and streamflow time series at the Marseilles Lock and Dam indicated that the simulated and observed values were similar (fig. 7A, C). The MAE and RMSE values from the calibration of the Marseilles pool water-surface elevations were 0.03 foot (ft) and 0.04 ft, respectively, indicating close agreement (table 3). Similarly, the simulated and observed water-surface elevations at the Marseilles Lock tailwater were similar (fig. 8B), with an MAE of 0.18 ft and an RMSE of 0.23 ft (table 3). The NSE value of 0.99 for the calibration of the simulated Marseilles Dam outflows with the observed streamflows at the USGS Marseilles streamgage also indicated close agreement. The 2020 validation period was dominated by the May 19, 2020, event for which water-surface elevations and streamflows were underpredicted by the model at the Marseilles Lock and Dam (fig. 7A, B), but this can be attributed to the Qmax value in the dynamic weir equation (eq. 1) being maintained at the maximum flow value during the calibration period. The MAE for Marseilles Lock and Dam pool and lock tailwater water-surface elevations during the validation period were 0.04 and 0.36, respectively, and similar to corresponding values during calibration, whereas the NSE for the Marseilles Dam outflows during the model validation period was 0.99 (table 3).
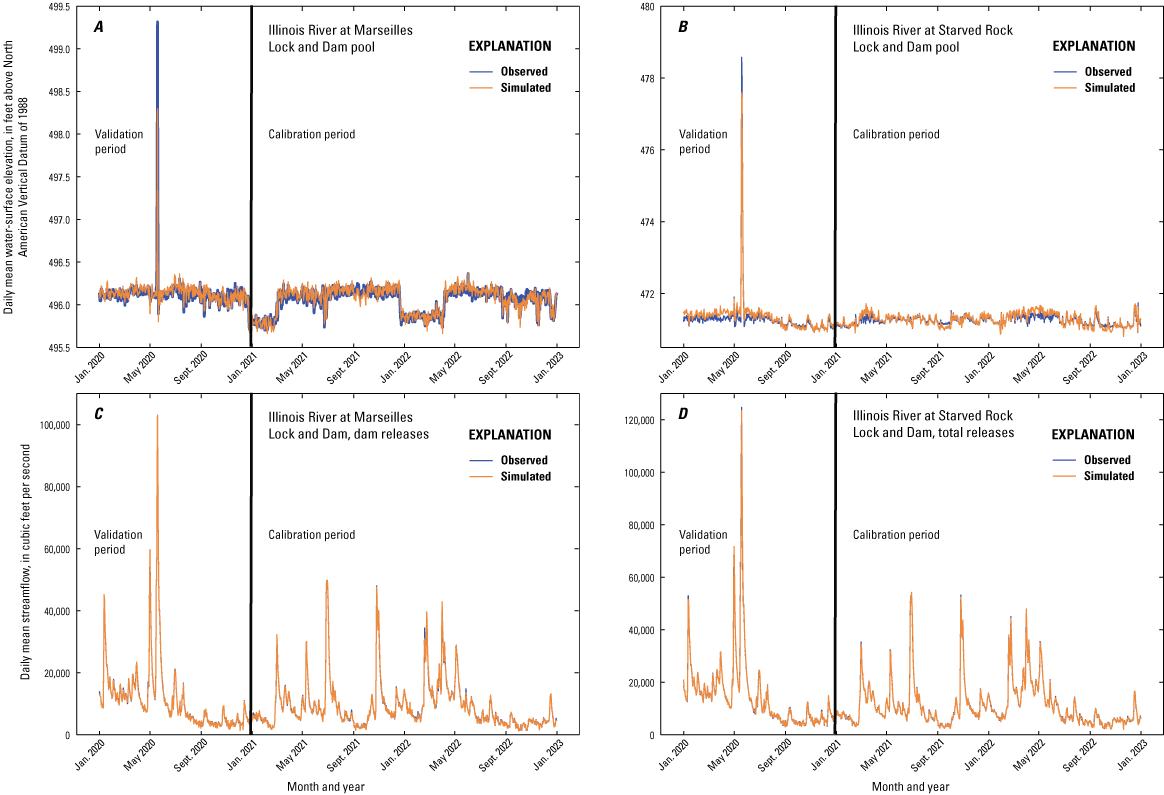
Calibration and validation results of observed and simulated water-surface elevations and lock and dam releases. A, Water-surface elevations at the Illinois River at Marseilles Lock and Dam pool. B, Water-surface elevations at the Illinois River at Starved Rock Lock and Dam pool. C, Daily mean dam releases at the Illinois River at Marseilles Dam. D, Total releases from the Illinois River at Starved Rock Lock and Dam. Data from U.S. Army Corps of Engineers (2022).
Table 3.
Summary of model calibration and validation of water-surface elevation and streamflow results at selected streamgage locations.[Station locations are shown in figure 1. Ill., Illinois; ft, foot; NAVD 88, North American Vertical Datum of 1988; USGS, U.S. Geological Survey; ft3/s, cubic foot per second]
Calibration of pool water-surface elevations and total releases at the Starved Rock Lock and Dam only involved comparing simulated and observed combined dam and lock outflows and simulated and observed pool water-surface elevations. Calibration of the simulated and observed lock tailwater elevations was not done because the downstream model boundary is the Starved Rock Dam pool. The simulated Starved Rock Dam pool water-surface elevations were compared to observed elevation time series at the USACE streamgage at Starved Rock. The simulated total outflows were compared to the sum of the daily flows for Fox River at Dayton and Illinois River at Marseilles. The calibration steps for the Starved Rock total outflows and pool water-surface elevation were the same as those described previously for the Marseilles Lock and Dam except the parameter in equation 1 for the Starved Rock application referred to total simulated dam and lock flows rather than just the dam outflows.
The calibration results of simulated water-surface elevation and streamflow time series at the Starved Rock Lock and Dam also indicated that the observed and simulated values were similar (fig. 7B, D). The calibrated Starved Rock pool water-surface elevations resulted in an MAE of 0.06 ft and RMSE of 0.08 ft and the NSE value of calibrated total outflows was 0.99 (table 3). Comparison of observed and simulated values during the 2020 validation period also indicated close agreement in the time series because the MAE and RMSE values of pool water-surface elevations were 0.10 ft and 0.13 ft, respectively, and the NSE metric of observed and simulated total streamflows was 0.99 (table 3).
The calibration of the water-surface elevations at remaining nonlock and dam locations including the USGS streamgage at Marseilles, the USACE streamgage Illinois River at Ottawa, and the USGS streamgage on the Fox River at Dayton (fig. 1) involved modifying the channel friction parameter (Manning’s n) and branch slopes to match the simulated to observed time series. The calibration and validation results at these locations also indicated close agreement between observed and simulated values (fig 8). Model performance metrics for the calibration of water-surface elevation indicated MAE ranged from 0.20 ft at the Illinois River at Ottawa to 0.34 ft at the USGS Marseilles streamgage (table 3). The RMSE values ranged from 0.26 ft at the Illinois River at Ottawa to 0.45 ft at the USGS Marseilles streamgage. Performance metrics during the validation period at the three sites were similar to the metrics measured during the calibration period, with a maximum mean difference in water-surface elevations of 0.58 ft (RMSE) at the USGS streamgage at Marseilles (table 3).
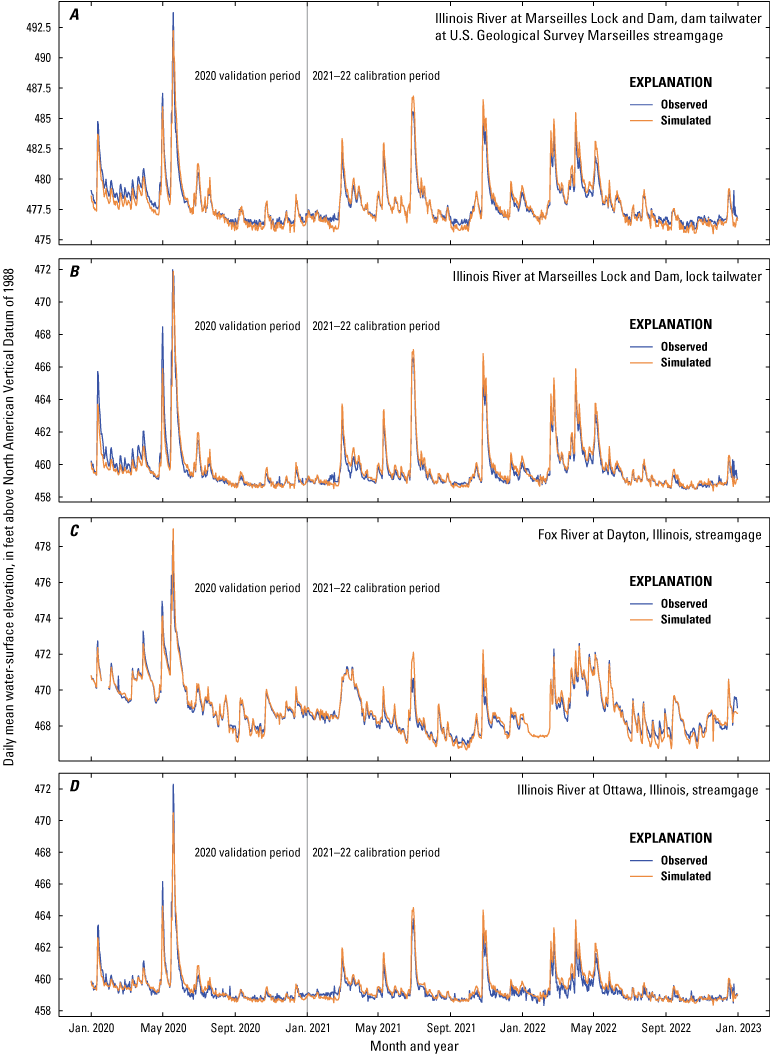
Calibration and validation of continuous water-surface elevations at nonlock and dam streamgages. A, Daily mean water-surface elevations at Illinois River at Marseilles Lock and Dam, dam tailwater at U.S. Geological Survey Marseilles streamgage. B, Daily mean water-surface elevations at Illinois River at Marseilles Lock and Dam, lock tailwater. C, Daily mean water-surface elevations at Fox River at Dayton, Illinois streamgage. D, Daily mean water-surface elevations at Illinois River at Ottawa, Illinois, streamgage. Data from U.S. Geological Survey (2022a, b) and U.S. Army Corps of Engineers (2022).
Calibration of Instantaneous Streamflow Measurement Data
Streamflow measurement data collected near the USGS streamgages at Marseilles and Dayton provided the opportunity to compare observed point-location streamflow, velocities, and channel areas at the measurement locations to simulated values. Seventeen streamflow measurements were made near each of the Marseilles and Dayton streamgages during the January 1, 2020, through December 31, 2022, calibration and validation periods. Corresponding simulated streamflow, velocities, and model channel area at the nearest segment face at the time of the streamflow measurements were used for comparison.
Streamflow
Calibration results from the comparisons of observed data from 13 streamflow measurements made between January 1, 2021, and December 31, 2022, at the USGS Marseilles streamgage indicated simulated values of streamflow were about 9.22 percent of observed values (table 4). Similar comparisons from four measurements during the 2020 validation period indicated average streamflow differences of 2.41 percent. It is of note that the exact location of streamflow measurement transects can vary and the comparisons were made between the location of most measurements and the simulated conditions at the nearest model segment face.
Table 4.
Summary of calibration and validation of simulated and measured streamflow, velocities, and channel areas at the Illinois River at Marseilles, Illinois (U.S. Geological Survey station 05543500), streamgage.[ft3/s, cubic foot per second; ft/s, foot per second; ft2, square foot]
Similar comparisons of 12 streamflow measurements at the Fox River at Dayton also indicated reasonable point-specific model performance. The mean of the differences between simulated and observed streamflows was about 6.36 percent (table 5). Similar comparisons for five measurements during the 2020 validation period indicated the average difference between simulated and observed streamflows was 4.82 percent.
Table 5.
Summary of calibration and validation of simulated and measured streamflow, velocities, and channel areas at the Fox River at Dayton, Illinois (U.S. Geological Survey station 05552500), streamgage.[ft3/s, cubic foot per second; ft/s, foot per second; ft2, square foot]
Velocities
Mean observed velocities at streamflow measurement locations at the USGS streamgages at the Illinois River at Marseilles and the Fox River at Dayton were compared to simulated flow-weighted mean velocities at the nearest segment face. Adjustments made to minimize differences included modifying channel slope and channel Manning’s n values. Calibration results from 13 comparisons of observed and simulated discrete streamflow measurements at the USGS Marseilles streamgage indicated a mean difference of about 16.1 percent between simulated values and observed values (table 4). Similar comparisons from four measurements during the 2020 validation period indicated average differences in velocity of 8.28 percent.
Similar comparisons of 12 streamflow measurements with simulated conditions during the calibration and validation periods at the Fox River at Dayton also indicated reasonable model performance—with a mean difference of about 7.87 percent of observed values (table 5). Similar comparisons for five measurements during the 2020 validation period indicated average velocity differences of 8.63 percent.
Wetted Channel Area
The calculated wetted-channel from the discrete streamflow measurements at the Marseilles and Dayton streamgages were compared to model simulated wetted channel areas at the measurement location and date. Calibration of the channel area involved making small changes to the width of the original comparison model segment or dividing the segment and making modifications to a part of the original segment. Results from 13 streamflow measurements at the USGS Marseilles streamgage indicated channel areas had a mean difference of about 6.64 percent of observed values (table 4). Similar comparisons from four streamflow measurements at higher streamflows during the 2020 validation period indicated channel area differences of 10.8 percent.
Comparisons from 12 streamflow measurements at the Fox River at Dayton in 2021–22 also indicated reasonable site-specific model performance—with a mean difference of about 6.23 percent of observed values (table 5). Comparisons for five measurements during the 2020 validation period indicated average channel area differences of 17.1 percent. Much of the differences in channel area during the validation period can be attributed to the May 20, 2020, flood measurement in which area was underpredicted. The streamflow conditions during the validation period fell outside the upper range of those during the calibration period. Again, some differences between observed and simulated values can be expected because of differences between the measurement and model comparison locations. Overall, the calibration and validation results indicate that the model is capable of accurately (generally within 10 percent) simulating selected hydrodynamic characteristics at specific locations within the study reach and at discrete points in time.
Water-Temperature Calibration
Model parameters used in the calibration of water temperature included coefficients used in the computation of surface heat exchange and evaporation (primarily coefficient AFW), a wind sheltering coefficient (WSC), hydraulic coefficients controlling the temperature of sediments, a sediment heat absorbance coefficient, and eddy viscosity and eddy diffusivity coefficients. Output parameters included 15-minute time series of water temperature for each vertical layer of a segment at the downstream segment boundary.
Temperature calibration was done using observed near-surface continuous time-series data at the Marseilles Lock and Dam pool and at the Starved Rock Lock and Dam pool. Discrete vertical profile temperatures also were collected in the summer of 2022 at several Illinois River main-stem locations within the study reach. A comparison of daily mean temperature values at the Marseilles and Starved Rock Lock and Dam pool locations during the 2021–22 calibration period indicated close agreement spatially and temporally within the study reach (fig. 9A, B). A comparison of simulated and observed near-surface-water temperatures at the Marseilles Lock and Dam pool indicated a MAE and RMSE of less than 0.22 °Celsius (°C) with an NSE of 0.99 (table 6) indicating excellent model performance. The model performance during the 2020 validation period indicated MAE and RMSE values of less than 0.24 °C and an NSE of 0.99. Similarly, the simulated water temperatures at the Starved Rock Lock and Dam pool during the calibration and validation period had MAE and RMSE values of less than or equal to 0.61 °C and NSE values of 0.99 (table 6).
Table 6.
Summary of model calibration and validation of continuous surface-water-temperature results at selected streamgage monitoring locations.[Station location is shown in figure 1. °C, degree Celsius; Ill., Illinois]
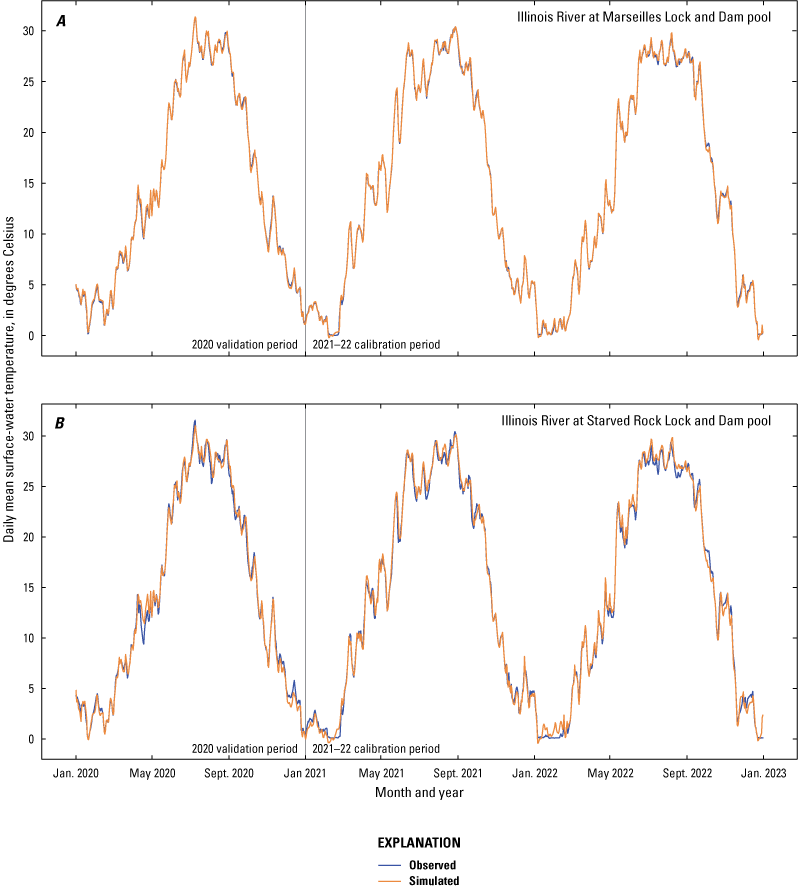
Comparison of observed and simulated continuous water temperatures in the Illinois River study reach for 2020–22. A, Water temperature at the Illinois River at Marseilles Lock and Dam pool; B, Water temperature at the Illinois River at Starved Rock Lock and Dam pool. Data from U.S. Army Corps of Engineers (2022) and U.S. Geological Survey (2022d).
Discrete water temperature vertical profiles were collected at three locations from May 22, 2022, through July 15, 2022 (fig. 10). The overall MAE and RMSE values of the profile comparisons were less than 1 °C (0.59 °C and 0.70 °C, respectively), indicating that the model also closely represented temperature conditions with depth. A minor thermal gradient was present in the observed profiles and captured in the simulated time series at the downstream main-stem sampling locations near the Starved Rock Lock and Dam pool (segments 71 and 90; refer to fig. 6 for location) in late June and July profiles.
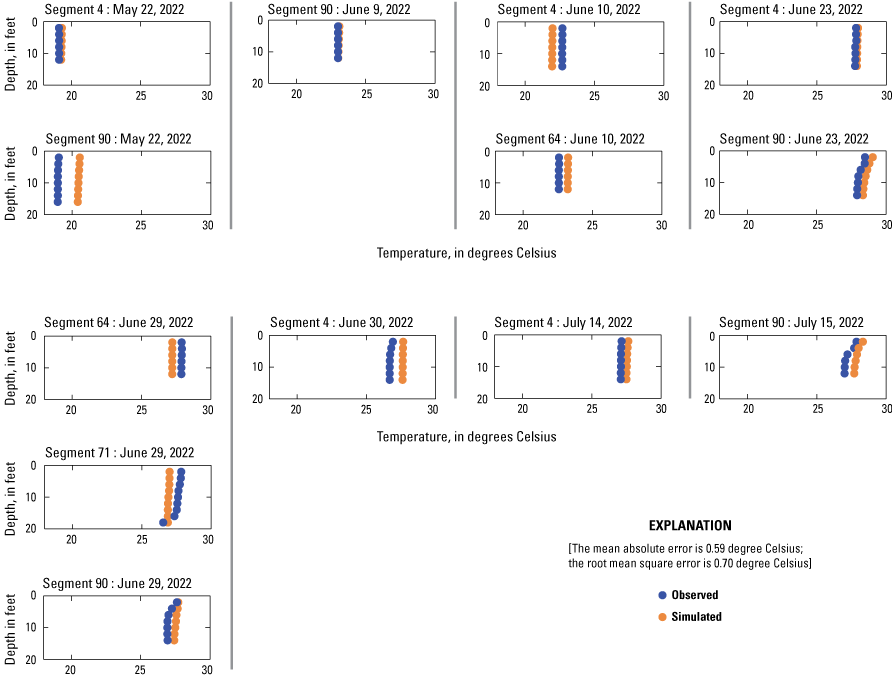
Comparison of observed and simulated water-temperature profiles in the Illinois River study reach for 2022. Data from Ament and Heimann (2024).
Sensitivity Analyses of Temperature Simulations
To determine the relative effects of changes in input time series and selected model parameters on simulated water temperatures, eight additional model scenarios were run and the resulting changes in water temperature were quantified. The sensitivity analysis runs were done for the period of January 1, 2021, through December 31, 2021, and results are presented for the Starved Rock Lock and Dam pool at the end of the study reach. The base model input time series was changed as follows:
-
1. Flows at the upstream model boundaries (Illinois River at Seneca and Fox River at Dayton) were increased by 15 percent;
-
2. Flows at the upstream model boundaries (Illinois River at Seneca and Fox River at Dayton) were decreased by 15 percent;
-
3. Monthly mean air temperatures were increased by the projected change in monthly air temperatures under RCP 4.5 2075 future conditions (table 7), which resulted in a nearly 15-percent change in temperature during summer months;
-
4. Monthly air temperatures were decreased by the projected change in monthly air temperatures under RCP 4.5 2075 future conditions (table 7), which resulted in a nearly 15-percent change in temperature during summer months;
-
5. Model parameter AFW controlling heat exchange at the surface was increased by 15 percent;
-
6. Model parameter AFW controlling heat exchange at the surface was decreased by 15 percent;
-
7. Model parameter WSC controlling wind sheltering was increased by a target of 15 percent; and
-
8. Model parameter WSC controlling wind sheltering was decreased by a target of 15 percent.
Table 7.
Long-term monthly mean and projected monthly change in air temperatures for Ottawa, Illinois, under representative concentration pathway of 4.5 megawatts per square meter in year 2075.[°C, degree Celsius]
Results indicated that the model was most sensitive (greatest quantitative effect on simulated water temperature) to the defined increases and decreases in air temperature followed by increases and decreases in streamflow, parameter AFW, and parameter WSC (table 8). Although the monthly change in air temperature in nonsummer months may exceed 15 percent, the temperature changes in the summer months were about 15 percent. This 15-percent change was then used as the basis for the comparable 15-percent change in the other time series and parameters included in the sensitivity analyses. The month with the greatest effects from the simulated changes in projected air temperature, wind sheltering, and surface heat exchange parameters was September, with a simulated increase of 2.38 °C under future RCP 4.5 2075 conditions, a decline of 0.30 °C with the 15-percent increase in parameter AFW, and a decline of 0.12 °C with the 12-percent increase in WSC (the model became unstable with a 15-percent target increase in WSC and a 12-percent increase was used). The months with the greatest effects from a 15-percent change in streamflows were June and December. A 15-percent increase in streamflow resulted in a decline in water temperature of 0.10 °C in June and an increase in water temperature of 0.09 °C in December. A 15-percent reduction in streamflow resulted in a 0.12 °C increase in water temperature in June and a 0.12 °C decline in December. The months that responded the least to the change in air temperature, streamflows, and the parameters WSC and AFW were February and March with resulting absolute changes in water temperature of 0.01 to 0.50 °C, respectively.
Table 8.
Summary of model sensitivity analyses.[AFW+15, scenario in which the heat exchange parameter (AFW) was increased by 15 percent; WSC+12, scenario in which the wind shelter coefficient (WSC) was increased by 12 percent; RCP 4.5, 2075, scenario representing monthly change in monthly air temperature resulting from projected representative of concentration pathway 4.5 megawatts per square meter in year 2075; AFW−15, scenario in which the AFW was decreased by 15 percent; WSC−15, scenario in which the WSC was decreased by 15 percent]
Simulation of Illinois River Hydrodynamics and Temperatures
Using the observed and simulated hydrodynamic conditions in the Illinois River study reach made it possible to compare streamflow, velocity, and temperature conditions in years with varying distributions of HABs. Extensive HABs in the study reach were documented in June 2020 and June 2021, but a small HAB was restricted to the Marseilles Lock and Dam pool in the summer of 2022. The objective was to find similarities in site conditions between 2020 and 2021 that may contrast with the conditions in 2022.
Streamflow Characteristics
Notable streamflow characteristics leading up to and associated with the occurrence of HABs could be substantial spring runoff events that can transport nutrients into the system from agriculture and urban sources followed by a dry period and declining flows that allow nutrients to be retained in the system. In addition to the role of nutrient delivery and transport, streamflows also are a key component of heat transfer and a conveyer of phytoplankton communities. Of the 3 years of analysis, the streamflow characteristics of May to July of 2021 and May to July of 2022 were the most similar and contrasted with the higher flow conditions of May to July of 2020. Agricultural field preparation and fertilizer application in the study area generally occurs in spring (April–May generally are peak months; Illinois Department of Agriculture, 2023; fig. 11) and fall (October–December). Fertilizer application quantity and timing were similar among study years (fig. 11), but the quantity of post application precipitation was less in June 2022 than in 2020 and 2021. Although the timing and rates of fertilizer application may vary along with timing and magnitude of precipitation and resulting runoff (fig. 12), there also were consistent sources of nutrients into the study reach from upstream urban areas (Peake and Hodson, 2022). Streamflows in late June for all 3 analysis years were relatively stable and less than 10,000 ft3/s on the Illinois River in the Marseilles reach and less than 2,000 ft3/s on the lower Fox River (fig. 12).
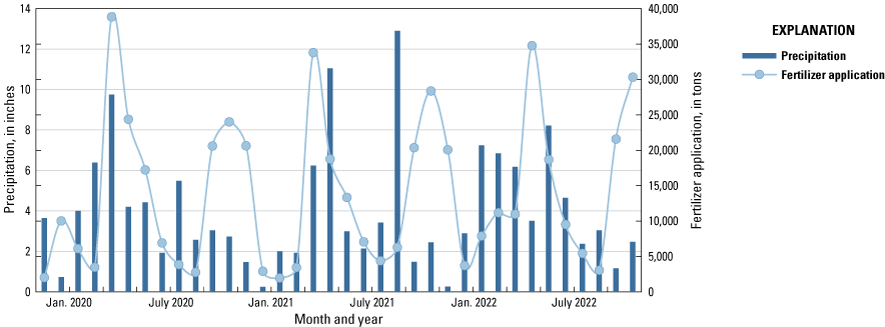
Monthly fertilizer application (Illinois Department of Agriculture, 2023) and precipitation (National Centers for Environmental Information, 2023b) in LaSalle County, Illinois, during January 2020 through December 2022.
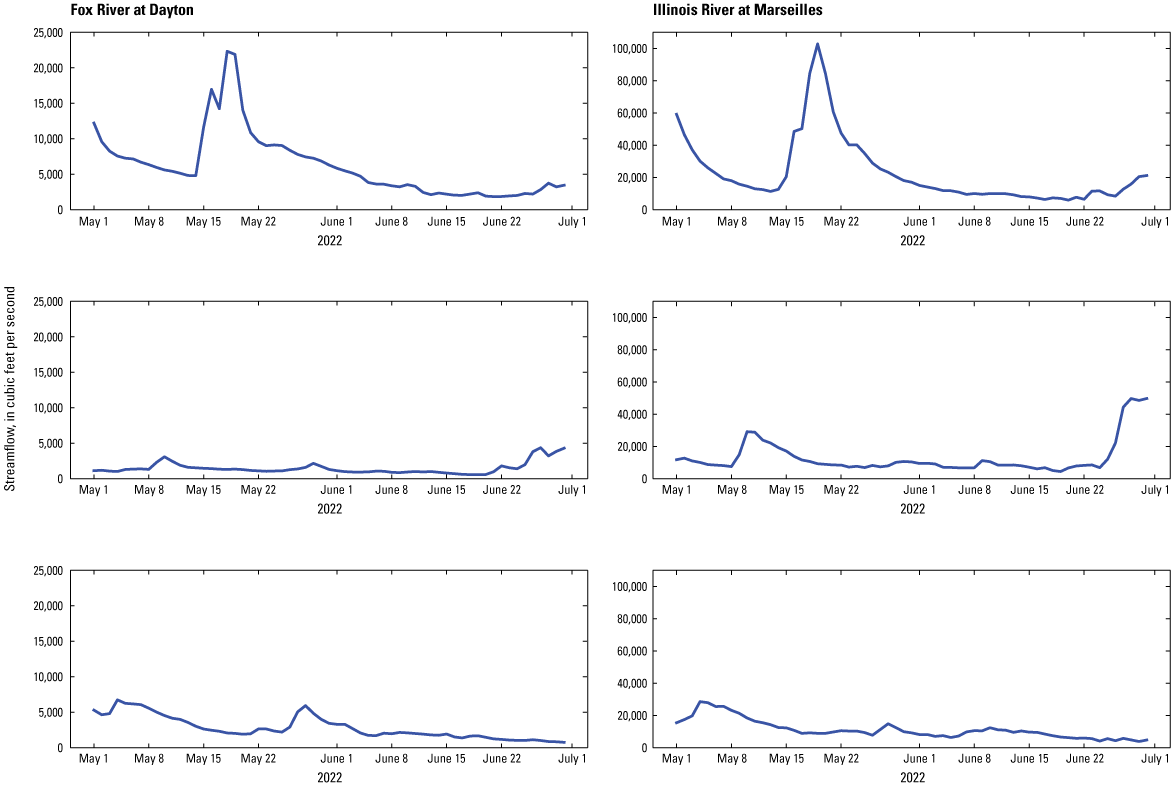
Comparison of May and June observed daily streamflows in 2020, 2021, and 2022 at the Fox River at Dayton, Illinois (U.S. Geological Survey station 05552500), and Illinois River at Marseilles, Illinois (U.S. Geological Survey station 05543500), streamgages. Data from U.S. Geological Survey (2022a, b).
Water Velocities
Simulated flow-weighted velocities were compared at segments representing selected geomorphic channel features of the Illinois River study reach at different longitudinal locations along the reach; the channel features were the main stem, side channel (segments fed by main stem that feed back into a main stem segment), and backwater areas (segments fed by main stem or side-channel segments but “dead end” and do not feed back into the main stem or side channel). The results of simulated water velocities were compared from each of five longitudinal groupings of segments representing the three geomorphic channel features (figs. 13–15). As expected, simulated velocities decreased substantially between the main channel, side channel, and backwater features, but there were no substantial differences between velocities in common areas between years. Mean velocities in the main channel segments in each year generally were between 1 and 2 feet per second (ft/s). Side-channel velocities generally were between 0 and 1 ft/s, whereas velocities in the backwater areas generally were within +0.1 and −0.1 ft/s and never exceeded 1 ft/s.
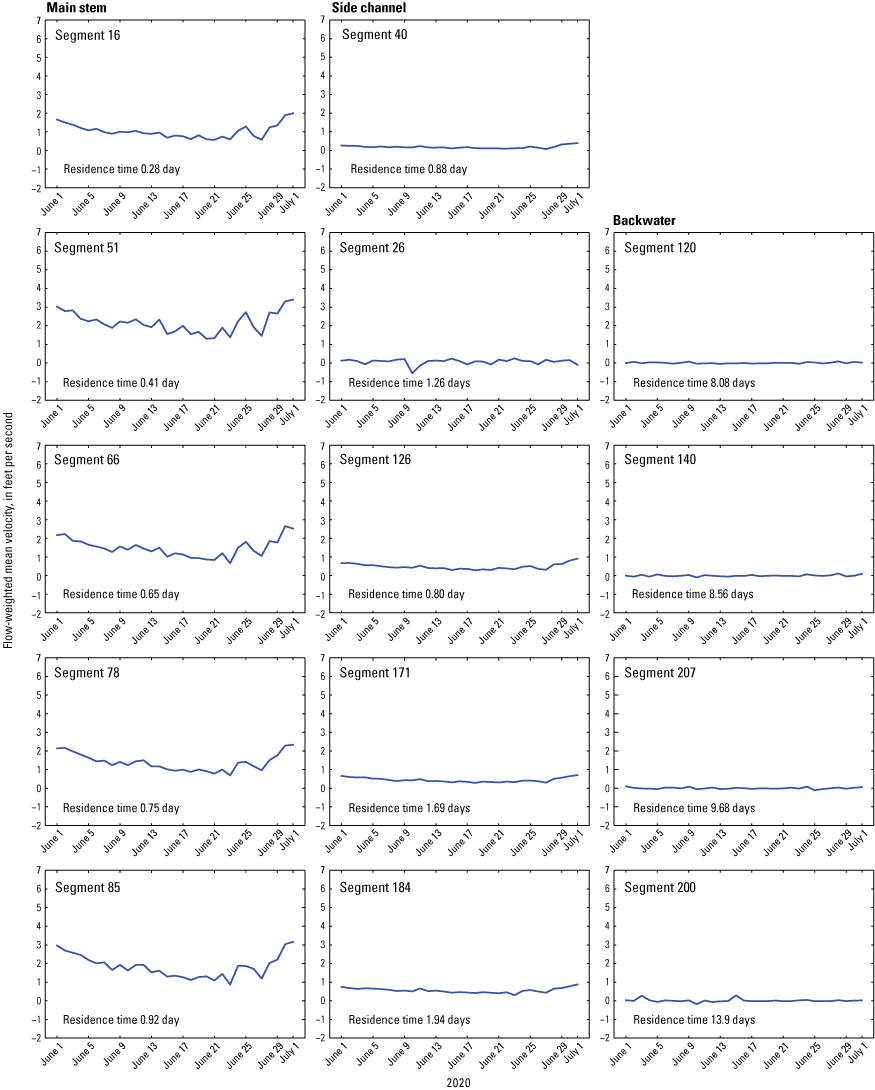
Simulated daily mean velocities and residence times for June 2020 in selected model segments representing different Illinois River channel features (refer to figure 6 for segment locations).
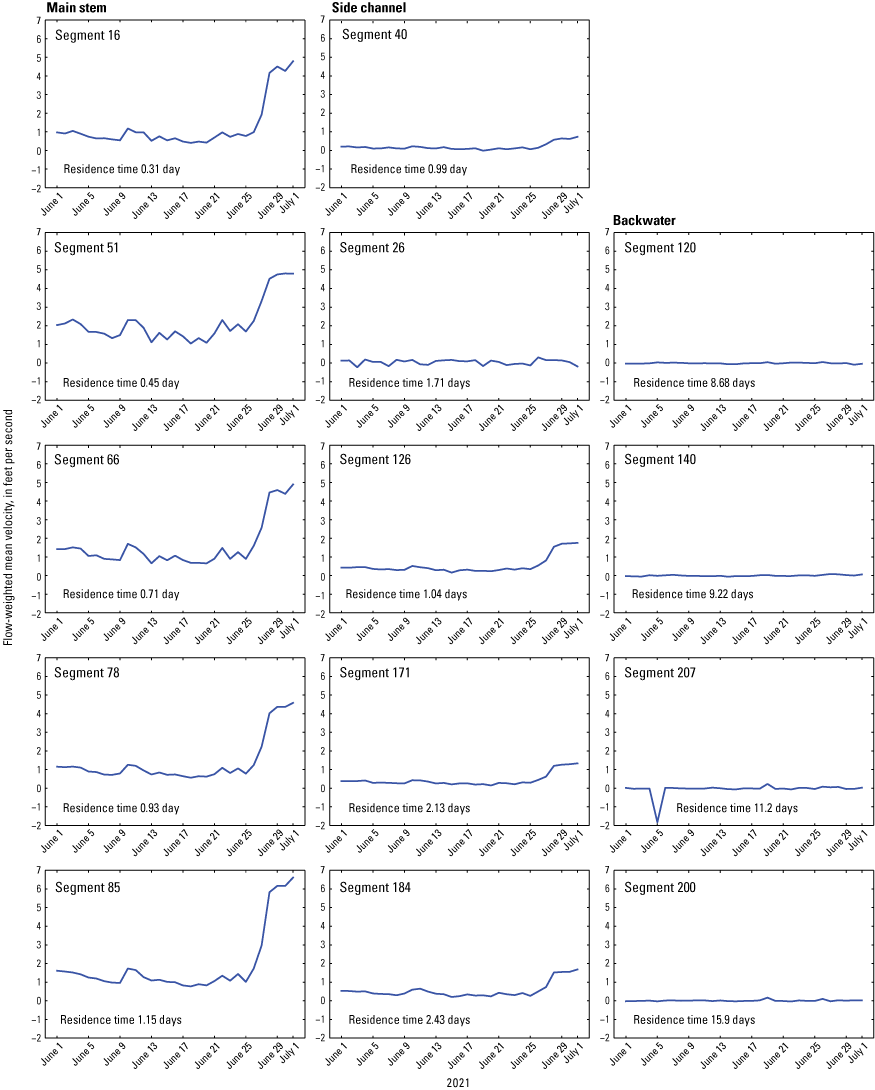
Simulated daily mean velocities and residence times for June 2021 in selected model segments representing different Illinois River channel features (refer to figure 6 for segment locations).
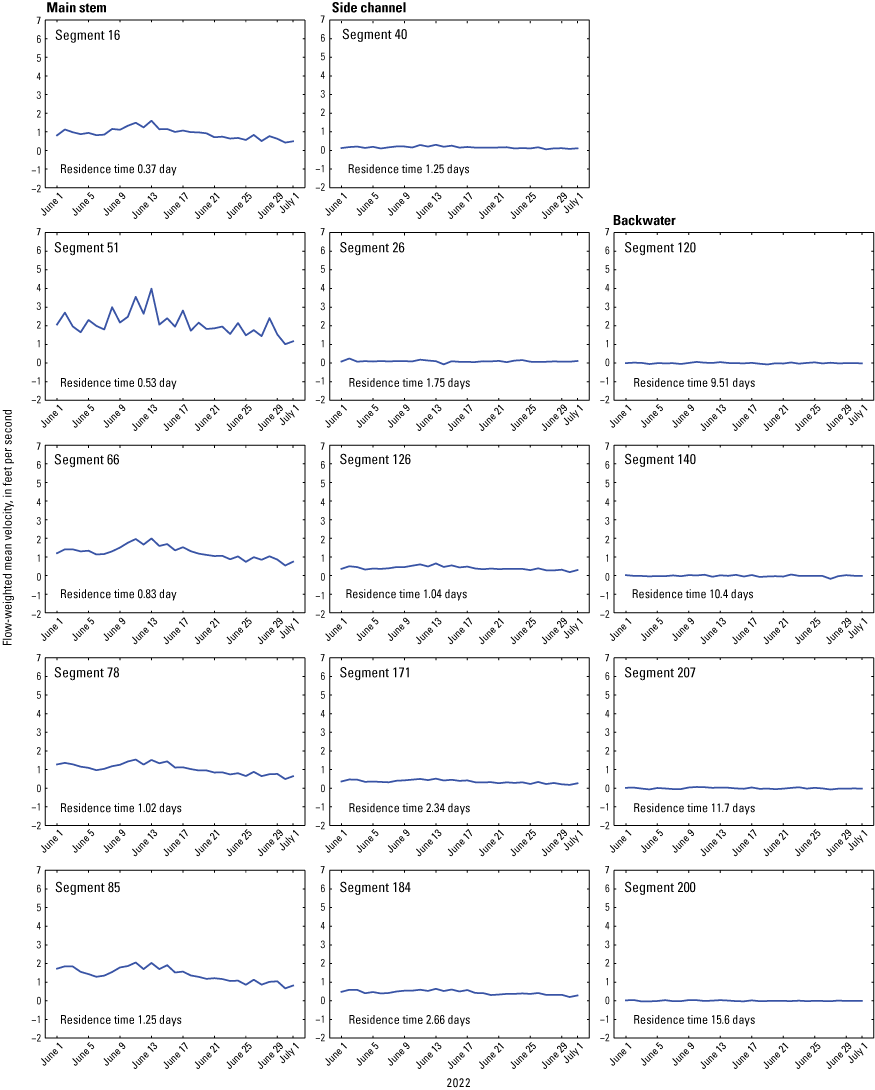
Simulated daily mean velocities and residence times for June 2022 in selected model segments representing different Illinois River channel features (refer to figure 6 for segment locations).
Residence Times
The model-computed residence times during the June 2020, June 2021, and June 2022 analysis periods at the selected comparison segments reflect the differences in velocity and segment water volume exchange characteristics (figs. 13–15). Residence times were normalized to a 500-m common segment length. Two gradients in residence times were apparent from the simulation results. There was a substantial lateral difference in residence time in segments between channel features as values ranged from 0.28 to 17.3 days per 500 m of channel. Residence times also generally increased longitudinally from upstream to downstream within common channel features; for example, residence times within the selected main stem segments increased 330 percent in 2021 (fig. 14) from upstream from the Marseilles Lock and Dam to the upper Starved Rock Lock and Dam pool. These gradients in residence time reflect the effects of differences in velocities, segment volumes, water temperature, and the operation of the lock and dams. The relatively high residence times of segment 26 (refer to fig. 6 for locations) among side-channel segments, for example, are a result of its location within the Marseilles Lock. Variation in average June residence times also was greater among channel features than among years in the study period (fig. 16). Average simulated residence times in June 2022 were 5–38 percent higher than in June 2020 and June 2021—periods of extensive HABs—depending on the channel feature and year of comparison. The results quantify the substantial differences and complexities of water movement among channel features in the study reach.
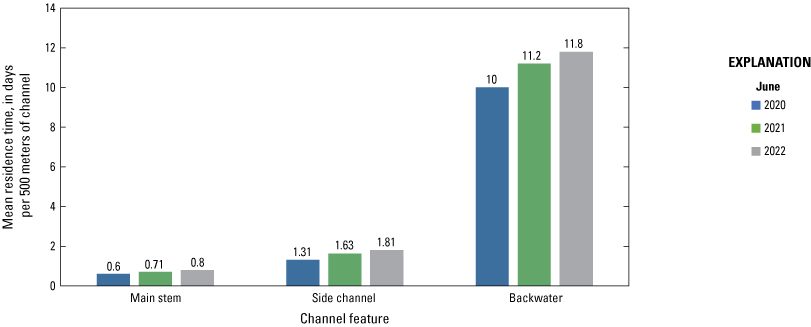
Simulated mean residence times by Illinois River channel feature June 2020, 2021, and 2022.
Water Temperatures
Simulated daily water temperature profiles also were compared at the five selected longitudinal locations along the Illinois River for June 2020, June 2021, and June 2022, and variability among years was greatest for this physical characteristic (figs. 17–19). For all years, there was a sharp contrast in water temperatures between the beginning of June and the mid- to late-June periods with increases in water temperature from about 20 to 28 °C or higher. This contrast was most evident in June 2021 in which water temperatures of near 20 °C transitioned into an extended period of water temperatures of greater than 26 °C in under a week (fig. 18), corresponding to the formation of the HAB that year. The weakest contrast in temperatures was in the June 2022 simulated period (fig. 19). The period of water temperatures greater than 27 °C in June 2020 was relatively short compared to similar periods in 2021 and 2022 (fig. 17), but this relatively short period of warm water temperatures coincided with the HAB that year (Illinois Environmental Protection Agency, 2023). The longest period of temperatures greater than 27 °C in the selected segments in the 3-year analysis period was in the second half of June 2022, yet only a localized HAB was documented that year. There were multiple short cooling periods (near 20 °C) in the first half of June 2022, and shortly after water temperatures approached 26–28 °C; at midmonth another cooling period broke up the possible extended warm water-temperature period. This cooling period varied in duration and intensity depending on channel feature and longitudinal location but was most prevalent in the segments downstream from segments 51, 28, and 120 (fig. 19) and the Marseilles Dam (refer to fig. 6 for locations). This could account, in part, for the lack of an extensive HAB in 2022 as the cooling water temperatures were most pronounced downstream from the Marseilles Lock and Dam pool where a HAB was documented that year. It is possible that the cooling period altered the development of and composition of the algal community and limited the spread of the bloom. Warm water temperatures exceeding 27 °C, however, were again present throughout the main stem and side-channel areas from June 21, 2022, through the remainder of the month.
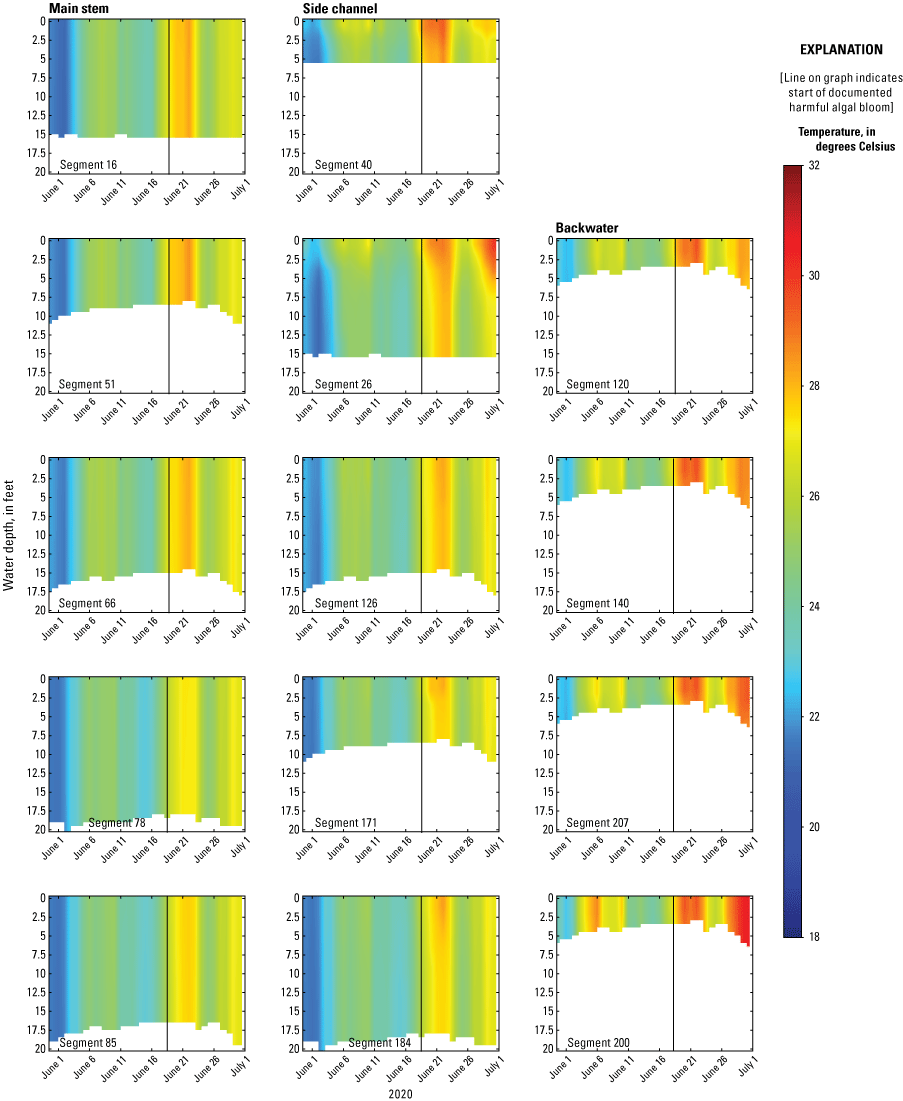
Simulated daily temperature profiles for June 2020 at selected model segments representing different Illinois River channel features.
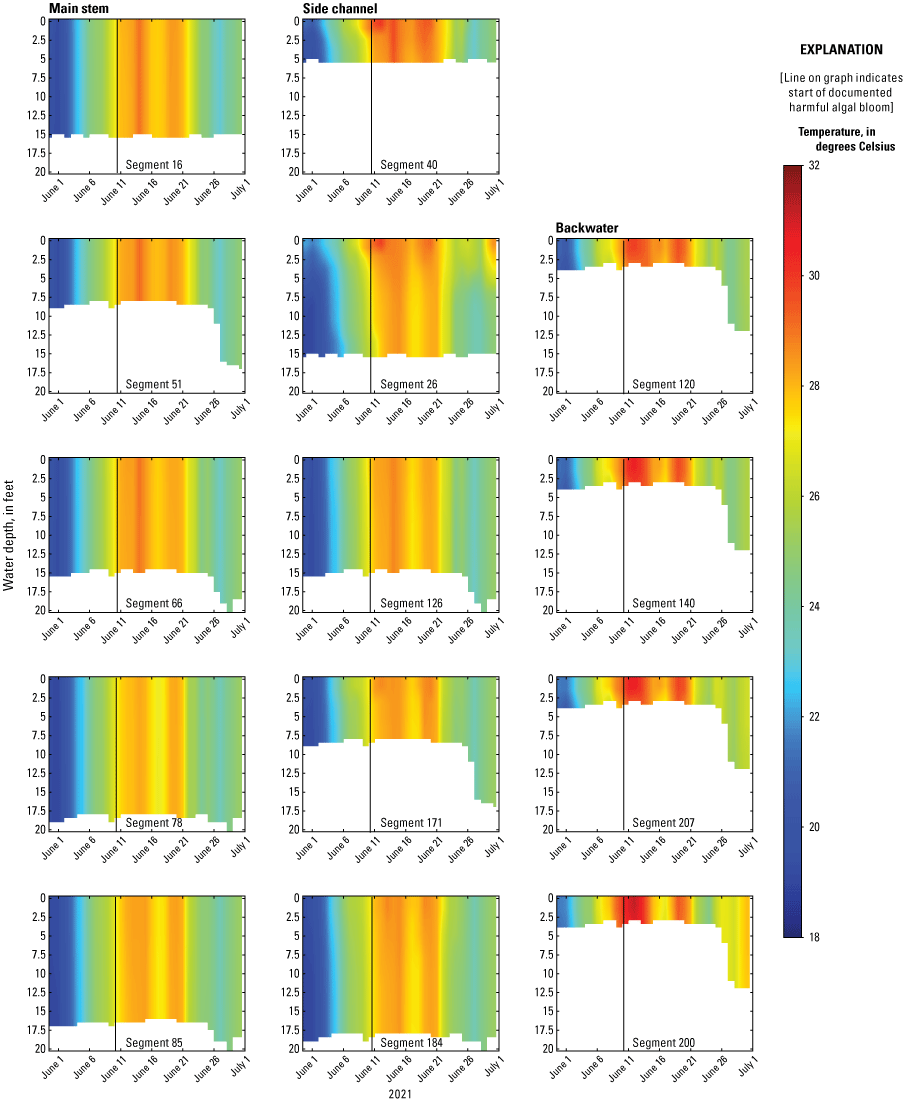
Simulated daily temperature profiles for June 2021 at selected model segments representing different Illinois River channel features.
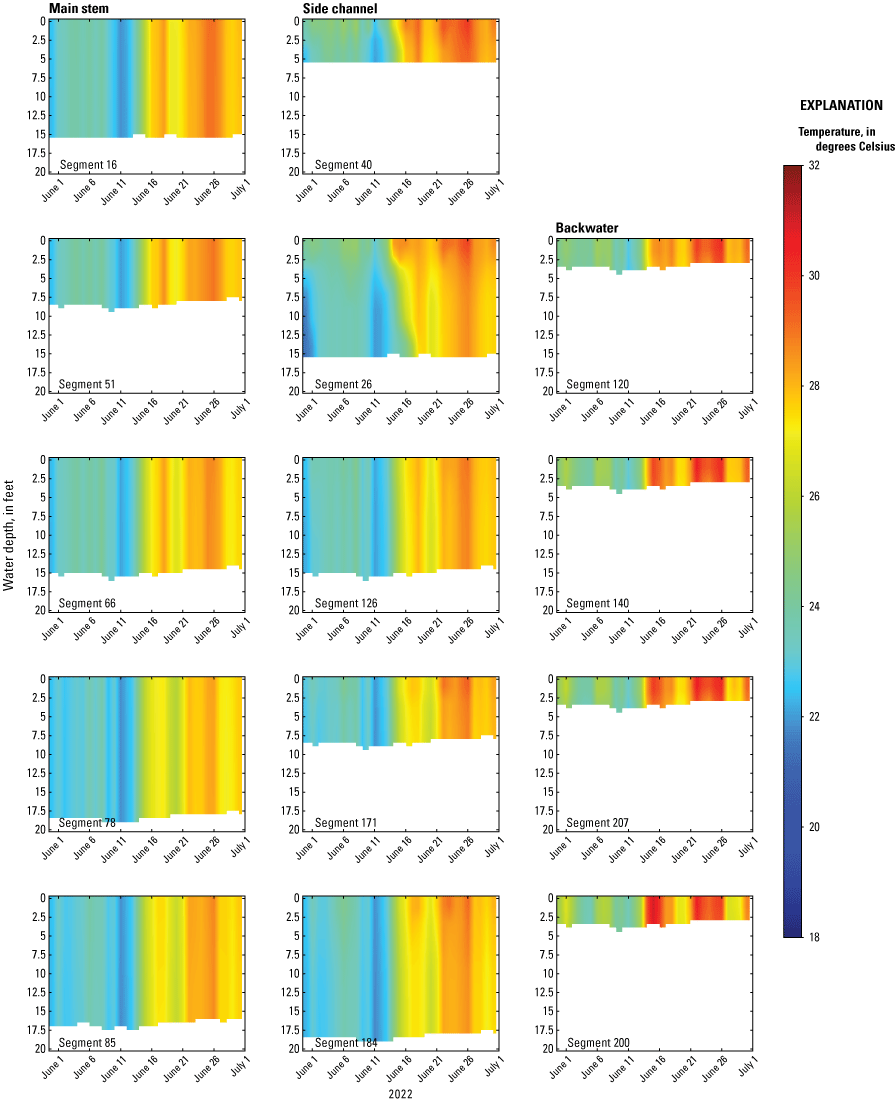
Simulated daily temperature profiles for June 2022 at selected model segments representing different Illinois River channel features.
The timing of the water-temperature changes among the lateral transect segments generally was consistent between geomorphic channel areas and between years, but side channels and particularly backwater areas did exhibit greater variability in timing compared to corresponding main-stem segments. Examples of greater variability include the temperature increases in the side-channel segments 40 and 26 between June 6–11, 2020, and similar temperature increases in backwater segments 140, 207, and 200 from June 5 through June 10, 2020, compared to the corresponding homogenous main channel segments. Simulated temperatures generally were uniform with depth in this relatively shallow system, with exceptions at some side-channel and backwater segments (for example refer to segments 40 and 26 in mid-June 2020, 2021, and 2022 in figs. 17–19). The results also demonstrate that some consistent spatial and longitudinal patterns in temperature magnitude are likely within and among years. There generally is a consistent lateral increase in temperature magnitude from main stem to backwater areas for a specified day; however, the longitudinal gradients vary by geomorphic channel feature. The selected side channels indicate a gradient in water temperature from downstream (lower) to upstream (higher) whereas the selected backwater segments indicate the opposite with an upstream (lower) to downstream (higher) gradient. The lateral and longitudinal temperature gradients can be attributed, in part, to differences in water depths and residence times.
The earlier warm water temperatures in backwater areas compared to the main stem could provide the opportunity for these areas to serve as algal community “nurseries” for the main stem, but the residence times in these backwater areas likely exceed the temperature lag times between the backwater and main stem. The documented HABs in 2020 and 2021 at Starved Rock Dam occurred during temperatures of about 26 °C and backwater areas at some locations did attain these temperatures 2–3 days before the conditions in the main stem. Residence times in the backwater areas, however, generally exceeded 9 days, thus limiting the exchange of water with potentially higher algal biomass into the main channel. Overall, the model results indicated that CE-QUAL-W2 captures the variability in water temperatures along with the highly variable hydrodynamics that provide a complex array of habitat conditions associated with algal community dynamics and the formation of HABs.
Model Uncertainty and Limitations
A primary factor contributing to CE-QUAL-W2 model uncertainty and limitations is that the discretized model geometry, using a series of segments and layers to represent the Illinois River system does not completely capture all water and temperature dynamics in this complex system. The Illinois River, for example, has a nonuniform channel geometry characterized by a deeper main navigation channel, and a wide, shallower side channel in places that could be combined within some segments. This nonuniformity in geometry is challenging to capture in the model. The assumed lateral averaging of the model, therefore, may have limitations in some model segments. In addition, channel bathymetry surveys from 1999 to 2017 were used to represent current (2020 through 2022) conditions, and some changes in channel geometry could be expected. Temperature and velocity calibration data were limited in space and time, and although comparisons of observed and simulated values indicated close agreement, there is some uncertainty with simulated values outside of the observed locations and times. Although the availability of required model time-series data for this reach is plentiful and exceeds that of most river systems, there were some time series were estimated (Fox River boundary condition temperatures) that can result in added uncertainty.
Despite the given model limitations and uncertainties, the calibration and validation process objective is to confirm model performance and representation of observed conditions. In this way, confidence can be established in terms of relative changes and absolute values generated from the modeling effort.
A limitation of this study was that the focus was on the development and application of the CE-QUAL-W2 model on system hydrodynamics and the potential correlation of selected simulated physical factors and the occurrence of HABs. Many other contributing factors were not included and considered, including nutrients dynamics, that may better explain the location, timing, and magnitude of HABs in the upper Illinois River.
Summary
This report describes the development of a CE-QUAL-W2 river hydrodynamics and temperature model of a 21-mile (mi) reach of the Illinois River including a 3-mi reach of the Fox River, a major tributary. The model was developed using CE-QUAL-W2, a two-dimensional laterally averaged hydrodynamic and water-quality model for rivers, lakes, and estuaries. The model was calibrated to observed water-surface elevation, streamflow, velocity, channel area, and temperature data for the period January 1, 2021, through December 31, 2022, and model performance was validated for January 1 through December 31, 2020.
Hydrodynamic model calibration involved adjusting model parameters until observed and simulated daily water-surface elevations, daily streamflows, discrete velocities, and channel area were similar. Temperature calibration was done with near-surface continuous time-series data and discrete vertical profile temperatures. Observed and simulated water temperatures generally were within 1 degree Celsius (°C).
To determine the sensitivity of the modeled water temperatures to changes in input time series and selected model parameters, additional model scenarios were run modifying streamflows, projected changes in air temperatures, and selected model parameters. Results indicated that the model was most sensitive to increases and decreases in air temperature followed by changes in streamflow, a heat exchange parameter, and a wind sheltering parameter. The month with the greatest effects from the simulated changes in projected air temperature was September with a simulated increase of 2.38 °C under future (2075) conditions. The months with the greatest effects from a 15-percent change in streamflow were June and December, but changes were minor and within 0.12 °C. The months with the least change in water temperatures in response to the changes in air temperature, streamflows, and the wind sheltering and heat exchange parameters were February and March, with resulting changes in water temperature of 0.01 to 0.50 °C.
Using the observed and simulated hydrodynamic conditions in the study reach, it was possible to compare streamflow, velocity, and temperature conditions in years with widely distributed (2020, 2021) and only localized (2022) occurrences of harmful algal blooms (HABs). Streamflows in late June (month of recent HAB occurrences) for all three analysis years were relatively stable in the study reach and less than 10,000 cubic feet per second on the Illinois River and less than 2,000 cubic feet per second on the lower Fox River.
Simulated flow-weighted velocities were compared at segments representing selected geomorphic channel features—the main stem, side channel, and backwater areas—of the Illinois River study reach at different longitudinal locations along the reach. As expected, simulated velocities decreased substantially between the main channel, side channel, and backwater features, but differences between velocities were not substantial in common areas between years. Mean velocities in the main channel segments in each year generally were between 1 and 2 feet per second (ft/s). Side-channel velocities generally were between 0 and 1 ft/s, whereas velocities in the backwater areas generally were within +0.1 and −0.1 ft/s and never exceeded 1 ft/s.
The model-computed residence times during the June 2020–22 analysis periods at the selected comparison segments reflect the differences in velocity and segment water volume exchange characteristics. There was a substantial lateral difference in residence time in segments between channel features; values ranged from 0.28 to 17.3 days per 500 meters of channel between the main stem and backwater areas. Residence times also generally increased longitudinally from upstream to downstream within common channel features. These gradients in resident time reflect the effects of differences in velocities, segment volumes, and the likely effects of the operation of the Starved Rock Lock and Dam at the downstream end of the study reach. Variation in average June residence times was greater among channel features than among years.
Simulated daily water-temperature profiles also were compared at the five selected transect locations along the Illinois River for June 2020, June 2021, and June 2022, and variability among years was greatest for this physical characteristic. The period of water temperatures greater than 27 °C in June 2020 was relatively short in comparison to similar periods in 2021 and 2022, but this relatively short period of warm water temperatures coincided with the HAB that year. The longest period of temperatures greater than 27 °C in the selected segments in the 3-year analysis period was in the second half of June 2022, yet no study-area wide HAB was documented that year. After warm water temperatures were established in the reach in June 2022, a cooling period broke up the extended warming period, particularly in some of the backwater segments. The cooling period was greater in magnitude and duration downstream from the Marseilles Lock and Dam pool where a localized HAB was documented that year, perhaps limiting the spread of the HAB. The timing of the temperature changes among the lateral transect segments generally was consistent between geomorphic channel areas and between years, but side channels and particularly backwater areas did demonstrate greater dynamics in timing compared to corresponding main stem segments.
The documented HABs in 2020 and 2021 at Starved Rock Dam occurred during a period of water temperatures of about 26 °C, and backwater areas at some locations did attain these temperatures 2–3 days before the conditions in the main stem. Residence times in the backwater areas, however, generally exceeded 9 days, thus limiting the exchange of water carrying algal biomass into the main channel. Overall, the model results indicated that CE-QUAL-W2 captures the variability in water temperatures along with the highly variable hydrodynamics that provide a complex array of habitat conditions for the development of algal communities and HABs.
References Cited
Ament, M.R., and Heimann, D.C., 2024, Hydrodynamic and water-temperature model of a 21-mile reach of the upper Illinois River, Illinois (ver. 1.1, October 2024): U.S. Geological Survey data release, https://doi.org/10.5066/P9BV9EG2.
Bernstein, Y., 2019, QGIS-CEQUALW2-bath: GitHub software release, accessed February 19, 2021, at https://github.com/WQDSS/qgis-cequalw2-bath.
Dewitz, J., and U.S. Geological Survey, 2021, National Land Cover Database (NLCD) 2019 products (ver. 2.0, June 2021): U.S. Geological Survey data release, accessed August 5, 2021, at https://doi.org/10.5066/P9KZCM54.
Healy, R.W., 1979, River mileages and drainage areas for Illinois streams –Volume 2, Illinois River Basin: U.S. Geological Survey Water-Resources Investigations Report 79-111, 283 p. [Also available at https://pubs.usgs.gov/wri/1979/0111/wrir79_111.pdf.]
Illinois Department of Agriculture, 2023, Fertilizer Program: Illinois Department of Agriculture web page, accessed August 5, 2023, at https://agr.illinois.gov/plants/fertilizer.html.
Illinois Environmental Protection Agency, 2023, Harmful Algal Bloom (HAB) Dashboard: IEPA web page, accessed January 10, 2023, at https://illinois-epa.maps.arcgis.com/apps/dashboards/e916019b725e4acca7d666e760b74b5f.
Iowa State University, 2023, Iowa Environmental Mesonet ASOS Network: Iowa State University web page, accessed February 7, 2023, at https://mesonet.agron.iastate.edu/request/download.phtml?network=IL_ASOS.
Moriasi, D.N., Gitau, M.W., Pai, N., and Daggupati, P., 2015, Hydrologic and water quality models: Performance measures and evaluation criteria: Transactions of the American Society of Agricultural and Biological Engineers, vol. 58, no. 6, p. 1763–1785. [Also available at https://doi.org/10.13031/trans.58.10715.]
Nash, J.E., and Sutcliffe, J.V., 1970, River flow forecasting through conceptual models part 1—A discussion of principles: Journal of Hydrology, v. 10, no. 3, p. 282–290. [Also available at https://doi.org/10.1016/0022-1694(70)90255-6.]
National Centers for Environmental Information, 2023a, Global Historical Climatology Network-Daily (GHCN-Daily), version 3: National Centers for Environmental Information web page, accessed February 10, 2023, at https://www.ncei.noaa.gov/access/search/data-search/daily-summaries.
National Centers for Environmental Information, 2023b, U.S. monthly climate normals (1980–2010): National Centers for Environmental Information web page, accessed July 12, 2023, at https://www.ncei.noaa.gov/cdo-web/search?datasetid=NORMAL_MLY.
Peake, C.S., and Hodson, T.O., 2022, Continuous monitoring of nutrient and sediment loads from the Des Plaines River at Route 53 at Joliet, Illinois, water years 2018–20 (ver. 1.1, February 2022): U.S. Geological Survey Scientific Investigations Report 2021–5125, 15 p., accessed August 29, 2023, at https://doi.org/10.3133/sir20215125.
QGIS Development Team, 2021, QGIS Geographic Information System: Open Source Geospatial Foundation web page, accessed February 19, 2021, at https://qgis.org/.
Summers, K.M., Krempa, H.M., and Garrett, J.D., 2022, Central Midwest Water Science Center—Harmful Algal Blooms Team: U.S. Geological Survey, Fact Sheet 2022–3011, 4 p. [Also available at https://doi.org/10.3133/fs20223011.]
Terrio, P.J., Straub, T.D., Domanski, M.M., and Siudyla, N.A., 2015, Continuous monitoring of sediment and nutrients in the Illinois River at Florence, Illinois, 2012–13: U.S. Geological Survey Scientific Investigations Report 2015–5040, 61 p. [Also available at https://doi.org/10.3133/sir20155040.]
U.S. Army Corps of Engineers [USACE], 2022, River gages: USACE web page, accessed March 13, 2022, at https://rivergages.mvr.usace.army.mil/WaterControl/new/layout.cfm.
U.S. Environmental Protection Agency [EPA], 2013, Impacts of climate change on the occurrence of harmful algal blooms: EPA 820–S–13–001, 3 p., accessed August 21, 2023, at https://www.epa.gov/sites/default/files/documents/climatehabs.pdf.
U.S. Environmental Protection Agency, 2022a, EPA drinking water health advisories for cyanotoxins: EPA web page, accessed April 22, 2022, at https://www.epa.gov/cyanohabs/epa-drinking-water-health-advisories-cyanotoxins.
U.S. Environmental Protection Agency, 2022b, Impaired waters and TMDLs in Region 5: EPA web page, accessed March 3, 2022, at https://www.epa.gov/tmdl/impaired-waters-and-tmdls-region-5.
U.S. Federal Government, 2023, U.S. Climate Resilience Toolkit Climate Explorer: National Environmental Modeling and Analysis Center digital data, accessed March 3, 2023 at https://crt-climate-explorer.nemac.org.
U.S. Geological Survey [USGS], 2021a, 3DEP LidarExplorer: U.S. Geological Survey digital data, accessed January 4, 2021, at https://apps.nationalmap.gov/lidar-explorer/#/.
U.S. Geological Survey [USGS], 2021b, USGS surface-water data for the Nation, in USGS water data for the Nation: U.S. Geological Survey National Water Information System database, accessed January 3, 2021, at https://doi.org/10.5066/F7P55KJN. [Surface-water data directly accessible at https://waterdata.usgs.gov/nwis/sw.]
U.S. Geological Survey [USGS], 2022a, Fox River at Dayton, IL—05552500, in USGS water data for the Nation: U.S. Geological Survey National Water Information System database, accessed March 2, 2022, at https://doi.org/10.5066/F7P55KJN. [Site information directly accessible at https://waterdata.usgs.gov/monitoring-location/05552500/#parameterCode=00065&period=P7D.]
U.S. Geological Survey [USGS], 2022b, Illinois River at Marseilles, IL—05543500, in USGS water data for the Nation: U.S. Geological Survey National Water Information System database, accessed March 3, 2022, at https://doi.org/10.5066/F7P55KJN. [Site information directly accessible at https://waterdata.usgs.gov/monitoring-location/05543500/#parameterCode=00065&period=P7D.]
U.S. Geological Survey [USGS], 2022c, Illinois River at Seneca, IL—05543010, in USGS water data for the Nation: U.S. Geological Survey National Water Information System database, accessed March 4, 2022, at https://doi.org/10.5066/F7P55KJN. [Site information directly accessible at https://waterdata.usgs.gov/monitoring-location/05543010/#parameterCode=00065&period=P7D.]
U.S. Geological Survey [USGS], 2022d, Illinois River at Starved Rock, IL—05553700, in USGS water data for the Nation: U.S. Geological Survey National Water Information System database, accessed March 4, 2022, at https://doi.org/10.5066/F7P55KJN. [Site information directly accessible at https://waterdata.usgs.gov/monitoring-location/05553700/#parameterCode=00010&timeSeriesId=310640&period=P7D.]
vanVuuren, D.P., Edmonds, J., Kainuma, M., Riahi, K., Thomson, A., Hibbard, K., Hurtt, G.C., Kram, T., Krey, V., Lamarque, J., Masui, T., Meinshausen, M., Nakicenovic, N., Smith, S.J., and Rose, S.K., 2011, The representative concentration pathways—An overview: Climatic Change, v. 109, no. 1–2, p. 5–31. [Also available at https://doi.org/10.1007/s10584-011-0148-z.]
Wells, S.A., ed., 2023, CE–QUAL–W2 (version 4.5): Portland State University software release, accessed January 2, 2023, at http://www.ce.pdx.edu/w2/.
Conversion Factors
U.S. customary units to International System of Units
Temperature in degrees Celsius (°C) may be converted to degrees Fahrenheit (°F) as follows:
°F = (1.8 × °C) + 32.
Supplemental Information
A water year is the period from October 1 to September 30 and is designated by the year in which it ends; for example, water year 2020 was from October 1, 2019, to September 30, 2020.
Concentrations of chemical constituents in water are given in micrograms per liter (µg/L).
Abbreviations
AFW
heat exchange parameter
DEM
digital elevation model
EPA
U.S. Environmental Protection Agency
HAB
harmful algal bloom
IEPA
Illinois Environmental Protection Agency
MAE
mean absolute error
NSE
Nash-Sutcliffe efficiency
RCP 4.5
representative concentration pathway with 4.5 megawatts per square meter
RMSE
root mean square error
USACE
U.S. Army Corps of Engineers
USGS
U.S. Geological Survey
WSC
wind sheltering coefficient
∞
infinity
For more information about this publication, contact:
Director, USGS Central Midwest Water Science Center
1400 Independence Road
Rolla, MO 65401
573–308–3667
For additional information, visit: https://www.usgs.gov/centers/cm-water
Publishing support provided by the
Rolla Publishing Service Center
Disclaimers
Any use of trade, firm, or product names is for descriptive purposes only and does not imply endorsement by the U.S. Government.
Although this information product, for the most part, is in the public domain, it also may contain copyrighted materials as noted in the text. Permission to reproduce copyrighted items must be secured from the copyright owner.
Suggested Citation
Ament, M.R., and Heimann, D.C., 2024, Simulation of hydrodynamics and water temperature in a 21-mile reach of the upper Illinois River, Illinois, 2020–22 (ver. 1.1, October 2024): U.S. Geological Survey Scientific Investigations Report 2024–5025, 35 p., https://doi.org/10.3133/sir20245025.
ISSN: 2328-0328 (online)
Study Area
| Publication type | Report |
|---|---|
| Publication Subtype | USGS Numbered Series |
| Title | Simulation of hydrodynamics and water temperature in a 21-mile reach of the upper Illinois River, Illinois, 2020–22 |
| Series title | Scientific Investigations Report |
| Series number | 2024-5025 |
| DOI | 10.3133/sir20245025 |
| Edition | Version 1.0: April 30, 2024; Version 1.1: October 1, 2024 |
| Publication Date | April 30, 2024 |
| Year Published | 2024 |
| Language | English |
| Publisher | U.S. Geological Survey |
| Publisher location | Reston, VA |
| Contributing office(s) | Central Midwest Water Science Center |
| Description | Report: viii, 35 p.; Data Release; Dataset |
| Country | United States |
| State | Illinois |
| Other Geospatial | Upper Illinois River |
| Online Only (Y/N) | Y |
| Additional Online Files (Y/N) | N |