

Accuracy Assessment of Three-Dimensional Point Cloud Data Collected With a Scanning Total Station on Shinnecock Nation Tribal Lands in Suffolk County, New York
Links
- Document: Report (14.4 MB pdf) , HTML , XML
- Figures:
- Figure 2 (3.20 MB) - Map showing the study area where three-dimensional point cloud data were collected with a scanning total station along the western shoreline of the Shinnecock Peninsula in Suffolk County, New York, for a point cloud accuracy assessment
- Figure 3 (3.25 MB) - Map showing estimated position of the shoreline after sea-level rise of about 0.46 meter (m) within the study area on the Shinnecock Nation Tribal lands in Suffolk County, New York, using a conservative model projection for 2050
- Figure 4 (1.76 MB) - Graphical representation of the point cloud of A, the study area in plan view, B, the coastal spit in plan view, and C, the dune adjacent to the Tribal cemetery on the Shinnecock Nation Tribal lands in Suffolk County, New York, in section view in July 2022
- Data Release: USGS data release - Three-dimensional point cloud data collected with a scanning total station on the western shoreline of the Shinnecock Nation Tribal lands, Suffolk County, New York, 2022
- Download citation as: RIS | Dublin Core
Acknowledgments
The authors express sincere thanks and gratitude to the Shinnecock Nation for their partnership and facilitating access to their lands. Special thanks to Shavonne Smith of the Shinnecock Nation Environmental Department for providing logistical support throughout the project. This study was funded by the Federal Emergency Management Agency’s hazard mitigation assistance grant that supports federally recognized Tribes that undertake hazard mitigation projects to reduce risks from disasters and natural hazards. The authors also recognize Brian Collins and Amanda R. Whaling of the U.S. Geological Survey for their technical recommendations.
Abstract
A combined point cloud of about 85.6 million points was collected during 27 scans of a section of the western shoreline along the Shinnecock Peninsula of Suffolk County, New York, to document baseline geospatial conditions during July and October 2022 using a scanning total station. The three-dimensional accuracy of the combined point cloud is assessed to identify potential systematic error sources associated with the surveying equipment and the novel methodology used to collect and field-register (data are oriented and aligned in real time) point cloud data. The accuracy of the combined point cloud was assessed in terms of relative and absolute reference frames. Relative accuracy provides a measure of error within the local coordinate system and is determined by combining the uncertainty associated with the position of the scan station (the point being occupied by the scanning total station during the scan), the uncertainty associated with the position of the network control points, and the uncertainty associated with the laser of the scanning total station. Assessment of the absolute accuracy includes these three potential error sources combined with the uncertainty associated with the geodetic coordinates to which the local control network is referenced. The combined overall relative horizontal and vertical accuracy of the point cloud is 0.0156 and 0.0241 meter, respectively, at the 95 percent confidence level. The combined overall absolute horizontal and vertical accuracy of the point cloud is 0.0598 and 0.0733 meter, respectively, at the 95 percent confidence level.
Introduction
During major coastal storms during the past 10 years (2012–22), erosion of the west-facing shoreline of the Shinnecock Nation Tribal lands—including the beach face, dunes, vegetation, and the coastal spit—on the Shinnecock Peninsula (fig. 1) in Suffolk County on Long Island, New York, has been observed and documented by the Shinnecock Nation Environmental Department (Shavonne Smith, written commun., 2022) and the U.S. Geological Survey (USGS; fig. 2). These shoreline features provide a natural barrier to coastal erosion by attenuating tidal and wave energy and help protect many of the Tribe’s cultural and environmental resources. The Shinnecock Nation Tribal cemetery, about 20 meters (m) from Shinnecock Bay, has also been inundated by coastal floodwaters during major storms. Flooding may become increasingly common because of predicted sea-level rise (Parris and others, 2012) and potential increases in storm frequency and intensity. Assessment of the coastal change from erosional events associated with intense coastal storms and flooding requires the collection of three-dimensional positions of features such as topography, shallow bathymetry, and vegetation over time. These data are often collected via terrestrial (ground)- or aerial-based surveys using a light detection and ranging (lidar) scanner that rapidly collects millions of precisely positioned survey points during a single scan. The points collected during a scan are collectively referred to as a “point cloud.” The combined point cloud refers to all the point cloud data that were collected during the 27 scans of the western shoreline in July and October 2022.
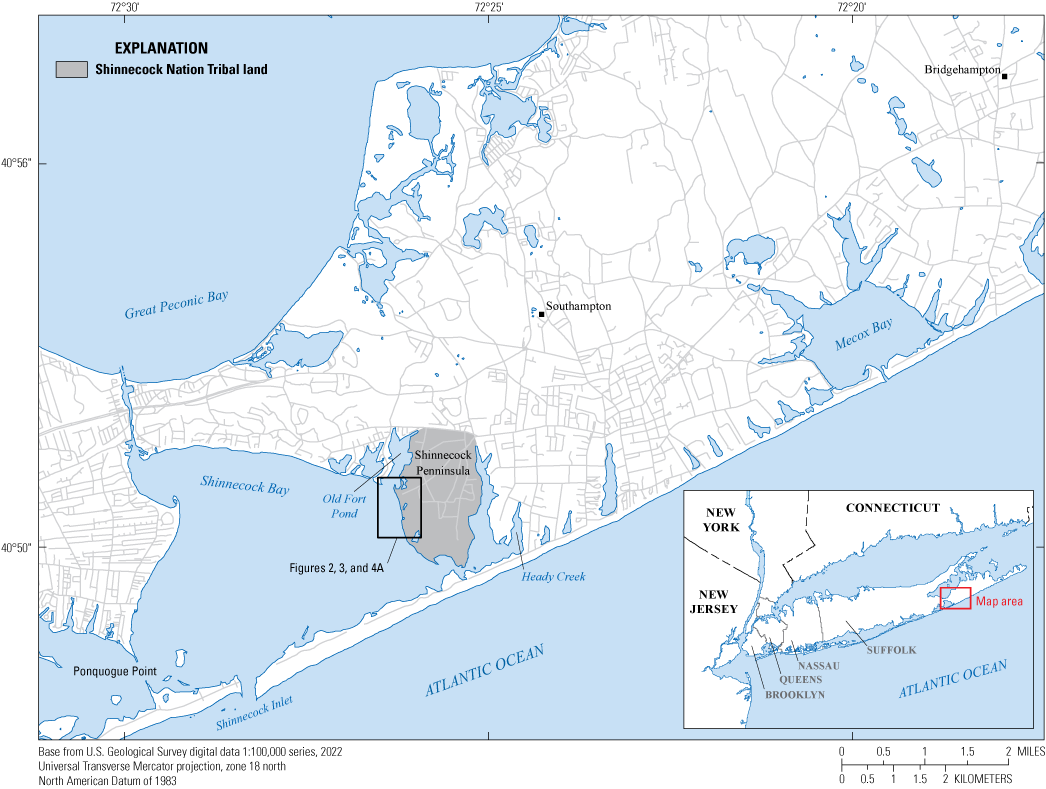
Map showing the location of the Shinnecock Nation Tribal lands in Suffolk County, New York.
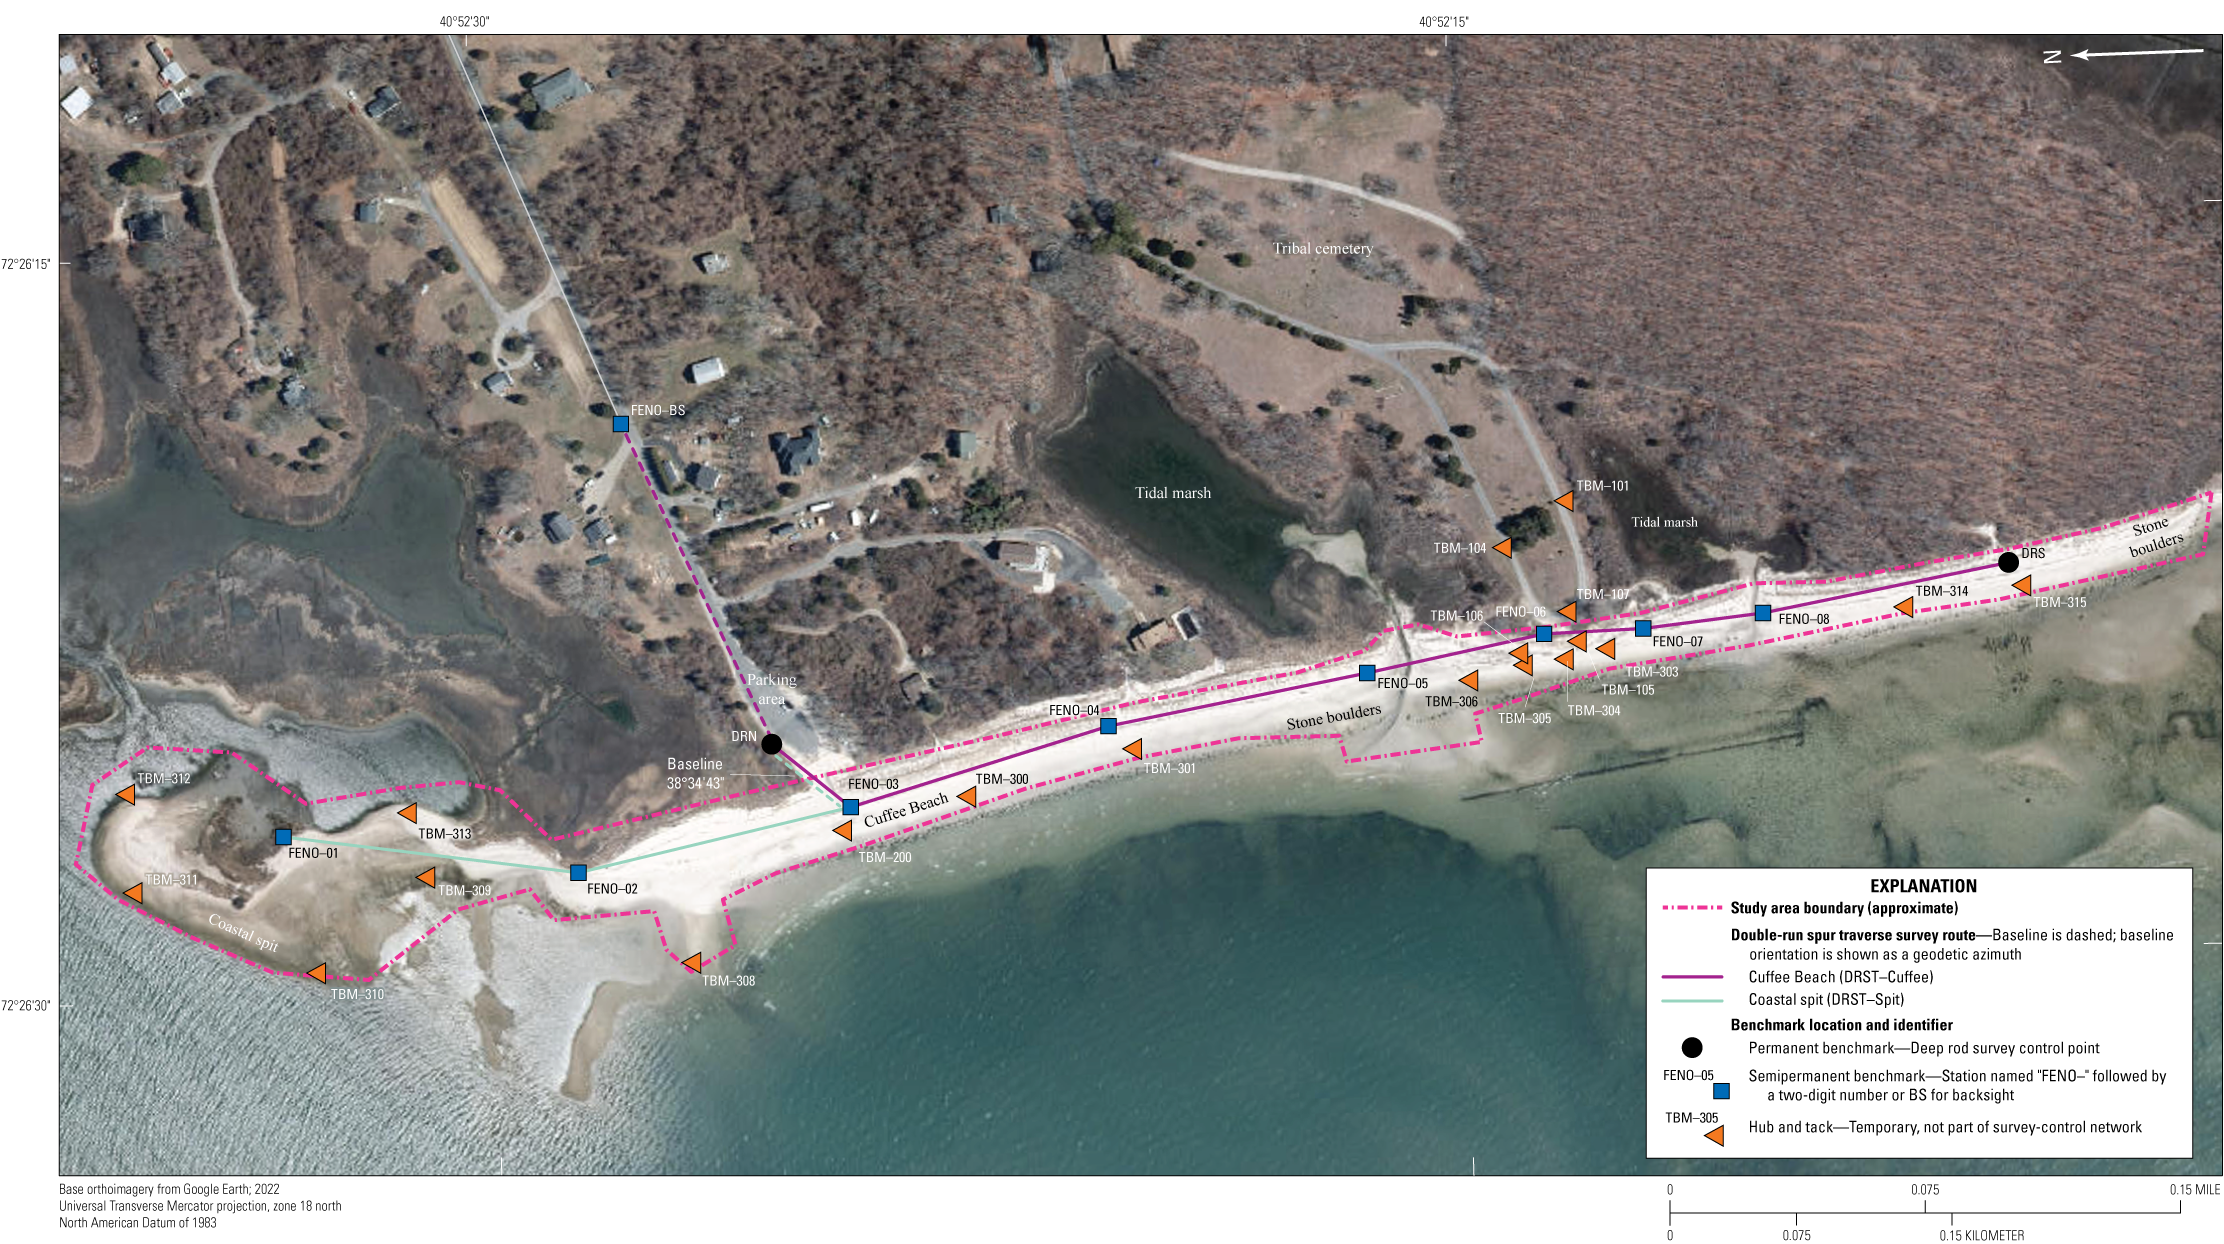
Map showing the study area where three-dimensional point cloud data were collected with a scanning total station along the western shoreline of the Shinnecock Peninsula in Suffolk County, New York, for a point cloud accuracy assessment. Data are from Capurso and others, 2024.
Measurement error is an important consideration in any research study. Identifying the sources of relative and absolute error associated with the point clouds (from baseline and subsequent surveys) is crucial for analytical purposes, such as determining the positional uncertainty (error threshold) of a feature or object within the study area; for temporal comparison of two or more point clouds to precisely determine the positional uncertainty of observed change over time and the error associated with derivative products from the point cloud comparisons, such as area and volume computations—for example, changes in sediment quantity after an erosional or depositional event; and for comparison of the point cloud (by overlaying) on other data products, such as airborne lidar or aerial photographs (Collins and others, 2014).
The west-facing shoreline is a dynamic coastal environment with very little environmental or anthropogenic control, such as buildings, bridges, or other permanent structures, that can be used to orient and align the point clouds during postprocessing (a process known as point cloud registration). For this reason, an integrated total station and laser scanner (scanning total station), which uses previously surveyed points to orient and align point clouds in real time during the survey (field registration), was used to collect point clouds. A network of permanent, semipermanent, and temporary control points was established using a total station and was referenced to a geodetic datum using long-duration, static Global Navigation Satellite System (GNSS) measurements.
Purpose and Scope
The purpose of this investigation was to establish the baseline geospatial conditions of a section of the western shoreline of the Shinnecock Peninsula using the point cloud (and derivative products) from the July and October 2022 surveys, which will be disseminated as a companion dataset (Capurso and others, 2024); determine the components of the overall relative and absolute uncertainty associated with the combined point cloud; and document and describe the potential sources of uncertainty to improve the accuracy of future point clouds collected with the scanning total station.
Study Area Description
The Shinnecock Nation is a federally recognized Algonquin Tribe on the southern fork of eastern Long Island adjacent to the town of Southampton in Suffolk County (fig. 1; Shinnecock Indian Nation, 2022). The Shinnecock Nation lands encompass a peninsula—referred to in this report as the Shinnecock Peninsula—of approximately 3.1 square kilometers, nominally 2.6 kilometers (km) long, and 1.6 km wide at the widest spot (Noll and others, 2016). The Shinnecock Peninsula is south of Montauk Highway and between three interconnected marine water bodies—Heady Creek to the east, Shinnecock Bay to the south and west, and Old Fort Pond to the west. The Shinnecock Inlet is approximately 4.8 km west of the southernmost extent of the peninsula and hydraulically connects Shinnecock Bay to the Atlantic Ocean. The inlet was formed during the Great New England Hurricane of 1938 and is the easternmost of five inlets that cut the discontinuous outer barrier island south of Long Island (U.S. Army Corps of Engineers, 1999). The easternmost segment of the outer barrier island extends east from the Shinnecock Inlet to the village of Southampton and is about 90 m south of the southernmost extent of the Tribal lands across Shinnecock Bay (fig. 1).
Cuffee Beach is along the west-facing shoreline of the Shinnecock Peninsula along Shinnecock Bay (figs. 1 and 2). Historical observations indicate evidence of erosion and potential shoreline retreat: makeshift and formal methods of coastal erosion mitigation have been implemented in certain areas (Shinnecock Indian Nation, 2013). For example, directly south of the Cuffee Beach parking area at the end of Little Beach Road (fig. 2), old oyster cages have been placed to attenuate wave energy from large coastal storms, reduce erosion, and facilitate sand buildup. Just north of Cuffee Beach, there is a dynamic coastal area where an extended spit forms a significant embayment and estuarine habitat area. This dynamic area is susceptible to ongoing transformations due to variations in sediment transport and overtopping, erosion, overwash, and reformation of the coastal spit, which can result in transitions of the ecological features of the area. Changes to the embayment region, such as a loss of the coastal spit, may result in increased wave energy and coastal flooding of the landward areas. It is pertinent to further assess this area to understand future potential changes.
The study area is along the narrow western shoreline of the Shinnecock Peninsula from the spit at the northern extent of the study site along Cuffee Beach to a barrier of stone boulders that truncate the beach about 1 km south of the spit (fig. 2). In general, the eastern extent is a dune that runs roughly parallel to the western shoreline; the western extent is the shoreline of Shinnecock Bay (more specifically, the surf zone or foreshore). The nominal width of the study site from east to west is about 25 m.
The Shinnecock Nation Tribal Cemetery (burial ground) is adjacent to Cuffee Beach in the southern part of the peninsula along the western shoreline. During major coastal storms in the past 10 years (2012–22), flooding of the Tribal cemetery has been observed and documented by the Shinnecock Nation Environmental Department (Shavonne Smith, written commun., 2022). Flooding may become increasingly common because of predicted sea-level rise and potential increases in storm frequency and intensity (Parris and others, 2012). Currently, the west-facing shoreline is protected by a barrier of large (about 1-m diameter) boulders that have been placed approximately parallel to the coastline (fig. 2) and may not provide as much protection as an engineered revetment, constructed oyster reef, or seawall (Shinnecock Indian Nation, 2013). These structures were intended to provide the necessary freeboard and structural stability to attenuate wave energy because they were less likely to be washed out or dislodged by severe storms. Bounding the cemetery to the west is a dune that was reinforced by the Shinnecock Nation with large pieces of concrete and boulders in the 1980s and 1990s (Shavonne Smith, Shinnecock Nation Environmental Department, oral commun., 2023). The cemetery is also bordered on both the north and south by tidal marshes. Each marsh has a degraded drainage pipe that is intended to facilitate drainage of stormwater from the marsh areas (following coastal flooding or a heavy rainstorm) and possibly to allow adequate tidal flushing to and from the marsh area. However, both pipes are damaged, partially buried, and clogged, resulting in poor drainage and limited tidal exchange capacity. Ultimately, this results in increased flooding potential and drainage times in the vicinity of the cemetery and may also result in substandard ecological habitat in the marsh systems.
Following a 2018 ground-penetrating radar survey by the U.S. Department of Agriculture, 152 possible grave sites were detected in the burial grounds; the average grave depth is approximately 0.6 m (U.S. Department of Agriculture, written commun., 2018). The depth of the potential grave sites may become a concern if the shallow water table rises—depth-to-water is about 1 to 2 m beneath the Tribal cemetery (Noll and others, 2016)—in response to predicted sea-level rise. Also, the proximity of some of the potential grave sites to the western shoreline may be an issue if the dune that bounds the cemetery to the west (along Shinnecock Bay) continues to erode.
Cuffee Beach and the Tribal cemetery have been affected by major coastal storms such as Hurricane Sandy in October 2012 and others as recently as December 2022 (during an unnamed winter storm locally referred to as Winter Storm Elliot; Shavonne Smith, Shinnecock Nation Environmental Department, written commun., 2022). During September 2020, a combination of high astronomical tides and swells from Hurricane Teddy in the Atlantic Ocean caused a widespread and long-duration erosional event; substantial dune and beach erosion and moderate coastal flooding was observed and documented in vulnerable coastal locations along the western shoreline of the Shinnecock Peninsula, including Cuffee Beach and the salt marshes that surround the cemetery (Shavonne Smith and Viola Cause, Shinnecock Nation Environmental Department, written commun., 2020). Recent shoreline restoration plantings of native plants and shrubs and barriers to coastal erosion that were installed along Cuffee Beach were also damaged or destroyed during the September 2020 coastal storm. During December 2022, a combination of high astronomical tides and winds out of the south and southwest from Winter Storm Elliot pushed seawater to the northeastern side of Shinnecock Bay, resulting in moderate flooding of the Tribal cemetery and the adjacent salt marshes (Shavonne Smith, Shinnecock Nation Environmental Department, written commun., 2022).
Based on current models, sea level is expected to rise on Tribal lands between 0.64 m (intermediate-low scenario) and 1.34 m (intermediate-high scenario) by 2100 (Parris and others, 2012) along the southern shore of Long Island. Conservative models project a sea-level rise of 0.46 m on the Shinnecock Tribal lands by 2050 (fig. 3; Parris and others, 2012); based on this sea-level rise scenario, more than half of the peninsula—including the Tribal cemetery—may be inundated with flood waters during intense (100-year storm) coastal storms (Shinnecock Indian Nation, 2013). Furthermore, sea-level rise coupled with frequent and intense coastal storms will likely accelerate erosion rates along the western shoreline of the peninsula in vulnerable areas like the coastal spit, Cuffee Beach, and the tidal marshes and dunes surrounding the Tribal cemetery.
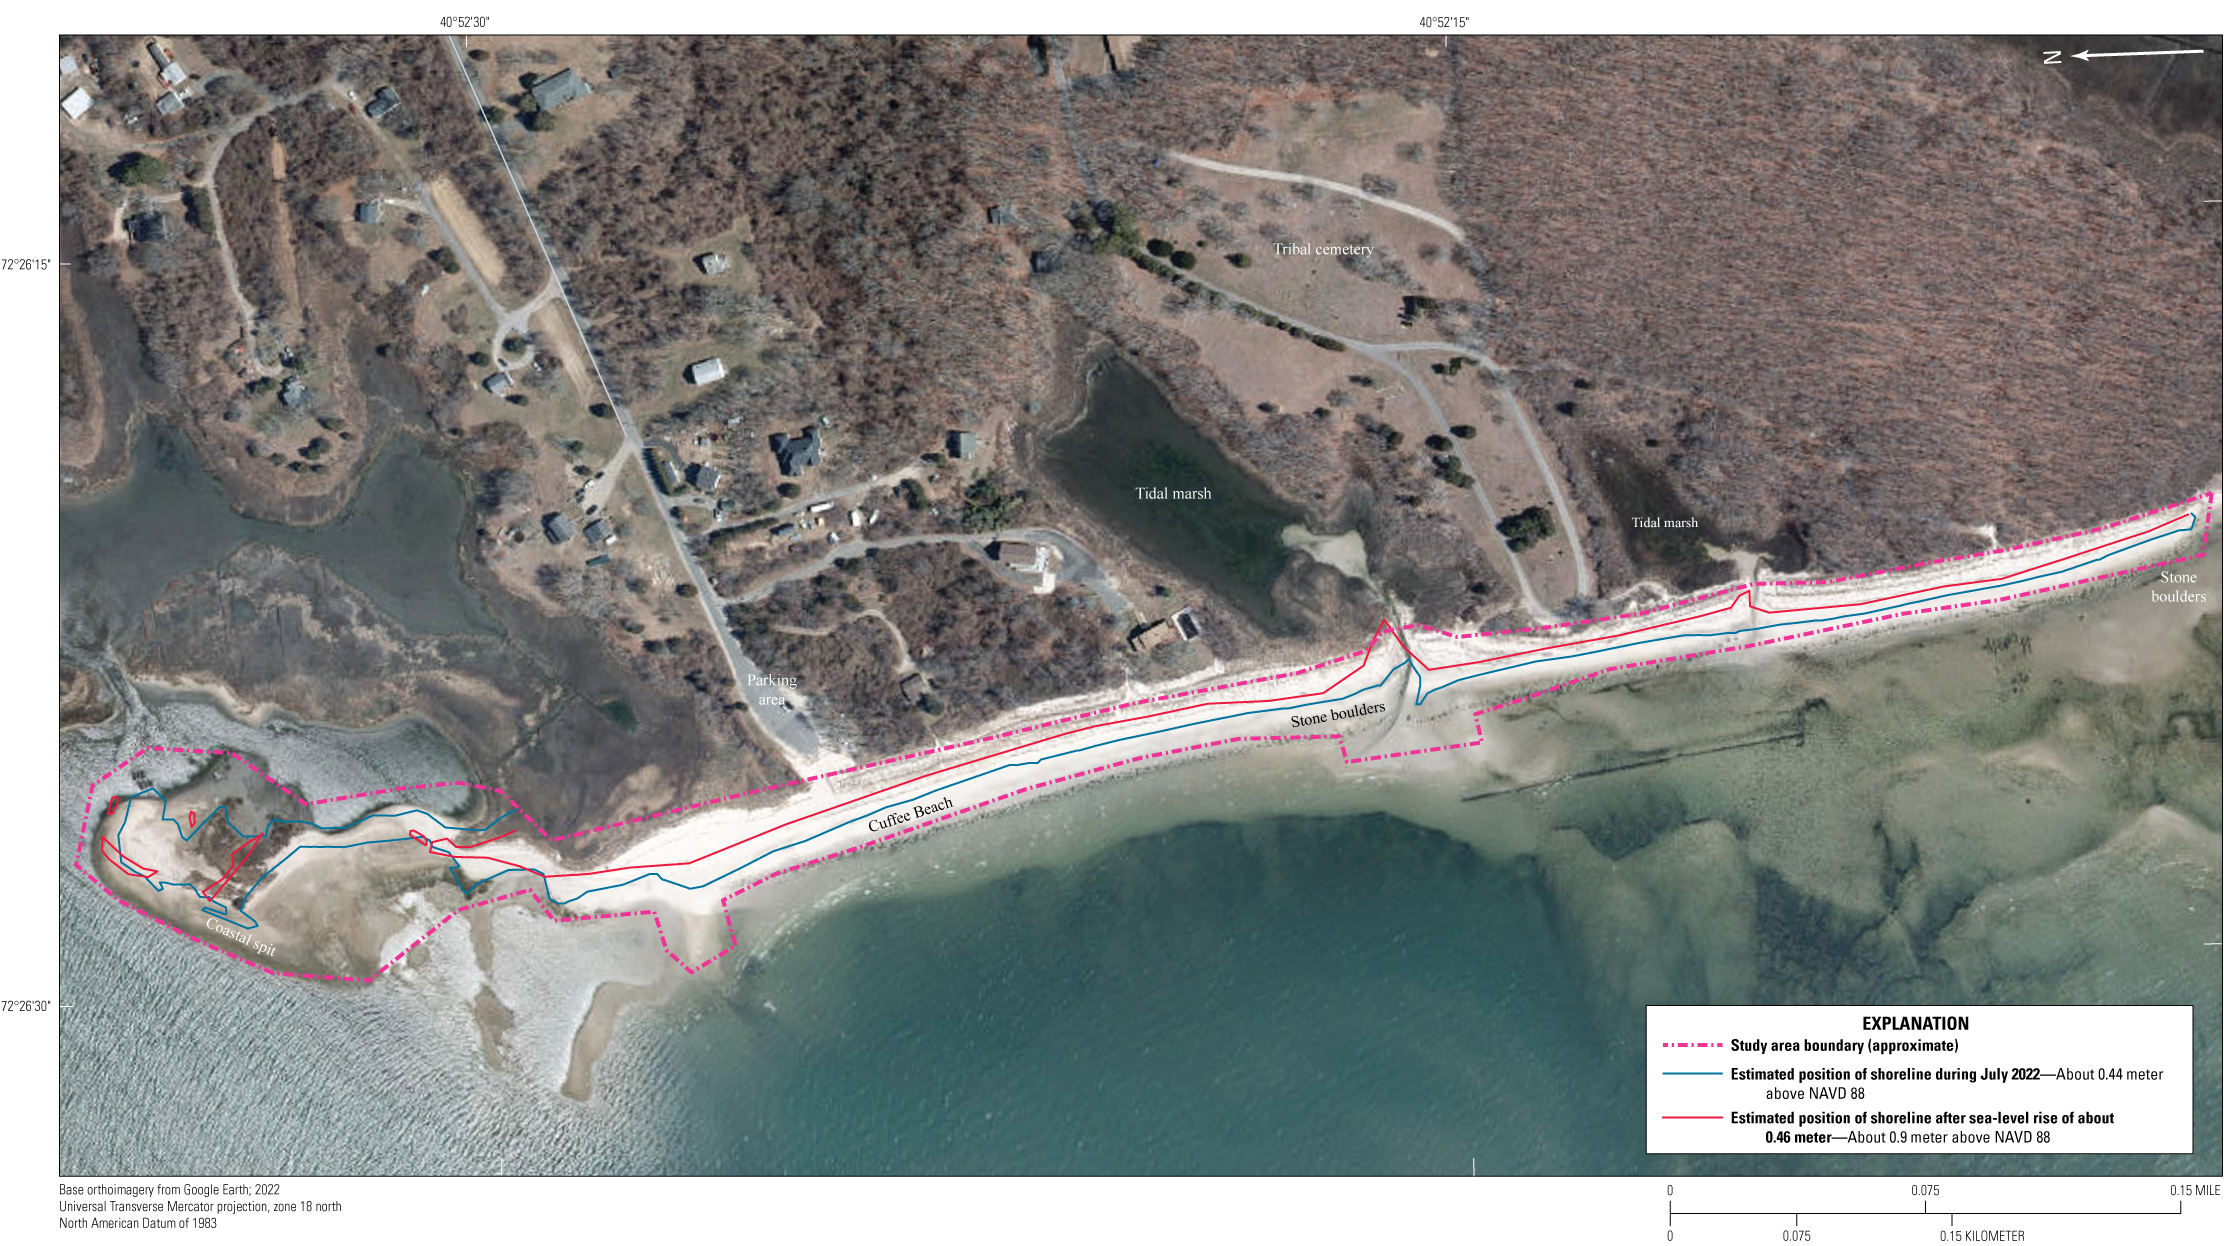
Map showing estimated position of the shoreline after sea-level rise of about 0.46 meter (m) within the study area on the Shinnecock Nation Tribal lands in Suffolk County, New York, using a conservative model projection for 2050. NAVD 88, North American Vertical Datum of 1988.
Methods of Investigation
A network of permanent and semipermanent control points was installed and initially surveyed with a robotic total station in spring 2022 to establish provisional coordinates. The network was resurveyed in winter 2023 with a more precise, integrated total station and laser scanner (scanning total station) to reduce the positional uncertainty of the control points and to establish final coordinates. A combined point cloud of about 85.6 million points was collected during 27 scans of the study area in July and October 2022 using the scanning total station. The scanning total station was also used to establish additional scan stations that were observed from network-control points (the combined installed permanent and semipermanent control points). The survey data (network control points, temporary benchmarks, and the point cloud) were then imported into Trimble Business Center (proprietary software referred to as the “survey software” for the purposes of this report) for postprocessing. GNSS observations were used to establish a point of origin and baseline for the surveys. The point of origin is defined as the beginning (origination) point for the terrestrial surveys.
Benchmark Installation
Two permanent and eight semipermanent benchmarks were installed along the western shoreline of the Shinnecock Peninsula in spring 2022 (fig. 2; table 1). On May 20, 2022, a 12.2-m-long deep rod, identified as deep rod north (DRN), was installed and monumented near the parking area for Cuffee Beach at the end of Little Beach Road (fig. 2; table 1). DRN was the fiducial point of origin for the two control traverses that were used to position the survey control network with a total station. The installation method described by Berntsen International Inc. (2023a) requires driving 0.0143-m-diameter stainless steel rods, fitted with a drive point, into the subsurface until refusal. Refusal for a rod monument is no more than 0.3048 m of penetration per 1 minute of striking with a gasoline-powered reciprocating impact hammer. The rods were driven to refusal in 1.22-m sections with a specialized drive bit designed specifically for the environmental conditions at the study area.
Table 1.
Positional information of network-control points and temporary benchmarks on Shinnecock Nation Tribal lands in Suffolk County, New York.[Data are from Capurso and others (2024). Northing and easting are the northward-measured distance and the eastward-measured distance, respectively, and are referenced to the North American Datum of 1983, Universal Transverse Mercator, zone 18 north. Elevation is referenced to North American Vertical Datum of 1988. FENO, semipermanent spike benchmark by Berntsen International Inc. TBM, temporary benchmark; m, meter; bls, below land surface]
Installation of DRN was completed with a polyethylene sleeve, which insulates the deep rod with a nontoxic biodegradable grease. The purpose of the grease and sleeve, which was installed through the frost line (about 1-m deep in the northeastern United States), is to prevent any movement of the deep rod caused by freezing and thawing of the surface sediment. A stainless-steel spherical datum point was installed on the top of the last deep-rod section as a measuring point for future surveys. An approximate 1.5-m section of 0.15-m-diameter protective polyvinyl chloride casing with a lockable aluminum cap was then installed around the deep rod and a layer of medium sand was added to the bottom of the sleeve to facilitate water drainage. Concrete was then poured around the protective polyvinyl chloride casing for additional stability. The aluminum cap was later monumented with identifying information. The 12.2-m-long deep rod was set about 0.2 m below land surface.
On June 3, 2022, a second 12.2-m-long deep rod, identified as deep rod south (DRS) was installed on top of a dune at the southern end of the project site about 200 m south of the Tribal cemetery and 100 m north of the southernmost part of the study area, where the stone boulders truncate Cuffee Beach (fig. 2). The previously described Berntsen method (Berntsen International Inc., 2023a) that was used to install DRN was also used to install the DRS, which was also set about 0.2 m below land surface.
On June 3, 2022, nine semipermanent benchmarks made of 1-m-long galvanized-steel pins with stabilizing anchor wings, which resemble hooks of an anchor when deployed, also known as FENO anchors (FENO–01 to FENO–08 and FENO–BS; fig. 2; table 1), were installed using the Berntsen method (Berntsen International Inc., 2023b) and distributed at variable intervals along the western shoreline of the Shinnecock Peninsula within the study area (fig. 2). A drive adapter and sledgehammer were used to advance the FENO anchor through the subsurface until the desired depth was reached (typically when the anchor is stable). Once the anchor is driven to the desired depth, a drive pin (extension sleeve) is placed inside the middle of the FENO anchor. A sledgehammer is then used to drive the stabilizing wings out from the base of the FENO anchor, which curl back on the monument and improve stability. An aluminum cap with a datum point (dimple) stamped into the top was then installed on top of the FENO anchor as a measuring point for future surveys. All the FENO anchors except FENO–BS were installed and buried about 0.6 m below land surface to assure the safety of beachgoers and the stability of the monument. FENO–BS was installed 0.2 m below land surface in a grass field and away from the beach.
Twenty temporary benchmarks (fig. 2; table 1) were established from the existing control network on the day of the scan with the scanning total station. An approximately 0.3-m-long hub and tack was set flush-to-grade using a lightweight sledgehammer. In most cases, the temporary benchmarks were used as scan stations, which are the survey markers from which scans are collected. Because most temporary benchmarks were set in the surf zone during low tide to obtain clear line-of-sight to the target feature and to maximize the field-of-view to the study area, they were installed and surveyed on the day of the scan immediately before the survey to assure the stability of the temporary point.
GNSS Observations
To establish an origin point and georeference the control network for subsequent collection of point cloud data, a static GNSS measurement was collected for about 4.2 hours at permanent benchmark location DRN on June 3, 2022, using standard GNSS survey methods (table 2; Rydlund and Densmore, 2012). The static observation was processed through the National Geodetic Survey (NGS) Online Positioning User Service (OPUS; National Geodetic Survey, 2022) using rapid ephemeris data (orbital information of satellites used to produce the solution) to compare the unknown DRN point with other continuously operating reference station (CORS; National Geodetic Survey, 2023) points that have known geographic coordinates. The solution from rapid ephemeris data was used as a provisional coordinate for DRN so a terrestrial (total station) survey of the control network could begin. The observation was reprocessed weeks later to compare the rapid ephemeris solution to the precise ephemeris solution—a slight change was indicated in the Universal Transverse Mercator projection coordinates (2-millimeter [mm] change in the horizontal direction and 1-mm change in the elevation). The three CORS that were used by OPUS to determine the position of the DRN are identified by the NGS as DH7113, DO8498, and DH5833 (National Geodetic Survey, 2023) at baseline distances from DRN of about 92, 61, and 50 km, respectively. All three CORS are part of the NGS National Spatial Reference System.
Table 2.
Global Navigation Satellite System coordinates and uncertainty metrics for static surveys collected at the site identified as deep rod north on the Shinnecock Nation Tribal lands in Suffolk County, New York.[Northing and easting are the northward-measured distance and the eastward-measured distance, respectively, and are referenced to the North American Datum of 1983, Universal Transverse Mercator, zone 18 north. Elevation is referenced to North American Vertical Datum of 1988, GEOID 18A]
Defined in Rydlund and Densmore (2012).
A second static GNSS measurement was collected for about 4.5 hours at permanent benchmark location DRN on January 9, 2023, using standard GNSS survey methods (Rydlund and Densmore, 2012) to improve the accuracy of the (original) provisional coordinates. The observation was processed weeks later through OPUS using precise ephemeris data. The three CORS that were used by OPUS to determine the position of DRN for the June 6, 2022, static measurement were identical to those used for the January 9, 2023, measurement.
A comparison of the coordinates between the June 6, 2022, solution, and the January 9, 2023, solution (both using solutions from the precise ephemeris data) indicated a difference of 0.014 m in the northing direction (the northward-measured distance), no change in the easting direction (the eastward-measured distance), and 0.029 m in the elevation (table 2). Because all three of these coordinates were within the uncertainty range for the horizontal and vertical components (discussed in the “Positional Uncertainty of the Geodetic Control” section of this report) and the rigorous installation procedure of DRN (discussed in the “Benchmark Installation” section of this report), the discrepancies in the coordinates were attributed to the uncertainty of the OPUS algorithm as opposed to a physical change in the permanent benchmark position. The static observations met or exceeded level I criteria for a single-base static OPUS (OPUS–S) survey, which requires a minimum of two 4-hour occupations of the objective point, 80 percent of observations must be used, 80 percent of ambiguities must be fixed, the root mean square error (RMSE) must be less than 0.03 m, and the vertical peak-to-peak must be less than or equal to 0.06 m (table 2; Rydlund and Densmore, 2012). As of the time of this writing, the USGS had no published metrics for horizontal peak-to-peak values. The static GNSS solutions from the June 3, 2022, and January 9, 2023, surveys were averaged to determine the final coordinates for the DRN.
A real time GNSS survey was completed on June 3, 2022, at FENO–BS to orient the control survey with a geodetic azimuth (fig. 2; table 3). FENO–BS is a FENO anchor that was set about 167.4 m east-northeast of DRN along Little Beach Road at an azimuth of 64°44′58″. The real time measurement at FENO–BS used the real time network (RTN) maintained by the New York State Department of Transportation to produce a solution that met or exceeded the level II criteria described by Rydlund and Densmore (2012) for real time positioning. (Berntsen International Inc., 2023b).
Table 3.
Information about scans collected from survey control points and temporary benchmarks on the Shinnecock Nation Tribal lands in Suffolk County, New York.[Data are from Capurso and others (2024). m, meter; —, no data]
Terrestrial Surveys
A terrestrial survey refers to the collection of ground-based geospatial measurements, such as angles and distances, that are observed at the Earth’s surface. Two types of terrestrial-surveying instrumentation were used to observe geospatial measurements during spring, summer, and fall 2022 and winter 2022–3. During spring 2022 (June), initial control traverses were measured with a robotic total station (Trimble, Inc., 2017, 2022b) to establish provisional coordinates for the survey control network. These control points were used to orient and align the point clouds that were collected during the subsequent scans of the western shoreline (fig. 2; tables 1 and 3). During summer (July) and fall (October) 2022, an integrated total station and laser scanner (scanning total station) was used to collect the point clouds and measure the position of temporary benchmarks that were established from the survey control network. The temporary benchmarks that were used as scan stations (defined as the point that is occupied by the total station during the scan) were installed and surveyed on the same day the point cloud was collected to ensure the stability of the temporary mark; for example, installing a 0.3 m-long hub in the dynamic surf zone (characterized by a wet and loose mixture of gravels, sands, and silts) a week before data collection may compromise the original surveyed position of the hub and introduce additional uncertainty into the error budget.
The scanning total station—which is a newer and more precise instrument than the robotic total station (Trimble, Inc., 2017, 2022b)—was also used to resurvey and determine the final coordinates of the control points in the network (table 1) during winter 2023 (January and February). The scanning total station was not available for use during the initial survey of the control points in spring 2022. The positions of the point clouds (collected during July and October 2022) were then adjusted based on the differences between the provisional coordinates (measured in spring 2022) and the final coordinates (measured in winter 2023) in the survey software.
Total Station
A traverse survey is a series of successive straight lines of known distance and orientation that connect a series of points on the Earth (U.S. Army Corps of Engineers, 2007). Field measurements of survey lines are typically determined with a total station, which uses previously surveyed points as a reference to establish subsequent points. A closed traverse originates at a point of known location and terminates on a point of known location. A double-run spur traverse (DRST; Noll and Rydlund, 2020) is a type of closed traverse and was used to establish control points in the survey network. The DRST requires a double occupation of all control points and begins and terminates at the point of origin, which was the DRN in this study (fig. 2; table 1). The procedures and best practices for running a DRST were applied to precisely position the control network. This closed traverse method was selected because it reduces the measurement uncertainty of the total station observations in both the horizontal and vertical directions. Vertical uncertainty is reduced by determining the average of four vertical (height) difference measurements made between each pair of directly connected (adjacent) control points—one pair of reciprocal observations (two of the four measurements) are observed during the forward running of the spur and the second pair of reciprocal observations (the other two measurements) are observed during the backward running of the spur. Vertical misclosure is determined by comparing the height differences in the forward direction (origin to destination) to the height differences in the backward direction (destination to origin). Vertical misclosure provides a check on the leveling and assures the vertical accuracy of the survey.
The horizontal closure ratio and the angular misclosure (indicators of horizontal uncertainty) of the irregular polygon that represents the DRST are determined by returning to the origin point of the survey, which in this study was the DRN (fig. 2; table 1). A horizontal closure ratio is the horizontal distance misclosure (linear units) in a horizontal-control traverse divided by the length of the traverse (linear units). For example, if 1 m of misclosure was determined for a 50,000-m traverse, then the horizontal closure ratio is 1:50,000. To determine the angular misclosure of a geometrically closed horizontal-control traverse, the measured interior angles (angular units) of the irregular polygon that represents the traverse must be summed and then subtracted from the sum of the interior angles of a similar mathematically closed traverse. The sum of the interior angles of a mathematically closed traverse is equal to (n−2)×180, where n is the number of sides of the polygon that represents the traverse. For example, the sum of the interior angles of a mathematically and geometrically closed horizontal-control traverse that is represented by a four-sided polygon is 360°; if the measured (field) interior angles of the traverse do not equal 360°, then the difference is considered to be the angular misclosure. A Bowditch-rule adjustment (also known as a compass-rule adjustment) distributes the linear misclosure of a traverse proportionally throughout each leg of a traverse. The proportion of error being distributed to a particular side of a traverse is based on the ratio of the length of that side to the length of the perimeter of the traverse. The Bowditch-rule adjustment assumes that the quality of the distance and angle measurements are similar and the misclosure of the traverse is from accidental or random error (Brinker and Minnick, 1995).
During the initial traverse survey in spring 2022 to establish provisional coordinates for the control network, a tripod-mounted robotic total station with an angular precision of 2 arc-seconds and an electronic distance measurement instrument precision of 3 mm plus 2 parts per million (ppm; Trimble, Inc., 2017) was used to measure the angles and distance measurements of the closed traverses. A newer and more precise scanning total station (described in the “Scanning Total Station” section of this report) was used to establish the final coordinates of the control network in winter 2023. The scanning total station has an angular precision of 1 arc-second and an electronic distance measurement instrument precision of 1 mm plus 1.5 ppm (Trimble, Inc., 2022b).
For both spring 2022 (robotic total station) and winter 2023 (scanning total station) control traverses, the traverse was split into two traverses because of time constraints associated with the tidal cycles in Shinnecock Bay (for example, FENO–01 cannot be occupied during high tide). The first traverse, identified as DRST–Cuffee, was run from DRN to FENO–03, FENO–04, FENO–05, FENO–06, FENO–07, FENO–08, and DRS, then back to DRN along the same route (fig. 2); the total two-way length of the traverse was 1,217.5 m. The second traverse, identified as DRST–Spit, was run from FENO–03 to FENO–02, and FENO–01, then back to FENO–03 along the same route; the total two-way length of the traverse was 545.9 m. For both the spring 2022 and winter 2023 control traverses, DRST–Cuffee was completed first and DRST–Spit was competed second. The provisional coordinates from the spring 2022 traverse were adjusted vertically using the methods described Noll and Rydlund (2020); the provisional horizonal coordinates were not adjusted. For the winter 2023 traverse, the horizontal coordinates were adjusted with the Bowditch rule, and the vertical coordinates were adjusted using the methods described Noll and Rydlund (2020). The adjusted coordinates for FENO–03 and DRN were then used for the baseline for the DRST–Spit control traverse. The horizontal and vertical coordinates of DRST–Spit were also adjusted using the same methods.
Traverse prisms were mounted to adjustable-height tripods to measure foresight and backsight locations from the total station. The prism offset (Noll and Rydlund, 2020) of the traverse prisms that were used to establish the control network is −35 mm with an uncertainty of 0.3 mm (Trimble, Inc., 2022b). The low prism offset error is an important specification to ensure that the prism is precisely centered over the ground point.
Scanning Total Station
Laser scanners and terrestrial light detection and ranging (T-lidar) technology emit laser pulses that are reflected off target objects within its field of view (Brenner and others, 2016). These instruments calculate the distance of each returned laser pulse based on half the two-way travel time of the pulse multiplied by the speed of light. Along with the distance to the object, the vertical and horizontal angle of the reflected pulse is collected by the instrument to determine a three-dimensional position of the target. An integrated total station and laser scanner (Trimble SX–12), also called a scanning total station, was used to collect 21 point clouds along the western shoreline of the Shinnecock Peninsula during July 2022 and 6 point clouds during October 2022. The scanning total station has most of the functionality of a conventional total station but also has the capability to collect rapid, large-quantity, high-precision positional data using a band-scanning method (rotating prism inside the telescope) at a measurement rate of 26.6 kilohertz (Trimble, Inc., 2022a). For example, a full-dome scan—a 360° horizontal by 300° vertical field of view—with a point spacing of 50 mm at a distance of 50 m, would take about 12 minutes. The scanning laser of the instrument has a three-dimensional precision of 2.5 mm at 100-m measurement distance (Trimble, Inc., 2022a) and an angular uncertainty of 5 arc-seconds; the range of the scanner is 0.9 to 600 m. The total station component of the instrument has an angular precision of 1 arc-second and an electronic distance measurement instrument precision of 1.0 mm plus 1.5 ppm. In addition to the 27 scans, this instrument was also used to survey 20 temporary benchmarks from the existing control network. In some cases, the temporary benchmarks were used as scan stations, defined as the survey markers from which point clouds are collected. Two point clouds each were collected from scan stations FENO–06 and TBM–308 (fig. 2; table 1).
To establish most of the temporary benchmarks, a hub and tack was set in the surf zone or foreshore in a location that had clear line-of-sight to the target feature—beach-morphology features such as the foreshore, backshore, berms, and dunes; and previously scanned features to ensure overlap of the point clouds—during low tide. A traverse prism mounted to a calibrated 2-m carbon fiber pole and bipod, which was precisely centered and leveled over the temporary benchmark and was measured from a control point in the network using multiple face 1 (total station is in direct instrument orientation) and face 2 (total station is in reverse instrument orientation) angle and distance measurements. Face 1 and face 2 observations reduce or eliminate measurement uncertainty from random and systematic error sources (Noll and Rydlund, 2020). A bipod-mounted, fixed-height pole was used to eliminate prism-height uncertainty from manual height measurements, which are typically made with an engineer’s ruler from the ground point to the tilting axis of the traverse prism. The prism height for all the measurements made with the fixed-height pole was 2.135 m. The scanning total station is equipped with automatic target recognition (ATR) technology that uses electromagnetic, optical, or both sensing technologies and uses advanced algorithms to detect, track, and precisely point the instrument at the center of the prism (Grimm and others, 2015). ATR can help reduce measurement uncertainty from pointing errors. Once the target has been detected, a paired internal motor rotates the alidade and telescope to maintain a lock on the prism. The operator commands the total station to make a measurement when the instrument is locked on the prism.
Of the 27 point clouds, 21 were collected from temporary benchmarks (table 1), which were set from permanent or semipermanent network-control points; the remaining six point clouds were collected from network-control points (FENO anchors; table 1). Positional uncertainty of the scan station and backsight was determined with a backsight check in face 1 instrument orientation. A backsight check is a quality-assurance procedure used to verify station setup information before a total station survey (such as a scan, control traverse, or side-shot); this information includes the point numbers, positions, orientation, and instrument heights of the station and backsight. After the observation for the backsight check is made, the data-collection device displays a residual value (sometimes called the “delta”) for the horizontal and vertical (elevation) components; the residual value of the backsight check for the horizontal component is the difference between the known and measured horizontal distance between the station and backsight points and, for the vertical component, it is the difference between the known and measured height difference between the station and backsight points.
Conventional laser scanners and terrestrial lidar instruments typically require target-based or cloud-based registration of point clouds during postprocessing after the field data have been collected. The scanning total station that was used for the July and October 2022 surveys can orient the point cloud in real-time during field data-collection activities, which is known as field registration (Trimble, Inc., 2022a). The onboard software on the data-collection device processes the point cloud similarly to traditional side-shots using previously surveyed points to orient the data by station setup (occupied station and backsight are known) or resection (determine the position of the occupied station from previously surveyed points using field-measured angles and distances). Once the point cloud is field registered, it is tied to the ground point (scan station) and held fixed during postprocessing—no additional work is required to orient the point cloud during postprocessing. The point cloud can also be automatically georeferenced in real time if the scan stations (network-control points and temporary benchmarks) are referenced to a geodetic datum. The point cloud and other field data (control points, temporary benchmarks, regular topography measurements) are then exported to a proprietary software for postprocessing (described in the “Postprocessing of Point Clouds” section of this report) and analysis. The positional uncertainty of the point cloud can be estimated from the backsight-check residual observed from the scan station.
Postprocessing of Point Clouds
In summer and fall 2022, a total of 27 point clouds, comprising a combined point cloud of about 85.6 million points, were collected during 27 scans: 21 of the point clouds were collected on July 26–27, 2022, and 6 were collected on October 17, 2022. The combined point cloud was then colorized, then provisionally classified into four point-cloud regions using a proprietary algorithm designed by Trimble Inc. during postprocessing. The regions of the combined point cloud are identified as ground, default, redacted, and vegetation. The combined point cloud was then manually inspected to refine the classifications and quality assure the algorithm. Ground cover, such as seaweed, eel grass, boulders, large cobbles, wash lines, debris lines, rack lines, low vegetation, and phragmite, that was not correctly classified by the algorithm was manually removed from the ground region, reclassified, and then added to the default region. Scrutiny was required to identify points that represent bare earth because the scanning total station used for this project does not have the capability to collect later-time returns of laser pulses; these pulses travel further distances and may be more representative of the bare-earth surface.
The results of the algorithm that classifies points into regions were scrutinized to assure every point was correctly identified. However, it is possible that some points were misclassified by the algorithm and subsequently overlooked during the quality assurance inspection. For example, ground cover, such as a wash line of dead eel grass or phragmite, may have been identified as the ground (bare earth) by the algorithm. If the wash line was also not identified correctly in the manual assessment, the ground region may be misrepresented in the analysis. The accuracy assessment presented in this report pertains only to the point data and does not account for potential uncertainty associated with the misclassification of the points by the algorithm.
The default region, which consists of points that could not be classified by the algorithm, made up about 14 percent (11.6 million points) of the combined point cloud. Ground points―defined as the bare earth surface that is free of ground cover such as vegetation, debris lines, or boulders―made up about 47 percent (40.5 million points) of the total points. The redacted region accounted for about 30 percent (26.0 million points) of the combined point cloud and consisted of personally identifiable information (such as homes and other personal property) and data collected outside the study area. These data were not included in Capurso and others (2024) to protect the privacy of the Shinnecock Nation and Tribal members. The vegetation region accounted for about 9 percent (7.4 million points) of the combined point cloud.
Slight elevation differences (approximately 0.1 m or less) between the points collected during July and October 2022 surveys were determined within the study area between FENO–05 and FENO–08 (fig. 2). The elevation differences can most likely be attributed to geomorphological processes between surveys. For these elevation differences, the points collected during the July 2022 survey are considered authoritative and were given precedence over the points collected in October 2022; the points collected in October 2022 were classified as redacted and are not included in Capurso and others (2024) and the analysis in this report. The July 2022 points are considered authoritative because most of the data (21 of the 27 point clouds) were collected during the July 2022 survey. The main purpose of the October 2022 survey was to collect additional detail of the dune adjacent the Tribal cemetery. Along the dune adjacent to the Tribal cemetery, most of the elevation differences between the points collected during the July and October surveys were negligible. The 27 point clouds are distributed irregularly along the narrow western shoreline of the Shinnecock Peninsula (fig. 2). Of the 27 point clouds, 20 were concentrated at two critical locations along the western shoreline of Shinnecock Peninsula: the dune adjacent to the Tribal cemetery and the coastal spit at the northern part of the study site (figs. 1, 2, and 4; table 1). The loss of the dune that bounds the Tribal cemetery and the coastal spit at the northern end of the project site (fig. 2) could adversely affect the Tribe’s ecological (for example, the estuary habitat) and cultural (for example, the Tribal cemetery) resources along Shinnecock Bay; furthermore, both features may attenuate wave energy and help reduce coastal flooding of the landward areas during storms. Of the 27 total point clouds, 11 were collected from 10 scan stations near the dune that bounds the Tribal cemetery to the west and runs parallel to shoreline of Shinnecock Bay. Additional geospatial detail of baseline conditions (five point clouds were collected in July 2022, and six point clouds were collected in October 2022) was required for this dune (fig. 4) because it is a critical barrier of protection for the Tribal cemetery (figs. 2 and 4). Concrete blocks, plantings, and small boulders were installed to stabilize the dune and are represented by the point cloud shown in figure 4. Nine of the total 27 point clouds were collected from 8 scan stations near the dynamic coastal spit at the northern end of the project site (fig. 4), which is susceptible to ongoing transformations due to variations in sediment transport, overtopping, erosion, and overwash. The coastal spit forms an embayment and estuarine habitat area that is important to the health of the local ecosystem. The loss of the coastal spit may also result in an increase in wave energy and coastal-flood inundation of the landward areas.
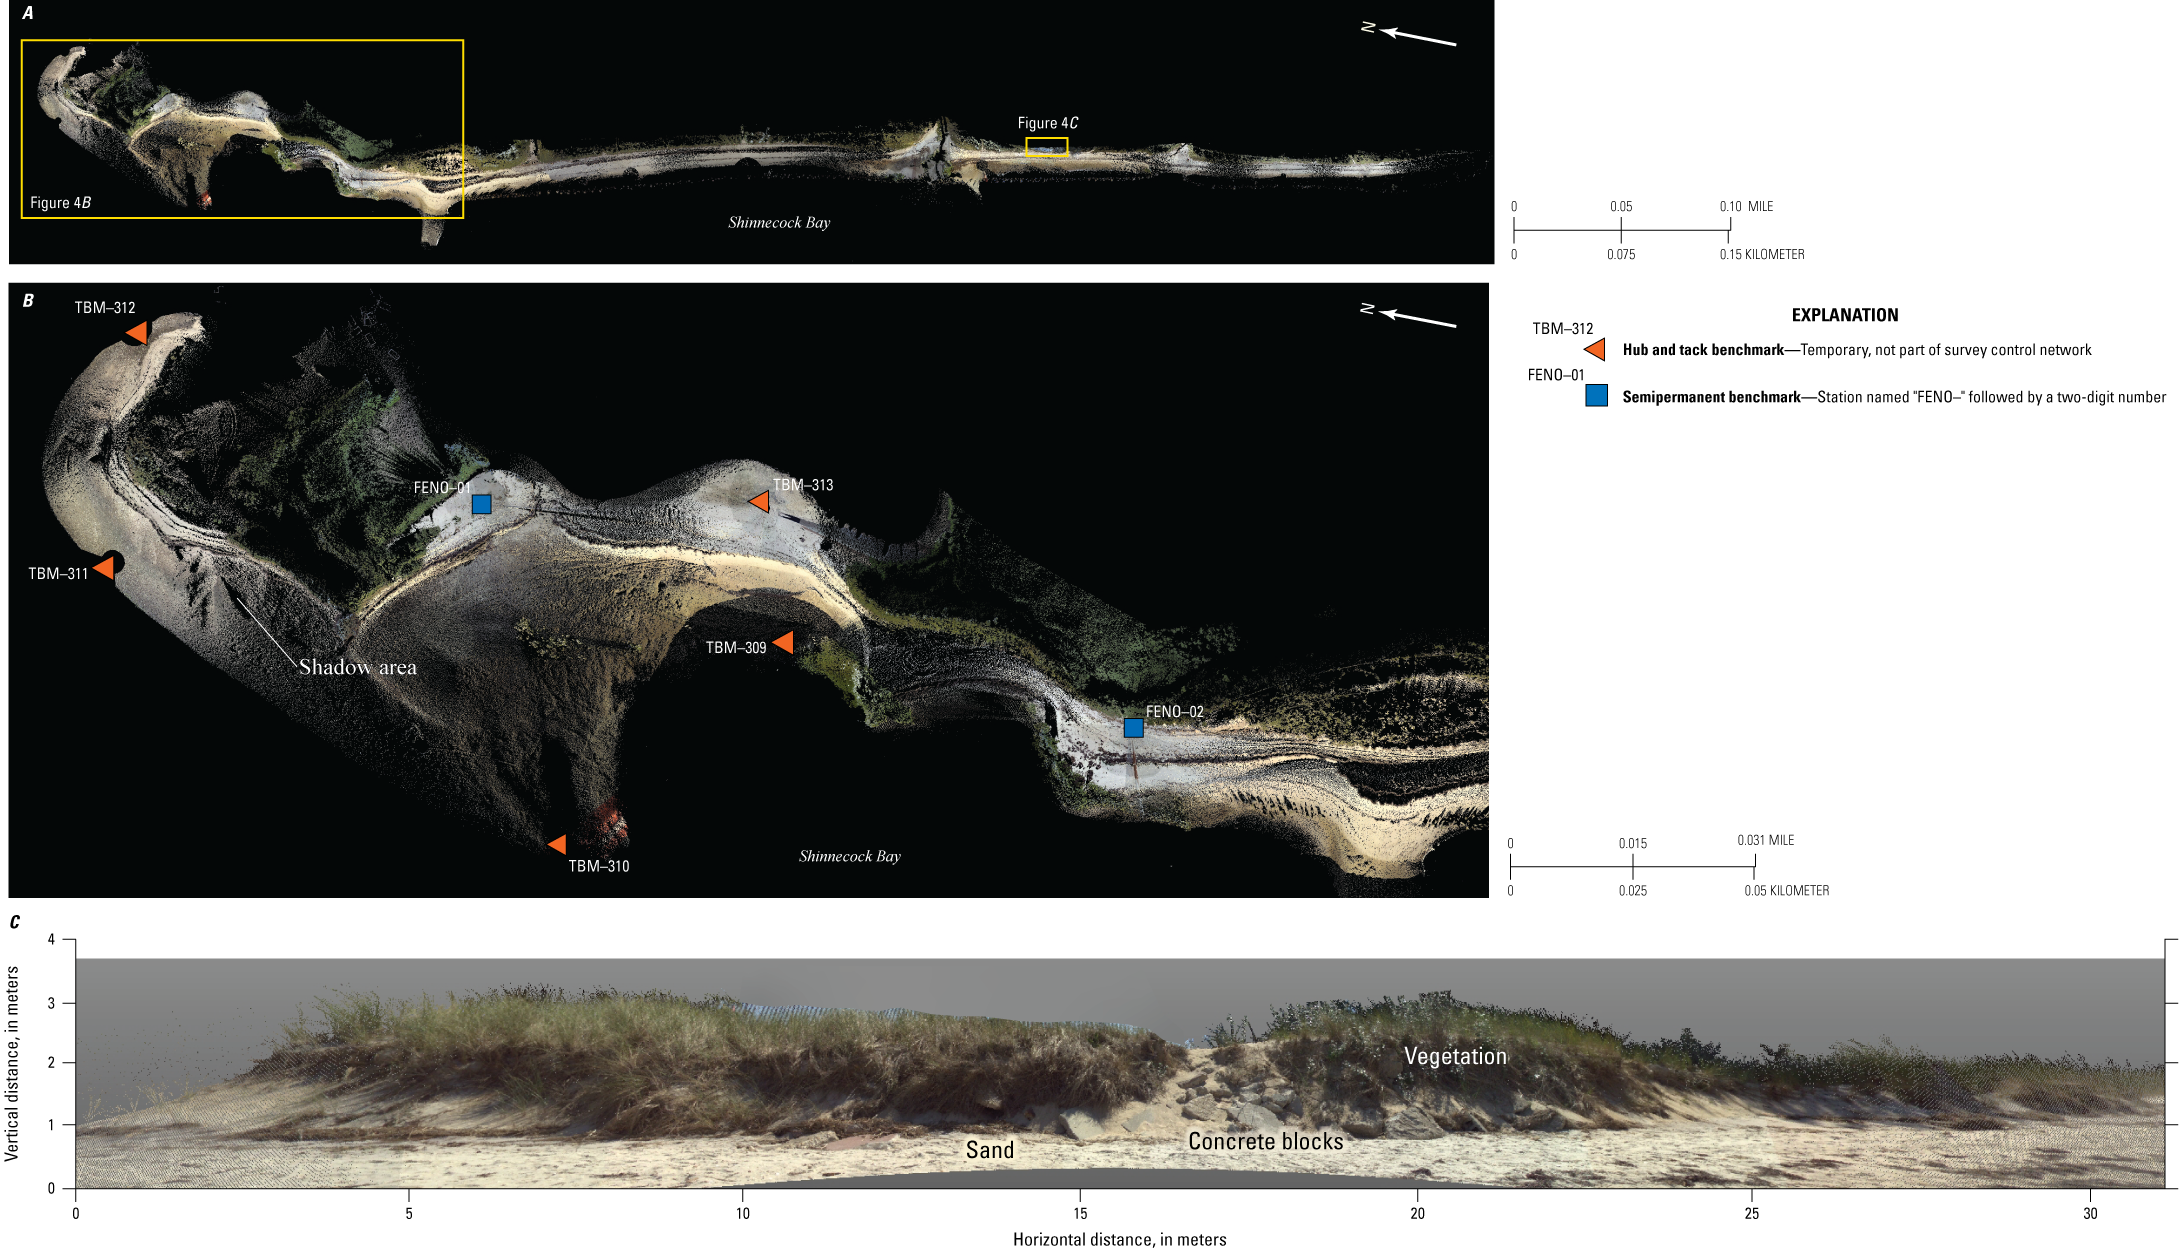
Graphical representation of the point cloud of A, the study area in plan view, B, the coastal spit in plan view, and C, the dune adjacent to the Tribal cemetery on the Shinnecock Nation Tribal lands in Suffolk County, New York, in section view in July 2022. Estimated horizontal and vertical scales are variable between point cloud images.
Approximately 29 percent of the combined point cloud (about 25.2 of 85.6 million points) were collected during the 20 scans near the dune adjacent to the Tribal cemetery (11 point clouds) and the coastal spit (9 point clouds) at the northern part of the project site. The remaining seven point clouds are generally distributed north-south along Cuffee Beach between the coastal spit and dune adjacent to the Tribal cemetery, and between the dune and the cement blocks that truncate the beach at the southern end of the study site (fig. 2).
The scanning total station was configured to collect standard point spacing for 14 of the 27 point clouds (table 1); a standard point density is defined as a point spacing of 25 mm at a measurement distance of 50 m. A coarse point density configuration was used for the remaining 13 point clouds, which is defined as a point spacing of 50 mm at a measurement distance of 50 m. Point spacing is a function of measurement distance and is always denser near the scan station (unless otherwise programmed) and increasingly sparse with increasing distance from the station. Point density also decreases in shadow areas (see example in fig. 4) of the point cloud that are caused by features that partially or completely obscure the ground surface or other targets (for example, boulders or trees). Target features such as the bare earth were scanned from multiple stations (different perspectives) to reduce shadow areas in the combined point cloud.
Accuracy Assessment
Four error sources determine the combined overall absolute uncertainty (Eabsolute) in the horizontal and vertical dimensions for the point cloud data collected along the western shoreline of the Shinnecock Peninsula in July and October 2022. These four error sources include (1) the error associated with the network control (Econtrol), which can be determined by examining the backsight-check residuals (defined in the “Scanning Total Station” section of this report) measured between the network-control points (fig. 2; table 1); (2) the error associated with the scan stations (Esurvey), which can be determined by examining the backsight-check residuals between the scan station (temporary benchmark or network control; fig 2; table 1) and the network control; (3) the error associated with the three-dimensional accuracy of the scanning laser of the total station (Elaser) indicated on the datasheet of the scanning total station; and (4) the error associated with the GNSS measurements (Egeodetic), which is determined from the quality assurance metrics on the OPUS solution report (National Geodetic Survey, 2022). The first three error sources (Econtrol, Esurvey, and Elaser) determine the combined overall relative error estimate (Erelative). All backsight checks were observed with the total station in direct instrument orientation (face 1).
Random sources of error associated with the point cloud are difficult to quantify and are assumed to be negligible. The following sections of this report describe and quantify some of the systematic errors associated with the point cloud (for example, the accuracy of the scanning laser of the total station), which are assumed to comprise a majority of the total error budget. The “Discussion of Error” section of this report describes some of the potential random sources of uncertainty such as operator errors and environmental conditions. Furthermore, it is assumed the positional uncertainty of the network control (Econtrol) and the other scan stations (Esurvey) are spatially independent although the error likely varies throughout the project site. The accuracy of the scanning laser (Elaser) of the total station is proportional to measurement distance; however, it is also held constant to simplify the relative and absolute error computations.
Positional Uncertainty of the Network Control
DRST–Cuffee (defined in the “Total Station” section of this report) was resurveyed in winter 2023 with the more precise scanning total station. The origin point for the DRST–Cuffee was DRN; DRN and FENO–BS were used as the baseline points for the control traverse. The baseline was about 167.4 m long at a geodetic azimuth of 64°44′58″ (fig. 2). Following the traverse, the raw field coordinates of the control points were imported into the survey software for analysis. The horizontal distance and angular misclosure of the DRST–Cuffee were 0.024 m and 1.256 arc-seconds, respectively. Holding DRN fixed, the horizontal coordinates for anchors FENO–03 through FENO–08, and DRS, were then adjusted with the Bowditch rule resulting in a mathematically and geometrically closed polygon with negligible angular and distance misclosures. Elevations (more specifically, height differences between adjacent control points) were refined using the methods described by Noll and Rydlund (2020), resulting in a vertical misclosure of 0.003 m.
Similar to DRST–Cuffee during winter 2023, DRST–Spit was also resurveyed with the more precise scanning total station in February 2023 using the previously adjusted coordinates for FENO–03 and DRN as the baseline points for the control traverse. The baseline distance between these points is about 47.7 m at a geodetic azimuth of 38°34′43″; the origin point for DRST–Spit was FENO–03. Following the traverse, the raw field coordinates of the control points were imported into the survey software for analysis. The horizontal distance and angular misclosure of the DRST–Spit were 0.001 m and 0.899 arc-second, respectively. Holding FENO–03 fixed, the horizontal coordinates for FENO anchors 01 and 02 were then adjusted with the Bowditch rule resulting in a mathematically and geometrically closed polygon with negligible angular and distance misclosures. Elevations were refined using the methods described by Noll and Rydlund (2020), resulting in a vertical misclosure of 0.001 m.
Once the horizontal and vertical coordinates of the survey control network were adjusted using the Bowditch rule and the methods described in Noll and Rydlund (2020), the network is considered precisely tied to point of origin (DRN) with negligible error. The final coordinates listed in table 1 represent the true or known values of the network-control points and were used as the basis for comparison to determine the residual error of the backsight check (table 3). Potential sources of uncertainty associated with the residual error of the backsight check are listed in Noll and Rydlund (2020, table 2), which identifies sources of random and systematic errors related to the equipment (for example, constant and scale errors that affect the precision of the distance measurement and the angular uncertainty of the total station, which will affect the precision of the horizontal and vertical angle measurement), the operator (for example, instrument-height measurements, pointing, and reading), and the procedures (for example, testing and accounting for horizontal and vertical collimation errors). Another potential source of uncertainty associated with the horizontal residual of the backsight check is the set of assumptions of the Bowditch-rule adjustment; the method assumes that the quality of the distance and the angle measurements are similar and the misclosure of the traverse is from accidental or random error (Brinker and Minnick, 1995). If these assumptions were not met during the control traverses, then the adjustments to the horizontal coordinates may be erroneous.
Six backsight checks were observed between network-control points during the collection of the 27 point clouds in July and October 2022. During the collection of 21 of the 27 point clouds in July 2022, a total of five backsight checks were observed between network-control points at FENO–01, FENO–02, FENO–05, FENO–06, and FENO–08. During October 2022, one backsight check was observed from FENO–06. Table 1 lists the horizontal and vertical residuals of the six backsight checks that were measured on the day of the scan before the collection of the point cloud. The error estimate associated with the positional uncertainty of the network-control points (Econtrol) in the vertical (elevation) dimension was computed with the following equation that determines the RMSE at the 68 percent confidence level:
whereEcontrol z
is the RMSE associated with the vertical (elevation) uncertainty of the network-control points,
ΔElevi
is the backsight-check residual for the vertical (elevation) dimension of the ith residual in the dataset,
n
is the number of backsight-check residuals in the dataset, and
i
is an integer from 1 to n.
The RMSE for the horizontal dimension (Econtrol h) can be calculated in a similar way using equation 1 by substituting the ΔElev term with ΔH, which is the backsight-check residual for the horizontal dimension (table 1). A total of six backsight-check residuals were used to determine Econtrol for the horizontal and vertical dimensions. The RMSE of the survey control network for the horizontal and vertical dimensions is 0.0060 and 0.0060 m, respectively, at the 68 percent confidence level; and 0.0111 and 0.0108 m, respectively, at the 95 percent confidence level (table 4). An example of syntax stating the reported uncertainty at the 95 percent confidence level for a point in the combined point cloud having an easting coordinate of 715686.435 m, northing coordinate of 4527901.563 m, and elevation of 1.745 m would be as follows: the application of Eabsolute (0.0598 and 0.0733 m in horizontal and vertical uncertainty, respectively; table 4) to the example point results in a range of 715,686.375 to 715,686.495 m for the easting coordinate, a range of 4,527,901.503 to 4,527,901.623 m for the northing coordinate, and a range of 1.670 to 1.8196 m for the elevation coordinate.
Table 4.
Sources of positional uncertainty and corresponding error estimate associated with the combined point cloud collected on the Shinnecock Nation Tribal lands in Suffolk County, New York, for the 68 and 95 percent confidence levels.[All values listed are in meters. Elaser, error estimate associated with the accuracy of the scanning laser of the total station; Esurvey, error estimate associated with the positional uncertainty of the scan station; Econtrol, error estimate associated with the positional uncertainty of the network-control points; Egeodetic, error estimate associated with the Global Navigation Satellite System measurements; Erelative, combined overall relative error estimate; Eabsolute, combined overall absolute error estimate]
Positional Uncertainty of the Scan Stations
A total of 25 scan stations were used to collect 27 point clouds during summer and fall 2022 (fig. 2; table 3). Of the 27 point clouds, 6 were collected from network-control points (FENO anchors), and the remaining 21 were collected from temporary benchmarks (hub and tack). When a network-control point is used as a scan station, the positional uncertainty of the point cloud is dependent on the backsight-check residual measured between network-control points; for example, when occupying FENO–01 and backsighting FENO–02, the positional uncertainty of the point cloud in the horizontal dimension is the difference between the measured and known horizontal distance between FENO–01 (station) and FENO–02 (backsight). If a temporary benchmark is set from a network-control point, the uncertainty of the point cloud collected from the temporary benchmark is dependent on the backsight-check residual of both the control point and the temporary benchmark (error propagation). For example, if FENO–02 is the occupied point, FENO–01 is the backsight point, and TBM–311 is the foresight point, then the total uncertainty of the subsequent point cloud collected from TBM–311 is the square root of the sum of the squares of the backsight-check residuals at FENO–02 and TBM–311. This dependence is accounted for by the Esurvey and Econtrol terms in equation 3, defined in the “Combined Overall Relative Error Estimate of the Point Cloud” section of this report.
The error estimate associated with the positional uncertainty of the scan stations (Esurvey) in the vertical (elevation) dimensions can be computed with equation 1, which determines the RMSE at the 68 percent confidence level by substituting the Econtrol z term with Esurvey z. To determine the horizontal positioning uncertainty of the scan stations (Esurvey h), the Econtrol z term is substituted with Esurvey h and the ΔElev term is substituted with ΔH in equation 1. To determine Esurvey for the horizontal and vertical dimensions, 27 backsight-check residuals each were used (54 total). The RMSEs of the scan stations for the horizontal and vertical dimensions are 0.0046 and 0.0104 m, respectively, at the 68 percent confidence level and 0.0090 and 0.0204 m, respectively, at the 95 percent confidence level (table 4).
In additional to the error sources that were described in the “Positional Uncertainty of the Network Control” section of this report, environmental conditions may also affect the positional uncertainty of a scan station (temporary benchmarks, specifically). This potential source of error, along with other random and systematic errors, are described in the “Discussion of Error” section of this report.
Accuracy of the Scanning Laser of the Total Station
Elaser is the error estimate associated with the accuracy of the scanning laser of the total station. The accuracy of the scanning laser was determined by the manufacturer by scanning a sphere target that was fitted at a known position from the scanning laser. The difference between the measured position and the known position for 68 percent of the observations was 0.0025 m for both horizontal and vertical dimensions. Of the measurements, 95 percent were within 0.0049 m of the known position of the target sphere. This information is indicated on the manufacturer datasheet for the scanning total station (Trimble, Inc., 2022a).
Positional Uncertainty of the Geodetic Control
The positional uncertainty of the geodetic control used in this study was assessed by examining the solutions obtained for the static GNSS measurements on permanent benchmark DRN. Estimating the accuracy of a static GNSS solution is difficult because sources of random uncertainty such as user error (for example, misidentification of antenna or antenna reference point height) may not be detected and errors associated with local multipath and adverse atmospheric conditions can degrade the quality of the solution. If OPUS cannot detect these errors, the accuracy estimates from formal error propagation may be erroneous (National Geodetic Survey, 2022).
An adequate representation of accuracy is a quality indicator called peak-to-peak (PTP) error or solution-range error, which indicates the difference between the maximum and minimum coordinate values for the horizontal (latitude and longitude) and vertical (elevation) dimensions, from the three independent, single-baseline solutions (table 2). The PTP error also includes any uncertainty from the base station (CORS) coordinates. For the June 3, 2022, static observation at DRN, the horizontal PTP error is 0.009 m for latitude and 0.003 m for longitude; the combined horizontal PTP error is 0.009 m. The PTP error for the elevation of DRN is 0.06 m. For the January 9, 2023, static observation, the horizontal PTP error is 0.008 m for latitude and 0.006 m for longitude; the combined horizontal PTP error is 0.01 m. The PTP error for the elevation of DRN is 0.06 m. Horizontal and vertical PTP errors are reported in the solution report at about 1.7 times one standard deviation (National Geodetic Survey, 2022). The combined uncertainty for the two static measurements of DRN is 0.0056 m for the horizontal component and 0.0353 m for the elevation component at the 68 percent confidence level. This was determined by dividing the average of the combined overall PTP error for horizontal (0.0095 m) and vertical (0.06 m) components by 1.7.
To further assess the accuracy of the geodetic control, eight FENO points in the network (anchors FENO–01 through FENO–08; table 1) were measured again using the New York State Department of Transportation-maintained RTN to help estimate the horizontal uncertainty associated with the RTN measurements. The coordinates listed in table 1 for FENO–01 to FENO–08 were surveyed with a total station and are considered to be the known values; the measured RTN positions of FENO–01 to FENO–08 were compared against the known values to determine an RMSE. The overall horizontal uncertainty of the measurements made using the RTN at the 68 percent confidence level is 0.0289 m.
To determine the overall horizontal uncertainty of the geodetic control (Egeodetic h) at the 68 percent confidence level, the following equation was used:
whereEgeodetic h
is the combined overall horizontal uncertainty for the geodetic control,
Estatic
is the positional uncertainty associated with the static GNSS measurements at DRN, and
Ertn
is the positional uncertainty associated with the real-time GNSS measurements at FENO–BS.
The combined overall vertical (elevation) uncertainty of the geodetic control was determined from the vertical PTP errors from the two static measurements at DRN (0.0353 and 0.0353 m, respectively) at the 68 percent confidence level—the combined uncertainty value is 0.0353 m at the 68 percent confidence level and 0.0692 m at the 95 percent confidence level (Egeodetic; table 4). The vertical uncertainty of FENO–BS was not considered for this error estimate because FENO–BS was only used to establish a reliable geodetic azimuth (horizontal orientation) for the survey control network.
Overall Relative Error Estimate of the Combined Point Cloud
The overall relative uncertainty of the combined point cloud (Erelative) in the horizontal and vertical dimensions at the 95 percent confidence level was determined by the following equation, which has been modified from Collins and others (2009, 2014):
whereErelative
is the overall relative error estimate for the combined point cloud,
Econtrol
is the error estimate associated with the positional uncertainty of the network-control points,
Esurvey
is the error estimate associated with the positional uncertainty associated with the scan stations (temporary benchmarks and network-control points), and
Elaser
is the error estimate associated with the accuracy of the scanning laser of the total station.
For future change detection applications on the Tribal lands, which is determining the difference between similar points clouds (or derivative surfaces) collected during two different periods, the relative error (as opposed to absolute error, discussed in the “Overall Absolute Error Estimate of the Point Cloud” section of this report) is used to compute the change detection error threshold. This threshold is critical to understanding the uncertainty of the change estimates computed from the comparison of two (or more) point clouds with respect to spatial distribution and magnitude (volume changes). For example, where and how much sand was eroded from (or deposited to) a section of beach following a large coastal storm can be determined by comparing the baseline point cloud (collected before the storm) against the point cloud collected after the storm.
Relative error can only be used for multiepoch (temporal) change detection studies if the same control points used for the collection of the baseline point cloud are also used for the collection of the subsequent point cloud (for example, collection of a poststorm point cloud to determine volume loss along a section of shoreline). However, if the network-control points are damaged, destroyed, or cannot be recovered, then the control would need to be reset and the error assessment would be based on the overall absolute error estimate (Collins and others, 2014).
Overall Absolute Error Estimate of the Combined Point Cloud
The overall absolute uncertainty of the combined point cloud in the horizontal and vertical dimensions at the 95 percent confidence level was determined by the following equation:
whereEabsolute
is the overall absolute error estimate for the combined point cloud,
Econtrol
is the error estimate associated with the positional uncertainty of the network-control points,
Esurvey
is the error estimate associated with the positional uncertainty associated with the scan stations (temporary benchmarks and network-control points),
Elaser
is the error estimate associated with the accuracy of the scanning laser of the total station, and
Egeodetic
is the error estimate associated with the GNSS measurements.
The calculation of the overall absolute error for the combined point cloud (Eabsolute) includes the three error sources used to calculate the relative error (Econtrol, Esurvey, and Elaser) combined with the positional error associated with the geodetic control (Egeodetic) for the horizontal and vertical dimensions (0.0576 and 0.0692 m, respectively) at the 95 percent confidence level (table 4). The absolute error is critical when, for example, comparing or overlaying the point cloud on other data products, such as airborne lidar or aerial photographs (Collins and others, 2014). The overall absolute uncertainty of the combined point cloud is 0.0598 and 0.0733 m in the horizontal and vertical dimensions, respectively, at the 95 percent confidence level.
Discussion of Error
More than 90 percent of the overall relative error estimate (Erelative) of the combined point cloud for the horizontal and vertical dimensions is from the positional uncertainty of the survey control points (Econtrol) and the scan stations (Esurvey; table 4). This uncertainty is measured in the field and is indicated in the backsight-check residual, which is the difference between the known and observed coordinates of the station and backsight. All the backsight-check residuals for the network-control points (Econtrol) are within the 95 percent confidence level (0.0111 and 0.0108 m for the horizontal and vertical values, respectively) of the known value (tables 3 and 4). The following sections describe potential sources of error of the backsight-check residuals for the scan stations (Esurvey) that exceeded the known value at the 95 percent confidence level.
Out of 27 backsight-check residuals for the horizontal positional uncertainty of the scan stations (Esurvey h), 25 (about 93 percent) are within 0.009 m (table 3) of the known value (tables 3 and 4). These residuals include observations between network-control points and observations between temporary benchmarks and network-control points. The largest residual was observed at TBM–200 (0.011 m; table 3), which was established using a resection (see the “Scanning Total Station” section of this report). Resections are dependent on the positional uncertainty of two (or more) control points, which can introduce additional error (as compared to a traditional station setup, when the station and backsight have been previously surveyed) into the backsight-check residual. A traditional backsight measurement is typically not made from the scan station established with a resection; experience and observation indicate a check to an independent control point (not used for the computation of the resection) is typically best practice to evaluate the positional uncertainty of the station (Noll and Rydlund, 2020). Resection was only used to establish one scan station during the collection of the point clouds during summer and fall 2022.
The second-largest horizontal residual measured from a scan station was observed between FENO–08 and DRS (0.009 m), which is anomalous because both points are part of the highly precise survey control network; at least four horizontal angle and distance measurements were made between the control points during the traverse (DRST–Cuffee) and were subsequently (potentially) improved with a Bowditch-rule adjustment. A residual of 0.005 m, which is about 0.004 m less than the backsight-check residual observed during summer 2022, was measured between FENO–08 (station) and DRS (backsight) with face 1 and face 2 observations during a subsequent survey in winter 2023. This indicates a potential face 1 pointing error of the total station’s ATR system, a centering error, or leveling error, or both, of the bipod-mounted, fixed-height pole at DRS during the backsight check that was observed during summer 2022. A gust of wind may have also pushed the fixed-height pole slightly off-center, out of level, or both before the backsight check.
Out of 27 of the backsight-check residuals for the vertical positional uncertainty of the scan stations (Esurvey z), 25 (about 93 percent) are within 0.0204 m of the known value (tables 3 and 4). Scan stations TBM–311 and TBM–312 had residual values of 0.029 and 0.039 m, respectively, and were set from FENO–02 at the northern end of the project site near the coastal spit (fig. 2). The measurement (slope) distance between FENO–02 and TBM–311 is about 211.2 m, and the distance between FENO–02 and TBM–312 is about 217.6 m (fig. 2; table 3). These two measurement distances are the longest of any measurement distances between a network-control point and a temporary benchmark.
A pointing error may have been introduced if the ATR was affected by gusty winds or other environmental conditions. A pointing error is an angular uncertainty and is proportional to the measurement distance. Typically, when using an instrument with an ATR system, if a pointing error is introduced in face 1 instrument orientation, the face 2 observation would correct the error because the face 1 and face 2 measurements are equivalent but in opposite directions. For example, missing a target high and right in face 1 would be corrected in face 2 with a low and left measurement. Face 2 measurements were not collected during any backsight checks for the summer and fall 2022 surveys; therefore, the backsight-check residual represents the face 1 measurement only. Wind gusts may have also affected the centering and leveling of the fixed-height pole at TBM–311 and TBM–312 when the temporary benchmark was established. Furthermore, after the temporary benchmark was established in the dynamic surf zone, which is characterized by a wet and loose mixture of gravels, sands, and silts, the hub and tack may have become unstable.
The positional uncertainty of the network-control points (Econtrol) was nearly equivalent for the horizontal (0.0111 m) and vertical (0.0108 m) control points at the 95 percent confidence level. As described by Noll and Rydlund (2020), four height differences—two reciprocal observations from the forward running and two reciprocal observations from the backward running of the DRST—were averaged to determine a final height difference between directly connected control points along a leveling section (fig. 2). This workflow substantially improved the vertical misclosure of the network-control points, therefore, decreasing the positional uncertainty. Reciprocal observations were not observed to establish temporary benchmarks; this may explain the discrepancy between the vertical uncertainty of the network control (Econtrol z; 0.0108 m) and the vertical uncertainty of the scan stations (Esurvey z; 0.0204 m).
If a GNSS was used to establish the network, the positional uncertainty of the control points would likely increase (Rydlund and Noll, 2017) and the vertical uncertainty would likely be greater than the horizonal uncertainty. Position dilution of precision, which represents the geometry of the GNSS satellite constellation and its effect on precision, will generally affect vertical precision of GNSS observations more than the horizontal precision. For this study, GNSS observations were used only to establish an origin point and baseline for the terrestrial surveys. A total station was used to establish the survey control network to avoid introducing additional error that may be associated with GNSS measurements.
Conclusion
Scanning total stations may have a variety of applications for geospatial data collection in the USGS because centimeter-level accuracy can be obtained without the need for substantial postprocessing to orient and align adjacent point clouds using traditional methods, such as a cloud-based or target-based registration. The scanning total station used for this project can field-register point clouds in real time using previously surveyed points for orientation. However, the positional uncertainties of the field-registered point clouds are substantially dependent on the positional error of the scan station. This error is indicated by the backsight-check residual, which is the difference between the known and measured coordinates of station and backsight. Random and systematic errors associated with the equipment, operator, procedures, and the environment can affect the amount of the residual error.
A precision survey control network is crucial because positional error in the control will propagate to the scan stations and ultimately to the point cloud. For projects that require a higher level of accuracy (decimeter versus centimeter level), it is recommended that terrestrial surveying methods (such as a total station) are used to establish the network control and reduce amount of positional uncertainty that may be associated with satellite-based surveying methods (such as real-time GNSS). In practice, the positional uncertainty of the real-time GNSS observations can be much higher than the total station observations. Using this project as an example, the horizontal positional uncertainty associated with the RTN GNSS measurements was 0.0289 m as compared to the horizontal positional uncertainty (established with the total station) of the survey control network (Esurvey h), which was 0.006 m.The uncertainty of the total station observations was more accurate than the RTN GNSS measurements by a factor of about five. If a more labor-intensive satellite-based surveying method is used to establish control, such as a GNSS network survey (Rydlund and Densmore, 2012), positional uncertainty can be reduced but still may not approach the level of precision that can be obtained by a trained surveyor who applies less error-prone field methods to a well-calibrated, survey grade total station.
The scanning total station used for this study does not have the capability to collect later-time returns of laser pulses. It only can send, receive, and process a single pulse returned from a target object as opposed to collecting multiple returns from the same location. A single return of a laser pulse may be adequate for many engineering applications such as creating an as-built survey of a city intersection but may not be sufficient for environmental applications such as the collection of bare-earth data for the purpose of creating a digital elevation model and detecting change over time. Later time (also known as last returns) returns of lasers pulses travel further distances than first-return laser pulses and are more likely to reflect off bare-earth surfaces. Identifying points in the cloud that represent the bare-earth surface requires manual scrutiny during postprocessing because at the time of this writing, technology capable of registering point clouds in real time while collecting multiple signal returns does not exist.
Selected References
Berntsen International Inc., 2023a, 9/16” stainless steel rod monument w/ floating sleeve: Berntsen International, Inc. web page, accessed January 3, 2023, at https://www.berntsen.com/Surveying/Survey-Monuments/Top-Security-Sleeve-Rod-Monuments/9-16-Stainless-Steel-Top-Security-Sleeve-Monument.
Berntsen International Inc, 2023b, FENO F1000SPK drive-in spike survey marker: Berntsen International, Inc. web page, accessed January 3, 2023, at https://www.berntsen.com/Surveying/Survey-Monuments/FENO–Survey-Monument/FENO–Spike/ctl/ViewProduct/mid/630/itemID/464.
Brenner, O.T., Hapke, C.J., Lee, K.G., and Kimbrow, D.R., 2016, Terrestrial-based lidar beach topography of Fire Island, New York, June 2014: U.S. Geological Survey Data Series 980, accessed September 11, 2023, https://doi.org/10.3133/ds980.
Brinker, R.C., and Minnick, R., eds., 1995, The surveying handbook (2d ed.): New York, Chapman & Hall, 967 p. [Also available at https://doi.org/10.1007/978-1-4615-2067-2.]
Capurso, W.D., Noll, M.L., and Chu, A., 2024, Three-dimensional point cloud data collected with a scanning total station on the western shoreline of the Shinnecock Nation Tribal lands, Suffolk County, New York, 2022: U.S. Geological Survey data release, https://doi.org/10.5066/P9OG0AAO.
Collins, B.D., Corbett, S.C., Sankey, J.B., and Fairley, H.C., 2014, High-resolution topography and geomorphology of select archeological sites in Glen Canyon National Recreation Area, Arizona: U.S. Geological Survey Scientific Investigations Report 2014–5126, 31 p., accessed July 12, 2023, at https://doi.org/10.3133/sir20145126.
Collins, B.D., Minasian, D., and Kayen, R., 2009, Topographic change detection at select archeological sites in Grand Canyon National Park, Arizona, 2006–2007: U.S. Geological Survey Scientific Investigations Report 2009–5116, 58 p. [Also available at https://doi.org/10.3133/sir20095116.]
Federal Geodetic Control Committee, 1984, Standards and specifications for geodetic control networks: National Oceanic and Atmospheric Administration, 34 p., accessed March 9, 2010, at https://www.ngs.noaa.gov/FGCS/tech_pub/1984-stds-specs-geodetic-control-networks.pdf.
Federal Geographic Data Committee, 1998a, Geospatial positioning accuracy standards part 2—Standards for geodetic networks: Federal Geographic Data Committee FGDC–STD–007.2–1998, 9 p. [Also available at https://www.fgdc.gov/standards/projects/FGDC-standards-projects/accuracy/part2/chapter2.]
Federal Geographic Data Committee, 1998b, Geospatial positioning accuracy standards part 4—Standards for architecture, engineering, construction (A/E/C) and facility management: Federal Geographic Data Committee FGDC–STD–007.4–2002, 19 p. [Also available at https://www.fgdc.gov/standards/projects/accuracy/part4/FGDC-endorsed-standard.]
Grimm, D., Kleemaier, G., and Zogg, H.-M., 2015, ATRplus—White paper: Heerbrugg, Switzerland, Leica Geosystems AG, 11 p., accessed April 2, 2019, at https://globalsurvey.co.nz/wp-content/uploads/2014/10/ATRplus_WP.pdf.
National Geodetic Survey, 2022, OPUS—Online positioning user service: National Oceanic and Atmospheric Administration database, accessed September 25, 2022, at https://www.ngs.noaa.gov/OPUS.
National Geodetic Survey, 2023, CORS map: National Geodetic Survey interactive map, accessed January 3, 2023, at https://geodesy.noaa.gov/CORS_Map/.
Noll, M.L., and Chu, A., 2017, Detecting temporal change in land-surface altitude using robotic land-surveying techniques and geographic information system applications at an earthen dam site in southern Westchester County, New York: U.S. Geological Survey Open-File Report 2017–1028, 15 p., accessed July 12, 2023, at https://doi.org/10.3133/ofr20171028.
Noll, M.L., and Rydlund, P.H., 2020, Procedures and best practices for trigonometric leveling in the U.S. Geological Survey: U.S. Geological Survey Techniques and Methods, book 11, chap. D3, 94 p., accessed July 12, 2023, at https://doi.org/10.3133/tm11D3.
Noll, M.L., Rivera, S.L., and Busciolano, R., 2016, Hydrologic assessment of the shallow groundwater flow system beneath the Shinnecock Nation Tribal lands, Suffolk County, New York: U.S. Geological Survey Scientific Investigations Report 2016–5110, 44 p., accessed July 12, 2023, at https://doi.org/10.3133/sir20165110.
Parris, A., Bromirski, P., Burkett, V., Cayan, D., Culver, M., Hall, J., Horton, R., Knuuti, K., Moss, R., Obeysekera, J., Sallenger, A., and Weiss, J., 2012, Global sea level rise scenarios for the United States national climate assessment: National Oceanic and Atmospheric Administration Technical Memorandum OAR CPO–1, 29 p. [Also available at https://toolkit.climate.gov/reports/global-sea-level-rise-scenarios-united-states-national-climate-assessment.]
Rydlund, P.H., Jr., and Densmore, B.K., 2012, Methods of practice and guidelines for using survey-grade global navigation satellite systems (GNSS) to establish vertical datum in the United States Geological Survey: U.S. Geological Survey Techniques and Methods, book 11, chap. D1, 102 p., 4 apps., accessed July 19, 2016, at https://doi.org/10.3133/tm11D1.
Rydlund, P.H., Jr., and Noll, M.L., 2017, Vertical datum conversion process for the inland and coastal gage network located in the New England, mid-Atlantic, and south Atlantic-gulf hydrologic regions (ver. 1.1, July 2017): U.S. Geological Survey Techniques and Methods, book 11, chap. B8, 29 p., accessed July 12, 2023, at https://doi.org/10.3133/tm11B8.
Shinnecock Indian Nation, 2013, Climate change adaptation plan: Shinnecock Indian Nation, 25 p., accessed January 27, 2021, at https://www.epa.gov/sites/default/files/2016-09/documents/shinnecock_nation_ccadaptation_plan_9.27.13.pdf.
Shinnecock Indian Nation, 2022, Shinnecock Indian Nation—Always sovereign: Shinnecock Indian Nation web page, accessed March 3, 2023, at https://www.shinnecock-nsn.gov/.
Trimble, Inc., 2017, Trimble S6 total station: Trimble, Inc. web page, accessed July 10, 2017, at https://www.trimble.com/Survey/trimbles6.aspx/.
Trimble, Inc., 2022b, Trimble SX12 scanning total station: Trimble, Inc. web page, accessed September 18, 2022, at https://geospatial.trimble.com/products-and-solutions/trimble-sx12/.
Trimble, Inc., 2022c, Trimble traverse kit: Trimble, Inc. data sheet, 1 p., accessed September 19, 2022, at http://trl.trimble.com/docushare/dsweb/Get/Document-928187/022516-483_Trimble_Traverse%20Kit_DS_A4_1019_LR.pdf.
U.S. Army Corps of Engineers, 1999, Morphology and historical behavior, report 1 of Shinnecock inlet, New York, site investigation: U.S. Army Corps of Engineers Technical Report CHL–98–32, 226 p., accessed April 25, 2023, at https://apps.dtic.mil/sti/pdfs/ADA368662.pdf.
U.S. Army Corps of Engineers, 2007, Control and topographic surveying, in Engineering and design: U.S. Army Corps of Engineers Engineer Manual 1110–1–1005, 498 p. [Also available at https://www.publications.usace.army.mil/portals/76/publications/engineermanuals/em_1110-1-1005.pdf.]
Datums
Horizontal coordinate information is referenced to the North American Datum of 1983 (NAD 83).
Vertical coordinate information is referenced to the North American Vertical Datum of 1988 (NAVD 88).
Elevation, as used in this report, refers to a height referenced to the vertical datum.
Benchmark, as used in this report, refers to a survey marker with a precise horizontal and vertical coordinate that is referenced to a datum.
Abbreviations
ATR
automatic target recognition
CORS
continuously operating reference station
DRN
deep rod north
DRS
deep rod south
DRST
double-run spur traverse
GNSS
Global Navigation Satellite System
lidar
light detection and ranging [remote sensing]
NGS
National Geodetic Survey
OPUS
Online Positioning User Service
ppm
part per million
PTP
peak-to-peak
RMSE
root mean square error
RTN
real-time network
USGS
U.S. Geological Survey
For more information, contact
Director, New York Water Science Center
U.S. Geological Survey
425 Jordan Road
Troy, NY 12180–8349
dc_ny@usgs.gov
or visit our website at
https://www.usgs.gov/centers/ny-water
Publishing support provided by the Pembroke Publishing Service Center
Disclaimers
Any use of trade, firm, or product names is for descriptive purposes only and does not imply endorsement by the U.S. Government.
Although this information product, for the most part, is in the public domain, it also may contain copyrighted materials as noted in the text. Permission to reproduce copyrighted items must be secured from the copyright owner.
Suggested Citation
Noll, M.L., Capurso, W.D., and Chu, A., 2024, Accuracy assessment of three-dimensional point cloud data collected with a scanning total station on Shinnecock Nation Tribal lands in Suffolk County, New York: U.S. Geological Survey Scientific Investigations Report 2024–5027, 23 p., https://doi.org/10.3133/sir20245027.
ISSN: 2328-0328 (online)
Study Area
| Publication type | Report |
|---|---|
| Publication Subtype | USGS Numbered Series |
| Title | Accuracy assessment of three-dimensional point cloud data collected with a scanning total station on Shinnecock Nation Tribal lands in Suffolk County, New York |
| Series title | Scientific Investigations Report |
| Series number | 2024-5027 |
| DOI | 10.3133/sir20245027 |
| Year Published | 2024 |
| Language | English |
| Publisher | U.S. Geological Survey |
| Publisher location | Reston, VA |
| Contributing office(s) | New York Water Science Center |
| Description | Report: vii, 23 p.; Data Release |
| Country | United States |
| State | New York |
| County | Suffolk County |
| Online Only (Y/N) | Y |
| Additional Online Files (Y/N) | N |
| Google Analytic Metrics | Metrics page |