

Dissolved Arsenic Concentrations in Surface Waters Within the Upper Portions of the Klamath River Basin, Oregon and California
Links
- Document: Report (11 MB pdf) , HTML , XML
- Data Release: USGS Data Release - Dissolved arsenic, copper and lead concentrations in surface water within the Klamath Basin (ver 4.0, April 2023)
- Download citation as: RIS | Dublin Core
Acknowledgments
The authors are grateful to Gunter Schanzenbacher and Matthew Kritzer from the Bureau of Reclamation (Reclamation), and to Kristi Hill, Eric Hepler, Veronika Kocen, and Emily Zeirdt Smith from the U.S. Geological Survey (USGS) for their help with field collection. Derek Caro and Josh Parris, both former National Association of Geoscience Teachers (NAGT) interns, also provided crucial assistance with field sampling. We thank Kelsey Crocker (USGS) for her assistance with the GIS-based figures. Funding was provided by Reclamation and the USGS National Water Quality and Water Availability and Use Science Programs. Chauncey Anderson, Kurt Carpenter, and Annett Sullivan from the USGS Oregon Water Science Center provided comparative data and valuable comments on the study results and interpretation. Review comments by Terry Short, Jim Kuwabara, and Annett Sullivan (USGS) are much appreciated.
Abstract
Arsenic toxicity is an environmental health problem. Levels of arsenic in surface waters at some locations in the Klamath River Basin in southern Oregon and northern California can exceed the U.S. Environmental Protection Agency (EPA) standard for drinking water. There are both anthropogenic and natural sources of arsenic. The Klamath River Basin consists primarily of volcanic deposits and contains an underground geothermal system with hot springs and warm water wells, all known natural sources of arsenic. Anthropogenic sources of arsenic are related to the agricultural use of herbicides, fungicides, and insecticides. Surface water arsenic levels can also be affected by fertilizer amendments, evaporative concentration, oxygen-level depletion, and various geochemical transformations that can increase arsenic mobilization.
In this study by the U.S. Geological Survey and the Bureau of Reclamation, dissolved concentrations of arsenic, copper, and lead were measured in surface waters at 39 unique sites within the upper portions of the Klamath River Basin between 2018 and 2022. In every year, except 2022, sites were sampled four times between April and November. Surface-water arsenic concentrations varied up to four-orders of magnitude among sites. Median arsenic concentration was lowest at Cherry Creek (0.03 micrograms per liter [µg/L]) and highest at Wood Kimball Spring (36.7 µg/L), two sites located north of Upper Klamath Lake. The highest arsenic concentrations (17.4±4.9 µg/L, n=3) were found in drain sites (defined here as a waterbody returning used irrigation water) while the lowest arsenic concentrations were found in an artesian well (0.8 µg/L, n=1). The elevated arsenic concentrations of the drain sites suggests that arsenic might be sourced or mobilized by agricultural activities, water re-use practices, and (or) by geochemical processes occurring around water stored in drains (that that is, in the water column and across sediment water boundaries). Other potential sources of arsenic in drain water in the Klamath Strait Drain area include water used for irrigation originating from Ady Canal and nearby geothermal waters.
Seasonal differences in surface-water arsenic concentrations were detected at 13 sites, 10 of which had higher arsenic concentrations in summer than in either spring or fall. The sites sampled around Upper Klamath Lake, the impounded rivers, one of the two canal sites, and 5 of the 14 river sites had higher surface-water arsenic concentrations in the summer than in either spring or fall. Surface-water arsenic concentrations from groundwater sources (that is, springs and in the artesian well) did not vary significantly among seasons (p-values greater than 0.1).
Median surface-water concentrations of copper and lead ranged from 0.03 to 3.7 µg/L, and from 0.013 to 0.175 µg/L (n=2–18), respectively. Dissolved concentrations of both metals were below acute toxicity endpoints reported by the EPA for freshwater animals. Surface-water arsenic concentrations varied independently from corresponding changes in surface-water lead or copper concentrations. However, arsenic concentrations measured in bed-sediment samples collected from a subset of sites located north of Upper Klamath Lake correlated strongly and significantly with the corresponding sedimentary lead concentrations (p=0.015).
Aqueous arsenic speciation measured in a subset of sites in 2019 and 2022 showed that all the arsenic existed as arsenic (V), the most oxidized arsenic species, and presumably, the least toxic. The highest proportions of arsenite (As(III)), the presumably most toxic arsenic species, relative to total arsenic concentrations were found at drain sites.
Our assessment of dissolved arsenic concentrations in various surface-water bodies in the Upper Klamath River Basin reveals geographical areas of consistently low (below 2.1 µg/L), moderate (below 10 µg/L) and high (above 10 µg/L) surface-water arsenic concentrations. South of Upper Klamath Lake, surface-water arsenic concentrations were consistently higher than 20 µg/L at two drain sites located in an area of predominant agricultural land use with extensive water re-use practices. North of Upper Klamath Lake, surface-water arsenic concentrations greater than 20 µg/L were consistently measured at sites with limited nearby agricultural activities, suggesting a geogenic source. The consistently high arsenic levels from the Wood River at Jackson F. Kimball State Park, Fort Creek, and Crooked Creek, which are sites located at or near headwater spring sources, suggest a natural background source of arsenic. Water flowing downstream from this area could be a potential source of arsenic to Upper Klamath Lake and the Upper Klamath River.
Introduction
Arsenic toxicity is an environmental health problem. Acute exposure to arsenic in humans can cause severe toxicity. Symptoms of acute toxicity include gastrointestinal discomfort, vomiting, convulsions, cancer, coma, and death (Hughes 2002; Choudhury and others, 2018). Chronic exposure to inorganic arsenic can elicit subacute adverse effects that include skin lesions, cirrhosis, and diabetes (Hughes, 2002). In the United States, exposure to arsenic in drinking water has been identified as a health concern in states where bedrock contains naturally high levels of arsenic. The U.S. Environmental Protection Agency (EPA) and World Health Organization have set the drinking water arsenic standard to 10 parts per billion (10 micrograms per liter [µg/L]) to mitigate effects of long-term arsenic exposure to humans (EPA, 2001). More stringent criteria have also been established by states. For instance, the human health water-quality criterion (WQC) for arsenic set by the Oregon Department of Environmental Quality (DEQ) is 2.1 µg/L (Sturdevant, 2011).
Arsenic occurs naturally in the Earth’s crust. Shales, slates, hydrothermal ore deposits, and volcanic rocks are commonly associated with elevated groundwater arsenic levels (Smedley and Kinniburgh, 2002). More than 245 minerals contain arsenic (Bissen and Frimmel, 2003). The most common type of arsenic minerals are sulfide minerals, which includes arsenopyrite (O’Day, 2006). As gold tends to associate with pyrite and arsenopyrite, arsenic is also often found in association with gold deposits (for example, Kuwabara others, 1990). Arsenic from geogenic sources can be mobilized by a variety of processes including alkaline desorption, anionic competition, reactive glass dissolution, and reductive dissolution of iron oxides (Ferreira, 2016).
In western Oregon, there are well-documented occurrences of geogenic arsenic contamination of groundwater. For example, Stoner and others (1977) reported arsenic levels exceeding the EPA drinking water criterion of 10 parts per billion (10 µg/L; EPA, 2001) in 53 of 174 surveyed wells. Hinkle and Polette (1999) reported exceedances of the EPA drinking water limit of 50 µg/L (at the time in 1999) in 8 percent of groundwater samples (n=728) collected in the Willamette Basin. Arsenic mobilized from volcanic tuffs and tuffaceous sediments from the late Eocene and Oligocene Fisher and Oligocene Eugene Formations, and the Oligocene and early Miocene Little Butte Volcanics explained these high arsenic groundwater concentrations (Hinkle and Polette, 1999; Ferreira 2016). The Upper Klamath Basin is also composed largely of volcanic rocks (Gannett and others, 2007). Klamath Basin studies have shown variable but occasionally high concentrations of arsenic in water (Sorenson and Schwarzbach, 1991; Kuwabara and others, 2016). Similar to arsenic contamination in western Oregon, arsenic exceedances of the EPA drinking-water limit have been largely ascribed to the natural geologic conditions of the Klamath Basin (Sorenson and Schwarzbach, 1991; Oregon DEQ, 2019).
Aside from atmospheric input from smelting operations and fossil-fuel combustion (Cullen and Reimer, 1989), common anthropogenic sources of arsenic to the environment include agricultural uses of herbicides, fungicides, and pesticides as well as wood preservatives (Bissen and Frimmel, 2003). For instance, arsenical herbicides have been widely applied to cotton fields, orchards, golf courses, and to dry out plants before harvesting. Prior to the introduction of dichlorodiphenyltrichloroethane (DDT) in 1947, arsenate pesticides (including lead [Pb] arsenate, copper [Cu] arsenate, and calcium [Ca] arsenate) were commonly used in agriculture (Bissen and Frimmel, 2003; Hughes and others, 2011). Although they were banned in 1988 by the EPA due to the poisonous nature of arsenic compounds, surface-reactive arsenic may persist in agricultural soils due to prior pesticide application.
Agriculture is a vital activity in the Klamath region. There are approximately 557,000 acres of privately owned land used for farming; nearly 6 percent of the Klamath Basin total land (https://sciencepolicy.colorado.edu/klamathbasin/background/physical.html). Numerous hydrological features such as irrigation ditches, canals, and reservoirs are used to capture, store, and divert surface water to supply farmers with irrigation water, especially south (down gradient) of Upper Klamath Lake. In addition to possible anthropogenic sources of arsenic to surface waters, the physicochemical conditions of the water, and adjacent bed sediments associated with these waterbodies affected by agricultural activities, can favor arsenic mobilization, accumulation, and concentration. For instance, water evaporation, or evapoconcentration, can increase solute concentrations (Ong and others, 1995), while fertilizer amendments can influence arsenic speciation and mobility (Battaglia-Brunet and others, 2021). Arsenic can also be mobilized by favorable pH values, redox conditions, temperatures, and solute concentrations, including phosphate and organic matter (Smedley and Kinniburgh, 2002; Campbell and Nordstrom 2014). Diurnal variations in pH due to photosynthetic activity can further affect surface-water arsenic concentrations by influencing adsorption-desorption reactions at mineral surfaces (Fuller and Davis, 1989).
Arsenic often changes forms as it moves through the aqueous environment. Depending on the biological, chemical, and geological conditions, arsenic can be present as different chemical species, including arsenite (arsenic(III)), arsenate (arsenic(V)), and organic species such as monomethylarsonate (MMA), and dimethylarsinate (DMA) (Bissen and Frimmel, 2003). Methylated forms of arsenic are thought to result from detoxification processes (Thirunavukkarasu and others, 2002). Although the inorganic forms of arsenic usually dominate in natural freshwaters, organic arsenic species can be important in eutrophic systems (Rahman and Hasegawa, 2012). Arsenic(V) is the thermodynamically stable state in oxic waters, while arsenic(III) is predominant in reducing conditions (Cullen and Reimer, 1989). The biological availability and toxicological effects of arsenic depend on its chemical forms, and not on the total aqueous arsenic concentration (Cullen and Reimer, 1989). For example, inorganic arsenic has a high toxicity level and increases cancer risks (Hughes, 2002), whereas methylated forms of arsenic are generally considered non-toxic (Thirunavukkarasu and others, 2002). Although toxicity of arsenic(III) is in general greater than that of arsenic(V), mechanisms of toxicity for both inorganic redox states have been well studied (Hughes, 2002).
In this study, the U.S. Geological Survey (USGS) and Bureau of Reclamation (Reclamation) measured dissolved concentrations of arsenic, copper, and lead in surface waters at 39 sites within the Upper Klamath Basin between 2018 and 2022. Because surface-water lead and copper concentrations are naturally low in the region (Carpenter and others, 2009), their dissolved concentrations were used as potential proxies for lead- and copper-based arsenate pesticides. Except in 2022, sites were sampled four times per year, between late April and November, bracketing both the annual cyanobacterial bloom in Upper Klamath Lake and the most intensive agricultural season (Kuwabara and others, 2016). Data were used to provide an assessment of dissolved arsenic concentrations in various surface-water bodies in the Upper Klamath Basin, including Klamath Strait Drain, whose water is considered impaired, that is, section 303(d) listed under the Clean Water Act of 1972 (33 U.S.C. 1251 et seq.). Data were also used to help identify arsenic sources in the region and assess potential for arsenic toxicity at a subset of sites.
Methods
All glass and plastic materials used in the collection, preparation, and storage of the samples were cleaned thoroughly to remove metal contamination. Cleaning consisted of sequential immersion in a detergent bath for at least 24 hours, a rinse in deionized water, and then immersion in a 10-percent nitric acid (HNO3) bath. After at least 72 hours, immersed materials were rinsed three times with deionized water, followed by one final rinse with double-deionized water (approximately 18 megohm centimeter [MΩ cm] resistivity). Materials were then dried in a dust-free (HEPA filtered) positive-pressure environment. Prior to field collection, syringes were filled with double-deionized water and individually sealed in plastic bags.
Field Collection and Water Body Types
Surface water was collected at 39 sites located in the Upper Klamath Basin from 2018 to 2022 (fig. 1). Waterbody types included springs (6 sites), creeks (8 sites), rivers (14 sites), canals (2 sites), drains (defined here as a waterbody returning used irrigation water, 3 sites), river impoundments (2 sites), lakes (namely 3 sites on Upper Klamath Lake), and an artesian well (table 1). Except in 2022, sites were sampled four times per year between late April and November. Samples were collected only in April and June in 2022. Sampling occurred mostly over two consecutive days, and the listed date in tables 2–6 corresponds to the first day of sampling. Time of sample collection varied among sites, as samples were collected throughout the day. For 2020, 2021, and 2022, some sites were either sampled or re-sampled later in the month than the listed date. At each site, two replicate samples (replicate A and B) were collected in 250 milliliter (mL) high-density polyethylene (Nalgene, Rochester, New York) wide-mouth acid washed bottles. Immediately after sampling, water was drawn through Millipore Millex-GP 0.22-micrometer (µm) hydrophilic PES filters into Henke Sass Wolf (Tuttlingen, Germany) 60 mL acid washed syringes. Prior to filtration, double-deionized water was removed from the syringes. In 2022, field blanks were collected using a similar procedure. Filtered water samples collected for speciation analyses in 2022 were stored in acid-washed (5 percent hydrochloric acid [HCl]) brown bottles and acidified (1 percent HCl) on site. Filtered water samples were placed in bags and stored on ice in coolers. At each site, field parameters including temperature, pH, specific conductance, oxidation-reduction (redox) potential, and dissolved oxygen were measured using a Xylem YSI ProDSS sonde (Yellow Springs, Ohio).
In 2020, bed-sediment samples were collected from a subset of 7 sites from streambed deposits in areas near the bank using the procedure described in Axtmann and Luoma (1991). Sediments were sampled using an acid-washed polypropylene scoop and sieved onsite through a 63-µm polyester-mesh sieve. The finer fraction of sediment was collected in an acid-washed 500-mL polyethylene bottle and transported on ice to the USGS Metal Bioavailability laboratory (Menlo Park, California).
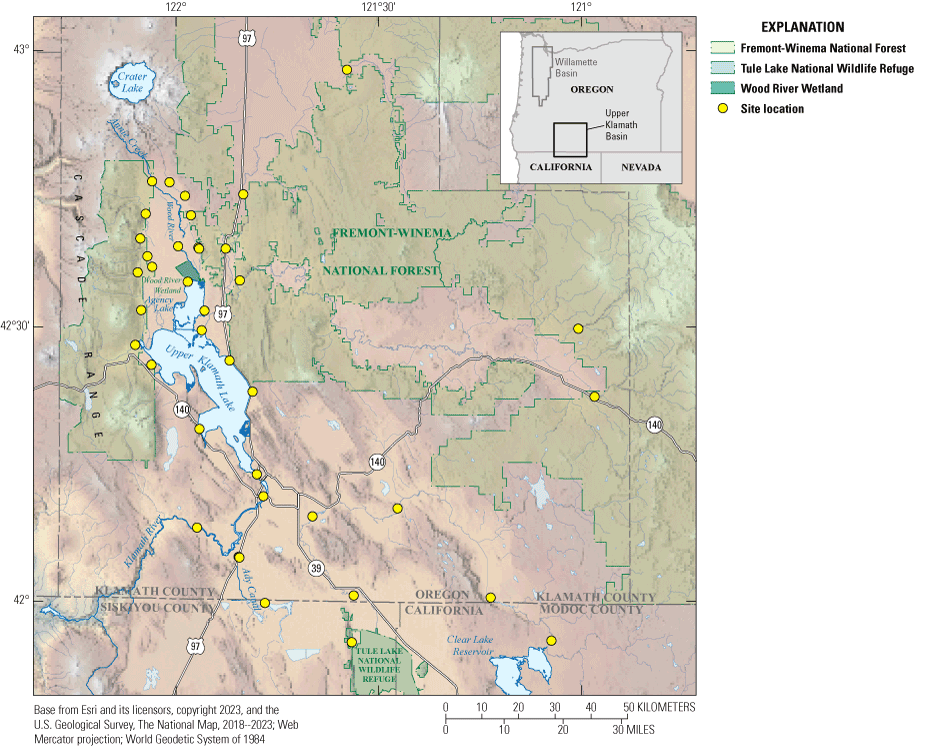
Location map of the 39 sampling sites in the Klamath Region, Oregon and California.
Table 1.
Locations of the 39 sampling sites in the Klamath Region, Oregon and California, and waterbody types at the site locations.[Coordinate information is referenced to the World Geodetic System 1984 (WGS 84), listed in decimal degrees. Canal, waterbody bringing water from rivers and lakes; drain, a waterbody returning used irrigation water. N, north; W, west; Reclamation, Bureau of Reclamation; KSD, Klamath Strait Drain; USGS, U.S. Geological Survey; TNC, The Nature Conservancy.]
Sample Preparation
In the laboratory, filtered water samples were acidified to 0.1 percent with double-distilled HNO3 and stored at 4 degrees Celsius (°C) until analyses. Sieved bed-sediment samples were oven dried at 60 °C and ground using an acid-washed, ceramic mortar and pestle. Aliquots of about 0.2–0.3 grams (g) of sediment from each sample were digested using a hot, concentrated HNO3 reflux according to methods described by Luoma and Bryan (1981). After a 2-week digestion period, samples were evaporated to dryness and reconstituted in 10 mL of 0.6 N (normal) HCl. Reconstituted samples were filtered through a 0.45-µm pore-size filter and diluted with 0.6 N HCl.
Metal Analyses
Water samples were analyzed for arsenic, copper, and lead by inductively coupled plasma mass spectrometry (ICP-MS) using a method adapted from Garbarino and Taylor (1996). Except for arsenic that has only one stable isotope, metal concentrations were inferred from two stable isotopes. To account for instrument drift and change in sensitivity, internal standardization was performed by addition of indium to all samples and standards, but not the calibration blanks. In 2018 and 2019, samples were analyzed using an autosampler which spiked each sample with the internal standard. Starting in 2020, samples were manually spiked with indium prior to analysis. External standards, serially diluted from ultrapure, single-element standards, were used to create calibration curves.
A subset of water samples collected in 2019 was sent to the USGS National Water Quality Laboratory (NWQL) in Lakewood, Colorado, for arsenic speciation analysis using liquid chromatography-inductively coupled plasma-tandem mass spectrometry (LC-ICP-MS/MS). In April 2022, samples collected from a subset of 12 sites were sent to the USGS Redox Chemistry Laboratory in Boulder, Colorado, for speciation analyses (namely arsenic(III) and total arsenic) by hydride-generation atomic absorption spectrometry (McCleskey and others, 2003, 2004).
Sediment samples were analyzed for arsenic, copper, and lead by inductively coupled plasma-optical emission spectrometry (ICP-OES), as described in Cain and others (2021). Solid-phase metal concentrations, in milligrams per kilogram (mg/kg), were calculated using the liquid phase concentrations (milligram per liter [mg/L]), the volumes of digested sample (mL), the dilution ratios and the sample dry weights (g).
Method Detection Limits
Method detection limits (MDL) and reporting levels (RL) for the ICP-MS were determined using the procedures outlined by Glaser and others (1981). For arsenic, copper, and lead, the MDLs ranged from 0.024 to 0.03 µg/L, 0.02 to 0.06 µg/L, and 0.005 to 0.04 ug/L, respectively (appendix 1). Data collected prior to 2021 were evaluated against MDLs and RLs determined in April 2021 whereas data collected in 2021 and 2022 were evaluated against MDLs and RLs determined in October 2021. Metal concentrations below MDLs were ascribed a value corresponding to half the MDL for the calculations and statistical analyses.
Quality Assurance
Samples prepared for ICP-MS and ICP-OES analysis were accompanied by certified reference materials issued by the National Research Council of Canada (NRCC) and standard reference samples issued by the USGS Branch of Quality Systems, Office of Water Quality. Analyses were preceded by instrument calibration, followed by quality-control checks during each analytical run (approximately every 10 samples).
Data Treatment
Replicate measurements of arsenic, copper, and lead concentrations were averaged for each sampling event and reported as a mean ± deviation. Deviation (DEV) was defined as the absolute value of the difference between measurements divided by 2. Some sites were not sampled at each sampling campaign. Reasons include restricted access or no water. Absence of data is reported as “NS” (not sampled) and single measurements are reported without DEV. In 2020, two sites (Fourmile Well and Upper 4-Mile) were re-sampled three weeks after the fall sampling event (Hill and others, 2021). Because only these two sites were sampled twice in the fall, and only in 2020, data collected in November 2020 were not included in the data analyses for consistency with other sites and years, and for minimizing risk of skewness. For collection years 2021 and 2022, metal analyses were reported twice in Hill and others (2021) for a given replicate sample at Sevenmile Guard (June 6, 2021), Fort Creek (September 1, 2021), Odessa (October 13, 2021) and Fourmile Well (May 24, 2021). Data for only one replicate were included in the compilations and statistical analyses.
Copper and lead concentrations greater than the reporting limits were used to calculate copper-63 (63Cu) to copper-65 (65Cu) ratios as well as lead-208 (208Pb) to lead-206 (206Pb) ratios. Concentrations of copper in samples collected at Fort Creek on June 24, 2020, and at South Fork Sprague on August 26, 2020, were discarded because of the high discrepancies between copper concentrations inferred from both copper isotopes (that is, 20- to 80-fold differences) or because copper concentrations varied by more than 70-fold between replicate samples. Similarly, lead concentration reported in one replicate sample collected at South Fork Sprague on August 26, 2020, was abnormally high (8 µg/L as opposed to less than [<] MDL in replicate sample) and thus excluded from the dataset. These elevated copper and lead concentrations were likely caused by inadvertent contamination.
Statistical Analysis
Boxplots of monthly metal-concentration averages were used to evaluate skewness and identify outliers in the dataset. Median (table 7) and annual arsenic, copper, and lead concentration means were calculated from monthly metal concentration-averages (tables 2–6). Variability in surface-water arsenic concentrations was evaluated using the grand means of the annual concentration averages and associated errors (that is, standard errors of the means divided by the grand means of the annual arsenic concentration averages, table 8). Data from Tecumseh, which was only sampled in 2022, were not included in the analyses. Duplicate measurements of sedimentary metal concentrations were averaged and summarized at each site as means ± standard error. Data for sites described as “impounded river” or as “lake” were combined for most statistical analyses.
Seasonal variation in arsenic concentrations was evaluated using either one-way analysis of variance (ANOVA) or Kruskal-Wallis non-parametric test when data failed the normality and equality of variance requirements after log-transforming the data. Pairwise multiple comparisons (either Holm-Sidak method or Dunn’s method) were used to identify significant differences in arsenic concentrations between seasons. Monthly arsenic concentration averages were ascribed to a season based on the day sampling occurred. Specifically, “Spring” was ascribed when sampling occurred from April to June 20, “Summer” was ascribed when sampling occurred between June 21 and September 20, and “Fall” was ascribed when sampling occurred after September 21. Exceptions to this categorization include the sampling events that occurred on September 19, 2018, and September 18, 2018 (only days prior to the autumnal equinox) that were ascribed as “Fall” category to ensure enough data in this category. Sites sampled only in the spring (that is, Modoc Point, Tecumseh, and William USGS) or for which data are missing for a season (that is, Sun Creek) were excluded from the analyses.
Medians and annual means for surface-water temperature, pH, specific conductance, dissolved-oxygen concentration, and redox potential were calculated from monthly averages. Differences among waterbody types for each of these physicochemical parameters were evaluated using one-way ANOVA or Kruskal-Wallis non-parametric test when data failed the normality and equality of variance requirements after log-transforming the data. Pairwise multiple comparisons (either Holm-Sidak method or Dunn’s method) were used to identify significant differences among waterbody types for each physicochemical parameter. Grand means, calculated from yearly averages, were used in the statistical analyses.
Patterns in the data and sources of variability were identified using a principal component analysis (PCA). Grand means of annual surface-water concentrations and physicochemical parameters at each site were used in the analysis. Modoc Point, Tecumseh, Fourmile Well, Upper 4-Mile, and William USGS were not included in the PCA because of the limited dataset for these sites.
Results
Sampling Site Locations
All 39 sampling sites (fig. 1) were in Klamath County, Oregon, around Upper Klamath Lake, except for three sites (PP-D Tule, KSD Headworks, and Lost Clear Dam) located in Northern California in Siskyou and Modoc Counties, respectively. PP-D Tule is near the Tule Lake National Wildlife Refuge while Lost Clear Dam is approximately 200 meters (m) downstream of Clear Lake Reservoir. Site locations extend almost to Crater Lake’s latitude to the north (42°50′ N.), to the California-Oregon border to the south, east of the Cascades to the west, and to the Fremont-Winema National Forest to the east.
The land cover of the studied area was dominated by agricultural fields to the southeast, and by forested areas to the west and north (fig. 2; USGS, 2021). To the east, land cover includes both forests and agricultural fields. The Klamath River basin comprises 10 million acres (Reclamation, 2021). Federal agencies such as the Bureau of Land Management, U.S. Department of Agriculture Forest Service, U.S. Fish and Wildlife Service, and the U.S. National Park Service own 6.2 million acres of the land (fig. 3). Privately owned lands account for 3.7 million acres, 15 percent of which (557,000 acres) are used for farming (https://sciencepolicy.colorado.edu/klamathbasin/background/physical.html).
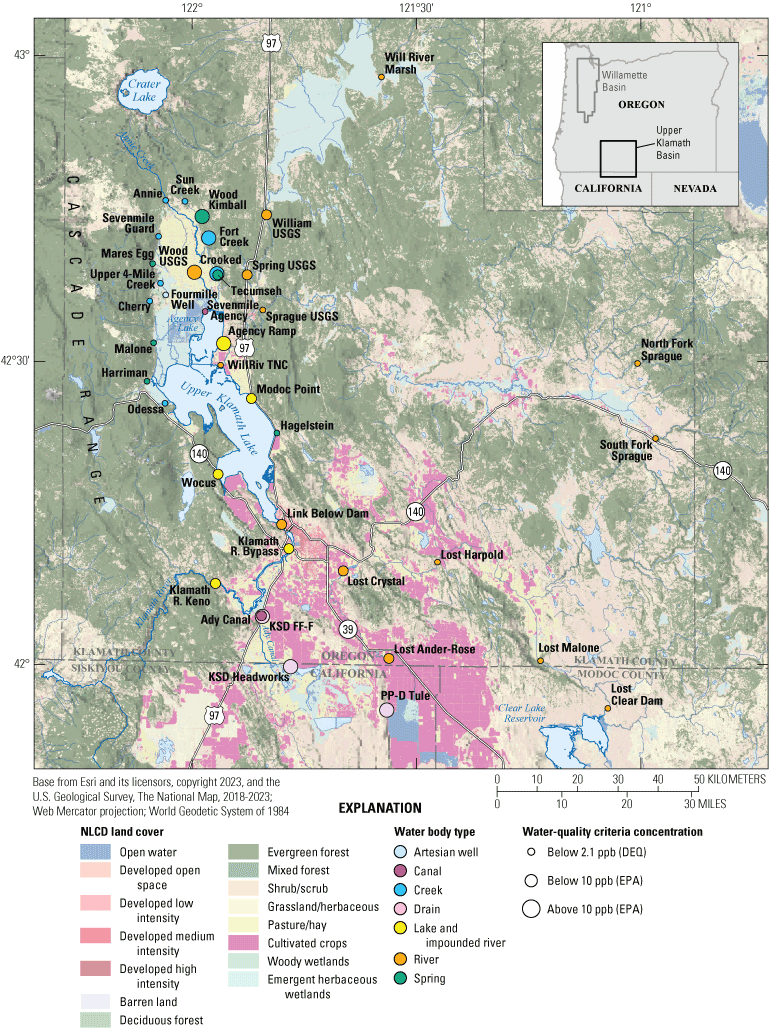
Location map of the arsenic sampling sites along with land cover in the Klamath River Basin, Oregon and California. The land cover of the studied area was dominated by agricultural fields to the southeast, and by forested areas to the west and north. To the east, land cover includes both forests and agricultural fields. Waterbodies at sampling sites are colored by type. Symbol sizes indicate median arsenic concentration (in parts per billion [ppb]) below or above water-quality criterion for the Oregon Department of Environmental Quality (DEQ) and U.S. Environmental Protection Agency (EPA). Land cover from the National Land Cover Database (NLCD) (U.S. Geological Survey, 2021).
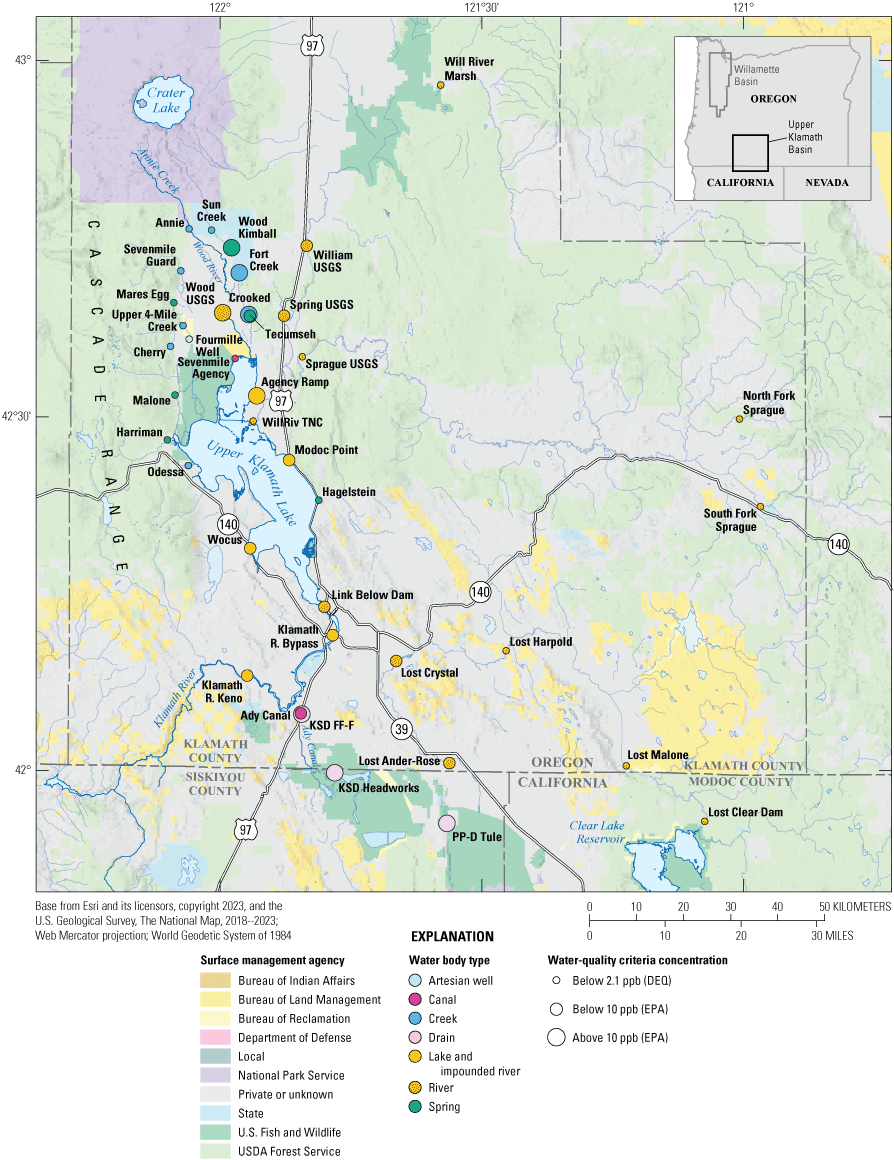
Location map of the arsenic sampling sites and land ownership in the Klamath Region, Oregon and California. A variety of Federal agencies own 6.2 million acres of land in this region. Privately owned lands account for 3.7 million acres, 15 percent of which are used for farming and account for nearly 6 percent of the Klamath Basin total land (https://sciencepolicy.colorado.edu/klamathbasin/background/physical.html). Waterbodies at sampling sites are colored by type. Symbol sizes indicate median arsenic concentration (in parts per billion [ppb]) below or above the water-quality criteria for the Oregon Department of Environmental Quality (DEQ) for human health and the U.S. Environmental Protection Agency (EPA) for drinking water. Data used for this map are from U.S. Bureau of Land Management (2023). USDA, U.S. Department of Agriculture.
Waterbody Types
Sample sites vary in their hydrological features (table 1). Six of the sampling sites were springs or a waterbody located meters away from a spring source, all of which were classified as “springs.” They included Hagelstein, Harriman, Malone, Mares Egg, Tecumseh, and Wood Kimball. Note that the Wood Kimball site is located about 50 meters downstream of what is considered the start of the Wood River, which emanates out of the ground from a spring. Spring water originates from aquifers overflowing to the surface. Spring-water quality depends on the type of rocks with which the groundwater is in contact and the quality of water recharging the aquifer (https://www.usgs.gov/special-topics/water-science-school/science/springs-and-water-cycle).
Rivers, as designated by their geographic names, were the most frequently sampled sites in this study. The 14 “river” sites included Link Below Dam, Lost Clear Dam, Lost Crystal, Lost Harpold, Lost Malone, Lost Ander-Rose, North Fork Sprague, South Fork Sprague, Sprague USGS, Spring USGS, Will River Marsh, William USGS, WillRiv TNC and Wood USGS (table 1). Note that the feature name for the stream where the Spring USGS site is located is called Spring Creek in table 1 even though it has more flow than some of the rivers. Although there is no technical difference between a river and a creek, rivers tend be larger flowing bodies than creeks (https://www.usgs.gov/special-topics/water-science-school/science/rivers-streams-and-creeks). Eight sampling sites belong to the “creek” category: Annie, Cherry, Crooked, Fort Creek, Odessa, Sevenmile Guard, Sun Creek, and Upper 4-Mile (table 1). Note that the Crooked and Fort Creek sites are located between 150 to several hundred meters downstream of where water emanates from the ground.
Sample sites also included “canal” and “drain” categories, the former defined as a waterbody bringing water from rivers and lakes, and the latter defined as a waterbody returning used irrigation water. One exception to this definition is the drain site “KSD Headworks” that can also receive water from the Lower Klamath Lake National Wildlife Refuge (A.B. Sullivan, USGS, written commun., March 8, 2023). However, for most of the study period, the Klamath area was in drought and the Lower Klamath Lake National Wildlife Refuge held water. Two of the sampling sites were canals (that is, Ady Canal, Sevenmile Agency), and three of the sampling sites were drains (that is, KSD FF-F, KSD Headworks, and PP-D Tule). It is worth noting that two sites, KSD FF-F, and Ady Canal are adjacent to each other, yet are different waterbody types. The former site, located east of Highway 97 (U.S. Route 97), is a drain returning irrigation water, whereas the latter site, located west of Highway 97, is sourced by the Klamath River water.
Sampling sites also included two impounded river sites on the Klamath River (Klamath R. Bypass and Klamath R. Keno). The sampling sites located on the shore of Upper Klamath Lake were ascribed as “lake.” They include Agency Ramp, Modoc Point and Wocus (table 1). Although Upper Klamath Lake is a natural lake, its outlet is dammed to control water level (at the Link River Dam). One artesian well was also sampled on the northwest side of the study area (that is, Fourmile Well). Water from artesian wells is directly sourced and flows from a groundwater aquifer.
Table 2.
Dissolved arsenic concentrations in surface-water samples collected in 2018 at 37 sites in the Klamath River Basin, Oregon and California.[Data from Hill and others (2021). Monthly concentrations are reported as mean ± deviation (n=2). Means for monthly concentrations were summarized and reported as annual mean ± standard error (SEM) (n=1–4). Metal concentrations below method detection limits (MDL) were ascribed a value corresponding to half the MDL for the calculations. Date in month/day/year format. µg/L, micrograms per liter; NS, not sampled; <MDL, concentration below method detection limit; KSD, Klamath Strait Drain; USGS, U.S. Geological Survey; TNC, The Nature Conservancy; —, not applicable]
Table 3.
Dissolved arsenic concentrations in surface-water samples collected in 2019 at 38 sites in the Klamath River Basin, Oregon and California.[Data from Hill and others (2021). Monthly concentrations are reported as mean ± deviation (n=2). Means for monthly concentrations were summarized and reported as annual mean ± standard error (SEM) (n=1–4). Metal concentrations below method detection limits (MDL) were ascribed a value corresponding to half the MDL for the calculations. Access to Modoc Point was problematic and the site was dropped in 2019 and replaced by Hagelstein. Date in month/day/year format. µg/L, micrograms per liter; NS, not sampled; <MDL, concentration below method detection limit; KSD, Klamath Strait Drain; USGS, U.S. Geological Survey; TNC, The Nature Conservancy; —, not applicable]
Table 4.
Dissolved arsenic concentrations in surface-water samples collected in 2020 at 36 sites in the Klamath River Basin, Oregon and California.[Data from Hill and others (2021). Monthly concentrations are reported as mean ± deviation (n=2). Means for monthly concentrations were summarized and reported as annual mean ± standard error (SEM) (n=1–4). Metal concentrations below method detection limits (MDL) were ascribed a value corresponding to half the MDL for the calculations. Date in month/day/year format. µg/L, micrograms per liter; NS, not sampled; <MDL, concentration below method detection limit; KSD, Klamath Strait Drain; USGS, U.S. Geological Survey; TNC, The Nature Conservancy; —, not applicable]
Table 5.
Dissolved arsenic concentrations in surface-water samples collected in 2021 at 36 sites in the Klamath River Basin, Oregon and California.[Data from Hill and others (2021). Monthly concentrations are reported as mean ± deviation (n=2). Means for monthly concentrations were summarized and reported as annual mean ± standard error (SEM) (n=1–4). Metal concentrations below method detection limits (MDL) were ascribed a value corresponding to half the MDL for the calculations. Date in month/day/year format. µg/L, micrograms per liter; NS, not sampled; <MDL, concentration below method detection limit; KSD, Klamath Strait Drain; USGS, U.S. Geological Survey; TNC, The Nature Conservancy; —, not applicable]
Table 6.
Dissolved arsenic concentrations in surface-water samples collected in 2022 at 36 sites in the Klamath River Basin, Oregon and California.[Data from Hill and others (2021). Monthly concentrations are reported as mean ± deviation (n=2). Means for monthly concentrations were summarized and reported as annual mean ± standard error (SEM) (n=1–4). Metal concentrations below method detection limits (MDL) were ascribed a value corresponding to half the MDL for the calculations. PP-D Tule could not be accessed in 2022. Tecumseh was only sampled in 2022 and was not included in the analyses. Date in month/day/year format. µg/L, micrograms per liter; NS, not sampled; <MDL, concentration below method detection limit; KSD, Klamath Strait Drain; USGS, U.S. Geological Survey; TNC, The Nature Conservancy; —, not applicable]
Surface-Water Arsenic Concentrations
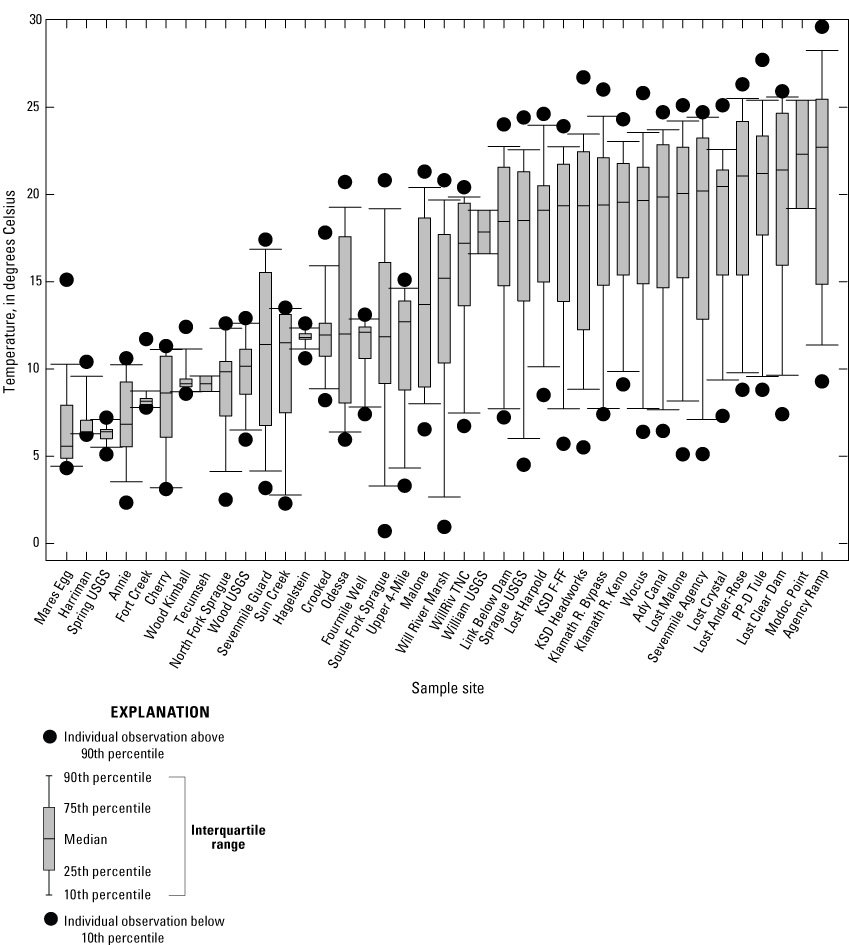
Surface-water arsenic concentrations varied four orders of magnitude among the 39 sites (fig. 4). As shown in figure 4, data distribution was skewed at many sites, and some means for monthly arsenic concentrations were either lower than the 10th percentile or exceeded the 90th percentile. Notable outliers included the arsenic concentration reported at Sevenmile Guard in May 2018 (3.4 µg/L, table 2), which was nearly 20-times higher than the median concentration for this site (0.18 µg/L, table 7). Arsenic concentration from the May 2018 sample was excluded from the dataset. Median arsenic concentrations were lowest at Cherry (0.03 µg/L) and highest at Wood Kimball (36.7 µg/L, table 7).
Arsenic concentrations measured in the spring of 2018 and 2019 at Odessa (3.0 µg/L, tables 2–3) were nearly six times higher than the median arsenic concentration for the site (0.54 µg/L, table 7). A similar difference was observed between the arsenic concentrations measured on June 26, 2019 (7.6 µg/L, table 3) at Sevenmile Agency and the median arsenic concentration for the site (1.3 µg/L, table 7). Monthly arsenic concentration means were also 6- to 10-times lower than the median arsenic concentrations at Malone Ramp (0.08 µg/L versus 0.53 µg/L, tables 5 and 7), Sevenmile Agency (0.18 µg/L versus 1.3 µg/L, tables 2 and 7), Odessa (0.07 µg/L versus 0.54 µg/L, tables 5 and 7), Upper 4-Mile (0.06 µg/L versus 0.56 µg/L, tables 6 and 7), and Modoc Point (0.41 µg/L versus 4.1 µg/L, tables 3 and 7). This variability in dissolved arsenic concentrations is discussed in the section “Variability in Surface-Water Arsenic Concentrations.”
Table 7.
Median surface-water metal concentrations and physicochemical characteristics for samples collected from 39 sites during 2018–2022 in Klamath River Basin, Oregon and California.[Data from Hill and others (2021). Medians were calculated using means of monthly samples (see tables 2–6). µg/L, micrograms per liter; Temp, temperature; °C, degrees Celsius; µS/cm, microsiemens per centimeter; mg/L, milligrams per liter; redox, oxidation-reduction; mV, millivolt; KSD, Klamath Strait Drain; USGS, U.S. Geological Survey; TNC, The Nature Conservancy; ND, no data]
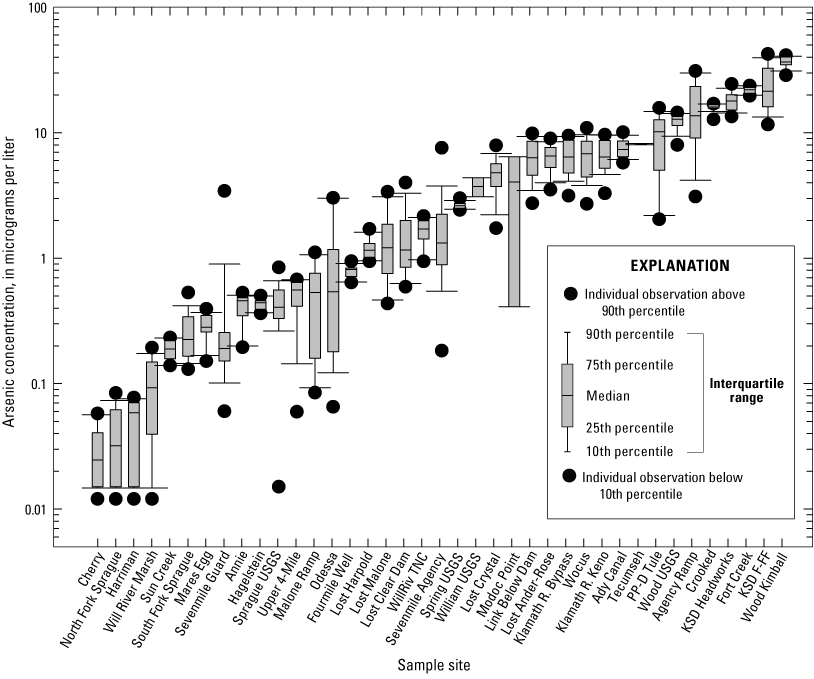
Boxplot showing arsenic concentrations determined from monthly means for samples collected 2018–2022 in the Klamath River Basin, Oregon and California. Surface-water arsenic concentrations varied four orders of magnitude among sites; median values ranged from 0.03 to 37 micrograms per liter [µg/L], (table 7) among the 39 sample sites (see tables 2–6). Data distribution was skewed at many sites and means for monthly arsenic concentrations were either lower than the 10th percentile or exceeded the 90th percentile. Notable outliers included the arsenic concentration reported at Sevenmile Guard in May 2018 (3.4 µg/L), which was nearly 20-times higher than the median concentration for this site (0.18 µg/L). This sample was excluded from the dataset. Error bars show the standard error of mean (SEM). Arsenic concentrations below method detection limits were ascribed a value corresponding to half the method detection limits (that is, 0.012 and 0.015 µg/L). For locations of sample sites, see figure 1. Site categories found in table 1. Data from Hill and others (2021).
Based on the grand means of annual arsenic concentrations (table 8), the highest arsenic concentration was found for the drain site category (17.4±4.9 µg/L, n=3) and the lowest was found for the artesian well category (0.8 µg/L, n=1) (fig. 5). Limited data support this comparison, however. Arsenic concentrations within waterbody types were highly variable and there was no statistical difference in the mean values among waterbody types (ANOVA log-transformed data, probability value [p]=0.078).
Table 8.
Grand means of annual surface-water arsenic concentrations for 39 sample sites, 2018–2022, in the Klamath River Basin, Oregon and California.[Data from Hill and others (2021). Averages of annual means (n=5, tables 2–6) are summarized and reported as grand means (GM) ± standard error means (SEM). Ratio of SEM to GM (SEM:GM) are reported as percentage (%). µg/L, micrograms per liter; As, arsenic; USGS, KSD, Klamath Strait Drain; U.S. Geological Survey; TNC, The Nature Conservancy; —, not applicable]
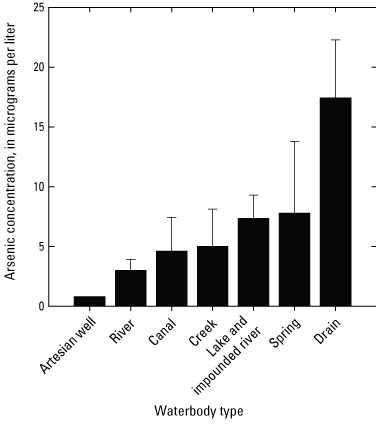
Plot showing the grand means of annual arsenic concentration averages for each waterbody type sampled in the Klamath River Basin, Oregon and California. The highest arsenic concentration was found for the drain category (17.4±4.9 micrograms per liter [µg/L], n=3) and the lowest was found for the artesian well category (0.8 µg/L, n=1). Arsenic concentrations within waterbody types were highly variable and as a result, there was no statistical difference in the mean arsenic concentrations among waterbody types (analysis of variance log-transformed data, p=0.078). Grand means (table 8) were calculated using mean annual arsenic concentrations. Error bars show the standard error of mean. For locations of sample sites, see figure 1. Waterbody categories are shown in table 1. A drain is defined as a waterbody returning used irrigation water. See tables 2–6 for dissolved arsenic concentrations in surface-water samples. Data from Hill and others, 2021.
Variability in Surface-Water Arsenic Concentrations
Variability in surface-water arsenic concentrations was evaluated by comparing data dispersion. Like calculations for coefficients of variation (that is, standard deviation to mean ratio), data dispersion was captured by ratioing the standard error of annual means (SEM) to the grand means (GM) of annual arsenic concentrations for each site (table 8). As shown in figure 6, data dispersion was less than 10 percent for nearly half the sites (that is, 17 of the 38 sites, Tecumseh excluded as it was only sampled in 2022), most of which were creeks, springs, and rivers. Means for monthly surface-water arsenic concentrations at 4 of the 10 sites displaying the lowest variability (<6 percent, table 8) were consistently in exceedance of the EPA drinking water criterion of 10 µg/L (EPA, 2001): Crooked, Fort Creek, Wood Kimball, and KSD Headworks (tables 2–6).
Annual arsenic concentration means were the most variable at Modoc Point (85.5 percent, table 8), which could be partly ascribed to the scarcity of data for this site (that is, the site was sampled twice in 2018, and once in 2019, tables 2–3). After Modoc Point, the greatest variability in surface-water arsenic concentrations was found at two river sites: Lost Malone (30.6 percent) and Lost Clear Dam (28.9 percent, table 8). At these sites, arsenic concentrations varied among years (ANOVA p<0.001, data log-transformed for Lost Malone), which explained some of the variability in surface-water arsenic concentrations (fig. 6). Variability in surface-water arsenic concentrations was also greater than 20 percent at one of the two canal sites (Sevenmile Agency, 24.8 percent), at one drain site (PP-D Tule, 23.0 percent) and at two creek sites (Upper 4-Mile 24.0 percent and Odessa 20.4 percent, table 8). Statistical differences in surface-water arsenic concentrations were detected among years at two of these sites (ANOVA p<0.001, PP-D Tule, and Upper 4-Mile). Apart from PP-D Tule, annual surface-water arsenic concentrations at the sites displaying the greatest variability (that is, greater than [>] 20 percent, table 8) were consistently lower than the EPA drinking water criterion of 10 µg/L (EPA, 2001).
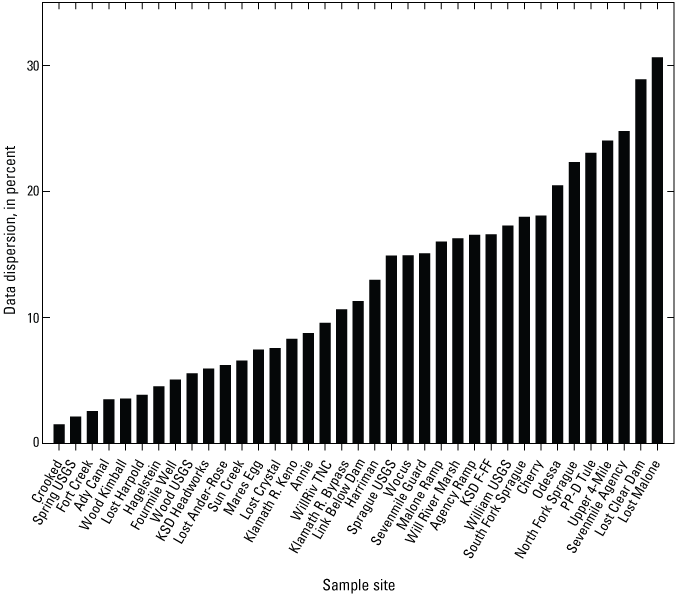
Plot showing data dispersion in surface-water arsenic concentrations for 37 sample sites in the Klamath River Basin, Oregon and California. Dispersion was defined as the ratio of standard error of annual means (SEM) to the grand means (GM) of annual arsenic concentrations. Dispersion for Tecumseh could not be calculated (n=1). Data dispersion for Modoc Point not shown (85 percent). See tables 2–6 and 8 for arsenic concentration and grand means for samples, respectively. For locations of sample sites, see figure 1. Data from Hill and others, 2021.
To assess whether some of the variability in surface-water arsenic concentrations could be ascribed to seasonal variability in geochemical or biological processes, land use practices, water use, or weather-related factors such as precipitation or temperature, monthly arsenic concentration means for each site were compared among seasons. Statistical difference in arsenic concentrations was detected at 13 sites (appendix 2), two of which had highly variable surface-water arsenic concentrations (>20 percent at Odessa and Sevenmile Agency, fig. 6). Surface-water arsenic concentrations were significantly higher in summer than in either spring or fall at 10 of the 12 sites for which statistical differences in arsenic concentrations among seasons were detected by pairwise multiple comparisons (Holm-Sidak method, p<0.05, table 9). Two sites on Upper Klamath Lake, the impounded rivers, one of the two canals, 4 rivers, and one creek had higher surface-water arsenic concentrations in the summer than in either spring or fall (table 9). Higher arsenic concentrations in the spring than in either summer, or fall, or both summer and fall, were observed at one of the drain sites and at one creek site. Arsenic concentrations in the spring sites and for the artesian well did not vary significantly among seasons (appendix 2).
Table 9.
Seasonal surface-water arsenic concentrations, 2018–2022 for 39 sample sites in the Klamath River Basin, Oregon and California.[Data from Hill and others (2021). Means for seasonal averages of monthly samples from tables 2–6 are summarized and reported as grand means ± standard error (SEM). Spring is defined from April to June 20, summer is defined as between June 21 and September 20, and fall is defined as after September 21. µg/L, micrograms per liter; KSD, Klamath Strait Drain; NS, not sampled; USGS, U.S. Geological Survey; TNC, The Nature Conservancy]
Surface-Water Copper and Lead Concentrations
Copper concentrations inferred from the most abundant copper isotope, 63Cu, were on average 1.74±1.23 times higher than copper concentrations inferred from 65Cu, the least abundant copper isotope (n=960, Hill and others, 2021). Copper concentrations inferred from both copper isotopes should be consistent, however. For instance, ratioing the copper concentrations inferred from both 63Cu and 65Cu for the standard reference samples analyzed as quality assurance quality controls (QAQCs) in this study yielded a value of 1.04 (n=372, Hill and others, 2021). The discrepancy in copper concentrations inferred from both copper isotopes for the surface-water samples can be ascribed to polyatomic interferences, namely argon-40 sodium-23 (40Ar23Na) (May and Wiedmeyer, 1998), that inflated copper concentrations inferred from the 63Cu isotope. Copper concentrations measured at sites with high specific conductance were especially affected by polyatomic interferences. For instance, 63Cu/65Cu ratio at PP-D Tule, the site with the highest specific conductance (table 7), averaged (± standard deviation) 4.75±3.38 (n=32) as opposed to 1.19±0.31 (n=23) for North Fork Sprague, the site with the lowest specific conductance (table 7). To minimize risks of overestimating copper concentrations, concentrations inferred from 65Cu, rather than from 63Cu, were used as surface-water total-dissolved-copper concentrations. As shown in figure 7, the median surface-water copper concentrations ranged from 0.03 to 3.7 µg/L across sites.
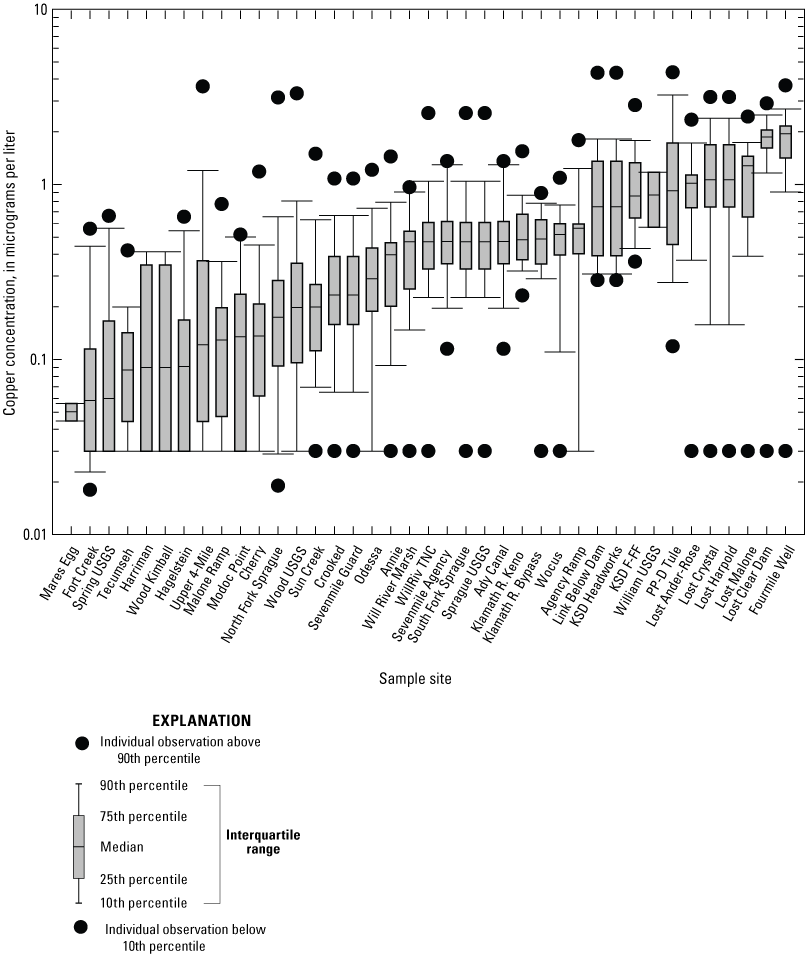
Boxplot showing surface-water copper concentrations determined from monthly means for samples from 39 sites collected 2018–2022 in the Klamath River Basin, Oregon and California. Median surface-water copper concentrations ranged from 0.03 to 3.7 micrograms per liter (µg/L) across sites. Error bars show the standard error of mean. Copper concentrations below method detection limits were ascribed a value corresponding to half the method detection limits (that is, 0.01 and 0.03 µg/L). For locations of sample sites, see figure 1. Data from Hill and others (2021).
Surface-water lead concentrations were inferred from two lead isotopes, namely 208Pb and 206Pb (Hill and others, 2021). Concentrations inferred from 208Pb were 1.02±0.11 (standard deviation) times higher than concentrations inferred from 206Pb (n=256, Hill and others, 2021). As this difference was not significantly different from 1.00, lead concentrations inferred from the most abundant isotope (that is, 208Pb) were used as surface-water lead concentrations in this study. As shown in figure 8, the median surface-water lead concentrations ranged from 0.013 to 0.175 µg/L. Lead concentrations were below the method detection limits (<0.04 µg/L, appendix 1) for 535 of 564 samples collected in 2018 and 2019. In 2020, an aberrantly high lead concentration was measured at South Fork Sprague (7.96 µg/L, Hill and others, 2021) likely due to sample contamination, and was therefore not included in data analyses.
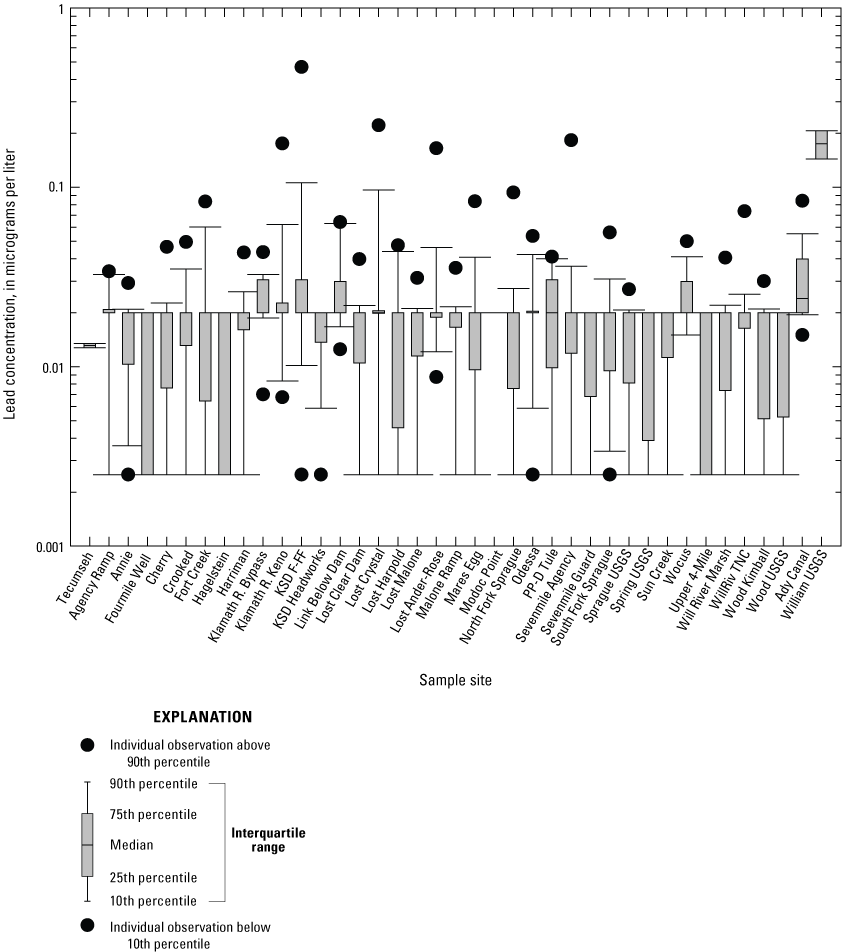
Boxplot showing surface-water lead concentrations determined from monthly means for samples from 39 sites collected 2018–2022 in the Klamath River Basin, Oregon and California. Error bars show the standard error of mean. Median surface-water lead concentrations ranged from 0.013 to 0.175 micrograms per liter (µg/L). Lead concentrations were below the method detection limits (<0.04 μg/L) for 535 of 564 samples collected in 2018 and 2019. Lead concentrations below method detection limits were ascribed a value corresponding to half the method detection limits (that is, 0.0025 and 0.02 µg/L). For locations of sample sites, see figure 1. Data from Hill and others (2021).
Surface-water dissolved copper and lead concentrations were below acute toxicity endpoints reported by the EPA for freshwater animals. For example, LC50 or EC50 values for aquatic animals range from 3.4 to 2,000 µg/L for copper (EPA, 2007) and from 124 to 542,000 µg/L for lead (EPA, 1984). Measured surface-water copper and lead concentrations were also below the EPA action levels for drinking water (1,300 µg/L and 15 µg/L for copper and lead, respectively).
Correlations between surface-water arsenic, copper, and lead concentrations determined in this study were not obvious. For example, means for annual averages of surface-water arsenic concentration were not significantly correlated with means for annual averages of surface-water copper (correlation coefficient [r] = −0.062, p=0.708) or lead concentrations (r=0.034, p=0.840) (fig. 9A, B). Similarly, there was no significant correlation between the means for annual averages of surface-water copper and lead concentrations (r=0.095, p=0.567, fig. 9C).
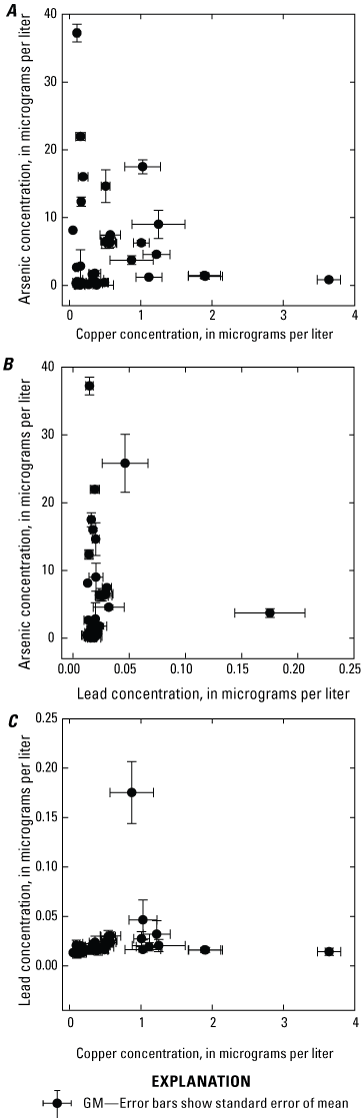
Plots showing the relationships between grand means of annual surface-water arsenic, copper, and lead concentrations determined from monthly means for samples from 39 sites collected 2018–2022 in the Klamath River Basin, Oregon and California. Correlations between surface-water concentrations of arsenic, copper, and lead concentrations were not statistically significant, p>0.5. A, Arsenic and copper, B, Arsenic and lead, and C, Lead and copper. Data from Hill and others (2021).
Physicochemical Characteristics
A boxplot was used to show the distribution of monthly-mean temperature measurements acquired with the multiparameter water quality sonde. As shown in figure 10, median surface-water temperatures (n=2–18) varied from 6 to 23 °C among sites. Eight of the 39 sites had median temperatures higher than 20 °C, and nine sites had median temperatures lower than 10 °C. Surface-water temperatures varied significantly among waterbody types (ANOVA p<0.001). Based on the grand means of annual surface-water temperatures, the lowest surface-water temperatures (± SEM) were observed at spring (9.6±1.1 °C, n=6) and creek sites (9.9±0.7 °C, n=8) with lowest water residence times, while the highest surface-water temperatures (± SEM) were found at canal (17.2±0.4 °C, n=2), drain (18.4±1.6 °C, n=3), and at the lake and impounded river sites (18.9±0.8 °C, n=5), with highest water residence times (fig. 11, table 7) (p>0.1 for all pairwise multiple comparisons).
Boxplot showing surface-water temperatures determined from monthly means for samples from 39 sites collected 2018–2022 in the Klamath River Basin, Oregon and California. Median surface-water temperatures (n=2–18) varied from 6 to 23 degrees Celsius (°C) among sites. Eight of the 39 sites had median temperatures greater than 20 °C, and nine sites had median temperatures lower than 10 °C. For locations of sample sites, see figure 1. Data from Hill and others (2021).
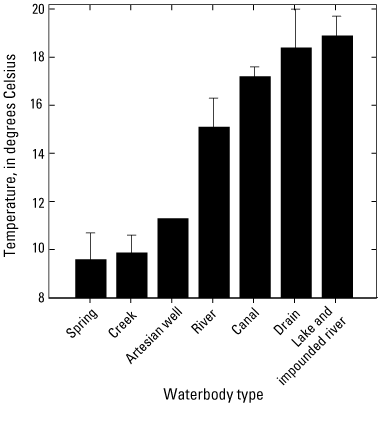
Plot showing the grand means of annual surface-water temperatures averaged by waterbody types (n=1–14) for samples collected 2018–2022 in the Klamath River Basin, Oregon and California. Surface-water temperatures varied significantly among waterbody types (analysis of variance p<0.001). Error bars show the standard error of mean. For locations of sample sites, see figure 1. Waterbody categories are shown in table 1. A drain is defined as a waterbody returning used irrigation water. Data from Hill and others (2021).
Surface-water median pH values varied from 7.0 to 9.1 among sites (table 7). Surface-water pH varied significantly among waterbody types (ANOVA p=0.001). Similar to the water temperature results, based on the grand means of annual surface-water pH values, the lowest pH values (± SEM) were observed in creeks (7.41±0.08, n=8) and springs (7.55±0.13, n=5) while the highest pH values (± SEM) were found at drain (8.53±0.23, n=3), lake and impounded river sites (8.56±0.14, n=5) (fig. 12, table 7). A statistically significant difference in pH values was detected between the creeks and the drains, the creeks and the lake/impounded rivers, as well as between the springs and the drains and lake/impounded rivers (pairwise multiple comparison, p<0.05).
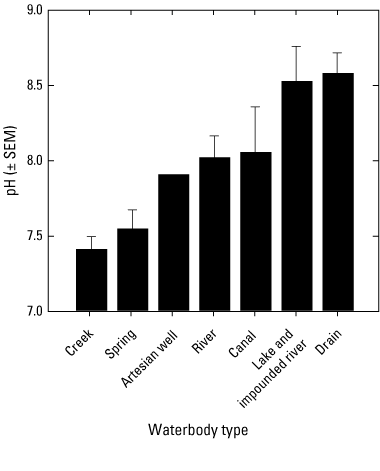
Plot showing the grand means of annual surface-water pH values averaged by waterbody types (n=1–14) for samples collected 2018–2022 in the Klamath River Basin, Oregon and California. A statistically significant difference in pH values was detected between the creeks and the drains, the creeks and the lake/impounded rivers, as well as between the springs and the drains and lake/impounded rivers (pairwise multiple comparison, p<0.05). Error bars show the standard error of mean (SEM). For locations of sample sites see figure 1. Waterbody categories are shown in table 1. A drain is defined as a waterbody returning used irrigation water. Data from Hill and others (2021).
Median surface-water specific conductance values varied twentyfold among sites, ranging from 56 microsiemens per centimeter (µS/cm) at North Fork Sprague to 1,120 µS/cm at KSD Headworks (table 7). Specific conductance varied significantly among sites (Kruskal-Wallis p=0.005). Like trends observed for pH values, based on the grand means of annual surface-water values, the lowest specific conductance values (µS/cm ± SEM) were observed in creeks (72±7, n=8) while the highest specific conductance values (± SEM) were found at drain sites (817±155, n=3) (fig. 13, table 7). A statistically significant difference in specific conductance was detected between the creeks and the drains (pairwise multiple comparison, Dunn’s Method, p=0.003) (fig. 13).
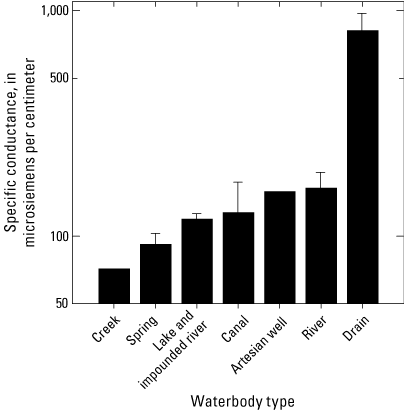
Plot showing the grand means of annual surface-water specific-conductance values averaged by waterbody types (n=1–14) for samples collected 2018–2022 in the Klamath River Basin, Oregon and California. A statistically significant difference in specific conductance was detected between the creeks and the drains. Based on the grand means of annual surface-water values, the lowest specific conductance values in microsiemens per centimeter (µS/cm) were observed in creeks (72±7, n=8), whereas the highest specific conductance values were found at drain sites (817±155, n=3) (table 7). Error bars show the standard error of mean. Scale for the y-axis is logarithmic. For locations of sample sites, see figure 1. Waterbody categories are shown in table 1. A drain is defined as a waterbody returning used irrigation water. Data from Hill and others (2021).
Median dissolved-oxygen concentrations ranged from 2.6 to 10.9 mg/L among sites (table 7). Based on the grand means of annual surface-water dissolved-oxygen concentrations, the artesian well had the lowest dissolved-oxygen concentrations (2.50 mg/L, n=1) and the creeks had the highest dissolved-oxygen concentrations (9.47±0.44 mg/L) (± SEM) (fig. 14, table 7). Dissolved-oxygen concentrations varied significantly among sites (ANOVA p<0.001). Significant statistical differences were detected between the artisan well and all the other waterbody types (Holm-Sidak p<0.02), except the drains (Holm-Sidak p=0.059). Dissolved-oxygen concentrations also varied significantly between creeks and drains (Holm-Sidak p=0.008).
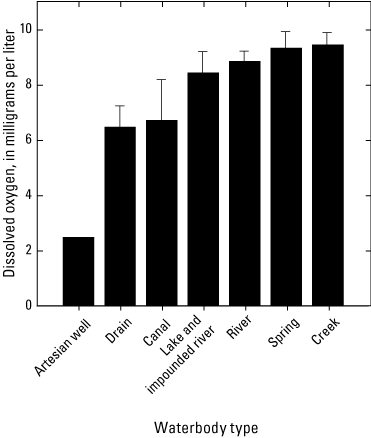
Plot showing the grand means of annual surface-water dissolved-oxygen concentrations averaged by waterbody types (n=1–14) for samples collected 2018–2022 in the Klamath River Basin, Oregon and California. Based on the grand means of annual surface-water dissolved-oxygen concentrations, the artesian well had the lowest dissolved-oxygen concentrations and the creeks had the highest dissolved-oxygen concentrations. Dissolved-oxygen concentrations varied significantly among sites (analysis of variance p<0.001) with significant differences between the artesian well and all the other waterbody types (Holm-Sidak p<0.02), except the drains (Holm-Sidak p=0.059). Dissolved-oxygen concentrations also varied significantly between creeks and drains (Holm-Sidak p=0.008). Error bars show the standard error of mean. For locations of sample sites, see figure 1. Waterbody categories are shown in table 1. A drain is defined as a waterbody returning used irrigation water. Data from Hill and others (2021).
The median redox potentials ranged from 16 to 170 mV among sites (table 7). Based on the grand means of annual surface-water redox potential values, the lowest redox potentials (± SEM) were observed at the drain sites (71±28 mV, n=3) while the highest values (± SEM) were observed at creek (144±2 mV, n=8) and spring sites (153±9 mV, n=6) (fig. 15, table 7). There was a statistical difference in redox potential values among waterbody types (Kruskal-Wallis, p=0.032). Note that no data were collected at the artesian well site. Relationships between physicochemical and trace element data are explored with principal component analyses below.
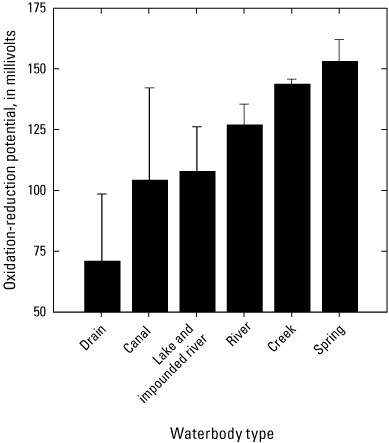
Plot showing the grand means of annual surface-water oxidation-reduction (redox) potential values averaged by waterbody types (n=1–14) for samples collected 2018–2022 in the Klamath River Basin, Oregon and California. Based on the grand means of annual surface-water redox potential values, the lowest redox potential values were observed at the drain sites (71±28 millivolts [mV], n=3) while the highest values were observed at creek (144±2 mV, n=8) and spring sites (153±9 mV, n=6, table 7). There was a statistical difference in redox potential values among waterbody types (Kruskal-Wallis, p=0.032). Note that no data were collected at the artesian well site. Waterbody categories are shown in table 1. A drain is defined as a waterbody returning used irrigation water. Data from Hill and others (2021).
Aqueous Arsenic Speciation
Arsenic speciation data showed that nearly all the arsenic in the surface-water samples existed as As(V), the most oxidized species, with the exception of one sample from PP-Tule on June 29, 2023 (table 10). Arsenic(III) was only detected in the samples collected in 2019, which is largely a consequence of the higher detection limit for arsenite analyzed in 2022 (that is, different laboratories provided arsenic speciation analyses, see methods section). The highest proportion of arsenite (arsenic(III) relative to total arsenic) was found in samples collected in a drain site in 2019. Arsenite concentration in one replicate sample collected in June 2019 at PP-D Tule was twice that for arsenate (arsenic(V); Hill and others, 2021). Data for this replicate sample were excluded because DMA concentrations did not correlate with the arsenite level (Maguffin and others, 2015). The concentrations of DMA and MMA were 20 to 400-times lower than the total arsenic concentrations (that is, consistently <5 percent of total dissolved arsenic). Ratios of DMA to MMA varied from 0.3 to 6.7.
Table 10.
Arsenic speciation for surface-water samples collected in 2019 and 2022 in the Klamath River Basin, Oregon and California.[Data from Hill and others (2021). Dates are listed in month/day/year (mm/dd/yyyy) format. As, arsenic; DMA, dimethylarsinate; MMA, monomethylarsonate; µg/L, micrograms per liter; KSD, Klamath Strait Drain, USGS, U.S. Geological Survey; <, less than; —, not analyzed]
Sedimentary Arsenic, Copper, and Lead Concentrations
Sedimentary arsenic concentrations varied 66-fold among sites that included five creeks, one river and one spring. They ranged from 0.70 mg/kg at Will River Marsh to 46.5 mg/kg at Wood Kimball (table 11). The elevated arsenic concentration reported at Wood Kimball is more than 10-times the average crustal abundance of arsenic (4.8 milligram per kilogram [mg/kg]; Rudnick and Gao, 2003), while the sedimentary arsenic concentration at Will River Marsh is less than 20 percent the average crustal abundance for arsenic. Concentrations of lead and copper in sediment varied 31- and fourfold among sites, respectively, that is, from 1.0 to 31.3 mg/kg for lead and from 13.9 to 58.0 mg/kg for copper (table 11). The highest sedimentary lead concentration was measured at Wood Kimball, while the highest sedimentary copper concentration was measured at Fort Creek. Variations in sedimentary arsenic and lead concentrations were statistically correlated (r=0.85, p=0.015). In contrast, weak correlations that were not statistically significant (p>0.9) were found between sedimentary concentrations of arsenic and copper (r=0.014) as well as between sedimentary concentrations of copper and lead (r=0.003). The correlation between sedimentary arsenic concentrations and the corresponding grand means of annual surface-water arsenic concentrations was strong and statistically significant (r=0.94, p=0.001, n=7).
Table 11.
Sedimentary metal concentrations for bed sediment samples collected in 2020 in the Klamath River Basin, Oregon and California.[Data from Hill and others (2021). Concentrations are reported as means of monthly averages ± standard error (n=2). As, arsenic; Pb, lead; Cu, copper; mg/kg, milligram per kilogram]
Correlations Among All Measured Variables
A PCA was used to identify linear relationships among variables and explain sources of variability. As shown on figure 16, 70 percent of the variance in the data was explained by two principal components. PC1 explained most of the variance (55.52 percent) and had large positive associations with surface-water copper and lead concentrations, as well as temperature, pH and specific conductance. PC1 was primarily associated with measured dissolved constituents, excluding arsenic concentrations (fig.16A). The second component, PC2 (14.17 percent), had a large negative association with surface-water arsenic concentrations and to a lesser extent, with surface-water lead concentrations (fig. 16A). PC2 therefore primarily measured dissolved arsenic concentrations considering that lead concentrations were often below MDLs. A plot of the component scores showed that 14 of the 37 sites aligned positively along PC1 (fig. 16B). These sites showed a strong association with both surface-water copper and lead concentrations, temperature, pH, and specific conductance. They included the three drains (KSD Headworks, KSD FF-F, and PPD Tule), one of the two canals (Ady Canal), one impounded river (Klamath R. Keno), and four rivers. Along with two creeks (Crooked, Fort Creek) and one spring (Wood Kimball), one drain site (KSD F-FF) also aligned negatively with PC2, showing an association with surface-water arsenic concentrations. None of the rivers, Upper Klamath Lake sites, impounded rivers, canals, or the artesian well showed a strong negative association with PC2.
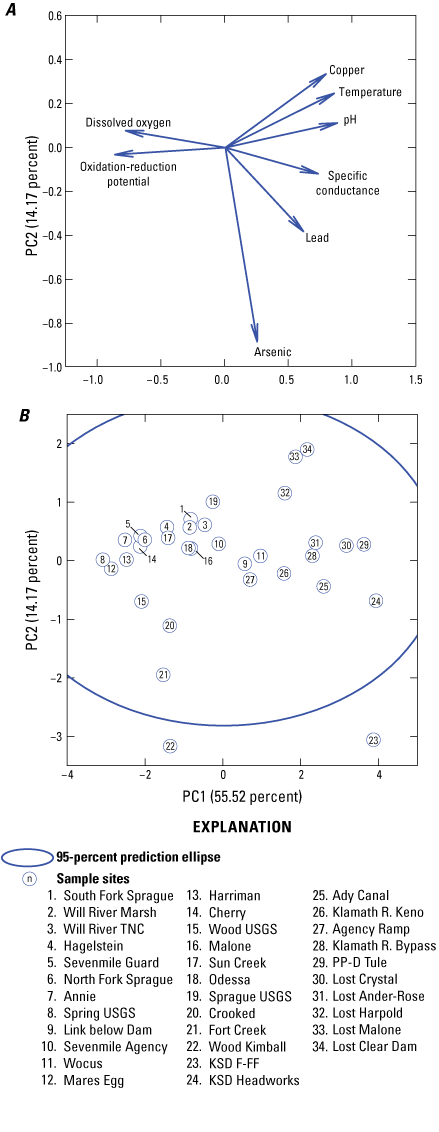
Plot showing principal component analysis (PCA) loadings (A) and scores (B) as well as 95-percent prediction ellipse. Grand means of surface-water concentrations and physicochemical parameter values for each site in the Klamath River Basin, Oregon and California, were used in the PCA. Seventy percent of the variance in the data was explained by two principal components. PC1 explained most of the variance and had large positive associations with surface-water copper and lead concentrations, as well as temperature, pH, and specific conductance. PC2 had a large negative association with surface-water arsenic concentrations and to a lesser extent, with surface-water lead concentrations.
Discussion
Surface-Water Arsenic Concentrations in the Upper Klamath Basin
Surface-water arsenic concentrations varied four orders of magnitude among sites, with median values ranging from 0.03 to 36.7 µg/L (table 7, fig. 4). At 20 of the 39 sites, median surface-water arsenic concentrations were within the range, or below, the baseline arsenic concentrations reported in United States natural waters (that is, from 0.15 to 2.1 µg/L, Smedley and Kinniburgh, 2002). The highest arsenic concentrations measured in this study (that is, 30–40.8 µg/L, tables 2–6) were within the range of concentrations reported in rivers influenced by geothermal activities (that is, from 10 to 370 µg/L, Nimick and others, 1998), and by mining activities in the United States and Canada (that is, from 35 to 100 µg/L, Azcue and Nriagu, 1995). Surface-water arsenic concentrations were, however, orders of magnitude lower than the highest arsenic concentrations reported in natural waters affected by mining activities in the United States (that is, up to 34,000 µg/L, Plumlee and others, 1997).
Surface-water arsenic concentrations (grand means of annual means, table 8) were below the DEQ aquatic life water quality criteria for both acute (350 µg/L) and chronic (150 µg/L) toxicity for all 39 sites (Oregon DEQ, 2011). Compared to drinking water quality criteria, annual surface-water arsenic concentrations were below the Oregon DEQ’s water-quality criterion (2.1 µg/L; Sturdevant, 2011) at 20 of the 39 sampling sites (51 percent). They were also below the EPA drinking water quality criterion of 10 µg/L at 32 of the 39 sites (82 percent) (table 8, fig. 4) (EPA, 2001). Five of the seven sites with the highest surface-water arsenic concentrations had monthly arsenic concentration averages consistently above the EPA drinking water quality criterion (Crooked, KSD Headworks, Fort Creek, KSD F-FF and Wood Kimball, tables 2–6).
Averaging the grand means of annual arsenic concentrations by waterbody types showed that the highest arsenic concentrations (± SEM) were found in drains (17.4±4.9 µg/L, n=3) (fig. 5), which were in areas of increased agricultural activities and associated water re-use practices (fig. 2). Although this comparison is supported by limited data and is specific to the geographical area of the sampling sites, surface-water arsenic concentrations are lower at nearby sites that are not drains (for example, Ady Canal, Klamath R. Keno, table 7). Some of the arsenic in drain water could have originated from past applications of arsenic-containing pesticides, from use of arsenic additive in livestock feed (Smedley and Kinniburgh 2002), or possibly from the geothermal waters in the Klamath Strait Drain area (A.B. Sullivan, USGS, written commun., March 8, 2023) (USGS streamgage station no. 420258121443101; USGS, 2023). Aside from these potential arsenic sources, agricultural activities can affect arsenic mobility by changing soil pH and redox conditions, which influences arsenic speciation and stability with solid phases, in particular iron oxides (Monagail and others, 2018). Fertilizer amendments can also affect arsenic speciation and mobility. For instance, addition of phosphate, a structural analogue to arsenate (arsenic(V)), can (1) compete with arsenic for sorption onto iron oxides, which favors arsenic desorption from solid phases (Smith and Naidu, 2009), and (2) stimulate phytoplankton production and subsequent eutrophication effects on adsorbate mobilization (Kuwabara and others, 2009).
Surface-water samples from the artesian well had the lowest arsenic concentrations among waterbody types (0.81 µg/L, table 8, fig. 5). But only one artesian well was sampled in the study, and it is in an area where surface-water arsenic concentration is low (northwest side of the study area, fig. 1). Higher arsenic concentrations (up to 14 µg/L) have been recorded in wells located elsewhere in the Upper Klamath Lake region (at the time of publication, data for arsenic concentrations in wells from 2001 to 2007 are not publicly available from the Bureau of Reclamation but can be requested from the Klamath Basin Area office in Klamath Falls, Oregon). Arsenic concentrations reported at sites in the Wood River Wetland, whose sources of water include regional groundwater discharge and five flowing artesian wells (Carpenter and others, 2009) were even higher (that is, up to 56 µg/L, USGS streamgage station no. 423618121571401; USGS, 2023). Considering that water from artesian wells is directly sourced from groundwater aquifers, the low arsenic concentration measured in the artesian well sampled in this study suggests that water-rock interactions at this location minimally favored arsenic mobilization and accumulation, or that particulate arsenic concentrations surrounding the aquifer are low.
The highest median surface-water arsenic concentration among sites was observed at Wood Kimball (table 7), a spring located north of Upper Klamath Lake (figs. 1 and 4). This site was not influenced by agricultural activities (fig. 2). In addition to water characteristics of the recharging aquifer, spring water-quality largely depends on the type of rocks with which the groundwater is in contact. Like Fort Creek and Crooked, Wood Kimball is located on the east edge of the Wood River Valley. Water from these sites, including Wood USGS, appeared to originate out of the ground from the base of a ridge that runs north to south. Similarly high arsenic concentrations have been reported in the Wood River (Kuwabara and others, 2016). Tecumseh, which was sampled only in 2022, is in the southern portion of this ridge, and surface-water arsenic concentrations up to 8.2 µg/L were measured here (tables 2–6). The source of arsenic for these sites thus seems geogenic.
Variability in Surface-Water Arsenic Concentrations
Variability in surface-water arsenic concentrations was less than 10 percent at 17 of the 38 sites (Tecumseh is excluded, as it was only sampled in 2022) (table 8, fig. 6). With a consistent groundwater source, surface-water arsenic concentrations in springs and in the artesian well were the least variable (table 8); no statistical differences were observed among seasons (appendix 2). On the contrary, surface-water arsenic concentrations at 13 sites, including the sites on Upper Klamath Lake (except Modoc Point), the impounded rivers, the canals, one of the drains, two creeks, and four rivers, varied significantly among seasons (appendix 2). Surface-water arsenic concentrations were significantly higher in summer than in either spring or fall at 10 of these 13 sites. Geochemical processes such as redox and sorption reactions mobilizing arsenic can explain some of the seasonal variations in surface-water arsenic concentrations (Smedley and Kinniburgh, 2002). For example, elevated surface-water temperatures can trigger the microbial reduction of As(V) to As(III), which increases arsenic mobilization (McLaren and Kim, 1995). Anoxia induced by degradation of algal biomass has also been shown to accelerate the release of arsenic from sediment (Rahman and Hasegawa 2012; Tang and others 2019). Kuwabara and others (2016) reported a trend towards increasing arsenic during July and August (from 2.8 and 11.9 μg/L) in Upper Klamath Lake, concomitant with the annual peak of cyanobacteria Aphanizomenon flosaquae (J. Ralfs Ex Bornet and Flah). Abiotic processes can also affect surface-water arsenic concentrations. For example, high-flow conditions in spring can dilute surface-water concentrations of solutes during runoffs. During low-flow season, solute concentrations can increase because of evaporative concentration especially in shallow waterbodies (Ong and others, 1995). Greater contribution of arsenic from geothermal water can also increase surface-water arsenic concentrations (Nimick and others, 1998).
Diurnal patterns in temperature, pH, oxygen levels, and metal concentrations including arsenic are well documented (Fuller and Davis, 1989; Nimick and others 1998, 2011). Because time of day when sampling occurred varied among sites, some of the variability observed among sites and among sampling periods in the surface-water metal concentrations and physicochemical characteristics could be attributed to diurnal patterns. However, because comparisons were based on data dispersion (for example, medians, means, SEM), influences of diel biogeochemical processes were likely modest in this study.
Sedimentary Arsenic, Copper, and Lead Concentrations
Apart from Wood Kimball, Fort Creek, and Crooked, sedimentary arsenic, copper, and lead concentrations are similar to those measured in sediments collected in reservoirs along the Klamath River (Benninger and others, 2011). Arsenic concentrations measured in the bed sediments of two of the seven sampled sites exceeded the Oregon DEQ maximum limit of arsenic in soil for the Basin and Range provinces (12 mg/kg; Oregon DEQ, 2013). Exceedances were observed at Fort Creek, and Wood Kimball (table 11), two sites that also had the highest surface-water arsenic concentrations (fig. 4). The strong and statistically significant correlation observed between the arsenic concentrations in surface water and sediment is driven by these two sites. Surface-water arsenic concentrations (µg/L) were three orders of magnitude lower than sedimentary arsenic concentrations (mg/kg), reflecting arsenic propensity to bind or adsorb to suspended and settling particles such as manganese and iron oxides, organic matter, sulfides, and carbonates (Ruokolainen and others, 2000). Metal concentrations in aquatic systems are orders of magnitude higher in sediments than in water (Luoma and Rainbow, 2008).
The correlation between sedimentary arsenic and lead concentrations could stem from the mineralogy of the sediment collected as arsenic often occurs in minerals with lead (that is, there are over 346 minerals containing arsenic and lead, https://www.mindat.org). X-ray diffraction analyses of sediment samples could confirm this hypothesis, however. Because agricultural activities are negligible in the area surrounding the sampled sites (fig. 2), the source of arsenic and lead in the bed-sediment at these sites is likely geogenic.
Influence of Physicochemical Characteristics on Arsenic Speciation
Temperature, pH, dissolved-oxygen concentrations, and specific conductance varied among sites. In general, creeks and springs had colder surface-water temperatures, circum-neutral pH values, lower specific conductance, and higher dissolved-oxygen concentrations and redox potentials than the other waterbody types (figs. 11–15). The colder water temperatures reported in creeks, springs, and in the artesian well point to their groundwater origin. Except for the artesian well, whose water is sourced underground where no photosynthesis occurs and oxygen is naturally low, the colder water temperatures of the creeks and springs were associated with elevated oxygen levels (figs. 11 and 14). Oxygen saturation increases as temperature decreases, a relationship important for aquatic species (https://www.usgs.gov/special-topics/water-science-school/science/dissolved-oxygen-and-water#overview). Arsenate (arsenic(V)) is thermodynamically stable in oxic waters (Sharma and Sohn, 2009). Arsenate is also presumably the least toxic inorganic arsenic species (Ng, 2005), although it can substitute for phosphate and interfere with adenosine triphosphate production in bacteria (Hughes, 2002).
Drains, canals, and to some extent the sites on Upper Klamath Lake and the impounded rivers, had in general higher surface-water temperatures, higher specific conductance (drains only), alkaline pH values, and lower dissolved-oxygen concentrations and redox potentials than the other waterbody types (figs. 11–15). Evapoconcentration likely explained the particularly high specific conductance reported for the drains (table 7, fig. 13) (Ong and others, 1995). Irrigation water evaporates as it moves through streams and irrigation fields, getting progressively enriched in ions, notably sodium and sulfate ions (Sorenson and Schwarzbach, 1991). The presence of fertilizers and organic matter in drain and canal water can stimulate bacterial activities, which in turn, can lead to oxygen decline (fig. 14) and reducing conditions (fig. 15) (Tang and others, 2019). Furthermore, large concentrations of phosphate and organic matter can enhance arsenic desorption because of competition for adsorption sites (Sharma and Sohn, 2009). In contrast to metals like copper and lead, arsenic can also desorb from mineral oxides at high pH values (>8.5) because the adsorbate is a ligand (Smedley and Kinniburgh, 2002). Collectively, the physicochemical characteristics of the drains, canals, Upper Klamath Lake sites, and impounded rivers would favor the more reduced arsenic species, arsenite (arsenic(III)), which has presumably a higher toxicity than arsenate (Hughes, 2002). However, at the pH and redox potential values measured in this study (table 7), arsenic(V) is expected to be thermodynamically stable and thus, likely the most abundant inorganic arsenic form across sites (Hasegawa and others, 2010).
In addition to inorganic arsenic species, methylated organoarsenic compounds were detected in all the samples collected in 2019 (table 10). A wide variety of methylated arsenic compounds can be found in the environment, and their occurrence is mediated by bacteria (Rahman and Hasegawa, 2012). Because methylated arsenic species tend to be persistent and are generally not metabolized or bioaccumulated by higher eukaryotes, they are considered less toxic than the inorganic forms of arsenic, although studies have found that MMA can be toxic (Sharma and Sohn, 2009).
Arsenic Sources in the Upper Klamath Region
Surface-water concentrations of arsenic in the Klamath Basin, which has a volcanic origin and encompasses large areas of agricultural lands, can exceed at some locations both the Oregon DEQ human health water quality criterion (2.1 ug/L; Sturdevant, 2011) and the EPA drinking water limit (10 ug/L; EPA, 2001). Both natural and anthropogenic sources of arsenic seem likely.
To the north, surface-water arsenic concentrations at three sites consistently exceeded the EPA drinking water limit (Wood Kimball, Fort Creek, and Crooked, tables 2–6). Exceedance of the EPA drinking water limit was also observed at all but two sampling events at Wood USGS (tables 2–6). These four sites are located either within, or on the east edge of the Wood River Valley (fig. 1). Water from these sites, including that for Tecumseh, originates from the base of a ridge that runs north to south. Although this area comprises wetlands that used to be drained for cattle grazing and crop cultivation (Carpenter and others, 2009), arsenic at these sites seems to originate from the groundwater aquifer hosted in a rock formation of volcanic origin (Gannett and others, 2007). High aqueous concentrations of arsenic are found where basaltic rocks are dominant and where water-rock interactions are maximal (Stoner and others, 1977; Hinkle and Polette, 1999).
To the south, surface-water arsenic concentrations at two drain sites consistently exceeded the EPA drinking water limit (KSD Headworks and KSD FF-F, tables 2–6). Water in drains consists mainly of water used for irrigation. As discussed previously in “Influence of Physicochemical Characteristics on Arsenic Speciation,” the unique physicochemical characteristics of drain waters (for example, elevated pH, fig. 12), high phosphate and dissolved organic carbon concentrations (USGS streamgage station no. 420451121510000; USGS, 2023), were likely favorable to processes mobilizing arsenic from solids (Smedley and Kinniburgh, 2002; Sharma and Sohn, 2009), including soils previously contaminated by arsenical pesticides and herbicides. In addition, evapoconcentration likely affected the solute concentrations of drain water during the summer months, thereby concentrating arsenic. But evaporation does not provide insight into the original source(s) of arsenic at these sites, which could include volcanic minerals in the north, some geothermal waters from the Klamath Strait Drain area (USGS streamgage station no. 420258121443101, U.S. Geological Survey, 2023), or legacy arsenical pesticides and herbicides, although we found no evidence of arsenic-based pesticide use in the Upper Klamath region. The lack of correlation between surface-water copper and arsenic concentrations (fig. 9A), as well as between surface-water lead and arsenic concentrations (fig. 9B) provides an argument against the pesticide source. But differences in sorption characteristics and leaching behaviors among metals (Merry and others, 1983) preclude using copper and lead concentrations as proxies for lead- and copper-based arsenate pesticides, which was the initial intent. The four orders of magnitude spread in the surface-water arsenic concentrations (fig. 4) compared to the 1.2-order of magnitude spread for lead (fig. 8) and 1.9-order of magnitude spread for copper (fig. 7) does indicate a decoupling, caused in part, by differences in mobilities among metals (Merry and others, 1983). Although identifying the source(s) of arsenic in drain water remains unquantified, the unique physicochemical characteristics of drain water may be conducive to processes mobilizing and concentrating arsenic.
In support of water-quality managers and water-use stakeholders in the Klamath Basin, mass balances of arsenic loads and transport, arsenic adsorption and desorption experiments, as well as evaporation calculations could help quantify relative arsenic sources at these sites, especially drain sites. Moreover, additional mechanistic studies could enhance understanding of the interplay among water chemistry, speciation, bioavailability, and toxicity, especially at sites with different sources of arsenic (for example, geogenic versus agricultural origin).
Summary
Levels of dissolved arsenic in surface waters at some locations in the Klamath Basin can exceed the U.S. Environmental Protection Agency (EPA) and Oregon Department of Environmental Quality (DEQ) standards for drinking water (10 and 2.1 micrograms per liter [µg/L], respectively). The Klamath Basin consists primarily of volcanic deposits and contains an underground geothermal system hosting hot springs and warm water wells that are known sources of arsenic. Common anthropogenic sources of arsenic are related to agricultural use and include pesticides, although irrigation, water re-use and water storage practices can favor arsenic mobilization and concentration by variety of biogeochemical processes.
In this study, dissolved concentrations of arsenic, copper, and lead were measured in surface waters at 39 sites within the Upper Klamath Basin, of varied waterbody types, between 2018 and 2022. Surface-water arsenic concentrations varied four orders of magnitude among sites. Median arsenic concentrations ranged from 0.03 to 36.7 µg/L. Surface-water arsenic concentrations varied independently of corresponding changes in surface-water lead or copper concentrations, which does not support the “anthropogenic use of arsenic-based pesticides” hypothesis, although differences in sorption and leaching characteristics among metals might have driven the lack of correlations. Literature searches did not provide any evidence of arsenic-based pesticide use in the Upper Klamath region. Speciation data collected in a subset of sites showed that arsenic existed mostly as arsenic(V), the most oxidized species, and presumably, the least toxic arsenic species.
Drain sites (drains are defined here as a waterbody returning used irrigation water) sampled in this study had the highest arsenic concentrations (17.4±4.9 µg/L) as opposed to the artesian well (0.81±0.04 µg/L). In addition to evapoconcentration, the unique physicochemical characteristics of water stored in drains likely favored arsenic mobilization from solids, and explained in part, the elevated surface-water arsenic concentrations.
Variability in surface-water arsenic concentrations was less than 10 percent at 17 of the 38 sites (Tecumseh excluded, as it was only sampled in 2022). Seasonal differences in surface-water arsenic concentrations were detected at 13 sites, 10 of which had higher arsenic concentrations in summer than in either spring or fall. Two sites on Upper Klamath Lake, the impounded rivers, one of the canals, one creek and four rivers had higher surface-water arsenic concentrations in the summer than in either spring or fall. Redox and sorption reactions mobilizing arsenic at higher temperatures, evapoconcentration, or release of arsenic from sediment due to sub-oxic conditions associated with eutrophication can explain, in part, the higher surface-water arsenic concentrations observed in summer than in the spring or fall. Surface-water arsenic concentrations in the sites at springs and for the artesian well did not vary significantly among seasons, likely because of the groundwater origin of the sourced water.
There are likely both natural and anthropogenic sources of arsenic in the Klamath Basin. North of Upper Klamath Lake, high surface-water arsenic concentrations were consistently measured at sites with limited nearby agricultural activities, suggesting a geogenic source. South of Upper Klamath Lake, surface-water arsenic concentrations were elevated and consistently higher than the EPA drinking water criterion at two drain sites in an area of predominant agricultural land use with extensive water re-use practices. Although the source(s) of arsenic in drain water remains unquantified, the unique physicochemical characteristics of drain water were likely conducive to processes controlling arsenic partitioning between solid and aqueous phases.
Our assessment of dissolved arsenic concentrations in various surface-water bodies in the Upper Klamath River Basin reveals geographical areas of consistently low (below the Oregon Department of Water Quality water-quality criterion of 2.1 µg/l), moderate (below EPA water quality criterion of 10 µg/L) and high (above 10 µg/L) surface-water arsenic concentrations. Consistently high (above 10 µg/L) arsenic levels from the Wood River at Kimball Park, Fort Creek, and Crooked (sites located at or near headwater spring sources), suggest a natural background source of arsenic in this area. Water flowing downstream from this area could be a potential source of arsenic to Upper Klamath Lake and the Upper Klamath River.
References Cited
Azcue, J.M. and Nriagu, J.O., 1995, Impact of abandoned mine tailings on the arsenic concentrations in Moira Lake, Ontario: Journal of Geochemical Exploration, v. 52, no. 1–2, p. 81–89. https://doi.org/10.1016/0375-6742(94)00032-7
Axtmann, E.V., and Luoma, S.N., 1991, Large-scale distribution of metal contamination in the fine-grained sediments of the Clark Fork River, Montana, USA: Applied Geochemistry v. 6, no. 1, p. 75–88, https://doi.org/10.1016/0883-2927(91)90064-V.
Battaglia-Brunet, F., Le Guédard, M., Faure, O., Charron, M., Hube, D., Devau, N., Joulian, C., Thouin, H., and Hellal, J., 2021, Influence of agricultural amendments on arsenic biogeochemistry and phytotoxicity in a soil polluted by the destruction of arsenic-containing shells: Journal of Hazardous Materials, v. 409, article 124580, https://doi.org/10.1016/j.jhazmat.2020.124580.
Benninger, L., Eldredge, J., and Holdren, G.C., 2011, Sediment chemistry investigation—Sampling, analysis, and quality assurance findings for Klamath River reservoirs and estuary, October 2009–January 2010—In support of the Secretarial determination on Klamath River dam removal and basin restoration, Klamath River, Oregon and California: Bureau of Reclamation, 464 p., accessed April 4, 2023, at https://ifrmp.net/wp-content/uploads/2017/01/Benninger-et-al_2011_0118_Sediment-Chemistry-Investigation.pdf.
Bissen, M., and Frimmel, F.H., 2003, Arsenic—A review, Part I—Occurrence, toxicity, speciation, mobility: Acta Hydrochimica et Hydrobiological, v. 31, no. 1, p. 9–18, https://doi.org/10.1002/aheh.200390025.
Bureau of Reclamation [Reclamation], 2021, Water reliability in the west—2021 SECURE Water Act Report: Bureau of Reclamation fact sheet, 2 p., accessed April 4, 2023, at https://www.usbr.gov/climate/secure/docs/2021secure/factsheets/Klamath.pdf.
Cain, D.J., Croteau, M.-N., Thompson, J.K., Parchaso, F., Stewart, R., Shrader, K.H., Zierdt Smith, E.L., and Luoma, S.N., 2021, Near-field receiving-water monitoring of trace metals and a benthic community near the Palo Alto Regional Water Quality Control Plant in south San Francisco Bay, California—2019: U.S. Geological Survey Open-File Report 2021–1079, 59 p., https://doi.org/10.3133/ofr20211079.
Campbell, K.M., and Nordstrom, D.K., 2014, Arsenic speciation and sorption in natural environments: Reviews in Mineralogy and Geochemistry, v. 79, no, 1, p. 185–216, https://doi.org/10.2138/rmg.2014.79.3.
Carpenter, K.D., Snyder, D.T., Duff, J.H., Triska, F.J., Lee, K.K., Avanzino, R.J., and Sobieszczyk, S., 2009, Hydrologic and water-quality conditions during restoration of the Wood River Wetland, upper Klamath River Basin, Oregon, 2003–05: U.S. Geological Survey Scientific Investigations Report 2009–5004, 66 p., https://doi.org/10.3133/sir20095004.
Choudhury, M.I.M., Shabnam, N., Ahsan, T., Ahsan, S.M., Kabir, M.S., Kahn, R.M., Miah, M.A., Uddin, M., and Liton, M.A.R., 2018, Cutaneous malignancy due to arsenicosis in Bangladesh—12-Year study in tertiary level hospital: BioMed Research International, v. 2018, article 4678362, 9 p., https://doi.org/10.1155/2018/4678362.
Cullen, W.R., and Reimer, K.J., 1989, Arsenic speciation in the environment: Chemical Reviews v. 89, no. 4, p. 713–764, https://doi.org/10.1021/cr00094a002.
Ferreira, G.R. de S., 2016, Arsenic mobilization from silicic volcanic rocks in the southern Willamette Valley: Portland, Oreg., Portland State University, master’s thesis, 94 p., accessed April 4, 2023, at http://archives.pdx.edu/ds/psu/17037.
Fuller, C.A., and Davis, J.A., 1989, Influence of coupling of sorption and photosynthetic processes on trace element cycles in natural waters: Nature, v. 340, p. 52–54, https://doi.org/10.1038/340052a0.
Gannett, M.W., Lite, K.E., Jr., La Marche, J.L., Fisher, B.J., and Polette, D.J., 2007, Ground-water hydrology of the upper Klamath Basin, Oregon and California: U.S. Geological Survey Scientific Investigations Report 2007–5050, 85 p., https://doi.org/10.3133/sir20075050.
Garbarino, J.R., and Taylor, H.E., 1996, Inductively coupled plasma-mass spectrometric method for the determination of dissolved trace elements in natural water: U.S. Geological Survey Open-File Report 94–358, 49 p., https://doi.org/10.3133/ofr94358.
Glaser, J.A., Foerst, D.L., Mckee, G.D., Quave, S.A., and Budde, W.L., 1981, Trace analyses for wastewaters: Environmental Science and Technology, v. 15, no. 12, p. 1426–1435, https://doi.org/10.1021/es00094a002.
Hasegawa, H., Rahman, M.A., Kitahara, K., Itaya, Y., Maki, T., and Ueda, K., 2010, Seasonal changes of arsenic speciation in lake waters in relation to eutrophication: Science of the Total Environment, v. 408, no. 7, p. 1684–1690, https://doi.org/10.1016/j.scitotenv.2009.11.062.
Hill, K.L., Croteau, M.N., Topping, B.R., Caro, D.A., Parris, J.L., Zierdt Smith, E.L., and Baesman, S.M., 2021, Dissolved arsenic, copper and lead concentrations in surface water within the Klamath Basin (ver. 4.0, April 2023): U.S. Geological Survey data release, https://doi.org/10.5066/P943CWH1.
Hinkle, S.R., and Polette, D.J., 1999, Arsenic in ground water of the Willamette Basin, Oregon: U.S. Geological Survey Water-Resources Investigations Report 98–4205, 28 p., 1 pl., https://doi.org/10.3133/wri984205.
Hughes, M.F., 2002, Arsenic toxicity and potential mechanisms of action: Toxicology letters, v. 133, no. 1, p. 1–16, https://doi.org/10.1016/S0378-4274(02)00084-X.
Hughes, M.F., Beck, B.D., Chen, Y., Lewis, A.S., and Thomas, D.J., 2011, Arsenic exposure and toxicology—A historical perspective: Toxicological Sciences, v. 123, no. 2, p. 305–332, https://doi.org/10.1093/toxsci/kfr184.
Kuwabara, J.S., Chang, C.C.Y., and Pasilis, S.P., 1990, Effects of benthic flora on arsenic transport: Journal of Environmental Engineering, v. 116, no. 2, p. 394–409, https://doi.org/10.1061/(ASCE)0733-9372(1990)116:2(394).
Kuwabara, J.S., Topping, B.R., Carter, J.L., Carlson, R.A., Parchaso, F., Fend, S.V., Stauffer-Olsen, N., Manning, A.J., and Land, J.M., 2016, Benthic processes affecting contaminant transport in Upper Klamath Lake, Oregon (ver. 1.1, October 2016): U.S. Geological Survey Open-File Report 2016–1175, 103 p., https://doi.org/10.3133/ofr20161175.
Kuwabara, J.S., Topping, B.R., Lynch, D.D., Carter, J.L., and Essaid, H.I., 2009, Benthic nutrient sources to hypereutrophic upper Klamath Lake, Oregon, USA: Environmental Toxicology and Chemistry, v. 28, no. 3, p. 516–524, https://doi.org/10.1897/08-207.1.
Luoma, S.N., and Bryan, G.W., 1981, A statistical assessment of the form of trace metals in oxidized estuarine sediments employing chemical extractants: Science of the Total Environment, v. 17, no. 2, p. 165–196, https://doi.org/10.1016/0048-9697(8)90182-0.
McLaren, S.J., and Kim, N.D., 1995, Evidence for a seasonal fluctuation of arsenic in New Zealand’s longest river and the effect of treatment on concentrations in drinking water: Environmental Pollution, v. 90, no. 1., p. 67–73, https://doi.org/10.1016/0269-7491(94)00092-R.
Maguffin, S.C., Kirk, M.F., Daigle, A.R., Hinkle, S.R., and Jin, Q., 2015, Substantial contribution of biomethylation to aquifer arsenic cycling: Nature Geoscience, v. 8, no. 4, p. 290–293, https://doi.org/10.1038/ngeo2383.
May, T.W., and Wiedmeyer, R.H., 1998, A table of polyatomic interferences in ICP-MS: Atomic Spectroscopy, v. 19, no. 5, p. 150–155, accessed November 8, 2022, at http://www.at-spectrosc.com/uploadfile/cover/as/1998_5_contents.pdf#page=10.
McCleskey, R.B., Nordstrom, D.K., and Ball, J.W., 2003, Metal interferences and their removal prior to the determination of As(T) and As(III) in acid mine waters by hydride generation atomic absorption spectrometry: U.S. Geological Survey Water-Resources Investigations Report 2003–4117, 14 p., https://doi.org/10.3133/wri034117.
McCleskey, R.B., Nordstrom, D.K., and Maest, A.S., 2004, Preservation of water samples for arsenic(III/V) determinations—An evaluation of the literature and new analytical results: Applied Geochemistry, v. 19, no. 7, p. 995–1009, https://doi.org/10.1016/j.apgeochem.2004.01.003.
Merry, R.H., Tiller, K.G., and Alston, A.M., 1983, Accumulation of copper, lead and arsenic in some Australian orchard soils: Australian Journal of Soil Research, v. 21, no. 4, p.549–561, https://doi.org/10.1071/SR9830549.
Monagail, M.M., Cummins, E., Bermejo, R., Daly, E., Costello, D., and Morrison, L., 2018, Quantification and feed to food transfer of total and inorganic arsenic from a commercial seaweed feed: Environment International, v. 118, p. 314–324, https://doi.org/10.1016/j.envint.2018.05.032.
Ng, J.C., 2005, Environmental contamination of arsenic and its toxicological impact on humans: Environmental Chemistry v. 2, no. 3, p. 146–160, https://doi.org/10.1071/EN05062.
Nimick, D.A., Gammons, C.H., and Parker, S.R., 2011, Diel biogeochemical processes and their effect on the aqueous chemistry of streams—A review. Chemical Geology, v. 283, no. 1–2, p. 3–17, https://doi.org/10.1016/j.chemgeo.2010.08.017.
Nimick, D.A., Moore, J.N., Dalby, C.E., and Savka, M.W., 1998, The fate of geothermal arsenic in the Madison and Missouri Rivers, Montana and Wyoming: Water Resources Research, v. 34, no. 11, p. 3051–3067, https://doi.org/10.1029/98WR01704.
O’Day, P.A., 2006, Chemistry and mineralogy of arsenic: Elements, v. 2, no. 2, p. 77–83, https://doi.org/10.2113/gselements.2.2.77.
Ong, C.G., Tanji, K.K., Dahlgren, R.A., Smith, G.R. and Quek, A.F., 1995, Water quality and trace element evapoconcentration in evaporation ponds for agricultural wastewater disposal: Journal of Agricultural and Food Chemistry, v. 43, no. 7, p. 1941–1947, https://doi.org/10.1021/jf00055a034.
Oregon Department of Environmental Quality [DEQ], 2011, Water quality standards: Portland, Ore., State of Oregon Department of Environmental Quality, accessed February 21, 2023, at https://www.oregon.gov/deq/FilterDocs/wqstandardsinfo.pdf.
Oregon Department of Environmental Quality [DEQ], 2013, Development of Oregon background metals concentrations in soil: State of Oregon Department of Environmental Quality, Land Quality Division Cleanup Program, Technical Report, 38 p., accessed February 21, 2023, at https://digital.osl.state.or.us/islandora/object/osl:21142.
Oregon Department of Environmental Quality [DEQ], 2019, Klamath toxics basin summary (ver. 1.3, October 17, 2019): State of Oregon Department of Environmental Quality, Laboratory and Environmental Assessment Division, no. DEQ19–LAB–0041–TR, 34 p., accessed February 21, 2023, at https://www.oregon.gov/deq/FilterDocs/KlamathToxicsSummary.pdf. [Also available at https://digital.osl.state.or.us/islandora/object/osl:944436.]
Plumlee, G.S., Smith, K.S., Montour, M.R., Ficklin, W.H., and Mosier, E.L., 1997, Geologic controls on the composition of natural waters and mine waters draining diverse mineral deposit types, chap. 19 of Plumlee, G.S., Logsdon, M.J., and Filipek, L.F., eds., The environmental geochemistry of mineral deposits, Part B—Case studies and research topics: Society of Economic Geologists, Reviews in Economic Geology, v. 6, p. 373–432, https://doi.org/10.5382/Rev.06.19.
Rahman, M.A., and Hasegawa, H., 2012, Arsenic in freshwater systems—Influence of eutrophication on occurrence, distribution, speciation, and bioaccumulation: Applied Geochemistry, v., 27, no. 1, p. 304–314, https://doi.org/10.1016/j.apgeochem.2011.09.020.
Rudnick, R.L., and Gao, S., 2003, Composition of the continental crust, chap. 3.01 of Treatise on geochemistry (2d ed.): Elsevier, Ltd., v. 3, p. 1–64, https://doi.org/10.1016/B0-08-043751-6/03016-4.
Ruokolainen, M., Pantsar-Kallio, M., Haapa, A., Kairesalo, T., 2000, Leaching, runoff and speciation of arsenic in a laboratory mesocosm: Science of the Total Environment, v. 258, no. 3, p. 139–147, https://doi.org/10.1016/S0048-9697(00)00521-0.
Sharma, V.K., and Sohn, M., 2009, Aquatic arsenic—Toxicity, speciation, transformations, and remediation: Environment International, v. 35, no. 4, p. 743–759, https://doi.org/10.1016/j.envint.2009.01.005.
Smedley, P.L., and Kinniburgh, D.G., 2002, A review of the source, behaviour and distribution of arsenic in natural waters: Applied Geochemistry, v. 17, no. 5, p. 517–568, https://doi.org/10.1016/S0883-2927(02)00018-5.
Smith, E., and Naidu, R., 2009, Chemistry of inorganic arsenic in soils—Kinetics of arsenic adsorption–desorption: Environmental Geochemistry and Health, v. 31, p. 49–59, https://doi.org/10.1007/s10653-008-9228-z.
Sorenson, S.K., and Schwarzbach, S.E., 1991, Reconnaissance investigation of water quality, bottom sediment, and biota associated with irrigation drainage in the Klamath Basin, California and Oregon, 1988–89: U.S. Geological Survey Water-Resources Investigations Report 90–4203, https://doi.org/10.3133/wri904203.
Stoner, J.C., Whanger, P.D., and Weswig, P.H., 1977, Arsenic levels in Oregon waters: Environmental Health Perspectives, v. 19, p. 139–143, https://doi.org/10.1289/ehp.7719139.
Sturdevant, D., 2011, Water quality standards review and recommendations—Arsenic, Attachment E, April 21, 2011, EQC meeting: Oregon Department of Environmental Quality (DEQ), Water Quality Standards Program Draft Report, 36 p., accessed February 21, 2023, at https://www.oregon.gov/deq/FilterDocs/AppEArsenicIssuePaper.pdf.
Tang, Y., Zhang, M., Sun, G., and Pan, G., 2019, Impact of eutrophication on arsenic cycling in freshwaters: Water Research, v. 150, p. 191–199, https://doi.org/10.1016/j.watres.2018.11.046.
Thirunavukkarasu, O.S., Viraraghavan, T., Subramanian, K.S., and Tanjore, S., 2002, Organic arsenic removal from drinking water: Urban Water, v. 4, no. 4, p. 415–421, https://doi.org/10.1016/S1462-0758(02)00029-8.
U.S. Bureau of Land Management, 2023, National surface management agency area polygons: Esri file geodatabase, accessed March 1, 2023, at https://gbp-blm-egis.hub.arcgis.com/datasets/blm-national-sma-surface-management-agency-area-polygons/about.
U.S. Environmental Protection Agency [EPA], 1984, Ambient water quality criteria for lead: U.S. Environmental Protection Agency, Office of Water Regulations and Standards, Criteria and Standards Division, no. EPA 440/5-84-027, accessed February 21, 2023, at https://www.epa.gov/sites/default/files/2019-02/documents/ambient-wqc-lead-1984.pdf.
U.S. Environmental Protection Agency [EPA], 2001, Drinking water standard for arsenic: U.S. Environmental Protection Agency, Office of Water, no. EPA 815-F-00-015, 2 p., accessed February 21, 2023, at https://www.epa.gov/dwreginfo/chemical-contaminant-rules. [Also available at https://nepis.epa.gov/Exe/ZyPURL.cgi?Dockey=20001XXC.txt.]
U.S. Environmental Protection Agency [EPA], 2007. Aquatic life ambient freshwater quality criteria—Copper (revision 2007): U.S. Environmental Protection Agency, Office of Water, Office of Science and Technology, no. EPA-822-R-07-00, accessed February 21, 2023 at https://www.epa.gov/sites/default/files/2019-02/documents/al-freshwater-copper-2007-revision.pdf.
U.S. Geological Survey [USGS], 2021, National Land Cover Database (NLCD): U.S. Geological Survey, Earth Resources Observation and Science (EROS) Center, Multi-Resolution Land Characteristics (MRLC) Consortium, accessed March 3, 2023, at http://www.mrlc.gov.
U.S. Geological Survey [USGS], 2023, USGS water data for the Nation: U.S. Geological Survey National Water Information System database, accessed March 21, 2023, at https://doi.org/10.5066/F7P55KJN.
Appendix 1. Method Detection Limits and Method Reporting Levels for the Inductively Coupled Plasma Mass Spectrometry Method
Table 1.1.
Method detection limits and method reporting levels for the inductively coupled plasma mass spectrometry method that was used to analyze samples collected in the Klamath River Basin, Oregon and California.[Concentrations inferred from 65Cu and 208Pb were used to calculate method limits. Dates are given in year-month (yyyy-mm) format. As, arsenic; Cu, copper; Pb, lead; MDL, method detection limit; MRL, method reporting level; µg/L, micrograms per liter]
Appendix 2. Statistical Parameters for Seasonal Comparisons of Monthly Arsenic Concentration Means
Table 2.1.
Statistical parameters for seasonal comparisons of monthly arsenic concentration means at 39 sampling sites in the Klamath River Basin, Oregon and California.[Data from Hill and others (2021). ANOVA, analysis of variance; p, probability value; ND, not detected, Sp, spring, Su, summer, F, fall, —, not applicable; <, less than; KSD, Klamath Strait Drain; USGS, U.S. Geological Survey]
Conversion Factors
Temperature in degrees Celsius (°C) may be converted to degrees Fahrenheit (°F) as follows:
°F = (1.8 × °C) + 32.
Temperature in degrees Fahrenheit (°F) may be converted to degrees Celsius (°C) as follows:
°C = (°F – 32) / 1.8.
Datums
Coordinate information is referenced to the World Geodetic System 1984 (WGS 84).
Elevation, as used in this report, refers to distance above the vertical datum.
Supplemental Information
Specific conductance is given in microsiemens per centimeter at 25 degrees Celsius (µS/cm at 25 °C).
Concentrations of chemical constituents in water are given in either milligrams per liter (mg/L) or micrograms per liter (µg/L).
Abbreviations
ANOVA
analysis of variance
As(III)
arsenite
As(V)
arsenate
Ca
calcium
Cu
copper
DDT
dichlorodiphenyltrichloroethane
DEQ
Department of Environmental Quality
DEV
deviation
DMA
dimethylarsinate
EC50
half-maximal effective concentration
EPA
U.S. Environmental Protection Agency
GM
grand mean
HCl
hydrochloric acid
HNO3
nitric acid
ICPMS
inductively coupled plasma mass spectrometry
ICP-OES
inductively coupled plasma-optical emission spectrometry
LC50
lethal concentration 50
LC-ICP-MS/MS
liquid chromatography-inductively coupled plasma-tandem mass spectrometry
MΩ cm
megohm centimeter
MDL
method detection limit
mL
milliliter
µm
micrometer
MMA
monomethylarsonate
NRCC
National Research Council of Canada
NS
not sampled
NWQL
National Water Quality Laboratory
p
probability value
Pb
lead
PCA
principal component analysis
ppb
parts per billion
r
correlation coefficient
Reclamation
Bureau of Reclamation
redox
oxidation reduction
RL
reporting levels
SEM
standard error of the mean
USGS
U.S. Geological Survey
WQC
water quality criteria
Disclaimers
Any use of trade, firm, or product names is for descriptive purposes only and does not imply endorsement by the U.S. Government.
Although this information product, for the most part, is in the public domain, it also may contain copyrighted materials as noted in the text. Permission to reproduce copyrighted items must be secured from the copyright owner.
Suggested Citation
Croteau, M.N., Topping, B.R., and Carlson, R.A., 2024, Dissolved arsenic concentrations in surface waters within the upper portions of the Klamath River Basin, Oregon and California: U.S. Geological Survey Scientific Investigations Report 2024–5029, 42 p., https://doi.org/10.3133/sir20245029.
ISSN: 2328-0328 (online)
Study Area
| Publication type | Report |
|---|---|
| Publication Subtype | USGS Numbered Series |
| Title | Dissolved arsenic concentrations in surface waters within the upper portions of the Klamath River Basin, Oregon and California |
| Series title | Scientific Investigations Report |
| Series number | 2024-5029 |
| DOI | 10.3133/sir20245029 |
| Publication Date | June 21, 2024 |
| Year Published | 2024 |
| Language | English |
| Publisher | U.S. Geological Survey |
| Publisher location | Reston VA |
| Contributing office(s) | Geology, Minerals, Energy, and Geophysics Science Center |
| Description | Report: viii, 38 p.; Data Release |
| Country | United States |
| State | California, Oregon |
| Other Geospatial | Klamath River basin |