

Using Ground Crack and Very Low Frequency Measurements to Map the Location of the June 2007 Father’s Day Dike, Kīlauea Volcano
Links
- Document: Report (8.8 MB pdf) , HTML , XML
- Data Release: USGS data release - Ground crack, VLF measurement, and sample vesicularity data for the June 2007 Father’s Day eruption, Kīlauea Volcano
- NGMDB Index Page: National Geologic Map Database Index Page (html)
- Download citation as: RIS | Dublin Core
Acknowledgments
Eruption response is a team effort, and we thank the staff, students, and volunteers of the U.S. Geological Survey (USGS) Hawaiian Volcano Observatory, the National Park Service, and the University of Hawai‘i at Hilo for the logistical support and observations that helped facilitate this research. We are grateful for the expert piloting of D. Okita of Volcano Helicopters. D. Swanson and M. Poland of the USGS Hawaiian Volcano Observatory helped with the mapping and measuring of ground cracks. Installation and measurement campaigns of the crack stations in Nāpau Crater were conducted over the years in collaboration with USGS Hawaiian Volcano Observatory scientists D. Sherrod, J. Sutton. This work was aided by USGS Hawaiian Volcano Observatory volunteers D. Weiss, D. Ahearn, R. Holm, M. Cazeneuve, D. Goehring, E. Llewellin, R. Doust, A. DeMello, and M. Garcia. A. DeMello also helped with measurement of VLF receiver transects. Reviews by R. Hazlett and E. Gallant improved the manuscript greatly. We extend our appreciation to K. Petersen and K. Sullivan for illustration and cartography support and to C. Landowski and K. Pauls for editing the report.
Abstract
An intrusion into Kīlauea’s upper East Rift Zone during June 17–19, 2007, during the 1983–2018 Pu‘u‘ō‘ō eruption, led to widespread ground cracking and a small (approximately 1,525 cubic meters) eruption on the northeast flank of Kānenuiohamo, a cone about 6 kilometers upslope from Pu‘u‘ō‘ō. Transmitted and induced very low frequency (VLF) magnetic fields were measured with a handheld VLF receiver along transects spanning the dike trace, and zones of ground cracking related to the intrusion were mapped. The locations of crack zones and the VLF receiver measurements suggest that the Father’s Day dike splayed as it approached the surface, dividing into four segments—one between Pauahi Crater and Pu‘uhuluhulu and three en echelon segments near Kānenuiohamo. The dike did not extend appreciably northeastward beyond the eruption site.
Introduction
Kīlauea (United States) underwent several changes in 2007. Years of heightened activity, caused by a near-doubling of the magma supply rate to the volcano (Poland and others, 2012), culminated in a magmatic intrusion into Kīlauea’s East Rift Zone that spanned the period June 17–19, 2007. Poland and others (2008) gave an overview of the mid-June 2007 activity, which caused widespread ground cracking in the upper East Rift Zone starting on June 17 and culminated in a short-lived, volumetrically small eruption on the northeast flank of Kānenuiohamo, about 6 kilometers (km) upslope from Pu‘u‘ō‘ō, on June 19 (fig. 1). This activity is informally known as the Father’s Day eruption, since it started on the Father’s Day holiday (United States), and it is categorized as episode 56 of the Pu‘u‘ō‘ō eruption (Orr and others, 2015). The Pu‘u‘ō‘ō eruption lasted in total from 1983 to 2018 (Neal and others, 2019).
Here we describe the Father’s Day eruption and discuss a few aspects of the activity not covered elsewhere, including the ground cracking associated with the intrusion and the results of electromagnetic measurements that were made across the trace of the dike using the very low frequency (VLF) technique (see, for example, McNeill and Labson, 1991). These measurements help us to better understand how the intruding dike splayed as it approached the surface from depth.
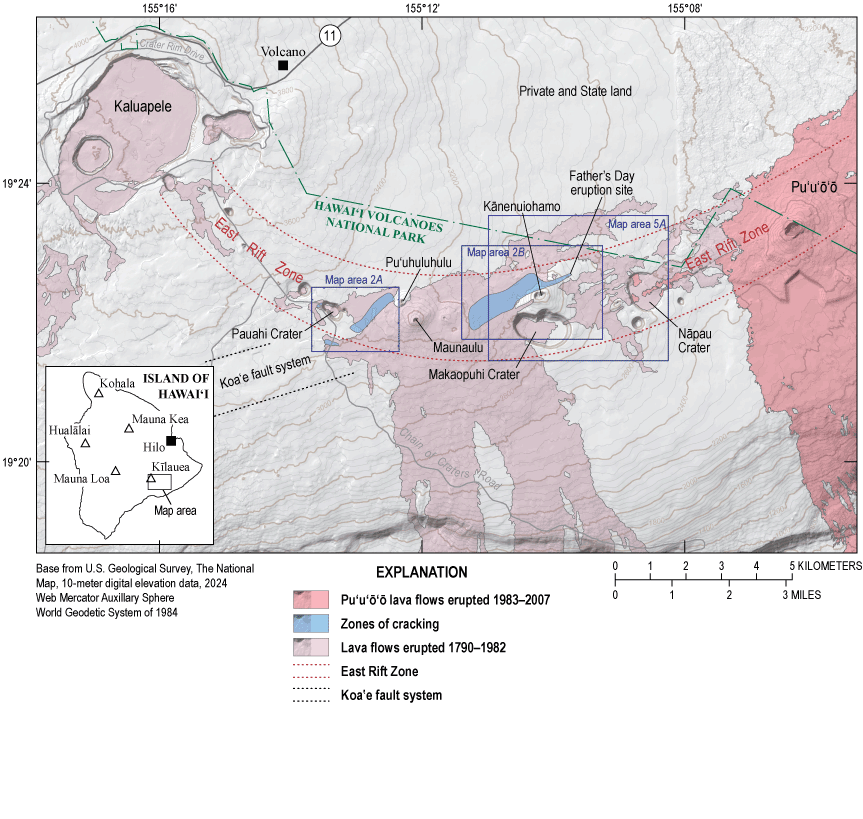
Map showing summit and upper East Rift Zone of Kīlauea and pertinent geological features. Kaluapele is the main caldera of Kīlauea. Zones of cracking are related to Father’s Day eruption in June 2007; Pu‘u‘ō‘ō lava flows that erupted 1983–2007 are shown for reference; and lava flows erupted 1790–1982 are also included. Inset, Map of Island of Hawaiʻi showing volcano summits and study area.
Eruption setting
From 1997 to 2007, magma traveled from Kīlauea’s summit reservoir through the East Rift Zone to Pu‘u‘ō‘ō, where it erupted from vents on the southwest flank of Pu‘u‘ō‘ō (fig. 1; Heliker and Mattox, 2003; Orr and others, 2015). Lava tube systems carried the lava to the island’s southeast coast. Ephemeral outgassing spatter cones and small lava lakes were also commonly present on Pu‘u‘ō‘ō’s crater floor during this period.
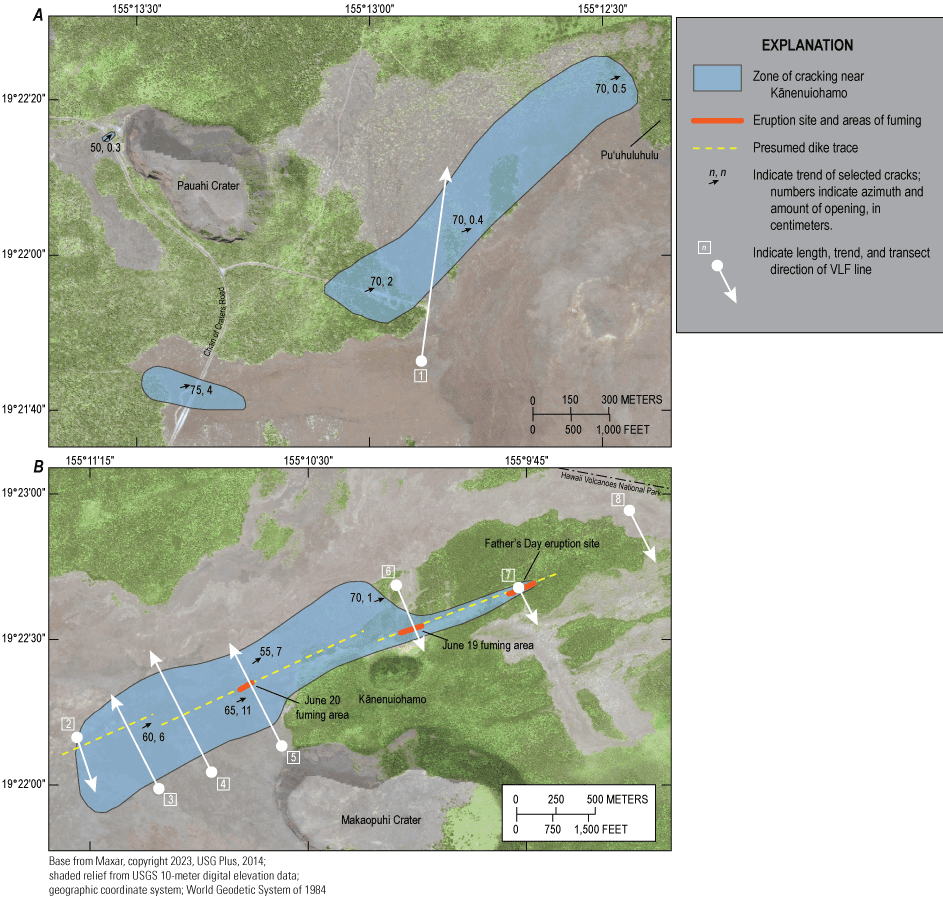
Maps showing zones of cracking near (A) Pauahi Crater and (B) Kānenuiohamo, Kīlauea, Island of Hawaiʻi. The white arrows indicate length, trend, and transect direction of very low frequency (VLF) transect lines through the zones of cracking at each location.
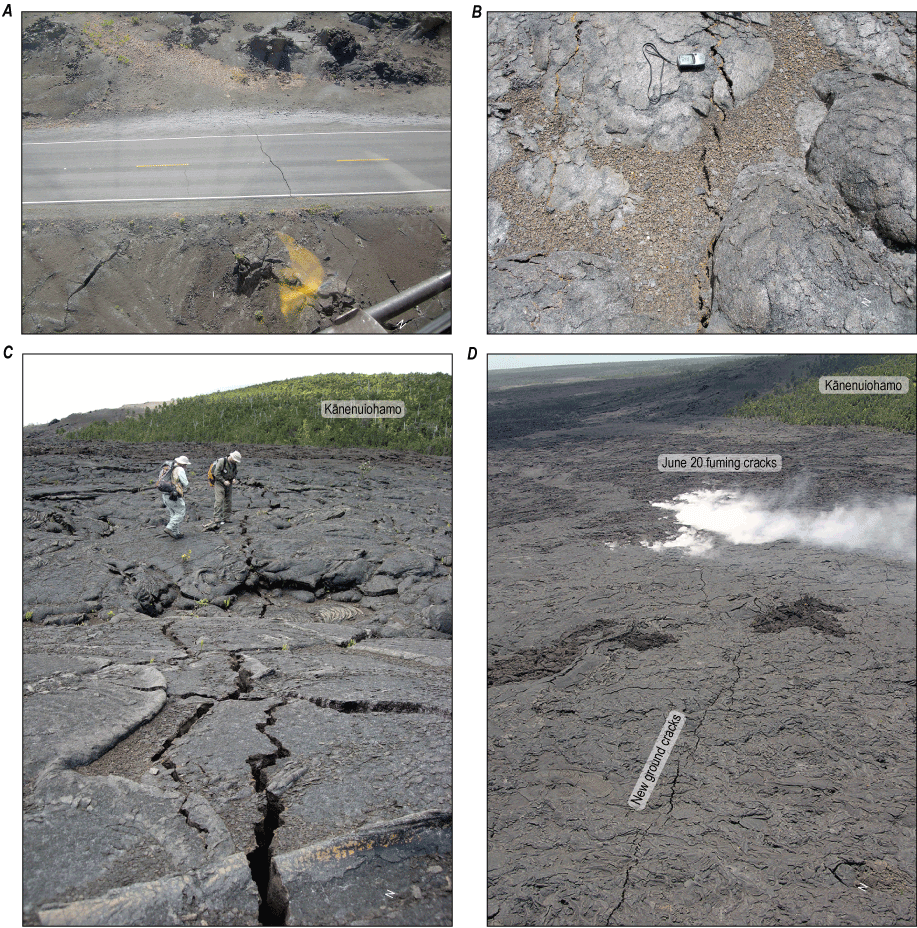
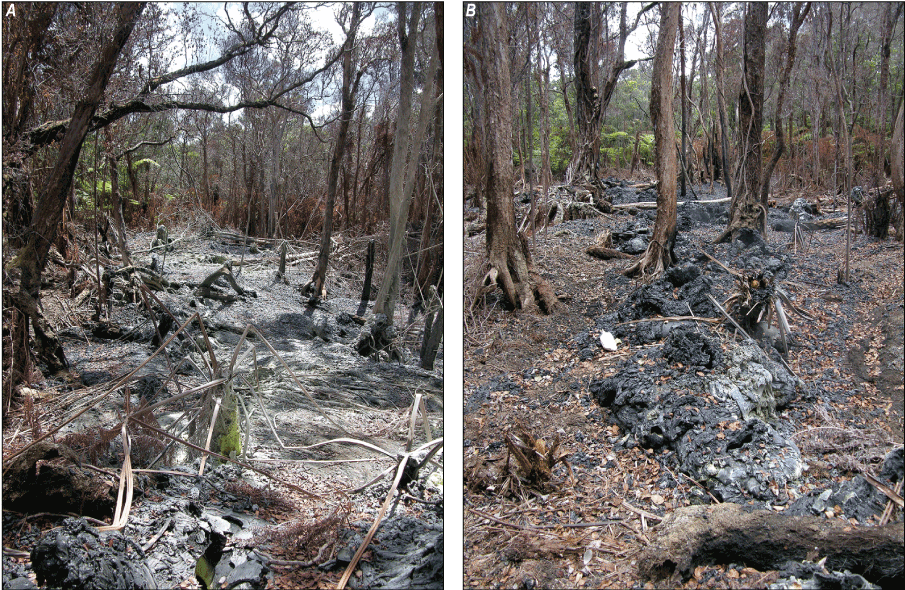
Photographs showing new cracks formed during the Father’s Day eruption in 2007, Kīlauea, Island of Hawaiʻi. A, Oblique aerial photograph showing new cracks crossing Chain of Craters Road south of Pauahi Crater on June 17, 2007. Photograph by T. Orr, U.S. Geological Survey. B, Photograph taken showing new cracks cutting lava and tephra surfaces on plain between Maunaulu and Kānenuiohamo on June 18, 2007. Photograph by D. Swanson, U.S. Geological Survey. C, Photograph taken showing new cracks on plain between Maunaulu and Kānenuiohamo, on June 18, 2007, looking along strike. Photograph by M. Poland, U.S. Geological Survey. D, Oblique aerial photograph with a northeast view at new ground cracks on the plain between Maunaulu and Kānenuiohamo on June 21, 2007. Gas emissions from the cracks increased dramatically on June 20, 2007. Photograph by T. Orr, U.S. Geological Survey.
Starting in 2003, Global Positioning System (GPS) sensors spanning the volcano’s summit and upper East Rift Zone showed gradual extension, interpreted as pressurization of the summit magma reservoir due to an increase in magma supply (Poland and others, 2012). This manifested as an upsurge in discharge from the vent active at Pu‘u‘ō‘ō at that time. The extent of the pressurization was expressed on May 24, 2007, by two M4+ earthquakes and a brief swarm of smaller events (Wauthier and others, 2013) associated with Kīlauea’s outermost caldera faults. The overall pressurization of the volcano’s magmatic system, however, was unaffected by this seismicity, and extension continued.
The pressurized condition of the volcano changed abruptly at 0216 (all times Hawaii Standard Time [HST]) on June 17, 2007, when magma from Kīlauea’s summit began to intrude the volcano’s upper East Rift Zone (fig.1; Poland and others, 2008). Increased seismicity caused nearly continuous ground shaking felt as far away as Volcano, Hawai‘i (fig. 1), about 8 km north of the East Rift Zone. The seismicity was initially centered between Pauahi Crater and Maunaulu but migrated downrift to Makaopuhi Crater over the next two days (fig. 1; Poland and others, 2008).
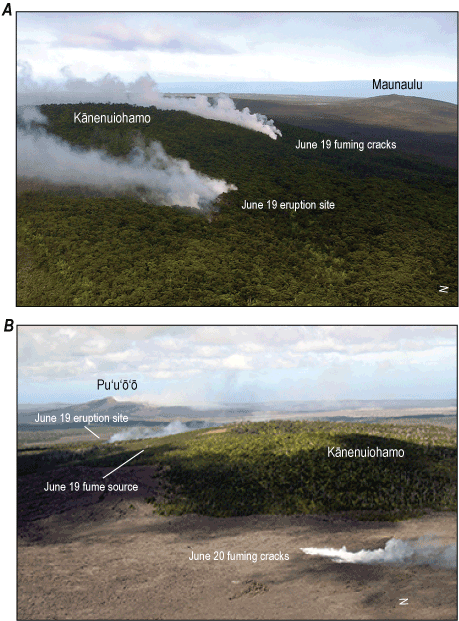
Oblique aerial photographs showing views of fume sources on June 19 and 20, 2007, Kīlauea, Island of Hawaiʻi. A, Oblique aerial photograph looking west (uprift) at fume sources on flank of Kānenuiohamo on June 19, 2007. June 19 eruption site in foreground; more distant area is fume rising from old fissures formed in 1969. Photograph by T. Orr, U.S. Geological Survey. B, Oblique aerial photograph looking east (downrift) at fume sources on and near Kānenuiohamo on June 20, 2007. Gas emissions in foreground were barely evident the previous day (June 19); conversely, robust emissions at the 1969 fissures on Kānenuiohamo on June 19 were nearly nonexistent on June 20. Photograph by C. Heliker, U.S. Geological Survey.
Borehole tiltmeters at the summit of the volcano recorded the onset of rapid deflation at about the same time as the onset of the earthquake swarm, and tiltmeters at Pu‘u‘ō‘ō began recording deflation a few minutes later (Poland and others, 2008). This was followed by slow subsidence of the floor of Pu‘u‘ō‘ō starting at about 0930 HST on June 17, and spatter cones on the crater floor and on the west and southwest flanks of Pu‘u‘ō‘ō collapsed as they were engulfed by gradually enlarging pits. The crater floor continued to fall over the following days, parts of it dropping about 80 meters (m) by June 21 (Poland and others, 2008; Orr, 2014). The magma supply to the active tube system was severed as the magma column withdrew, causing the Pu‘u‘ō‘ō eruption to cease.
New ground cracks developed in four areas from Pauahi Crater to Kānenuiohamo during the Father’s Day eruption (figs. 1–3), and just after sunrise on June 19, gas emissions were discovered emanating from two spots in the area of cracking that crossed the flank of Kānenuiohamo (fig. 4). Specifically, whitish gas emissions were streaming profusely from fissures that formed in 1969 on the north flank of the cone, and a robust plume of bluish fume was rising from its heavily forested northeast flank. Fissures had opened at this second location overnight, erupting sparse tephra and two small pads of lava (figs. 5, 6). A third area of barely perceptible fuming was also observed that same morning on the lava plain just east of Kānenuiohamo, but it was no longer apparent a few hours later, as the day warmed and humidity dropped. Fuming from the third area reappeared and increased dramatically in strength overnight, forming a small white plume when seen in the morning on June 20, whereas the June 19 fuming area at the 1969 fissures to the northeast was barely evident (fig. 4B). The June 20 fuming cracks emitted choking gases and were found to be too hot to approach closely, indicating that magma was close to the surface.
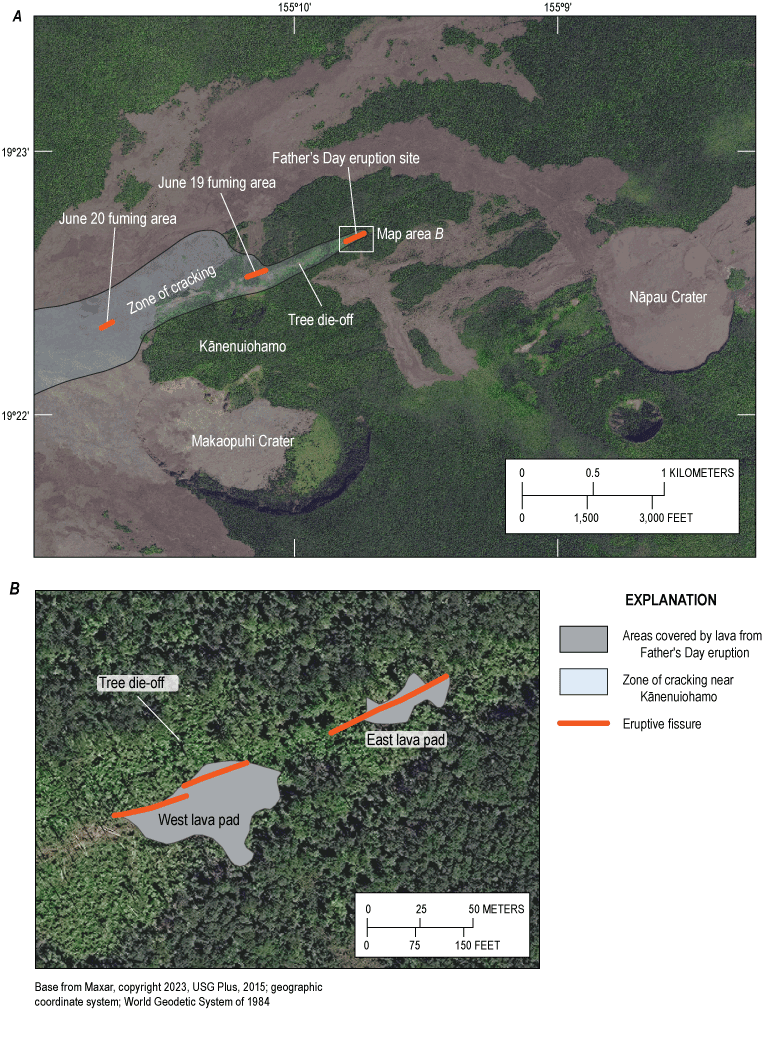
Maps showing zone of cracking near Kānenuiohamo and location of Father’s Day eruption and fuming cracks on June 19 and 20, 2007, Kīlauea, Island of Hawai‘i. A, Map showing zone of cracking near Kānenuiohamo and location of Father’s Day eruption and fuming cracks. White box indicates location of B, map showing eruptive fissures and areas covered by lava from Father’s Day eruption.
The Father’s Day eruption was followed by a period of repose at Kīlauea, during which there was no discernable eruptive activity. The Pu‘u‘ō‘ō eruption resumed 12 days later, on July 1, with lava erupting in the bottom of the Pu‘u‘ō‘ō (Orr, 2014). After a period of filling, new fissures opened on the east flank of Pu‘u‘ō‘ō on July 21, marking the start of a new episode of eruptive activity (Orr and others, 2022). The trace of the Father’s Day dike on the forested north flank of Kānenuiohamo became more apparent over the following years (fig. 5), as increased heat flow from the intrusion caused considerable tree die-off while leaving the understory ferns unaffected.
Photographs showing June 19, 2007, eruption site views of the (A) west lava pad and the (B) east lava pad, taken on August 10, 2007, Kīlauea, Island of Hawai‘i. Photographs by T. Orr, U.S. Geological Survey.
Methods
The field observations used in this report were conducted on the ground and during helicopter overflights. Activity at Pu‘u‘ō‘ō was also observed by a telemetered webcam on the north rim of the Pu‘u‘ō‘ō cone (Hoblitt and others, 2008). Another telemetered webcam was temporarily deployed on June 20 to the west flank of Maunaulu looking toward Kānenuiohamo.
Cracks associated with the Father’s Day eruption were identified on the ground by the exposure of fresh crack surfaces where they cut older pāhoehoe and tephra cover (figs. 3B, C) and sometimes duff where forested. Larger cracks were visible from the air (figs. 3A, D). Crack locations were marked by hand-held GPS devices (horizontal accuracy approximately plus or minus (±) 10 m) during foot traverses across the affected area. The mapped extent of cracking is incomplete, especially where these crack zones border forest, which is heavily vegetated with thick undergrowth in most of this area, and where they abut ʻaʻā flows, which have a rubbly carapace that does not preserve small cracks. Crack width and opening direction were measured for a subset of cracks (fig. 2; appendix 1). Crack lengths were not measured during the eruption because of insufficient time and resources during the ongoing volcanic crisis. At later times, it was no longer possible to locate the smaller cracks because they were either covered by soil or had lost their fresh appearance and could not be distinguished from older cracks. In general, the smaller cracks could be traced for up to a few tens of meters before they ended or intersected natural joints in the pāhoehoe surface. The largest cracks could be traced for a few hundred meters, though individual en echelon segments were generally as long as a few tens of meters.
In late June 2007, we re-measured five crack stations on the floor of Nāpau Crater (appendix 2) that had been installed shortly after an eruption there in January 1997 (Thornber and others, 2003). The stations were located along a major East Rift Zone crack system related to the 1997 eruption. Each crack station is marked by a set of three or four hardened-steel survey nails arranged in a network that spans the monitored crack. Distances between the nails, marked from the dimple at the center of each nail head, were measured to the nearest millimeter with a fiberglass surveying tape, allowing changes in crack width to be determined. Prior to our measurements in 2007, the crack stations had last been measured in 1999. During our 2007 survey, we found the survey nails to be heavily corroded, but the center of each nail head could still be approximated to within ±1 mm. A south-to-north foot traverse across Nāpau Crater to look for new ground cracks was also conducted.
The margins of the lava flows and the extents of the eruptive fissures were mapped on the ground using a hand-held GPS with a horizontal accuracy of ±10 m. Lava and tephra samples were collected by hand, after the eruption ended, from points along the fissures and lava pads (fig. 5). In most locations, tephra (spatter) was collected both from the top surface of the lava flows and from the forest floor beneath them. The density of the basalt erupted (appendix 3) was determined by measuring the weight of spatter and lava clasts in air and water following the approach of Houghton and Wilson (1989). Density was converted to vesicularity using a dense rock equivalent density of 2.75 grams per cubic centimeter (g/cm3) (Lesher and Spera, 2015).
Very low frequency electromagnetic energy in the 15–28 kilohertz (kHz) range is transmitted nearly continuously by a global network of high-powered military transmitters, producing a vertical electric field and tangential magnetic field. These components of the VLF wave are affected by local conductivity heterogeneities, such as those caused by shallow intrusive bodies, which can generate an electromagnetic contrast that is orders of magnitude higher in conductivity than the surroundings (Zablocki, 1978; Kauahikaua and others, 1998) that can last for decades (Davis, 2015). For a shallow, narrow conductor, such as a dike, the VLF wave generates an induced magnetic field detectable with a portable VLF receiver, which measures the elliptically polarized sum of the transmitted and induced magnetic fields. This technique has long been used in volcanic settings (for example, Zablocki, 1978; Jackson and others, 1987; Kauahikaua and others, 1996; Davis, 2015), for instance to estimate the location of new dikes (Zablocki, 1978). We used the technique here to locate the trace of the Father’s Day dike.
Results
Ground cracking
The new ground cracks associated with the Father’s Day eruption were first found where they crossed the Chain of Craters Road southwest of Maunaulu, within Hawaiʻi Volcanoes National Park, midday on June 17 (figs. 1–3). This area is at the eastern end of the Koa‘e fault system, close to where it intersects the East Rift Zone (Duffield, 1975; Swanson and others, 2019). The crack zone was oriented approximately east–west and was trackable a few hundred meters on either side of the highway. The individual cracks were oriented from about 90° to 115° (roughly parallel to the crack zone) and ranged in width from hairline to 2 centimeters (cm) when first observed, but they continued to grow, and some were found to have widths ranging from 3 to 6 cm the next day (June 18). The main crack crossing the road had the same sense of slip as nearby fault scarps, with a slight north-side-down offset. The road was patched by the National Park Service later in the day on June 18, and the cracks showed no signs of widening after that. The cracks generally stepped left at their tips, although some right steps were also seen.
A larger zone of new ground cracks oriented roughly northeast–southwest was found June 18 on the lava plain between Maunaulu and Kānenuiohamo (figs. 1, 2). Later excursions into the area, after the Father’s Day eruption was over, found that some cracks had widened, and additional cracks had formed. The cracks, which ranged in width from hairline to about 10 cm (as measured on June 18), were generally aligned with the trend of Kīlauea’s East Rift Zone (approximately [~] 65°) and were identified by the exposure of fresh crack surfaces and lack of infilling debris and vegetation (figs. 2, 3). On June 18, faint pops and booms were heard when we were in relatively quiet spots sheltered from wind noise. These sounds were probably related to crack development in response to the propagating and ascending dike. The cracks define a ~0.5-km by 3-km zone that extends from near the east base of Maunaulu, across the north flank of Kānenuiohamo, and to the June 19 eruption site (fig. 1). It did not extend as far as the 1972 Maunaulu lava flow, which is 720 meters farther northeast.
A poorly developed crack zone oriented roughly northeast–southwest was also found in the area between Pauahi Crater and Pu‘uhuluhulu (figs. 1, 2). Cracks within this zone were oriented at roughly 70° and were generally hairline to a few millimeters across. However, several larger, en echelon cracks at the southwest end of this zone crossed the Maunaulu access road and parking area. One set of cracks even formed a low (~10 cm), north-side-down hump crossing the pavement. The southeast edge of this crack zone borders a large ʻaʻā flow, which does not preserve small cracks because of its rubbly surface, so the shape of the zone as shown in figure 2A probably does not well represent its actual shape.
A single crack likely related to the Father’s Day eruption was also found extending across the Chain of Craters Road near Pauahi Crater. The crack opening increased from 4 mm on June 17 to 1 cm by June 21, with north-side down vertical motion that caused a low hump in the paved road.
We found no fresh cracks during our traverse of Nāpau Crater, and our re-measurement of the crack stations there found only a few millimeters of movement since the last measurements in 1999. This is within expected error considering the time interval between measurements and the rusted condition of the nails in 2007.
Eruption Site
The Father’s Day eruption site was discovered hours after activity had stopped (cover photo), so direct observations can only narrow its timing to occurring sometime overnight on June 18–19. However, a distinct infrasound signal from the direction of Kānenuiohamo was recorded from 0015 to 0045 HST on June 19, and this is interpreted as the approximate onset and duration of the eruption (Fee and others, 2011). The inferred eruption time was bracketed by an increase in real-time seismic amplitude at a seismic station about 700 m west-northwest that lasted from about 2330 on June 18 to 0200 on June 19.
Two small lava pads and a sparse tephra deposit erupted from three east-northeast-trending fissures with azimuths ranging from 64° to 74° (figs. 5,6). The fissures define an overall trend of ~68°. The lava pad to the west is the larger of the two, with a mapped area of about 1,830 square meters (m2) and an estimated average thickness of 0.7 m. This equates to a bulk volume of roughly 1,280 cubic meters (m3). Most of the lava flowed down a gentle slope to the southeast, away from the fissures that fed it. The smaller, east lava pad (fig. 4B) had a mapped area of 490 m2 and an estimated average thickness of 0.5 m, giving it a bulk volume of about 245 m3. The two lava pads were connected by lightly fuming cracks, and numerous other steaming and lightly fuming cracks cut the forest floor nearby, especially to the north and west of the west lava pad.
The small total volume (~1,525 m3) of the lava pads suggests a short-lived eruption, which is consistent with the 0.5-hour-long infrasound signal (Fee and others, 2011). Using this duration gives a bulk effusion rate of ~0.8 cubic meters per second (m3/s). The average vesicularity of the spatter and lava (appendix 3) was calculated at 52 percent (range 33–68 percent), which equates to a dense-rock equivalent effusion rate of ~0.4±0.1 m3/s, which is far smaller than the effusion rate of 6–7 m3/s determined for Kīlauea both before and after the Father’s Day eruption (Poland and others, 2012). In addition, the small volume and short duration are unusual compared to other fissure eruptions that occurred during the Pu‘u‘ō‘ō eruption.
Very Low Frequency Measurements
The VLF receiver transects we conducted across the Father’s Day dike (appendix 4) help locate its axis where the dike is sufficiently shallow. The depth to which this technique can penetrate is about 100 m (Zablocki, 1978), implying a low-resistivity anomaly shallower than this. It is important to note, though, that the low-resistivity anomaly includes both the dike and a zone of surrounding country rock heated by the dike (Davis, 2015), so the low-resistivity anomaly might be shallower than 100 m while the dike could be slightly deeper. The weeks-long gap between the intrusion and the VLF measurements also would have had little effect on the data, considering that the low-resistivity anomaly associated with a dike can last for decades (Davis, 2015).
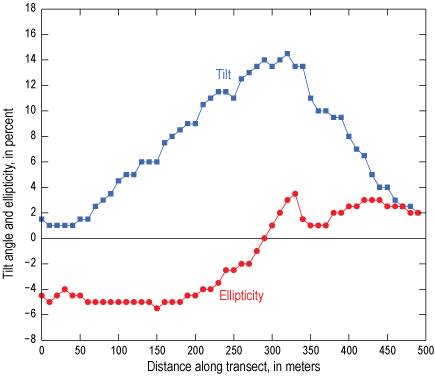
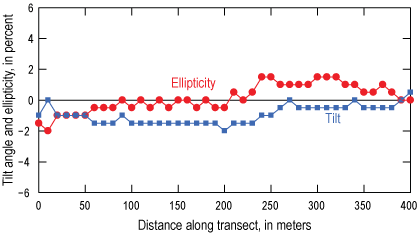
Figure 4.5 (appendix 4) shows the tilt and ellipticity profiles for transect 5 (fig. 2B), which crosses the dike trace at the June 20 fuming area west of Kānenuiohamo. The tilt and ellipticity profiles for this transect exhibit the classic shape expected for a transect over a shallow conductor (Zablocki, 1978; Kauahikaua and others, 1996). By comparison, the profiles for transects 1, 2, and 8 (appendix 4) show no such shape, indicating there is no conductive anomaly in that area or it is too deep to be detected (deeper than 100 m).
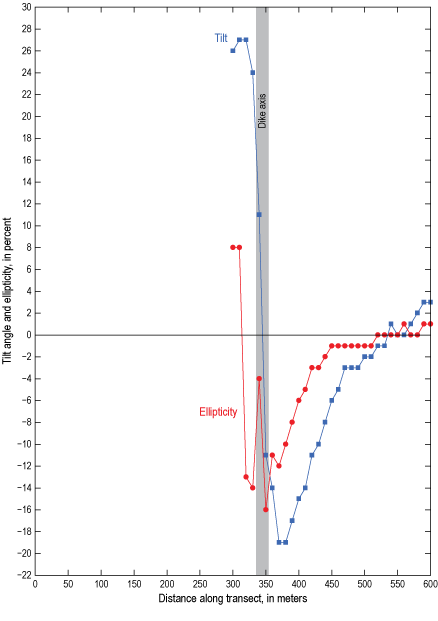
In those profiles that obviously show the presence of a conductive dike (transects 3, 4, 5, and 7; appendix 4), the point where tilt and ellipticity cross the x-axis marks the location of the dike trace on the ground. We can use this, along with the eruption site and the prominent fume sources, to locate and orient the presumed trace of the Father’s Day dike (fig. 2B).
The VLF receiver results for transect 6 (appendix 4), which crosses the June 19 fuming area high on the north flank of Kānenuiohamo, are not interpretable, perhaps because the transect extends down the relatively steep slope of the cone of Kānenuiohamo or because the dike is too deep. Instead, we use the alignment between the June 19 fuming area, which transect 6 crosses, and the eruption site (transect 7) to determine that the dike trace in this area has a trend of ~70°. This also matches the trend of the zone of tree die-off that extends between the June 19 fuming area and the eruption site (fig. 5).
The dike trace implied by VLF receiver results for transects 4 and 5 trends 65° (fig. 2B). The trace extends toward the lower flank of Kānenuiohamo and is offset about 90 m north from the dike trace between the June 19 fuming area and the eruption site, suggesting that either the dike curves between transects 5 and 6 or that these are en echelon dike segments. The VLF receiver results for transect 3 show a weak indication of the dike, but the results for transect 2 are inconclusive, so we are unable to determine the trend of the dike trace there. Nevertheless, the dike trace probably trends about the same as the dike trace elsewhere, or roughly 65°–70°. Allowing this trend, the location of the dike trace at transect 3 is offset about 85 m north from the dike trace defined by transects 4 and 5. This offset in the dike trace indicates either that the dike curves between transects 3 and 4 or that these are en echelon segments as well.
Discussion
The location and orientation of ground cracks between Pauahi Crater and Pu‘uhuluhulu and near Kānenuiohamo define zones oriented approximately northeast–southwest. The northeast end of the crack zone between Pauahi Crater and Pu‘uhuluhulu is offset about 1 km north of the southwest end of the crack zone near Kānenuiohamo. This location suggests that the Father’s Day dike splayed as it approached the surface, perhaps along structural weaknesses, forming separate dike segments, as supported by geodetic modeling (Montgomery-Brown and others, 2010). Although the dike segment between Pauahi Crater and Pu‘uhuluhulu reached a level shallow enough to crack the overlying ground surface, it was still too deep to be detected using the VLF technique. The opening of new cracks in the eastern extension of the Koa‘e fault system could indicate that some magma was diverted there from the East Rift Zone, but it might also be the result of the seaward slip of Kīlauea’s south flank associated with the Father’s Day eruption (Montgomery-Brown and others, 2010).
The dike segment near Kānenuiohamo, however, did reach a level shallow enough to be detected using the VLF technique. Although it is possible that the Father’s Day dike near Kānenuiohamo approached the surface as a single curvilinear dike, we believe it more likely that the dike in this area splayed further and approached the surface along at least three en echelon segments as suggested by the VLF receiver results in concert with the locations of the fuming cracks and the eruption site (fig. 2).
The seismicity related to the Father’s Day eruption migrated down the East Rift Zone in four pulses (Poland and others, 2008) that may correspond to the four dike segments we identify. If so, the migrating seismicity suggests the dike segments formed sequentially from west to east and culminated with the dike reaching the surface at the point of lowest elevation near the dike’s eastern tip, where lava erupted. Magma rose close enough to the ground surface at the June 20 fuming area on the lava plain west of Kānenuiohamo to expose the top of the magma column to atmospheric pressure, releasing heat and volcanic gases but failing to erupt.
Conclusions
The June 17–19, 2007, Father’s Day eruption was the result of the forceful intrusion of magma from Kīlauea’s summit magma reservoir into the volcano’s upper East Rift Zone. The intruding dike splayed as it migrated downrift and ascended, forming at least four separate dike segments that caused cracking of the overlying ground surface. Measurement of very low frequency magnetic fields using a handheld very low frequency receiver, along with the location of outgassing cracks and eruptive fissures, help to define the traces of the eastern three dike segments near Kānenuiohamo. The Father’s Day eruption culminated in a brief (approximately 30 minutes long) eruption early in the morning on June 19, discharging two small pads of lava totaling about 1,525 cubic meters of lava near the eastern end of the dike. Adjusting volume based on the average vesicularity of eruptive products, which is 52 percent, equates to a very low dense-rock equivalent eruption rate of about 0.4 cubic meters per second.
References Cited
Davis, P.M., 2015, Geothermal evolution of an intruded dike in the rift zone of Kilauea volcano, Hawaii from VLF and self-potential measurements: Journal of Volcanology and Geothermal Research, v. 302, p. 64–80, https://doi.org/10.1016/j.jvolgeores.2015.06.007.
Duffield, W.A., 1975, Structure and origin of the Koae fault system, Kilauea Volcano, Hawaiʻi: U.S. Geological Survey Professional Paper 856, 12 p., https://doi.org/10.3133/pp856.
Fee, D., Garces, M., Orr, T., and Poland, M., 2011, Infrasound from the 2007 fissure eruptions of Kīlauea Volcano, Hawai‘i: Geophysical Research Letters, v. 38, no. 6, 5 p., https://doi.org/10.1029/2010GL046422.
Heliker, C., and Mattox, T.N., 2003, The first two decades of the Pu‘u ‘Ō‘ō–Kupaianaha eruption—Chronology and selected bibliography, chap. 1 of Heliker, C., Swanson, D.A., and Takahashi, T.J., eds., The Pu‘u ‘Ō‘ō–Kupaianaha eruption of Kīlauea Volcano, Hawai‘i—The first 20 years: U.S. Geological Survey Professional Paper 1676, p. 1–27, https://doi.org/10.3133/pp1676.
Hoblitt, R.P., Orr, T.R., Castella, F., and Cervelli, P.F., 2008, Remote-controlled pan, tilt, zoom cameras at Kīlauea and Mauna Loa volcanoes, Hawai‘i: U.S. Geological Survey Scientific Investigations Report 2008–5129, 14 p., https://doi.org/10.3133/sir20085129.
Houghton, B.F., and Wilson, C.J.N., 1989, A vesicularity index for pyroclastic deposits: Bulletin of Volcanology, v. 51, no. 6, p. 451–462, https://doi.org/10.1007/BF01078811.
Kauahikaua, J., Mangan, M., Heliker, C., and Mattox, T., 1996, A quantitative look at the demise of a basaltic vent—The death of Kupaianaha, Kilauea Volcano, Hawai‘i: Bulletin of Volcanology, v. 57, no. 8, p. 641–648, https://doi.org/10.1007/s004450050117.
Kauahikaua, J., Cashman, K.V., Mattox, T.N., Heliker, C.C., Hon, K.A., Mangan, M.T., and Thornber, C.R., 1998, Observations on basaltic lava streams in tubes from Kilauea Volcano, island of Hawaii: Journal of Geophysical Research, v. 103, no. B11, p. 27303–27323, https://doi.org/10.1029/97JB03576.
Lesher, C.E., and Spera, F.J., 2015, Thermodynamic and Transport Properties of Silicate Melts and Magma, chap. 5 of Sigurdsson, H., ed., The encyclopedia of volcanoes (2d ed.): Amsterdam, Elsevier, p. 113–141, https://doi.org/10.1016/B978-0-12-385938-9.00005-5.
McNeill, J.D., and Labson, V.F., 1991, Geological mapping using VLF radio waves, chap. 7 of Nabighian, M.N., ed., Electromagnetic Methods in Applied Geophysics, Volume 2, Application, Parts A and B: Society of Exploration Geophysicists, p. 521–640, https://doi.org/10.1190/1.9781560802686.ch7.
Montgomery-Brown, E.K., Sinnett, D.K., Poland, M., Segall, P., Orr, T., Zebker, H., and Miklius, A., 2010, Geodetic evidence for en echelon dike emplacement and concurrent slow slip during the June 2007 intrusion and eruption at Kīlauea volcano, Hawaii: Journal of Geophysical Research, v. 115, no. B7, 15 p., https://doi.org/10.1029/2009JB006658.
Neal, C.A., Brantley, S.R., Antolik, L., Babb, J.L., Burgess, M., Calles, K., Cappos, M., Chang, J.C., Conway, S., Desmither, L., Dotray, P., Elias, T., Fukunaga, P., Fuke, S., Johanson, I.A., Kamibayashi, K., Kauahikaua, J., Lee, R.L., Pekalib, S., Miklius, A., Million, W., Moniz, C.J., Nadeau, P.A., Okubo, P., Parcheta, C., Patrick, M.R., Shiro, B., Swanson, D.A., Tollett, W., Trusdell, F., Younger, E.F., Zoeller, M.H., Montgomery-Brown, E.K., Anderson, K.R., Poland, M.P., Ball, J.L., Bard, J., Coombs, M., Dietterich, H.R., Kern, C., Thelen, W.A., Cervelli, P.F., Orr, T., Houghton, B.F., Gansecki, C., Hazlett, R., Lundgren, P., Diefenbach, A.K., Lerner, A.H., Waite, G., Kelly, P., Clor, L., Werner, C., Mulliken, K., Fisher, G., and Damby, D., 2019, The 2018 rift eruption and summit collapse of Kīlauea Volcano: Science, v. 363, n. 6425, p. 367–374, https://doi.org/10.1126/science.aav7046.
Orr, T., 2014, The June-July 2007 collapse and refilling of Puʻu ʻŌʻō Crater, Kīlauea Volcano, Hawaiʻi: U.S. Geological Survey Scientific Investigations Report 2014–5124, 15 p., https://doi.org/10.3133/sir20145124.
Orr, T.R., Poland, M.P., Patrick, M.R., Thelen, W.A., Sutton, A.J., Elias, T., Thornber, C.R., Parcheta, C., and Wooten, K.M., 2015, Kīlauea’s 5–9 March 2011 Kamoamoa fissure eruption and its relation to 30+ years of activity from Pu‘u ‘Ō ‘ō, chap. 18 of Carey, R., Poland, M., Cayol, V., Weis, D. (eds.), Hawaiian volcanoes—From source to surface: Hoboken, New Jersey, Wiley, p. 393–420, https://doi.org/10.1002/9781118872079.ch18.
Orr, T.R., Llewellin, E.W., and Patrick, M.R., 2022, Development, structure, and behavior of a perched lava channel at Kīlauea Volcano, Hawaiʻi, during 2007: Journal of Volcanology and Geothermal Research, v. 430, no. 107637, 18 p., https://doi.org/10.1016/j.jvolgeores.2022.107637.
Orr, T., 2024, Ground crack, VLF measurement, and sample vesicularity data for the June 2007 Father's Day eruption, Kīlauea Volcano: U.S. Geological Survey data release, https://doi.org/10.5066/P955VWUV.
Poland, M., Miklius, A., Orr, T., Sutton, J., Thornber, C., and Wilson, D., 2008, New episodes of volcanism at Kilauea Volcano, Hawaii: Eos (American Geophysical Union Transactions), v. 89, no. 5, p. 37–38, https://doi.org/10.1029/2008EO050001.
Poland, M.P., Miklius, A., Sutton, A.J., Thornber, C.R., 2012, A mantle-driven surge in magma supply to Kilauea Volcano during 2003-2007: Nature Geoscience, v. 5, no. 4, p. 295–300, https://doi.org/10.1038/ngeo1426.
Swanson, D.A., Fiske, R.S., Thornber, C.R., and Poland, M.P., 2019, Dikes in the Koa‘e fault system, and the Koa‘e–east rift zone structural grain at Kīlauea Volcano, Hawai‘i, in PolandM.P., Garcia, M.O., Camp, V.E., and Grunder, A., eds., Field Volcanology—A Tribute to the Distinguished Career of Don Swanson: Geological Society of America Special Paper 538, p. 247–274. https://doi.org/10.1130/2018.2538(11)
Thornber, C.R., Heliker, C., Sherrod, D.R., Kauahikaua, J.P., Miklius, A., Okubo, P.G., Trusdell, F.A., Budahn, J.R., Ridley, W.I., and Meeker, G.P., 2003, Kilauea east rift zone magmatism—an episode 54 perspective: Journal of Petrology, v. 44, no. 9, p. 1525–1559, https://doi.org/10.1093/petrology/egg048.
Wauthier, C., Roman, D.C., and Poland, M.P., 2013, Moderate-magnitude earthquakes induced by magma reservoir inflation at Kīlauea Volcano, Hawai‘i. Geophysical Research Letters v. 40,no. 20, p. 5366–5370, https://doi.org/10.1002/2013GL058082.
Zablocki, C.J., 1978, Applications of the VLF induction method for studying some volcanic processes of Kilauea volcano, Hawaii: Journal of Volcanology and Geothermal Research, v. 3, no. 1-2, p. 155–195, https://doi.org/10.1016/0377-0273(78)90008-2.
Appendix 1. Ground Crack Data
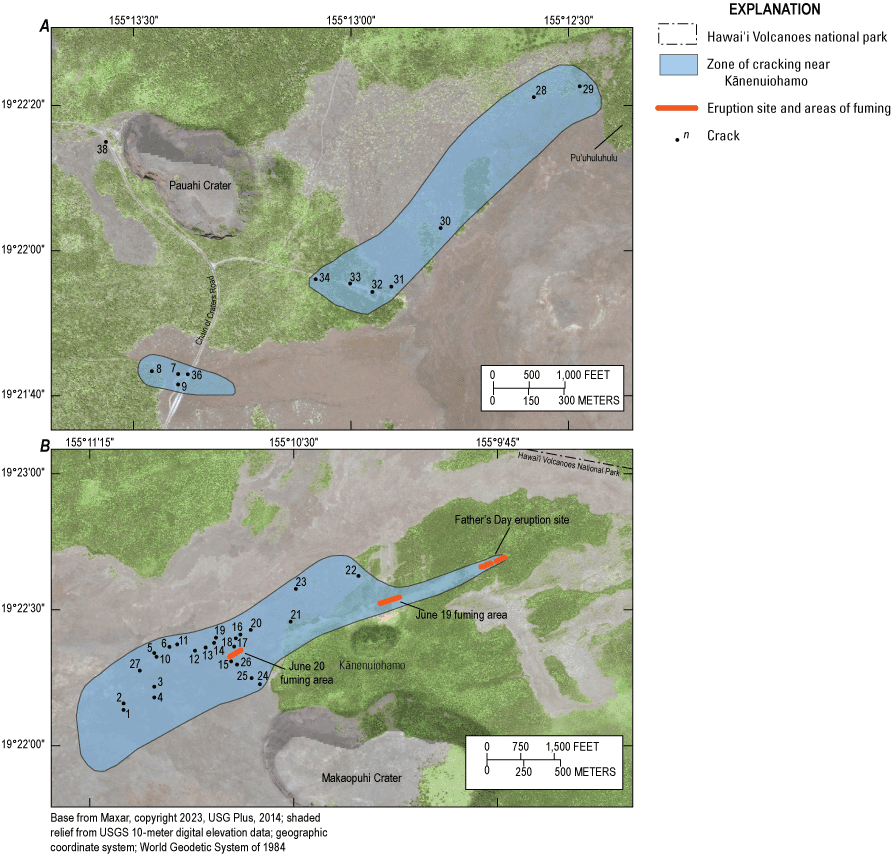
Maps showing zones of cracking near Pauahi Crater (A) and Kānenuiohamo (B), Kīlauea, Island of Hawaiʻi. The numbered cracks in the zones of cracking on the map correspond to the crack numbers in table 1.1.
Table 1.1.
Identification number, location, trend, width, and opening direction of measured cracks associated with the Father’s Day eruption.[Data archived in Orr (2024). cm, centimeter; —, not available]
Appendix 2. Nāpau Crater Crack Stations
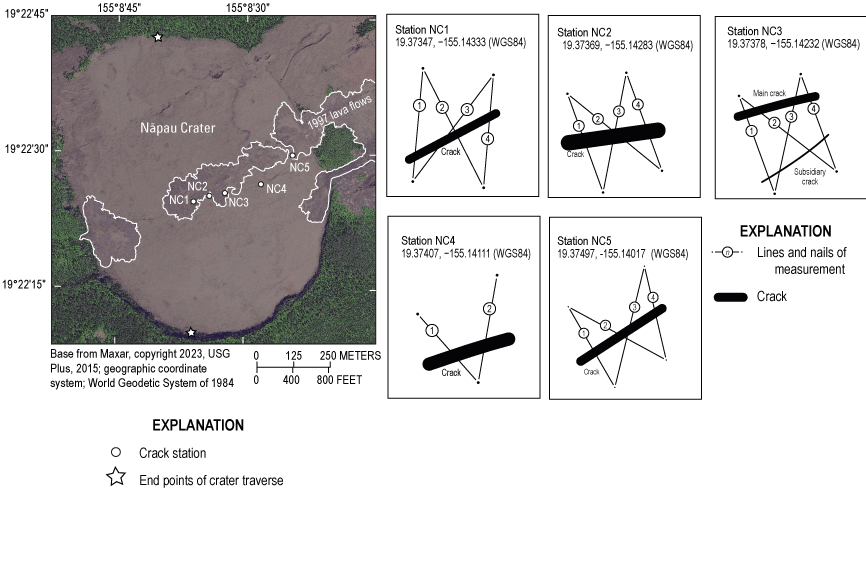
Maps showing locations of crack monitoring stations and station nail arrangements in Nāpau Crater, Kīlauea, Island of Hawaiʻi. A, Map showing locations of crack stations NC1 to NC5. Lava flows erupted in 1997 outlined in white. B, Crack station maps showing the arrangement of measurement nails across the cracks.
Table 2.1.
Line lengths between nails for crack stations NC1–NC5 on the dates indicated.[See figure 2.1 for arrangement of nails. Line lengths are given in centimeters (cm). Dates are shown in MM/DD/YYYY. Data archived in Orr (2024).]
Appendix 3. Clast Density and Vesicularity Data
Table 3.1.
Density and vesicularity data for selected lava and spatter samples from the Father’s Day eruption in the East Rift Zone of Kīlauea, Island of Hawaiʻi.[Data archived in Orr (2024). g/cm3, grams per cubic centimeter; %, percent]
Appendix 4. Very Low Frequency Transect Data
Transect 1
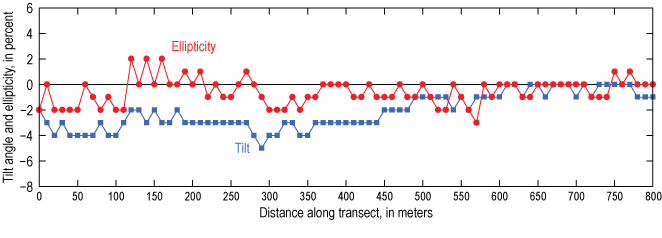
Plot showing tilt and ellipticity measurements along transect 1, collected by EM16 VLF receiver on June 27, 2007.
Table 4.1.
EM16 VLF receiver measurements for transect 1, arranged south to north, and collected facing north on June 27, 2007.[Transect length, 800 meters (m); spacing, 10 m; start point, 19.36267, −155.21484 (World Geodetic System 1984); transect azimuth, 8°. Data archived in Orr (2024). %, percent]
Transect 2
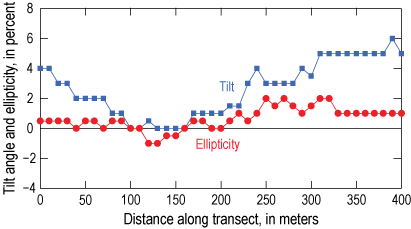
Plot showing tilt and ellipticity measurements along transect 2, collected by EM16 VLF receiver on September 27, 2007.
Table 4.2.
EM16 VLF receiver measurements for transect 2, arranged north to south, and collected facing south on September 27, 2007.[Transect length, 400 meters (m); spacing, 10 m; start point, 19.36972, −155.18835 (World Geodetic System 1984); transect azimuth, 155°. Data archived in Orr (2024). %, percent]
Transect 3
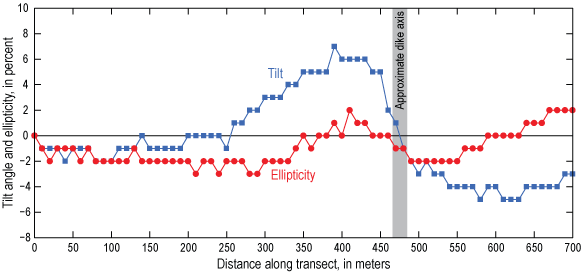
Plot showing tilt and ellipticity measurements along transect 3, collected by EM16 VLF receiver on July 10, July 19, and July 31, 2007.
Table 4.3.
EM16 VLF receiver measurements for transect 3, arranged south to north, and collected facing north on July 10, July 19, and July 31, 2007.[Transect length, 700 meters (m); spacing, 10 m; start point, 19.36619, −155.18340 (World Geodetic System 1984); transect azimuth, 335°. Data archived in Orr (2024). %, percent]
Transect 4
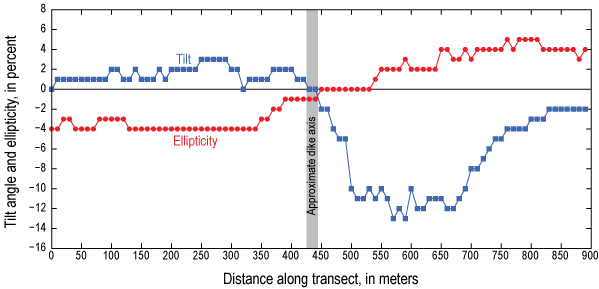
Plot showing tilt and ellipticity measurements along transect 4, collected by EM16 VLF receiver on July 9, July 10, July 19, and July 30, 2007.
Table 4.4.
EM16 VLF receiver measurements for transect 4, arranged south to north, and collected facing north on July 9, July 10, July 19, and July 30, 2007.[Transect length, 890 meters (m); spacing, 10 m; start point, 19.36714, −155.18039 (World Geodetic System 1984); transect azimuth, 335°. Data archived in Orr (2024). %, percent]
Transect 5
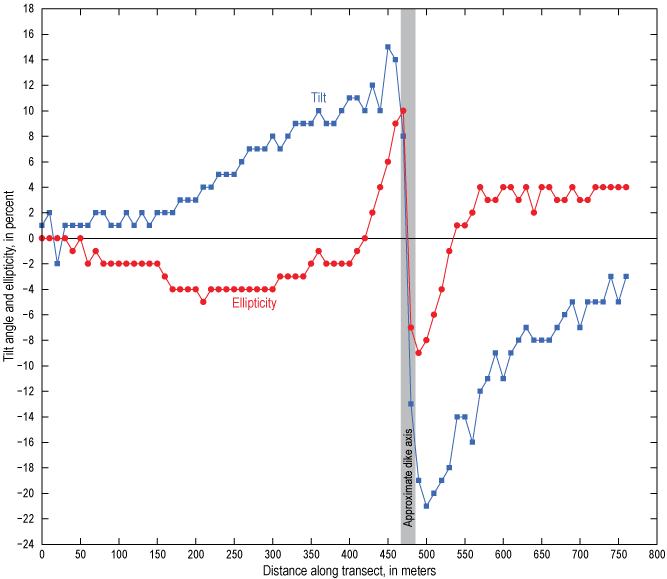
Plot showing tilt and ellipticity measurements along transect 5, collected by EM16 VLF receiver on July 5, July 6, July 9, and July 23, 2007.
Table 4.5.
EM16 VLF receiver measurements for transect 5, arranged south to north, and collected facing north on July 5, July 6, July 9, and July 23, 2007.[Transect length, 760 meters (m); spacing, 10 m; start point, 19.36863, −155.17637 (World Geodetic System 1984); transect azimuth, 335°. Data archived in Orr (2024). %, percent]
Transect 6
Plot showing tilt and ellipticity measurements along transect 6, collected by EM16 VLF receiver on August 28, 2007.
Table 4.6.
EM16 VLF receiver measurements for transect 6, arranged north to south, and collected facing south on August 28, 2007.[Transect length, 490 meters (m); spacing, 10 m; start point, 19.3784, −155.17008 (World Geodetic System 1984); transect azimuth, 159°. Data archived in Orr (2024). %, percent]
Transect 7
Plot showing tilt and ellipticity measurements along transect 7, collected by EM16 VLF receiver on August 10, 2007. Thick forest undergrowth prevented measurement of entire transect.
Table 4.7.
EM16 VLF receiver measurements for transect 7, arranged north to south, and collected facing south on August 10, 2007.[Transect length, 300 meters (m); spacing 10 m; start point, 19.37827, −155.16310 (World Geodetic System 1984); transect azimuth 155°. Data archived in Orr (2024). %, percent]
Transect 8
Plot showing tilt and ellipticity measurements along transect 8, collected by EM16 VLF receiver on August 17, 2007.
Table 4.8.
EM16 VLF receiver measurements for transect 8, arranged north to south and collected facing south on August 17, 2007.[Transect length, 400 meters (m); spacing, 10 m; start point, 19.38270, −155.15677 (World Geodetic System 1984); transect azimuth, 155°. Data archived in Orr (2024). %, percent]
Conversion Factors
Temperature in degrees Celsius (°C) may be converted to degrees Fahrenheit (°F) as follows:
°F = (1.8 × °C) + 32.
Temperature in degrees Fahrenheit (°F) may be converted to degrees Celsius (°C) as follows:
°C = (°F – 32) / 1.8.
Datums
Vertical coordinate information is referenced to the World Geodetic System 1984 (WGS 84).
Horizontal coordinate information is referenced to the World Geodetic System 1984 (WGS 84).
Altitude, as used in this report, refers to distance above the vertical datum.
Disclaimers
Any use of trade, firm, or product names is for descriptive purposes only and does not imply endorsement by the U.S. Government.
Although this information product, for the most part, is in the public domain, it also may contain copyrighted materials as noted in the text. Permission to reproduce copyrighted items must be secured from the copyright owner.
Suggested Citation
Orr, T.R., Kauahikaua, J.P., and Heliker, C., 2024, Using ground crack and very low frequency measurements to map the location of the June 2007 Father’s Day dike, Kīlauea Volcano: U.S. Geological Survey Scientific Investigations Report 2024–5030, 44 p., https://doi.org/10.3133/sir20245030.
ISSN: 2328-0328 (online)
Study Area
| Publication type | Report |
|---|---|
| Publication Subtype | USGS Numbered Series |
| Title | Using ground crack and very low frequency measurements to map the location of the June 2007 Father’s Day dike, Kīlauea Volcano |
| Series title | Scientific Investigations Report |
| Series number | 2024-5030 |
| DOI | 10.3133/sir20245030 |
| Publication Date | April 12, 2024 |
| Year Published | 2024 |
| Language | English |
| Publisher | U.S. Geological Survey |
| Publisher location | Reston, VA |
| Contributing office(s) | Volcano Science Center |
| Description | Report: v, 24 p.; Data Release |
| Country | United States |
| State | Hawaii |
| Other Geospatial | Kīlauea Volcano |
| Online Only (Y/N) | Y |