

Assessment of Long-Term Changes in Surface-Water Extent Within Klamath Marsh, South-Central Oregon, 1985–2021
Links
- Document: Report (6.2 MB pdf) , HTML , XML
- Data Release: USGS data release - Klamath Marsh January through June maximum surface water extent, 1985–2021
- NGMDB Index Page: National Geologic Map Database Index Page (html)
- Download citation as: RIS | Dublin Core
Acknowledgments
The authors express their gratitude to the Klamath Tribes for their support of this study. They were instrumental in providing background information on Klamath Marsh, sharing data, and facilitating access to property and wells. Mike Johnson and Jeremy Welch (U.S. Fish and Wildlife Service) provided access to refuge property and assisted with locating and accessing wells for groundwater-level measurements during the study. Jeff Repass with Union Pacific Railroad provided access to wells for groundwater-level measurements. Jordan Beamer (Oregon Water Resources Department) provided preliminary datasets of irrigated agricultural land that were helpful in facilitating timely analyses. Dan Polette (U.S. Geological Survey) assisted with the collection of groundwater-level measurements.
Abstract
The annual maximum extent of surface water in Klamath Marsh has naturally fluctuated in response to periods of wet and dry conditions in the surrounding basin. Field observations during the 2010s indicate that the annual maximum extent of surface water has been declining and the marsh is not responding to hydrologic inputs as it had historically. This report describes the results of a hydrologic evaluation of Klamath Marsh to characterize and understand multi-year declines in the surface-water extent and increased intermittency of streamflow exiting the marsh.
Landsat imagery collected during 1985–2021 was processed to create a time series of annual maximum surface-water extent to assess changes in surface-water inundation within the marsh. A 50-percent decrease in the mean surface area of annual total open-water extent (TOWE) during the latter half of the study period (2003–21) compared to the first half (1985–2003) was observed in this 37-year time-series dataset. The change in open-water extent was offset by a corresponding increase in dry land in the marsh.
Time series of streamflow, groundwater level, total annual precipitation, annual mean temperature, and anthropogenic water use and water management were compiled and evaluated to improve understanding of the factors affecting TOWE. Statistically significant downward trends in the regional groundwater table and streamflow into and out of the marsh were identified as well as statistically significant upward trends in annual mean temperature. Statistically significant correlations among TOWE, streamflow, and groundwater level also were identified. The decreasing trends could not be attributed to changes in total annual precipitation or changing anthropogenic groundwater use within the study area.
Declines in the open-water extent of Klamath Marsh since 2000 principally are due to a decoupling of the groundwater and surface-water system beneath the marsh because of regional declines in groundwater level. Regional increases in air temperature and the reestablishment of more than 55,000 acres of forested land within the study area have likely contributed to increasing evapotranspiration, leaving less water available for groundwater recharge and stream base flow and resulting in basin-wide declines in streamflow and groundwater levels.
Introduction
Klamath Marsh is an important and complex piece of the Williamson River Basin, which is a source of water to Upper Klamath Lake in southern Oregon. The marsh is centrally located within the basin, and aggregates flow from the upper Williamson River and tributaries draining the eastern Cascade Range (fig. 1). The upper Williamson River is a groundwater-dominated stream with headwaters emanating from a spring complex southeast of the marsh (Mayer and Naman, 2011) and is the only perennial stream that reaches Klamath Marsh. Many of the streams draining the Cascade Range and some draining the northern lava plateau are perennial until they reach the thick pumice deposits that underlie the lowlands surrounding the marsh. As the upper Williamson River enters Klamath Marsh, it is initially redirected through a network of ditches and diversion structures. All defined stream channels are lost within the central area of the marsh and water flows diffusely until coalescing into a narrow channel in the southern part of the marsh. About 20 miles (mi) downstream from the marsh, the Williamson River discharges into Upper Klamath Lake, a vital habitat for two federally listed endangered fish, the shortnose sucker (Chasmistes brevirostris) and Lost River sucker (Deltistes luxatus).
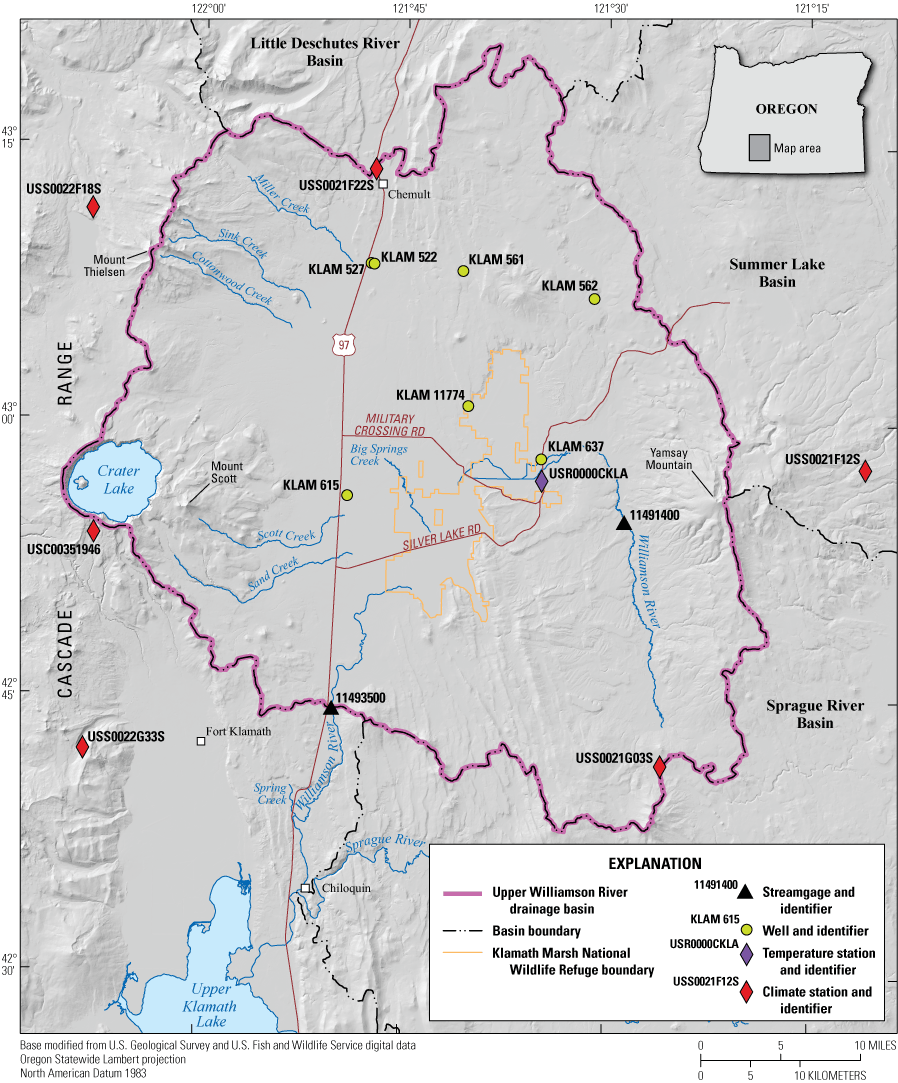
Klamath Marsh study area, south-central Oregon.
For millennia, the Klamath Tribes have subsisted on the natural resources of Klamath Marsh and Upper Klamath Lake (Klamath Tribes, 2018). In 1864, the United States created the Klamath Indian Reservation (U.S. Forest Service, 1998). The Klamath Tribes had exclusive use of this land, which included Klamath Marsh (U.S. Fish and Wildlife Service, 2010). The Reservation was dissolved in 1954 through the Klamath Termination Act and the land was sold to various Federal and private entities (U.S. Forest Service, 1998). The Klamath Marsh National Wildlife Refuge (KMNWR) was established 4 years later in 1958 with the acquisition of 585 acres to mitigate the loss of critical wetland habitat for waterfowl (U.S. Fish and Wildlife Service, 2010). The extent of the refuge expanded through multiple land-acquisition phases and currently (2023) covers an area of 43,737 acres (U.S. Fish and Wildlife Service, 2023). The U.S. Fish and Wildlife Service (USFWS) manages much of Klamath Marsh, which provides important nesting and feeding grounds for resident and migratory birds. It also provides habitat for redband trout (Oncorhynchus mykiss ssp.), a variety of mammals including coyote (Canis latrans), elk (Cervus elaphus), and deer (Odocoileus ssp.), as well as a federally listed species of concern, the Oregon spotted frog (Rana pretiosa; U.S. Fish and Wildlife Service, 2010).
Throughout the 20th century, an extensive network of irrigation ditches and diversion structures were created within Klamath Marsh to drain wetlands and irrigate pastureland for cattle grazing and haying operations. These structures have disrupted the natural flow of water within the marsh by redirecting streamflow away from wetland areas, resulting in the altered distribution and composition of wetland and riparian plant communities (U.S. Forest Service, 1998). Additionally, many tributaries of the Williamson River upstream from Klamath Marsh were modified or diverted completely, reducing streamflow in the Williamson River and surface-water inflow to the marsh (U.S. Fish and Wildlife Service, 2014). Land containing most of the legacy diversion structures in and around the marsh was acquired by USFWS by 1990. The diversion structures have been used to actively manage marsh hydrology, including artificial flooding of areas to maintain wetland habitats (U.S. Fish and Wildlife Service, 2014).
Although the annual maximum extent of surface water within Klamath Marsh naturally fluctuates in response to seasonal changes in precipitation and longer-term periods of wet and dry conditions in the surrounding basin, a reduction in open-water extent has been noted by Tribal members and biologists. Reports and concerns have increased about multi-year declines in the seasonal open-water extent and about how gaged streamflow exiting the marsh has become more intermittent relative to historical measurements. In response to these reports and concerns, the U.S. Geological Survey (USGS), in cooperation with the Klamath Tribes, initiated an investigation to characterize and understand the recent hydrologic changes that have been observed.
Purpose and Scope
The purpose of this report is to assess long-term changes in surface-water extent within Klamath Marsh. It documents the development of a dataset that quantifies the maximum area of wetland and open water in the marsh for each water year1 (WY) during 1985–2021. Explanations for changes in the wetland open-water area are explored by evaluating groundwater measurements, streamflow, and climate records at locations near Klamath Marsh that were available during the study period, 1985–2021. Analysis of changes in precipitation type and timing were outside the scope of this report.
The 12-month period from October 1, for any given year, through September 30, of the following year. The water year is designated by the calendar year in which it ends.
Study Area
Klamath Marsh is a large wetland in south-central Oregon spanning an area of about 70 square miles (mi2; 45,000 acres). The study area encompasses about 1,300 mi2, the part of the Williamson River Basin upstream from the U.S. Geological Survey (USGS) streamgage Williamson River near Klamath Agency, OR (11493500, hereinafter referred to as the Klamath Agency streamgage; fig. 1). The marsh is centrally located within the Williamson River Basin, situated in a topographic low between the Cascade Range to the west and Yamsay Mountain to the east. The altitude of the low-elevation area surrounding Klamath Marsh ranges from 4,500 to 4,600 feet (ft) with Klamath Marsh having a mean altitude of about 4,520 ft. Study area margins range in altitude from about 5,000 to over 8,000 ft at prominent peaks such as Mount Scott, Mount Thielsen, and Yamsay Mountain. The study area is bounded on the north by a broad plateau, separating it from the Little Deschutes River Basin to the north, and on the west by the Cascade Range. Volcanic peaks and fault scarps separate the Williamson River Basin from the Sprague River Basin to the south and the Summer Lake Basin to the east.
Geology
Klamath Marsh occupies a topographic low at the southern end of the Chemult graben fault system, a transitional area between the northwestern extent of the Basin and Range geologic province and the Cascade Range (Personius, 2016). The marsh is underlain by an organic-rich sediment layer ranging in thickness from 3 to 5 ft (U.S. Fish and Wildlife Service, 2010) that sits atop a wedge of pumice from the 7.7 kilo-annum (ka) eruption of Mount Mazama that created the Crater Lake caldera (Melady, 2002). The pumice ranges in thickness from more than 80 ft in areas west of the marsh to only a few feet along the eastern edge of the marsh (Norvelle and others, 1981; Melady, 2002). The pumice is underlain by a variety of lava flows and vent deposits of Pliocene to Pleistocene basalt, basaltic andesite, and andesitic lava flows interbedded with volcanic sediments and pyroclastic deposits (Conaway, 2000; Melady, 2002). Several north- and northwest-trending normal faults are exposed along the southern and eastern part of the study area (Conaway, 2000).
Climate
The study area lies in the rain shadow of the Cascade Range. Weather systems moving eastward off the Pacific Ocean are orographically lifted by the mountainous topography, creating a precipitation gradient that generally decreases from west to east across the study area. Higher elevations within the study area receive more precipitation than nearby lower elevations. From west to east across the study area, mean annual precipitation for 1991–2020 from the Parameter-elevation Regressions on Independent Slopes Model (PRISM) varied from about 70 inches (in.) along the western rim of Crater Lake (altitude 7,500–8,000 ft) to about 22 in. across Klamath Marsh (altitude 4,520 ft) to about 55 in. at Yamsay Mountain (altitude about 8,000 ft; PRISM Climate Group, 2022). On average during 1981–2021, 70 percent of precipitation in the study area occurred during November–March (Lawrimore and others, 2016) with the accumulated winter snowpack typically melting during March–June. During 2002–22 at KMNWR (temperature station USR0000CKLA; Lawrimore and others, 2016), December was the coldest month with a mean monthly temperature of 26.5 degrees Fahrenheit (°F) and July was the hottest month with a mean monthly temperature of 62.0 °F.
Land Cover
In the early 2000s, Klamath Marsh was described as primarily a mix of emergent bulrush marsh and sedge and rush wetland bordered by dry grassland, pastureland, and agricultural land (U.S. Fish and Wildlife Service, 2007; Beamer and Bromley, 2022). The area surrounding the marsh is primarily evergreen forest consisting of lodgepole pine (Pinus contorta) and ponderosa pine (Pinus ponderosa) interspersed with mixed shrubland and pockets of herbaceous cover (U.S. Fish and Wildlife Service, 2010; Dewitz and U.S. Geological Survey, 2021). The higher-altitude areas of the Cascade Range are forested with a variety of evergreen trees, including Douglas fir (Pseudotsuga menziesii), western hemlock (Tsuga heterophylla), whitebark pine (Pinus albicaulis), and subalpine fir (Abies lasiocarpa), whereas the drier climate of Yamsay Mountain is primarily forested with lodgepole pine, ponderosa pine, and white fir (Abies concolor; U.S. Forest Service, 1998; National Park Service, 2022).
Surface Water
The Williamson River is the only perennial surface-water inflow to Klamath Marsh (Mayer and others, 2007). The river originates from a spring complex southeast of the marsh, and from its headwaters, the river flows north for about 35 mi, gaining additional inflow from small creeks and seeps along the west flank of Yamsay Mountain. The river gradually bends to the west and enters the marsh about 10 mi downstream from Oregon Water Resources Department (OWRD) streamgage Williamson River below Sheep Creek (11491400, hereinafter referred to as the Sheep Creek streamgage). Within the upper part of the marsh, the river flows generally westward for about 5 mi through a network of distributary channels and diversion structures until it intersects Military Crossing Road near where the marsh narrows to about 1-mi wide. Military Crossing Road acts as a physical boundary between the upper marsh and the lower marsh. South of Military Crossing Road, the marsh widens substantially, and the Williamson River ceases to follow a well-defined channel. Silver Lake Road bisects the lower marsh in a southwest to northeast direction, impeding the diffuse surface flow to the south except where culverts allow for the passage of water southward toward Wocus Bay and Little Wocus Bay. A defined stream channel emerges from the western side of Little Wocus Bay, meandering to the west and then south for 9 mi. Here, the broad open marsh abruptly ends, and the river enters a bedrock-controlled reach with a well-defined channel that continues southward for about 2 mi to the Klamath Agency streamgage (11493500). The basaltic andesite bedrock controls streamflow at this location; if the elevation of the stream surface drops below the elevation of the bedrock, streamflow ceases and the surface-water connection of the upper Williamson River to Upper Klamath Lake is severed (La Marche, 1999; Cummings and Conaway, 2009). Depending on antecedent precipitation and the time of year, parts of the channel from Little Wocus Bay to the Klamath Agency streamgage might be dry. Flow has been consistently zero at the Klamath Agency streamgage during a recent 3-year period (April 2020–April 2023).
Big Springs Creek is the only other surface-water feature that flows directly into Klamath Marsh and is influenced by changes in the regional groundwater table (La Marche, 2004). The intermittent stream originates from springs in the pumice plateau northwest of Klamath Marsh and enters the marsh on the west side, south of Military Crossing Road (Mayer and others, 2007). The flow in Big Springs Creek is highly variable and responds rapidly to snowmelt and rainfall, which is atypical for groundwater-fed streams (La Marche, 2004). Gannett and others (2007) hypothesized that local rainfall and snowmelt infiltrate quickly and move easily through the highly permeable pumice soils in the area, resulting in a short residence time and rapid discharge of groundwater to Big Springs Creek.
The western side of the study area has multiple streams, including Miller, Sink, Cottonwood, Scott, and Sand Creeks, which flow eastward from the Cascade Range and infiltrate the pumice plain along the northwestern and western part of the study area. The infiltration from these streams likely supports groundwater beneath Klamath Marsh through subsurface flow and is an important contributor to the overall water budget of the marsh (Gannett and others, 2007). Most of the discharge in Scott and Sand Creeks was diverted for irrigation for much of the 1900s and into the early 2000s; however, curtailment of the irrigation diversions began in 2015 because of regulatory calls on water from senior water-right holders (Oregon Water Resources Department, 2023a). Despite the curtailment, neither stream has been observed to reach the marsh in the years since diversions ceased, with all streamflow infiltrating the pumice plain west of Klamath Marsh.
Groundwater
Groundwater is an important part of the water budget of the upper Williamson River Basin. Previous studies of Klamath Marsh have concluded that the groundwater system underlying the marsh is the principal control of marsh stage (Norvelle and others, 1981; La Marche, 1999). Estimates of inflows to the groundwater system under the marsh, however, are not well constrained and the spatial distribution is not known (Gannett and others, 2007).
Approach
To assess whether the extent of surface-water inundation within Klamath Marsh has changed over time, a geospatial dataset of Landsat imagery was used to determine year-to-year variability in the annual maximum extent of surface-water inundation during 1985–2021. To explain the observed changes in the extent of surface-water inundation over time, the magnitude and timing of changes in surface-water discharge, groundwater level, precipitation, and air temperature were evaluated during periods when concurrent measurements existed. Not all datasets spanned the full 1985–2021 study period, and, therefore, two additional periods of analysis were used to assess relations among the different datasets: WYs 1991–2021 and WYs 2001–21.
Maximum Surface-Water Extent
The development of the January-through-June annual maximum surface-water extent (MSWE) geospatial dataset (Kennedy, 2023) is based on the Dynamic Surface Water Extent (DSWE) model by Jones (2015; 2019). The DSWE model uses Landsat imagery to detect surface-water inundation within open and vegetated areas using a series of diagnostic tests to determine the probability of the presence of water in each pixel, which is then classified based on the probabilistic confidence that the pixel contains water (U.S. Geological Survey, 2022). Although DSWE data, based on a revised approach, are available as a USGS Landsat Collection 2 Level-3 science product (U.S. Geological Survey, 2022), the MSWE dataset was created using the method previously developed by Jones (2019) for Collection 1 DSWE data production as described in U.S. Geological Survey (2018), and implemented within Google Earth Engine (GEE; Soulard and others, 2020; Walker and others, 2020). GEE was used to leverage the processing power needed to access the entire Landsat period of record in a manner that would fit within the project timeframe and budget constraints.
The DSWE algorithm (Jones, 2019) uses water and vegetation indices to classify each pixel within an image as not water, open water—high confidence, open water—moderate confidence, partial surface water—conservative, partial surface water—aggressive, and cloud/shadow/snow. Pixels classified as open water—high confidence and open water—moderate confidence contain areas of open water. Pixels classified as partial surface water—conservative and partial surface water—aggressive contain surface water and vegetation (Jones, 2019). Pixels classified as not water were assumed to be dry land, and pixels classified as cloud/shadow/snow indicate that the pixel was contaminated by the presence of clouds, cloud shadow, or snow using the Landsat Quality Assessment band.
The initial step for creating the MSWE dataset was to constrain a fixed area of the marsh for which changes in the extent of surface-water inundation would be calculated. Defining a marsh boundary was an iterative process using a 10-meter (m) resolution digital elevation model (DEM; U.S. Geological Survey, 2021) and resulted in the selection of the 4,522-ft elevation contour because it encompassed those parts of the marsh most prone to surface-water inundation. Excepting some dry, upland areas, this elevation contour encompasses the extent of the KMNWR. The contour line was modified to form a closed polygon (hereinafter referred to as the marsh boundary) at the southeast end of the marsh where the marsh converges into the Williamson River channel (fig. 2).
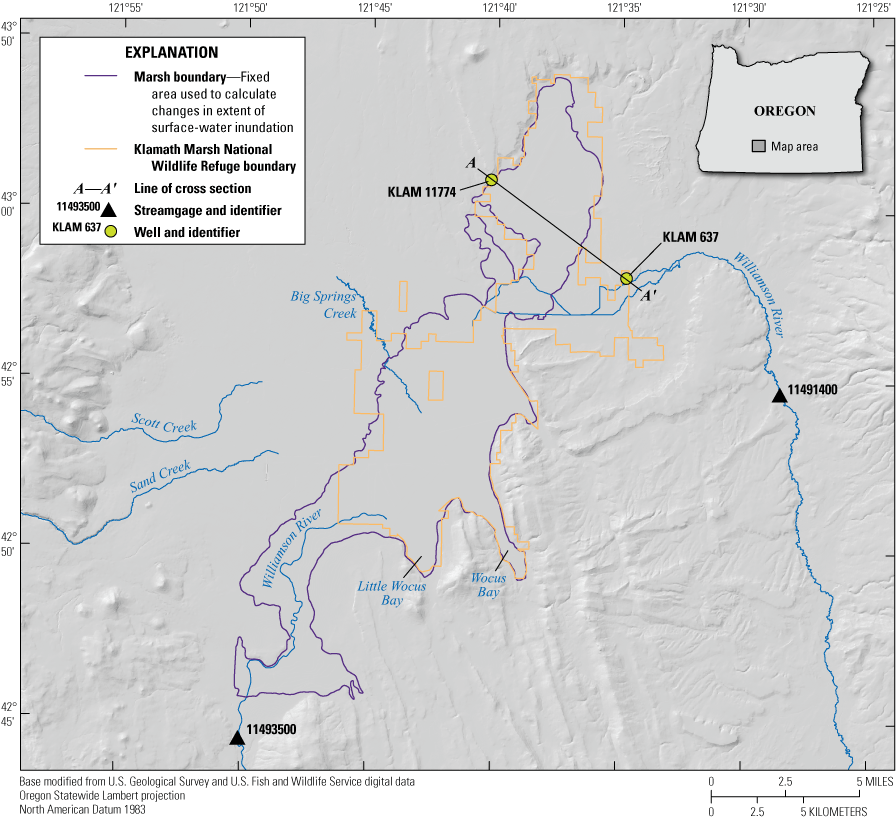
Marsh boundary used for maximum surface-water extent calculations and the Klamath Marsh National Wildlife Refuge boundary, south-central Oregon. Cross section A–A' is shown in figure 13.
The MSWE dataset integrated two modifications to the GEE code written by Walker and others (2020). First, the script was modified to use a higher-resolution 10-m DEM instead of the 30-m DEM used in the published code. Second, the timeframe during which Landsat imagery was composited was shortened to only include imagery obtained during January 1–June 30 of each year. This time frame was selected for two reasons. First, it coincided with maximum streamflow from snowmelt and the typical period of maximum water extent in the marsh based on visual examination of historical imagery and anecdotal observations. Second, water-management practices diverted water through a system of ditches from wet areas to drier areas within the marsh (U.S. Fish and Wildlife Service, 2014) during late summer. Excluding imagery after June minimized the inclusion of areas that may have been artificially flooded.
The GEE code created annual raster layers of MSWE by compositing every scene within the designated annual timeframe (January through June), selecting only the highest confidence water-containing pixel type from each individual Landsat image. Each annual MSWE raster was then clipped to the extent of the marsh boundary polygon described previously. The resulting output is a January-through-June MSWE raster image for each year (1985–2021) for which useable Landsat imagery exists. Surface-area calculations of each MSWE classification type were then calculated for each year. All MSWE data are made available in a USGS data release2 (Kennedy, 2023).
Pixel classification names in this report vary slightly from pixel classification names in the data release. Pixel classifications defined in this report are shown here, with their data release counterpart shown in parentheses: open water—high confidence (Water—high confidence); open water—moderate confidence (Water—moderate confidence); partial surface water—conservative (Wetland—moderate confidence); partial surface water—aggressive (Wetland—low confidence). The classification names not water and cloud/shadow/snow are the same in both this report and in the data release.
MSWE imagery was compared with a high-resolution light detection and ranging (lidar) DEM of Klamath Marsh to ensure that pixels classified as containing water corresponded with areas of lower topography. The imagery was also compared with available high-resolution true-color imagery where standing water existed during a similar time frame. The qualitative evaluation indicated that the algorithm consistently matched MSWE pixels with areas of lower topography in the DEM and areas containing standing water in the true-color imagery. Visual inspection of the 37 annual MSWE images indicated that scenes from 2008 and 2012 contain linear stripes. These stripes are an artifact in Landsat 7 imagery caused by the mechanical failure of the scan-line corrector, resulting in data gaps along the margins of images collected since June 2003 (U.S. Geological Survey, 2015). These data gaps exist in the 2008 MSWE image along the eastern margin of the central part of the marsh. Data gaps in the 2012 image are more noticeable, with linear stripes apparent across the entire extent of the marsh. Although the data gaps appear to have a minimal impact on the 2008 image, the data gaps in the 2012 image appear to underestimate the extent of pixels classified as open water—high confidence. Despite this issue, the imagery and surface-area calculations for 2008 and 2012 provided useful information and were included in the analysis.
Statistical Analyses
Trends in MSWE, stream discharge, groundwater level, total annual precipitation, and annual mean temperature were evaluated using the Mann-Kendall (MK) trend test. A 90-percent significance level (p-value less than [<] 0.10) was used to characterize the likelihood of trends. Correlations among these time-series datasets were evaluated using Spearman’s rank correlation coefficient. Serial correlation was not addressed as part of this study. Locally weighted scatterplot smoothing (LOWESS) lines were used to smooth, visually inspect, and compare time-series data (Gramfort, 2015). Because the various datasets used in the study contained differing numbers of data and periods of record and because a similar degree of smoothness was desired among the datasets for comparison purposes, the value of the smoothing parameter used to generate the LOWESS lines varied from 0.15 to 0.22.
Results
Annual Surface-Water Extent
The spatial extent of surface-water inundation was assessed as a percentage of the total marsh boundary area (44,201 acres; 69.1 mi2) for each pixel type (fig. 3). Pixels classified as not water (dry land) and open water—high confidence had the largest year-to-year variability and the largest changes during the 37-year study period. During the first half of the study period, 1985–2003, the mean surface area of pixels classified as not water and open water—high confidence accounted for 34 and 22 percent of total marsh area, respectively. During the latter half of the study period, 2003–21, the mean surface area of pixels classified as not water increased to account for 50 percent of the marsh, whereas the mean surface area of pixels classified as open water—high confidence decreased by half, accounting for 11 percent of total marsh area. By comparison, the other three MSWE classifications had less variability and no substantial long-term changes during the study period. Surface area for 2003 was included in calculations for the first half and latter half of the study period.
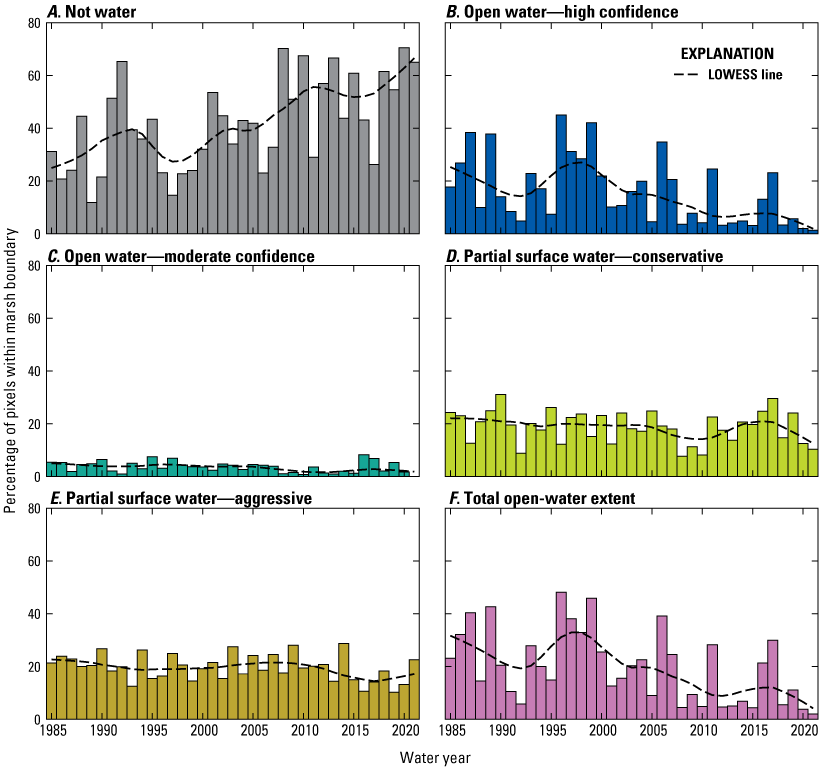
Annual maximum surface-water extent in percentage of total Klamath Marsh boundary area, south-central Oregon, for pixels classified as not water (A), open water—high confidence (B), open water—moderate confidence (C), partial surface water—conservative (D), partial surface water—aggressive (E), and total open-water extent (F). Total open-water extent is the combined percentage of pixels classified as open water—high confidence and open water—moderate confidence. Each plot includes a locally weighted scatterplot smoothing (LOWESS) line.
The Mann-Kendall trend test was performed for each of the five MSWE classifications (table 1). Statistically significant (p-value <0.1) trends during 1985–2021 were identified for pixel classifications not water (upward), open water—high confidence (downward), open water—moderate confidence (downward), and partial surface water—aggressive (downward). These results corroborate the visual evaluation of the LOWESS line through the data (fig. 3A–E). A change in the area of pixels classified not water is nearly entirely due to a corresponding and opposite change in the area of pixels classified as open water—high confidence and open water—moderate confidence. Subsequent analyses and discussion can therefore be simplified to total open-water extent (TOWE), which is the combined area of pixels classified as open water—high confidence and open water—moderate confidence (fig. 3F).
Table 1.
Results of the Mann-Kendall trend test and Sen’s slope for each maximum surface-water extent pixel classification type for Klamath Marsh study area, south-central Oregon, in periods 1985–2021, 1991–2021, and 2001–21.[Shading is present for visual grouping. Total open-water extent, combined area of both open water—high confidence and open water—moderate confidence. Abbreviations: MSWE, maximum surface-water extent; MK, Mann-Kendall]
Stream Discharge
Continuously gaged streamflow data for the Williamson River have been collected at two sites within the study area (fig. 1; table 2). The OWRD Sheep Creek streamgage is about 9 mi upstream from the KMNWR boundary and has data for WYs 1974–2022 (Oregon Water Resources Department, 2023b). USGS Klamath Agency streamgage serves as the downstream drainage basin boundary of the study area and has data available for WYs 1955–2022 (U.S. Geological Survey, 2023). Total annual discharge by WY for each streamgage was calculated from the mean daily flow values for the period of the MSWE analysis (WYs 1985–2021). Both sites contained periods of missing measurements. The Sheep Creek streamgage had three periods of missing data: December 12, 2001, to February 4, 2002; April 25 to June 19, 2002; and October 1, 2005, to May 1, 2006. The result of these missing data is an absence of total annual discharge calculations for WYs 2002 and WY2006. The mean of the data from the years bracketing the missing WYs was used for the LOWESS line. The Klamath Agency streamgage had one period of missing data from October 25, 1995, to October 1, 1998. Because of the 3-year gap and large year-to-year variability at this location, we deemed it inappropriate to statistically fill the missing values and generated separate LOWESS lines for WYs 1985–95 and 1999–2021.
Table 2.
Streamgages within the Klamath Marsh study area, south-central Oregon.[Latitude and longitude coordinates in North American Datum of 1983. Abbreviations: ID, identifier; NAVD 88, North American Vertical Datum of 1988; OR, Oregon; OWRD, Oregon Water Resources Department; USGS, U.S. Geological Survey]
Streamflow dynamics at the two gaged locations in the study area are considerably different (fig. 4). The difference partly reflects the streamgage locations and the contributing area each integrates. The catchment of the Sheep Creek streamgage comprises 14 percent of the study area, drains the drier eastern part, and is relatively stable because of a large groundwater contribution (Gannett and others, 2007). In contrast, the Klamath Agency streamgage aggregates streamflow for the entire study area; therefore, annual variability in snowpack amount and snowmelt timing in the Cascade Range likely has a major influence on the large variability in streamflow at the site. During and prior to the study period, flow commonly ceased at the Klamath Agency streamgage for 1–3 months each year. In recent years, however, the frequency of zero-flow months has increased; zero flow was measured at the streamgage during April 2020–April 2023, which is the longest dry period on record for the Klamath Agency streamgage. In contrast, annual discharge at the Sheep Creek streamgage has remained within 35 percent of the study period median with no dry periods.
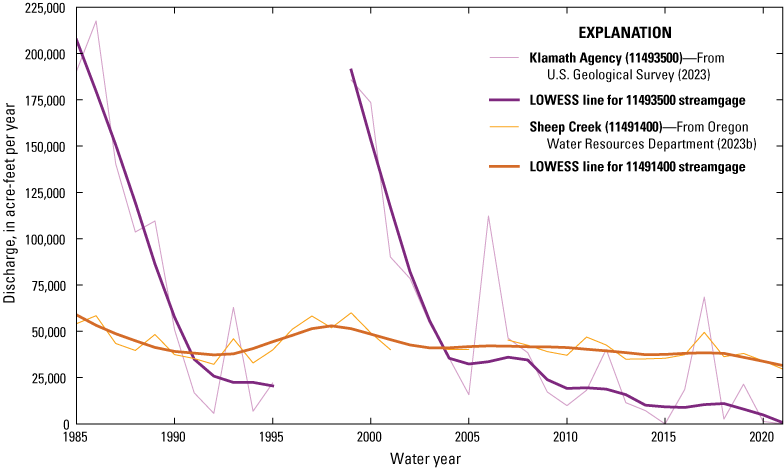
Annual stream discharge with locally weighted scatter plot smoothing (LOWESS) line for streamgages Williamson River below Sheep Creek near Lenz, Oregon (11491400), and Williamson River near Klamath Agency, Oregon (11493500), Klamath Marsh study area, south-central Oregon.
Mann-Kendall trend tests substantiate the trends apparent in the LOWESS lines and indicated statistically significant (p-value <0.1) declines in total annual discharge at both streamgages during the 1985–2021 study period (table 3). The 3-year gap in discharge measurements at the Klamath Agency streamgage introduces an uncertainty in the magnitude of the trend. Additional care in the interpretation of the trend statistic at this location is warranted because of the large historical variability in total annual streamflow, which can vary by an order of magnitude within a 6-year period; for example, from 1986 to 1992 and 1999 to 2005.
Table 3.
Results of the Mann-Kendall trend test and Sen’s slope for annual stream discharge by water year for Klamath Marsh study area, south-central Oregon, in periods 1985–2021, 1991–2021, and 2001–21.[Shading is present for visual grouping. Abbreviations: ID, identifier; MK, Mann-Kendall; OR, Oregon]
Groundwater Level
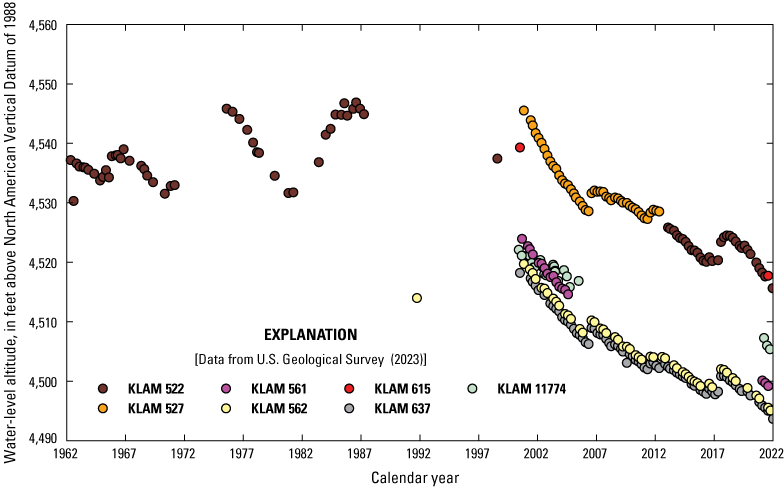
Available groundwater monitoring locations are sparse and limited to the northern part of the study area (fig. 1, table 4). All groundwater-level data were obtained from the USGS National Water Information System (U.S. Geological Survey, 2023); any measurement that was interpreted from a geophysical log or was designated as having been affected by pumping was excluded. Groundwater-level measurements were not temporally consistent, and no wells had measurements throughout the full MSWE period of record (1985–2021). KLAM 522 had the longest period of record spanning WYs 1962–2023. Regular, periodic water-level measurements within the basin began in WY 2000 for wells KLAM 637 and KLAM 11774 and in WY 2001 for wells KLAM 527, KLAM 561, and KLAM 562. Well KLAM 527 had consistent quarterly measurements until it was decommissioned in 2012 and monitoring efforts switched to KLAM 522 (about 300 ft away) starting in 2013. Wells KLAM 561 and KLAM 11774 were consistently monitored until WY 2005 when monitoring efforts were stopped. Well KLAM 615 only had two measurements during the study period, one in WY 2000 and one in WY 2021. Quarterly measurements at wells KLAM 561, KLAM 615, and KLAM 11774 resumed in 2021 as part of this project. Wells KLAM 637 and KLAM 562 have been consistently monitored since WYs 2000 and WY2001, respectively. No consistent groundwater-level measurements were collected at any of the wells during the 1990s.
Table 4.
Selected wells near Klamath Marsh, south-central Oregon.[Latitude and longitude coordinates in North American Datum of 1983. Years listed in the period of record contain at least one water-level measurement. Abbreviations: ID, identifier; OWRD, Oregon Water Resources Department; NAVD 88, North American Vertical Datum of 1988]
Declining trends in groundwater level were observed in all wells during the study period (fig. 5). An MK trend test was performed on groundwater-level measurements for all wells with more than two measurements; all trends were downward and statistically significant for WYs 2001–21 (p-value <0.1; table 5). Rates of decline were calculated from the slope of a least-squares regression through the groundwater-level record of each well (table 5). Mean annual rate of change was also calculated from the difference of the first and last water-level measurement for each period of analysis and divided by the time spanning the two measurements (table 5). Among wells having a period of record of WYs 2001–21, the mean decline in groundwater level based on the linear regression slope was 18.8 ft, with a mean decline rate of 0.94 ft per year. Two prominent increases in groundwater level were observed in 2006 and 2017. Wells KLAM 561, KLAM 562, and KLAM 637 all had similar rates of groundwater-level decline at 1.2 ft per year during WYs 2001–21. KLAM 615 is closest to areas where most of the groundwater withdrawal for irrigation occurs, and the decline was similar to the decline in other wells throughout the study area.
Measured groundwater level in selected wells within the Klamath Marsh study area, south-central Oregon.
Table 5.
Results of Mann-Kendall trend test, trend slope, and rate of change for groundwater level from selected wells within the Klamath Marsh study area, south-central Oregon.[Abbreviations: ID, identifier; OWRD, Oregon Water Resources Department; MK, Mann Kendall; <, less than; --, no value]
Groundwater-level measurements at KLAM 522 do not have the same period of record as other wells in the study area, but the well provides a useful historical context for groundwater level near Klamath Marsh. During WYs 1962–87, groundwater level varied from 4,530 to 4,547 ft, likely in response to periods of wetter and drier conditions in the basin. For this period, a small statistically significant increase in groundwater level was observed (+0.31 ft per year; p-value <0.1; table 5). Sometime during WYs 1987–2001, the groundwater system shifted from a state of fluctuating groundwater level (as observed prior to 1987) to one of nearly continuous year-over-year decline. During WYs 2013–21, a statistically significant decline in groundwater level at KLAM 522 was observed at a rate comparable to other wells nearby (table 5).
Agricultural Groundwater Use
Groundwater pumpage for agricultural irrigation, fire suppression, manufacturing, and construction within the study area is permitted at 26 well locations, also referred to as a point of diversion (POD) by OWRD (fig. 6). Maximum annual pumpage for permitted wells was estimated from permitted groundwater rights retrieved from OWRD Water Rights Information System (WRIS; Oregon Water Resources Department, 2023c). Irrigation water rights are classified as primary or supplemental. A primary water right designates the POD as the principal water source for the authorized use. A supplemental water right designates that the POD can only be used to make up for a deficiency in available water from a primary water right. Additional pumpage from unpermitted wells is unknown; unpermitted pumpage for irrigation likely is minimal based on an assessment of historical aerial imagery. The pumpage estimates might reflect a maximum value because (1) reporting of actual pumpage or water use is not required of the permittees, (2) many of the water rights are for supplemental irrigation and, therefore, are not used every year, (3) withdrawals might not be at the full permitted rate, and (4) not all well pumps are in working condition. The permitted maximum annual pumpage for each groundwater right within the study area is summarized in table 6. The rates obtained from WRIS (in cubic feet per second) were converted to acre-feet per day and multiplied by the maximum number of days permitted for the POD.
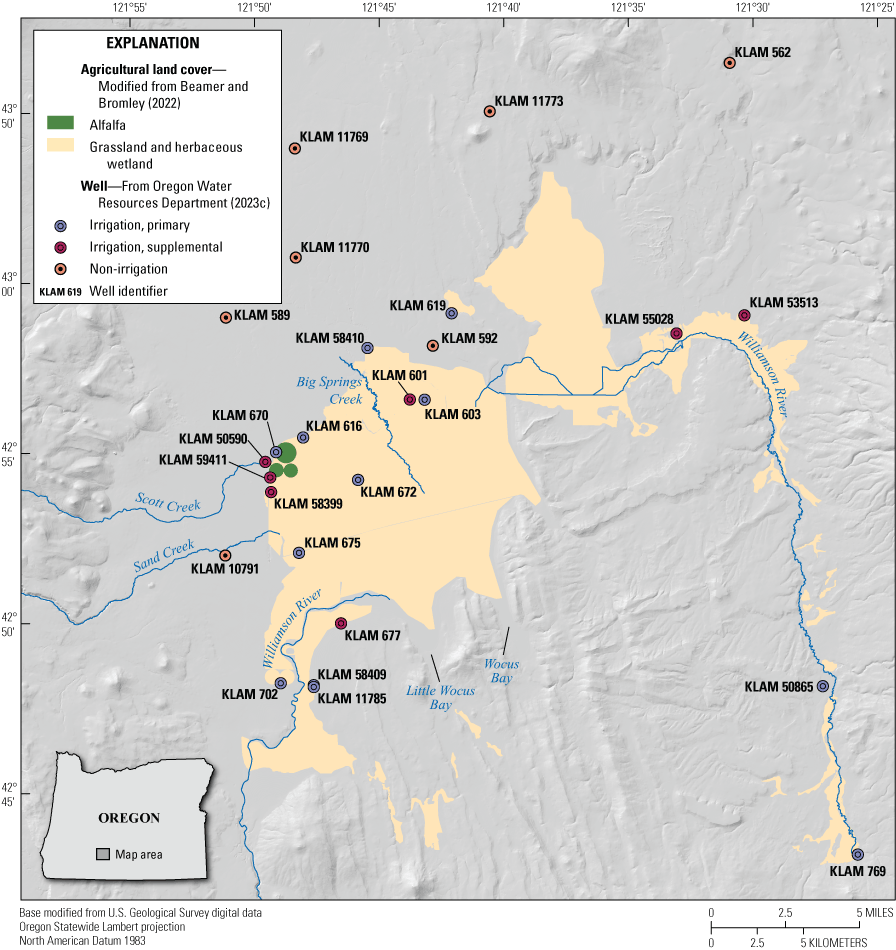
Wells with a groundwater right permit and agricultural land-cover type for the 2021 growing season, Klamath Marsh study area, south-central Oregon.
Table 6.
Maximum annual pumpage from all permitted groundwater rights issued by Oregon Water Resources Department for wells within the Klamath Marsh study area, south-central Oregon (Oregon Water Resources Department, 2023c).[Abbreviations: ID, identifier; mm-dd-yyyy, month, day, year; POD, point of diversion]
Groundwater permits for irrigation represent 99 percent of the permitted groundwater use in the study area and the maximum permitted groundwater pumpage for all uses is 48,082 acre-feet per year (acre-ft/yr). In terms of both the number of water rights issued and the associated permitted pumpage, most groundwater rights were issued during the 1960s and 1970s (table 6; fig. 7). During those 2 decades, the permitted maximum annual groundwater pumpage for primary irrigation increased to about 25,700 acre-feet (acre-ft) and supplemental irrigation increased to about 12,300 acre-ft. During 1980–2004, the permitted maximum annual groundwater pumpage for primary irrigation and supplementary irrigation increased by about 10,000 acre-ft, and no new permits have been issued since.
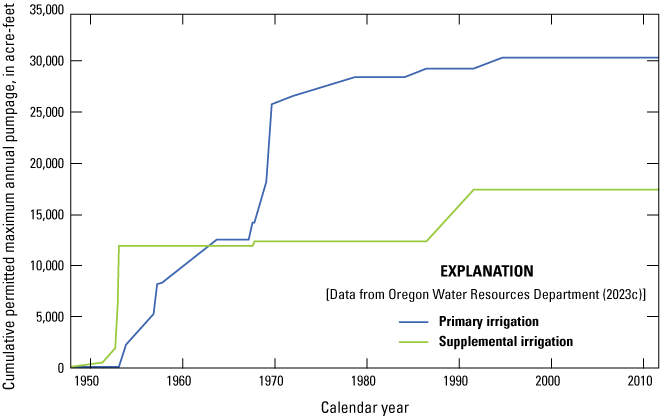
Cumulative permitted maximum annual pumpage for primary and supplemental groundwater irrigation water rights, Klamath Marsh study area, south-central Oregon.
Climate Data
Precipitation and temperature data for six sites (table 7) were obtained from the National Oceanic and Atmospheric Administration’s National Centers for Environmental Information (NCEI) Global Summary of the Month dataset (Lawrimore and others, 2016). The sites were selected to represent the spatial variability of climate across the study area. These data were used to assess trends in total annual precipitation and annual mean temperature by WY.
Table 7.
Summary of precipitation and temperature data by water year for selected climate stations near Klamath Marsh, south-central Oregon.[Latitude and longitude coordinates in North American Datum of 1983. Abbreviations: ID, identifier; NAVD 88, North American Vertical Datum of 1988; OR, Oregon; NPS, National Park Service; HQ, Headquarters]
Total Precipitation
Annual precipitation totals by WY were computed for 1985–2021 from monthly totals for selected sites around the study area (fig. 1; table 7). Two climate stations (USS0022F18S and USC00351946) contained two incomplete months of precipitation data during the study period. An incomplete month was defined as missing more than three daily measurements. The precipitation value for an incomplete month was discarded and replaced with an adjusted PRISM monthly precipitation value for the missing month (PRISM Climate Group, 2022). The adjusted PRISM value was calculated from a linear regression between all measured monthly values from the climate station and the PRISM monthly precipitation values for the grid cell in which the climate station is located, and the adjusted value for the missing month was used.
The precipitation records from the six climate stations were analyzed for trends that could contribute to changes in surface-water inundation within the marsh (fig. 8). During the mid-to-late 1990s, a marked increase in total precipitation at all sites is apparent. A second period of higher precipitation at sites in the Cascade Range (USS0022F18S, USC00351946, and USS0022G33S) began in the mid-2000s with a peak around 2011. Unlike the peak during the 1990s, the 2011 peak was not observed at sites in the central to eastern part of the study area (USS0021F22S, USS0021F12S, and USS0021G03S). Precipitation during WYs 2020 and 2021 was among the lowest measured during the study period. MK trend analyses were completed for each station for three time periods: (a) WYs 1985–2021, (b) WYs 1991–2021, and (c) WYs 2001–21. No statistically significant trends (p-value <0.1) in total annual precipitation were determined (table 8).
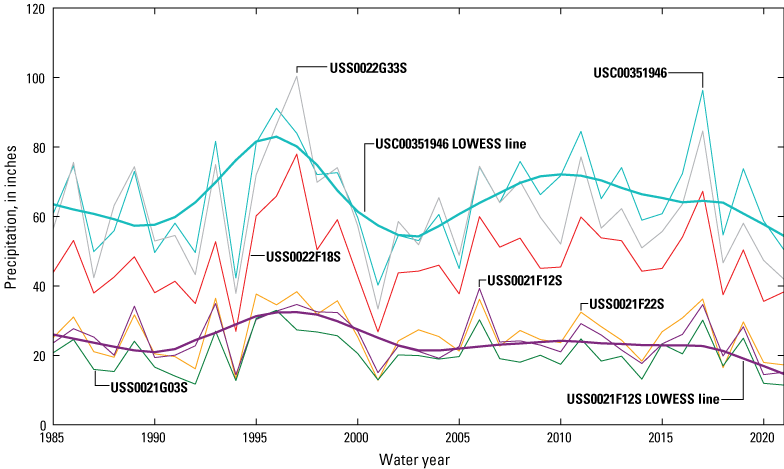
Total annual precipitation by water year for selected climate stations within and near the Klamath Marsh study area, south-central Oregon. Locally weighted scatterplot smoothing (LOWESS) line is included for the highest-altitude climate station USC00351946 within the Cascade Range and for the climate station farthest east, USS0021F12S. Data from Lawrimore and others (2016).
Table 8.
Results of Mann-Kendall trend test and Sen’s slope for total annual precipitation by water year from selected climate stations within the Klamath Marsh study area, south-central Oregon, in periods 1985–2021, 1991–2021, and 2001–21.[Shading is present for visual grouping. Abbreviations: ID, identifier; MK, Mann-Kendall; OR, Oregon; NPS, National Park Service; HQ, Headquarters]
Annual Mean Temperature
Annual mean temperature by WY was calculated from the NCEI Global Summary of the Month dataset (Lawrimore and others, 2016) and was evaluated for trends during the study period at the same sites evaluated for trends in precipitation (fig. 1; table 7). The period of record for temperature at these sites was shorter than the period of record for precipitation because temperature instrumentation was installed later. Temperature was not consistently monitored, with each station having multiple months of either missing or incomplete data (table 7). All incomplete or missing monthly temperature values were replaced with an adjusted PRISM temperature value (PRISM Climate Group, 2022) determined in a manner similar to that described for the precipitation data.
Climate station USC00351946 is the highest-altitude station at 6,485 ft above the NAVD 88 datum, with noticeably cooler mean annual temperatures compared to the other five stations. This station is also the only site that has data spanning the MSWE period of record, with temperature data collection beginning in WY 1921. Although the other five climate stations span an altitude of about 900 ft (4,850–5,740 ft) and bracket the entire study area from west to east and north to south, the annual mean temperatures of these stations are generally within about 2 °F of each other. None of the periods of record for temperature at the five lower-altitude stations spanned the full MSWE study period (table 7).
Mann-Kendall trend analyses were conducted on the temperature data for two time periods: (1) WYs 1991–2021 and (2) WYs 2001–21. Significant warming trends (p-value <0.1) were observed at four of the five lower-altitude climate sites (USS0021F22S, USS0021F12S, USS0022G33S, and USS0021G03S) during both periods of analysis, with the most substantial warming occurring at the easternmost site (USS0021F12S; fig. 9; table 9). Climate station USS0022F18S had significant warming during WYs 1991–2021 and no significant trend during WYs 2001–21. No significant trends in temperature were identified at the highest-altitude site (USC00351946); however, the last decade had two of the three warmest years of the study period. Warming rates for the sites with statistically significant trends were calculated from Sen’s slope and ranged from 0.4 to 1.2 °F per decade.
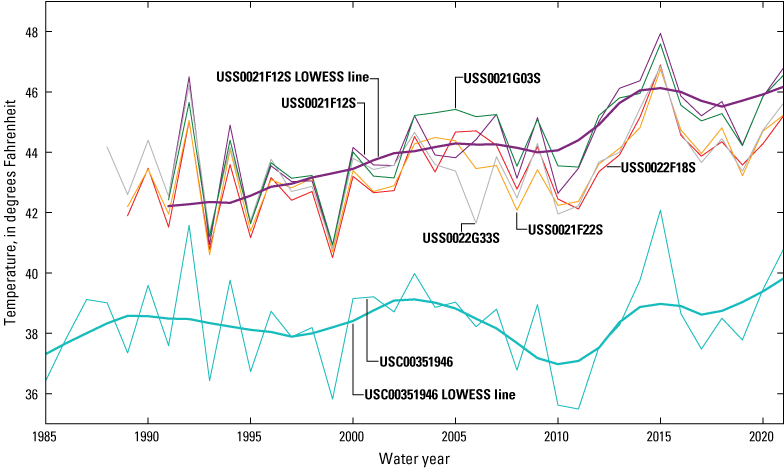
Annual mean temperature by water year for selected climate stations in and near the Klamath Marsh study area, south-central Oregon. Locally weighted scatterplot smoothing (LOWESS) line included for the highest-altitude climate station USC00351946 within the Cascade Range and for the climate station farthest east, USS0021F12S. Data from Lawrimore and others (2016).
Table 9.
Results of Mann-Kendall trend test and Sen’s slope for annual mean temperature by water year from selected climate stations within the Klamath Marsh study area, south-central Oregon, in periods 1991–2021 and 2001–21.[Shading is present for visual grouping. Abbreviations: ID, identifier; MK, Mann-Kendall; OR, Oregon; NPS, National Park Service; HQ, headquarters]
Spearman’s Rank Correlation Analysis of All Variables
Correlations among the time series of TOWE, stream discharge, groundwater level, precipitation, and temperature were evaluated using the Spearman’s rank correlation test. Correlation coefficients (Spearman’s Rho) were computed for two periods of record, WYs 1991–2021 (fig. 10) and WYs 2001–21 (fig. 11). These periods correspond to the maximum overlap among the datasets. The magnitude and sign of the correlation coefficients are similar among the two periods, although the magnitude of the correlation tends to be somewhat weaker for the shorter period, which was expected because of the smaller sample size. A small number of correlation coefficients that were significant in the longer analysis period were not significant in the shorter analysis period.
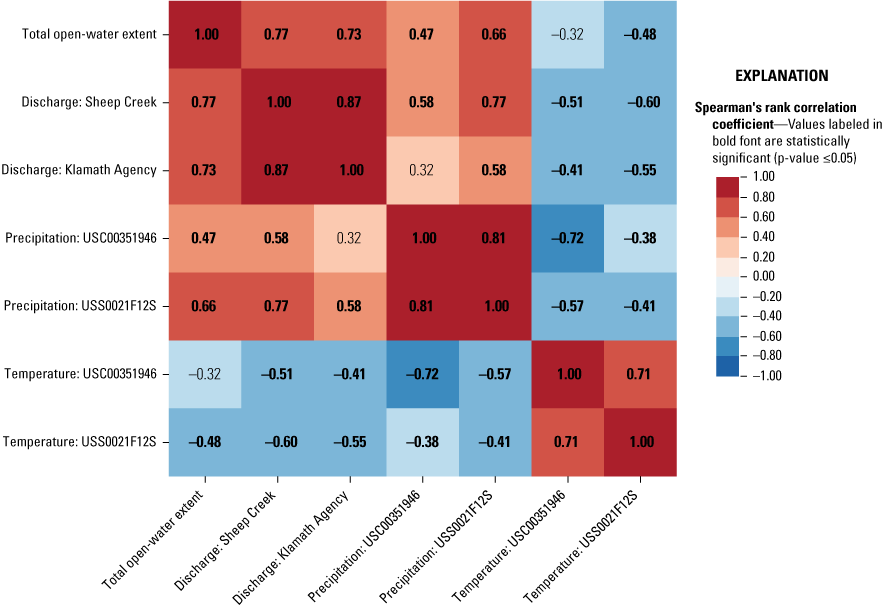
Correlation matrix containing Spearman’s rank correlation coefficients comparing datasets for Klamath Marsh, south-central Oregon, with periods of record that span water years 1991–2021. All correlation coefficient values in bold font are statistically significant (p-value less than or equal to [≤] 0.05).
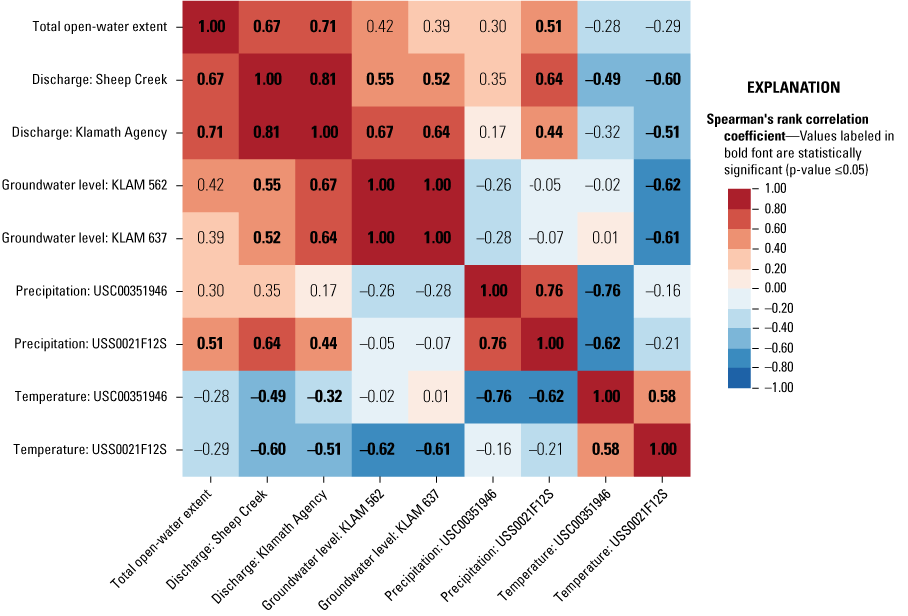
Correlation matrix containing Spearman’s rank correlation coefficients comparing datasets for Klamath Marsh, south-central Oregon, with periods of record that span water years 2001–21. All correlation coefficient values in bold font are statistically significant (p-value less than or equal to [≤] 0.05).
A high degree of correlation exists in the temperature records and precipitation records among the six climate sites (figs. 8 and 9), so correlations were first developed among the six climate sites to reduce redundancy. Among the six climate stations, correlation coefficients of annual precipitation records for WYs 1985–2021 ranged from 0.78 to 0.93 and correlation coefficients of annual mean temperature records for WYs 1991–2021 ranged from 0.64 to 0.94. Subsequent analyses and discussions used two climate stations, USS0021F12S and USC00351946. Climate station USS0021F12S was used to represent conditions across most of the study area east of the Cascade Range. This station had the strongest temperature correlations (0.89–0.91) with the other four lower-altitude sites. Climate station USC00351946 at Crater Lake was used to represent conditions at high altitudes in the Cascade Range.
Correlations with Total Open-Water Extent
Total open-water extent was most strongly correlated with the two streamflow sites during both time periods, with correlation coefficients ranging from 0.67 to 0.77 (figs. 10 and 11). The correlation was strongest with discharge at the Sheep Creek streamgage for the longer period (fig. 10), with a statistically significant correlation of 0.77. The correlation between TOWE and the Klamath Agency streamgage were similar for both time periods, having statistically significant correlations of 0.73 for the longer period (fig. 10) and 0.71 for the shorter period (fig. 11).
Total open-water extent and total annual precipitation at climate station USS0021F12S had strong statistically significant correlations of 0.66 for the longer period (fig. 10) and a slightly weaker correlation of 0.51 for the shorter period (fig. 11). TOWE and precipitation at climate station USC00351946 had a moderate statistically significant correlation of 0.47 for the longer period (fig. 10) and was not significantly correlated for the shorter period (fig. 11). Annual mean temperature at climate station USS0021F12S had a moderate statistically significant inverse correlation with TOWE of –0.48 for the longer period (fig. 10) and was not significantly correlated for the shorter period (fig. 11). No statistically significant correlations were detected between TOWE and annual mean temperature at climate station USC00351946. Also, no statistically significant correlations were detected for TOWE and groundwater level for WYs 2001–21.
Correlations with Stream Discharge
Discharge at Sheep Creek and total annual precipitation at climate station USS0021F12S had a strong statistically significant correlation of 0.77 for the longer period (fig. 10) and 0.64 for the shorter period (fig. 11). A moderate statistically significant correlation of 0.58 existed between discharge at Sheep Creek and precipitation at climate station USC00351946 for the longer period (fig 10), although no significant correlation existed during the shorter period (fig 11). Discharge at Klamath Agency and total annual precipitation at climate station USS0021F12S had a moderate statistically significant correlation of 0.58 for the longer period (fig. 10) and 0.44 for the shorter period (fig. 11). No significant correlation was detected between discharge at Klamath Agency streamgage and precipitation at climate station USC00351946 for either period considered (figs. 10 and 11).
Discharge at Sheep Creek and annual mean temperature at climate station USS0021F12S had a statistically significant inverse correlation of –0.60 for both analysis periods (figs. 10 and 11). Discharge at Klamath Agency and annual mean temperature at climate station USS0021F12S had a moderate statistically significant inverse correlation of –0.55 for the longer period (fig. 10) and –0.51 for the shorter period (fig. 11). Discharge at Sheep Creek and temperature at climate station USC00351946 had a moderate statistically significant inverse correlation of –0.51 for the longer period (fig. 10) and –0.49 for the shorter period (fig. 11). A moderate statistically significant inverse correlation of –0.41 existed between discharge at the Klamath Agency streamgage and temperature at station USC00351946 for the longer period (fig. 10), although no significant correlation existed during the shorter period (fig. 11).
For the available groundwater-level analysis period of 2001–21, discharge at Sheep Creek had a moderate but significant correlation with groundwater level at KLAM 562 and KLAM 637, with coefficients of 0.55 and 0.52, respectively (fig. 11). Stream discharge at Klamath Agency had a stronger correlation to the observed decline in groundwater level at KLAM 562 and KLAM 637, with strong significant correlation coefficients of 0.67 and 0.64, respectively (fig. 11).
Correlations with Groundwater Level
Observed declines in groundwater level were not significantly correlated with total annual precipitation (fig. 11). Groundwater level at KLAM 562 and KLAM 637 and annual mean temperature at the lower-altitude climate station (USS0021F12S) had strong inverse correlations with statistically significant coefficients of –0.62 and –0.61, respectively. No significant correlation was detected between groundwater level and annual mean temperature at the highest-altitude climate station (USC00351946; fig. 11).
Discussion
The relations among trends in hydrology, climate, and water use in the study area provide a foundation for a conceptual model for the hydrology of Klamath Marsh. The annual maximum extent of surface-water inundation in Klamath Marsh is the result of a dynamic balance between the regional groundwater table and surface-water inflows. Groundwater level near Klamath Marsh is influenced by fluctuations in the regional groundwater table and by recharge through infiltration of surface water from many streams draining toward the marsh from the eastern Cascade Range and the volcanic uplands to the north and east of the marsh. Except during years of substantial snowmelt, these streams typically do not flow into the marsh and therefore do not directly contribute to the open-water area. However, water from these losing streams recharges the shallow groundwater system in the study area, influencing the groundwater level beneath the marsh. The recharge process is rapid, likely due to the shallow, thick, high-permeability pumice deposits underlying the lowlands east of the Cascade Range in the study area. The depth of the groundwater beneath Klamath Marsh controls the available storage space within the permeable pumice soils, and thus, the amount of the annual springtime surface-water freshet that can infiltrate. When the groundwater level is near land surface and the springtime freshet is large, the open-water extent of the marsh is at its largest (fig. 12A). The open-water extent is smallest in years of low surface-water runoff or when groundwater level is substantially below the altitude of the marsh land surface, providing greater storage capacity for infiltrating surface water (fig. 12B). Details supporting this conceptual model of the Klamath Marsh hydrologic system are discussed in the sections that follow.
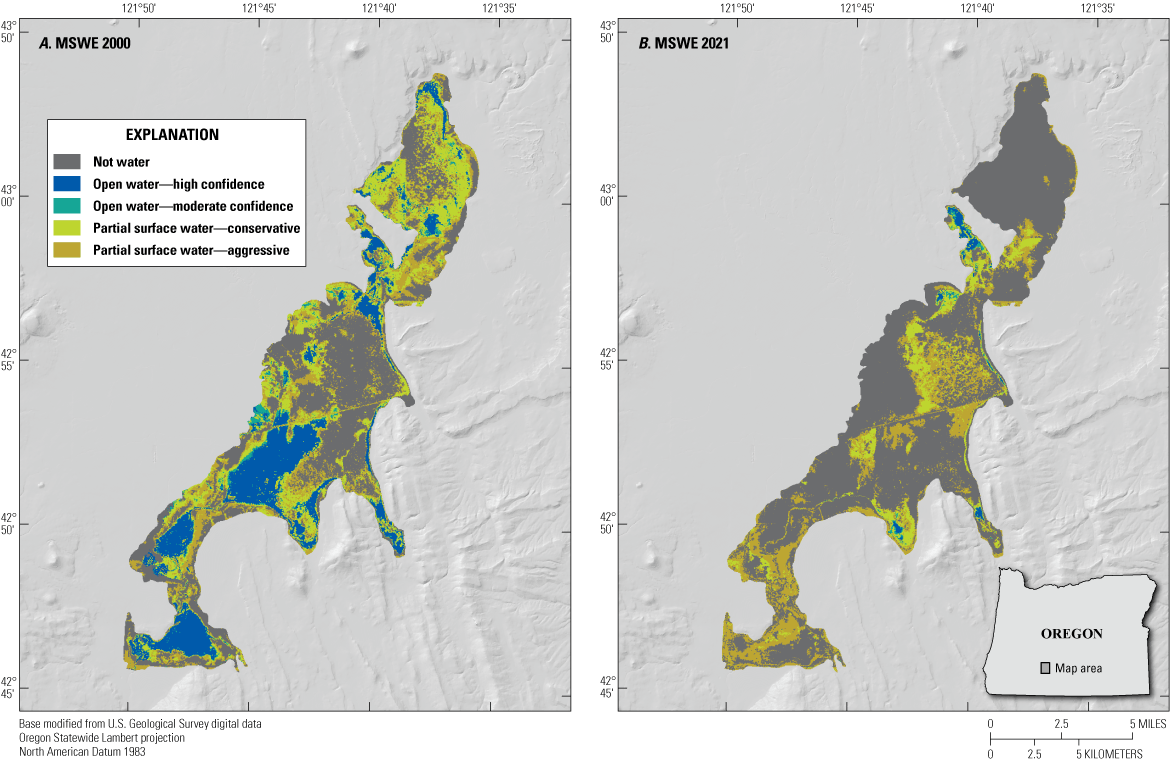
Maximum surface-water extent (MSWE) of Klamath Marsh, south-central Oregon, for years 2000 (A) and 2021 (B).
Altitude of Groundwater Level Relative to Marsh Land Surface
Groundwater level across the Williamson River Basin upstream from the Klamath Agency streamgage has been declining since at least 2000 (fig. 5). Although groundwater-level data for the study area prior to WY 2000 are sparse and the onset of declines is not well documented, sustained decreases in open-water area for the study period began after WY 2000 (fig. 3). Therefore, groundwater level for WY 2000 is useful for illustrating the relation between groundwater and open-water area in the marsh prior to substantial declines in open-water area and provide a contrast to current conditions.
In summer 2000, the groundwater level in two wells on opposite sides of the upper marsh (KLAM 11774, 300-ft deep, open from 4,505 to 4,224 ft above NAVD 88; KLAM 637, 136-ft deep, open from 4,478 to 4,458 ft above NAVD 88) was at or above the altitude of the marsh land surface (fig. 13), about 4,520 ft. The groundwater level has been declining since WY 2000 and was about 10 ft below marsh land surface at KLAM 11774 and about 20 ft below marsh land surface at KLAM 637 by July 2021. Because of the decline in groundwater level over the previous 21 years, a 10- to 20-ft-thick unsaturated zone formed beneath the marsh.
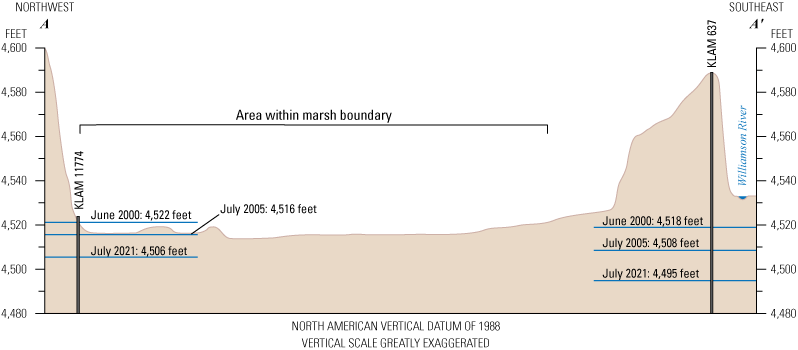
Cross section of the northern marsh land surface showing groundwater level and date of measurements at two wells in the northern part of Klamath Marsh, south-central Oregon. Location of cross section is shown in figure 2. Groundwater-level data are from U.S. Geological Survey (2023).
Permeability of Sediments and Rocks Underlying Klamath Marsh
Although information about the subsurface geology under Klamath Marsh is limited, the available data indicate the upper 100 to 200 ft of material are moderately to highly permeable. A surficial layer of peat and diatomaceous silts, varying in thickness from 3 to 5 ft, are present across much of the marsh. The thin surficial layer has a lower permeability than deeper deposits and attenuates the hydraulic interaction between surface water and groundwater (U.S. Fish and Wildlife Service, 2010). Evidence for material with much higher permeability beneath the surficial peat layer comes from multiple sources, including driller descriptions and yield tests from OWRD water well reports; numerous losing streams on the marsh periphery, few established surface-water channels within the marsh and surrounding area, low groundwater-level gradients (Gannett and others, 2007), and relatively high hydraulic conductivities estimated from a calibrated groundwater model (Gannett and others, 2012).
Response of Total Open-Water Extent to Changes in Surface Water and Groundwater
Total open-water extent is well-correlated with annual discharge in the Williamson River at both streamgages throughout the study period (figs. 10, 11, and 14); however, discharge at Sheep Creek has a stronger correlation during the first half of the study period (1985–2003; Spearman’s Rho =0.80, p-value= <0.001), compared to the second half (2003–21; Spearman’s Rho =0.71, p-value =0.001). The shift in the relation between TOWE and discharge at Sheep Creek occurs during the period when the groundwater level in the two near-marsh wells (KLAM 637, KLAM 11774) declined below the land surface of the marsh (figs. 5 and 13). The correlation with TOWE and discharge at the Klamath Agency streamgage is marginally weaker during the first half (Spearman’s Rho =0.69, p-value =0.003) of the study period compared to the second half (Spearman’s Rho =0.72, p-value =0.001). The decline in groundwater level resulted in an increased thickness of the unsaturated zone, providing greater storage capacity for infiltrating stream water beneath and near the marsh and ultimately reducing the extent of open water within Klamath Marsh. Although an increased fraction of the springtime freshet is potentially infiltrating the subsurface, this additional recharge is still less than the amount needed to stop or reverse the groundwater-level declines observed at all wells within the study area.
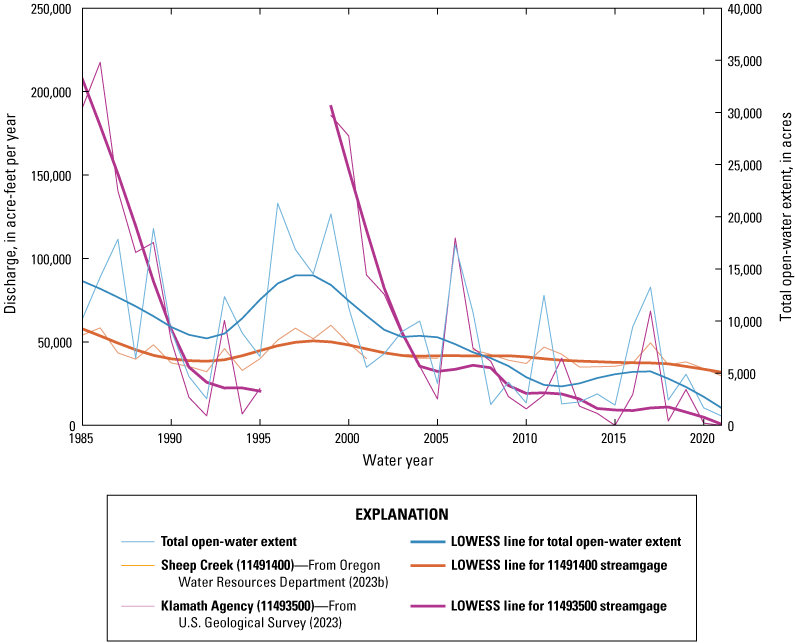
Total stream discharge by water year at streamgages Williamson River below Sheep Creek near Lenz, Oregon (11491400), and Williamson River near Klamath Agency, Oregon (11493500), and surface area of total open-water extent with locally weighted scatterplot smoothing (LOWESS) line, Klamath Marsh study area, south-central Oregon.
Despite the groundwater level having been below the marsh land surface continuously since about 2005, the area of open water in Klamath Marsh has expanded greatly during years when the springtime freshet was large, such as in 2006, 2011, and 2017. Presumably, the rate of the inflowing surface water exceeds the infiltration rate through the surficial layer of peat and silt. Although the area of open water in the marsh still expands in response to years of large streamflow, the area of open water in years of less-abundant inflow has declined since about 2005.
Total Open-Water Extent, Groundwater, and the Klamath Agency Streamgage
Declining groundwater level in the study area likely is responsible for the decrease in flow at the Klamath Agency streamgage over the previous 20 years (fig. 15). Since WY 2000, discharge at this streamgage has been steadily decreasing, with peaks during years of abundant streamflow and precipitation, such as in WYs 2006, 2011, and 2017. Historically, discharge at this streamgage commonly was seasonal with flows declining to zero during the late summer. During WYs 1955–2000, the median number of dry days per year was 73; since WY 2000, the median number of dry days per year was 240. From WY 1955 (the beginning of the record) through WY 2014, this site had not remained dry for an entire year; however, starting in WY 2015 it has remained dry for 3 years, including WYs 2021 and 2022.
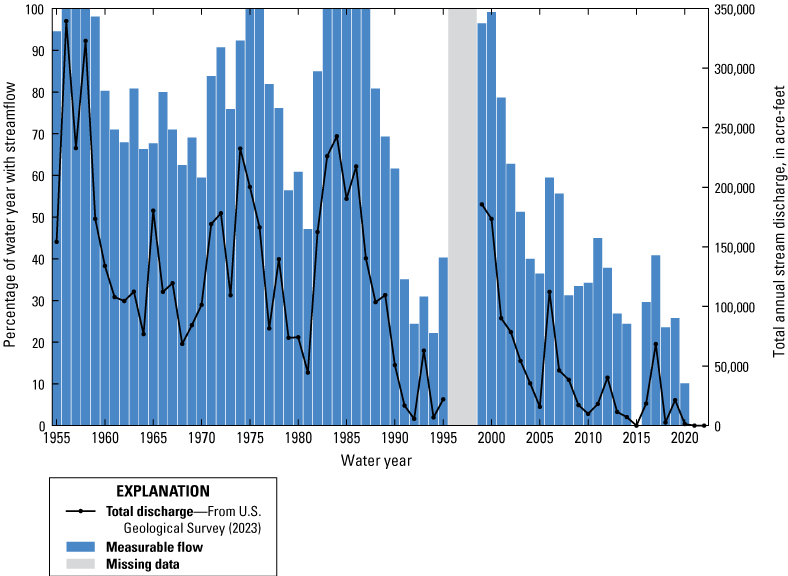
Percentage of year containing measurable streamflow and total annual discharge at the Williamson River near Klamath Agency, Oregon streamgage (11493500), Klamath Marsh, south-central Oregon, during water years 1955–95 and 1999–2022. Data for water years 1996–98 are missing.
Declining streamflow at the Klamath Agency streamgage since 2000 is likely due to the declining groundwater level in the study area, and in particular, the level in the lowlands directly underlying and surrounding Klamath Marsh. Trends in precipitation (fig. 8; table 8) since WY 2001 were not statistically significant and trends in streamflow at the Sheep Creek streamgage (fig. 4; table 3) were of substantially smaller magnitude than trends at the Klamath Agency streamgage. As groundwater level has declined during the previous 2 decades, increasing volumes of surface-water inflow have been infiltrating into the shallow groundwater system leaving less (or no) water available for streamflow through the Williamson River channel downstream from the marsh.
Groundwater-Level Decline
Declining groundwater level is the principal factor influencing changes in the seasonal surface-water expression (TOWE) and surface-water outflow from Klamath Marsh. Rates of decline in groundwater level is similar across the entire study area, including areas far upgradient from Klamath Marsh (figs. 1 and 5). Declines in the surface-water extent of the marsh are likely related to these regional changes in groundwater level rather than to changes in water management and water use in the study area. An assessment of groundwater right permits obtained from OWRD WRIS (Oregon Water Resources Department, 2023c) in the study area supports this conclusion.
As of WY 2021, permitted groundwater withdrawals in the study area totaled 48,082 acre-ft/yr, with 9,190 acre-ft/yr (19 percent) permitted during the study period of WYs 1985–2021 and the latest permit issued in WY 2004 (table 6). Of the pumpage permitted during the study period, 3,739 acre-ft/yr were for primary irrigation and were likely used to their full extent each year. This recent primary irrigation pumpage represents 12 percent of the total permitted pumpage for primary irrigation (30,238 acre-ft/yr) in the study area. Of all permitted groundwater withdrawals during the 1985–2021 study period, 62 percent is associated with one well located along the Williamson River between the marsh and the Sheep Creek streamgage. This permitted pumpage is for supplemental irrigation water and the reported water use for this well indicated that it was only used in 5 years during 2003–22 and was pumped at a maximum rate of 459 acre-ft/yr (Oregon Water Resources Department, 2023c). Considering the actual use of this one large permit, new groundwater withdrawals during the study period were likely less than 4,600 acre-ft/yr. Groundwater-level data from KLAM 522 indicate that groundwater level in the study area fluctuated during 1962–87, but there was no indication of a sustained decline (fig. 5). The relatively small amount of additional pumpage permitted after 1985 is likely not responsible for the sustained declines in groundwater level observed in measurements from multiple wells across the study area since 2000.
One water right transfer was identified within the study area during the study period. The transfer enabled the owner to withdraw water from a second well of similar depth less than 1 mi from the original well and was associated with the installation of several center pivot sprinkler systems west of the marsh sometime during August 2012–July 2014 (based on high-resolution aerial imagery). Although conspicuous on the landscape, the sprinkler systems use groundwater that has been permitted for use since the early 1960s and that water is being withdrawn near the originally permitted well.
Potential Influences on Observed Changes in Klamath Marsh Hydrology
The hydrologic response of Klamath Marsh is seemingly at odds with the hydrologic input to the marsh. Changes to the water budget of the marsh were attributed to two potential influences: increasing air temperatures and the reestablishment of forested land within the study area. Since 2000, the extent of TOWE, groundwater level, and streamflow at Klamath Agency streamgage have all declined, whereas no trend in total annual precipitation was observed at any climate station within and adjacent to the study area. Streamflow entering the marsh from the Williamson River has had significant declines during all three analysis periods, WYs 1985–2021, 1991–2021, and 2001–21, with a somewhat pronounced decline during WYs 2019–21.
Climate Change
Climate stations near Klamath Marsh have recorded a mean increasing trend in air temperature of 0.9°F per decade during the WYs 1985–2021 study period (table 9) and may be contributing to the observed hydrologic responses of Klamath Marsh. This hypothesis is supported by recent studies in the western United States that have linked increasing temperatures with declining snowpack and increasing aridity across the region (Mote and others, 2018; Haig and others, 2019; Donnelly and others, 2020; Hall and others, 2023).
The Great Basin region, which borders the upper Klamath River Basin to the east and south, has been experiencing an intensifying aridity trend due to a warmer and drier climate resulting in changing evapotranspiration (ET) patterns, reduced snow cover, and declines in terminal lake water levels (Hall and others, 2023). The northwesternmost part of the hydrographic Great Basin study area of Hall and others (2023) is adjacent to the eastern boundary of the Williamson River Basin and consists primarily of high-altitude areas that typically accumulate snow during the winter, supplying melt water to respective drainage basins. Hall and others (2023) showed a statistically significant (p ≤0.05) increase in total ET during 2001–21 in the high-altitude area adjacent to the Williamson River Basin. The authors suggested that the increase in air temperature during the study period has contributed to enhanced snowpack sublimation, leading to decreases in the springtime freshet and potentially drier soil conditions than in the past. Temperature-induced snowpack loss would not be evident in total annual precipitation records because it is a post-depositional process. Although total annual precipitation at climate stations around the upper Williamson River Basin did not have statistically significant declining trends during WYs 1985–2021, increases in mean annual temperature and declines in stream discharge are consistent with the observations and conclusions of Hall and others (2023).
Supporting the findings of Hall and others (2023), a recent study by Mote and others (2018) found significant declines in snowpack across the western United States, with parts of Oregon and Nevada having the largest downward trends during their 1955–2016 analysis period. Three of the climate stations (USS0022F18S, USS0021F22S, and USS0021F12S) in this report were included in that analysis of April 1 snowpack. All three sites had downward trends, with climate stations USS0022F18S and USS0021F22S having significant declines (p ≤0.05). The authors concluded that the substantial decline in snowpack was predominantly influenced by increasing temperatures.
Haig and others (2019) and Donnelly and others (2020) provided additional evidence of climate-driven decreases in surface-water prevalence in the intermontane west. Donnelly and others (2020) used a spectral mixing analysis of Landsat imagery during 1984–2018 to assess long-term trends in lake water levels of endorheic watersheds, comparing surface area change during 1984–99 to 2000–18. They evaluated changes in snowmelt-dominated watersheds and monsoonal-dominated watersheds and showed a 27-percent decrease in lake surface area and a 47-percent decrease in wetland areas that primarily receive surface-water inflows from snowmelt, but no parallel change in monsoonal watersheds during this period. Although the upper Williamson River Basin was not included in the study and is not an endorheic watershed, the adjacent Summer Lake Basin (fig. 1) was included as a snowmelt-dominated watershed and had statistically significant declines in lake surface area and insignificant declines in wetland surface area during 2000–18 compared to 1984–99. Furthermore, the climate station (USS0021F12S) with the strongest correlation to streamflow in the upper Williamson River is in the Summer Lake Basin. Haig and others (2019) evaluated water availability and climate trends during the previous century within the same hydrographic Great Basin study area as Hall and others (2023). They found that the rate of increase of mean annual air temperature during 1980–2008 was more than double the long-term trend during 1900–2008. Furthermore, the warming trend was accompanied by a shift in high streamflow to earlier in the year, indicating more winter precipitation is falling as rain instead of snow or that snowmelt is occurring earlier, resulting in declines in warm-season water availability despite negligible changes in total precipitation amounts (Haig and others, 2019).
Land-Use Change
Cycles of clearcutting and regrowth of forest land for timber production in Klamath County has substantially modified the natural land cover since at least the early 1900s (U.S. Forest Service, 1998; Andrews and Kutara, 2005; U.S. Fish and Wildlife Service, 2010). Timber production peaked between 1970 and 1990 followed by substantial long-term declines (fig. 16; Andrews and Kutara, 2005; University of Montana Forest Industry Research Program, 2024). Mean timber production during 2001–21 was 26 percent of the 1970–90 mean. Comparison of forested land cover in 2001 and 2021 from the National Land Cover Database (Multi-Resolution Land Cover Characteristics Consortium, 2024) indicates a net increase of 55,556 acres (87 mi2) in forested land cover within the Williamson River Basin upstream of the Klamath Agency streamgage, which is consistent with the decline in timber harvest and regrowth of clearcut areas. Although a comparison with forest land cover in the early 1990s would provide a better understanding of land-cover changes, a dataset of directly comparable forest land cover was not available for years prior to 2001.
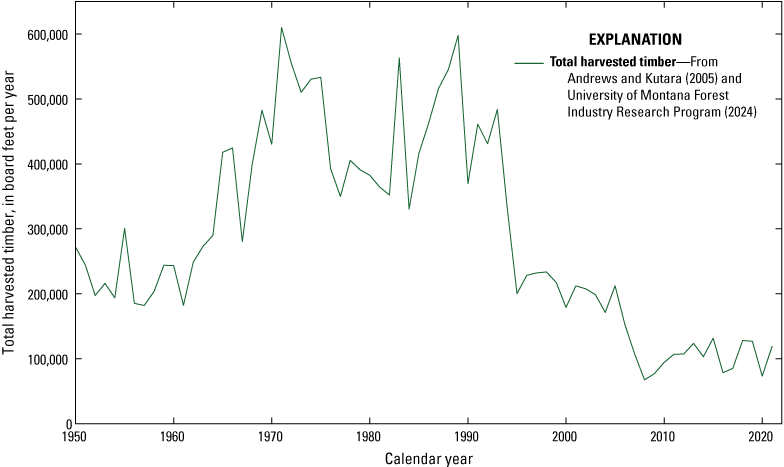
Total harvested timber during 1950–2021 in Klamath County, south-central Oregon.
The reestablishment of more than 55,000 acres of forests following the decline in timber harvests after 1990 could be contributing to increased levels of ET across the basin. After a timber harvest, ET decreases and water yield from the cut area increases (Rothacher, 1970). After replanting, ET within clearcut areas has been observed to return to pre-cut values in about 10 years for multiple conifer species (Jassal and others, 2009; Aguilos and others, 2021). However, following initial establishment, ET has been shown to exceed pre-cut values, with ET peaking in young, replanted forests aged 10–25 years; followed by a substantial decrease in ET as forests mature (Irvine and others, 2004; Delzon and Loustau, 2005; Domec and others, 2012). If the declines are, in part, related to forest reestablishment during the last 30 years, the currently observed stress on groundwater resources in the basin could lessen as forests mature and the ET from forest land of the Williamson River Basin begins to decline.
Working Toward a Hydrologic Budget for Klamath Marsh
The MSWE data document declining surface-water inundation within Klamath Marsh since about 2000. Although no trend in the total annual precipitation at climate stations in and near the study area was detected, groundwater level near and surface-water inflows to the marsh declined during the study period. Increasing mean annual temperatures could indicate that evaporative demand is increasing and potentially capturing a part of water that otherwise would recharge the groundwater system. This initial assessment of available climatic and hydrologic data indicated that surface-water extent within Klamath Marsh is a complex issue caused by a combination of factors, and that new and continued monitoring would be useful for tracking and understanding future changes.
Groundwater Monitoring
Observation wells within the basin are sparse and primarily limited to the northern part of the basin. No paired observation wells are available anywhere in the upper Williamson River Basin to provide information on the connectivity between the deep and shallow groundwater systems. Shallow/deep well pairings provide insight into how changes in surface-water inflow affect shallow groundwater level and conversely, how rising or falling water level in the shallow groundwater system influence surface water. Shallow/deep well pairings also provide insight into how changes in water level in deeper geologic units are related to water level in the shallow groundwater system.
Four areas would benefit from shallow/deep well clusters within the study area, including: (1) Silver Lake Road near Big Springs Creek, (2) Williamson River mouth near the KMNWR eastern boundary, (3) Williamson River upstream from streamgage 11493500, and (4) Wocus Bay. Location (1) would provide information on groundwater level beneath the marsh and near the terminus of a large losing creek. This location also is close to center-pivot-irrigated land and would allow for the evaluation of pumping effects on groundwater level. Location (2) is suspected to be a major losing reach of the Williamson River where substantial infiltration of surface water recharges the shallow groundwater system beneath Klamath Marsh. A paired shallow/deep well cluster within this area would provide information on the dynamics of surface-water infiltration. A shallow/deep well cluster in location (3) would provide insight into the groundwater level that is necessary to maintain streamflow downstream from Klamath Marsh. Location (4) is one of a few locations within the marsh that consistently had open water during the entire study period and could serve as a baseline for comparing how other areas of the basin vary in response to changing hydrologic inputs.
Groundwater-Irrigation Use
The OWRD WRIS system provides useful information on permitted groundwater pumpage, but largely lacks information on actual water use. This is particularly crucial for supplemental irrigation water use, which can fluctuate with availability of surface water. According to the U.S. Drought Monitor (2023), 80 percent of the Williamson River Basin was in a state of severe drought from March 2020 through May 2023. With less surface water available for irrigation, reliance on and demand for supplemental groundwater rights is expected to increase. Reporting of actual water use is fraught with issues and measurements of ET can augment or replace water-use reporting programs. One or more ET monitoring stations in the marsh would be useful in evaluating changes in ET from natural and irrigated land in response to varying climate and also for calibrating remotely sensed ET models.
Surface-Water Monitoring
Long-term streamflow monitoring locations within the study area currently (2023) are limited to the Sheep Creek and the Klamath Agency streamgages, and only one streamgage (Sheep Creek) provides information on surface-water inflow to Klamath Marsh. Measurements of streamflow from the Cascade Range were limited to a short period during WYs 1993–99. None of these discontinued streamgages had a period of record exceeding 7 years, and, therefore, data are unavailable to provide substantive insight into changes in surface-water flow into the west side of the study area during the previous 2 decades. Augmented streamflow monitoring at selected discontinued and new locations would provide crucial information on surface-water inflows to Klamath Marsh. Quantifying streamflow losses using paired streamgages or making routine seepage-run measurements on losing reaches also would provide needed constraints on groundwater inputs to the hydrologic system supporting the marsh. Improved monitoring of artificial surface-water routing within the marsh, including quantity and timing of managed flows, also would aid management.
Water Budget
Water budgets are a tool for understanding the quantity and timing of water movement into and out of a hydrologic system, and often are an important first step in the development of numerical models. A comprehensive water budget for Klamath Marsh would provide valuable insight into the hydrologic functioning of the marsh, including quantifying the amount and timing of water movement into and out of the system. Water budgets can be developed for varying amounts of data, ranging from coarse, first-order assessments of inflow and outflows to spatially and temporally refined management tools; their quality and utility are directly proportional to the spatial and temporal density of the data used in their development.
Summary
Klamath Marsh plays an important and complex role in aggregating surface water and groundwater in the northern Klamath River Basin of south-central Oregon. Historically, the seasonal open-water extent of the marsh has naturally fluctuated in response to periods of wet and dry conditions, regardless of historical land-use and water-management practices. This study was undertaken to address concerns about multi-year declines in the seasonal open-water extent and increased intermittency of streamflow exiting the marsh during the previous 2 decades.
The annual maximum of total open-water extent (TOWE) within Klamath Marsh was quantified using Landsat imagery for water years (WYs) 1985–2021. Mean TOWE declined by 50 percent during the latter half of the study period (WYs 2003–21) compared to the first half. The change in surface area of TOWE is nearly entirely offset by a corresponding and opposite change in the area of dry land. Statistically significant declines in TOWE were identified for three periods of analysis: WYs 1985–2021, 1991–2021, and 2001–21. Statistically significant declines in groundwater level and streamflow into and out of the marsh were also identified during the period of decline in TOWE. Statistically significant correlations among the time series of TOWE, streamflow, and groundwater level were identified among most of the datasets, indicating a consistent response to the hydrologic changes in the study area.
The declines in TOWE, groundwater level, and streamflow could not be attributed to changes in precipitation. Only one streamgage had a statistically significant strong correlation with precipitation and no significant trends in precipitation were identified at the six climate stations in and around the study area. Declines in TOWE, groundwater level, and streamflow also could not be attributed to changes in anthropogenic water use, which has changed little since the late 1970s based on an evaluation of water-right permits on file with Oregon Water Resources Department.
Changes to the water budget of the marsh were attributed to two potential influences: increasing air temperatures and the reestablishment of forested land within the study area. Annual mean temperature at five of the six climate stations had statistically significant increasing trends during WYs 1991–2021; no significant trend in temperature was observed at the highest altitude site in the Cascade Range. Temperature records at the five lower-altitude climate stations increased at a mean rate of 0.9 degrees Fahrenheit per decade and had statistically significant inverse correlations with TOWE, streamflow, and groundwater level. The increase in annual mean air temperature likely has increased evaporative demand, affecting groundwater recharge and streamflow runoff, which is consistent with other recent studies in the western United States that have linked increasing temperatures with declining water availability. Similarly, the reestablishment of more than 55,000 acres of forested land during the past 30 years also has likely increased evapotranspiration, potentially reducing recharge, stream base flow, and contributing to the observed regional declines in groundwater levels.
The relations among trends in hydrology, climate, and water use in the upper Williamson River Basin indicate that the annual maximum extent of surface-water inundation in Klamath Marsh is the result of a dynamic balance between the regional groundwater level and surface-water inflow. The upper 100–200 feet of the subsurface material below the marsh is comprised of moderately to highly permeable deposits. The depth of the groundwater table beneath the marsh, therefore, controls the proportion of the annual springtime surface-water freshet that infiltrates the groundwater system. As groundwater level has declined, more of the springtime freshet infiltrates, resulting in decreased surface-water extent and diminished streamflow exiting the marsh.
References Cited
Aguilos, M., Sun, G., Noormets, A., Domec, J.-C., McNulty, S., Gavazzi, M., Prajapati, P., Minick, K.J., Mitra, B., and King, J., 2021, Ecosystem productivity and evapotranspiration are tightly coupled in loblolly pine (Pinus taeda L.) plantations along the Coastal Plain of the southeastern U.S.: Forests, v. 12, no. 8, article no. 1123, accessed April 26, 2024, at https://doi.org/10.3390/f12081123.
Cummings, M.L., and Conaway, J.S., 2009, Landscape and hydrologic response in the Williamson River Basin following the Holocene eruption of Mount Mazama, Cascade volcanic arc, in O’Connor, J.E., Dorsey, R.J., and Madin, I.P., eds., Volcanoes to vineyards—Geologic field trips through the dynamic landscape of the Pacific Northwest: Geological Society of America Field Guide 15, p. 271–294. [Also available at https://doi.org/10.1130/2009.fld015(14).]
Delzon, S., and Loustau, D., 2005, Age-related decline in stand water use—sap flow and transpiration in a pine forest chronosequence: Agricultural and Forest Meteorology, v. 129, nos. 3–4, p. 105–119, accessed April 26, 2024, at https://doi.org/10.1016/j.agrformet.2005.01.002.
Dewitz, J., and U.S. Geological Survey, 2021, National land cover database (NLCD) 2019 products (ver. 2.0, June 2021): U.S. Geological Survey data release, accessed February 10, 2021, at https://doi.org/10.5066/P9KZCM54.
Domec, J.-C., Sun, G., Noormets, A., Gavazzi, M.J., Treasure, E.A., Cohen, E., Swenson, J.J., McNulty, S.G., and King, J.S., 2012, A comparison of three methods to estimate evapotranspiration in two contrasting loblolly pine plantations—Age-related changes in water use and drought sensitivity of evapotranspiration components: Forest Science, v. 58, no. 5, p. 497–512, accessed April 26, 2024, at https://doi.org/10.5849/forsci.11-051.
Donnelly, J.P., King, S.L., Silverman, N.L., Collins, D.P., Carrera‐Gonzalez, E.M., Lafón‐Terrazas, A., and Moore, J.N., 2020, Climate and human water use diminish wetland networks supporting continental waterbird migration: Global Change Biology, v. 26, no. 4, p. 2042–2059, accessed May 18, 2023, at https://doi.org/10.1111/gcb.15010.
Gannett, M.W., Lite, K.E. Jr., La Marche, J.L., Fisher, B.J., and Polette, D.J., 2007, Ground-water hydrology of the upper Klamath Basin, Oregon and California: U.S. Geological Survey Scientific Investigations Report 2007–5050, 84 p., accessed November 10, 2021, at https://doi.org/10.3133/sir20075050.
Gannett, M.W., Wagner, B.J., and Lite, K.E., Jr., 2012, Groundwater simulation and management models for the upper Klamath Basin, Oregon and California: U.S. Geological Survey Scientific Investigations Report 2012–5062, 92 p., accessed November 10, 2021, at https://doi.org/10.3133/sir20125062.
Gramfort, A., 2015, lowess.py—Lowess function for nonparametric regression: GitHub Gist website, accessed October 20, 2022, at https://gist.github.com/agramfort/850437.
Haig, S.M., Murphy, S.P., Matthews, J.H., Arismendi, I., and Safeeq, M., 2019, Climate-altered wetlands challenge waterbird use and migratory connectivity in arid landscapes: Scientific Reports, v. 9, no. 1, p. 1–10, accessed May 11, 2023, at https://doi.org/10.1038/s41598-019-41135-y.
Hall, D.K., Kimball, J.S., Larson, R., DiGirolamo, N.E., Casey, K.A., and Hulley, G., 2023, Intensified warming and aridity accelerate terminal lake desiccation in the Great Basin of the Western United States: Hoboken, New Jersey, Earth and Space Science, v. 10, no. 1, p. 1–20, accessed May 11, 2023, at https://doi.org/10.1029/2022EA002630.
Irvine, J., Law, B.E., Kurpius, M.R., Anthoni, P.M., Moore, D., and Schwarz, P.A., 2004, Age-related changes in ecosystem structure and function and effects on water and carbon exchange in ponderosa pine: Tree Physiology, v. 24, no. 7, p. 753–763, accessed April 26, 2024, at https://doi.org/10.1093/treephys/24.7.753.
Jassal, R.S., Black, T.A., Spittlehouse, D.L., Brümmer, C., and Nesic, Z., 2009, Evapotranspiration and water use efficiency in different-aged Pacific Northwest Douglas-fir stands: Agricultural and Forest Meteorology, v. 149, nos. 6–7, p. 1168–1178, accessed April 26, 2024, at https://doi.org/10.1016/j.agrformet.2009.02.004.
Jones, J.W., 2015, Efficient wetland surface water detection and monitoring via Landsat—Comparison with in situ data from the Everglades Depth Estimation Network: Remote Sensing (Basel), v. 7, no. 9, p. 12503–12538, accessed August 12, 2021, at https://doi.org/10.3390/rs70912503.
Jones, J.W., 2019, Improved automated detection of subpixel-scale inundation—Revised dynamic surface water extent (DSWE) partial surface water tests: Remote Sensing, v. 11, no. 4, p. 1–26, accessed August 12, 2021, at https://doi.org/10.3390/rs11040374.
Kennedy, J.J., 2023, Klamath Marsh January through June maximum surface water extent, 1985–2021: U.S. Geological Survey data release, accessed March 21, 2023, at https://doi.org/10.5066/P9RC7RJM.
Klamath Tribes, 2018, Our history: The Klamath Tribes web page, accessed November 10, 2021, at http://klamathtribes.org/history/.
La Marche, J.L., 1999, An assessment of the effects of Klamath Marsh on water rights above and below Klamath Marsh: Oregon Water Resources Department report prepared for the Klamath Alternative Dispute Resolution Hydrology Steering Committee and Klamath Dispute Resolution Participants, 21 p., accessed March 4, 2024, at https://ecos.fws.gov/ServCat/DownloadFile/101007?Reference=60675.
La Marche, J.L., 2004, Big Springs Creek near Klamath Marsh hydrologic field study: Oregon Water Resources Department report, 19 p., accessed March 4, 2024, at https://www.oregon.gov/owrd/WRDPublications1/BigSpringsCrNeKlamathMarchHydrologicFieldStudy.pdf.
Lawrimore, J.H., Ray, R., Applequist, S., Korzeniewski, B., and Menne, M.J., 2016, Global summary of the month (GSOM), version 1: National Oceanic and Atmospheric Administration, National Centers for Environmental Information, accessed January 14, 2023, at https://doi.org/10.7289/V5QV3JJ5.
Mayer, T.D., and Naman, S.W., 2011, Streamflow response to climate as influenced by geology and elevation: Journal of the American Water Resources Association, v. 47, no. 4, p. 724–738, accessed November 10, 2021, at https://doi.org/10.1111/j.1752-1688.2011.00537. [Also available at https://doi.org/10.1111/j.1752-1688.2011.00537.x.]
Melady, J.M., 2002, Hydrogeologic investigation of the Klamath Marsh, Klamath County, Oregon: Portland, Oregon, Portland State University, M.S. thesis, 128 p., accessed November 10, 2021, at https://doi.org/10.15760/etd.753.
Mote, P.W., Li, S., Lettenmaier, D.P., Xiao, M., and Engel, R., 2018, Dramatic declines in snowpack in the western US: NPJ Climate and Atmospheric Science, v. 1, no. 1, p. 1–6, accessed November 13, 2023, at https://doi.org/10.1038/s41612-018-0012-1.
Multi-Resolution Land Cover Characteristics Consortium, 2024, National Land Cover Database: U.S. Geological Survey Earth Resources Observation and Science (EROS) Center, MRLC Project database, accessed April 26, 2024, at https://www.mrlc.gov/.
National Park Service, 2022, Crater Lake National Park—Trees: U.S. Department of Interior website, accessed May 15, 2023, at https://www.nps.gov/crla/learn/nature/trees.htm.
Oregon Water Resources Department, 2023b, Historical streamflow and lake level data: Oregon Water Resources Department website, accessed May 16, 2023, at https://apps.wrd.state.or.us/apps/sw/hydro_report/.
Oregon Water Resources Department, 2023a, Regulatory status, Watermaster District 17—Klamath Basin status: Oregon Water Resources Department website, accessed May 16, 2023, at https://apps.wrd.state.or.us/apps/misc/dsb_area_status/Default.aspx?wm_district=17.
Oregon Water Resources Department, 2023c, Water rights information search: Oregon Water Resources Department website, accessed April 19, 2023, at https://apps.wrd.state.or.us/apps/wr/wrinfo/.
Personius, S.F., compiler, 2016, Fault number 839b, Chemult graben fault system, Walker Rim section, in Quaternary fault and fold database of the United States: U.S. Geological Survey website, accessed July 28, 2022, at https://earthquakes.usgs.gov/hazards/qfaults. [Also available at https://earthquake.usgs.gov/cfusion/qfault/show_report_AB_archive.cfm?fault_id=839§ion_id=b]
PRISM Climate Group, 2022, Parameter-elevation regressions on independent slopes model (PRISM): Oregon State University website, accessed January 17, 2023, at https://prism.oregonstate.edu.
Rothacher, J., 1970, Increases in water yield following clear-cut logging in the Pacific Northwest: Water Resources Research, v. 6, no. 2, p. 653–658, accessed May 13, 2021, at https://andrewsforest.oregonstate.edu/sites/default/files/lter/pubs/pdf/pub391.pdf.
Soulard, C.E., Walker, J.J., and Petrakis, R.E., 2020, Implementation of a surface water extent model in Cambodia using cloud-based remote sensing: Remote Sensing, v. 12, no. 6, p. 1–19, accessed August 12, 2021, at https://doi.org/10.3390/rs12060984.
University of Montana Forest Industry Research Program, 2024, Timber harvest for Klamath County, Oregon: University of Montana Bureau of Business and Economic Research website, accessed April 26, 2024, at https://www.bber.umt.edu/FIR/HarvestT1.aspx?co=41035.
U.S. Drought Monitor, 2023, U.S. Drought Monitor: National Drought Mitigation Center, the U.S. Department of Agriculture, and the National Oceanic and Atmospheric Administration website, accessed April 4, 2023, at https://droughtmonitor.unl.edu/
U.S. Fish and Wildlife Service, 2007, Vegetation and land cover, Klamath Marsh National Wildlife Refuge, 2007: U.S. Fish and Wildlife Service, Pacific Southwest Region data release, accessed October 20, 2022, at https://www.sciencebase.gov/catalog/item/56902097e4b0e7a44bc923be.
U.S. Fish and Wildlife Service, 2010, Klamath Marsh Wildlife Refuge—Final comprehensive conservation plan and environmental assessment: U.S. Fish and Wildlife Service, Pacific Southwest Region, 162 p. plus appendixes, accessed October 20, 2022, at https://ecos.fws.gov/ServCat/DownloadFile/205147.
U.S. Fish and Wildlife Service, 2023, Klamath Marsh National Wildlife Refuge: U.S. Fish and Wildlife Service website, accessed June 22, 2023, at https://www.fws.gov/refuge/klamath-marsh/about-us.
U.S. Forest Service, 1998, Big Bill—the Williamson River Basin watershed analysis: Winema National Forest, Chiloquin and Chemult ranger districts, Oregon, accessed October 20, 2022, at https://www.fs.usda.gov/Internet/FSE_DOCUMENTS/stelprdb5319607.pdf.
U.S. Geological Survey, 2015, Landsat—Earth observation satellites (ver. 1.4, August 2022): U.S. Geological Survey Fact Sheet 2015–3081, 4 p., accessed August 2, 2023, at https://doi.org/10.3133/fs20153081.
U.S. Geological Survey, 2018, Landsat dynamic surface water extent (DSWE) algorithm description document (ADD), LSDS-1325 V1: U.S. Geological Survey, accessed August 2, 2023, at https://www.usgs.gov/landsat-missions/landsat-collection-1-level-3-dynamic-surface-water-extent-science-product.
U.S. Geological Survey, 2021, 3D Elevation Program 1/3 Arc-Second Digital Elevation Model: U.S. Geological Survey, The National Map Download website, accessed July 27, 2021, at https://apps.nationalmap.gov/downloader/
U.S. Geological Survey, 2022, Landsat Collection 2 Level-3 Dynamic Surface Water Extent science product: U.S. Geological Survey Fact Sheet 2022–3084, 2 p., accessed August 2, 2023, at https://doi.org/10.3133/fs20223084.
U.S. Geological Survey, 2023, USGS National Water Information System: U.S. Geological Survey web interface, accessed May 16, 2023, at https://doi.org/10.5066/F7P55KJN.
Walker, J.J., Petrakis, R.E., and Soulard, C.E., 2020, Implementation of a surface water extent model using cloud-based remote sensing—Code and maps: U.S. Geological Survey data release, accessed August 12, 2021, at https://doi.org/10.5066/P9LH9YYF.
Conversion Factors
U.S. customary units to International System of Units
Temperature in degrees Fahrenheit (°F) may be converted to degrees Celsius (°C) as follows:
°C = (°F – 32) / 1.8.
Datums
Vertical coordinate information is referenced to the North American Vertical Datum of 1988 (NAVD 88).
Horizontal coordinate information is referenced to the North American Datum of 1983 (NAD 83).
Altitude, as used in this report, refers to distance above the vertical datum.
Abbreviations
DEM
digital elevation model
DSWE
dynamic surface-water extent
ET
evapotranspiration
GEE
Google Earth Engine
KMNWR
Klamath Marsh National Wildlife Refuge
LOWESS
locally weighted scatterplot smoothing
MK
Mann-Kendall
MSWE
maximum surface-water extent
NAD 83
North American Datum of 1983
NAVD 88
North American Vertical Datum of 1988
NCEI
National Oceanic and Atmospheric Administration’s National Centers for Environmental Information
OWRD
Oregon Water Resources Department
POD
point of diversion
PRISM
Parameter-elevation Regressions on Independent Slopes Model
TOWE
total open-water extent
USFWS
U.S. Fish and Wildlife Service
USGS
U.S. Geological Survey
WRIS
Water Rights Information System
WY
water year
For information about the research in this report, contact the
Director, Oregon Water Science Center
U.S. Geological Survey
601 SW 2nd Avenue, Suite 1950
Portland, OR 97204
https://www.usgs.gov/centers/oregon-water-science-center
Manuscript approved on April 7, 2024
Publishing support provided by the U.S. Geological Survey
Science Publishing Network, Tacoma Publishing Service Center
Edited by Esther Pischel
Layout and design by Yanis Xavier Castillo
Illustration support by Yanis Xavier Castillo and JoJo Mangano
Disclaimers
Any use of trade, firm, or product names is for descriptive purposes only and does not imply endorsement by the U.S. Government.
Although this information product, for the most part, is in the public domain, it also may contain copyrighted materials as noted in the text. Permission to reproduce copyrighted items must be secured from the copyright owner.
Suggested Citation
Kennedy, J.J., Johnson, H.M., Gingerich, S.B., 2024, Assessment of long-term changes in surface-water extent within Klamath Marsh, south-central Oregon, 1985–2021: U.S. Geological Survey Scientific Investigations Report 2024–5033, 32 p., https://doi.org/10.3133/sir20245033.
ISSN: 2328-0328 (online)
Study Area
| Publication type | Report |
|---|---|
| Publication Subtype | USGS Numbered Series |
| Title | Assessment of long-term changes in surface-water extent within Klamath Marsh, south-central Oregon, 1985–2021 |
| Series title | Scientific Investigations Report |
| Series number | 2024-5033 |
| DOI | 10.3133/sir20245033 |
| Publication Date | July 30, 2024 |
| Year Published | 2024 |
| Language | English |
| Publisher | U.S. Geological Survey |
| Publisher location | Reston, VA |
| Contributing office(s) | Oregon Water Science Center |
| Description | Report: ix, 32 p.; Data Release |
| Country | United States |
| State | Oregon |
| Online Only (Y/N) | Y |