

Distribution of Ancient Carbon in Groundwater and Soil Gas from Degradation of Petroleum near the Red Hill Bulk Fuel Storage Facility, Oʻahu, Hawaiʻi
Links
- Document: Report (42.6 MB pdf) , HTML , XML
- Dataset: USGS National Water Information System database —USGS water data for the Nation
- Data Release: USGS data release - Groundwater and soil gas data, methods, and quality assurance information for samples collected to determine ancient carbon distributions at Red Hill Bulk Fuel Storage Facility, Oʻahu, Hawaiʻi, 2022–2023
- NGMDB Index Page: National Geologic Map Database Index Page (html)
- Download citation as: RIS | Dublin Core
Acknowledgments
Thanks to U.S. Navy staff for coordinating access to the site. Thanks to the AECOM groundwater sampling crews who allowed us to tag along and collect groundwater samples. Thanks to the Honolulu Board of Water Supply who allowed us to collect a sample at one of their wells (DH43) during their sampling of the well. Thanks to John (Jack) Kronen (AECOM) for field geology orientation. Thanks to Bojan Milinic and Colin Livdahl of the Upper Midwest Water Science Center who organized data and prepared figures for this report. Thanks to John Hoffmann and other staff of the Pacific Islands Water Science Center who provided administrative and technical assistance that supported successful completion of this study.
Abstract
The groundwater below the Red Hill Bulk Fuel Storage Facility (the facility) in O‘ahu, Hawai‘i, contains fuel compounds from past spills. This study used carbon-14 analyses to distinguish fuel-derived carbon from background carbon, along with other biodegradation indicators, to address two goals: (1) determine the extent and migration direction of groundwater affected by residual fuel below the facility and (2) determine if residual fuel locations in the subsurface could be identified by analyzing soil gas at the surface above the facility.
Groundwater from 19 wells was sampled between September 2022 and April 2023. Nonvolatile dissolved organic carbon (NVDOC) from a well presumed to be unaffected by past spills contained 38 percent ancient carbon indicating a natural source of ancient carbon in the subsurface. The NVDOC concentrations and ancient carbon percentages indicate fuel biodegradation products are likely present on the north and south of Red Hill with the greatest effects at well RHMW02 near the 2014 spill site. The NVDOC concentrations are almost three times higher than diesel range organic (DRO) concentrations in groundwater from the same sites. Major ion data indicate that iron reduction is an important biodegradation process.
Soil probe samples and soil carbon traps were used to determine the carbon-14 content of soil carbon dioxide. Ancient carbon from fuel biodegradation was not detected at any soil probe or carbon trap site in contrast to a 2017 study which reported ancient carbon detections. A reanalysis of the 2017 results using a range of local values for background carbon-14 indicates that ancient carbon from fuel biodegradation was probably only detected in lower tunnel exhaust system samples and not in any soil carbon trap samples. Measurements of carbon dioxide efflux with a dynamic closed chamber were highly variable. The soil gas results indicate that soil gas measurements at land surface were not useful for detecting residual fuel at the facility.
Introduction
This study used information related to the fate and transport of crude oil at a spill site in Minnesota to help clarify the fate of past fuel spills at the Red Hill Bulk Fuel Storage Facility (the facility) in O‘ahu, Hawai‘i (fig. 1). The facility has supported military operations in the Pacific since it was completed in 1943. It overlies the aquifer supplying water for the city of Honolulu and military housing. In November 2021, a fuel release at the facility resulted in residential water contamination of the Navy water system at Joint Base Pearl Harbor-Hickam, the Army’s Aliamanu Military Reservation, and Red Hill housing (Department of the Navy, 2022). Concern by the public and government agencies about the ongoing potential for contaminants from the facility to enter the water supply led to a decision to permanently shut down the facility in March 2022.
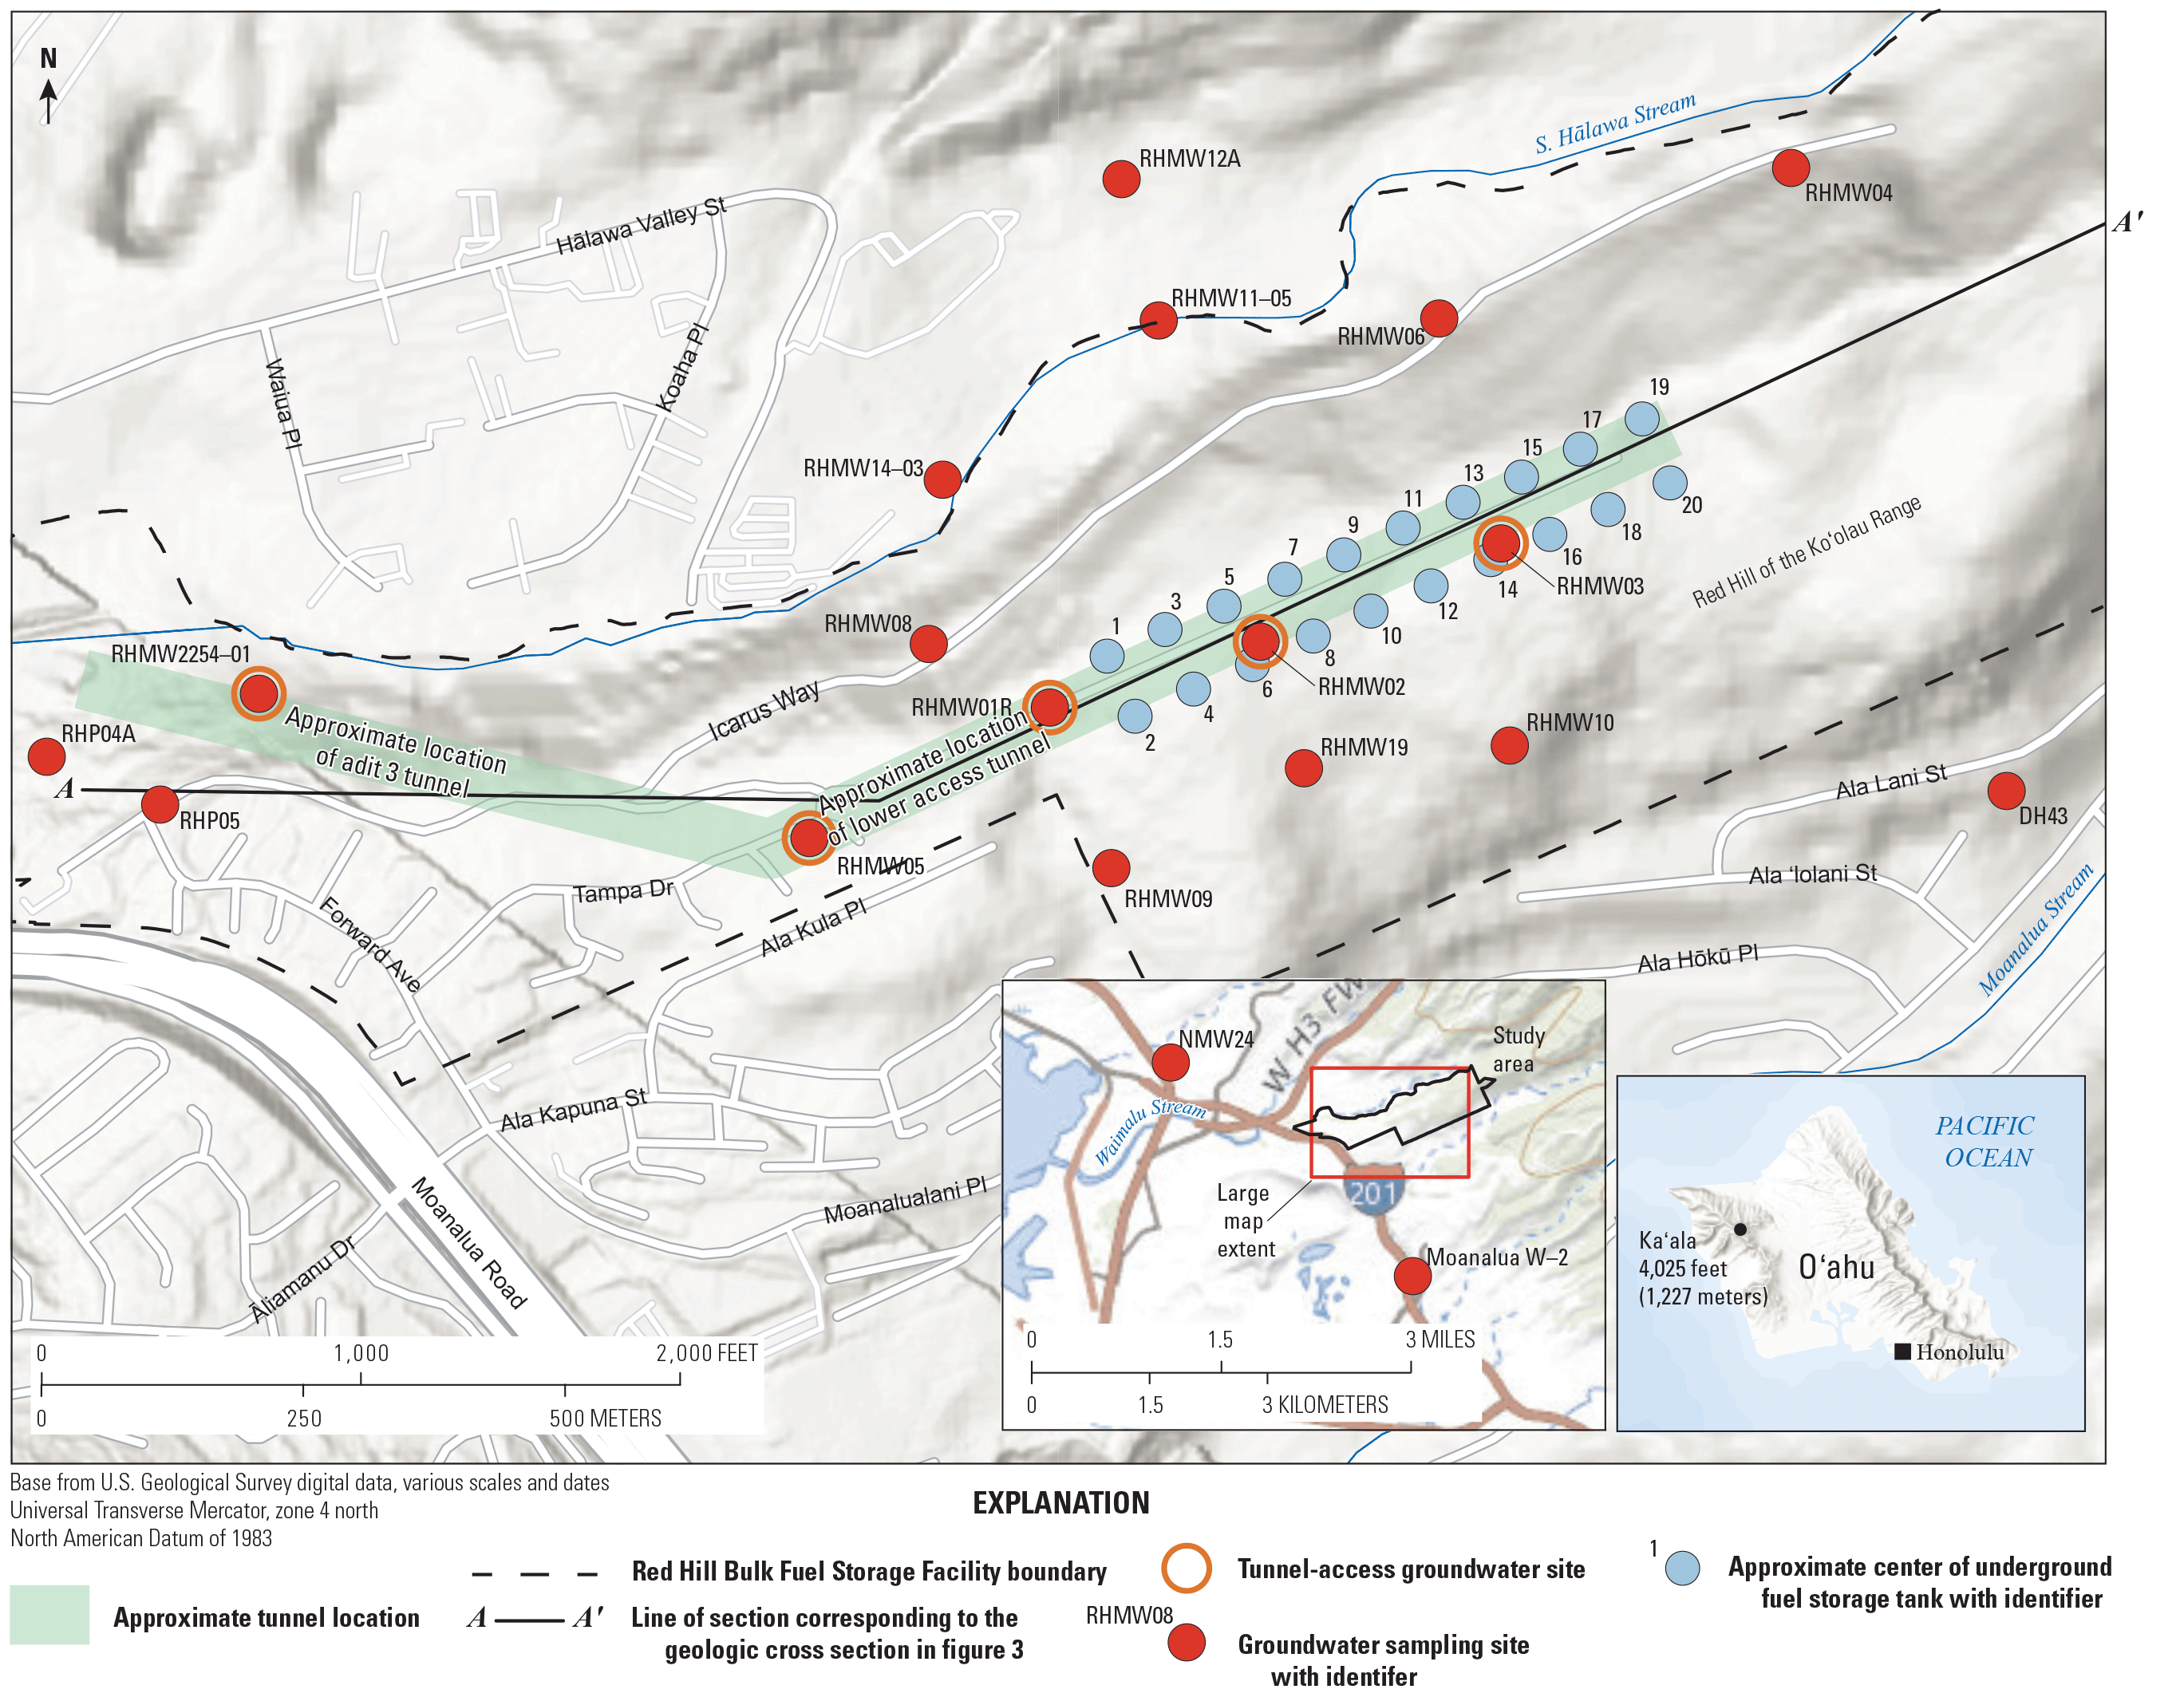
Features and groundwater sampling locations near the Red Hill Bulk Fuel Storage Facility, O‘ahu, Hawai‘i.
At the facility, varying amounts and types of fuel have been spilled during operations (AMEC Earth and Environmental, Inc., 2002). In addition to the November 2021 spill, there were releases in May 2021 and January 2014, and evidence of releases before 2014 exists below 16 of the 20 tanks at the facility (AMEC Earth and Environmental, Inc., 2002). Although the facility is closing and the Joint Task Force-Red Hill completed its defueling mission (by removing more than 104 million gallons of fuel via gravity and all accessible residual fuel as of March 28, 2024, [U.S. Indo-Pacific Command, 2024]), the presence of fuel from past spills in the unsaturated zone above the aquifer creates a need to understand the fate of any fuel from past spills still present in the subsurface. Investigating the fate of spilled fuel commonly has two main goals. The first is to identify the locations of source areas where spilled fuel is present in the subsurface. The second is to identify the migration direction of dissolved fuel compounds and degradation products in the groundwater.
Previous studies by the U.S. Geological Survey (USGS) of a crude oil spill site in Minnesota indicated that carbon dioxide (CO2) flux from biodegradation of the spilled oil is elevated at the land surface above the spilled oil (Sihota and others, 2011, 2016). The underlying crude oil source zone at that site is roughly delineated by the area of increased CO2 efflux at the surface (Sihota and others, 2011). The CO2 from biodegrading oil is ancient and depleted in radiocarbon (carbon-14 [14C]), in contrast to CO2 from natural soil respiration, which contains modern 14C near atmospheric levels (Wozney and others, 2021). At the facility, a small number of measurements made in 2017 indicated that ancient CO2 from biodegradation of underlying spilled fuel was present at the land surface above the facility (Department of the Navy, 2019; McHugh and others, 2020). The 2017 results raised the question of whether or not it might be possible to find unknown fuel spill locations at the facility by measuring CO2 flux and the 14C content of soil CO2 at the land surface; thus, one component of this study was to measure the 14C content of soil CO2 and CO2 effluxes at the facility to determine if they could help locate spilled fuel in the subsurface.
Understanding the direction of migration and biodegradation of contaminants in groundwater below the facility is complicated by the complex sequence of fractured lava flows, which make up the underlying basalt aquifer. Moreover, in some parts of the facility, the depth of the water table is more than 400 feet (ft) below land surface, making monitoring wells expensive to install. As a result, the distances between monitoring wells range from 200 to 800 ft. A groundwater sampling approach was needed to maximize information from the existing well network. The difference in spilled product dates and fuel types over the history of the facility means that past spills have differing compositions and biodegradation states. These differences make the use of a single compound problematic for tracking the effect of the spills on groundwater moving away from the facility. Consequently, monitoring of the existing well network has focused on measuring total petroleum hydrocarbons in the diesel range (also referred to as “diesel range organics [DRO]”), total petroleum hydrocarbons in the oil range (also referred to as “oil-range organics”), and a suite of hydrocarbons.
Previous work by the USGS on the fate and transport of spilled crude oil has demonstrated that partial transformation products of the crude oil compounds form the largest mass fraction in the groundwater contaminant plume (Bekins and others, 2016; Podgorski and others, 2021). The total concentration of partial transformation products can be quantified by measuring the concentrations of nonvolatile dissolved organic carbon (NVDOC) in the groundwater. Results from crude oil studies indicate that concentrations of NVDOC are 3−20 times higher than DRO measured in the same wells (Bekins and others, 2016, 20204). The relatively high concentrations of NVDOC make NVDOC a useful tracer for mapping the migration of compounds from the crude-oil source zone. Thus, a second component of this study was to determine if concentrations and 14C contents of groundwater NVDOC could be used to better understand the migration direction and biodegradation potential of compounds migrating from the fuel source zones.
Background—Application of Carbon-14 to Petroleum Spills
Carbon-14 is a general tracer that can be used to identify petroleum-derived carbon (C) in groundwater and in soil CO2. Carbon-14 is a radioactive isotope of C that is formed in the atmosphere and has a half-life of about 5,700 years (Woods Hole Oceanographic Institution, National Ocean Sciences Accelerator Mass Spectrometry, 2023b). Radiocarbon is continually produced in the atmosphere by interactions between energetic neutrons created by cosmic radiation and atmospheric nitrogen (Suess, 1965). In the atmosphere, 14C combines with oxygen to form 14CO2, which is then fixed by plants and algae (Tans and others, 1979). When C exchange with the atmosphere ceases because of death or senescence of photosynthetic tissues, the 14C concentration of dead organic matter declines from radioactive decay as time elapses (Larsen and others, 2018). Given enough time (about 60,000 years), plant-derived C such as that detected in fossil fuels (petroleum and coal) can become “radiocarbon dead,” being entirely depleted in 14C (Graven and others, 2017).
In groundwater, plumes migrating away from petroleum fuel spills contain dissolved organic carbon (DOC) in the form of dissolved fuel compounds and partial transformation products of the fuel compounds originating in the fuel in addition to background DOC (Bekins and others, 2016). In the unsaturated zone or soil gas, plumes of CO2 from the biodegradation of petroleum fuel can exist near source areas along with CO2 from background soil respiration (Sihota and others, 2011; Wozney and others, 2021). In groundwater DOC and soil CO2, the 14C content of samples decreases as the proportion of petroleum-derived C increases (Sihota and others, 2011; Wozney and others, 2021). Samples with no petroleum-derived C will typically reflect background 14C content.
The primary motivations for this study were to use measurements of (1) 14C in groundwater DOC, along with other biodegradation indicators, to track migration of petroleum-derived DOC away from the facility and (2) 14C in soil CO2 to identify locations at the facility where petroleum may be biodegrading in the subsurface (fig. 2).
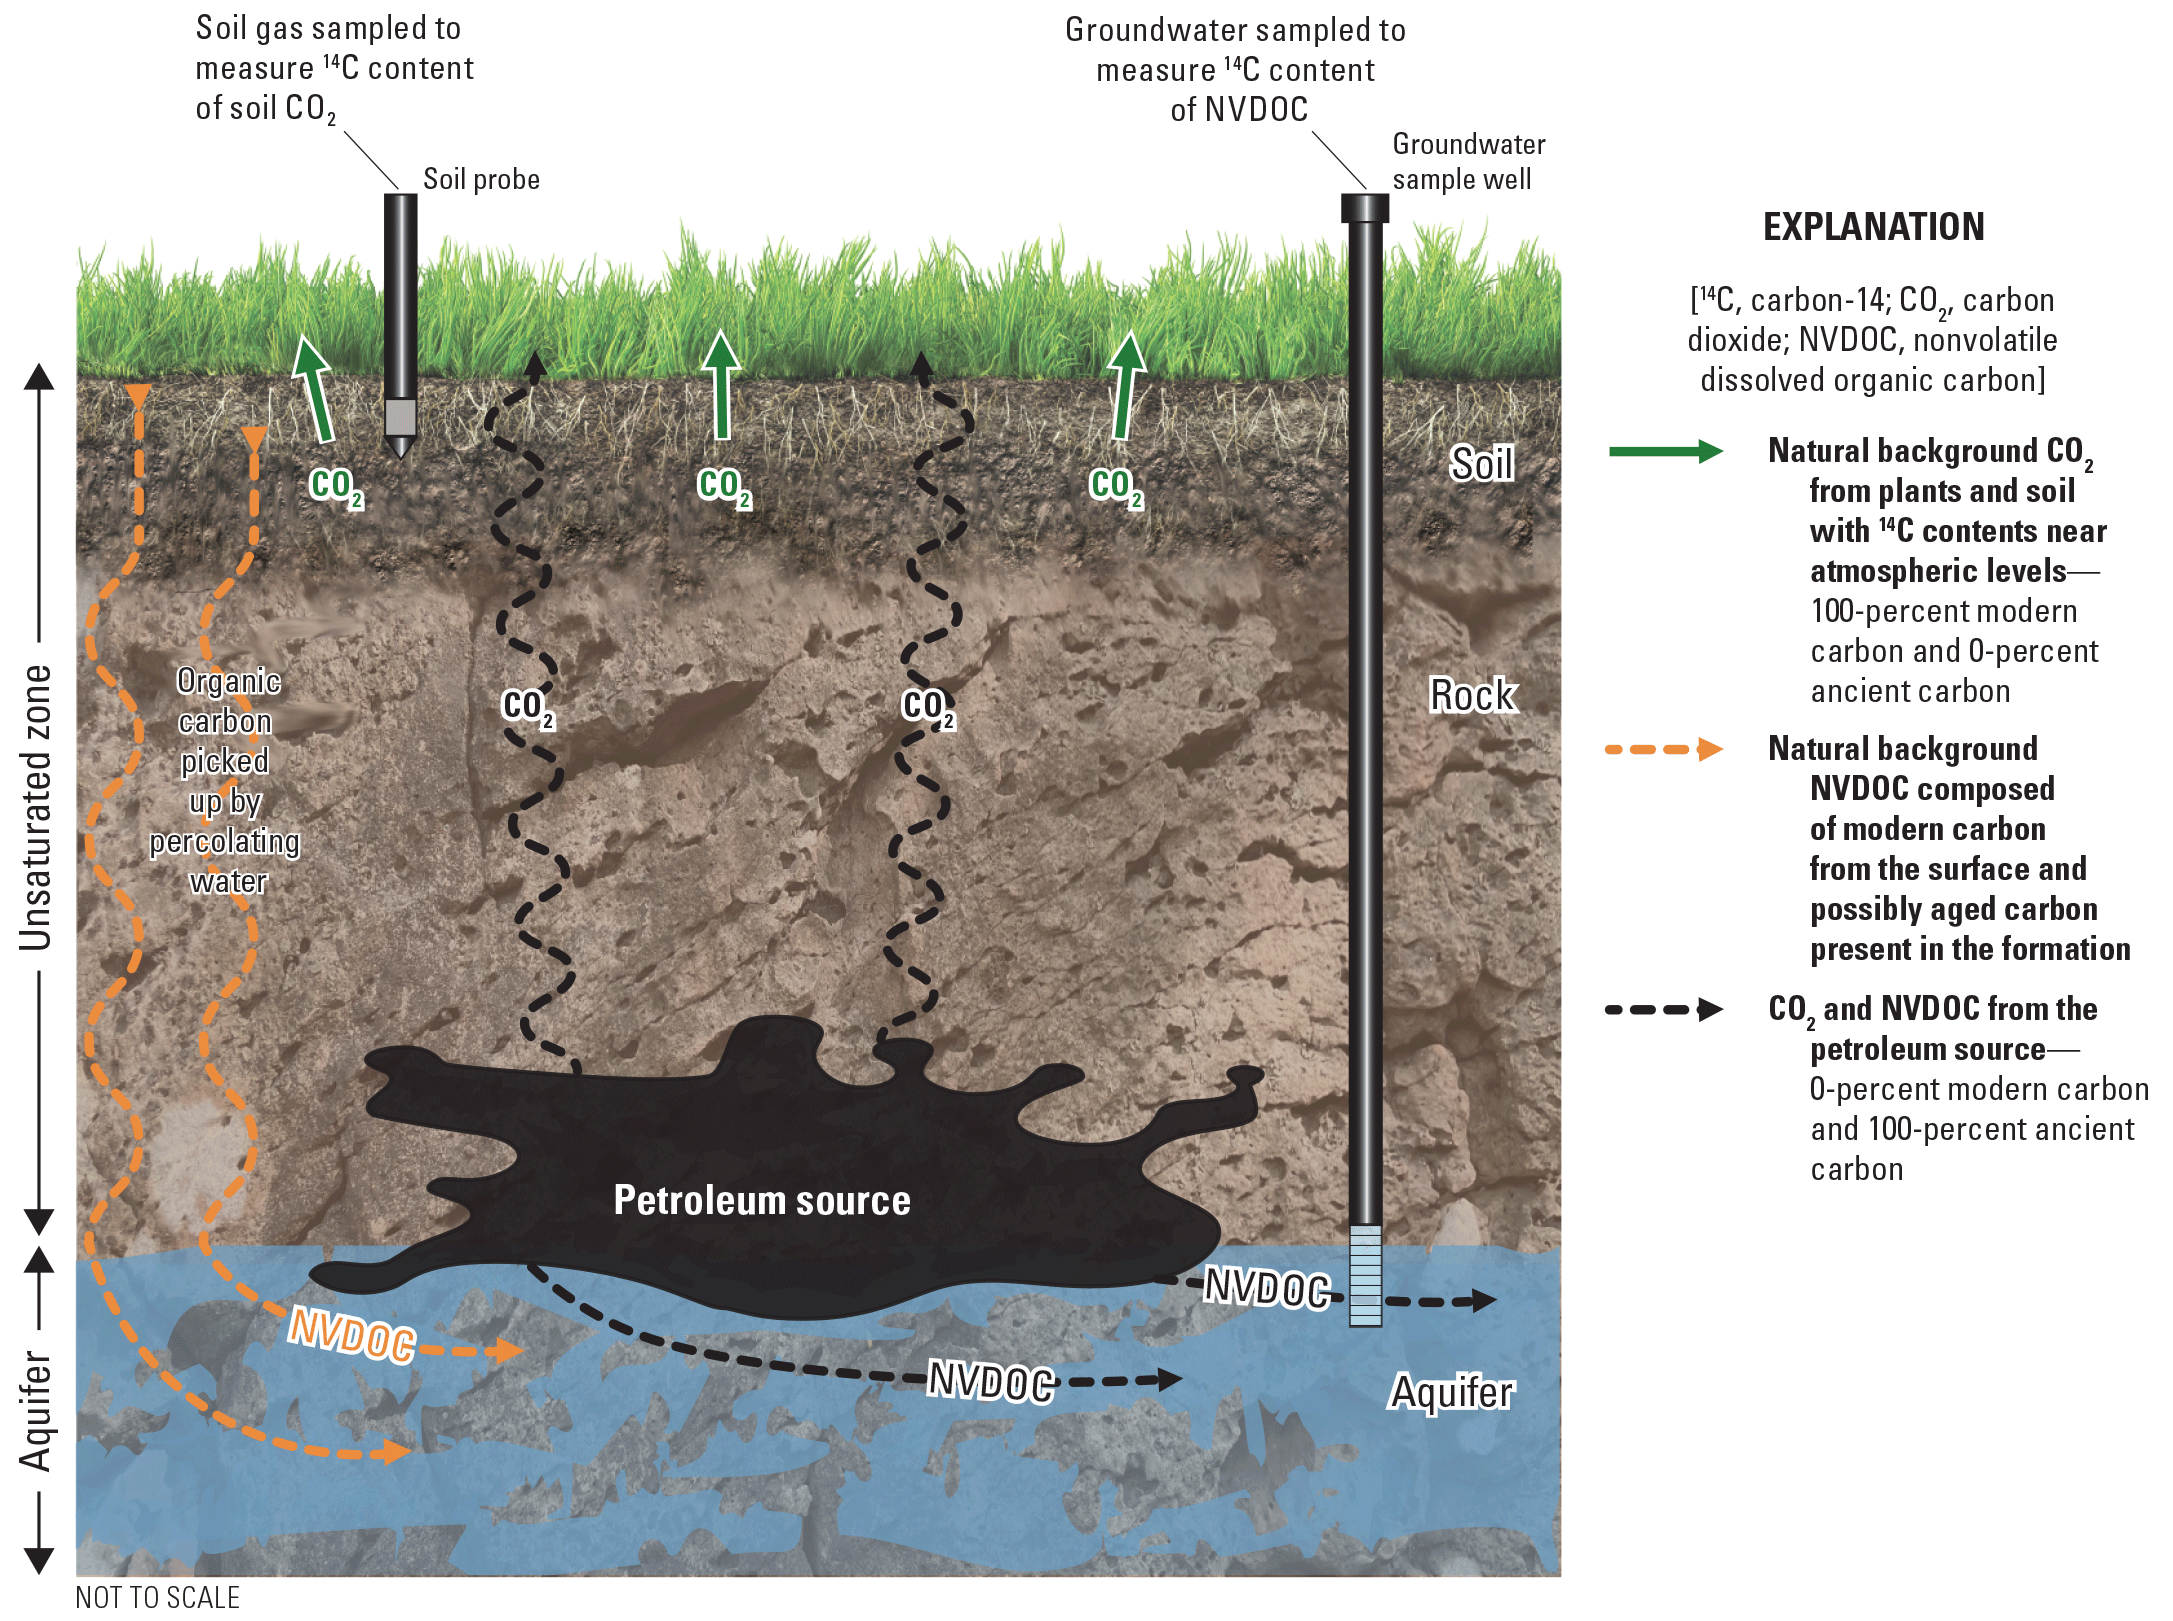
Conceptual approach for using carbon-14 to distinguish petroleum-derived carbon dioxide in soil gas and petroleum-derived nonvolatile dissolved organic carbon in groundwater from natural background sources. The carbon from petroleum is distinct from background carbon dioxide and nonvolatile dissolved organic carbon because petroleum-derived carbon is ancient and completely carbon-14 dead with 0-percent modern carbon and 100-percent ancient carbon.
Purpose and Scope
The purpose of this report is to present results and interpretation of groundwater and soil gas samples collected in and around the facility in O‘ahu, Hawai‘i. Samples were collected to understand the migration of petroleum-derived DOC in groundwater away from the facility and to identify locations at the facility where petroleum might be biodegrading in the subsurface.
Site Description
The study site is on the island of O‘ahu, Hawai‘i. The following sections describe the location and important features of the facility and the history of known spills. Short descriptions of the geology and hydrology are provided next and are followed by a description of existing groundwater concentration data used for comparison with the results from this study.
Facility
The facility occupies 144 acres along Red Hill on the southwest flank of the Ko‘olau Range (the eroded remnants of the Ko‘olau shield volcano) 2−3 miles east of Pearl Harbor. It is flanked by Moanalua Stream valley to the southeast and South Hālawa Stream valley to the northwest. The facility contains 20 fuel tanks arranged in 2 parallel rows 100−200 ft below the surface of Red Hill (fig. 1). The tanks were excavated into basalt rock in the early 1940s. Each tank is 245 ft high by 100 ft in diameter with a volume of 12.5 million gallons. The tanks are serviced by connecting upper, lower, and cross tunnels. The tunnel ventilation system maintains an air pressure that is lower than that in the surrounding basalt formation. As a result, some gas from the unsaturated zone flows into the tunnels (Department of the Navy, 2019). More detailed descriptions of the facility and its setting are given in other publicly available documents (Department of the Navy, 2019, 2023b).
Facility Spill History
This section summarizes evidence for fuel spills documented during past investigations at the facility. During 1998−2001, core samples were collected from slant borings below each of the 20 tanks (AMEC Earth and Environmental, Inc., 2002). The cores indicated hydrocarbon in the boreholes below 16 of the 20 tanks. Hydrocarbon presence, defined as a hydrocarbon odor and an elevated photoionization detector reading, was detected at tanks 1, 2, 3, 4, 5, 6, 7, 11, 12, 13, 14, 16, 17, 18, 19, and 20; a sheen was present at tanks 1 and 13; and product was detected at tanks 6 and 11 (AMEC Earth and Environmental, Inc., 2002). Angle borings at tanks 8, 9, 10, and 15 indicated no hydrocarbon presence. Fingerprinting of fluid samples collected from cores and boreholes indicated a mixture of middle distillate fuels of varying degrees of biodegradation ranging from relatively fresh to heavily biodegraded. Taken together, these results indicate that numerous fuel spills occurred at different times and locations at the facility before 2001.
The following summary of the 2014 fuel spill is based on the report from the Department of the Navy (2019). In January 2014, an estimated 27,000 gallons (gal) of Jet Propellant 8 were released during refilling of tank 5 (Department of the Navy, 2019). A Jet Propellant 8 seep was observed in the lower cross tunnel wall outside the lower part of tank 5. Soil vapor monitoring points below tank 5 and nearby tanks 3, 6, 7, 8, and 9 indicated increases in hydrocarbon vapor concentrations compared to measurements made the previous month in December 2013. Temporal variations in the hydrocarbon vapor levels below tank 5 indicate multiple migration pathways of Jet Propellant 8 from the release points on the sides of tank 5 to the tank bottom. No free product was observed in monitoring wells below the facility but exceedances of screening criteria for total petroleum hydrocarbons and (or) naphthalene were detected in the wells before and after the release.
The following summary of the 2021 fuel spill is from the Department of the Navy (2022). On May 6, 2021, an estimated 20,957 gal of Jet Propellant 5 were spilled from two piping joint ruptures near tanks 18 and 20. In the immediate aftermath of the spill, an estimated 1,580 gal were recovered. Most of the remainder flowed to a sump and was pumped automatically into the fire suppression system’s aqueous film forming foam recovery pipelines. The recovered fuel flowed to a low point in the aqueous film forming foam recovery pipeline far down the facility’s lower tunnel in the area overlying Red Hill Shaft (refer to well RHMW2254–01 in fig. 1). The fuel remained there undetected for more than 6 months until November 20, 2021, when an equipment operator accidentally struck and broke an overhead valve. Consequently, the nearly 19,000 gal of fuel that had been stored in the aqueous film forming foam pipeline since May 6 spilled from the break and flowed downhill along the tunnel floor. A detailed accounting of the fuel recovered since the May 6 and November 20 spills estimates that 5,542 gal of Jet Propellant 5 were not recovered and might have entered the formation below the tunnels. The pathways of migration from the tunnel to the formation were a sump, openings in drainpipes below the floor of the tunnel that were connected to the sump, and various cracks, holes, and penetrations in the tunnel floor. The spilled fuel migrated downward through the basalt rocks to the water infiltration tunnel for Red Hill Shaft roughly 80 ft vertically below the tunnel. The time required for the spill to reach the well is unknown but can be bracketed by two events: the first report of tainted water by a resident was on November 27, and observation of a fuel sheen on the water and stain on the wall in the Red Hill Shaft was on December 2. These two events give an upper estimate of 7–12 days migration time through the 80-ft thickness of basalt between the tunnel and the well.
Geology
Most of the facility is underlain by the Ko‘olau Basalt, which ranges in age from 2 to 3 million years (Ozawa and others, 2005). The far western edge of the facility lies on tuff cone deposits of the rejuvenated Honolulu Volcanics. Highly weathered basalt known as saprolite is present in the top 25–50 ft below Red Hill (fig. 3). The basalt rocks consist of individual lava flow layers containing ‘a‘ā flows with clinker zones and commonly massive flow cores and pāhoehoe flows. Interflow voids, joints, and lava tubes associated with pāhoehoe flows contribute to the overall permeability of the volcanic aquifer (fig. 3, fig. 4). Based on observations from outcrops near the facility, the average dip azimuth and dip angle of the lava flows were 246 degrees (Department of the Navy, 2023a) and 2.9 degrees, respectively (Department of the Navy, 2019). The adjacent South Hālawa and Moanalua Stream valleys are underlain by alluvial valley-fill deposits and variably weathered basalt, including saprolite. Measurements of outcrops in South Hālawa, Moanalua, and Waimalu Stream valleys quantified the proportion of clinker to total ‘a‘ā as 15–45 percent (Wentworth and Macdonald, 1953). Rocky outcrops on Red Hill contain numerous vertical fractures that may provide vertical flow connections across otherwise low permeability ‘a‘ā flow cores (fig. 4; Beckett and others, 2022). Extensive vertical connectivity may also be inferred from the rapid transport that occurred from the tunnel floor of adit 3 to the water table about 80 ft below after the November 2021 fuel spill.
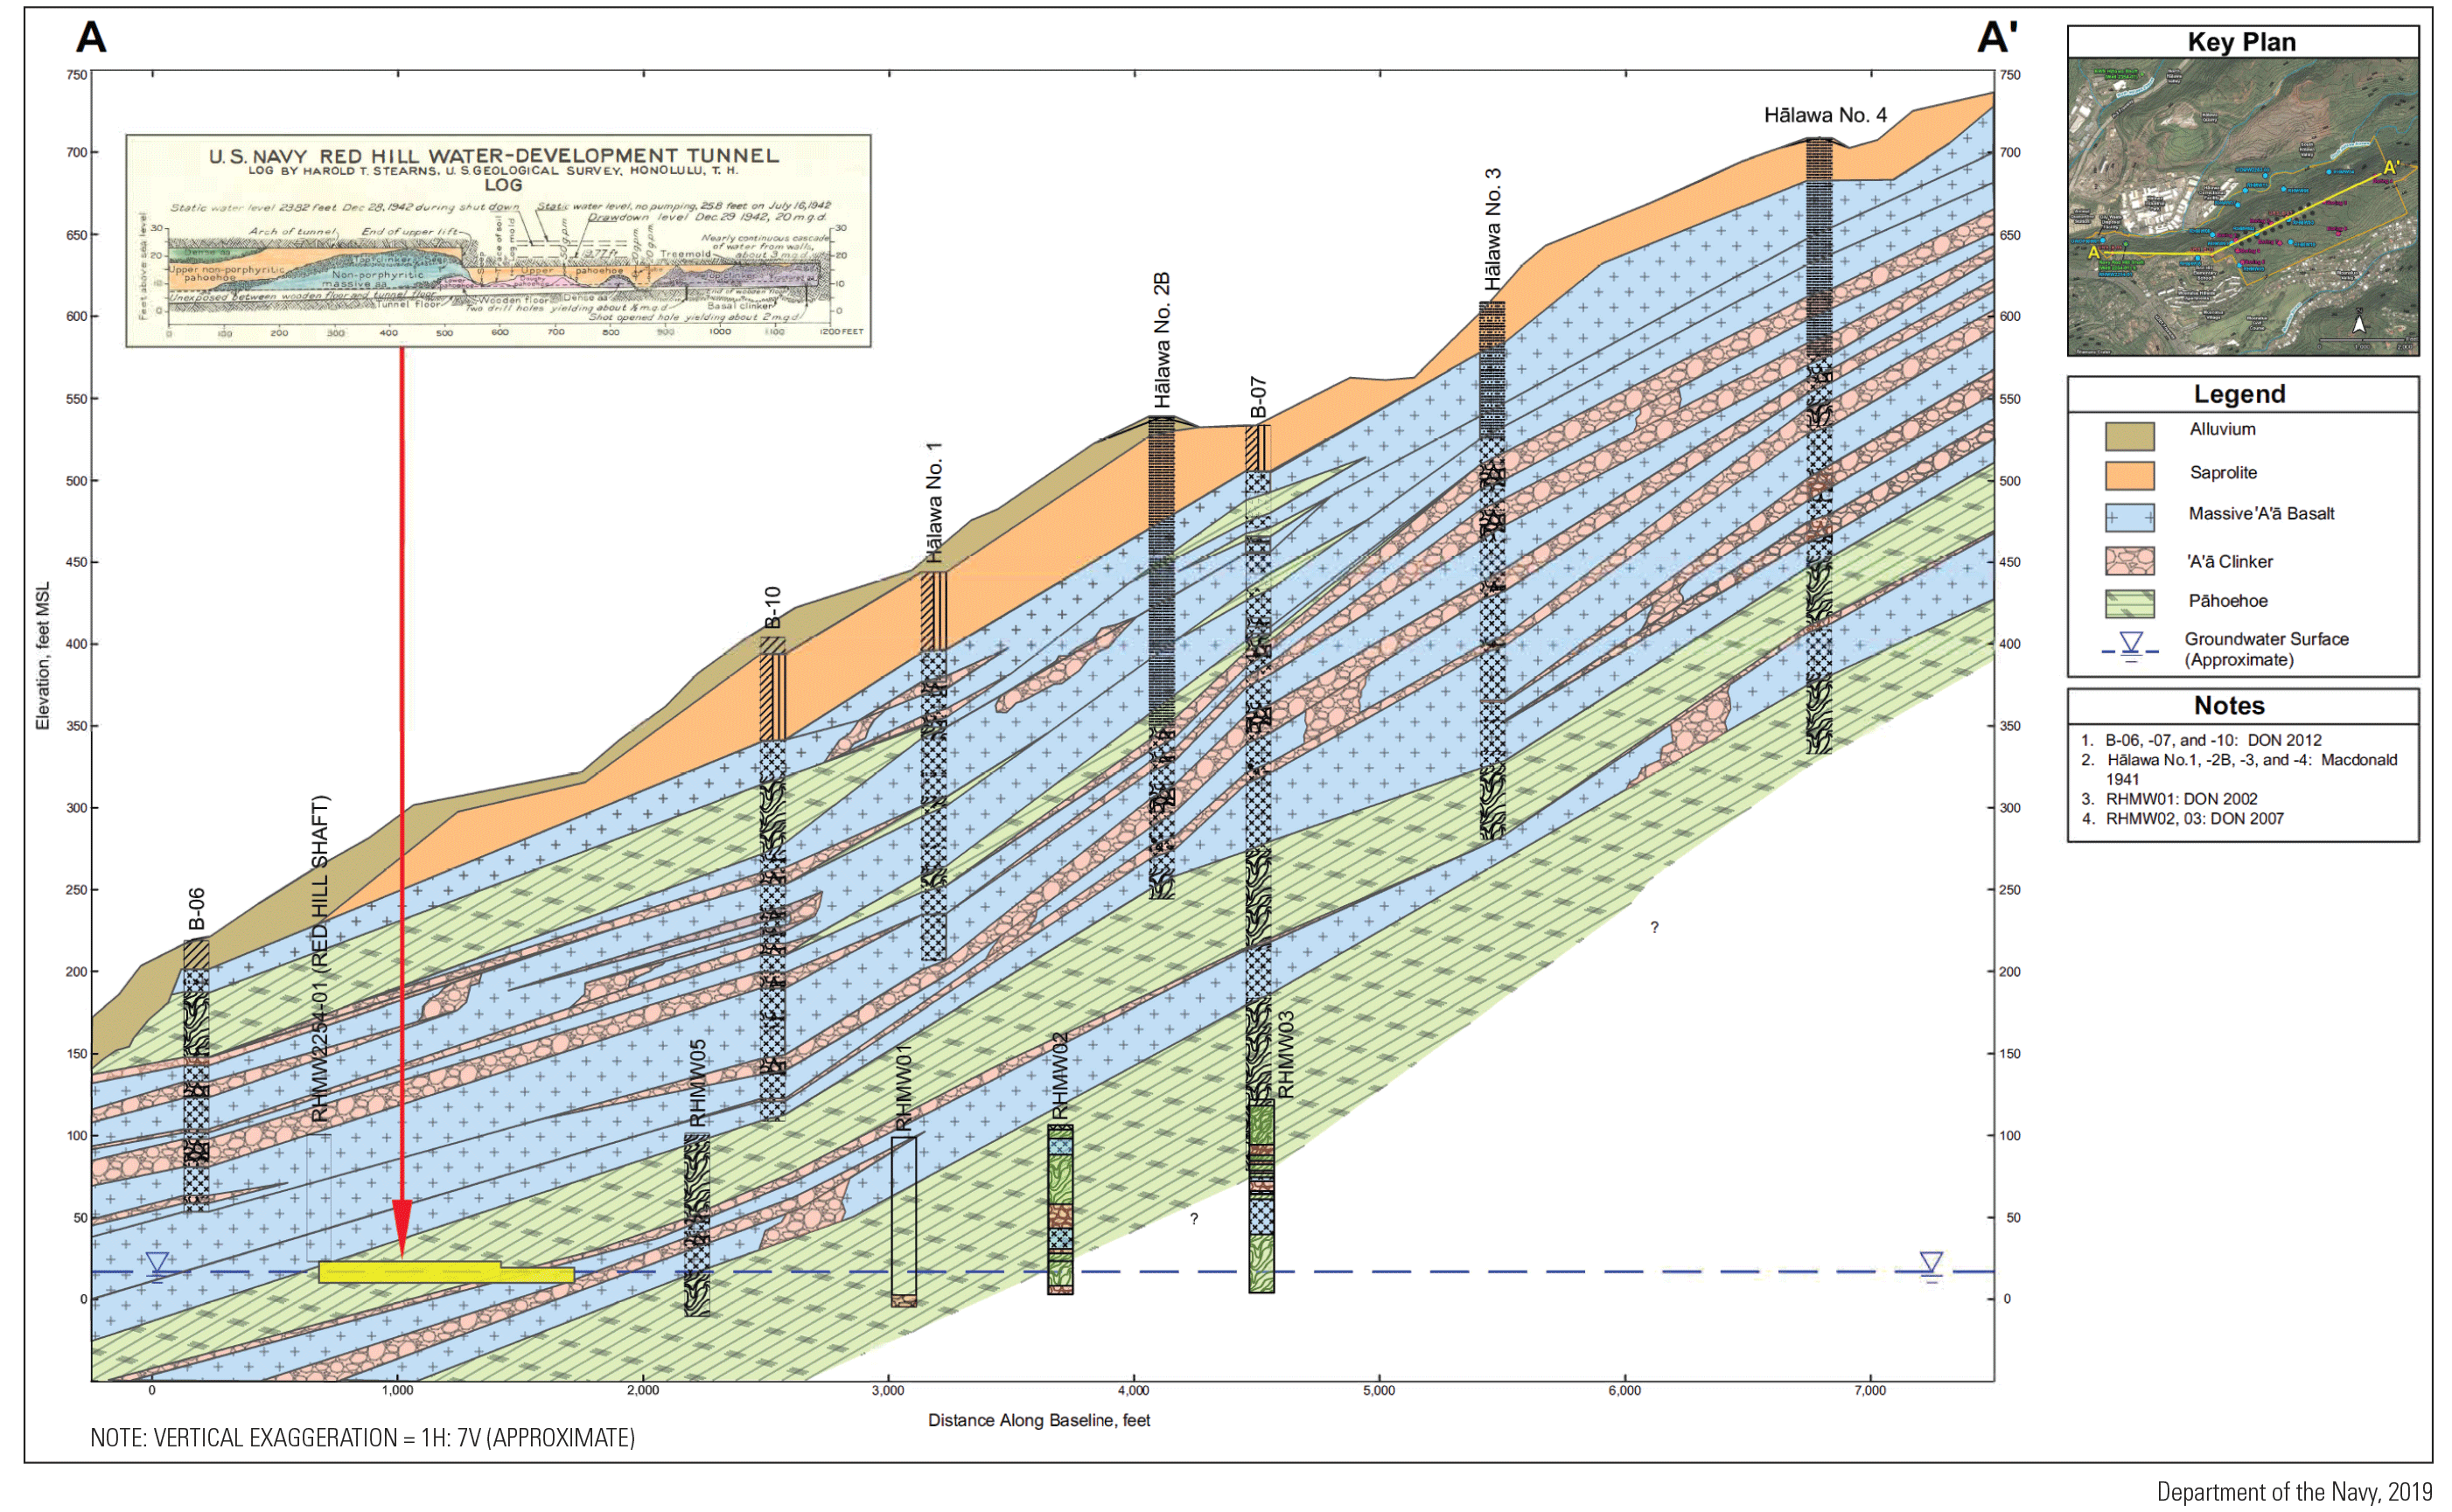
Geology at the Red Hill Bulk Fuel Storage Facility, O‘ahu, Hawai‘i (unmodified from fig. 5.2 of Department of the Navy [2019]).
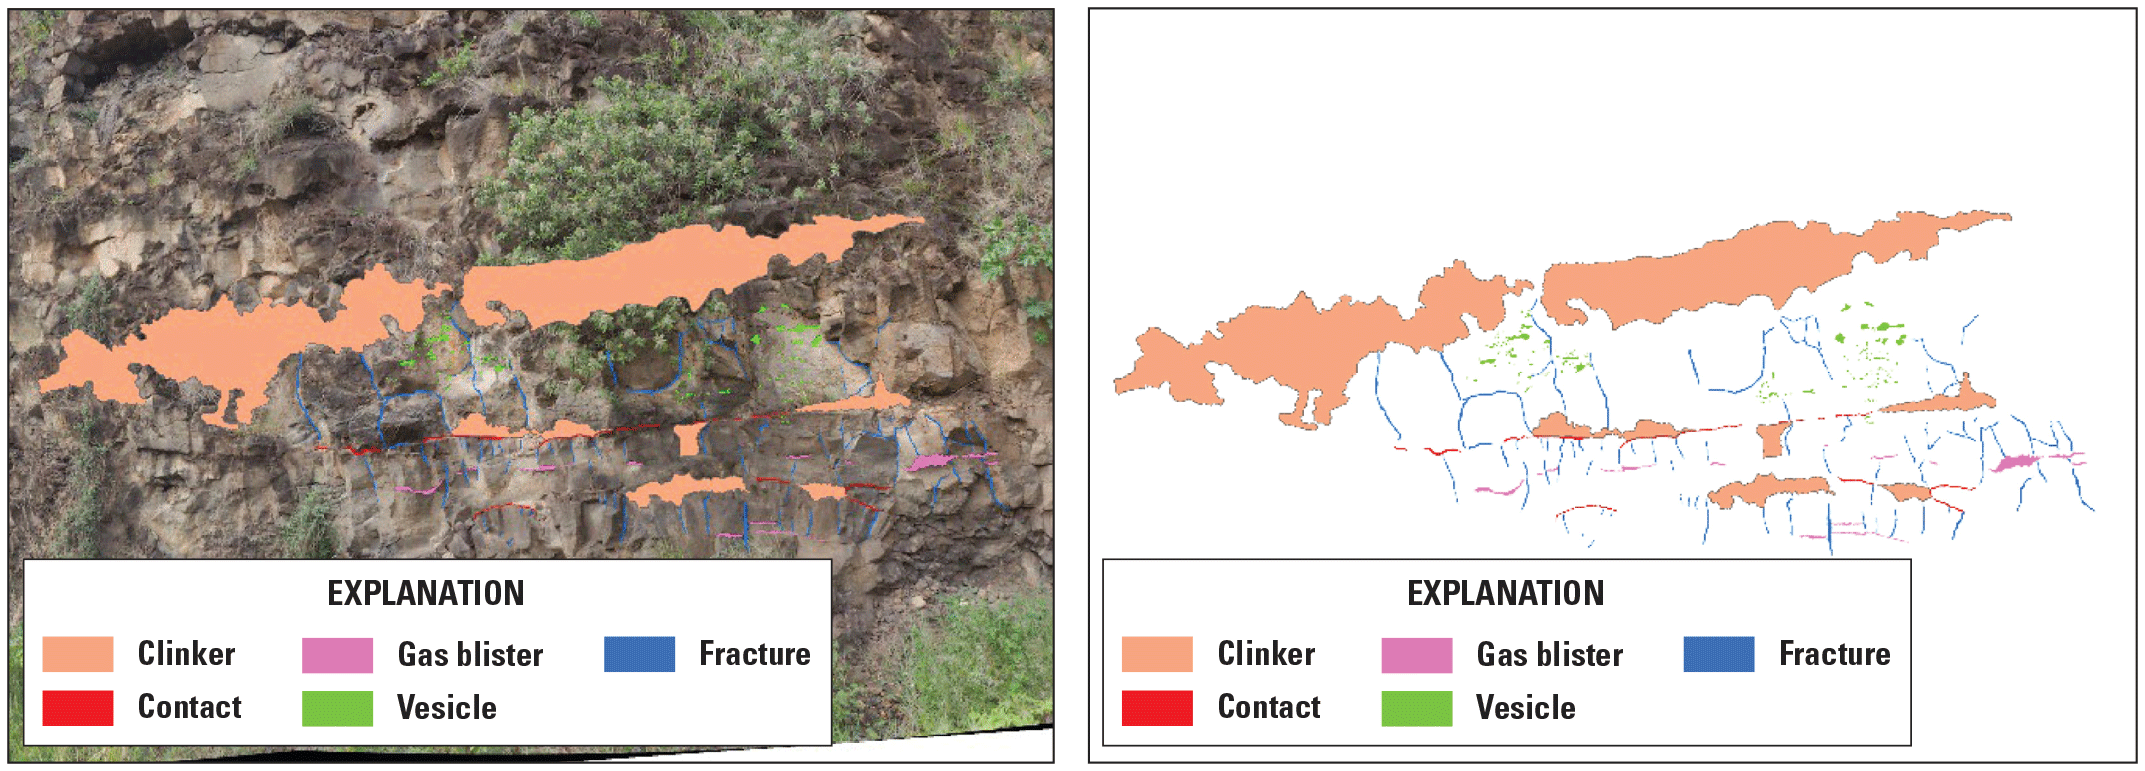
An outcrop of clinker and ‘a‘ā core sequencing, with interpreted void characteristics shown (left) overlaying a photograph of the rock outcrop and (right) without the photograph (unmodified from Beckett and others [2022]; used with permission).
Groundwater in the uncontaminated basalt aquifers of O‘ahu is relatively low in DOC with concentrations of 0.19–0.27 milligram per liter (mg/L; Chapelle and others, 2013). For reference, a literature review of uncontaminated aquifer DOC values indicated a range for other sites of 0.1–4 mg/L (Regan and others, 2017). The DOC in uncontaminated groundwater samples from O‘ahu seems to have low to no bioavailability based on the high dissolved oxygen concentrations and lack of correlation between DOC and dissolved oxygen (Chapelle and others, 2013). The Ko‘olau Basalt contains organic C in paleosol layers between lava flows (Wentworth and Macdonald, 1953) that is 14C dead (Doell and Dalrymple, 1973). Addition of DOC from the paleosol layers will create a DOC pool in groundwater that is older than modern age. Paleosols may also contain pyrogenic C because lava flows engulf and burn plant matter under low oxygen conditions as they advance through forested areas (Wentworth and Macdonald, 1953).
Hydrology
The Red Hill area is part of the southern O‘ahu groundwater flow system (Hunt, 2004). Groundwater movement is controlled by the hydraulic properties of the rocks and the spatial distribution of recharge on the Ko‘olau Range, where rainfall averages as much as 276 inches per year (Giambelluca and others, 2013). Water levels in the aquifer below Red Hill are 17–20 ft above mean sea level (Nakama and others, 2022). The unsaturated zone thickness is 400–500 ft, including about 100 ft below the base of the tanks and lower tunnel. Groundwater flowing into the area is supplemented by an estimated recharge of 10–20 inches per year within the facility (Engott and others, 2017). In locations where residual fuel from past spills is present in the unsaturated zone, recharge from infiltration of rainfall provides a mechanism for transporting dissolved hydrocarbons and hydrocarbon transformation products from the unsaturated zone to the underlying aquifer. For example, infiltrating rainwater has been documented between the steel tank liners and the concrete walls (Department of the Navy, 2019). Apparent recharge dates for groundwater in four wells with age dates nearest the facility ranged from 1950s to 1980s (Hunt, 2004), indicating a travel time of 20–50 years.
Existing Groundwater Concentration Data
Concentrations measured in water samples from wells near the facility between 2016 and 2023 are available online at the Joint Base Pearl Harbor-Hickam Safe Waters website (https://jbphh-safewaters.org/; accessed January 18, 2024). A compilation of detections of DRO for the sampled wells is listed in table 1. The number of analyzed samples and frequency of DRO detections is listed for each well by year. The highest frequency of detections was at RHMW02 where DRO was always detected. The next highest frequencies were at RHMW01R and RHMW03 at 99 and 93 percent, respectively. The lowest number of detections was at RHP05 and RHMW10 at 5 and 8 percent, respectively. Zemo and Foote (2003) previously noted that natural organic matter can contribute to elevated values of DRO. In this report, we use additional data and provide strategies to comment on the likelihood that the DRO detections came from fuel at the facility.
Table 1.
Summary of diesel range organics results from groundwater samples collected for the Department of the Navy or the Honolulu Board of Water Supply at sites near the Red Hill Bulk Fuel Storage Facility, O‘ahu, Hawai‘i.[n, number of results reported; f, frequency of detection; a, denotes data source is Department of the Navy (2024); --, not applicable; b, denotes data source is Honolulu Board of Water Supply (2024)]
Methods of Study
This section describes the sampling design and field and laboratory methods used in this study. Methods for 14C analyses are described in appendix 1.
Groundwater
This section describes the methods used in the groundwater part of this study. The wells sampled and the sampling methods are described first and followed by a description of sample preservation methods and analytical procedures used in the field and laboratory to determine concentrations of constituents in the water.
Groundwater Sampling Design
In September 2022, January to February 2023, and April 2023, 19 groundwater sites were sampled. One well was presumed to be unaffected by spills at the facility (Moanalua W–2) and was classified as a background site (fig. 1 inset, table 2, table 3). The remaining 18 sites were on or near the facility and were sampled to understand the direction of migration of dissolved groundwater plumes from spills at the facility (fig. 2). Groundwater sites were sampled by USGS personnel with assistance from field crews from consultants for the Navy (AECOM) and Honolulu Board of Water Supply (INTERA). Wells selected for sampling were (1) evenly distributed spatially around the facility, (2) routinely visited by field sampling crews, and (3) ideally open near the water table (though some exceptions to this criterion were made).
Table 2.
Site information for groundwater sampling sites near the Red Hill Bulk Fuel Storage Facility, O‘ahu, Hawai‘i.[USGS, U.S. Geological Survey; HI, Hawai‘i; <, less than; PVC, polyvinyl chloride; --, not available]
Data from U.S. Geological Survey (2024). Database limitations preclude the use of Hawaiian diacritical marks in U.S. Geological Survey station names.
Table 3.
Summary of groundwater sampling at sites near the Red Hill Bulk Fuel Storage Facility, O‘ahu, Hawai‘i.[Y, yes; --, no]
Groundwater samples were analyzed for several constituents useful for distinguishing petroleum hydrocarbon groundwater plumes from unaffected groundwater. These include NVDOC (which is synonymous with DOC in this report), 14C content of NVDOC, DRO, alkalinity, pH, specific conductance, major ions, and trace metals. Dissolved iron (Fe), manganese (Mn), nitrate (NO3), sulfate (SO4), and methane are indicators of the redox state of the aquifer and useful for identifying locations where biological demand for electron acceptors is high.
Groundwater Field and Laboratory Methods
Groundwater field and laboratory methods are briefly described in this section. More detailed descriptions, especially for laboratory procedures, are available in Jaeschke and others (2023) and other references as cited.
Groundwater samples were collected with one of the following: a disposable bailer, a discrete interval sampler in a multilevel well (Westbay Instruments, Burnaby, British Columbia, Canada), or a pump (either a bladder pump or submersible pump; table 3). For all groundwater samples bailed in September 2022 and for wells RHMW01R, RHMW08, RHMW09, and NMW24 bailed in January and February 2023, samples were collected with disposable Teflon bailers that were 36 inches (in.) long by 1.5 in. in diameter. All other bailed 2023 samples were collected with disposable ridge and clear per- and polyfluoroalkyl substances free AquaClear polyvinyl chloride (PVC) bailers that were 36 in. long by 1.6 in. in diameter (Pine Environmental, Glen Burnie, Maryland, United States). Bailed samples were collected from the uppermost 3–5 ft of groundwater in each well (AECOM, written commun., August 3, 2023). Wells were not purged before sample collection with bailers. At each well, bailer sample retrieval continued until enough volume was acquired for the planned analyses by USGS and AECOM. During each bailer retrieval, the bailer was kept vertical and a clamp was installed on the outlet so sample water outflow could be controlled during sample container filling.
Wells RHMW14–03 and RHMW11–05 were sampled using a discrete interval sampling system (Westbay Instruments, Burnaby, British Columbia, Canada), which allows the collection of aqueous samples from multiple zones within a single borehole. The MOSDAX sampler probe contains a valve operable from the surface with a hydraulic winch, which controls the sampling operation. Four stainless steel 250-milliliter (mL) canisters (316/316L stainless steel) were linked in sequence to collect samples suspended below the probe at specified intervals (table 2, table 3). The canisters were deployed multiple times until enough sample volume was collected for the planned laboratory analyses by USGS and AECOM.
Bladder pumps were used to collect regular samples at wells RHMW12A, RHP05, and DH43. The pump intake for RHMW12A was set near the middle of the well’s open interval, or about 202 ft below the water level in this well. The pump intake for RHP05 was also set near the middle of its open interval, which is about 4 ft below the water level in this well. Information on the pump intake depth for DH43 was unavailable at the time this report was prepared. At wells RHWM12A and DH43, dedicated PVC bladder pumps (model P1101HM, QED Environmental Systems, Dexter, Michigan, United States) connected to high-density polyethylene (HDPE) skip-bonded tubing were used to collect samples. At well RHP05, a dedicated stainless steel bladder pump that was 18 in. long by 1.66 in. in diameter with a polytetrafluoroethylene bladder (Geotech Environmental Equipment, Inc., Denver, Colorado, United States) connected to Teflon-lined polyethylene skip-bonded tubing was used for sample collection (AECOM, written commun., August 3, 2023).
Bladder pumps were used to collect quality assurance samples for comparison with bailed samples at wells RHMW2254–01, RHMW02, and RHMW03. The pump intakes were set at about 6, 9, and 8 ft below the top of the water column at RHMW2254–01, RHMW02, and RHMW03, respectively (AECOM, written commun., August 3, 2023). At RHMW02 and RHMW03, dedicated PVC bladder pumps (model P1101M, QED Environmental Systems, Dexter, Mich.) with skip-bonded HDPE tubing were used to collect samples. At RHMW2254–01, a dedicated stainless steel bladder pump that was 36 in. long by 1.66 in. in diameter with a polyethylene bladder (Geotech Environmental Equipment, Inc., Denver, Colo.) connected to HDPE skip-bonded tubing was used for sample collection (AECOM, written commun., August 3, 2023).
In the field at most sites, groundwater levels, specific conductance, and pH were measured according to standard USGS procedures (Cunningham and Schalk, 2011; U.S. Geological Survey, 2023). Groundwater level tapes were calibrated with a National Institute of Standards and Technology certified reference steel tape. Meters used for measuring specific conductance and pH were checked or calibrated according to standard USGS procedures (U.S. Geological Survey, 2023) and described in more detail by Jaeschke and others (2023). Specific conductance measurements were made using an Orion Star A122 instrument (Thermo Fisher Scientific, Waltham, Massachusetts, United States) or a YSI 300 instrument (Yellow Springs Instruments, Yellow Springs, Ohio, United States). Field measurements of pH were made with an Orion Star A121 instrument (Thermo Fisher Scientific, Waltham, Mass.). Raw, unfiltered samples for methane and DRO analyses were collected into their final containers at each sampling site. Raw, unfiltered samples for all other analyses were collected into either baked 1- or 4-liter (L) amber glass bottles or 1- or 4-L HDPE bottles and immediately put on wet ice until they were processed in the laboratory.
The following is a brief description of methane sample collection and analysis based on a detailed description provided in Jaeschke and others (2023). The methods used in this study are modified from Baedecker and Cozzarelli (1992). Methane analyses were only completed for samples collected in September 2022. Raw, unfiltered groundwater samples were collected into baked clear glass 25-mL vials that contained about 20 milligrams of trisodium phosphate dodecahydrate, had been purged with nitrogen gas, were capped with butyl rubber stoppers, and were partially evacuated. The trisodium phosphate dodecahydrate is a preservative that inhibits microbial activity by increasing the pH of the sample. About 2–3 mL of the water samples were injected into each sample bottle using a closed-system syringe and needle as described in Baedecker and Cozzarelli (1992). Samples were placed on wet ice immediately after collection and then stored at 4 degrees Celsius (°C) until analysis at the USGS Reston Microbiology Laboratory in Reston, Virginia. Methane concentrations were determined with a headspace method on an HP 6890 thermal conductivity detector gas chromatograph with a GS GasPro column, flame ionization detector back injection, and front detector (Agilent Technologies, Inc., Santa Clara, California, United States; described in Jaeschke and others [2023]).
Samples for DRO analysis were collected into duplicate 1-L glass amber bottles provided by RTI Laboratories (Livonia, Mich.). Bottles were filled with raw, unfiltered, and unpreserved water samples. The samples were stored and shipped on wet ice as soon as possible after field collection to meet the 7-day holding time requirement. The samples were analyzed using a gas chromatograph flame ionization detector method according to U.S. Environmental Protection Agency (EPA) Validated Test Method 8015D (U.S. Environmental Protection Agency, 2003) for nonhalogenated volatile organic compounds and semivolatile organic compounds in unfiltered water.
Each day after field sampling, raw water samples in field bottles (baked 1- or 4-L amber glass bottles or 1- or 4-L HDPE bottles) were filtered, transferred into final storage containers, and preserved (in some cases) for shipment to analytical laboratories. Methane and DRO samples required no laboratory processing before shipment. Each sample was first filtered through a 0.45-micron capsule filter (Pall Corporation), then through a 0.22-micron Sterivex polyethersulfone filter (Millipore Sigma) and transferred into containers for shipment to analytical laboratories. Filters were conditioned before use by running 2 L of deionized water through them. Tubing used with the peristaltic pump for filtering was cleaned before use with a 0.1 percent Alconox detergent solution, rinsed with tap water, soaked for 30 minutes in 5 percent hydrochloric acid (HCl assay of 36.5–38.0 percent), rinsed in deionized water, and finally air dried. Clean tubing and conditioned filters were used for each sample.
A bottle set from each sample was shipped to the Reston Biogeochemical Processes in Groundwater Laboratory (RBPGL) in Reston, Va., on wet ice. Samples were stored at 4 °C at the laboratory until analyses were completed. The RBPGL analyzed samples for alkalinity, NVDOC, methane, fluoride (F), chloride (Cl), bromide (Br), NO3, phosphate (PO4), SO4, calcium (Ca), sodium (Na), magnesium (Mg), potassium (K), silicon (Si), strontium (Sr), aluminum (Al), Fe, Mn, boron (B), barium (Ba), lithium (Li), copper (Cu), zinc (Zn), beryllium (Be), vanadium (V), chromium (Cr), cobalt (Co), nickel (Ni), arsenic (As), selenium (Se), rubidium (Rb), molybdenum (Mo), silver (Ag), cadmium (Cd), antimony (Sb), lanthanum (La), cerium (Ce), thallium (Tl), lead (Pb), and uranium (U).
Samples for analysis of major cations including Ca, Na, Mg, K, Fe, Si, Sr, Al, Mn, B, Ba, Li, Cu, and Zn were stored in acid-washed leakproof HDPE 30-mL vials (Thermo Fisher Scientific, Waltham, Mass.). The vials were filled close to the top of the shoulder, then preserved with 67–70 percent Optima nitric acid (Fisher Scientific, Bothell, Washington, United States) to a pH of less than or equal to 2. Samples were analyzed on a Perkin Elmer Optima 4300DV inductively coupled plasma-optical emission spectrometer (ICP–OES, Perkin Elmer, Hopkinton, Mass.) following EPA Method 200.8 version 5.4 (U.S. Environmental Protection Agency, 1994). The reporting limits for the instrument were 0.05–50 mg/L (Li), 0.1–50 mg/L (Fe, Mn), 0.2–20 mg/L (B, Ba, Cu, Zn), 0.25–50 mg/L (Mg, K, Si, Sr, Al), and 0.5–200 mg/L (Ca, Na).
Concentrations of trace elements including Li, Be, Al, B, Ba, V, Cr, Co, Fe, Ni, As, Cu, Mn, Zn, Se, Rb, Sr, Mo, Ag, Cd, Sb, La, Ce, Tl, Pb, and U were measured from an aliquot of the cation vial and recorded in micrograms per liter using an Agilent 7900 inductively coupled plasma-mass spectrometer (ICP–MS, Perkin Elmer, Waltham, Mass.) following EPA Method 200.8 version 5.4 (U.S. Environmental Protection Agency, 1994). The reporting limits for the instrument were 0.50–200 micrograms per liter (μg/L; Li, Be, Cr, Co, Ni, Cu, As, Tl, Pb, U), 0.50–200 μg/L (Mo, Ag, Sb), 1.00–200 μg/L (Se, La), 2.0–200 μg/L (B, Mn, Fe, Zn, Rb, Sr, Ba, Ce), and 5.00–200 μg/L (Al, V).
Several cation analytes were measured on the ICP–OES and the ICP–MS. When concentrations of these analytes were greater than or equal to 500 µg/L, the ICP–OES results are reported in Jaeschke and others (2023) and in the USGS National Water Information System database (U.S. Geological Survey, 2024). When the analyte concentrations were less than 500 µg/L, the ICP–MS results are reported according to the laboratory’s reporting limits.
Samples for analysis of major anions including F, Cl, Br, NO3, PO4, and SO4 were filtered into leakproof HDPE 30-mL vials (Cole-Palmer North America Vernon Hills, Illinois, United States) that were sample rinsed and filled, leaving no headspace. The six major anions were measured using ion chromatography on a Thermo Dionex ICS 1000 (Thermo Fisher Scientific, Waltham, Mass.). The method used a carbonate/bicarbonate (HCO3) eluent coupled with suppressed conductivity detection to determine inorganic anion concentrations and met the performance requirements specified in EPA Method 300.1 (U.S. Environmental Protection Agency, 1997). The minimum detection limits of the instrument were 0.013 mg/L (Cl), 0.014 mg/L (Br), 0.023 mg/L (F), 0.031 mg/L (SO4), 0.033 mg/L (NO3), and 0.063 mg/L (PO4). The reporting limit ranges were 0.10–10 mg/L (F, PO4), 0.1–50.1 mg/L (Br, NO3), and 0.10–75.1 mg/L (Cl, SO4). Values detected between the minimum detection limit and reporting limit were reported as estimated values in Jaeschke and others (2023) and the USGS National Water Information System database (U.S. Geological Survey, 2024).
Alkalinity concentrations were measured on groundwater samples filtered into duplicate precleaned 40-mL clear EPA/volatile organic analysis 2000-class vials. The vials were sample rinsed, filled to the top with no headspace, and sealed with a polypropylene cap with a spectra seal polytetrafluoroethylene/silicone septa. Concentrations were recorded as milligrams of HCO3 per liter using an automatic titrator. Details of the field collection and analyses are described in the USGS Field Manual (Rounds and Wilde, 2012) with the modification for the normality of the acid used. Samples collected in September 2022 were titrated with 0.020N (normality) sulfuric acid (H2SO4), and samples collected in April 2023 were titrated with 0.200N H2SO4 following EPA Method 310.1 (U.S. Environmental Protection Agency, 1978). Samples were analyzed in duplicate. The reporting limits for the instrument range from 50 to 1,000 mg/L HCO3.
NVDOC concentrations were measured in duplicate or triplicate on groundwater samples filtered into precleaned 20-mL amber EPA/volatile organic analysis 2000 class vials. The vials were sample rinsed and filled close to the top, leaving some headspace. The samples were acidified with trace HCl assay of 36.5–38.0 percent (Millipore Sigma, Burlington, Mass.) to a pH of less than or equal to 2 and capped. Concentrations were measured as milligrams of C per liter using a Shimadzu TOC–L Total Organic Carbon Analyzer equipped with an ASI–L Autosampler (Shimadzu Scientific Instruments, Columbia, Md.). A modified version of EPA Method 415.1 (U.S. Environmental Protection Agency, 1974) was used for determining NVDOC concentrations in samples. The method was modified as follows: (1) samples were filtered, (2) samples were acidified with HCl rather than H2SO4, (3) total organic carbon (TOC) reference stock solutions of either 100 mg/L or 1,000 mg/L (Millipore Sigma, Burlington, Mass.) were used rather than a potassium hydrogen phthalate stock solution, and (4) the lower reporting limit was 0.60 mg/L of C compared to 1.0 mg/L of C. For this study, the method detection limit was 0.20 mg/L of C and the reporting limit range was 0.60–30 mg/L of C.
Carbon-14 contents of groundwater NVDOC were measured in samples filtered into duplicate 1-L baked glass amber bottles and acidified with trace HCl assay of 36.5–38.0 percent (Millipore Corporation) to a pH of less than or equal to 2. Carbon-14 analyses were completed at the Woods Hole Oceanographic Institution, National Ocean Sciences Accelerator Mass Spectrometry Facility (WHOI NOSAMS; https://www2.whoi.edu/site/nosams/). Samples were shipped on wet ice and stored at 4 °C until laboratory processing and analysis. At the laboratory, sample NVDOC was converted to CO2 (Xu and others, 2021, 2022; Xu, 2022a, b). The CO2 was then reacted with an Fe catalyst to form graphite, which was used in the analysis (Vogel and others, 1984; Pearson and others, 1997; Shah Walter and others, 2015; Elder and others, 2019; Goehring and others, 2019). A summary description of 14C analysis at WHOI NOSAMS is available through the “General Statement of 14C Procedures at the National Ocean Sciences AMS Facility: Woods Hole Oceanographic Institution” (Woods Hole Oceanographic Institution, National Ocean Sciences Accelerator Mass Spectrometry, 2023a). Refer to appendix 1 of this report for an explanation of 14C data and units.
Soil Gas
This section covers the strategy and methods used for soil gas sampling and analyses. It begins with an explanation of how sample locations were chosen and continues with a description of the sampling and analysis methods.
Soil Gas Sampling Design
At the facility, fluxes of CO2 depleted in 14C (ancient CO2) have been used to estimate biodegradation rates of spilled fuel below the facility (Department of the Navy, 2019; McHugh and others, 2020). In 2017, ancient CO2 was detected above tank 5 and on the southeast-facing slope of Red Hill downhill from tanks 11 and 12 (sites T2, T3, and T8 on fig. 5; Department of the Navy, 2019; McHugh and others, 2020). The presence of ancient CO2 south of the tank farm at the facility at site T8 (fig. 5) was concerning because it might indicate that spilled fuel migrated south away from the tanks in the direction of the dip of the lava flows. To investigate whether other locations had signs of underlying biodegrading fuel, a series of soil gas measurements was made over the crest of Red Hill, along the southeast-facing slope of the ridge and above the November 2021 spill areas near adit 3 (fig. 5, table 4, adit 3 shown on fig. 1). The purpose of these measurements was to replicate previous results (Department of the Navy, 2019; McHugh and others, 2020) and determine if evidence for subsurface biodegradation of fuel was present at other locations on the surface of the facility, including the area overlying adit 3, the site of the November 2021 spill (Department of the Navy, 2022). Three methods were used to evaluate the presence of ancient C in soil CO2 at land surface: (1) soil gas sample collection with soil probes for measuring 14C content of soil CO2, (2) soil C traps (E-Flux, Fort Collins, Colo.) for measuring soil CO2 efflux and 14C content of CO2 leaving the soil, and (3) soil CO2 efflux measurements made with a dynamic closed chamber (fig. 5, table 4).
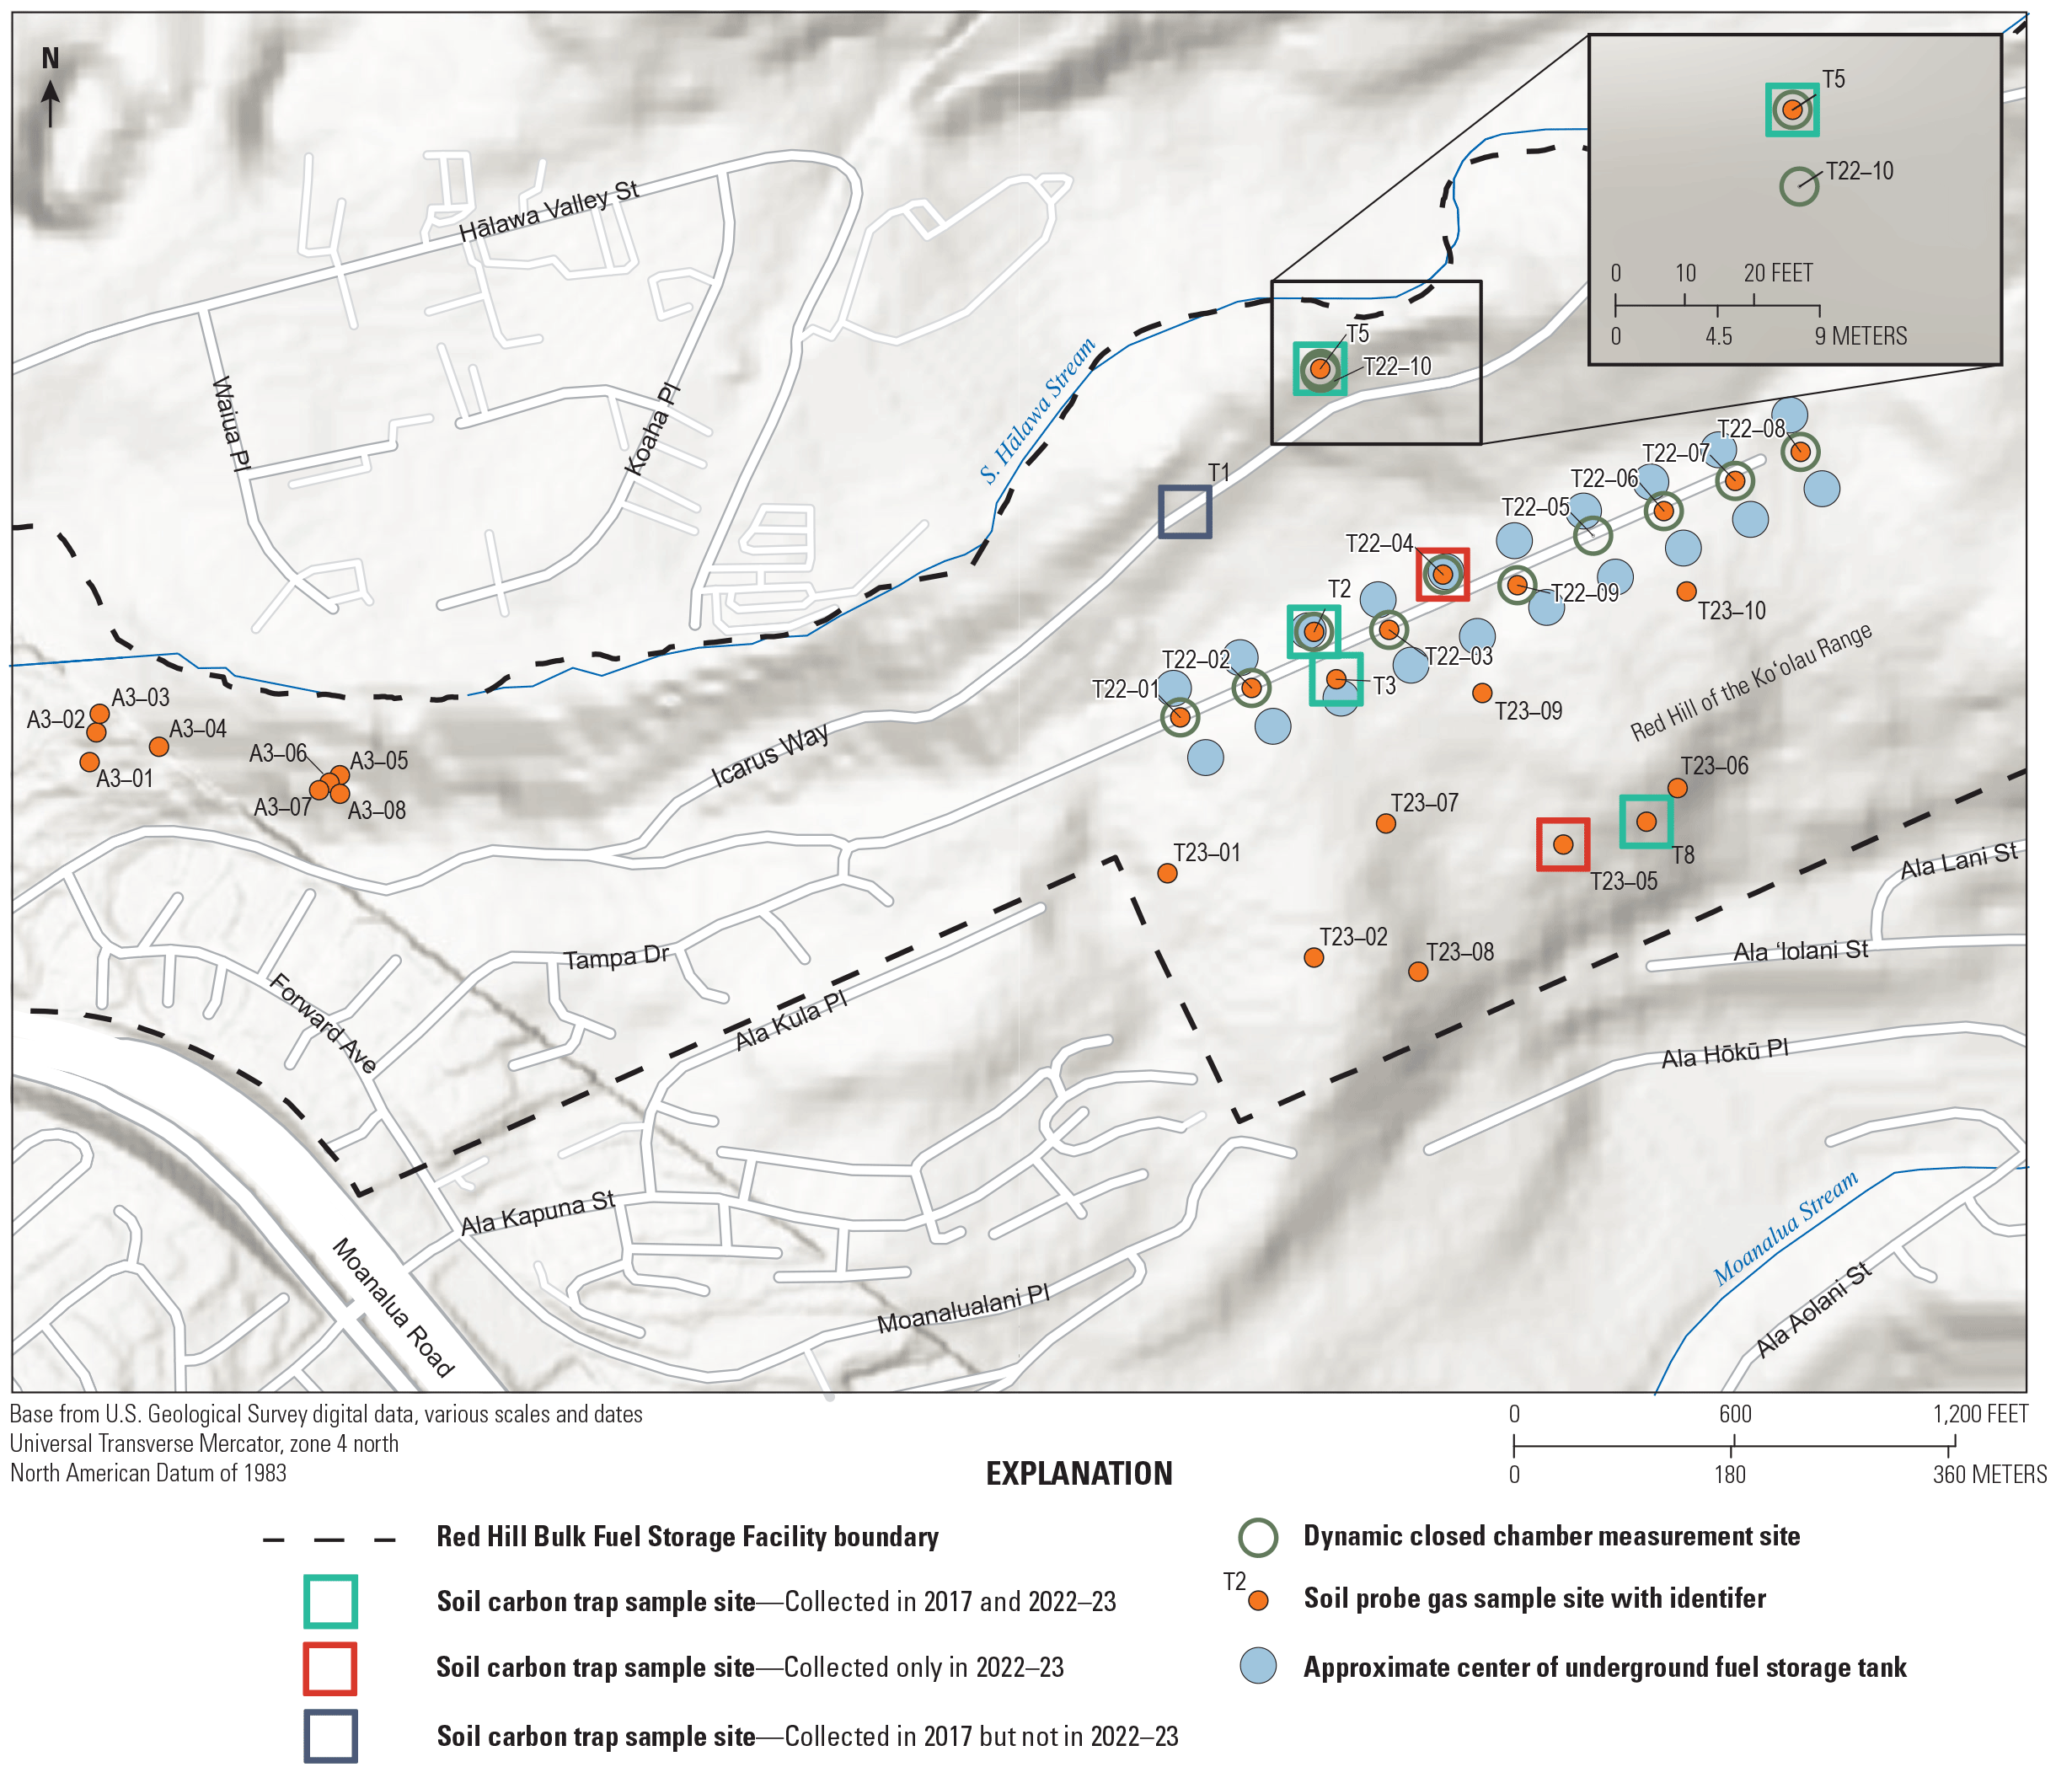
Soil gas sampling sites and types of data collected at each site.
Table 4.
Site information for soil gas sampling sites at the Red Hill Bulk Fuel Storage Facility, O‘ahu, Hawai‘i.[USGS, U.S. Geological Survey; HI, Hawai‘i; --, no samples collected; site information from U.S. Geological Survey (2024)]
Soil Gas Field and Laboratory Methods
This section describes the sampling and analysis methods for soil gas. This study used three soil gas sampling methods. The first is a soil gas probe driven 1 ft below the surface connected to a pump. The second is a carbon trap that passively captures carbon dioxide in soil gases emitted at the land surface. The third is a dynamic closed chamber that measures the flux of carbon dioxide in soil gas exiting the land surface. These methods are described in the following sections.
Soil Probe Gas Sample Collection and Analysis
Soil gas samples were collected to measure soil CO2 concentrations and the 14C content of soil CO2. Samples were collected with a soil probe based on a sampling method evaluated and refined at the National Crude Oil Spill Fate and Natural Attenuation Research Site near Bemidji, Minnesota (Wozney and others, 2021). Stainless steel retract-a-tip soil gas sampling probes (part 210.01 at AMS Samplers, American Falls, Idaho, United States) were used to collect soil gas samples. These soil probes have an outer casing diameter of 2.2 centimeters (cm) and an inner 5.0-cm long stainless-steel screen. During installation with a slide hammer, the screened interval was protected by the outer casing. The screen was exposed after installation when the upper outer casing was pulled back and held in place with locking pliers. The targeted soil gas sampling depth at all sites was centered at 30 cm below land surface. Sampling locations required at least 30 cm of soil for a sample to be collected; rocky areas without soil cover were not sampled.
Soil gas was extracted through the exposed screen with a peristaltic pump. Fluoropolymer tubing with a 4.76-millimeter (mm) inner diameter x 6.35-mm outer diameter was used to connect the retract-a-tip sampler to the flexible tubing (MasterFlex C-Flex Ultra, 06434–15) in the pump head of the peristaltic pump. Fluorinated ethylene propylene lined Bev-A-Line tubing (6.35-mm outer diameter) was used between the pump head, pressure gage, and a final Luer-Lok fitting for connecting to sample containers.
Sampling began at each location after the screen was installed, exposed to soil, and connected to a pump and tubing. The first sample collected at each site was for determining the soil CO2 concentration. A 5-L Tedlar bag (AMS Inc., American Falls, Idaho) was attached to the sample line and filled at least two-thirds full of soil gas with a pumping rate of about 600 mL per minute. These samples were stored and analyzed the same day of sample collection with an LI–8100 infrared gas analyzer (LI-COR Biosciences, Lincoln, Nebraska, United States). Next, soil gas samples for measuring the 14C content of soil CO2 were collected into prepared vials containing nitrogen gas at atmospheric pressure.
Vials for soil gas sample collection were prepared at RBPGL before field sampling according to the following procedure. Each sample vial comprised a 200-mL clear serum vial (Voigt Global Distribution Inc., United States) fitted with a 20-mm butyl stopper (Bellco Glass, Pennsylvania, United States) that was held in place with an Al seal (Voigt Global Distribution Inc.). Before the stoppers were inserted into the vials, the vials were rinsed with 18 megaohm (Milli-Q) deionized water and baked at 450 degrees Fahrenheit for at least 4 hours and the stoppers were boiled in 18 megaohm (Milli-Q) deionized water for 10 minutes and then placed in a vacuum chamber for as many as 5 days to remove atmospheric gases. A crimper tool (Voigt Global Distribution Inc.) was then used to insert the stopper into the vial and emplace a seal. Each vial was then purged with at least five volumes of nitrogen gas to remove all atmospheric gases from the vial. Two needles (22 gauge or smaller and at least 2.5 cm long) were inserted through the stopper to purge the vials. One needle was pushed in as far as possible and connected to the nitrogen gas supply. The second needle served as a vent and was inserted just to the bottom of the stopper. After purging five volumes and while the gas was still flowing, both needles were removed simultaneously, so the vial remained filled with nitrogen gas at atmospheric pressure.
In the field, a 3.8-cm 23-gauge needle was attached to the sample line to fill the prepared sample vials. A vent needle was inserted through the stopper and then the needle on the sample line was inserted through the stopper on a sample bottle. About five volumes of soil gas were purged through the sample bottle before removing the vent needle. The vent needle was removed while the pump was running, and the bottle was pressurized to about 25 pounds per square inch and then removed from the sample line. Silicone caulking was then used to cover the stopper and the top of the sample bottle to prevent sample leakage. A second, duplicate sample bottle was attached to the sample line, and the bottle-filling procedure was repeated. Samples were stored at ambient temperature. After sampling, the soil probe was removed from the ground. The surrounding soil was pressed into the sample probe hole, and a nail with flagging tape was inserted at the sample location to be revisited if necessary.
Soil gas samples in Tedlar bags were analyzed with an LI–8100A infrared gas analyzer to determine CO2 concentrations. These CO2 concentrations were determined to ensure that the samples had enough C for 14C analysis at WHOI NOSAMS. The LI–8100A was run in “continuous” mode for determining the CO2 concentrations of soil gas. The LI–8100A “in” line was attached to a three-way Luer-Lok fitting, attached to the Tedlar sample bag. The LI–8100A pulled in ambient air until the three-way valve was turned to open the Tedlar bag. Data logging on the LI–8100A was started during the ambient air reading to record the transition to sample air. The LI–8100A recorded a concentration every second as it pumped the sample air from the bag. After the bag was nearly empty, the valve was turned so ambient air entered the LI–8100A again. After this transition, the data recording was stopped. An average CO2 concentration was calculated from the readings taken from the sample in the Tedlar bag.
One of the 200-mL sample vials from each sampling location was shipped to the WHOI NOSAMS laboratory for analysis. The CO2 was extracted from each gas sample (Xu, 2022b) and reacted with an Fe catalyst to form graphite, which was used in the analysis (Vogel and others, 1984; Pearson and others, 1997; Shah Walter and others, 2015; Elder and others, 2019; Goehring and others, 2019). A summary of 14C analytical procedures used at WHOI NOSAMS is available through their document “General Statement of 14C Procedures at the National Ocean Sciences AMS Facility: Woods Hole Oceanographic Institution” (Woods Hole Oceanographic Institution, National Ocean Sciences Accelerator Mass Spectrometry, 2023a). Refer to appendix 1 of this report for an explanation of 14C data unit and interpretation.
Soil Carbon Traps
Soil CO2 traps from E-Flux (Fort Collins, Colo.) were deployed during the 2022 and 2023 field sample periods to replicate and expand on soil CO2 traps measurements completed in 2017 (Department of the Navy, 2019; McHugh and others, 2020). Soil CO2 traps were deployed for at least 2 weeks to provide time-integrated average CO2 efflux measurements. The traps are designed to passively collect CO2 samples with minimal interference to soil gas respiration and transport processes. The 14C content of soil CO2 on the trap sorbent (after a trip blank correction) is used to differentiate modern background CO2 from ancient fossil fuel-derived CO2 (E-Flux, 2023a).
Traps were deployed at three sites during September 28–October 12, 2022 (14 days), and at five sites during January 27–February 16, 2023 (20 days). During the 2022 sample period, traps were deployed at a background site (T5), a site with a reported detection of ancient CO2 in 2017 (T2; McHugh and others, 2020), and a site with high CO2 efflux (T22–04) measured as part of this study. During the 2023 sample period, traps were deployed at the background site T5, site T2, and three other locations at or near where ancient CO2 was reported in 2017 (sites T3, T8, and T23–05; fig. 5; McHugh and others, 2020). A travel blank was collected with each set of traps to correct analytical results for the trap sorbent composition (E-Flux, 2023b).
After field deployment, the soil CO2 trap samples were shipped to E-Flux and analyzed to determine the mass of CO2 accumulated on each trap and apportion that mass to modern background and ancient fossil fuel components. The ancient fossil fuel fraction of the CO2 trapped on the sorbent (ffsample) was determined from the laboratory-reported 14C content (pMCsample) and an assumed background 14C content (pMCbg) according to equation 1.5 in appendix 1. The ancient fossil fuel fraction of the sample (ffsample) was then used in equation 1 to compute the mass of ancient fossil fuel CO2 on the sorbent (Department of the Navy, 2019):
whereCO2ff
is ancient fossil fuel CO2 on the trap sorbent, in grams;
msorbent
is the mass of sorbent in the trap, in grams;
CO2sample
is the CO2 content on field-deployed trap sorbent, as a fraction;
ffsample
is the ancient fossil fuel fraction of the sample (calculated with eq. 1.5);
CO2TB
is the CO2 content of sorbent material determined from the travel blank, as a fraction; and
ffTB
is the ancient fossil fuel fraction of the sorbent material (calculated by applying eq. 1.5 to travel blank data).
The complete set of values from E-Flux sample reports for the variables in equations 1 and 1.5 are listed in table 1.1 in appendix 1. If equation 1 produced a negative value for a given sample, the concentration of the sample was classified by E-Flux as a nondetect. If equation 1 produced a positive value for a given sample, E-Flux reported a detection of ancient fossil fuel C and provided ancient C efflux rates in micromoles per square meter per second as CO2. The mass of ancient fossil fuel C on the trap sorbent was converted into a flux rate using the cross-sectional area of the trap, the length of the trap deployment, and the molecular weight of CO2 (Department of the Navy, 2019).
Dynamic Closed Chamber Soil Carbon Dioxide Efflux Measurements
At other petroleum spill sites, the magnitude of soil CO2 effluxes overlying the source area compared to background CO2 effluxes has been used to delineate the approximate extent of source zones (for example, Sihota and others [2011]). Furthermore, measurements of CO2 effluxes coupled with measurements of 14C content of soil CO2 can be used to separate background CO2 effluxes and petroleum-derived CO2 effluxes (Sihota and Mayer, 2012; Wozney and others, 2021). For these reasons, a field soil CO2 efflux survey was done in addition to soil gas sample collection during the September 2022 sampling period. The survey included two background sites (T5 and T22–10) and a series of sites overlying the fuel storage tanks at the facility. An LI–8100A dynamic closed CO2 flux survey chamber system equipped with an infrared gas analyzer (LI-COR Biosciences, Lincoln, Nebr.) was used for this survey.
The same general field procedure described by (Sihota and others, 2011) was used and is described briefly here. PVC collars that were 20 cm in diameter by 10 cm long were installed (part 6581–044, LI-COR Biosciences, Lincoln, Nebr.). The collars were pounded at least 3 cm into the soil and vegetation and litter were removed from the soil surface within the collars. Soil CO2 efflux was measured at least 24 hours after collar installation. Two rounds of three efflux measurements were completed at each site for a total of six efflux measurements per site. These six measurements were then averaged to calculate a single efflux value for each site. A “round” of measurements at a site consisted of three consecutive 2-minute efflux measurements separated by 1 minute 20 second purges. During the 2-minute efflux measurements, the chamber was lowered onto the collar and CO2 concentrations increased within the sealed chamber-collar environment. The LI–8100A recorded CO2 concentrations every few seconds and then, at the end of the 2 minutes, calculated CO2 efflux (rate of increase of CO2 in the chamber) by fitting a linear or exponential model to the recorded CO2 concentrations. During the 1 minute 20 second purge time, the LI–8100A lifted the chamber off the collar, thereby releasing the entrapped CO2 so the next measurement could begin under ambient conditions. Soil temperature was measured with a thermocouple probe (LI-COR 8100–201), and soil moisture of the upper 5 cm of soil was measured with a Teros-10 soil moisture sensor (Meter Group, Pullman, Wash.) and recorded by the LI–8100A instrument during efflux measurements.
Petroleum and Degradation Products in Groundwater
This section describes the results of sampling 19 monitoring wells in and near the facility. The goal of the sampling was to determine the migration direction of groundwater containing dissolved partial hydrocarbon oxidation products. An important focus was to measure the concentrations of partial hydrocarbon oxidation products in the groundwater by analyzing for NVDOC and the ancient C fraction of NVDOC.
Recent research at the National Crude Oil Spill Fate and Natural Attenuation Research Site near Bemidji, Minn., indicates that partial hydrocarbon oxidation products (metabolites) transported by groundwater from the crude oil source are represented by about 2,000 chemical formulas (Islam and others, 2016). Plumes of benzene, toluene, ethylbenzene, xylene, and DRO are routinely delineated at petroleum spill sites, but the metabolite plumes are largely ignored (Bekins and others, 2016). Data from the Bemidji site indicate that a plume of metabolites from degradation of residual crude oil has migrated more than 1,000 ft from the source, well beyond the plumes of benzene, toluene, ethylbenzene, xylene, and DRO, which have stabilized at about 500 ft from the source (Bekins and others, 2016). The concentrations of metabolites represented by NVDOC are two to three times greater than DRO concentrations measured in samples from the same wells. The metabolite plume represents the largest electron acceptor demand of any C fraction in the groundwater plume (Bekins and others, 2016).
Quantification of NVDOC in this project extends beyond previously published results on polar metabolites (Zemo and Foote, 2003; Mohler and others, 2013; Zemo and others, 2013, 201776; O’Reilly and others, 2015) because, in those studies, organics were extracted using methylene chloride, the solvent typically used for EPA Method 3510C (U.S. Environmental Protection Agency, 1996). The most polar compounds do not extract well with methylene chloride or hexane (Weisman, 1998; Zito and others, 2019). Moreover, the studies mentioned previously are based on two-dimensional gas chromatography (or GC) combined with time-of-flight mass spectrometry (or TOFMS; GC×GC−TOFMS), but many polar metabolites do not readily pass through a gas chromatography column without derivatization (Weisman, 1998). Thus, important compounds of interest may be retained in the column. We measured NVDOC using combustion, which captures all metabolites except volatiles lost during purging.
Results of the NVDOC analyses include natural dissolved organic matter present in the uncontaminated aquifer. Natural organic matter can be distinguished from petroleum hydrocarbon metabolites using 14C analyses because petroleum hydrocarbon partial oxidation products contain no modern C. By analyzing for the modern C content of NVDOC to determine the fraction of NVDOC from natural organic matter, the partial hydrocarbon transformation products produced during biodegradation can also be determined; thus, NVDOC depleted in modern C can be used as a tracer for groundwater migrating from the fuel source zone.
In addition to measuring NVDOC, ancient C in NVDOC, and DRO, a suite of analytes known to be altered during biodegradation of petroleum fuels in groundwater was also measured. These include major anions, cations, pH, alkalinity, and trace metals. These data are combined to help provide a picture of the direction of migration of the petroleum hydrocarbon oxidation products. The results of these analyses are presented in the next section.
Comparison of Nonvolatile Dissolved Organic Carbon to Routinely Collected Analytes
A comparison of concentrations of NVDOC and DRO is shown in figure 6A. For this direct comparison of NVDOC and DRO, DRO concentrations reported in Jaeschke and others (2023) were divided by 1,000 and multiplied by 0.87 to convert from micrograms per liter into milligrams of C per liter (Zito and others, 2019). Nondetects for DRO were assigned a value of 20 μg/L (the laboratory’s limit of detection) before converting to milligrams of C per liter. The designated background well (Moanalua W–2) had an NVDOC concentration of 0.21 mg/L and DRO less than the detection limit. The NVDOC value is flagged as “estimated” by the analytical laboratory because it is less than the reporting limit but greater than the detection limit. Only well DH43 and one sample at RHMW12A had NVDOC concentrations within the range (0.19−0.27 mg/L) typical of DOC in the basalt aquifers of O‘ahu (Chapelle and others, 2013). Samples from the remaining wells all had elevated values of NVDOC compared to the background value. A linear regression through the data has a slope of 2.79 (coefficient of determination of 0.82), indicating that the NVDOC concentrations are about three times the DRO concentrations in the same wells. The NVDOC analysis method quantifies hydrocarbon oxidation products that are more polar than hydrocarbons and therefore missed in the DRO analysis (Bekins and others, 2016). Assuming no other substantial NVDOC inputs to groundwater near the facility, this result indicates that elevated NVDOC provides a measure of groundwater containing hydrocarbon oxidation products that might help to trace migration pathways of solutes away from the facility.
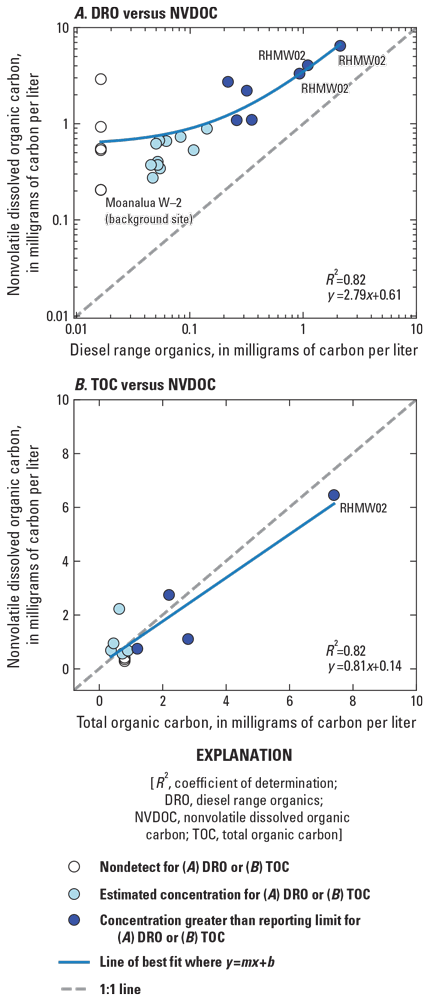
Comparison of nonvolatile dissolved organic carbon concentrations with (A) concentrations of diesel range organics and (B) concentrations of total organic carbon in samples.
NVDOC is operationally defined as the organic fraction passing through a 0.45-micrometer filter and typically accounts for more than 90 percent of TOC in natural groundwaters (Regan and others, 2017). In this study, samples were filtered with a 0.22-micrometer filter (to filter out particulates and microorganisms) and compared with unfiltered TOC values from the same wells (fig. 6B, table 5). For this plot, samples with nondetects for TOC were assigned a value of 0.8 mg/L, which is the laboratory limit of detection for TOC. This comparison is provided because TOC rather than NVDOC has been routinely measured as part of the facility’s monitoring. The regression line shows a strong positive linear relation (coefficient of determination of 0.82) between these variables. In general, NVDOC is expected to be lower than TOC because NVDOC samples are filtered before analysis and TOC samples are unfiltered. The slope of the relation is about 0.8, indicating, as expected, that NVDOC is about 80 percent of the TOC; however, NVDOC concentrations were greater than TOC in four of the nine samples with detections of TOC, and at low TOC values, the regression gives NVDOC values more than 100 percent of TOC. The reason for this result is unknown. NVDOC is a more sensitive analytical approach. TOC was not detected in well RHMW09 to the south of the facility, or in wells RHMW11–05 and RHMW12A, which are screened below the water table; however, NVDOC was detected in these wells at concentrations of 0.41, 0.35, and 0.28 mg/L, respectively. These results indicate that NVDOC may be a better measure than TOC of the presence of hydrocarbon oxidation products.
Table 5.
Sample information, nonvolatile dissolved organic carbon concentrations from samples filtered through 0.22-micrometer filters and analyzed by the U.S. Geological Survey (Jaeschke and others, 2023), and total organic carbon concentrations from unfiltered samples collected by AECOM (Department of the Navy, 2023c).[USGS, U.S. Geological Survey; mg/L, milligram per liter; C, carbon; J, estimated value; E, estimated value; U, nondetect value]
Data from Jaeschke and others (2023).
Data from Department of the Navy (2023c).
Bailed and Pumped Sample Comparison
A component of this study included a comparison of bailed and pumped sample concentrations at three wells. The purpose was to determine if one sampling method resulted in consistently higher analyte concentrations. The spilled fuel at the facility is a light nonaqueous phase liquid, which is less dense than water and therefore will tend to form plumes in the uppermost part of the aquifer near the water table and near the source. Bailed samples from wells near the source were hypothesized to have greater concentrations of organic constituents (NVDOC and DRO) and biodegradation indicators (Fe, alkalinity) compared to pumped samples because bailed samples were collected near the water table. At locations farther from the source, the opposite might be true because plumes often migrate deeper with distance because of the addition of recharge at the water table or the presence of downward pressure gradients. In this study, bailer samples were collected from the upper 3−5 ft below the water table at wells RHMW2254–01, RHMW02, and RHMW03, whereas the pump intakes were set deeper at about 6, 9, and 8 ft below the water table, respectively (AECOM, written commun., August 3, 2023).
The shaft (RHMW2254–01) had higher DRO, NVDOC, and Fe in the bailed samples compared to the pumped samples (fig. 7, table 6). In contrast, well RHMW02 had lower DRO and NVDOC in the bailed samples compared to the pumped samples. At well RHMW03, the NVDOC and DRO results were mixed. Major ions (Al, alkalinity, B, Ba, Br, Ca, Cl, Cu, F, Fe, K, Li, Mg, Mn, Na, NO3, PO4, Si, SO4, Sr, Zn) typically had higher concentrations in bailed samples compared to pumped samples; about 70 percent of the bailed samples had higher concentrations of major ions compared to the pumped samples (table 6). At the shaft (RHMW2254–01), all detected major ion concentrations were higher in the bailed samples compared to the pumped samples. Well RHMW03 had more analytes with lower concentrations in bailed samples compared to pumped samples relative to wells RHMW2254–01 and RHMW02.
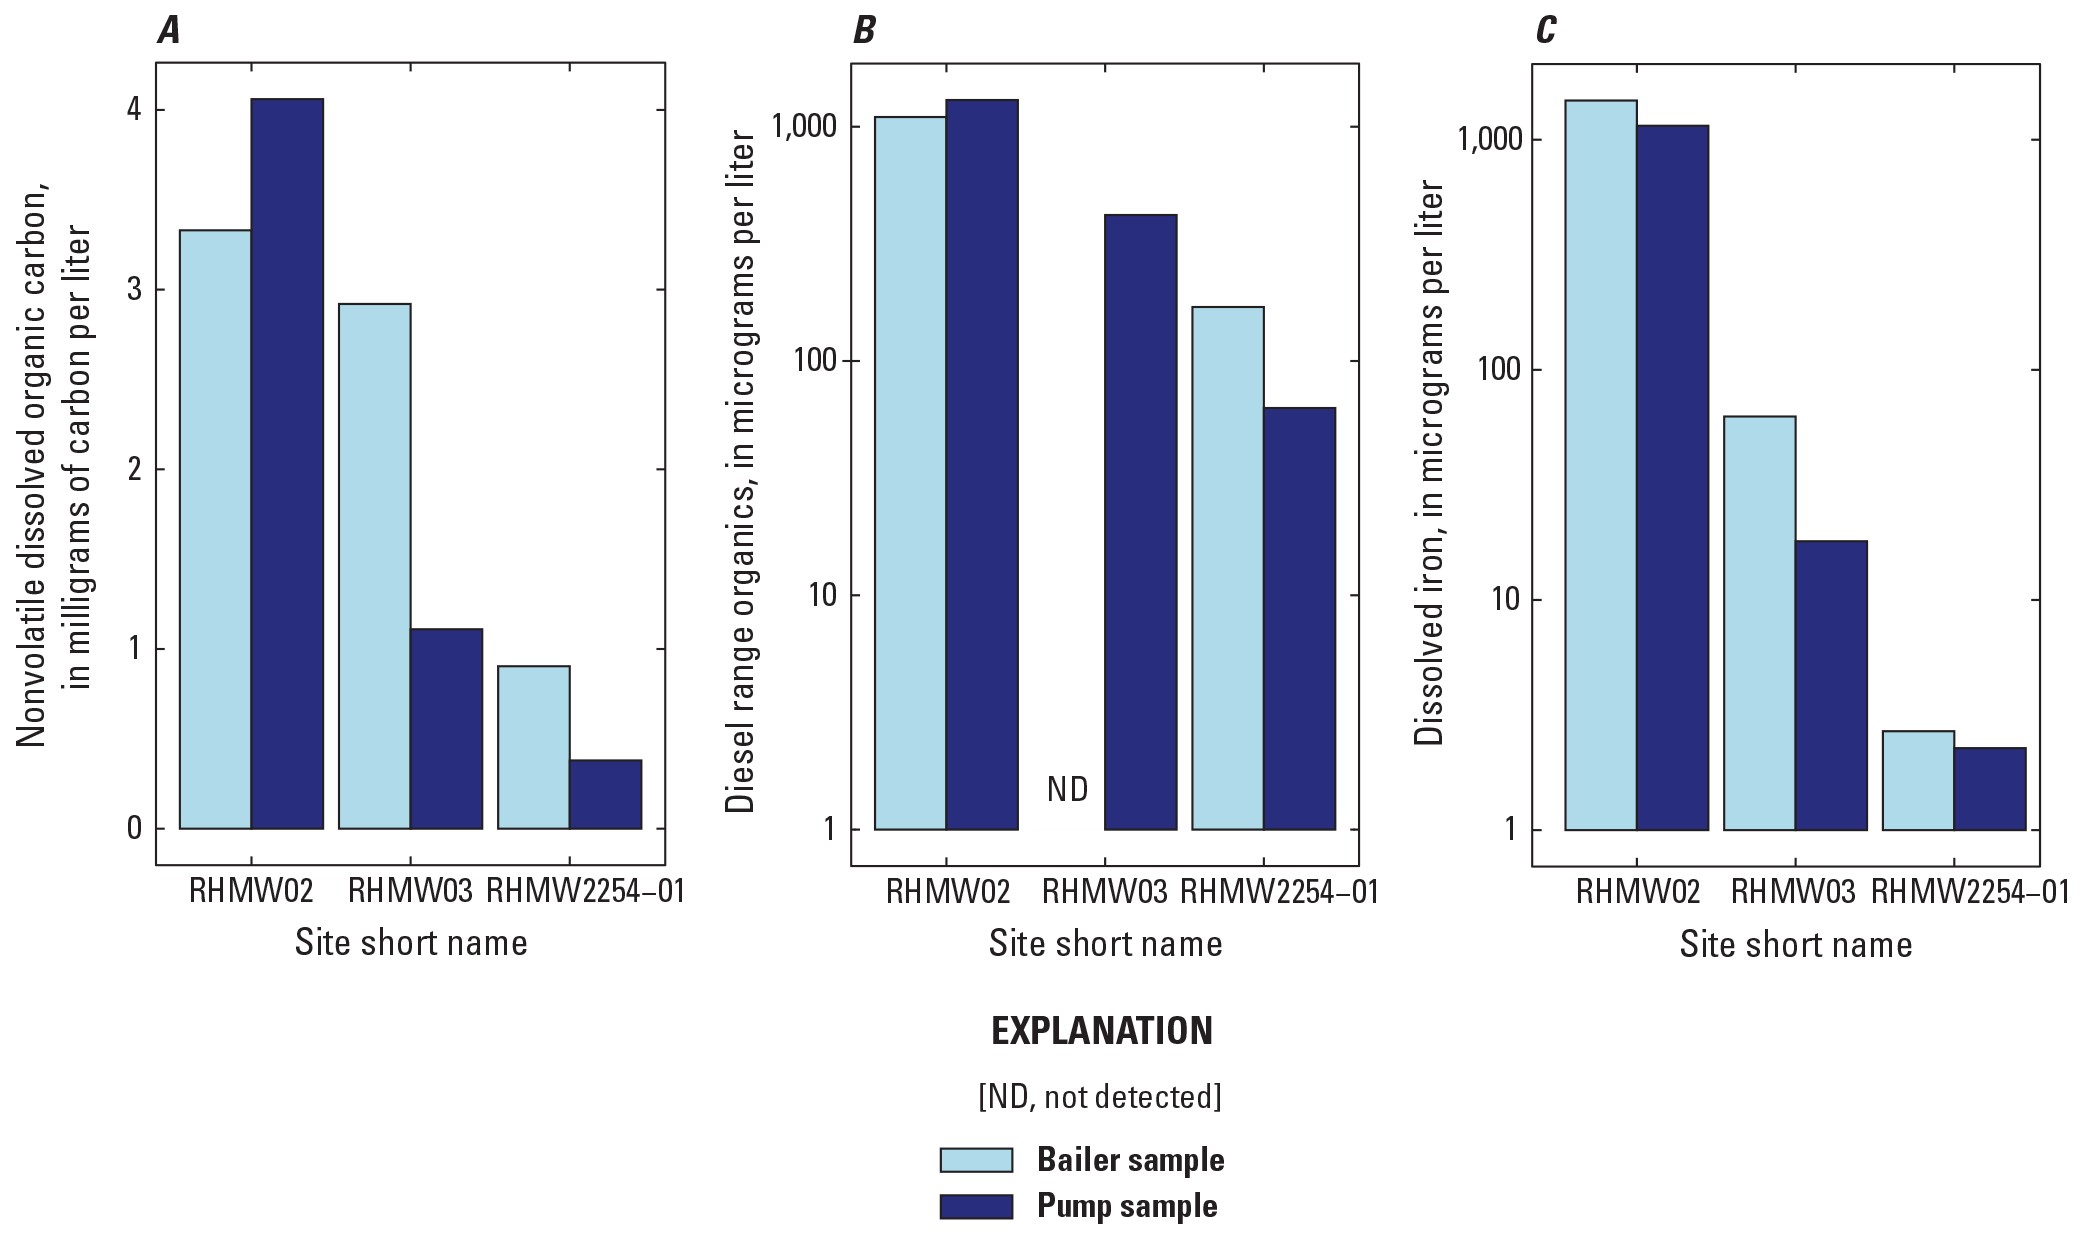
Comparison of bailed and pumped sample concentrations for (A) nonvolatile dissolved organic carbon, (B) diesel range organics, and (C) dissolved iron.
Table 6.
Table containing concentrations and percentage differences in concentrations of analytes measured in paired bailed and pumped samples.[Dates given in month/day/year format; μg/L, microgram per liter; LT, less than; mg/L, milligram per liter; HCO3, bicarbonate; --, not applicable; E, estimated value; µs/cm at 25 °C, microsiemens per centimeter at 25 degrees Celsius; values with an “LT” flag were assumed to have the value listed in the table for purposes of calculating a percentage difference; data from Jaeschke and others (2023)]
In summary, the elevated NVDOC, DRO, Fe, and alkalinity concentrations in the bailed compared to the pumped samples at the shaft (RHMW2254–01) are consistent with a nearby source of light nonaqueous phase liquid. Differences in concentrations between the bailed and pumped samples were more variable at the other two wells, indicating that, in those locations, the source of light nonaqueous phase liquid is not as localized near the water table. The interpretation of RHMW03 data is discussed further with the alkalinity data in the following section.
Distribution of Petroleum Indicators
A plot of Kendall’s tau (τ) correlation coefficients between analytes measured in groundwater samples in this study is shown in figure 8. These analytes have been determined in previous studies to indicate petroleum degradation (National Research Council, 2000). Data from regular field samples were included for this analysis; field blanks and duplicates were excluded. Pumped samples from pumped-bailed sample pairs were also excluded because 14C content was not measured in the pumped samples. For all analytes except DRO, nondetects were assigned the value of the reported limit in the data release (for example, a value of LT 0.5 is assigned a value of 0.5). For DRO, nondetects were assigned a value of 20 µg/L, which is the laboratory’s limit of detection. In the case of ties, Kendall’s τ is computed according to Kendall (1945).
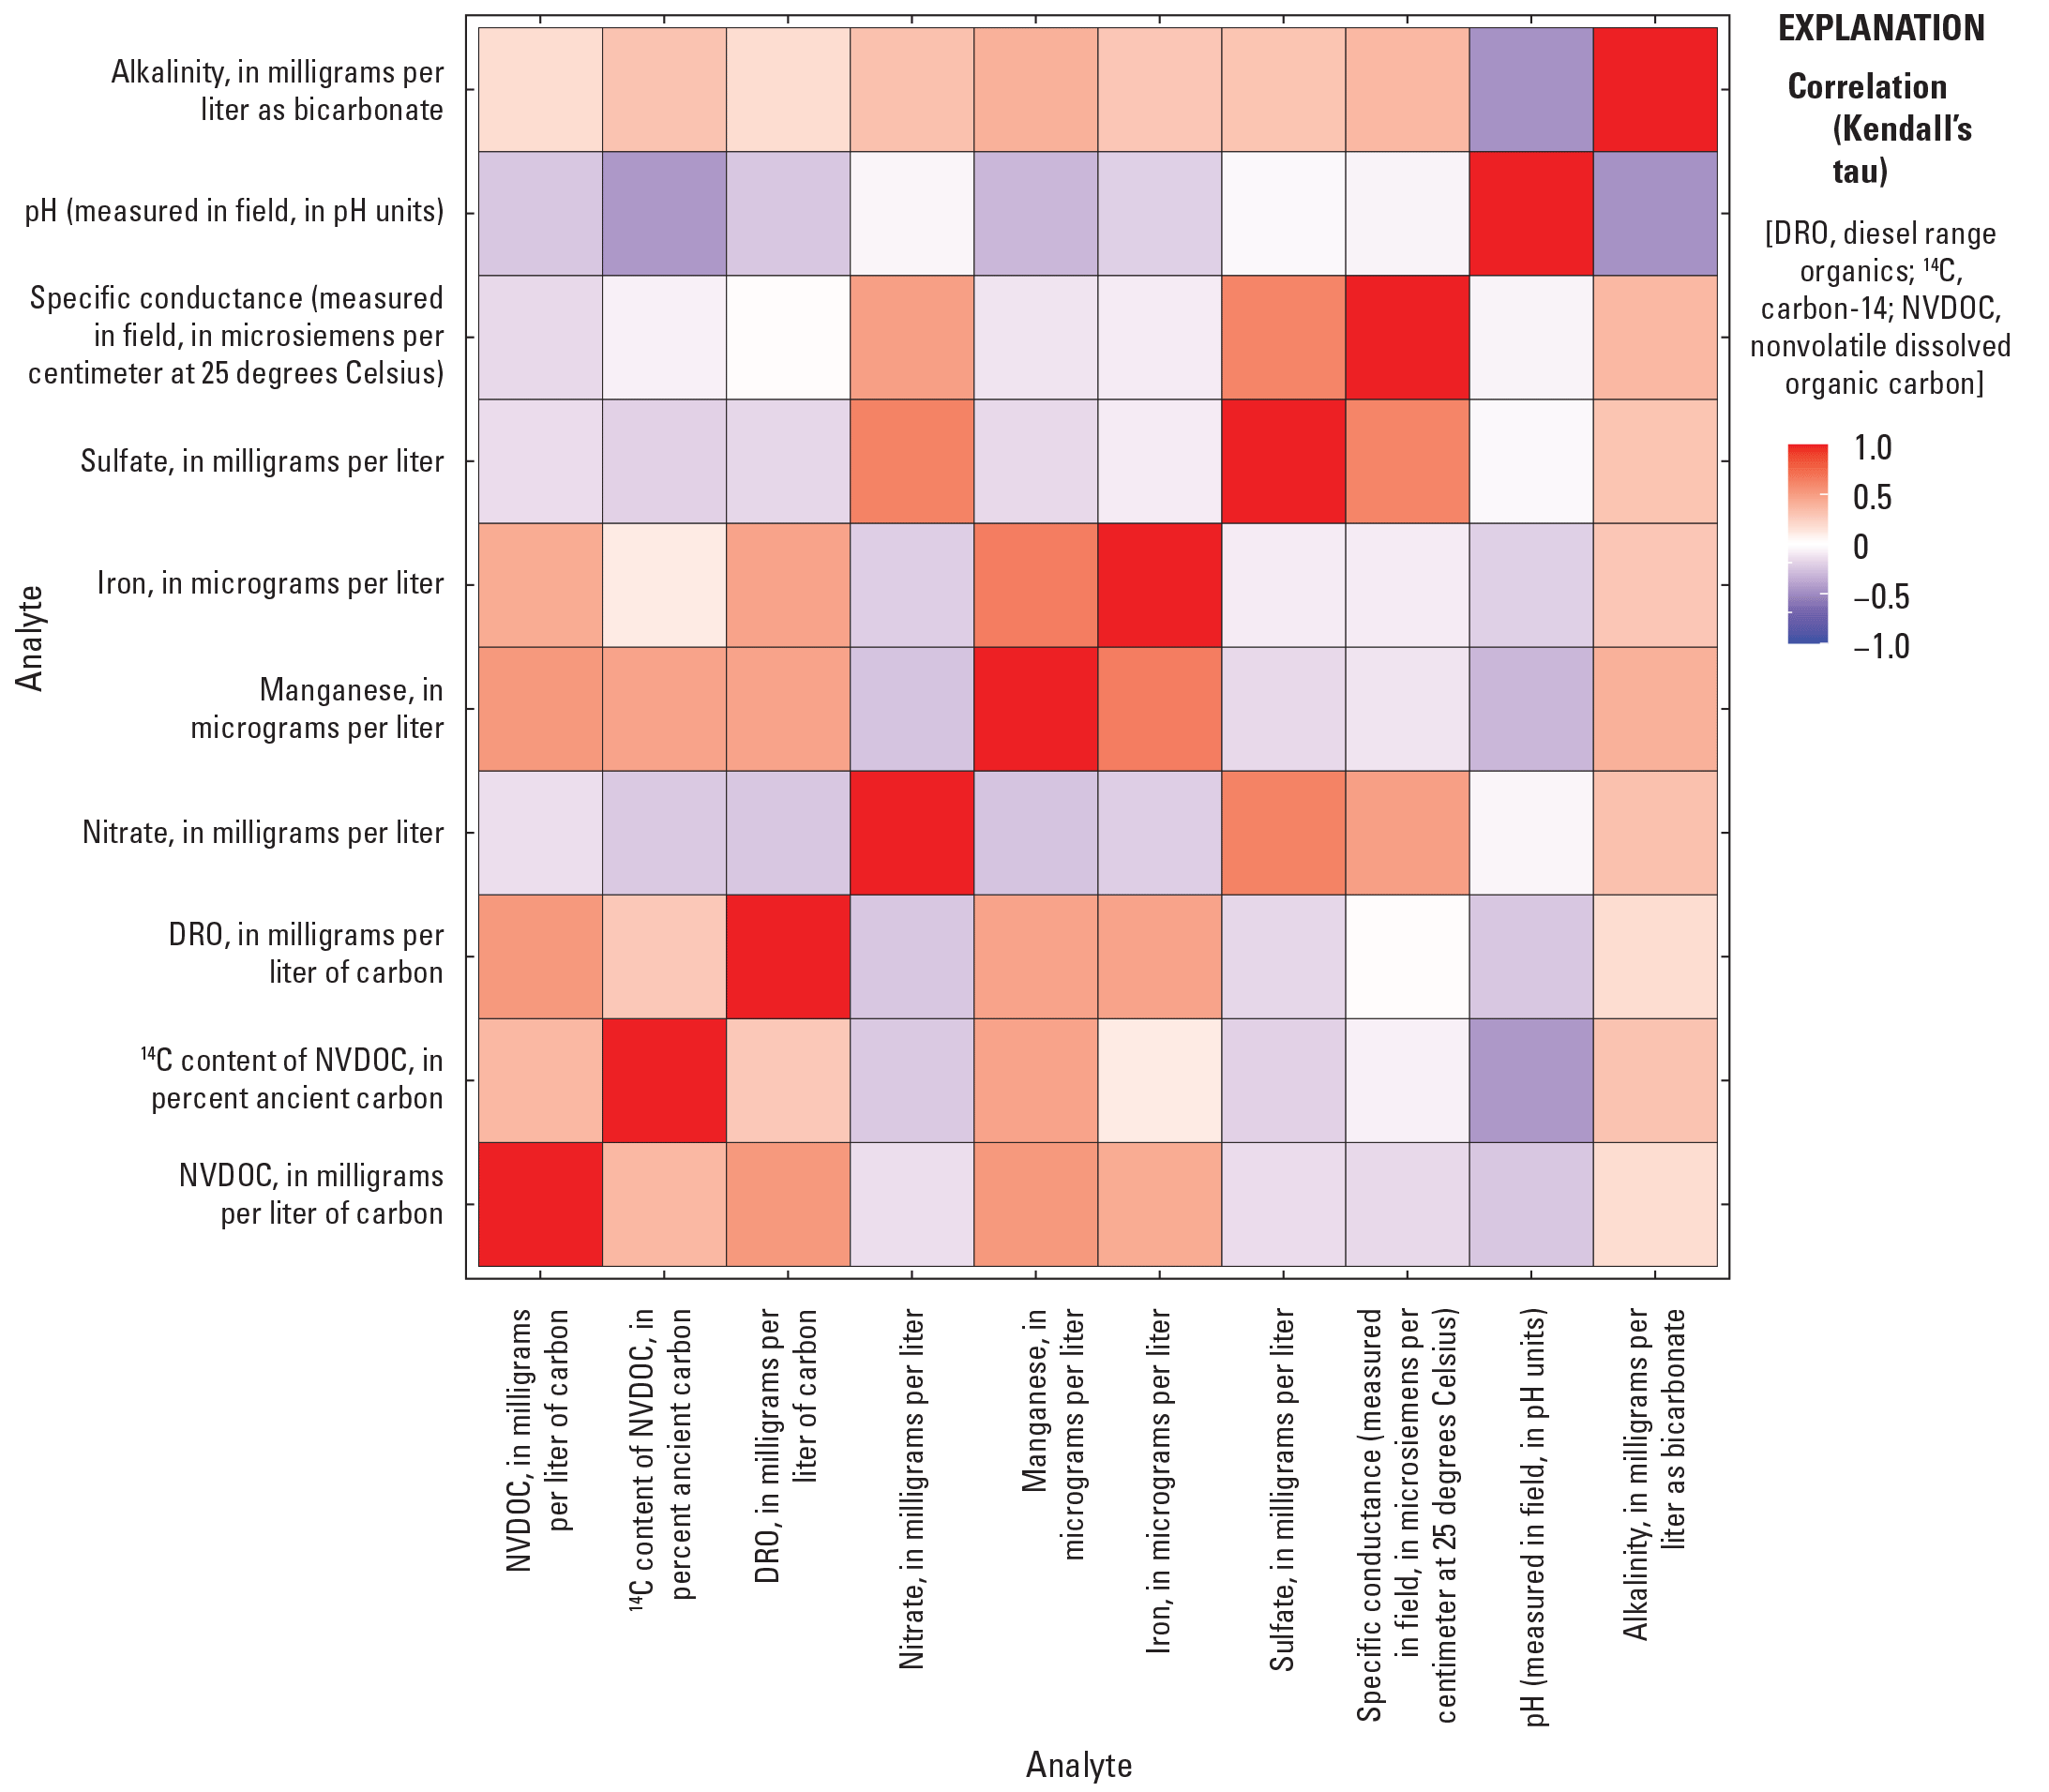
Correlation coefficients among analytes measured in groundwater samples that have been determined in previous studies to indicate petroleum degradation (National Research Council, 2000).
The results indicate that NVDOC correlates with percentage ancient C in NVDOC (τ=0.36) and with DRO (τ=0.52). NVDOC also correlates with Fe and Mn (τ=0.43, 0.52 respectively), consistent with biodegradation under Fe- and Mn-reducing conditions. NVDOC does not correlate as strongly with either NO3, SO4, specific conductance, pH, or alkalinity (τ=−0.14, −0.15, −0.16, −0.24, 0.18 respectively), indicating that these traditional measures of biodegradation might not be useful to delineate the contaminant plume at this site. Instead, specific conductance correlates well with SO4, indicating that mixing of groundwater with a seawater source has a larger effect on the SO4 concentration than biodegradation. The inverse correlation of pH with alkalinity is expected. In summary, the indicators that are useful for tracking the plume migration are NVDOC, percentage ancient C, Fe, and Mn.
NVDOC concentrations in the samples from the wells are compared to the ancient C contents of the NVDOC in figure 9. This plot includes all regular field samples that had measurements of NVDOC and 14C; field duplicates are excluded. The NVDOC and 14C data together indicate the presence of hydrocarbon oxidation products in groundwater below the facility. At background well Moanalua W–2, the ancient C is 38.20 percent. Higher ancient C values than this are indicative of the addition of hydrocarbon oxidation products to the NVDOC pool. The highest percentage ancient C (92.99 percent) and the highest NVDOC (6.45 mg/L) were detected at well RHMW02, indicating that groundwater near this well is the most affected by a fuel source. Overall, a trend of decreasing percentage ancient C with decreasing NVDOC concentrations indicates that the hydrocarbon oxidation products are either biodegrading or mixing with uncontaminated groundwater or both.
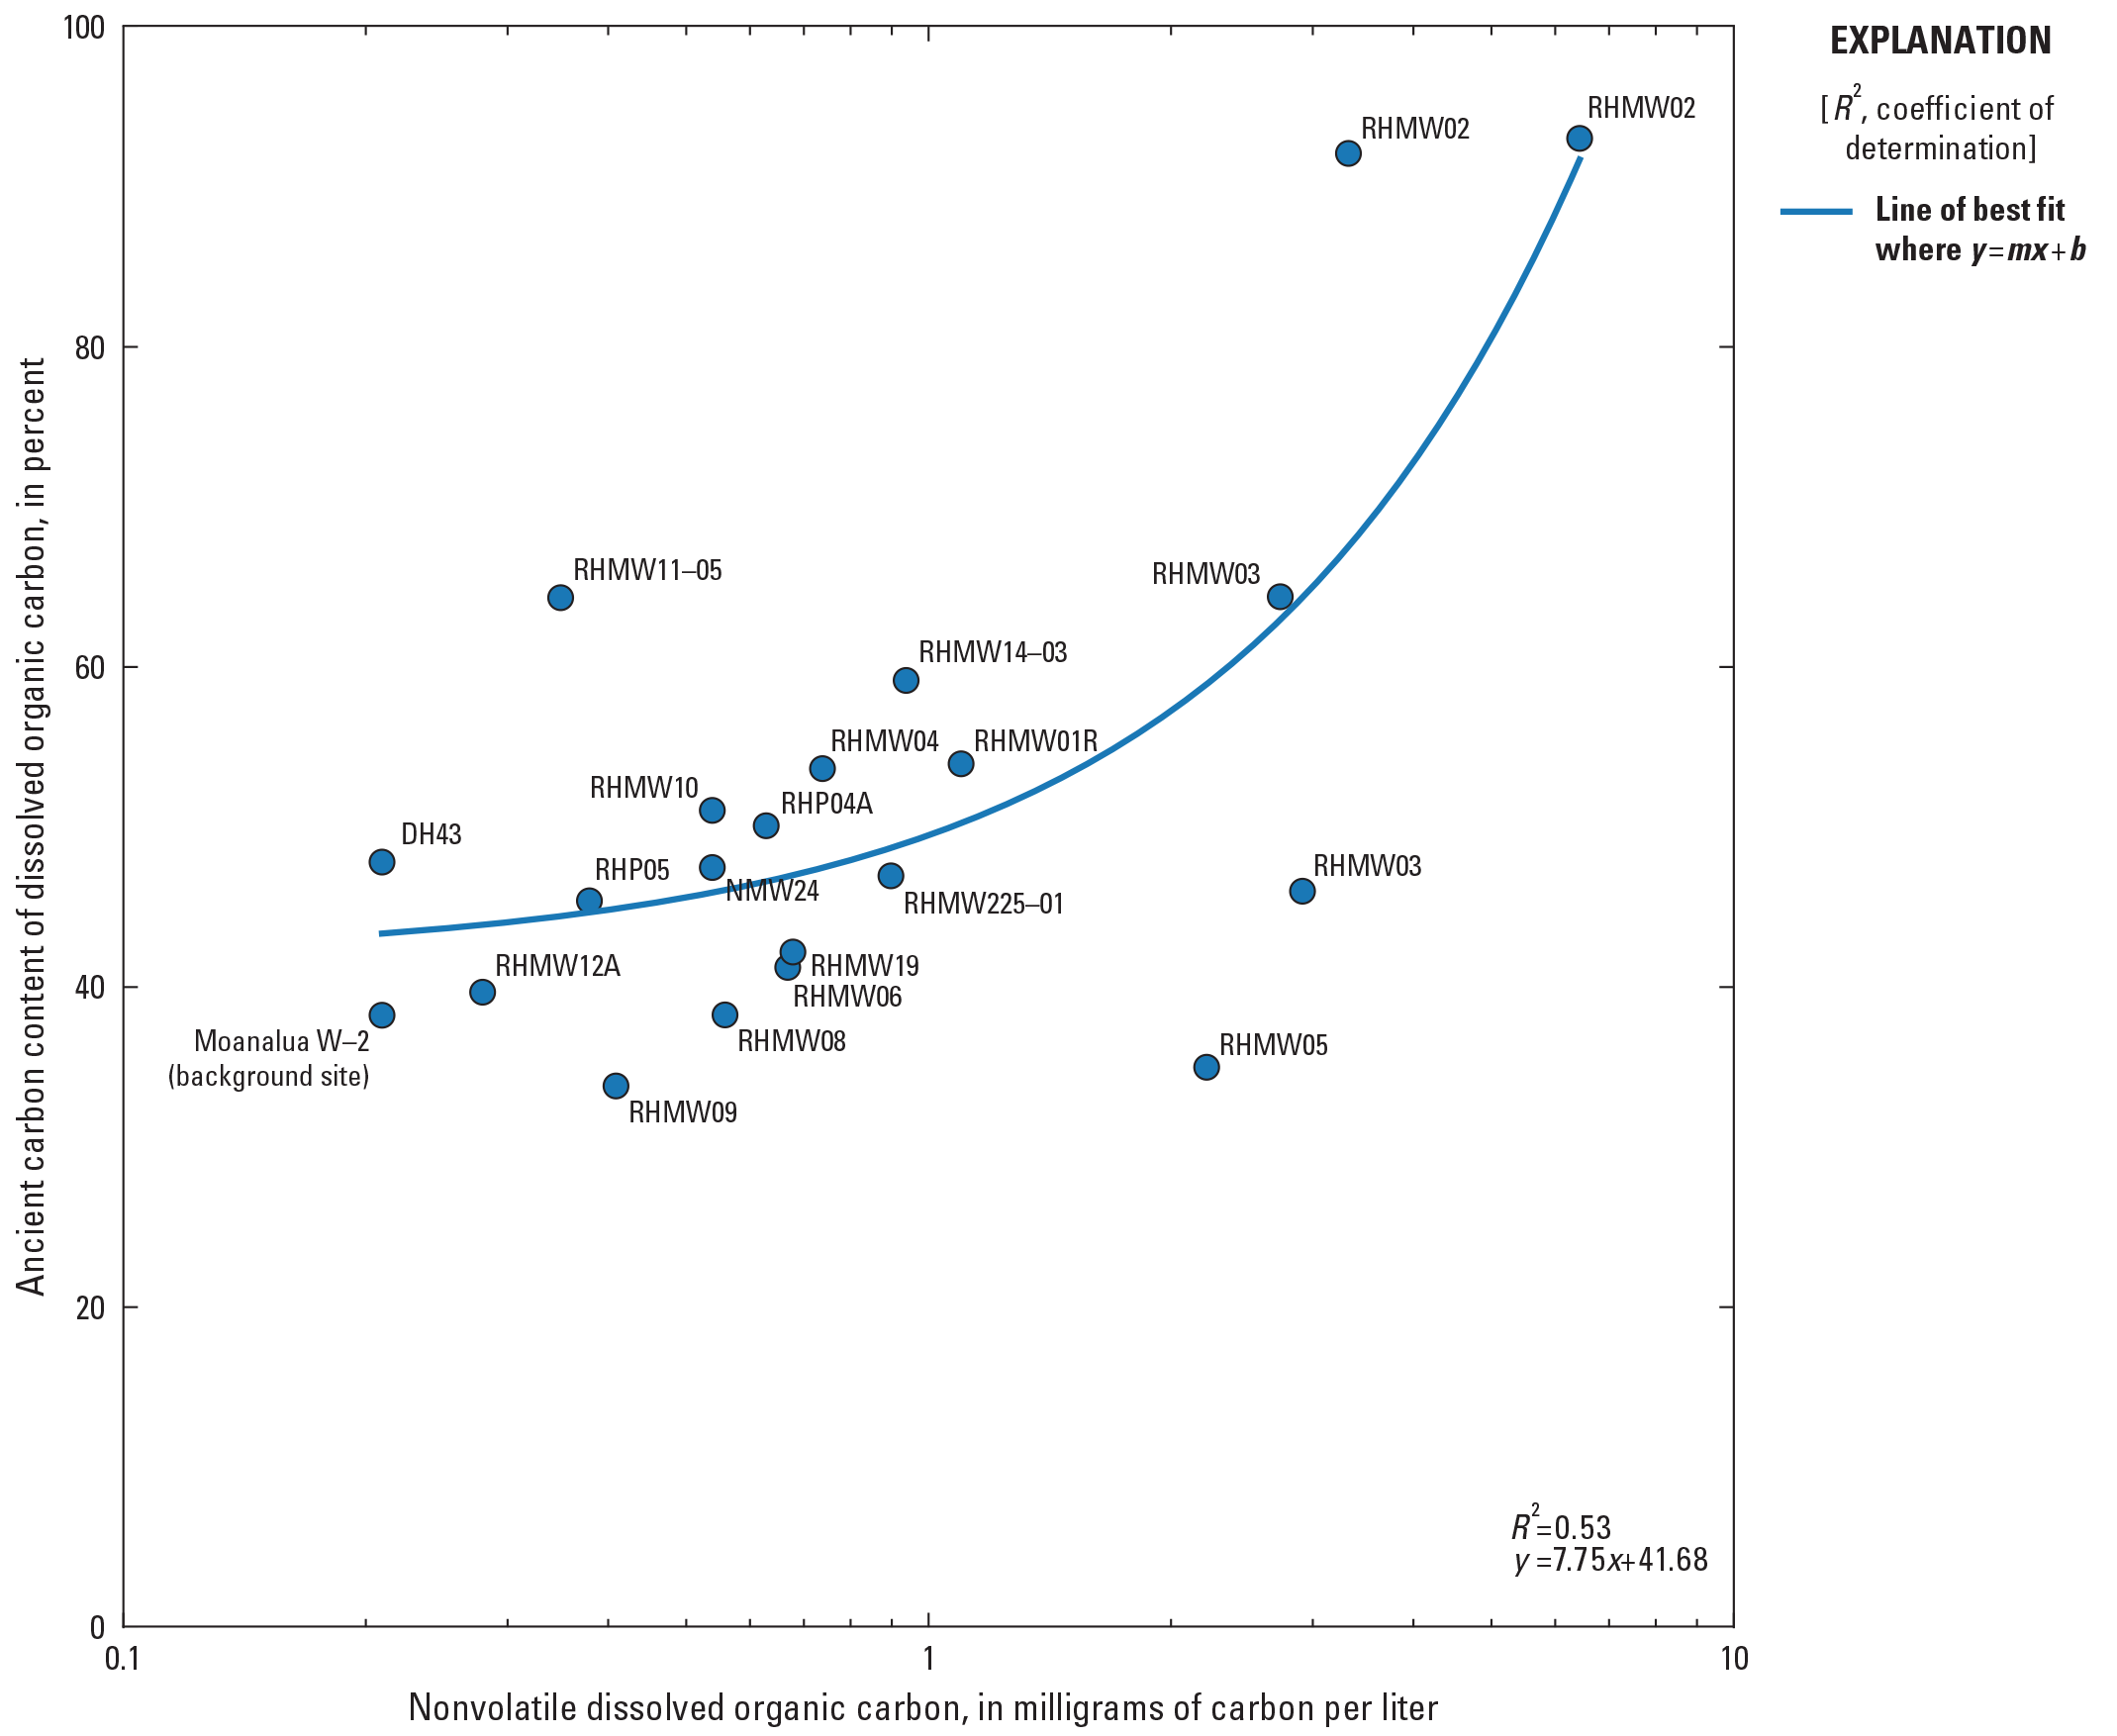
Graph comparing the ancient carbon contents of nonvolatile dissolved organic carbon with nonvolatile dissolved organic carbon concentrations in groundwater.
Two outliers are noteworthy. Groundwater from well RHMW05 has a relatively high NVDOC concentration of 2.22 mg/L but the ancient C is 34.95 percent, which is lower than the background value of 38.20 percent. Groundwater from this well had a DRO concentration of 380 µg/L, and DRO was detected at RHMW05 in 13 percent of samples collected in 2023 (table 1). Conversely, groundwater from well RHMW11–05 had a high ancient C value of 64.29 percent but a barely elevated NVDOC concentration of 0.35 mg/L. DRO values in this well were estimated concentrations of 66 and 84 µg/L. Based on the ancient C percentage, groundwater from this well could be affected by hydrocarbon oxidation products; however, the sampled interval of this well is −65 to −79 ft relative to local mean sea level or about 85−100 ft below the water table. One possible explanation for the very low NVDOC concentration is dilution and dispersion of the plume during vertical migration from the source to the sampled interval. Examining other aspects of the NVDOC using techniques in Podgorski and others (2021) such as optical properties or ultrahigh resolution mass spectrometry could be used to determine if NVDOC matches the characteristics of the natural NVDOC or that of the hydrocarbon oxidation products.
The background ancient C value of 38.20 percent is surprising because there is 0 percent ancient C at sites with shallow water tables such as the Bemidji site. The ancient C percentage of 38.20 percent corresponds to an age of 3,870 years for the background NVDOC. Such a large age is unreasonable for the transport time of NVDOC from the surface by the groundwater based on recharge dates of the 1940s to the 1980s for groundwater in this part of O‘ahu (Hunt, 2004). Other investigators have determined that the use of DOC for estimating groundwater age is questionable for thick unsaturated zones because of the potential for old, buried soil C to be transported in recharge water (Thomas and others, 2021). A possible source of the ancient NVDOC is burned vegetation between lava flows. This hypothesis could be tested by examining the optical properties of the background NVDOC or characterizing it with ultrahigh resolution mass spectrometry (Podgorski and others, 2021).
Maps showing contours of NVDOC, 14C content (percentage ancient C), DRO, and alkalinity are shown in figures 10–13. The data are combined from sample days in September 2022, January 2023–February 2023, and April 2023. Only regular field samples were used for these plots; field duplicates were excluded. Most wells were only sampled once, but wells RHMW02 and RHMW03 were sampled in September 2022 and January 2023. For these sites, the average of the September 2022 and January 2023 samples was used for plotting each analyte except DRO in well RHMW03 (fig. 2). Only the September 2022 concentration was used for RHMW03 because the January 2023 concentration was less than detection and nondetects occur infrequently at this well (table 1). Values plotted are from samples acquired with a bailer, except for samples from RHMW11–05, RHMW14–03, DH43, RHP05 and RHMW12A. Well locations (U.S. Geological Survey, 2024) and chemical concentration data were used to interpolate a concentration surface for each analyte using the Natural Neighbor method provided in the Spatial Analyst Toolbox of ArcGIS Pro version 3.1.3 (Esri, 2023). From these surfaces, concentration contour lines were created using the Contour tool in the same toolbox (Esri, 2023).
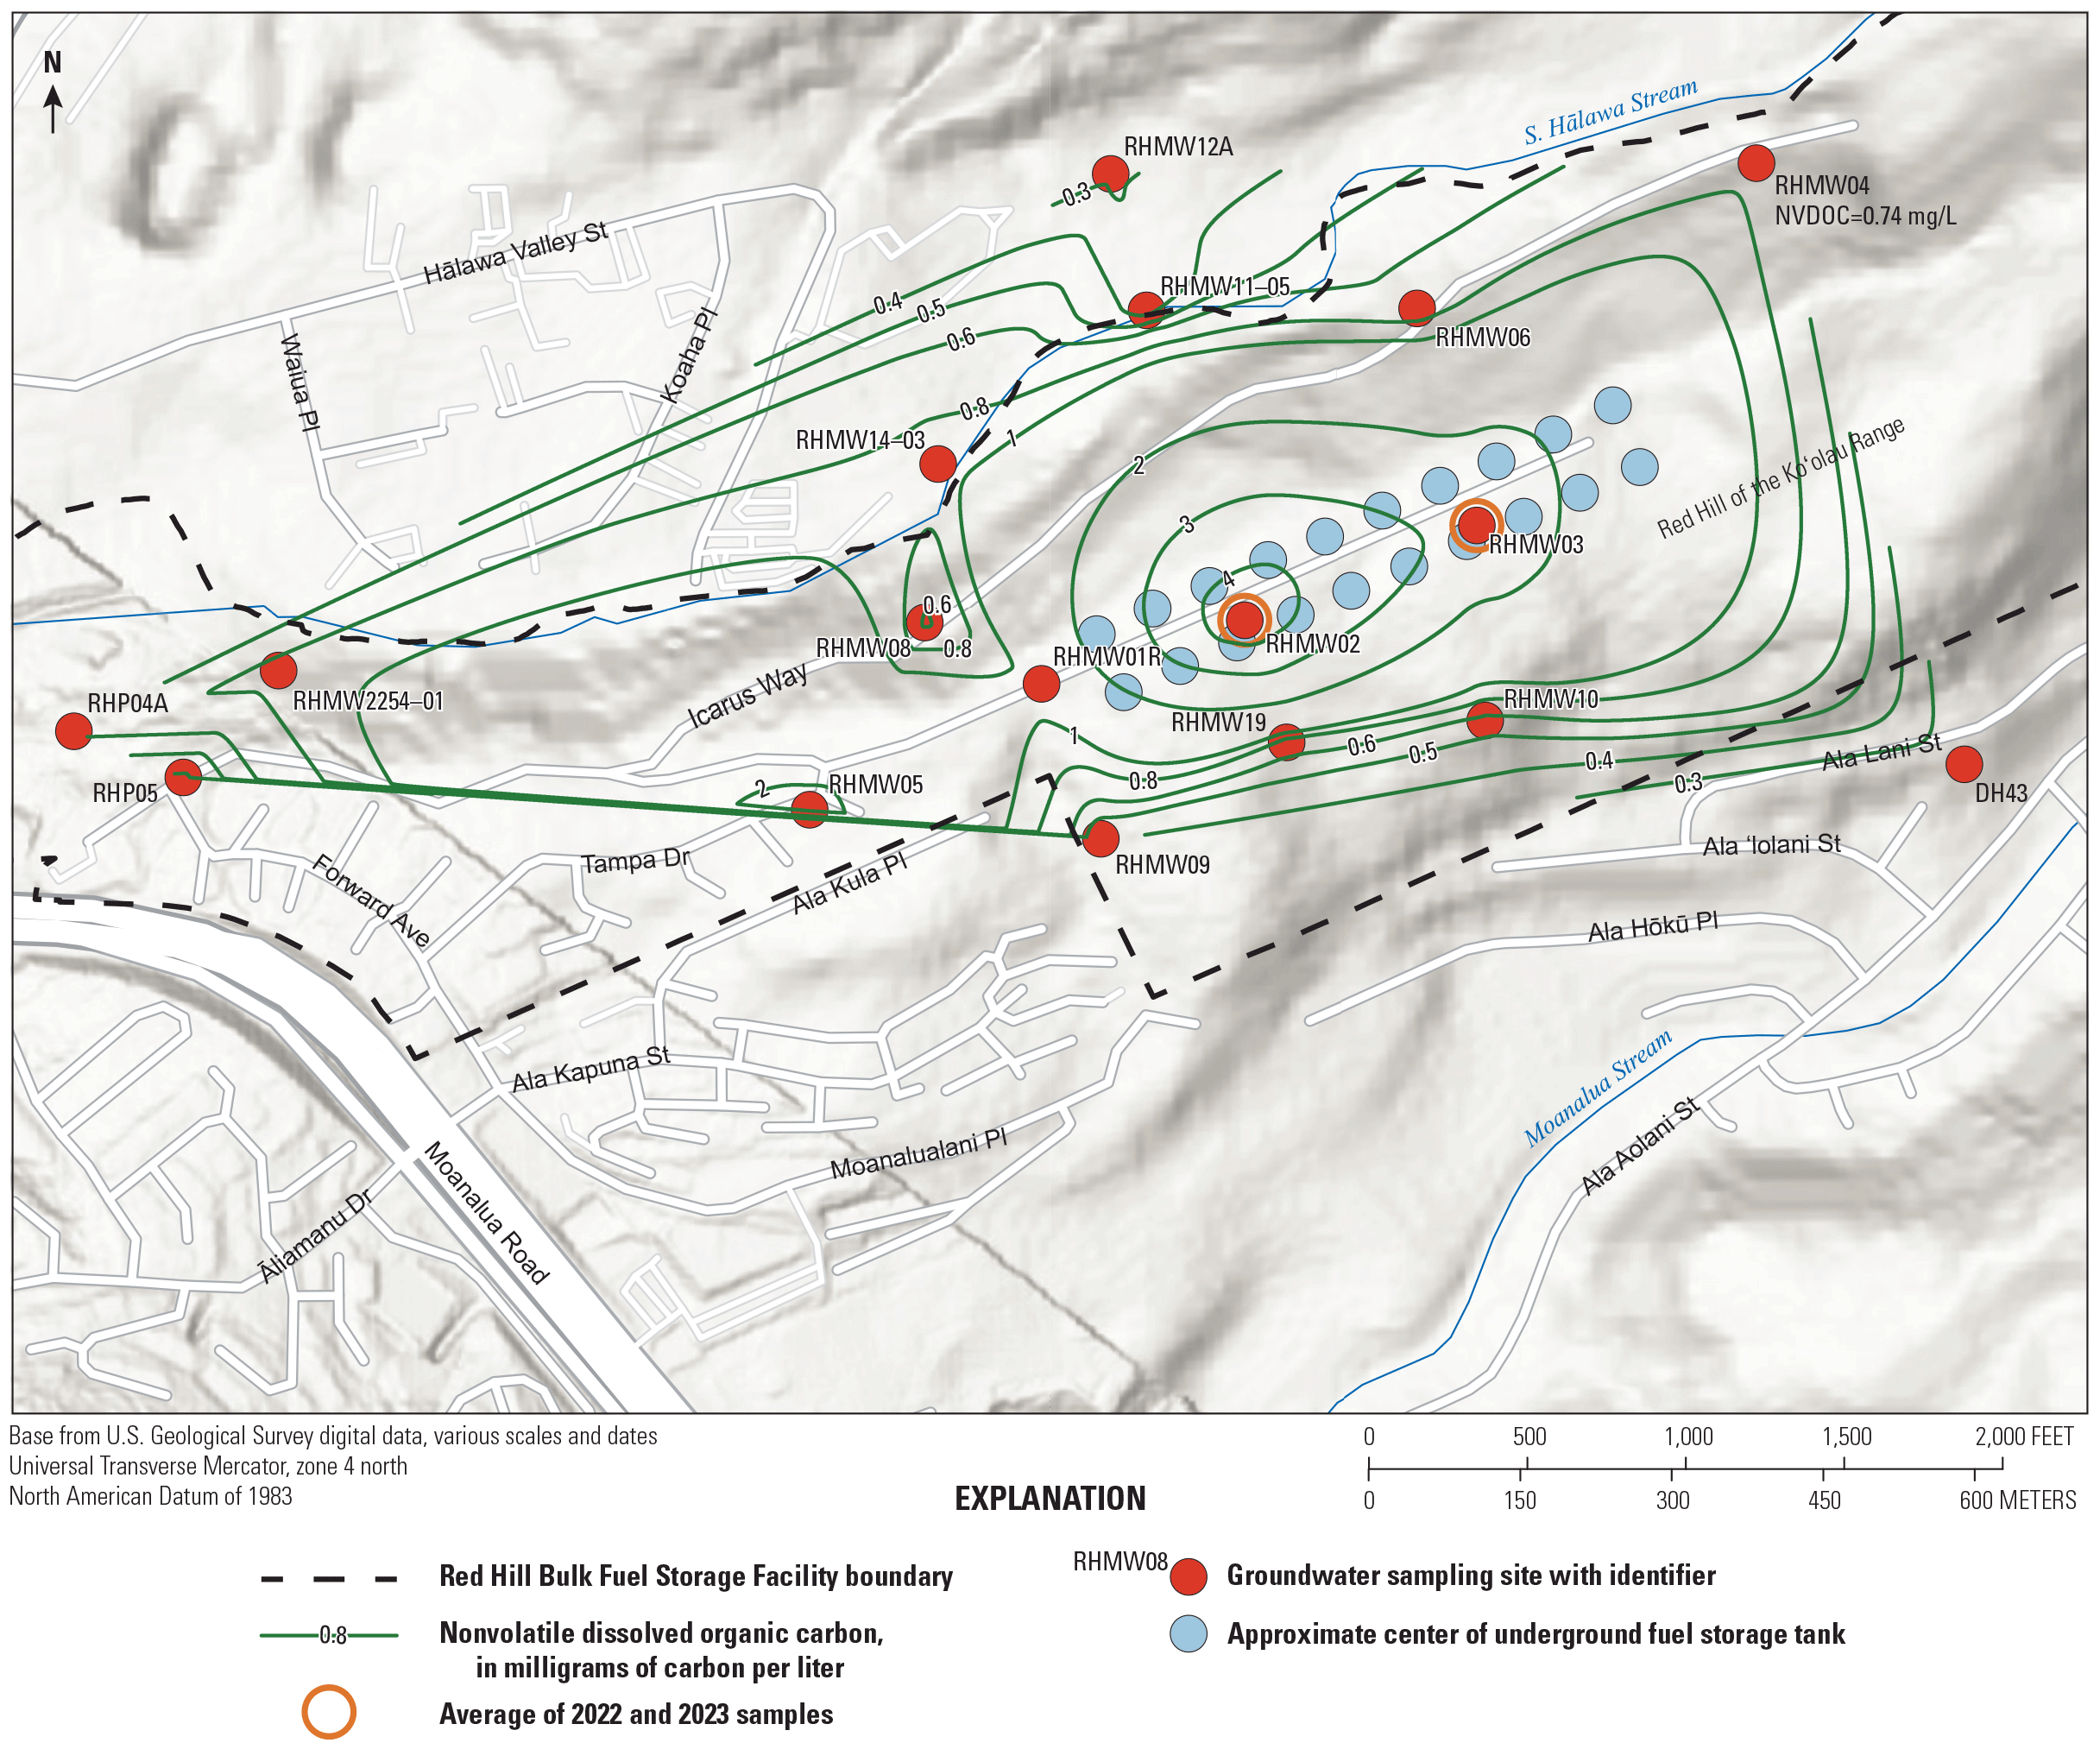
Contours of nonvolatile dissolved organic carbon concentrations in groundwater from samples collected in September 2022, January–February 2023, and April 2023 at the Red Hill Bulk Fuel Storage Facility, O‘ahu, Hawai‘i.
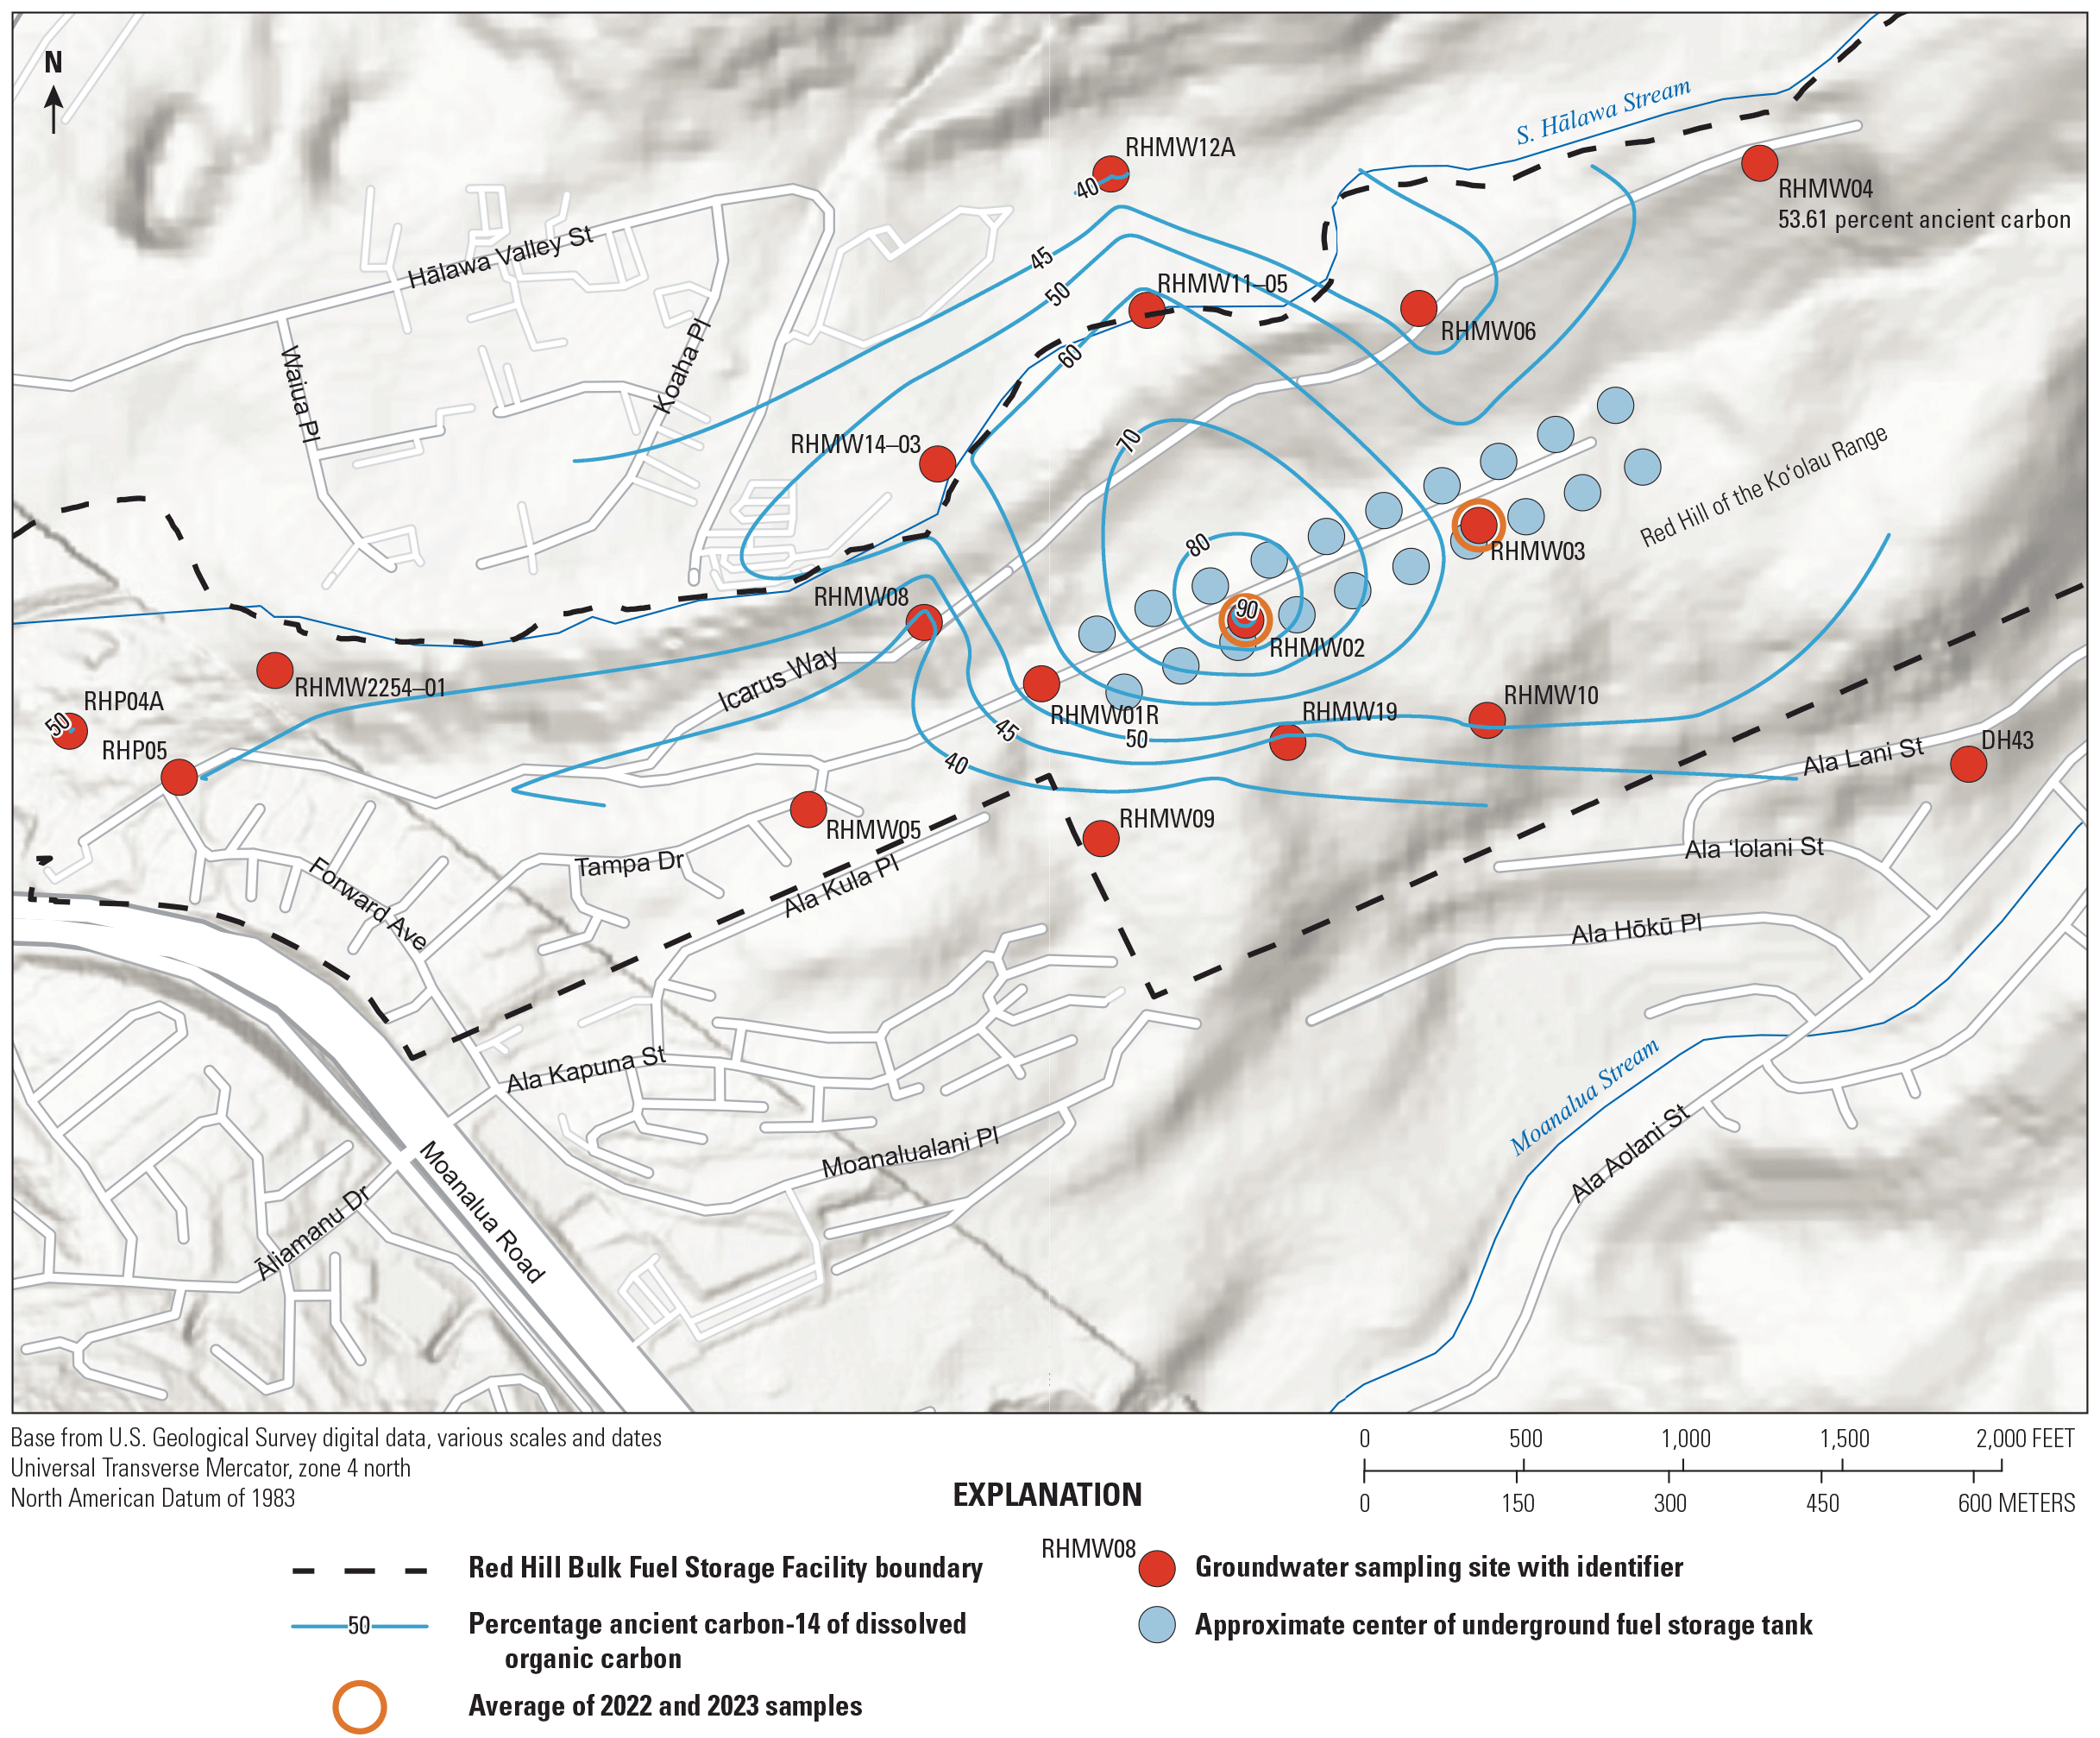
Contours of ancient carbon contents of nonvolatile dissolved organic carbon concentrations in groundwater from samples collected in September 2022, January–February 2023, and April 2023 at the Red Hill Bulk Fuel Storage Facility, O‘ahu, Hawai‘i.
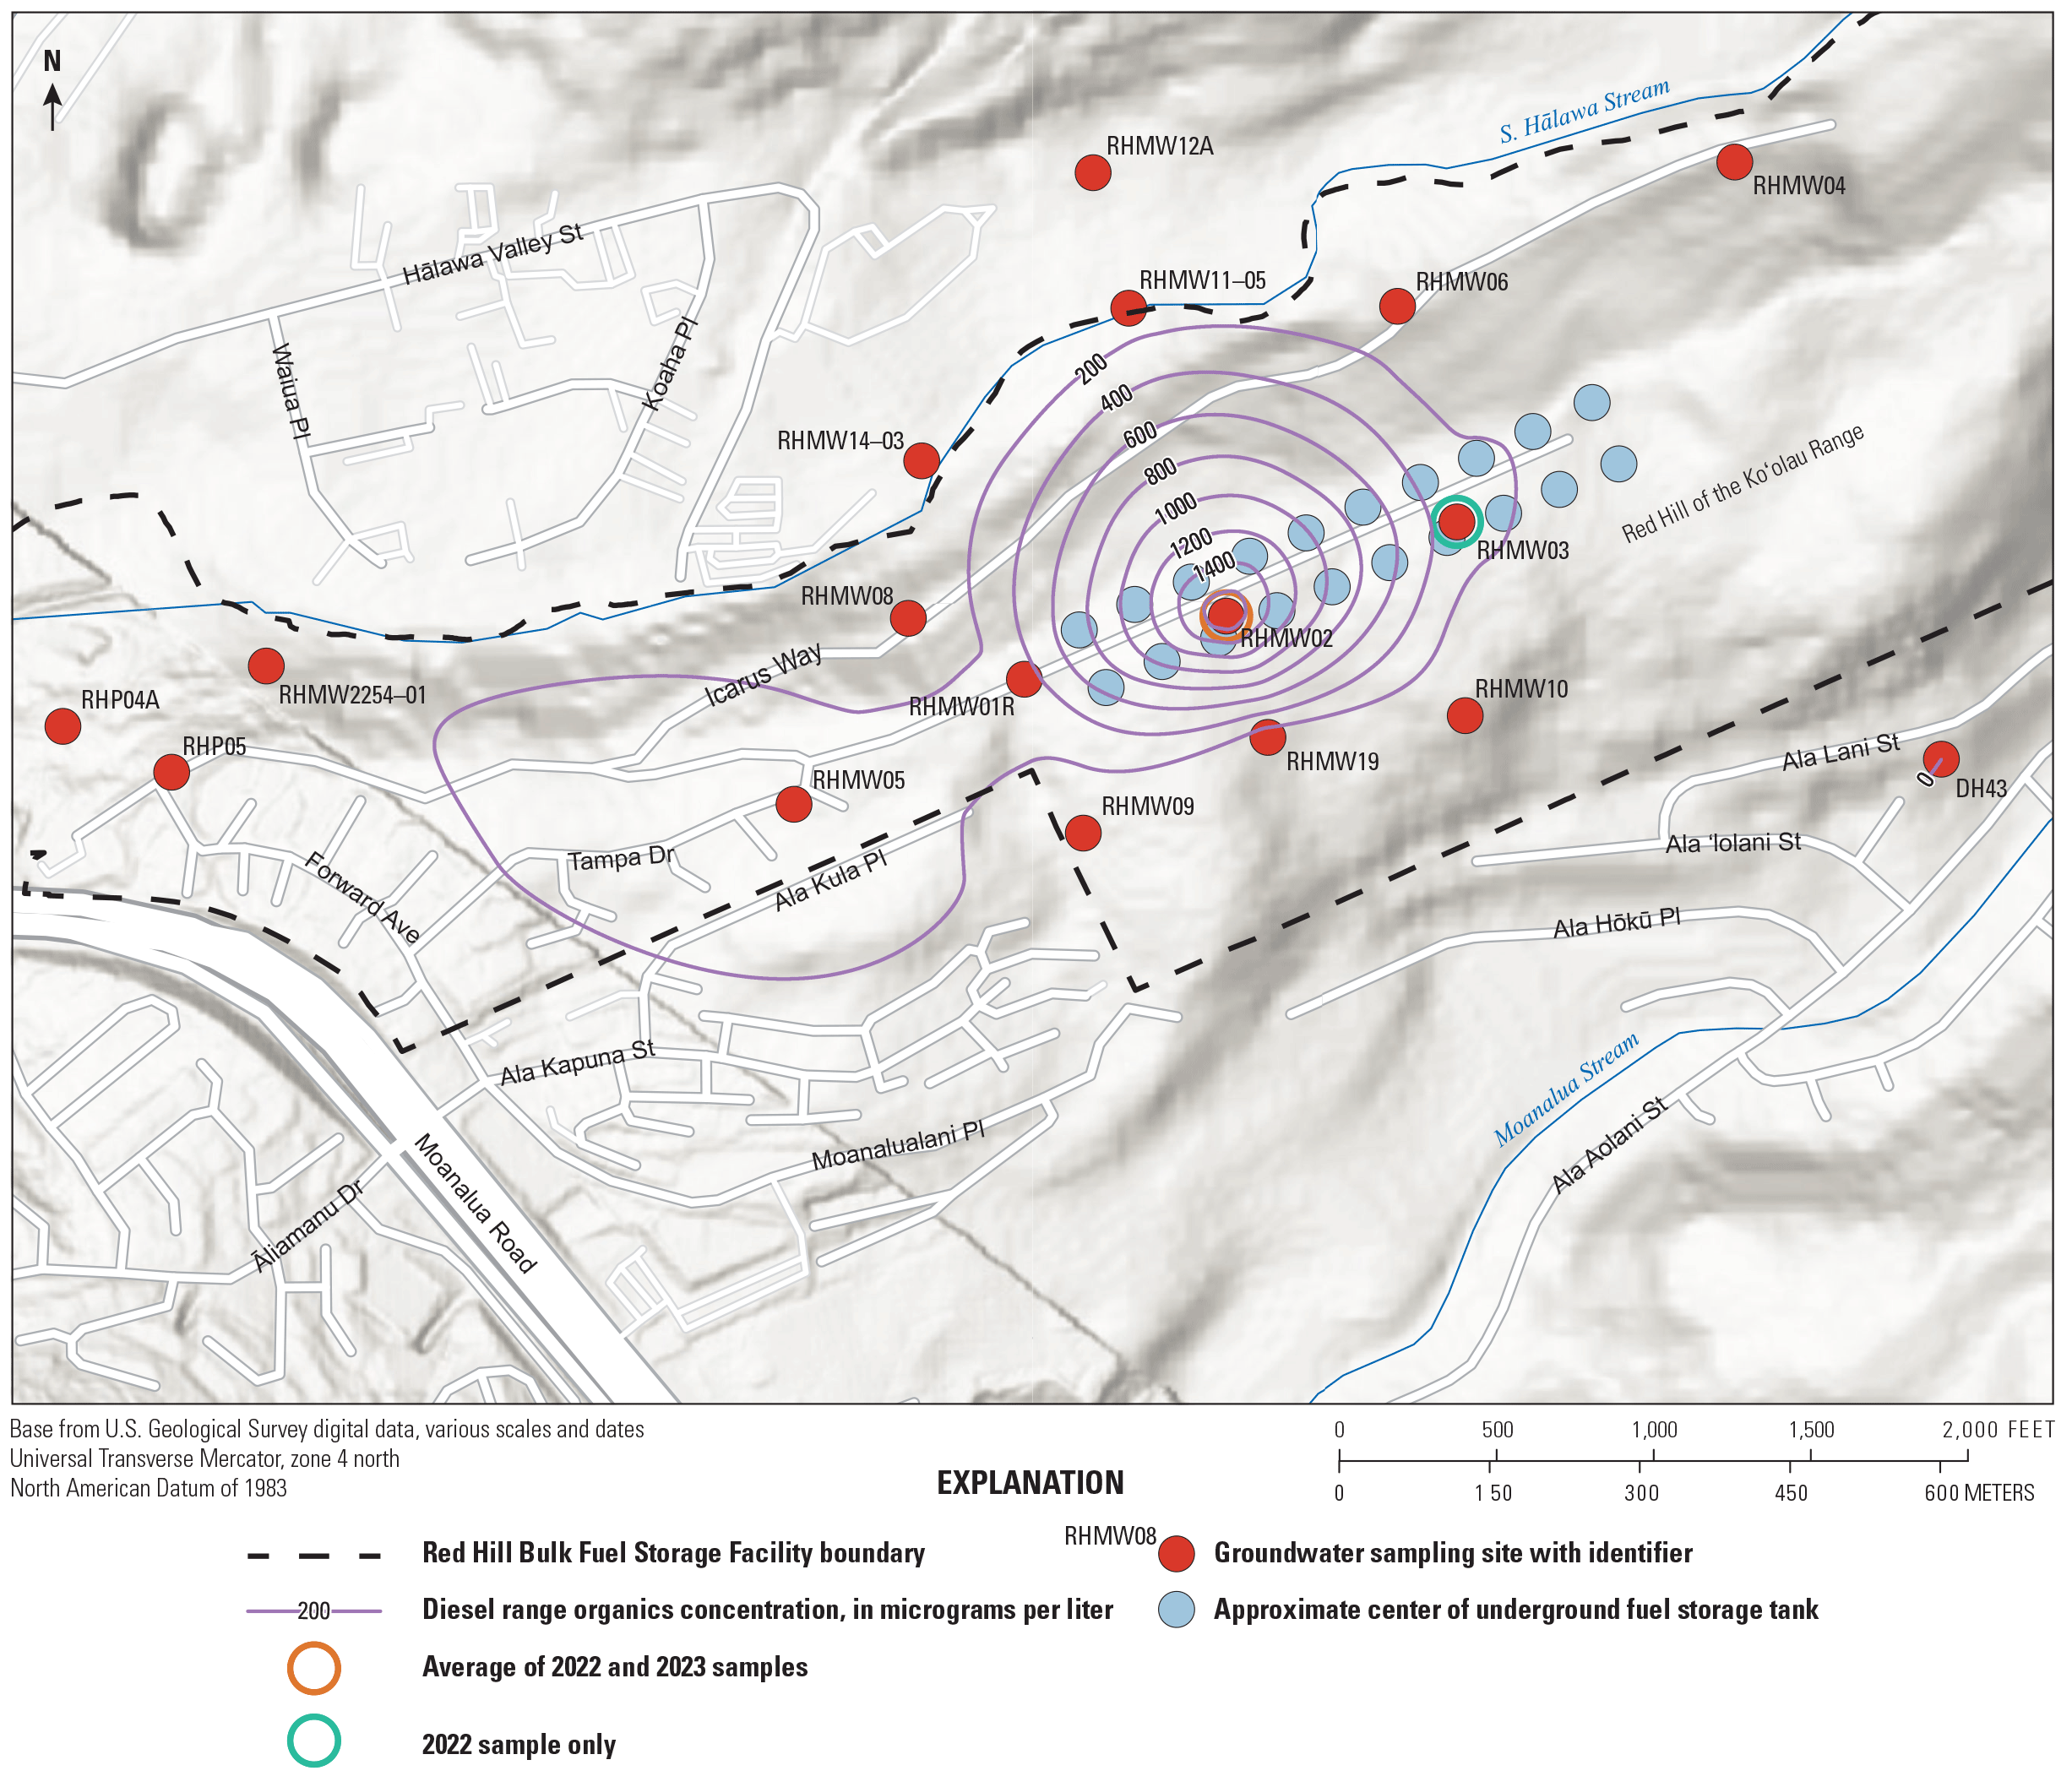
Contours of diesel range organics concentrations in groundwater from samples collected in September 2022, January–February 2023, and April 2023 at the Red Hill Bulk Fuel Storage Facility, O‘ahu, Hawai‘i.
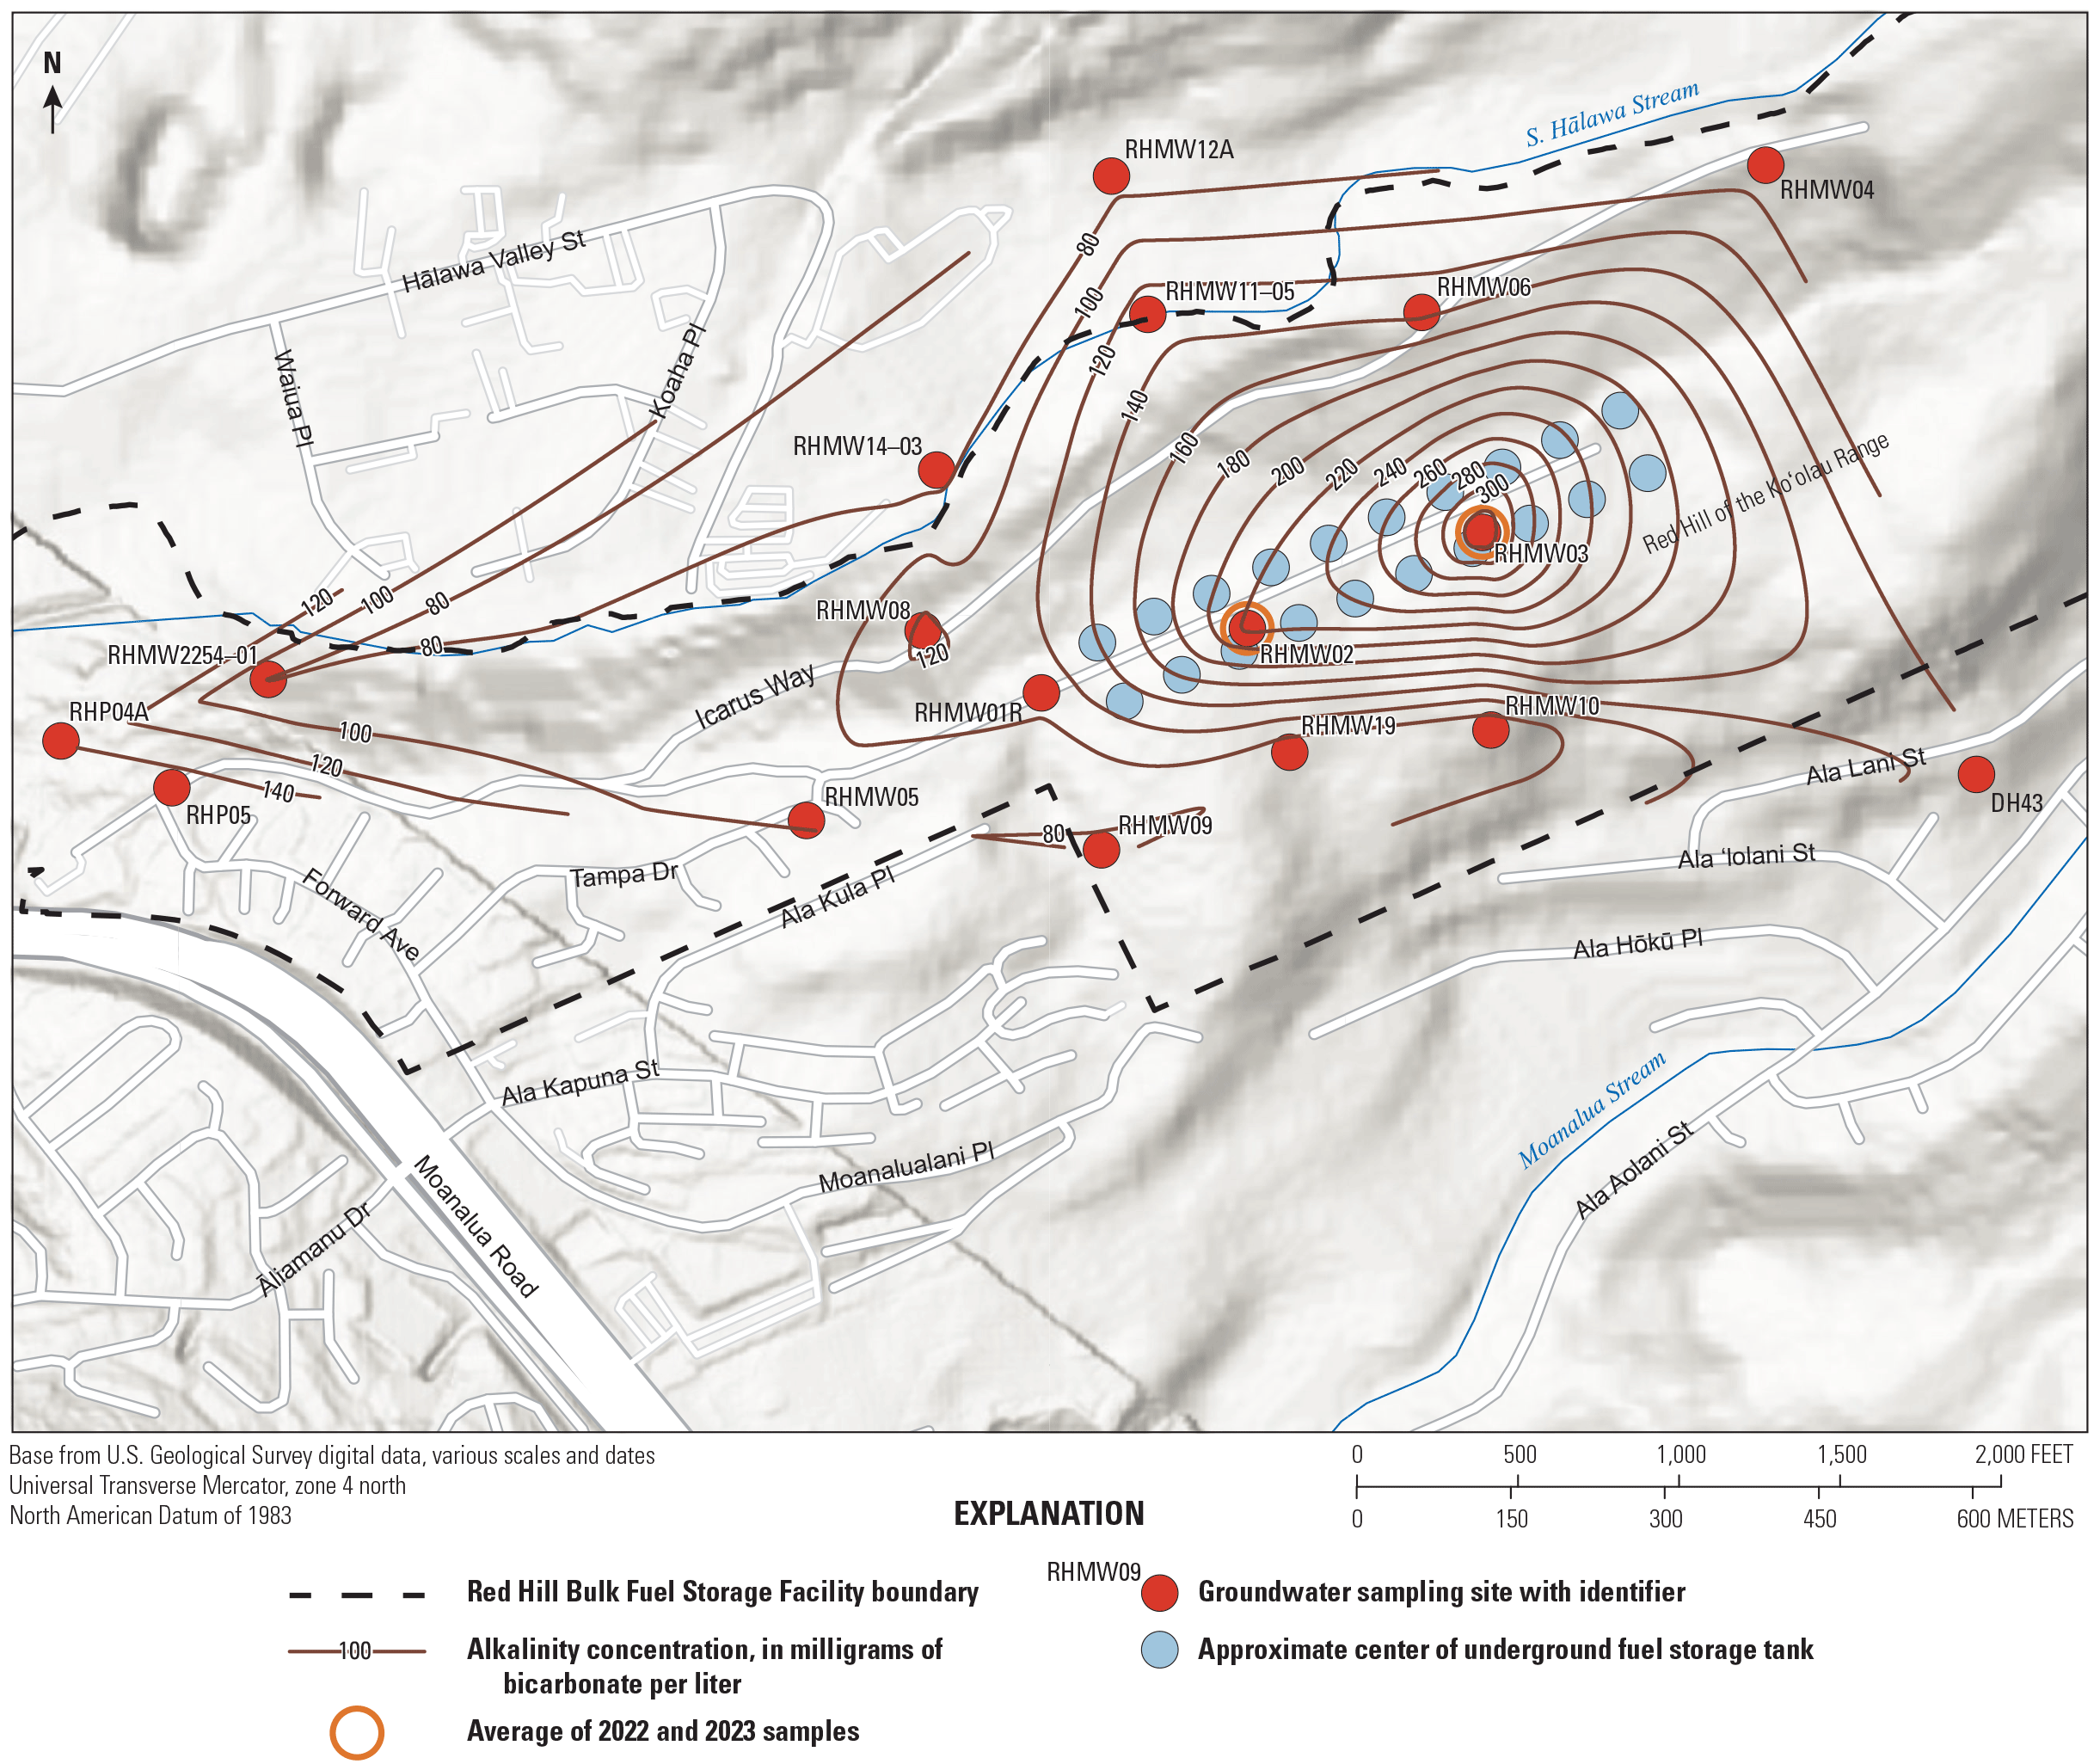
Contours of alkalinity in groundwater from samples collected in September 2022, January–February 2023, and April 2023 at the Red Hill Bulk Fuel Storage Facility, O‘ahu, Hawai‘i.
A contour map of NVDOC concentrations in groundwater is shown in figure 10. The lowest value of 0.21 mg/L, measured at the Moanalua well W–2, is assumed to represent background groundwater. It falls in the range of previous values measured by Chapelle and others (2013) on O‘ahu (0.19−0.27 mg/L) and is low for natural groundwater (Regan and others, 2017). Values measured in the three blank samples were 0.20, 0.26, and 0.30 mg/L, which are in the same range as the background sample; thus, values greater than 0.3 mg/L are considered elevated. Values less than 0.3 mg/L were detected at wells DH43 (0.21, 0.23 mg/L) and RHMW12A (0.27, 0.28 mg/L). The sampled interval of RHMW12A is −174 to −194 ft relative to local mean sea level (194–215 ft below the water table); thus, the low values at RHMW12A likely reflect the natural background NVDOC. Concentrations in groundwater at all other wells exceed 0.3 mg/L with the highest at well RHMW02 (3.33, 6.45 mg/L). The second highest concentration was from well RHMW03 (2.74, 2.92). Away from the ridge, concentrations drop rapidly by a factor of 5.2 in the approximately 700 ft between RHMW03 and RHMW10. Values at the two sampled periphery wells, RHP04A and RHP05, were 0.63 and 0.38 mg/L, respectively. Examining the overall shape and extent of the contours indicates that wells on the north and south side of the ridge are elevated; however, elevated values do not extend to well DH43 on the south side or well RHMW12A on the north side. The concentrations of NVDOC in groundwater decrease to about 10 percent of the highest concentration measured under the tanks within a distance of 700 feet to the south and 1,000 feet to the north of the ridge. The NVDOC data alone indicate no clear direction of contaminant migration away from the sources associated with the facility spills.
A contour map of the percentage of ancient C in NVDOC is shown in figure 11. As in figure 10, groundwater from well RHMW02 is most affected by hydrocarbon oxidation products with more than 90 percent ancient C in NVDOC. The contours in figure 11 indicate a broad south-southeast to north-northwest pattern of migration of ancient C from RHMW02 toward wells RHMW14–03 and RHMW11–05. However, the sampled intervals of wells RHMW14–03 and RHMW11–05 are quite deep at −140 to −158 ft relative to local mean sea level (160–179 ft below the water table) and −66 to −79 ft relative to local mean sea level (86–100 ft below the water table), respectively, calling into question whether or not the elevated ancient C values measured in these wells reflect compounds from a fuel source. The samples could be analyzed by optical methods to determine if the dissolved organic C is natural or from the facility (Podgorski and others, 2021). Groundwater from wells RHMW04, RHMW10, RHP05, RHP04A, and Red Hill Shaft RHMW2254–01 have slightly elevated ancient C values of 40–50 percent. Other techniques are needed to analyze the NVDOC from these wells to determine if the ancient C comes from biodegradation of fuel hydrocarbons.
A contour map of DRO concentrations in groundwater is shown in figure 12. The lowest contour line is set to 200 µg/L. Groundwater in the four tunnel wells exceeded the reporting limit of 190–220 µg/L, with the highest values measured at well RHMW02 (2,500 µg/L in September 2022 and 1,100 µg/L in January 2023). The values drop to the south and north of the facility. As with the ancient C map (fig. 11), the contours in this figure indicate a broad south-southeast to north-northwest direction of migration of DRO from well RHMW02 toward wells RHMW14–03 and RHMW11–05, but DRO was less than detection at RHMW14–03. The contours are dominated by the high value at well RHMW02 and provide little new information. Comparing this DRO map with the NVDOC plot in figure 10 and the ancient C map in figure 11 illustrates how the lower detection level of NVDOC combined with percentage ancient C can provide greater insight into the migration directions revealing the presence of elevated NVDOC and ancient C on the south side of the ridge. The DRO results in this study compare well with the monitoring data from 2016 to 2023 summarized in table 1. The frequencies of detection of DRO in all samples from the three tunnels wells, RHMW01R, RHMW02, and RHMW03, were 0.99, 1.00, and 0.93, respectively. For RHMW05, the overall frequency of DRO detection was 0.36 with higher frequencies in 2021 and 2022 compared to other years.
A contour map of carbonate alkalinity is shown in figure 13. All biodegradation reactions except fermentation produce CO2, which raises the carbonate alkalinity. The background value at Moanalua well W–2 (fig. 2) is 84.1 mg/L as HCO3. Higher values than this are considered an indicator of biodegradation, whereas lower values indicate less evidence for presence of a contaminant plume. Groundwater samples with alkalinity values less than the background alkalinity value were from wells RHMW12A, RHMW14–03, RHMW2254–01, RHMW09, RHMW10, RHMW05, and RHMW19. The elevated values on the map indicate a different pattern than the NVDOC (fig. 10) and the percentage ancient C (fig. 11). In this case, the highest values are at well RHMW03 (335 and 343 mg/L as HCO3 for bailed samples) and the second highest values are at RHMW02 (214 and 240 mg/L as HCO3 for bailed samples). These data indicate that biodegradation of fuel in the unsaturated zone above well RHMW03 results in transport to the water table of CO2. Also at this well, NVDOC was higher in the bailed sample compared to the pumped sample (fig. 7) consistent with a source of partial transformation products in the unsaturated zone. Previous studies have established that aerobic biodegradation of petroleum hydrocarbons and methane lead to increased temperatures in the vadose zone and underlying groundwater (for example, Sweeney and Ririe, 2014; Warren and Bekins, 2015; McHugh and others, 2020). Mitchell and Oki (2018) determined that the groundwater temperature in well RWMW03 was 2.4–2.5 °C warmer than RHMW02. Likewise, McHugh and others (2020) measured temperatures about 2 °C higher at RHMW03 than RHMW02. These observations of increased temperatures support the conclusion from the alkalinity data that there is aerobic biodegradation of fuel in the unsaturated zone above well RHMW03. Samples from both periphery wells, RHP04A and RHP05, provide evidence of increased alkalinity consistent with biodegradation. Alkalinity at Red Hill Shaft RHMW2254–01 is not elevated. Groundwater from well DH43 had elevated alkalinity but no other clear signs of the presence of hydrocarbon oxidation products based on the NVDOC concentrations and ancient carbon percentage. Petroleum hydrocarbons in the diesel and oil range were detected at well DH43 in 2022 on February 23 (2.53 mg/L), March 6 (1.83 mg/L), and May 5 (0.46–0.06 mg/L) (Honolulu Board of Water Supply, 2024). These concentrations decreased with time from greater than 2 mg/L in February to less than 0.5 mg/L in May. The decreasing trend is consistent with the lack of evidence for fuel contamination by the time of sampling on April 11, 2023, in this study.
Ancient Carbon in Soil Carbon Dioxide
In this section, results from soil probe gas samples, soil C trap samples, and dynamic closed chamber measurements of soil CO2 efflux at the facility are discussed. Data that are the basis for this discussion are primarily from Jaeschke and others (2023) and the USGS National Water Information System database (U.S. Geological Survey, 2024) unless otherwise referenced. A detailed discussion of 14C units and approaches for data interpretation is in appendix 1.
For discussions of 14C in soil and atmospheric CO2, 14C contents are referenced to the absolute international standard for the base year 1950 (Stuiver and Polach, 1977). Carbon-14 data from WHOI NOSAMS were first converted from conventional percentage modern C (pMCsample) to ∆14C notation using equation 1.1 in appendix 1, where ∆14C notation reports sample 14C content relative to the absolute international standard for the base year of 1950 (Stuiver and Polach, 1977). To keep language consistent in this report (though it is not the typical 14C convention), the atmospheric ∆14C values from Graven and others (2017) and the soil ∆14C values were converted into an absolute percentage modern notation, which is corrected for age since 1950 (pMCage-corr) using equation 1.2 in appendix 1. A subset of soil 14C contents in CO2 from soil probe samples in conventional percentage modern (pMCsample), ∆14C per mil, and absolute (age-corrected) percentage modern (pMCage-corr) notations are listed in table 7 (columns beginning with “soil probe sample”).
Table 7.
Compilation of soil carbon trap and cartridge results for 2017 and 2022–23 samples (Department of the Navy, 2019; McHugh and others, 2020; Jaeschke and others, 2023), literature-based atmospheric carbon-14 contents in carbon dioxide, carbon-14 contents in carbon dioxide from soil probe gas samples collected in 2022–23, and estimated reasonable ranges for background carbon-14 contents in carbon dioxide (background percentage modern carbon).[CO2, carbon dioxide; CO2 ff, ancient fossil fuel CO2 on the trap sorbent; µmol/m2/s, micromole per square meter per second; 14C, carbon-14; ∆14C, sample 14C content relative to the absolute international standard with a base year of 1950 and sample activity corrected for age and isotopic fractionation; --, no data available; ND, not detected]
Values are from Jaeschke and others (2023). The 2017 samples were originally reported in either Department of the Navy (2019) or McHugh and others (2020). .
Values in this column are calculated by equation 1.6 in appendix 1 and converted to percentage modern carbon notation with equation 1.2 in appendix 1.
Values in this column are calculated by equation 1.6 in appendix 1.
Values in this column are from Jaeschke and others (2023) and correspond to the variable pMCsample as used in equations 1.1 and 1.3 in appendix 1.
Values in this column are from Jaeschke and others (2023), converted to ∆14C notation with equation 1.1 in appendix 1.
Values in this column are from Jaeschke and others (2023), converted to ∆14C notation with equation 1.1, and then converted to percentage modern notation with equation 1.2 in appendix 1.
Values in this column correspond to the variable pMCbg in equations 1.4 and 1.5 in appendix 1. For soil trap samples, the lower limit of the reasonable range is the literature-based annual average atmospheric 14C in CO2 and the upper limit is 2 percent higher or a soil probe sample’s age-corrected soil 14C in CO2 (if it is more than 2 percent higher than atmospheric 14C in CO2); for cartridge samples on tunnel air intake and exhaust, the reasonable range is plus or minus 1 percent from the literature-based annual average atmospheric 14C in CO2.
Carbon-14 in Soil Probe Samples
All but two soil gas samples at the facility had 14C age-corrected percentage modern values higher than annual average atmospheric 14C during the study period (Jaeschke and others, 2023). The annual average atmospheric 14C was estimated to be about 99 and 98 percent modern in 2022 and 2023, respectively (table 7). These values were estimated with equation 1.6 in appendix 1. Equation 1.6 is a linear regression equation fit to annual average atmospheric 14C values for 2005–15 from Graven and others (2017). Samples with 14C contents greater than atmospheric 14C indicate that ancient fossil fuel-derived CO2 is not present in detectable quantities in soil gas at land surface.
Two samples at site T3 (fig. 5), a regular sample and a field duplicate sample, had 14C contents (97.85 and 97.35 percent modern, age corrected) slightly less than the estimated annual average atmospheric 14C of 98 percent modern in 2023. This difference is too small to confidently classify the T3 results as a detection of ancient C because of variability in atmospheric 14C and measurement error. During 2020, 12 samples of atmospheric CO2 were collected at Mauna Loa Observatory and analyzed for 14C content (about 200 miles from the facility). These samples varied by about 1 percent modern (10 per mil); similar annual ranges in atmospheric 14C were observed at stations in La Jolla, Calif.; Samoa; and the South Pole (Graven and others, 2022). This atmospheric variation in 14C, coupled with the laboratory measurement error (0.2 percent modern), and the standard deviation of the two samples at site T3 (0.35 percent modern) indicates that the 14C contents of CO2 at site T3 are not distinguishable from atmospheric 14C contents and are therefore not classified as detections of ancient C.
The average 14C content of CO2 in soil gas samples (including regular and duplicate samples) at the facility was 100.43 percent modern (age corrected), which is about 2 percent higher than average atmospheric 14C contents in 2022 and 2023. Because the 14C of soil CO2 is generally higher than atmospheric 14C at the facility, it indicates that a substantial part of the soil CO2 is produced from biodegradation of soil organic matter containing “bomb” 14C deposited in the soil since the 1950s and early 1960s. After peaking in the late 1960s, atmospheric 14C contents have been declining (Graven and others, 2017). Between June 2017 and June 2023, atmospheric 14C contents decreased from about 101 to 98 percent modern (age corrected) according to equation 1.6. Positive 14C values (values of ∆14C greater than 0 or percentage modern values greater than 100) of soil CO2 indicate “bomb” 14C whereas negative 14C values indicate CO2 that is derived from a soil C pool with an average turnover time long enough to reflect radioactive decay of cosmogenic 14C (Wang and others, 2000).
The 14C contents of CO2 in soil probe samples collected at the facility in 2022 and 2023 varied by almost 6 percent, from 97.35 to 103.06 percent modern (age corrected by applying equations 1.1 and 1.2 in appendix 1 to 14C data in Jaeschke and others [2023]). The wide range of soil 14C values is likely the result of variability across sample sites in soil moisture, temperature, and vegetation types. These are characteristics that are known to affect root respiration rates (Raich and Tufekcioglu, 2000). The sites sampled at the facility had different vegetation types, ranging from grass covered to scrub forest, to forested. Surface soil temperatures were variable during sample collection, ranging from about 23 to 36 °C for samples collected in September 2022 (Jaeschke and others, 2023). Soil moisture in the upper 10 cm of soil also varied substantially, from about 5 to 31 percent, during the September 2022 sample collection (Jaeschke and others, 2023). Soil temperature and moisture were not measured during the January 2023 sample collection, but samples were collected at different times of day and some sites were rarely exposed to direct sunlight because of their position on slopes.
Soil Carbon Traps
In 2022 and 2023, 8 traps were deployed at 6 sites at the facility (fig. 5). No detections of ancient fossil fuel-derived CO2 were reported by the laboratory for any of these trap samples (table 7; Jaeschke and others, 2023). These results are consistent with the soil probe samples and support the conclusion that no detectable ancient fossil fuel-derived CO2 was present in soil at the locations sampled for this study; however, the 2022–23 trap results differ from 2017 reported detections at sites T1, T2, T3, and T8 (Department of the Navy, 2019; McHugh and others, 2020). Detections of ancient fossil fuel-derived C were also reported for tunnel air intake samples and upper and lower tunnel air exhaust samples collected in 2017 (table 7; Department of the Navy, 2019; McHugh and others, 2020). The mass of ancient fossil fuel CO2 trapped on the sorbent material (CO2 ff) for each of these samples was calculated by equation 1 using analytical data measured in the laboratory. The values used for these calculations are provided in table 1.1 in appendix 1 and Jaeschke and others (2023). The reported masses of ancient fossil fuel-derived CO2 (CO2 ff) for 2017 trap samples were near zero (0.002–0.085 gram, table 7), which is the operational “detection limit” of equation 1.
Positive CO2 ff values from equation 1 are classified as detections, but CO2 ff values that are less than or equal to zero are classified as nondetects. Nondetects are represented as “ND” in table 7, table 8, and table 1.1 in appendix 1. The calculated CO2 ff values from equation 1 that are less than 0 are shown below the zero line in figure 14A and B. Positive CO2 ff values are shown as numeric values in table 7, table 8, and table 1.1 in appendix 1 and shown above the zero line in figure 14A and B. The laboratory provided ancient C efflux rates in micromoles per square meter per second (µmol/m2/s) for all samples classified as detections. In the following discussion, the sensitivity of classifying results as a detection or nondetect from equation 1 is examined.
Table 8.
Calculated masses of ancient fossil fuel-derived carbon dioxide accumulated on sorbent across a range of age-corrected background carbon-14 content values for soil trap and cartridge samplers deployed at the Red Hill Bulk Fuel Storage Facility, O‘ahu, Hawai‘i, in 2017 and 2022–23.[14C, carbon-14; CO2, carbon dioxide; CO2 ff, ancient fossil fuel CO2 on the trap sorbent; pMCbg, background 14C content; ND, not detected]
Values in this column correspond to the variable pMCbg in equations 1.4 and 1.5 in appendix 1. For soil trap samples, the lower limit of the reasonable range is the literature-based annual average atmospheric 14C in CO2 and the upper limit is 2 percent higher or a soil probe sample’s age-corrected soil 14C in CO2 (if it is more than 2 percent higher than atmospheric 14C in CO2); for cartridge samples on tunnel air intake and exhaust, the reasonable range is plus or minus 1 percent from the literature-based annual average atmospheric 14C in CO2. See table 7.
A probable detection for a sample is defined as a positive mass (CO2 ff) calculated from equation 1 throughout the entire estimated reasonable range of background 14C in CO2 (pMCbg).
Ancient fossil fuel CO2 (CO2 ff) values were calculated with equations 1 and 1.5 using the pMCbg values in this table and values for each sample available in table 1.1 in appendix 1.
Values in this column for samples collected in 2022 and 2023 are reported in Jaeschke and others (2023).
Values in this column for samples collected in 2017 are reported in Department of the Navy (2019) or McHugh and others (2020).
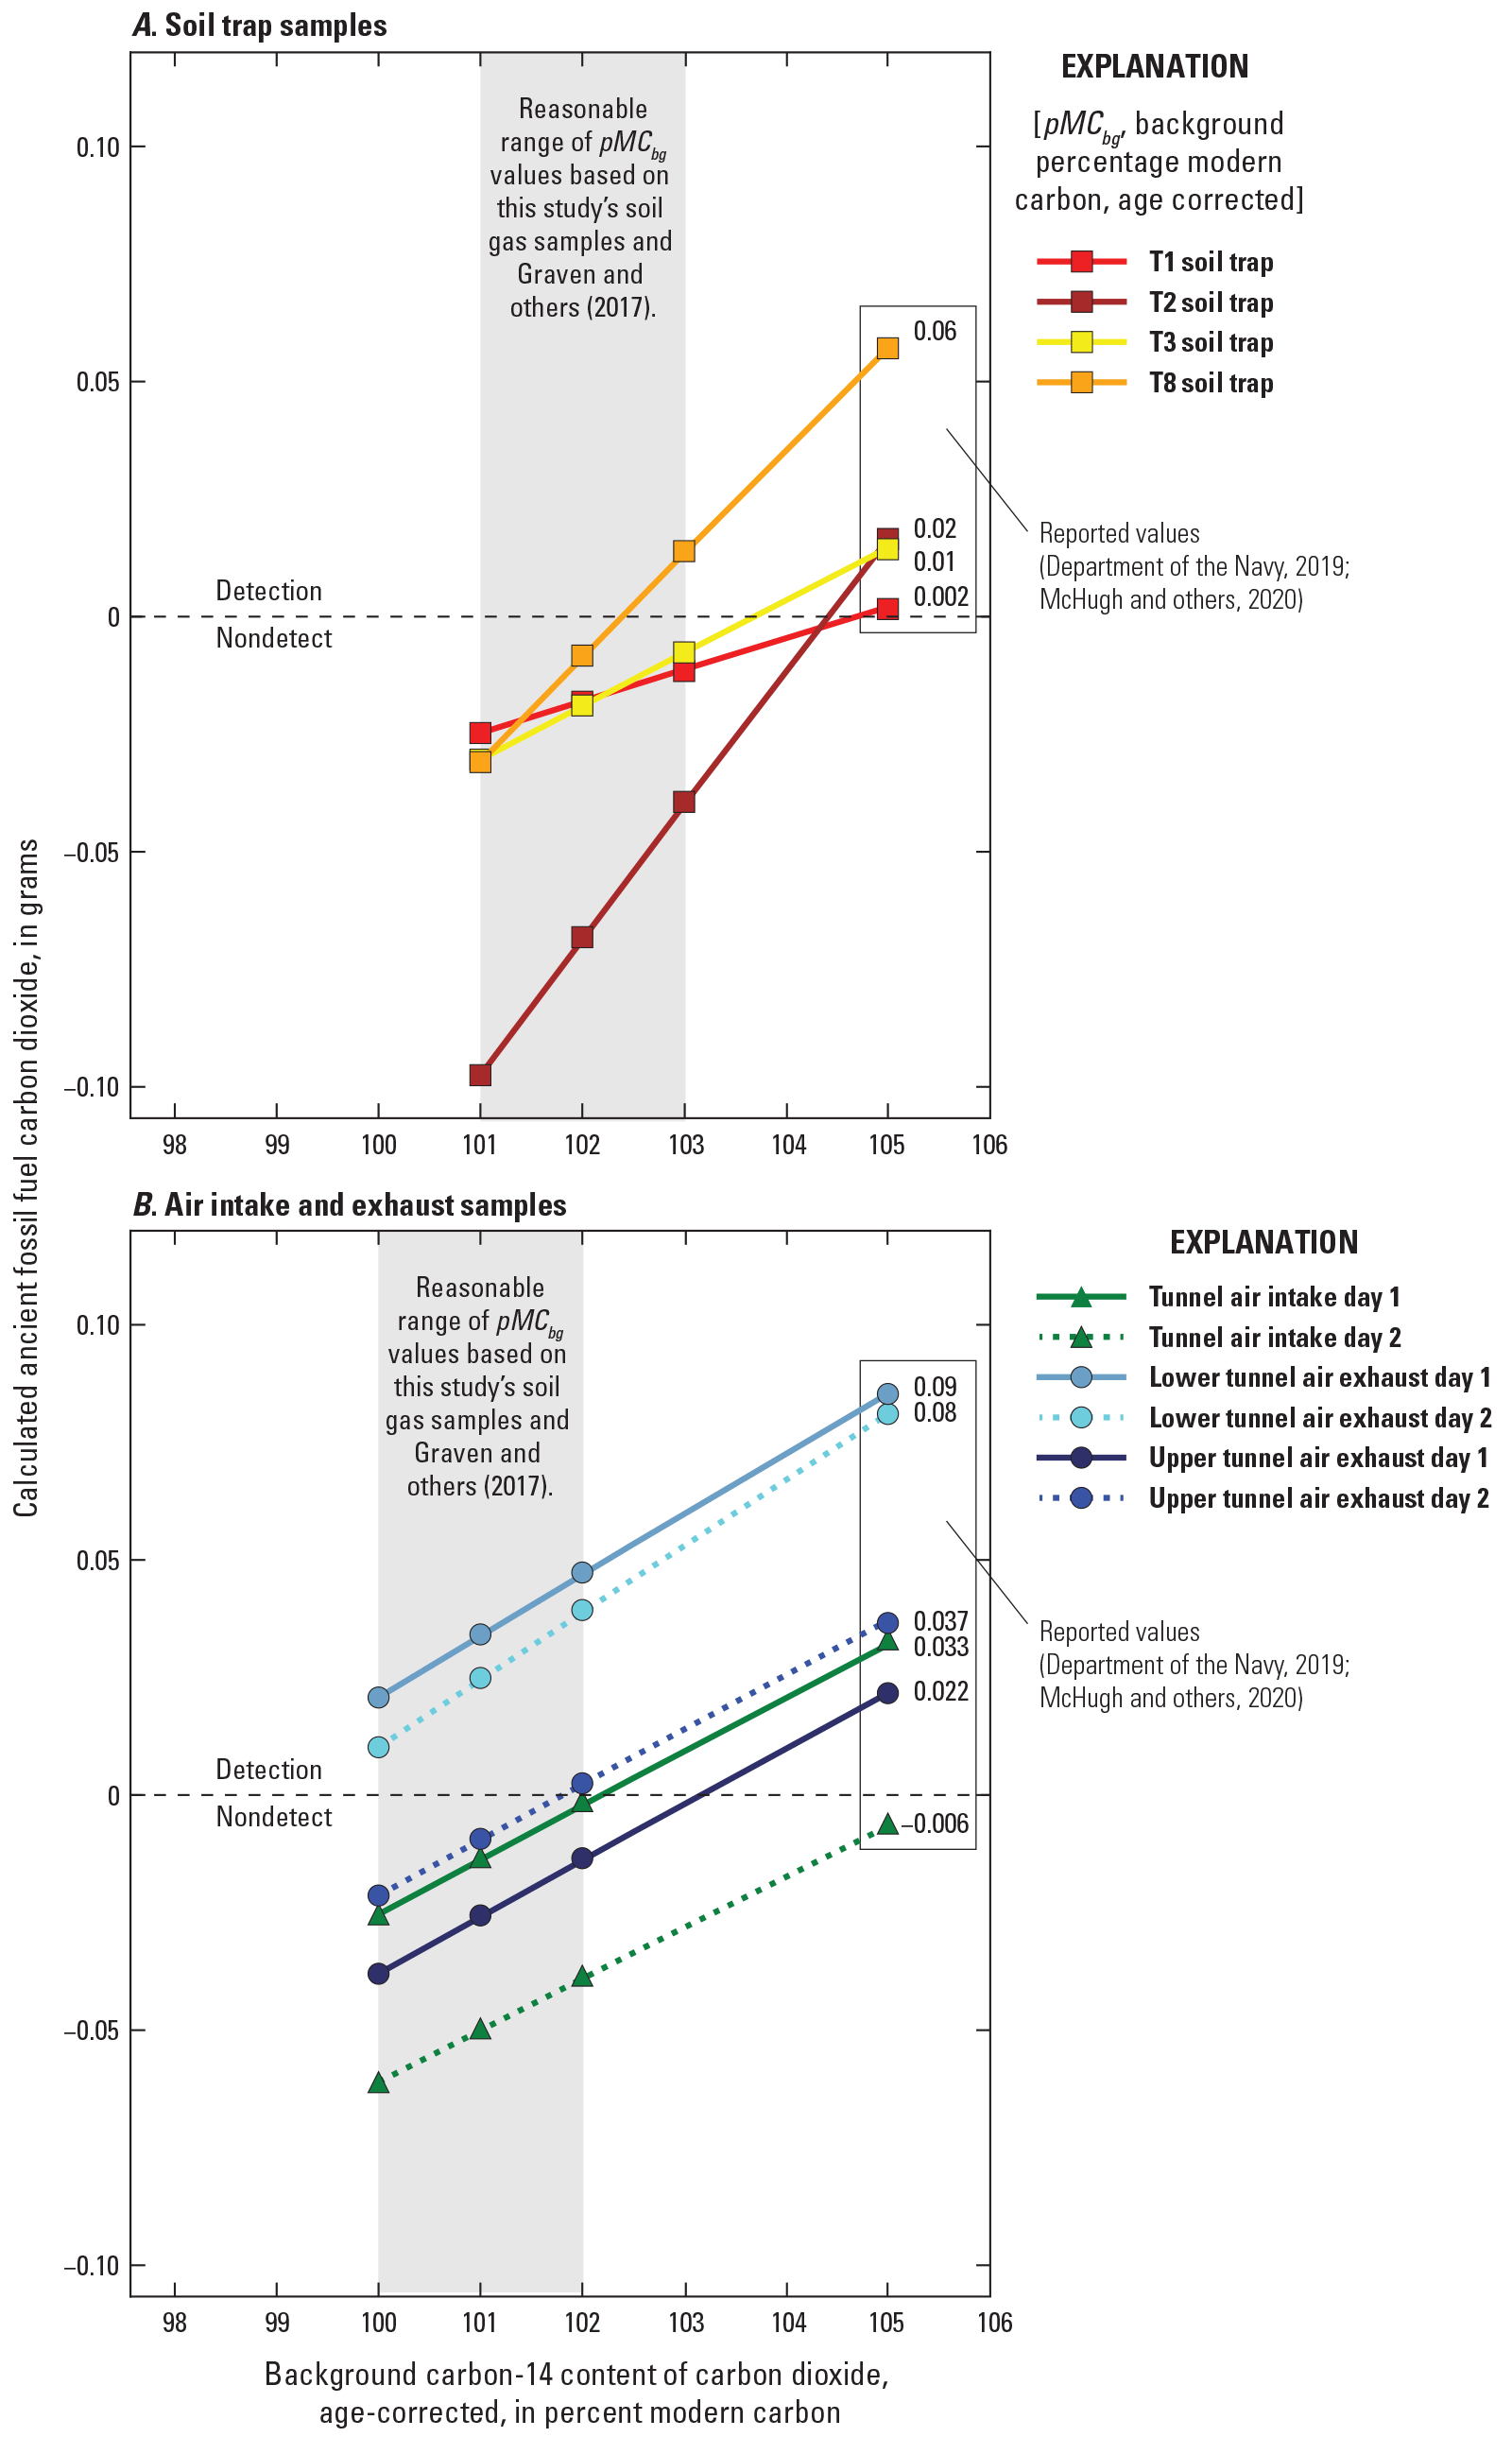
Calculated mass of ancient fossil fuel-derived carbon dioxide (CO2 ff, eq. 1) and assumed background carbon-14 contents, age-corrected (pMCbg) for (A) soil trap samples and (B) tunnel air intake and exhaust samples collected in 2017 and reported as detections (Department of the Navy, 2019; McHugh and others, 2020).
Equation 1 corrects sample results for the CO2 content and 14C composition of the trap sorbent from the travel blank (table 1.1 in appendix 1). Equation 1 relies on the variable ffsample, which is the fossil fuel fraction of a sample calculated according to equation 1.5 in appendix 1. Equation 1.5 relies on an assumed value of age-corrected background C content (pMCbg). As pMCbg for a given sample and travel blank combination increases, the calculated ancient fossil fuel CO2 mass also increases (table 8, fig. 14). Therefore, for samples near the reporting limit, classification of results as detections by equation 1 is sensitive to the assumed age-corrected background 14C content value (pMCbg).
E-Flux assumed that age-corrected background CO2 from natural soil respiration processes (pMCbg) is equal to the atmospheric 14C content (Department of the Navy, 2019; Jaeschke and others, 2024). Under this assumption, E-Flux used a fixed value of 102 for pMCbg for the 2022–23 samples (Jaeschke and others, 2023) based on literature values (Cerling and others, 2016; Larsen and others, 2018). E-Flux assumed a fixed value of 105 for pMCbg for the 2017 samples (Department of the Navy, 2019) also based on a literature value available at the time of sample analysis (Hua and others, 2013). E-Flux’s approach is typical in that literature-based annual average 14C values are considered to be representative of conditions over very large areas, such as the entire northern or southern hemisphere (Graven and others, 2017, 2020). However, this study’s soil probe field data and other comprehensive published compilations of atmospheric 14C data (Graven and others, 2017, 2020) indicate the age-corrected background 14C values used by E-Flux were likely high and indicate the trap results could be reevaluated using more reasonable values for background 14C content.
Evaluating possible ancient fossil fuel CO2 detections across a range of reasonable pMCbg values is a careful approach that provides more context for classifying sample results as detections compared to evaluating possible detections at a single literature value. For the following evaluations, samples are considered to have likely detections when equation 1 produces positive CO2 ff values across the entire site-specific reasonable range of pMCbg values listed in table 7 and table 8 and shown on figure 14. Each sample was evaluated by plugging in the age-corrected background 14C contents (pMCbg) listed in table 8 into equation 1.5 and then using the resulting ffsample values in equation 1 along with the reported sample values in table 1.1 in appendix 1.
Reasonable ranges for age-corrected background 14C contents in CO2 (pMCbg) are from published atmospheric 14C data and from soil probe samples collected in this study (table 7). The 14C content of atmospheric CO2 is trending down through time (Graven and others, 2017, 202225). Data from this study demonstrate that 14C contents of soil CO2 are variable across the facility. In 2022 and 2023, the average age-corrected atmospheric 14C was 98 to 99 percent modern (eq. 1.6 in appendix 1, based on data from Graven and others [2017]) and the average 14C of soil CO2 from soil probe samples was 100.43 percent modern (age-corrected), or about 2 percent higher than atmospheric 14C. Therefore, 2022–23 samples were evaluated over a reasonable pMCbg range of 98–101. In some cases, a soil probe sample had a 14C content more than 2 percent greater than the average atmospheric value, so the soil probe sample concentration was set as the upper limit to the reasonable range rather than 101 (table 7, table 8). Assuming the 14C of soil CO2 in 2017 was also, on average, about 2 percent higher than annual average atmospheric 14C, a reasonable pMCbg range of 101–103 is appropriate for evaluating the 2017 samples. Evaluation of the 2022–23 samples across the pMCbg range of 98–101 still indicates no detectable ancient fossil-fuel derived CO2 for all samples (table 8).
The reevaluation of reported ancient fossil fuel 14C results from the 2017 samples collected at the facility (Department of the Navy, 2019; McHugh and others, 2020) is listed in table 8 and figure 14A and B. Each line in figure 14A and B represents one field sample being evaluated over a range of age-corrected pMCbg values. The gray shading on figure 14A and B shows the reasonable range of age-corrected background 14C content (pMCbg) values (x-axis) over which the 2017 samples were evaluated. The reasonable ranges do not overlap the background 14C content of 105 percent modern, which is the value used by E-Flux in sample reports (Department of the Navy, 2019). When the pMCbg value is 105, all four soil trap samples (T1, T2, T3, T8) are classified as detections (above the zero line), as was reported previously (fig. 14A); however, within the reasonable range of pMCbg values, none of the samples’ calculated ancient CO2 masses are entirely greater than zero. Therefore, according to the metrics proposed in this report, none of the 2017 soil trap samples are classified as detections because none of the samples are always positive across the reasonable range of pMCbg values (fig. 14A and B). Furthermore, when pMCbg is set to 105 for the 2022–23 samples, the range of calculated ancient fossil fuel CO2 masses for the 2022–23 samples overlaps with the calculated masses for the 2017 samples (table 8). This is further evidence that the analytical results for the soil trap samples are similar from the two studies and the detections of ancient C reported from the 2017 samples were affected by the selection of a high age-corrected background 14C value.
In 2017, cartridges were used to collect CO2 from the tunnel air intake and exhaust systems (Department of the Navy, 2019; McHugh and others, 2020). These cartridges were not placed on soil so evaluating the trap results over a range of possible atmospheric 14C contents was more appropriate than evaluating trap results over a range of 14C from soil CO2. The average atmospheric value in 2017 was about 101 percent modern (age-corrected). Previous studies have determined that atmospheric 14C varies by about 1 percent modern (10 per mil) within 1 year at the Mauna Loa Observatory and other stations (Graven and others, 2022); therefore, the exhaust samples were evaluated over a pMCbg range of 100–102 percent modern (table 8, fig. 14B). Both lower tunnel exhaust cartridge samples were classified as detections because the calculated ancient fossil fuel CO2 mass was always greater than zero over the reasonable range of age-corrected pMCbg values (fig. 14B, table 8). No other tunnel intake or upper tunnel exhaust samples were classified as detections because they were not always positive over the reasonable range of age-corrected background 14C values (table 8, fig. 14B).
In conclusion, only the lower tunnel exhaust samples from 2017 are classified as detections using a method that accounts for reasonable ranges of 14C contents of background CO2. All other intake, exhaust, and soil trap samples collected in 2017 and 2022–23 are not classified as detections.
Dynamic Closed Chamber Soil Carbon Dioxide Efflux
Soil CO2 effluxes measured with a dynamic closed chamber were highly variable at the facility, ranging from site average values of 1.34 to 7.72 μmol/m2/s (fig. 15). As previously discussed, none of the sites sampled in 2022–23 had detectable ancient C in soil CO2; therefore, the variability in measured soil CO2 effluxes only represents variability in natural soil respiration rather than variability caused by mixtures of natural soil respiration and petroleum biodegradation.
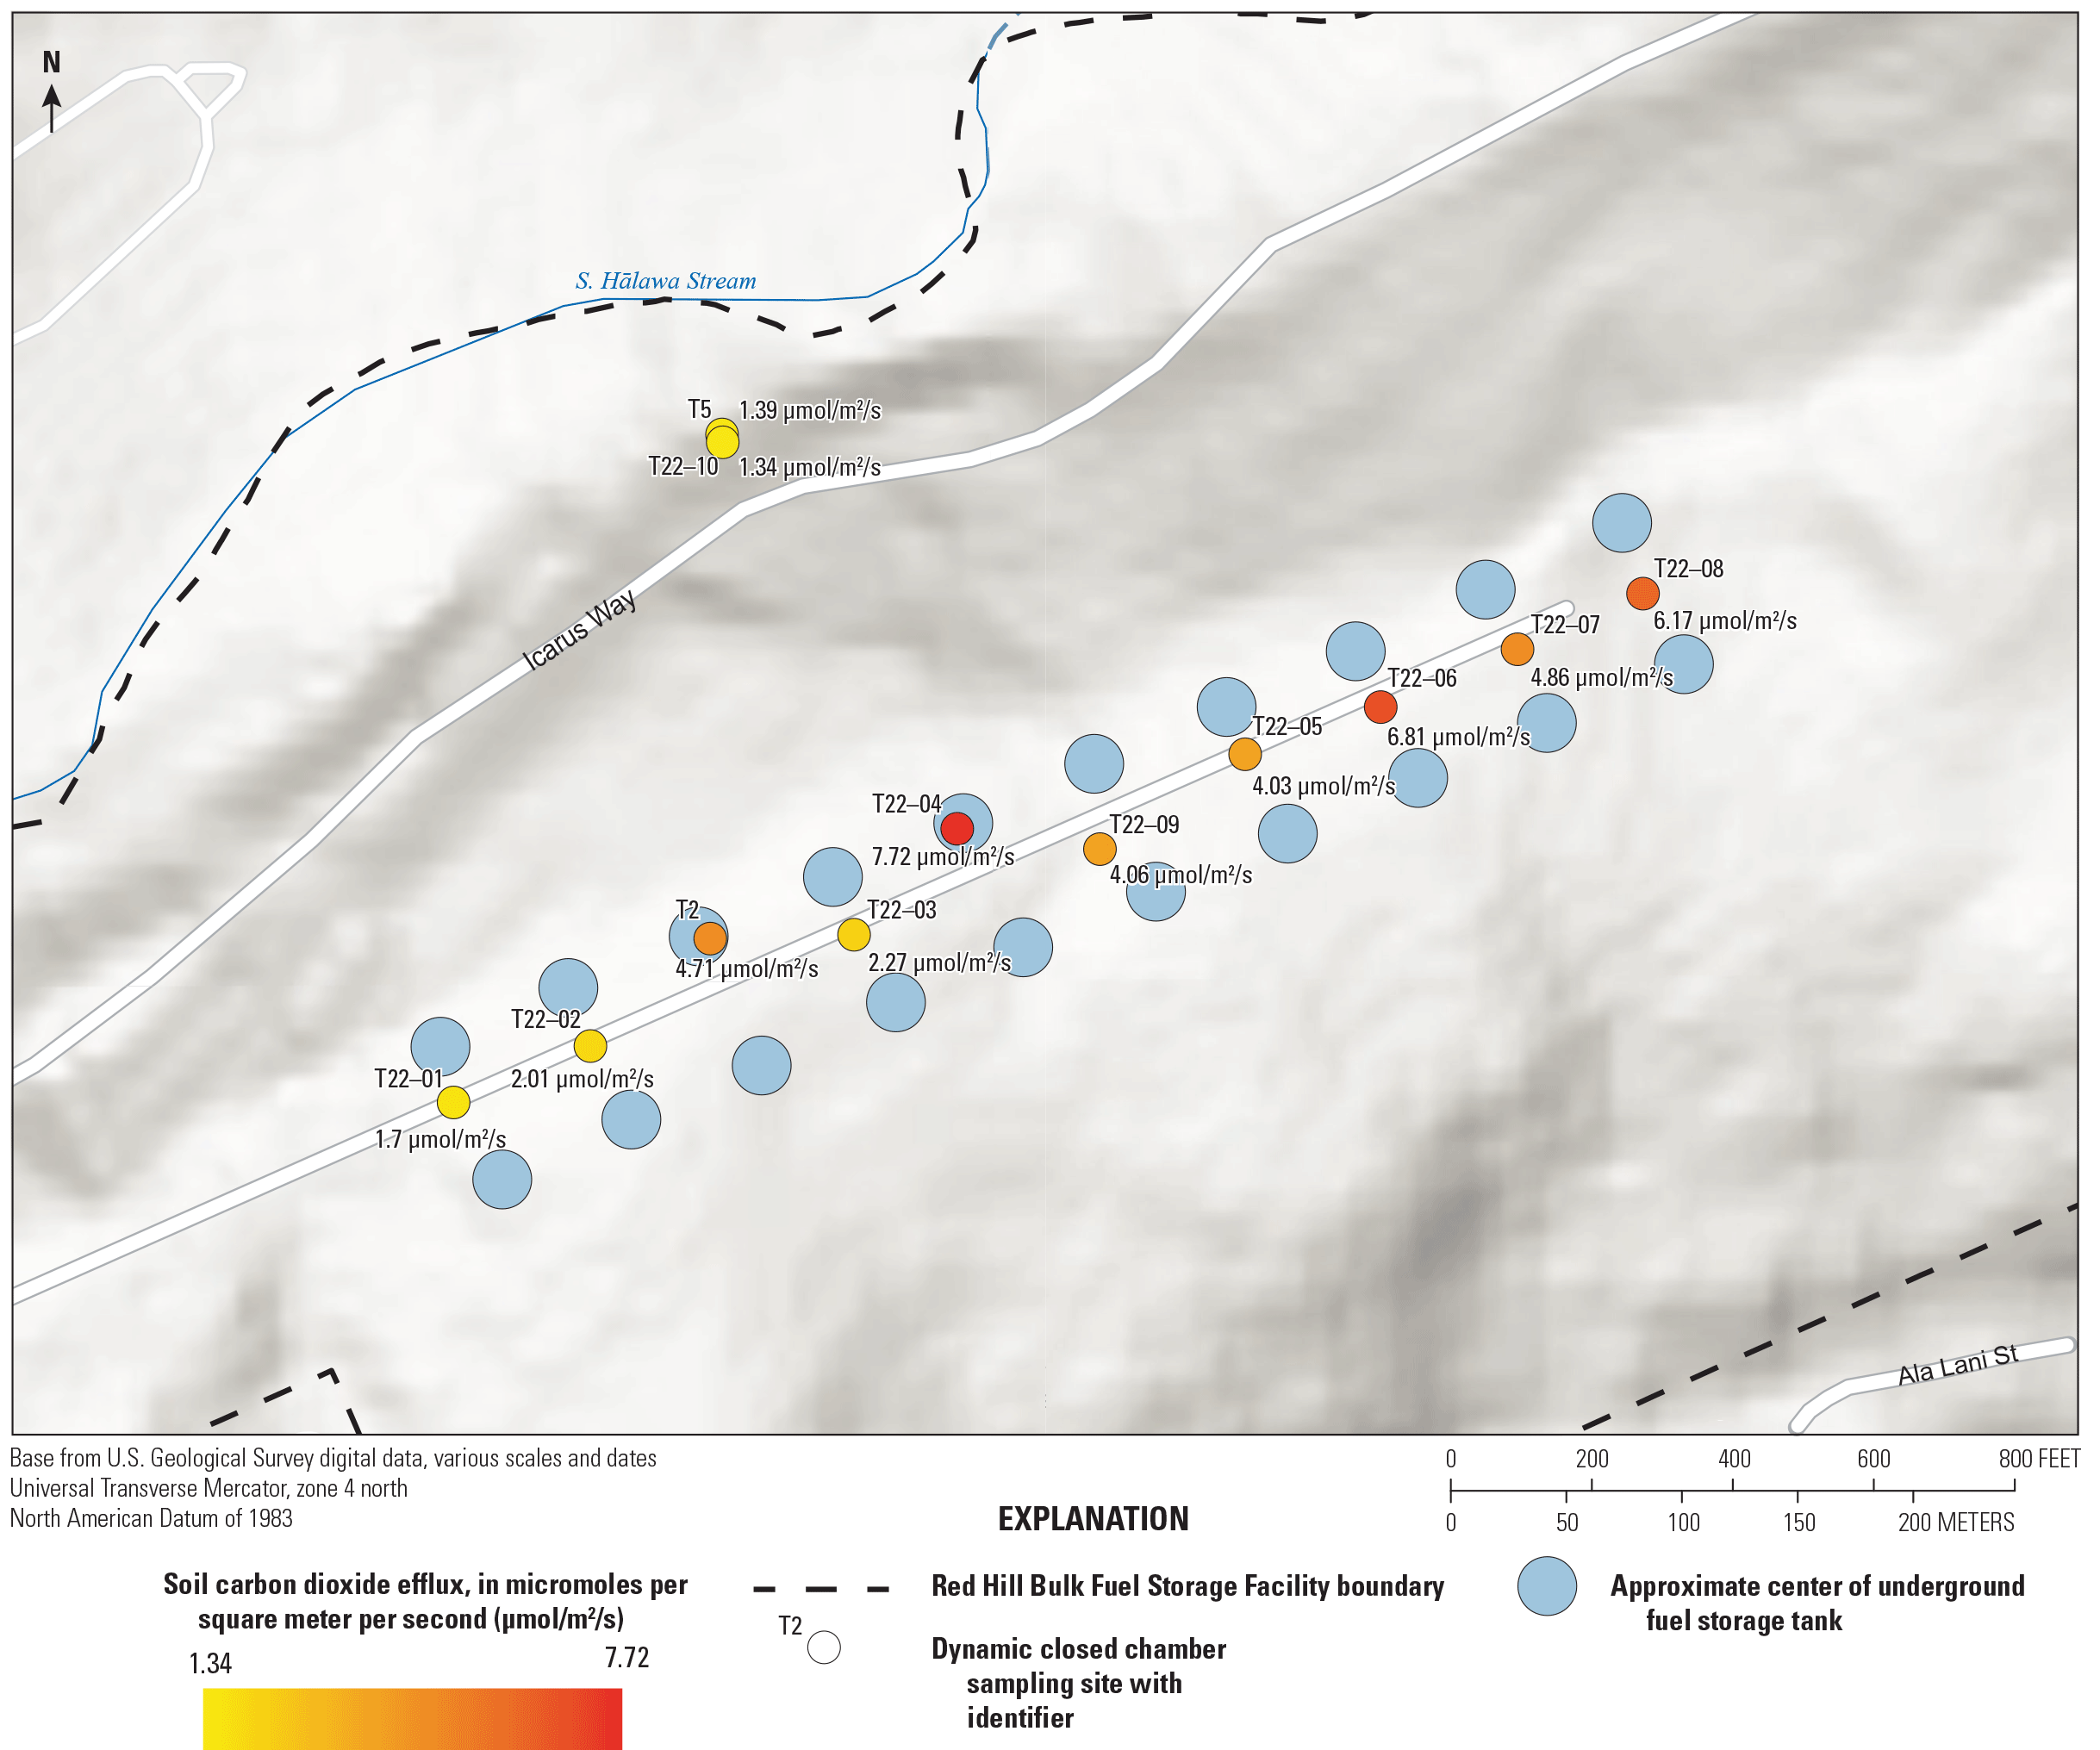
Average dynamic closed chamber soil carbon dioxide efflux measurements made in September 2022 at the Red Hill Bulk Fuel Storage Facility, O‘ahu, Hawai‘i.
The variability in natural soil respiration at the facility is large compared to variability in measured soil CO2 effluxes at the well-documented Bemidji site. At the Bemidji site, the magnitude of soil CO2 effluxes has been used to distinguish sampling locations unaffected by petroleum biodegradation from “affected” locations where petroleum biodegradation is occurring (Sihota and others, 2011). At the Bemidji site, 30 years after a crude oil spill occurred, the average CO2 efflux at unaffected locations was 3.29 µmol/m2/s compared to an average of 5.89 µmol/m2/s at affected locations where oil was degrading (Sihota and others, 2011). The individual efflux measurements at affected and unaffected locations were also distinct. The effluxes ranged from 2.63 to 4.45 µmol/m2/s at the unaffected locations and from 5.21 to 7.12 µmol/m2/s at the affected locations (Sihota and others, 2011). The range of natural soil respiration effluxes observed at the facility (6.38 µmol/m2/s) exceeds the range of mixed natural respiration and petroleum degradation effluxes observed at the Bemidji site (4.49 µmol/m2/s). Because of the inherent variability in natural soil respiration at the facility, a substantial increase in CO2 efflux from petroleum biodegradation would be needed to distinguish natural and contaminant effluxes based solely on the magnitude of fluxes. The magnitude of soil CO2 effluxes alone could not be used to estimate natural source zone depletion rates at the facility.
Summary
This study had two goals. The first was to provide information helpful to determine the direction of migration of fuel compounds and biodegradation products in the groundwater below the Red Hill Bulk Fuel Storage Facility (the facility). The second was to determine whether or not surface measurements of carbon dioxide efflux can help to locate fuel source zones in the underlying unsaturated zone.
To determine the direction of migration of fuel-related compounds in groundwater, a total of 19 wells were sampled. These included one well known to be unaffected by contamination that served as a background well. The groundwater analyses included nonvolatile dissolved organic carbon (NVDOC), ancient carbon in NVDOC, and diesel range organics (DRO). In addition, a suite of analytes known to be altered during biodegradation of petroleum fuels in groundwater, including major anions, cations, pH, alkalinity, and trace metals, was measured.
The results indicate that NVDOC correlates with ancient carbon, indicating that concentrations of NVDOC elevated to greater than background originate from a fuel source. The NVDOC concentrations are almost three times higher than DRO values in the same wells, demonstrating that DRO analyses quantify only a fraction of the compounds migrating from the fuel source zones.
The NVDOC concentrations and ancient carbon data indicate that groundwater from well RHMW02 has the highest concentrations of partial transformation products from fuel. The ancient carbon data indicate partial transformation products are present in wells on the north and south sides of the ridge. The NVDOC concentrations in groundwater decrease to about 10 percent of the highest concentration measured under the tanks within a distance of 700 feet to the south and 1,000 feet to the north of the ridge, indicating biodegradation, dilution, or both.
Further analyses of the organic carbon may help determine if biodegradation is important. Optical methods could be applied to determine if increased oxidation of the NVDOC with distance occurs during biodegradation. These measurements would also help to distinguish ancient natural organic matter in the unaffected aquifer from NVDOC migrating from fuel sources. In addition, a few puzzling cases could be investigated further, such as the elevated NVDOC with low ancient carbon in groundwater from well RHMW05 and the small concentration of ancient carbon at RHMW11–05.
The carbon-14 content of soil carbon dioxide in samples collected with a soil probe were determined at 28 sites overlying the facility and the adit 3 tunnel. The modern and ancient fossil fuel components of soil carbon dioxide efflux were determined from soil carbon traps deployed at six sites overlying the tank farm. Bulk soil carbon dioxide efflux was measured with a dynamic closed chamber at 12 sites overlying the tank farm.
Ancient carbon from biodegradation of fuels was not detected in any of the soil probe or carbon trap samples above the facility. Soil carbon trap results were evaluated using an approach that accounts for variability in the background carbon-14 content of carbon dioxide. Calculations that used reasonable ranges of background carbon-14 contents were key to determining whether or not soil carbon trap results near the reporting limit should be classified as detections of ancient fossil-fuel-derived carbon dioxide. Using this approach, a reanalysis of the 2017 carbon trap data (Department of the Navy, 2019; McHugh and others, 2020) indicates that the only probable detections of ancient carbon in 2017 were in samples from the lower tunnel exhaust system.
Bulk measurements of soil carbon dioxide efflux with a dynamic closed chamber were highly variable across the site and could not be used to delineate areas potentially affected by fuel biodegradation. Overall, soil gas results indicate that discrete soil gas measurements at land surface were not useful for detecting biodegradation of residual fuel in the unsaturated zone at the facility.
References Cited
AMEC Earth and Environmental, Inc., 2002, Comprehensive Long-Term Environmental Action Navy (CLEAN) for Pacific Division, Naval Facilities Engineering Command Pearl Harbor, Hawaii: Naval Facilities Engineering Command, Pacific Division, prepared by AMEC Earth and Environmental, Inc., Huntsville, Ala., under contract no. N62742–90–D–0019, CTO no. 0229, [variously paged].
Beckett, G.D., Thomas, D., and Whittier, R., 2022, Technical commentary to direct aerobic NSZD of a basalt vadose zone LNAPL source in Hawaii, McHugh et al., JCH #235 (2020): Journal of Contaminant Hydrology, v. 251, article 104070, 6 p., accessed December 19, 2023, at https://doi.org/10.1016/j.jconhyd.2022.104070.
Bekins, B.A., Brennan, J.C., Tillitt, D.E., Cozzarelli, I.M., Illig, J.M., and Martinović-Weigelt, D., 2020, Biological effects of hydrocarbon degradation intermediates—Is the total petroleum hydrocarbon analytical method adequate for risk assessment?: Environmental Science & Technology, v. 54, no. 18, p. 11396–11404, accessed December 19, 2023, at https://doi.org/10.1021/acs.est.0c02220.
Bekins, B.A., Cozzarelli, I.M., Erickson, M.L., Steenson, R.A., and Thorn, K.A., 2016, Crude oil metabolites in groundwater at two spill sites: Groundwater, v. 54, no. 5, p. 681–691, accessed December 19, 2023, at https://doi.org/10.1111/gwat.12419.
Cerling, T.E., Barnette, J.E., Chesson, L.A., Douglas-Hamilton, I., Gobush, K.S., Uno, K.T., Wasser, S.K., and Xu, X., 2016, Radiocarbon dating of seized ivory confirms rapid decline in African elephant populations and provides insight into illegal trade: Proceedings of the National Academy of Sciences of the United States of America, v. 113, no. 47, p. 13330–13335, accessed December 19, 2023, at https://doi.org/10.1073/pnas.1614938113.
Chapelle, F.H., Bradley, P.M., Journey, C.A., and McMahon, P.B., 2013, Assessing the relative bioavailability of DOC in regional groundwater systems: Groundwater, v. 51, no. 3, p. 363–372, accessed December 19, 2023, at https://doi.org/10.1111/j.1745-6584.2012.00987.x.
Cunningham, W.L., and Schalk, C.W., comps., 2011, Groundwater technical procedures of the U.S. Geological Survey: U.S. Geological Survey Techniques and Methods, book 1, chap. A1, 151 p., accessed December 19, 2023, at https://doi.org/10.3133/tm1A1.
Department of the Navy, 2019, Conceptual site model, investigation and remediation of releases and groundwater protection and evaluation, Red Hill Bulk Fuel Storage Facility, Joint Base Pearl Harbor-Hickam, O‘ahu, Hawai‘i: Fort Belvoir, Va., Defense Logistics Agency Energy, prepared by AECOM Technical Services, Inc., [variously paged], accessed December 19, 2023, at https://www.epa.gov/sites/default/files/2019-07/documents/red_hill_conceptual_site_model_20190630-redacted.pdf.
Department of the Navy, 2022, Supplement to the command investigation into the 6 May 2021 and 20 November 2021 incidents at Red Hill Bulk Fuel Storage Facility: Department of the Navy, [variously paged], accessed December 19, 2023, at https://s3.documentcloud.org/documents/22077265/foia-release-red-hill-ci-june-2022.pdf.
Department of the Navy, 2023a, Final report of findings, Red Hill Shaft flow optimization study, September 19, 2023: Honolulu, Hawai‘i, prepared by AECOM Technical Services Inc., 250 p., accessed January 30, 2024, at https://health.hawaii.gov/ust/files/2023/12/REDACTED-Final-Report-of-Findings-Red-Hill-Shaft-Flow-Optimization-Study-September-19-2023_Redacted_508.pd f.
Department of the Navy, 2023b, Groundwater protection plan update—Defueling revision, Red Hill Bulk Fuel Storage Facility, Joint Base Pearl Harbor-Hickam, O‘ahu, HI: Honolulu, Hawai‘i, prepared by AECOM Technical Services Inc., 20 p. plus appendix, accessed December 19, 2023, at https://jbphh-safewaters.org/public/Final_GWPP_2023_09_28_Redacted.pdf.
Department of the Navy, 2023c, Notice of Interest (NOI) data, RH NOI–GW by well cumulative data table, final (May 2021–May 2023): Naval Facilities Engineering Systems Command, accessed November 29, 2023, at https://view.officeapps.live.com/op/view.aspx?src=https%3A%2F%2Fjbphh-safewaters.org%2Fpublic%2Flibrary%2FStreamResource.axd%3FDSN%3Dpub%26Mode%3DFile Image_Inline%26ID%3D13677&wdOrigin=BROWSELINK.
Department of the Navy, 2024, Joint Base Pearl Harbor-Hickam (JBPHH) Safe Waters website: interactive groundwater results map, accessed January 18, 2024, at https://jbphh-safewaters.org/public/framework/bannerhtml.aspx?idhtml=10769&banner=jbphh_environmental.png&title=JBPHH%20Red%20Hill%20Environmental&Dom ain=env.jbphh-safewaters.org&idMenu=90120&ddlDSN=SYSTM&DSN=SYSTM.
Doell, R.R., and Dalrymple, G.B., 1973, Potassium-argon ages and paleomagnetism of the Waianae and Koolau volcanic series, Oahu, Hawaii: Geological Society of America Bulletin, v. 84, no. 4, p. 1217–1242, accessed December 19, 2023, at https://doi.org/10.1130/0016-7606(1973)84<1217:PAAPOT>2.0.CO;2.
E-Flux, 2023a, Fossil fuel traps: Product overview, E-Flux web page, accessed November 3, 2023, at https://www.soilgasflux.com/co2-traps/the-science.
E-Flux, 2023b, Fossil fuel traps: Sampling process, E-Flux web page, accessed November 3, 2023, at https://www.soilgasflux.com/co2-traps/sampling-process.
Elder, K.L., Roberts, M.L., Walther, T., and Xu, L., 2019, Single step production of graphite from organic samples for radiocarbon measurements: Radiocarbon, v. 61, no. 6, p. 1843–1854, accessed December 19, 2023, at https://doi.org/10.1017/RDC.2019.136.
Engott, J.A., Johnson, A.G., Bassiouni, M., Izuka, S.K., and Rotzoll, K., 2017, Spatially distributed groundwater recharge for 2010 land cover estimated using a water-budget model for the Island of O‘ahu, Hawai‘i (ver. 2.0, December 2017): U.S. Geological Survey Scientific Investigations Report 2015–5010, 49 p., accessed December 19, 2023, at https://doi.org/10.3133/sir20155010.
Esri, 2023, ArcGIS Pro 3.1.3: Esri software release, accessed September, 2023 at https://www.esri.com/en-us/arcgis/products/arcgis-pro/overview.
Giambelluca, T.W., Chen, Q., Frazier, A.G., Price, J.P., Chen, Y.-L., Chu, P.-S., Eischeid, J.K., and Delparte, D.M., 2013, Online rainfall atlas of Hawai‘i: Bulletin of the American Meteorological Society, v. 94, no. 3, p. 313–316, accessed December 19, 2023, at https://doi.org/10.1175/BAMS-D-11-00228.1.
Goehring, B.M., Wilson, J., and Nichols, K., 2019, A fully automated system for the extraction of in situ cosmogenic carbon-14 in the Tulane University cosmogenic nuclide laboratory: Nuclear Instruments & Methods in Physics, Research Section B—Beam Interactions with Materials and Atoms, v. 455, p. 284–292, accessed December 19, 2023, at https://doi.org/10.1016/j.nimb.2019.02.006.
Graven, H., Allison, C.E., Etheridge, D.M., Hammer, S., Keeling, R.F., Levin, I., Meijer, H.A.J., Rubino, M., Tans, P.P., Trudinger, C.M., Vaughn, B.H., and White, J.W.C., 2017, Compiled records of carbon isotopes in atmospheric CO2 for historical simulations in CMIP6: Geoscientific Model Development, v. 10, no. 12, p. 4405–4417, accessed December 19, 2023, at https://doi.org/10.5194/gmd-10-4405-2017.
Graven, H., Keeling, R.F., and Rogelj, J., 2020, Changes to carbon isotopes in atmospheric CO2 over the industrial era and into the future: Global Biogeochemical Cycles, v. 34, no. 11, article e2019GB006170, 21 p., accessed December 19, 2023, at https://doi.org/10.1029/2019GB006170.
Graven, H., Keeling, R., and Xu, X., 2022, Radiocarbon dating—Going back in time: Nature, v. 607, 1 p., accessed September 15, 2023, at https://doi.org/10.1038/d41586-022-01954-y.
Honolulu Board of Water Supply, 2024, BWS monitoring well test results: Honolulu Board of Water Supply web page, accessed January 3, 2024, at https://www.boardofwatersupply.com/protectoahuwater/news-updates/bws-monitoring-water-well-test-results.
Hua, Q., Barbetti, M., and Rakowski, A.Z., 2013, Atmospheric radiocarbon for the period 1950–2010: Radiocarbon, v. 55, no. 4, p. 2059–2072, accessed December 19, 2023, at https://doi.org/10.2458/azu_js_rc.v55i2.16177.
Hunt, C.D., Jr., 2004, Ground-water quality and its relation to land use on Oahu, Hawaii, 2000–01: U.S. Geological Survey Water-Resources Investigations Report 2003–4305, 57 p., accessed December 19, 2023, at https://doi.org/10.3133/wri20034305.
Islam, A., Ahmed, A., Hur, M., Thorn, K., and Kim, S., 2016, Molecular-level evidence provided by ultrahigh resolution mass spectrometry for oil-derived doc in groundwater at Bemidji, Minnesota: Journal of Hazardous Materials, v. 320, p. 123–132, accessed December 19, 2023, at https://doi.org/10.1016/j.jhazmat.2016.08.018.
Jaeschke, J.B, Trost, J.J., Polite, B.F., Sinclair, D.A., Cozzarelli, I.M, Pagaduan, L.D., Miyajima, U.M., Nakama, R.K., Delin, G.N., Stack, J.K., and Baesman, S.M., 2023, Groundwater and soil gas data, methods, and quality assurance information for samples collected to determine ancient carbon distributions at Red Hill, Bulk Fuel Storage Facility, O‘ahu, Hawai‘i 2022–2023: U.S. Geological Survey data release, accessed December 19, 2023, at https://doi.org/10.5066/P9TIDAA4.
Kendall, M.G., 1945, The treatment of ties in ranking problems: Biometrika, v. 33, no. 3, p. 239–251. [Also available at https://doi.org/10.2307/2332303.]
Larsen, T., Yokoyama, Y., and Fernandes, R., 2018, Radiocarbon in ecology—Insights and perspectives from aquatic and terrestrial studies: Methods in Ecology and Evolution, v. 9, no. 1, p. 181–190, accessed December 19, 2023, at https://doi.org/10.1111/2041-210X.12851.
McHugh, T., Newell, C., Strasert, B., Stanley, C., Johnson, J., Henderson, T., Roff, D., and Narusawa, J., 2020, Direct aerobic NSZD of a basalt vadose zone LNAPL source in Hawaii: Journal of Contaminant Hydrology, v. 235, article 103729, 7 p., accessed December 19, 2023, at https://doi.org/10.1016/j.jconhyd.2020.103729.
Mitchell, J.N., and Oki, D.S., 2018, Groundwater-level, groundwater-temperature, and barometric-pressure data, July 2017 to February 2018, Hālawa Area, Oʻahu, Hawaiʻi: U.S. Geological Survey Open-File Report 2018–1147, 35 p., accessed January 22, 2024, at https://doi.org/10.3133/ofr20181147.
Mohler, R.E., O’Reilly, K.T., Zemo, D.A., Tiwary, A.K., Magaw, R.I., and Synowiec, K.A., 2013, Non-targeted analysis of petroleum metabolites in groundwater using GC×GC–TOFMS: Environmental Science & Technology, v. 47, no. 18, p. 10471–10476, accessed December 19, 2023, at https://doi.org/10.1021/es401706m.
Nakama, R.K., Mitchell, J.N., and Oki, D.S., 2022, January 18, 2022, Red Hill synoptic groundwater-level survey, Hālawa area, O‘ahu, Hawai‘i: U.S. Geological Survey Open-File Report 2022–1048, 11 p., accessed October 31, 2023, at https://doi.org/10.3133/ofr20221048.
National Research Council, 2000, Natural attenuation for groundwater remediation: Washington, D.C., National Academies Press, 274 p., accessed December 19, 2023, at https://doi.org/10.17226/9792.
O’Reilly, K.T., Mohler, R.E., Zemo, D.A., Ahn, S., Tiwary, A.K., Magaw, R.I., Espino Devine, C., and Synowiec, K.A., 2015, Identification of ester metabolites from petroleum hydrocarbon biodegradation in groundwater using GC×GC‐TOFMS: Environmental Toxicology and Chemistry, v. 34, no. 9, p. 1959–1961, accessed December 19, 2023, at https://doi.org/10.1002/etc.3022.
Ozawa, A., Tagami, T., and Garcia, M.O., 2005, Unspiked K–Ar dating of the Honolulu rejuvenated and Ko‘olau shield volcanism on O‘ahu, Hawai‘i: Earth and Planetary Science Letters, v. 232, no. 1–2, p. 1–11. [Also available at https://doi.org/10.1016/j.epsl.2005.01.021.]
Pearson, A., McNichol, A.P., Schneider, R.J., Von Reden, K.F., and Zheng, Y., 1997, Microscale AMS 14C measurement at NOSAMS: Radiocarbon, v. 40, no. 1, p. 61–75, accessed December 19, 2023, at https://doi.org/10.1017/S0033822200017902.
Podgorski, D.C., Zito, P., Kellerman, A.M., Bekins, B.A., Cozzarelli, I.M., Smith, D.F., Cao, X., Schmidt-Rohr, K., Wagner, S., Stubbins, A., and Spencer, R.G.M., 2021, Hydrocarbons to carboxyl-rich alicyclic molecules—A continuum model to describe biodegradation of petroleum-derived dissolved organic matter in contaminated groundwater plumes: Journal of Hazardous Materials, v. 402, article 123998, 16 p., accessed December 19, 2023, at https://doi.org/10.1016/j.jhazmat.2020.123998.
Raich, J.W., and Tufekcioglu, A., 2000, Vegetation and soil respiration—Correlations and controls: Biogeochemistry, v. 48, no. 1, p. 71–90, accessed December 19, 2023, at https://doi.org/10.1023/A:1006112000616.
Regan, S., Hynds, P., and Flynn, R., 2017, Synthèse sur le carbone organique dissous dans l’eau souterraine et implications pour la sécurité de l’eau potable [An overview of dissolved organic carbon in groundwater and implications for drinking water safety]: Hydrogeology Journal, v. 25, no. 4, p. 959–967, accessed December 19, 2023, at https://doi.org/10.1007/s10040-017-1583-3.
Rounds, S.A., and Wilde, F.D., 2012, Alkalinity and acid neutralizing capacity (ver. 4.0, September 2012): U.S. Geological Survey Techniques of Water-Resources Investigations, book 9, chap. A6, 45 p., accessed December 19, 2023, at https://doi.org/10.3133/twri09A6.6.
Shah Walter, S.R., Gagnon, A.R., Roberts, M.L., McNichol, A.P., Lardie Gaylord, M.C., and Klein, E., 2015, Ultra-small graphitization reactors for ultra-microscale 14C analysis at the National Ocean Sciences Accelerator Mass Spectrometry (NOSAMS) facility: Radiocarbon, v. 57, no. 1, p. 109–122, accessed December 19, 2023, at https://doi.org/10.2458/azu_rc.57.18118.
Sihota, N.J., and Mayer, K.U., 2012, Characterizing vadose zone hydrocarbon biodegradation using carbon dioxide effluxes, isotopes, and reactive transport modeling: Vadose Zone Journal, v. 11, no. 4, article vzj2011.0204, 14 p., accessed December 19, 2023, at https://doi.org/10.2136/vzj2011.0204.
Sihota, N.J., Singurindy, O., and Mayer, K.U., 2011, CO2-efflux measurements for evaluating source zone natural attenuation rates in a petroleum hydrocarbon contaminated aquifer: Environmental Science & Technology, v. 45, no. 2, p. 482–488, accessed December 19, 2023, at https://doi.org/10.1021/es1032585.
Sihota, N.J., Trost, J.J., Bekins, B.A., Berg, A., Delin, G.N., Mason, B., Warren, E., and Mayer, K.U., 2016, Seasonal variability in vadose zone biodegradation at a crude oil pipeline rupture site: Vadose Zone Journal, v. 15, no. 5, p. 1–14, accessed December 19, 2023, at https://doi.org/10.2136/vzj2015.09.0125.
Stuiver, M., and Polach, H.A., 1977, Discussion reporting of 14C data: Radiocarbon, v. 19, no. 3, p. 355–363, accessed December 19, 2023, at https://doi.org/10.1017/S0033822200003672.
Suess, H.E., 1965, Secular variations of the cosmic-ray-produced carbon 14 in the atmosphere and their interpretations: Journal of Geophysical Research, v. 70, no. 23, p. 5937–5952, accessed December 19, 2023, at https://doi.org/10.1029/JZ070i023p05937.
Sweeney, R.E., and Ririe, G.T., 2014, Temperature as a tool to evaluate aerobic biodegradation in hydrocarbon contaminated soil: Groundwater Monitoring & Remediation, v. 34, no. 3, p. 41–50, accessed January 22, 2024, at https://doi.org/10.1111/gwmr.12064.
Tans, P.P., De Jong, A.F.M., and Mook, W.G., 1979, Natural atmospheric 14C variation and the Suess effect: Nature, v. 280, no. 5725, p. 826–828, accessed December 19, 2023, at https://doi.org/10.1038/280826a0.
Thomas, J.M., Hershey, R.L., Fereday, W., and Burr, G., 2021, Using carbon-14 of dissolved organic carbon to determine groundwater ages and travel times in aquifers with low organic carbon: Applied Geochemistry, v. 124, article 104842, 17 p., accessed December 19, 2023, at https://doi.org/10.1016/j.apgeochem.2020.104842.
U.S. Environmental Protection Agency, 1974, Method 415.1—Organic carbon, total (combustion or oxidation): Methods for the Chemical Analysis of Water and Wastes (MCAWW) (EPA/600/4–79/020), accessed January 30, 2024, at https://www.nemi.gov/methods/method_summary/5403/.
U.S. Environmental Protection Agency, 1978, Method 310.1—Alkalinity (titrimetric, pH 4.5): Methods for the Chemical Analysis of Water and Wastes (MCAWW) (EPA/600/4–79/020), accessed January 30, 2024, at https://www.nemi.gov/methods/method_summary/5230/.
U.S. Environmental Protection Agency, 1994, Method 200.8—Determination of trace elements in waters and wastes by inductively coupled plasma–mass spectrometry (revision 5.4): Cincinnati, Ohio, U.S. Environmental Protection Agency, 57 p., accessed December 19, 2023, at https://www.epa.gov/esam/epa-method-2008-determination-trace-elements-waters-and-wastes-inductively-coupled-plasma-mass.
U.S. Environmental Protection Agency, 1996, Method 3510C—Separatory funnel liquid-liquid extraction, revision 3: U.S. Environmental Protection Agency, SW–846, 8 p., accessed December 19, 2023, at https://www.epa.gov/hw-sw846/sw-846-test-method-3510c-separatory-funnel-liquid-liquid-extraction.
U.S. Environmental Protection Agency, 1997, Method 300.1—Determination of inorganic anions in drinking water by ion chromatography, revision 1.0: U.S. Environmental Protection Agency, 39 p. plus April 27, 1999, errata cover sheet, accessed December 19, 2023, at https://www.epa.gov/esam/epa-method-3001-revision-10-determination-inorganic-anions-drinking-water-ion-chromatography.
U.S. Environmental Protection Agency, 2003, Method 8015D—Nonhalogenated organics using gas chromatography/flame ionization detection (GC/FID) (revision 4): U.S. Environmental Protection Agency, 37 p., accessed December 19, 2023, at https://www.epa.gov/hw-sw846/validated-test-method-8015d-nonhalogenated-organics-using-gas-chromatographyflame.
U.S. Indo-Pacific Command, 2024, Joint Task Force-Red Hill completes defueling mission; closure and environmental remediation now main DoD effort: U.S. Indo-Pacific Command, March 29, 2024, accessed May 30, 2024, at https://www.pacom.mil/JTF-Red-Hill/Press-Room/News/Article/3723968/joint-task-force-red-hill-completes-defuelingmission-closure-and-environmental/.
U.S. Geological Survey, 2023, Guidelines for field-measured water-quality properties (ver. 1.1, July 2023): U.S. Geological Survey Techniques and Methods, book 9, chap. A6.0, 22 p., accessed December 19, 2023, at https://doi.org/10.3133/tm9A6.0.
U.S. Geological Survey, 2024, USGS water data for the Nation: U.S. Geological Survey National Water Information System database, accessed February 21, 2024, at https://doi.org/10.5066/F7P55KJN.
Vogel, J.S., Southon, J.R., Nelson, D.E., and Brown, T.A., 1984, Performance of catalytically condensed carbon for use in accelerator mass spectrometry: Nuclear Instruments and Methods in Physics Research, Section B—Beam Interactions with Materials and Atoms, v. 5, no. 2, p. 289–293, accessed December 19, 2023, at https://doi.org/10.1016/0168-583X(84)90529-9.
Wang, Y., Amundson, R., and Niu, X.-F., 2000, Seasonal and altitudinal variation in decomposition of soil organic matter inferred from radiocarbon measurements of soil CO2 flux: Global Biogeochemical Cycles, v. 14, no. 1, p. 199–211, accessed December 19, 2023, at https://doi.org/10.1029/1999GB900074.
Warren, E., and Bekins, B.A., 2015, Relating subsurface temperature changes to microbial activity at a crude oil-contaminated site: Journal of Contaminant Hydrology, v. 182, p. 183–193, accessed January 22, 2024, at https://doi.org/10.1016/j.jconhyd.2015.09.007.
Wentworth, C.K., and Macdonald, G.A., 1953, Structures and forms of basaltic rocks in Hawaii: U.S. Geological Survey Bulletin 994, 98 p., accessed November 2, 2023, at https://doi.org/10.3133/b994.
Woods Hole Oceanographic Institution, National Ocean Sciences Accelerator Mass Spectrometry, 2023a, General statement of 14C procedures at the National Ocean Sciences AMS Facility: Woods Hole Oceanographic Institution, 2 p., accessed August 22, 2023, at https://www2.whoi.edu/site/nosams/wp-content/uploads/sites/124/2023/02/General-Statement-of-14C-Procedures_2023.pdf.
Woods Hole Oceanographic Institution, National Ocean Sciences Accelerator Mass Spectrometry, 2023b, What is radiocarbon dating?: Woods Hole Oceanographic Institution web page, accessed October 16, 2023, at https://www2.whoi.edu/site/nosams/resources/what-is-radiocarbon-dating/.
Wozney, A., Clark, I.D., and Mayer, K.U., 2021, Quantifying natural source zone depletion at petroleum hydrocarbon contaminated sites—A comparison of 14C methods: Journal of Contaminant Hydrology, v. 240, article 103795, 11 p., accessed December 19, 2023, at https://doi.org/10.1016/j.jconhyd.2021.103795.
Xu, L., 2022a, NOSAMS SPL—Dissolved organic carbon (DOC) UV oxidation procedure [procedure number 460001]: Woods Hole Oceanographic Institution, 4 p. [Method code OX040 in the U.S. Geological Survey National Water Information System database at https://doi.org/10.5066/F7P55KJN.]
Xu, L., 2022b, NOSAMS SPL—Extraction of CO2 in mixed gases from glass bottles with rubber septa tops [procedure number 445000]: Woods Hole Oceanographic Institution, 1 p. [Method code GAS02 in the U.S. Geological Survey National Water Information System database at https://doi.org/10.5066/F7P55KJN.]
Xu, L., Roberts, M.L., Elder, K.L., Hansman, R.L., Gagnon, A.R., and Kurz, M.D., 2022, Radiocarbon in dissolved organic carbon by UV oxidation—An update of procedures and blank characterization at NOSAMS: Radiocarbon, v. 64, no. 1, p. 195–199, accessed December 19, 2023, at https://doi.org/10.1017/RDC.2022.4.
Xu, L., Roberts, M.L., Elder, K.L., Kurz, M.D., McNichol, A.P., Reddy, C.M., Ward, C.P., and Hanke, U.M., 2021, Radiocarbon in dissolved organic carbon by UV oxidation—Procedures and blank characterization at NOSAMS: Radiocarbon, v. 63, no. 1, p. 357–374, accessed December 19, 2023, at https://doi.org/10.1017/RDC.2020.102.
Zemo, D.A., and Foote, G.R., 2003, The technical case for eliminating the use of the TPH analysis in assessing and regulating dissolved petroleum hydrocarbons in ground water: Groundwater Monitoring & Remediation, v. 23, no. 3, p. 95–104, accessed December 19, 2023, at https://doi.org/10.1111/j.1745-6592.2003.tb00687.x.
Zemo, D.A., O’Reilly, K.T., Mohler, R.E., Magaw, R.I., Espino Devine, C., Ahn, S., and Tiwary, A.K., 2017, Life cycle of petroleum biodegradation metabolite plumes, and implications for risk management at fuel release sites: Integrated Environmental Assessment and Management, v. 13, no. 4, p. 714–727, accessed December 19, 2023, at https://doi.org/10.1002/ieam.1848.
Zemo, D.A., O’Reilly, K.T., Mohler, R.E., Tiwary, A.K., Magaw, R.I., and Synowiec, K.A., 2013, Nature and estimated human toxicity of polar metabolite mixtures in groundwater quantified as TPHd/DRO at biodegrading fuel release sites: Groundwater Monitoring & Remediation, v. 33, no. 4, p. 44–56, accessed December 19, 2023, at https://doi.org/10.1111/gwmr.12030.
Zito, P., Ghannam, R., Bekins, B.A., and Podgorski, D.C., 2019, Examining the extraction efficiency of petroleum‐derived dissolved organic matter in contaminated groundwater plumes: Groundwater Monitoring & Remediation, v. 39, no. 4, p. 25–31, accessed December 19, 2023, at https://doi.org/10.1111/gwmr.12349.
Appendix 1. Carbon-14 Information
Unit Definitions
“Modern” carbon is defined as 95 percent of the radiocarbon concentration in 1950 of the National Bureau of Standards oxalic acid I (Standard Reference Material 4990B, OX-I) normalized to δ carbon-13 (13C) of Vienna Pee Dee Belemnite equal to −19 per mil (Olsson, 1970). δ13C is the ratio of 13C to carbon-12 (12C) of the sample compared to the ratio of 13C to 12C of the reference material. Results from the Woods Hole Oceanographic Institution, National Ocean Sciences Accelerator Mass Spectrometry, laboratory are calculated using this internationally agreed upon definition. The definition is equivalent to an absolute 1950 carbon-14 (14C)/12C ratio of 1.176 plus or minus 0.010×10⁻¹² (Karlen and others, 1965). All results are normalized to −25 per mil using the δ13C Vienna Pee Dee Belemnite of the sample (Woods Hole Oceanographic Institution, National Ocean Sciences Accelerator Mass Spectrometry, 2023).
Carbon-14 contents of samples are reported as deviations from “modern.” Percentage modern carbon (pMC) is a measurement of the deviation of the 14C/12C ratio, normalized to a δ13C of −25 per mil to account for isotopic fractionation (Woods Hole Oceanographic Institution, National Ocean Sciences Accelerator Mass Spectrometry, 2023). To compare laboratory-reported values in units of pMC directly to atmospheric data (Graven and others, 2017, 2020, 2022), the laboratory data were converted to ∆14C values, which are defined as the relative difference between the sample and the absolute international standard with a base year of 1950 (Stuiver and Polach, 1977). Carbon-14 values given in ∆14C notation are corrected for age and isotopic fractionation in contrast to 14C values in pMC notation, which are only corrected for isotopic fractionation. Carbon-14 contents were converted from pMC to ∆14C notation according to Woods Hole Oceanographic Institution, National Ocean Sciences Accelerator Mass Spectrometry (2023):
where∆14C
is sample 14C content relative to the absolute international standard with a base year of 1950 and sample activity corrected for age and isotopic fractionation (Stuiver and Polach, 1977);
pMCsample
is sample 14C content relative to the “modern” standard corrected for isotopic fractionation (Woods Hole Oceanographic Institution, National Ocean Sciences Accelerator Mass Spectrometry, 2023);
λ
is 1/8,267, or the inverse of the true average life of 14C (Woods Hole Oceanographic Institution, National Ocean Sciences Accelerator Mass Spectrometry, 2023); and
Yc
is the year of sample collection.
The ∆14C notation is the typical convention for reporting age-corrected values that are referenced to the absolute international standard with a base year of 1950 (Stuiver and Polach, 1977), but for consistency among 14C data discussions in this report, all 14C values are presented in pMC notation. Values that have been age corrected according to equation 1.1 are converted back to pMC notation using equation 1.2:
wherepMCage-corr
is sample 14C content relative to the absolute international standard with a base year of 1950 14C with sample activity corrected for age and isotopic fractionation (Stuiver and Polach, 1977), in percent modern notation, and
∆14C
is as defined previously.
In this report, all pMC values are only corrected for isotopic fractionation unless age correction is also specified. And finally, the 14C contents of some samples are converted from pMC to percentage ancient carbon according to the following equation:
wherepACsample
is 14C content as percentage ancient carbon and
pMCsample
is 14C content as percentage modern carbon, as previously defined.
Data Interpretation
Understanding how much petroleum-derived carbon depleted in 14C relative to background carbon exists in environmental samples requires direct measurements or assumptions of background 14C contents. Conceptually, the background and petroleum-derived parts of samples are related by a two-component mass balance (Avery and others, 2006):
wherepMCsample
is the measured 14C content reported by the laboratory, in percent modern carbon;
ffsample
is the petroleum, or fossil fuel, fraction of the sample;
pMCff
is the 14C content of the petroleum-derived fraction of the sample, in percent modern carbon; and
pMCbg
is the 14C content of the background fraction of the sample, in percent modern carbon.
This equation illustrates that the background percentage modern carbon is important for quantifying the fraction of petroleum-derived carbon in an environmental sample. In this report, equation 1.5 was applied to soil carbon dioxide (CO2) trap samples with age-corrected values for pMCbg in order to distinguish between petroleum-derived CO2 and CO2 from background soil respiration. The pMCsample, pMCbg, and ffsample values for the samples collected in 2017, 2022, and 2023 and data values from E-Flux laboratory reports that were used in equation 1 to calculate the mass of ancient fossil fuel CO2 in soil trap and cartridge samples are listed in table 1.1 and Jaeschke and others (2023).
Table 1.1.
Data values from E-Flux sample reports (Department of the Navy, 2019; Jaeschke and others, 2023) used in equations 1 and 1.5 to calculate the mass of ancient fossil fuel carbon dioxide in soil trap and cartridge samples deployed at the Red Hill Bulk Fuel Storage Facility, O‘ahu, Hawai‘i, in 2017 and 2022–23.[ID, identifier; 14C, carbon-14; CO2, carbon dioxide; ND, not detected; a, denotes data source is appendix B in Department of the Navy (2019); b, denotes data source is Jaeschke and others (2023)]
| Data source | Sample year | Site | E-Flux sample ID | E-Flux sample type | aBackground 14C content in CO2 used in E-Flux report (pMCbg in eq. 1.5), age corrected, in percent modern | Dry sorbent mass (msorbent in eq. 1), in grams | bAverage CO2 content of sample sorbent (CO2 sample in eq. 1), as a fraction | 14C content of sample as reported from laboratory (pMCsample in eq. 1.5), in percent modern | bAverage CO2 content of travel blank sorbent (CO2 TB in eq. 1), as a fraction | 14C content of travel blank as reported from laboratory (used as pMCsample in eq. 1.5), in percent modern | bFossil fuel fraction of the sample (ffsample in eqs. 1 and 1.5), as a fraction | b, cFossil fuel fraction of the travel blank (ffTB in equation 1 and computed as ffsample in eq. 1.5), as a fraction | dAncient fossil fuel CO2 in sample (calculated by eq. 1), in grams | Ancient fossil fuel CO2 in sample reported by E-Flux, in grams |
|---|---|---|---|---|---|---|---|---|---|---|---|---|---|---|
| a | 2017 | T1 | PHHI–R1–CO2–04 | Soil trap | 105 | 41.937 | 0.0248 | 89.9 | 0.0092 | 64.6 | 0.144 | 0.385 | 0.0016 | e0.00 |
| a | 2017 | T2 | PHHI–R1–CO2–07 | Soil trap | 105 | 43.589 | 0.0756 | 99.6 | 0.0092 | 64.6 | 0.052 | 0.385 | 0.0165 | 0.02 |
| b | 2022 | T2 | 10231–R1–CO2–01 | Soil trap | 102 | 41.67 | 0.0341 | 92.75 | 0.0155 | 75.71 | 0.0907 | 0.2577 | −0.0376 | ND |
| b | 2023 | T2 | 10231–R2–CO2–01 | Soil trap | 102 | 42.84 | 0.0675 | 96.86 | 0.0127 | 74.57 | 0.0504 | 0.2689 | −0.0006 | ND |
| a | 2017 | T3 | PHHI–R1–CO2–02 | Soil trap | 105 | 41.747 | 0.0366 | 93.9 | 0.0092 | 64.6 | 0.106 | 0.385 | 0.0143 | 0.01 |
| b | 2023 | T3 | 10231–R2–CO2–02 | Soil trap | 102 | 41.93 | 0.0421 | 93.79 | 0.0127 | 74.57 | 0.0805 | 0.2689 | −0.0011 | ND |
| b | 2022 | T5 | 10231–R1–CO2–03 | Soil trap | 102 | 41.99 | 0.0342 | 92.46 | 0.0155 | 75.71 | 0.0935 | 0.2577 | −0.0334 | ND |
| b | 2023 | T5 | 10231–R2–CO2–05 | Soil trap | 102 | 43.20 | 0.0695 | 97.88 | 0.0127 | 74.57 | 0.0404 | 0.2689 | −0.0263 | ND |
| a | 2017 | T8 | PHHI–R1–CO2–08 | Soil trap | 105 | 45.130 | 0.0597 | 96.6 | 0.0092 | 64.6 | 0.080 | 0.385 | 0.0571 | 0.06 |
| b | 2023 | T8 | 10231–R2–CO2–04 | Soil trap | 102 | 42.59 | 0.0477 | 96.44 | 0.0127 | 74.57 | 0.0545 | 0.2689 | −0.0347 | ND |
| b | 2022 | T22–04 | 10231–R1–CO2–02 | Soil trap | 102 | 44.27 | 0.0786 | 98.87 | 0.0155 | 75.71 | 0.0307 | 0.2577 | −0.0701 | ND |
| b | 2023 | T23–05 | 10231–R2–CO2–03 | Soil trap | 102 | 42.89 | 0.0753 | 98.56 | 0.0127 | 74.57 | 0.0337 | 0.2689 | −0.0376 | ND |
| a | 2017 | Tunnel air intake day 1 | PHHI–C1–CO2–05 | Cartridge | 105 | 4.877 | 0.2557 | 100.8 | 0.0091 | 65.3 | 0.040 | 0.378 | 0.0331 | 0.03 |
| a | 2017 | Tunnel air intake day 2 | PHHI–C1–CO2–06 | Cartridge | 105 | 4.817 | 0.2362 | 104.0 | 0.0091 | 65.3 | 0.009 | 0.378 | −0.0061 | ND |
| a | 2017 | Upper tunnel air exhaust day 1 | PHHI–C1–CO2–01 | Cartridge | 105 | 4.858 | 0.2592 | 101.8 | 0.0091 | 65.3 | 0.031 | 0.378 | 0.0217 | 0.02 |
| a | 2017 | Upper tunnel air exhaust day 2 | PHHI–C1–CO2–02 | Cartridge | 105 | 4.882 | 0.2540 | 100.5 | 0.0091 | 65.3 | 0.043 | 0.378 | 0.0366 | 0.04 |
| a | 2017 | Lower tunnel air exhaust day 1 | PHHI–C1–CO2–03 | Cartridge | 105 | 5.005 | 0.2841 | 97.4 | 0.0091 | 65.3 | 0.072 | 0.378 | 0.0853 | f0.09 |
| a | 2017 | Lower tunnel air exhaust day 2 | PHHI–C1–CO2–04 | Cartridge | 105 | 5.101 | 0.3029 | 98.3 | 0.0091 | 65.3 | 0.064 | 0.378 | 0.0810 | g0.08 |
Reported as a fraction in E-Flux sample reports but listed here as a percentage as in Jaeschke and others (2023).
Reported as a percentage in E-Flux sample reports but listed here as a fraction as in Jaeschke and others (2023).
Equation 1.5 was used to calculate ffTB, where ffTB is synonymous with ffsample and pMCsample is the reported value of the travel blank from the laboratory, and pMCbg is the same as was used for the field sample.
In some cases, the 2017 reported data had fewer decimal places than the 2022–23 data. Higher precision estimates (that at least matched the 2022–23 data precision) were used for pMCsample, ffsample, and ffTB to calculate the values shown in this column. Estimated higher precision values, when rounded, were equivalent to the reported values in this table.
This is the value in the E-Flux report in appendix B in Department of the Navy (2019); however, McHugh and others (2020) report a value of 0.002 gram for this sample.
The value 0.09 is the value in the E-flux report in appendix B in Department of the Navy (2019); however, McHugh and others (2020) report a value of 0.081 gram for this sample.
The value 0.08 is the value in the E-Flux report in appendix B in Department of the Navy (2019); however, McHugh and others (2020) report a value of 0.085 gram for this sample.
Groundwater dissolved organic carbon (DOC) can have a background 14C content that is much different from modern atmospheric 14C. Modern-aged DOC from plant and soil organic matter at the land surface is transported to groundwater in recharge. In thick unsaturated zones, such as those at the facility, infiltrating recharge water may also incorporate older organic carbon present deeper in the formation. As a result, 14C contents of background groundwater DOC in geologic settings like the facility can be much older than modern age (Thomas and others, 2021).
The 14C content of background soil CO2 is generally close to atmospheric 14C contents and fluctuates seasonally from variations in root respiration and soil organic matter decomposition (Dörr and Münnich, 1986; Wang and others, 2000). Atmospheric 14C nearly doubled in the 1950s and 1960s from nuclear weapons testing and has since been declining because of radioactive decay, mixing with other reservoirs, and burning of 14C-depleted fossil fuels (Graven and others, 2017). In addition to these atmospheric changes, the 14C content of soil CO2 at a given location varies depending on the relative contributions of root respiration and soil organic matter decomposition to soil CO2. Generally, when plant roots are actively respiring during the growing season, 14C of soil CO2 nearly reaches atmospheric levels, whereas in dormant seasons, soil CO2 is more depleted in 14C (Dörr and Münnich, 1986). The 14C depletion results from a decreasing effect of root respiration and an increasing contribution of microbial decomposition of soil organic matter (Dörr and Münnich, 1986; Wang and others, 2000). Soil moisture and temperature conditions during the warm season can also affect rates of root respiration and soil organic matter decomposition (Wang and others, 2000).
The atmospheric 14C content during soil CO2 sample collection at the facility varied from an annual average ∆14C value of about 9 per mil in 2017 to about −19 per mil in 2023. These age-corrected values (∆14Cpred) were estimated from the following linear regression equation:
whereY
is decimal year (for example, 2015.5 corresponds to around July 2, 2015) and
4.68 and 9,451.35
are coefficients from a linear regression, which related ∆14C to year for the period of 2005.5 to 2015.5 using published atmospheric ∆14C annual average values for tropical regions (Graven and others, 2017).
References Cited
Avery, G.B., Jr., Willey, J.D., and Kieber, R.J., 2006, Carbon isotopic characterization of dissolved organic carbon in rainwater—Terrestrial and marine influences: Atmospheric Environment, v. 40, no. 39, p. 7539–7545. [Also available at https://doi.org/10.1016/j.atmosenv.2006.07.014.]
Department of the Navy, 2019, Conceptual site model, investigation and remediation of releases and groundwater protection and evaluation, Red Hill Bulk Fuel Storage Facility, Joint Base Pearl Harbor-Hickam, O‘ahu, Hawai‘i: Fort Belvoir, Va., Defense Logistics Agency Energy, prepared by AECOM Technical Services, Inc., [variously paged], accessed December 19, 2023, at https://www.epa.gov/sites/default/files/2019-07/documents/red_hill_conceptual_site_model_20190630-redacted.pdf.
Dörr, H., and Münnich, K.O., 1986, Annual variations of the 14C content of soil CO2: Radiocarbon, v. 28, no. 2A, p. 338–345. [Also available at https://doi.org/10.1017/S0033822200007438.]
Graven, H., Allison, C.E., Etheridge, D.M., Hammer, S., Keeling, R.F., Levin, I., Meijer, H.A.J., Rubino, M., Tans, P.P., Trudinger, C.M., Vaughn, B.H., and White, J.W.C., 2017, Compiled records of carbon isotopes in atmospheric CO2 for historical simulations in CMIP6: Geoscientific Model Development, v. 10, no. 12, p. 4405–4417. [Also available at https://doi.org/10.5194/gmd-10-4405-2017.]
Graven, H., Keeling, R.F., and Rogelj, J., 2020, Changes to carbon isotopes in atmospheric CO2 over the industrial era and into the future: Global Biogeochemical Cycles, v. 34, no. 11, article e2019GB006170, 21 p. [Also available at https://doi.org/10.1029/2019GB006170.]
Graven, H., Keeling, R.F., and Xu, X., 2022, Radiocarbon dating—Going back in time: Nature, v. 607, no. 7919, 1 p., accessed September 15, 2023, at https://doi.org/10.1038/d41586-022-01954-y.
Jaeschke, J.B, Trost, J.J., Polite, B.F., Sinclair, D.A., Cozzarelli, I.M, Pagaduan, L.D., Miyajima, U.M., Nakama, R.K., Delin, G.N., Stack, J.K., and Baesman, S.M., 2023, Groundwater and soil gas data, methods, and quality assurance information for samples collected to determine ancient carbon distributions at Red Hill, Bulk Fuel Storage Facility, O‘ahu, Hawai‘i 2022–2023: U.S. Geological Survey data release, accessed December 19, 2023, at https://doi.org/10.5066/P9TIDAA4.
McHugh, T., Newell, C., Strasert, B., Stanley, C., Johnson, J., Henderson, T., Roff, D., and Narusawa, J., 2020, Direct aerobic NSZD of a basalt vadose zone LNAPL source in Hawaii: Journal of Contaminant Hydrology, v. 235, article 103729, 7 p., accessed December 19, 2023, at https://doi.org/10.1016/j.jconhyd.2020.103729.
Stuiver, M., and Polach, H.A., 1977, Discussion reporting of 14C data: Radiocarbon, v. 19, no. 3, p. 355–363. [Also available at https://doi.org/10.1017/S0033822200003672.]
Thomas, J.M., Hershey, R.L., Fereday, W., and Burr, G., 2021, Using carbon-14 of dissolved organic carbon to determine groundwater ages and travel times in aquifers with low organic carbon: Applied Geochemistry, v. 124, article 104842, 17 p., accessed March 1, 2024, at https://doi.org/10.1016/j.apgeochem.2020.104842.
Wang, Y., Amundson, R., and Niu, X.-F., 2000, Seasonal and altitudinal variation in decomposition of soil organic matter inferred from radiocarbon measurements of soil CO2 flux: Global Biogeochemical Cycles, v. 14, no. 1, p. 199–211. [Also available at https://doi.org/10.1029/1999GB900074.]
Woods Hole Oceanographic Institution, National Ocean Sciences Accelerator Mass Spectrometry, 2023, Radiocarbon data and calculations: Woods Hole Oceanographic Institution web page, accessed October 16, 2023, at https://www2.whoi.edu/site/nosams/calculations-and-reporting-of-results/.
Appendix 2. Quality Assurance
Field Blank Samples
Three field blank samples were collected during groundwater sampling at wells RHMW03, RHMW08, and RHP05. Most analytes were not detected in field blank samples, although a few detections that are described in this appendix were notable (table 2.1). For the purposes of the discussion in this appendix, concentrations of analytes with LT flags were assigned the value of the reported limit for calculating summary statistics; for example, an analyte result with a reported concentration of LT 0.5 was assigned a numeric value of 0.5 for calculation of the median. Field samples described in this section include regular field samples and field duplicates (sample_type equal to “REGULAR” or “FIELD DUP” in Jaeschke and others [2023]).
Table 2.1.
Results from field blank samples collected at the Red Hill Bulk Fuel Storage Facility, O‘ahu, Hawai‘i.[Dates given in month/day/year format; HST, Hawai‘i-Aleutian standard time; μg/L, microgram per liter; mg/L, milligram per liter; HCO3, bicarbonate; μS/cm @ 25C, microsiemens per centimeter at 25 degrees Celsius; LT, less than; ND, not determined; --, no data or not applicable; E, estimated value; data from Jaeschke and others (2023)]
The field blank collected at RHMW03 had detectable concentrations of copper and sodium. Copper was only detected in about 25 percent of the field samples, and the copper concentration (0.55 microgram per liter [μg/L]) in the RHMW03 field blank was within the range of copper concentrations of regular field samples (0.51–1.11 μg/L). Sodium was detected in all nonblank field samples, and the sodium concentration (686 μg/L) in the RHMW03 blank was substantially less than the concentration in any regular field sample (minimum of 32,300 μg/L).
The field blank collected at RHMW08 had detectable concentrations of arsenic, barium, iron, and zinc. Arsenic was detected in about 68 percent of field samples, and the arsenic concentration of this field blank (0.81 μg/L) is near the lower end of the range of field sample concentrations (0.66–9.2 μg/L). Barium was detected in all field samples, and the barium concentration of this field blank (11.7 μg/L) is greater than the median concentration (10.0 μg/L) of the measured field sample concentrations. Iron was detected in 82 percent of field samples, and the iron concentration of this field blank (7.39 μg/L) is greater than the median concentration (4.55 μg/L) of the measured field sample concentrations. Zinc was detected in 64 percent of field samples, and the zinc concentration (68.6 μg/L) of this field blank is greater than the zinc concentration of all field samples, except for samples collected at well DH43, which had zinc concentrations of about 80 μg/L.
The field blank collected at RHP05 had detectable concentrations of sodium (507 μg/L), diesel range organics (DRO; estimated value of 71 μg/L), nitrate (estimated value of 0.07 mg/L), and sulfate (estimated value of 0.04 mg/L). The sodium concentration of this blank (507 μg/L) was substantially less than the sodium concentration in any regular field sample (minimum of 32,300 μg/L). The DRO, nitrate, and sulfate concentrations were all low and flagged as estimated values because they were greater than the minimum detection level but less than the reporting level (Jaeschke and others, 2023). These analytes were frequently detected in nonblank field samples (DRO, 74 percent; nitrate, 86 percent; and sulfate, 100 percent) and generally at higher concentrations than reported in the blank samples.
Nonvolatile dissolved organic carbon (NVDOC) was detected in every sample, including the field blanks. Low concentrations of NVDOC were measured in all three field blanks, ranging from 0.20 to 0.30 milligram per liter (mg/L) of carbon. The blank NVDOC concentrations were generally lower than NVDOC concentrations in regular field samples, which ranged from 0.21 to 6.45 mg/L. Five field sample NVDOC concentrations from three sites (DH43, Moanalua W–2, and RHMW12A) overlapped with the blank NVDOC concentrations. RHMW12A is a deep well (table 2) and Moanalua W–2 was presumed to be a background well.
Field Duplicate Samples
Variability between regular-duplicate sample pairs was evaluated by calculating the relative percentage difference according to the following equation:
whereRPD
is the relative percentage difference,
v1
is the reported value of the regular field sample, and
v2
is the reported value of the field duplicate sample.
Field duplicate soil gas samples were collected at sites T2, T3, T5, and A3–07. Four sample pairs were analyzed for ancient carbon (14C) content of CO2, and four sample pairs were analyzed in the field for CO2 concentration. All the relative differences between regular samples and field duplicates were less than 15 percent (table 2.2).
Table 2.2.
Results from field duplicate samples collected at the Red Hill Bulk Fuel Storage Facility, O‘ahu, Hawai‘i.[μg/L, microgram per liter; mg/L, milligram per liter; HCO3, bicarbonate; 14C, carbon-14; δ13C, isotopic ratio of 13C to 12C of the sample compared to the ratio of the Vienna Pee Dee Belemnite standard; results are only included for samples when analytes were detected in the regular and duplicate sample pair; silver, beryllium, cadmium, cerium, methane, cobalt, copper, lanthanum, nickel, thallium, and uranium did not have any paired detections and therefore are not included in this table; data from Jaeschke and others (2023)]
Field duplicate groundwater samples were collected at wells RHMW08, RHMW11–05, RHMW12A, and DH43. Detections and concentrations were in reasonable agreement for most of the regular-duplicate sample pair comparisons. Sample pairs with split detections/nondetections or relative differences greater than 15 percent are discussed.
Only two split detections/nondetections were observed in the regular-duplicate sample pairs: aluminum from RHMW08 (regular sample: 5.72 μg/L; duplicate: less than 5.0 μg/L) and antimony from DH43 (regular sample: less than 0.5 μg/L; duplicate: 0.52 μg/L). In both cases, the detected concentration was very near the detection limit. Nondetects in paired regular and field duplicate samples were reported in 67 cases. In all other instances, the analyte was detected in the field duplicate and regular sample. These detected concentrations are the basis for the following discussion and summarized in table 2.2.
Five analytes (NVDOC, DRO, phosphate, iron, and ancient carbon content of NVDOC [NVDOC_14C]) each had one instance of a regular and field duplicate sample having a relative difference of greater than 15 percent. The regular and field duplicate concentrations of NVDOC from well RHMW08 were 0.56 mg/L and 0.87 mg/L, respectively. These concentrations straddle the laboratory reporting level of 0.60 mg/L. The concentration of 0.56 mg/L is reported as an estimated value because it is less than the reporting level of the laboratory (Jaeschke and others, 2023). Three analytes from the regular-duplicate pair of samples at well RHWMW11–05 had relative differences greater than 15 percent: DRO, phosphate, and iron. The DRO concentrations (66 and 84 μg/L) were low-level estimated concentrations that were less than the reporting level but greater than the detection level of the laboratory (Jaeschke and others, 2023). The regular and field duplicate concentrations of phosphate were 0.48 mg/L and 0.58 mg/L, respectively. The regular and field duplicate concentrations of iron were 6.53 μg/L and 15.3 μg/L, respectively. The relative difference between these two concentrations (80.3 percent) was the largest in the study and anomalous for iron. All other regular-duplicate sample pairs had a relative difference of less than 15 percent for iron. The regular and field duplicate concentrations of carbon-14 (14C) content in NVDOC from well DH43 were 52.23 percent and 66.26 percent, respectively, with a relative difference of 23.7 percent. The other three field duplicate samples for 14C content of NVDOC (parameter NVDOC_14C in Jaeschke and others, 2023) had relative difference values of less than 5 percent. Field pH and specific conductance are not included in table 2.2 because they were not independently measured in the regular and field duplicate samples.
Reference Cited
Jaeschke, J.B, Trost, J.J., Polite, B.F., Sinclair, D.A., Cozzarelli, I.M, Pagaduan, L.D., Miyajima, U.M., Nakama, R.K., Delin, G.N., Stack, J.K., and Baesman, S.M., 2023, Groundwater and soil gas data, methods, and quality assurance information for samples collected to determine ancient carbon distributions at Red Hill, Bulk Fuel Storage Facility, O‘ahu, Hawai‘i 2022–2023: U.S. Geological Survey data release, accessed December 19, 2023, at https://doi.org/10.5066/P9TIDAA4.
Conversion Factors
U.S. customary units to International System of Units.
International System of Units to U.S. customary units
Temperature in degrees Celsius (°C) may be converted to degrees Fahrenheit (°F) as follows:
°F = (1.8 × °C) + 32.
Temperature in degrees Fahrenheit (°F) may be converted to degrees Celsius (°C) as follows:
°C = (°F – 32) / 1.8.
Datums
Vertical coordinate information is referenced to local mean sea level (LMSL).
Horizontal coordinate information is referenced to the North American Datum of 1983 (NAD 83).
Altitude, as used in this report, refers to distance above the vertical datum.
Supplemental Information
Specific conductance is given in microsiemens per centimeter at 25 degrees Celsius (µS/cm at 25 °C).
Concentrations of chemical constituents in water are given in either milligrams per liter (mg/L) or micrograms per liter (µg/L).
Activities for carbon-14 in water and soil gas are given in percent modern carbon (pMC) or percent ancient carbon (pAC).
Results for measurements of stable isotopes of an element (with symbol C) in water, solids, and dissolved constituents commonly are expressed as the relative difference in the ratio of the number of the less abundant isotope (iC) to the number of the more abundant isotope of a sample with respect to a measurement standard.
Soil efflux is given in micromoles per square meter per second (µmol/m2/s).
Abbreviations
Ag
silver
Al
aluminum
As
arsenic
B
boron
Ba
barium
Be
beryllium
Br
bromide
C
carbon
14C
carbon-14
Ca
calcium
Ce
cerium
Cl
chloride
Co
cobalt
CO2
carbon dioxide
Cr
chromium
Cu
copper
DOC
dissolved organic carbon
DRO
diesel range organics (synonymous with total petroleum hydrocarbons in the diesel range)
EPA
U.S. Environmental Protection Agency
F
fluoride
Fe
iron
H2SO4
sulfuric acid
HCl
hydrochloric acid
HCO3
bicarbonate
HDPE
high-density polyethylene
ICP–MS
inductively coupled plasma-mass spectrometer
ICP–OES
inductively coupled plasma-optical emission spectrometer
K
potassium
La
lanthanum
Li
lithium
Mg
magnesium
Mn
manganese
Mo
molybdenum
Na
sodium
Ni
nickel
NO3
nitrate
NVDOC
nonvolatile dissolved organic carbon
Pb
lead
pMC
percentage modern carbon
PO4
phosphate
PVC
polyvinyl chloride
Rb
rubidium
RBPGL
Reston Biogeochemical Processes in Groundwater Laboratory
Sb
antimony
Se
selenium
Si
silicon
SO4
sulfate
Sr
strontium
τ
Kendall’s tau
Tl
thallium
TOC
total organic carbon
U
uranium
USGS
U.S. Geological Survey
V
vanadium
WHOI NOSAMS
Woods Hole Oceanographic Institution, National Ocean Sciences Accelerator Mass Spectrometry
Zn
zinc
For more information about this publication, contact:
Director, USGS Upper Midwest Water Science Center
2280 Woodale Drive
Mounds View, MN 55112
763–783–3100
For additional information, visit: https://www.usgs.gov/centers/umid-water
Publishing support provided by the
Rolla Publishing Service Center
Disclaimers
Any use of trade, firm, or product names is for descriptive purposes only and does not imply endorsement by the U.S. Government.
Although this information product, for the most part, is in the public domain, it also may contain copyrighted materials as noted in the text. Permission to reproduce copyrighted items must be secured from the copyright owner.
Suggested Citation
Trost, J.J., Bekins, B.A., Jaeschke, J.B., Delin, G.N., Sinclair, D.A., Stack, J.K., Nakama, R.K., Miyajima, U.M., Pagaduan, L.D., and Cozzarelli, I.M., 2024, Distribution of ancient carbon in groundwater and soil gas from degradation of petroleum near the Red Hill Bulk Fuel Storage Facility, Oʻahu, Hawaiʻi: U.S. Geological Survey Scientific Investigations Report 2024–5034, 54 p., https://doi.org/10.3133/sir20245034.
ISSN: 2328-0328 (online)
Study Area
| Publication type | Report |
|---|---|
| Publication Subtype | USGS Numbered Series |
| Title | Distribution of ancient carbon in groundwater and soil gas from degradation of petroleum near the Red Hill Bulk Fuel Storage Facility, O‘ahu, Hawai‘i |
| Series title | Scientific Investigations Report |
| Series number | 2024-5034 |
| DOI | 10.3133/sir20245034 |
| Publication Date | June 11, 2024 |
| Year Published | 2024 |
| Language | English |
| Publisher | U.S. Geological Survey |
| Publisher location | Reston, VA |
| Contributing office(s) | Pacific Islands Water Science Center, Upper Midwest Water Science Center, Toxics Substances Hydrology Program |
| Description | Report: xi, 54 p.; Data Release; Dataset |
| Country | United States |
| State | Hawaii |
| Other Geospatial | Red Hill Bulk Fuel Storage Facility |
| Online Only (Y/N) | Y |
| Additional Online Files (Y/N) | N |