

Groundwater Quality Near the Placerita Oil Field, California, 2018
Links
- Document: Report (7.93 MB pdf) , HTML , XML
- Appendixes:
- Appendix 2, Tables 2.1–2.7 (56.3 KB xlsx) - Supplemental Tables for the Placerita Oil Field Study Area, California, 2018
- Appendix 2, Tables 2.1–2.7 (10.4 KB zip) - CSV files
- Data Releases:
- USGS data release - Produced water chemistry data collected from the Oxnard Oil Field, Ventura County, and the Placerita Oil Field, Los Angeles County, 2018, California
- USGS data release - Water chemistry data for samples collected at groundwater sites in the Placerita Oil Field study area, June 2018—November 2018, Los Angeles County, California
- NGMDB Index Page: National Geologic Map Database Index Page (html)
- Download citation as: RIS | Dublin Core
Acknowledgments
This study was funded by the California State Water Resources Control Board Oil and Gas Regional Monitoring Program, with additional funding from U.S. Geological Survey cooperative matching funds. The U.S. Geological Survey is the technical lead in implementing the State Water Board’s Oil and Gas Regional Groundwater Program through the California Oil, Gas, and Groundwater (COGG) program.
Abstract
Groundwater-quality data and potential fluid-migration pathways near the Placerita Oil Field in Los Angeles County, California, were examined by the U.S. Geological Survey to determine if oil-field fluids (water and gas from oil-producing and non-producing zones) have mixed with groundwater resources. Six of the 13 new groundwater samples collected for this study contained petroleum hydrocarbons, thermogenic gas, inorganic chemical signatures, and (or) isotopic values consistent with potential mixing with fluids from hydrocarbon-bearing formations.
For historical groundwater samples, benzene was the most detected petroleum hydrocarbon. The historical groundwater samples with a benzene concentration greater than 0.5 micrograms per liter were from environmental monitoring wells at industrial or commercial facilities unrelated to oil and gas development that, in many cases, have identified soil or groundwater contamination and were not typically analyzed for other constituents that could provide additional lines of evidence for potential mixing with oil-field fluids. Methane was not detected in any of the 12 historical samples with a reported measurement.
Reviewing historical data revealed factors that could potentially adversely affect groundwater quality in the study area. These factors include modified hydraulic gradients caused by large volumes of water extracted from the main production area and reinjected downgradient into nonproducing zones, well-barrier failures in wells constructed in the northern part of the oil field before the 1970s, well-barrier failures in produced-water disposal wells downgradient from the main production area, and naturally occurring hydrocarbons at shallow intervals. The groundwater samples most geochemically similar to samples from hydrocarbon-bearing formations were in areas where hydrocarbons are naturally occurring at shallow intervals and where oil development is at shallow depths. Additional data for hydraulic heads, water quality, and formation temperatures at multiple depths in areas with large injection volumes and well-integrity issues are needed to evaluate whether those factors have contributed to mixing between fluids from oil-producing or injection formations and groundwater resources.
Plain Language Summary
The U.S. Geological Survey studied groundwater near the Placerita Oil Field in Los Angeles County to see if oil-field fluids have mixed with groundwater. Six out of 13 new samples showed signs of mixing with fluids from hydrocarbon-bearing formations. Historical data revealed factors that could affect groundwater quality, including modified hydraulic gradients, well-barrier failures, and naturally occurring hydrocarbons. More data are needed to evaluate the effects of these factors.
Introduction
California produces substantial volumes of crude oil (U.S. Energy Information Administration, 2020) with almost 500 onshore oil fields. Fresh groundwater used for drinking water supply and other purposes typically is separated from hydrocarbon-producing zones (zones from which commercial quantities of oil or gas have been extracted) by low-permeability confining layers. However, oil and gas development can sometimes introduce pathways for migration of fluids from hydrocarbon-producing zones to groundwater resources (Richter and Kreitler, 1991; Darrah and others, 2014; Hammond and others, 2020; McMahon and others, 2023). In addition, natural features such as faults and discontinuous, low-permeability confining layers can allow upward movement of oil-field fluids (Jung and others, 2015; Eichhubl and Boles, 2000). Naturally occurring hydrocarbons at shallow intervals can also affect groundwater resources (Hodgson, 1987; Hornafius and others, 1999; Rosecrans and others, 2021). Where pathways are present, upward movement of water from injection zones can be driven by increased pressures caused by injecting produced water or steam into subsurface formations (Rosecrans and others, 2021; McMahon and others, 2023) or withdrawing water from supply wells with perforations close to deep formations (Izbicki and others, 2005a, b; United Water Conservation District, 2021).
The U.S. Geological Survey (USGS) is working in cooperation with the California State Water Resources Control Board (State Water Board), and other State and local agencies, to implement the Oil and Gas Regional Monitoring Program (RMP) as required by California Senate Bill 4 (California State Legislature, 2013). The objectives of the RMP are to assess the location of groundwater resources with less than 10,000 milligrams per liter (mg/L) total dissolved solids (TDS), the upper limit defined for potential sources of drinking water (U.S. Environmental Protection Agency, 2019), in proximity to oil and gas fields; assess evidence for the presence or absence of constituents potentially derived from hydrocarbon-bearing formations in groundwater, and, if present, identify potential migration pathways or processes; and determine how oil and gas development has affected groundwater quality relative to other anthropogenic activities and natural processes (U.S. Geological Survey, undated). The USGS serves as the technical lead of the RMP through the California Oil, Gas, and Groundwater program.
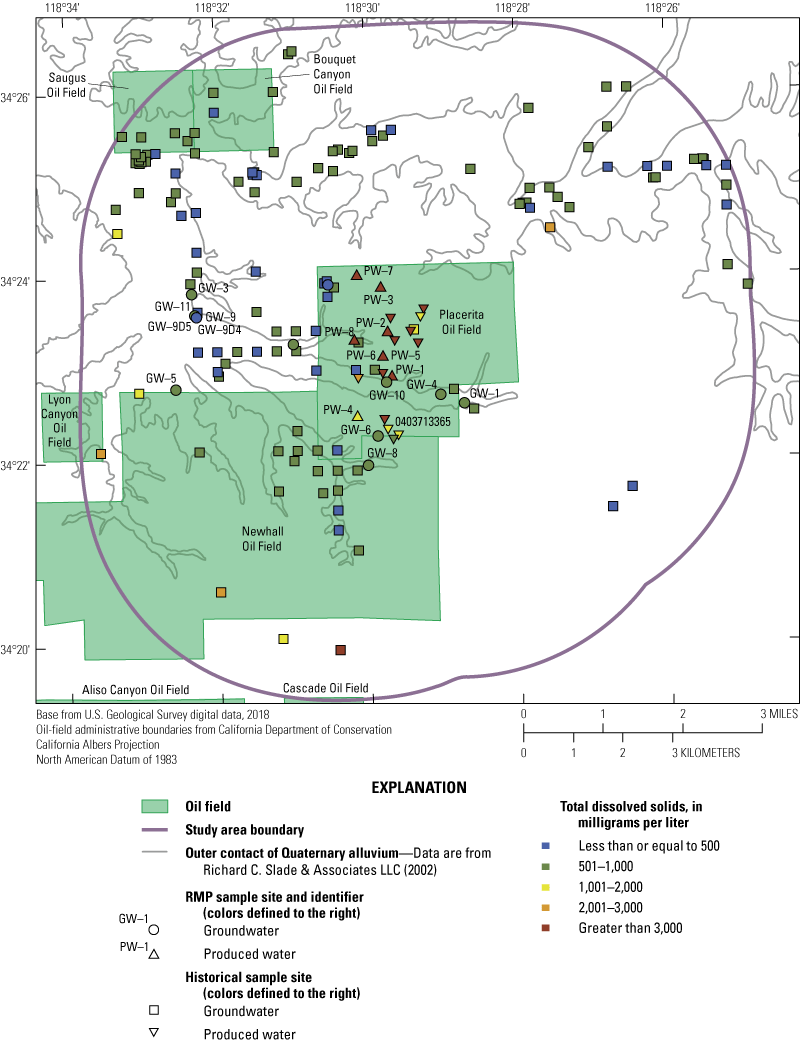
The Placerita Oil Field and surrounding areas in Los Angeles County, California (fig. 1) was selected in consultation with the State Water Board and Los Angeles Regional Water Quality Control Board as a priority oil field for study because of its high density of oil wells and its close vertical proximity of the oil-producing zones to land surface relative to other oil fields in California (Davis and others, 2018a). In addition, the Placerita Oil Field is at the upgradient end of a groundwater basin (fig. 2) that provides water for public supply and other uses.
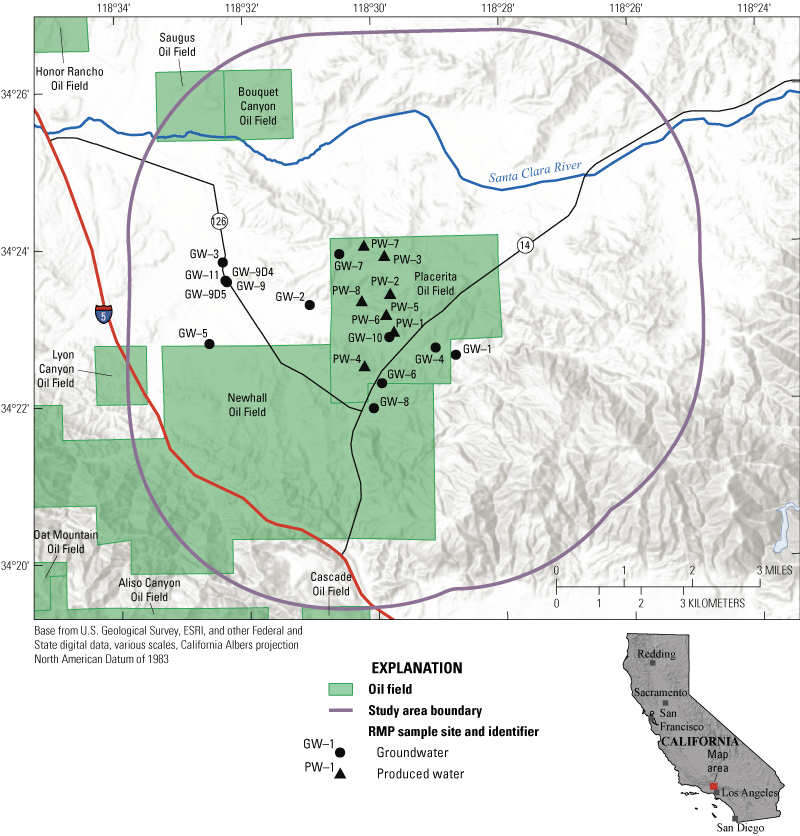
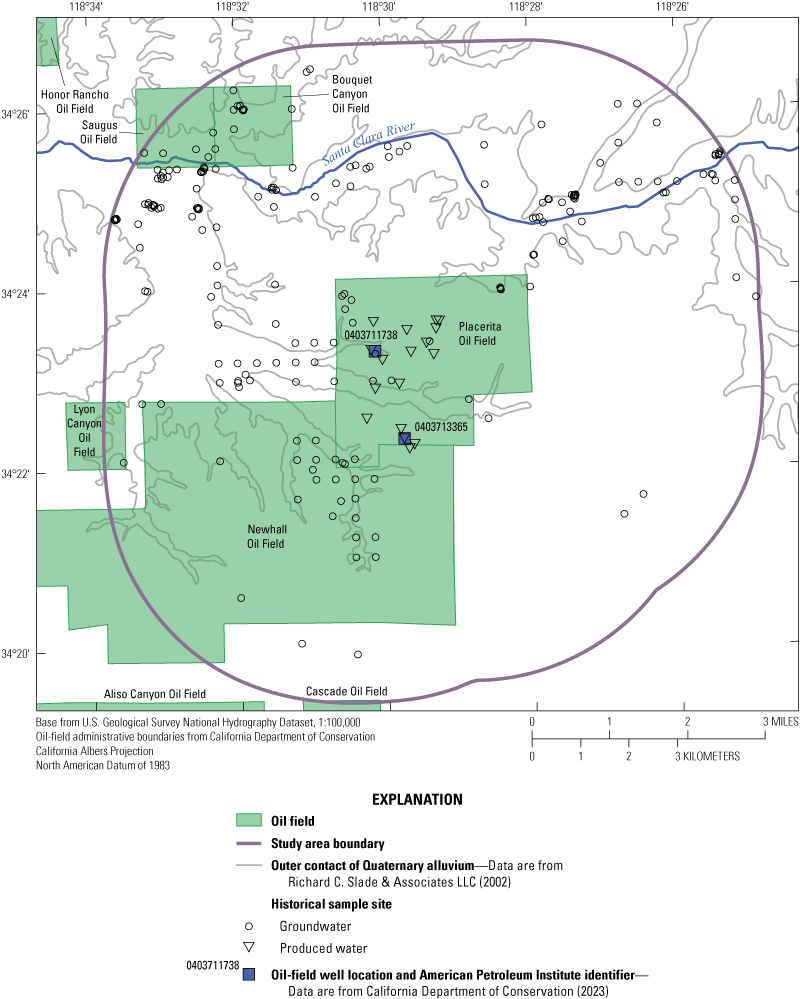
Map showing the Placerita Oil Field study area and California State Water Resources Control Board Oil and Gas Regional Monitoring Program (RMP) sample collection sites, California, 2018. Data are from Stanton and Marcusa (2024).
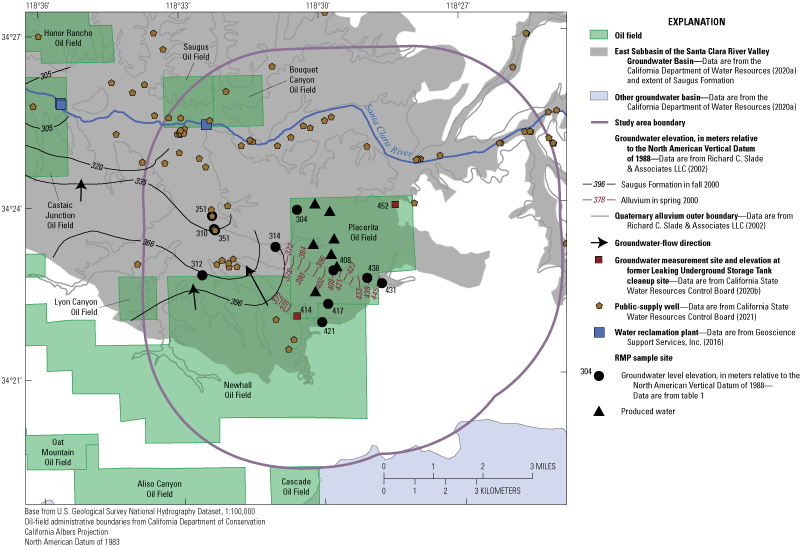
Map showing the groundwater basins, public-supply wells, water reclamation plants, groundwater elevations, and other hydrogeologic features near the Placerita Oil Field study area and California State Water Resources Control Board Oil and Gas Regional Monitoring Program (RMP) sample collection sites, California, 2018.
Purpose and Scope
This report describes groundwater quality in the context of oil development, other anthropogenic activities, and natural processes near the Placerita Oil Field. Study results are provided in three sections: “Groundwater Quality”, “Potential Fluid-Migration Pathways”, and “Relation of Groundwater Quality to Pathways”. The “Groundwater Quality” section discusses the primary chemical constituents most helpful for identifying potential effects of oil development on groundwater in the study area:
-
• volatile organic compounds (VOCs),
-
• light hydrocarbon gases and stable isotopes of methane,
-
• groundwater age-dating tracers,
-
• inorganic tracers,
-
• dissolved organic carbon,
-
• stable isotopes of water,
-
• noble gases, and
-
• stable isotopes of carbon in dissolved inorganic carbon.
Groundwater quality results were compared with the chemistry of oil field produced-water samples representing oil field formation water, water stored in tanks before injection, and water from wells that have been used for steam injection and disposal.
Information about potential sources and pathways of hydrocarbons and other chemical constituents that are associated with oil-field fluids are presented in the “Potential Fluid-Migration Pathways” section. Data about potential pathways were obtained from historical data, historical publications and documents, and new analyses conducted by this study. The potential pathways were assessed using a coarse-level examination of available information and more detailed reviews of data in selected parts of the study area where the coarse-level examination indicated the presence of potential pathways.
The “Relation of Groundwater Quality to Pathways” section includes detailed reviews of possible pathways near the California Oil, Gas, and Groundwater RMP groundwater samples with chemistry results that indicated potential mixing with fluids from hydrocarbon-bearing formations.
Data limitations that prevented a better understanding of the effects of anthropogenic activities and natural factors on groundwater quality were identified. The RMP groundwater chemistry data used for analyses within this report are published in Stanton and Marcusa (2024), and the RMP produced-water chemistry data are published in Seitz and others (2024).
Study Area Description
The study area includes the area within 4.8 kilometers (km) of the Placerita Oil Field administrative boundary. The Placerita Oil Field is about 3 km east of the town of Newhall in western Los Angeles County and is at the upgradient end of the East Subbasin of the Santa Clara River Valley Groundwater Basin, hereinafter referred to as the East Subbasin (fig. 2; California Department of Water Resources, 2020a). As of 2012, land use in the study area was designated as 30 percent low use (shrub or scrub or grassland), 28 percent urban, and 25 percent residential (Falcone, 2015; Multi-Resolution Land Characteristics Consortium, 2021). Smaller parts of the study area were used for commercial, industrial, transportation, and recreation purposes (17 percent).
Hydrogeologic Setting
The most prominent surface-water feature in the study area is the Santa Clara River, which intermittently flows and is north of the Placerita Oil Field (fig. 2). Several small tributaries of the Santa Clara River serve as drainage features within and downgradient from the Placerita Oil Field. Groundwater used for supply is stored in Quaternary alluvial deposits under the Santa Clara River and its tributaries and in the Pliocene to Pleistocene Saugus Formation (Richard C. Slade & Associates, LLC, 2002; Geoscience Support Services, Inc., 2016). Infiltration of water from the Santa Clara River and intermittently flowing tributary streams is the major source of recharge in the alluvial aquifer (Robson, 1972; Geoscience Support Services, Inc., 2016). Primary sources of water to the Saugus Formation are groundwater from the overlying alluvium, recharge from precipitation, and smaller amounts of subsurface inflow from upgradient geologic units (Geoscience Support Services, Inc., 2016).
The Saugus Formation is composed of two stratigraphic units (Richard C. Slade & Associates, LLC, 2002). The lower unit is composed of fine-grained sandstone and siltstone sediments that were deposited in shallow marine and terrestrial environments and is not widely used for public supply because of its brackish quality and low well yields (Richard C. Slade & Associates, LLC, 2002). Water from the lower unit could be a source of salinity in areas where hydraulic gradients favor upward movement of groundwater. The upper unit is composed of coarse-grained sediments that were deposited in a terrestrial environment. Sediments of the upper unit comprise aquifers that are used for public water supply at depths from about 90 to 760 meters (m) below land surface. The base of freshwater, commonly defined in California as having a TDS concentration of less than 3,000 mg/L, varies across the study area. The depth to base of freshwater has a maximum depth of about 460 m below land surface on the north side of the San Gabriel Fault (fig. 3) and more than 1,000 m below land surface south of the San Gabriel Fault (Richard C. Slade & Associates, LLC, 2002). Within the Placerita Oil Field, the base of freshwater denoted in oil-field well drilling records is commonly at a depth of about 150 m below land surface (Davis and others, 2018b).
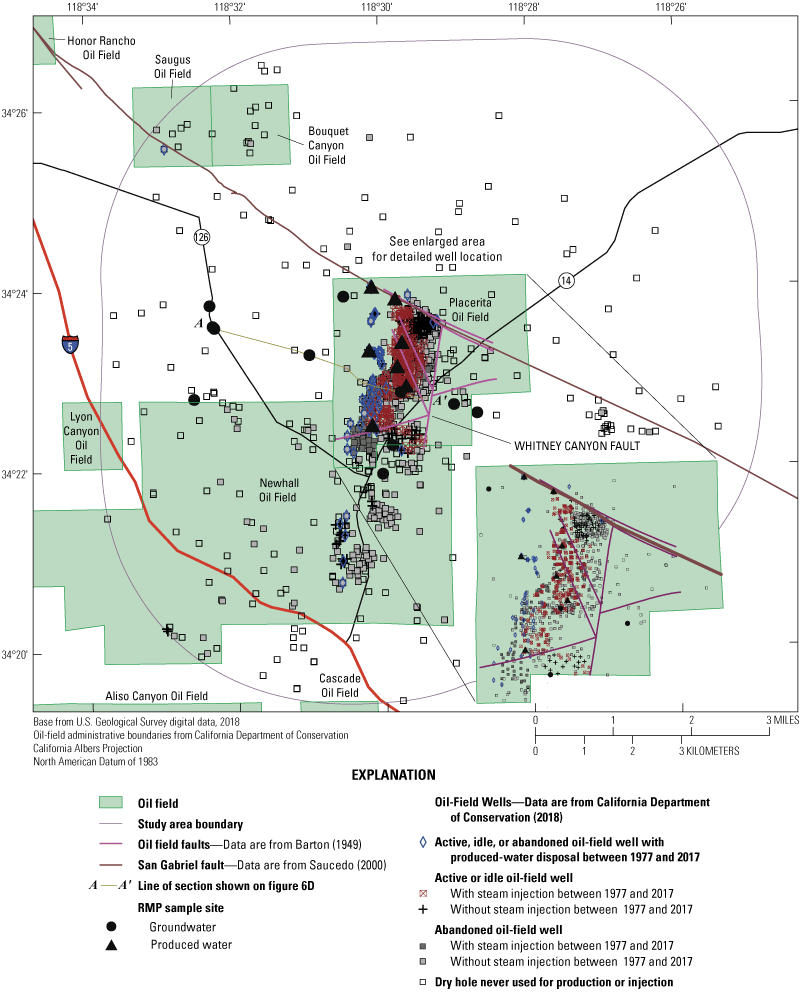
Map showing oil-field wells and faults in the Placerita Oil Field study area and California State Water Resources Control Board Oil and Gas Regional Monitoring Program (RMP) sample collection sites, California, 2018.
Few water levels were available from wells within the Placerita Oil Field for determining the depth to groundwater and local flow directions above the oil production and injection zones (California Department of Water Resources, 2020b). However, documentation for a produced-water spill indicated that groundwater is or has been within 15 m below land surface (corresponding to elevations of 452 and 414 m) at several locations near the far northeast and southwest edges of the Placerita Oil Field (GeoTracker Global ID T1000007342). Groundwater elevations in the alluvial valleys were also available in the southern part of the Placerita Oil Field and ranged from 378 to 445 m (fig. 2; Richard C. Slade & Associates LLC, 2002). The regional groundwater flow in the Saugus Formation downgradient of the Placerita Oil Field is generally toward the northwest (fig. 2), with local groundwater flow patterns in the alluvium toward the river and then westward (Richard C. Slade & Associates, LLC, 2002; Geoscience Support Services, Inc., 2016; Luhdorff & Scalmanini Consulting Engineers, 2021).
Water use exceeds local aquifer production, and in 2020, more than 60 percent of water supply was imported from the State Water Project and other sources, 22 percent was pumped from groundwater in alluvial deposits, 16 percent was pumped from groundwater in the Saugus Formation, and less than 1 percent was from recycled wastewater (Luhdorff & Scalmanini Consulting Engineers, 2021). Water has been imported from outside the study area since the 1980s and has been the primary source of freshwater since 2003. Three water reclamation plants are downgradient from the Placerita Oil Field and RMP sample locations (fig. 2). They are tertiary treatment facilities, primarily treating municipal wastewater for discharge into the Santa Clara River or for beneficial reuse downgradient from the study area (Geoscience Support Services, Inc., 2016). Unlike some oil field settings in California, such as the Fruitvale (Wright and others, 2019) and Oxnard (Rosecrans and others, 2021) Oil Fields, groundwater directly overlying the Placerita Oil Field is not used for purposes that require high quality water, such as for drinking (California Department of Water Resources, 2023). As of 2020, water in the region was primarily used for municipal supply with smaller amounts used for agriculture and other purposes (Luhdorff & Scalmanini Consulting Engineers, 2021).
Oil Field Geology and History
The geologic structures of the Placerita Oil Field consist of a series of Quaternary and Tertiary sedimentary deposits that lie on northwest dipping pre-Cretaceous crystalline rocks (Barton and Sampson, 1949; Oakeshott, 1950; Tudor, 1962; Winterer and Durham, 1962; California Department of Conservation, 1992). The extent of oil-producing zones in the Placerita Oil Field has been described as limited by an edge-water drive (groundwater flow into the oil-producing zones) on the west and geologic facies changes in other directions (Tudor, 1962; Berkman, 1994). Most oil development is west of the Whitney Canyon fault and south of the San Gabriel fault (fig. 3). Other than the bounding faults, faulting within the field is minor (Tudor, 1962). Oil is produced from three zones: the Pliocene-Pleistocene Shepard zone in the lower unit of the Saugus Formation, and the Pliocene Upper Kraft and Lower Kraft zones in the Pico and Repetto (Towsley) Formations (fig. 4). The Lower Kraft zone is the main producing interval (Berkman, 1994). The elevation of the top of the Shepard zone, the shallowest oil-producing zone, ranges from 46 to 411 m (fig. 4), corresponding with approximate depths of 400 to 60 m below land surface (California Department of Conservation, 1992). The oil-producing zones are overlain by younger intervals of the Saugus Formation, terrace deposits, and recent alluvium (Oakeshott, 1950; Tudor, 1962).
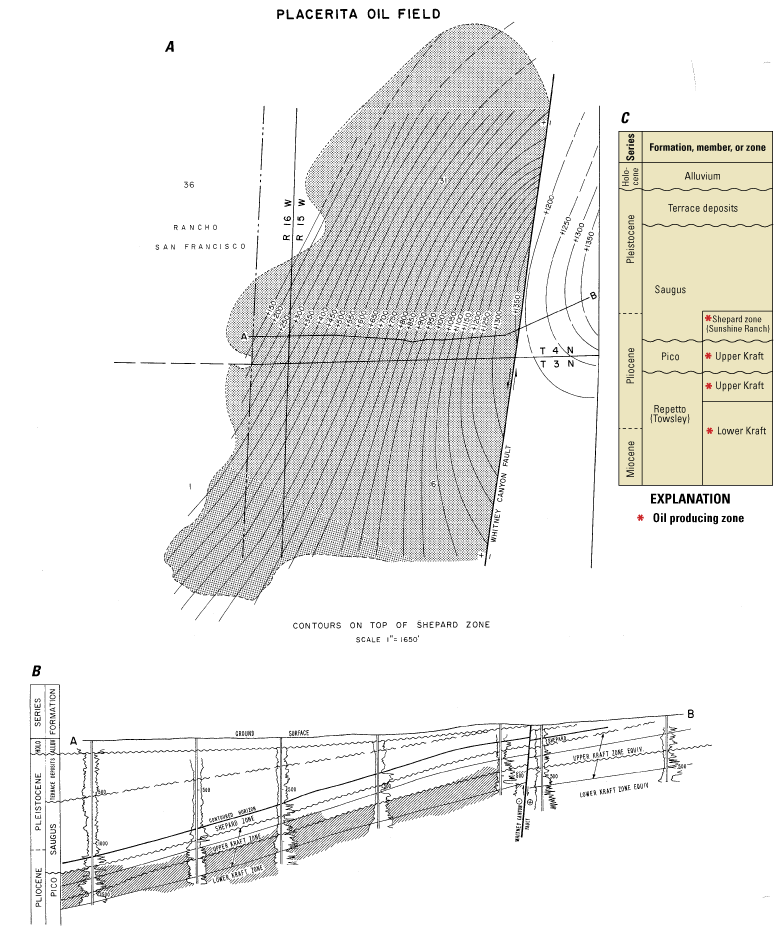
A, map showing elevation, in feet above sea level, of the top of the oil-producing zones (Shepard zone); B, cross section of oil-producing zones (California Department of Conservation, 1992, p. 386); and, C, stratigraphy of oil-producing zones (Tudor, 1962, table 1; Winterer and Durham, 1962) in the Placerita Oil Field, California.
The Placerita Oil Field had two early periods of development. Four wells (York 1, 2, 3, 4) were developed to maximum depths of 487 m below land surface between 1920 and 1933 (Winterer and Durham, 1962). These first four wells only yielded small amounts of low gravity (11.8° American Petroleum Institute [API] gravity) oil; therefore, no further development commenced until the late 1940s when a well (Kraft 1) was constructed that yielded 10 cubic meters (m3) a day of 16.4° API gravity oil from depths of 178 to 219 m below land surface (Winterer and Durham, 1962). In 1949, a period of rapid development in the northern part of the field was initiated by the completion of a well (Juanita 1) that produced 54 m3 a day of 22.8° API gravity oil from 529 to 560 m below land surface (Winterer and Durham, 1962). By the end of November 1951, 1.8 million cubic meters (Mm3) of high-gravity oil was produced from the northern part of the field, and 0.5 Mm3 of lower gravity oil was produced in the southern part of the field (Winterer and Durham, 1962). Oil production declined substantially after 1950 and has remained below about 200,000 m3 per year since 1959 (fig. 5; California Department of Conservation, variously dated). The field produced almost 11.7 Mm3 of oil, 278,000 m3 of gas, and 137 Mm3 of water from 1949 to 2017 (California Department of Conservation, variously dated). Gas has not been extracted since 1990. Because gas extraction is relatively small in the study area compared to oil extraction, discussions throughout this report focus on oil development.
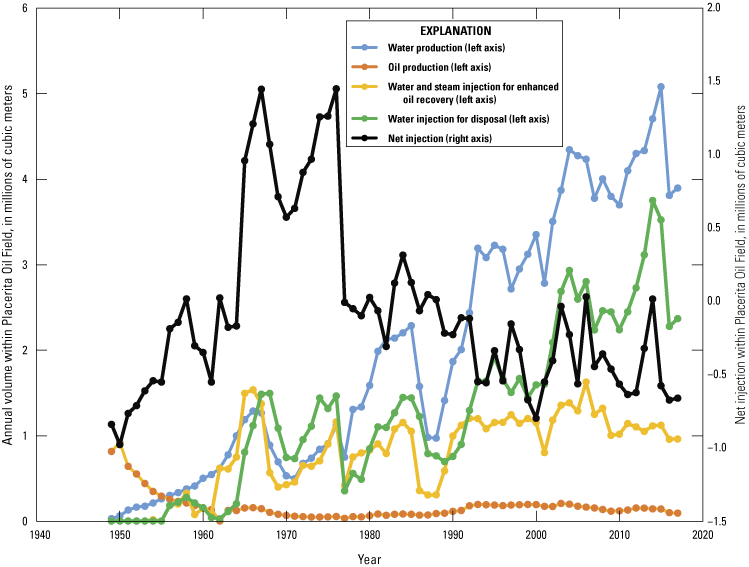
Line graph showing annual water production, oil production, water and steam injection for enhanced oil recovery, water injection for disposal, and net injection volumes, Placerita Oil Field, California, 1949–2017 (California Department of Conservation, variously dated).
Enhanced oil recovery practices used since the mid-1950s in the Placerita Oil Field to help increase the flow of low gravity oil for extraction include waterflooding, steamflooding, cyclic steam, and fireflooding (California Department of Conservation, 1992, variously dated). Waterflooding began in 1954 but is no longer practiced. Steamflooding and cyclic steam activities began in 1964 and are still common in the Placerita Oil Field. Fireflooding was only used between 1964 and 1967. Hydraulic fracturing was not reported as an enhanced oil recovery practice used within the Placerita Oil Field (California Department of Conservation, 2021).
As of 2018, the Placerita Oil Field had 978 wells (184 active, 261 idle, and 533 abandoned; fig. 3; California Department of Conservation, 2018). Among active wells, 2 were used for production without cyclic steam, 128 were used for production with cyclic steam, 40 were used for steam flood injection, 10 were used for produced-water disposal injection, and four wells were used for observation. About 142 Mm3 of water and steam were injected in the Placerita Oil Field from 1954 to 2017 with about 55 Mm3 injected for enhanced oil recovery and about 87 Mm3 injected for disposal (fig. 5; California Department of Conservation, variously dated). The cumulative volume of water and steam injected between 1949 and 2017 is about 4 percent smaller than the volume of oil and water produced. More water and steam were injected than produced in the mid-1960s to late-1970s, implying that produced water was treated and used for enhanced oil recovery and sources of water in addition to produced water were injected. During the other times, more water was produced than injected, indicating that excess water was disposed of using methods other than injection, such as surface disposal ponds, before disposal through injection wells became more prevalent, or through export out of the oil field, or because excess water was generated by groundwater flow into the oil-producing zones. Production and injection are shallower, and volumes are generally smaller, in the southern part of the Placerita Oil Field (fig. 6A, B, C). Water and steam injection volumes are discussed in more detail in the “Hydraulic Gradients” section.
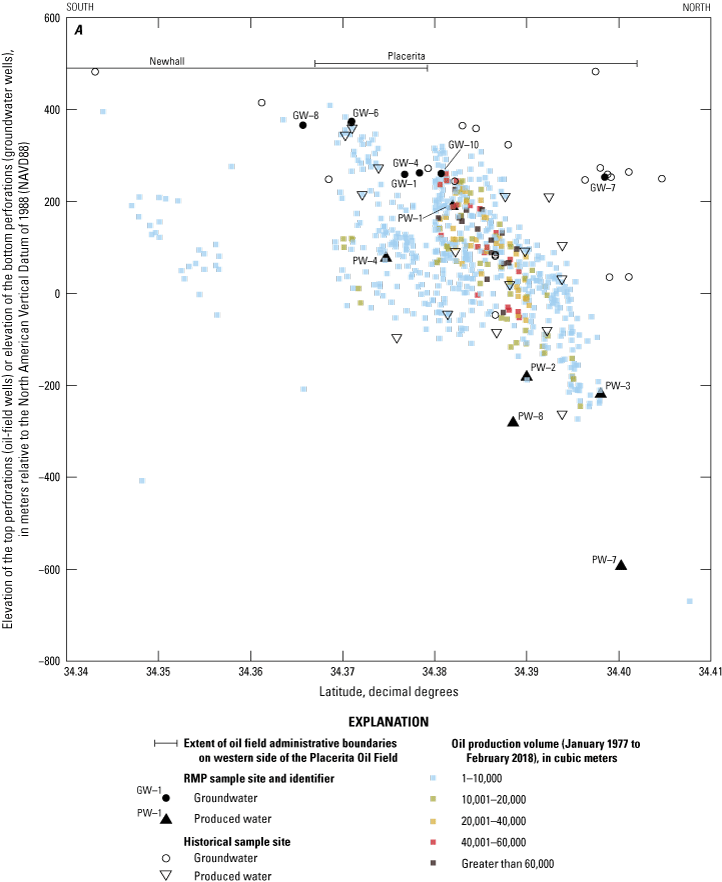
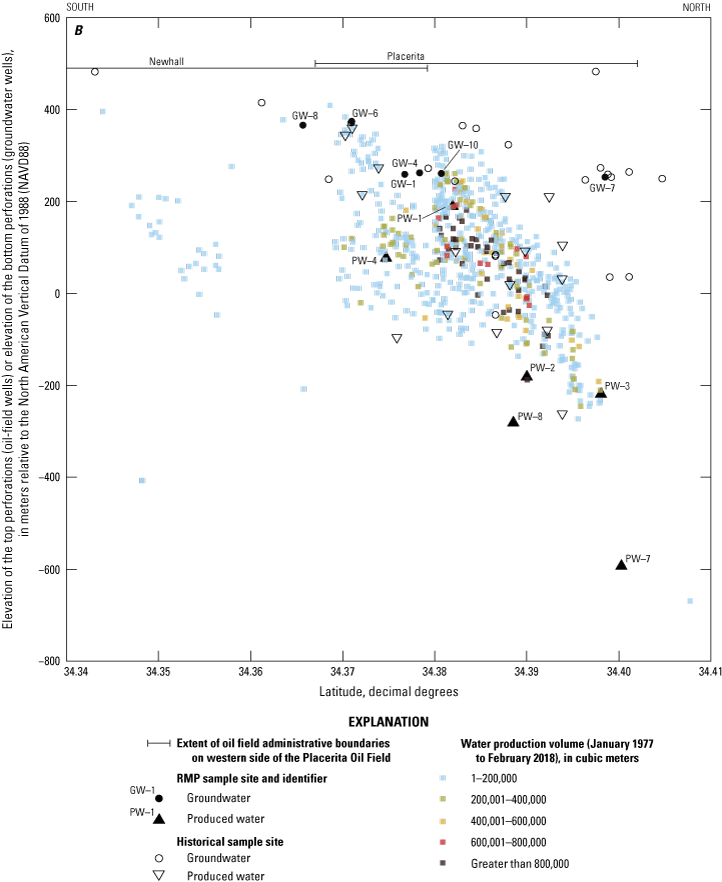
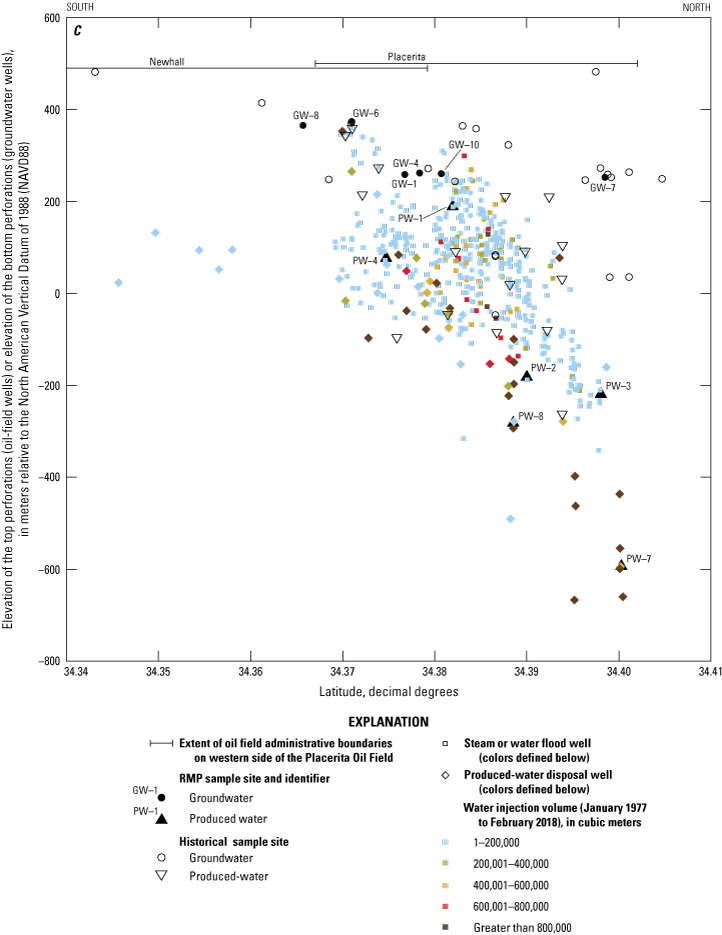
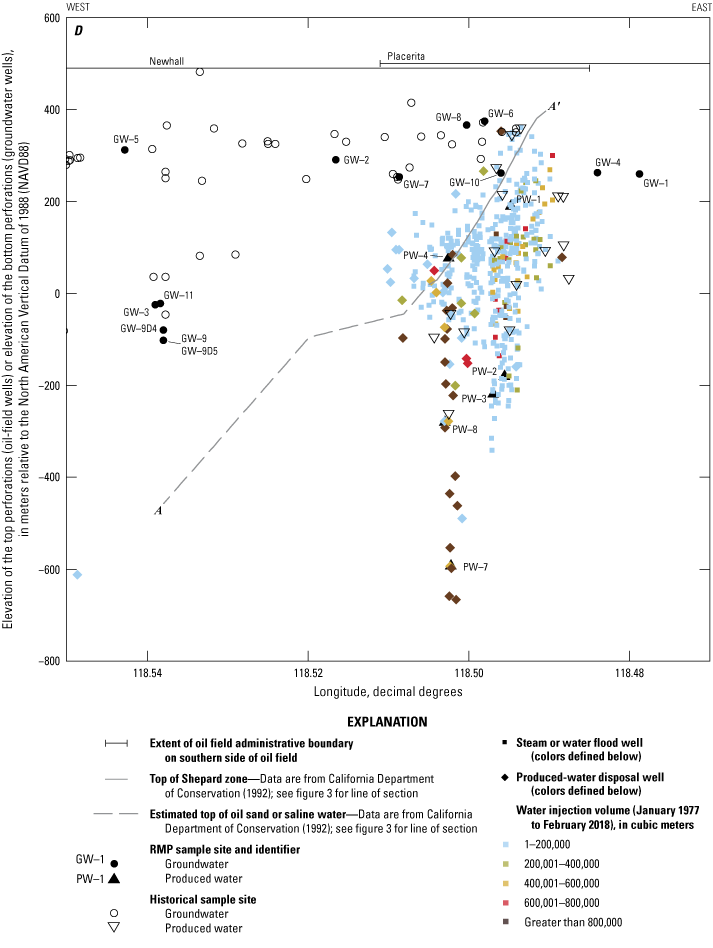
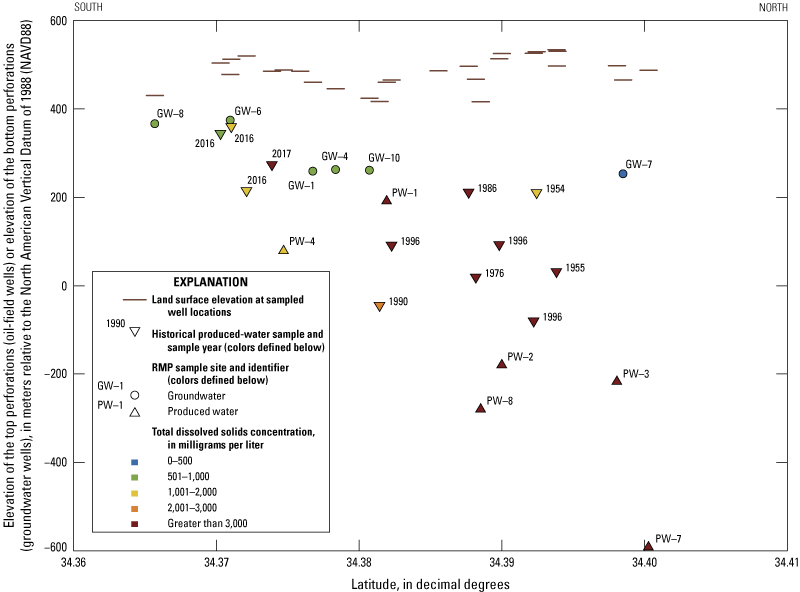
Aggregated plot of vertical separation between the depths of California State Water Resources Control Board Oil and Gas Regional Monitoring Program (RMP) and historical samples for A, latitude and oil production volumes; B, latitude and water production volumes; C, latitude and water and steam injection volumes; and D, longitude and water and steam injection volumes in the Placerita Oil Field, California (California Department of Conservation, 2019b). Wells within the easternmost and westernmost boundaries of the Placerita Oil Field are shown in plots A, B, and C, and all wells are shown in plot D.
Other oil fields in the study area are the Newhall Oil Field, Bouquet Canyon Oil Field, Lyon Canyon Oil Field, and Saugus Oil Field. Oil development in these fields is much less extensive than in the Placerita Oil Field (California Department of Conservation, 2018, 2020). As of 2018, 27 idle and 294 abandoned oil-field wells in the study area were outside of the Placerita Oil Field; however, 186 of those were dry holes never used for production or injection. Between 1977 and 2018, 48,000 m3 of oil were produced from 41 of those oil-field wells, mostly from the Newhall Oil Field.
Data Used for Analyses
Data used in this study include groundwater and produced-water chemistry obtained from samples collected for the RMP study, historical groundwater and produced-water chemistry compiled from other sources, oil-well data available from the California Department of Conservation, and the State Water Board’s GeoTracker data management system for sites that could affect water quality. Additional published material (described in the “Potential Fluid-Migration Pathways” section) was also reviewed for information about hydrogeology, oil development, and other anthropogenic activities that could explain the presence of hydrocarbons or elevated concentrations of selected inorganic constituents in groundwater samples. Oil companies were invited to share relevant information on wells they owned that were selected for sampling and on oil field conditions that would be relevant to the study. USGS scientists also consulted with the Newhall County Water District, California Department of Conservation Division of Geologic Energy Management, and Los Angeles Regional Water Quality Control Board staff that were familiar with the study area to obtain information about local wells, hydrogeologic conditions, and oil-field operations.
The term “reporting level” is used within this report to represent the smallest concentration reported by a laboratory as a numeric value. If a concentration is smaller than the reporting level, it is coded as “less than” the reporting level. However, volatile organic compounds (VOCs) measured by the USGS National Water Quality Laboratory are an exception to this reporting convention and are often reported as numeric values that are smaller than the reporting level because they were analyzed using mass spectrometry methods that provide multiple pieces of information for identifying analytes (Williams and others, 2015). Any concentration not coded as “less than” the reporting level is considered a detection.
Regional Monitoring Program Water Chemistry Samples
Groundwater samples were collected by the USGS in 2018 from two monitoring wells (GW–5, GW–7), three irrigation wells (GW–1, GW–2, GW–4), one domestic well (GW–8), three public-supply wells (GW–3, GW–9, GW–11), and two oil field water-supply wells (GW–6, GW–10; table 1; Stanton and Marcusa, 2024). The sampled wells were constructed at depths ranging from 64 to 471 m below land surface. Wells were chosen on the basis of areal and vertical position along expected groundwater-flow paths upgradient and downgradient from the Placerita Oil Field, proximity of wells to current and historical oil development such as active and abandoned oil-field wells and produced-water injection, and availability of historical water-quality data. The groundwater samples collected close to past or present productive oil development (within 500 m of an oil-field well not designated as a dry hole) were GW–4, GW–6, GW–8, and GW–10 (app. 2, table 2.1). Sample GW–1 was upgradient from the areas of most intensive oil development. The remaining samples were downgradient from oil development.
Table 1.
Well construction and sampling information for groundwater and oil-field wells sampled as part of the California State Water Resources Control Board Oil and Gas Regional Monitoring Program (RMP) in the Placerita Oil Field study area, California, 2018.[Data are from Seitz and others (2024) and Stanton and Marcusa (2024). Dates shown as month–day–year. NA, not applicable; <, less than]
| Sample identifier (fig. 1) | Site identification number | Sample date | Well or site type | Well perforation interval or sample interval, meters below land surface | Length of well perforation, meters | Land surface elevation, meters | Water or fluid level depth, meters below land surface | Percent well yield from flowmeter data |
|---|---|---|---|---|---|---|---|---|
| GW–1 | 342236118284301 | 6–28–2018 | Irrigation | 85–201 | 116 | 456 | 125 | NA |
| GW–2 | 342316118305901 | 6–27–2018 | Irrigation | 79–104 | 24 | 393 | 82 | NA |
| GW–3 | 342350118322001 | 6–27–2018 | Public supply | 128–390 | 262 | 364 | 60 | NA |
| GW–4 | 342242118290201 | 8–7–2018 | Irrigation | 67–183 | 116 | 443 | 25 | NA |
| GW–5 | 342247118223401 | 8–14–2018 | Monitoring | 70–73 | 3 | 384 | 71 | NA |
| GW–6 | 342216118295301 | 8–16–2018 | Oil-field supply (inactive) | 49–104 | 55 | 467 | 350 | NA |
| GW–7 | 342355118303101 | 8–15–2018 | Monitoring | 207–213 | 6 | 464 | 161 | NA |
| GW–8 | 342157118300101 | 8–13–2018 | Domestic | 4<64–64 | 5Unknown | 429 | 8 | NA |
| GW–96 | 342335118321701 | 11–7–2018 | Public supply (inactive) | 238–471 | 233 | 368 | 24 | NA |
| GW–10 | 342248118294801 | 11–5–2018 | Oil-field supply | 73–163 | 90 | 423 | 215 | NA |
| GW–11 | 342336118321801 | 11–26–2018 | Public supply | 148–390 | 242 | 365 | 755 | NA |
| GW–9D18 | 342335118321701 | 11–8–2018 | Public supply (inactive) | 290–369 | NA | 368 | 24 | <5 |
| GW–9D28 | 342335118321701 | 11–9–2018 | Public supply (inactive) | 369–404 | NA | 368 | 24 | <5 |
| GW–9D38 | 342335118321701 | 11–9–2018 | Public supply (inactive) | 404–421 | NA | 368 | 24 | <5 |
| GW–9D4 | 342335118321701 | 11–10–2018 | Public supply (inactive) | 421–448 | NA | 368 | 24 | 26 |
| GW–9D5 | 342335118321701 | 11–8–2018 | Public supply (inactive) | 448–471 | NA | 368 | 24 | 70 |
| PW–1 | 342255118294101 | 12–10–2018 | Cyclic steam | 271–383 | 112 | 461 | Unknown | NA |
| 9PW–2 | 342324118294401 | 12–10–2018 | Cyclic steam | 707–1,053 | 346 | 525 | Unknown | NA |
| 9PW–3 | 342353118294901 | 12–10–2018 | Lower Kraft production (formation water) | 717–811 | 94 | 498 | Unknown | NA |
| 9PW–4 | 342229118300901 | 12–10–2018 | Upper and Lower Kraft production (formation water) | 411–441 | 40 | 488 | Unknown | NA |
| PW–5 | 342308118294801 | 12–11–2018 | Tank influent (composite formation water) | NA | NA | 486 | NA | NA |
| PW–6 | 342308118294802 | 12–11–2018 | Tank effluent (processed composite water for injection) | NA | NA | 486 | NA | NA |
| PW–7 | 342401118300801 | 12–11–2018 | Produced-water disposal | 1,081–1,260 | 179 | 487 | Unknown | NA |
| PW–8 | 342319118301101 | 12–11–2018 | Produced-water disposal | 697–882 | 185 | 416 | Unknown | NA |
Additional groundwater samples were collected at multiple depths from one of the public-supply wells (GW–9 sample well) to represent vertical changes in groundwater chemistry (Izbicki and others, 2005a; Wright and others, 2021). These depth-dependent samples were collected in conjunction with fluid-velocity logs while the public-supply well was having water withdrawn from a temporary large-capacity pump installed in the well. The temporary pump was installed at a depth of 183 m below land surface and pumped at a rate of 360 liters per minute. This pumping caused upward flow in the well from the well perforations toward the temporary pump inlet, which was above the top of the perforations (238 m below land surface). A composite sample was collected from the temporary pump that represented an integrated sample of water entering the full thickness of the perforations (sample GW–9). Depth-dependent samples were then collected by lowering a PVC pipe and a submersible portable sampling pump with a withdrawal rate of about 4 liters per minute to collect water in the well at five depths (290, 369, 404, 421, and 448 m below land surface). For the depth-dependent samples, concentrations in groundwater inflow from the aquifer over the vertical intervals between samples (290–369, 369–404, 404–421, 421–448, and 448–471 m below land surface; table 1) were estimated for conservative constituents (constituents that would not be affected by geochemical reactions) using fluid-velocity data and assuming simple mixing within the well (Izbicki and others, 2005a). To prevent errors associated with the greater uncertainty of estimating concentrations at smaller inflow amounts, only samples collected from the two depth intervals having at least 5 percent of the total flow into the well (GW–9D4 and GW–9D5; table 1) were used for study analyses.
Produced-water geochemical data were collected at eight sites for the RMP. Produced-water sample collection methods and analytical results are described in more detail by Seitz and others (2024). The RMP produced-water sample chemistry and isotopic data are used within this report for comparison and to provide context for interpreting groundwater sample chemistry and isotopic results.
Groundwater samples were processed onsite in a mobile laboratory using USGS National Field Manual procedures designed to minimize changes to the water sample chemistry or introduction of target analytes during sample collection (U.S. Geological Survey, variously dated). Prior to sample collection, water was flushed from the wells by purging at least three casing volumes. Samples were delivered from the well to the onsite mobile laboratory through Teflon tubing with stainless-steel connections that were cleaned between samples according to USGS protocols (U.S. Geological Survey, variously dated). At wells without a dedicated pump, water was pumped with a portable stainless-steel submersible pump. Precleaned bottles were then filled within an enclosed chamber to help prevent sample contamination and preserved by chilling, filtration, chemical treatment, or a combination of these methods, to reduce sample degradation. Specific conductance, pH, water temperature, turbidity, and dissolved oxygen were monitored throughout the duration of pumping to assess the stability of the pumped water (U.S. Geological Survey, variously dated). Blank, replicate, and laboratory-matrix spike samples were collected to evaluate the reliability of sample processing and analytical methods (app. 3, table 3.1). Samples from public-supply wells were collected prior to treatment and do not represent water delivered for consumption.
Groundwater samples were analyzed for a wide range of dissolved chemical, gas, and isotopic constituents to identify potential indicators of groundwater mixing with oil-field fluids. Results and analytical methods for groundwater chemistry analyses are available in Stanton and Marcusa (2024). Constituents analyzed included the following:
-
• inorganic elements (major and minor cations and anions);
-
• nutrients;
-
• volatile organic compounds;
-
• dissolved organic carbon (DOC) and its optical properties;
-
• hydrogen and oxygen stable isotopes of water;
-
• isotopes of strontium and boron;
-
• radium-224, radium-226, and radium-228;
-
• groundwater age-dating tracers;
-
• dissolved noble gases;
-
• light hydrocarbon gases (methane through hexane);
-
• the stable isotopes of carbon in dissolved inorganic carbon (δ13C-DIC), and
-
• hydrogen and carbon stable isotopes of methane.
The groundwater-age tracers tritium (3H) and carbon-14 in dissolved inorganic carbon (14C-DIC) were used to classify samples as modern (recharged during or after 1953), premodern (pre-1953), or a mixture. For this study, premodern groundwater was defined as having no detected 3H and 14C-DIC less than 75 percent modern carbon (Plummer and Sprinkle, 2001; McMahon and others, 2017). Modern groundwater was defined as having a 3H activity greater than 0.59 tritium unit and 14C-DIC greater than 90 percent modern carbon (Jurgens and others, 2010; Kulongoski and others, 2010; McMahon and others, 2017). If any values fell outside of those co-occurring ranges, samples were classified as a mixture of modern and premodern groundwater. These thresholds are approximate values for classifying groundwater ages and assessing relations of groundwater age to concentrations of selected chemical constituents.
Historical Water Chemistry Data
Samples collected for the RMP were supplemented with additional chemistry data from historical groundwater and produced-water samples from five sources: the California State Water Resources Control Board (2017, 2020a, b), the California Department of Water Resources (2018), the California State Water Resources Control Board Division of Drinking Water (2021), the USGS National Water Information System (U.S. Geological Survey, 2021), and Metzger (2022). Water chemistry samples were included in the compilation if they had results for inorganic constituents, benzene, toluene, ethylbenzene, and xylene (BTEX) compounds, age-dating tracers, or light hydrocarbon gases.
Historical supplemental sources provided data from more than 9,000 groundwater samples collected from 271 wells in the study area since 1931 (fig. 7). About 40 percent of the wells had either well-perforation or well-depth information for associating chemical properties with depth intervals. Depths ranged from 8 to 433 m below land surface, with a median depth of 36 m below land surface. The RMP produced-water data were supplemented with data from 43 previously collected produced-water samples representing water from storage and processing tanks, oil-production wells, injectate, and unidentified sources (fig. 7). Depths to the top of sampled oil-well perforations ranged from 103 to 758 m below land surface, with a median depth of 397 m below land surface. Sixteen of the wells with historical groundwater-chemistry data were within 500 m and 5 were within 100 m of active oil-field wells. Two of those wells were also sampled for the RMP (GW–6 and GW–10).
Map showing historical groundwater and produced-water sample collection sites in the Placerita Oil Field study area, California, 1931–2020 (California State Water Resources Control Board, 2017, 2020a, 2020b; California Department of Water Resources, 2018; U.S. Geological Survey, 2021; California State Water Resources Control Board Division of Drinking Water, 2021; Metzger, 2022).
Historical chemistry data from other sources were primarily used as a supplement and to provide context for interpreting RMP results. Few methane concentrations (12 samples) and age-dating tracer results (1 sample) were available for historical groundwater samples. When using historical major ion and trace element data, the most recent sample with complete data was used because the most recent sample was often closer to the RMP sample collection dates. However, for VOCs and light hydrocarbon gas data, all historical samples at each well were used to evaluate whether there had been a detectable concentration in any sample at any time. This approach was used to best determine the locations where groundwater has been affected by those compounds regardless of subsequent remediation or attenuation. The reporting levels for VOC concentrations obtained from historical data sources were often substantially higher than for RMP samples, typically by about an order of magnitude.
Groundwater Quality
Water-chemistry data from the RMP samples and other sources were used to characterize groundwater quality in the Placerita Oil Field study area with respect to chemical constituents potentially associated with oil-field fluids. Results are presented in the context of age-dating results (table 2) and other geochemical tracers. Samples with modern-age groundwater indicate that compounds detected in groundwater may have originated at or near the land surface since 1953, and samples containing premodern groundwater indicate that compounds have originated at the land surface before 1953 or are from old, subsurface sources. The following sections provide a summary of results for VOCs and light hydrocarbon gases as indicators of potential mixing with oil-field fluids and other geochemical tracers for additional lines of evidence.
Table 2.
Volatile organic compound and age-dating results for California State Water Resources Control Board Oil and Gas Regional Monitoring Program (RMP) groundwater samples in the Placerita Oil Field study area, California, 2018.[VOC, volatile organic compound; ND, not detected]
| Sample identifier (fig. 1) | Tritium concentration, in tritium units | Percent modern carbon, from carbon-14 concentration in dissolved inorganic carbon | Groundwater age category | Number of detections by VOC category1 | |||
|---|---|---|---|---|---|---|---|
| Petroleum hydrocarbon | Manufactured or from oil-field fluids2 | Manufactured | Manufactured or naturally occurring | ||||
| GW–1 | 0.5 | 56.5 | Mix | 0 | 0 | 0 | 0 |
| GW–2 | 1.3 | 79.0 | Mix | 0 | 0 | 0 | 0 |
| GW–3 | 0.8 | 82.1 | Mix | 0 | 1 | 3 | 0 |
| GW–4 | 1.0 | 82.8 | Mix | 1 | 0 | 0 | 0 |
| GW–5 | 0.4 | 95.3 | Mix | 0 | 2 | 3 | 0 |
| GW–6 | 0.2 | 6.8 | Mix | 5 | 2 | 1 | 0 |
| GW–7 | ND | 47.5 | Premodern | 0 | 0 | 0 | 0 |
| GW–8 | 1.3 | 52.2 | Mix | 0 | 0 | 0 | 1 |
| GW–9 | ND | 29.8 | Premodern | 1 | 0 | 0 | 0 |
| GW–9D43 | ND | 28.94 | Premodern | 0 | 0 | 0 | 0 |
| GW–9D43 | ND | 27.91 | Premodern | 0 | 0 | 0 | 0 |
| GW–10 | ND | 21.2 | Premodern | 10 | 1 | 0 | 1 |
| GW–11 | 0.2 | 44.2 | Mix | 0 | 1 | 0 | 0 |
Categories based on Eganhouse and others (1996), DeSimone and others (2014), Akob and others (2015), and Seitz and others (2023). Concentrations provided in app. 2, table 2.3.
Volatile Organic Compounds
Analyzed VOCs were categorized as a petroleum hydrocarbon, a compound that is manufactured or from oil-field fluids, a manufactured compound, or a compound that is manufactured or naturally occurring (table 2; app. 2, tables 2.2 and 2.3). At least one petroleum hydrocarbon VOC was detected in 4 of the 13 RMP groundwater samples. Concentrations of petroleum hydrocarbons were much smaller than drinking-water benchmarks, such as maximum contaminant levels or health-based screening levels (fig. 8; app. 2, table 2.2; U.S. Environmental Protection Agency, 2018; California State Water Resources Control Board, 2019; California State Water Resources Control Board Division of Drinking Water, 2020) and no individual petroleum hydrocarbon concentration exceeded 0.5 micrograms per liter (µg/L). The two samples containing multiple petroleum hydrocarbons (GW–6 and GW–10) were the samples closest to oil field sources and are discussed in more detail in the “Relation of Groundwater Quality to Pathways” section. Sample GW–10 was categorized as having premodern groundwater and sample GW–6 was a mixture of modern and premodern groundwater.
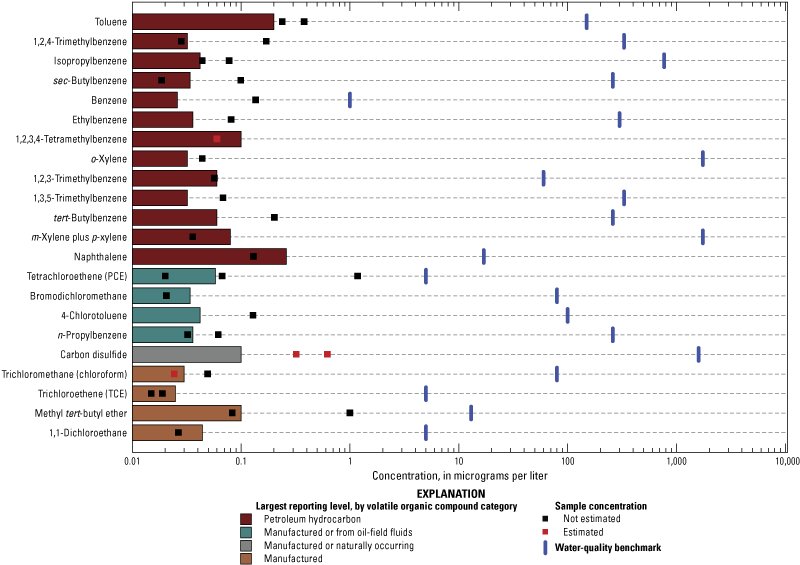
Bar graph showing concentrations of detected volatile organic compounds for California State Water Resources Control Board Oil and Gas Regional Monitoring Program (RMP) groundwater samples in the Placerita Oil Field study area, California, 2018.
The largest petroleum hydrocarbon concentrations in RMP groundwater samples were of toluene in samples GW–4 (0.24 µg/L) and GW–9 (0.38 µg/L). However, the toluene concentrations in these samples may not reflect regional groundwater conditions. Detections of toluene in the absence of other petroleum hydrocarbons, as is the case for those samples, have been associated with well construction and maintenance activities (Gintautas, 2015); both samples were collected from wells that had recent well work completed. In addition, historical samples collected between 1985 and 1998 from the GW–9 well did not contain BTEX compounds (California State Water Resources Control Board, 2017). Furthermore, sample GW–9 was collected under non-ideal circumstances. The well had previously been inactive so heavy equipment had to be inserted into the well to scrape the well screen before sampling commenced. Although large generators that could have artificially contributed airborne VOCs to the sample were running during sample collection, results from a field-blank sample collected concurrently with sample GW–9 ruled out an airborne source of toluene because it did not contain toluene or any other VOCs (app. 3). Petroleum hydrocarbons, including toluene, were not detected in the depth-dependent samples collected from the same well on different days (GW–9D4 and GW–9D5). Internal testing performed by the National Water Quality Laboratory to identify false positive and false negative results for VOCs indicated that none of the 161 blind samples analyzed from January 2018 to January 2023 had a false positive result for toluene (app. 2, table 2.2; U.S. Geological Survey, 2023).
Benzene was the most detected petroleum hydrocarbon in historical groundwater samples. This result is expected, in part, because benzene and other BTEX compounds adversely affect human health (Lawrence, 2006) and are, therefore, analyzed more frequently than other petroleum hydrocarbons. Benzene and the other BTEX compounds also have relatively higher solubilities than other petroleum hydrocarbons (Lawrence, 2006). Benzene concentrations were available for more than 3,000 historical and RMP groundwater samples collected from 130 wells (monitoring, public supply, and other supply) and were detected in 36 groundwater wells at concentrations ranging from 0.11 to 12,500 µg/L. To help minimize the effect of variable reporting levels from data sources, an artificial threshold level of 0.5 µg/L (the most often used reporting level for historical groundwater chemistry data) was applied to benzene samples. Benzene concentrations were greater than 0.5 µg/L in none of the RMP groundwater samples and in 25 percent (32 of 130) of the wells that had a historical benzene measurement. These were all environmental monitoring wells at facilities that, in many cases, have identified soil or groundwater contamination from industrial or commercial facilities unrelated to oil and gas development (California State Water Resources Control Board, 2017). Twenty-one of the 32 environmental monitoring wells with a benzene detection greater than 0.5 µg/L had depth information, and those data showed that the samples were collected from wells with depths of less than 25 m below land surface. Twenty-seven of the 32 wells were northwest or northeast of the Placerita Oil Field, in areas unlikely to be affected by oil development based on distance from oil-field wells and expected groundwater flow directions (figs. 2 and 9). Four of the sites were clustered at a historical leaking underground gasoline storage tank cleanup site (GeoTracker Global ID T0603705321) near the northeast corner of the Placerita Oil Field. Those sites were on the north side of the San Gabriel fault, away from most oil-field wells (fig. 3). Only one oil-field well was within 500 m of those four sites—an exploratory well that had oil and gas shows (oil or gas detected in the drilling mud or drilling cuttings; see app. 1) as shallow as 44 m below land surface but was never used for production and was abandoned within a month after the well was drilled because of commercial importance were encountered. The presence of shallow oil and gas shows in the vicinity of the benzene detections indicate that natural sources of petroleum hydrocarbons not related to oil-field development cannot be ruled out.
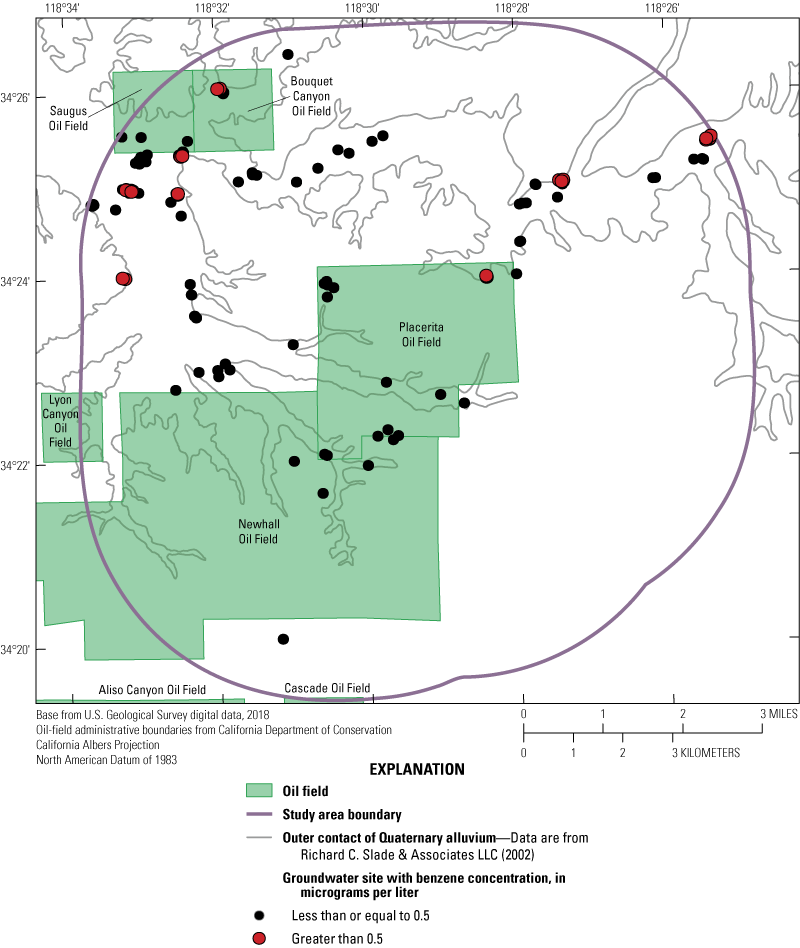
Map showing the distribution of benzene detections greater than 0.5 microgram per liter for California State Water Resources Control Board Oil and Gas Regional Monitoring Program (RMP) groundwater samples and historical groundwater samples in the Placerita Oil Field study area, California, 1985–2020 (California State Water Resources Control Board, 2017, 2020a, 2020b; California State Water Resources Control Board Division of Drinking Water, 2021; Stanton and Marcusa, 2024).
At least one manufactured VOC was detected in 3 of the 13 RMP groundwater samples (table 2) at concentrations below drinking-water benchmarks (U.S. Environmental Protection Agency, 2018; California State Water Resources Control Board, 2019; California State Water Resources Control Board Division of Drinking Water, 2020). The manufactured VOCs detected were trichloromethane (2 samples), trichloroethene (2 samples), methyl tert-butyl ether (2 samples), and 1,1-dichloroethane (1 sample; app. 2, table 2.2). Methyl tert-butyl ether (a gasoline additive discontinued in the early 2000s) was detected in sample GW–6, implying that some source of this compound occurs in the vicinity. The other detections of manufactured VOCs were in samples GW–3 and GW–5, relatively far from oil field sources and likely from urban sources. The three samples containing manufactured VOCs were classified as mixed-age groundwater.
Several detected VOCs could either be manufactured or from oil-field fluids. N-propylbenzene is both a manufactured compound and a petroleum hydrocarbon (Eganhouse and others, 1996; DeSimone and others, 2014). Four Placerita Oil Field RMP produced-water samples had n-propylbenzene at concentrations ranging from 5.09 to 82.4 µg/L, but it was only detected in the two RMP groundwater samples (GW–6 and GW–10) that contained multiple petroleum hydrocarbons, no other manufactured VOCs, and were near oil-field wells—indicating that the compound was more likely from oil-field fluids than from a manufactured source. Tetrachloroethene (PCE), bromodichloromethane, and 4–chlorotoluene are manufactured VOCs and also were detected in produced-water samples collected from other oil fields (Akob and others, 2015; Seitz and others, 2023). PCE was detected downgradient from the oil field in two samples (GW–3 and GW–11) collected from deep wells and one sample (GW–5) collected from a well installed to specifically monitor groundwater contamination from dry-cleaning chemicals that contained PCE (app. 2, table 2.3). Bromodichloromethane was only detected in one RMP groundwater sample (GW–5), and that sample also contained four other manufactured VOCs but no petroleum hydrocarbons. The VOC 4–chlorotoluene was only detected in sample, GW–6, a RMP groundwater sample collected near oil development that contained multiple petroleum hydrocarbons. It is unlikely that the PCE and bromodichloromethane detections in sample GW–5 represent mixing with produced water, but the 4–chlorotoluene detection in sample GW–6 could be from oil-field fluids.
Carbon disulfide, a compound that can be naturally occurring or manufactured (Agency for Toxic Substances and Disease Registry, 1996), was detected in two samples near oil development. One of those samples (GW–8) contained no other VOCs, but the other sample (GW–10) contained multiple petroleum hydrocarbons.
Light Hydrocarbon Gases
Dissolved methane was detected in all RMP groundwater samples at concentrations ranging from 0.0025 to 88 mole percent, with a median concentration of 0.147 mole percent (0.0006–75 mg/L, with a median of 0.0153 mg/L; app. 2, table 2.4). Methane concentrations were largest, ranging from 1.73 to 88 mole percent, in samples collected near oil development (GW–6, GW–8, GW–10). Methane was not detected in any of the 12 historical groundwater samples with a reported measurement. Methane concentrations in the five RMP produced-water samples ranged from 4.89 to 23.9 mole percent with a median of 9.12 mole percent, and concentrations in three RMP casing-gas samples were 26.5, 88.9, and 90.4 mole percent (Seitz and others, 2024).
Methane is produced in two ways. Microbial methane is a byproduct of the microbial decomposition of organic matter in geochemically reducing settings (through microbial methanogenesis) whereas thermogenic methane is produced in deep geologic formations with high pressure and temperature that produces coal, oil, or natural gas deposits (Whiticar and others, 1986; Kulongoski and others, 2018). Thermogenic methane sometimes co-occurs with the heavier gases ethane (C2), propane (C3), isobutane (C4), n-butane (C4), isopentane (C5), n-pentane (C5), or hexane (C6). The presence of propane and heavier gases is indicative of thermogenic contributions to formation gases (Schoell, 1980). Samples GW–6 and GW–5 contained small amounts of heavier gases in the propane through pentane (C3–C5) range, indicating that the gases at these sites are at least partially from thermogenic sources. Ethane is not necessarily indicative of thermogenic sources because it can also result from microbial processes in some cases (Taylor and others, 2000). However, for Placerita samples, ethane was only detected in samples GW–6, GW–8, and GW–10, which had the highest methane concentrations and at least one indicator of thermogenic gas, including detection of C3–C5 hydrocarbon gases and (or) mixed methane isotopic signals (see the next paragraph). All the RMP produced-water and casing-gas samples contained heavier gases (Seitz and others, 2024), signifying that thermogenic gas was present in oil-field fluids.
The source of methane can be determined from multiple lines of evidence including the stable isotopes of hydrogen and carbon in methane (δ2H-CH4, δ13C-CH4), the molar ratio of methane to heavier hydrocarbon gases [C1/(C2+C3)], the stable isotope of carbon in dissolved inorganic carbon (δ13C-DIC), and oxidation-reduction conditions (Schoell, 1980; Whiticar and others, 1986; Aravena and others, 1995; Whiticar, 1999; Avrahamov and others, 2015; McMahon and others, 2017; Kulongoski and others, 2018; Anders and others, 2022). Four RMP groundwater samples (GW–1, GW–6, GW–8, and GW–10) had a methane concentration large enough to analyze for δ2H-CH4 and δ13C-CH4. Methane isotopic results (fig. 10A) and the ratio of methane to heavier hydrocarbon gases (fig. 10B) indicated that methane in samples GW–8 and GW–10 is a mixture of thermogenic and microbial sources. The combination of gas molar ratio data (fig. 10B), enriched δ13C-CH4 (greater than −50 per mil) and δ2H-CH4, and the presence of heavier gases (propane and isobutane) indicates that sample GW–6 contains at least some thermogenic gas that has been oxidized. Based on the carbon and hydrogen isotopic values in methane and oxic conditions (dissolved oxygen of 6.6 mg/L) at the site, methane in sample GW–1 is consistent with either a microbial or a mixture of microbial and thermogenic sources that have undergone methane oxidation. Methane in the RMP produced-water and casing-gas samples was from thermogenic sources except for PW–4. However, PW–4 was collected on the western side of the Placerita Oil Field where the effects of the edge-water drive (groundwater flow into the oil-producing zones) likely contribute to its mixed composition.
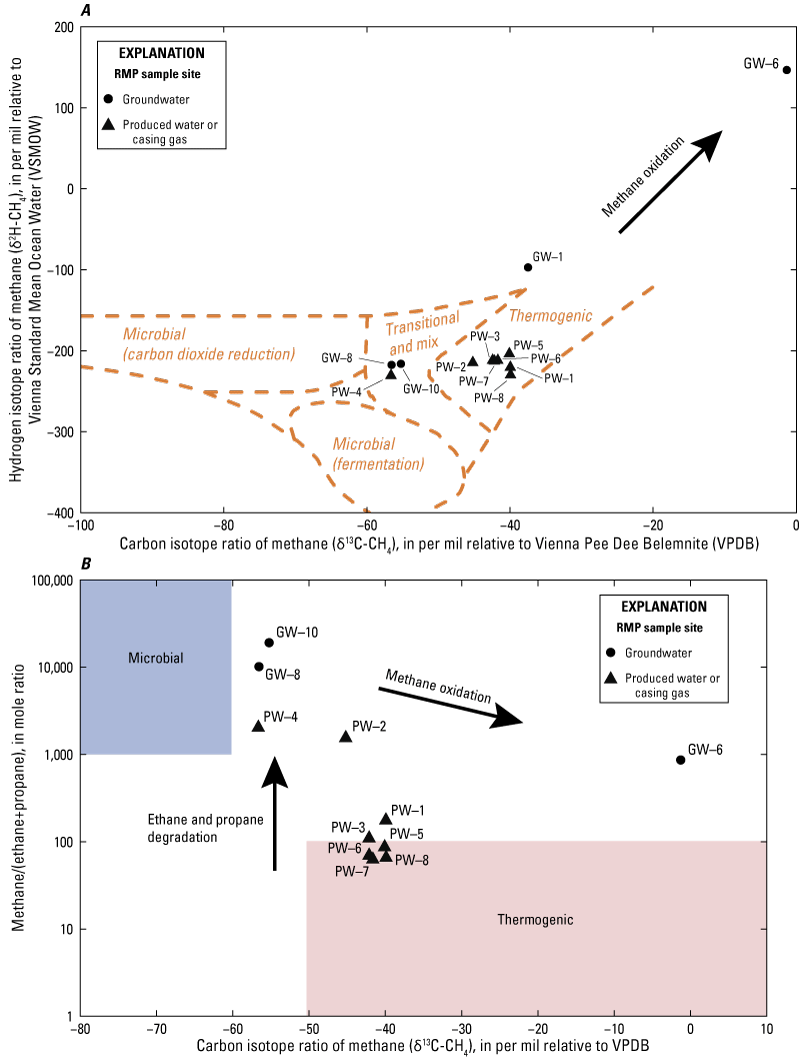
Graph showing carbon isotopic composition of methane for California State Water Resources Control Board Oil and Gas Regional Monitoring Program (RMP) groundwater and produced-water or casing-gas samples in the Placerita Oil Field study area, California, 2018, in relation to A, the hydrogen isotopic composition of methane, and B, the ratio of methane to ethane plus propane. Zone boundaries for microbial and thermogenic methane are from Whiticar and others (1986). Samples with methane concentrations less than 0.1 milligrams per liter are not shown because of insufficient methane in those samples to measure isotopes.
Other Geochemical Tracers
Hydrocarbon-bearing formations often contain saline water with higher concentrations of TDS and alkalinity, as well as specific constituents such as ammonium, barium, boron, bromide, chloride, DOC, iodide, and lithium (Angino, 1970; Compton and others, 1992; Blondes and others, 2018; McMahon and others, 2018; Wright and others, 2019). Historical and RMP groundwater samples were generally fresh water, and samples with concentrations of TDS larger than 3,000 mg/L were in areas not immediately downgradient from the Placerita Oil Field (fig. 11). Two groundwater wells with historical data contained water that was slightly saline (TDS greater than 3,000 mg/L). One is about 3.5 km northwest of the oil field, near the Santa Clara River, and the other is about 4 km south of the oil field. Three historical groundwater samples, collected in the 1950s, within the oil field contained water with TDS concentrations greater than 1,000 mg/L. The largest concentrations of alkalinity, ammonium, barium, boron, chloride, DOC, and lithium were often found in the RMP groundwater samples close to oil development (GW–4, GW–6, GW–8, GW–10; table 3, app. 2, table 2.5, fig. 12). For historical groundwater samples, that pattern was less apparent for alkalinity, barium, boron, and chloride. Most historical groundwater samples had not been analyzed for ammonium, DOC, or lithium.
Map showing total dissolved solids concentrations in the Placerita Oil Field study area, California, 1980–2018 (California State Water Resources Control Board, 2017, 2020a, b; California Department of Water Resources, 2018; U.S. Geological Survey, 2021; California State Water Resources Control Board Division of Drinking Water, 2021; Metzger, 2022; Seitz and others, 2024; Stanton and Marcusa, 2024).
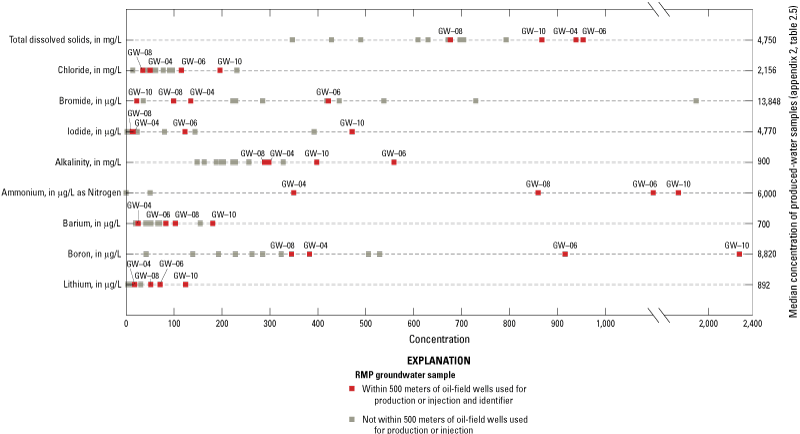
Graph showing concentrations of inorganic constituents potentially associated with hydrocarbon-bearing formations for California State Water Resources Control Board Oil and Gas Regional Monitoring Program (RMP) groundwater samples in the Placerita Oil Field study area, California, 2018.
Table 3.
Conceptual summary of detections of classes of compounds and inferred observations on sources of constituents for California State Water Resources Control Board Oil and Gas Regional Monitoring Program (RMP) groundwater samples in the Placerita Oil Field study area, California, 2018.[VOC, volatile organic compound; DOC, dissolved organic carbon; δ13C-DIC, stable isotopes of carbon in dissolved inorganic carbon; TDS, total dissolved solids]
| Sample identifier (fig. 1) | Petroleum hydrocarbons detected | Thermogenic hydrocarbon gas detected | VOC manufactured or from oil-field fluids | Concentrations of chloride relative to iodide indicate potential mixing | Elevated concentrations of inorganic chemistry constituents that indicate potential mixing | Elevated DOC concentration1 | Enriched δ13C-DIC values | Possible hydrocarbon source(s) | Sample location |
|---|---|---|---|---|---|---|---|---|---|
| GW–4 | Yes | No | No | No | TDS, ammonium | No | No | Well rework, natural, oil development | Placerita Oil Field |
| GW–5 | No | Yes | Yes2 | No | None | No | No | Unknown | Downgradient, dense urban area, monitoring dry-cleaning chemicals |
| GW–6 | Yes | Yes | Yes | Yes | TDS, alkalinity, ammonium, boron, iodide, lithium | Yes | Yes | Natural, oil development | Placerita Oil Field |
| GW–8 | No | Yes | No | No | Ammonium, barium, lithium | Yes | No | Natural, oil development | Newhall Oil Field, Whitney Canyon Park |
| GW–9 | Yes | No | No | Yes | Iodide, bromide | Not analyzed | No | Well rework, oil development | Downgradient, alluvial valley |
| GW–10 | Yes | Yes | No | Yes | Alkalinity, ammonium, barium, boron, chloride, iodide, lithium | Not analyzed | Yes | Natural, oil development | Placerita Oil Field |
Elevated DOC defined as having a concentration greater than 2 mg/L (McMahon and others, 2019; Hanson and others, 2023).
Concentrations of TDS and inorganic constituents in produced-water samples were commonly one to several orders of magnitude greater than the concentrations in groundwater samples (fig. 12; app. 2, table 2.5). However, RMP produced-water sample PW–4 had concentrations more like groundwater samples. That sample was collected on the west side of the Placerita Oil Field in an area where the geochemistry is likely affected by the edge-water drive (Berkman, 1994). In addition, smaller concentrations of inorganic constituents (fig. 13) were detected in produced-water samples in the southern part of the oil field where production and injection wells are shallower (fig. 6) than in the northern part of the oil field. EnviroTech Consultants, Inc. (2018) proposed that the smaller TDS concentrations in a produced-water sample from a well in the southern part of the oil field (API 0403713365; fig. 7) could be from long-term injection of low TDS water as steam. However, this pattern could also be related to recharge from precipitation that has low TDS or other natural geochemical differences such as lack of contact with deeper marine sediments or ancient seawater that has high TDS.
Graph showing latitude and total dissolved solids concentrations in California State Water Resources Control Board Oil and Gas Regional Monitoring Program (RMP) groundwater and produced-water samples, 2018, and historical produced-water samples, 1954–2018. Only groundwater samples within the eastern and western boundaries of the Placerita Oil Field are shown (Metzger, 2022; Seitz and others, 2024; Stanton and Marcusa, 2024).
Concentrations of chloride relative to iodide indicated that two RMP groundwater samples near oil development (GW–6 and GW–10) have chemical characteristics that plot along an apparent mixing line between native groundwater (sample GW–1) and produced-water (fig. 14). The locations of those samples, along the apparent mixing line, are consistent with groundwater that is mixed with 5–10 percent water from oil-bearing formations. Sample GW–9D4, representing aquifer inflow into well GW–9 between 421 and 448 m below land surface, also plots along the apparent mixing line that could be consistent with a 5-10 percent mixture from oil-bearing formations. Sample GW–9 plots lower along the mixing line at a position similar to GW–6 because the GW–9 surface discharge sample is a mixture of water from the bottom of the well represented by sample GW–9D5 between 448 to 471 m below land surface, which shows little to no evidence of mixing, and GW–9D4; GW–9 therefore plots along the mixing line because GW–9D4 may be mixed. Samples GW–9, GW–9D4, and GW–9D5 are about 3 km downgradient from oil development and have well perforations at intervals that overlap with perforations of large volume produced-water disposal wells on the western side of the Placerita Oil Field (fig. 6D). However, if upgradient oil-field water is reaching the location of GW–9, it is doing so between the depths of 421 and 448 m, an interval that represented about 26 percent of the flow into the well during the depth dependent test and not flowing into deeper intervals (sample GW-9D5) that represented about 70 percent of inflow into the well during the depth-dependent test (table 1). It is also possible that sample GW–9D4 represents mixing between shallow native groundwater and deeper groundwater with elevated iodide and chloride that there was no opportunity to sample. Noble gas results (app. 4) are consistent with sample GW–9D4 representing natural deep groundwater.
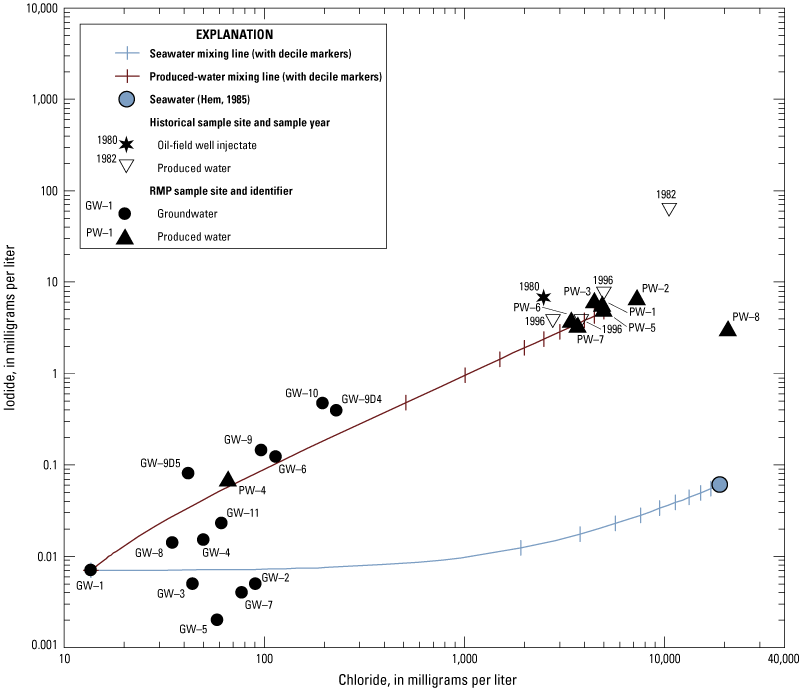
Graph showing concentrations of chloride in relation to iodide in the Placerita Oil Field study area, California, 1980–2018 (Metzger, 2022; Seitz and others, 2024; Stanton and Marcusa, 2024). RMP indicates California State Water Resources Control Board Oil and Gas Regional Monitoring Program (RMP) sample collection sites.
Relative proportions of major inorganic constituents as charge equivalents (Piper and others, 1983) indicate that sample GW–10, along with the deeper RMP groundwater samples GW–7, GW–9, GW–9D4, GW–9D5, and GW–11, plot away from most other groundwater samples (fig. 15). Their compositions are consistent with groundwater that has undergone geochemical processes such as cation exchange of calcium and magnesium for sodium, calcite precipitation, and(or) sulfate reduction (Appelo and Postma, 1999). This pattern is similar to groundwater that has moved into the deep flow system in coastal California aquifers (Izbicki and others, 2003). All these samples, except GW–11, contained only premodern groundwater (table 2). Other RMP groundwater samples were geochemically similar to most of the historical groundwater samples and are consistent with regional groundwater processes. Relative proportions of major inorganic constituents as charge equivalents indicate sample PW–4, along with several historical produced-water samples in the southern part of the oil field, have a different chemical composition than other produced-water samples.
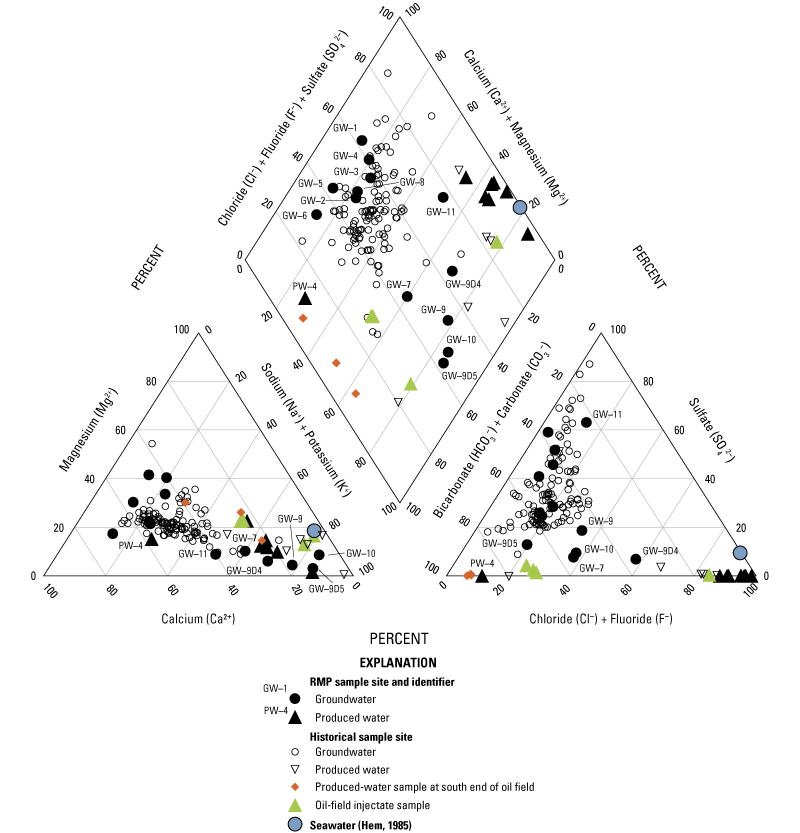
Trilinear diagram showing relative proportions of major ions in the Placerita Oil Field study area, California, 1953–2020 (California Department of Water Resources, 2018; California State Water Resources Control Board Division of Drinking Water, 2021; Metzger, 2022; Seitz and others, 2024; Stanton and Marcusa, 2024).
The stable isotopes of water (δ2H and δ18O) are used to understand the origins and climate conditions of water at the time of recharge (Clark and Fritz, 1997). Apart from sample PW–4, there was little overlap between produced-water and groundwater samples (fig. 16) and results do not clearly indicate mixing between oil-field fluids and groundwater. However, the stable isotopes of water might not be sensitive enough to identify small mixing fractions because of the uncertainty in the isotopic values of oil field waters that span a large range of values. Groundwater samples plot close to the global meteoric water line and were consistent with precipitation as the primary source of water (Clark and Fritz, 1997). Most produced-water samples were less depleted (had larger values) in δ2H and δ18O and plot below the global meteoric water line indicating differing recharge conditions than groundwater.
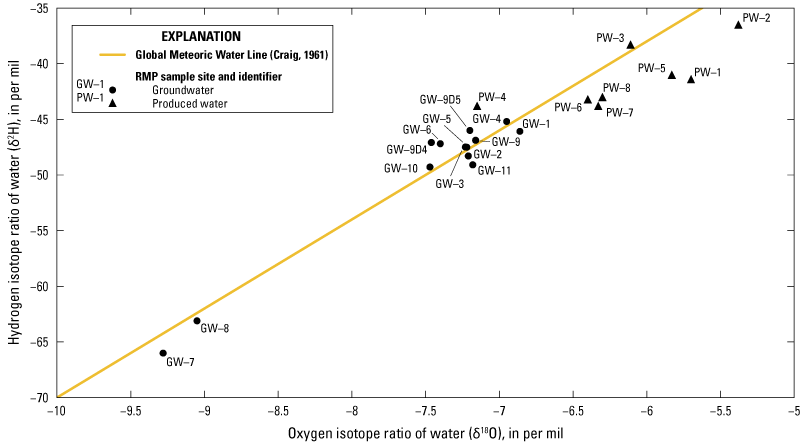
Graph showing stable isotopes of hydrogen and oxygen in water in California State Water Resources Control Board Oil and Gas Regional Monitoring Program (RMP) groundwater and produced-water samples, Placerita Oil Field study area, California, 2018.
Noble gas concentrations and their isotopic ratios can provide additional evidence that groundwater may have mixed with oil-field fluids (app. 4). The composition of sample GW–10 was more like produced-water samples than other groundwater samples for many noble gas results (Seitz and others, 2024; Stanton and Marcusa, 2024). In addition, isotopic data indicated that sample GW–10 was the only groundwater sample that had been exposed to partitioning of neon-20 and argon-36 from water to the oil or gas phases, like all the produced-water samples except for PW–4 (app. 4, fig. 4.1). Noble gas values for all groundwater samples other than GW–10 were consistent with natural evolution of groundwater over long periods (hundreds to thousands of years) after recharge in equilibrium with the atmosphere.
Oil-field fluids commonly have enriched values of δ13C-DIC because of extensive methanogenesis (Carothers and Kharaka, 1980; McMahon and others, 2018). Values of δ13C-DIC in the RMP produced-water samples ranged from 17.06 per mil in sample PW–4 to 25.42 per mil in sample PW–5. Values for groundwater samples ranged from −37.82 to 14.34 per mil. The most enriched RMP groundwater samples, with respect to δ13C-DIC (sample GW–6 [14.34 per mil] and GW–10 [−6.71 per mil]), were from groundwater near oil-field wells. Although mixing with oil-field fluids is one possibility for the enriched δ13C-DIC values in samples GW–6 and GW–10, the results could also be caused by processes other than mixing—such as extensive methanogenesis (Carothers and Kharaka, 1980).
Potential Fluid-Migration Pathways
Available data for understanding the factors that could affect the quality of groundwater resources with respect to chemical constituents associated with oil-field fluids were compiled from many sources and included information related to hydraulic gradients between oil-producing or injection zones and groundwater zones that could drive water movement; oil-field well characteristics favorable for leaks that could have created pathways for upward migration of oil-field fluids; surface ponds, spills, or leaks at or near the land surface; and naturally occurring sources of hydrocarbons at shallow intervals.
Hydraulic Gradients
The risk of upward movement of water from injection zones is enhanced in areas where water is injected in quantities large enough to cause positive hydraulic pressures relative to fresh groundwater zones. Hydraulic gradients between the zones can be determined by comparing fluid levels in idle oil wells with water levels in overlying groundwater wells. Fluid levels were measured in 2018 at 89 idle oil wells distributed across the oil field (fig. 17; California Department of Conservation, 2019b; Shimabukuro and others, 2023). However, few overlying groundwater-level measurements were geographically close enough to the idle oil well fluid levels for determining vertical gradients. The closest groundwater levels to the idle oil well fluid levels were generally higher east of the oil field and lower west of the oil field, indicating that horizontal flow patterns were toward the northwest (fig. 2).
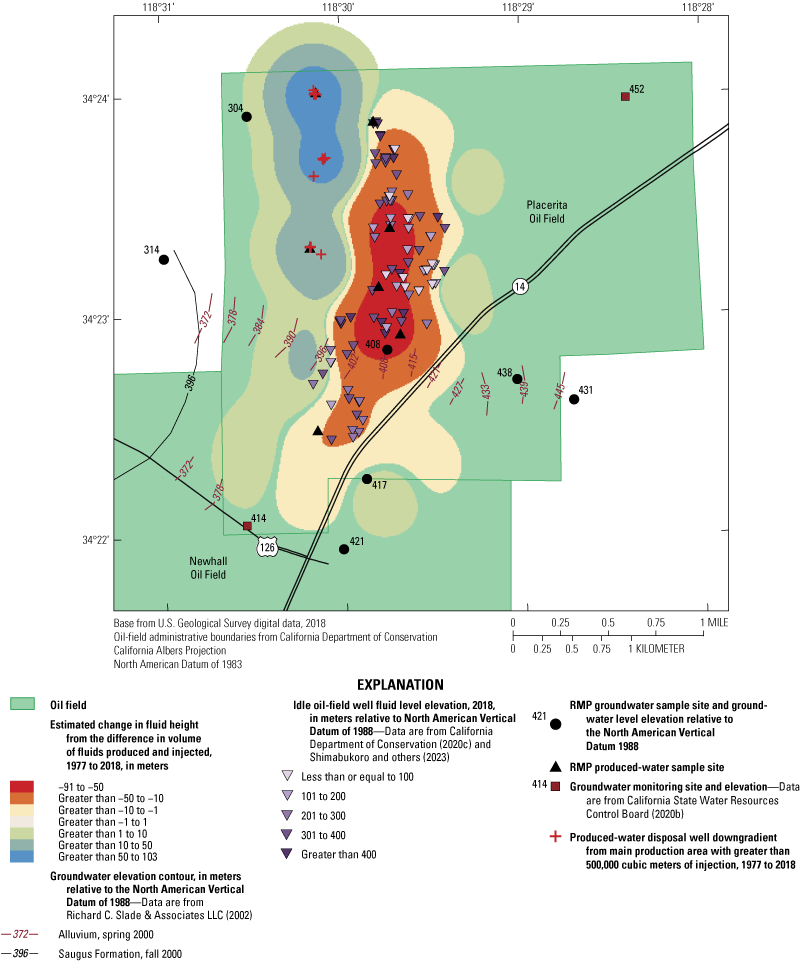
Map of estimated change in fluid height computed from the difference in volume of fluids produced and injected and idle oil well fluid levels, Placerita Oil Field, California, 1977–2018.
Another method for assessing whether hydraulic gradients favor upward fluid movement is to determine if there are areas where the volume of fluids injected (water and steam) is greater than the volume extracted (oil and water). Spatial patterns of the fluid volume balance from January 1977 to February 2018 (California Department of Conservation, 2019b) were determined for this study using methods described in Shimabukuro and others (2019). These volume-balance calculations integrated all vertical producing and injection zones because insufficient data exists to resolve volume balances for specific zones.
Since 1977, most produced water in the Placerita Oil Field has been injected downgradient from the main production area through disposal wells, causing a net positive fluid balance (net change in fluid height greater than zero; fig. 17). In this downgradient area, reservoir pressure may have increased, favoring upward movement of water if a pathway is available. Conversely, the main production area had a net negative fluid balance (net change in fluid height less than zero) and potential decreases in reservoir pressure. Before 1977, overall net injection for the entire field was larger (fig. 5) and indicates that the decrease in pressure in the main production area after 1977 could be offset by earlier positive pressures. However, data were not available for individual wells before 1977 to confirm that possibility. Sustained decreases in reservoir pressure have resulted in land subsidence in some California oil fields, which can induce well-casing failures (Myer and others, 1996; Dale and others, 2000); however, land subsidence data were not available in the Placerita Oil Field (California Department of Water Resources, 2021). Additional limitations for net injection analysis are discussed in Stanton and others (2023).
Areas with net positive fluid balances are expected to correspond with higher pressures or shallower depths to fluid levels in idle oil wells unless a net negative fluid balance existed before 1977. However, no idle well fluid levels were discovered as part of the data search in the areas with large net positive fluid balances (California Department of Conservation, 2019b). The 2018 idle oil well fluid levels in the areas of net negative fluid balance did not exhibit any spatial patterns (fig. 17).
Withdrawing large volumes of fresh groundwater can cause hydraulic gradients to favor movement of variable quality water toward pumping wells, such as in the Pleasant Valley Groundwater Basin in Ventura County (not shown; Izbicki and others, 2005a, b; United Water Conservation District, 2021). This possibility was considered by Luhdorff & Scalmanini Consulting Engineers (2021). They concluded that concentrations of TDS had increased slightly during the past 50 years (including in the RMP sampled public-supply wells GW–3 and GW–11), but data were not sufficiently complete to determine whether pumping was affecting water quality (Luhdorff & Scalmanini Consulting Engineers, 2021). The depths of the sampled RMP public-supply wells were more than 300 m above the base of freshwater (Richard C. Slade & Associates LLC, 1988), and, in the public-supply well that had depth-dependent samples collected, concentrations of inorganic constituents were smaller in the deepest depth-dependent sample (GW–9D5) than in the interval immediately above it (GW–9D4). Therefore, if the public-supply wells are mobilizing high salinity water toward the sampled wells, the source of that water is more likely from a horizontal source than a deeper source. The RMP-sampled public-supply wells have perforations at similar depths to those of produced-water disposal wells on the western side of the Placerita Oil Field (fig. 6D). Although available data for fluid levels and net fluid balances were examined to determine vertical hydraulic gradients between injection or production zones and groundwater, the available data were not sufficient to make a conclusion about migration of poor-quality water to fresh groundwater.
Oil-Field Well Characteristics
Well-Barrier Failures
Although hydraulic gradients, when known, can indicate potential for migration of oil-field fluids, a pathway must be present for fluids to move upward. Incomplete cementing in the space between the well casing and the formation (annulus) at the time of construction, inadequate cementing during well abandonment, and degradation of cement over time can allow upward movement of fluids from production or injection zones or escaped fluids from an oil-field well casing failure (Wu and others, 2008; King and King, 2013). Other subsurface well-barrier failures, in addition to the absence of annular cement, can be caused by inadequate well construction, well-operation stresses, corrosion, tectonic activity, land subsidence, and other factors (Myer and others, 1996; Dale and others, 2000; King and King, 2013; Wisen and others, 2020). Steam injection wells, commonly used in the Placerita Oil Field, have additional well-operation stresses associated with large temperature fluctuations (Wu and others, 2008; King and King, 2013).
Annular Cement
The cemented interval within the well annulus at the time of construction was estimated for this study using methods described by Stanton and others (2023) on the basis of reported depth of the cement injection point, casing diameter, borehole diameter, casing bottom, and the volume of cement and cement additives used (California Department of Conservation, 2019b). These data were available for 729 oil-field wells in the study area, representing construction dates between 1930 and 2014. Oil-field wells within the main production area (550 wells) were further evaluated to determine the presence of gaps in the annular cement between the top of the Shepard zone (the shallowest oil-production zone) and the base of freshwater, the interval most likely to affect groundwater quality if a pathway connecting these zones is present, by comparing the calculated annular cement interval or intervals with the interval between the top of the Shepard zone and base of freshwater (fig. 18). If the base of freshwater was deeper than the top of the Shepard zone, gaps were calculated for the interval between the top of the Shepard zone and the top of annular cement. If the oil-field well perforations were shallower than the top of the Shepard zone, the top of the perforations was used to estimate the top of the oil-production zones.
Depths to base of freshwater used for the calculations were primarily from injection well records compiled by Davis and others (2018b) and supplemented for this study with values from a limited review of selected oil-field well records (California Department of Conservation, 2022). For most injection well records within the Placerita Oil Field (131 of 135), the base of freshwater was reported as the same value (152 m below land surface). Because the same value was reported for most wells, the records probably represent a generally accepted estimate for the Placerita Oil Field instead of a measured value for each well. Annular cement calculations for oil-field wells that did not have an available base of freshwater value from the above sources were based on the most common reported base of freshwater depth of 152 m, and so results include some uncertainty.
The wells with calculated gaps in annular cement were compared with operator-reported cement intervals or notations of cement returning to the surface (indicating that the entire well annulus above the injection point was filled with cement) that were available from oil-field well records (California Department of Conservation, 2019b). Calculated cement intervals were revised using operator-reported values if the reported values indicated that the well annulus was more completely filled with cement than this study’s calculated value. In addition, a date-based random selection of wells (10 percent of wells in each decade with a minimum of either 10 wells or the actual number of well records available from the decade) were checked to determine whether operator-reported values of cement intervals caused an adjustment of the intervals that were calculated using the parameters above. Operator-reported values confirmed the results for the cement gaps in the annular cement between the top of the Shepard zone and the base of freshwater for 168 of the 170 wells assessed.
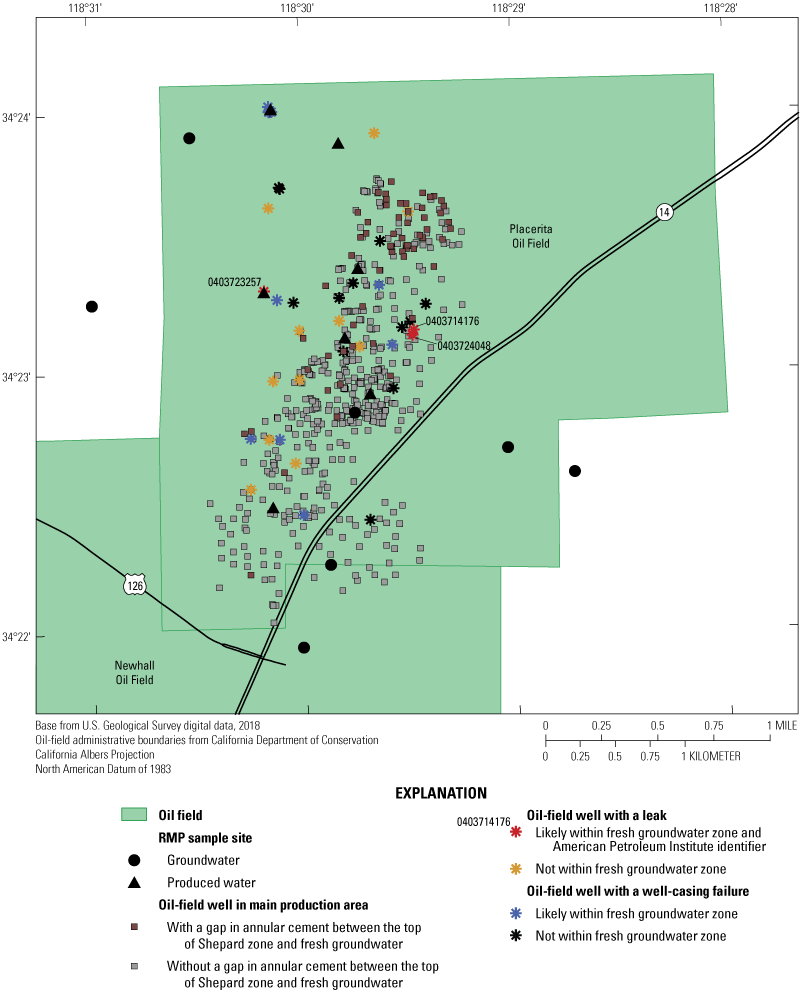
Map showing oil-field well-barrier failures above top perforations in the Placerita Oil Field, California (California Department of Conservation, 2019b; California Department of Conservation, 2022). RMP indicates California State Water Resources Control Board Oil and Gas Regional Monitoring Program sample collection sites.

18. Map showing oil-field well-barrier failures above top perforations in the Placerita Oil Field, California
Gaps in annular cement ranged in length from 1 to 253 m, with a median of 57 m. However, gaps less than 10 m may be smaller than the calculation’s uncertainties caused by (1) data limitations and (2) the inability to take into consideration whether all the cement was contained within the annulus or if some was lost to porous geologic formations during well construction. Therefore, only gaps greater than 10 m were considered for this analysis. Using this approach, annular cement intervals were complete between the top of the Shepard zone and base of freshwater in 489 of the 550 wells (89 percent) evaluated in the main production area. The 61 oil-field wells with gaps in annular cement were primarily in the northern part of the Placerita Oil Field (fig. 18), and all were in wells drilled before 1966 (fig. 19; app. 2, table 2.6). Dusseault and others (2014) described movement of fluids along well casing in very small gaps present along the casing. However, we had no data available to evaluate this mechanism. Annular cement can also degrade over time, especially in wells that convey steam because temperature fluctuations cause cement to expand and contract (Wu and others, 2008; King and King, 2013). Additional limitations of this assessment are included in Stanton and others (2023).
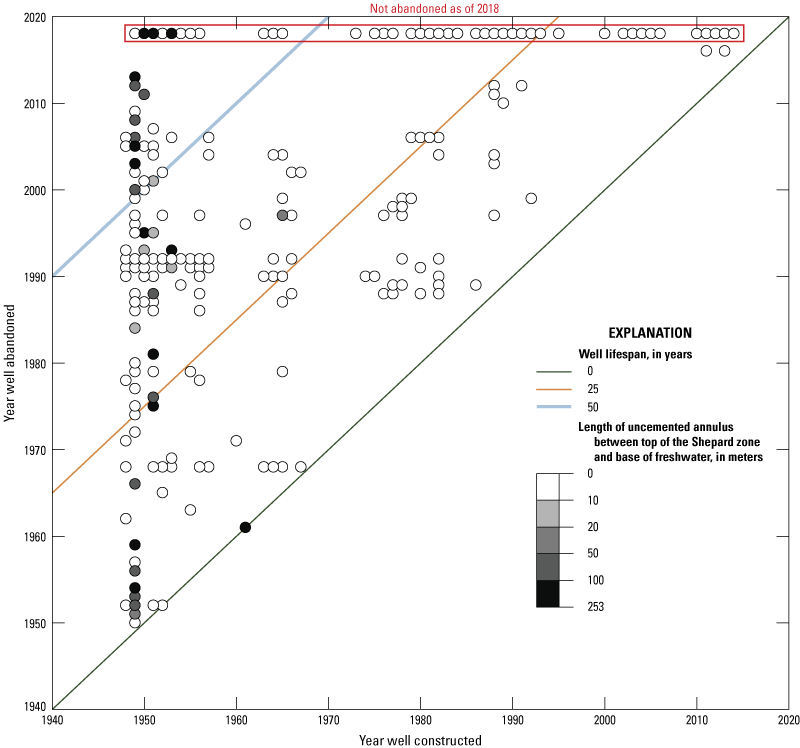
Graph showing oil-field well annular cement and well ages in the Placerita Oil Field, California (California Department of Conservation, 2019b; California Department of Conservation, 2022).
The analysis of annular cement between the top of the Shepard zone and base of freshwater did not include areas where large volumes of produced water are disposed of because contours for the top of the Shepard zone were not available for those areas. Instead, a more detailed review of information related to annular cement and other well characteristics that might be related to potential migration of oil-field fluids was completed for the fourteen downgradient produced-water disposal wells injected with at least 500,000 m3 of fluid (fig. 17; app. 2, table 2.7; California Department of Conservation, 2022). Available data indicated that these wells had top perforations ranging from 518 to 1,173 m below land surface. Twelve wells were constructed such that annular cement extended from land surface to the bottom of the well; one well had a gap in annular cement between 396 and 524 m below land surface; and one was cemented from the bottom of well to about 180 m below land surface (about the same depth as the base of freshwater). Thus, injection wells in the downgradient areas from the largest disposal injection volumes have generally been constructed such that groundwater resources are protected from migration along well annuli. These findings may be related to the age of the injection wells—all but one was constructed after 1984, when new requirements for subsurface injection were established (California Department of Conservation, 1984).
Well Casings
Oil-field well records within the Placerita Oil Field were reviewed for well-casing failures reported by well operators (California Department of Conservation, 2019b, 2022). This was accomplished in the following steps: a computer search for terms such as leak, hole in casing, parted casing, seepage, and fluid surfacing; a manual review of the oil-field well-construction records identified from computer search results to verify that an actual failure existed; and a manual review of the 14 downgradient disposal wells with injection volumes greater than 500,000 m3 (fig. 17). This simple approach cannot fully characterize well-casing integrity across the study area or effects on groundwater quality but may reveal general patterns in well-casing failures. The review identified 36 wells with well-casing failures above the top perforation (fig. 18; app. 2, table 2.6). The failures were recorded between years 1952 and 2020 and were mostly in wells used to inject steam or dispose of produced water, which comprise most of the wells in the Placerita Oil Field. Depths of the failures ranged from 1.5 to 1,036 m below land surface; 13 wells had failures likely in the fresh groundwater zone (generally considered in oil-field well records to be less than 152 m below land surface) and 15 wells had failures in the positive net injection zone where hydraulic gradients could cause upward movement of poor-quality water (fig. 17). These failures were often discovered and repaired as part of regular testing mandated by the California Department of Conservation (2019a) for injection wells.
A well-barrier failure will only cause a leak if other well-containment barriers, such as additional outer-well casings and annular cement, also fail. In addition, fluids will only leak if hydraulic pressures are greater inside the casing than in the surrounding formation (King and King, 2013). Two of the casing failures were in wells (API 0403706373 and 0403711724) that also had a gap in annular cement between the top of the Shepard zone and the estimated base of fresh groundwater, but the depths of the casing failures were unknown, and it could not be determined whether they overlapped with annular cement gaps (app. 2, table 2.6). Fourteen of the well-barrier failure reports specifically mention that the well had leaked (fig. 18), and three of those leaks were likely within the fresh groundwater zone (app. 2, table 2.6). Volumes of leaked fluids were not reported.
Well Age
The age of an oil-field well can indicate potential risk to groundwater quality because well casings and cement seals degrade through time (Dusseault and others, 2000, 2014; King and King, 2013; Ingraffea and others, 2014); and well construction and abandonment practices, including cement quality, have improved through time to better protect groundwater (Nelson, 2012; King and King, 2013). Berkman’s (1996) account of the history of the Placerita Oil Field highlights the lack of proper abandonment procedures in early years, stating that after the initial full-scale development in 1949, “production declined rapidly and many of the leases were abandoned and left in disarray with some of the old tanks and corroded wellheads still remaining” (p. 200). The oil-field wells with gaps in annular cement were in wells that were constructed before 1966 (see the “Annular Cement” section).
Expanded regulations on the oil and gas industry were enacted to protect California groundwater resources in the mid-1970s (California Department of Conservation, 2019a). Of the 1,299 oil-field wells in the study area, 811 (62 percent) were constructed and 311 (24 percent) were abandoned before 1976 (California Department of Conservation, 2018). More than half of the wells constructed before 1976 (463) were abandoned after more protective measures were enacted. Greater potential for fluid migration may not coincide with a specific well age, but 1976 was used as an approximate year for classifying oil-field wells with the possibility of higher potential associated with older wells. Wells constructed before 1976 are distributed throughout the Placerita Oil Field, but no wells were constructed after that time in the far northeast part of the field. Locations of wells abandoned after 1976 do not have a notable spatial pattern.
Detecting Subsurface Migration
Leaked fluids sometimes migrate upward to the land surface at the well head (surface expression) where they are easy to observe and document (King and King, 2013); although, the pathway for that leak may still be difficult to determine and the potential intersection of the leak with groundwater unknown. Other methods for determining whether oil-field fluids are leaking out of the target formations include pressure tests for the space between injection tubing and well casing, fluid-migration surveys, noise logs, radioactive tracer surveys, temperature logs, and water chemistry analyses (California Department of Conservation, 2022). In California, regulatory measures are in place to verify that injection fluids are confined to the intended injection zone. As of 2019, requirements for water-disposal wells included a fluid-migration survey every year and a pressure test every 5 years (California Department of Conservation, 2019a). Steam injection wells require a fluid-migration survey every 5 years.
Temperature logs are sometimes collected by oil field operators to monitor steam distributions for optimizing production or detecting possible fluid migration from warmer oil producing or injection zones into non-targeted zones. Berkman (1994) used temperature logs in the Placerita Oil Field to conclude that the shale overlying the Lower Kraft zone was an effective barrier for confining steam. Temperature log data were available for 46 wells in the northern part of Placerita Oil Field, where most steam injection and disposal of produced water is happening. Temperature log data are only useful for assessing conditions in aquifers overlying oil-producing zones if steam or hot produced water have not been recently injected into the well. Therefore, only 95 logs from the 19 wells that had not been steamed between 1977 and 2018 were examined for anomalous temperature patterns (fig. 20). A simple assessment was made by comparing the temperatures at 91 m and 183 m below land surface (depths that split many of the intervals above the injection zones at oil-field wells into three approximately equal sections) in each of the 95 logs to identify those that did not have a steadily increasing temperature between the land surface and the production or injection zone. The shallower depth of 91 m below land surface was chosen for this comparison because most anomalous high temperature recordings in available temperature logs were recorded near that depth, and the deeper depth of 183 m below land surface was chosen because it was approximately halfway between 91 m and the top of perforations for the wells used in this analysis. This approach resulted in 22 logs from 10 wells that had a higher temperature at the shallower interval. These results could indicate migration of fluids from deeper formations, or leaks in nearby steam injection wells, or warming of aquifer fluids by thermal conduction from contact with the casing of a steam injection well. Therefore, it can be difficult to conclude that migration has happened based solely on temperature anomalies (McKinley, 1994), and additional lines of evidence are required.
Additional analysis, such as comparing water chemistry at the interval of the temperature anomaly with the underlying production or injection zone, is needed to confirm whether migration has happened. This comparison was completed by the oil-well operator for one of the wells with a temperature anomaly. In that case, the California Department of Conservation, Division of Geologic Energy Management suspected that a pathway for migration of fluids from disposal wells was available through a nearby abandoned oil-field well that never produced oil (API 0403711738; fig. 7; California Department of Conservation, 2022). Water chemistry data were used to determine that migration of injectate was not happening (California Department of Conservation, 2022). No additional data in the oil-field well records were provided to explain temperature anomalies in the other wells or rule out migration of fluids. Vertical and temporal patterns of temperature logs were examined more closely for the 10 wells with a higher temperature at the shallower interval; however, results lacked notable patterns and were difficult to summarize. Therefore, no conclusions about fluid migration were made.
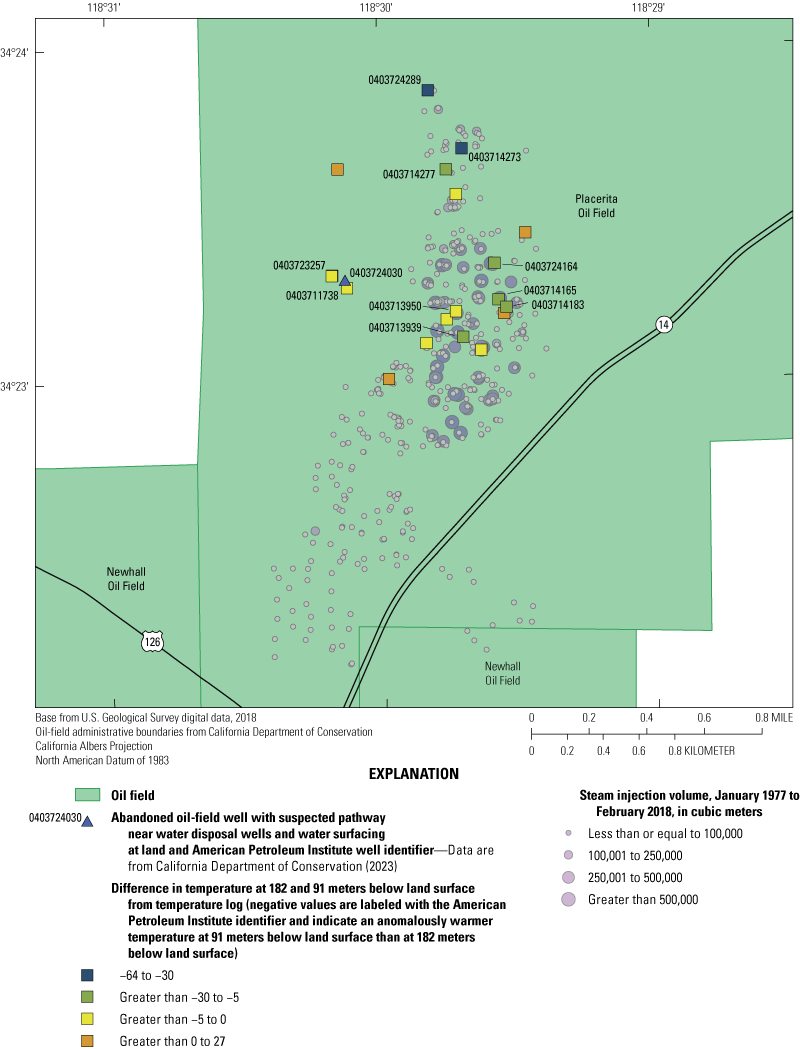
Map showing the difference in temperatures at 182 and 91 meters below land surface from unsteamed oil-field well temperature logs (1965–2019) and steam injection volumes (1977–2018), Placerita Oil Field, California (California Department of Conservation, 2019b, 2022).
Oil Field Sumps and Ponds
Common sources of contaminants associated with oil development are disposal sumps and ponds. Evidence of sumps and ponds affecting groundwater has been found in California (Gillespie and others, 2019; McMahon and others, 2019; Wright and others, 2019; DiGiulio and others, 2021). Records filed with the State Water Board (California State Water Resources Control Board, 2020b) from several oil companies confirm that sumps and ponds have existed previously at some locations in the Placerita Oil Field, but as of 2016 were no longer used. Information about the locations of sumps and ponds or whether they were lined with materials to reduce infiltration was not available for determining their potential to serve as sources to shallow groundwater. However, the relatively close balance between fluid production (water and oil production) and fluid injection (water injection for disposal and enhanced recovery) since 1950 (shown as net injection on fig. 5) implies that volumes of water disposed of in surface disposal ponds would have been a small percentage of the total amount of water disposed through injection if the amount of water injected for enhanced oil recovery was primarily sourced from water produced from the Placerita Oil Field.
Spills and Leaks at the Land Surface
In California, more than 2,000 surface spills or leaks of oil-field fluids were documented between 2006 and 2014 (Rossi and others, 2022). Additional studies in North Dakota found the most common type of wastewater release between 2007 and 2014 happened during movement via flowlines or transfers from storage tanks (Lauer and others, 2016; Patterson and others, 2017). A study of oil and gas wells in Texas and Ohio found that historical environmental incidents were more often associated with fluid handling, leaking tanks and flowlines, and storage ponds at the land surface than with subsurface oil-field well pathways (King and King, 2013). The State Water Board maintains an inventory of spills and leaks that require cleanup because they affect, or have the potential to affect, water quality in California (California State Water Resources Control Board, 2020b). Two spills specific to oil development have been documented in the Placerita Oil Field (fig. 21). In 2008, petroleum hydrocarbons were detected in soils near a tank battery and sumps used for separating heavy oil from water (GeoTracker Global ID T10000000510). Soil samples indicated that petroleum hydrocarbons were only present at depths less than 10 m below land surface, except for heavy hydrocarbons (diesel and motor oil range) found at the bottom of one borehole (15 m below land surface) but not above it. The investigators proposed that the hydrocarbons present only at the bottom of the borehole may be naturally occurring, citing the occurrence of exposed oil seeps at higher elevations in road cuts and rockslides within Placerita Canyon. In 2015, about 207 m3 of produced water was released into a dry channel from a ruptured pipe (GeoTracker Global ID T10000007342). Soil samples were collected at and downgradient from the release site after initial cleanup activities. Based on laboratory results of petroleum hydrocarbons, VOCs, and inorganic constituents in those samples, the investigators concluded that shallow soil and groundwater was not affected by the spill.
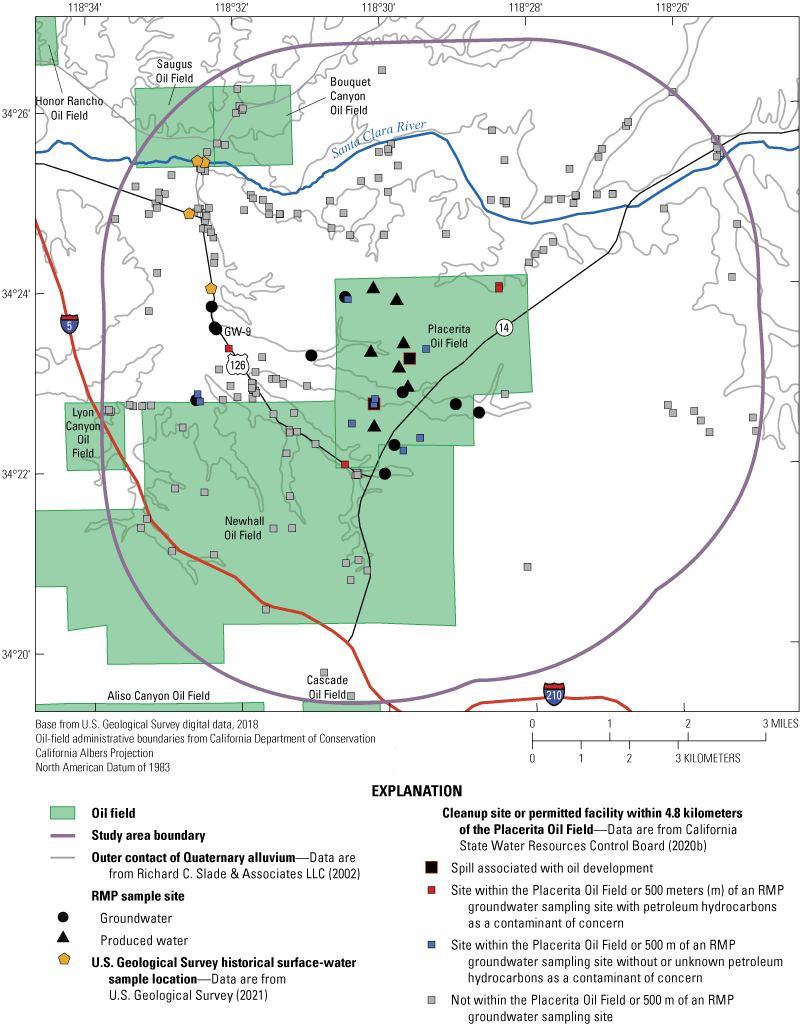
Map showing potential sources of petroleum hydrocarbons at or near the land surface in the Placerita Oil Field study area, California. RMP indicates California State Water Resources Control Board Oil and Gas Regional Monitoring Program sample collection sites.
Other leaks or spills that contained hydrocarbons but were not associated with oil development included four leaking underground storage tanks within the Placerita Oil Field (fig. 21; California State Water Resources Control Board, 2020b). Three of these were in the far northeast corner of the oil field, away from oil development, and one was in the southwest corner of the oil field within 500 m of 11 abandoned oil-field wells. Another leaking underground storage tank was within 500 m upgradient from RMP samples GW–9, GW–9D4, and GW–9D5.
Stream Leakage and Land Use
Elevated salinity is associated with hydrocarbon-bearing formations, but stream leakage and land use activities can also affect the salinity of groundwater. Stream leakage is the primary source of recharge to the aquifers in the study area (Robson, 1972; Geoscience Support Services, Inc., 2016). Previously published work identified salinity levels as high as 4,000 mg/L in the Santa Clara River, particularly during times when precipitation was low (Robson, 1972). However, the high salinity was downstream of the study area and unlikely to affect groundwater in or immediately downgradient from the Placerita Oil Field. Historical samples collected from 1974 through 2009 by the USGS indicated that TDS concentrations were less than 600 mg/L at three locations along the Santa Clara River upstream from the study area (not shown) and between 700 and 1,400 mg/L in the four locations along the Santa Clara River and its tributaries within the study area, downgradient from the oil field and RMP groundwater samples (fig. 21; U.S. Geological Survey, 2021). All the downstream TDS concentrations were greater than the secondary maximum contaminant level of 500 mg/L (U.S. Environmental Protection Agency, 2018).
Other sources of salinity within the East Subbasin (fig. 2) include urban development, septic tank leachate, irrigation return flow beneath agricultural lands, and treated wastewater (Geoscience Support Services, Inc., 2016). However, some of these activities only occur in areas downgradient from the study area. Toxics Release Inventory data for 2018 were reviewed to determine whether air deposition could be a source of petroleum hydrocarbons in the area (U.S. Environmental Protection Agency, 2020). Only two Toxics Release Inventory sites were in the study area and neither was described as contributing petroleum hydrocarbons to the atmosphere.
Naturally Occurring Hydrocarbons at Shallow Intervals
Geologic pathways can allow upward movement of fluids through faults, fracture systems, geologic unconformities that intersect permeable formations, and thin or absent low-permeability layers that overlie hydrocarbon-bearing formations. The Placerita Oil Field is bounded on the north and east by faults (fig. 3; Berkman, 1994). Berkman (1994) concluded that the fault on the eastern side may provide a pathway for seepage of fluids because oil-stained cores and seeps have been found on the east side of the fault. Several smaller faults are within and to the east of the Placerita Oil Field, but fluxes of fluids from hydrocarbon-bearing formations along those faults have not been documented. The low-permeability confining layer that overlies the Shepard zone (the shallowest oil-producing zone) has not been defined for the entire oil field in previously published work but is described as a fine-grained unit approximately 21 m thick south of the Placerita Oil Field (WZI, Inc., 2016).
Naturally occurring seeps and oil sand outcrops are also common in the study area (fig. 22); many early oil wells were drilled in areas of tar outcrops and seeps (Kew, 1924; Walling, 1934). Mud logs are sometimes collected when drilling oil-field wells to determine the depth to oil and hydrocarbon gases. Three of the nine mud logs collected in the study area indicated that hydrocarbons were present at shallow depths (less than 183 m below land surface; fig. 22). However, these were not in the Placerita Oil Field and were in the northwestern part of the study area, far from the sample data collected for this study.
Construction information for oil-field wells also indicate that oil is naturally present at shallow intervals in the southern and eastern parts of the Placerita Oil Field (fig. 22); 7 percent (46 of 635) of production wells had a depth to top perforation of 200 m below land surface or less (California Department of Conservation, 2019b). Sample data indicate that oil field water is generally less saline in the shallow intervals in the southern part of the oil field (fig. 13) and, therefore, may have a smaller potential to affect groundwater salinity in those areas.
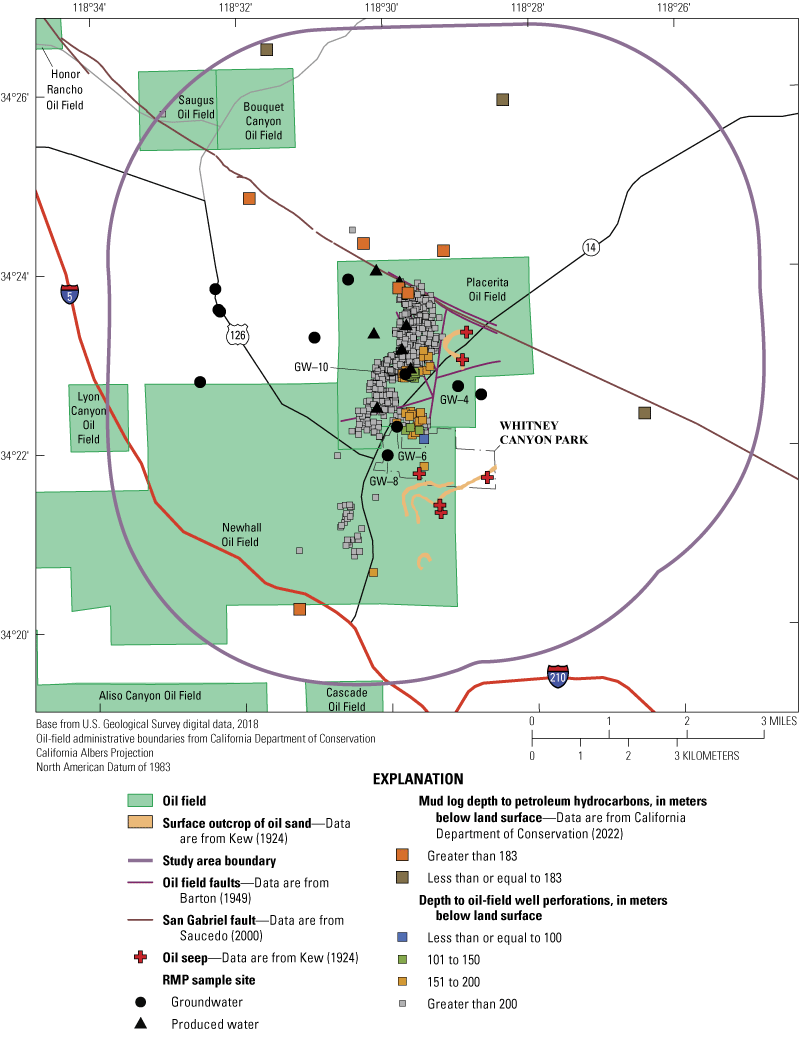
Map showing naturally occurring hydrocarbons at shallow intervals in the Placerita Oil Field study area, California. RMP indicates California State Water Resources Control Board Oil and Gas Regional Monitoring Program sample collection sites.

22. Map showing naturally occurring hydrocarbons at shallow intervals in the Placerita Oil Field study area, California
Relation of Groundwater Quality to Pathways
The six RMP groundwater samples containing petroleum hydrocarbons or thermogenic gas (table 3) were examined with respect to potential oil-field fluid migration pathways. Water chemistry results are also presented in the context of other geochemical tracers to better understand the potential sources of the chemical constituents detected in groundwater.
Near Oil Development
Four samples (GW–4, GW–6, GW–8, and GW–10) were collected from wells within 500 m of active or historical oil production (app. 2, table 2.1). The RMP groundwater samples most geochemically similar to fluids in oil-bearing formations were GW–10 and GW–6 (figs. 12 and 14; table 3). Sample GW–10 contained 10 petroleum hydrocarbons (app. 2, table 2.3), a VOC that could be manufactured or from oil-field fluids (n-propylbenzene; Seitz and others, 2023), at least some thermogenic gas (based on stable isotopes of methane, fig. 10), high concentrations of ammonium, alkalinity, boron, barium, chloride, iodide, lithium, and TDS relative to other groundwater samples (figs. 11 and 12), enriched δ13C-DIC, and noble gas compositions most similar to produced-water samples (app. 4, fig. 4.1). Sample GW–6 contained five petroleum hydrocarbons, two VOCs that could be manufactured or from oil-field fluids (n-propylbenzene and 4-chlorotoluene; Seitz and others, 2023), two thermogenic gases (propane and 2-methylpropane), and elevated concentrations of ammonium, alkalinity, boron, chloride, DOC, iron, lithium, and TDS. The sample also contained isotopically enriched δ13C-DIC and δ13C-CH4. Concentrations of chloride relative to iodide in samples GW–10 and GW–6 plot along the apparent mixing line between native groundwater and produced-water and imply that the samples may contain mixing fractions of produced water of 5 to 10 percent (fig. 14).
Sample GW–10 is near the middle of the Placerita Oil Field and closer to more oil-field wells and other oil-field infrastructure than the other RMP groundwater samples (app. 2, table 2.1). It was within 100 m of 28 oil-field wells. Thirteen of those oil-field wells had been used for steam injection at some point between 1977 and 2018 (California Department of Conservation, 2019b). Seventeen of the oil-field wells were drilled before 1958 and abandoned in the late 1980s or early 1990s. If these older wells were constructed with less protective measures, any potential pathways introduced for migration of oil-field fluids may have been sealed when abandoned because they were abandoned after more protective regulations were enacted. The remaining oil-field wells within 100 m were drilled after 1990 and are still active. Available records for the 28 oil-field wells within 100 m of sample GW–10 indicated that potential for migration of oil-field fluids along well bores is minimal; 8 of the 11 active wells had at least one well-integrity test conducted since the early 1990s and no well-integrity failures were noted in well records. Data for calculating the annular cement intervals were available for 27 wells within 100 m and indicated that estimated cement gaps were minimal (less than 8 m) between the top of the Shepard zone and the base of freshwater (or between the top of annular cement and the top of Shepard zone if the base of freshwater was lower than the top of the Shepard zone). Idle well fluid levels were not available for any of the wells within 100 m. For the two idle well fluid levels within 200 m of this sample, one had a fluid level that was at about the same elevation as the groundwater elevation estimated for sample GW–10 (table 1), and the other had a fluid level that was about 300 m below the estimated groundwater elevation, indicating that pressure gradients in the area under modern conditions would probably not favor upward movement of fluids in the event of a well-integrity issue. Infiltration of produced water from a recent spill or disposal at the land surface also is not likely because age-dating tracers indicate that the sample water is of premodern age and has not been in contact with the atmosphere since at least the 1950s. No State Water Board cleanup sites or permitted facilities were within 500 m of this sample.
Shallow hydrocarbons and oil seeps are common in the study area (figs. 6 and 22; Kew, 1924). Naturally occurring hydrocarbons near the land surface could explain the geochemistry of sample GW–10. Oil-field well records within 100 m of GW–10 indicated that the elevation of oil sand ranged from 226 to 278 m (California Department of Conservation, 2022). That range of elevations overlaps part of the perforated interval (260–350 m elevation) of the GW–10 sample well (table 1).
Sample GW–6 was collected from the south side of the Placerita Oil Field along the border with the Newhall Oil Field where oil-field well perforations are generally shallow (figs. 6 and 22). Two oil-field wells were within 100 m of this sample. Neither of those wells had documented well integrity issues or gaps in annular cement. One of the wells within 100 m of the sample was used to inject produced water for disposal purposes from 1974 to 2003. A mechanical integrity test was performed on that well in 1976 and found no issues. Idle well fluid levels were collected from this well in 2010 and 2017. Elevations of those fluid levels were 406 and 389 m, respectively, and were lower than the water level measured in the GW–6 sampled well (417 m) in 2012. These hydraulic head conditions are consistent with downward movement of fluids toward the oil-producing zones under modern conditions. Hydrocarbons detected in sample GW–6 could be from either deep or surficial sources because the age of the water was classified as a mixture of modern and premodern water.
Like sample GW–10, naturally occurring hydrocarbons at shallow intervals could explain the geochemistry of sample GW–6. The shallowest perforations of the two oil-field wells within 100 m of GW–6 were only 97 m and 73 m, respectively, below the bottom of sample GW–6 (table 1). In addition, 13 (19 percent) of the 68 oil-field wells within 500 m of sample GW–6 had at least some oil production since 1977 and had perforations less than 200 m below land surface, indicating that petroleum hydrocarbons are naturally occurring at shallow intervals in this part of the Placerita Oil Field. The presence of methyl tert-butyl ether (a common additive to gasoline, prior to 2005) in this sample could indicate that the source of petroleum hydrocarbons may be from leaking underground storage tanks or another anthropogenic source of gasoline. No other potential sources were known to be within 500 m of this sample.
Sample GW–8 was collected south of the Placerita Oil Field in the Newhall Oil Field near historical oil development (fig. 1). No oil-field wells were within 100 m of it, but 28 abandoned oil-field wells were within 500 m (fig. 3; app. 2, table 2.1). Sixteen of the oil-field wells were “dry holes” that never produced and only two have produced oil since 1977. Sample GW–8 was collected from a shallow domestic well and contained a mixture of premodern and modern groundwater. The only geochemical marker indicating potential mixing with hydrocarbons was the presence of thermogenic gas determined by the stable isotopes of methane (fig. 10) and the presence of ethane, which is usually—but not always—thermogenic. However, the sample did contain higher concentrations of several chemical constituents associated with oil-field fluids (ammonium, DOC, barium, iron, and lithium) relative to other RMP groundwater samples collected outside of the oil field (fig. 12; Stanton and Marcusa, 2024). This sample is in an undeveloped area with native vegetation to the east and low-to-medium density developed land to the west. No known cleanup sites nor permitted facilities are nearby, but a large highway is within 500 m to the west (fig. 21). A possible source of hydrocarbons in this sample is naturally occurring hydrocarbons at shallow intervals. This sample is in the vicinity of a large oil seep that was present as of 1924 (fig. 22; Kew, 1924). Construction records for the closest oil-field well 105 m to the southeast indicated that the well was shallow (205 m below land surface), and oil sands were present at an elevation that was about 120 m above the bottom of the GW–8 sample well. Data for determining the hydraulic gradient between sample GW–8 and the closest oil-field well were not available, though the land surface slope from that oil well toward the GW–8 sample well, providing some evidence that the oil well is upgradient.
Sample GW–4 contained the BTEX compound toluene (app. 2, table 2.3). However, detection of toluene in the absence of other petroleum hydrocarbons could be associated with well construction or maintenance activities (Gintautas, 2015). Chloride and iodide concentrations did not plot along mixing lines (fig. 13), but the sample did have higher TDS and ammonium concentrations (fig. 12) relative to other RMP groundwater samples outside of oil development areas (Stanton and Marcusa, 2024). Other geochemical data for this sample did not provide clear evidence of mixing with oil field water.
Sample GW-4 was collected from an irrigation well with a long well screen and was composed of a mixture of modern and premodern groundwater, indicating the well could be affected by either deep or shallow sources. Six abandoned oil-field wells are within 500 m of this sample and records for one of the wells indicated that oil shows were present at a shallow depth of 31 m below land surface and could provide evidence that shallow hydrocarbons naturally occur in the vicinity. However, shallow oil shows were not recorded for the other five oil-field wells closer to the sample. No other potential sources of hydrocarbons were found near this sample; land use near the sample was primarily agriculture and open space (Falcone, 2015) and no cleanup sites nor permitted facilities were nearby (fig. 21). However, the sampled irrigation well had recently been reworked, and toluene could have been introduced during that process or from materials in the well.
Downgradient From Oil Development
Samples GW–5 and GW–9, downgradient from the Placerita Oil Field, contained small amounts of chemical constituents associated with oil-field fluids. Both samples were collected in urban areas underlain by thick (greater than 300 m) freshwater deposits of the Saugus Formation (Richard C. Slade & Associates LLC, 2002). Sample GW–5 contained isobutane (app. 2, table 2.4), a thermogenic light hydrocarbon gas. The sample was a mixture of modern and premodern water, and it also contained small concentrations of five manufactured VOCs and a nitrate concentration that exceeded its health-based benchmark (U.S. Environmental Protection Agency, 2018). The sample was collected from a shallow monitoring well constructed for a cleanup site to monitor concentrations of PCE from a dry-cleaning facility (GeoTracker global ID 19720018; Terrax Environmental, Inc., 2022). No other cleanup sites or permitted facilities were within 500 m of this sample. Five oil-field wells were drilled within 500 m of this sample collection site in exploration of oil sands at intervals much deeper than the GW–5 sampled well. Commercially viable oil sands were not discovered, and the shallowest documented oil shows were at depths of more than 1,800 m below land surface.
Sample GW–9 contained the petroleum hydrocarbon compound toluene but no other VOCs or thermogenic gases. Its chloride and iodide concentrations were plotted along an apparent mixing line between native and produced-water (fig. 14). The sample contained premodern water, and its relative proportions of major inorganic constituents were similar to several other premodern age groundwater samples (fig. 15). The sample’s elevated iodide and bromide concentrations were consistent with mixing with oil field water (Stanton and Marcusa, 2024). The sample was collected from an inactive public-supply well with a long screen, making it possible for water from multiple upgradient sources to affect the chemistry of the sample. The sample was about 470 m downgradient from a potential source of hydrocarbons at a cleanup site (figs. 2 and 21; California State Water Resources Control Board, 2020b) and its well perforations partially overlapped the perforations of produced-water disposal wells on the west side of the Placerita Oil Field (about 3 km upgradient; fig. 6D). However, the toluene detection may be related to recent well work that had been completed (see the “Volatile Organic Compounds” section).
Study Limitations
For the RMP, only existing wells were sampled; therefore, it was not always possible to collect samples at locations potentially affected by oil-field fluid migration pathways. However, several groundwater samples (GW–4, GW–6, GW–8, GW–10) were collected in areas of naturally occurring hydrocarbons at shallow intervals and (or) shallow oil development (fig. 3 and fig. 22). Two groundwater samples (GW–2 and GW–7) collected to the west of where large produced-water disposal volumes are injected did not contain chemical constituents associated with oil-field fluids. However, those samples represent intervals that were much shallower than produced-water disposal wells (fig. 6D), and data were not available to determine the direction of local groundwater flow near the disposal wells. The remaining RMP groundwater samples were either upgradient or much farther downgradient from migration pathways.
Additional information for understanding the effects of potential oil-field fluid migration pathways on groundwater quality was sparse. Only one oil-well record (API 0403724030) was discovered as part of the review of well-casing failures and temperature log anomalies that included geochemistry data to determine the effects on groundwater quality after a leak or anomalous temperature log was discovered (California Department of Conservation, 2022). The direction and magnitude of hydraulic gradients to drive fluid movement vertically in the oil field are unknown. Consequently, the occurrence, duration, and magnitude of upward water fluxes through leaky oil-field wells to groundwater are unknown. Information about groundwater flow directions in the Saugus Formation near produced-water disposal wells was not available, making it difficult to know the direction of flow of injected disposal water. Oil field surface disposal ponds and sumps were used in the Placerita Oil Field. However, historical data about former ponds and sumps were not available to assess their potential to affect groundwater quality. Although there is some evidence to suggest potential effects of anthropogenic activities, a definitive determination was not possible. The limited evidence does, however, suggest that anthropogenic effects cannot be ruled out. This suggests that additional information would be required in order to make further progress on such a determination.
Future monitoring and analysis could help refine understanding of potential effects of oil development west of the main production area near large volumes of water disposal (fig. 17) and near oil-field wells with casing failures that intersect the fresh groundwater zone or have gaps in annular cement between the top of the Shepard zone and fresh groundwater (fig. 18). Wells with barrier failures are primarily older wells constructed before the 1970s in the northern part of the oil field and produced-water disposal wells downgradient from the main production area (app. 2, table 2.6). This monitoring and analysis could be accomplished by installing monitoring wells and measuring hydraulic heads periodically at multiple depths, including depths in the fresh groundwater zone overlying the oil field and near injection wells, and comparing those measurements with heads in oil-field wells. Water-quality samples and additional temperature and resistivity logs could also be collected over time at these monitoring sites to provide information about whether fluid migration has happened.
Summary
Groundwater-quality data and potential fluid-migration pathways were examined near the Placerita Oil Field to determine if oil-field fluids have mixed with groundwater resources. The Placerita Oil Field and surrounding areas in Los Angeles County, California, was a priority oil field for the Regional Monitoring Program (RMP) because of its high density of oil-field wells, its close vertical proximity of the oil-producing zones to land surface relative to other oil fields in California, and its location at the upgradient end of a groundwater basin that provides water for public supply and other uses.
Groundwater samples were collected in 2018 from two monitoring wells, three irrigation wells, three public-supply wells, and two wells used for oil field activities, including groundwater used as a water source for steam injection. Additional groundwater samples were collected at multiple depths from one of the public-supply wells to obtain information about vertical changes in groundwater chemistry. Groundwater samples were analyzed for a wide range of dissolved chemical, gas, and isotopic constituents to identify potential mixing with fluids from hydrocarbon-bearing formations. Produced-water samples were collected and analyzed at eight sites to provide context for interpreting groundwater sample results. Historical groundwater and produced-water sample data were compiled to supplement data from the samples collected for the RMP.
At least one petroleum hydrocarbon volatile organic compound (VOC) was detected in 4 of the 13 of the RMP groundwater samples. Concentrations of petroleum hydrocarbons were much smaller than drinking-water benchmarks and no concentration exceeded 0.5 µg/L. Benzene was the most common petroleum hydrocarbon detected in historical groundwater samples. The two RMP groundwater samples containing multiple petroleum hydrocarbons (GW–6 and GW–10) were the samples closest to oil development.
Dissolved methane was detected in all RMP groundwater samples at concentrations ranging from 0.0025 to 88 mole percent (median concentration of 0.147 mole percent), and concentrations were largest in samples collected near oil development (GW–6, GW–8, GW–10). Methane isotopic results, the presence of heavier gases, the ratio of methane to heavier hydrocarbon gases, and (or) stable isotopes of hydrogen and carbon in methane indicated that samples GW–5, GW–6, GW–8, and GW–10 contain at least some thermogenic gas; sample GW–1 is consistent with either a microbial or a mixture of microbial and thermogenic sources; and samples GW–2, GW–3, GW–4, GW–7, GW–9, GW–9D4, GW–9D5, and GW–11 only contain microbial methane. Methane was not detected in any of the 12 historical groundwater samples with a reported measurement.
Six of the 13 new groundwater samples collected for this study contained petroleum hydrocarbons or thermogenic gas, indicating potential mixing with fluids from hydrocarbon-bearing formations. Four of those six samples (GW–4, GW–6, GW–8, and GW–10) were collected within 500 m of at least one producing oil-field well and contained other geochemical tracers that indicated potential mixing. Additional geochemical tracers consistent with mixing with fluids from hydrocarbon-bearing formations were:
-
• elevated concentrations of total dissolved solids (TDS) and ammonium in sample GW–4;
-
• VOCs that are manufactured or from oil-field fluids, concentrations of chloride relative to iodide, elevated concentrations of TDS, alkalinity, ammonium, boron, iodide, lithium, and DOC, and enriched δ13C-DIC in sample GW–6;
-
• elevated concentrations of ammonium, barium, lithium, and DOC in sample GW–8; and
-
• VOCs that are manufactured or from oil-field fluids, concentrations of chloride relative to iodide, elevated concentrations of alkalinity, ammonium, barium, boron, chloride, iodide, and lithium, and enriched δ13C-DIC in sample GW–10.
Naturally occurring hydrocarbons near the land surface or in proximity to shallow oil development could explain the geochemical similarities between RMP groundwater samples collected near oil production and hydrocarbon-bearing formations. Other potentially important factors for groundwater quality in the study area include possible hydraulic gradients caused by large volumes of water extracted from the main production area and reinjected downgradient into nonproducing zones, well-barrier failures in older wells constructed before the 1970s in the northern part of the oil field, and well-barrier failures in produced-water disposal wells downgradient from the main production area.
Only existing wells were sampled for the RMP, and, therefore, few groundwater samples were collected in areas with evidence for potential migration pathways. Future monitoring and analysis could help better understand effects of oil development on groundwater quality. Installation of monitoring wells and periodic comparison of hydraulic heads at multiple depths in the fresh groundwater zone with heads in oil-field wells, and collection of additional water-quality samples, temperature logs, and resistivity logs over time could provide information about whether fluid migration from potential pathways has happened.
References Cited
Agency for Toxic Substances and Disease Registry, 1996, Carbon disulfide CAS# 75–15–0: Agency for Toxic Substances and Disease Registry public health statement, 4 p., accessed July 31, 2020, at https://www.atsdr.cdc.gov/ToxProfiles/tp82-c1-b.pdf.
Akob, D.M., Cozzarelli, I.M., Dunlap, D.S., Rowan, E.L., and Lorah, M.M., 2015, Organic and inorganic composition and microbiology of produced waters from Pennsylvania shale gas wells: Applied Geochemistry, v. 60, p. 116–125, accessed April 2023 at https://doi.org/10.1016/j.apgeochem.2015.04.011.
Anders, R., Landon, M.K., McMahon, P.B., Kulongoski, J.T., Hunt, A.G., and Davis, T.A., 2022, Occurrence of water and thermogenic gas from oil-bearing formations in groundwater near the Orcutt Oil Field, California, USA: Journal of Hydrology—Regional Studies, v. 41, article 101065, accessed July 23, 2023, at https://doi.org/10.1016/j.ejrh.2022.101065.
Angino, E.E., 1970, Selective element recovery from oil field brines: Water Resources Research, v. 6, no. 5, p. 1501–1504, accessed May 2, 2023, at https://doi.org/10.1029/WR006i005p01501.
Aravena, R., Wassenaar, L.I., and Plummer, L.N., 1995, Estimating 14C groundwater ages in a methanogenic aquifer: Water Resources Research, v. 31, no. 9, p. 2307–2317, accessed December 12, 2022, at https://doi.org/10.1029/95WR01271.
Avrahamov, N., Gelman, F., Yechieli, Y., Aizenshtat, Z., Nissenbaum, A., and Sivan, O., 2015, Proposed sources of methane along the Dead Sea transform: Chemical Geology, v. 395, p. 165–175, accessed December 30, 2022, at https://doi.org/10.1016/j.chemgeo.2014.11.026.
Berkman, T.A., 1994, Placerita Oil Field—A case study of steamflooding a complexly stratified reservoir, in Pacific petroleum geologist newsletter—Fall 1994: Pacific Section American Association of Petroleum Geologists, no. 1, p. 4–9, accessed December 5, 2022, at http://www.psaapg.info/cloud/newsletters/newsletter_1994.pdf.
Berkman, T.A., 1996, Summary of the Placerita Oil Field, in Structure and hydrocarbon exploration in the transpressive basins of southern California, of Guidebook for field trip #5 AAPG Annual Convention, Long Beach, CA, April 22–25, 2012, p. 200–203, accessed November 30, 2022, at https://www.elsmerecanyon.com/placerita/berkman1996.pdf.
Blondes, M.S., Gans, K.D., Engle, M.A., Kharaka, Y.K., Reidy, M.E., Saraswathula, V., Thordsen, J.J., Rowan, E.L., and Morrissey, E.A., 2018, U.S. Geological Survey national produced waters geochemical database (ver. 2.3, January 2018): U.S. Geological Survey data release, accessed November 11, 2022, at https://doi.org/10.5066/F7J964W8.
California Department of Conservation, 1992, Volume II—Southern, central, and offshore California of California oil and gas fields: Division of Oil, Gas, and Geothermal Resources, 645 p. [Also available at https://filerequest.conservation.ca.gov/RequestFile/37041.]
California Department of Conservation, 2018, California state geoportal—Unlocking the power of Government data: California Department of Conservation Geoportal website, accessed November 2018 at https://gis.data.ca.gov.
California Department of Conservation, 2019a, Updated underground injection control regulations in Development, regulation, and conservation of oil and gas resources, chap. 4 of California code of regulations, Title 14— Natural resources, Division 2—Department of Conservation: California Department of Conservation, 32 p., accessed December 27, 2022, at https://www.conservation.ca.gov/calgem/general_information/Documents/UIC_regs_workshop/Final%20Text%20of%20the%20UIC%20Regulations%20(Clean).pdf.
California Department of Conservation, 2019b, WellSTAR—Online data tools: Geologic Energy Management Division web page, accessed January 8, 2020, at https://www.conservation.ca.gov/calgem/Online_Data/Pages/Index.aspx.
California Department of Conservation, 2021, WellSTAR—Well stimulation—Disclosures (build ver. R5.1.3): Geologic Energy Management Division web page, accessed December 8, 2021, at https://wellstar-public.conservation.ca.gov/WellStimulation/WellStimulation/Index.
California Department of Conservation, 2022, WellSTAR—Wells (build ver. R5.1.11): California Department of Conservation, Geologic Energy Management Division web page, accessed February 23, 2022, at https://wellstar-public.conservation.ca.gov/Well/Well/Index.
California Department of Conservation, [variously dated], Annual reports of the state supervisor of oil and gas: California Department of Conservation, accessed October 30, 2020, at https://www.conservation.ca.gov/calgem/pubs_stats/annual_reports/Pages/annual_reports.aspx.
California Department of Water Resources, 2018, Water data library (WDL) station map—Water quality data reports: California Department of Water Resources web page, accessed August 2018 at https://www.water.ca.gov/waterdatalibrary/waterquality/index.cfm/.
California Department of Water Resources, 2020a, California’s groundwater update 2020—Bulletin 118: California Department of Water Resources web page, accessed March 28, 2022, at https://data.cnra.ca.gov/dataset/calgw_update2020.
California Department of Water Resources, 2020b, Periodic groundwater levels measurements: California Natural Resources Agency web page, accessed November 5, 2020, at https://data.cnra.ca.gov/dataset/periodic-groundwater-level-measurements.
California Department of Water Resources, 2021, Land subsidence global positioning system stations online data: UNAVCO Inc. data, accessed February 21, 2023, at https://sgma.water.ca.gov/webgis/?appid=SG MADataViewer#landsub.
California Department of Water Resources, 2023, Well completion reports map application: California Natural Resources Agency online data, accessed February 27, 2023, at https://data.cnra.ca.gov/showcase/well-completion-report-map-app.
California State Legislature, 2013, Senate Bill No. 4—Chapter 313, chap. 1 of division 3 of public resources code: California Senate, 21 p., accessed January 22, 2024, at http://www.leginfo.ca.gov/pub/13-14/bill/sen/sb_0001-0050/sb_4_bill_20130920_chaptered.pdf.
California State Water Resources Control Board, 2017, GeoTracker—Electronic submittal of information (ESI) data in the electronic deliverable format (EDF) for environmental monitoring wells: California State Water Resources Control Board web page, accessed May 2017 at https://geotracker.waterboards.ca.gov/data_download_by_county.
California State Water Resources Control Board, 2019, California drinking water-related laws: California State Water Resources Control Board web page, accessed March 26, 2020, at https://www.waterboards.ca.gov/drinking_water/certlic/drinkingwater/Lawbook.shtml.
California State Water Resources Control Board, 2020a, GeoTracker GAMA: California State Water Resources Control Board web page, accessed June 4, 2020, at https://gamagroundwater.waterboards.ca.gov/gama/Default.asp.
California State Water Resources Control Board, 2020b, GeoTracker map: California State Water Resources Control Board web page, accessed May 19, 2020, at https://geotracker.waterboards.ca.gov/map/.
California State Water Resources Control Board, 2021, GAMA data downloads: California State Water Resources Control Board web page, accessed October 1, 2021, at https://gamagroundwater.waterboards.ca.gov/gama/datadownload.
California State Water Resources Control Board Division of Drinking Water, 2021, EDT library and water quality analyses data and download page: California State Water Resources Control Board Division of Drinking Water web page, accessed October 1, 2021, at https://www.waterboards.ca.gov/drinking_water/certlic/drinkingwater/EDTlibrary.shtml.
Carothers, W.W., and Kharaka, Y.K., 1980, Stable carbon isotopes of HCO3− in oil field waters—Implications for the origin of CO2: Geochimica et Cosmochimica Acta, v. 44, no. 2, accessed May 8, 2023, at https://doi.org/10.1016/0016-7037(80)90140-4.
Compton, J.S., Williams, L.B., and Ferrell, R.E., Jr., 1992, Mineralization of organogenic ammonium in the Monterey Formation, Santa Maria and San Joaquin basins, California, USA: Geochimica et Cosmochimica Acta, v. 56, no. 5, p. 1979–1991, accessed August 21, 2020, at https://doi.org/10.1016/0016-7037(92)90324-C.
Craig, H., 1961, Standard for reporting concentrations of deuterium and oxygen-18 in natural waters: Science, v. 133, no. 3467, p. 1833–1834, accessed March 20, 2023, at https://doi.org/10.1126/science.133.3467.1833.
Dale, B.A., Narahara, G.M., and Stevens, R.M., 2000, Case history of reservoir subsidence and wellbore damage management in the South Belridge Diatomite Field: SPE Production & Facilities, v. 15, no. 1, p. 50–57, accessed March 2023 at https://doi.org/10.2118/60844-PA.
Darrah, T.H., Vengosh, A., Jackson, R.B., Warner, N.R., and Poreda, R.J., 2014, Noble gases identify the mechanisms of fugitive gas contamination in drinking-water wells overlying the Marcellus and Barnett Shales: Proceedings of the National Academy of Sciences of the United States of America, v. 111, no. 39, p. 14076–14081, accessed November 9, 2022, at https://doi.org/10.1073/pnas.1322107111.
Davies, R.J., Almond, S., Ward, R.S., Jackson, R.B., Adams, C., Worrall, F., Herringshaw, L.G., Gluyas, J.G., and Whitehead, M.A., 2014, Oil and gas wells and their integrity—Implications for shale and unconventional resource exploitation: Marine and Petroleum Geology, v. 56, p. 239–254, accessed September 14, 2021, at https://doi.org/10.1016/j.marpetgeo.2014.03.001.
Davis, T.A., Landon, M.K., and Bennett, G.L., 2018a, Prioritization of oil and gas fields for regional groundwater monitoring based on a preliminary assessment of petroleum resource development and proximity to California’s groundwater resources: U.S. Geological Survey Scientific Investigations Report 2018–5065, 115 p., accessed December 14, 2020, at https://doi.org/10.3133/sir20185065.
Davis, T.A., Bennett, G.L., Metzger, L.F., Kjos, A.R., Peterson, M.F., Johnson, J., Johnson, T.D., Brilmyer, C.A., and Dillon, D.B., 2018b, Data analyzed for the preliminary prioritization of California oil and gas fields for regional groundwater monitoring: U.S. Geological Survey data release, accessed April 18, 2019, at https://doi.org/10.5066/F7FJ2DV3.
DeSimone, L.A., McMahon, P.B., and Rosen, M.R., 2014, The quality of our nation’s waters—Water quality in principal aquifers of the United States, 1991–2010: U.S. Geological Survey Circular 1360, 151 p., accessed September 11, 2019, at https://doi.org/10.3133/cir1360.
DiGiulio, D.C., Rossi, R.J., Jaeger, J.M., Shonkoff, S.B.C., and Ryan, J.N., 2021, Vulnerability of groundwater resources underlying unlined produced water ponds in the Tulare basin of the San Joaquin Valley, California: Environmental Science & Technology, v. 55, no. 21, p. 14782–14794, accessed March 30, 2023, at https://doi.org/10.1021/acs.est.1c02056.
Dusseault, M.B., Gray, M.N., and Nawrocki, P.A., 2000, Why oil wells leak—Cement behavior and long-term consequences in International Oil and Gas Conference and Exhibition, Beijing, China, November 7–10, 2000: Beijing, China, Society of Petroleum Engineers, 8 p., accessed September 20, 2021, at https://doi.org/10.2118/64733-MS.
Dusseault, M.B., Jackson, R.E., and MacDonald, D., 2014, Towards a road map for mitigating the rates and occurrences of long-term wellbore leakage: Ottawa, Ontario, Canada, University of Waterloo and Geofirma Engineering Ltd., 69 p., accessed September 20, 2021, at https://ci.carson.ca.us/content/files/pdfs/planning/oilcodeupdate/staffreports_04142015/Toward_RoadMap_Mitigat_Rate_Occurr_WellBoreLeakage.pdf.
Eganhouse, R.P., Dorsey, T.F., Phinney, C.S., and Westcott, A.M., 1996, Processes affecting the fate of monoaromatic hydrocarbons in an aquifer contaminated by crude oil: Environmental Science & Technology, v. 30, no. 11, p. 3304–3312, accessed May 15, 2023, at https://doi.org/10.1021/es960073b.
Eichhubl, P., and Boles, J.R., 2000, Focused fluid flow along faults in the Monterey Formation, coastal California: Geological Society of America Bulletin, v. 112, no. 11, p. 1667–1679, accessed April 5, 2021, at https://doi.org/10.1130/0016-7606(2000)112<1667:FFFAFI>2.0.CO;2.
EnviroTech Consultants, Inc., 2018, Application for pilot waterflood, Albert lease, Placerita Oil Field, Los Angeles County, California: California State Water Resources Control Board GeoTracker project T10000008465 web page, accessed July 6, 2018, at https://geotracker.waterboards.ca.gov/profile_report?global_id=T10000008465.
Falcone, J.A., 2015, U.S. conterminous wall-to-wall anthropogenic land use trends (NWALT), 1974–2012: U.S. Geological Survey Data Series 948, 33 p., apps., accessed January 14, 2020, at https://doi.org/10.3133/ds948.
Geoscience Support Services, Inc., 2016, Salt and nutrient management plan—Santa Clara River Valley East Subbasin, volume 1: Castaic Lake Water Agency, and Santa Clara River Valley East Subbasin Salt and Nutrient Management Plan Task Force, 217 p., 57 supps., accessed May 16, 2022, at https://cawaterlibrary.net/document/salt-and-nutrient-management-plan-santa-clara-river-valley-east-subbasin/.
Gillespie, J.M., Davis, T.A., Stephens, M.J., Ball, L.B., and Landon, M.K., 2019, Groundwater salinity and the effects of produced water disposal in the Lost Hills-Belridge oil fields, Kern County, California: Environmental Geoscience, v. 26, no. 3, p. 73–96, accessed July 19, 2021, at https://doi.org/10.1306/eg.02271918009.
Gintautas, P., 2015, Investigation of occurrences of tert-butyl alcohol in Raton basin groundwater, Huerfano and Las Animas Counties, Colorado: Denver, Colo., Colorado Oil and Gas Conservation Commission Special Project #2130, 83 p., accessed March 3, 2023, at https://ecmc.state.co.us/documents/library/AreaReports/RatonBasin/TBA/Project_2130_Raton_Basin_TBA_summary_report_Jan2015.pdf.
Hammond, P.A., Wen, T., Brantley, S.L., and Engelder, T., 2020, Gas well integrity and methane migration—Evaluation of published evidence during shale-gas development in the USA: Hydrogeology Journal, v. 28, no. 4, p. 1481–1502, accessed May 25, 2021, at https://doi.org/10.1007/s10040-020-02116-y.
Hanson, A., Krauk, T., Landon, M., and McMahon, P., 2023, Spectral characterization of dissolved organic matter in groundwater to assess mixing with oil field water near selected oil fields, southern California: Science of the Total Environment, v. 905, article 166970, 13 p., accessed March 4, 2024, at https://doi.org/10.1016/j.scitotenv.2023.166970.
Hem, J.D., 1985, Study and interpretation of the chemical characteristics of natural water (3d ed.): U.S. Geological Survey Water-Supply Paper 2254, 263 p., 4 pls. [Also available at https://doi.org/10.3133/wsp2254.]
Hodgson, S.F., 1987, Onshore oil and gas seeps in California: California Department of Conservation, Division of Oil and Gas, publication TR26, 97 p., accessed March 2020 at https://www.conservation.ca.gov/calgem/pubs_stats/Pages/technical_reports.aspx. [File available by request at https://filerequest.conservation.ca.gov/RequestFile/37014.]
Hornafius, J.S., Quigley, D., and Luyendyk, B.P., 1999, The world’s most spectacular marine hydrocarbon seeps (Coal Oil Point, Santa Barbara Channel, California)—Quantification of emissions: Journal of Geophysical Research, v. 104, no. C9, p. 20703–20711, accessed September 20, 2021, at https://doi.org/10.1029/1999JC900148.
Ingraffea, A.R., Wells, M.T., Santoro, R.L., and Shonkoff, S.B.C., 2014, Assessment and risk analysis of casing and cement impairment in oil and gas wells in Pennsylvania, 2000–2012: Proceedings of the National Academy of Sciences of the United States of America, v. 111, no. 30, p. 10955–10960, accessed September 20, 2021, at https://doi.org/10.1073/pnas.1323422111.
Izbicki, J.A., Borchers, J.W., Leighton, D.A., Kulongoski, J.T., Fields, L., Galloway, D.L., and Michel, R.L., 2003, Hydrogeology and geochemistry of aquifers underlying the San Lorenzo and San Leandro areas of the East Bay Plain, Alameda County, California: U.S. Geological Survey Water-Resources Investigations Report 2002–4259, 61 p., accessed August 26, 2020, at https://doi.org/10.3133/wri024259.
Izbicki, J.A., Christensen, A.H., Newhouse, M.W., and Aiken, G.R., 2005a, Inorganic, isotopic, and organic composition of high-chloride water from wells in a coastal southern California aquifer: Applied Geochemistry, v. 20, no. 8, p. 1496–1517, accessed August 8, 2023, at https://doi.org/10.1016/j.apgeochem.2005.04.010.
Izbicki, J.A., Christensen, A.H., Newhouse, M.W., Smith, G.A., and Hanson, R.T., 2005b, Temporal changes in vertical distribution of flow and chloride in deep wells: Groundwater, v. 43, no. 4, p. 531–544, accessed May 23, 2023, at https://doi.org/10.1111/j.1745-6584.2005.0032.x.
Jung, B., Garven, G., and Boles, J.R., 2015, The geodynamics of faults and petroleum migration in the Los Angeles basin, California: American Journal of Science, v. 315, no. 5, p. 412–459, accessed April 5, 2021, at https://doi.org/10.2475/05.2015.02.
Jurgens, B.C., Fram, M.S., Belitz, K., Burow, K.R., and Landon, M.K., 2010, Effects of groundwater development on uranium—Central Valley, California, USA: Groundwater, v. 48, no. 6, p. 913–928, accessed August 11, 2020, at https://doi.org/10.1111/j.1745-6584.2009.00635.x.
King, G.E., and King, D.E., 2013, Environmental risk arising from well-construction failure—Differences between barrier and well failure, and estimates of failure frequency across common well types, locations, and well age: SPE Production & Operations, v. 28, no. 4, p. 323–344 accessed December 2, 2022, at https://doi.org/10.2118/166142-PA.
Kulongoski, J.T., Belitz, K., Landon, M.K., and Farrar, C., 2010, Status and understanding of groundwater quality in the north San Francisco Bay groundwater basins, 2004—California GAMA priority basin project: U.S. Geological Survey Scientific Investigations Report 2010–5089, 88 p., accessed March 20, 2023, at https://pubs.usgs.gov/sir/2010/5089/.
Kulongoski, J.T., McMahon, P.B., Land, M., Wright, M.T., Johnson, T.A., and Landon, M.K., 2018, Origin of methane and sources of high concentrations in Los Angeles groundwater: Journal of Geophysical Research. Biogeosciences, v. 123, no. 3, p. 818–831, accessed July 27, 2020, at https://doi.org/10.1002/2017JG004026.
Luhdorff & Scalmanini Consulting Engineers, 2021, 2020 Santa Clarita Valley water report: Santa Clarita Valley Water Agency, prepared by Luhdorff & Scalmanini Consulting Engineers, 83 p., accessed November 4, 2021, at https://yourscvwater.com/sites/default/files/SCVWA/2020-Santa-Clarita-Valley-Water-Report.pdf.
Lauer, N.E., Harkness, J.S., and Vengosh, A., 2016, Brine spills associated with unconventional oil development in North Dakota: Environmental Science & Technology, v. 50, no. 10, p. 5389–5397, accessed May 25, 2023, at https://doi.org/10.1021/acs.est.5b06349.
Lawrence, S.J., 2006, Description, properties, and degradation of selected volatile organic compounds detected in ground water—A review of selected literature: U.S. Geological Survey Open-File Report 2006–1338, 62 p., accessed August 3, 2020, at https://doi.org/10.3133/ofr20061338.
McKinley, R.M., 1994, Temperature, radioactive tracer, and noise logging for injection well integrity: U.S. Environmental Protection Agency EPA/600/R–94/124, prepared by Exxon Production Research CR-818926, 161 p., accessed June 14, 2023, at https://www.epa.gov/sites/default/files/2018-06/documents/mckinley_1994_temperature_tracer_noice_epa_600_r94_124.pdf.
McMahon, P.B., Kulongoski, J.T., Wright, M.T., Land, M.T., Landon, M.K., Cozzarelli, I.M., Vengosh, A., and Aiken, G.R., 2017, Preliminary results from exploratory sampling of wells for the California oil, gas, and groundwater program, 2014–15 (ver 1.1, January 2017): U.S. Geological Survey Open-File Report 2016–1100, 8 p., accessed August 21, 2017, at http://doi.org/10.3133/ofr20161100.
McMahon, P.B., Kulongoski, J.T., Vengosh, A., Cozzarelli, I.M., Landon, M.K., Kharaka, Y.K., Gillespie, J.M., and Davis, T.A., 2018, Regional patterns in the geochemistry of oil field water, southern San Joaquin Valley, California, USA: Applied Geochemistry, v. 98, p. 127–140, accessed May 9, 2023, at https://doi.org/10.1016/j.apgeochem.2018.09.015.
McMahon, P.B., Vengosh, A., Davis, T.A., Landon, M.K., Tyne, R.L., Wright, M.T., Kulongiski, J.T., Hunt, A.G., Barry, P.H., Kondash, A.J., Wang, Z., and Ballentine, C.J., 2019, Occurrence and sources of radium in groundwater associated with oil fields in the southern San Joaquin Valley, California: Environmental Science & Technology, v. 53, no. 16, p. 9398–9406, accessed May 16, 2023, at https://doi.org/10.1021/acs.est.9b02395.
McMahon, P.B., Landon, M.K., Stephens, M.J., Taylor, K.A., Gillespie, J.M., Davis, T.A., and Shimabukuro, D.H., 2023, Fluid migration pathways to groundwater in mature oil fields—Exploring the roles of water injection/production and oil-well integrity in, California, USA: Science of the Total Environment, v. 900, article 166400, 15 p., accessed January 22, 2024, at https://doi.org/10.1016/j.scitotenv.2023.166400.
Metzger, L.F., 2022, Historical groundwater and produced water chemistry data compiled for the Placerita and Newhall Oil Fields, Los Angeles County, southern California: U.S. Geological Survey data release, accessed November 10, 2020, at https://doi.org/10.5066/P9MBVEOW.
Multi-Resolution Land Characteristics Consortium, 2021, National land cover database 2019: Multi-Resolution Land Characteristics Consortium database, accessed November 9, 2021, at www.mrlc.gov/data.
Myer, L., Jacobsen, J., Horsman, J., Fredrich, J.T., Wawersik, W.R., Arguello, J.G., Bruno, M., and Qian, H., 1996, Use of visualization techniques in analysis of well failures in diatomite reservoirs: The Leading Edge, v. 15, no. 3, p. 185–189, accessed March 2023 at https://library.seg.org/doi/epdf/10.1190/1.1437290.
Nelson, E.B., 2012, Well cementing fundamentals: Oilfield Review, v. 24, no. 2, 2 p., accessed December 2, 2022, at https://www.slb.com/resource-library/oilfield-review/defining-series/defining-cementing.
Patterson, L.A., Konschnik, K.E., Wiseman, H., Fargione, J., Maloney, K.O., Kiesecker, J., Nicot, J.-P., Baruch-Mordo, S., Entrekin, S., Trainor, A., and Saiers, J.E., 2017, Unconventional oil and gas spills—Risks, mitigation priorities, and state reporting requirements: Environmental Science & Technology, v. 51, no. 5, p. 2563–2573, accessed May 25, 2023, at https://doi.org/10.1021/acs.est.6b05749.
Piper, E.M., Riddell, A.W., and Trent, R.H., 1983, An evaluation of heavy oil mining—Final report, volume 1: U.S. Department of Energy, prepared by Energy Development Consultants, DOE/PC/30259-1volume 1, 13 p., accessed February 2, 2022, at https://edx.netl.doe.gov/dataset/evaluation-of-heavy-oil-mining-final-report-volume-1.
Plummer, L.N., and Sprinkle, C.L., 2001, Radiocarbon dating of dissolved inorganic carbon in groundwater from confined parts of the upper Floridan aquifer, Florida, USA: Hydrogeology Journal, v. 9, p. 127–150, accessed April 5, 2021, at https://doi.org/10.1007/s100400000121.
Richard C. Slade & Associates LLC, 1988, Hydrogeologic assessment of the Saugus Formation in the Santa Clara Valley of Los Angeles County, California—Report for Castaic Lake Water Agency, Los Angeles County Waterwards District 36: Valencia, Cali., Newhall County Water District, Santa Clarity Water Company, and Valencia Water Company, prepared by Richard C. Slade & Associates LLC, Van Nuys, Cali., 168 p.
Richard C. Slade & Associates LLC, 2002, Hydrogeologic conditions in the Alluvial and Saugus Formation aquifer systems—2001 update report: Santa Clarita Valley Water Purveyors, prepared by Richard C. Slade & Associates LLC, 98 p., accessed January 20, 2022, at https://www.yourscvwater.com/sites/default/files/SCVWA/your-water/watershed-planning/water-supply-assessments/2001-Update-Report-Hydrogeologic-Conditi ons-in-the-Alluvial-and-Saugus-Formation-Aquifer-Systems-Slade-and-Associates.pdf.
Richter, B.C., and Kreitler, C.W., 1991, Identification of sources of ground-water salinization using geochemical techniques: U.S. Environmental Protection Agency EPA/600/2–91/064, 272 p., accessed December 14, 2020, at https://nepis.epa.gov/Exe/ZyNET.EXE?ZyActionL=Register&User=anonymous&Password=anonymous&Client=EPA&Init=1.
Robson, S.G., 1972, Water-resources investigation using analog model techniques in the Saugus-Newhall area, Los Angeles County, California: U.S. Geological Survey Open-File Report 72–320, 58 p., accessed June 5, 2018, at https://doi.org/10.3133/ofr72320.
Rosecrans, C.Z., Landon, M.K., McMahon, P.B., Gillespie, J.M., Kulongoski, J.T., Stephens, M.J., Hunt, A.G., Shimabukuro, D.H., and Davis, T.A., 2021, Groundwater quality of aquifers overlying the Oxnard Oil Field, Ventura County, California: Science of the Total Environment, v. 771, article 144822, 17 p., accessed May 12, 2023, at https://doi.org/10.1016/j.scitotenv.2020.144822.
Rossi, J.R., DiGiulio, D.C., and Shonkoff, S.B.C., 2022, An examination of onshore produced water spills in the state of California—Incident frequency, spatial distribution, and shortcomings in available data: Environmental Science and Pollution Research, v. 30, p. 18631–18642, accessed May 30, 2023, at https://doi.org/10.1007/s11356-022-23391-0.
Saucedo, G.J., Bedford, D.R., Raines, G.L., Miller, R.J., and Wentworth, C.M., 2000, GIS data for the geologic map of California: California Department of Conservation, California Geological Survey, accessed January 20, 2021, at https://maps.conservation.ca.gov/cgs/gmc/.
Schoell, M., 1980, The hydrogen and carbon isotopic composition of methane from natural gases of various origins: Geochimica et Cosmochimica Acta, v. 44, no. 5, p. 649–661, accessed August 4, 2020, at https://doi.org/10.1016/0016-7037(80)90155-6.
Seitz, N.O., Lorah, M.M., Cozzarelli, I.M., Marcusa, J.A., Kulongoski, J.T., and Jeschke, J.B., 2023, Produced water volatile organic compound data collected from eight oil fields, 2016–2020, California: U.S. Geological Survey data release, accessed May 12, 2023, at https://doi.org/10.5066/P9KBI8ZO.
Seitz, N.O., Kulongoski, J., Marcusa, J.A., Stanton, J.S., and Rosecrans, C.Z., 2024, Produced water chemistry data collected from the Oxnard Oil Field, Ventura County, and the Placerita Oil Field, Los Angeles County, 2018, California: U.S. Geological Survey data release, https://doi.org/10.5066/P93KFFR8.
Shimabukuro, D.H., Sowers, T.A., and Stephens, M.J., 2023, Idle well fluid measurements for oil and gas wells in California: U.S. Geological Survey data release, accessed April 10, 2023, at https://doi.org/10.5066/P92AIV6T.
Shimabukuro, D.H., Stephens, M.J., Crandall-Bear, A., Gillespie, J.M., Haugen, E.A., and Chang, W., 2019, Mapping volume balance of injected and produced fluids in and around Kern County oil fields [abs.] in American Association of Petroleum Geologists Pacific Section Convention, Long Beach, California, April 1–3, 2019: AAPG Datapages, Inc., accessed July 18, 2022, at https://www.searchanddiscovery.com/abstracts/html/2019/longbeach-90339/abstracts/2019.PS.04.html.
Stanton, J.S., Land, M., Landon, M.K., Shimabukuro, D.H., McMahon, P.B., Davis, T.A., Hunt, A.G., and Sowers, T.A., 2023, Groundwater quality near the Montebello Oil Field, Los Angeles County, California: U.S. Geological Survey Scientific Investigations Report 2022–5128, 80 p., accessed March 10, 2023, at https://doi.org/10.3133/sir20225128.
Stanton, J.S., and Marcusa, J.A., 2024, Water chemistry data for samples collected at groundwater sites in the Placerita Oil Field study area, June 2018—November 2018, Los Angeles County, California: U.S. Geological Survey data release, https://doi.org/10.5066/P9G5UD7J.
Taylor, S.W., Sherwood Lollar, B., and Wassenaar, L.I., 2000, Bacteriogenic ethane in near-surface aquifers—Implications for leaking hydrocarbon well bores: Environmental Science & Technology, v. 34, no. 22, p. 4727–4732, accessed April 5, 2021, at https://doi.org/10.1021/es001066x.
Terrax Environmental, Inc., 2022, Third quarter 2022 groundwater monitoring report: California Department of Toxic Substances Control, prepared by Terrax Environmental, Inc., 10 p., 10 supps., accessed January 23, 2023, at https://www.envirostor.dtsc.ca.gov/public/deliverable_documents/2010112941/Old%20Orchard_3Q22%20GWM%20Rpt_102522.pdf.
Tudor, R.B., 1962, Recent developments in the Kraft-York area of Placerita Oil Field: California Division of Oil and Gas, Summary of Operations—California Oil Fields, v. 48, no. 1, p. 47–53, accessed January 1, 2022, at https://www.elsmerecanyon.com/placerita/tudor1962.pdf.
U.S. Energy Information Administration, 2020, California state profile and energy estimates—State energy data system (SEDS) 1960–2018: U.S. Energy Information Administration web page, accessed October 6, 2020, at https://www.eia.gov/state/seds/seds-data-complete.php?sid=CA#stateSelection.
U.S. Environmental Protection Agency [EPA], 2018, 2018 edition of the drinking water standards and health advisories, EPA 822-F-18-001: Washington, D.C., Office of Water, 20 p., accessed February 27, 2020, at https://www.epa.gov/system/files/documents/2022-01/dwtable2018.pdf.
U.S. Environmental Protection Agency [EPA], 2019, Aquifer exemptions in the underground injection control program: U.S. Environmental Protection Agency web page, accessed December 2019 at https://www.epa.gov/uic/aquifer-exemptions-underground-injection-control-program.
U.S. Environmental Protection Agency [EPA], 2020, TRI basic data files—Calendar years 1987–present: U.S. Environmental Protection Agency web page, accessed June 18, 2020, at https://www.epa.gov/toxics-release-inventory-tri-program/tri-basic-data-files-calendar-years-1987-2018.
U.S. Geological Survey, 2021, USGS water data for the Nation: U.S. Geological Survey National Water Information System database, accessed January 12, 2021, at https://doi.org/10.5066/F7P55KJN.
U.S. Geological Survey, 2023, False positive and false negative report for method—4440: U.S. Geological Survey Organic Blind Sample Project web page, accessed May 23, 2023, at https://bqs.usgs.gov/OBSP/Current_Charts/False_SCHED4440.html.
U.S. Geological Survey, [variously dated], National field manual for the collection of water-quality data, sec. A of Handbooks for water-resources investigations: U.S. Geological Survey Techniques of Water-Resources Investigations, book 9, 9 chaps. (A1–A9), [variously paged], accessed April 5, 2019, at https://www.usgs.gov/mission-areas/water-resources/science/national-field-manual-collection-water-quality-data-nfm#overview.
U.S. Geological Survey, [undated], California oil, gas, and groundwater (COGG) program: U.S. Geological Survey web page, accessed April 7, 2019, at https://webapps.usgs.gov/cogg/.
United Water Conservation District, 2021, Saline intrusion and 2020 groundwater conditions update, Oxnard and Pleasant Valley basins: United Water Conservation District Open-File Report 2021-03, 49 p., 5 supps., accessed March 23, 2022, at https://www.unitedwater.org/wp-content/uploads/2021/12/UWCD-OFR-2021-03-Saline-Intrusion-and-2020-GW-Conditions-Update-Oxnard-and-PV-Basins.pdf.
Whiticar, M.J., Faber, E., and Schoell, M., 1986, Biogenic methane formation in marine and freshwater environments—CO2 reduction vs. acetate fermentation—Isotopic evidence: Geochimica et Cosmochimica Acta, v. 50, no. 5, p. 693–709, accessed August 4, 2020, at https://doi.org/10.1016/0016-7037(86)90346-7.
Whiticar, M.J., 1999, Carbon and hydrogen isotope systematics of bacterial formation and oxidation of methane: Chemical Geology, v. 161, no. 1–3, p. 291–314, accessed August 4, 2020, at https://doi.org/10.1016/S0009-2541(99)00092-3.
Williams, T., Foreman, W.T., Decess, J., Reed-Parker, C., and Stevenson, D.L., 2015, National Water Quality Laboratory technical memorandum 15.02: U.S. Geological Survey, 21 p., accessed September 16, 2021, at https://nwql.usgs.gov/tech_memos/nwql.2015-02.pdf.
Winterer, E.L., and Durham, D.L., 1962, Geology of southeastern Ventura basin, Los Angeles County, California—A study of the stratigraphy, structure, and occurrence of oil in the late Cenozoic Ventura basin: U.S. Geological Survey Professional Paper 334–H, 88 p., 6 pls., accessed February 1, 2018, at https://doi.org/10.3133/pp334H.
Wisen, J., Chesnaux, R., Werring, J., Wendling, G., Baudron, P., and Barbecot, F., 2020, A portrait of wellbore leakage in northeastern British Columbia, Canada: Proceedings of the National Academy of Sciences of the United States of America, v. 117, no. 2, p. 913–922, accessed January 8, 2021, at https://doi.org/10.1073/pnas.1817929116.
Wright, M.T., McMahon, P.B., Landon, M.K., and Kulongoski, J.T., 2019, Groundwater quality of a public supply aquifer in proximity to oil development, Fruitvale Oil Field, Bakersfield, California: Applied Geochemistry, v. 106, p. 82–95, accessed May 9, 2023, at https://doi.org/10.1016/j.apgeochem.2019.05.003.
Wright, M.T., Izbicki, J.A., and Jurgens, B.C., 2021, A multi-tracer and well-bore flow profile approach to determine occurrence, movement, and sources of perchlorate in groundwater: Applied Geochemistry, v. 129, article 104959, 18 p., accessed June 21, 2022, at https://doi.org/10.1016/j.apgeochem.2021.104959.
Wu, J., Knauss, M.E., and Kritzler, T., 2008, Casing failures in cyclic steam injection wells in IADC/SPE Asia Pacific Drilling Technology Conference and Exhibition, August 25–27, 2008: Jakarta, Indonesia, Society of Petroleum Engineers International, paper SPE-114231-MS, accessed February 23, 2023, at https://doi.org/10.2118/114231-MS.
WZI, Inc., 2016, Watt Mineral Holdings, LLC—Technical report, section 13267 order, Phillips no. 1 well, API# 037–13052, Newhall field: Watt Mineral Holdings, LLC, prepared by WZI, Inc., 174 p., accessed July 5, 2018, at https://documents.geotracker.waterboards.
Appendix 1. Glossary
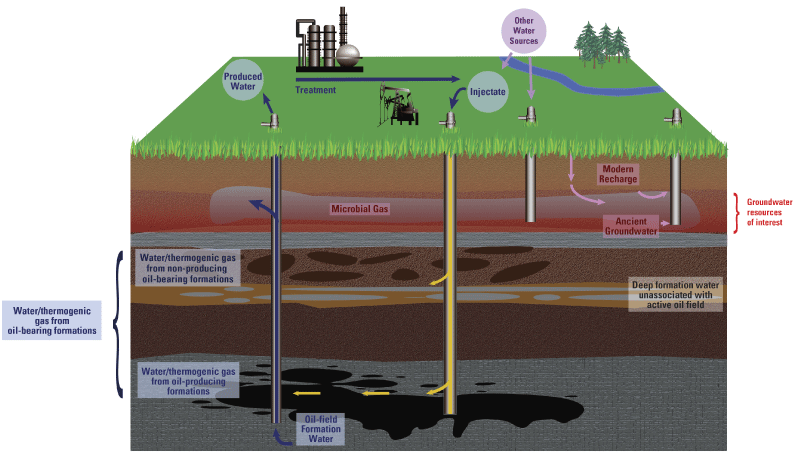
Conceptual diagram illustrating oil-field features and sources of water and petroleum hydrocarbons.
Terms Related to Oil and Gas Development
-
Oil and gas development Commercial oil and gas extraction activities including production (withdrawal) from wells, injection, treatment, and disposal of excess water.
-
Oil and gas shows Gas or oil detected in the drilling mud or drilling cuttings and reported in mud logs or cores.
-
Oil-field well Any well constructed for oil-field activities including oil production, gas production, produced-water disposal, waterflood, steam flood, cyclic steam, observation, dry hole (never produced), and water supply.
Terms Related to Sources
-
Oil and gas sources of chemical constituents Include oil- and gas-development activities and naturally occurring (geologic) oil, gas, and saline water in sediments near oil fields. Synonyms: oil-production activities, oil-bearing formations, hydrocarbon-bearing formations.
-
Naturally occurring sources of hydrocarbons Naturally occurring oil and gas shows in sediments overlying or near oil fields; these do not yield commercial quantities of oil or gas.
Terms Related to Water
-
Oil-field fluids Water and gas from oil-producing zones and non-producing oil-bearing formations.
-
Water from oil-bearing formations Water having elevated salinity and concentrations of inorganic or organic solutes derived from oil- and gas-bearing formations, including those used for commercial oil and gas production and naturally occurring oil and gas shows in overlying sediments.
-
Water from oil-producing zones Water derived from an oil-field source. This can include produced water, oil-field formation water and injectate (water intended for disposal or injection for secondary recovery). Differs from produced water in terms of how the sample is accessed. This would not include water potentially derived from naturally hydrocarbon-bearing sediments overlying oil fields that do not yield commercial quantities of oil or gas.
-
Produced water Water withdrawn from an oil well and brought to the surface and may include oil, water, and gas from the geologic formation, and water or gas injected for enhanced recovery.
-
Oil-field formation water Water of original composition in the pore spaces of oil-producing zones that has not been altered by injection processes.
-
Injectate Water injected for disposal or for secondary recovery. Generally, consists primarily of recycled produced water, with treatments such as oil skimming (dehydrogenation), sometimes with treatment and (or) additives to limit biological activity, corrosion, and buildup of mineral deposits in injection wells. In some fields, injection for disposal occurs outside of oil-producing zones.
-
Water from non-producing oil-bearing formations Water from sediments containing naturally occurring oil and gas shows that overlie oil-producing zones.
-
Deep formation water unassociated with active oil fields Water having elevated salinity (concentrations of inorganic constituents and other dissolved solutes) derived from relatively deep formations not associated with oil and gas fields.
-
Idle well fluid level A fluid level measured in a well that has not produced oil or gas, produced water to be used in production stimulation, or been used for enhanced oil recovery, reservoir pressure management, or injection for a period of 24 consecutive months.
Terms Related to Gas
-
Thermogenic gas from oil-bearing formations Hydrocarbon gas of thermogenic origin derived from oil- and gas-bearing formations, including those used for commercial oil and gas production and naturally occurring oil and gas shows in overlying sediments.
-
Thermogenic gas from oil-producing zones Thermogenic gas derived from an oil-field source. This can include produced water, oil-field formation water, and injectate (water intended for disposal or injection for secondary recovery). This would not include water potentially derived from naturally occurring hydrocarbon-bearing sediments overlying oil fields that do not yield commercial quantities of oil or gas.
-
Thermogenic gas from non-producing oil-bearing formations Thermogenic gas from sediments containing naturally occurring oil and gas shows that overlie oil-producing zones.
-
Thermogenic gas Natural gas including methane and heavier light hydrocarbon gases derived from oil and gas generation processes including heating and high pressure, typically originally occurring at relatively large depths.
-
Microbial gas Natural gas, generally including methane with sometimes small amounts of ethane, derived from in situ production by microbe-facilitated reactions with organic carbon.
Terms Related to Enhanced Oil Recovery (EOR)
-
Cyclic steam Injecting steam into the oil-production zone through an oil-production well, allowing time for the heat energy of steam to reduce viscosity of the oil, and then producing oil from the well.
-
Waterflood The use of water injection to increase the reservoir pressure.
-
Steamflood Injecting steam into the oil-production zone through injection wells to reduce oil viscosity and drive oil toward oil-production wells.
-
Fireflood Igniting a fire in the oil-production zone to reduce oil viscosity and generate steam to drive oil toward oil-production wells.
-
Hydraulic fracturing A well stimulation treatment that, in whole or in part, includes the pressurized injection of one or more base fluids mixed with physical and chemical additives into an underground geologic formation in order to fracture the formation, thereby causing or enhancing the production of oil or gas from a well.
Appendix 2. Supplemental Tables for the Placerita Oil Field Study Area, California, 2018
Oil-field well characteristics within 500 meters of California State Water Resources Control Board Oil and Gas Regional Monitoring Program (RMP) groundwater samples in the Placerita Oil Field study area, California.
[Table is available as a Microsoft Excel (xlsx) and a comma separated values (csv) format file for download at https://doi.org/10.3133/sir20245042]
Volatile organic compounds detected in California State Water Resources Control Board Oil and Gas Regional Monitoring Program (RMP) groundwater samples, Placerita Oil Field study area, California, 2018.
[Table is available as a Microsoft Excel (xlsx) and a comma separated values (csv) format file for download at https://doi.org/10.3133/sir20245042.]
Volatile organic compound concentrations, dissolved organic carbon concentrations, and age-dating results in California State Water Resources Control Board Oil and Gas Regional Monitoring Program (RMP) groundwater samples, Placerita Oil Field study area, California, 2018.
[Table is available as a Microsoft Excel (xlsx) and a comma separated values (csv) format file for download at https://doi.org/10.3133/sir20245042]
Dissolved gases and other light hydrocarbon gas properties in California State Water Resources Control Board Oil and Gas Regional Monitoring Program (RMP) groundwater samples, Placerita Oil Field study area, California, 2018.
[Table is available as a Microsoft Excel (xlsx) and a comma separated values (csv) format file for download at https://doi.org/10.3133/sir20245042]
Summary of selected inorganic constituent concentrations in California State Water Resources Control Board Oil and Gas Regional Monitoring Program (RMP) groundwater and produced-water samples, and historical produced-water samples, Placerita Oil Field study area, California.
[Table is available as a Microsoft Excel (xlsx) and a comma separated values (csv) format file for download at https://doi.org/10.3133/sir20245042]
Well-barrier failures above top perforations of oil-field wells, Placerita Oil Field, California.
[Table is available as a Microsoft Excel (xlsx) and a comma separated values (csv) format file for download at https://doi.org/10.3133/sir20245042]
Produced-water disposal wells downgradient from the main production area that have injected more than 500,000 cubic meters of produced water between 1977 and 2018, Placerita Oil Field, California.
[Table is available as a Microsoft Excel (xlsx) and a comma separated values (csv) format file for download at https://doi.org/10.3133/sir20245042]
References Cited
Akob, D.M., Cozzarelli, I.M., Dunlap, D.S., Rowan, E.L., and Lorah, M.M., 2015, Organic and inorganic composition and microbiology of produced waters from Pennsylvania shale gas wells: Applied Geochemistry, v. 60, p. 116–125, accessed April 2023 at https://doi.org/10.1016/j.apgeochem.2015.04.011.
California Department of Conservation, 2020, Online data tools—Oil and gas: Geologic Energy Management Division web page, accessed January 8, 2020, at https://www.conservation.ca.gov/calgem/Online_Data/Pages/Index.aspx.
California Department of Conservation, 2022, WellSTAR—Wells (build ver. R5.1.11): California Department of Conservation, Geologic Energy Management Division web page, accessed February 23, 2022, at https://wellstar-public.conservation.ca.gov/Well/Well/Index.
California Department of Water Resources, 2018, Water data library (WDL) station map—Water quality data reports: California Department of Water Resources web page, accessed August 2018 at https://www.water.ca.gov/waterdatalibrary/waterquality/index.cfm/.
California State Water Resources Control Board, 2017, GeoTracker—Electronic submittal of information (ESI) data in the electronic deliverable format (EDF) for environmental monitoring wells: California State Water Resources Control Board web page, accessed May 2017, at https://geotracker.waterboards.ca.gov/data_download_by_county.
California State Water Resources Control Board, 2019, California drinking water-related laws: California State Water Resources Control Board web page, accessed March 26, 2020, at https://www.waterboards.ca.gov/drinking_water/certlic/drinkingwater/Lawbook.shtml.
California State Water Resources Control Board, 2020a, GeoTracker GAMA: California State Water Resources Control Board web page, accessed June 4, 2020, at https://gamagroundwater.waterboards.ca.gov/gama/Default.asp.
California State Water Resources Control Board, 2020b, GeoTracker map: California State Water Resources Control Board web page, accessed May 19, 2020, at https://geotracker.waterboards.ca.gov/map/.
California State Water Resources Control Board Division of Drinking Water, 2021, EDT library and water quality analyses data and download page: California State Water Resources Control Board Division of Drinking Water web page, accessed October 1, 2021, at https://www.waterboards.ca.gov/drinking_water/certlic/drinkingwater/EDTlibrary.shtml.
DeSimone, L.A., McMahon, P.B., and Rosen, M.R., 2014, The quality of our nation’s waters—Water quality in principal aquifers of the United States, 1991–2010: U.S. Geological Survey Circular 1360, 151 p. accessed September 11, 2019, at https://doi.org/10.3133/cir1360.
Metzger, L.F., 2022, Historical groundwater and produced water chemistry data compiled for the Placerita and Newhall Oil Fields, Los Angeles County, southern California: U.S. Geological Survey data release, accessed November 10, 2020, available at https://doi.org/10.5066/P9MBVEOW.
Norman, J.E., Toccalino, P.L., and Morman, S.A., 2018, Health-based screening levels for evaluating water-quality data (2d ed.): U.S. Geological Survey web page, accessed December 7, 2020, at https://water.usgs.gov/water-resources/hbsl/.
Seitz, N.O., Kulongoski, J., Marcusa, J.A., Stanton, J.S., and Rosecrans, C.Z., 2024, Produced water chemistry data collected from the Oxnard Oil Field, Ventura County, and the Placerita Oil Field, Los Angeles County, 2018, California: U.S. Geological Survey data release, https://doi.org/10.5066/P93KFFR8.
Stanton, J.S., and Marcusa, J.A., 2024, Water chemistry data for samples collected at groundwater sites in the Placerita Oil Field study area, June 2018—November 2018, Los Angeles County, California: U.S. Geological Survey data release, https://doi.org/10.5066/P9G5UD7J.
U.S. Environmental Protection Agency [EPA], 2018, 2018 edition of the drinking water standards and health advisories: U.S. Environmental Protection Agency 822–F–18–001, 20 p., accessed June 23, 2023, at https://www.epa.gov/system/files/documents/2022-01/dwtable2018.pdf.
U.S. Geological Survey, 2021, USGS water data for the nation: U.S. Geological Survey National Water Information System database, accessed January 12, 2021, at https://doi.org/10.5066/F7P55KJN.
U.S. Geological Survey, 2023, False positive and false negative report for method 4440: U.S. Geological Survey Organic Blind Sample Project web page, accessed May 23, 2023, at https://bqs.usgs.gov/OBSP/Current_Charts/False_SCHED4440.html.
Appendix 3. Quality of Groundwater Samples Collected for the Placerita Oil Field Study Area, California, 2018
Table 3.1.
Quality-control samples used for evaluating data quality of California State Water Resources Control Board Oil and Gas Regional Monitoring Program (RMP) groundwater samples collected for the Placerita Oil Field study area, 2018.-
• barium (one replicate pair),
-
• boron (one replicate pair),
-
• lithium (one replicate pair),
-
• methane (two replicate pairs),
-
• ethane (one replicate pair),
-
• carbon-14 in dissolved inorganic carbon (14C-DIC; one replicate pair),
-
• neon (one replicate pair),
-
• helium-4 (one replicate pair), and
-
• helium-3/helium-4 ratio (one replicate pair).
References Cited
Maloney, T.J., ed., 2005, Quality management system, U.S. Geological Survey National Water Quality Laboratory (version 1.3, November 9, 2005): U.S. Geological Survey Open-File Report 2005–1263, 94 p., accessed November 3, 2023, at https://pubs.usgs.gov/of/2005/1263/.
Stanton, J.S., and Marcusa, J.A., 2024, Water chemistry data for samples collected at groundwater sites in the Placerita Oil Field study area, June 2018–November 2018, Los Angeles County, California: U.S. Geological Survey data release, https://doi.org/10.5066/P9G5UD7J.
Appendix 4. Noble Gas Compositions of Groundwater and Produced Water in the Placerita Oil Field Study Area, California, 2018
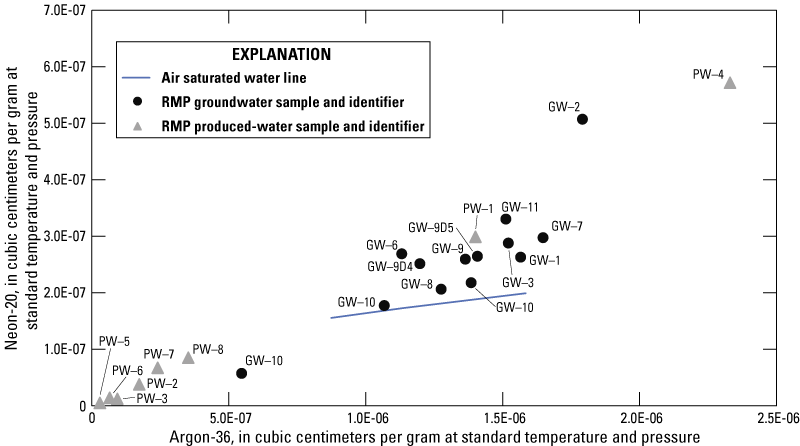
Neon-20 and argon-36 isotopes in California State Water Resources Control Board Oil and Gas Regional Monitoring Program (RMP) groundwater and produced-water samples with the air-saturated water line at 2–30 degrees Celsius.
References Cited
Ballentine, C.J., Burgess, R., and Marty, B., 2002, Tracing fluid origin, transport and interaction in the crust, chap. 3 of Porcelli, D.P., Ballentine, C.J., and Wieler, R., eds., Noble gases—In geochemistry and cosmochemistry, v. 47 of Reviews in Mineralogy and Geochemistry: Berlin, Boston, De Gruyter, p. 539–614. [Also available at https://doi.org/10.1515/9781501509056-015.]
Ballentine, C.J., O’Nions, R.K., and Coleman, M.L., 1996, A Magnus opus—Helium, neon, and argon isotopes in a North Sea oilfield: Geochimica et Cosmochimica Acta, v. 60, no. 5, p. 831–849, accessed March 2023 at https://doi.org/10.1016/0016-7037(95)00439-4.
Ballentine, C.J., O’Nions, R.K., Oxburgh, E.R., Horvath, F., and Deak, J., 1991, Rare gas constraints on hydrocarbon accumulation, crustal degassing and groundwater flow in the Pannonian basin: Earth and Planetary Science Letters, v. 105, nos. 1–3, p. 229–246, accessed March 2023 at https://doi.org/10.1016/0012-821X(91)90133-3.
Barry, P.H., Kulongoski, J.T., Landon, M.K., Tyne, R.L., Gillespie, J.M., Stephens, M.J., Hillegonds, D.J., Byrne, D.J., and Ballentine, C.J., 2018, Tracing enhanced oil recovery signatures in casing gases from the Lost Hills oil field using noble gases: Earth and Planetary Science Letters, v. 496, p. 57–67, accessed March 2023 at https://doi.org/10.1016/j.epsl.2018.05.028.
Bosch, A., and Mazor, E., 1988, Natural gas association with water and oil as depicted by atmospheric noble gases—Case studies from the southeastern Mediterranean Coastal Plain: Earth and Planetary Science Letters, v. 87, no. 3, p. 338–346, accessed March 2023 at https://doi.org/10.1016/0012-821X(88)90021-0.
Byrne, D.J., Barry, P.H., Lawson, M., and Ballentine, C.J., 2020, The use of noble gas isotopes to constrain subsurface fluid flow and hydrocarbon migration in the East Texas Basin: Geochimica et Cosmochimica Acta, v. 268, p. 186–208, accessed March 2023 at https://doi.org/10.1016/j.gca.2019.10.001.
Harkness, J.S., Darrah, T.H., Warner, N.R., Whyte, C.J., Moore, M.T., Millot, R., Kloppmann, W., Jackson, R.B., and Vengosh, A., 2017, The geochemistry of naturally occurring methane and saline groundwater in an area of unconventional shale gas development: Geochimica et Cosmochimica Acta, v. 208, p. 302–334, accessed March 2023 at https://doi.org/10.1016/j.gca.2017.03.039.
Heaton, T.H.E., and Vogel, J.C., 1981, “Excess air” in groundwater: Journal of Hydrology, v. 50, p. 201–216, accessed March 2023 at https://doi.org/10.1016/0022-1694(81)90070-6.
Hunt, A.G., Darrah, T.H., and Poreda, R.J., 2012, Determining the source and genetic fingerprint of natural gases using noble gas geochemistry—A northern Appalachian Basin case study: AAPG Bulletin, v. 96, no. 10, p. 1785–1811, accessed March 2023 at https://doi.org/10.1306/03161211093.
Karolytė, R., Barry, P.H., Hunt, A.G., Kulongoski, J.T., Tyne, R.L., Davis, T.A., Wright, M.T., McMahon, P.B., and Ballentine, C.J., 2021, Noble gas signatures constrain oil field water as the carrier phase of hydrocarbons occurring in shallow aquifers in the San Joaquin Basin, USA: Chemical Geology, v. 584, article 120491, accessed March 2023 at https://doi.org/10.1016/j.chemgeo.2021.120491.
Stanton, J.S., and Marcusa, J.A., 2024, Water chemistry data for samples collected at groundwater sites in the Placerita Oil Field study area, June 2018—November 2018, Los Angeles County, California: U.S. Geological Survey data release, https://doi.org/10.5066/P9G5UD7J.
Tyne, R.L., Barry, P.H., Hillegonds, D.J., Hunt, A.G., Kulongoski, J.T., Stephens, M.J., Byrne, D.J., and Ballentine, C.J., 2019, A novel method for the extraction, purification, and characterization of noble gases in produced fluids: Geochemistry, Geophysics, Geosystems, v. 20, no. 11, p. 5588–5597, accessed March 2023 at https://doi.org/10.1029/2019GC008552.
Tyne, R.L., Barry, P.H., Karolytė, R., Byrne, D.J., Kulongoski, J.T., Hillegonds, D.J., and Ballentine, C.J., 2021, Investigating the effect of enhanced oil recovery on the noble gas signature of casing gases and produced waters from selected California oil fields: Chemical Geology, v. 584, article 120540, accessed March 2023 at https://doi.org/10.1016/j.chemgeo.2021.120540.
Conversion Factors
International System of Units to U.S. customary units
Temperature in degrees Celsius (°C) may be converted to degrees Fahrenheit (°F) as follows:
°F=(1.8×°C)+32.
Datums
Vertical coordinate information is referenced to the North American Vertical Datum of 1988 (NAVD 88).
Horizontal coordinate information is referenced to the North American Datum of 1983 (NAD 83).
Elevation, as used in this report, refers to distance above the vertical datum.
Supplemental Information
Specific conductance is given in microsiemens per centimeter at 25 degrees Celsius (µS/cm at 25 °C).
Concentrations of chemical constituents in water are given in either milligrams per liter (mg/L) or micrograms per liter (µg/L).
Results for measurements of stable isotopes of an element (with symbol E) in water, solids, and dissolved constituents commonly are expressed as the relative difference in the ratio of the number of the less abundant isotope (iE) to the number of the more abundant isotope of a sample with respect to a measurement standard.
Tritium is given in tritium units (TUs), which is equal to 3.19 picocuries per liter.
Carbon-14 in dissolved inorganic carbon is given in percent modern carbon (pmc).
Dissolved light hydrocarbon gases are given in milligrams per liter (mg/L) or percentage of total dissolved gases (mole percent).
Oil-field terminology used throughout this report is defined in appendix 1.
Abbreviations
14C-DIC
carbon-14 in dissolved inorganic carbon
δ13C-DIC
stable isotopes of carbon in dissolved inorganic carbon
δ2H-CH4
stable isotopes of hydrogen in methane
δ13C-CH4
stable isotopes of carbon in methane
δ2H
stable isotopes of hydrogen in water
δ18O
stable isotopes of oxygen in water
3H
tritium
API
American Petroleum Institute
BTEX
benzene, toluene, ethylbenzene, and xylenes
COGG
California Oil, Gas, and Groundwater program
DOC
dissolved organic carbon
EPA
U.S. Environmental Protection Agency
PCE
tetrachloroethylene
RMP
California State Water Resources Control Board Oil and Gas Regional Monitoring Program
TDS
total dissolved solids
USGS
U.S. Geological Survey
VOC
volatile organic compound
For more information about this report, contact:
Director, California Water Science Center
U.S. Geological Survey
6000 J Street, Placer Hall
Sacramento, California 95819
or visit our website at
https://www.usgs.gov/centers/ca-water/
Publishing support provided by the Pembroke, Baltimore, and Reston Publishing Service Centers
Disclaimers
Any use of trade, firm, or product names is for descriptive purposes only and does not imply endorsement by the U.S. Government.
Although this information product, for the most part, is in the public domain, it also may contain copyrighted materials as noted in the text. Permission to reproduce copyrighted items must be secured from the copyright owner.
Suggested Citation
Stanton, J.S., Landon, M.K., Shimabukuro, D.H., Kulongoski, J.T., Hunt, A.G., McMahon, P.B., Cozzarelli, I.M., Anders, R., and Sowers, T.A., 2024, Groundwater quality near the Placerita Oil Field, California, 2018: U.S. Geological Survey Scientific Investigations Report 2024–5042, 65 p., https://doi.org/10.3133/sir20245042.
ISSN: 2328-0328 (online)
Study Area
| Publication type | Report |
|---|---|
| Publication Subtype | USGS Numbered Series |
| Title | Groundwater quality near the Placerita Oil Field, California, 2018 |
| Series title | Scientific Investigations Report |
| Series number | 2024-5042 |
| DOI | 10.3133/sir20245042 |
| Publication Date | September 26, 2024 |
| Year Published | 2024 |
| Language | English |
| Publisher | U.S. Geological Survey |
| Publisher location | Reston, VA |
| Contributing office(s) | California Water Science Center |
| Description | Report: ix, 65 p.; 2 Data Releases; 7 Tables |
| Country | United States |
| State | California |
| Other Geospatial | Placerita Oil Field |
| Online Only (Y/N) | Y |
| Additional Online Files (Y/N) | Y |