Analysis of Water Use Associated With Hydraulic Fracturing and Determination of Baseline Water Quality in Watersheds Within the Shale Play of Eastern Ohio, 2021–23
Links
- Document: Report (28.5 MB pdf) , HTML , XML
- Data Releases:
- USGS data release - Data from quality-control equipment blanks, field blanks, and field replicates for baseline water quality in watersheds within the shale play of eastern Ohio, 2021–23
- USGS data release - Annual streamflow statistics for selected streamgages in and near the shale play area of eastern Ohio (through water year 2021)
- NGMDB Index Page: National Geologic Map Database Index Page (html)
- Download citation as: RIS | Dublin Core
Acknowledgments
Thanks are extended to the Ohio Department of Natural Resources for their cooperation with the U.S. Geological Survey in completion of this study and for providing hydraulic fracturing water use data for analysis in this report.
Abstract
The U.S. Geological Survey, in cooperation with the Ohio Department of Natural Resources, performed a two-part study to (1) assess water use and temporal trends and changes in streamflow, and to (2) characterize 2021–23 baseline water quality, as they relate to oil and gas extraction activities in selected eastern Ohio watersheds. Between calendar years 2010 and 2019, hydraulic fracturing water withdrawals totaling about 27,168 million gallons were reported at 643 locations in Ohio. In 2021, wells developed with hydraulic fracturing were the source of most of the oil and gas produced in Ohio.
Daily streamflow time-series data from seven study gages and two reference gages were used to assess temporal trends and changes in streamflow. The study gages were in basins with reported water withdrawals for hydraulic fracturing. The reference gages, which have long periods of record and were subject to minimal streamflow regulation, were in nearby basins with no hydraulic fracturing water withdrawals.
Trend slopes for the period of record annual minimum and median daily streamflows and for annual daily streamflow nonexceedance probabilities less than 0.9 were all uniformly positive at the study and reference gages. This trend indicates a consistently increasing pattern over the periods of record, except for high flows. In addition, analyses of annual streamflow statistics showed no general indication that low flows or extreme low flows at the reference or study gages have lowered, become more frequent, or lengthened in duration since 2010, when records for hydraulic fracturing water withdrawals began in Ohio. In fact, in almost all cases, the opposite was indicated.
Nonexceedance percentiles of daily streamflows were compared between the full and pre-2012 periods of record for reference and study gages. The streamflows associated with nonexceedance percentiles in the lower quartile of daily streamflows determined for the full period of record were larger than or equal to those determined for the pre-2012 period of record for all study and reference gages. This indicates that low flows did not decrease during the post-2011 period of record when water was withdrawn for hydraulic fracturing.
Water-quality data were collected eight times at each of eight sampling sites (six of which were colocated with the study gages). Sampling was done during a variety of flow conditions to assess baseline water quality. In 2021, the 8 sampling sites had drainage basins that were wholly or partially within 7 of the 10 most active counties in Ohio for oil and gas development. As part of the record of baseline conditions, water-quality data were used to assess (1) water types based on major-ion chemistry; (2) sources of salinity to streams; (3) exceedances of aquatic life use criteria; and (4) the correlations between water chemistry and drainage-basin characteristics, such as density of oil and gas wells, density of wastewater treatment plants, or the percentage of different types of land cover (agriculture, developed, forest).
Seven of the water-quality sampling sites were designated as coal-mine impacted based on criteria developed for assessing mine-drainage impacts in Ohio. Mine drainage from historical coal mining in the region likely affected the quality of these streams and complicated the use of some constituents typically used as indicators of oil and gas influence. Based on major-ion chemistry, three main types of water were in the study area―sulfate (three sites), calcium-bicarbonate (one site), and mixed bicarbonate-chloride (four sites) type waters. One site had samples with a higher proportion of sodium and chloride ions than other stream samples, indicating potential contamination with oil-field brine or road salt. Binary mixing curves revealed that 11 samples from 4 of the sampling sites likely contained a component of brine. The results of the baseline assessment of surface-water quality in the study area showed no exceedances of Ohio Environmental Protection Agency aquatic life use criteria. Spearman’s rank correlation coefficients indicated no significant positive correlations with the density of vertical or horizontal oil and gas wells.
Introduction
Hydraulic fracturing is a process in which water, chemical additives, and proppants (solid materials used to keep hydraulic fractures open during or after the fracturing process) are injected under high pressure into wells completed in shale formations to create fractures that facilitate the release of natural gas and oils. About 30–50 percent of the injected water returns to the surface after the pressure is released (Gregory and others, 2011) and is called “flowback.” Flowback water and brines that are naturally present in the shale are coproduced with the oil and gas throughout the lifetime of the well and are referred to as “production water.” Production water contains elevated concentrations of major ions and trace elements leached from the shale formation, including calcium, magnesium, sodium, bicarbonate, sulfate, chloride, bromide, barium, iron, and strontium, when compared to natural surface waters. Flowback and produced water also contain elevated concentrations of total dissolved solids—sometimes exceeding 100,000 milligrams per liter—that, if accidentally released to streams, could potentially impair water quality, and detrimentally affect aquatic life in surface waters (Ohio Environmental Protection Agency [OEPA], 2011; Pichtel, 2016).
Crude oil production in Ohio increased more than 280 percent from 2012 to 2021, and natural gas production increased more than 2,500 percent (fig. 1). In 2021, the drainage basins for sites sampled to evaluate baseline water quality were wholly or partially contained within 7 of the 10 most active counties for oil and gas development (Belmont, Carroll, Guernsey, Harrison, Jefferson, Monroe, and Noble Counties; fig. 2; ODNR–OGRM, 2023b) in Ohio. In 2021, hydraulic fracturing in those seven counties accounted for most of Ohio’s oil and gas production with wells in the Utica Shale (Late Ordovician), Point Pleasant Limestone (Late Ordovician), and Marcellus Shale (Early Middle Devonian) accounting for 85.7 percent of oil production and 96.7 percent of natural gas production. Of all wells drilled in Ohio in 2021, about 90 percent targeted Utica Shale and Point Pleasant Limestone (ODNR–OGRM, 2023a).
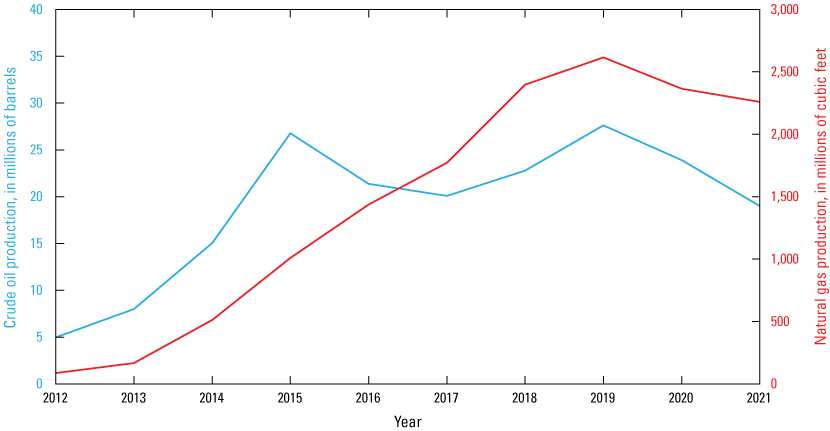
Line graph showing historically reported crude oil and gas production in Ohio, 2012–21. Data are from Ohio Department of Natural Resources Division of Oil & Gas Resources Management ODNR–OGRM, (2023a).
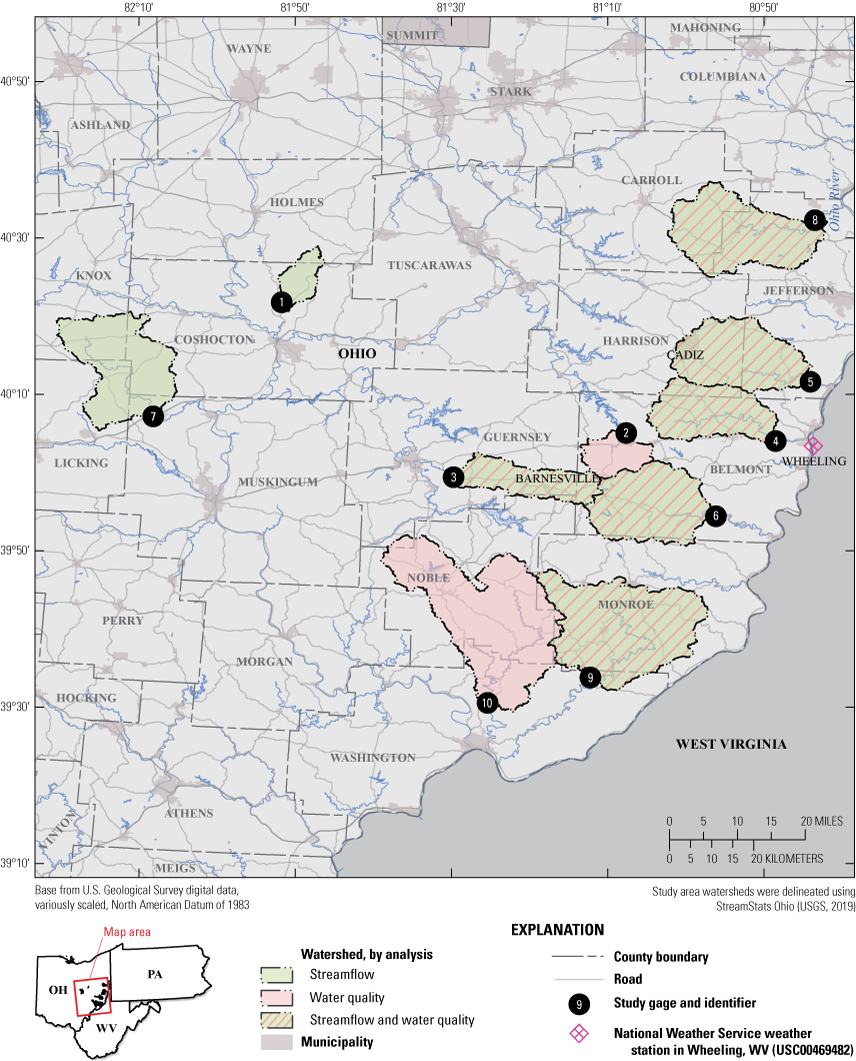
Map showing study area consisting of 10 sites used in the analysis of water use associated with hydraulic fracturing and determination of baseline water quality in watersheds within the shale play of eastern Ohio, 2021–23.
Streams and lakes have been the primary sources of water withdrawn for hydraulic fracturing in eastern Ohio where shale-gas extraction is most active (fig. 3). While it is undeniable that withdrawing water reduces streamflows or lake levels, more information was desired by state regulatory agencies and the public about the magnitude and importance of those withdrawals with respect to the amount of water present in the lakes or flowing in the streams. To help answer questions about potential effects of shale-gas development on surface-water quantity and quality, the U.S. Geological Survey (USGS), in cooperation with the Ohio Department of Natural Resources, analyzed streamflow time-series data from nine streamgages and collected baseline (2021–23) water-quality data at eight stream sites. Baseline water-quality data help document current (2021–23) conditions and can be compared to future water-quality data to identify possible changes caused by shale-gas production or other activities, should they occur.
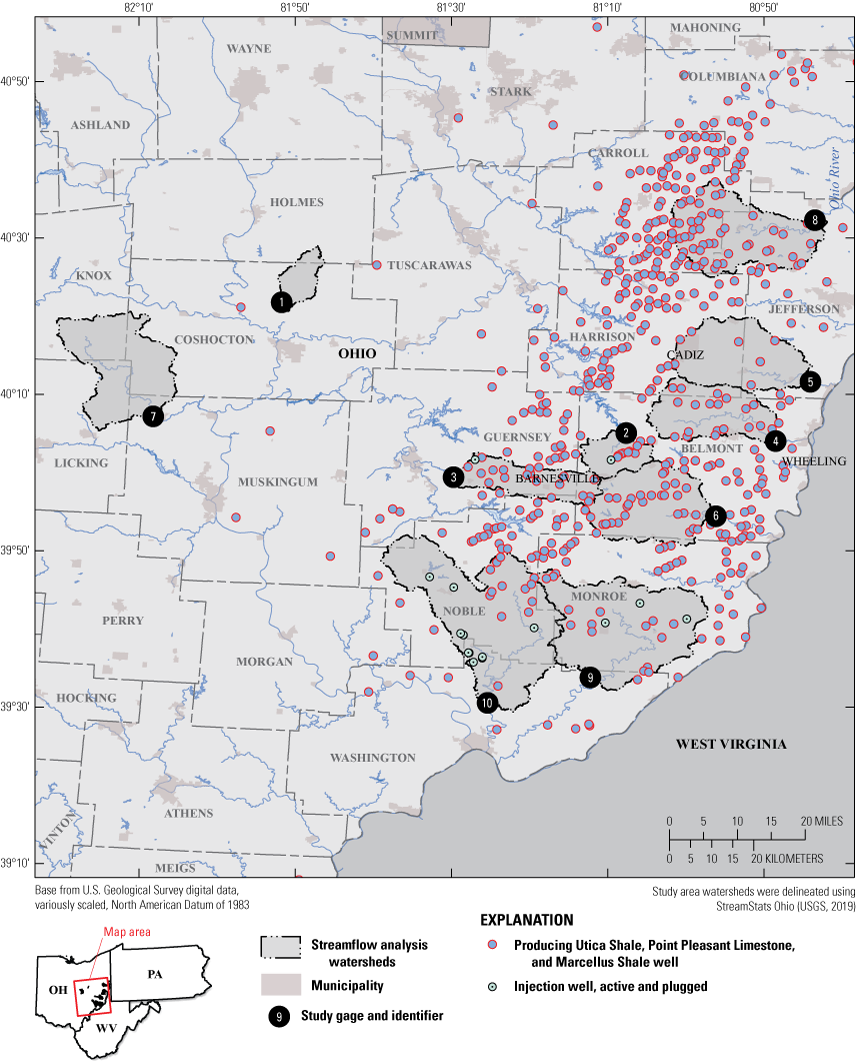
Map showing density of horizontal oil and gas wells and waste injection wells within and around the study area of eastern Ohio, 2021–23.
Purpose and Scope
This report describes methods and results of a two-part study designed to (1) assess water use and temporal trends and changes in streamflow, and to (2) characterize baseline water quality (2021–23) in eastern Ohio, as they relate to hydraulic fracturing and (or) other oil and gas extraction-related activities. Streamflow time-series data from eight gages were used to assess temporal trends and changes in streamflow. Water-quality data were collected at about 3-month intervals between 2021 and 2023 at eight sampling sites on streams near the eastern edge of Ohio where shale-gas drilling is particularly focused (fig. 2). Six of the sampling sites were colocated with gages whose streamflow data were used to assess temporal trends and changes in streamflow, and the other two sampling sites were colocated with other gages.
Description of Study Area
The study area is in the eastern half of the State and consists of 10 drainage basins (covering 1,373 square miles) with predominantly forest (about 41–82 percent) and agricultural (about 11–48 percent) land cover (fig. 2; table 1). The study basins lie wholly or partially in Belmont, Carroll, Coshocton, Guernsey, Harrison, Jefferson, Monroe, Muskingum, Noble, and Washington Counties, counties with histories of coal mining and vertical oil and gas drilling. These counties were some of the most active for oil and gas development in Ohio in 2021 (ODNR–OGRM, 2023b), giving watersheds in this area the potential to be affected by oil and gas drilling activities.
Table 1.
Site information for 11 sites used in analysis of water use associated with hydraulic fracturing and determination of baseline water quality in watersheds within the shale play of eastern Ohio, 2021–23.[Sites are listed in order from smallest to largest drainage area. Site types are defined as follows: F, streamflow data were collected from these sites as part of a water use associated with hydraulic fracturing assessment; QW, water-quality data were collected from these sites as part of a baseline water-quality assessment and contained shale-gas wells completed in the Utica Shale, Point Pleasant Limestone, or Marcellus Shale in their upstream drainage basins. ID, identification; USGS; U.S. Geological Survey; mi2, square mile; n.r., not reported because record was combined with station 03113990]
| Site ID (fig. 2) | USGS station number | Site name | Shortened site name | Site type | Decimal latitude | Decimal longitude | Drainage area (mi2) | Land cover type (percent) | ||
|---|---|---|---|---|---|---|---|---|---|---|
| Developed | Forest | Agriculture | ||||||||
| 1 | 03140000 | Mill Creek near Coshocton OH | Mill Creek | F1 | 40.362846 | −81.862356 | 27.2 | 6.5 | 44.6 | 48.4 |
| 2 | 03125338 | Stillwater Creek above Piedmont Lake OH | Stillwater Creek | QW | 40.084167 | −81.127222 | 37.9 | 8.5 | 41.1 | 39.3 |
| 3 | 03141870 | Leatherwood Creek near Kipling OH | Leatherwood Creek | QW, F | 39.990072 | −81.495676 | 69.5 | 7.3 | 58.3 | 28.5 |
| 4 | 03111548 | Wheeling Creek below Blaine OH | Wheeling Creek | QW, F | 40.067016 | −80.808420 | 97.7 | 9.8 | 40.7 | 43.5 |
| 5 | 03111500 | Short Creek near Dillonvale OH | Short Creek | QW, F | 40.193404 | −80.734248 | 123 | 9.2 | 52.3 | 34.8 |
| 6 | 03113990 | Captina Creek at S.R. 148 at Armstrongs Mills OH | Captina Creek | QW, F | 39.906740 | −80.935929 | 127 | 7.6 | 56.1 | 33.7 |
| n.r. | 03114000 | Captina Creek at Armstrongs Mills OH | n.r. | F | 39.908684 | −80.923984 | 134 | — | — | — |
| 7 | 03144000 | Wakatomika Creek near Frazeysburg OH | Wakatomika Creek | F1 | 40.119722 | −82.136389 | 140 | 6.3 | 54.9 | 38.3 |
| 8 | 03110000 | Yellow Creek near Hammondsville OH | Yellow Creek | QW, F | 40.537842 | −80.725078 | 147 | 6.1 | 70.8 | 20.7 |
| 9 | 03115400 | Little Muskingum River at Bloomfield OH | Little Muskingum River | QW, F | 39.563129 | −81.203724 | 210 | 6.4 | 82.1 | 10.6 |
| 10 | 03115786 | Duck Creek below Whipple OH | Duck Creek | QW | 39.508889 | −81.423056 | 260 | 7.6 | 71.8 | 17.7 |
The long-term (1988–2023) average annual precipitation was 39.1 inches at a weather station operated by the National Weather Service in Wheeling, W. Va. (USC00469482) located near the baseline water-quality study drainage basins (fig. 2; Midwestern Regional Climate Center, 2024). The baseline water quality was surveyed from June 2021 through March 2023. Annual precipitation totals during 2021–23 at station USC00469482 in Wheeling, W. Va. were 82.4, 91.3, and 110.5 percent of the long-term average (table 2).
Table 2.
Monthly and annual total precipitation, in inches, during the baseline water-quality study period compared to long-term average monthly and annual precipitation at climate station USC00469482 in Wheeling, WV.[Data are from the Midwestern Regional Climate Center cli-MATE (application tools environment; 2024). Long-term average monthly and annual precipitation is for the period of record (1988–2023). Blue shading indicates the time range of the baseline water-quality study, June 2021–March 2023. Gray shading indicates long-term average precipitation for the period of record. Jan., January; Feb., February; Mar., March; Apr., April, Aug., August; Sep., September; Oct., October; Nov., November; Dec., December; NA, not applicable]
Coal Mining
The study area lies within the Ohio coal region where more than 4 billion tons of coal have been extracted since 1800 (Wright, 2022). Lands associated with coal mines (active, remediated, and abandoned) are present in all eight drainage basins used to establish baseline water quality—although only about 0.2 percent of the Little Muskingum River (station 03115400) drainage basin contains lands associated with coal mines (fig. 4). In 2022, Belmont County was the second highest coal-producing county in Ohio (Wright, 2022). Mine drainage can increase specific conductance and concentrations of total dissolved solids, sulfate, iron, manganese, arsenic, aluminum, total carbon, and dissolved organic carbon in receiving streams and cause water quality in drainage basins to be impaired so that they do not support a normal assemblage of aquatic life (Helsel, 1983; Haefner and Simonson, 2010; Ohio Department of Natural Resources Division of Mineral Resources Management [ODNR–DMRM], 2016).
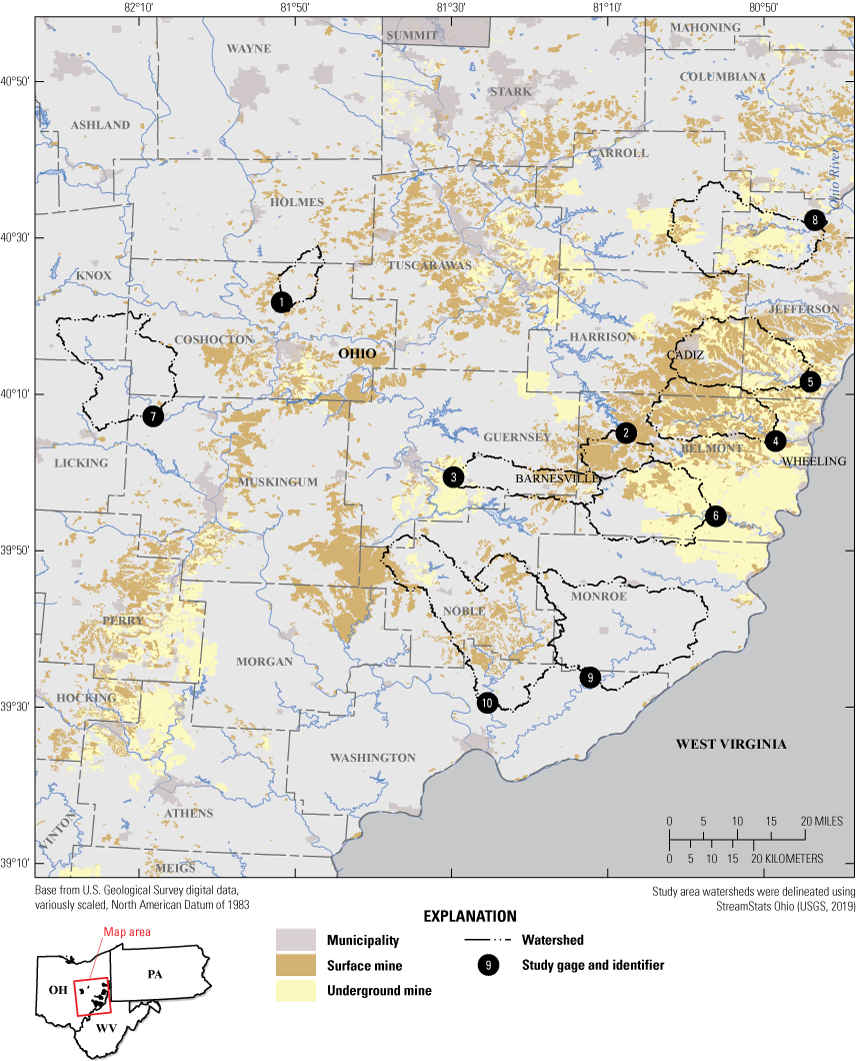
Map showing lands associated with or affected by coal mines within and around the study area of eastern Ohio, 2021–23.
Oil and Gas Drilling
Oil and gas drilling has been active in Ohio for more than 150 years (Ohio Oil & Gas Association, 2013), most recently in the eastern one-third of the State. As of March 2023, there were approximately 3,794 vertical oil and gas wells and 438 horizontal oil and gas wells in the drainage basins used to establish baseline water quality (fig. 3). Most of the vertical wells were completed in the Ohio Shale (23.6 percent; Late Devonian), Gordon Sandstone (13.0 percent; Pennsylvanian), Berea Sandstone (10.0 percent; Late Devonian), Clinton Sandstone (3.7 percent; Early Silurian), and Clinton Group (3.2 percent; Early Silurian). Most of the horizontal wells were completed in the Point Pleasant Limestone (90.4 percent), Utica Shale (8.0 percent), and Marcellus Shale (1.6 percent; ODNR–OGRM, 2023b).
Waste injection wells, depending on their type, can be used to dispose of hazardous and (or) nonhazardous fluids in deep underground porous geologic formations. Seven active and nine plugged waste injection wells are within the study basins used to establish baseline water quality—one active injection well each in the Stillwater Creek (station 03125338) and Leatherwood Creek (station 03141870) drainage basins and three plugged injection wells in the Little Muskingum River (station 03115400) drainage basin. The Duck Creek (station 03115786) drainage basin contained the most injection wells—five active and six plugged (fig. 3; ODNR–OGRM, 2023b). In addition to oil-field fluids from Ohio, fluids disposed of in Ohio injection wells may originate from out of state.
The ODNR–DMRM regulates the spreading of oil-field fluids on township roads for dust control in the State of Ohio. Within the eight drainage basins of the baseline water-quality sites, permits to spread oil-field fluids were issued during the study sampling period (2021–23) to two townships in Carroll County, two townships in Harrison County, two townships in Monroe County, three townships in Noble County, and three townships in Washington County (Wendy Booth, ODNR–OGRM, written commun., 2023).
Site Selection
Daily mean streamflow data (hereafter referred to as “daily streamflow” data) from nine USGS streamgages (hereafter referred to as “gages”) in eastern and east-central Ohio were used to assess temporal streamflow trends and changes (fig. 2; table 3). The gage on Captina Creek at Armstrongs Mills, OH (station 03114000, drainage area 134 square miles), was discontinued in 2003 and another gage (station 03113990, drainage area 127 square miles) was installed upstream later that same year. The records for the two gages on Captina Creek (stations 03113990 and 03114000) were merged into a single record intended to be representative of flows at station 03113990, effectively yielding eight gage records for analysis. Before merging the Captina Creek datasets, daily streamflows from station number 03114000 were multiplied by a simple drainage-area ratio for the two gages (127/134) to estimate streamflows from station 03113990, referred to as Captina Creek at S.R. 148 at Armstrongs Mills OH.
Table 3.
Site information for sites used in analysis of water use associated with hydraulic fracturing in watersheds within the shale play of eastern Ohio, 2021–23.[Sites are listed in order from smallest to largest drainage area. See table 1 for site specifics. Years of record determined by dividing the number of days with reported flows by 365.25. ID, identification; mi2, square mile; —, no value assigned; n.r., not reported because record was combined with station 03113990.]
| Site ID (fig. 2) | USGS station number | Begin date (mm/dd/yyyy) | End date (mm/dd/yyyy) | Years of record | Sen's slope for climatic year minimum daily mean streamflow (median percent change per year) | Sen's slope for water year median daily streamflow (median percent change per year) |
|---|---|---|---|---|---|---|
| 1 | 103140000 | 11/1/1936 | 9/30/2021 | 84.9 | 21.80 | 20.66 |
| 3 | 03141870 | 10/1/2000 | 9/30/2021 | 21.0 | 10.00 | 1.90 |
| 4 | 03111548 | 12/1/1982 | 9/30/2021 | 37.8 | 1.10 | 0.50 |
| 5 | 03111500 | 10/1/1941 | 9/30/2021 | 80.0 | 21.20 | 0.55 |
| 6 | 03113990 | 310/1/1927 | 39/30/2021 | 70.8 | 22.30 | 20.68 |
| — | 03114000 | n.r. | n.r. | n.r. | n.r. | n.r. |
| 7 | 103144000 | 10/1/1936 | 9/30/2021 | 85.0 | 0.15 | 0.40 |
| 8 | 03110000 | 10/1/1941 | 9/30/2021 | 80.0 | 21.20 | 0.56 |
| 9 | 03115400 | 10/1/1958 | 9/30/2021 | 49.0 | 0.62 | 0.92 |
Six of the gages (collectively referred to as “study gages”) have drainages that contain withdrawals for hydraulic fracturing reported to the ODNR–OGRM. Two of the streamgages, on Mill Creek (station 03140000) and Wakatomika Creek (station 03144000; referred to as “reference gages”), had no reported hydraulic fracturing withdrawals within their drainages (fig. 2; table 3). In addition to having no hydraulic fracturing withdrawals, the two reference gages were chosen because (a) their basins are close to the shale play area (the geological region in Ohio with promising potential for commercial extraction of oil and gas from its shale formations) that contains the drainage basins that had hydraulic fracturing withdrawals, (b) both had long (more than 84 years) streamflow records, and (c) their drainages contain no dams and have minimal streamflow regulation (Falcone, 2017).
Eight sites were selected for baseline water-quality sampling (fig. 2; table 1). The sampling sites, located on tributaries to the Ohio River, were selected in part because they had vertical oil and gas wells and horizontally drilled Utica Shale, Point Pleasant Limestone, or Marcellus Shale gas wells in their upstream drainage basins. The water-quality sampling sites were colocated with USGS gages that monitor streamflow and (or) stage. Six of the eight water-quality sampling sites were colocated with the same gages used to assess temporal trends and changes in streamflow.
Water Used for Hydraulic Fracturing
As previously stated, about 30–50 percent of the water injected for hydraulic fracturing is returned to the surface as “flowback.” In some cases, some of the returned fluids are recycled or reused (usually for further fracturing practices), but most of the returned fluids are disposed of by injecting them into deep geologic formations via wells that are specifically designed for that purpose (U.S. Environmental Protection Agency [EPA], 2016). Chen and Carter (2016) reported that the percentages of recycled water used for hydraulic fracturing in Ohio steadily decreased from 2011 to 2014, as did the percentage of wells put into production using recycled water.
In Ohio, between calendar years 2010 and 2019, hydraulic fracturing withdrawals were reported at 643 locations, based on hydraulic fracturing facility and water-use data provided by the Ohio Department of Natural Resources (Bradley Lodge, ODNR–Division of Water, written commun., 2022). Of those 643 locations, 366 (56.9 percent) were on streams, 205 (31.9 percent) were in reservoirs, 51 (7.93 percent) were in ponds, and 21 (3.27 percent) were from other sources such as municipal supplies.
Hydraulic fracturing withdrawals totaled about 27,168 million gallons between calendar years 2010 (the first year with reported withdrawals) and 2019. That is the equivalent volume of a rectangular column that has a base the size of an American football field including end zones (360 feet by 160 feet or 57,600 square feet) and a height of about 11.94 miles (for comparison, commercial aircraft fly at heights of about 5–7 miles). Annual hydraulic fracturing withdrawals in Ohio did not exceed 100 million gallons until 2012 (fig. 5). Consequently, the 2012 date will be treated as a potential change point when assessing trends in streamflow.
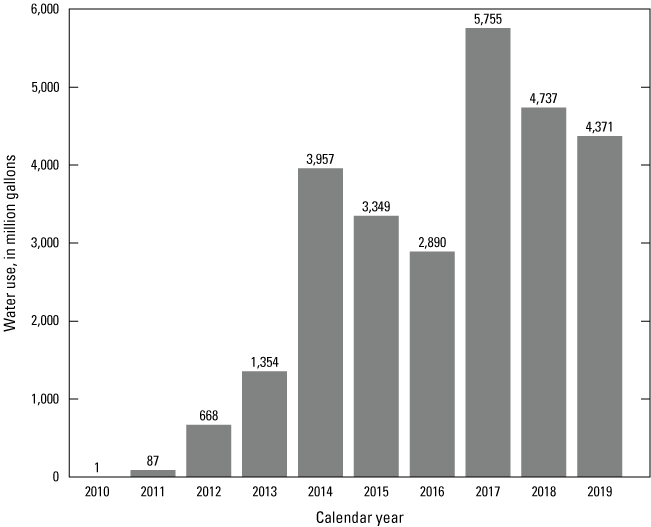
Bar graph showing annual water use for hydraulic fracturing in Ohio during calendar years 2010–19. Data are from Ohio Department of Natural Resources (Bradley Lodge, ODNR–Division of Water, written commun., 2022).
Hydraulic fracturing in the Marcellus Shale and Utica Shale (like those present in eastern Ohio) are associated with some of the highest average water uses nationally (Gallegos and others, 2015). Between 2010 and 2019, annual withdrawals for hydraulic fracturing in Ohio peaked at about 5,755 million gallons in 2017 and then decreased to about 4,371 million gallons in 2019. Between 2012 (when annual withdrawals first exceeded 100 million gallons) and 2019, average withdrawals by calendar month ranged from about 226 to 349 million gallons (fig. 6). On average, water use for hydraulic fracturing in Ohio was highest during April and May and lowest during January and December.
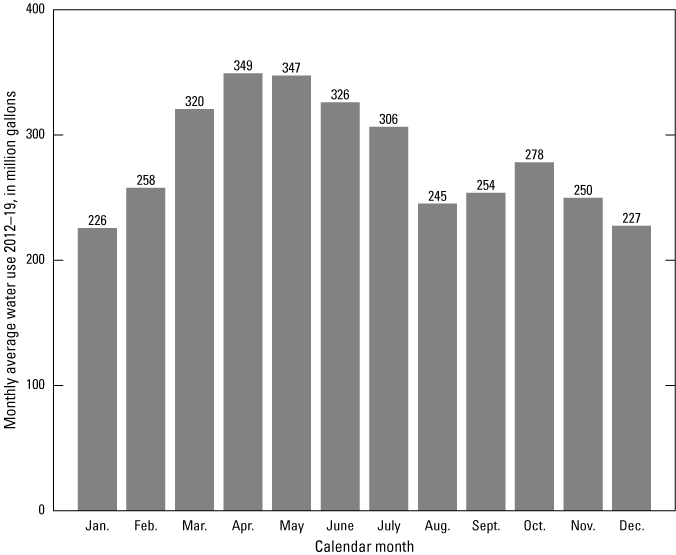
Bar graph showing monthly average water use for hydraulic fracturing in Ohio during calendar years 2012–19. Data are from Ohio Department of Natural Resources (Bradley Lodge, ODNR–Division of Water, written commun., 2022).
The national average per capita domestic water use (includes indoor and outdoor uses at residences for things such as drinking, food preparation, bathing, washing clothes and dishes, flushing toilets, watering lawns and gardens, and maintaining pools) in 2015 was about 82 gallons per day (Dieter and others, 2018). Consequently, 1 million gallons of water would supply about 12,195 person-days of water, or, in other words, it would provide the water used by a single person for a little less than 33.4 years. At the peak of hydraulic fracturing water use in Ohio (in 2017), the annual amount of water withdrawn for hydraulic fracturing (5,755 million gallons) could have supplied the average water used by a single person for over 192,150 years or supplied a small town, like St. Clairsville, Ohio, for over 38 years (based on the July 1, 2021, U.S. Census estimated population of 5,048 [U.S. Census Bureau, 2022]). To provide additional context, the city of St. Clairsville lies within the Wheeling Creek drainage basin where one of the study gages (station number 03111548) is located (fig. 2, site 4). The average streamflow at that gage in calendar year 2017 was 114 cubic feet per second (equal to about 26,893 million gallons per year), which coincidentally also happened to be the average streamflow for the period of record at the gage through the 2021 water year. So, the total amount of water use reported for hydraulic fracturing in all of Ohio in calendar year 2017 constituted only a little more than 20 percent of water passing that single study gage. Although the amount of water used for hydraulic fracturing was substantial, it still represented a small fraction of the water discharged in streams.
Streamflow Trend and Change Methods of Analysis
The “Exploration and Graphics for RivEr Trends” (EGRET) package (Hirsch and De Cicco, 2015) provides a variety of tabular and graphical outputs that can be used to evaluate whether selected streamflow characteristics are changing over time. EGRET analyses of long-term changes in streamflow characteristics are based on time-series smoothing methods pioneered by Cleveland (1979) and Cleveland and Devlin (1988). EGRET performs Locally WEighted Scatterplot Smoothing (lowess) on annual streamflow statistics (relevant to low, high, and mean flows) to produce plots that show patterns of change over time spans of about a decade or more. Lowess is a nonparametric method that can determine the coordinates of a smooth line (hereafter referred to as a “lowess smooth”) representing the central tendency of the relation between dependent and independent variables. Plotting the lowess smooth along with the annual data makes it easier to visualize how the dependent and independent variables covary. When the independent variable is time, the lowess smooth shows the central tendency of how the dependent variable has changed over time. A detailed description of the smoothing method can be found in Hirsch and others (2010).
Mann-Kendall tests (Mann, 1945) were used in some cases to assess temporal trend. The Mann-Kendall test makes no assumption about the shape of the trend (for example, whether it is linear or nonlinear) but, instead, tests whether values tend to increase or decrease overall. The null hypothesis for the Mann-Kendall test is that there is no trend in the series. Unless stated otherwise, all tests of statistical significance described in this report are based on a significance level (alpha value) of 0.05. Sen’s slope (the median of the slopes of all lines through all pairs of points) was computed to determine the median linear rate of change in the natural logarithms of annual streamflow statistics (Sen, 1968).
Quantile-Kendall plots were prepared for each study gage using the EGRET framework and methods described by Hirsch (2018). In a quantile-Kendall plot, daily streamflow nonexceedance probability is plotted versus the trend slope for streamflows associated with those probabilities. The trend slope is determined with Sen's slope (Sen, 1968) and expressed in percent change per year. Larger nonexceedance probabilities are associated with larger streamflows and smaller nonexceedance probabilities are associated with smaller streamflows. Each point in the Quantile-Kendall plot is color coded according to the p-value for a test of the null hypothesis that the trend slope is zero. Points plotted in red indicate a statistically significant likelihood that streamflows at those nonexceedance probabilities have nonzero trend slopes.
The Indicators of Hydrologic Alteration (IHA) software, version 7.1 (Nature Conservancy, 2009), was used to compute 67 potentially ecologically relevant statistical parameters from the USGS daily streamflow time series for study and reference gages. The IHA statistical parameters provide information on high, low, and median flow characteristics. This study focused on the potential impact of water use for development of hydraulic fracturing wells; therefore, only statistics related to low flows were examined because that is where the impact of water withdrawal would be most likely to be observed. The statistics examined include the following:
-
• magnitude of annual 1- and 7-day average minimum flows;
-
• frequency and duration of annual low-flow pulses;
-
• magnitude, frequency, and duration of extreme low flows during each water year; and
-
• the annual number of zero-flow days.
The classification of daily streamflow data into different flow categories was based on nonparametric criteria. The IHA software makes three passes through the daily streamflow data for each gage to assign each day to a flow class. During the first pass, each day was initially classified as a low or high flow. During the second pass, all days that were initially classified as high flows were reclassified as either a small flood, large flood, or high-flow pulse. During the third pass, some of the initial low-flow days were reclassified as extreme low flows. Flows that exceeded the 75th percentile of the daily flows for the period were classified as high flows. All flows below that level initially were classified as low flows; however, low flows were subsequently reclassified as extreme low flows if they were less than the 10th percentile of daily flows. High-flow pulses were defined as contiguous periods when the daily flow was greater than or equal to 75 percent of the flow values and low-flow pulses were defined as contiguous periods when the daily flow was less than or equal to 25 percent of the flow values. A screen capture of the Environmental Flow Component selections used in the IHA analyses is shown in figure 7. For more detail on the classification process, see the IHA user’s manual (Nature Conservancy, 2009).
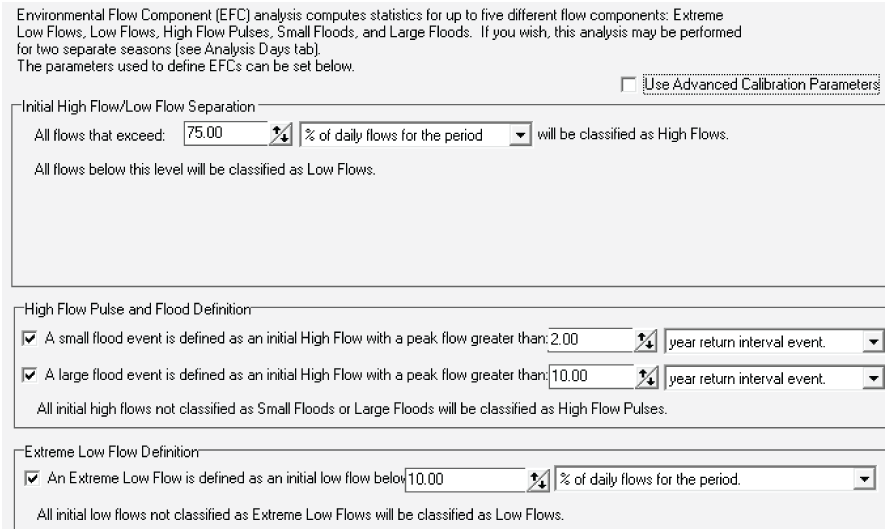
Screen capture of Environmental Flow Component settings used for the Indicators of Hydrologic Alteration analyses (Nature Conservancy, 2009).
The gages whose streamflow records were analyzed (including Captina Creek [station 03113990] where records from two gages were merged) had between 21 and 85 equivalent years of observed flows (table 3, determined by dividing the number of reported daily flows divided by 365.25 days/year) and averaged about 68.7 years. The IHA user’s manual (Nature Conservancy, 2009) suggests 20 years of record as a baseline requirement for the amount of data needed for an IHA analysis; however, it states that more years of record may be needed depending on the (1) degree of climate variability, (2) the frequency of occurrence or variability of the particular parameter, (3) the severity of the hydrologic alteration that you are trying to detect, (4) and whether the goal is to characterize the central tendency or range of interannual variability.
R language (R Core Team, 2017) scripts were developed to process outputs from the IHA analyses and create time-series plots with lowess smooths overlaid on the annual IHA statistics. The lowess smooths were used to assess temporal trends in the IHA statistical parameters. In particular, the lowess smooths were examined to see whether there was an observable change in slope of the smoothed line around 2012 when annual hydraulic fracturing water use in Ohio first exceeded 100 million gallons. If withdrawals for hydraulic fracturing began to appreciably affect flows around 2012, one might expect the annual 1- and 7-day minimum flows and the median of extreme low-flow period minimums to show indications of decline beginning around 2012. Also, metrics describing the frequency and duration of low-flow pulses and extreme low-flow periods might increase (indicating more frequent and (or) longer low-flow pulses and extreme low-flow periods) because of the withdrawals.
The daily streamflow records for each gage were also analyzed to determine daily flows associated with selected daily nonexceedance probabilities (that is, the probabilities that selected flows are not exceeded) in each water year. In the absence of persistent streamflow-altering factors such as climate change or changes in regulation, if withdrawals for hydraulic fracturing started to appreciably reduce streamflows beginning around water year 2012, then streamflows associated with at least some nonexceedance percentiles should decrease. In that case, points in a scatterplot of streamflows versus nonexceedance percentiles computed for the entire period of record should plot on or below points computed using only data from the period before water year 2012.
Streamflow Trend and Change Results
The sections “Trends in Annual Minimum and Median Daily Streamflows and Annual Daily Streamflow Nonexceedance Probabilities,” “Temporal Trends in Indicators of Hydrologic Alteration (IHA) Statistics” and “Changes in Nonexceedance Percentiles of Daily Streamflows” describe results from analyses designed to assess temporal trends in a variety of streamflow characteristics. EGRET analyses provided information on trends in climatic-year (April 1–March 31, designated by the beginning year) minimum daily streamflows, water-year (October 1–September 30, designated by the ending year) median daily streamflows, and flows over a range of nonexceedance probabilities. Analyses of statistics determined with the IHA software program provided information on temporal trends in the magnitude, frequency, and duration of a variety of low-flow characteristics. Finally, analyses of nonexceedance percentiles of daily streamflows provided information about the relative magnitude of flows in the lower quartile of daily streamflows before and after annual hydraulic fracturing water use in Ohio first exceeded 100 million gallons.
Trends in Annual Minimum and Median Daily Streamflows and Annual Daily Streamflow Nonexceedance Probabilities
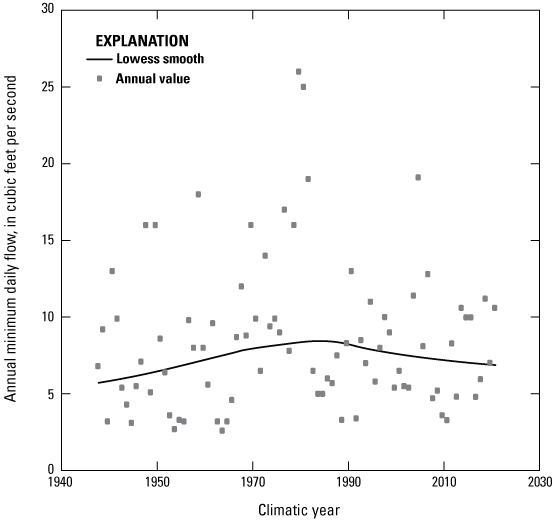
Sen’s slopes of the period of record climatic-year annual minimum daily streamflows and water year median daily streamflows were positive for all reference and study gages (table 3); however, the slopes were not statistically different than zero for some gages. Figures 8 and 9 show examples of trend plots for a study gage and a reference gage, respectively. The Sen’s slope value was statistically significant for the data shown in figure 8 but not in figure 9. Irrespective of statistical significance, the uniformly positive Sen’s slopes for the study and reference gages indicate a consistent tendency for low and median flows to have increased over the periods of record. Quantile-Kendall plots showed positive trend slopes for flows with nonexceedance probabilities of 0.90 and less for all reference and study gages (see figures 10 and 11 for example). While trend slopes were not statistically significant for all nonexceedance probabilities, these results indicate a consistent pattern for all but high flows to have increased over the periods of record at both the study and reference gages.
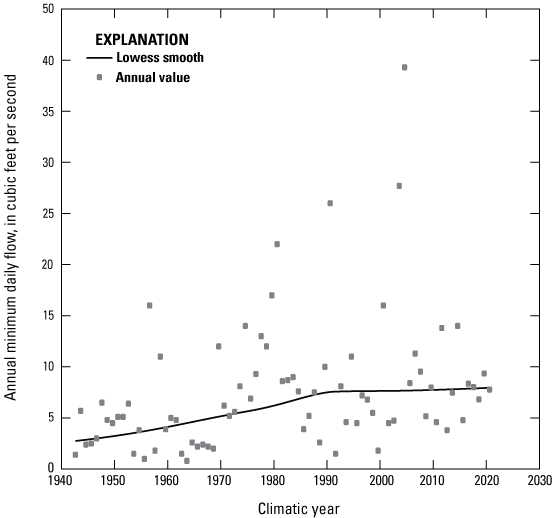
Scatterplot of annual minimum daily mean streamflow by climatic year for Yellow Creek near Hammondsville, Ohio—03110000.
Scatterplot of annual minimum daily mean streamflow by climatic year for Wakatomika Creek near Frazeysburg, Ohio—03144000.
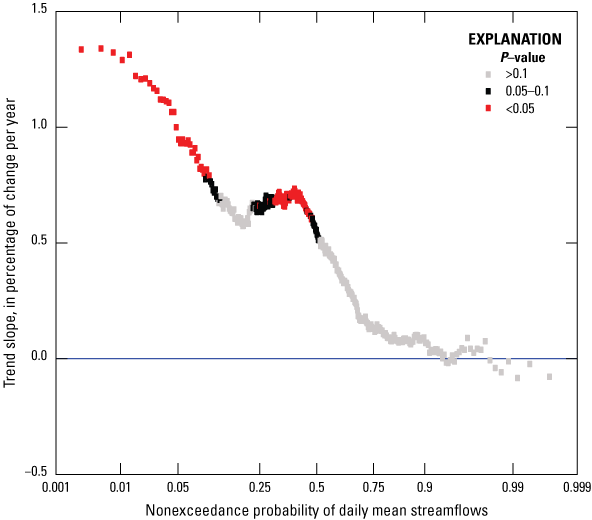
Quantile-Kendall plot for Yellow Creek near Hammondsville, Ohio—03110000.
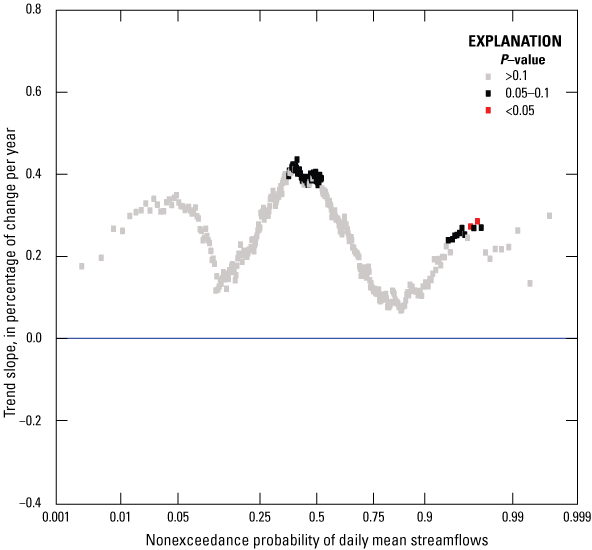
Quantile-Kendall plot for Wakatomika Creek near Frazeysburg, Ohio—03144000.
Temporal Trends in Indicators of Hydrologic Alteration (IHA) Statistics
With one exception (Little Muskingum River [station 03115400]), the slopes of lowess smooths fit to the annual 1-day and 7-day average minimum flows at all the study gages were positive since about water year 2010 (the first water year with reported hydraulic fracturing withdrawals). The exception, the Little Muskingum River (station 03115400), had a negative slope that may be an artifact of a couple of uncharacteristically high flows in the early to mid-2000s and a 13-year gap in the record between water years 1982 and 1996. In addition, the slopes of the lowess smooths fit to the annual number of low-flow pulses since 2010 were near zero or negative at four study gages (indicating no change or decreasing numbers of low-flow pulses) and positive (indicating increasing numbers of low-flow pulses) at two study gages. At the reference gages, the slopes of the lowess smooths fit to the annual number of low-flow pulses since 2010 were positive at one gage and negative at the other. Annual IHA flow statistics and R scripts to produce plots (41 per gage) showing trends in selected annual IHA statistics for all the study and reference gages are available in the accompanying data release (Koltun, 2024).
With only one exception (Leatherwood Creek [station 03141870]), the slopes of the lowess curves fit to the annual median low-flow pulse durations (in days) were negative since 2010, indicating generally decreasing low-flow pulse durations at the study and reference gages. The Leatherwood Creek (station 03141870) study gage had a positive slope; however, the indication of increasing low-flow pulse duration was weak (based on inspection of the variability of annual median low-flow pulse duration values in combination with the lowess smooth line).
For five of the six study gages and both reference gages, the slopes of lowess smooths fit to the annual median of extreme low-flow period minimum flows were positive between 2010 and 2021 (indicating increasing flows associated with extreme low-flow period minimums). The slope of the lowess smooth for Captina Creek (station 03113990) was negative for the same period, indicating extreme low-flow period minimums were decreasing; however, it is notable that the portion of the lowess smooth from 2010 to 2021 still plotted higher than most of the lowess smooth before 2010. Even though there were indications that extreme low-flow period minimums were decreasing at Captina Creek (station 03113990) between 2010 and 2021, they still tended to be higher than during most of its earlier record. Also, of note for Captina Creek (station 03113990) is the positive slope in the lowess smooth for the median day of the year associated with the extreme low-flow period minimums. The positive slope suggests that minimum flow periods at Captina Creek (station 03113990) have been gradually shifting to later in the calendar year. The slopes of the lowess curves fit to the annual number of extreme low-flow periods between 2010 and 2021 were negative (indicating decreasing numbers of extreme low-flow periods) for all reference and study gages. None of the gages experienced zero-flow days during that same period.
Changes in Nonexceedance Percentiles of Daily Streamflows
The percentage of daily streamflows that did not exceed a given streamflow magnitude is referred to as its nonexceedance percentile. Nonexceedance percentiles were computed for the reference and study gages for two time periods. The first time period was computed based on the record through water year 2011 (referred to as the “pre-2012 period”), before annual withdrawals for hydraulic fracturing exceed 100 million gallons in Ohio. The second time period was based on the entire period of record through water year 2021 (referred to as the “full period”). Scatterplots of nonexceedance percentiles less than or equal to 25 percent (the lower quartile of daily streamflows) versus streamflow were prepared for each gage record for both the pre-2012 and full periods. The streamflows associated with each nonexceedance percentile determined for the full period of record plotted at or, more commonly, above those determined for pre-2012 period for all study and reference gages (for examples, see figures 12 and 13). If low flows decreased (relative to the pre-2012 period) in the post-2011 period when withdrawals were being made for hydraulic fracturing, the percentage of observations that did not exceed a given low-flow value would increase when the two periods were combined. In fact, the opposite was observed, indicating that low flows did not decrease during the post-2011 period.
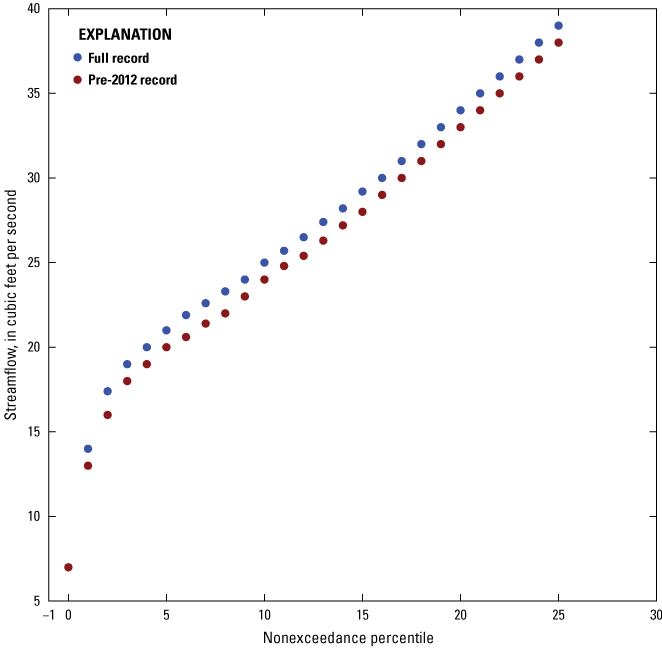
Scatterplot of full and pre-2012 period streamflows versus nonexceedance probabilities for Wheeling Creek below Blaine, Ohio—03111548.
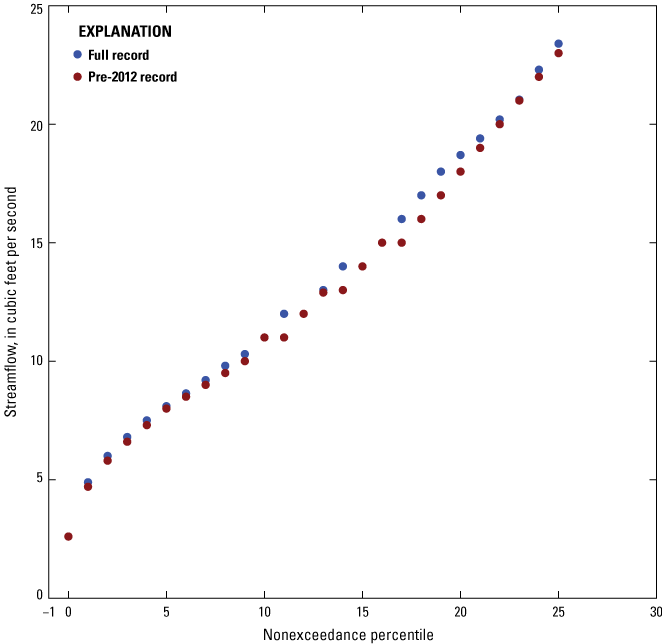
Scatterplot of full and pre-2012 period streamflows versus nonexceedance probabilities for Mill Creek near Coshocton, Ohio—03140000.
Baseline Water Quality
Previous Studies
The study area has an extensive history of coal, oil, and gas production and subsequently, several water-quality studies have been done in eastern Ohio (Pfaff and others, 1981; Engelke and others, 1981; Helsel, 1983; Jones, 1988; Sedam, 1991; Sedam and Francy, 1993; ODNR–DMRM, 2016; OEPA, 2017). More recently, the U.S. Geological Survey, in cooperation with the Muskingum Watershed Conservancy District, did a study to assess baseline (2015–16) surface-water quality at 30 surface-water sites within the Muskingum River watershed that were in the early years of shale-gas development (Covert and others, 2018).
Sampling Methods and Laboratory Analysis
Water-quality data were collected eight times at each of eight sites from June 2021 through March 2023. Sampling was done during a variety of flow conditions and included field parameters and major ions, trace elements, and nutrients (table 4). When sites were fully wadable, multiple vertical, depth-integrated, isokinetic samples were collected with a DH–81 sampler using an equal-width-increment method described in the USGS National Field Manual (USGS, variously dated). When sites were not fully wadable, multiple vertical, depth-integrated, isokinetic samples were collected from one or more points in the wadable portion of the stream or, if available, from a nearby bridge. Samples from the multiple verticals were composited in a churn splitter and then processed using standard USGS methods (USGS, variously dated; Wilde and others, variously dated). All samples were analyzed for turbidity, total dissolved solids, major ions, trace elements, nutrients, and dissolved organic carbon (table 4). Field measurements of water temperature, specific conductance, dissolved oxygen concentration, pH, and alkalinity were made onsite according to standard protocols (USGS, variously dated). Water temperature, specific conductance, pH, and dissolved oxygen were measured using YSI data sondes, and the reported value of each parameter was the median of at least three readings taken across the stream cross section. Sulfide concentration was measured in the field with a Hach DR2000 spectrophotometer by use of the methylene blue method (Hach Company, 1989) for grab samples collected in the thalweg. Turbidity was measured in the field using a portable Hach 2100P turbidimeter on a subsample of the unfiltered, composited sample (obtained from churn splitter). Alkalinity was measured in the field using a Beckman 250 pH meter on a subsample of the unfiltered, composited sample (obtained from churn splitter). Analyses for total dissolved solids, major ions, trace elements, nutrients, and dissolved organic carbon were done at the USGS National Water Quality Laboratory (NWQL) in Denver, Colorado. Analytical methods are listed in table 4.
Table 4.
Constituents and properties, reporting levels, and analytical methods used in analysis of baseline water quality in watersheds within the shale play of eastern Ohio, 2021–23.[NA, not applicable; ft3/s, cubic foot per second; °C, degrees Celsius; μS/cm, microsiemens per centimeter; mg/L, milligram per liter; NTRU, nephelometric turbidity ratio unit; ASTM, American Society for Testing and Materials; USGS, U.S. Geological Survey; CaCO3, calcium carbonate; ICP–AES, inductively coupled plasma atomic emission spectroscopy; μg/L, microgram per liter; S2–, sulfide; EPA, U.S. Environmental Protection Agency; N, nitrogen; P, phosphorus; GCM, gas chromatography/mass spectrometry]
Parameter codes are used to identify the constituent and units of measure in the USGS National Water Information System—Web Interface. Some parameter code definitions include information about the methods used to measure the constituent.
Data are from Kennedy (1984).
Data are from Wilde and others (variously dated).
Data are from U.S. Environmental Protection Agency (1993a).
Data are from Fishman and Friedman (1989).
Data are from Fishman (1993).
Data are from Standard Methods Online (2021).
Data are from Garbarino and others (2005).
Data are from Struzeski and others (1996).
Data are from Patton and Kryskalla (2011).
Data are from Zimmerman and others (1997).
Data are from U.S. Environmental Protection Agency (1993b).
Data are from Patton and Kryskalla (2003).
Data are from Brenton and Arnett (1993).
The terms “detection limits,” “reporting levels,” and “censored values” are often used in discussions of chemical concentrations. The detection limit is traditionally defined as the lowest concentration (or amount) of an analyte that can be measured and reported with 99 percent confidence that the analyte concentration is higher than zero (Electronic Code of Federal Regulations, 2018). The reporting level is the lowest measured concentration that may be reliably measured and is statistically determined (USGS–NWQL, 2015). Censored values are values less than the reporting level and are reported using a less-than sign (<) in front of the reporting level value. The analytical results are available online from the USGS National Water Information System (NWIS) database (USGS, 2023a). USGS station numbers (table 1) and parameter codes (table 4) are needed to retrieve these data.
Geospatial Analyses
Geospatial data were obtained and compiled using a geographic information system (GIS; ArcMap [Esri, 2023]) to assess potential relations between geospatial characteristics and water quality. Drainage basin boundaries for the sampling sites were delineated using StreamStats—a USGS, GIS-based web application (USGS, 2019). The drainage basins were used to aggregate and summarize land cover data and other characteristics within each sampling site’s upstream drainage basin. Summary geospatial data were divided by the drainage area of the site—producing a number per square mile—to better facilitate comparisons among sites with different sized drainage areas.
The following geospatial data types, sources, and transformations were used in analysis of:
-
Oil and gas wells (both vertical and horizontal).—Specific well types within the oil and gas database were compiled to represent only producing oil and gas wells (rather than dry holes or plugged wells). These well types included MapSymble=(1) gas, (2) gas show (meaning some gas), (3) gas with oil show, (4) gas and oil show, (5) oil, (6) oil and gas, (7) oil show, and (8) oil with gas show. Selected only records with WL_STATUS = PR, WELL_TYP = OG_R, and DT_STATUS < 3/16/2023 (ODNR–OGRM, 2023b).
-
Lands associated with surface and underground coal mines.—Four data classes were merged to calculate the percentage of lands associated with surface coal mines for each site’s drainage basin: (1) Surface Industrial Minerals (IM) Mine Operations, (2) Surface Mines, (3) Surface Coal Mine Operations, and (4) Disturbed Reclamation Land. Two data classes were merged to calculate the percentage of lands associated with underground coal mines for each site’s drainage basin: (1) Underground Mine Extents and (2) Abandoned Underground Mines (ODNR–DMRM, 2023).
-
Active and plugged waste injection wells.—Specific well types within the oil and gas database were compiled to represent only active and plugged injection wells. Plugged injection well types included (1) MapSymble = pl_injection and (2) WL_STATUS = FR or PA. Active injection well types included (1) MapSymble = injection and (2) WL_STATUS = AI (ODNR–OGRM, 2023b).
-
Wastewater treatment plants.—Specific records within the NPDES database were compiled to represent wastewater treatment plants. Permits included (1) FACILITY_N = %WWTP% (OEPA, 2023).
-
Land cover, including forest, agriculture, and developed.—Specific land cover classes within the 2021 NLCD data were compiled so that (1) forest included 41, 42, 43, 52 classes; (2) developed included 21, 22, 23, 24 classes; and (3) agriculture included 81 and 82 classes (Dewitz, 2023).
-
Township, Municipal, County, State, and Federal roads.—Specific road types within the ODOT road inventory were compiled so that ROUTE_TYPE = CR, SR, TR, MR, or US (Ohio Department of Transportation, 2023).
-
Townships with permits to spread brine.—The following townships are in Carroll County: Lee, Loudon; Harrison County: Cadiz, German; in Monroe County: Bethel, Malaga; in Noble County: Jackson, Noble, Olive; Washington: Aurelius, Fearing, Salem (Wendy Booth, ODNR–OGRM, written commun., 2023).
Statistical Analyses
Descriptive and summary statistics for censored data (those with values less than the reporting level) and uncensored data were computed in Statistical Analysis System (SAS) JMP version 14.3.0 statistical and graphing software (SAS Institute, Inc., 2023). Censored-style boxplots were created using a USGS-developed function (boxPlot.lcens/smwrQW) in RStudio software package (RStudio, Inc., 2023) to compare the range, median, and outliers of the water-chemistry data. The Wilcoxon rank-sum test (Wilcoxon, 1945) was used to test differences among median constituent concentrations in samples with a brine component versus samples containing no brine. Spearman’s rank correlation coefficients (Spearman, 1904) were used to identify correlations between water chemistry and drainage-basin characteristics that could affect water quality. The Spearman’s rank correlation coefficient is a nonparametric test that measures the strength and direction of monotonic association between two variables. The Spearman’s rank correlation coefficient is computed on the ranks of the data values instead of on the values themselves. All concentrations less than the reporting level for a constituent were assigned a single value that was less than all reported concentrations, so that ranks of values less than the reporting level were tied, yet less than the rank for the lowest measured concentration. The strength of the relation is denoted by the Greek letter rho—the closer rho is to +1 or −1, the stronger the association. Positive values of rho signify a positive correlation and negative values of rho signifies a negative correlation. For purposes of this report, the strength of the correlation between two properties or constituents is defined as follows, based on the absolute value of rho: very strong correlation 0.80–1.0; strong correlation 0.60–0.79; moderate correlation 0.40–0.59; and weak correlation 0.20–0.39.
Quality-Control Results
Quality-control (QC) samples collected during sampling consisted of blanks and replicates. Blank samples were used to check for contamination potentially introduced during sample collection, processing, equipment cleaning, or analysis. Replicate samples were used to determine the reproducibility or variability in the collection and analysis of environmental samples. All QC samples were collected and processed according to protocols described in the “National Field Manual for the Collection of Water-Quality Data” (USGS, variously dated). More detailed QC information is in appendix 1.
To ensure sample integrity and final quality of data, QC samples (one equipment blank, three field blanks, and five replicate samples) were collected for all constituents except those measured or analyzed in the field (alkalinity, bicarbonate, carbonate, dissolved oxygen, pH, specific conductance, sulfide, turbidity, and water temperature) and sent to the National Water Quality Laboratory (Covert, 2024).
Data Treatment Based on Quality-Control Results
Sampling and analytical variability were evaluated using replicate analyses. When analysis of water-quality data identified statistically significant differences between samples containing a component of brine versus samples without a brine component, the authors assessed whether the observed difference in median concentrations between groups was higher than the maximum difference in concentration between QC replicate pair samples. There were no instances of differences being the result of sampling and analytical variability rather than actual environmental differences between groups.
Baseline Water-Quality Results
This report documents the occurrences and concentrations of a suite of constituents measured between June 2021 and March 2023. Many of the measured constituents have been found to be present at elevated concentrations in sediment associated with construction of well pads, in flowback and produced waters associated with oil and gas development, or in coal-mine drainage. As part of the record of baseline conditions, water-quality data were used to assess (1) water types based on major-ion chemistry; (2) sources of salinity to streams; (3) the potential for stream water to adversely affect aquatic life; and (4) the relation between water chemistry and drainage-basin characteristics. Summary statistics are presented for physical water-quality properties and chemical analyses for streams (table 5). Complete analytical results are available online from the USGS NWISWeb database (USGS, 2023a).
Table 5.
Minimum, median, and maximum concentrations or levels of constituents and properties in streams used in analysis of baseline water quality in watersheds within the shale play of eastern Ohio, 2021–23 (USGS, 2023a).[°C, degree Celsius; µS/cm, microsiemens per centimeter; mg/L, milligram per liter; NTRU, nephelometric turbidity ratio unit; CaCO3, calcium carbonate; µg/L, microgram per liter; N, nitrogen; P, phosphorus; <, less than]
The distributions of water-quality sampling results at each sampling site were visually compared by use of boxplots (app. 2, figures 2.1A—2.1KK). Median flows were determined by using 15−minute instantaneous streamflows at the sampling sites for the entire study period (6/23/2021–3/16/2023). Evaluation of the boxplots indicated that higher-than-median concentrations or levels of several constituents and properties generally occurred in samples collected during less-than-median streamflows (denoted by black dots on boxplots) at most of the sites, as listed in table 6. Constituents and properties that were generally observed at higher values in samples collected during higher-than-median streamflows (denoted by blue dots on boxplots) include those typically associated with runoff—turbidity, aluminum, zinc, and nitrate plus nitrite (table 6).
Table 6.
Constituents and properties indicating a relation between measured value and streamflow at most sites used in analysis of baseline water quality in watersheds within the shale play of eastern Ohio, 2021–23.For these calculations, median concentration and median flow at each individual site were determined. Median flows were determined by using 15-minute instantaneous streamflows at the sampling sites for the entire study period (6/23/2021–3/16/2023). The number of samples having greater-than-median concentrations of a constituent under the specified flow conditions (either greater-than- or less-than-median) at an individual site were summed for all sites and divided by the total number of samples in the entire dataset that were collected at (1) less-than-median flow (low flow) or (2) greater-than-median flow (high flow).
Hydrologic Conditions Captured by Sampling Events
To characterize water chemistry over a range of seasons and hydrologic conditions, a total of eight samples were collected at about 3-month intervals at each of eight water-quality sampling sites. The variation in hydrologic conditions that was captured by the sampling was assessed by creating boxplots showing the distribution of the 15-minute instantaneous streamflows (or gage heights) at the sampling sites for the entire study period (6/23/2021–3/16/2023) and overlaying them with points representing the streamflows (or gage heights) at the times of sampling (fig. 14). Continuous streamflow was not determined at Stillwater Creek (station 03125338) during the study period, so its sampled variation is shown using gage heights in figure 14. Streamflows (and gage heights for Stillwater Creek [station 03125338]) at the times of sampling were distributed throughout the box representing the interquartile range (the range containing 50 percent of the observed instantaneous values), and frequently extended a little above and below the interquartile range. That indicates that although sampling did not capture the extremes in flow (both high and low), it did capture a wide range of flows, typically including one or more streamflows in the first and fourth quartile of streamflows that occurred during the sampling period.
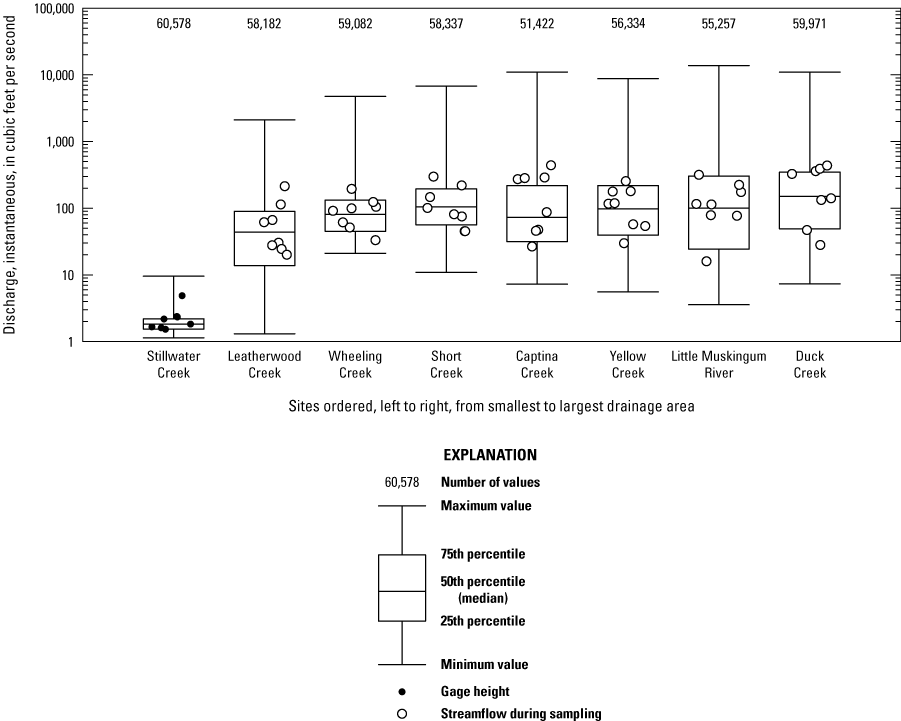
Boxplots showing the distribution of 15-minute instantaneous streamflows (or gage heights) for the study period (6/23/2021–3/16/2023) overlaid with points representing the streamflows (or gage heights) at the times of sampling to characterize baseline water quality in selected watersheds within the shale play of eastern Ohio.
Water Types Based on Major Ions
Patterns in major-ion composition at eight sampling sites were examined by constructing trilinear diagrams (fig. 15). This type of diagram uses the relative percentages of major cations and anions to classify water types (Hem, 1985). The study samples were plotted with two other sources of water (oil and gas brines and samples affected by road salt) to provide context. Data for brines originating from vertical (58 brine samples from Blondes and others, 2018) and horizontal (2 Marcellus Shale brines [AppMSB16–17] and 20 Utica Shale brines [AppMSB36–55] from Blondes and others, 2020) oil- and gas-drilling activities in Ohio and Pennsylvania (hereafter referred to as “oil and gas brines”) were plotted on the trilinear diagram as points of reference, as were results for water samples affected by road salt. Horizontal well brines did not have bicarbonate values, but, typically, because of the high concentrations of chloride in brines, the relative percentage makeup of chloride compared to bicarbonate for total anions is enough to mask most bicarbonate value differences where brine samples are plotted. To put this in perspective, all but one of the vertical brines had bicarbonate percentages of 0.001 to 0.3 (not including the maximum value of 4.4 percent). For the purposes of this study, it was acceptable to use the horizontal brine data (without bicarbonate values) that plot in the middle of the linear pattern of oil and gas brines (indicated as grey squares) in the upper diamond graph of figure 15. The water samples affected by road salt included a sample of road salt runoff from beneath a bridge in Western Springs, Illinois (sample RS–2 in table 2 of Panno and others [2005]) and samples of groundwater collected from monitoring wells at a salt-storage facility in Valparaiso, Indiana (wells TW–2, TW–94D, TW–94E, MW–3, MW–4, MW–5, and MW–7 in table 1 of Risch and Robinson [2000]). The samples that plot close to the oil and gas brines or road salt-affected samples have a higher proportion of sodium and chloride ions than other stream samples and might contain a component of road salt or oil-field brine.
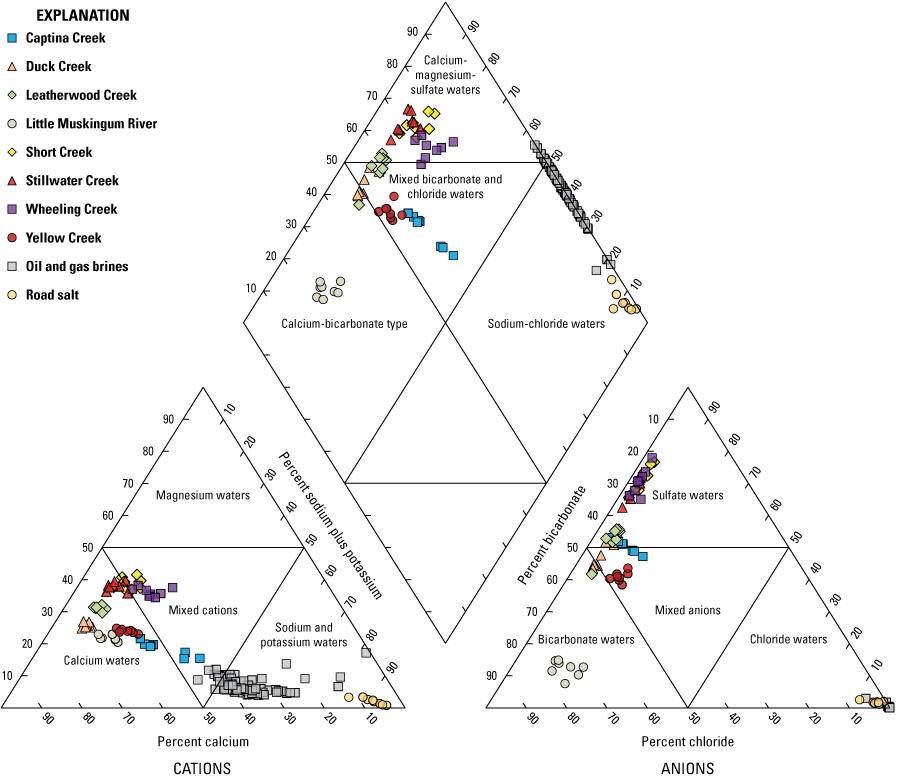
Major cation and anion percentages for water-quality samples collected from the 8 sites used in analysis of baseline water quality in watersheds within the shale play of eastern Ohio, 2021–23.
The trilinear diagrams showed that samples from Short Creek (station 03111500), Stillwater Creek (station 03125338), and Wheeling Creek (station 03111548) were calcium-magnesium-sulfate-type waters (hereafter referred to as “sulfate-type waters”; fig. 15). The highest specific conductance (higher than 756 microseimens per cm [µS/cm]), elevated concentrations of total dissolved solids (higher than 541 milligrams per liter [mg/L]), sulfate (higher than 254 mg/L), calcium (higher than 93 mg/L), and magnesium (higher than 40 mg/L) relative to other samples were observed in the sulfate-type waters. A relation between elevated sulfate concentrations and coal-mine drainage was determined in past studies (Helsel, 1983; Haefner and Simonson, 2010). Surface and underground coal mines are prevalent in the region (fig. 4). The Ohio Department of Natural Resources, Abandoned Mine Land Program assessed drainage basins in Ohio that were impacted by abandoned mine lands (ODNR–DMRM, 2016). The program developed criteria (table 6 of ODNR–DMRM, 2016) to identify and assess the severity of mining impacts based on concentrations of eight water-quality constituents and properties. For the purposes of this study, describing severity of impact was not an objective, and therefore, if any constituent concentration for a site met one of the ODNR–DMRM criteria for mild, moderate, or severe mine drainage, then the site could be classified as “mine impacted.” Sulfate values for seven of the eight sites in the baseline water-quality analysis fell into one of the mild, moderate, or severe mine drainage impact categories of the ODNR–DMRM criteria. The only exception was Little Muskingum River (station 03115400) with sulfate concentrations (12.1 to 19.4 mg/L) less than 76 mg/L (table 6 of ODNR–DMRM, 2016), which is considered to have “no detectable mine drainage impact.”
The trilinear diagrams also showed that samples from Little Muskingum River (station 03115400) were the only calcium-bicarbonate-type waters (fig. 15). Most of the remaining samples were mixed bicarbonate-chloride-type waters and included Captina Creek (station 03113990), Yellow Creek (station 03110000), and a few samples each from various other drainage basins (fig. 15).
The oil and gas brines and road salt-affected waters are sodium-chloride-type waters. Ion compositions enriched in chloride and sodium plus potassium relative to the other surface-water samples were observed in a few samples at Captina Creek (station 03113990; depicted as light blue squares in figure 15), indicating a chemistry intermediate between that of calcium-bicarbonate waters and oil and gas brines or road salt—best seen on the cations triangle (lower left) of figure 15. The highest chloride concentration (44.2 mg/L) among all sites was measured in a sample collected at Captina Creek (station 03113990). These samples at Captina Creek (station 03113990) might contain a component of oil-field brine or road salt.
Sources of Salinity
Binary mixing curves (fig. 16) were prepared following methods described in Whittemore (1988) to help identify samples with components of oil-field brine or saturated halite (road salt) solution (should they exist). The binary mixing curves show how the chloride:bromide (Cl:Br) ratio of dilute stream water would change with the addition of increasing amounts of two concentrated solutions—oil-field brine and saturated halite (road salt) solution. The brine and halite solutions and the dilute, unaffected stream water are referred to as “endmembers” because they represent the starting and stopping points of the possible mixing process. Data from the eight sites used in the analysis of baseline water quality were plotted with the binary mixing curves to evaluate whether any samples were representative of road salt or brine endmembers (fig. 16). The Cl:Br ratios of the brine endmembers were determined using chemical data from multiple samples of oil and gas brines produced from the Berea Sandstone and Clinton Formation, which are two of the primary target formations for vertical wells drilled in the study area (Blondes and others, 2018), as well as from the Utica Shale (Blondes and others, 2020). Two road salt endpoints were used to show a range of possible concentrations. The uppermost Cl:Br value for the road salt endpoint (depicted as a light blue square in [fig. 16]) is road salt runoff collected beneath a bridge in Western Springs, Ill. (Panno and others, 2005). The lesser road salt endpoint (depicted as a yellow square in [fig. 16]) was computed as the mean of three samples of road salt applied in northeastern Ohio (collected by Knuth and others, 1990). The light blue square shown between these two values represents a concentrated saline solution made by Panno and others (2005) from road salt collected at an Illinois Department of Transportation salt-storage facility. The area designated as dilute water in (fig. 16) is based on the maximum chloride concentration (12 mg/L) and the maximum Cl:Br ratio (521) reported by Panno and others (2005) for samples of Midwestern precipitation, soil water, and groundwater deemed to be unaffected by sodium chloride contamination.
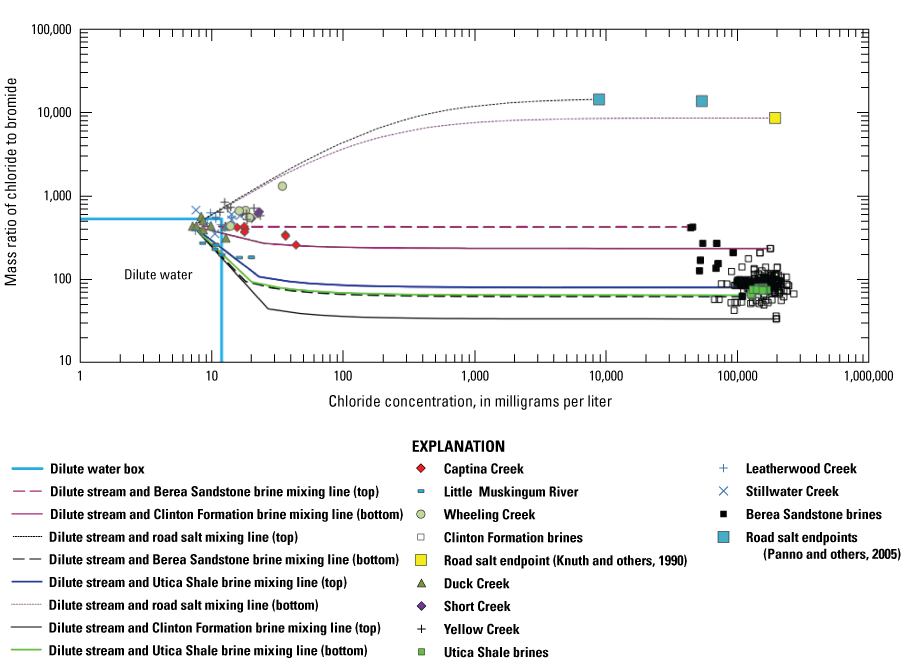
Binary mixing curves for chloride-to-bromide ratios from eight sites used in analysis of baseline water quality in watersheds within the shale play of eastern Ohio, 2021–23.
Water samples collected as part of this baseline study in which uncensored bromide concentrations were observed are plotted on figure 16. Twenty-four samples (representing all sites except Little Muskingum River [station 03115400]) plotted outside of the dilute water region and between the bounds of the lower road salt (depicted as dotted black line) and upper Berea Sandstone brine mixing curves (depicted by dashed black line; figure 16). Panno and others (2005) determined that septic effluent, wastewater treatment plant effluent, animal wastes, and water from field tiles (agricultural subsurface drainage systems) plots between the brine and road salt mixing curves.
Eleven samples from four sites showed a component of brine in the binary mixing curves. These samples plotted outside of the dilute water region and within the bounds of the upper and lower mixing curves, between dilute water and brines from the Clinton Formation (depicted by solid black lines) and Berea Sandstone (depicted by dashed black lines). No samples plotted inside of the Utica Shale mixing curves (depicted by solid green lines). Captina Creek (station 03113990) had six samples (depicted as red diamonds) with a component of brine. Three samples (depicted as light blue dashes) from Little Muskingum River (station 03115400) plotted within the bounds of the Berea Sandstone and Clinton Formation brine mixing curves (fig. 16). Single samples from two other sites plotted within the bounds of the Berea Sandstone and Clinton Formation brine mixing curves—Leatherwood Creek (station 03141870; denoted by plus sign) and Duck Creek (station 03115786; denoted by triangle; fig. 16). Based on binary mixing calculations, the maximum percentage of brine input denoted by these samples is less than one percent—0.08 percent—Berea Sandstone brine, and 99.92 percent dilute water.
The Wilcoxon rank-sum test was used to test differences between median constituent concentrations for samples with a component of brine (11 samples) and samples containing no brine (42 samples; figs. 17A, B, C, and D). Results indicated statistically significant differences between median concentrations of bromide, chloride, arsenic, and barium for sites with and without a component of brine in their drainage areas (table 7). Boxplots for these constituents showed higher median concentrations at sites with a component of brine in their drainage areas compared to sites without a component of brine (figs. 17A, B, C, and D). It should be noted that the increased concentrations of constituents in samples containing a component of brine does not necessarily mean that the elevated concentrations were caused by the brine.
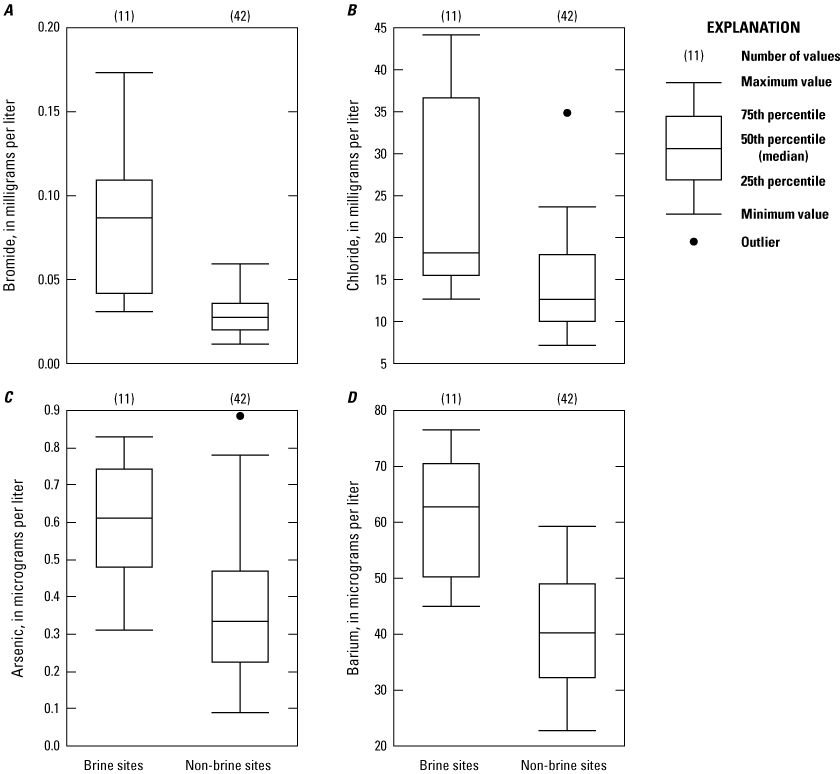
Constituent concentrations that differed at a statistically significant level (p-value <0.05) between samples with and without a component of brine at sites used in analysis of baseline water quality in watersheds within the shale play of eastern Ohio, 2021–23. A, bromide; B, chloride; C, arsenic; and D, barium.
Table 7.
Wilcoxon rank-sum test Z-values and p-values between median concentrations of selected constituents for samples with and without a component of brine at sites used in analysis of baseline water quality in watersheds within the shale play of eastern Ohio, 2021–23.[Categories were compared using the Wilcoxon rank-sum test. Constituents that were different at a p-value of <0.05 are shown. Z-value, standard score or number of standard deviations an element is from the mean; P-value, statistical significance of a test result based on Z-value; <, less than]
OEPA Aquatic Life Use Criteria
Measured pH and constituent concentrations at the eight sampling sites were compared to OEPA aquatic life use criteria based on beneficial use designations to assess the potential for adversely affecting stream biota (table 8). Stillwater Creek (station 03125338), Leatherwood Creek (station 03141870), Wheeling Creek (station 03111548), Short Creek (station 03111500), and Duck Creek (station 03115786) are designated as warmwater habitat (WWH), while Captina Creek (station 03113990) and Yellow Creek (station 03110000), as well as Little Muskingum River (station 03115400), are designated as exceptional warmwater habitat (EWH; Ohio Administrative code 3745–1–24 [LAWriter Ohio Laws and Rules, 2023a]). If a constituent or property is not included in table 8, the OEPA has not established an aquatic life use criterion for that constituent or property. The results of the baseline assessment of surface-water quality in the study area showed no exceedances of aquatic life use criteria as contained in Ohio Administrative Code 3745–1–35 (LAWriter Ohio Laws and Rules, 2023b).
Table 8.
Ohio Environmental Protection Agency aquatic life use criteria and exceedances used in analysis of baseline water quality in watersheds within the shale play of eastern Ohio, 2021–23.[Exceedance, criteria were not met; OMZM, outside mixing zone minimum; OMZA, outside mixing zone average; %, percent; <, less than; WWH, warmwater habitat site designation; EWH, exceptional warmwater habitat site designation; NA, not applicable; °C, degrees Celsius; mg/L, milligram per liter; μg/L, microgram per liter; e, the base e exponential function; ln H, the natural logarithm of the water hardness; N, nitrogen]
The criteria at a water hardness of 350 mg/L calcium carbonate are used for water hardness greater than 350 mg/L.
The criteria at a water hardness of 400 mg/L calcium carbonate are used for water hardness greater than 400 mg/L.
Found in tables 35–2 (WWH) and 35-3 (EWH) of Ohio Administrative Code 3745–1–35 (LAWriter Ohio Laws and Rules, 2023b).
Relation Between Water Chemistry and Drainage-Basin Characteristics
Spearman’s rank correlation coefficients were used to identify correlations between water chemistry and selected drainage-basin characteristics that could affect water quality (tables 9 and 10). Spearman’s rank correlation coefficients were calculated using median water-chemistry values for each site and drainage-basin characteristics that included (1) the density of producing vertical oil and gas wells, (2) the density of producing horizontal gas wells that were tapped into the Utica Shale, Point Pleasant Limestone, and Marcellus Shale, (3) the density of active and plugged injection wells, (4) the density of wastewater treatment plants, (5) the percentage of lands associated with underground coal mines, (6) the percentage of lands associated with surface coal mines, (7) the density of road miles, (8) the percentage of township lands with permits to spread brine for dust control, and (9) the percentage of land cover for agriculture, developed, and forest. In the “Summary and Discussion” section, only significant positive correlations are mentioned. A positive correlation means that as the drainage basin characteristic increases (either in density or percentage), so does the median concentration or level of the constituent or property. Caution must be used when interpreting the correlations, because correlations were among the drainage-basin characteristics themselves (table 11).
Table 9.
Environmental and drainage-basin characteristics compiled by upstream drainage basin used in analysis of baseline water quality in watersheds within the shale play of eastern Ohio, 2021–23.[Sites are listed in order by smallest to largest drainage area. See table 1 for site specifics. Utica, Point Pleasant, or Marcellus refers to a well completed in the Utica Shale, Point Pleasant Limestone, or Marcellus Shale. Numbers in parentheses are densities per square mile; ID, identification; USGS, U.S. Geological Survey; &, and; mi2, square mile; %, percent]
| Site ID (fig. 2) | Producing vertical oil & gas wells1 | Producing oil and gas wells that are tapping Utica, Point Pleasant, or Marcellus 1 | Active and plugged waste injection wells1 | Wastewater treatment plants2 | Lands associated with underground coal mines (%)3 | Lands associated with surface coal mines (%)3 | Total road miles4 | Township lands with permits to spread brines for dust-control (%)5 |
|---|---|---|---|---|---|---|---|---|
| 2 | 27 (0.712) | 24 (0.633) | 1 (0.026) | 0 | 3.0 | 58.3 | 141 (3.720) | 0.0 |
| 3 | 154 (2.216) | 47 (0.676) | 1 (0.014) | 2 (0.029) | 4.3 | 16.8 | 214 (3.079) | 0.0 |
| 4 | 113 (1.157) | 51 (0.522) | 0 | 5 (0.051) | 57.5 | 52.0 | 375 (3.838) | 0.0 |
| 5 | 112 (0.911) | 15 (0.122) | 0 | 4 (0.033) | 49.1 | 40.5 | 427 (3.472) | 9.6 |
| 6 | 115 (0.91) | 98 (0.772) | 0 | 2 (0.016) | 56.0 | 9.0 | 426 (3.354) | 1.9 |
| 8 | 110 (0.748) | 133 (0.905) | 0 | 0 | 29.8 | 7.4 | 411 (2.796) | 27.6 |
| 9 | 1846 (8.790) | 41 (0.195) | 3 (0.014) | 0 | 0.0 | 0.2 | 692 (3.295) | 9.5 |
| 10 | 1317 (5.065) | 29 (0.112) | 11 (0.042) | 1 (0.004) | 2.2 | 14.1 | 898 (3.454) | 37.6 |
Data are from Ohio Department of Natural Resources Division of Oil & Gas Resources Management (2023b).
Data are from Ohio Environmental Protection Agency (2023).
Data are from Ohio Department of Natural Resources Division of Mineral Resources Management (2023).
Data are from Ohio Department of Transportation (2023).
Table 10.
Spearman’s rank correlation coefficients between median concentrations or levels of constituents and drainage-basin characteristics in watersheds within the shale play of eastern Ohio, 2021–23.[Utica, Point Pleasant, or Marcellus well, refers to a well completed in the Utica Shale, Point Pleasant Limestone, or Marcellus Shale. %, percentage of drainage area; -, negative]
Table 11.
Spearman’s rank correlation coefficients for drainage-basin characteristics in watersheds within the shale play of eastern Ohio, 2021–23.[Utica, Point Pleasant, or Marcellus well, refers to a well completed in the Utica Shale, Point Pleasant Limestone, or Marcellus Shale. %, percentage of drainage area; −, negative]
Table 10 shows correlations between water chemistry and selected drainage-basin characteristics for the eight sites used in the analysis of baseline water quality. There were no statistically significant correlations between the density of vertical or horizontal wells and median characteristic values. Median parameter values were predominantly positively correlated with the density of wastewater treatment plants and the percentage of land associated with surface mines and predominantly negatively correlated with township lands with permits to spread brines.
Summary and Discussion
Water Use and Changes in Streamflow
Between calendar years 2010 and 2019, hydraulic fracturing withdrawals were reported in 643 locations, with streams and reservoirs being the most common sources for withdrawals (Bradley Lodge, ODNR–Division of Water, written commun., 2022). Annual withdrawals for hydraulic fracturing in Ohio totaled about 27,168 million gallons between 2010 and 2019. Annual withdrawals peaked at about 5,755 million gallons in 2017 and then decreased to about 4,371 million gallons in 2019. Average withdrawals by calendar month ranged from about 226 to 349 million gallons, with April and May typically being the highest withdrawal months—January and December being the lowest.
Water withdrawn within a drainage basin for hydraulic fracturing may or may not be detectable in a streamgage’s record depending on factors such as the proximity of the gage to the withdrawal location(s), the magnitude of the withdrawal(s) relative to the magnitude of the streamflow, and whether the withdrawal(s) were made from streams instead of ponds or reservoirs. Withdrawals made from ponds or reservoirs may have no detectable impact on downstream flows depending on the outlet characteristics of the pond or reservoir and (or) if outflow from the pond or reservoir is regulated. Other factors, such as changes in other sources of water use, discharges within the drainage basins, or changing climate also can confound the ability to detect streamflow changes caused by hydraulic fracturing withdrawals.
The amount of water used for hydraulic fracturing in Ohio was substantial but represented a small fraction of the water discharged in streams. The environmental impact of those withdrawals was not evaluated in this study. The reader is referred to Dieter and others (2018) for a brief discussion of some potential environmental impacts associated with hydraulic fracturing, including issues surrounding water availability, water quality, and the disposal of wastewater and associated potential for seismicity.
Daily streamflow data from nine USGS gages in eastern and east-central Ohio were used to assess temporal streamflow trends and changes. The records for two gages on Captina Creek (stations 03113990 and 03114000) were merged into a single record intended to be representative of flows at the Captina Creek (station 03113990) gage in current (2023) operation. Two of the gages that had no hydraulic fracturing withdrawals within their drainages were used as “reference gages.” The remaining streamgages (referred to as “study gages”) had hydraulic fracturing withdrawals within their drainages.
Sen’s slopes of the period of record annual minimum and median daily streamflows were positive for all reference and study gages, indicating a consistent tendency for low and median flows to have increased over the periods of record. In addition, the trend slopes were positive for all flows with nonexceedance probabilities of 0.90 and less for all reference and study gages. These results indicate a consistent pattern for all but high flows to have increased over the periods of record at both the study and reference gages.
The Indicators of Hydrologic Alteration (IHA) software (Nature Conservancy, 2009) was used to compute annual values of 67 potentially ecologically relevant statistics from daily streamflow time series for the study and reference gages. Analyses of annual IHA statistics showed no general indication that low flows or extreme low flows have gotten lower, become more frequent, or increased in duration since 2010, when records for hydraulic fracturing water withdrawals began. In fact, in almost all cases, the opposite was indicated.
Analyses of nonexceedance percentiles of daily streamflows from reference and study gages indicated flows in the lower quartile of nonexceedance percentiles were typically larger for the period of record than for the pre-2012 record (before annual withdrawals for hydraulic fracturing exceeded 100 million gallons in Ohio). This indicates that low flows did not decrease during the post-2011 period when hydraulic fracturing water withdrawals were occurring. It is possible that the higher discharges for the low flows at both study and reference gages reflect the results of shorter-term climate fluctuations or possibly more permanent changes in climate. In either case, reductions in streamflow caused by hydraulic fracturing withdrawals (if measurable at the gages) appear to have been more than offset by wetter climatic conditions.
Baseline Water Quality
Lands associated with coal mines are prevalent in the study area region. Sulfate values for seven of the eight sites in the baseline water-quality analysis indicated some degree of mine drainage impact based on ODNR–DMRM criteria. The only exception was Little Muskingum River (station 03115400). Because of the potential impacts from mine drainage at these seven streams, the use of constituents such as specific conductance, total dissolved solids, sulfate, iron, manganese, arsenic, total carbon, and dissolved organic carbon as indicators of oil and gas influence was complicated.
Wheeling Creek (station 03111548), Short Creek (station 03111500), and Stillwater Creek (station 03125338) had the highest maximum specific conductance values and the highest median concentrations of total dissolved solids and sulfate. Stillwater Creek (station 03125338) also had the highest maximum (223 μg/L) and median (183 μg/L) concentration of manganese. These three sites were classified as sulfate-type waters based on major-ion chemistry and have some of the highest percentages of lands associated with surface and underground coal mines in their drainage basins—a potential source for these elevated values.
Trilinear diagrams also revealed that a few samples at Captina Creek (station 03113990) had a chemistry intermediate between that of calcium-bicarbonate-type waters and oil and gas brines or road salt and might contain a component of oil-field brine or road salt. Sources of chloride in water samples were also evaluated using binary mixing curves and ratios of chloride-to-bromide. These ratios indicated that 11 samples from 4 sites (Captina Creek [station 03113990], Little Muskingum River [station 03115400], Leatherwood Creek [station 03141870], and Duck Creek [station 03115786]) likely contained a component of brine from the Clinton Formation or Berea Sandstone. Captina Creek (station 03113990) had the most samples (six) with a component of brine. The other three sites with samples having a component of brine, potentially indicative of oil and gas contamination, all had brine injection wells in their upstream drainages as well as having the top three highest densities of vertical oil and gas wells. Concentrations of arsenic, barium, bromide, and chloride were statistically higher in samples with a component of brine than in samples without a component of brine.
The results of the baseline assessment of surface-water quality in the study area showed no exceedances of OEPA aquatic life use criteria. Spearman’s rank correlation coefficients indicated no significant positive correlations with the density of vertical or horizontal oil and gas wells.
References Cited
Blondes, M.S., Gans, K.D., Engle, M.A., Kharaka, Y.K., Reidy, M.E., Saraswathula, V., Thordsen, J.J., Rowan, E.L., and Morrissey, E.A., 2018, U.S. Geological Survey National Produced Waters Geochemical Database v.2.3: U.S. Geological Survey data release, accessed August 2023 at https://doi.org/10.5066/F7J964W8.
Blondes, M.S., Shelton, J.L., Engle, M.A., Trembly, J.P., Doolan, C.A., Jubb, A.M., Chenault, J.C., Rowan, E.L., Haefner, R.J., and Mailot, B.E., 2020, Utica shale play oil and gas brines—Geochemistry and factors influencing wastewater management: Environmental Science & Technology, v. 54, no. 21, p. 13917–13925, accessed August 2023 at https://doi.org/10.1021/acs.est.0c02461.
Brenton, R.W., and Arnett, T.L., 1993, Methods of analysis by the U.S. Geological Survey National Water Quality Laboratory—Determination of dissolved organic carbon by UV-promoted persulfate oxidation and infrared spectrometry: U.S. Geological Survey Open-File Report 92–480, 12 p., accessed June 2023 at https://doi.org/10.3133/ofr92480.
Chen, H., and Carter, K.E., 2016, Water usage for natural gas production through hydraulic fracturing in the United States from 2008 to 2014: Journal of Environmental Management, v. 170, p. 152–159. accessed July 2022 at https://doi.org/10.1016/j.jenvman.2016.01.023.
Cleveland, W.S., 1979, Robust locally weighted regression and smoothing scatterplots: Journal of the American Statistical Association, v. 74, no. 368, p. 829–836 accessed July 2022 at https://doi.org/10.1080/01621459.1979.10481038.
Cleveland, W.S., and Devlin, S.J., 1988, Locally weighted regression—An approach to regression analysis by local fitting: Journal of the American Statistical Association, v. 83, no. 403, p. 596–610 accessed July 2022 at https://doi.org/10.1080/01621459.1988.10478639.
Covert, S.A., 2024, Data from quality-control equipment blanks, field blanks, and field replicates for baseline water quality in watersheds within the shale play of eastern Ohio, 2021–23: U.S. Geological Survey data release, https://doi.org/10.5066/P1EDHXB9.
Covert, S.A., Jagucki, M.L., and Huitger, C.A., 2018, Baseline water quality of an area undergoing shale-gas development in the Muskingum River watershed, Ohio, 2015–16: U.S. Geological Survey Scientific Investigations Report 2018–5113, 129 p., accessed August 2023 at https://doi.org/10.3133/sir20185113.
Dewitz, J., 2023, National Land Cover Database (NLCD) 2021 Products: U.S. Geological Survey data release, accessed December 2023 at https://doi.org/10.5066/P9JZ7AO3.
Dieter, C.A., Maupin, M.A., Caldwell, R.R., Harris, M.A., Ivahnenko, T.I., Lovelace, J.K., Barber, N.L., and Linsey, K.S., 2018, Estimated use of water in the United States in 2015: U.S. Geological Survey Circular 1441, 65 p., accessed July 2022 at https://doi.org/10.3133/cir1441. [Supersedes USGS Open-File Report 2017–1131.]
Electronic Code of Federal Regulations, 2018, Title 40—Protection of the environment, Part 136—Guidelines establishing test procedures for the analysis of pollutants: accessed January 14, 2024, at https://ecfr.io/Title-40/pt40.32.136.
Engelke, M.J., Jr., Roth, D.K., and others, 1981, Hydrology of Area 7, Eastern Coal Province, Ohio: U.S. Geological Survey Open-File Report 81–815, 60 p. accessed August 2023 at https://doi.org/10.3133/ofr81815.
Falcone, J.A., 2017, U.S. Geological Survey GAGES-II time series data from consistent sources of land use, water use, agriculture, timber activities, dam removals, and other historical anthropogenic influences: U.S. Geological Survey data release, accessed July 2022 at https://doi.org/10.5066/F7HQ3XS4.
Fishman, M.J., ed., 1993, Methods of analysis by the U.S. Geological Survey National Water Quality Laboratory—Determination of inorganic and organic constituents in water and fluvial sediments: U.S. Geological Survey Open-File Report 93–125, 217 p., accessed August 2023 at https://pubs.usgs.gov/of/1993/0125/report.pdf.
Fishman, M.J., and Friedman, L.C., eds., 1989, Methods for determination of inorganic substances in water and fluvial sediments (3d edition): U.S. Geological Survey Techniques of Water-Resources Investigations, book 5, chap. A1, 545 p., accessed August 2023 athttp://https://pubs.usgs.gov/twri/twri5-a1/.
Gallegos, T.J., Varela, B.A., Haines, S.S., and Engle, M.A., 2015, Hydraulic fracturing water use variability in the United States and potential environmental implications: Water Resources Research, v. 51, no. 7, p. 5839–5845. accessed July 2022 at https://doi.org/10.1002/2015WR017278.
Garbarino, J.R., Kanagy, L.K., and Cree, M.E., 2005, Determination of elements in natural-water, biota, sediment, and soil samples using collision/reaction cell inductively coupled plasma-mass spectrometry: U.S. Geological Survey Techniques and Methods, book 5, chap. B1, 88 p., accessed August 2023 at https://pubs.usgs.gov/tm/2006/tm5b1/PDF/TM5-B1.pdf.
Gregory, K.B., Vidic, R.D., and Dzombak, D.A., 2011, Water management challenges associated with the production of shale gas by hydraulic fracturing: Elements (Quebec), v. 7, no. 3, p. 181–186. accessed July 2022 at https://doi.org/10.2113/gselements.7.3.181.
Haefner, R.J., and Simonson, L.A., 2010, Summary of hydrologic data for the Tuscarawas River Basin, Ohio, with an annotated bibliography: U.S. Geological Survey Scientific Investigations Report 2010–5010, 115 p. accessed August 2023 at https://doi.org/10.3133/sir20105010.
Helsel, D.R., 1983, Mine drainage and rock type influences on eastern Ohio stream water quality: Journal of the American Water Resources Association, v. 19, no. 6, p. 881–888, accessed August 2023 at https://doi.org/10.1111/j.1752-1688.1983.tb05936.x.
Hem, J.D., 1985, Study and interpretation of the chemical characteristics of natural water: U.S. Geological Survey Water-Supply Paper 2254, 263 p., accessed August 2023 at https://doi.org/10.3133/wsp2254.
Hirsch, R.M., Moyer, D.L., and Archfield, S.A., 2010, Weighted regressions on time, discharge, and season (WRTDS), with an application to Chesapeake Bay river inputs: Journal of the American Water Resources Association, v. 46, no. 5, p. 857–880, accessed July 2022 at https://doi.org/10.1111/j.1752-1688.2010.00482.x.
Hirsch, R.M., and De Cicco, L.A., 2015, User guide to Exploration and Graphics for RivEr Trends (EGRET) and dataRetrieval—R packages for hydrologic data (version 2.0, February 2015): U.S. Geological Survey Techniques and Methods book 4, chap. A10, 93 p., accessed July 2022 at https://doi.org/10.3133/tm4A10.
Hirsch, R.M., 2018, Daily streamflow trend analysis—Using the R-package EGRET to investigate trends in daily streamflow: U.S. Geological Survey Water Data for the Nation Blog, accessed January 12, 2022, at https://waterdata.usgs.gov/blog/quantile-kendall/.
Kennedy, E.J., 1984, Discharge ratings at gaging stations: U.S. Geological Survey Techniques of Water-Resources Investigations, book 3, chap. A10, 59 p., accessed August 2023 at https://pubs.usgs.gov/twri/twri3-a10/.
Koltun, G.F., 2024, Annual streamflow statistics for selected streamgages in and near the shale play area of eastern Ohio (through water year 2021): U.S. Geological Survey data release, https://doi.org/10.5066/P1G2W3JQ.
Knuth, M., Jackson, J.L., and Whittemore, D.O., 1990, An integrated approach to identifying the salinity source contaminating a ground-water supply: Groundwater, v. 28, no. 2, p. 207–214. accessed August 2023 at https://doi.org/10.1111/j.1745-6584.1990.tb02248.x.
LAWriter Ohio Laws and Rules, 2023a, Ohio Administrative Code 3745–1–24—Muskingum River drainage basin: Legislative Service Commission, accessed December 4, 2023, at https://codes.ohio.gov/oac/3745-1-24v1.
LAWriter Ohio Laws and Rules, 2023b, Ohio Administrative Code 3745–1–35—Aquatic life and wildlife criteria: Legislative Service Commission, accessed December 4, 2023, at https://codes.ohio.gov/assets/laws/administrative-code/rules/3745/0/3745$0-1-35_eff_2_6_17.pdf.
Mann, H.B., 1945, Nonparametric tests against trend: Econometrica, v. 13, no. 3, p. 245–249, accessed July 2022 at https://doi.org/10.2307/1907187.
Midwestern Regional Climate Center, 2024, cli-MATE—MRCC application tools environment: Midwestern Regional Climate Center, accessed January 4, 2024, at https://mrcc.purdue.edu/CLIMATE/.
Nature Conservancy, 2009. Indicators of hydrologic alteration, Version 7.1, User's Manual: The Nature Conservancy, 76 p., accessed July 2022, at https://www.conservationgateway.org/Documents/IHAV7.pdf.
Ohio Department of Natural Resources Division of Mineral Resources Management [ODNR–DMRM], 2016, Mine drainage impact assessment of Ohio watersheds: Ohio Department of Natural Resources, accessed January 12, 2024, at https://ohiodnr.gov/wps/wcm/connect/gov/41891d9b-c08a-4667-b0b5-aa06369952c8/Mine+Drainage+Impact+Assessment+of+Ohio+Coal+Region+Watersheds.pdf?MOD=AJ PERES&CVID=nUCoFWd.
Ohio Department of Natural Resources Division of Mineral Resources Management [ODNR–DMRM], 2023, Mines of Ohio: Ohio Department of Natural Resources, Division of Mineral Resources Management web page, accessed October 18, 2023, at https://gis.ohiodnr.gov/MapViewer/?config=OhioMines.
Ohio Department of Natural Resources Division of Oil & Gas Resources Management [ODNR–OGRM], 2023a, Annual report, 2021: ODNR Division of Oil and Gas Resources Management, accessed October 18, 2023, at https://ohiodnr.gov/static/documents/oil-gas/resources/2021-O%26G-Annual.pdf.
Ohio Department of Natural Resources Division of Oil & Gas Resources Management [ODNR–OGRM], 2023b, Risk based data management system (RBDMS) database, accessed October 18, 2023, at https://ohiodnr.gov/discover-and-learn/safety-conservation/about-odnr/oil-gas/oil-gas-resources/featured-content-3.
Ohio Department of Transportation, 2023, Roads Inventory database, accessed October 18, 2023, at https://gis.dot.state.oh.us/tims/Data/Download.
Ohio Environmental Protection Agency [OEPA], 2011, Drilling for natural gas in the Marcellus and Utica Shales— Environmental Regulatory Basics: Fact sheet, 6 p., accessed January 13, 2024, at https://ohiomemory.org/digital/collection/p267401ccp2/id/7850.
Ohio Environmental Protection Agency [OEPA], 2023, Individual NPDES Permits in Ohio database, accessed October 18, 2023, at https://ohio-epa-gis-hub-oepa.hub.arcgis.com/apps/25cf405adc3444139f4b410e69a2bbc9/explore.
Ohio Oil & Gas Association, 2013, Overview of Ohio oil and natural gas in Presentation to American Association of Energy Engineers: Cleveland, Ohio, April 5, 2013, American Association of Energy Engineers, accessed January 13, 2024, at http://www.aeeohio.com/OOGA_SHALE%20OIL%20AND%20GAS_05022103.pdf.
Patton, C.J., and Kryskalla, J.R., 2003, Methods of analysis by the U.S. Geological Survey National Water Quality Laboratory—Evaluation of alkaline persulfate digestion as an alternative to Kjeldahl digestion for determination of total and dissolved nitrogen and phosphorus in water: U.S. Geological Survey Water-Resources Investigations Report 03–4174, 33 p., accessed August 2023 at https://pubs.usgs.gov/wri/2003/4174/report.pdf.
Patton, C.J., and Kryskalla, J.R., 2011, Colorimetric determination of nitrate plus nitrite in water by enzymatic reduction, automated discrete analyzer methods: U.S. Geological Survey Techniques and Methods, book 5, chap. B8, 34 p., accessed August 2023 at https://pubs.usgs.gov/tm/05b08/.
Pichtel, J., 2016, Oil and gas production wastewater—Soil contamination and pollution prevention: Applied and Environmental Soil Science, v. 2016, article 2707989, accessed August 2023 at https://doi.org/10.1155/2016/2707989.
R Core Team, 2017, R: A language and environment for statistical computing: Vienna, Austria, R Foundation for Statistical Computing, website accessed on January 14, 2024, at https://www.R-project.org/.
Risch, M.R., and Robinson, B.A., 2000, Use of borehole and surface geophysics to investigate ground-water quality near a road-deicing salt-storage facility, Valparaiso, Indiana: U.S. Geological Survey Water-Resources Investigations Report 00–4070, 65 p., accessed February 23, 2018, at https://pubs.usgs.gov/publication/wri004070.
Sen, P.K., 1968, Estimates of the regression coefficient based on Kendall’s tau: Journal of the American Statistical Association, v. 63, no. 324, p. 1379–1389. accessed July 2022 at https://doi.org/10.1080/01621459.1968.10480934.
Spearman, C., 1904, The proof and measurement of correlation between two things: The American Journal of Psychology, v. 15, no. 1, p. 72–101, accessed August 2023 at https://doi.org/10.2307/1412159.
Standard Methods Online, 2021, 4500-S2− Sulfide: Standard Methods for the Examination of Water and Wastewater, accessed January 11, 2024, at https://www.standardmethods.org/doi/10.2105/SMWW.2882.096.
Struzeski, T.M., DeGiacomo, W.J., and Zayhowski, E.J., 1996, Methods of analysis by the U.S. Geological Survey National Water Quality Laboratory—Determination of dissolved aluminum and boron in water by inductively coupled plasma-atomic emission spectrometry: U.S. Geological Survey Open-File Report 96–149, 17 p., accessed August 2023 at https://doi.org/10.3133/ofr96149.
U.S. Census Bureau, 2022, QuickFacts—St Clairsville City, Ohio, accessed June 13, 2022, at https://www.census.gov/quickfacts/fact/table/stclairsvillecityohio/INC110220.
U.S. Environmental Protection Agency [EPA], 1993a, Method 180.1, Revision 2.0— Determination of turbidity by nephelometry: U.S. Environmental Protection Agency, accessed January 11, 2024, at https://www.epa.gov/sites/default/files/2015-08/documents/method_180-1_1993.pdf.
U.S. Environmental Protection Agency [EPA], 1993b, Method 365.1, Revision 2.0—Determination of phosphorus by semi-automated colorimetry: U.S. Environmental Protection Agency, accessed January 14, 2024, at https://www.epa.gov/sites/default/files/2015-08/documents/method_365-1_1993.pdf.
U.S. Geological Survey—National Water Quality Laboratory [USGS–NWQL], 2015, TECHNICAL MEMORANDUM 15.02, accessed January 13, 2024, at https://www.usgs.gov/media/files/tm15-02-changes-national-water-quality-laboratoryprocedures-used-establish-and-verify.
U.S. Geological Survey [USGS], 2017a, Quality Systems Branch: U.S. Geological Survey web page, accessed October 1, 2023, at https://qsb.usgs.gov.
U.S. Geological Survey [USGS], 2017b, Dissolved oxygen and water: U.S. Geological Survey web page, accessed January 13, 2024, at https://www.usgs.gov/special-topics/water-science-school/science/dissolved-oxygen-and-water.
U.S. Geological Survey [USGS], 2019, StreamStats website, accessed on August 15, 2023, at https://streamstats.usgs.gov/ss/.
U.S. Geological Survey [USGS], 2023a, National Water Information System—Web Interface: U.S. Geological Survey web page, accessed September 21, 2023, at https://doi.org/10.5066/F7P55KJN.
U.S. Geological Survey [USGS], variously dated, National field manual for the collection of water-quality data: U.S. Geological Survey Techniques of Water-Resources Investigations, book 9, chaps. A1–A10, accessed January 14, 2024, at https://www.usgs.gov/mission-areas/water-resources/science/national-field-manual-collection-water-quality-data-nfm.
Wilcoxon, F., 1945, Individual comparisons by ranking methods: Biometrics Bulletin, v. 1, no. 6, p. 80–83, accessed August 2023 at https://doi.org/10.2307/3001968.
Wilde, F.D., Radtke, D.B., Gibs, J., and Iwatsubo, R.T., eds., [variously dated], Processing of water samples (version 2.2, with updates through February 2009): U.S. Geological Survey Techniques of Water-Resources Investigations, book 9, chap. A5, accessed February 2, 2015, at https://pubs.water.usgs.gov/twri9A5/.
Appendix 1. Quality-Control Results (detailed)
Equipment Blanks
Prior to field sampling, one equipment blank (Covert, 2024) was processed in a laboratory setting in June 2021. Concentrations of most constituents in the equipment blanks were less than the reporting levels with the following exceptions: (1) chloride was detected in one blank sample at a concentration of 0.079 mg/L, 0.059 mg/L greater than the reporting level of 0.02 mg/L; (2) total particulate carbon (TPC) was detected in one blank sample at a concentration of 0.097 mg/L, 0.003 mg/L less than the reporting level of 0.1 mg/L (Covert, 2024). The detected concentration of chloride in the equipment blank (0.079 mg/L) was at least 91 times less than the lowest chloride concentration in the environmental samples (7.24 mg/L), making the contribution by sample equipment negligible. After the detection of TPC in the equipment blank from the churn splitter and total particulate carbon and nitrogen apparatus, these pieces of equipment were recleaned prior to field use. Subsequent field blanks collected contained no detectable concentrations of TPC (Covert, 2024).
Field Blanks
Three field blank samples were collected for 27 analytes (Covert, 2024). The range of blank results was compared to the range of all environmental results and was calculated as the percentage of values greater than the reporting level in environmental samples that also were less than the maximum blank value (ideally, 0 percent). Field blanks had concentrations greater than the reporting level for chloride, fluoride, dissolved organic carbon, and orthophosphate (Covert, 2024). For chloride, fluoride, and dissolved organic carbon, the percentage of environmental samples with concentrations greater than the reporting level and less than the maximum field blank concentration was 0 percent. For orthophosphate, however, 40.6 percent of the environmental samples were greater than the reporting level (<0.004 mg/L as P) and less than the maximum blank concentration of 0.00811 mg/L as P. The orthophosphate concentrations in samples collected during the same week as the blank detection sample were all less than the reporting level except for one at Yellow Creek (0.019 mg/L of P; station 03110000).
Analytical Bias and Variability
To determine and track bias and variability (or uncertainty) associated with the measured values of chemical concentration with time, the USGS Quality Systems Branch operates independent, external, blind sample projects for inorganic, nutrient, and organic constituents (USGS, 2017a). Metrics obtained from the USGS Quality Systems Branch for orthophosphate (parameter code 00671, method code PHM01) indicated false positive rates of 0, 0, and 4 percent for 2021, 2022, and 2023, respectively, in blind blanks sent to the laboratory. NWQL examined the analytical run data for the late 2022–early 2023 samples that have a high bias and did not find anything unusual. The analyst reported that the associated quality-control samples were within acceptable limits. Still, this positive analytical bias in early 2023 may indicate that the source of orthophosphate contamination in the March 2023 field blank for this study could have been introduced in the laboratory.
Replicate Samples
Five sequential replicate samples were collected for 27 analytes (Covert, 2024). The variability of concentrations was assessed using relative percent differences (RPD) for replicate sets having two values over the reporting level (Covert, 2024). The RPD in concentrations between replicate paired samples (for example, c1 and c2) were calculated as [100*(c1–c2) / ((c1+c2)/2)]. A criterion of 20 percent difference or less was considered acceptable. Concentrations for 25 of 27 analytes differed by less than 20 percent median RPD. Only 2 analytes, aluminum and iron, differed by greater than 20 percent median RPD, at 23.4 and 94.6, respectively. The RPD for aluminum replicates ranged from 5.61 to 169 percent, and the differences between the environmental and replicate concentrations ranged from 2.20 to 64.6 μg/L. RPDs for iron replicate values ranged from 33.8 to 169 percent, and the differences between the environmental and replicate concentrations ranged from 13.6 to 97.2 μg/L.
References Cited
Covert, S.A., 2024, Data from quality-control equipment blanks, field blanks, and field replicates for baseline water quality in watersheds within the shale play of eastern Ohio, 2021–23: U.S. Geological Survey data release, https://doi.org/10.5066/P1EDHXB9.
U.S. Geological Survey [USGS], 2017a, Quality Systems Branch: U.S. Geological Survey web page, accessed October 1, 2023, at https://qsb.usgs.gov.
Appendix 2. Boxplots of Concentrations or Levels of Constituents and Properties
Table 2.1.
Constituents correlated to the boxplots of figure 2.1 A-KK.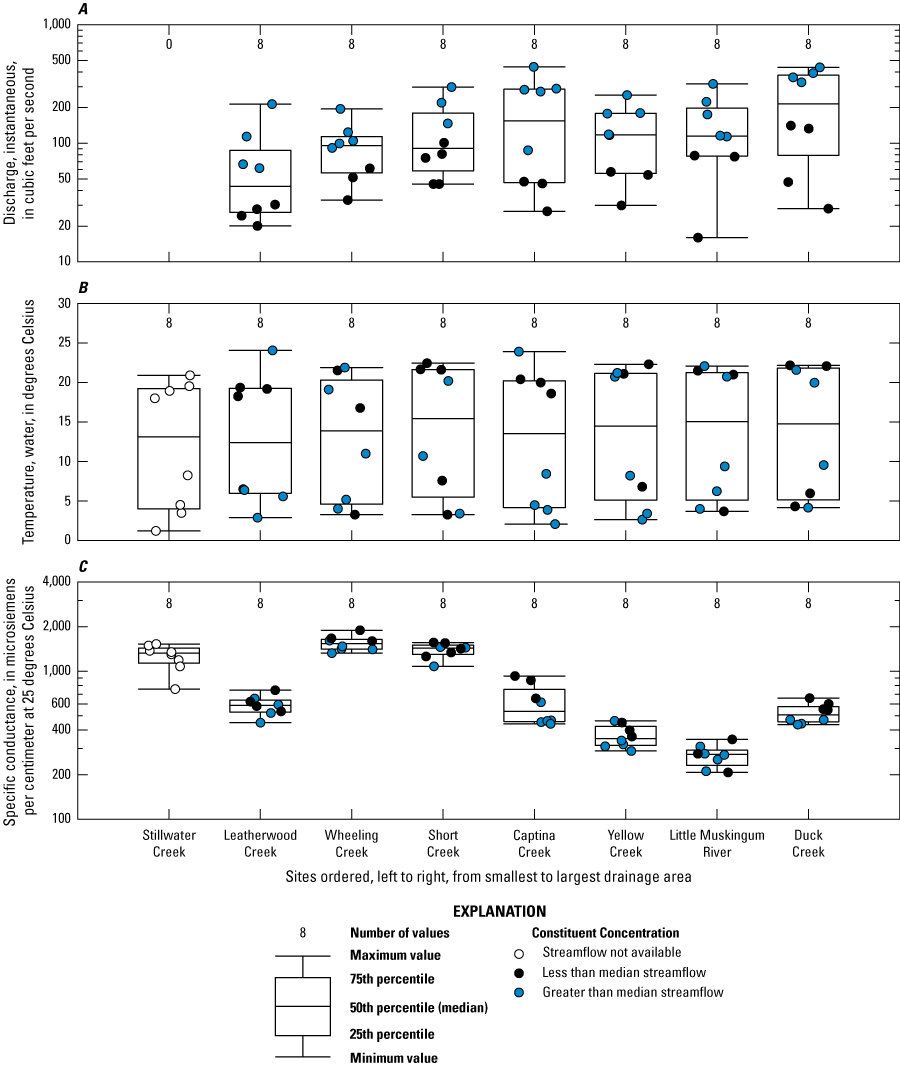
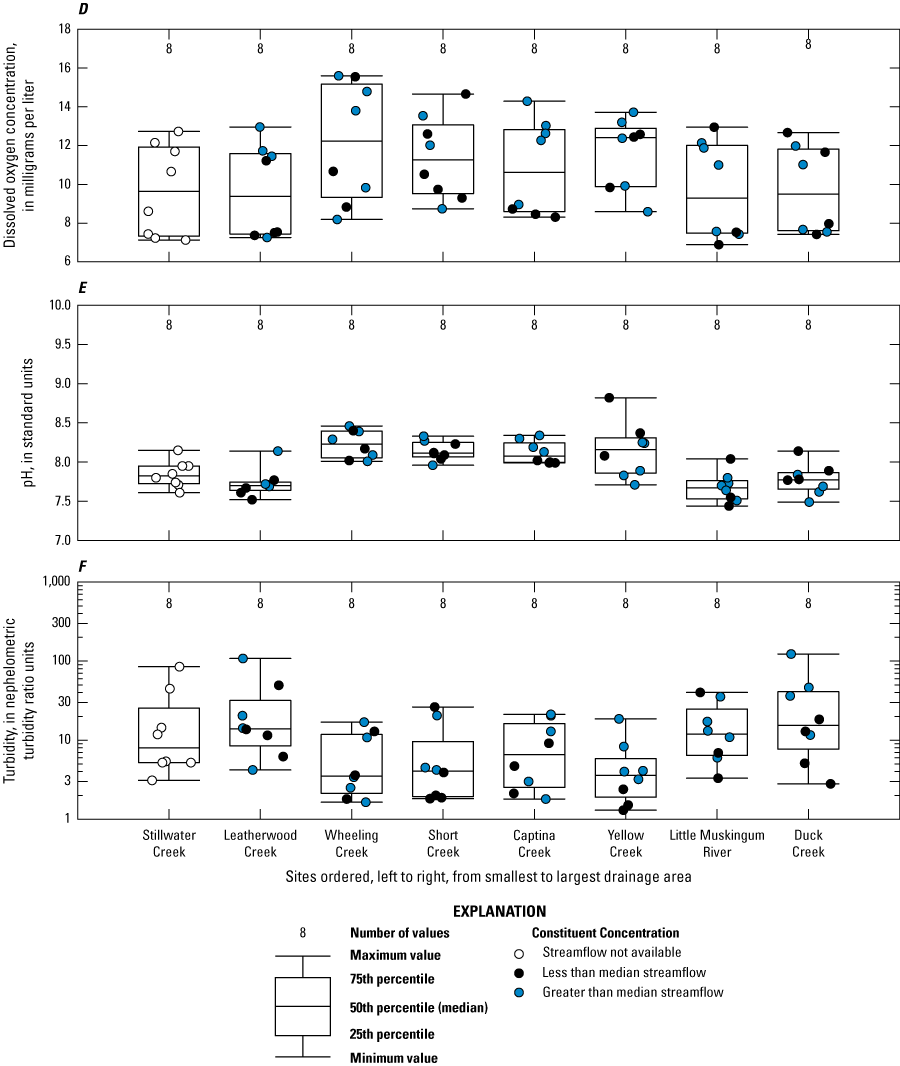
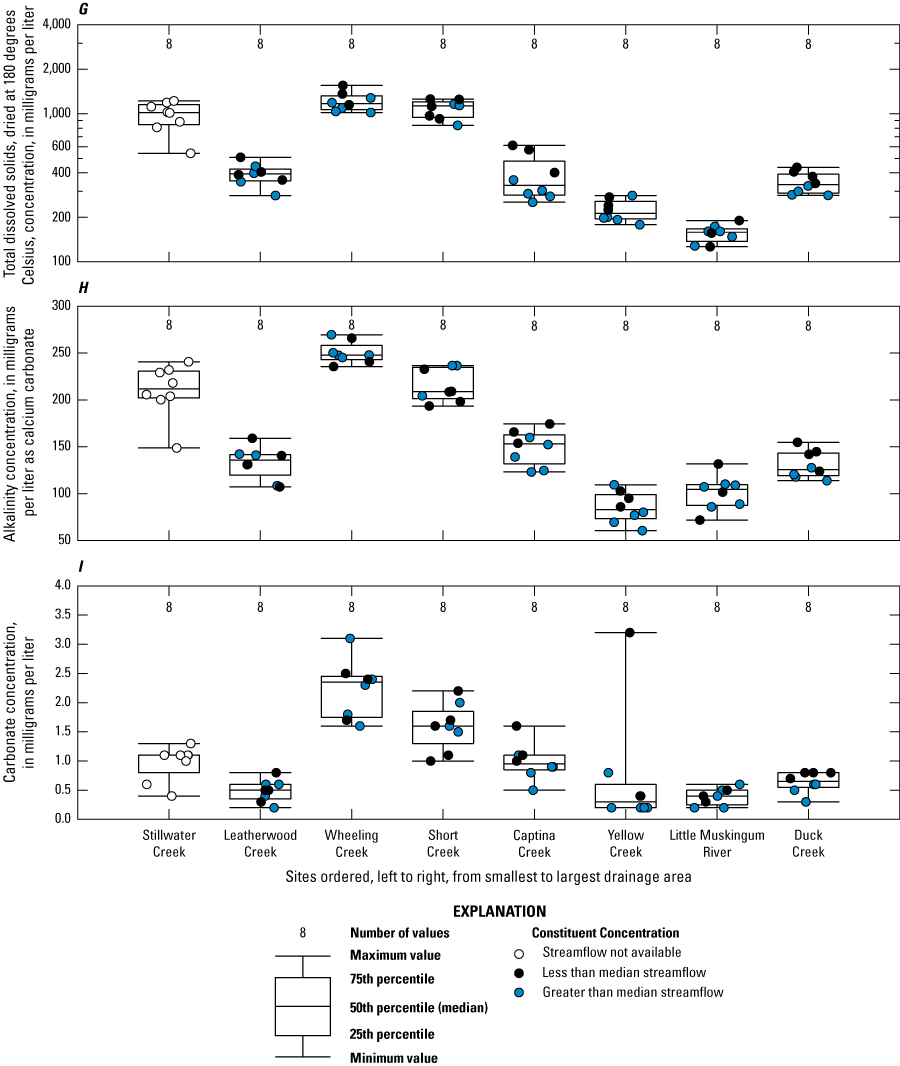
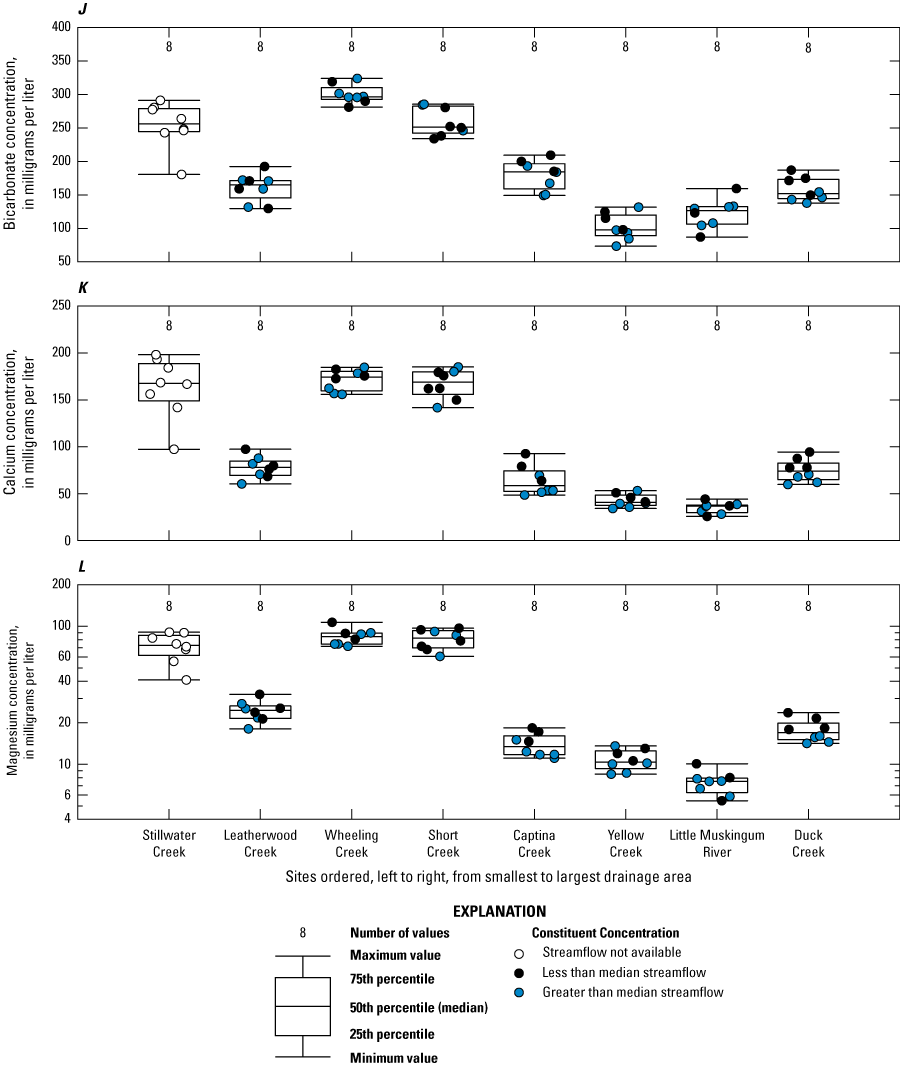
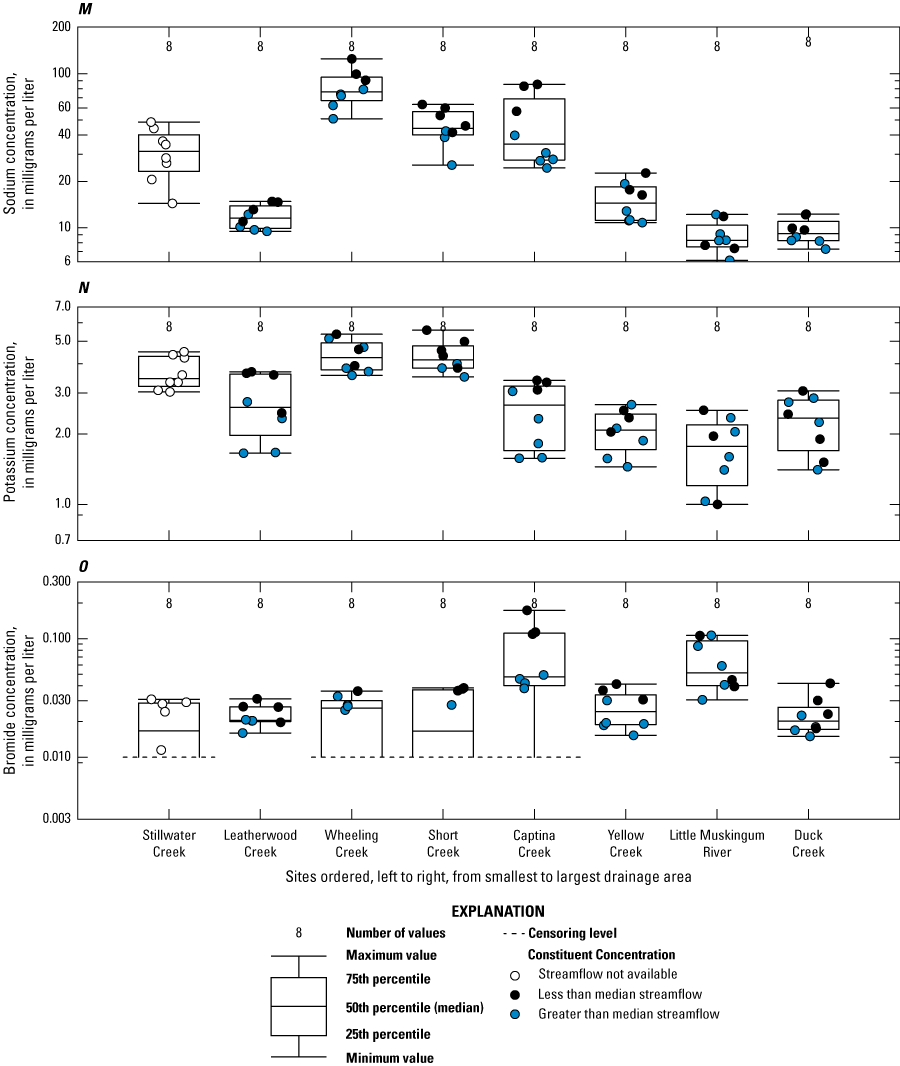
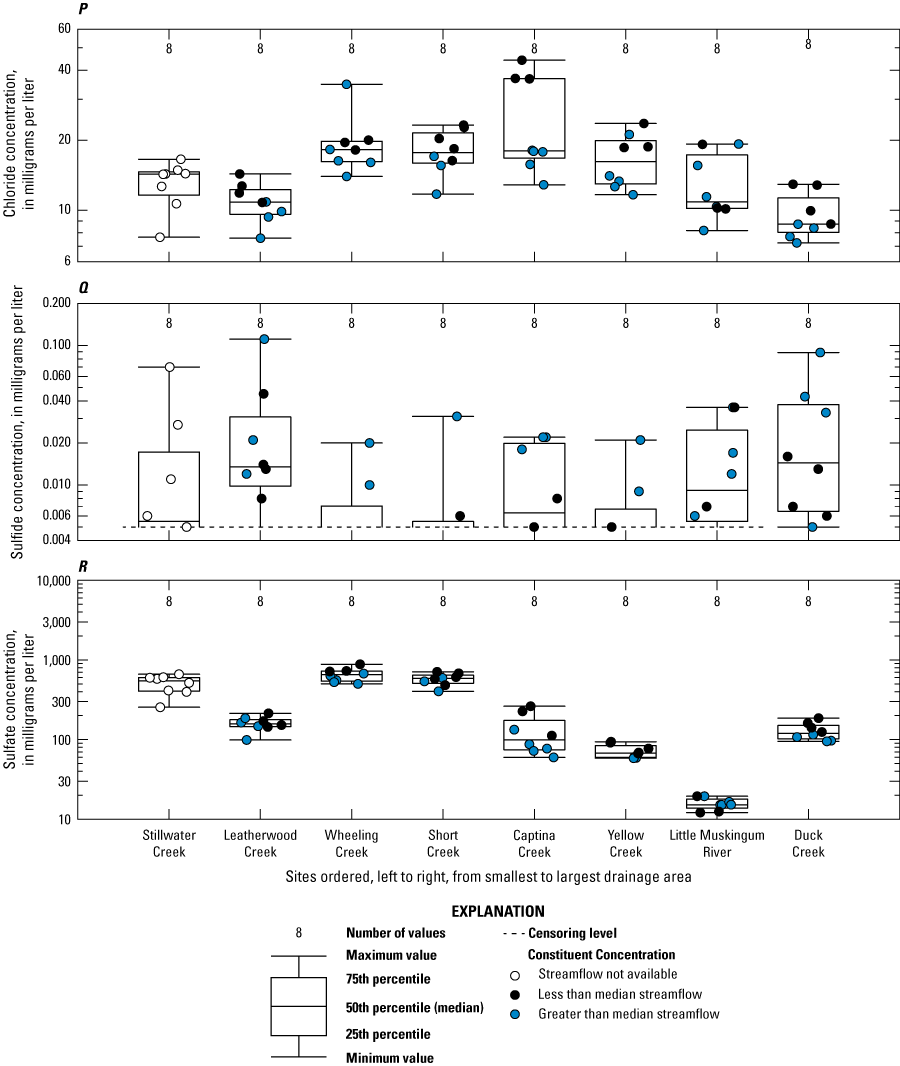
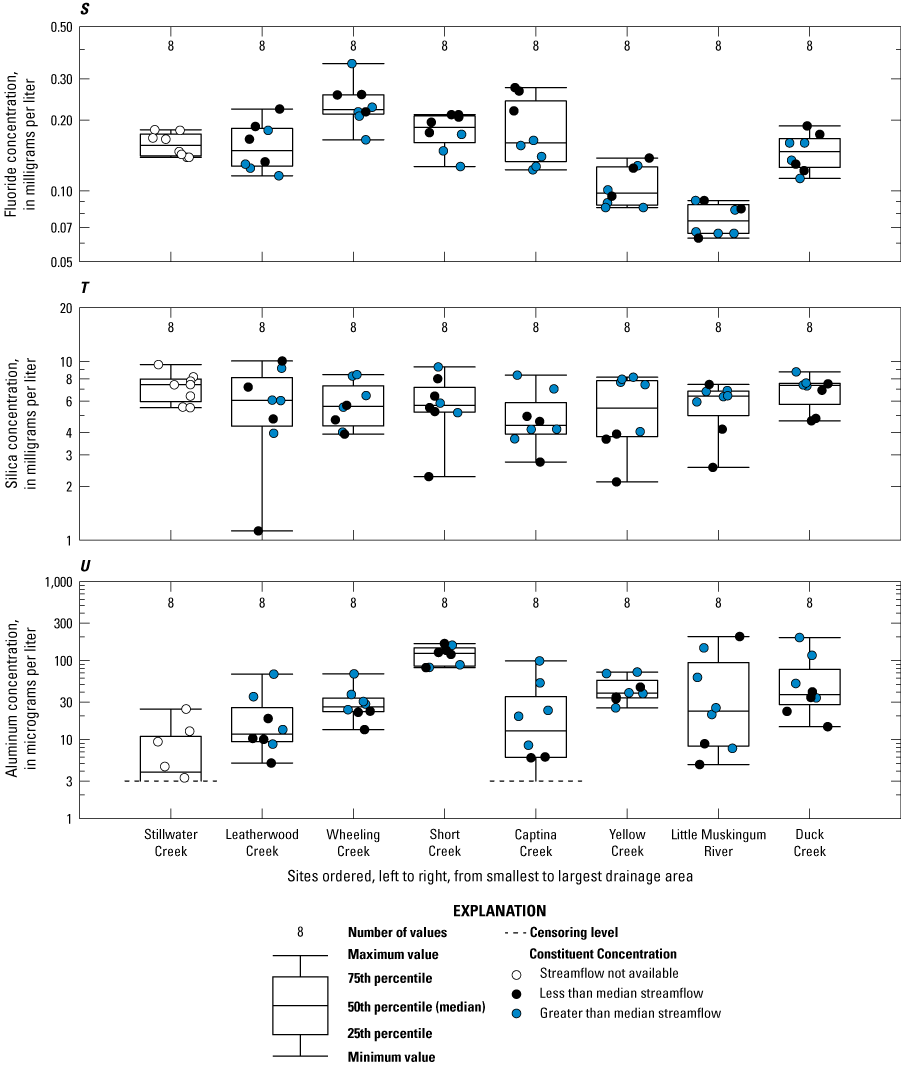
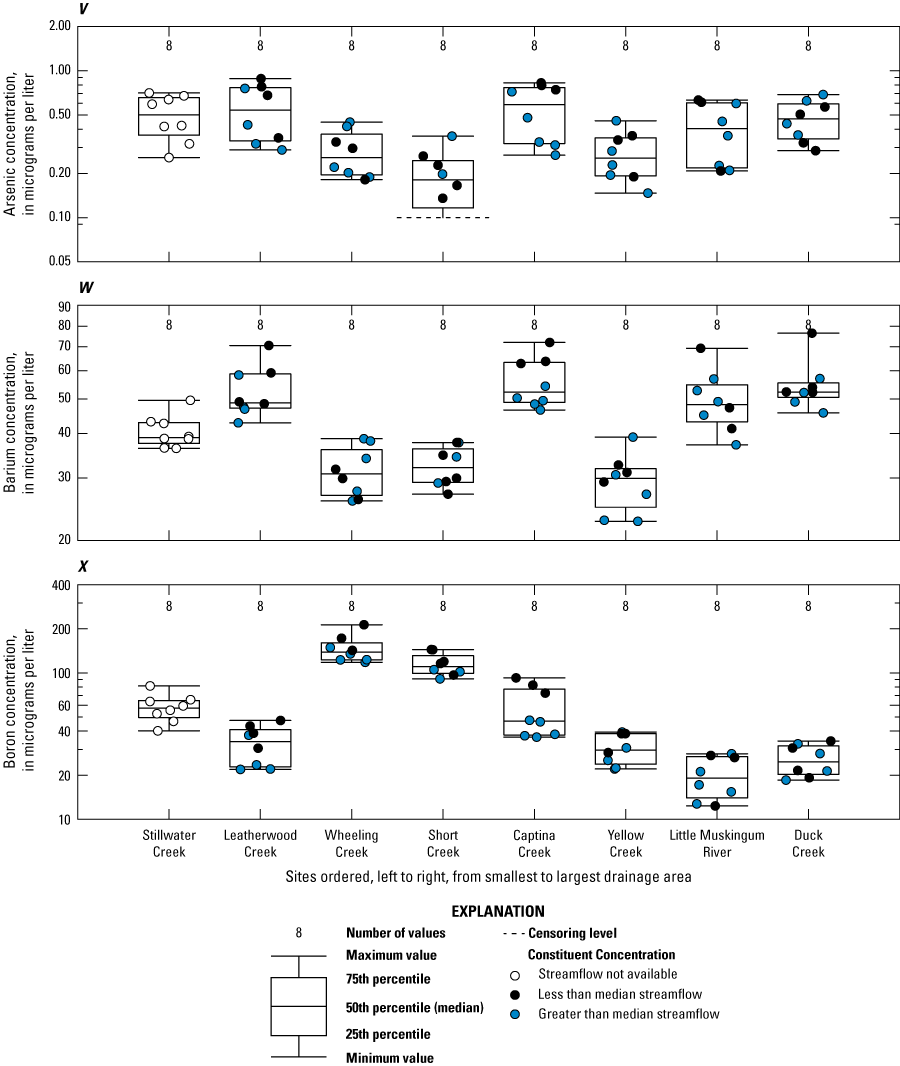
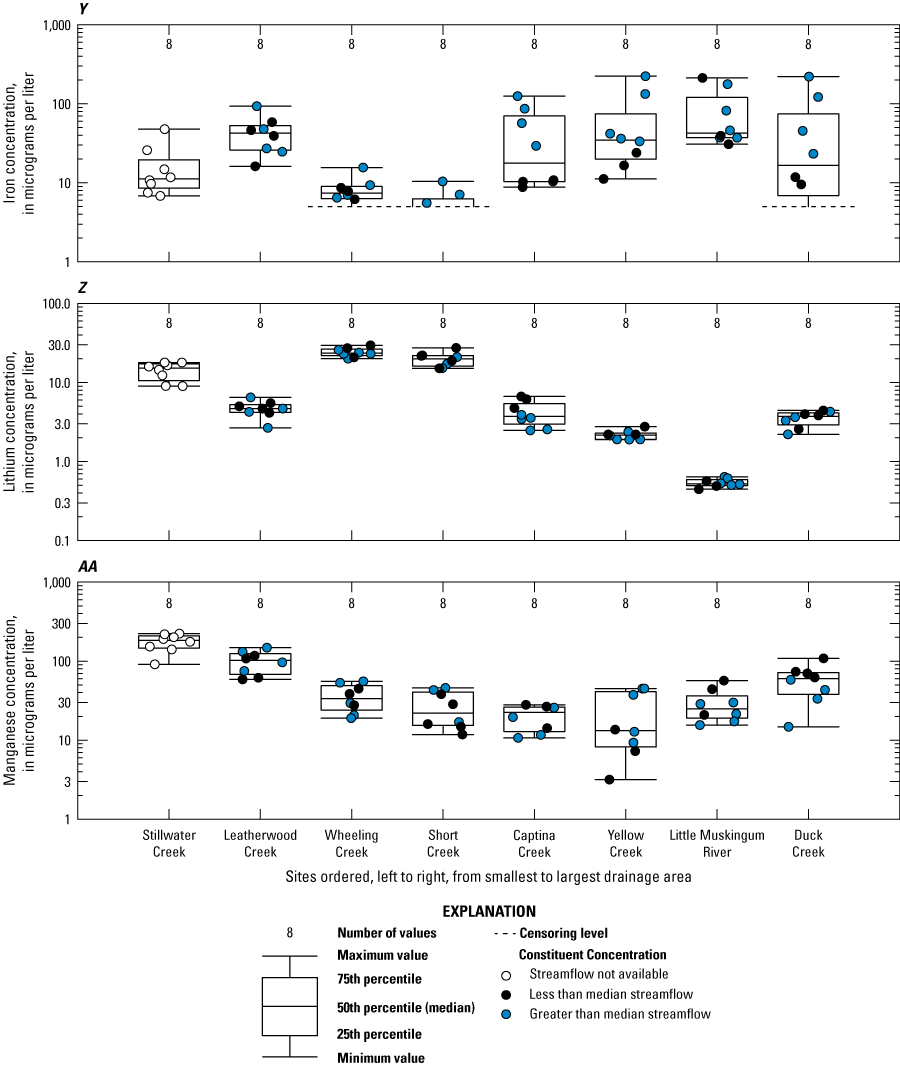
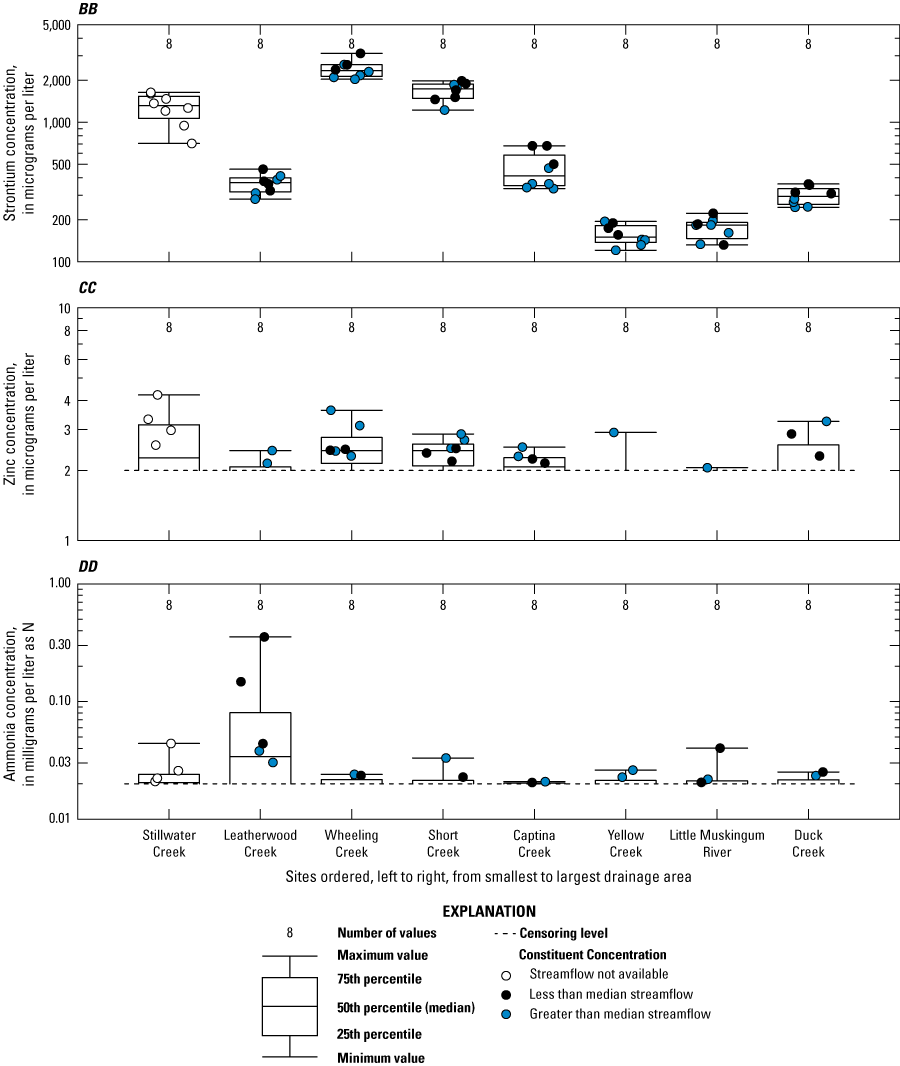
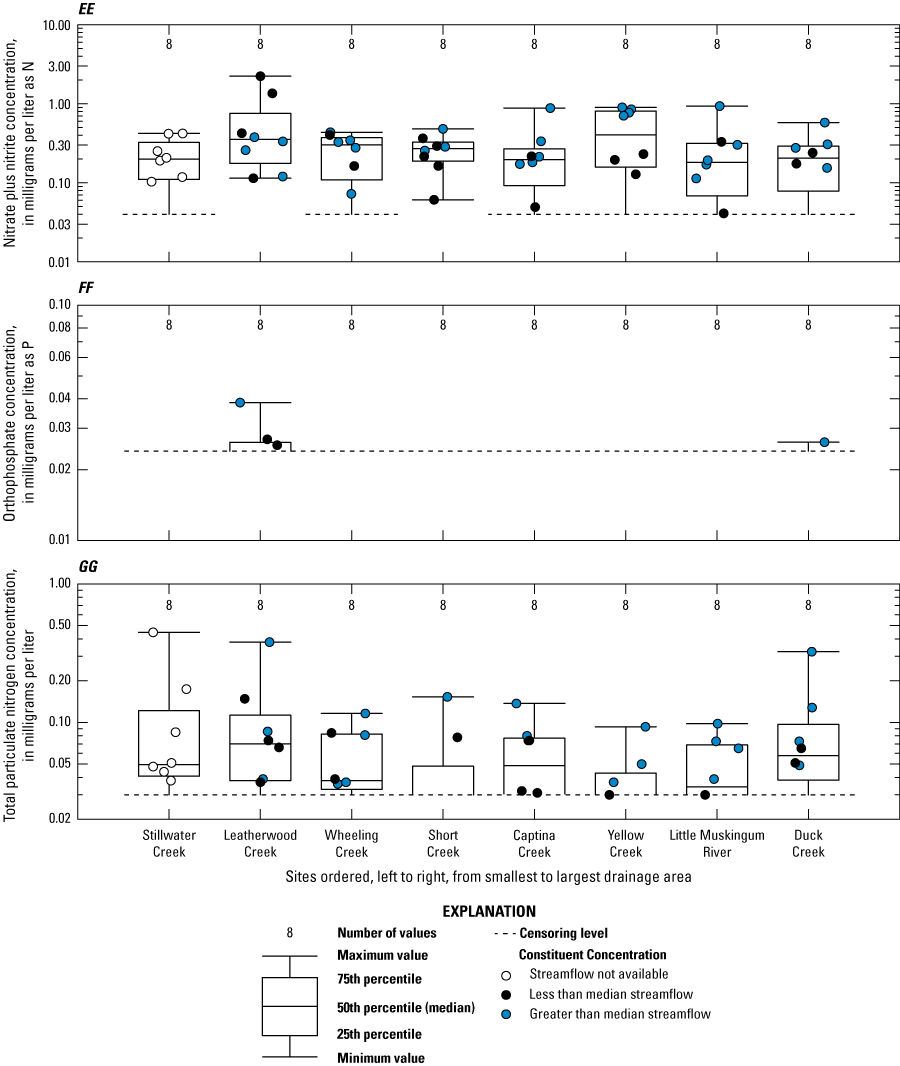
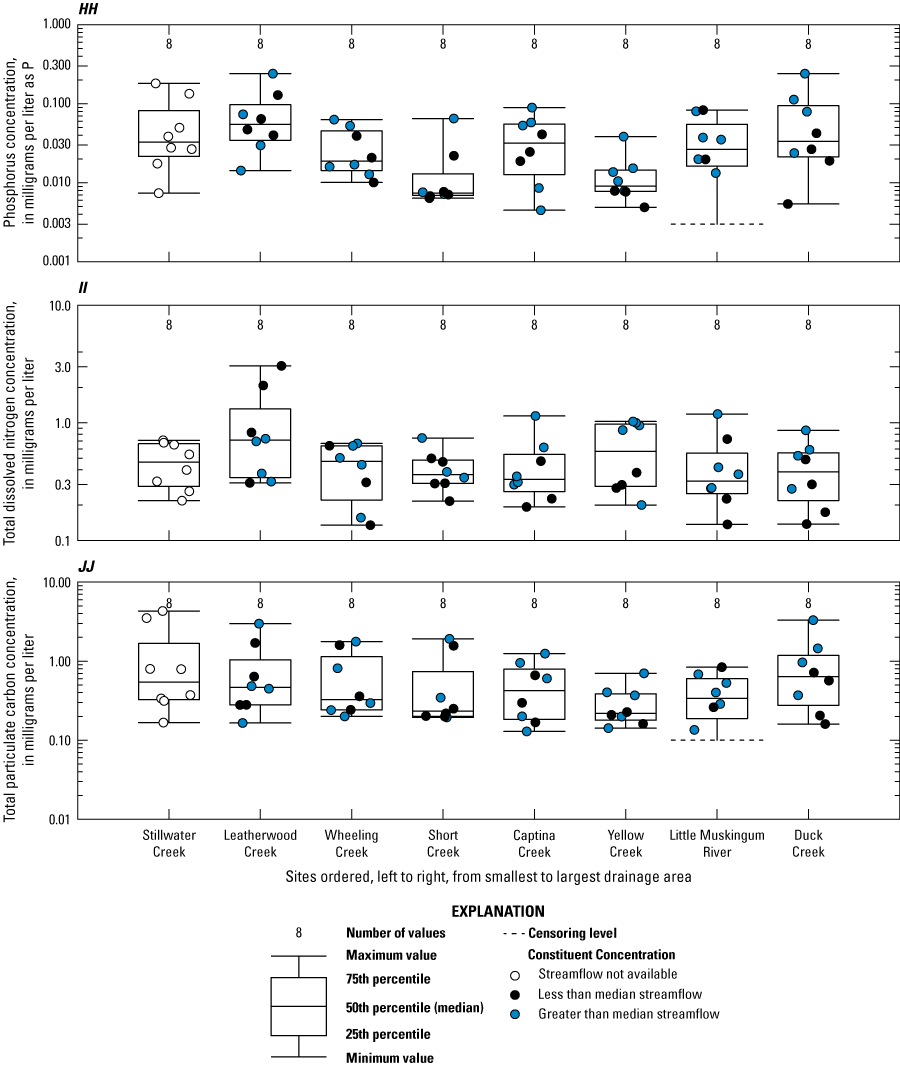
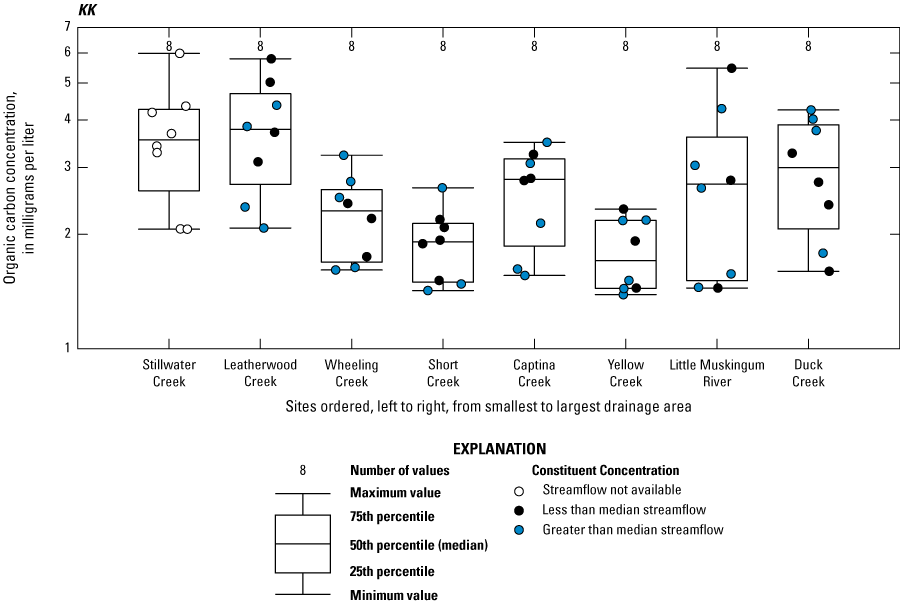
Boxplots showing the 37 constituent concentrations at eight sites used in the analysis of baseline water quality in watersheds within the shale play of eastern Ohio, 2021–23. A-KK.
Conversion Factors
Datums
Vertical coordinate information is referenced to the North American Vertical Datum of 1988 (NAVD 88).
Horizontal coordinate information is referenced to the North American Datum of 1983 (NAD 83).
Supplemental Information
Specific conductance is given in microsiemens per centimeter at 25 degrees Celsius (µS/cm at 25 °C).
Concentrations of chemical constituents in water are given in either milligrams per liter (mg/L) or micrograms per liter (µg/L).
A water year is the 12-month period from October 1 through September 30 of the following year and is designated by the calendar year in which it ends.
Abbreviations
Cl:Br
chloride-to-bromide
GIS
geographic information system
mg/L
milligram per liter
NTRU
nephelometric turbidity ratio unit
NWIS
National Water Information System
NWQL
National Water Quality Laboratory
ODNR–DMRM
Ohio Department of Natural Resources Division of Mineral Resources Management
ODNR–OGRM
Ohio Department of Natural Resources Division of Oil and Gas Resources Management
OEPA
Ohio Environmental Protection Agency
OMZA
outside mixing zone average
OMZM
outside mixing zone maximum
QC
quality control
RPD
relative percent difference
TPC
total particulate carbon
µg/L
microgram per liter
USGS
U.S. Geological Survey
For more information about this report, contact
Director, Ohio-Kentucky-Indiana Water Science Center
U.S. Geological Survey
5957 Lakeside Blvd.
Indianapolis, IN 46278-1996
or visit our website at
https://www.usgs.gov/centers/oki-water
Publishing support provided by the Pembroke and Baltimore Publishing Service Centers
Disclaimers
Any use of trade, firm, or product names is for descriptive purposes only and does not imply endorsement by the U.S. Government.
Although this information product, for the most part, is in the public domain, it also may contain copyrighted materials as noted in the text. Permission to reproduce copyrighted items must be secured from the copyright owner.
Suggested Citation
Covert, S.A., and Koltun, G.F., 2024, Analysis of water use associated with hydraulic fracturing and determination of baseline water quality in watersheds within the shale play of eastern Ohio, 2021–23: U.S. Geological Survey Scientific Investigations Report 2024–5045, 61 p., https://doi.org/10.3133/sir20245045.
ISSN: 2328-0328 (online)
Study Area
| Publication type | Report |
|---|---|
| Publication Subtype | USGS Numbered Series |
| Title | Analysis of water use associated with hydraulic fracturing and determination of baseline water quality in watersheds within the shale play of eastern Ohio, 2021–23 |
| Series title | Scientific Investigations Report |
| Series number | 2024-5045 |
| DOI | 10.3133/sir20245045 |
| Publication Date | July 03, 2024 |
| Year Published | 2024 |
| Language | English |
| Publisher | U.S. Geological Survey |
| Publisher location | Reston, VA |
| Contributing office(s) | Ohio-Kentucky-Indiana Water Science Center |
| Description | Report: viii, 61 p.; 2 Data Releases |
| Country | United States |
| State | Ohio |
| Online Only (Y/N) | Y |
| Additional Online Files (Y/N) | N |


