

Hydrogeologic Framework and Extent of Saltwater Intrusion in Kings, Queens, and Nassau Counties, Long Island, New York
Links
- Document: Report (14.0 MB pdf) , HTML , XML
- Figure: Full-size figures
- Additional Report Piece: Interactive geospatial data viewer - Western Long Island Hydrogeologic Framework and Chloride Concentrations Viewer
- Related Works:
- Interactive geospatial data viewer - Long Island Groundwater Sustainability - Phase 1 Simulation Outputs
- Scientific Investigations Report 2024–5044 - Simulation of Groundwater Flow in the Long Island, New York Regional Aquifer System for Pumping and Recharge Conditions From 1900 To 2019
- Data Releases:
- USGS data release - Hydrogeologic framework and chloride data for Kings, Queens, and Nassau Counties, Long Island, New York
- USGS data release - MODFLOW 6 Model Used to Simulate Groundwater Flow in the Long Island, New York Regional Aquifer System for 1900–2019 Pumping and Recharge Conditions
- USGS data release - Simulations of the Long Island Aquifer System Response to Potential Changes in Future Hydrologic Conditions, Long Island, New York
- NGMDB Index Page: National Geologic Map Database Index Page (html)
- Download citation as: RIS | Dublin Core
Acknowledgments
The authors thank the New York State Department of Environmental Conservation for their technical support during this study. Thanks are also extended to the Nassau County Department of Public Works for granting access to their observation wells for borehole geophysical measurements and for assistance in installing new observation wells on Nassau County properties; the Nassau County Department of Parks and Recreation for providing access and permission to drill several monitoring wells within their parks and preserves, and the New York City Department of Parks and Recreation and Jonathan Landsman for coordinating access to parks for the installation of several monitoring wells. The authors thank the National Park Service for granting access to Hamilton Beach Park for one of our monitoring wells. The authors also thank Delta Well and Pump Inc. for their assistance in collecting hydrogeologic cores and observation well installation. The authors also acknowledge Marie Zuck and Michael Como, of the U.S. Geological Survey for their field efforts in the collection of core samples, water-quality samples, surface-geophysical surveys, and geophysical logs.
Any use of trade, firm, or product names in the report is for descriptive purposes only and does not imply endorsement by the U.S. Government.
Abstract
In 2016, the U.S. Geological Survey began a multiyear cooperative study with the New York State Department of Environmental Conservation to evaluate the sustainability of Long Island’s sole-source aquifer system through hydrogeologic mapping, compilation of groundwater chloride concentrations, and groundwater flow modeling. In the initial phase of the islandwide study, the hydrogeologic framework and extent of saltwater intrusion in aquifers in Kings, Queens, and Nassau Counties on western Long Island, N.Y., were investigated. The aquifer system underlying western Long Island has been under stress from pumping of public, irrigation (golf course), and industrial supply wells. Saltwater intrusion has occurred from surrounding embayments (East River, Long Island Sound, Jamaica Bay, and the Atlantic Ocean) due to pumping.
Eighteen boreholes were drilled and cores taken during 2019–21 to collect hydrogeologic, geochemical, and geophysical data to delineate the complex subsurface hydrogeology and extent of saltwater intrusion within the study area. Evaluation of the new cores, reexamination of legacy core descriptions, and analysis of borehole geophysical logs was used to refine the previously published hydrogeologic framework of Pleistocene and Cretaceous unconsolidated sediments in the area, including delineation of a previously undefined hydrogeologic unit between the Magothy aquifer and the Raritan confining unit, herein named the “upper Raritan aquifer.” The upper Raritan aquifer was first recognized in southeastern Nassau County from an analysis of about 50 closely spaced boreholes with high-resolution core descriptions and gamma-ray (gamma) logs. Further analysis of borehole logs across the study area indicated that the upper Raritan aquifer was also present in Kings and Queens Counties.
Nuclear magnetic resonance (NMR) logging was used for the first time on Long Island to provide estimates of the hydraulic properties of the major aquifer and confining units. Unlike other geophysical logs that record responses to the rock matrix and fluid properties and are strongly dependent on mineralogy, NMR logs record responses to the presence of hydrogen protons in the formation fluid to determine water fraction and pore-size distribution. NMR log analysis provided estimates of the clay-bound, capillary-bound, and mobile water fractions and hydraulic conductivity of aquifers and confining units penetrated by five wells in Nassau County.
Pumpage for public-supply and industrial wells on Long Island began in the 1870s with small, localized suppliers of populated areas in Kings and Queens Counties. By 1904–16, pumpage for public water supply in Kings County averaged 21 million gallons per day, and averaged 37 million gallons per day in Queens County, mostly from the upper glacial aquifer. Saltwater intrusion was reported as early as the beginning of the 20th century and included the upper glacial-Jameco-Magothy and Lloyd-North Shore aquifer systems. By 1936, pumping in central Kings County created a major cone of depression in the water table extending to the south shore of much of Kings County and into southwestern Queens County. Saltwater intrusion has caused the shutdown of public-supply wells in Kings, Queens, and Nassau Counties. A large saltwater intrusion wedge in the Lloyd aquifer was indicated in southern Queens County in the early part of the 20th century, and the saltwater interface may have been onshore predevelopment. Most of Kings and Queens Counties are intruded with saltwater in both the upper glacial-Jameco-Magothy and Lloyd-North Shore aquifers systems. Saltwater increased during the 20th century and continues to increase to the present (2023) in the Lloyd-North Shore aquifer system in Great Neck and Manhasset Neck in northern Nassau County. A major wedge of saltwater intrusion in the upper glacial-Jameco-Magothy aquifer in southwestern Nassau County appears to be increasing.
Introduction
The U.S. Geological Survey (USGS) and the New York State Department of Environmental Conservation began an ongoing multiyear cooperative study in 2016 to evaluate the sustainability of the aquifer system in western Long Island by drilling a network of exploratory boreholes, collecting geologic and geophysical data, and compiling existing hydrologic, climate, geologic, water quality, and water-use data. Starting in 2016, the initial focus of the aquifer system study has been the western part of Long Island that includes Kings, Queens, and Nassau Counties (fig. 1). The groundwater system in western Long Island has been under stress from pumping of public, irrigation (golf course), and industrial supply wells. As a result, the chloride concentrations at many public-supply and industrial wells have increased (Lusczynski, 1952; Lusczynski and Swarzenski, 1966; Buxton and Shernoff, 1999; Stumm, 2001; Cartwright, 2002; Stumm and others, 2004). Sustainable management of the groundwater resources of the study area requires detailed knowledge of the hydrogeologic framework, the extent of saltwater intrusion into the groundwater system, and the effects of large cones of depression on changes in the saltwater–freshwater interface.
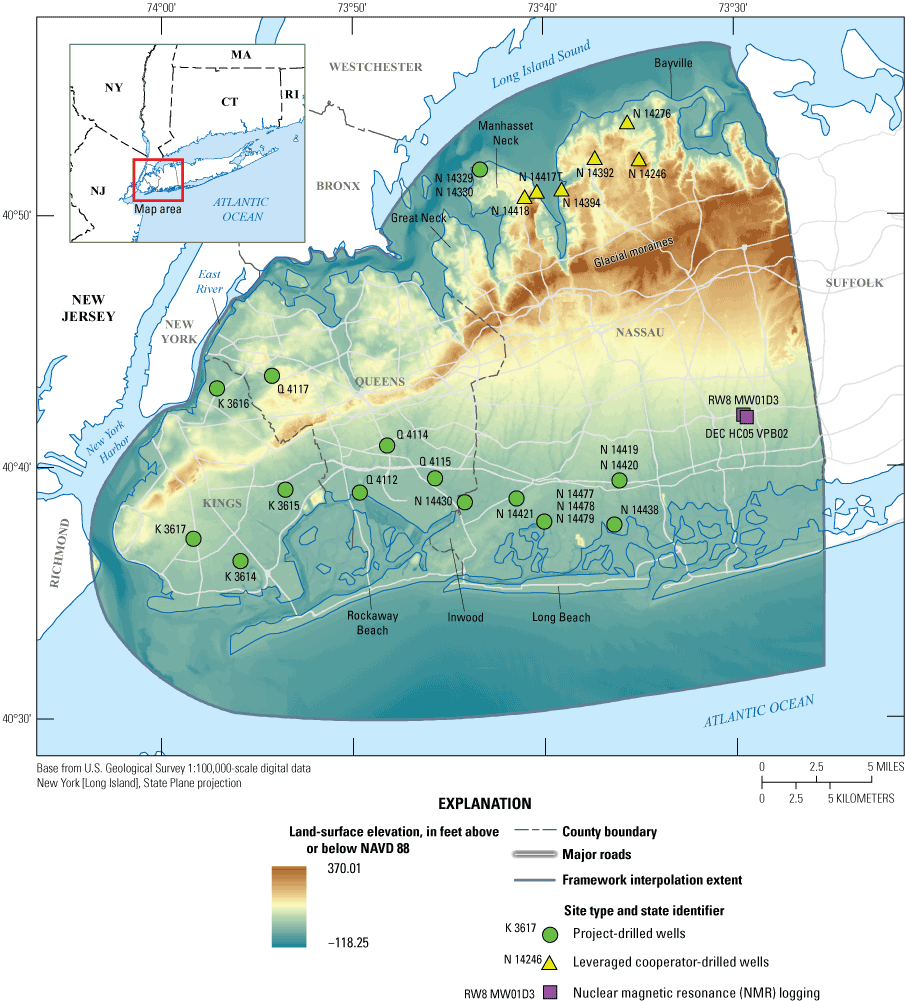
Location map of the study area in western Long Island, New York, including Kings, Queens, and Nassau Counties, showing regional and local context. Locations of project-drilled wells, leveraged cooperator-drilled wells, offshore bathymetry, and light detection and ranging (lidar) surface elevation are shown. NAVD 88, North American Vertical Datum of 1988.
The western Long Island study included: (1) evaluation of the current monitoring-well network; (2) drilling of new monitoring wells in areas of probable saltwater intrusion and where hydrogeologic data were needed; (3) collection of new and evaluation of historic geologic, hydrologic, geophysical (borehole, time-domain, and seismic) data, and water-quality data within the study area; and (4) compilation and analysis of these data to update the hydrogeologic framework and the extent of saltwater intrusion in the study area.
Purpose and Scope
This report (1) updates the hydrogeologic framework, (2) describes the groundwater-flow system, and (3) delineates the extent of saltwater intrusion within the major aquifers underlying Kings, Queens, and Nassau Counties in western Long Island, New York. It presents maps and hydrogeologic cross sections showing the extent and thickness of the hydrogeologic units, and maps and graphs showing the chloride concentrations within these units. This report also includes discussions of the theory and implementation of different geophysical techniques that can be used in water resource investigations.
Description of Study Area
The study area encompasses about 465 square miles (mi2) of land on western Long Island, New York, and surrounding offshore areas. Hydrogeological maps were created for a total of 754 square miles of offshore and onshore areas in the western part of Long Island, New York (fig. 1). The study area is bounded on the west by New York Harbor and the East River, on the north by Long Island Sound, on the east by Suffolk County, and on the south by the Atlantic Ocean. The populations of Kings, Queens, and Nassau Counties in 2021 were 2.6 million, 2.3 million, and 1.39 million, respectively (U.S. Census Bureau, 2022). The land surface elevations range from sea level along north, west, and the southern coastlines to more than 300 feet (ft) above the North American Vertical Datum of 1988 (NAVD 88) along the glacial moraines in the north-central parts of the study area (fig. 1). Land use in Kings and Queens Counties is primarily urban, and in Nassau County, it is primarily suburban.
Sources and Methods
Borehole lithologic logs, geophysical logs, core samples, horizontal-to-vertical spectral ratio (HVSR) soundings, time-domain electromagnetic (TDEM) soundings, and seismic-reflection surveys were analyzed to delineate the hydrogeologic framework of western Long Island. The locations of data-collection sites used in the analysis are shown in figures 2 and 3. The types and sources of borehole and other geophysical data used in the analysis are presented in table 1.
Table 1.
Types of data collection and sources of data in the study area, western Long Island, New York.[Locations for data collection are shown in figures 2 and 3; HVSR, horizontal-to-vertical spectral ratio; TDEM, time-domain electromagnetic]
| Data type | Database or data release | Publication |
|---|---|---|
| Borehole or well completion | National Water Information System | Leggette (1937, 1938a, b); Leggette and Brashears (1944); Buxton and Shernoff (1999) |
| Lithologic log | GeoLog Locator | Leggette (1937, 1938a, b); Leggette and Brashears (1944); Fluhr (1937a, b, c, 1954); Walter and Finkelstein (2020) |
| Lithologic log | Finkelstein and others (2024) | not applicable |
| Geophysical log(s) | GeoLog Locator | Stumm (2001); Stumm and others (2002, 2004) |
| Seismic survey | DeMott and others (2023b) | Stumm (2001); Stumm and others (2002, 2004); DeMott and others (2023c) |
| HVSR sounding | DeMott and others (2023b) | DeMott and others (2023c) |
| TDEM sounding | Como and others (2020) | Stumm and others (2020) |
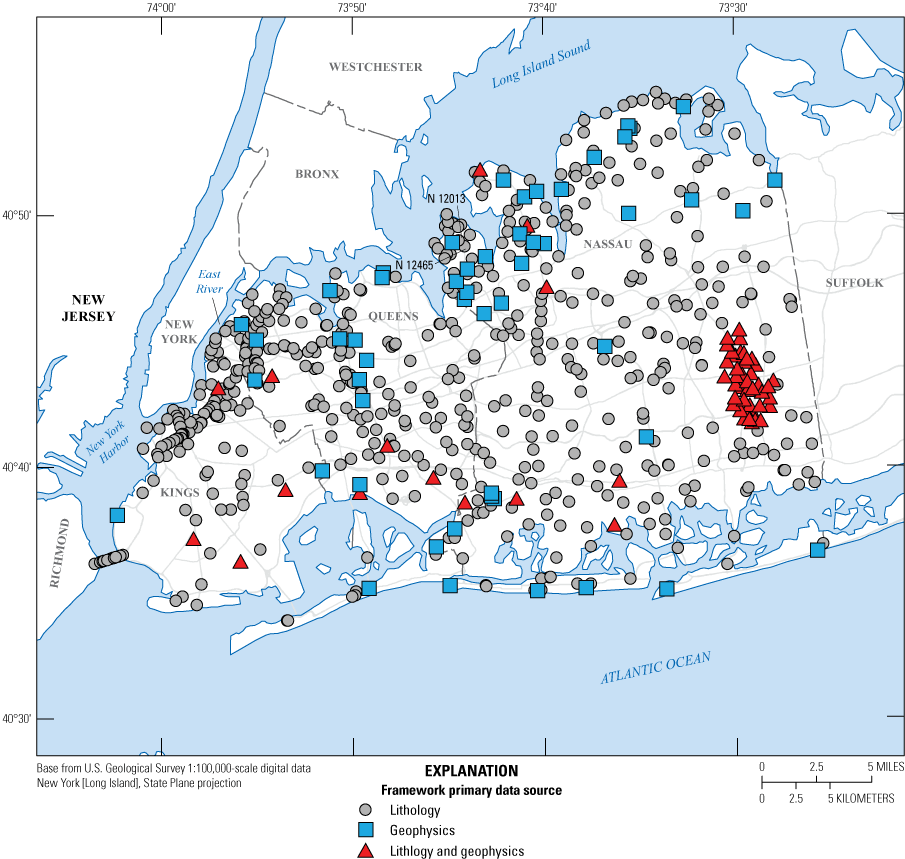
Map of borehole locations showing where lithologic logs, geophysical logs, or both were used to develop the hydrogeologic framework of the study area in western Long Island, New York. Two wells specifically discussed in the text are indicated on the map (N 12013 and N 12465).
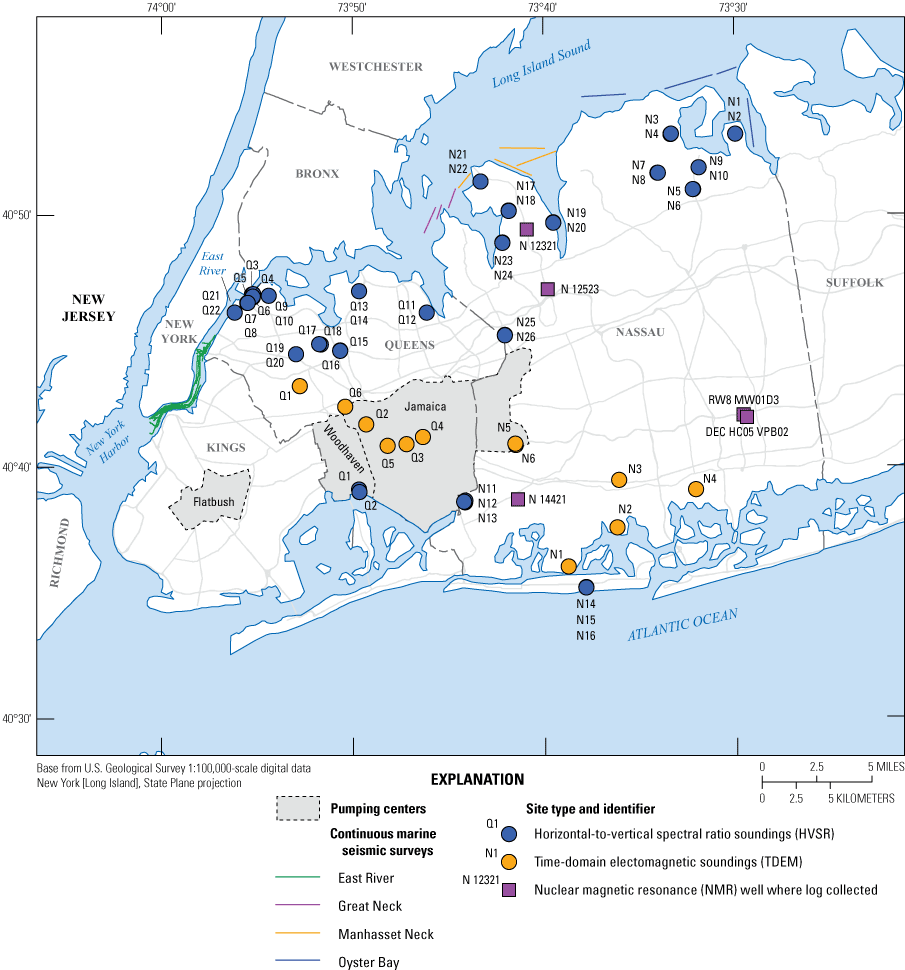
Map of the locations of pumping centers and where horizontal-to-vertical spectral ratio and time-domain electromagnetic soundings, nuclear magnetic resonance logging, and continuous marine seismic-reflection surveys were done in the study area in western Long Island, New York (Como and others, 2020; DeMott and others, 2023b).
Borehole Logs and New Borehole Drilling
Lithologic and geophysical logs from more than 650 borings, test holes, and wells were used in the framework analysis (fig. 2). During the period from 2019 to 2021, eighteen new boreholes were drilled for this study using the mud-rotary method (fig. 1; table 2). Core samples were obtained using split-spoon samplers at 20-ft intervals, when possible, except in selected intervals of the Cretaceous Raritan Formation, where 10-ft cores were collected. Core samples were examined and sample color was described using a Munsell color chart (Kollmorgan Instruments Corporation, 1994). Geophysical logs were collected in the mud-filled boreholes following installation of polyvinyl chloride (PVC) casing.
Table 2.
Site information, geophysical log, and hydraulic-test data collection from recently installed (2019–2021) wells, western Long Island, New York. (Data from U.S. Geological Survey, 2022b, c).[All depths are in feet below land surface. USGS, U.S. Geological Survey; ID, identifier; NMR, nuclear magnetic resonance; K, Kings County; N, Nassau County; Q, Queens County; U, data collected by U.S. Geological Survey; P, data collected by private company; —, data not collected]
Additional lithologic data used in the analysis were obtained from previous publications and legacy lithology logs, including deep observation wells with geophysical and lithologic logs that were collected during previous U.S. Geological Survey (USGS) studies (fig. 2; Chu and Stumm, 1995; Stumm, 2001; Cartwright, 2002; Stumm and others, 2002, 2004). Data from 50 deep boreholes that were cored and gamma-ray (gamma) logged by private contractors as part of a groundwater-plume investigation in southeastern Nassau County were also used in the analysis (fig. 2). Legacy lithologic logs utilized for the framework analysis were from New York Resources Commission publications (Leggette, 1938a, b; Leggette and Brashears, 1944; Roberts and Jaster, 1946, 1947; Johnson and others, 1958), from the Works Progress Administration (WPA) (Fluhr, 1937a, b, c), and geologic data from test borings taken for the Verrazzano-Narrows Bridge (Fluhr, 1954; fig. 2). The lithologic logs, which include descriptions of texture (gravel, sand, silt, and clay) and other characteristics, such as sorting, mineralogy, color, and the presence of lignite, as reported by drillers and geologists from drill cuttings and split-spoon core samples, are available in Finkelstein and others (2020) and the USGS GeoLog Locator (U.S. Geological Survey, 2022b).
A study by deLaguna (1948) highlighted the incomplete and vague descriptions of the subsurface in Kings and Queens Counties from the first half of the 20th century. Investigations of the hydrologic framework of Kings and Queens Counties have often produced conflicting results regarding the mapped extents and thicknesses of the major hydrogeologic units (deLaguna, 1948; Suter and others, 1949; Soren, 1971, 1978; Buxton and others, 1981; Buxton and Shernoff, 1999; Cartwright, 2002). This study uses the most complete dataset of subsurface geology available for western Long Island, including legacy lithologic descriptions, WPA descriptions of cores taken during well drilling, borehole geophysical logs, offshore seismic-reflection surveys, horizontal-to-vertical seismic surveys, and newly drilled and cored boreholes, to map the hydrogeologic framework of Kings, Queens, and Nassau Counties.
Geophysical logs collected during this and previous studies were analyzed to aid in mapping the hydrogeological framework in the study area. Geophysical logs are continuous digital records that reflect the physical properties of the sediments surrounding a borehole, fluids in the borehole and the surrounding formation, or both. Geophysical logs provide high-resolution information that may not be obtained by drill cores or water quality sampling alone. Borehole data varied from a single geophysical log (typically gamma) to a more complete log suite that included electric, electromagnetic induction (EM), temperature, and caliper logs. The geophysical logs used in these analyses are available for download from USGS GeoLog Locator (U.S. Geological Survey, 2022b).
For boreholes drilled for this study, gamma, spontaneous-potential (SP), single-point resistance (SPR), short- and long-normal resistivity (R), temperature, caliper, and EM logs were collected in mud-filled open boreholes at each site prior to the installation of PVC casing and screen (fig. 1; table 2) with the exception of K 3617, where only gamma and EM logs were collected. Only the deepest cased wells were logged using EM at each site. Nuclear magnetic resonance (NMR) logs were collected from selected wells through PVC casing (fig. 3; table 2). A typical example of a full suite of geophysical logs is presented in figure 4, and the different types of geophysical logs are described below.
Gamma logs provide a record of the total gamma radiation emitted by naturally occurring uranium, thorium, and potassium in a formation surrounding a borehole (Keys, 1990). Clays generally are more radioactive than the quartz sand that forms the bulk of the sediments on Long Island (fig. 4). Gamma logs were used for lithologic and stratigraphic correlation, and bed thickness.
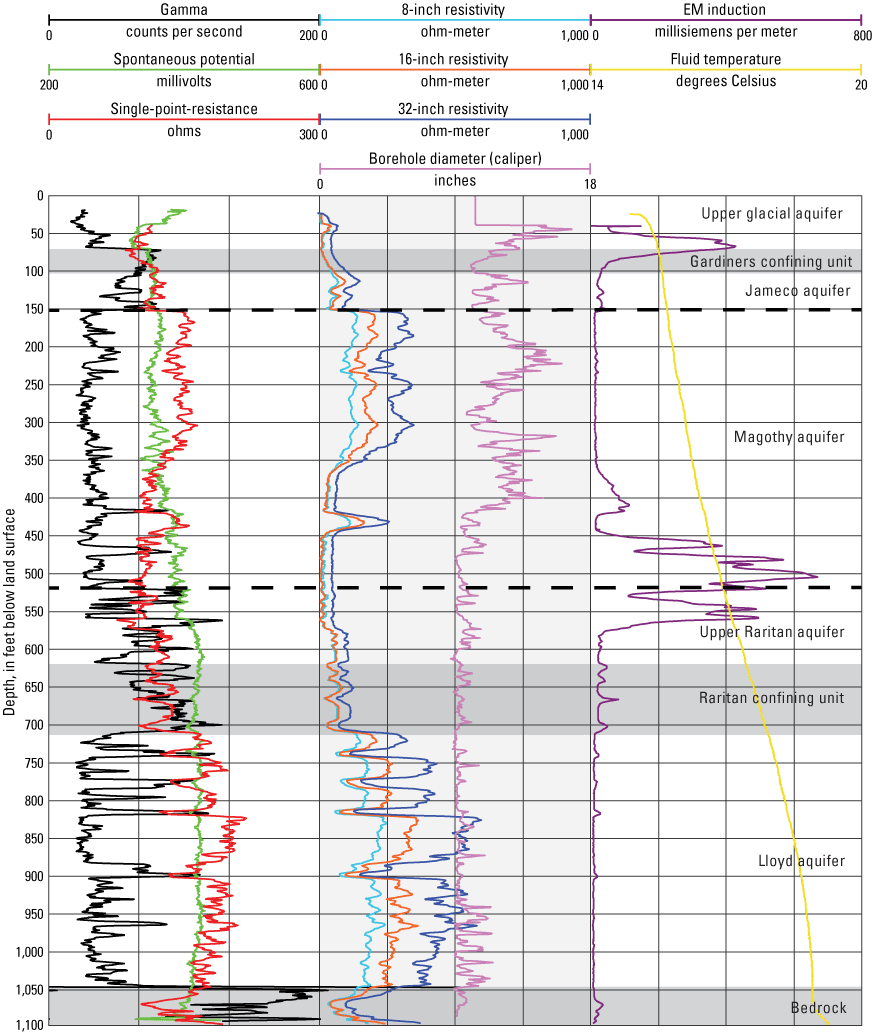
Graphs of a suite of geophysical logs collected in 2020 from well N 14430, Nassau County, New York (location of well shown in figs. 1, 3). Data are from U.S. Geological Survey (2022b). Dashed lines indicate extent of the Magothy aquifer.
SP logs provide a record of the electrical potential, or voltage, that develops at the contact between clays and sands penetrated by a borehole (Keys, 1990). SP differs from one formation to the next and is measured in millivolts (Serra, 1984). SP is a function of the chemical activity of the borehole fluid, water in the adjacent sediments, water temperature, and the type and quantity of clay. SP logs were useful in determining lithology, bed thickness, and salinity (fig. 4; Keys, 1990).
SPR logs provide a measure of the resistance in ohms between an electrode in the borehole and an electrode at land surface. The volume of surrounding material to which the SPR probe is sensitive is spherical and only 5 to 10 times the electrode diameter, and is affected by the borehole fluid (Keys, 1990). SPR logs were used to obtain high-resolution lithologic information (fig. 4).
Normal-R logs measure apparent resistivity in ohm-meters and are used to interpret lithology and water salinity (fig. 4; Keys, 1990). This technique uses four electrodes typically spaced 8 to 64 inches apart in the borehole, called short- and long-normal logs, respectively. The volume of surrounding material to which normal-R probes are sensitive is spherical, with a diameter about twice the electrode spacing (Serra, 1984; Keys, 1990).
Temperature logs are the continuous measurement of the temperature of the fluid column as a function of depth in degrees centigrade and can provide information on the materials immediately surrounding a borehole (Keys and MacCary, 1971; Keys, 1990). Because the temperature sensor only records the temperature of the water or air in the immediate vicinity of the sensor, measured temperatures may indicate the temperature of adjacent geologic materials and their contained fluids. Rock temperature may be indicated if no flow exists in the borehole and if equilibrium exists between the temperature of the fluid in the well and the temperature of the adjacent geologic materials. If there is no flow in or adjacent to a borehole, then the temperature gradually will increase with depth as a normal function of geothermal gradient (Keys and MacCary, 1971; Keys, 1990).
EM logs measure formation conductivity and are used in conjunction with gamma logs for distinguishing between conductive fluids and conductive clays (fig. 4). This technique uses an electromagnetic emitter coil that induces current loops within the surrounding formation to generate a secondary electromagnetic field. The intensity of the secondary field received by the receiver coil is proportional to the formation conductivity (fig. 4; Keys and MacCary, 1971; Serra, 1984; McNeill, 1986; Taylor and others, 1989; Keys, 1990). EM logs are measured in units of millisiemens per meter (mS/m) and are inversely related to the ohm-meter value of normal-R logs (Keys and MacCary, 1971; Serra, 1984; Keys, 1990).
The normally low conductivity of geologic sediments underlying Long Island is favorable for induction logging to delineate highly conductive fluids such as saltwater or leachate. EM logging has been used on Long Island to delineate the saltwater interface (Stumm, 1993, 1994, 2001; Stumm and Lange, 1994, 1996; Chu and Stumm, 1995; Stumm and others, 2002). Metzger and Izbicki (2013) and Prinos and Valderrama (2016) correlated EM log responses to chloride concentrations and produced log-based equations to estimate concentrations of chloride from EM logs. A linear relationship between chloride concentration and the response of EM logs in aquifers on Long Island was determined by Stumm and Como (2017). Chloride concentrations can be estimated from this linear relationship using EM logs for aquifers penetrated by a PVC-cased well.
The least-squares regression equation of Stumm and Como (2017) that is used to relate changes in EM conductivity to changes in chloride concentration in groundwater penetrated by the logged wells is:
whereCl
is the chloride concentration, in milligrams per liter (mg/L) in groundwater from screen zones of wells and filter press samples from cores, and
EM
is the peak electromagnetic conductivity, in millisiemens per meter from the EM conductivity geophysical log.
NMR logs measure the induced magnetic moment of hydrogen protons contained within the fluid-filled pore spaces of porous media. Unlike other geophysical logs that respond to the rock matrix and fluid properties and are strongly dependent on mineralogy, NMR logs respond to the presence of hydrogen protons in the formation fluid to determine water content or fraction (equivalent to porosity in the saturated zone) and pore-size distribution (bound versus mobile water; Dlubac and others, 2013). NMR logs can be used to estimate vertically continuous porosity and hydraulic conductivity in an adjacent formation using equations and compilations of regressions determined from published collocated hydraulic tests of unconsolidated aquifers (Walsh and others, 2013; Knight and others, 2016; Kendrick and others, 2021).
NMR logs were collected from five monitoring wells in Nassau County (fig. 3; table 2) and were analyzed to determine clay-bound, capillary-bound, and mobile water content or fraction, and to estimate hydraulic conductivity of aquifers and confining units.
During 2019, NMR logs were collected from monitoring wells N 12321, N 12523, and N 14421 using the NMRSA (NMR Services Australia) BMR90 logging tool (fig. 3; table 2). During the period from 2021–22, NMR logs were collected using a Vista Clara JPY300 logging tool from monitoring wells N 12321, RW8 MW01D3, and DEC HC05 VPB02. Selected intervals of well N 14421 had NMR logs collected using a Vista Clara JPY300 logging tool and were described and analyzed by Stumm and Williams (2022). As shown in figure 5, NMR logs collected with the BMR90 and JPY300 tools produced similar estimates of total porosity and clay-bound, capillary-bound, and mobile water content.
Hydraulic conductivity was estimated from NMR logs collected using the JPY300 tool by using the sum of squared echoes (SOE) equation (Walsh and others, 2013). The SOE equation is
wherek
is the horizontal hydraulic conductivity in feet per day (ft/d),
CSOE
is an empirically derived constant,
S(t)
describes the echo decay curve, and
dt
derivative of time.
In the present application, a constant of 1.38×10⁴ was used based on compilations of regressions determined from published colocated hydraulic tests of unconsolidated aquifers (Walsh and others, 2013; Knight and others, 2016; Kendrick and others, 2021). Hydraulic conductivity was estimated from the NMR logs collected with the BMR90 tool using the Schlumberger-Doll Research (SDR) equation (Walsh and others, 2013). The SDR equation is
wherek
is the horizontal hydraulic conductivity, in feet per day
ϕNMR
is the NMR-derived porosity,
T2ml
is the logarithmic mean of the T2 distribution (spin echo decay time), and
CSDR, a, and b
are empirically derived constants.
In the present application, a=2, b=1, and CSDR was visually scaled so that the hydraulic conductivity estimates from the SDR equation best matched those from the SOE equation for borehole intervals where NMR logs were collected with both the JPY300 and BMR90 tools (fig. 5).
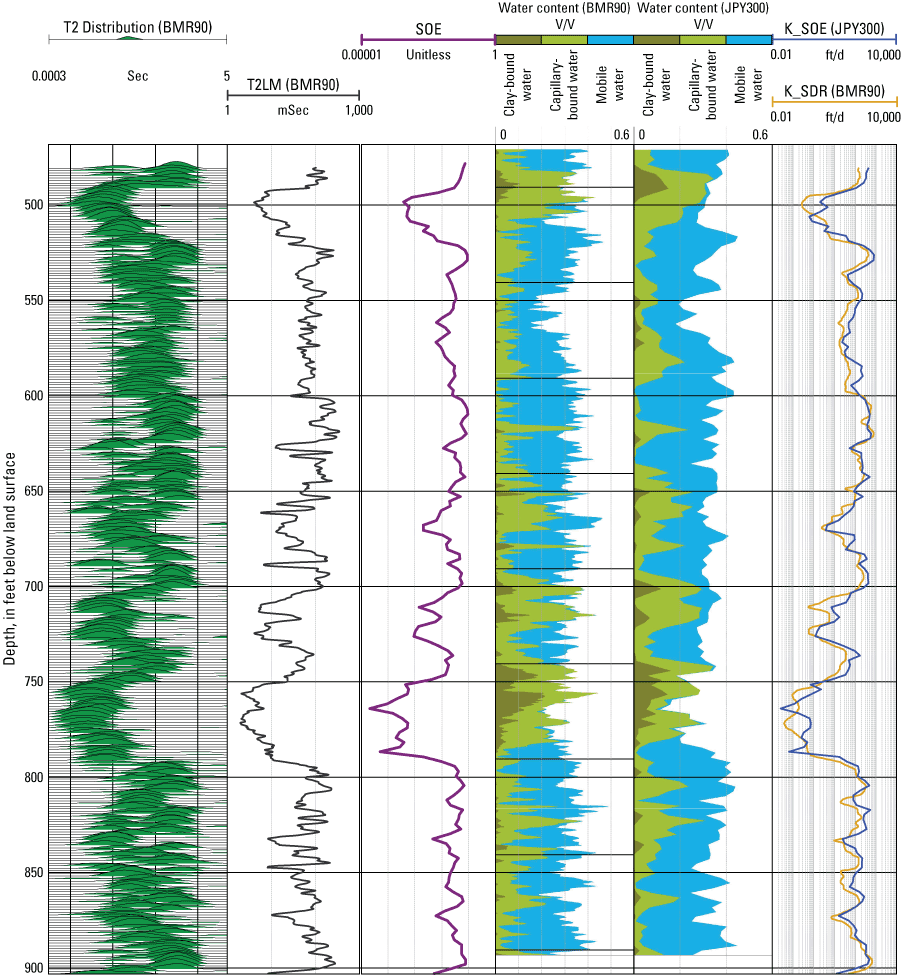
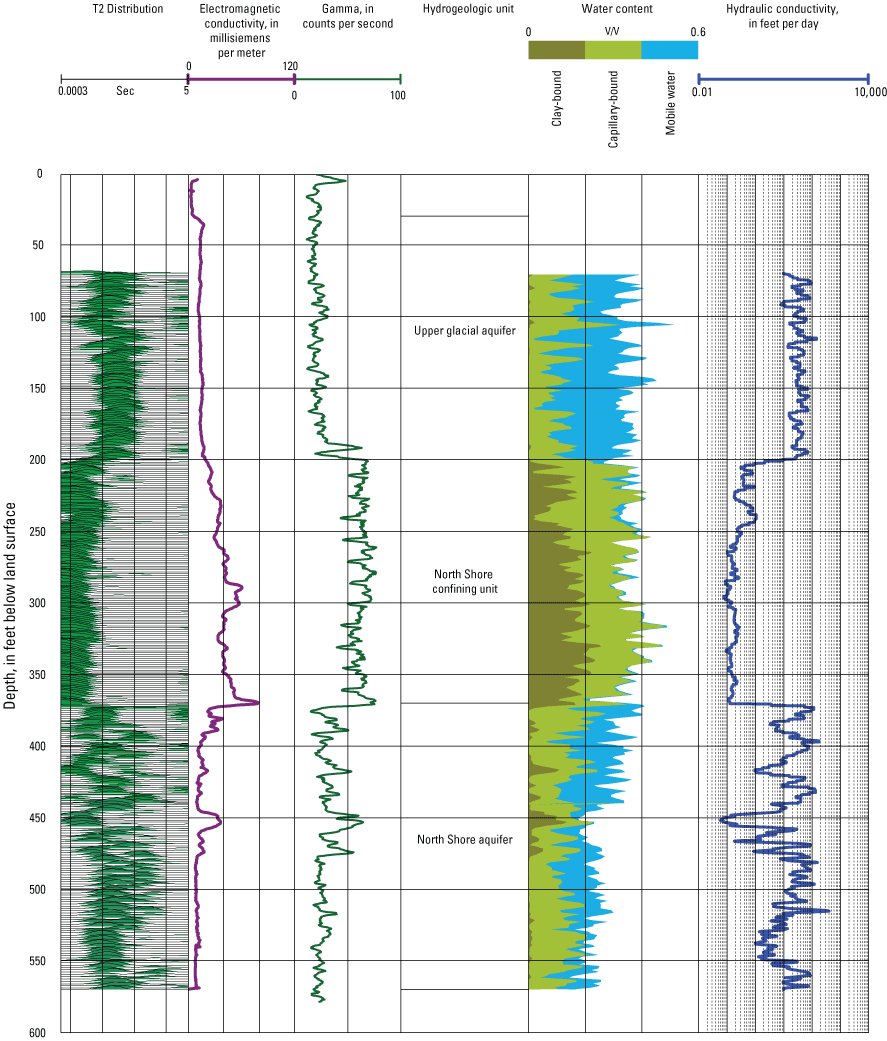
Graphs of nuclear magnetic resonance (NMR) logs collected in 2021 showing a comparison of the estimated water content and hydraulic conductivity using a Vista Clara JPY300 tool and a NMRSA BMR90 tool from the 480–900-foot depth interval in well N 14421, Nassau County, New York (location of well shown in figs. 1, 3). T2LM, geometric mean of T2 distribution; SOE; sum of squared echoes; mSec, milliseconds; Sec, seconds; K_SOE, hydraulic conductivity using sum of squared echoes equation; K_SDR, hydraulic conductivity using the Schlumberger-Doll Research equation; ft/d, feet per day; V/V, porosity. Data are from U.S. Geological Survey (2022b).
Horizontal-to-Vertical Spectral Ratio (HVSR) Soundings
HVSR soundings were made at 22 sites as part of a previous study of the depth to bedrock in New York City (fig. 3; DeMott and others, 2023b) These data were used to inform the hydrogeologic framework of western Long Island. HVSR soundings are a passive seismic method that is used to estimate the thickness of unconsolidated sediments and depth to bedrock (Lane and others, 2008). This passive seismic method uses a single broad-band three-component (two horizontal and one vertical) seismometer to record ambient seismic noise. The seismic noise induces resonance at frequencies that range from about 0.3 to 40 hertz in areas that have a strong acoustic contrast between the bedrock and overlying sediments. The ratio of the average horizontal-to-vertical spectrums produces a spectral-ratio curve that can be used with an average shear-wave velocity or a power-law regression equation to estimate sediment thickness and depth to bedrock.
The depth to bedrock was estimated from HVSR soundings using an empirical equation established between measured resonance frequencies and reported depths to bedrock at nearby wells for 15 sites in New York City, and for reported depths to bedrock that are less than 600 ft on Long Island (DeMott and others, 2023b). The power-law regression equation with a r2 of 0.837 is as follows:
whereFor depths to bedrock greater than 600 ft (DeMott and others, 2023b), a power-law regression equation with a r2 of 0.948:
whereTime-Domain Electromagnetic (TDEM) Soundings
TDEM soundings made at 12 sites (fig. 3) from 2017 to 2019 were used in this study. The TDEM sounding method uses a transmitter to drive an electrical current through a square loop of insulated cable on the ground and a receiver to measure the current induced in the subsurface. The time-variant nature of the primary electromagnetic field creates a secondary electromagnetic field in the ground beneath the loop that generally mirrors the primary field of the transmitter loop (Christiansen and others, 2006; North Carolina Division of Water Resources, 2006). This secondary field immediately begins to decay, generating additional eddy currents that propagate downward and outward into the subsurface (U.S. Army Corps of Engineers, 1995).
The signal strength of the decaying currents at specific times and depths is controlled by the bulk conductivity of the subsurface, including the conductivity of subsurface rock and sediment units and their contained fluids (Fitterman and Stewart, 1986; Stewart and Gay, 1986; McNeill, 1994; Auken and others, 2008). The depth investigated in a study depends upon the ability of the equipment used to monitor the early and late arrival times of the transient signal.
TDEM sounding locations were selected based on several factors, including locations where saltwater was suspected to be in the subsurface, site access, amount of open space to accommodate wire loop sizes, and the need to minimize electromagnetic interference. Soundings made at sites near power lines and buried utilities have a higher likelihood of electromagnetic interference due to these anthropogenic sources of signal “noise.” The soundings were made using 20-, 40-, or 100-meter square transmitter loops. Generally, the largest possible loop size was used at any location to increase the likelihood of obtaining the deepest aquifer measurements (Payne and Teeple, 2011). The data from each sounding were used to develop layered- and smoothed-earth resistivity models for each location and to calculate apparent resistivity to depths of about 375–1,100 ft below land surface (Como and others, 2020; Stumm and others, 2020).
Marine Seismic-Reflection Surveys
Marine seismic-reflection surveys were conducted near Great Neck, Manhasset Neck, and Oyster Bay along the northern coast of Nassau County during 1999–2003 (Stumm, 2001; Stumm and others, 2002, 2004), and in the East River from the southern part of Roosevelt Island to the northeastern part of New York Harbor during 1999 (DeMott and others, 2023a). A marine seismic reflection survey is conducted by using a boat-towed sound source that creates signals in the form of sound energy. These signals travel through the water column and partially penetrate the sediments at and underlying the sea floor. The reflected signal returns are measured by boat-towed hydrophones. Changes in the acoustic impedance (a product of the density and acoustic velocity of each medium) indicate where the seabed and stratigraphic interfaces are located (Haeni, 1986, 1988; Robinson and Çoruh, 1988). These seismic surveys were used to better define the bedrock surface and characterize the unconsolidated sediments in offshore areas of the study area (Stumm, 2001; Stumm and others, 2002, 2004; DeMott and others, 2023a, b, c). Applications of this geophysical technique for characterization of unconsolidated sediments in the subsurface and delineation of the bedrock surface for hydrogeologic and water-resource studies have been described by Haeni (1986, 1988), Reynolds and Williams (1988), and Stumm (2001). These marine seismic-reflection data were incorporated into this hydrogeologic framework analysis (fig. 3).
Hydraulic Tests
Hydraulic properties of the underlying Kings, Queens, and Nassau Counties hydrogeologic units were compiled from published single- and multiple-well aquifer tests and specific-capacity tests. Additional specific-capacity tests were also collected and analyzed for selected wells installed as part of this investigation. Estimates of hydraulic properties associated with specific wells are stored in the USGS National Water Information System (NWIS) database (U.S. Geological Survey, 2022c). In the NWIS, hydraulic test results can be searched for by using various parameters, including site ID, test type, aquifer, and publication; then viewed; and can be downloaded using the Aquifer Test Locator graphical user interface and mapper (U.S. Geological Survey, 2022a).
McClymonds and Franke (1972) presented estimates of the transmissivity and hydraulic conductivity of aquifer sediments at 57 sites in Queens and Nassau Counties. The analyses include both single and multiple well tests to determine hydraulic conductivity in the North Shore, Magothy, and Lloyd aquifers using methods discussed in Cooper and Jacob (1946) and Theis and others (1954). In addition, aquifer properties of transmissivity, hydraulic conductivity, and storage were estimated at seven sites in the Magothy aquifer using numerical radial-flow models (Lindner and Reilly, 1982; Aronson and others, 1983; Prince and Schneider, 1989; Cartwright, 1997).
Williams and others (2020) estimated the transmissivity of aquifer sediments in the upper glacial, North Shore, Magothy, and Lloyd aquifers from specific-capacity tests performed at 447 production-well sites in Kings, Queens, and Nassau Counties. Transmissivities were estimated using the method described by Bradbury and Rothschild (1985). As part of this investigation, transmissivity estimated from the specific-capacity tests of the unconfined upper glacial aquifer was corrected for partial penetration using the method described by Brons and Marting (1961).
Hydraulic conductivity was estimated by assuming that the top of an aquifer was at the prepumping water level and that the bottom of the aquifer was at the base of the screen. An unconfined storage coefficient of 0.25 was assumed. The transmissivity estimated from specific-capacity tests of the Jameco aquifer was corrected for partial penetration, and the hydraulic conductivity was estimated by assuming the top of aquifer to be the bottom of the overlying Gardiners confining unit (Finkelstein and others, 2024), and the bottom of the aquifer to be at the base of the screen. A storage coefficient of 2×10⁻⁵ was assumed for the confined aquifer.
Specific-capacity tests were conducted at 13 monitoring wells installed between 2019 and 2022 as part of this investigation. These wells were screened in the upper glacial, North Shore, Magothy, and Lloyd aquifers in Kings, Queens, and Nassau Counties (fig. 1, table 2). A submersible pump was used to pump the wells at a constant rate; pumping rates varied between well sites from 6.8 to 30 gallons per minute. Static and pumping water levels were manually measured with an electric tape. A Level TROLL 700 30 PSI transducer manufactured by In-Situ that was programmed to record water levels in logarithmic mode with a maximum time interval of 1 minute was used at some sites. The specific-capacity tests were analyzed following the method of Bradbury and Rothschild (1985) to estimate transmissivity. Partial penetration of the wells was accounted for, and hydraulic conductivity estimated for the North Shore and Lloyd aquifers where aquifer thickness could be determined from the geophysical and core logs. A confined storage coefficient of 2×10⁻⁵ was assumed for the confined aquifers.
Compilation and Synthesis of Lithologic Data
Lithologic and geophysical logs from new and existing boreholes were analyzed, and hydrogeologic information was inferred based on driller’s logs and geologist’s descriptions, geophysical logs, or both. The borehole data guided the delineation of contacts between different hydrogeologic units, thus allowing identification of the surface elevation of each unit. However, differentiation between hydrologic units is not completely implied, and knowledge of the geologic framework must be used to determine what sediment types are expected to be within each unit. The lithologic data were used to populate a database in a geographic information system (GIS). All geoprocessing was done by using ArcGIS Desktop 10.8.1 (Esri, 2020).
The hydrogeologic surfaces for Kings, Queens, and Nassau Counties were interpolated using the data sources as described in previous sections. The hydrogeological surfaces point data and associated vertical data were used to define the three-dimensional surfaces of the major hydrogeologic surfaces in Kings, Queens, and Nassau Counties. The surfaces for the following hydrogeological units were interpolated and mapped from geophysical logs: upper glacial aquifer, glacial semiconfined aquifer, Gardiners confining unit, Jameco aquifer, North Shore confining unit, North Shore aquifer, Magothy aquifer, upper Raritan aquifer, Raritan confining unit, and Lloyd aquifer. The bottom of the hydrogeologic framework is the bedrock surface. The surface of the upper glacial aquifer, which is the uppermost unit, is land surface as estimated from high-resolution light detection and ranging (lidar) data (USGS, 2016).
About 650 lithologic, geophysical, or combined lithological and geophysical logs were examined, and more than 1,700 unique elevation points representing distinct geologic units were defined when summing the points for all the surfaces. Contour lines and extents were drawn based on the assigned elevation point data for each surface and were digitized at a 50-ft interval, representing the surface of each geological unit. The points, contour lines, and extents were used as inputs to create an interpolated surface using the Topo to Raster tool in ArcMap (Esri, 2020). The Topo to Raster tool was used because it can incorporate points, contour lines, and boundary extents as inputs for interpolations. All surfaces were interpolated on coincident grids with a uniform discretization of 100 ft. A 1-ft minimum thickness was imposed on each unit (where present) to ensure a continuous hydrogeologic framework in three dimensions and to facilitate its later use in a groundwater model of the system. Where a unit is not present, it is implied to have a 0-ft thickness. The only exception to the interpolation methodology is the bedrock surface elevation for Kings and Queens Counties as described in DeMott and others (2023c).
Limitations
Development of the hydrogeologic framework surfaces for Kings, Queens, and Nassau Counties came with some challenges. Due to data gaps and data availability, additional checking and postprocessing of the interpolated hydrogeologic surfaces were performed.
The hydrogeologic surfaces were interpolated independently of one another, which can result in interpolation artifacts in areas where the surface elevations of some units are not in stratigraphic or depositional order, or where units are very thin. As an example, some interpolated grid cells within the Magothy aquifer surface had an elevation greater than the corresponding grid cells for the Gardiners confining unit surface. The Gardiners confining unit overlies the Magothy aquifer, so the interpolated grid cells for the Magothy aquifer that were higher than the Gardiners confining unit resulted in a negative thickness for the Gardiners confining unit. This situation mostly occurred in areas with sparse data and away from point and contour data. These occurrences were expected because of data gaps and the number of interpolated hydrogeologic surfaces in the framework.
Interpolation artifacts were adjusted through use of the Raster Calculator tool (Esri, 2020) by either raising or lowering the elevation of the surfaces at locations where there was a conflict with the elevation of another surface. In the example given above for the interpolated cells from the Magothy aquifer, the problematic grid cells for the Magothy aquifer surface were lowered so that they were 1 ft less than and below the Gardiners confining unit. The surface elevations published in the accompanying data release (Finkelstein and others, 2024) accounted for all of the changes that were needed to keep the elevations of each unit in the correct depositional order with a 1-ft minimum thickness for each unit.
Mapping the erosional extents for each hydrogeologic unit was simplified by avoiding the contouring of each unit pinching out at its extent boundary. Trying to represent the erosional surfaces would have been difficult due to a lack of lithologic data present along the unit extents. This mostly occurred along the buried valley edges where the North Shore units are in contact with the Cretaceous units. It was determined that ending each surface abruptly, creating cliff-like features along the extents, was easier for the GIS to interpolate. Incorporating the contours necessary to represent the erosion yielded more complex surfaces with interpolation artifacts that were not desired.
Because no single, high-resolution land-surface raster for Long Island exists, lidar data from multiple sources were merged to create a seamless top surface for Long Island and the surrounding waterways. For most of the study area, a topobathymetric elevation model of New England that covers all of Long Island except for the westernmost part of Kings County was used (U.S. Geological Survey, 2016). The section of Kings County that was not covered by the topobathymetric elevation model was supplemented by National Elevation Data (U.S. Geological Survey, 2013), and data for offshore areas surrounding Kings County were obtained from the U.S. Geological Survey (2015). All lidar data were resampled to match the 100-ft grid discretization being used for the hydrogeologic framework data surfaces.
For this report, most of the chloride data used was obtained from the USGS NWIS database (U.S. Geological Survey, 2022c). Supplementary chloride data was obtained from USGS records consisting of hand-written field sheets, and while the accuracy and field methods used for obtaining these data are unknown, repeated field visitations were carefully documented by date, time, and location, with a corresponding chloride concentration recorded in mg/L. These data appear to correlate well with nearby chloride samples that were collected and within the USGS NWIS database. Some chloride data were estimated from geophysical logs using equation 1. The authors were able to analyze and archive the historical and geophysical data in a uniform chloride concentration database, which was published in an accompanying data release (Finkelstein and others, 2024).
Hydrogeologic Framework
The groundwater resources of Long Island were first studied by Veatch and others (1906), who described the geologic sediments and occurrence of groundwater throughout Long Island. Fuller (1914) revised and supplemented much of the earlier geologic work. The geologic correlations used herein are revised from those of Fuller (1914), Zapecza (1984), and Sirkin (1986). Driller’s logs were utilized to refine the hydrogeologic framework within the study area (Leggette, 1938a, b; Leggette and Brashears, 1944; Roberts and Jaster, 1946, 1947; Johnson and others, 1958). Geologic log descriptions from the WPA (Fluhr, 1937a, b, c) and test-boring descriptions from the Verrazzano-Narrows Bridge that connects the New York City Boroughs of Staten Island and Brooklyn (Fluhr, 1954) were also used to map the hydrogeology in the study area. Suter and others (1949) created contour maps for the upper surface of the major geologic units underlying Long Island. Brown and others (1972) correlated Cretaceous coastal plain sediments from Long Island with sediments of the same age in the mid-Atlantic states. Smolensky and others (1990) updated the hydrogeologic framework of Long Island with contour maps of the upper surfaces of the major hydrogeologic units, but depicted the Pleistocene sediments as a single, generalized unit, which is not the case.
Several studies have outlined the hydrogeologic framework of all or parts of Long Island. For example, Sanford (1938) mapped the hydrogeologic framework of Kings and Queens Counties; deLaguna (1948) mapped the subsurface of Kings County; and Soren (1971, 1978), Buxton and others (1981), and Buxton and Shernoff (1999) mapped the hydrogeologic framework of Kings and Queens Counties, primarily using driller’s logs. Swarzenski (1964) described the hydrogeology and hydrologic conditions of northwestern Nassau County for the period 1955–57, and many of his interpretations and general hydrogeologic framework were verified by drill-core and marine seismic-reflection data. Perlmutter and Geraghty (1963) and Lusczynski and Swarzenski (1966) mapped the saltwater interface in southeastern Queens County and southwestern Nassau County. Isbister (1966) described the hydrogeology and hydrologic conditions of the northern part of Oyster Bay in Nassau County during the period 1958–60. Kilburn (1979) mapped the hydrogeologic framework of North Hempstead in Nassau County based on driller’s logs. Kilburn and Krulikas (1987) used driller’s logs to remap and rename parts of the hydrogeologic framework in the northern section of the Town of Oyster Bay. The hydrogeologic framework in northern Nassau County was remapped by Stumm (2001) and Stumm and others (2002, 2004), resulting in the identification of the North Shore aquifer and North Shore confining unit. Walter and Finkelstein (2020) compiled about 1,800 driller’s and geologist’s logs to produce texture descriptions for the upper glacial and Magothy aquifers throughout Long Island.
Long Island is underlain by crystalline bedrock that is mostly overlain by a thick wedge of unconsolidated coastal-plain sediments that have a thickness ranging from less than 1 ft in northwestern Queens County to more than 2,000 ft in southeastern Nassau County (fig. 6). There are a few isolated bedrock outcrops in northwestern Queens County. In places, the sediments overlying the bedrock are unconsolidated Upper Cretaceous coastal-plain sediments consisting of gravel, sand, silt, and clay, and in other places, there are unconsolidated Pleistocene glacial sediments overlying the bedrock. These unconsolidated sediments overlying the bedrock form the hydrogeologic framework of Long Island.
The relations between hydrogeologic and geologic units and their general descriptions, are shown in table 3. Cretaceous and Pleistocene geologic units were identified by their lithology and stratigraphic position. The geologic and hydrologic units of Long Island used here were described by Suter and others (1949), Perlmutter and Geraghty (1963), and Smolensky and others (1990). Geologic correlations are revised from those of Fuller (1914), Sanford (1938), Swarzenski (1964), and Kilburn (1979). Regional correlations of Cretaceous coastal-plain sediments from Long Island are based upon lithologic descriptions, core samples, pollen analyses, and gamma-log patterns (Brown and others, 1972; Zapecza, 1984; Sirkin, 1986). The drill-core data and geophysical logs obtained in this study provide a basis for the naming of a hydrogeologic unit: the upper Raritan aquifer. All other geologic and hydrologic unit names used in this report are names currently used by the USGS (2022d).
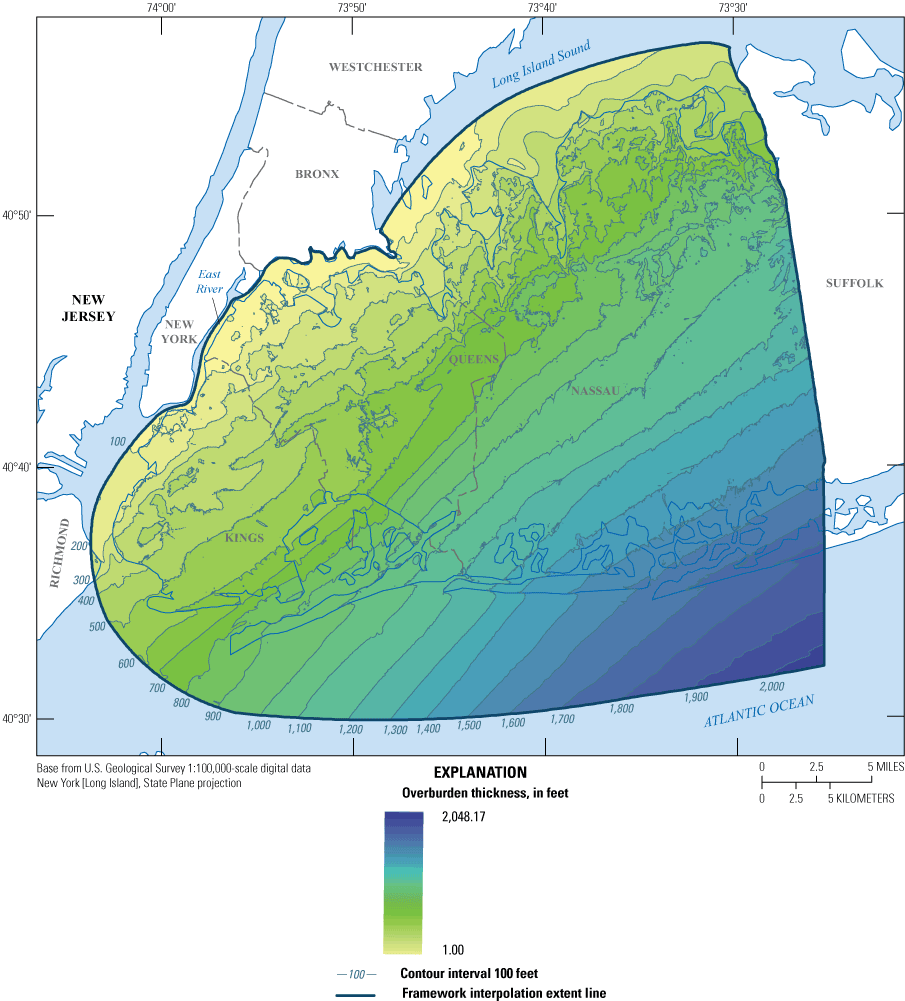
Isopach map showing thickness of Pleistocene and Cretaceous sediments combined (overburden), western Long Island, New York.
This study describes the hydrogeologic framework of the major hydrogeologic units underlying western Long Island that are discussed in more detail in the following sections. A link to an interactive web viewer that accompanies the report and presents the mapped hydrogeologic unit surfaces is accessible through the associated data release (Finkelstein and others, 2024).
Table 3.
Major hydrogeologic units in the aquifer system of western Long Island, New York.[ft/d, foot per day; NMR, nuclear magnetic resonance]
Bedrock
The bedrock underlying the study area has been mapped previously as a structurally complex assemblage of high-grade metamorphic rocks, including gneiss, schist, amphibolite, marble, granite, and serpentinite. The bedrock assemblage is Precambrian to Paleozoic, and is part of the Hartland Formation (Veatch and others, 1906; Fuller, 1914; Sanford, 1938; Suter and others, 1949; Merguerian and Baskerville, 1987; Baskerville and Mose, 1989; Baskerville, 1992; Merguerian and Sanders, 1993; Brock and Brock, 2001). Small bedrock outcrops are present as isolated exposures in the northwesternmost part of Queens County.
The bedrock surface generally consists of a saprolite or weathered rock layer that is absent in the northern and northwestern parts of the study area where it was removed by glacial erosion and solid bedrock is encountered, to an average of about 50 ft thick south of the moraine (fig. 1). The weathered zone generally appears as a transition from clay above to partially weathered bedrock below, and consists mostly of white, yellow, and gray clay with quartz fragments, and shows relict foliation in places. This weathered zone was previously interpreted in many of the references mentioned in the previous paragraph to be clay or clayey gravel above the bedrock surface. In the northern parts of Kings and Queens Counties, narrow, buried, U-shaped valleys and isolated knobs and depressions are present, indicating localized erosion of the bedrock surface (fig. 7). The bedrock forms a relatively impermeable boundary for the groundwater flow system on Long Island (McClymonds and Franke, 1972).
The bedrock surface was mapped to include the saprolite zone where it is present. In general, the bedrock slopes toward the southeast, except in northwestern Queens and Kings Counties and in northern Nassau County, where glacial erosion has removed the saprolite and mostly solid bedrock remains (figs. 7, 8, 9; Stumm, 2001; Stumm and others, 2002, 2004). The highest elevation of the bedrock surface is about 16 ft above NAVD 88 in these areas. The lowest elevation is in the southeasternmost corner of the study area just offshore of the Nassau and Suffolk County border, where the elevation is more than 2,000 ft below NAVD 88 (fig. 7).
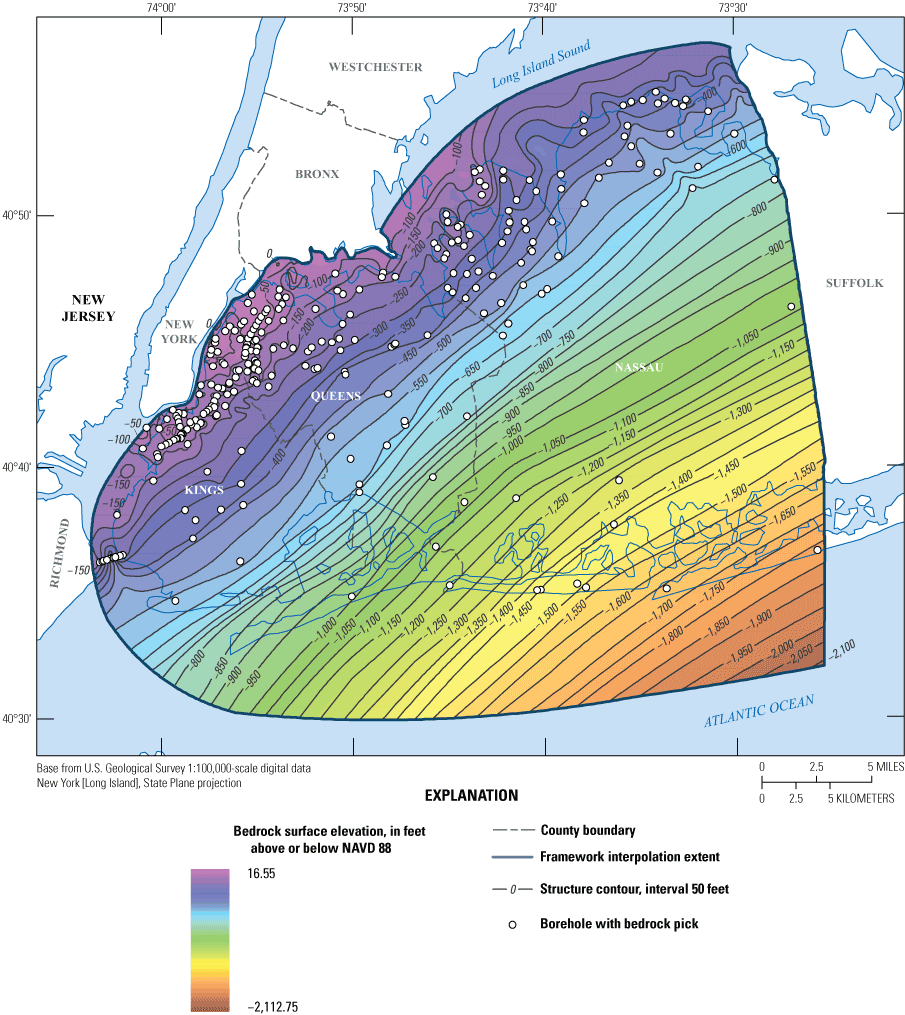
Map of interpolation data and surface elevation of bedrock underlying Kings, Queens, and Nassau Counties, New York. NAVD 88, North American Vertical Datum of 1988.
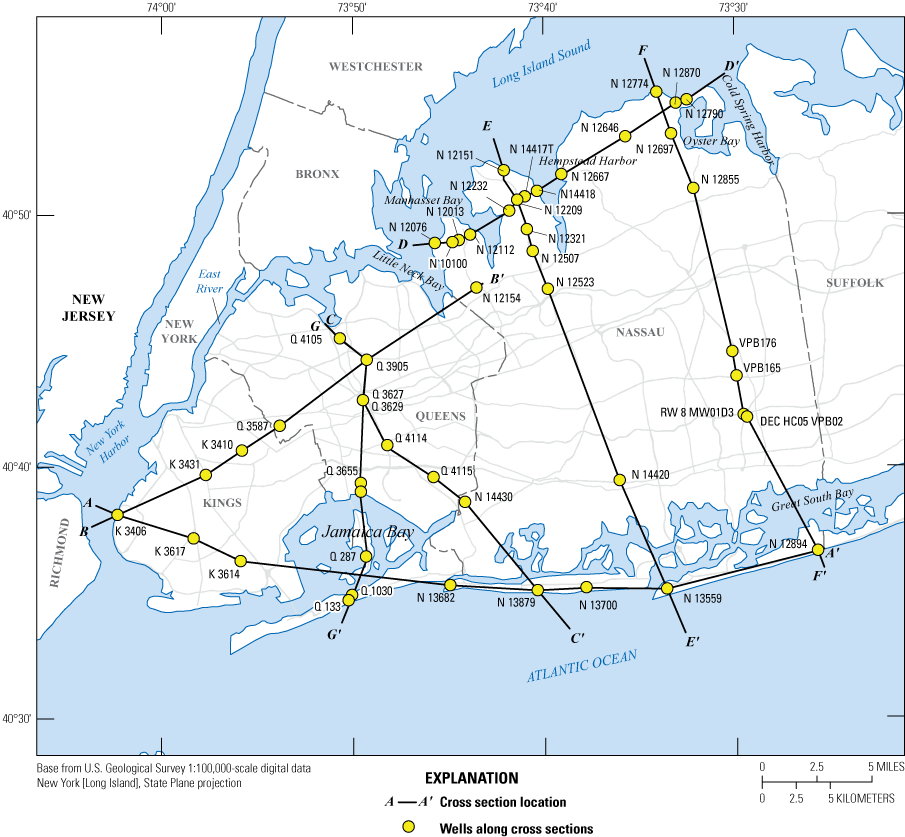
Map showing locations of boreholes along hydrogeologic cross-sections A–A′ through G–G′ in the study area in Kings, Queens, and Nassau Counties, New York.
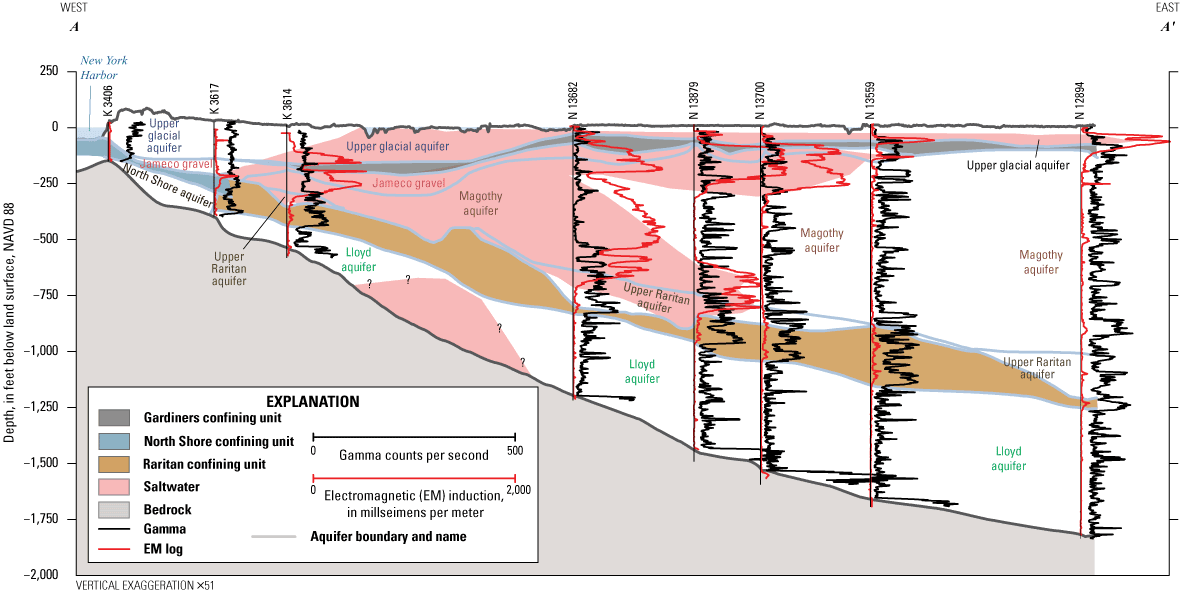
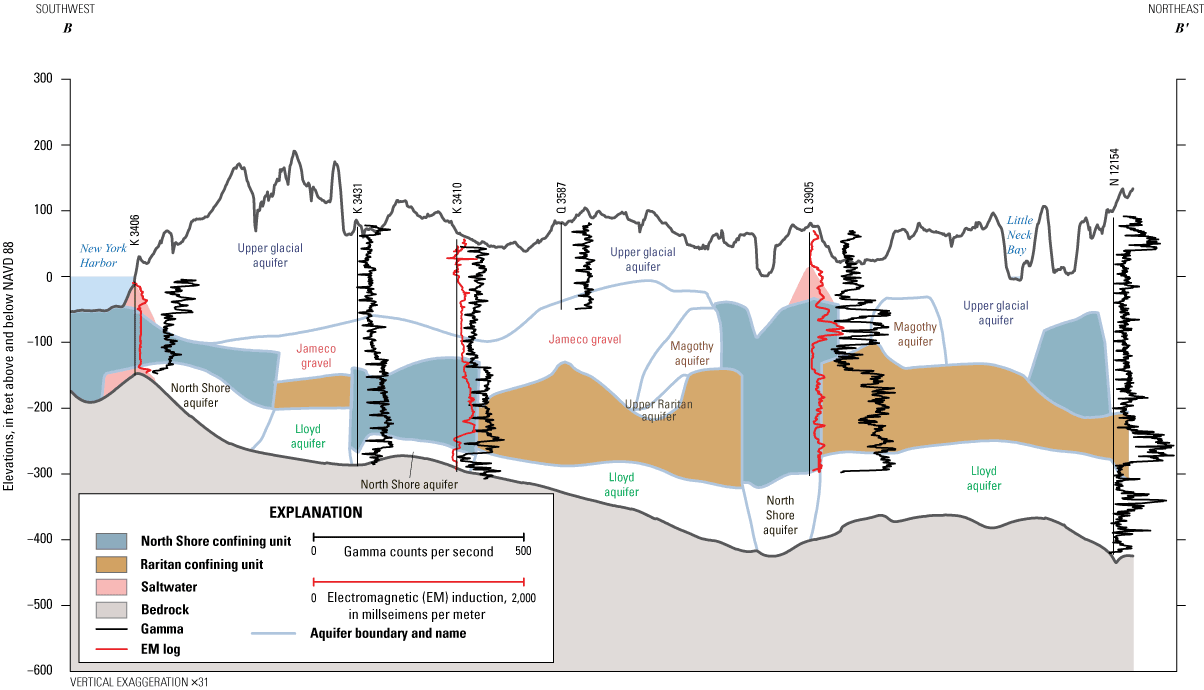
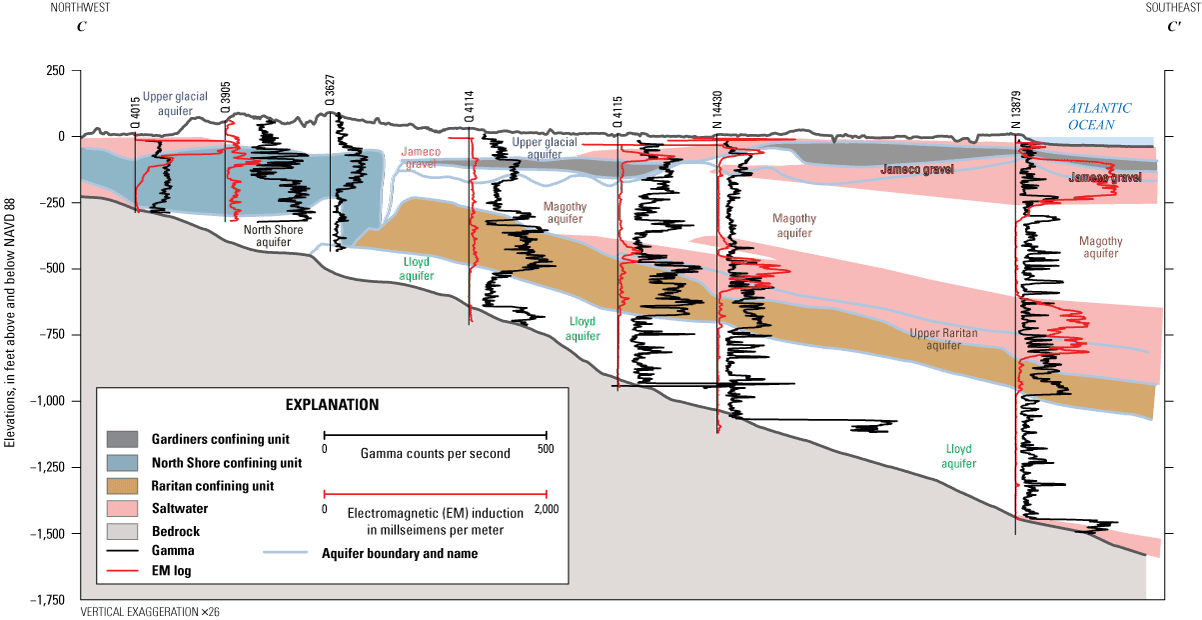
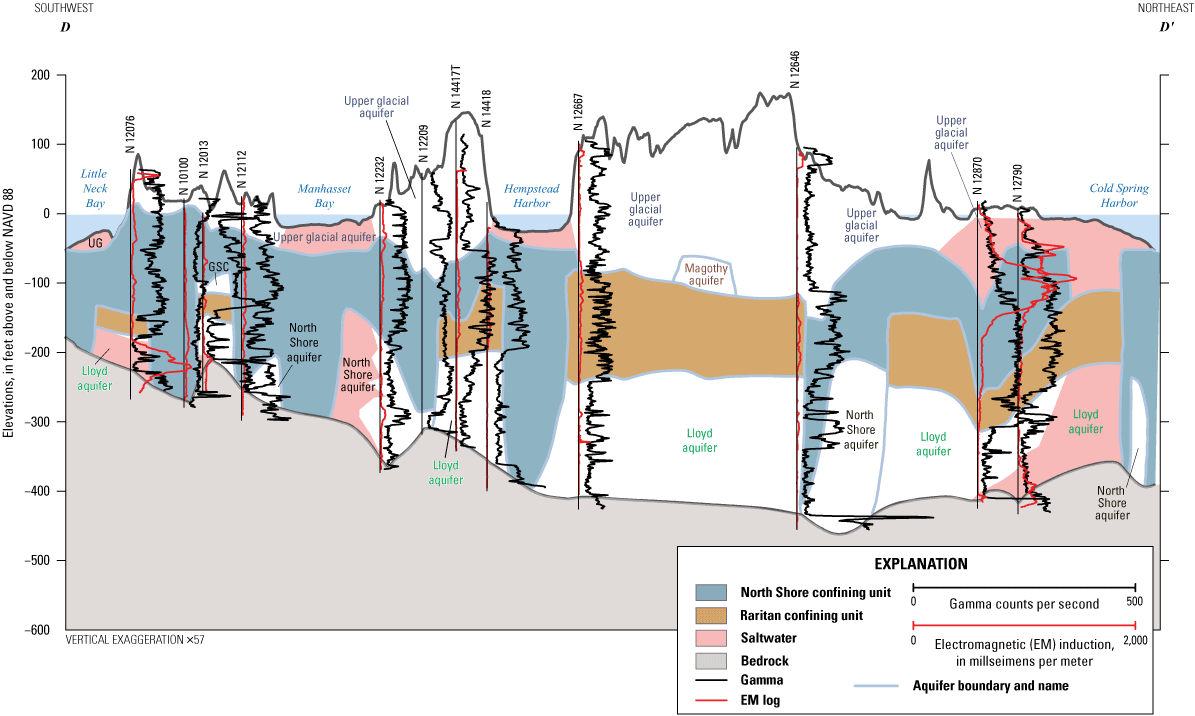
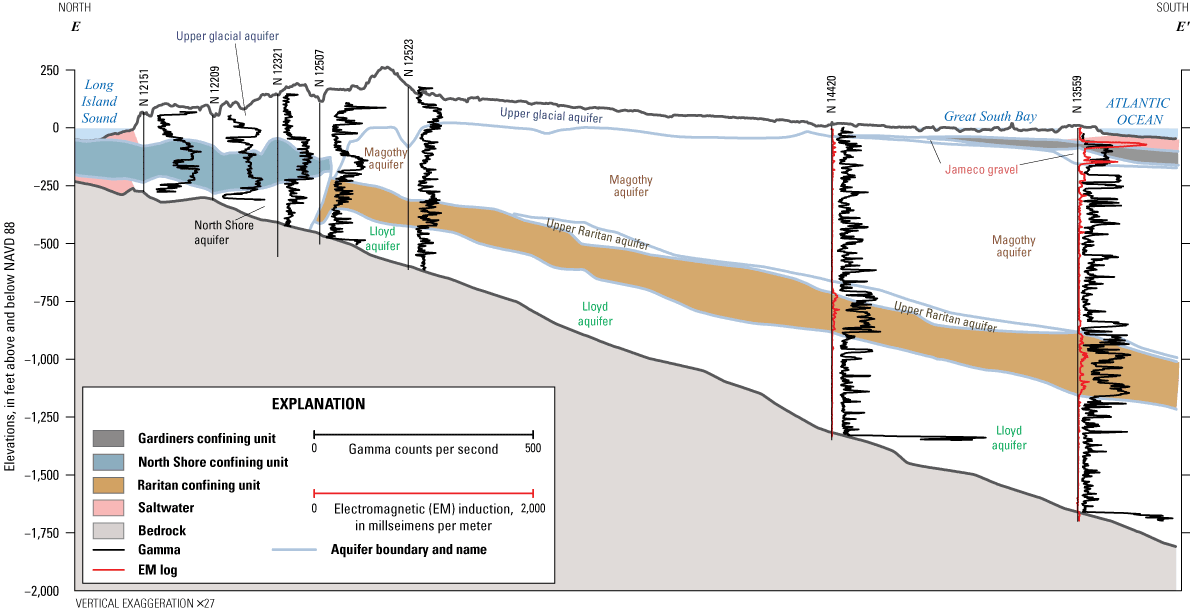
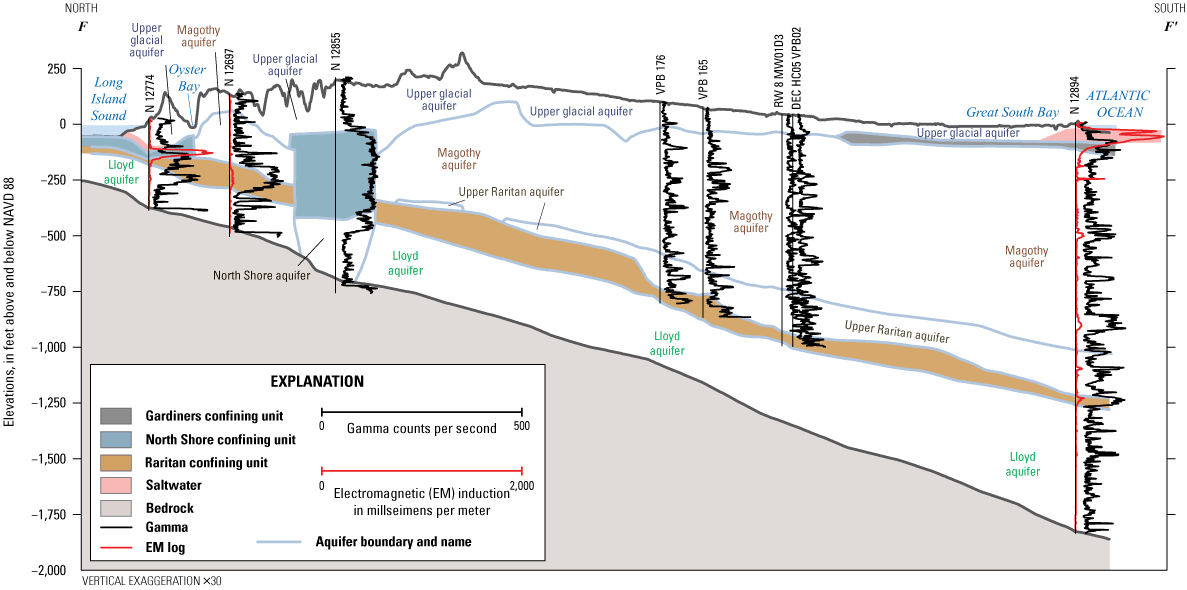
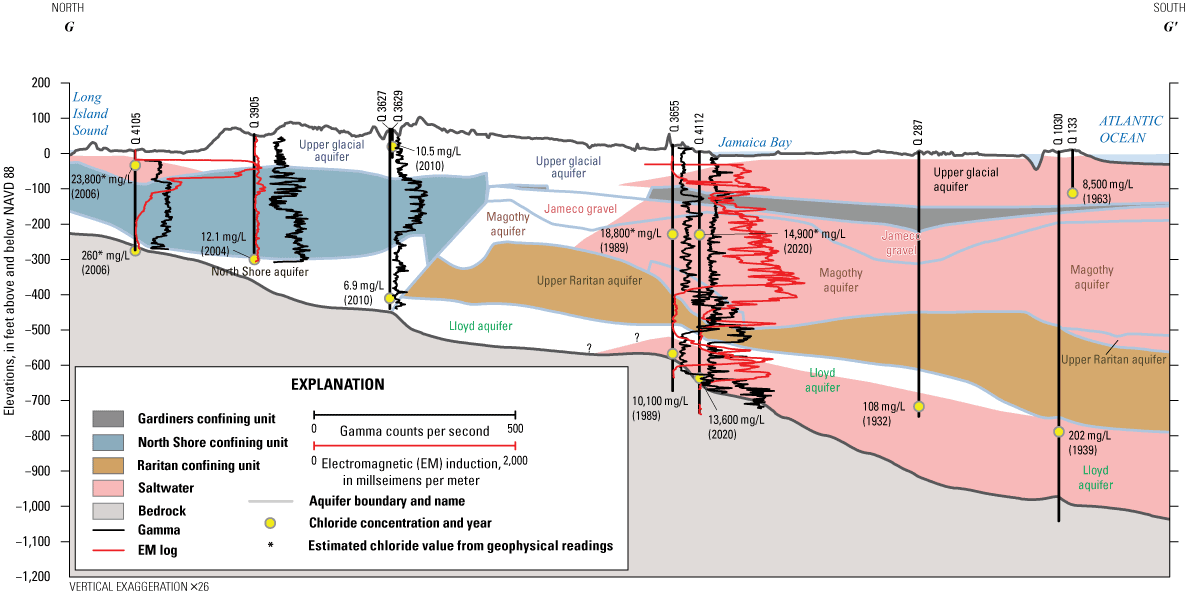
Hydrogeologic cross sections from Kings, Queens, and Nassau Counties, New York, showing aquifers, confining units, and gamma and electromagnetic log results from individual boreholes. Locations of lines of sections are shown in fig. 8. A, section A–A′; B, section B–B′; C, section C–C′; D, section D–D′; E, section E–E′; F, section F–F′; G, section G–G′. GSC, Glacial semiconfined; mg/L, milligrams per liter; UG, upper glacial; URA, upper Raritan aquifer. Gamma and electromagnetic (EM) log data are from U.S. Geological Survey (2022b).
Glacial erosion and alluvial scouring of weathered bedrock and overlying Cretaceous sediments, and possibly Pleistocene sediments, formed several valleys that were subsequently buried (Stumm 1994; Stumm and others, 2002, 2004). The weathered bedrock at the base of these valleys has been partly or totally removed. Drill-core data from observation wells in the northernmost parts of Nassau, Queens, and Kings Counties indicate that the bedrock surface is relatively flat and does not follow the regional southeastward dip (figs. 7, 8, 9). The timing of the removal of the weathered bedrock is unknown, but it could have occurred during successive glacial advances during the Pleistocene (Stone and Borns, 1986; Stanford, 2010; Stanford and others, 2021). In the study area, drill-core data indicate that below in-place Cretaceous sediments, there is a saprolite zone above the bedrock surface, and where Cretaceous sediments are absent, typically there is no saprolite zone (Stumm 2001; Stumm and others, 2002, 2004). Marine seismic-reflection data indicate that the bedrock surface beneath the embayments of Long Island Sound is uneven and undulates (Stumm 2001; Stumm and others, 2002, 2004). This finding is consistent with observations of Tagg and Uchupi (1967), who found that the bedrock surface beneath most of Long Island Sound was severely eroded during the Pleistocene, with deep, flat-bottomed, U-shaped troughs that were formed and extended over 600 ft below the sea surface within the sediment.
Lloyd Aquifer
The Lloyd Sand Member of the Cretaceous Raritan Formation is an upward-fining sequence of white and pale yellow (2.5Y 7/3) sand and gravel with white clay and silt lenses, and these sediments form the Lloyd aquifer on Long Island (Veatch and others, 1906; Suter and others, 1949; Garber, 1986). The Lloyd aquifer is confined by bedrock below, and generally is confined above by the Raritan confining unit, which is formed by the unnamed clay member of the Raritan Formation. The base of the Lloyd aquifer typically consists of a 10- to 50-ft-thick gravel layer. The Lloyd aquifer dips to the southeast and is present throughout western Long Island except where the sediments that compose the Lloyd aquifer were removed by glacial erosion (figs. 8, 9, 10; Stumm 2001; Stumm and others, 2002, 2004). The upper surface of the Lloyd aquifer ranges from about 38 ft above NAVD 88 in northwestern Queens County to 1,455 ft below NAVD 88 in southeasternmost Nassau County (figs. 8, 9, 10).
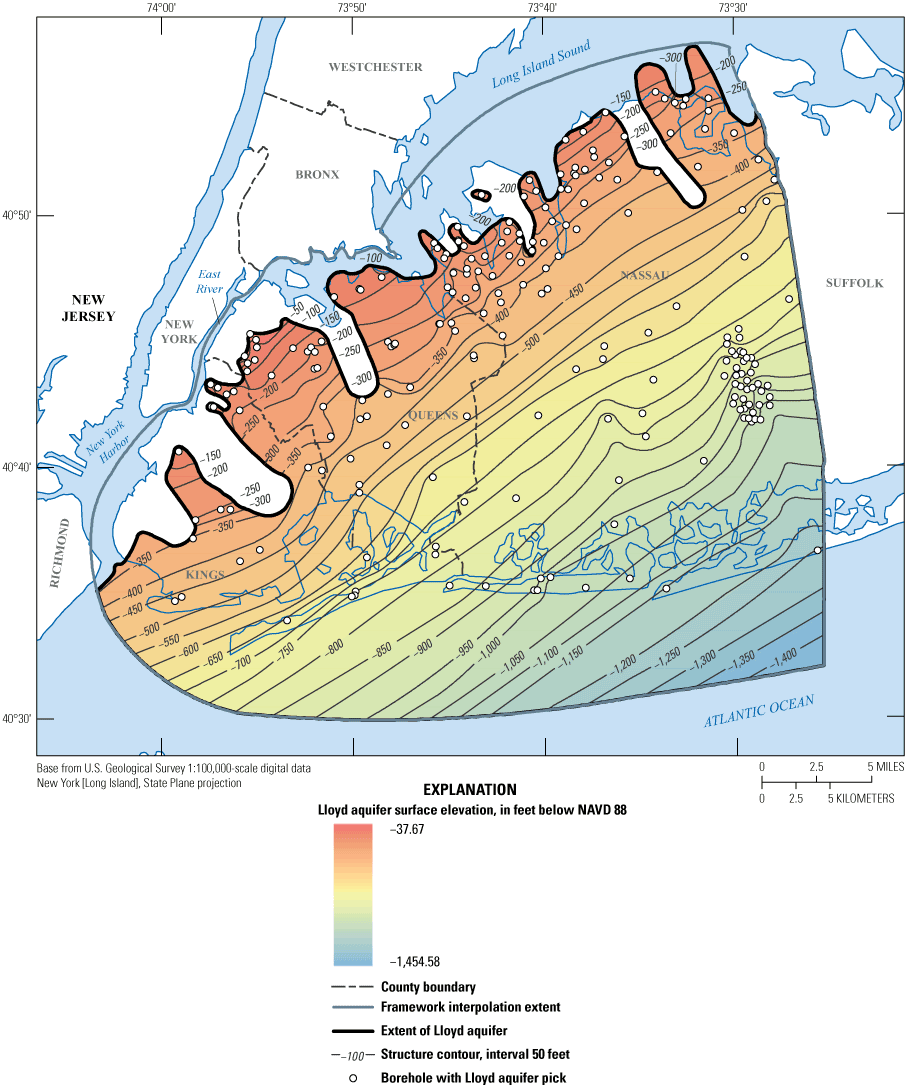
Map showing interpolation data, surface elevation, and extent of the Lloyd aquifer underlying Kings, Queens, and Nassau Counties, New York. NAVD 88, North American Vertical Datum of 1988.
The Lloyd aquifer, where present, ranges in thickness from less than 1 ft to about 660 ft in southeasternmost Nassau County. The Lloyd aquifer was removed by glacial erosion in the northwestern parts of Queens County, much of Kings County, and the northern part of Nassau County (figs. 8, 9, 10; Stumm 1994; Chu and Stumm, 1995; Stumm and others, 2002, 2004). Within the buried valleys onshore and offshore, the Lloyd aquifer was not penetrated during drilling and was not interpreted as being present in marine seismic-reflection surveys (figs. 8, 9, 10). Fourteen of the eighteen newly drilled wells penetrated the Lloyd aquifer: K 3616, K 3617, Q 4112, Q 4114, Q 4115, N 14392, N 14394, N 14417T, N 14418, N 14420, N 14421, N 14430, N 14438, and N 14477 (figs. 1, 8, 9, 10). Even though K 3617 was drilled at the base of a buried valley in Kings County, it also penetrated the Lloyd aquifer (figs. 9A, 10).
The Lloyd aquifer is a major source of water supply along the northern and southern coastal areas of Nassau County. McClymonds and Franke (1972) estimated an average hydraulic conductivity of about 50 ft/d for the Lloyd aquifer. According to Neuman (1982), the geometric mean provides a good approximation of hydraulic conductivity within three-dimensional aquifers. The geometric mean hydraulic conductivity of the Lloyd aquifer estimated from 25 pumping tests in western Long Island that were analyzed for this study was 55 ft/d (table 4). The geometric mean hydraulic conductivity estimated from the NMR log of the Lloyd aquifer penetrated by monitoring well N 12523 in north-central Nassau County was 80 ft/d, and ranged from less than 1 ft/d for fine-grained beds to more than 1,000 ft/d for coarse-grained beds (fig. 11). The hydraulic conductivity of the Lloyd aquifer estimated from a pumping test of a nearby production well (N 1328) was 66 ft/d. The geometric mean hydraulic conductivity estimated from the NMR log of the Lloyd aquifer in monitoring well N 14421 in southwestern Nassau County was 56 ft/d, and ranged from about 1 ft/d for fine-grained beds to more than 500 ft/d for coarse-grained beds (figs. 5, 12). The hydraulic conductivity of the Lloyd aquifer estimated from a pumping test of the screen zone at N 14421 was 47 ft/d (Stumm and Williams, 2022).
Table 4.
Mean hydraulic conductivity of the hydrogeologic units estimated from hydraulic tests and nuclear magnetic resonance logs of selected wells, western Long Island, New York. (Data from U.S. Geological Survey, 2022a, b).[Well site numbers from U.S. Geological Survey National Water Information System (U.S. Geological Survey, 2022c); —, no data]
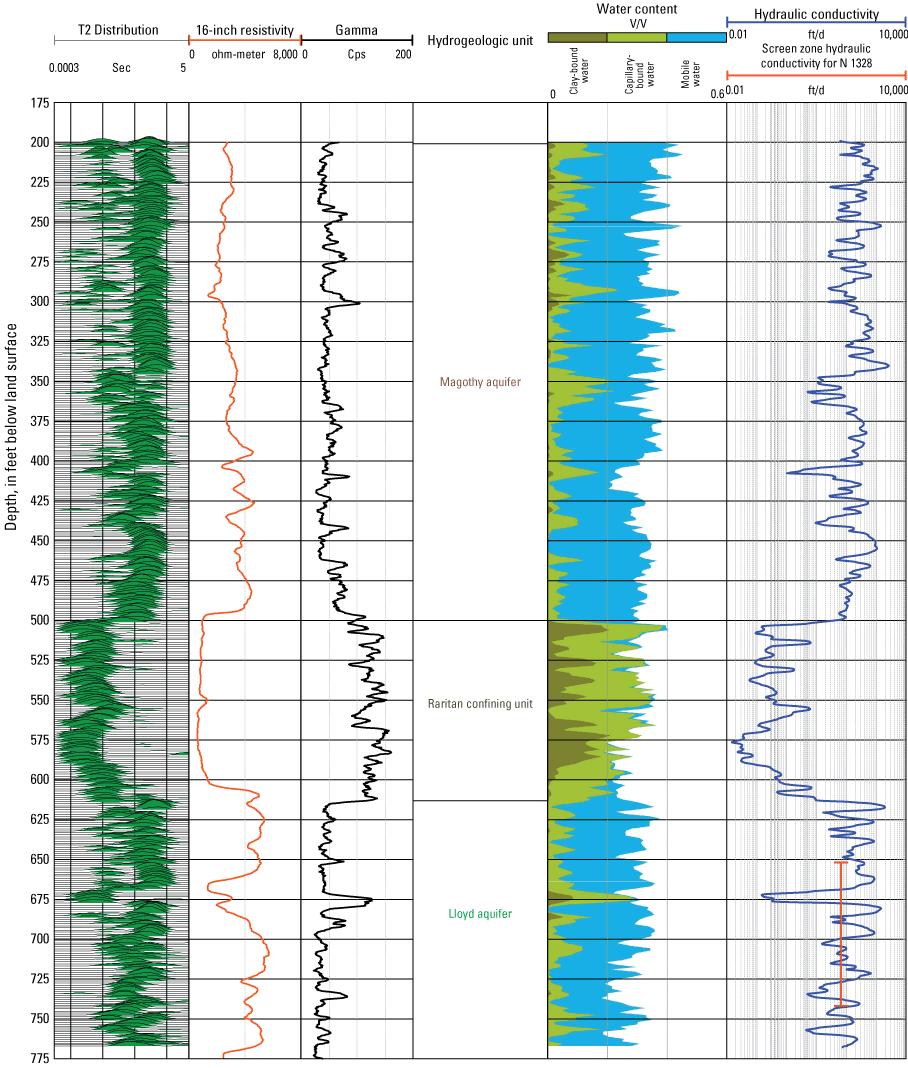
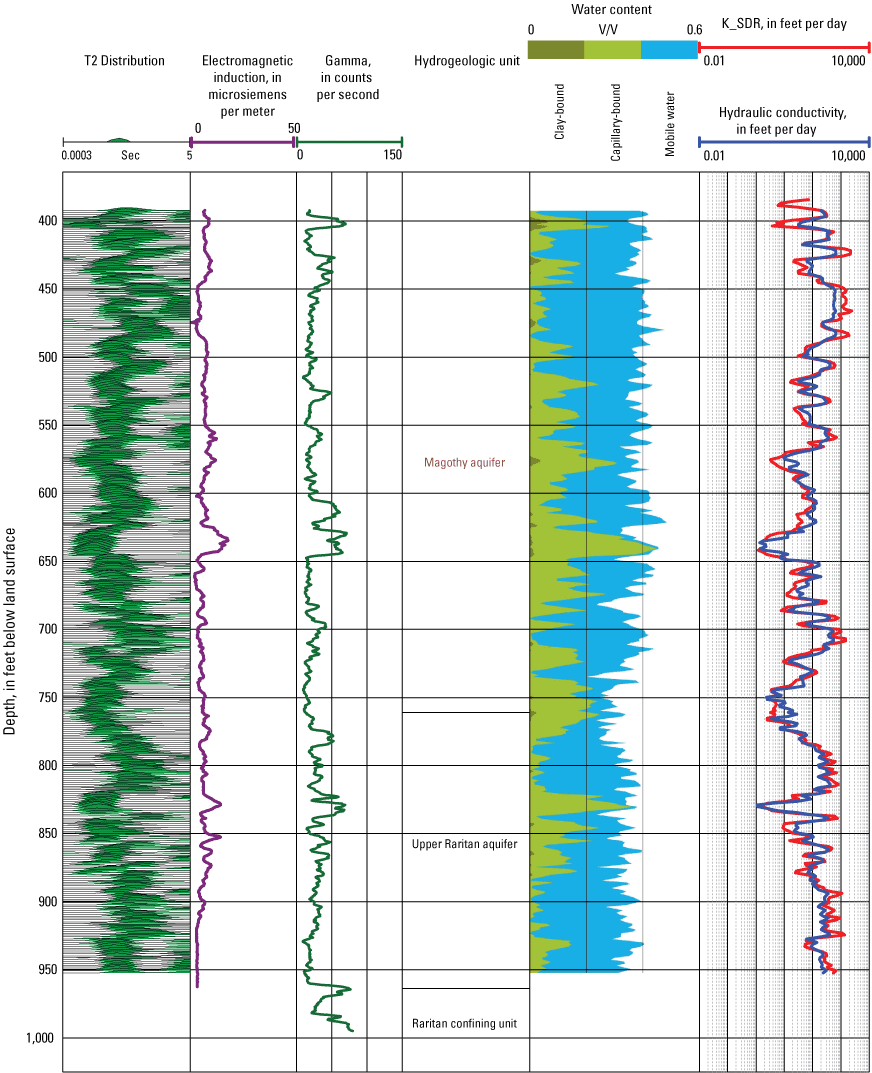
Graphs of a suite of borehole geophysical logs collected at well N 12523, including gamma, resistivity, and nuclear magnetic resonance (NMR) logs. NMR logs were collected in 2020, and all other logs were collected in 1996. The hydraulic conductivity was estimated from a specific-capacity test from a nearby production well. Location of the logged well is shown in figure 3, data are from U.S. Geological Survey (2022b). Cps; counts per second, V/V; pore volume, ft/d; foot per day, T2 Distribution; decay curve.
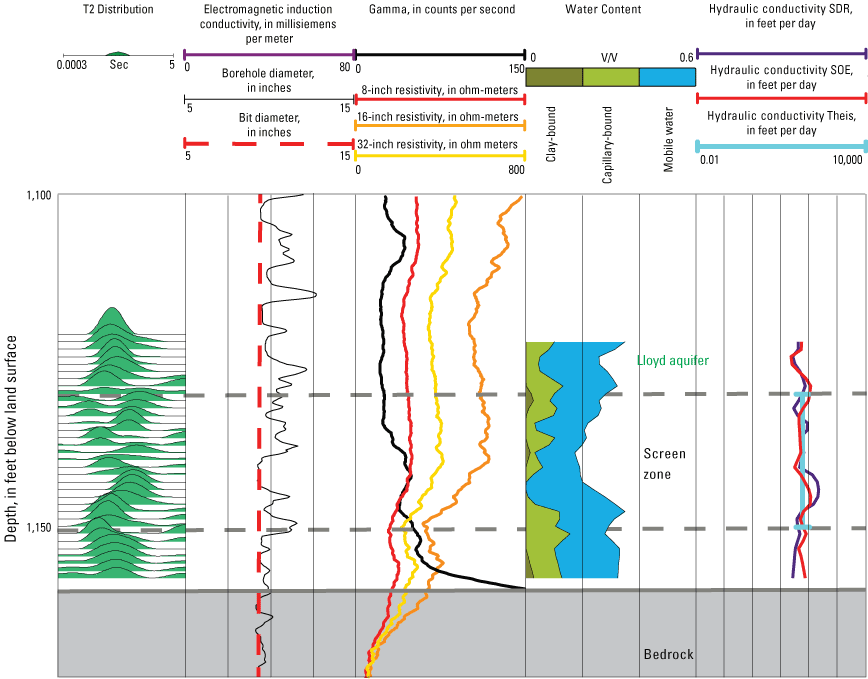
Graphs of a suite of geophysical logs of the lower interval of well N 14421 (from Stumm and Williams, 2022; location of well is shown in fig. 3). Nuclear magnetic resonance (NMR) logs were collected in 2021, and all other logs were collected in 2019. Theis (1935) hydraulic conductivity was estimated from a specific-capacity test of the screened interval of the well. The Schlumberger-Doll Research (SDR; Walsh and others, 2013) and sum of squared echoes (SOE; Walsh and others, 2013) hydraulic conductivities were estimated from the NMR log. V/V, porosity, T2 Distribution; decay curve.
The mobile water content of the Lloyd aquifer estimated from the NMR logs in wells N 12523 and N 14421 averaged 0.22 and 0.20, respectively (table 5). The estimated capillary water content of the aquifer in wells N 12523 and N 14421 averaged 0.06 and 0.09, respectively. The clay-bound water content for the aquifer in the wells averaged less than 0.01.
Table 5.
Mean clay-bound, capillary-bound, and mobile water content of hydrogeologic units as estimated from nuclear magnetic resonance logs taken from wells in the study area of western Long Island, New York (data from U.S. Geological Survey, 2022a, b).[Site names for wells from the U.S. Geological Survey National Water Information system (U.S. Geological Survey, 2022c); <, less than; —, no data]
Raritan Confining Unit
The unnamed clay member of the Cretaceous Raritan Formation forms the Raritan confining unit, which underlies most of the study area and dips to the southeast (fig. 13; Suter and others, 1949). The Raritan confining unit consists of dense clays and silts that are multicolored, including gray (2.5Y 4/1), white (2.5Y 9/1), red (10R 4/8), or tan (2.5YR 4/8), and are commonly variegated (Suter and others, 1949; Stumm, 2001; Stumm and others, 2002, 2004). The top of the Raritan confining unit is based on core samples and gamma logs, and is defined here as a unit consisting of dense clay and silt that is at least 20 feet thick. The Raritan confining unit ranges in thickness from less than 20 ft where it pinches out in the northwestern part of the study area to more than 310 ft in the southeasternmost part of Nassau County (figs. 8, 9, 13). The upper surface elevation of the Raritan confining unit ranges from about sea level in northwestern Queens County to about 1,230 ft below NAVD 88 in southeasternmost Nassau County (fig. 13). In many of the northern and western parts of the study area, the Raritan confining unit was severely eroded or completely removed by glacial scouring, creating an unconformity. The depositional extent of the Raritan confining unit is truncated by buried valleys that trend from the northwest to southeast that are interpreted as having been formed by glacial erosion (figs. 8, 9, 13; Stumm, 2001; Stumm and others, 2002, 2004). Eleven separate buried valleys were mapped in western Long Island during this study: four are offshore in the embayments of northern Nassau County, four are onshore in northern Nassau County (Stumm, 2001; Stumm and others, 2002, 2004), one was previously mapped in northern Queens County, and two new valleys are delineated in northern and western Kings County as part of this study (figs. 8, 9, 13; Veatch and others, 1906; Soren, 1971, 1978; Buxton and Shernoff, 1999).
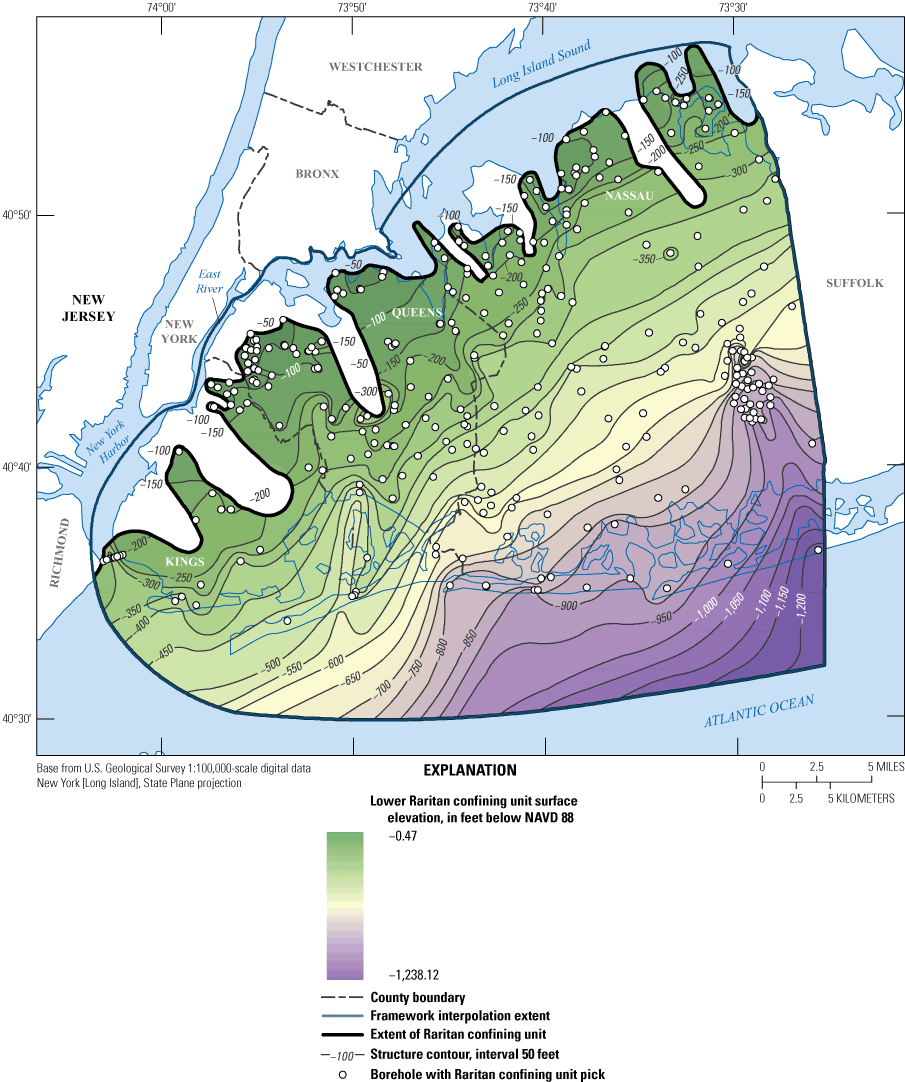
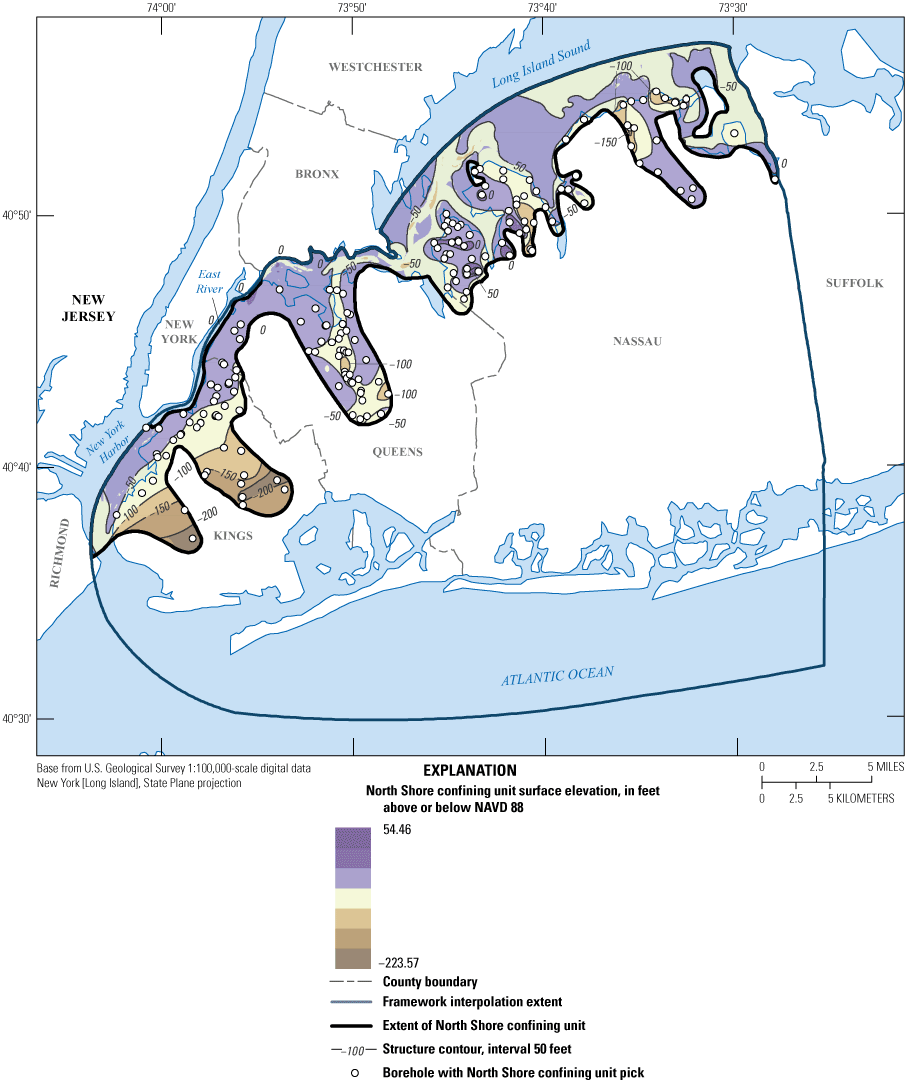
Map of interpolation data, surface elevation, and the extent of the Raritan confining unit underlying Kings, Queens, and Nassau Counties, New York. NAVD 88, North American Vertical Datum of 1988.
The Raritan confining unit is the most extensive confining layer on Long Island, and restricts flow between the Lloyd aquifer and overlying aquifers. The geometric mean hydraulic conductivity of the clay and silt of the Raritan confining unit estimated from the NMR log of well N 12523 was 0.30 ft/d (fig. 11; table 4). The geometric mean hydraulic conductivities estimated from the NMR log from well N 14421 for a portion of the Raritan confining unit dominated by a silt and sand interval was 9.9 ft/d, and was 0.12 ft/d for a clay and silt interval (fig. 5). The mobile, capillary, and clay-bound water contents of the silt and sand interval of the Raritan confining unit estimated from the NMR logs in well N 14421 averaged 0.15, 0.15, and 0.02, respectively (table 5). The mobile, capillary, and clay-bound water contents of the clay and silt interval of the Raritan confining unit estimated from the NMR logs in wells N 12523 and N 14421 averaged 0.02, 0.18, and 0.08 and 0.01, 0.17, and 0.1, respectively.
Upper Raritan Aquifer
The name “upper Raritan aquifer” is introduced here to represent an aquifer contained in a unit of sediments that are part of the Cretaceous Raritan Formation that overlies the clay and silt of the Raritan confining unit and lies below the basal gravel bed of the Magothy aquifer in parts of western Long Island (fig. 14). The upper Raritan aquifer was initially identified in this study through analyses of high-resolution (5-ft intervals) core descriptions and gamma logs from a dense network of about 50 monitoring wells that were drilled into the Raritan confining unit in southeastern Nassau County as part of a contaminant-plume study (fig. 2). These analyses indicated a substantial deviation of the top surface of the Raritan confining unit as compared to that surface as defined in previously published maps. Dense clay beds were absent in the upper part of the Raritan confining unit in this area where the monitoring wells were drilled, indicating a possible facies or depositional change from fine- to coarse-grained lithologies in the upper part of the Raritan Formation within the study area. The newly mapped upper part of the Raritan Formation is generally characterized by fine to coarse sand with silt and minor clay lenses below the basal gravel bed of the Magothy Formation (figs. 8, 9, 14), whereas the Raritan confining unit has been previously described as consisting of dense clay and silt with small sand interbeds (Suter and others, 1949, Smolensky and others, 1990).
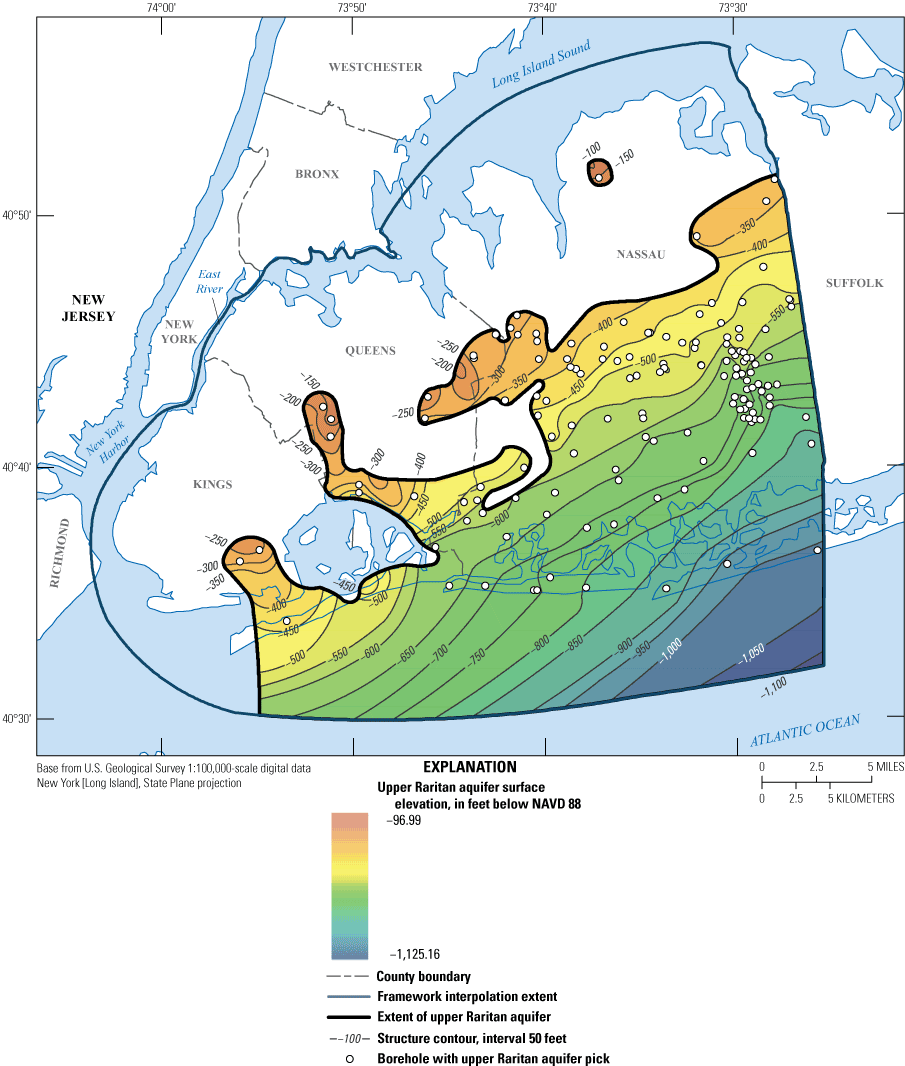
Map of interpolation data, surface elevation, and the extent of the upper Raritan aquifer underlying Kings, Queens, and Nassau Counties, New York. NAVD 88, North American Vertical Datum of 1988.
Further analysis of hundreds of core descriptions and gamma logs in Kings, Queens, and Nassau Counties indicated the upper Raritan aquifer extends throughout the southernmost parts of these counties (figs. 8, 9, 14). The aquifer also appears to extend throughout the central part of Nassau County, and may extend eastward into Suffolk County, Long Island. According to regional hydrogeologic framework investigations, including pollen studies of deep cores in the Raritan Formation of Suffolk County, the Raritan Formation between the Magothy Formation and Lloyd Sand Member appears to correlate chronologically with the South Amboy Fire Clay, Sayreville Sand, and Woodbridge Clay Members of the Raritan Formation in New Jersey (Zapecza, 1984; Sirkin, 1986). In the Potomac-Raritan-Magothy aquifer system underlying northeastern New Jersey, the Sayreville Sand Member of the Raritan Formation contains coarse-grained facies that are considered to be part of the upper aquifer in this system, and fine-grained facies that are considered to be part of the confining unit between the middle and upper aquifers (Farlekas, 1979; Zapecza, 1984).
The upper Raritan aquifer ranges in thickness from less than 1 ft where it pinches out to more than 200 ft at well N 12894 in southeastern Nassau County, corresponding to about one-third to two-thirds of the thickness of what had been previously mapped as the Raritan confining unit at that location (figs. 8, 9, 14; Suter and others, 1949; Perlmutter and Geraghty, 1963; Soren, 1971, 1978; Buxton and others, 1981; Buxton and Shernoff, 1999). Multicolored clays make up most of the Raritan confining unit, but are only found in lenses less than 20 ft in thickness in the upper Raritan aquifer, which contains more silt and sand than clay.
The geometric mean hydraulic conductivities estimated from the NMR logs of the upper Raritan aquifer penetrated by monitoring wells N 14421, DEC HC05 VPB02, and RW8 MW01D3 were 110, 100, and 40 ft/d, respectively, suggesting that the aquifer has a similar hydraulic conductivity to that of the upper parts of the Magothy aquifer (tables 4 and 5; figs. 2, 5, 15, 16). The geometric mean hydraulic conductivities ranged from less than 2 ft/d for fine-grained intervals to more than 800 ft/d for coarse-grained intervals. The mobile and capillary water contents of the upper Raritan aquifer estimated from the NMR logs in wells N 14421 averaged 0.26 and 0.08, respectively (table 5). The clay-bound water content for the aquifer in the well was less than 0.01.
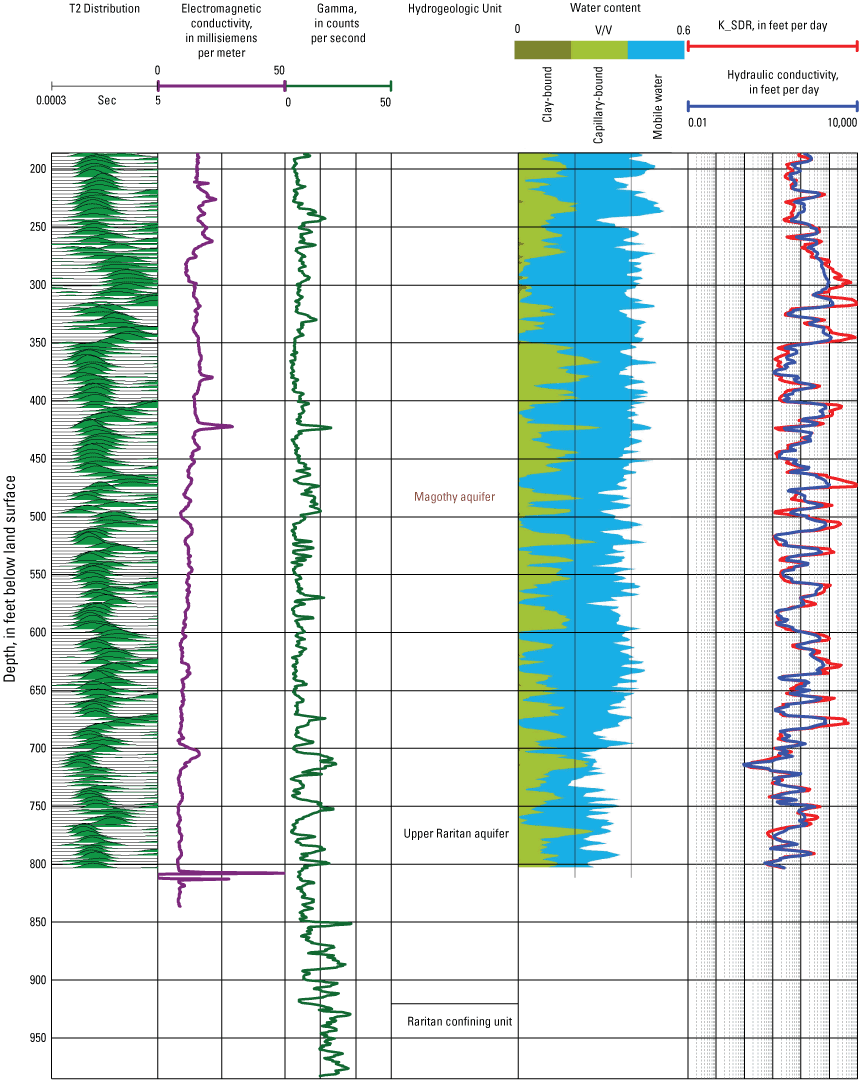
Graphs of a suite of borehole geophysical logs collected in 2022 at DEC HC05 VPB02 including gamma, electromagnetic induction (EM), and nuclear magnetic resonance (NMR) logs (location shown in fig. 3.) K_SDR, hydraulic conductivity using the Schlumberger-Doll Research equation; V/V, porosity. Data are from U.S. Geological Survey (2022b).
Graphs of a suite of borehole geophysical logs collected in 2022 at well RW8 MW01D3 including gamma, electromagnetic induction (EM), and nuclear magnetic resonance (NMR) logs. (Location shown in fig. 3.) K_SDR, hydraulic conductivity using the Schlumberger-Doll Research equation; V/V, porosity. Data are from U.S. Geological Survey (2022b).
Magothy Aquifer
The Magothy aquifer is present in Cretaceous sediments that consist of fine, micaceous, interbedded sand, silt, and clay (Suter and others, 1949; Smolensky and others, 1990). These sediments represent an upward-fining sequence consisting of gray, white, or pinkish sand, silt, and clay of the undifferentiated Matawan Group, or of the Magothy Formation (Smolensky and others, 1990). In some areas, there are lignite and iron-oxide concretions, and there is a nearly ubiquitous basal gravel bed that overlies the Raritan Formation. The Magothy aquifer overlies the Raritan confining unit or the upper Raritan aquifer (Suter and others, 1949).
The Magothy aquifer is absent in most of Kings County, the northern half of Queens County, and the northernmost parts of Nassau County, and is interpretated as having been eroded away by glacial erosion (figs. 8, 9, 17). Drill-core samples indicate that the Magothy aquifer consists of gray, subrounded, silty quartz sand and silt (5Y 6/1) and sand and silt-sized chemically stable, opaque heavy minerals. The top of the Magothy aquifer ranges from about 150 ft above NAVD 88 in north-central Nassau County to more than 310 ft below NAVD 88 in southeastern Nassau County (figs. 8, 9, 17). Glacial erosion produced a steep, wavy, north-facing scarp along the northern extent of the aquifer in south-central Queens County and north-central Nassau County (figs. 8, 9, 17). The Magothy aquifer ranges in thickness from less than 1 ft along the northern extent of the aquifer to about 930 ft in southeastern Nassau County.
The Magothy aquifer is the major water supply source for western Long Island. The geometric mean hydraulic conductivity of the Magothy aquifer as estimated from 35 pumping tests was 120 ft/d (table 4). The geometric mean hydraulic conductivities estimated from the NMR log of the Magothy aquifer penetrated by wells were 140 ft/d (N 12523), 81 ft/d (N 14421), 88 ft/d (DEC HC05 VPB02), and 110 ft/d (RW8 MW01D3) (figs. 2, 5, 11, 15, 16). In the Magothy aquifer, the geometric mean hydraulic conductivities ranged from a low of 0.33 ft/d for fine-grained intervals to a high of 590 ft/d for coarse-grained intervals (figs. 2, 5, 11, 15, 16; table 4). The mobile, water contents of the Magothy aquifer estimated from the NMR logs in the four wells averaged 0.26, 0.24, 0.25, and 0.28, respectively (table 5). Capillary water contents estimated for the aquifer in the four wells averaged 0.06 ,0.12, and 0.1, respectively. Estimated clay-bound water contents averaged 0.01 or less.
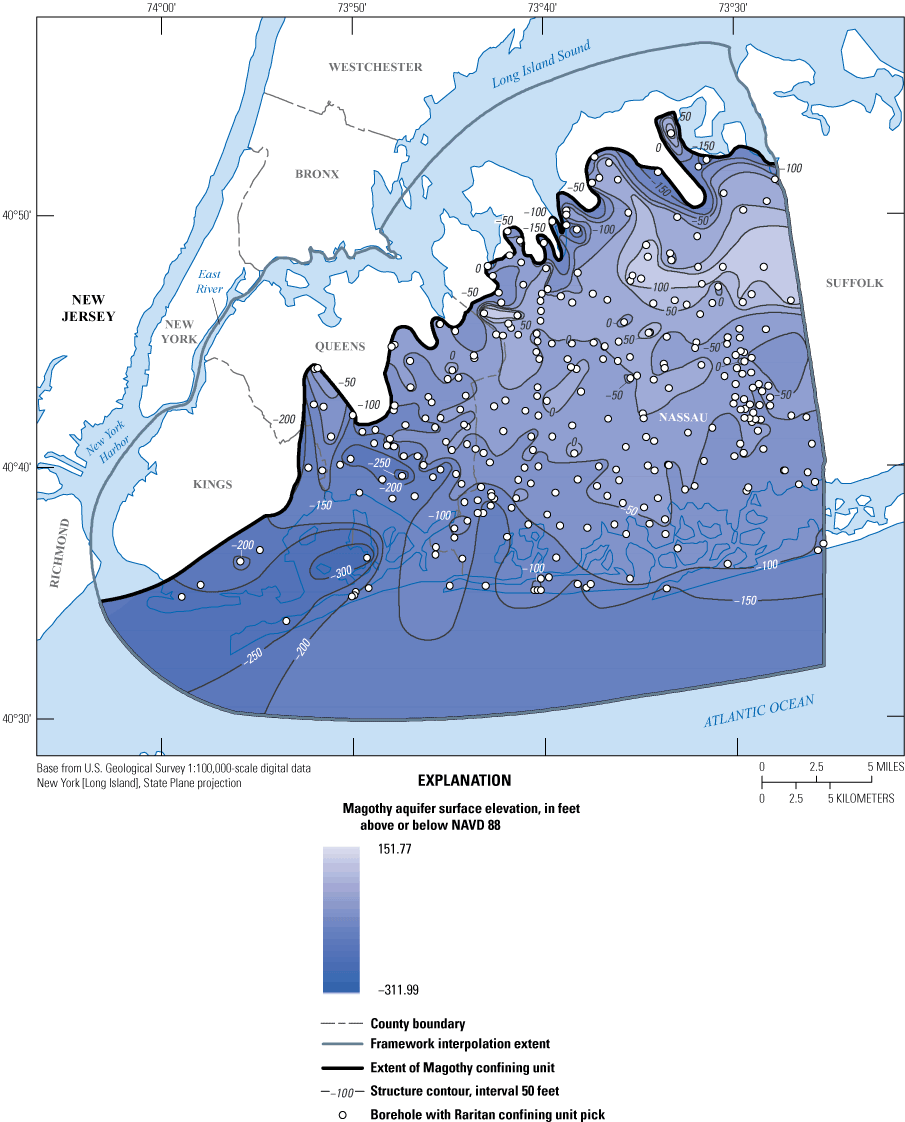
Map of interpolation data, surface elevation, and the extent of the Magothy aquifer underlying Kings, Queens, and Nassau Counties, New York. NAVD 88, North American Vertical Datum of 1988.
North Shore Aquifer
The North Shore aquifer is Pleistocene age fine to coarse sand, and is confined by Pleistocene clay and silt above and Precambrian to Cambrian bedrock below (Stumm, 2001, Stumm and others, 2002, 2004). Laterally, it is hydraulically connected with the Lloyd aquifer (Stumm, 2001; Stumm and others, 2002, 2004). The North Shore aquifer generally is present beneath the North Shore peninsulas and estuaries where Cretaceous sediments are absent due to glacial erosion (figs. 8, 9, 18). The North Shore aquifer was identified by Chu and Stumm (1995) in northwestern Queens, and by Stumm (2001) and Stumm and others (2002, 2004) in northern Nassau County, indicating that a unifying nomenclature for this aquifer unit along the northern shore of Long Island was needed. These aquifer sediments were called the Jameco Gravel by Swarzenski (1964) and the Port Washington aquifer by Kilburn (1979). The name “North Shore aquifer” is used in preference to the names “Jameco aquifer” or “Jameco Gravel” because the previously used names imply correlation with the Jameco aquifer or Jameco Gravel in southern Queens County. Also, the sand units that were mapped as the Port Washington aquifer were later found to be where marine seismic-reflection surveys indicated the presence of valleys that were hundreds of feet thick and filled with clay, indicating incorrect correlation and designations (Stumm, 2001; Stumm and others, 2002, 2004). Similar sediments (massive clay and varved clay units) have been identified in Suffolk County (Krulikas and Koszalka, 1983; Schubert and others, 2004). The North Shore aquifer is a distinct hydrogeologic unit that lies directly above bedrock and is overlain by a thick unit of clay and silt of the North Shore confining unit (figs. 8, 9, 18; Stumm, 2001; Stumm and others, 2002, 2004).
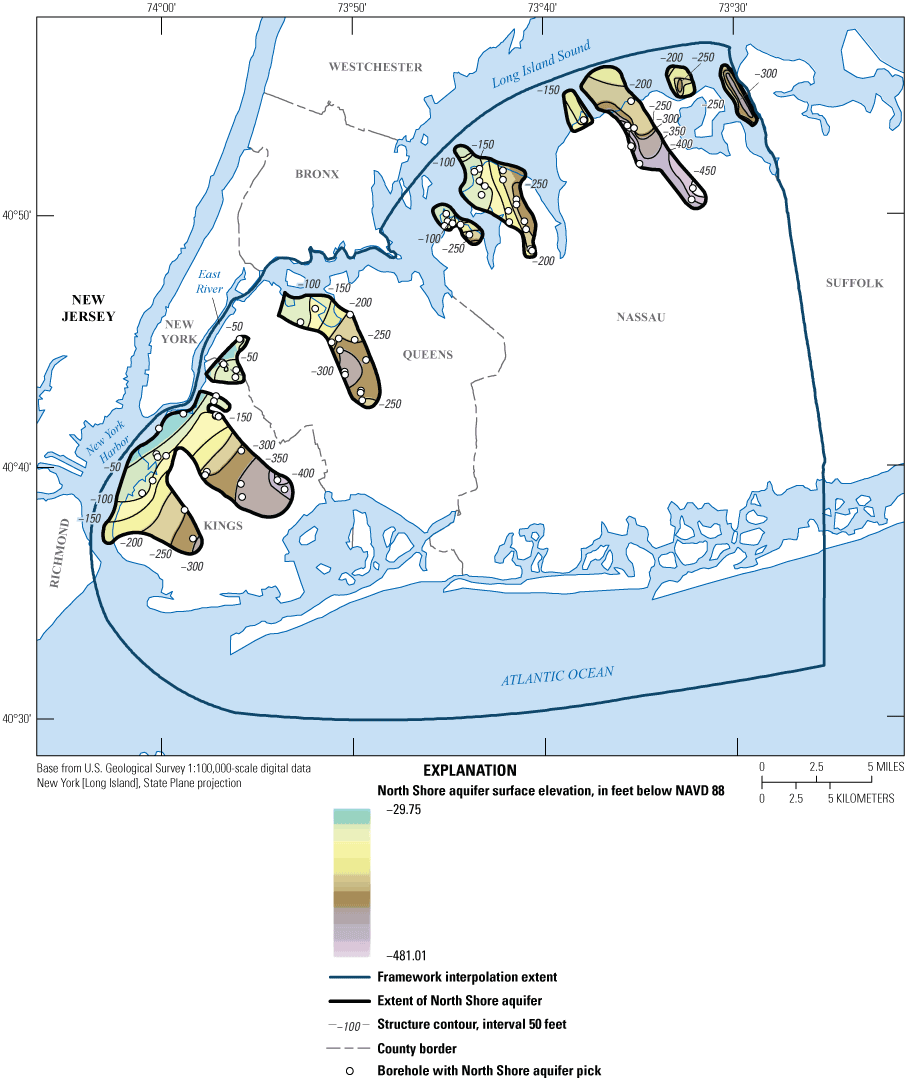
Map of interpolation data, surface elevation, and the extent of the North Shore aquifer underlying Kings, Queens, and Nassau Counties, New York. NAVD 88, North American Vertical Datum of 1988.
The North Shore aquifer is present in the northernmost part of Nassau County, the northwesternmost part of Queens Counties, the northern and parts of central Kings County, and extends southward to near Jamaica Bay in Kings County. This aquifer consists of moderately sorted, stratified, glacial-drift sediments filling in low-lying areas created after the removal of Cretaceous sediments and parts of the bedrock saprolitic zone by glacial erosion, fluvial erosion, or both. The aquifer is capped by clay and silt of Pleistocene age, which is the North Shore confining unit. Subsequent glacial advances eroded northwest–southeast-trending valleys that reached the bedrock surface and removed older sediments, possibly including those of the North Shore aquifer. These valleys were subsequently filled with hundreds of feet of clay and silt of the North Shore confining unit (figs. 8, 9, 18). The buried-valley sediments likely are associated with the most recent glacial advance in the area; however, the presence of the Jameco Gravel (also referred to as the Jameco aquifer) above some of these clay and silt sediments in two buried valleys in Kings County suggest that these sediments may not be the same age as the North Shore aquifer sediments in other parts of the study area. Therefore, the sediments in the buried valleys are grouped with the undifferentiated Pleistocene sediments of the North Shore confining unit.
Stanford (2010) and Stanford and others (2021) described early pre-Illinoian (about 230,000 years before present [ybp]) drainage in the New Jersey–New York area as including a diversion of the Hudson River to the East River and then eastward through Long Island, creating valleys that were subsequently filled. Veatch and others (1906) indicated potential Pleistocene age drainage patterns in Kings County through the coastal plain and southward offshore. Soren (1978), Buxton and Shernoff (1999), and Stanford and others (2021) proposed that the buried Flushing valley in north-central Queens County may be a buried valley related to pre-Illinoian drainage; however, detailed mapping presented in this study indicates that this valley is most likely glacial in origin, was not filled with sand, and did not have a southern extent offshore as had been proposed. The results of drilling in southern Queens County for this study indicate that the valley is filled with varved clay of the North Shore confining unit and does not extend to the southern coast.
One or two of the buried valleys mapped in Kings County may have been part of this early drainage system and may have ultimately continued offshore southward. Stanford (2010) and Stanford and others (2021) indicated that these buried valleys represent river channels in Kings County, and may have been modified, deepened, and filled during the most recent Wisconsinan glaciation during the Pleistocene. Glacial scouring directions in New York County (Manhattan) and Richmond County (Staten Island) indicate that glacial lobe flows were subparallel to the mapped buried valleys in this report (Stanford, 2010). Swarzenski (1964) interpreted sediments in northernmost Great Neck as being Sangamon age (130,000 to 80,000 ybp), which is an interglacial period between the Wisconsinan (about 80,000 to 17,000 ybp) and older Illinoian glaciations, or possibly of Illinoian age (about 191,000 to 130,000 ybp), and thus the oldest glacial deposits in the area.
The North Shore aquifer is a unit of moderately to poorly sorted, dark olive-brown (2.5Y 3/3) and olive-gray (5Y 6/2) gravel, sand, and silt. The sediments consist of subangular to subrounded quartz, rock fragments, chemically unstable opaque minerals, and much biotite and muscovite. The surface of the North Shore aquifer ranges from 30 ft below NAVD 88 in Kings County to about 480 ft below NAVD 88 in a buried valley at well N 12855 in northeastern Nassau County (figs. 8, 9, 18), and appears to be relatively flat. The North Shore aquifer is about 340 ft thick at well N 12855 but is less than 1-ft thick near its extents where it pinches out (figs. 8, 9, 18).
The geometric mean hydraulic conductivity of the North Shore aquifer as estimated from five aquifer tests was 31 ft/d (table 4). The geometric mean hydraulic conductivity estimated from the NMR log of the North Shore aquifer penetrated by monitoring well N 12321 was 11 ft/d, reflecting the high silt content in the aquifer at that location (fig. 19). The geometric mean hydraulic conductivity estimates ranged from 0.11 ft/d for fine-grained intervals to 310 ft/d for coarse-grained intervals. The mobile, capillary, and clay-bound water contents of the aquifer penetrated by the well averaged 0.16, 0.14 and 0.02, respectively (table 5)
Graphs from a suite of borehole geophysical logs collected at well N 12321 including gamma-ray, electromagnetic induction (EM), and nuclear magnetic resonance (NMR) logs, Nassau County, New York. NMR logs were collected in 2022, and all other logs were collected in 1996. (Location is shown in fig. 3.) Data are from U.S. Geological Survey (2022b). V/V, porosity.
North Shore Confining Unit
The North Shore confining unit is a sequence of Pleistocene-age clay and silt that occurs locally along the northern shore of Nassau County (Stumm and Lange, 1994, 1996; Stumm, 2001; Stumm and others, 2002, 2004), Kings and Queens Counties (Chu and Stumm, 1995), and Suffolk County (figs. 8, 9, 20; Soren, 1971). Oliver and Drake (1951), Grim and others (1970), Williams (1981), Lewis and Stone (1991), Stanford (2010), and Stanford and others (2021) interpreted these sediments as part of the stratified glacial-lake clay and silt that underlie Long Island Sound and the northern embayments in the study area (fig. 20).
Map of interpolation data, surface elevation, and the extent of the North Shore confining unit underlying Kings, Queens, and Nassau Counties, New York. NAVD 88, North American Vertical Datum of 1988.
Offshore seismic reflection surveys, borehole geophysical logs, and drill-core samples were used to correlate these Pleistocene clay and silt sediments with buried valleys that extend across the northern peninsulas of Nassau County and the surrounding embayments of Long Island Sound of Little Neck Bay, Manhasset Bay, Hempstead Harbor, and Cold Spring Harbor (Stumm and Lange, 1994, 1996; Stumm, 2001; Stumm and others, 2002, 2004). The North Shore confining unit consists of sediments from at least two separate depositional sequences—a brackish-water to marine clay and silt sequence, and a proglacial freshwater lake clay and silt sequence.
Core samples from well N 12013 and well N 12465 (fig. 2) contain olive-gray clay (5Y 4/2) with oyster shells, suggesting deposition in a shallow, brackish-water or marine environment. Amino-acid dating of oyster shells from well N 10101, which is adjacent to well N 12465, indicates an age of about 225,000 years before present (Ricketts, 1986). This suggests a Yarmouth age for these fine-grained marine sediments that make up the North Shore confining unit in this part of Great Neck along the north shore of Nassau County (Stumm and others, 2002). The presence of Cretaceous sediments beneath wells N 12013 and N 12465 in Nassau County and the presence of the Jameco aquifer above similar sediments at well K 3617 within a buried valley in southern Kings County, suggest that sediments in these areas could represent older Pleistocene deposition. Cores from many of the wells in these buried valleys contain varved gray clay and silt sequences without shell material, suggesting deposition in a more recent proglacial lake. Cretaceous sediments typically are thin or not present in many of these glacially eroded areas. Investigation of the stratigraphy and geologic age of these Pleistocene sediments was beyond the scope of this study. The marine clay in central Great Neck, and the gray clay below the Jameco aquifer within the buried valley in southern Kings County, are placed with the younger glacial-lake sediments as an undifferentiated Pleistocene unit of clay and silt that constitutes the North Shore confining unit, although these clays may represent an erosional remnant of an older interglacial environment.
Stanford (2010) and Stanford and others (2021) indicated that the maximum southern extent of ice in the New York City metropolitan area occurred about 21,000 years ago, and based upon the glacial varve count in the southern basin of Lake Passaic, the ice remained at a terminal moraine in central Kings and Queens Counties for 750–1,000 years, then rapidly retreated. The varves represent a minimum of 200 to 300 years of elapsed time from deglaciation to deposition of the organic sediment, assuming that these are thick proximal varves (Stanford, 2010; Stanford and others, 2021). Tagg and Uchupi (1967) conducted seismic profiles in Long Island Sound and found that the bedrock surface contains deep, flat-bottomed, U-shaped troughs that extend to more than 600 ft below NGVD 29. Tagg and Uchupi (1967) interpreted these troughs or valleys to be glacially eroded but were unable to discern if these features extended beneath Long Island because nearshore seismic data were lacking. Reeds (1927) described varved clay sediments found in the New York City area, and suggested that the depositional environment was in postglacial freshwater lakes occupying low-lying basins in southern New York. Reeds (1927) also proposed that there were a series of interconnected lakes called Glacial Lake Flushing within parts of Long Island Sound and northern Queens County (fig. 1), and interpreted these glacial lakes as containing extensive layers of varved clays and silt. Lewis and Stone (1991) described similar silt and clay sediments infilling extensive parts of Long Island Sound. Stanford (2010) and Stanford and others (2021) mapped similar sediments and interpreted several glaciations in the New York City metropolitan area. Offshore seismic-reflection profiles collected by the USGS during previous studies in Little Neck Bay, Long Island Sound, Manhasset Bay, Hempstead Bay, and Cold Spring Harbor display subhorizontal, parallel reflectors that are indicative of draped bedding, which is characteristic of silt and clay (Stumm, 2001; Stumm and others, 2002, 2004). These sediments fill several sharply defined buried valleys that truncate the surrounding geologic deposits (figs. 8, 9, 20). These valleys are typically asymmetrical, steep-sided, 2- to 4-miles (mi) long and about 1 mi wide, and trend northwest to southeast. The valleys extend to bedrock, which in places is deeper than 600 ft below sea level (figs. 8, 9, 20; Stumm and Lange, 1994, 1996; Stumm, 2001; Stumm and others, 2002, 2004).
Analyses of lithologic and geophysical logs from legacy and newly drilled wells indicate that at least 11 northwest-to-southeast-trending buried valleys underlie the northern parts of Kings, Queens, and Nassau Counties. Four of these valleys underly offshore embayments, four are onshore in northern Nassau County, one is in northern Queens County, and two were recently delineated in Kings County (Stumm, 2001; Stumm and others, 2002, 2004). One buried valley near Flushing in Queens County appears to have been mapped by previous studies (figs. 8, 9, 20; Soren, 1971, 1978; Buxton and others, 1981; Buxton and Shernoff, 1999). A major difference between the mapping for this study and previously published hydrogeologic studies of Kings and Queens Counties is that by using geophysical logs and core sample analysis of newly drilled wells, this study has confirmed that the buried valley near Flushing is likely of glacial origin and filled with varved glacial-lake clay and silt rather than fluvial sand and gravel sediments of the upper glacial aquifer. Another major difference is that this study finds no hydraulic connection within this buried valley between the upper glacial aquifer and the Lloyd aquifer as noted by Soren (1978) and Buxton and Shernoff (1999). There appears to be no gaps within the clay and silt sediments of the North Shore confining unit and that of the surrounding Raritan confining unit within the Flushing buried valley (figs. 8, 9, 20). The clay and silt of the North Shore confining unit restricts vertical flow between the North Shore aquifer and the upper glacial aquifer and also the Jameco and Magothy aquifers in this buried valley. The buried valley appears to be typical of those mapped along the northern part of Nassau County, where glacially eroded valleys are filled with varved clay and silt indicative of the North Shore confining unit that confines water in the underlying North Shore aquifer (Stumm, 2001; Stumm and others, 2002, 2004). This valley does not extend into southern Queens County as indicated by recent drilling with sediment samples and geophysical logs from this study, showing that Cretaceous sediments are present in this area.
In contrast, a similar buried valley in north-central Manhasset Neck contains both the North Shore aquifer and confining unit. In the southernmost part of this Manhasset Neck valley, there are areas of potential openings where the upper glacial aquifer or Magothy aquifer may be in hydraulic connection with the North Shore aquifer because of a gap between the Raritan confining unit and the North Shore confining unit (figs. 8, 9E, 18, 20; Stumm and others, 2002). There also appears to be a complex structural feature, possibly a fold in the North Shore confining unit, at the southernmost area of this buried valley. This narrow fold extends through the North Shore aquifer and is in contact with the bedrock surface, creating a localized, lateral hydraulic separation of the North Shore aquifer (figs. 8, 9E, 18). Hydrographs of water levels in the Lloyd and North Shore aquifers from wells in Manhasset Neck and a from a potentiometric surface map in 1997 (Stumm and others, 2002) indicate that this possible fold in the North Shore confining unit forms a low-permeability barrier that appears to isolate the western and eastern parts of the Lloyd and North Shore aquifers in this part of Manhasset Neck.
Two previously unmapped buried valleys were delineated in Kings County (figs. 8, 9, 18, 20). It is possible that one or both of these buried valleys were eroded by the ancestral Hudson or East Rivers, and were then deepened and widened by glacial erosion like those mapped in northern Queens and Nassau Counties. Veatch and others (1906) described at least one possible ancestral Hudson River channel eroding out a buried valley in Kings County and extending to the south off Long Island. Subsequent mapping by other researchers did not show any indications of buried valleys within Kings County; however, this may be due to a lack of new wells drilled with cores in that area (deLaguna, 1948, Buxton and others, 1981; Buxton and Shernoff, 1999).
Similar buried-valley sediments were found in New York County (Manhattan) northwest of the buried valleys in Kings County, suggesting a possible northwest extension of the Kings County valleys (Stumm, 2005; Stumm and Como, 2017). Core samples and geophysical logs from test wells drilled and installed in southern Manhattan Island indicate a deep northwest-trending valley that is 150 to 200 ft in depth that is filled with sand and gravel with diabase rock fragments, suggesting a possible fluvial origin (Stumm, 2005; Stumm and Como, 2017).
The North Shore confining unit underlies most northern parts of the study area (figs. 8, 9, 20). The upper surface of the North Shore confining unit is relatively flat in most parts of the study area except where older Pleistocene clay sediments included in the unit were possibly thrust-faulted and pushed to higher elevations during successive glacial advances during the late Pleistocene (figs. 8, 9, 20; Stumm, 2001; Stumm and others, 2002, 2004). The surface of the North Shore confining unit ranges from more than 50 ft above sea level in southern Great Neck to greater than 220 ft below NAVD 88 at well N 12855 (figs. 8, 9, 20). Marine seismic-reflection surveys indicate that the unit extends offshore and underlies embayments surrounding the study area (figs. 8, 9, 20; Stumm, 2001; Stumm and others, 2002, 2004). The North Shore confining unit has a maximum thickness of about 500 ft in northeastern Nassau County (figs. 8, 9, 20).
The geometric mean hydraulic conductivity estimated from the NMR log of the North Shore confining unit penetrated by monitoring well N 12321 was 0.22 ft/d (fig. 19; table 4). The estimated mean clay-bound, capillary-bound, and mobile water fractions of the confining unit penetrated by the well were 0.15, 0.20, and 0.01 respectively (table 5), which was the highest mean clay-bound and capillary-bound water content and lowest mean mobile water content estimated from the NMR logs for any hydrogeologic unit measured for this study.
Jameco Aquifer
The Jameco aquifer is present mainly in Kings and Queens Counties and only extends into the southwesternmost part of Nassau County (figs. 8, 9, 21). The aquifer sediments consist of reddish-brown (10R 4/3) to brown (7.5YR 4/3) gravel with coarse sand and boulders of mixed mineralogy and lithology, including diabase, gneiss, schist, sandstone, shale, and granite, which makes the unit distinctive when compared to the typical quartz-rich gravel in the upper glacial and Magothy aquifers (Veatch and others, 1906; Suter and others, 1949; Soren, 1971). Pebbles in the Jameco aquifer are well-sorted and well-rounded, suggesting fluvial transport. Analyses of core samples from wells Q 4117, K 3617, and K 3614 indicate nearly identical mineralogy and rock types in pebbles sampled from within the Jameco aquifer. This observation suggests that the aquifer sediments likely were deposited throughout northwestern Kings and Queens Counties, and extend into the southern parts of both Counties and into parts of southern Nassau County (figs. 8, 9, 21). The Jameco aquifer ranges in thickness from less than 1 ft near its northwestern extent to about 200 ft in west-central Queens County. The elevation of the Jameco aquifer ranges from about 150 ft above NAVD 88 in north-central Queens County to about 310 ft below NAVD 88 in the Rockaway area of southeastern Queens County (figs. 1, 9, 21). The variable surface elevation of the unit indicates that following deposition of the gravel, there was subsequent erosion. The Jameco aquifer sediments appear to show draped deposition from northwest to southeast over the westernmost parts of the study area (figs. 8, 9, 21).
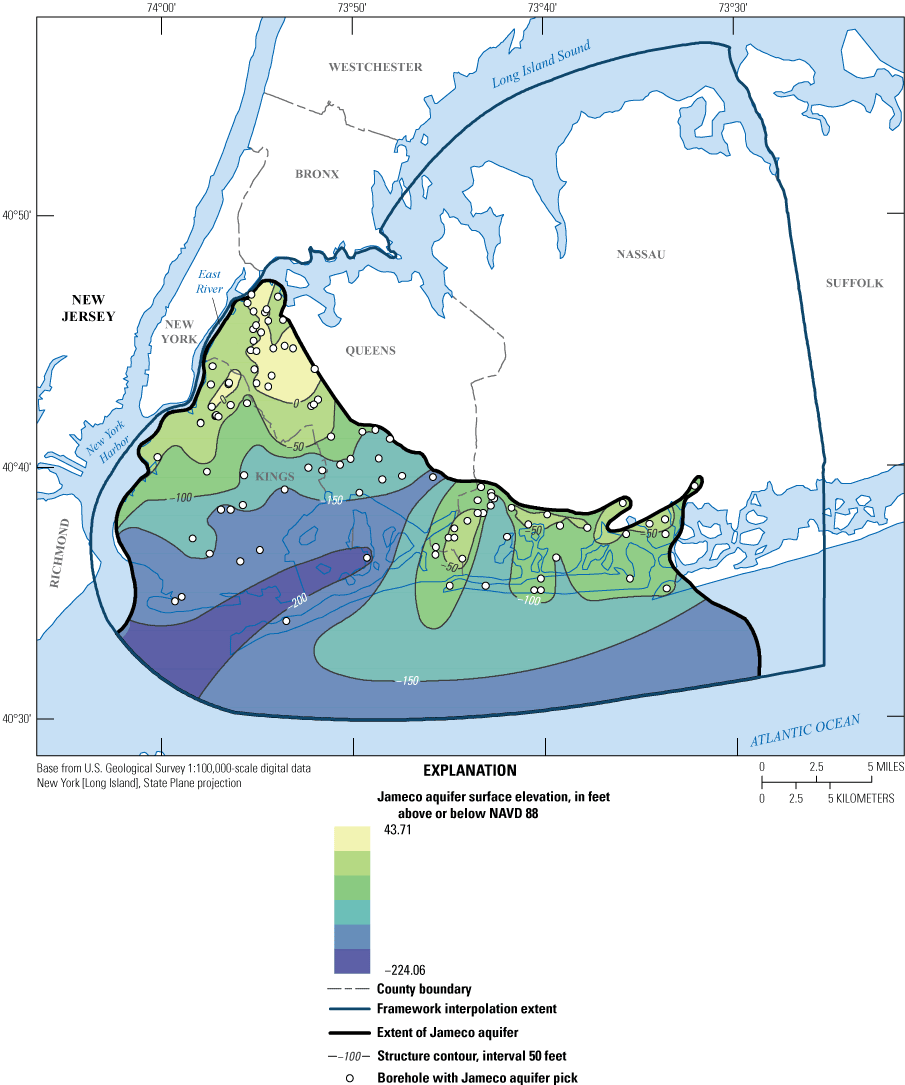
Map of interpolation data, surface elevation, and the extent of the Jameco aquifer underlying Kings, Queens, and Nassau Counties, New York. NAVD 88, North American Vertical Datum of 1988.
Suter and others (1949) considered the Jameco aquifer to be the oldest Pleistocene unit of Long Island. Stone and Borns (1986) suggested a younger age (late Illinoian) for the Jameco aquifer than previously thought. Data collected as part of this study show that the Jameco aquifer overlies the North Shore confining unit and North Shore aquifer in a newly delineated buried valley at well K 3617 in central Kings County, suggesting that parts of the North Shore confining unit and aquifer may be older than the Jameco aquifer (figs. 8, 9, 21). The Jameco aquifer is the most hydraulically conductive of all the aquifers in western Long Island due to its well-sorted and coarse-grained lithology. The geometric mean hydraulic conductivity of the Jameco aquifer estimated from 49 pumping tests was 500 ft/d (Williams and others, 2020; table 4). Suter and others (1949) indicated that most of the public-supply wells that pumped from the Jameco aquifer in southern Kings County experienced rapid saltwater intrusion due to the high transmissivity of the aquifer. Previous studies typically combined the Jameco aquifer with the underlying Magothy aquifer due to uncertainties of well-screen depths and lack of detailed lithologic logs (Soren, 1971; Buxton and others, 1981; Buxton and Shernoff, 1999; Como and others, 2015).
Gardiners Confining Unit
The Gardiners confining unit consists of marine sediments, mainly a greenish-gray or gray clay (5Y 5/1), with a minor amount of sand in some areas that contains diatoms, foraminifers, and shell fragments that were deposited along the southern coast of Long Island during a Pleistocene interglacial period (Suter and others, 1949). The Gardiners confining unit is present along the southernmost parts of Kings, Queens, and Nassau Counties (figs. 8, 9, 22). The confining unit has a gentle slope to the south and appears to thin and pinch out toward its northern extent, indicating a transgressive depositional setting during an interglacial period (Suter and others, 1949). The unit decreases in thickness from north to south and ranges in thickness from 190 ft in the southwesternmost part of Kings County to less than 1 ft near the northern extents of the unit (figs. 9, 22). The Gardiners confining unit ranges in elevation from about 2 ft above NAVD 88 in the area north of Long Beach to about 190 ft below NAVD 88 in the Rockaway Island area (figs. 1, 9, and 22).
The Gardiners confining unit generally overlies the Jameco aquifer in the southmost parts of the study area (figs. 8, 9, 22). Locally, the unit is a confining unit for the underlying Jameco and Magothy aquifers. Previous studies delineated and separated out a shallow Pleistocene clay layer called the 20-foot clay (Smolensky and others, 1990). However, examination of core samples, geologic logs, and gamma logs in this study suggest that there are no clear, widespread separations between these clay units. The 20-foot clay was indistinguishable from the Gardiners confining unit, with only thin sand separating them in some areas, and is considered to be part of the Gardiners confining unit in this study (figs. 9, 22).
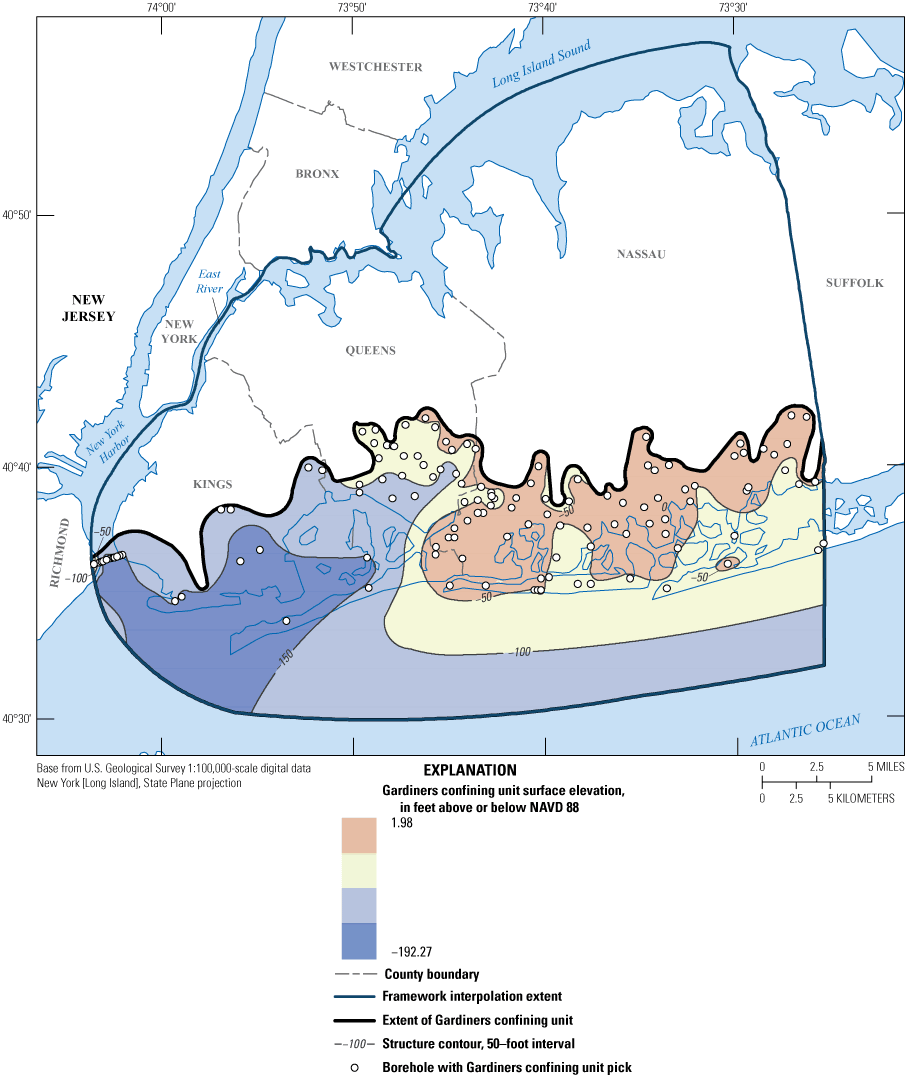
Map of interpolation data, surface elevation, and extent of the Gardiners confining unit underlying Kings, Queens, and Nassau Counties, New York. NAVD 88, North American Vertical Datum of 1988.
Upper Glacial Aquifer and Semiconfined Glacial Aquifer
The upper glacial aquifer consists of ice contact (glacial moraine and outwash) sediments of Pleistocene age (figs. 1, 9, 23; Suter and others, 1949; Cadwell, 1989; Smolensky and others, 1990). These sediments consist of stratified fine- to coarse-grained sand and gravel, unstratified boulders, clay, and silty till. This unit generally consists of moderately to poorly sorted brown (7.5Y 4/6) sand and dark yellowish-brown (10YR 4/6) sand with quartz, opaque minerals, rock fragments, and biotite and muscovite. The upper glacial aquifer is unconfined, and the water table is within the unit in most areas (fig. 24).
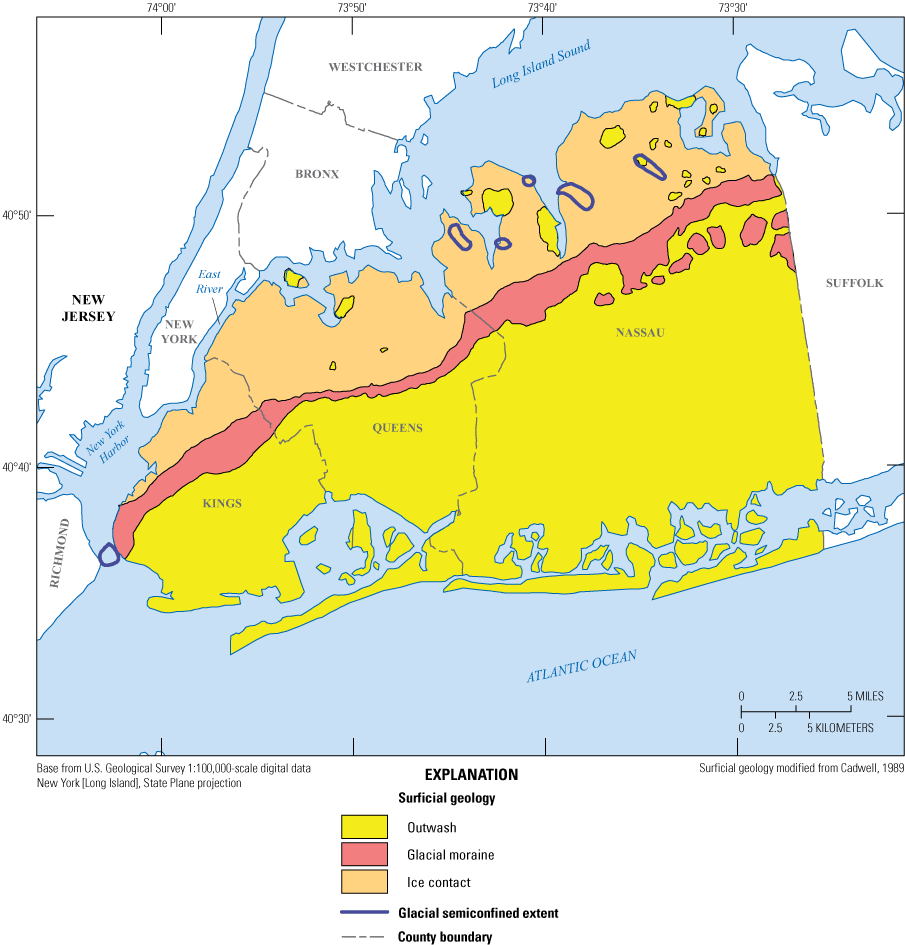
Surficial geology map with major geomorphic features underlying Kings, Queens, and Nassau Counties, New York (modified from Cadwell, 1989).
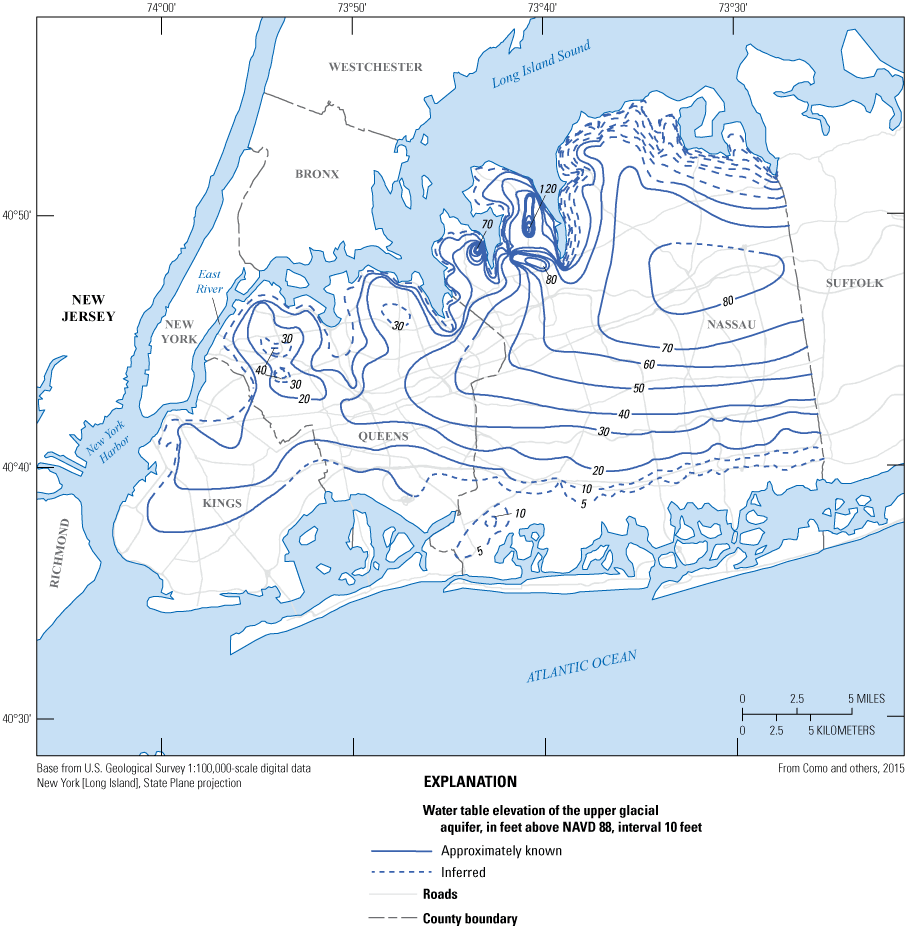
Water table elevation map of the upper glacial aquifer in 2013 underlying Kings, Queens, and Nassau Counties, New York (modified from Como and others, 2015).
In a few isolated areas, the North Shore confining unit overlies sediments of the upper glacial aquifer, potentially confining or semiconfining water locally. In these instances, the sediments were mapped as a semiconfined subdivision of the upper glacial aquifer (figs. 1, 9, 23). Only a few areas of the upper glacial aquifer are thought to be semiconfined. These pockets of potentially semiconfined glacial aquifer range in thickness from less than 5 ft in southwesternmost Kings County to 290 ft in northeastern Nassau County (figs. 1, 9, 23, 23). The elevation of the semiconfined glacial aquifer ranges from about 5 ft below NAVD 88 in northern Great Neck to about 220 ft below NAVD 88 in southwesternmost Kings County (figs. 1, 9, 23).
Most of the upper glacial aquifer is unconfined throughout the study area. Offshore seismic-reflection surveys and core samples indicate that the upper glacial aquifer extends well offshore along the southern coast, but is limited to nearshore areas along the northern parts of Nassau County (Stumm and others, 2002). The upper glacial aquifer historically was a major source of water supply in western Long Island. The upper glacial aquifer south of the glacial moraines within the study area (Harbor Hill and Ronkonkoma) is composed predominantly of well-sorted outwash and is more hydraulically conductive than sediments north of the moraines where the aquifer is comprised of variably silty ice-contact sediments (figs. 1, 9, and 23). The geometric mean hydraulic conductivity of the upper glacial aquifer as estimated from 121 pumping tests in the glacial outwash was 200 ft/d; north of the moraine, the mean was 120 ft/d (table 4) as estimated from 22 pumping tests. The total porosity of the upper-glacial outwash south of the moraine ranged from 30 to 40 percent based on laboratory analysis of several hundred samples from southern Long Island as reported by Veatch and others (1906). The geometric mean hydraulic conductivity of the upper glacial aquifer estimated from the NMR log of monitoring well N 12321 located in Manhasset Neck north of the moraine was 34 ft/d, reflecting the high silt content of the ice-contact sediments at the site (figs. 2, 19). The relatively low hydraulic conductivity for the upper glacial aquifer, and a likely presence of local clay lenses, may be responsible in part for the elevated mound (120 ft above NAVD 88) in the water table in this area of Manhasset Neck (Stumm and others, 2002). NMR logging of well N 12321 confirmed saturated conditions throughout sediments with low permeability below this well, ruling out perched water conditions. The mobile, capillary, and clay-bound water contents of the upper glacial aquifer estimated from the NMR log of well N 12321 averaged 0.23, 0.15, and less than 0.01, respectively (table 5).
Land surface defines the top of the unsaturated portion of the upper glacial aquifer, while the top of the saturation zone within the aquifer is the water table. Locally in north-central Nassau County, the glacial sediments of the upper glacial aquifer can be unsaturated, and the water table occurs in the uppermost part of the underlying Magothy aquifer.
Merged Aquifers Units
Each aquifer unit previously discussed is defined by very specific age and depositional environments and variations in hydraulic properties due to facies changes. However, many units are laterally adjacent to each other with no confinement between them (figs. 8, 9).
The upper glacial, Jameco, and Magothy aquifers in Kings, Queens, and southern Nassau Counties were combined into one hydrogeologic complex, referred to in this report as the upper glacial-Jameco-Magothy aquifer complex (UJM). The Jameco aquifer is absent in northeastern Queens and northern Nassau Counties, so in these areas, only the upper glacial and Magothy aquifers were combined into the UJM. These aquifers are in hydraulic connection, and are above the major confining units of the Raritan confining unit, the North Shore confining unit, or both. Below these major confining units, the deeper Lloyd and North Shore aquifers were also combined into a single hydrogeologic complex, referred to in this report as the NSL (North Shore and Lloyd aquifer complex). The NSL is confined by the Raritan confining unit and North Shore confining unit, and the individual aquifers are in hydraulic connection throughout the study area. The NSL as an aquifer is present only in the northern parts of the study area because the North Shore aquifer is absent in the southern parts of the study area.
Saltwater Intrusion
The Long Island aquifer system is surrounded by saltwater embayments where the underlying groundwater contains saltwater. The interface between freshwater and saltwater is in balance with recharge to the water table and density differences between the freshwater and saltwater. This freshwater–saltwater interface is dynamic and responds to changes in hydrologic stresses in the aquifer system, most notably groundwater withdrawals for public supply. Water-supply pumpage on western Long Island began during the 1870s with small, localized public suppliers and private supply wells in western Kings and Queens Counties and other populated areas (Veatch and others, 1906). In addition, industrial-well pumpage began in the western part of Kings County during the late 19th century as commercial companies began to set up the first industrial-park-like operations. Most of the public water supply in Kings and Queens Counties between 1904 and 1916 was pumped from the upper glacial aquifer at average rates of 21 and 37 million gallons per day (Mgal/d), respectively (Johnson and Waterman, 1952). As the population increased during the early 20th century, public-supply pumpage began to overtake industrial groundwater pumpage (Lusczynski, 1952). Most of the public-supply pumpage was focused at the Flatbush pumping center in central Kings County (fig. 3) during the 1930s, with total public- and industrial-supply pumpage from all aquifers in Kings County averaging 60 Mgal/d (Lusczynski, 1952).
By 1936, pumping in central Kings County had created a major cone of depression in the water table that extended to the south shore of much of Kings County and into southwestern Queens County (Chu and Stumm, 1995; Cartwright, 2002). Maximum drawdowns in the area exceeded 35 ft below sea level, resulting in saltwater intrusion and rapidly increasing chloride concentrations that required shutting down the public-supply wells at the Flatbush pumping center. Industrial pumping continued at rates of about 23 Mgal/d in northern Kings County after the public-supply wells were shut down in that area, where groundwater levels remained below sea level into the 1960s (Buxton and others, 1981). The cessation of pumping at the Flatbush pumping center was balanced by increased public-supply pumping from the Woodhaven pumping center in southwestern Queens County (Chu and Stumm, 1995; Cartwright, 2002; fig. 3). However, by 1961, a major cone of depression had developed in western Queens County, and in 1974, saltwater intrusion required shutting down the public-supply wells at the Woodhaven pumping center (Buxton and others, 1981). Public-supply pumping then moved eastward to the Jamaica pumping center in central and southern Queens County (fig. 3).
Since about 1955, the New York State Department of Environmental Conservation has restricted pumping from the Lloyd aquifer to coastal communities in northern and southern Nassau County where this aquifer is the only source of potable groundwater (Garber, 1986). One notable exception was in central Queens County, where the Jamaica Water Supply Company had been pumping 4 to 6 Mgal/d from the Lloyd aquifer since the mid-1930s (Garber, 1986). Garber (1986) estimated predevelopment water levels in the Lloyd aquifer in northwestern Queens and most of Kings Counties was less than 10 ft above sea level (NGVD 29). Kimmel (1973) indicated that pumpage of the Lloyd aquifer began in Queens County as early as 1910, and exponentially increased during the 1930s through the 1970s. Kimmel (1973) estimated about a 35- to 40-ft drop in the potentiometric surface of the Lloyd aquifer in 1970 when compared with early 1900s levels. By 1947, water levels in the Lloyd aquifer in most of Queens County and all of Kings County were tens of feet below sea level (NGVD 29), and these water levels continued to be below sea level into the early 1980s because of public-supply pumpage (Garber, 1986). Several public-supply wells, including Q 287 and Q 1030 in southern Queens County, were shut down by the 1980s due to saltwater intrusion (fig. 9G; Buxton and others, 1981). By the end of the 20th century, Kings and Queens counties transitioned from groundwater-supplied drinking water to water imported from upstate surface-water sources through water tunnels.
In Great Neck, Manhasset Neck, and the Oyster Bay areas in Nassau County, public-supply pumpage of the upper glacial and Magothy aquifers and the confined NSL aquifers has caused large cones of depression, resulting in saltwater intrusion. Stumm (2001) and Stumm and others (2002, 2004) noted water levels in these aquifers have localized cones of depression that extend tens of feet below sea level (NGVD 29), and delineated the extent of saltwater intrusion in these areas.
Historical Saltwater Intrusion
The predevelopment chloride concentration of freshwater on Long Island has been reported to be about 10 mg/L (Lusczynski and Swarzenski, 1966). However, in the 20th century, ambient chloride concentration of the shallow groundwater UJM aquifers in urbanized areas of Long Island was reported to be about 40 mg/L (Buxton and others, 1981; Heisig and Prince, 1993). This increase in chloride concentration is attributed to contamination from land surface sources. The chloride concentration in the NSL aquifers has been reported to be about 5 mg/L or less (Stumm, 2001; Stumm and others, 2002, 2004, 2020). Analysis of legacy chloride data collected by the USGS at industrial wells in Kings and Queens Counties from the beginning of the 20th century to the 1980s indicates that high chloride concentrations may have been present during predevelopment conditions due to the naturally low hydraulic heads in low-lying areas within the Lloyd, Jameco, and Magothy aquifers at or very close to the coastline in parts of Kings and Queens Counties and southwesternmost Nassau County (Kimmel, 1973; Garber, 1986; Stumm and others, 2020). In this report, freshwater is defined as groundwater with chloride concentrations of less than 250 mg/L, brackish water is defined as groundwater with chloride concentrations of 250 to 1,000 mg/L, and saltwater is defined as groundwater with chloride concentrations of greater than 1,000 mg/L. The U.S. Environmental Protection Agency has determined a secondary maximum contamination level for chloride in drinking water as 250 mg/L (U.S. Environmental Protection Agency, 2023).
Only one saltwater wedge, defined by peak chloride concentrations, was delineated for the UJM aquifer and also for the NSL aquifer because of the complex, hydraulically interconnected hydrogeologic framework and the variation in the number and depths of sampled wells within these aquifers. Wells with depths of less than 50 ft below land surface were excluded from the saltwater interface delineations to eliminate the effects of increased salt from coastal storm overwash, storm-tide inundation, and road salt contamination.
Historical Saltwater Intrusion in the Upper Glacial-Jameco-Magothy (UJM) Aquifer Complex
By the 1930s, chloride concentrations in the UJM aquifer complex in Kings County had increased to more than 100 mg/L (Lusczynski, 1952; Perlmutter and Arnow, 1953; Buxton and others, 1981), and by the 1940s, chloride concentrations at some inland wells exceeded 250 mg/L. The elevated chloride concentrations in the UJM resulted in the shutdown of public-supply wells within the Flatbush pumping center in Kings County in 1947 (Lusczynski, 1952). Lusczynski and others (1956) produced the earliest map of saltwater intrusion in the UJM in northwestern Queens and southern Nassau and Queens Counties. Lusczynski and others (1956) mapped a wedge of saltwater in the UJM in northwestern Queens and western Kings Counties in 1956. Breakthrough curves of chloride concentration in a well versus time were plotted for selected wells that had large (hundreds of mg/L) changes in chloride concentration and historical records of sampling. (fig. 25). These curves indicate that chloride generally increases slowly, followed by a rapid rise or breakthrough as the saltwater interface enters the well screen (fig. 25).
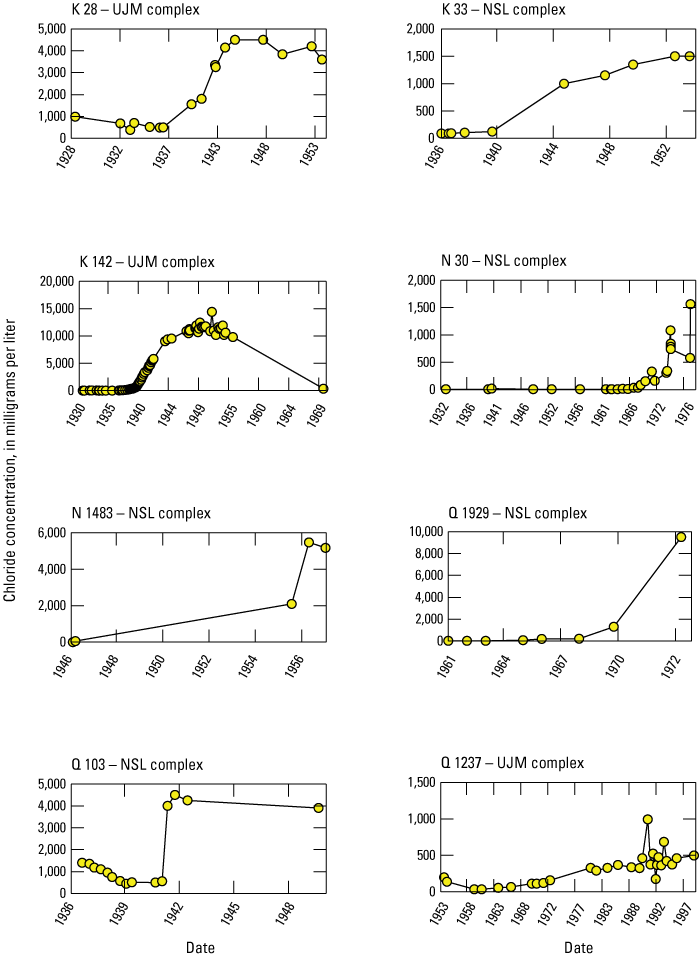
Graphs of chloride breakthrough curves for selected wells in western Long Island, New York. Locations of wells K 28, K 142, and Q 1237 are shown on fig. 26F. Locations of wells K 33, N 30, N 1483, Q 103, and Q 1929 are shown on fig. 28G. UJM, upper glacial-Jameco-Magothy aquifer complex; NSL, North Shore and Lloyd aquifer complex.
Suter (1937) documented a very large cone of depression referred to as “the crater” in the UJM that covered most of central Kings County during the mid-1930s, with water levels that were depressed more than 35 ft below sea level (NGVD 29) due to industrial and public-supply pumpage. Soren (1971) documented saltwater intrusion in the UJM in the early 1970s in the northwestern, north-central, and southwestern (Woodhaven Pumping Center) parts of Queens County. Lusczynski and Swarzenski (1966) delineated intermediate and deep UJM aquifer saltwater wedges in southern Nassau and southeastern Queens Counties by using chloride data from sampled observation wells, filter-press core samples, and geophysical logs.
A complex saltwater wedge documented within the UJM in southwestern Nassau County during 1958–61 was described as interlaced shallow, intermediate, and deep saltwater wedges within the freshwater aquifer (Lusczynski and Swarzenski, 1966). Salty groundwater was documented in southern Kings and Queens Counties in the UJM aquifer in 1983, but the saltwater interface was assumed to be several miles offshore to the south of Rockaway Island in southern Queens County (Buxton and Shernoff, 1999). Terraciano (1997) mapped the extent of saltwater intrusion in southwestern Nassau County and southeastern Queens County from 1988 to 1989 from existing observation wells. Analyses of historical chloride data from industrial supply wells and from observation wells sampled by the USGS from 1920 to 2022 provide a more detailed pattern of saltwater intrusion in the UJM aquifer than those in previous studies.
Kings and Queens Counties
During the period from 1920–39, chloride concentrations were more than 20,000 mg/L in western Kings County, more than 5,700 mg/L in southern Kings County and parts of southern Queens County (fig. 26A), and were as high as 14,000 mg/L in parts of northwestern Kings County and 560 mg/l in Queens County (fig. 26A). Saltwater intrusion affected the Flatbush pumping center in Kings County as pumping increased, with chloride concentrations as high as 800 mg/L in the UJM aquifer during the period from 1940–59 (fig. 26B). Lusczynski and others (1956) mapped a wedge of saltwater intrusion in northwestern Queens County and into western Kings County with concentrations as high as 5,000 mg/L, and a wedge of saltwater in the UJM aquifer in southern Kings and Queens Counties and southwestern Nassau County during 1956. During the period from 1960–79, chloride concentrations were as high as 2,000 mg/L in the Flatbush area of Kings County and 1,800 mg/L in southern Queens County (fig. 26C). During the period from 1980–99, the largest changes in the saltwater interface were seen in northern Queens County, where chloride concentrations were as high as 550 mg/L, and in southern Queens County, where concentrations were as high as 2,600 mg/L (fig. 26D). Reductions in pumpage in western Queens and Kings Counties may have caused the saltwater interface to stabilize during the period from 1980–99 (fig. 26D).
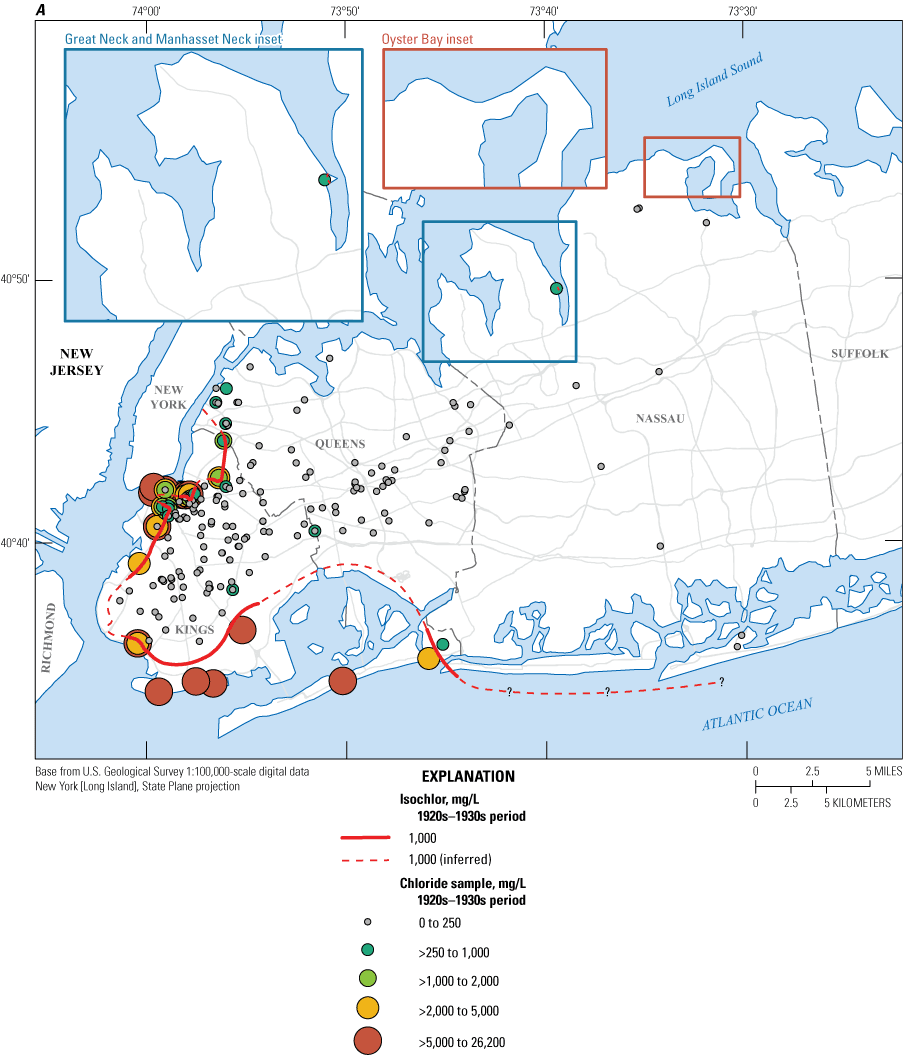
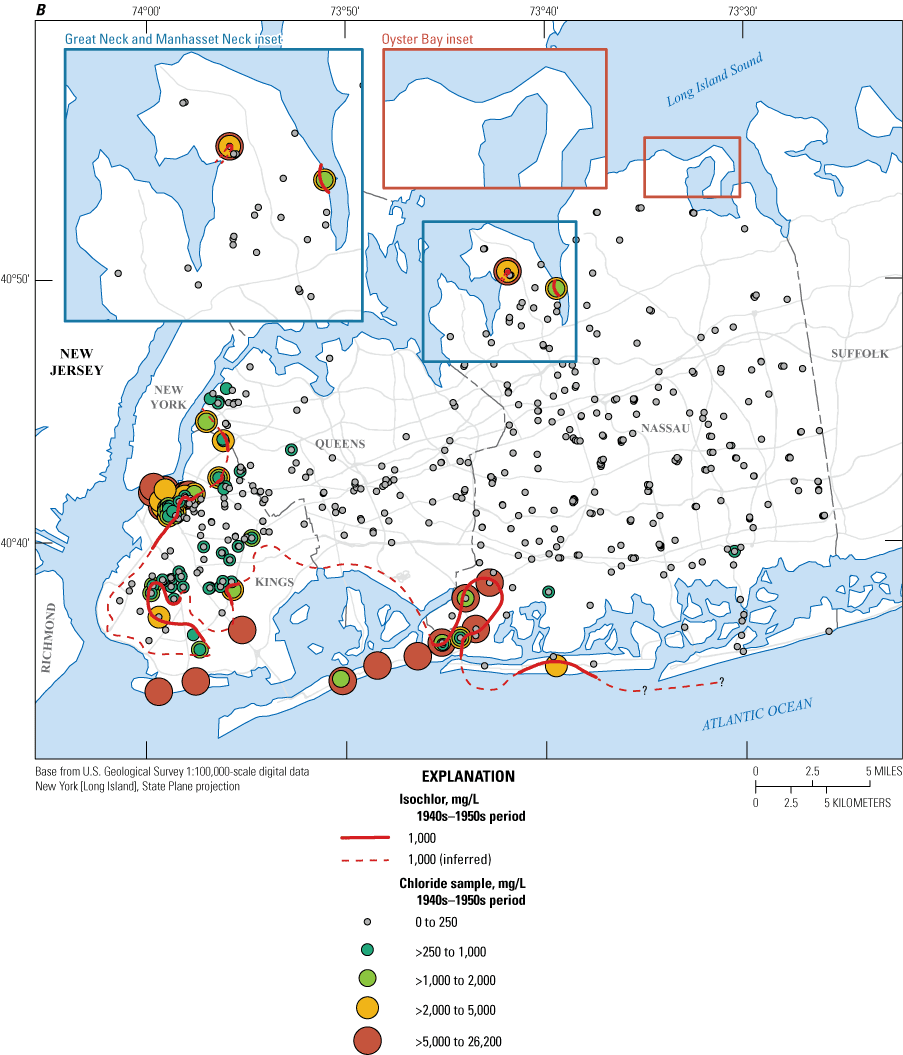
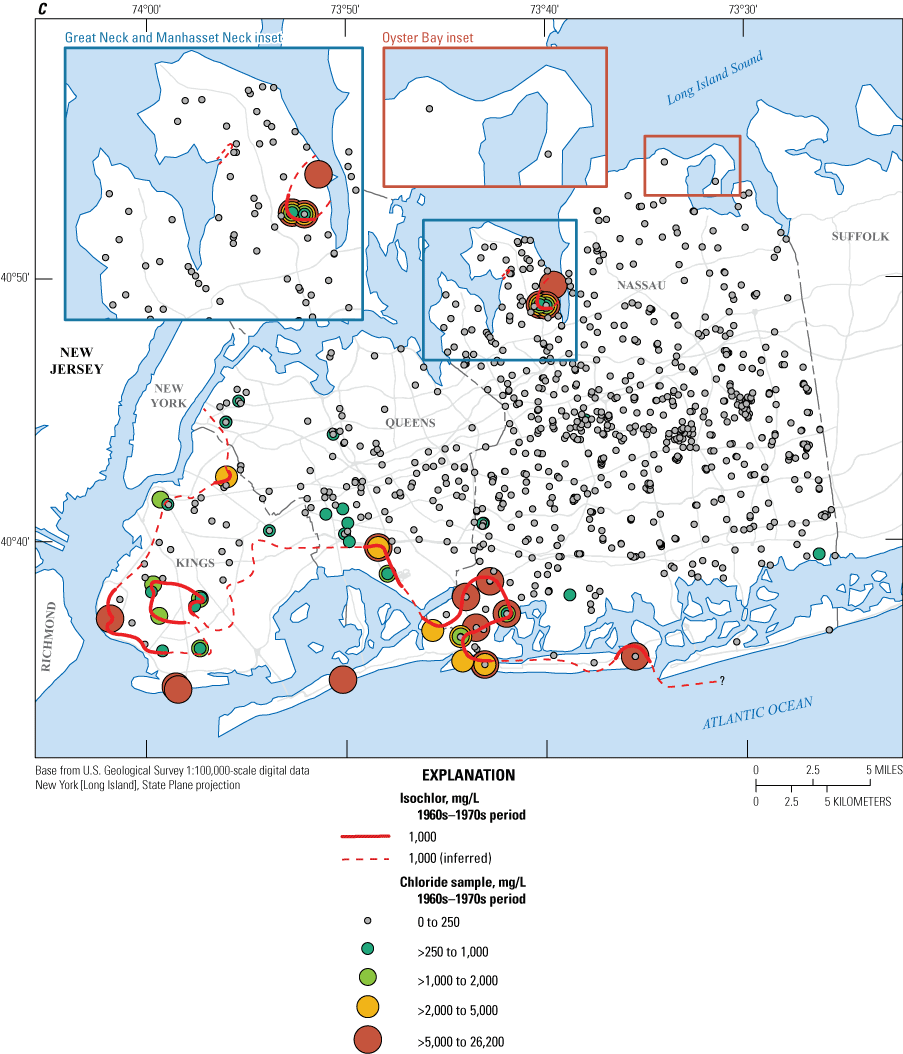
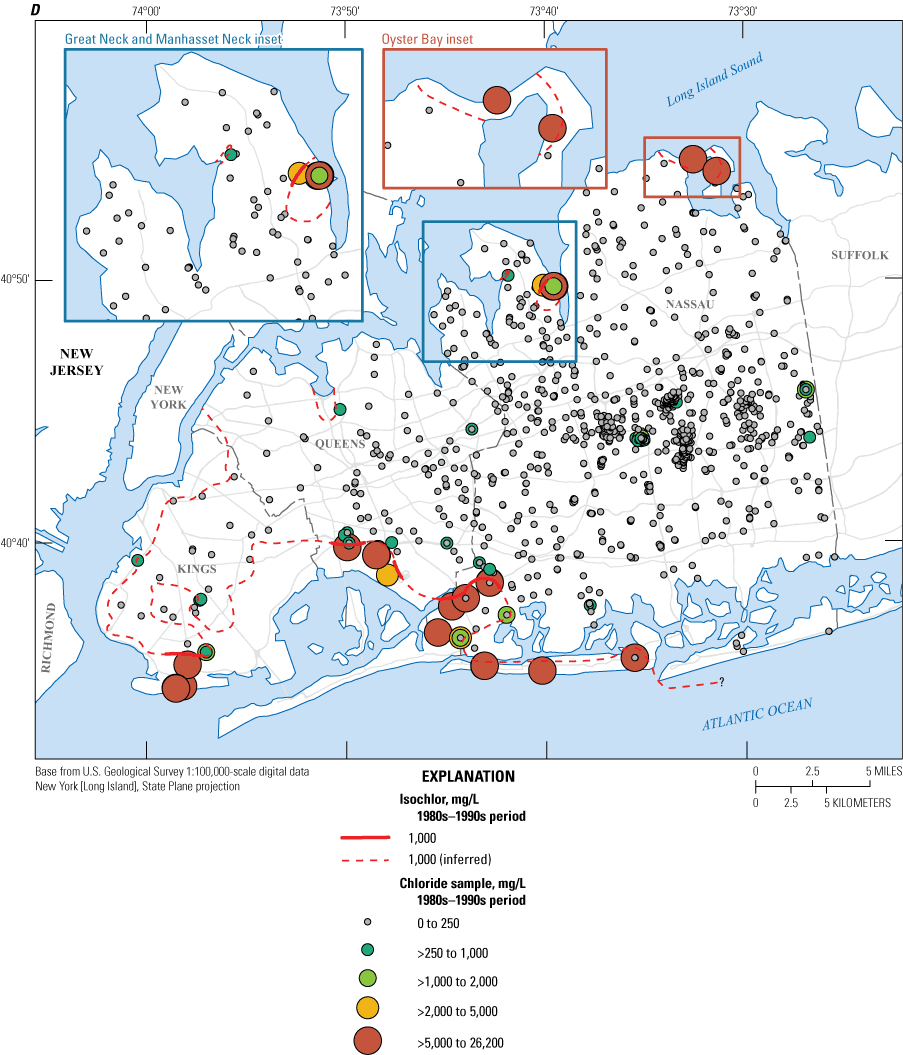
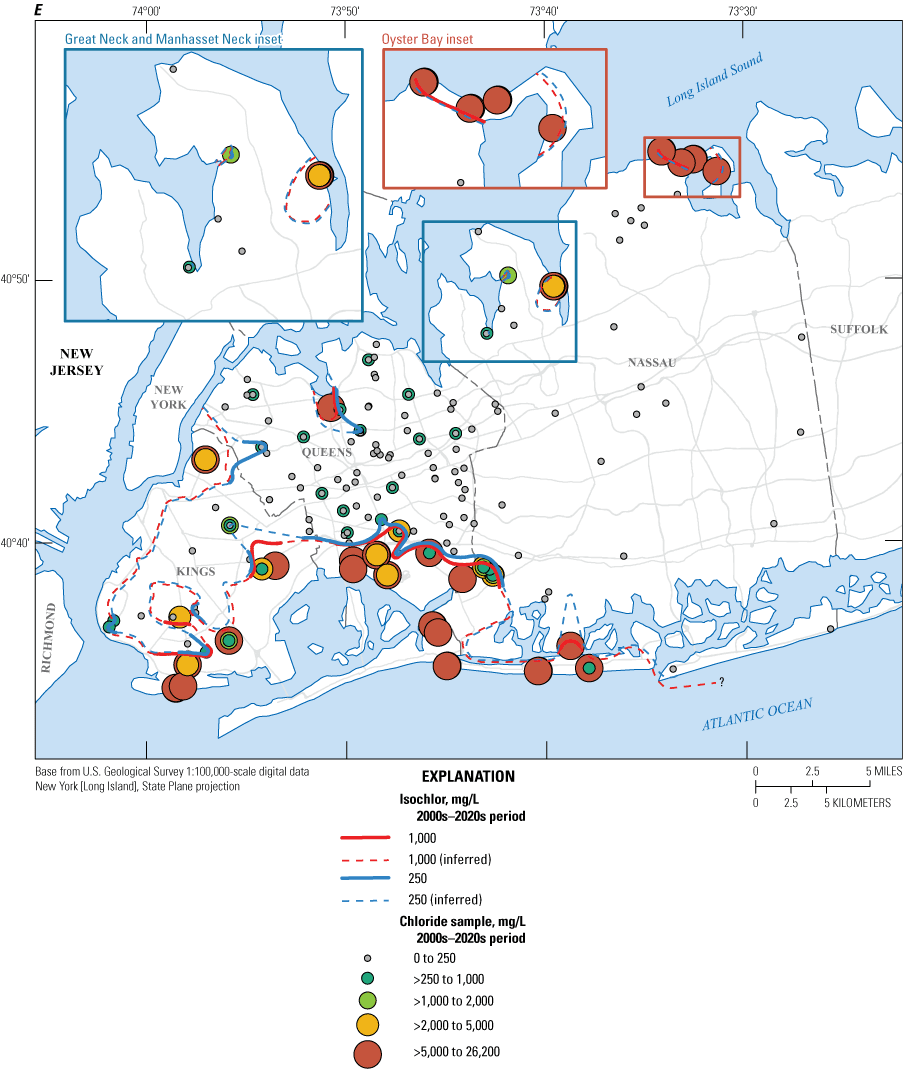
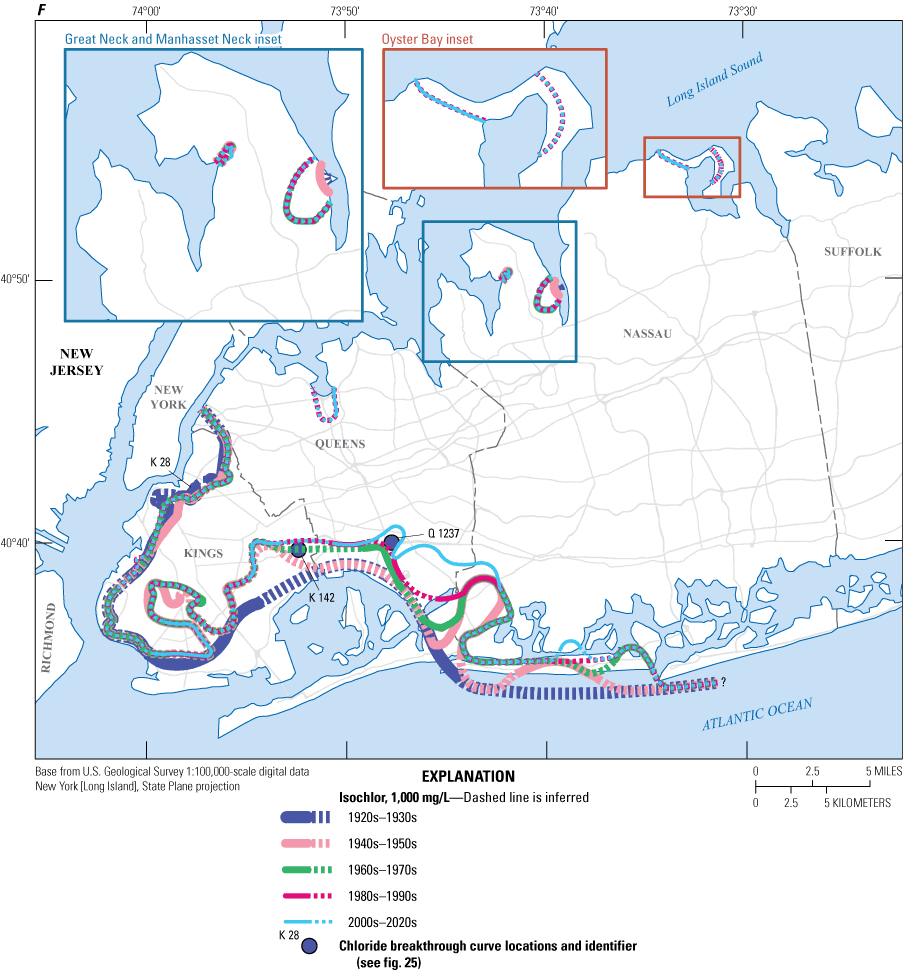
Maps of the historical 1,000 milligram per liter isochlor map for the upper glacial-Jameco-Magothy (UJM) aquifer complex for the periods of A, 1920s-1930s, B, 1940s-1950s, C, 1960s-1970s, and D, 1980s-1990s; E, 1,000 and 250 milligram per liter chloride for 2000s-2020s; and F, all periods combined with well notations for chloride breakthrough curves (fig. 25) in western Long Island, New York. Mg/L, milligrams per liter.
Nassau County
In southwestern Nassau County, no wells were sampled during the period from 1920–39. However, the 250 mg/L isochlor in the UJM aquifer is estimated to have been near the border of Nassau and Queens Counties based on data from well Q 286 (fig. 26A). From 1940–59 in the Inwood area of southwestern Nassau County, chloride concentrations were as high as 1,300 mg/L (fig. 26B). Chloride concentrations in the UJM increased to as much as 18,300 mg/L along the southwestern border of Nassau County during the period from 1940–59 (fig. 26B). Chloride concentrations also began to increase in the UJM aquifer at Long Beach in Nassau County during the period from 1940–59, with values exceeding 3,000 mg/L (fig. 26B). During the period from 1960–79, concentrations as high as 16,000 mg/L were measured in southwestern Nassau County, and as high as 8,700 mg/L at Long Beach (fig. 26C). From 1980–99, isochlors in southwestern Nassau County coalesced into a large wedge from eastern Long Beach to the Inwood area, with chloride concentrations as high as 12,250 mg/L at Long Beach and 17,000 mg/L in the Inwood area, (fig. 26D). From 2000 to 2022, chloride concentrations continued to increase in Inwood and the Long Beach areas of Nassau County, with recorded values greater than 23,000 mg/L (fig. 26E).
In eastern Manhasset Neck in northern Nassau County, chloride concentrations in the thousands of milligrams per liter were documented during 1960–79, likely because of sand mining in that area (fig. 26C; Stumm and others, 2002). During 1980–2022, chloride concentrations in the thousands and tens of thousands of milligrams per liter were observed in western and eastern Manhasset Neck and the Bayville areas of Nassau County (fig. 26D-F).
Examination of EM logs indicated a consistent slope in the saltwater–freshwater interface underlying Long Island as it relates to estimating chloride concentrations. Using these EM logs, the estimated thickness of freshwater within the UJM aquifer complex was determined at each well. The data were interpolated using the Natural Neighbors tool within ArcMap (Esri, 2020), and this analysis indicates a very sharp interface between freshwater and saltwater within the UJM aquifer complex. Figure 27 shows the thickness of the aquifer complex that is intruded with saltwater, represented as a percentage.
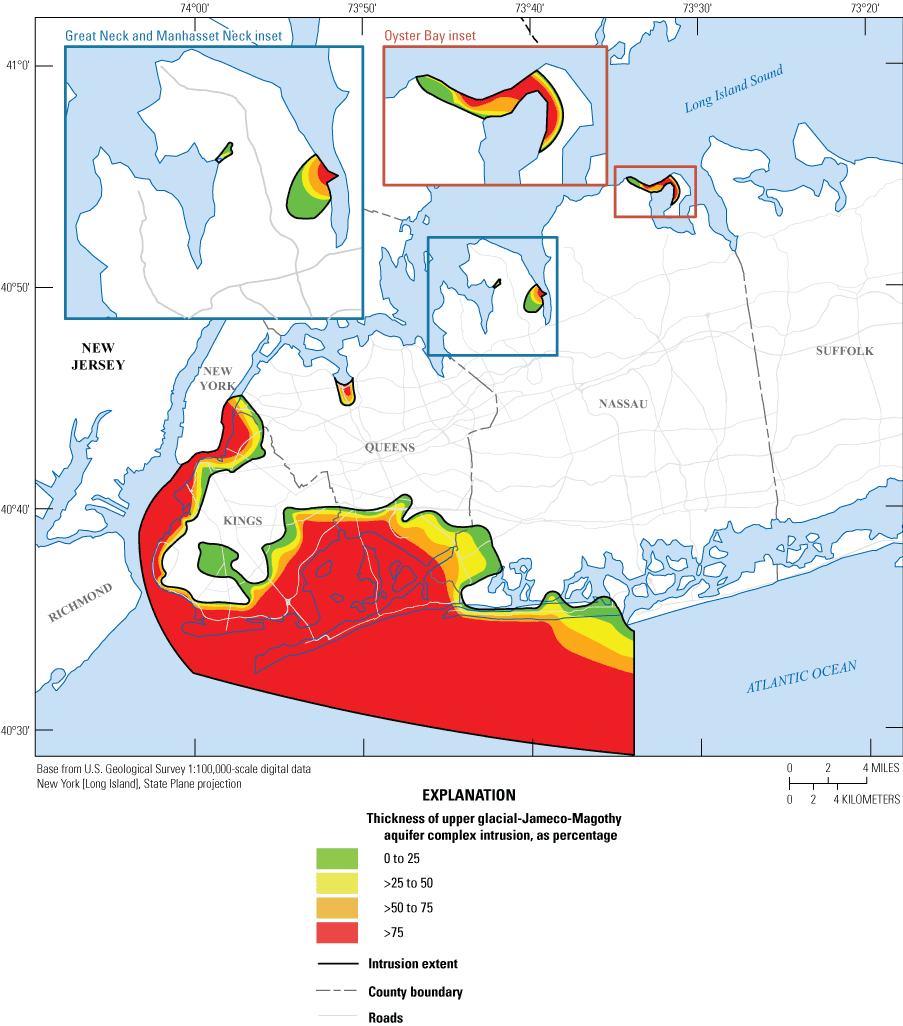
Map of the thickness of the upper glacial-Jameco-Magothy aquifer complex that is intruded with saltwater shown as a percentage estimated by electromagnetic induction (EM) logs taken during the period from 2000–22 in western Long Island, New York.
Historical Saltwater Intrusion in the Lloyd and North Shore Aquifers (NSL)
Previous studies on the extent of saltwater intrusion in the NSL in southwestern Long Island concluded that the saltwater interface in the Lloyd aquifer is several miles offshore beneath the Atlantic Ocean (Lusczynski and Swarzenski, 1966; Terraciano, 1997; Buxton and Shernoff, 1999). Elevated chloride concentrations in the Lloyd aquifer in the Rockaway area of Queens County were assumed to be the result of compromised well casings because the Lloyd aquifer was thought to contain only freshwater (fig. 9G; Perlmutter and Geraghty, 1963). Elevated chloride concentrations observed in 1983 in a few monitoring wells screened in the Lloyd aquifer in north-central Queens were dismissed as being caused by casing leakage; as a result, the saltwater interface was mapped several miles offshore (Buxton and Shernoff, 1999). Public-supply pumpage in the Lloyd aquifer during the 1950s only occurred in central and northeastern Queens County, Great Neck, Manhasset Neck, Oyster Bay, and Long Beach in Nassau County (Johnson and Waterman, 1952).
Analyses of historical chloride data for the period from 1890 to 2022 from industrial and observation wells indicate saltwater intrusion in parts the NSL aquifer (fig. 28A-G), which is the first documentation of saltwater intrusion of this aquifer in Kings and Queens Counties. The presence of high chloride concentrations early in the development of industrial and public-supply pumpage supports the hypothesis that the saltwater interface was at the southern coastline or onshore in Kings and Queens Counties during predevelopment conditions (fig. 28A, B).
Kings and Queens Counties
As early as 1890, chloride data from the first wells screened in the Lloyd aquifer indicate elevated chloride concentrations as high as 18,000 mg/L in western Kings County (fig. 28A). From 1890 to 1919, data from two wells indicate that a wedge of saltwater was likely onshore in western Kings County prior to the start of industrial pumping in the area (fig. 28A). Data from wells drilled between 1920 and 1939 indicate that the saltwater interface was probably onshore in northwestern Queens County and in western and southern Kings and Queens Counties during predevelopment conditions. Chloride concentrations during 1920–39 were as high as 20,000 mg/L in western Kings County, 2,000 mg/L in northwestern Queens County, and 240 mg/L in the Rockaway area of southern Queens County (fig. 28B). USGS groundwater-flow models (Kontis, 1999; Buxton and Shernoff, 1999) used the assumption that the saltwater interface was miles offshore and did not show any saltwater intrusion in these areas of Kings and Queens Counties, which does not agree with historical chloride data and current geophysical logs.
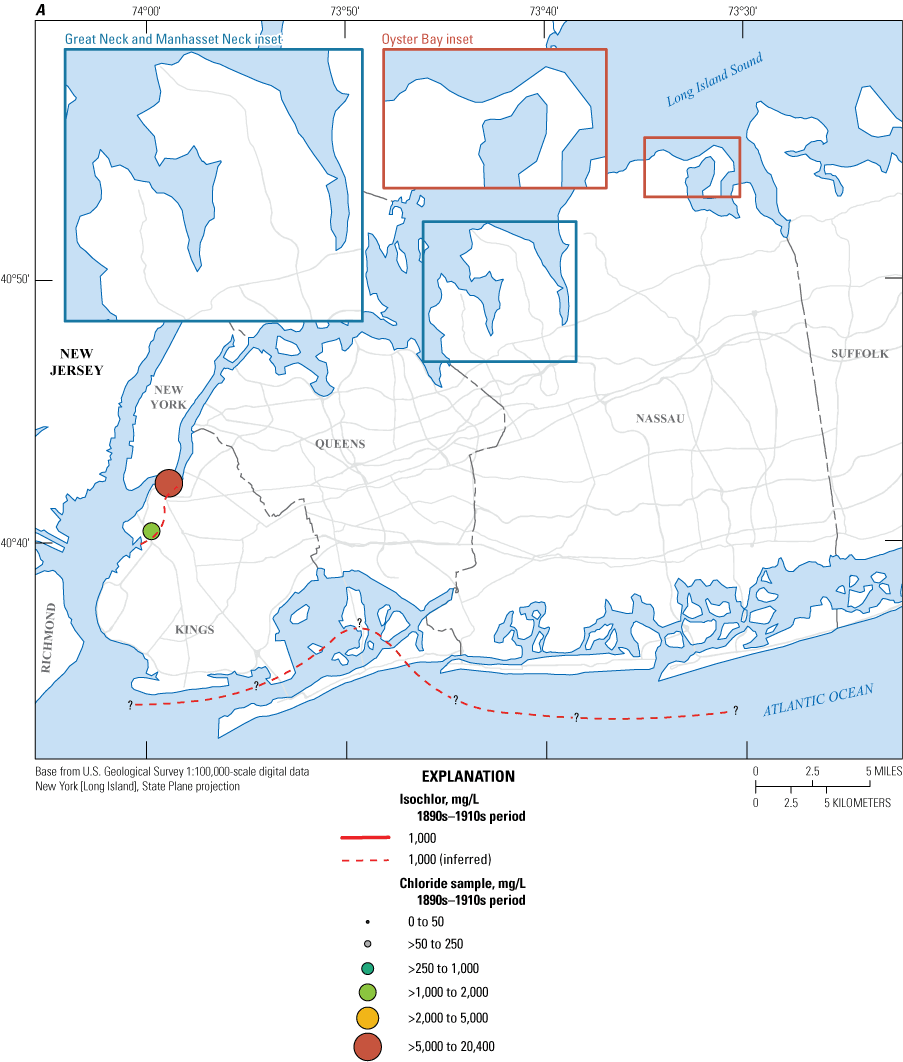
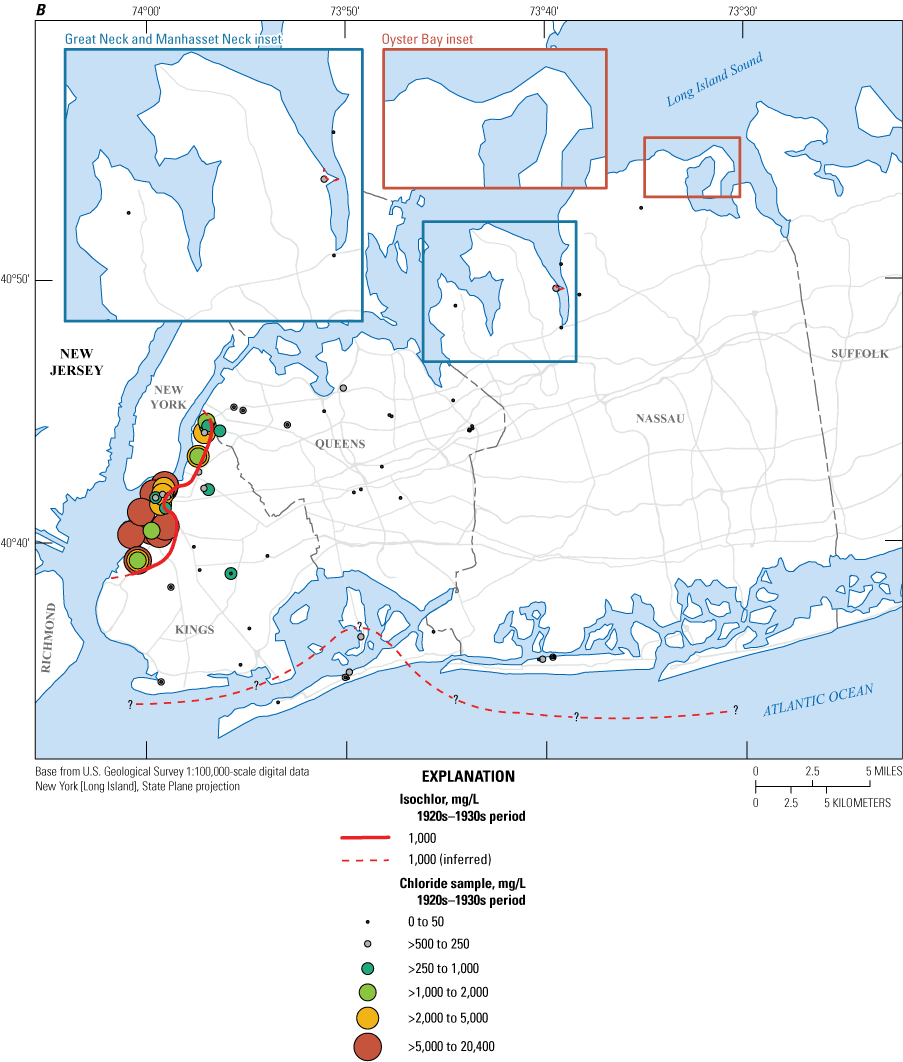
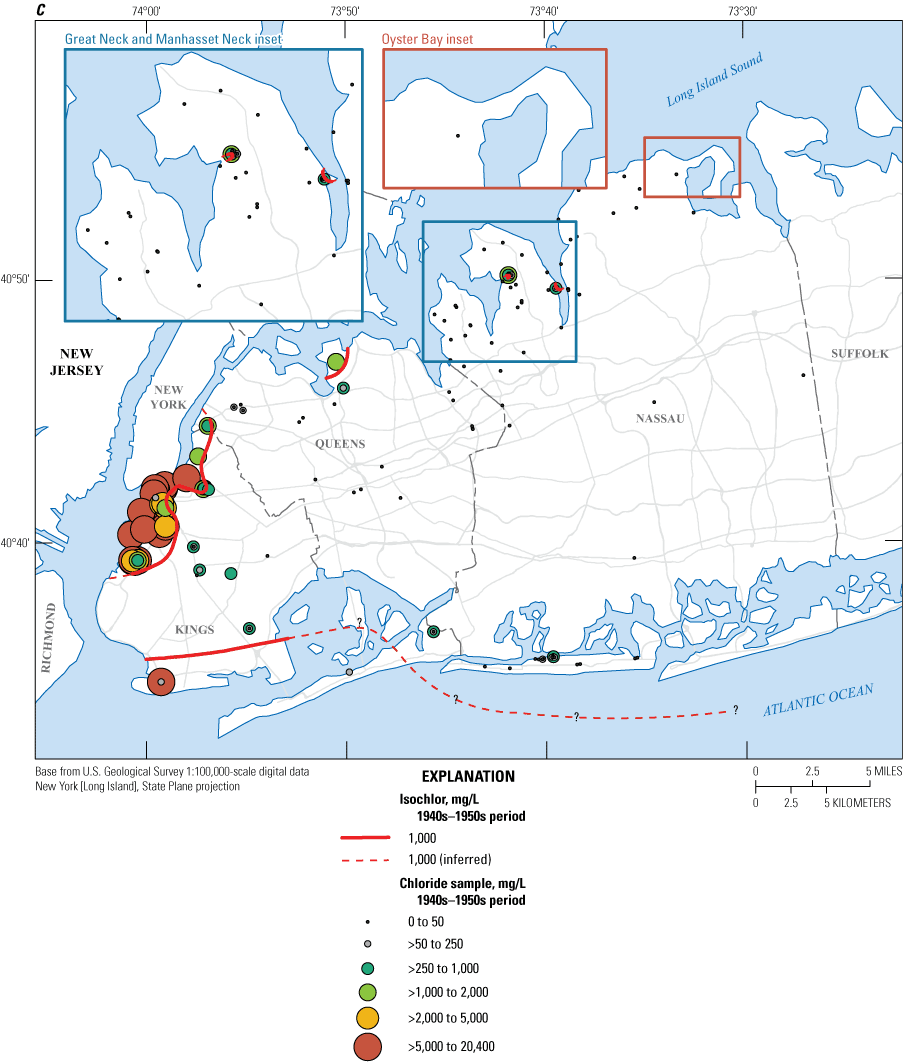
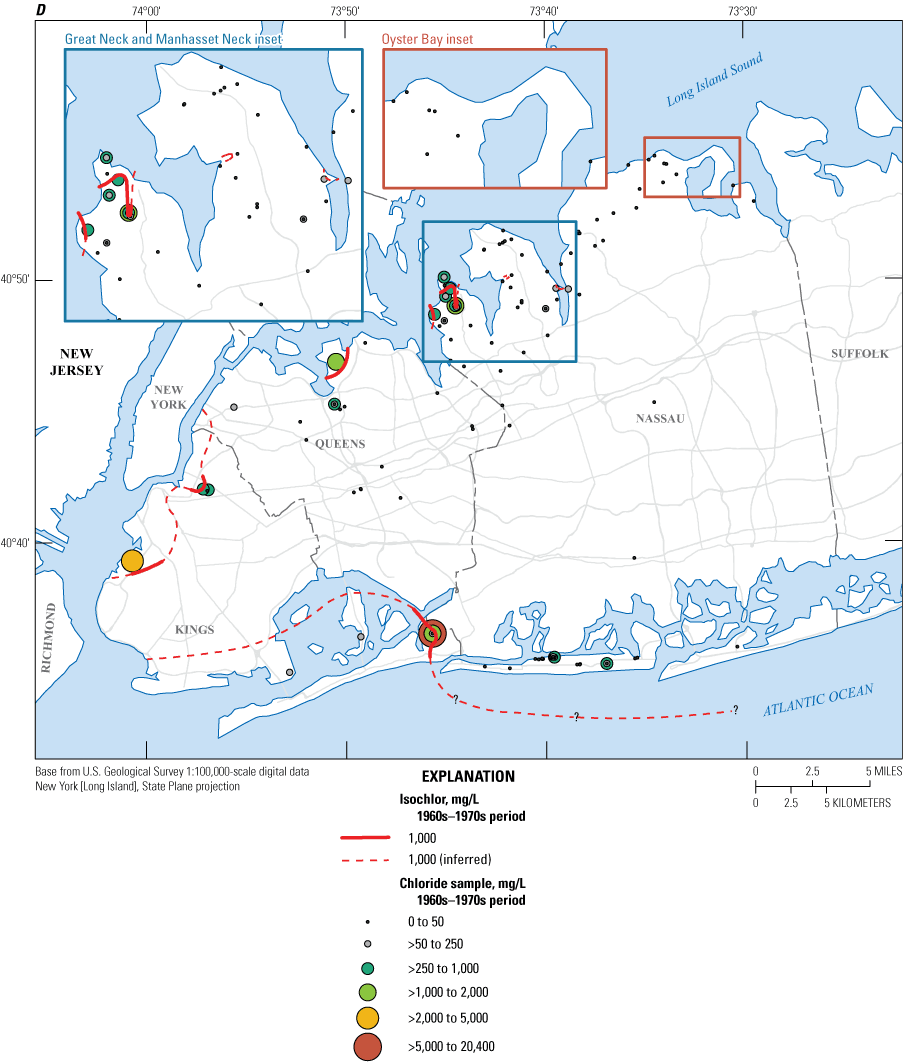
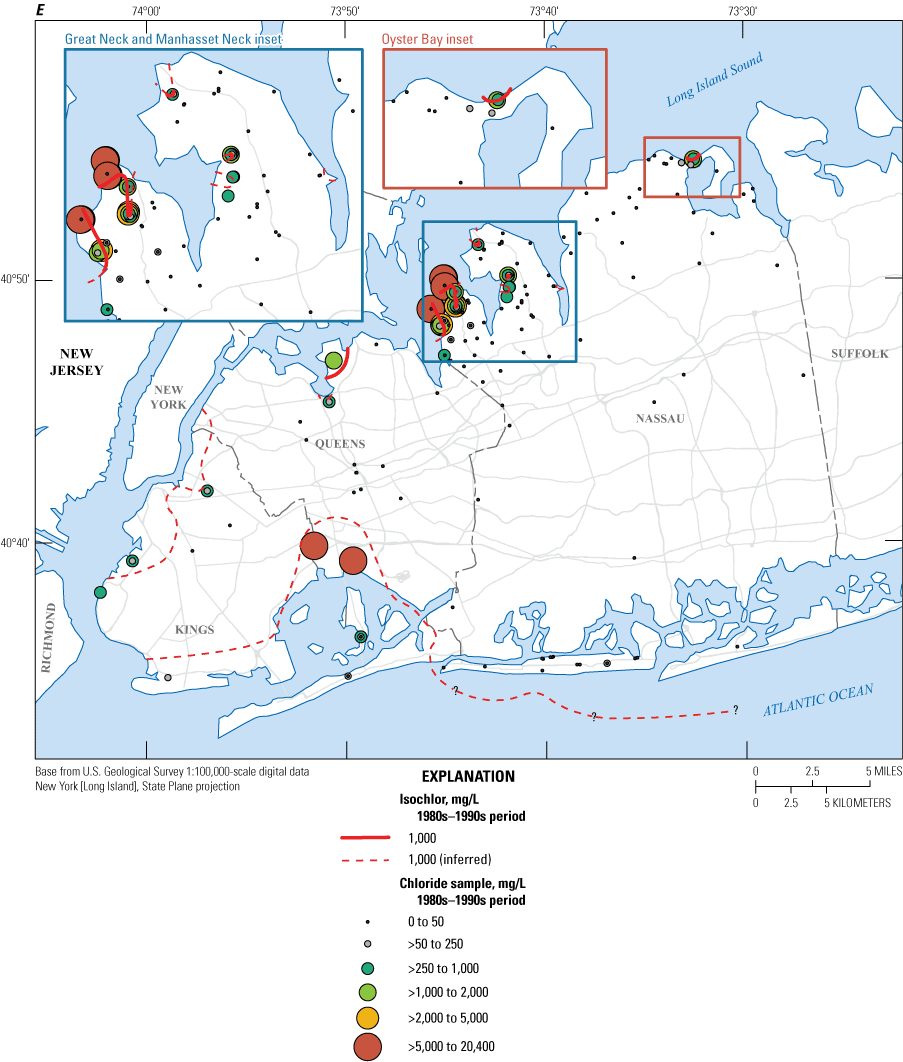
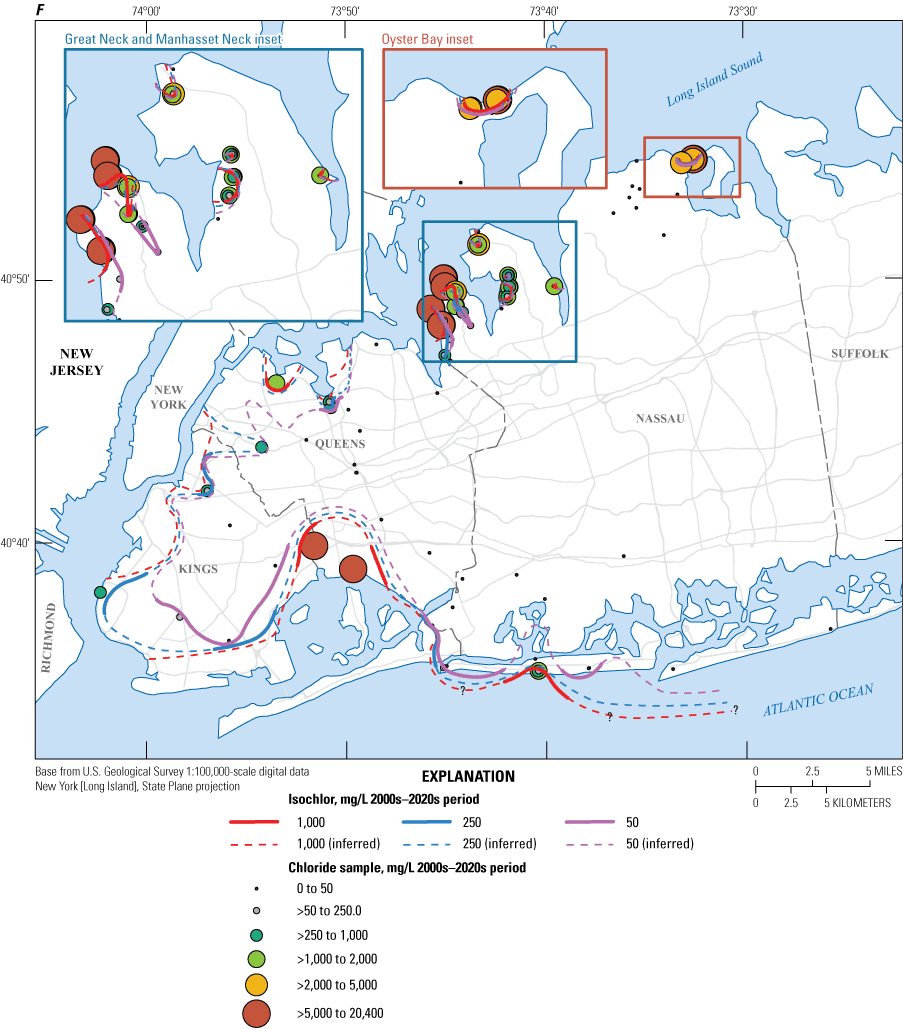
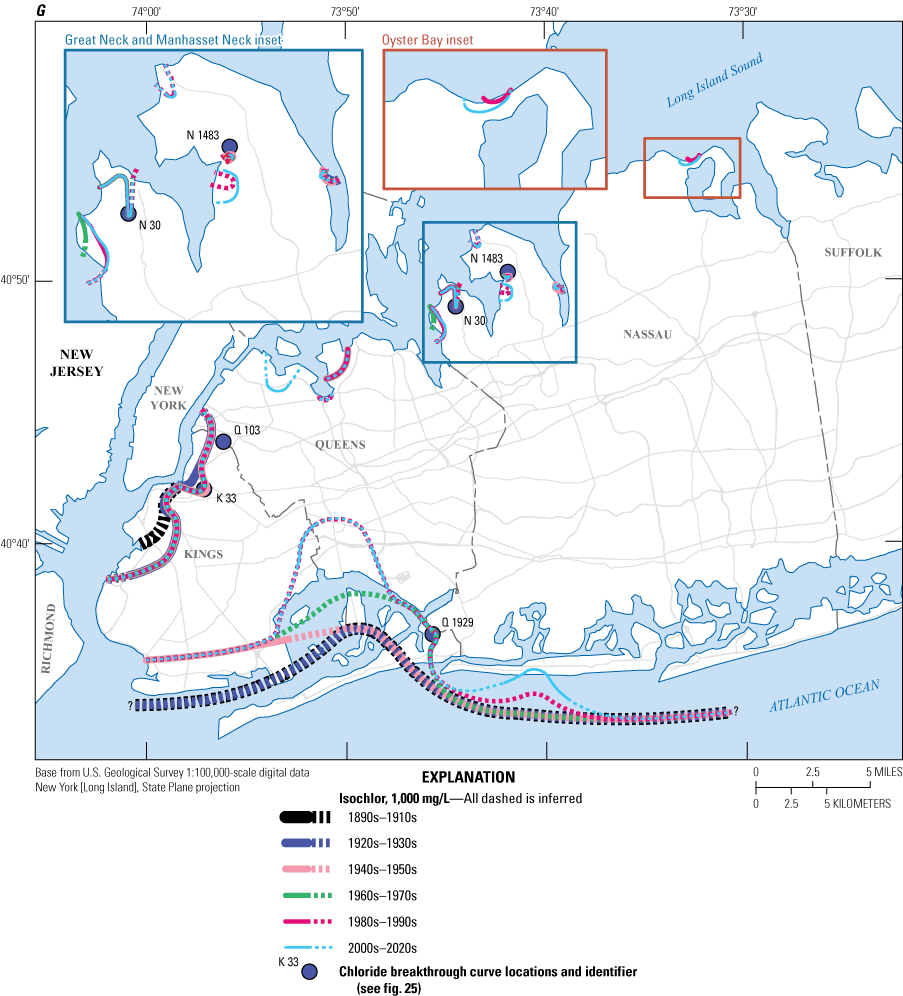
Maps of the historical 1,000 milligram per liter isochlor for the Lloyd and North Shore aquifer complex for the periods of A, 1890s–1910s; B, 1920s–1930s; C, 1940s–1950s; D, 1960s–1970s; E, 1980s–1990s; F, 1,000, 250, and 50 milligram per liter chloride for 2000s–2020s; and G, all periods combined with well notations for chloride breakthrough curves (fig. 25) in western Long Island, New York.
Lusczynski and Swarzenski (1966) described isolated increases in chloride concentrations in the Lloyd aquifer in the Rockaway area and interpreted these as possible downward leakages through the overlying Raritan confining unit. However, this current study incorporates previously unpublished chloride data (Finkelstein and others, 2024) collected by the USGS from 1890 to 1970 that allows for a refined interpretation of the predevelopment interface position prior to pumping. Examination of the chloride concentrations and depth of well screens with respect to Lloyd aquifer thickness indicates a classic lateral intrusion of a saltwater wedge at the base of a confined aquifer (fig. 9G). The Lloyd aquifer in the Rockaway area is about 250 ft thick. Legacy records indicate a chloride concentration of 240 mg/L was recorded in 1936 at well Q 123, a public-supply well in the Lloyd aquifer screened in the upper quarter of the aquifer at 835 ft below land surface in central Rockaway (fig. 9G). In contrast, Lloyd supply wells Q 290, Q 288, Q 287, and Q 1030 had chloride concentrations that ranged from 3 to 202 mg/L in the 1930s. These four nearby supply wells were screened more shallowly in the Lloyd aquifer than Q 123, and thus these chloride concentrations may represent a freshwater zone in the upper quarter of the Lloyd aquifer (fig. 9G). Bedrock is about 950 ft below land surface at Q 123 and indicating that water suppliers may have been avoiding the deeper and more transmissive parts of the Lloyd aquifer due to a potential wedge of saltwater residing at depth (fig. 9G). The legacy chloride data and shallow screen zones for the Lloyd production wells indicated that saltwater was present in the deepest parts of the confined aquifer at the southern coastline in Queens County as early as the 1930s (fig. 9G).
At well Q 1929, chloride concentrations were below 20 mg/L through the early 1960s, then began to rise rapidly at the end of the decade, and by 1973, the chloride concentrations reached 9,500 mg/L. Well Q 1929 is screened in the bottom quarter of the Lloyd aquifer in the easternmost part of Rockaway near the border with Nassau County. This suggests that a wedge of saltwater that existed within the lower part of the Lloyd aquifer west of this well began to expand and reach this area by the late 1960s.
Most historical supply wells in the vicinity of well Q 287 that were installed during the 1930s and early 1940s were screened in the shallower part of the Lloyd aquifer where chloride concentrations were generally below 200 mg/L. Wells screened in the bottom quarter of the aquifer had chloride concentrations greater than 200 mg/L. All of these supply wells had rapidly increasing chloride concentrations soon after installation and were shut down. Data suggest that the saltwater interface was probably at the coastline along the southern shore in Kings and Queens Counties prior to any public-supply pumping (predevelopment)(figs. 9G, 29) as determined from historical chloride data, recent water-quality sampling, and EM log analyses of wells Q 3655 and Q 4112.
By 1940–59, chloride concentrations in the Lloyd aquifer had increased to as high as 1,800 mg/L in northern Queens County. Saltwater was reported in well Q 1374 in the North Shore aquifer in northern Queens County during the 1950s (Perlmutter and Arnow, 1953; Lusczynski and others, 1956). During the period from 1940–59, chloride concentrations stabilized in western Kings County, probably because of the cessation of public-supply pumpage and reduction of industrial pumpage in that area (fig. 28C), but chloride in southern Kings County chloride concentrations increased to about 15,000 mg/L (fig. 28C).
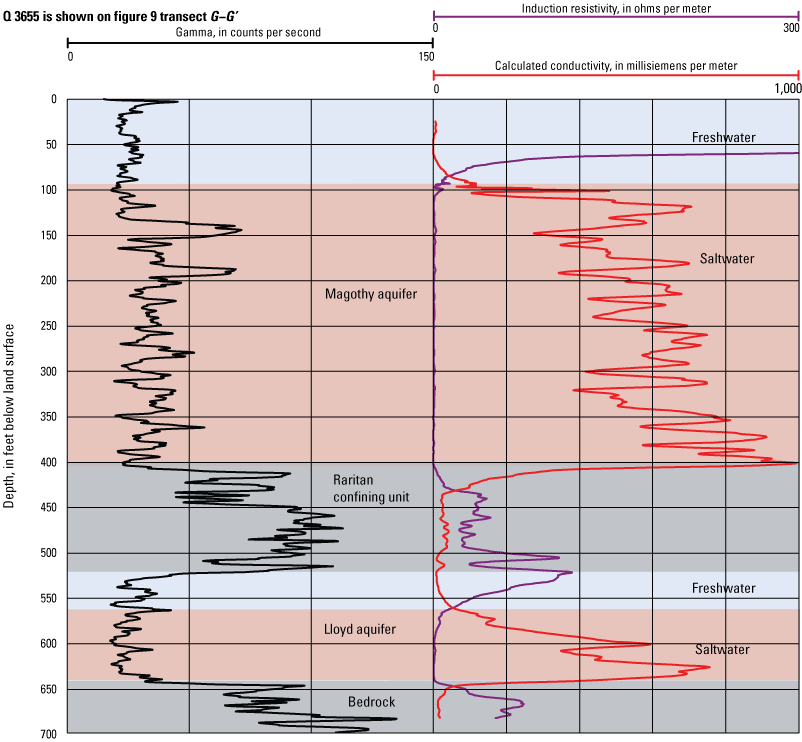
Graphs of a suite of geophysical logs collected in 1988 from well Q 3655 in Queens County, New York, showing two wedges of saltwater intrusion.
Nassau County
The earliest indication of elevated chloride concentrations in the NSL within Nassau County was at supply well N 662, in eastern Manhasset Neck in 1939, with values as high as 165 mg/L (figs. 25, 28B). Chloride breakthrough curves for N 662 indicate a rapid saltwater intrusion during the 1940s and 1950s, with chloride concentrations reaching a peak of 440 mg/L in 1955 (Stumm and others, 2002). It appears that supply well N 656, adjacent to well N 662, is screened in the deeper part of the NSL and had chloride concentrations below 70 mg/L. This suggests a shallow wedge of saltwater intrusion within the NSL in this part of Manhasset Neck.
Supply well N 35 in western Manhasset Neck was affected by a wedge of saltwater by the late 1940s, with a peak chloride concentration in 1946 of 1,150 mg/L; the well was shut down soon thereafter (Stumm and others, 2002). Additional public-supply wells were installed in shallower parts of the NSL in western Manhasset Neck because continued development increased local water demands.
Chloride concentrations have been increasing slowly at well N 36 in northwestern Manhasset Neck since the late 1960s. Monitoring well N 12318, just northwest of well N 36, has chloride concentrations that have been slowly increasing since the 1990s. EM logging of N 12318 indicates much higher estimated chloride concentrations within the NSL about 40 ft above the screened zone. The estimated chloride concentrations from the EM logs are consistently above 1,000 mg/L.
Stumm and others (2002) delineated three wedges of saltwater intrusion in the NSL aquifer in Manhasset Neck in 1996—one in the northwestern part and two in the western part of Manhasset Neck. As a part of this study, these three were further delineated, plus a fourth was identified and delineated in the NSL in Manhasset Neck.
Analyses of chloride breakthrough curves for wells N 30, N 31, and N 1926 in Great Neck indicate rapid saltwater intrusion into the NSL within 20 years after the start of public-supply pumpage during the latter half of the 1960s (Stumm, 2001). Based on analyses of more than 50 years of public-supply pumping and chloride data, Stumm (2001) reported an apparent trend showing that once chloride concentrations reached a threshold of 50 mg/L, concentrations in the well remained above that threshold, regardless of whether pumping ceased. Chloride concentrations have been increasing at supply well N 3443 in central Great Neck since the 1960s, and chloride concentrations rose rapidly during the late 1980s to early 1990s at supply well N 687 in southwestern Great Neck (Stumm, 2001). Chloride concentrations in both wells have continued to increase. Chloride concentrations in well N 3443 reached a peak of 73 mg/L in 2019, and 130 mg/L in well N 687 in 2011.
Stumm (2001) delineated three wedges of saltwater in the NSL aquifer underling Great Neck in 1996 that were consolidated into two wedges as a part of this study.
In Bayville, at supply well N 10144, chloride concentrations increased rapidly within 10 years after the well installation in 1984, and reached about 250 mg/L in 1994 (Stumm and others, 2004). The well was subsequently shut down from production. North of well N 10144 at observation well N 12790 (located along the coast), estimated chloride concentration from EM logs reached a peak of about 5,000 mg/L in 2018. This saltwater wedge is thin and extends westward to well N 12870, where estimated chloride concentration from EM logs reached a peak of about 2,000 mg/L in 2018. This is the only saltwater wedge delineated within the NSL in the Bayville area.
Similar to the EM logs from the UJM, EM logs for the NSL also indicated a consistent slope in the saltwater-freshwater interface underlying Long Island based on estimated chloride concentrations. Using EM logs, the estimated thickness of freshwater within the NSL aquifer complex was determined at each well that penetrated the NSL in Nassau County. The data were interpolated using the Natural Neighbors tool within ArcMap (Esri, 2020). This analysis indicates a very sharp interface between freshwater and saltwater within the NSL aquifer complex. Figure 30 shows the thickness of the aquifer complex that is intruded with saltwater, represented as a percentage.
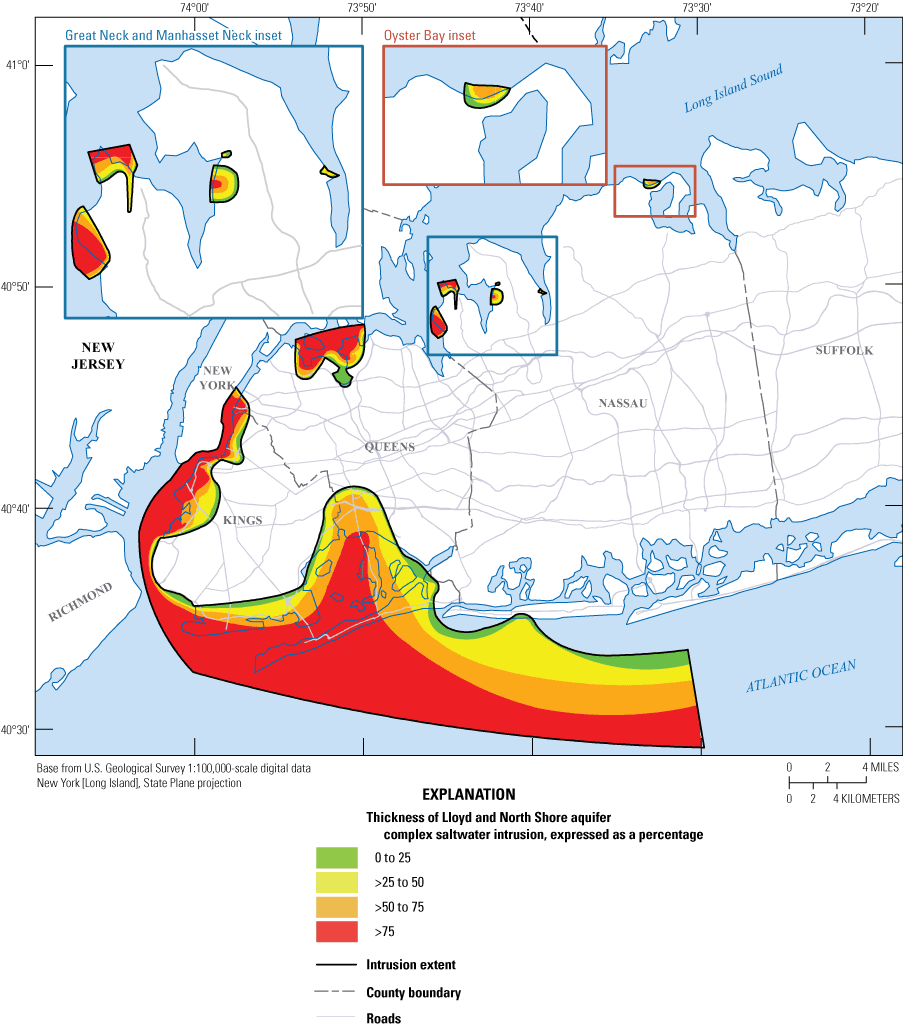
Thickness of Lloyd and North Shore aquifer complex that is intruded with saltwater expressed as a percentage, as estimated by electromagnetic induction (EM) logs for conditions from 2000–22, western Long Island, New York.
Current Saltwater Intrusion Monitoring and Conditions
A network of PVC-cased monitoring wells was installed in Nassau County between 1990 and 2020, and logged at various intervals using an EM probe. In northern Nassau County, chloride data in both the UJM and NSL aquifers underlying Great Neck and Manhasset Neck from 2007 to 2020 indicated continuing saltwater intrusion in most of the monitoring wells despite the reductions in pumping in that area during the late 1990s. Data from most of the UJM monitoring wells in southern Nassau County from 2007 to 2020 indicated that additional saltwater intrusion was occurring.
Current Saltwater Intrusion in the Upper Glacial, Jameco, and Magothy (UJM) Aquifers
Chloride concentration data from 2000–22 were used to map the current position of the saltwater interface in the UJM as part of this study (fig. 26E). Analyses of EM derived chloride data (equation 1) and water quality samples (U.S. Geological Survey, 2022c) from 2000–22 indicate that the 250 and 1,000 mg/L isochlors generally are close together in southwestern Nassau County, and a sharp interface exists at the brackish water to saltwater (fig. 26E) transition. The saltwater interface appears to be farther inland than previously mapped by Terraciano (1997). The 1,000 mg/L isochlor appears to indicate much more saltwater intrusion in southern Queens County than shown by previous mapping (fig. 26E; Buxton and Shernoff, 1999). Areas with salty groundwater exceeding 1,000 mg/L chloride were also mapped in northwestern, southern, and northern Queens County, indicating that significant saltwater intrusion has occurred in those areas (fig. 26E). Most of the UJM aquifer in Kings County has been intruded by saltwater (fig. 26E).
In northern Nassau County, a small area in southeastern Great Neck with about 500 mg/L chloride was observed in the UJM, whereas the rest of the aquifer on the Great Neck peninsula appears to be freshwater. An area on the eastern coast of Manhasset Neck has high chloride concentrations that are above 5,000 mg/L (fig. 26E), and localized saltwater intrusion also has been observed in northwestern Manhasset Neck. In the Bayville area, most of the shallow aquifers are intruded with chloride concentrations of more than 5,000 mg/L. EM logs also indicate that saltwater intrusion is occurring on the west side of the Manhasset Neck. EM logs from between 2007 and 2020 also indicate saltwater intrusion was occurring in most wells in southern Nassau County. Chloride concentrations exceed 5,000 mg/L throughout Long Beach and Inwood, along the southern coast of Nassau County (fig. 26E). The saltwater interface appears to be farther inland than had been previously mapped in this area, indicating that saltwater intrusion is occurring, probably due to current public-supply pumping.
The water table ranges in elevation from 82.8 ft above NAVD 88 at well N 9089 in north-central Nassau County to less than 5 ft above NAVD 88 along the coastline (fig. 24; Como and others, 2015). A localized mound of water has been mapped consistently in central Manhasset Neck, with elevations as high as 121.7 ft at well N 12451 (Stumm and others, 2002; Como and others, 2015). In Kings and Queens Counties, the elevations of the water table are similar to those of the potentiometric surfaces of the underlying Jameco and Magothy aquifers (Como and others, 2015). Higher elevations of the water table tend to coincide with high land-surface elevations such as those present along the glacial moraines (figs. 1, 23, 24; Como and others, 2015).
The Magothy aquifer water levels range from 80 ft above NAVD 88 at well N 11454 in north-central Nassau County to 4.9 ft below NAVD 88 at well N 11634 in southwestern Nassau County (Como and others, 2015). A mound of high water levels in the Magothy aquifer in north-central Nassau County coincides with the mound of high water levels in the underlying Lloyd aquifer (Como and others, 2015). Under public-supply pumping conditions, water levels in the Magothy aquifer can be as much as 15 ft below NAVD 88, with small cones of depression (Stumm, 1993).
Most of the monitoring wells in southern parts of Kings and Queens Counties are affected by saltwater intrusion and are not freshwater heads, and some wells in southwestern Nassau County are also similarly affected (Como and others, 2015). The highest water levels were measured in 2013 in the north-central part of Queens County at well Q 812 (Como and others, 2015). Due to the uncertainty of the screen depths at many of the south shore wells in Kings and Queens Counties, both the Jameco and Magothy aquifers are typically combined into a single potentiometric-surface map (Como and others, 2015).
Current Saltwater Intrusion in the Lloyd and North Shore Aquifers
Chloride concentrations from observation wells and estimated peak chloride concentrations derived from EM logs (equation 1) were used to delineate isochlors (fig. 28F). It should be noted that a portion of the thickness of the NSL aquifer may be fresh, even seaward of the isochlors. The chloride concentration in the Lloyd aquifer is normally 5 mg/L or less (Stumm, 2001; Stumm and others, 2002, 2004, 2020). Chloride breakthrough curves suggest that when public-supply wells screened in the Lloyd aquifer reach a chloride concentration of about 50 mg/L, saltwater intrusion may be essentially irreversible (Stumm, 2001). Chloride data from 2000–22 suggest that a 50 mg/L isochlor exists in the Lloyd aquifer in many parts of Long Beach, and possibly to the north of Long Beach in southern Nassau County (fig. 28F).
Hydraulic heads within the Lloyd aquifer measured in 2013 indicate a range of values from 49.5 ft above NAVD 88 at well N 11453 to 3.7 ft below NAVD 88 at well N 11730 (Como and others, 2015). A mound of high hydraulic head in the central part of northeast Nassau County had estimated elevations of 60 ft above NAVD 88 (Como and others, 2015). However, several cones of depression in the Lloyd aquifer caused by public-supply pumpage in northwestern Nassau County were below NAVD 88. Hydraulic heads were also depressed at wells N 13879 and N 13700 on the barrier island of Long Beach due to nearby public-supply pumpage from the Lloyd aquifer (Como and others, 2015). In Kings and Queens Counties, the highest elevation of the potentiometric surface occurred in the central part of Queens County at well Q 3627, which had a hydraulic head of 17.4 ft above NAVD 88, and the lowest elevations of the potentiometric surface were between 5 and 7 ft above NAVD 88 along the north and south coastal areas (Como and others, 2015). Under public-supply pumping conditions, the Lloyd aquifer can have water levels as low as 40 ft below NGVD 29, which is approximately 39 ft below NAVD 88 (Stumm, 1993; Stumm and others, 2002, 2004). Water levels in the Lloyd aquifer near the coast respond to tidal fluctuations (Stumm, 2001).
Due to the hydraulic interconnection of the North Shore aquifer and the Lloyd aquifer, the two aquifers have been combined into a single potentiometric-surface map (Stumm, 2001; Stumm and others, 2002, 2004; Como and others, 2015). In 2013, the North Shore aquifer potentiometric surface was highest in central Manhasset Neck at well N 12321 (22.5 ft above NAVD 88) and was lowest within a cone of depression in northernmost Manhasset Neck at well N 6282 (14.3 ft below NAVD 88) due to nearby public-supply pumpage (Como and others, 2015). In Great Neck, the North Shore aquifer is present in the northernmost part of the peninsula with water levels generally above NAVD 88 (Como and others, 2015). During the summer of 1992, public-supply pumpage resulted in water levels of the Great Neck peninsula to be dominated by multiple, large, interconnecting cones of depression that caused water levels to decline to several feet below NGVD 29 and NAVD 88 (Stumm, 2001). In 2013, the North Shore aquifer was measured at 8.8 ft above NAVD 88 at well K 3410 in Kings County, and was measured at 10.38 ft above NAVD 88 at well Q 577 in Queens County (Como and others, 2015).
Kings and Queens Counties
These data indicate that a large wedge of saltwater in the NSL (Lloyd aquifer) is present in southern Queens County, with the 50, 250, and 1,000 mg/L isochlors reaching into southern Queens County (figs. 9G, 28F). This wedge of saltwater extends westward into southern Kings County. In Kings County, the 50 mg/L isochlor in the NSL extends into the central parts of the county and the 1,000 mg/L isochlor may extend across most of the southern parts of Kings County (fig. 28F).
Recent geophysical log analysis of well Q 3655 that was drilled to the base of the Lloyd aquifer in southern Queens County in 1989 indicates that 70 percent of the Lloyd aquifer was intruded by saltwater (Stumm and others, 2020), and a sample from that well that was screened at the base of the Lloyd aquifer had a chloride concentration of 10,100 mg/L (figs. 8, 9G, 28E, F, 30). This concentration correlates with high chloride concentrations (8,500 mg/L in 1996) in samples from well K 3426 in southeastern Kings County, which is northwest of well Q 3655, confirming the extent of the wedge of saltwater in the NSL along the shore of Jamaica Bay (fig. 29). Well Q 4112 was installed in 2019 as a part of this study, and is located about 1,000 ft southwest of well Q 3655. Water-quality sampling of Q 3655 indicated a chloride concentration of 10,700 mg/L at the base of the Lloyd aquifer in 1989 (fig. 9G). The chloride concentration estimated from the EM log (equation 1) collected at Q 4112 was about 13,000 mg/L. The EM log and chloride concentration obtained from sampling well Q 4112 confirms the existence of a saltwater wedge in the lower three-quarters of the Lloyd aquifer in this area. Many of the wells that are screened hundreds of feet higher within the Lloyd aquifer in this part of Queens County have lower chloride concentrations.
Nassau County
The northern and northwestern parts of Great Neck have been intruded by saltwater in the NSL aquifers because of public-supply pumping stresses (Stumm, 2001; fig. 28D–F). Chloride concentrations at supply well N 3443.3 in Great Neck have increased from below 10 mg/L chloride in the 1950s to 73 mg/L in 2019. A previously undetected wedge of saltwater may be advancing from the northeast toward supply well N 3443.3 (fig. 28C−F). Analyses of EM logs indicate that for most wells in the NSL aquifer on the Great Neck peninsula, intrusion has continued since 2007.
The northwesternmost, western, and eastern parts of Manhasset Neck have been intruded by saltwater with chloride concentrations above 1,000 mg/L (fig. 28B−G). Recent EM logging confirms newly detected wedges of saltwater in the Lloyd aquifer at well N 12506. All wells in the NSL aquifer in Manhasset Neck that were monitored from 1990 to 2007 showed continued saltwater intrusion. EM logging at well N 12506, in 2020, suggests that more fingers of saltwater have begun to advance into the NSL aquifer along the eastern part of Manhasset Neck.
A wedge of saltwater with chloride concentrations greater than 1,000 mg/L was observed in the NSL aquifer in the Bayville area near supply well N 10144 (fig. 28E, F). Chloride concentrations at well N 10144 increased from less than 10 mg/L in 194 to a peak of 250 mg/L in 1994 (Stumm and others, 2004). Analyses of EM logs in the Bayville indicated saltwater intrusion was occurring in the NSL aquifer at least as long as 30 years ago and continues to present (2020).
EM logs from most wells along the south shore of Nassau County showed no indications of saltwater intrusion in the Lloyd aquifer except in well N 13879 in central Long Beach. Chloride concentrations suggest a 250 mg/L isochlor exists near the south-central part of Long Beach at well N 13879 (figs. 9A, 28F). A possible toe of saltwater in the Lloyd aquifer may be near this part of Long Beach. However, the Lloyd aquifer isochlor map for 2000–22 shows that the 50 mg/L isochlor has reached many parts of Long Beach and possibly farther north into the southern part of Nassau County, which is an indication of possible future saltwater intrusion.
Summary and Conclusions
In 2016, the U.S. Geological Survey (USGS) began a multiyear cooperative study with the New York State Department of Environmental Conservation to evaluate the sustainability of the sole-source aquifer system of Long Island through hydrogeologic mapping, compilation of groundwater chloride concentrations, and construction of a groundwater-flow model. The groundwater system in Kings, Queens, and Nassau Counties on western Long Island, New York, has been under stress from pumping of public-supply and industrial wells. As a result of this pumping, chloride concentrations have increased due to saltwater intrusion at many public- and industrial-supply wells.
For this study, eighteen boreholes were drilled and logged using a variety of geophysical methods. Data were also obtained from eight boreholes leveraged from other cooperators. Data from previous USGS studies, including deep observation wells with geophysical and lithologic logs, were also incorporated into this study as well as data from 50 boreholes that were cored and gamma-logged as part of a groundwater contaminant-plume investigation in southeastern Nassau County. Legacy lithologic descriptions, previously unutilized core descriptions of wells, borehole geophysical logs, offshore seismic-reflection surveys, time-domain electromagnetic soundings, horizontal-to-vertical seismic surveys, leveraged borehole data from other cooperators, and newly drilled and cored boreholes were used to map the hydrogeologic framework and delineate the position of saltwater interfaces in Kings, Queens, and Nassau Counties.
The hydrogeologic surfaces for Kings, Queens, and Nassau Counties were interpolated using the data sources described above. A geographic information system was used to organize and display these data. Approximately 650 lithologic or geophysical logs or both were examined. More than 1,700 unique elevation points were established when summing the elevation points for all surfaces. Contour lines and extents were drawn based on the assigned elevation point data for each surface. Contour lines were drawn and digitized at 50-foot (ft) intervals, representing the surface of each hydrogeologic unit. The points, contour lines, and extents were used as inputs to create the interpolated surface using the Topo to Raster tool in ArcMap. All surfaces were interpolated as a part of this study with a 100×100-ft grid discretization, aligned to the same grid, and ensured for a minimum thickness of 1 ft for each unit.
Western Long Island is composed of crystalline bedrock overlain by a wedge of unconsolidated coastal-plain sediments. Bedrock outcrops are present in a few isolated areas in northwestern Queens County. In most of the study area, bedrock is covered by unconsolidated sediments (overburden), with a thickness ranging from a few feet in northwestern Queens County to more than 2,000 ft in southeastern Nassau County.
The Lloyd Sand Member of the Raritan Formation of Cretaceous age is an upward-fining sequence of sand and gravel with white clay lenses, and these sediments form the Lloyd aquifer on Long Island. The Lloyd aquifer overlies bedrock and generally is overlain by the Raritan confining unit. The Lloyd aquifer dips to the southeast and is present throughout western Long Island. In some places along the northern parts of the study area, the aquifer has been eroded or removed by glacial erosion.
The unnamed clay member of the Raritan Formation forms the Raritan confining unit that underlies most of Long Island and dips to the southeast. The top of the Raritan confining unit is defined in the present investigation as being where there is a minimum thickness of 20 ft of dense (solid) clay. The Raritan confining unit ranges in thickness from less than 1 ft where it pinches out in the northwestern part of the study area to more than 310 ft in the southeasternmost part of Nassau County. The Raritan confining unit was severely eroded or completely removed by what is interpreted as glacial scouring in many parts of the study area. Eleven separate northwest-southeast trending buried valleys were mapped within the study area: 4 in offshore embayments, 4 onshore in northern Nassau County, 1 in northern Queens County, and 2 in Kings County.
The name “upper Raritan aquifer” is introduced here to represent an aquifer unit in Cretaceous sediments that are part of the Raritan Formation. The upper Raritan aquifer lies above the clay and silt of the Raritan confining unit and below the basal gravel bed of the Magothy aquifer in parts of western Long Island. Analysis of driller’s logs and new core samples indicated a substantial deviation of the top surface of the Raritan confining unit when compared with that same surface as shown in previously published maps. Dense clay beds were absent in the upper part of the Raritan confining unit, indicating a possible facies or depositional change from fine- to coarse-grained lithologies in the upper part of the Raritan Formation within the study area. The newly mapped upper part of the Raritan Formation in the study area is generally characterized by fine to coarse sand with silt and minor clay lenses below the basal gravel bed of the Magothy Formation. The upper Raritan aquifer ranges in thickness from less than 1 foot where it pinches out at its extent to more than 200 ft at well N 12894 in southeastern Nassau County.
The Magothy aquifer is composed of Cretaceous age sediments, and consists of fine, micaceous, interbedded clay, silt, and sand. The unit contains an upward-fining sequence of gray, white, or pinkish sand, silt, and clay of the undifferentiated Matawan Group or the Magothy Formation. The Magothy aquifer is absent in most of Kings County, the northern half of Queens County, and the northernmost parts of Nassau County where it is interpretated as having been eroded by glacial erosion. Core samples indicate that the unit consists of gray, subrounded, silty quartz sand and opaque heavy minerals. Glacial erosion has produced a steep, wavy, north-facing scarp along the northern extent of the aquifer in south-central Queens County and north-central Nassau County.
The North Shore aquifer is a Pleistocene age unit that consists of fine to coarse sand and the aquifer is confined by Pleistocene clay and silt above and bedrock below. Laterally, the North Shore aquifer is hydraulically contiguous with the Lloyd aquifer. The North Shore aquifer generally is present beneath the North Shore peninsulas and estuaries where Cretaceous sediments are absent due to glacial erosion. The North Shore aquifer is also present in the northernmost part of Nassau County, the northwesternmost part of Queens County, and northern and parts of central Kings County, and extends southward to near Jamaica Bay. This aquifer consists of coarse, sandy sediments that filled low-lying areas after removal of the Cretaceous sediments and parts of the bedrock saprolitic zone by glacial erosion, fluvial erosion, or both. The North Shore aquifer is capped by Pleistocene clay and silt that is referred to as the North Shore confining unit.
Subsequent erosion after the removal of Cretaceous sediments and parts of the bedrock saprolitic zone, possibly from glacial readvances, created northwest-southeast trending valleys that reached the bedrock surface and removed older sediments, possibly including those of the North Shore aquifer. These valleys were subsequently filled with clay and silt that can be hundreds of feet thick.
The North Shore confining unit is a sequence of Pleistocene clay and silt that occurs locally along the northern shore of Nassau County, often in association with the North Shore aquifer, and also in Kings and Queens Counties. These sediments correlate to stratified glacial-lake clay and silt that underlies Long Island Sound and the northern embayments in the study area.
Offshore seismic-reflection surveys, borehole-geophysical logs, and drill-core samples were used to correlate sediments with buried valleys that extend across the northern peninsulas of Nassau County and the surrounding embayments of Long Island Sound, Little Neck Bay, and Manhasset Bay. The North Shore confining unit consists of sediments from at least two separate depositional sequences—a brackish marine clay and silt sequence, and a proglacial freshwater-lake clay and silt sequence. Core samples from well N 12013 and well N 12465 contain olive-gray clay with oyster shells, suggesting deposition in a shallow, brackish water, or marine environment. A buried valley in north-central Manhasset Neck contains both the North Shore aquifer and confining unit. However, in the southernmost part of this buried valley, there are potential openings, or gaps, where the upper glacial aquifer or Magothy aquifer may be in hydraulic connection with the North Shore aquifer because of a gap between the Raritan confining unit and the North Shore confining unit. There also appears to be a complex structural feature, possibly a fold in the North Shore confining unit, at the southernmost end of this buried valley. This narrow fold is thought to extend through the North Shore aquifer and is in contact with the bedrock surface, creating a localized lateral hydraulic separation of the North Shore aquifer.
Two previously unmapped buried valleys were delineated in Kings County. It is possible that one or both of the buried valleys were eroded by ancestral Hudson or East Rivers, then deepened and widened by glacial erosion like the buried valleys mapped in northern Queens and Nassau Counties. Veatch and others (1906) described at least one possible ancestral Hudson River channel eroding a buried valley in Kings County and extending to the south, offshore of the island. Subsequent mapping by other researchers does not show any indications of buried valleys within Kings County; however, this may be due to a lack of new wells drilled with cores in that area.
The North Shore confining unit underlies most of the northern parts of the study area. The upper surface of the unit is relatively flat in most parts of the study area except where clay sediments included in the North Shore confining unit were possibly thrust-faulted and pushed to higher elevations during successive glacial advances during the late Pleistocene. The surface of the North Shore confining unit ranges from more than 50 ft above sea level in southern Great Neck to more than 220 ft below NAVD 88 at well N 12855. Marine seismic-reflection surveys indicate that this unit extends offshore and underlies surrounding embayments in the northern part of the study area. The North Shore confining unit has a maximum thickness of about 500 ft in northeastern Nassau County.
The Jameco aquifer is present mainly in Kings and Queens Counties, and extends only into the southwesternmost part of Nassau County. These sediments consist of reddish-brown to brown gravel with coarse sand and boulders of mixed mineralogy and lithology, including diabase, gneiss, schist, sandstone, shale, and granite, making this unit distinctive when compared to the typical quartz-rich gravel of the upper glacial and Magothy aquifers. Pebbles in the Jameco aquifer are well-rounded, suggesting possible fluvial transport. The Jameco aquifer ranges in thickness from less than 1 ft near its northwestern extent to about 200 ft in west-central Queens County. The Jameco aquifer sediments appear to show a draped deposition from northwest to southeast over the westernmost parts of the study area.
The mean hydraulic conductivity of the Jameco aquifer estimated from 49 pumping tests was more than 300 feet per day (ft/d). Most of the public-supply wells that pumped from the Jameco aquifer in southern Kings County experienced rapid saltwater intrusion due to the high transmissivity of the aquifer.
The Gardiners confining unit, also referred to as the Gardiners clay, is a Pleistocene greenish-brown or gray marine clay with sand interbeds in some areas that contains diatoms, foraminifers, and shell fragments that were deposited along the southern coast of Long Island during an interglacial period. The Gardiners confining unit is present along the southernmost parts of Kings, Queens, and Nassau Counties. The clay has a gentle slope to the south and appears to pinch out and thin toward its northern extent, indicating a transgressive depositional environment during an interglacial period. The unit decreases in thickness from north to south, and ranges in thickness from 190 ft in the southwestern most part of Kings County to less than 1 ft near its northern extents. The Gardiners confining unit ranges in elevation from about 2 ft above NAVD 88 in the area north of Long Beach to about 190 ft below NAVD 88 in the Rockaway Island area.
The Gardiners confining unit generally overlies the Jameco aquifer in the southernmost parts of the study area and is a confining unit for the Jameco and Magothy aquifers below it. Previous studies delineated and separated a shallow Pleistocene clay called the 20-foot clay above the Gardiners confining unit. However, examination of core samples, geologic logs, and gamma logs in this study suggest that there are no clear separations between these clay units, and that the 20-foot clay was indistinguishable from the Gardiners confining unit with only thin, sandy beds separating the clay beds in some areas, and therefore is considered to be part of the Gardiners confining unit in this study.
The upper glacial aquifer consists of ice-contact, morainal, and outwash sediments of Pleistocene age that contain stratified, fine- to coarse-grained sand and gravel, unstratified boulders, clay, and silty till. This unit consists mostly of brown (7.5Y 4/6) sand and dark yellowish-brown sand with quartz, opaque minerals, rock fragments, and biotite and muscovite that generally is moderately to poorly sorted. The upper glacial aquifer is unconfined, and the water table is within the unit in most areas.
In a few isolated areas, sediments that might be correlated with the North Shore confining unit may overlie sediments of the upper glacial aquifer, potentially confining or semiconfining those parts of the glacial aquifer. These sediments were mapped as a semiconfined subdivision of the upper glacial aquifer. The elevation of this subunit ranges from about 5 ft below NAVD 88 in northern Great Neck to about 220 ft below NAVD 88 in southwesternmost Kings County.
The upper glacial aquifer historically was a major source of water supply in western Long Island. The upper glacial aquifer south of the glacial moraines (Harbor Hill and Ronkonkoma) predominantly is composed of well-sorted outwash, and is more hydraulically conductive than sediments north of the moraine where the aquifer is composed of variably silty ice-contact sediments. The mean hydraulic conductivity of the upper glacial aquifer estimated from 121 pumping tests in the glacial outwash was 200 ft/d, while the mean hydraulic conductivity estimated from 22 pumping tests north of moraine was 120 ft/d. The geometric mean hydraulic conductivity of the upper glacial aquifer estimated from the nuclear magnetic resonance (NMR) log of monitoring well N 12321 located in Manhasset Neck north of the moraine was 34 ft/d, reflecting the high silt content of the ice-contact sediments at the site. The relatively low hydraulic conductivity for the upper glacial aquifer, and the likely presence of local clay lenses, may be responsible in part for the elevated mound (120 ft above NAVD 88) in the water table in this area of Manhasset Neck. NMR logging of this well confirms saturated conditions throughout the hydrogeologic sediments with low permeability below this well, ruling out perched water conditions.
Land surface defines the top of the upper glacial aquifer, which is variably saturated depending on the water table at any given time. Glacial sediments can be unsaturated in north-central Nassau County because the water table occurs in the uppermost part of the underlying Magothy aquifer at the highest elevation of the Cretaceous sediments.
The upper glacial, Jameco, and Magothy aquifers in Kings, Queens, and southern Nassau Counties were combined into one hydrogeologic aquifer complex: the upper glacial-Jameco-Magothy aquifer complex (UJM). These aquifers are in hydraulic connection and are above the major confining units of the Raritan confining unit or the North Shore confining unit, or both units. The Lloyd and North Shore aquifers also were combined into a single hydrogeologic aquifer complex, referred to as the NSL, which is confined by the Raritan confining unit and North Shore confining units, and is in hydraulic connection throughout the study area. The NSL aquifer complex only exists along the northern parts of the study area because only the Lloyd aquifer is present in the southern parts of the study area.
Pumpage for public-supply water in the study area began in the 1870s with small, localized suppliers sending water to limited populated areas, and by 1904–16, most of the public-supply water in Kings and Queens Counties was pumped from the upper glacial aquifer at average rates of 21 and 37 million gallons per day, respectively. In addition, industrial-well pumpage began along the western part of Kings County during the late 19th century when commercial companies began to set up industrial park-like operations in that area. As the population in the study area increased during the early 20th century, public-supply pumpage began to overtake industrial groundwater pumpage. Total public-supply and industrial pumpage from all aquifers in Kings County during that period averaged 60 million gallons per day.
By 1936, pumping in central Kings County created a major cone of depression in the water table. This cone of depression extended to the south shore of much of Kings County into southwestern Queens County. Maximum drawdowns in the area exceeded 35 ft below sea level, resulting in rapidly increasing chloride concentrations and shutdowns of supply wells due to saltwater intrusion. The cessation of pumping at the Flatbush pumping center in Kings County coincided with increased public-supply pumping from the Woodhaven pumping center in southwestern Queens County. By 1961, a major cone of depression had developed in the Woodhaven area, and in 1974, saltwater intrusion resulted in the shutdown of the Woodhaven public-supply wells. Public-supply well-pumping was then shifted eastward from the Woodhaven pumping center to the Jamaica pumping center in central and southeastern Queens County. By the 1970s to 1980s, several Jamaica pumping center public-supply wells were intruded by saltwater and were shut down along the southernmost part of Queens County.
A 30-year electromagnetic induction (EM) log dataset (1990 to 2020) indicates that saltwater intrusion has continued in both the north and south shore areas in Nassau County. In southern Nassau County, several wells had positive increases in EM conductivity values in the UJM, indicating intrusion is occurring. The south shore of Nassau County showed no indications of saltwater intrusion in the Lloyd aquifer except for well N 13879 in central Long Beach. A possible toe of saltwater in the Lloyd aquifer may be near this part of Long Beach. Recent drilling in southern Queens County at well Q 4112 confirms that most of the Lloyd aquifer is intruded with saltwater just west of Long Beach.
Using historical and current chloride data, isochlor maps were produced for the UJM and NSL aquifer complexes. Historic chloride data indicate that the UJM contained saltwater on or near the coast under predevelopment conditions. As early as the 1920s, elevated chloride concentrations were detected in western and southern Kings County due to pumpage. After installation of public-supply wells at the Flatbush and Woodhaven pumping centers, a similar pattern emerged of pumpage, followed by rapidly increasing chlorides, and ending in the shutdown of these wells. As public-supply pumpage in the UJM expanded eastward into Nassau County, so did the saltwater interface. The current isochlor map indicates wedges of saltwater throughout southern Kings and Queens Counties; western Kings and Queens Counties also have a wedge of saltwater. On the south shore of Nassau County, saltwater intrusion in the UJM was occurring at wells N 13804 in Inwood, and wells N 13879 and N 13700 in Long Beach. On the north shore of Queens County, another wedge of saltwater is evident in Manhasset Neck and Bayville, where several wedges of saltwater were mapped. Areas of the greatest recent (2007–20) increases in saltwater intrusion in the UJM are in Oyster Bay at well N 12790, and in Great Neck at well N 12153.
All the wells monitored in the NSL from 1990 to 2007 indicated continued saltwater intrusion in Manhasset Neck, including delineation of a new saltwater wedge in the Lloyd aquifer at well N 12506. Based upon elevated chloride concentrations in monitoring and public supply wells, a previously undetected wedge of saltwater may be advancing from the northeast toward supply well N 3443 in Great Neck. The 2000–22 Lloyd aquifer isochlor map indicates that 50 milligrams per liter (mg/L) chloride concentration has reached many parts of Long Beach and possibly farther north in the southern part of Nassau County (fig. 30). The 250 mg/L isochlor has started to encroach on the south-central part of Long Beach. In Great Neck, the northern and northwestern parts of the peninsula have been intruded by saltwater in the NSL due to public-supply pumping stresses. Similarly, the northwesternmost, west-, and east-central areas of Manhasset Neck have been intruded by saltwater with chloride concentrations greater than 1,000 mg/L. In the Bayville area, a wedge of saltwater with chloride concentrations greater than 1,000 mg/L was also detected. Most of Kings and Queens Counties are intruded with saltwater in both the UJM and NSL aquifer systems.
All newly drilled monitoring wells have been cased with polyvinyl chloride casing, allowing EM logs to be collected to monitor changes in the saltwater interface of aquifers penetrated by these wells. The operation of public-supply wells can be informed by this network of wells in conjunction with groundwater modeling to improve management of the groundwater resources of Long Island.
References Cited
Aronson, D.A., Lindner, J.B., and Katz, B.G., 1983, Geohydrology of the Meadowbrook artificial-recharge site at East Meadow, Nassau County, New York: U.S. Geological Survey Water-Resources Investigations Report 82–4084, 44 p. [Also available at https://doi.org/10.3133/wri824084.]
Auken, E., Christiansen, A.V., Jacobsen, L.H., and Sorensen, K.I., 2008, A resolution study of buried valleys using laterally constrained inversion of TEM data: Journal of Applied Geophysics, v. 65, no. 1, p. 10–20. [Also available at https://doi.org/10.1016/j.jappgeo.2008.03.003.]
Baskerville, C.A., 1992, Bedrock and engineering geologic maps of Bronx County and parts of New York and Queens Counties, New York: U.S. Geological Survey Miscellaneous Map I-2003, 2 sheets, scale 1:24,000. [Also available at https://doi.org/10.3133/i2003.]
Bradbury, K.R., and Rothschild, E.R., 1985, A computerized technique for estimating the hydraulic conductivity of aquifers from specific capacity data: Groundwater, v. 23, no. 2, p. 240–246. [Also available at https://doi.org/10.1111/j.1745-6584.1985.tb02798.x.]
Brons, F., and Marting, V.E., 1961, The effect of restricted fluid entry on well productivity: Journal of Petroleum Technology, v. 13, no. 2, p. 172–174. [Also available at https://doi.org/10.2118/1322-G-PA.]
Buxton, H.T., Soren, J., Posner, A., and Shernoff, P.K., 1981, Reconnaissance of the ground-water resources of Kings and Queens Counties, New York: U.S. Geological Survey Open-File Report 81–1186, 64 p. [Also available at https://doi.org/10.3133/ofr811186.]
Cadwell, D.H., 1989, Surficial geologic map of New York–Lower Hudson Sheet: New York State Museum Map and Chart Series 40, 1 sheet, scale 1:250,000. [Also available at https://www.nysm.nysed.gov/sites/default/files/surf_lowerhudson.jpg.]
Cartwright, R.A., 1997, Hydrogeologic-setting classification for Suffolk County, Long Island, New York; with results of selected aquifer-test analyses: U.S. Geological Survey Open-File Report 96–457, 18 p. [Also available at https://doi.org/10.3133/ofr96457.]
Christiansen, A.V., Auken, E., and Sorensen, K., 2006, The transient electromagnetic method, in Kirsch, R., ed., Groundwater geophysics—A tool for hydrogeology: Heidelberg, Springer-Verlag, p. 179–225. [Also available at https://doi.org/10.1007/3-540-29387-6_6.]
Chu, A., and Stumm, F., 1995, Delineation of the saltwater-freshwater interface at selected locations in Kings and Queens Counties, Long Island, New York, through use of borehole geophysical techniques, in Second Conference—Geology of Long Island and Metropolitan New York, State University of New York at Stony Brook, April 22, 1995, Program: Stony Brook, New York, Long Island Geologists, p. 21–30.
Como, M.D., Noll, M.L., Finkelstein, J.S., Monti, J., Jr., and Busciolano, R., 2015, Water-table and potentiometric-surface altitudes in the upper glacial, Magothy, and Lloyd aquifers of Long Island, New York, April–May 2013: U.S. Geological Survey Scientific Investigations Map 3326, 8 p., 4 sheets, scale 1:125,000, 6-p. pamphlet. [Also available at https://doi.org/10.3133/sim3326.]
Como, M.D., Zuck, M.A., and Stumm, F., 2020, Time domain electromagnetic surveys collected to estimate the extent of saltwater intrusion in Nassau and Queens County, New York, October–November 2017: U.S. Geological Survey data release, accessed May 15, 2023, https://doi.org/10.5066/P90B6OTX.
Cooper, H.H., Jr., and Jacob, C.E., 1946, A generalized graphical method for evaluating formation constants and summarizing well field history: Eos Transactions of the American Geophysical Union, v. 27, no. 4, p. 526–534. [Also available at https://doi.org/10.1029/TR027i004p00526.]
DeMott, L.M., Stumm, F., Como, M.D., and Finkelstein, J.S., 2023a, Geospatial data for bedrock elevation and overburden thickness maps of the Five Boroughs, New York City, New York: U.S. Geological Survey data release, accessed May 25, 2023, https://doi.org/10.5066/P911CSI3.
DeMott, L.M., Stumm, F., Como, M.D., and Finkelstein, J.S., 2023b, Horizontal-to-vertical spectral ratio soundings and depth-to-bedrock data for New York City and Long Island, NY: U.S. Geological Survey data release, accessed May 25, 2023, https://doi.org/10.5066/P9S7Q68D.
DeMott, L.M., Stumm, F., and Finkelstein, J.S., 2023c, Bedrock-surface elevation and overburden thickness maps of the five boroughs, New York City, New York: U.S. Geological Survey Data Report 1176, 22 p., accessed May 25, 2023, https://doi.org/10.3133/dr1176.
Dlubac, K., Knight, R., Song, Y.-Q., Bachman, N., Grau, B., Cannia, J., and Williams, J., 2013, Use of NMR logging to obtain estimates of hydraulic conductivity in the High Plains aquifer, Nebraska, USA: Water Resources Research, v. 49, no. 4, p. 1871–1886. [Also available at https://doi.org/10.1002/wrcr.20151.]
Farlekas, G.M., 1979, Geohydrology and digital-simulation model of the Farrington aquifer in the northern Coastal Plain of New Jersey: U.S. Geological Survey Water-Resources Investigations 79–106, 55 p. [Also available at https://doi.org/10.3133/wri79106.]
Finkelstein, J.S., Walter, D.A., and Monti, J., Jr., 2020, Aquifer texture data describing the Long Island aquifer system (ver. 3.0, December 2021): U.S. Geological Survey data release, accessed May 15, 2023, https://doi.org/10.5066/P954DLLC.
Finkelstein, J.S., Stumm, F., Williams, J.H., Lange, A, 2024, Hydrogeologic framework and chloride data for Kings, Queens, and Nassau counties, Long Island, New York: U.S. Geological Survey data release, https://doi.org/10.5066/P97WN72B.
Fitterman, D.V., and Stewart, M.T., 1986, Transient electromagnetic sounding for groundwater: Geophysics, v. 51, no. 4, p. 995-1005 [Also available at https://doi.org/10.1190/1.1442158.]
Fuller, M.L., 1914, The geology of Long Island, New York: U S Geological Survey Professional Paper 82, 231 p. [Also available at https://doi.org/10.3133/pp82.]
Grim, M.S., Drake, C.L., and Heirtzler, J.R., 1970, Sub-bottom study of Long Island Sound: Geological Society of America Bulletin, v. 81, no. 3, p. 649–666. [Also available at https://doi.org/10.1130/0016-7606(1970)81[649:SSOLIS]2.0.CO;2.]
Haeni, F.P., 1986, Application of continuous seismic-reflection methods to hydrologic studies: Groundwater, v. 24, no. 1, p. 23–31. [Also available at https://doi.org/10.1111/j.1745-6584.1986.tb01455.x.]
Haeni, F.P., 1988, Evaluation of the continuous seismic-reflection method for determining the thickness and lithology of stratified drift in the glaciated northeast, in Johnson, A.I., and Randall, A.D., eds., Regional aquifer systems of the United States—The northeast glacial aquifers—Papers presented at AWRA Symposium on monitoring, modeling, and mediating water quality, May 17–20, 1987, Syracuse, New York: American Water Resources Association Monograph Series, no. 11, p. 63–82.
Kendrick, A.K., Knight, R., Johnson, C.D., Liu, G., Knobbe, S., Hunt, R.J., and Butler, J.J., Jr., 2021, Assessment of NMR logging for estimating hydraulic conductivity in glacial aquifers: Groundwater, v. 59, no. 1, p. 31–48, accessed May 15, 2023, at https://doi.org/10.1111/gwat.13014.
Keys, W.S., 1990, Borehole geophysics applied to ground-water investigations: U.S. Geological Survey, Techniques of Water-Resources Investigations, book 2, chap. E2, 149 p. [Also available at https://pubs.usgs.gov/twri/twri2-e2/pdf/TWRI_2-E2.pdf.]
Keys, W.S., and MacCary, L.M., 1971, Application of borehole geophysics to water-resources investigations: U.S. Geological Survey Techniques of Water-Resources Investigations, book 2, chap. E1, 134 p. [Also available at https://doi.org/10.3133/twri02E1.]
Knight, R., Walsh, D.O., Butler, J.J., Jr., Grunewald, E., Liu, G., Parsekian, A.D., Reboulet, E.C., Knobbe, S., and Barrows, M., 2016, NMR logging to estimate hydraulic conductivity in unconsolidated aquifers: Groundwater, v. 54, no. 1, p. 104–114. [Also available at https://doi.org/10.1111/gwat.12324.]
Lane, J.W., Jr., White, E.A., Steele, G.V., and Cannia, J.C., 2008, Estimation of bedrock depth using the horizontal-to-vertical (H/V) ambient-noise seismic method, in Symposium on the Application of Geophysics to Engineering and Environmental Problems Proceedings: Denver, Colo., Environmental and Engineering Geophysical Society, p. 490–502, accessed February 10, 2023, at https://doi.org/10.4133/1.2963289.
Lindner, J.B., and Reilly, T.E., 1982, Analysis of three tests of the unconfined aquifer in southern Nassau County, Long Island, New York: U.S. Geological Survey Water-Resources Investigations Report 82–4021, 46 p. [Also available at https://doi.org/10.3133/wri824021.]
McClymonds, N.E., and Franke, O.L., 1972, Water transmitting properties of aquifers on Long Island, New York: U.S. Geological Survey Professional Paper 627–E, 24 p. [Also available at https://doi.org/10.3133/pp627E.]
McNeill, J.D., 1986, Technical note 20—Geonics EM39 borehole conductivity meter theory of operation: Mississauga, ON, Canada, Geonics Limited, 18 p. [Also available at https://geonics.com/pdfs/technicalnotes/tn20.pdf.]
McNeill, J.D., 1994, Technical note 27—principles and application of time domain electromagnetic techniques for resistivity sounding: Mississauga, ON, Canada, Geonics Limited, 16 p. [Also available at https://geonics.com/pdfs/technicalnotes/tn27.pdf.]
Merguerian, C., and Baskerville, C.A., 1987, The geology of Manhattan Island and the Bronx, New York City, New York, in Roy, D.C., ed., Northeastern section of the Geological Society of America Centennial Field Guide v. 5: Boulder, Colo., Geological Society of America, p. 137–140 [Also available at https://doi.org/10.1130/0-8137-5405-4.137.]
Merguerian, C., and Sanders, J.E., 1993, Southern Central Park, New York—Trips on the Rocks, Guide 20, Fieldtrip Series Trip 28, September 26, 1993, New York Academy of Sciences Section of Geological Sciences: Stone Ridge, N.Y., Duke Geological Laboratory, 143 p. [Also available at https://www.dukelabs.com/Publications/PubsPdf/OTR20_SouthernCentralPark_sm.pdf.]
Metzger, L.F., and Izbicki, J.A., 2013, Electromagnetic-induction logging to monitor changing chloride concentrations: Ground Water, v. 51, no. 1, p. 108–121. [Also available at https://doi.org/10.1111/j.1745-6584.2012.00944.x.]
Neuman, S.P., 1982, Statistical characterization of aquifer heterogeneities—An overview: Geological Society of America Special Paper, v. 189, p. 81–102. [Also available at https://doi.org/10.1130/SPE189-p81.]
North Carolina Division of Water Resources, 2006, Time domain electromagnetic geophysics: North Carolina Department of Environmental Quality web page, accessed April 19, 2020, at https://www.ncwater.org/?page=562.
Oliver, J.E., and Drake, C.L., 1951, Geophysical investigations in the emerged and submerged Atlantic Coastal Plain, part VI—The Long Island area: Geological Society of America Bulletin, v. 62, no. 11, p. 1287–1296. [Also available at https://doi.org/10.1130/0016-7606(1951)62[1287:GIITEA]2.0.CO;2.]
Payne, J.D., and Teeple, A.P., 2011, Time-domain electromagnetic soundings collected in Dawson County, Nebraska, 2007–09: U.S. Geological Survey Data Series 581, 54 p. [Also available at https://doi.org/10.3133/ds581.]
Prince, K.R., and Schneider, B.J., 1989, Estimation of hydraulic characteristics of the upper glacial and Magothy aquifers at East Meadow, New York, by use of aquifer tests: U.S. Geological Survey Water-Resources Investigations Report 87–4211, 43 p. [Also available at https://doi.org/10.3133/wri874211.]
Reynolds, R.J., and Williams, J.H., 1988, Continuous seismic-reflection profiling of glacial drift along the Susquehanna, Chemung, and Chenango rivers, south-central New York and north-central Pennsylvania, in Johnson, A.I., and Randall, A.D., eds., Regional aquifer systems of the United States—The northeast glacial aquifers—Papers presented at AWRA Symposium on monitoring, modeling, and mediating water quality, May 17–20, 1987, Syracuse, New York: American Water Resources Association Monograph Series, no. 11, p. 83–103.
Smolensky, D.A., Buxton, H.T., and Shernoff, P.K., 1990, Hydrologic framework of Long Island, New York: U.S. Geological Survey Hydrologic Investigations Atlas 709, scale 1:250,000, 3 sheets. [Also available at https://doi.org/10.3133/ha709.]
Stanford, S.D., Stone, B.D., Ridge, J.C., Witte, R.W., Pardi, R.R., and Reimer, G.E., 2021, Chronology of Laurentide glaciation in New Jersey and the New York City area, United States: Quaternary Research, v. 99, p. 142–167. [Also available at https://doi.org/10.1017/qua.2020.71.]
Stewart, M., and Gay, M.C., 1986, Evaluation of transient electromagnetic soundings for deep detection of conductive fluids: Groundwater, v. 24, no. 3, p. 351–356. [Also available at https://doi.org/10.1111/j.1745-6584.1986.tb01011.x.]
Stone, B.D., and Borns, H.W., Jr., 1986, Pleistocene glacial and interglacial stratigraphy of New England, Long Island, and adjacent Georges Bank and Gulf of Maine: Quaternary Science Reviews, v. 5, p. 39–52. [Also available at https://doi.org/10.1016/0277-3791(86)90172-1.]
Stumm, F., 1993, Use of focused electromagnetic induction borehole geophysics to delineate the saltwater-freshwater interface in Great Neck, Long Island, New York, in Bell, R.S., and Lepper, C.M., eds., Symposium on the Application of Geophysics to Engineering and Environmental Problems Proceedings, Vol. 2: San Diego, Calif., Environmental and Engineering Geophysical Society, p. 513–525.
Stumm, F., 1994, Delineation of the saltwater-freshwater interface in Great Neck, Long Island, New York, in Paillet, F.L., and Williams, J.H., eds., Proceedings of the U.S. Geological Survey workshop on the application of borehole geophysics to ground-water investigations, Albany, New York, June 2–4, 1992: U.S. Geological Survey Water-Resource Investigations Report 94–4103, p. 61–66.
Stumm, F., 2001, Hydrogeology and extent of saltwater intrusion of the Great Neck peninsula, Great Neck, Long Island, New York: U.S. Geological Survey Water-Resources Investigations Report 99–4280, 41 p. [Also available at https://doi.org/10.3133/wri994280.]
Stumm, F., 2005, Delineation of the fractured-rock and unconsolidated overburden ground-water flow systems, on the southern part of Manhattan, New York, through use of advanced borehole-geophysical techniques: New York, City University of New York, Ph.D. dissertation, 160 p. [Also available at https://academicworks.cuny.edu/gc_etds/3895/.]
Stumm, F., and Como, M.D., 2017, Delineation of salt water intrusion through use of electromagnetic-induction logging—A case study in southern Manhattan Island, New York: Water, v. 9, no. 9, p. 631–647. [Also available at https://doi.org/10.3390/w9090631.]
Stumm, F., Como, M.D., and Zuck, M.A., 2020, Use of time domain electromagnetic soundings and borehole electromagnetic induction logs to delineate the freshwater/saltwater interface on southwestern Long Island, New York, 2015–17: U.S. Geological Survey Open-File Report 2020–1093, 27 p. [Also available at https://doi.org/10.3133/ofr20201093.]
Stumm, F., and Lange, A., 1994, Delineation of the hydrogeologic framework and saltwater intrusion of the Great Neck Peninsula, Long Island, New York by use of geologic, hydrologic and geophysical methods: Conference on the Geology of Long Island and Metropolitan New York, State University of New York at Stony Brook, 10 p.
Stumm, F., and Lange, A., 1996, Delineation of the hydrologic framework and extent of saltwater intrusion within the Manhasset Neck Peninsula, Long Island, New York, by use of geologic, hydrologic, and geophysical methods: Conference on the Geology of Long Island and Metropolitan New York, State University of New York at Stony Brook, 7 p.
Stumm, F., Lange, A.D., and Candela, J.L., 2002, Hydrogeology and extent of saltwater intrusion on Manhasset Neck, Nassau County, New York: U.S. Geological Survey Water-Resources Investigations Report 00–4193, 42 p. [Also available at https://doi.org/10.3133/ wri004193.]
Stumm, F., Lange, A.D., and Candela, J.L., 2004, Hydrogeology and extent of saltwater intrusion in the northern part of the town of Oyster Bay, Nassau County, New York—1995–98: U.S. Geological Survey Water-Resources Investigations Report 2003–4288, 55 p. [Also available at https://doi.org/10.3133/wri034288.]
Stumm, F., and Williams, J.H., 2022, Nuclear magnetic resonance logging of a deep test well for estimation of aquifer and confining-unit hydraulic properties, Long Island, New York: State University of New York at Stony Brook, 29th Long Island Geologists Conference on Geology of Long Island and Metropolitan New York, 11 p.
Taylor, K.C., Hess, J.W., and Mazzela, A., 1989, A field evaluation of a slim-hole borehole induction tool: Ground Water Monitoring and Remediation, v. 9, no. 1, p. 100–104. [Also available at https://doi.org/10.1111/j.1745-6592.1989.tb01125.x.]
Terraciano, S.A., 1997, Position of the freshwater/saltwater interface in southeastern Queens and southwestern Nassau Counties, Long Island, New York, 1987–88: U.S. Geological Survey Open File Report 96–456, 17 p. [Also available at https://doi.org/10.3133/ofr96456.]
Theis, C.V., 1935, The relation between the lowering of the piezometric surface and the rate and duration of discharge of wells using groundwater storage: Eos, American Geophysical Union Transactions, v. 16, no. 2, p. 519–524. [Also available at https://doi.org/10.1029/TR016i002p00519.]
Theis, C.V., Brown, R.H., and Meyer, R.R., 1954, Estimating transmissibility from specific capacity: U.S. Geological Survey Open-File Report, 11 p. [Also available at https://doi.org/10.3133/ofr54310.]
U.S. Army Corps of Engineers, 1995, Geophysical exploration for engineering and environmental investigations, chap. 4 of Engineer Manual 1110–1–1802: Washington, D.C., U.S. Army Corps of Engineers, p. 4-1 to 4-57. [Also available at https://www.publications.usace.army.mil/Portals/76/Publications/EngineerManuals/EM_1110-1-1802.pdf.]
U.S. Census Bureau, 2022, Population estimates 2021: U.S. Census Bureau website, accessed May 4, 2022, at https://www.census.gov/quickfacts/fact/table/US#.
U.S. Environmental Protection Agency, 2023, Secondary drinking water standards—Guidance for nuisance chemicals: U.S. Environmental Protection Agency website, accessed on July 18, 2023, at https://www.epa.gov/sdwa/secondary-drinking-water-standards-guidance-nuisance-chemicals.
U.S. Geological Survey, 2013, National map data for Long Island, 10m DEM: U.S. Geological Survey website, accessed January 11, 2013, at https://apps.nationalmap.gov/viewer/.
U.S. Geological Survey, 2015, 1888–2014 USGS CoNED topobathy DEM (compiled 2015)—New Jersey and Delaware: National Oceanic and Atmospheric Administration Office for Costal Management website, accessed January 12, 2022, at https://chs.coast.noaa.gov/htdata/raster2/elevation/NewJersey_Delaware_Coned_Topobathy_DEM_2015_5040/index.html.
U.S. Geological Survey, 2016, 1887–2016 USGS CoNED topobathy DEM (compiled 2016)—New England: National Oceanic and Atmospheric Administration Office for Coastal Management website, accessed January 12, 2022, at https://chs.coast.noaa.gov/htdata/raster2/elevation/New_England_Coned_Topobathy_DEM_2016_6194/.
U.S. Geological Survey, 2022a, Aquifer test locator: U.S. Geological Survey web page, accessed August 15, 2022, at https://ny.water.usgs.gov/maps/aq-test/.
U.S. Geological Survey, 2022b, USGS GeoLog locator: U.S. Geological Survey web page, accessed August 15, 2022, at https://webapps.usgs.gov/GeoLogLocator/#!/.
U.S. Geological Survey, 2022c, USGS water data for the Nation: U.S. Geological Survey National Water Information System database, accessed August 15, 2022, at https://doi.org/10.5066/F7P55KJN.
U.S. Geological Survey, 2022d, USGS National Geologic Map Database: U.S. Geological Survey, accessed September 1, 2022, at https://ngmdb.usgs.gov/ngmdb/ngmdb_home.html.
Veatch, A.C., Slichter, C.S., Bowman, I., Crosby, W.O., and Horton, R.E., 1906, Underground water resources of Long Island, New York: U.S. Geological Survey Professional Paper 44, 394 p. [Also available at https://doi.org/10.3133/pp44.]
Walsh, D., Turner, P., Grunewald, E., Zhang, H., Butler, J.J., Jr., Reboulet, E., Knobbe, S., Christy, T., Lane, J.W., Jr., Johnson, C.D., Munday, T., and Fitzpatrick, A., 2013, A small-diameter NMR logging tool for ground-water investigations: Groundwater, v. 51, no. 6, p. 914–926. [Also available at https://doi.org/10.1111/gwat.12024.]
Walter, D.A., and Finkelstein, J.S., 2020, Distribution of selected hydrogeologic characteristics of the upper glacial and Magothy aquifers, Long Island, New York: U.S. Geological Survey Scientific Investigations Report 2020–5023, 21 p., accessed February 10, 2023, https://doi.org/10.3133/sir20205023.
Williams, J.H., Woodley, M., and Finkelstein, J.S., 2020, Aquifer transmissivity in Nassau, Queens, and Kings Counties, New York, estimated from specific-capacity tests at production wells: U.S. Geological Survey Open-File Report 2020–1108, 7 p., accessed March 30, 2023, at https://doi.org/10.3133/ofr20201108.
Zapecza, O.S., 1984, Hydrogeology framework of the New Jersey Coastal Plain: U.S. Geological Survey Open-File Report 84–730, 61 p. [Also available at https://doi.org/10.3133/ofr84730.]
Conversion Factors
Datums
Vertical coordinate information is referenced to the North American Vertical Datum of 1988 (NAVD 88) unless stated otherwise. On Long Island, NAVD 88 is around 1 foot lower than the National Geodetic Vertical Datum of 1929 (NGVD 29). In this report, elevation refers to the distance above or below the vertical datum. The vertical datum of NAVD 88 is referred to as sea level in this report unless otherwise indicated.
Horizontal coordinate information is referenced to the North American Datum of 1983 (NAD 83) or the North American Datum of 1927 (NAD 27).
Supplemental Information
Chloride concentrations are given in milligrams per liter.
Conductivity is given in millisiemens per meter, and resistivity is given in ohm-meters.
Spontaneous potential is given in millivolts, and single-point resistance is given in ohms.
Transmitter loop size is given in square meters, and
Natural gamma is given in counts per second.
Base frequencies are given in hertz.
U.S. Geological Survey (USGS) local number is a unique number and prefix assigned by county where K indicates Kings County, N indicates Nassau County, and Q indicates Queens County. Each county number is succeeded by a sequential number indicating if the borehole or well is the original completion at the site or a replacement. All boreholes or wells referenced in the report are original completions at the site and a suffix of _.1 is implied but not shown. USGS site ID is a 15-digit number assigned to a borehole or well.
Abbreviations
EM
electromagnetic induction
HVSR
horizontal-to-vertical spectral ratio
lidar
light detection and ranging
NAVD 88
North American Vertical Datum of 1988
NGVD 29
National Geodetic Vertical Datum of 1929
NMR
nuclear magnetic resonance
NSL
North Shore and Lloyd aquifer complex
NWIS
National Water Information System
PVC
polyvinyl chloride
R
resistivity
SDR
Schlumberger-Doll Research
SOE
sum of squared echoes
SP
spontaneous potential
SPR
single-point resistance
TDEM
time-domain electromagnetic
UJM
upper glacial-Jameco-Magothy aquifer complex
USGS
U.S. Geological Survey
WPA
Works Progress Administration
ybp
years before present
Disclaimers
Any use of trade, firm, or product names is for descriptive purposes only and does not imply endorsement by the U.S. Government.
Although this information product, for the most part, is in the public domain, it also may contain copyrighted materials as noted in the text. Permission to reproduce copyrighted items must be secured from the copyright owner.
Suggested Citation
Stumm, F., Finkelstein, J.S., Williams, J.H., and Lange, A.D., 2024, Hydrogeologic framework and extent of saltwater intrusion in Kings, Queens, and Nassau Counties, Long Island, New York: U.S. Geological Survey Scientific Investigations Report 2024–5048, 83 p., https://doi.org/10.3133/sir20245048.
ISSN: 2328-0328 (online)
Study Area
| Publication type | Report |
|---|---|
| Publication Subtype | USGS Numbered Series |
| Title | Hydrogeologic framework and extent of saltwater intrusion in Kings, Queens, and Nassau Counties, Long Island, New York |
| Series title | Scientific Investigations Report |
| Series number | 2024-5048 |
| DOI | 10.3133/sir20245048 |
| Publication Date | August 20, 2024 |
| Year Published | 2024 |
| Language | English |
| Publisher | U.S. Geological Survey |
| Publisher location | Reston, VA |
| Contributing office(s) | New York Water Science Center |
| Description | Report: ix, 83 p.; 3 Data Releases; Interactive Geospatial Data Viewer |
| Country | United States |
| State | New York |
| County | Kings County, Nassau County, Queens County |
| Other Geospatial | Long Island |
| Online Only (Y/N) | Y |
| Additional Online Files (Y/N) | N |