

Water-Quality Monitoring Strategy for Mount Hope Bay and the Taunton River Estuary, Southeastern Massachusetts
Links
- Document: Report (17.0 MB pdf) , HTML , XML
- Tables:
- Table 1.1 (30.3 KB xlsx) - Water-resource and environmental monitoring and sample collection programs in the greater Mount Hope Bay and Taunton River Estuary, southeastern Massachusetts
- Table 1.1 (12.1 KB csv)
- NGMDB Index Page: National Geologic Map Database Index Page (html)
- Download citation as: RIS | Dublin Core
Acknowledgments
This study benefited greatly from the interest, support, and assistance of personnel from the Massachusetts Department of Environmental Protection (MassDEP) Watershed Planning Program, the members of the MassDEP Marine Dissolved Oxygen Criteria Review Technical Advisory Committee, the stakeholders who participated in the Taunton River Estuary-Mount Hope Bay Monitoring Strategy Stakeholder meetings, and the U.S. Geological Survey colleagues and MassDEP staff who assisted with the project and provided reviews of the report.
Executive Summary
The water-quality monitoring strategy (WQMS) for Mount Hope Bay and the Taunton River Estuary is the result of a cooperative project between the U.S. Geological Survey and the Massachusetts Department of Environmental Protection (MassDEP). Mount Hope Bay, the Taunton River Estuary, and the drainages that contribute to them in Massachusetts compose an area of 600 square miles along the northeastern part of Narragansett Bay on the Massachusetts and Rhode Island border. MassDEP is interested in water-quality data in Mount Hope Bay and the Taunton River Estuary to characterize current water-quality conditions, assess nutrient-related effects, and capture conditions before and after planned upgrades to wastewater treatment facilities.
The U.S. Geological Survey, in cooperation with MassDEP, began a study in 2018 to develop a WQMS for Mount Hope Bay and the Taunton River Estuary in southeastern Massachusetts. The WQMS provides an overview of the environmental setting of Mount Hope Bay and the Taunton River Estuary and of dissolved oxygen and nutrient-related water-quality issues, reviews historical and existing monitoring data, and provides recommendations for future monitoring. A complete review and synthesis of all sources of nutrient-related water-quality information for Mount Hope Bay and the Taunton River Estuary are beyond the scope of this WQMS.
Information on important nutrient-related issues and questions on Mount Hope Bay and the Taunton River Estuary have been obtained from many sources, including meetings with a stakeholder group convened by MassDEP in 2018–19 and a technical advisory committee. The stakeholder group represented Federal, State, and local agencies; academic institutions; private entities; and volunteer-based monitoring organizations from Massachusetts and Rhode Island. The technical advisory committee consisted of representatives from a diverse group of organizations convened by MassDEP in 2017 to review existing coastal and marine dissolved oxygen criteria in the Massachusetts Surface Water Quality Standards, 314 Code of Massachusetts Regulations 4.00 (MassDEP, 2021), evaluate U.S. Environmental Protection Agency published guidance for developing dissolved oxygen criteria in saltwater (U.S. Environmental Protection Agency, 2000, 2003), and provide recommendations for potential criteria revisions that MassDEP could formally adopt in the future to address core requirements of the Clean Water Act of 1972, as amended (33 U.S.C. 1251 et seq.).
The WQMS provides recommendations for future monitoring designed to meet five MassDEP management objectives: (1) support MassDEP’s review of coastal and marine dissolved oxygen criteria, (2) assess conditions within MassDEP waterbody assessment units in Mount Hope Bay and the Taunton River Estuary with respect to selected criteria in the Massachusetts Surface Water Quality Standards, (3) assess conditions along the freshwater/saltwater interface (salt wedge) of the Taunton River Estuary and delineate the boundary between the freshwater and saltwater waterbody assessment units, (4) estimate data requirements needed to determine nutrient loads flowing into Mount Hope Bay and the Taunton River Estuary, and (5) evaluate data requirements needed to support hydrodynamic and water-quality models for Mount Hope Bay and the Taunton River Estuary. This WQMS may be used by MassDEP to develop a statewide approach for monitoring estuaries in Massachusetts.
References Cited
Massachusetts Department of Environmental Protection [MassDEP], 2021, 314 CMR 4.00—The Massachusetts Surface Water Quality Standards: Massachusetts Department of Environmental Protection web page, accessed December 12, 2022, at https://www.mass.gov/regulations/314-CMR-4-the-massachusetts-surface-water-quality-standards.
U.S. Environmental Protection Agency, 2000, Ambient aquatic life water quality criteria for dissolved oxygen (saltwater)—Cape Cod to Cape Hatteras: Washington, D.C., U.S. Environmental Protection Agency, EPA–822–R–00–012, [variously paged; 140 p.], accessed December 27, 2022, at https://www.epa.gov/sites/production/files/2018-10/documents/ambient-al-wqc-dissolved-oxygen-cape-code.pdf.
U.S. Environmental Protection Agency, 2003, Ambient water quality criteria for dissolved oxygen, water clarity and chlorophyll a for the Chesapeake Bay and its tidal tributaries: U.S. Environmental Protection Agency, EPA 903–R–03–002, [variously paged; 343 p.], accessed December 27, 2022, at https://d38c6ppuviqmfp.cloudfront.net/content/publications/cbp_13142.pdf.
Introduction
In 2000, the U.S. Environmental Protection Agency (EPA) published guidance for developing dissolved oxygen (DO) criteria for saltwater (EPA, 2000). The guidance targeted the region from Cape Cod, Massachusetts, to Cape Hatteras, North Carolina, and as a result, several States in the northeastern United States (Connecticut, New York, and Rhode Island) have updated their DO criteria for saltwater in response to the report. In 2017, the Massachusetts Department of Environmental Protection (MassDEP) began to review existing coastal and marine DO criteria in the Massachusetts Surface Water Quality Standards (SWQS). A technical advisory committee (TAC) was formed to provide expertise regarding available data, review deliverables, and guide recommendations for revising the coastal and marine DO criteria for Massachusetts. The TAC recognized that revisions to the coastal and marine DO criteria may require updated water-quality monitoring guidelines to inform data collection.
Based on the TAC findings, the U.S. Geological Survey (USGS), in cooperation with MassDEP, began a study in 2018 to develop a water-quality monitoring strategy (WQMS) for Mount Hope Bay and the Taunton River Estuary in southeastern Massachusetts (fig. 1). The WQMS may be used by MassDEP to provide a statewide approach for monitoring estuaries in Massachusetts and supports multiple water-quality management objectives, such as assessing nutrient-related effects, prioritizing impaired waters for protection and restoration, and identifying outstanding resource waters for special protection. Development of the WQMS involved a series of meetings among local and regional stakeholders to share information, identify data gaps, strengthen partnerships, and leverage existing resources among groups interested in the water quality of the study area. The stakeholders represented Federal, State, and local agencies; academic institutions; private entities; and volunteer-based monitoring organizations from Massachusetts and Rhode Island.
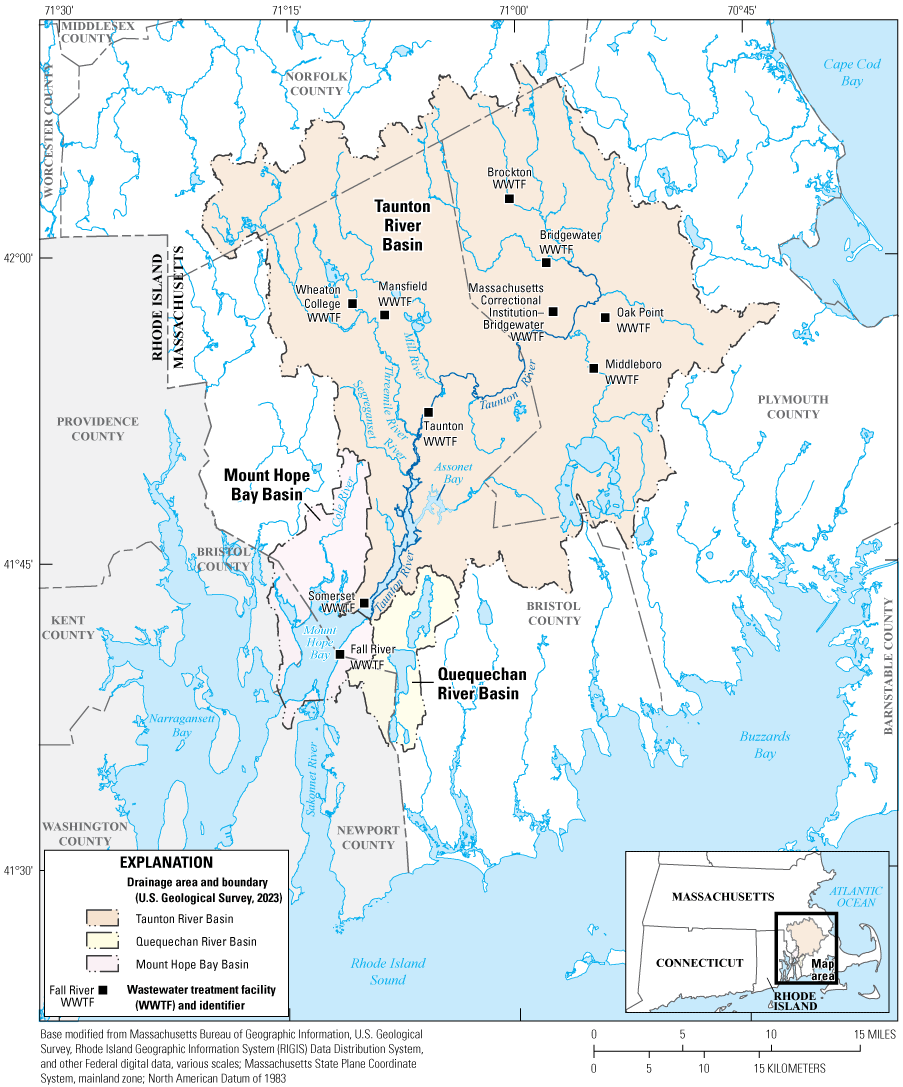
Location of the major drainage basin boundaries and wastewater treatment facilities in the Mount Hope Bay and Taunton River Estuary study area in southeastern Massachusetts. Wastewater treatment facility information is provided in table 1.
An ancillary goal of the WQMS is to provide transferability to other coastal areas in Massachusetts and the northeastern United States facing similar environmental challenges. MassDEP needs a comprehensive WQMS for monitoring estuaries that serves multiple management needs and addresses the core requirements of the Clean Water Act (CWA) of 1972, as amended (33 U.S.C. 1251 et seq.). Poor water quality can negatively affect commercial and recreational fishing and shellfishing, protected aquatic habitat, and public uses such as swimming and boating. Environmental data and information are needed to identify and characterize water pollution problems, set priorities for water-resource protection and restoration activities, support proactive decision-making on existing and emerging issues, and evaluate the effectiveness of past and ongoing measures taken to improve water quality.
Purpose and Scope
This report describes a WQMS for collecting water-quality information in Mount Hope Bay and the Taunton River Estuary. The WQMS was specifically designed to identify monitoring needed to meet the following MassDEP management objectives that are each outlined and assessed in the five subsections of this report:
-
1. Support MassDEP’s review of coastal and marine DO criteria,
-
2. Assess conditions within MassDEP waterbody assessment units (AUs) in Mount Hope Bay and the Taunton River Estuary with respect to selected Massachusetts SWQS,
-
3. Assess conditions along the freshwater/saltwater interface (salt wedge) of the Taunton River Estuary and delineate the boundary between the freshwater and saltwater waterbody AUs,
-
4. Estimate data requirements needed to determine nutrient loads to Mount Hope Bay and the Taunton River Estuary, and
-
5. Evaluate data requirements needed to support hydrodynamic and water-quality models for Mount Hope Bay and the Taunton River Estuary.
The study area for this report is the Taunton River Estuary and the Massachusetts part of Mount Hope Bay and the bordering Cole and Lee River embayments. MassDEP seeks to characterize current water-quality conditions (including the extent and duration of hypoxia) in this area as part of a review of coastal and marine DO criteria. The WQMS identifies core water quality and physical indicators used to support informed management strategies for marine DO and outlines sampling strategies needed to achieve these goals. The WQMS also reviews State monitoring objectives for Mount Hope Bay and the Taunton River Estuary and proposes a spatial and temporal monitoring design for selection of a mix of stations and sampling approaches that meet monitoring objectives. The WQMS includes an inventory of water-resource monitoring efforts in the region. The WQMS was developed for implementation by MassDEP and (or) one or more of its agents, contractors, or cooperating agencies. As a final planning effort, one or more quality-assurance project plans (QAPPs) would be needed before each of the five monitoring strategies is implemented.
Previous Studies
Water resources and water quality in the study area have been investigated over the past several decades by State and Federal agencies, academic institutions, and other organizations. MassDEP has several reports on assessments of water quality for the Taunton River, Taunton River Estuary, and Mount Hope Bay (Massachusetts Water Resources Commission [MWRC], 1971; Dorfman, 1988; MassDEP, 2001, 2009, 2010, 2011, 2012; Rojko and others, 2005). MassDEP’s Watershed Planning Program also maintains a database of discrete and 15-minute (hereinafter, “continuous”) measurements of water-quality data and metadata (https://www.mass.gov/guides/water-quality-monitoring-program-data, accessed June 23, 2022). Some MassDEP reports also provide water-quality data collected by other organizations. For example, MassDEP (2021a , b) provides water-quality data collected by the University of Massachusetts-Dartmouth School for Marine Science and Technology (SMAST) Coastal Systems Program from four stations in the Taunton River Estuary sampled in 2018, locations near the Somerset Power Facility sampled between 2004 and 2010, and 12 nearshore stations in Mount Hope Bay sampled by consultants for the Brayton Point Power Station (BPPS) in 2015–16.
Three resources that provide excellent summaries of water-quality and ecologic conditions in Narragansett Bay, including Mount Hope Bay and the Taunton River Estuary, are a report by the Narragansett Bay Estuary Program (NBEP) (NBEP, 2017), a book by Desbonnet and Costa-Pierce (2008), and a report by Raposa and Schwartz (2009). The NBEP report (NBEP, 2017) includes chapters on stressor indicators (landscape and chemical stressors, climate change) and condition indicators for Narragansett Bay (for the ecosystem, the drainage basin, and public health). The book by Desbonnet and Costa-Pierce (2008) arose from a 2004 symposium titled “State of Science Knowledge of Nutrients in Narragansett Bay” and includes chapters on nitrogen inputs and eutrophication in Narragansett Bay and chapters specific to water quality in Mount Hope Bay (Krahforst and Carullo, 2008) and circulation in Mount Hope Bay (Chen and others, 2008). The report by Raposa and Schwartz (2009) provides a comprehensive bay-wide overview of the ecology of Narragansett Bay, of which Mount Hope Bay and the Taunton River Estuary are important components. Additional water-quality data for Mount Hope Bay and the Taunton River Estuary are provided by Boucher (1991), Desbonnet and others (1992), Brayton Point Energy, LLC (Brayton Point Energy, LLC, written commun., 2016, as cited in Rhode Island Department of Environmental Management [RIDEM], 2021]), RIDEM (2021), Rountree and others (2003), Rountree and MacDonald (2006), Howes and Samimy (2007), and the Narragansett Bay Commission (NBC) (NBC, 2019) and by summarized information sources (GeoSyntec Consultants, 2006). Many journal articles on water quality in Narragansett Bay such as Codiga and others (2009), Hale and others (2016), Codiga (2020a, b), and Oviatt and others (2017, 2022) also provide data pertinent to Mount Hope Bay and the Taunton River Estuary. The NBEP maintains a resource library of scientific articles and research projects (https://www.nbep.org/technical-resources, accessed June 23, 2022).
Several USGS studies have documented hydrologic and water-quality data in the Taunton River Basin, including Williams (1968), Williams and Willey (1973), Williams and others (1973), Frimpter (1973), Wandle and Keezer (1984), and Lapham (1988). Barbaro and Sorenson (2013) compiled available data from 1996 to 2006 and developed a rainfall-runoff model for the Taunton River Basin that was calibrated for selected impaired reaches and used to evaluate nutrient loads to the Taunton River. More recently (January 2019 to December 2021), the USGS collected water-quality data at four USGS streamgages in the Taunton River Basin as part of a cooperative project with MassDEP, including Taunton River near Bridgewater, Mass. (station 01108000); Threemile (also known as Three Mile) River at North Dighton, Mass. (station 01109060); Segreganset River near Dighton, Mass. (station 01109070); and Mill River at Spring Street at Taunton, Mass. (station 01108410). Sampled water-quality constituents include major ions, nutrients, bacteria, and metals (quarterly), along with pH, water temperature, DO, specific conductance, turbidity, and alkalinity. These data are available in the USGS National Water Information System (NWIS) database (https://doi.org/10.5066/F7P55KJN, accessed June 25, 2023). An ongoing (2023) USGS study is using water-quality and discharge data to assess the nutrient loading at these four stations.
Environmental Setting of Mount Hope Bay and the Taunton River Estuary
Mount Hope Bay and the Taunton River Estuary provide important contributions to Narragansett Bay and affect its resources. Sources of water to Mount Hope Bay and the Taunton River Estuary include marine inputs from exchanges with Narragansett Bay and the Sakonnet River and freshwater inputs from the Taunton River and the smaller rivers and drainage areas that drain directly to the Taunton River Estuary and Mount Hope Bay. The major sources of the nutrients in these waters include wastewater treatment facility (WWTF) discharges, groundwater (from septic systems, residential sources, and agricultural sources), stormwater runoff, and atmospheric inputs.
The contributing drainage area to Mount Hope Bay is about 600 square miles (mi2). The Taunton River Basin composes the largest part of this area (529 mi2), and about 227 mi2 drain directly to the estuarine part of the Taunton River. The remaining drainage area to Mount Hope Bay is mostly from four small rivers: the Kickamuit, Cole, and Lee Rivers (34 mi2) on the north side of Mount Hope Bay and the Quequechan River (30.7 mi2) on the south (fig. 2).
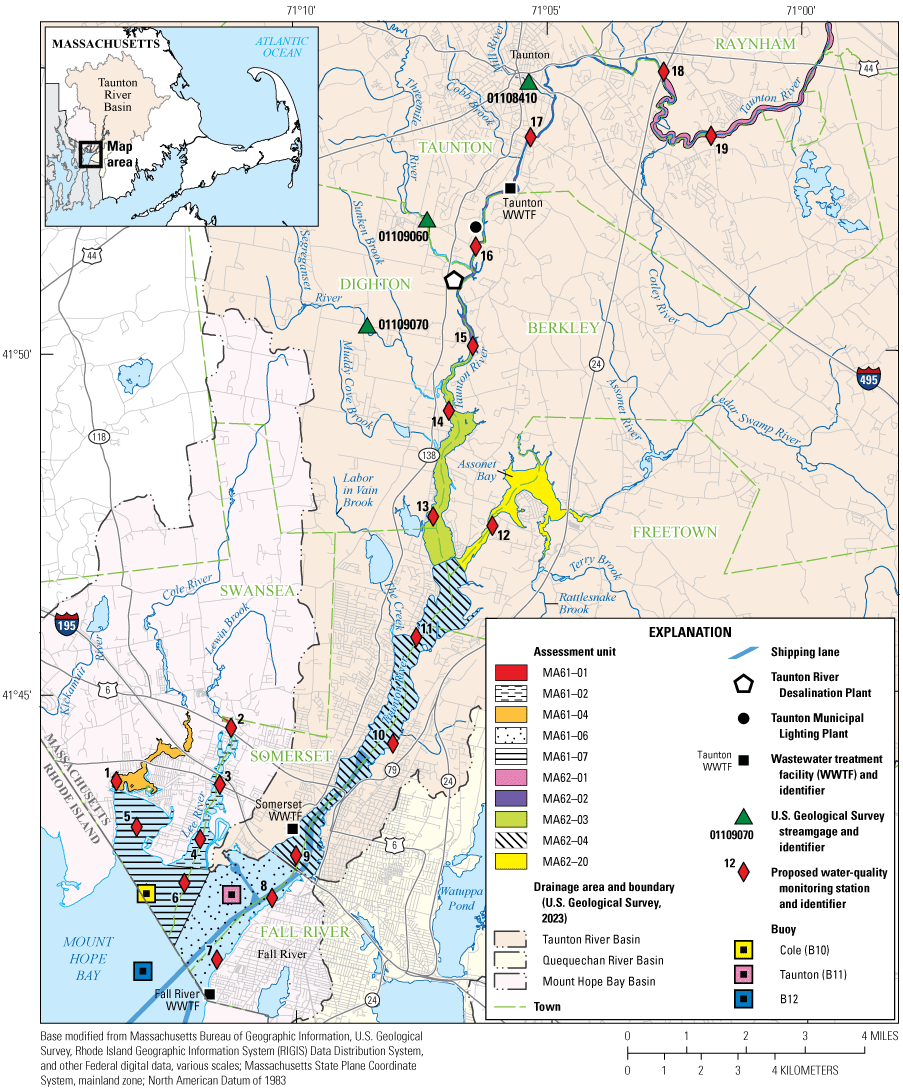
Mount Hope Bay, the Taunton River Estuary, and the drainage divides for Mount Hope Bay and the Taunton River Estuary, southeastern Massachusetts. Features labeled on the map include Massachusetts Department of Environmental Protection assessment units, stations proposed for monitoring water quality, Narragansett Bay Fixed Site Monitoring Network buoys, and U.S. Geological Survey streamgages.
Mount Hope Bay
Mount Hope Bay is a shallow, tidally dominated embayment in the northeastern part of Narragansett Bay, on the border between Massachusetts and Rhode Island (figs. 1–3). The surface area of Mount Hope Bay is about 13.5 mi2, about 70 percent of which is in Rhode Island. Mount Hope Bay has a complex coastline along its north shore, created by the mouth of the Taunton River (Fall River and Somerset, Mass.); embayments at the mouths of the Lee, Cole, and Kickamuit Rivers; and the adjoining peninsulas of Sewammock Neck (Somerset, Mass.), Gardners Neck (Swansea, Mass.), and Touisset (Warren, Rhode Island) (fig. 3). The western, southern, and eastern shores of Mount Hope Bay are made up by a peninsula (Bristol, R.I.), Aquidneck Island (Portsmouth, R.I.), and the Rhode Island-Massachusetts mainland (Tiverton, R.I., and Fall River, Mass.), respectively. The major connection between Mount Hope Bay and Narragansett Bay is through the East Passage, the waterway between the Bristol peninsula and Aquidneck Island that passes under the Mount Hope suspension bridge. Mount Hope Bay is also connected to the Sakonnet River, a tidal strait between Mount Hope Bay and Rhode Island Sound, through the Sakonnet River Narrows, the waterway between Aquidneck Island and the mainland (figs. 2 and 3). Bathymetrically, Mount Hope Bay consists of two regions, a shallow shelf in the north-central and northwestern regions of the bay (typical depths of 15 to 20 feet [ft]) and deeper waters in the East Passage (70 ft) and along the main shipping channels connecting the East Passage, Sakonnet River, and Taunton River (typical depths of 20 to 30 ft). The depth and orientation of these regions relative to seawater inputs from Narragansett Bay and the Sakonnet River and freshwater inputs from the Taunton River affect the circulation and water-quality conditions in Mount Hope Bay. The salinity in Narragansett Bay is about 32 parts per thousand (ppt). Surface water in Mount Hope Bay receives freshwater discharge from the Taunton River and is somewhat isolated from Narragansett Bay and so generally has lower salinities in the range of 20–27 ppt, depending on river flow. River discharge is generally highest in spring and lowest in summer; consequently, the average water salinity in the Mount Hope Bay system is typically lowest in spring and highest in summer. The southern part of Mount Hope Bay is generally well mixed to weakly stratified, whereas the shallower northern part of the bay is more likely to have instances of stratification, with the degree of stratification dependent upon freshwater input and the strength of tidal and wind-induced mixing (Howes and Samimy, 2007; Spaulding and Swanson, 2008).
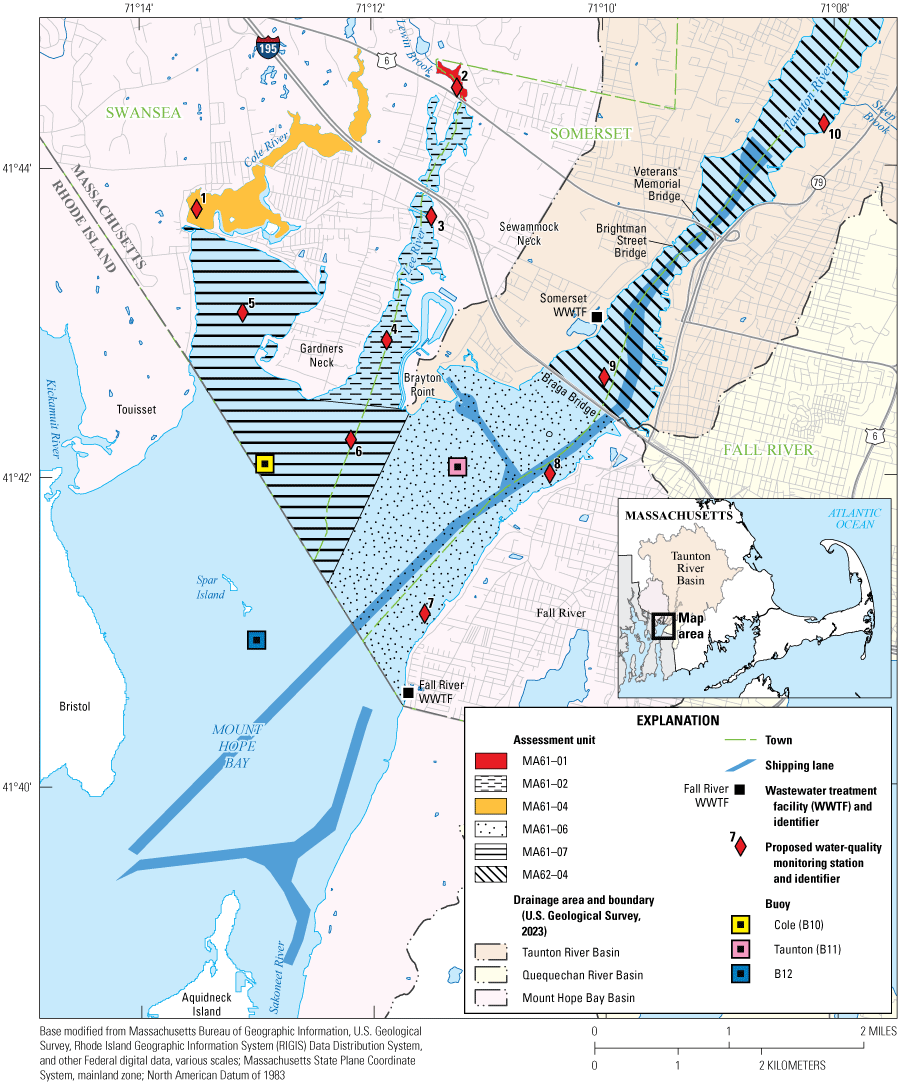
Monitoring stations proposed for monitoring water quality in Massachusetts Department of Environmental Protection assessment units in Mount Hope Bay (MA61–06 and MA61–07) and the Cole (MA61–04) and Lee (MA61–01 and MA61–02) River embayments, southeastern Massachusetts.
Tides in Mount Hope Bay are approximately semidiurnal (two tides per day). Tidal fluctuations range between 3.3 ft for neap tides (tides with the smallest tidal range) and 5.5 ft for spring tides (tides with the largest tidal range) (Spaulding and White, 1990). The short length of the bay and narrow connections to Narragansett Bay and the Sakonnet River modify the tides, creating tides that have a double-peaked flood tide and single ebb tide. The timing of the tides is slightly asymmetrical; incoming tides take longer to reach high tide than outgoing tides take to reach low tide (Desbonnet and Costa-Pierce, 2008). Tidal currents are typically less than 1 foot per second in Mount Hope Bay but can reach 6.6 feet per second in the narrow Sakonnet Passage (Rountree and others, 2003). The estimated residence time of Mount Hope Bay is between 14 and 49 days (Kincaid, 2006), with about 80 percent of Mount Hope Bay drainage moving through the East Passage and the remaining 20 percent through the Sakonnet River Passage (Deleo, 2001; Kincaid, 2006).
Substrates in Mount Hope Bay are predominantly mud, with smaller areas of sand mostly near the shoreline and in embayments (NBEP, 2017). Like Narragansett Bay, Mount Hope Bay is a phytoplankton-based ecosystem. Mount Hope Bay has few beds of Zostera marina L. (eelgrass) or macroalgae and little salt marsh (275 acres), primarily because of steep shoreline topography (Barrett and others, 2006; Raposa and Schwartz, 2007).
Taunton River Estuary
The Taunton River Estuary is defined as the area where freshwater from the Taunton River meets and mixes with saltwater from Mount Hope Bay. The estuary also includes tidal freshwater habitat in the upper part of the estuary. The Taunton River, which enters the northeastern corner of Mount Hope Bay adjacent to the city of Fall River, is the longest river unobstructed by dams in New England and provides the largest single freshwater discharge to Mount Hope Bay and Narragansett Bay. Tidal effects and the mixing between freshwater from the Taunton River and saltwater from Mount Hope Bay create complex and continually changing estuarine habitats. The lower Taunton River Estuary, from the Braga Bridge in Fall River upstream to the Berkley Bridge in Dighton (figs. 2–5), is a broad estuary strongly influenced by tides. This part of the estuary is wider, deeper, and more saline than the upper part of the Taunton River Estuary in Dighton, Berkley, and Taunton (fig. 6). The lower Taunton River Estuary and adjoining waters have a greater area of salt marsh (369 acres) than Mount Hope Bay or the upper Taunton River Estuary and most salt marsh is present in Broad Cove, the lower reaches of the Segreganset River, and Assonet Bay (fig. 5; Curley and others, 1974; NBEP, 2017). The narrowing of the river at Peters Point and the large rocks and ledge in the channel at this location mark the beginning of a natural transition between the lower and upper parts of the Taunton River Estuary (fig. 5). The boundary between the upper and lower parts of the estuary is generally considered to be near the Berkley Bridge in Dighton (station 15, figs. 5 and 6). The upper Taunton River Estuary from the Berkely Bridge in Dighton to the Route 24 bridge in Taunton/Raynham (fig. 6) is narrower, shallower, and more brackish than the lower Taunton River Estuary. Although the terms “upper” and “lower” are useful for describing different parts of the Taunton River Estuary, Mount Hope Bay and the upper and lower Taunton River Estuary can be described as a single estuary characterized by different levels of mixing of freshwater from the Taunton River and seawater from Narragansett Bay and the Sakonnet River (Desbonnet and others, 1992; U.S. Court of Appeals for the First Circuit, 2018).
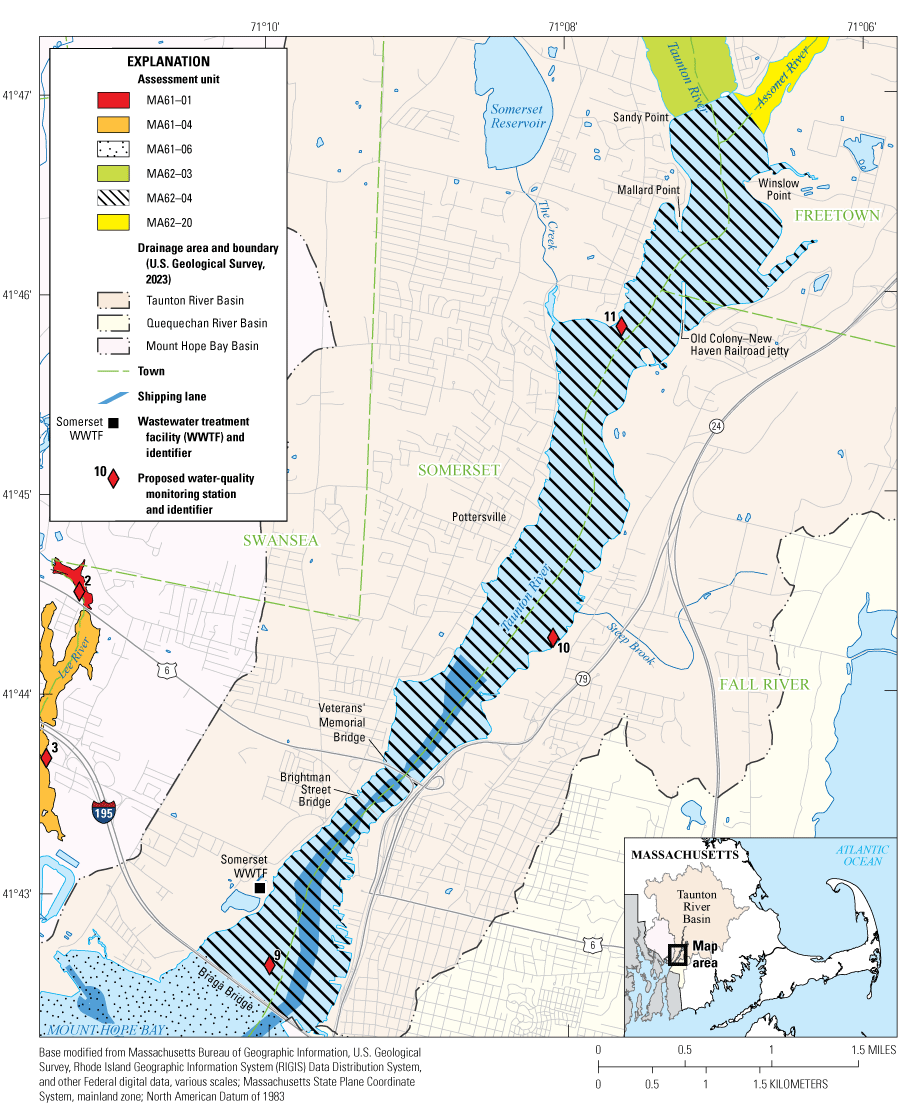
Monitoring stations proposed for monitoring water quality in Massachusetts Department of Environmental Protection assessment units in the lower part of the Taunton River Estuary (MA62–04), southeastern Massachusetts.
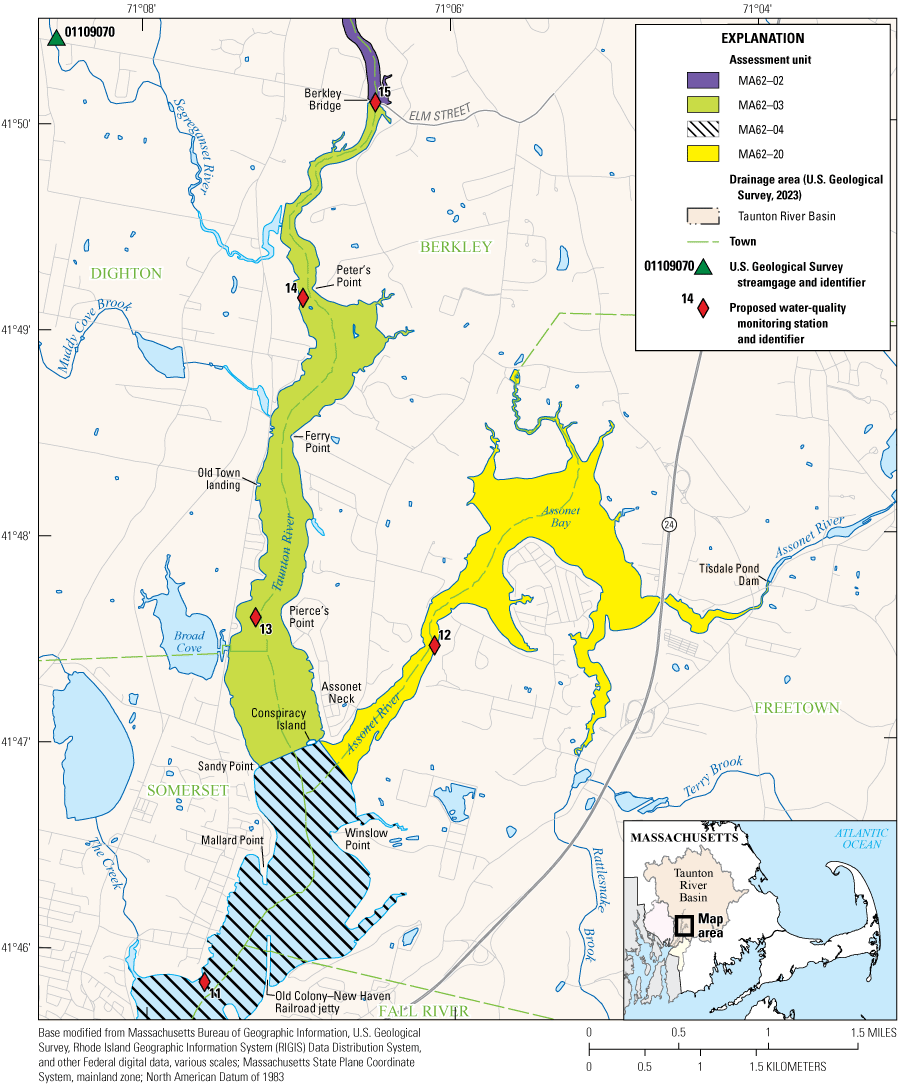
Monitoring stations proposed for monitoring water quality in Massachusetts Department of Environmental Protection assessment units in the middle part of the Taunton River Estuary (MA62–03) and Assonet River (MA62–20), southeastern Massachusetts.
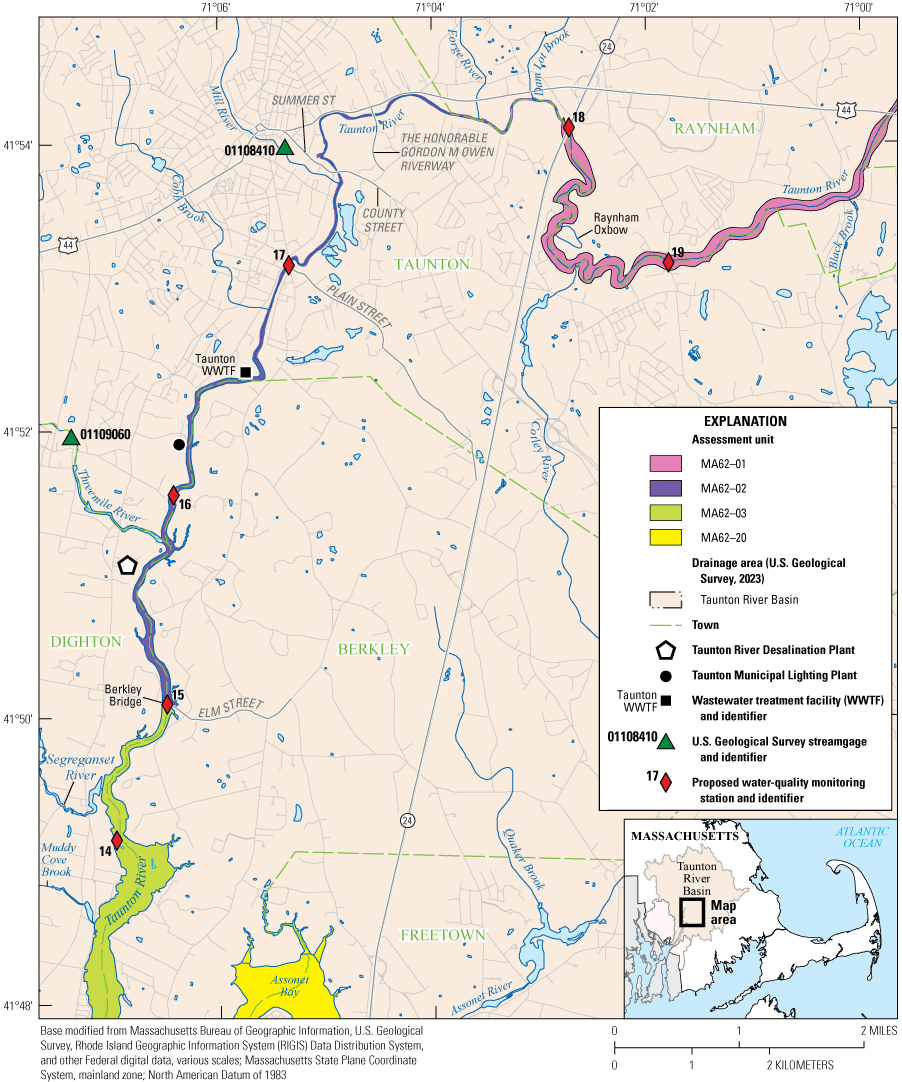
Monitoring stations proposed for monitoring water quality and water levels at the head of tide in the Massachusetts Department of Environmental Protection assessment units in the upper part of the Taunton River Estuary (MA62–02) and the freshwater Taunton River (MA62–01), southeastern Massachusetts.
Incoming tides carry saltwater about 12 miles (mi) into the Taunton River Estuary and past the confluence with the Threemile River (MWRC, 1971; Cantwell and others, 2007; figs. 2 and 6). The upstream extent of saltwater is not a fixed location but moves up and downriver about 2.5 mi in response to the magnitudes of the tide and freshwater flow of the Taunton River (Boucher, 1991). Because of the river’s low gradient, the flood tide entering the estuary backs up the freshwater flow in the Taunton River, creating freshwater tidal habitat that extends an additional 6 mi upstream from the farthest extent of saltwater. This backwater tidal effect extends to the head of tide in the reach of the Taunton River near the Raynham oxbow (upstream from Route 24 and downstream from the Cotley River; Taunton Wild & Scenic River Study Committee, 2005; figs. 2, 6). The head of tide, defined as a point where the mean tide range is less than 2.4 inches (Hicks, 2006), is not a fixed location but moves up and downriver in response to the magnitudes of the tide and freshwater flow of the Taunton River. The time taken for the propagation of tides upstream results in a delay of about 40 minutes between the time of high tide at the mouth of the estuary in Fall River and Somerset and the time of the high tide at the upstream end of the estuary in Taunton and Raynham and a lag of about 2 hours at low tide (Boucher, 1991). The estimated residence time of water in the Taunton River Estuary ranges between 1.3 hours during times of high freshwater input from the Taunton River to 2.7 days during periods of low flow (Boucher, 1991; Desbonnet and others, 1992).
The movement of saltwater in the Taunton River Estuary is complex and dynamic and varies with river discharge, tidal amplitude (neap and flood tides), baroclinic pressure gradients (arising from differing densities because of salinity and temperature), and other factors such as estuary geometry, channel curvature, bathymetry, bed roughness, and wind direction and strength. As saltwater from Mount Hope Bay enters the Taunton River Estuary, it mixes with freshwater from the Taunton River and the water column becomes partially mixed. As the flood tide progresses, partially mixed waters are transported up the river. This tidal influx of saltwater is referred to as a “saltwater intrusion” (Savenije, 2005). The transition from saltwater to freshwater (saltwater-freshwater interface, or salt front) is generally located in the reach upstream from the confluence of the Threemile River and downstream from the Plain St. Bridge in Taunton, Mass. The salt front is always moving with the tidal cycles; during the rising tide, saltwater pushes into the estuary, moving the salt front upstream, and during the ebb tide, freshwater flow in the river moves the salt front back toward the mouth of the river. The length of the saltwater intrusion is indirectly proportional to river discharge. High flows in the Taunton River limit the distance that the saltwater intrusion can move upstream, and low flows allow the salt intrusion to move farther upstream. Estuaries are hardly ever in steady state, and no tidal cycle is identical to the one preceding or after it (Fischer and others, 1979).
Water-Quality Issues and Management Needs for Monitoring in Mount Hope Bay and the Taunton River Estuary
Nutrient loading from wastewater, onsite septic systems, and from urban, suburban, and agricultural runoff is the largest factor contributing to eutrophication in Mount Hope Bay and the Taunton River Estuary (NBEP, 2017; Codiga, 2020b). The primary nutrient of concern is nitrogen, which is the limiting nutrient for phytoplankton in Mount Hope and Narragansett Bay. In general, phosphorus is considered the limiting nutrient for eutrophication in freshwater and nitrogen is considered the limiting nutrient in coastal marine ecosystems. In estuaries, high concentrations of nitrogen fuel phytoplankton blooms (algal blooms), which can have numerous adverse effects on water quality and aquatic habitat. When algal blooms die, they decompose, which can lead to reductions in DO concentrations through increased respiration and decomposition of organic matter. An algal bloom also can affect water quality and aquatic habitat by increasing turbidity, limiting light penetration, and altering the composition of the food chain (Trench, 2005).
Nutrient Loading, Eutrophication, and Hypoxia
Mount Hope Bay receives wastewater discharges from 10 permitted WWTFs (NBEP, 2017; table 1). The WWTF with the largest discharge, the Fall River WWTF, discharges directly to Mount Hope Bay near the Massachusetts-Rhode Island border. The Taunton and Somerset WWTFs discharge to the Taunton River Estuary (fig. 2), and another four municipal WWTFs, in Brockton, Mansfield/Foxborough/Norton Wastewater District, Middleborough, and Bridgewater, and three smaller facilities discharge to freshwater reaches of the Taunton River and its tributaries (fig. 1). Estimates of total nitrogen loads from individual WWTFs during 2013–15 are listed in table 1 (NBEP, 2017). Together, the WWTFs discharging to the Taunton River, Taunton River Estuary, and Mount Hope Bay account for about 35 percent of the nitrogen loading to Narragansett Bay (fig. 1; NBEP, 2017; Codiga, 2020a, b). Codiga (2021) augmented the NBEP (2017) analysis of nitrogen loading to Narragansett Bay by generating time series for estimated loads of total nitrogen at a daily resolution and used the loading data to investigate relations between hypoxia and nutrient loads in Narragansett Bay (Codiga, 2020a). Using estimated daily resolution time series for total nitrogen load from 2013 to 2015, Codiga (2020a, b) estimated that the mass discharge and percentage contribution of nitrogen loading to Narragansett Bay from the Fall River WWTF (995,000 pounds per year [lb/yr]; 10.9 percent) and Somerset WWTF (137,000 lb/yr; 1.5 percent) were about one-half of the nitrogen loading from WWTFs that discharge upstream in the Taunton River (2,235,000 lb/yr; 24.5 percent).
Table 1.
Nitrogen loadings and percentage of loading in Narragansett Bay originating from wastewater treatment facilities in Mount Hope Bay and the Taunton River Estuary in 2013–15 (Narragansett Bay Estuary Program, 2017).[WWTF, wastewater treatment facility; lb/yr, pound per year; MCI, Massachusetts Correctional Institution]
Efforts to reduce eutrophication and algal blooms that contribute to low DO concentrations typically focus on reducing nitrogen loads. In Narragansett Bay, WWTF upgrades to tertiary treatment decreased nitrogen loading by more than 50 percent to the Rhode Island part of Narragansett Bay over the last decade (Oviatt and others, 2017; Oczkowski and others, 2018). Although nutrient loading to the upper and mid-Bay regions of Narragansett Bay is lower than in years past, Mount Hope Bay has not yet demonstrated as much improvement. This may be due to the continued wastewater inputs to Mount Hope Bay from WWTFs in Massachusetts and from septic systems, stormwater runoff, and other sources related to urban sprawl in combination with inputs of freshwater from the Taunton River into Mount Hope Bay (Oviatt and others, 2017; see also Coastal State Discussion: A New Narragansett Bay https://www.youtube.com/watch?v=ZheLIR4bW90, accessed June 21, 2023). Implementation schedules for nitrogen reduction have been included in the wastewater discharge permits issued to five WWTFs upstream from the Somerset WWTF that discharge to waters tributary to the Taunton River Estuary or directly into the estuary (Mansfield/Foxborough/Norton, Middleborough, Bridgewater, Taunton, and Brockton; https://www.epa.gov/npdes-permits/region-1-final-medium-wastewater-treatment-facilities-general-permit-massachusetts, accessed June 25, 2023). These ongoing and future upgrades to WWTFs and improved management of stormwater are expected to provide future nutrient load reductions to Mount Hope Bay and improve future water quality in the bay.
Fall River is the largest urban area on Mount Hope Bay and the Taunton River Estuary, and its location immediately adjacent to the bay increases the potential for stormwater runoff and combined sewer overflows (CSOs) from the city to degrade water quality in Mount Hope Bay (RIDEM, 2010). In 2005, Fall River completed construction of a deep-rock tunnel 20 ft in diameter and 3 mi long that has a 38-million-gallon capacity for holding storm water and combined sewage until treatment (City of Fall River, 2017). The tunnel, together with expansion of the regional wastewater treatment plant, increased the wet-weather treatment capacity at the Fall River WWTF from 50 to 106 million gallons per day. Fall River has also implemented an integrated wastewater and stormwater plan that includes additional stormwater management such as constructing CSO screening and disinfection facilities and developing green infrastructure, including tree filter retrofits, rain barrels, and stormwater credits (EPA, 2016). More recently (2021), the EPA and City of Fall River began a 5-year plan to reduce discharges from CSOs into local waterways.
Historically, thermal loading from the former BPPS likely contributed to warmer temperatures and low DO conditions in Mount Hope Bay (fig. 3). The BPPS, at the confluence of the Lee and Taunton Rivers on the shallow north shore of Mount Hope Bay, was once the largest fossil-fueled generating station in the northeast. Thermal discharges and water withdrawals by the BPPS likely degraded aquatic habitat quality and contributed to violations of applicable DO criteria for designated uses in Mount Hope Bay and were implicated in the collapse of the bay’s finfish populations (Gibson, 1996; Mustard and others, 1999; EPA, 2003b; RIDEM, 2021). Concerns over degradation of the Mount Hope Bay ecosystem led to the construction of two cooling towers in 2011. The towers were part of a closed-cycle water system that recycled cooling water and ended the discharge of heated water to the bay. Analysis of temperature data collected in Mount Hope Bay indicated a cooling trend for near-surface waters in Mount Hope Bay after the discharge of heated water ceased (Codiga, 2020a, Benoit and Fox-Kemper, 2021). The BPPS went offline in June 2017, and the towers were demolished in April 2019. The thermal discharges from BPPS affected water quality, water temperature, and hypoxic conditions in the bay and must be considered when making comparisons between past and current DO conditions in Mount Hope Bay.
A study of metals and toxics in Mount Hope Bay is provided in Desbonnet and others (1992). More recently (2019–22), public demands increased for water-quality monitoring to assess the potential effects of stormwater runoff and atmospheric deposition of dust from a Somerset scrap metal facility on water quality and aquatic life in Mount Hope Bay (https://www.epa.gov/newsreleases/settlement-leads-halt-scrap-metal-releases-mt-hope-bay, accessed June 25, 2023). The scrap metal facility ceased operation in March 2022 (https://www.mass.gov/news/ags-office-settles-claims-of-illegal-dust-and-noise-pollution-and-stormwater-discharge-against-owner-and-operators-of-somers ets-brayton-point-scrap-facility, accessed January 4, 2024). Any future assessment of the environmental effects of water quality in Mount Hope Bay in relation to the scrap metal facility or other facilities proposed for the site of the former BPPS would be separate from the WQMS developed by this study.
DO may be the single most important indicator of environmental conditions in estuaries, and oxygen depletion poses a serious threat to estuarine and coastal ecosystems (Diaz and Rosenberg, 2008). The primary mechanism for depletion of DO is through the eutrophication cycle where nutrient overenrichment stimulates algal blooms and the subsequent die off and decomposition of organic matter after blooms increases oxygen consumption and leads to bottom-water hypoxia. Hypoxia and anoxia can have a wide range of negative effects on estuarine and marine ecosystems depending on the spatial extent, duration, frequency, and severity of hypoxic conditions. Hypoxia, defined as a DO concentration less than 2 milligrams per liter (mg/L), can cause physiologic stress in aquatic organisms (but see Vaquer-Sunyer and Duarte, 2008). Anoxia, when there is little to no oxygen in the water, leads to mortality of aquatic and marine organisms and is defined as a condition in which the DO concentration is less than 0.5 mg/L. Moderate hypoxia can disrupt life cycles, reduce growth rates of marine organisms, compress habitats, cause shifts in the benthic and pelagic community structure, and alter predator-prey relations (Codiga and others, 2009). Severe hypoxia and anoxia are associated with fish kills and can reduce species richness and biomass for benthic communities (Hale and others, 2016). Various taxa demonstrate a range of sensitivity to low concentrations of DO, and biological stress for organisms has been documented at DO concentrations between 2 and 5 mg/L (Diaz and Rosenberg, 1995; EPA, 2000; Vaquer-Sunyer and Duarte, 2008). The frequency and duration of the depletion of DO in bottom waters is critical to the structuring of habitat (Howes and others, 2003). Mobile organisms such as fish and crabs can move to avoid hypoxic and anoxic conditions but more sessile species such as benthic invertebrates cannot. Larvae are generally more acutely sensitive to hypoxia than juveniles and adults (EPA, 2000). Where hypoxia is a recurrent problem, benthic and pelagic communities tend to shift dominance from large, long-lived species to more tolerant or opportunistic short-lived species (Deacutis and others, 2006).
The processes or sequences of events that lead to hypoxic conditions may differ for different wind, tide, and current conditions. Vertical stratification, which inhibits the reoxygenation of bottom waters, often plays an important role in the development of hypoxic conditions. Vertical stratification is commonly affected by nonbiological variables, including freshwater discharge and meteorological conditions such as specific wind conditions and warmer air temperatures (Pinckney and others, 2001). Freshwater and saltwater have different densities and do not mix readily. Water with lower salinity or higher temperature is less dense and will float on top of water with higher salinity or lower temperature. This density difference can cause stratification that limits the vertical mixing of oxygen-rich surface water with oxygen-poor bottom water and can lead to bottom-water hypoxia. Increased water temperatures also can affect the vulnerability of organisms to hypoxia because the solubility of oxygen decreases as water temperature increases.
Hypoxic conditions in Mount Hope Bay generally develop over relatively short periods (days or weeks) and are infrequent (Hale and others, 2016). The intermittency of hypoxic events in Mount Hope Bay may be related to the relatively rapid tidal flushing of the bay (Codiga and others, 2009). Historically, areas in Mount Hope Bay that have demonstrated hypoxic or near hypoxic conditions include the mouths of the Lee and Cole River embayments and the Taunton River and along the eastern shore of Mount Hope Bay, south of the Fall River WWTF outfall (Deacutis and others, 2006).
Some of the low DO events that were detected historically in the upper reaches of Mount Hope Bay were attributed to stratification resulting from freshwater input from the Taunton River (Krahforst and Carullo, 2008). Several factors likely combine to create conditions that reduce mixing and allow stratification and hypoxia to develop. The shallow bays and sheltered coves that characterize the northern shore of Mount Hope Bay have poor circulation and flushing, making these areas vulnerable to the effects of nutrient loading such as algal blooms and prolonged periods of oxygen depletion from biodegradation processes. The critical season for low DO concentrations in Mount Hope Bay tends to be during late summer when water is the warmest. Stratification events have been detected during the mid-to-latter part of weak neap tides when tidal mixing is reduced in combination with periods of hot weather and low winds from directions that act to stall currents or gyres and increase the residence time in bottom waters. When stratification events are developing, DO concentrations in bottom waters tend to decrease over a period of several days. Once established, hypoxic events typically persist for periods ranging from hours to weeks until events such as strong tidal action from spring tides and (or) steady winds cause mixing and break up stratification (Desbonnet and Costa-Pierce, 2008; Codiga and others, 2009; Oviatt and others, 2017).
Conditions favoring hypoxia change within and between years. Hypoxia may be episodic (less than one event per year), periodic (lasting from days to weeks), or seasonal (Diaz and Rosenberg, 2008). Summers with large freshwater flows in June have been associated with more severe hypoxia in July and August (Nixon and others, 1995, Stoffel and Kiernan, 2009). In Narragansett Bay, the number of days (duration) and intensity of hypoxia also tend to be higher in wet summers than during dry summers (Stoffel and Kiernan, 2009; Oviatt and others, 2017). During wet summers, rivers discharge more freshwater into the bay, creating density differences that can lead to stratification. Heavy rains can also contribute to stratification.
Although stratification and hypoxia have been documented in Mount Hope Bay, little information is available to determine whether hypoxic events existed in the Taunton River Estuary. Historical discrete DO data in the Taunton River Estuary are available from MassDEP from 1970, 1981, and 1986 (MWRC, 1971; Massachusetts Department of Environmental Quality Engineering [MDEQE], 1982; and Dorfman, 1988, respectively); Boucher, 1991; and from SMAST in 2005–6 and 2018 (Howes and Samimy, 2007; MassDEP, 2021a, respectively). These reports indicate DO conditions in the lower Taunton River Estuary may be as much as 3 mg/L lower in bottom waters than at the surface; however, the short residence time of water in the Taunton River Estuary likely provides less opportunity for tidal waters to stratify and hypoxic conditions to develop.
Water-Quality Assessment in Mount Hope Bay and the Taunton River Estuary
The CWA requires MassDEP to classify surface waters in Massachusetts, complete water-quality assessments, and report to the EPA and the public whether the water resources meet Massachusetts SWQS 314 Code of Massachusetts Regulations 4.00 (314 CMR 4.00) (MassDEP, 2021b). Information on the Massachusetts Water Quality Management Program is available from MassDEP (https://www.mass.gov/guides/watershed-planning-program, accessed January 5, 2024) in reports entitled “A Strategy for Monitoring and Assessing the Quality of Massachusetts’ Waters to Support Multiple Water Resource Management Objectives” (MassDEP, 2018) and “Massachusetts Consolidated Assessment and Listing Methodology (CALM) Guidance Manual for the 2022 Reporting Cycle” (MassDEP, 2022) and in the Final Massachusetts Integrated List of Waters for the Clean Water Act 2022 Reporting Cycle (MassDEP, 2023).
Massachusetts rivers, lakes, and coastal waters are classified into discrete segments called AUs, each of which represents a waterbody segment considered to have similar water quality as classified in the Massachusetts SWQS. The AUs are differentiated to account for changes in water-quality conditions that may be expected in relation to factors such as bathymetry, geographic extent, tidal effect, water residence time, the confluence of major tributaries, or point-source discharges (MassDEP, 2022). The study area in Mount Hope Bay and the Taunton River Estuary has nine AUs: two large AUs within Mount Hope Bay, three smaller AUs in the Lee and Cole River embayments, three AUs in the Taunton River estuary, and one AU in Assonet Bay (table 2; fig. 2). A few adjoining waterbodies to the Taunton River Estuary, such as Broad Cove (MA62–50) and the lower reaches of the Segreganset and Threemile Rivers (MA62–55 and MA62–57, respectively), are tidal waterbodies and classified as separate AUs but are not included in this report at MassDEP’s request. The nontidal freshwater part of the Taunton River upstream from the Taunton River Estuary has a separate AU classification (MA62–01). A map of AUs in the Taunton River Basin can be viewed in appendix 24 of the Final 2022 Integrated List of Waters (MassDEP, 2023).
Table 2.
Assessment units in Mount Hope Bay and the Taunton River Estuary, and in the adjoining Taunton River main stem, southeastern Massachusetts, Massachusetts Department of Environmental Protection (2021a).[AU, assessment unit; ID, identifier; mi2, square mile; Mass, Massachusetts; RI, Rhode Island; —, no data or not applicable]
The Massachusetts SWQS assign all inland and coastal and marine waters to classes according to the intended beneficial uses of those waters. There are three class designations for coastal and marine waters in Massachusetts: classes SA, SB, and SC (MassDEP, 2022). These classes distinguish shellfish harvesting and recreational uses while providing suitable habitat for wildlife, fish, and other aquatic life. Minimum water-quality criteria (such as for DO and temperature) are specified for each class based on the most sensitive designated use for that class.
Water-quality conditions in each AU are evaluated under CWA Sections 305(b) and 303(d) to determine if surface waters meet numeric and narrative water-quality criteria to support designated uses, as defined in the Massachusetts SWQS (MassDEP, 2021b). These designated uses include aquatic life, fish consumption, shellfish harvesting, primary (for example, swimming) and secondary (for example, boating) contact recreation, and aesthetics. Public water supply is also a designated use but is assessed separately from the CWA 305(b) and 303(d) evaluations. MassDEP completes surface water-quality monitoring and uses ambient water-quality data (water quality of a waterbody measured immediately upstream from [or outside of] the effect of a particular source of contaminants) to assess whether waters are meeting their designated uses. Assessed waterbodies are assigned a use-attainment status (either fully supporting, not supporting, insufficient information, or not assessed) that characterizes whether each designated use is being supported, is impaired, or is not assessed.
Aquatic-life use assessments for estuaries are based primarily on DO and nutrient data relevant to cultural eutrophication. In addition to physical and chemical water-quality data, MassDEP collects quantitative information for public health, including fecal coliform bacterial indicators (Escherichia coli [E. coli] and enterococci), along with qualitative information on ecological health, including biological indicators, physical indicators, sediment characteristics, and aesthetic and bottom contaminant and alteration indicators. The nutrient-related ecological health of an estuary can be assessed by the nutrient (organic and inorganic nitrogen, phosphorus, silicon), chlorophyll, and DO concentrations of its waters, but because these can be highly variable, ecological health is also generally assessed using biological indicators, such as eelgrass versus macroalgal distribution, and benthic animal community presence and diversity. The rationale for using biological indicators is that they integrate environmental conditions over seasonal and annual intervals (Howes and others, 2003). MassDEP uses a weight-of-evidence approach to make aquatic life use assessment decisions that consider biological (including habitat) data first, followed by toxicological data, followed by chemical (physicochemical, sediment chemistry, whole-fish tissue residue) data (MassDEP, 2022, 2023).
Water-quality surveys are typically completed during the summer months (June through September) because this reflects the time of year when primary productivity is high and low marine DO concentrations are most likely to be detected. The timing of water-quality surveys is particularly important for sampling constituents where concentrations vary with location within or among coastal waters and with the time of sampling (day, season, year) and for constituents such as DO that have large temporal variability. To document worst-case conditions, profiling for DO and temperature is typically completed later in the sampling period, during mid-July through September, when the estuary is expected to demonstrate the greatest response to nutrient overenrichment. The sampling period for other constituents related to primary contact recreation such as E. coli and enterococci bacterial indicators may be broader, for example, from April 1 to October 15 (MassDEP, 2022).
The EPA, under Section 303(d) of the CWA, requires States to submit reports on the status of their waterbodies every two years. The most recent listings of impairments are reported in the Massachusetts 2022 Integrated List of Waters (MassDEP, 2023), which lists the two AUs in Mount Hope Bay (MA61–06 and MA61–07) as impaired for their designated uses because of multiple water-quality stressors. Aquatic-life impairments are listed in these AUs for chlorophyll a, DO, Fecal Coliform, fish bioassessments, and total nitrogen (MassDEP, 2023). In the Taunton River Estuary, MassDEP (2023) lists aquatic-life impairments for DO, enterococcus, and E. coli in MA62–01, for chlorophyll a, enterococcus, fecal coliform, total nitrogen, and total phosphorous in MA062–02, for DO, enterococcus, fecal coliform, and total nitrogen in MA62–03, and for DO, enterococcus, fecal coliform, fisheries bioassessments and total nitrogen in MA62–04. Additional impairments are listed for assessment units in the Cole, Kickamuit, and Lee Rivers (MassDEP, 2023).
Water-Quality Monitoring in Mount Hope Bay and the Taunton River Estuary
Water-quality data are collected throughout Mount Hope Bay and the Taunton River Estuary to help address resource-management questions and to identify trends in water quality, water quantity, or ecological conditions. MassDEP relies mostly on data collected by its ambient water-quality monitoring program. Historical water-quality assessments for Mount Hope Bay and the Taunton River Estuary are available in MassDEP publications such as the 1970 Taunton River study (MWRC, 1971), the 1986 Taunton River Basin water quality survey (Dorfman, 1988), the 2001 Taunton River watershed water-quality assessment report (Rojko and others, 2005), and the Narragansett and Mount Hope Bay watersheds 2004–8 water-quality assessment report (MassDEP, 2009). MassDEP also can use credible data from other State and Federal agencies, local governments, drinking water utilities, volunteer organizations, and other sources for making assessment decisions, contingent on quality-assurance review and approval (MassDEP, 2018, 2022).
Coordinating Federal, State, and local water resources monitoring efforts has been demonstrated to be an effective strategy for improving and maintaining water quality in estuaries (Fisher and others, 2018). Several organizations have programs that are engaged in monitoring water-quality conditions in the Mount Hope Bay and Taunton River Estuary study area (figs. 1 and 2). These programs are summarized in appendix 1 (table 1.1). This table was compiled with input from stakeholders to identify potential overlap of sampling sites and areas where efforts can be coordinated.
One of the major water-quality monitoring efforts in the region is the RIDEM Narragansett Bay Fixed Site Monitoring Network (NBFSMN) (https://dem.ri.gov/environmental-protection-bureau/water-resources/research-monitoring/narraganset-bay-assessment-1, accessed June 25, 2023). The NBFSMN collects water-quality data throughout Narragansett Bay including at three fixed monitoring-buoy stations in Mount Hope Bay. The monitoring buoys are operated seasonally (May–November) to monitor DO and nutrient conditions. The stations include two buoys in the Massachusetts part of Mount Hope Bay and one buoy in the Rhode Island part of the bay (figs. 2 and 3). The buoy in the Rhode Island part of Mount Hope Bay (station B12) is southeast of Spar Island near the Rhode Island-Massachusetts border. Data collection at this buoy began in 2005. Yearly data downloads of water-quality data for station B12 are available online from the NBFSMN (see https://dem.ri.gov/environmental-protection-bureau/water-resources/research-monitoring/narraganset-bay-assessment-0, accessed December 9, 2022).
The buoys in the Massachusetts part of Mount Hope Bay are in the shallow northern shelf of Mount Hope Bay. The Cole buoy (station B10) is south of the mouth of the Cole and Lee River embayments, and the Taunton buoy (station B11) is south of the mouth of the Taunton River. The Massachusetts buoys are an extension of the NBFSMN and are funded by MassDEP, in partnership with RIDEM, the University of Rhode Island Marine Ecosystem Research Laboratory, and the EPA Southeast New England Program for Coastal Watershed Restoration. Data collection at these buoys began in 2016. The Cole and Taunton buoys were deployed at these locations to represent water-quality conditions in AUs MA61–06 and MA61–07 in Mount Hope Bay (figs. 2 and 3, table 2).
The MassDEP buoys in Mount Hope Bay are equipped with multiparameter water-quality sondes (hereinafter referred to as “sondes”) that record continuous water-quality measurements at near-surface (1 meter [m] below surface) and near-bottom (0.5 m above bottom) locations in the water column. Constituents measured by the sondes include depth, water temperature, specific conductance, salinity, pH, DO, chlorophyll a, and phycoerythrin (a pigment present in blue-green algae). The near-surface sonde also measures nitrate using a Sea-Bird Scientific Submersible Ultraviolet Nitrate Analyzer that makes measurements hourly via ultraviolet light-absorbance measurement. To verify the accuracy of sensor measurements, water samples are collected for chemical analysis every 2 weeks at each buoy location for comparison of water quality to corresponding sensor data. Sondes at the stations are maintained and calibrated using recommended methods using an EPA-approved QAPP (https://www.mass.gov/guides/water-quality-monitoring-quality-management-program, accessed June 25, 2023) and NBFSMN standard operating procedures (Stoffel and Kiernan, 2009). The water-quality data collected at the Cole and Taunton buoys are published by MassDEP (MassDEP, 2020). Continuous water-quality data from the buoys are available online at https://www.mass.gov/info-details/mount-hope-bay-marine-buoy-continuous-probe-data (accessed December 9, 2022).
Organizations that collect water-quality monitoring data in the Taunton River Estuary include the Taunton River Watershed Alliance (TRWA), the Narragansett Bay Commission (NBC), and the Fall River, Somerset, and Taunton WWTFs. The TRWA, through a citizen monitoring effort, collects instantaneous water-quality data monthly (April to October) at 20 stations in the Taunton River Basin, including 3 stations on the Taunton River Estuary (Berkley Bridge, Plain Street, and the Assonet River) and 4 stations on tributaries to the estuary (Segreganset River, Threemile River, Mill River, and Forge River, see https://savethetaunton.org/water-quality-monitoring/, accessed June 25, 2023). These monitoring data include monthly measurements of water temperature, DO, pH, total suspended solids, nitrate, total phosphorus, and enterococci bacteria. The TRWA was founded in 1988 and has water-quality data dating back to 2003. Individual WWTFs in Fall River, Taunton, and Somerset also regularly complete water-quality monitoring in the Taunton River and Mount Hope Bay upstream and downstream from the permitted discharge mixing zone for their wastewater discharges. The NBC Environmental Monitoring and Data Analysis Section collects samples for nutrients from the Taunton River at Berkley Bridge, as well as sites on the Cole and Kickamuit Rivers that discharge to Mount Hope Bay (NBC, 2019).
Several agencies provide the physical data needed to support water-quality data monitoring. The National Oceanic and Atmospheric Administration (NOAA) operates three stations in Mount Hope Bay: the Fall River tide station (8447386) records tidal water level, air and water temperature, and conductivity; the Borden Flats light station (8447387) provides wind speed and direction and air temperature; and the Fall River visibility station (8447412) provides air temperature, visibility, and relative humidity (https://tidesandcurrents.noaa.gov/ports/index.html?port=nb, accessed June 25, 2023). NOAA also produces nautical charts that portray water depths, coastlines, aids to navigation, bottom characteristics, and other features in Mount Hope Bay and the Taunton River Estuary (NOAA, 2023). Maps of the Federal navigation channels are published by the U.S. Army Corps of Engineers (USACE) (https://www.mvr.usace.army.mil/Missions/Navigation/Hydrographic-Surveys/HydrographicSurveysMap/, accessed June 25, 2023). The USGS monitors streamflow in the Taunton River (station 01108000) and four tributaries in the Taunton River Basin including the Mill River (station 01108410), Segreganset River (station 01109070), Threemile River (station 01109060), and Wading River (station 01109000) (fig. 2). Streamflow data are reported in the USGS NWIS database (https://doi.org/10.5066/F7P55KJN).
Review of Coastal and Marine Dissolved Oxygen Criteria
The existing DO criteria in the Massachusetts SWQS prescribe the minimum DO necessary to sustain designated uses in coastal and marine waters (table 3; MassDEP, 2021b). Exceedances of DO criteria are determined by comparing coastal and marine DO measurements to the criteria, which are dependent on the waterbody classification (class SA or SB) in the Massachusetts SWQS.
Table 3.
Massachusetts dissolved oxygen criteria for coastal and marine surface water classifications (Massachusetts Department of Environmental Protection, 2021b).[DO, dissolved oxygen; mg/L, milligram per liter]
In 2017, MassDEP began completing a multiyear review of existing coastal and marine DO criteria in the Massachusetts SWQS 314 CMR 4.00 (MassDEP, 2021b). To provide expert guidance during the review of coastal and marine DO criteria, MassDEP worked with Tetra Tech, Inc., and Normandeau and Associates to convene a TAC. The TAC includes representatives from the EPA, Massachusetts Coastal Zone Management, Massachusetts Department of Fish and Game, RIDEM, University of Rhode Island, USGS, Footprints in the Water LLC, and Great Bay National Estuarine Research Reserve. MassDEP’s criteria review considered several approaches as the basis for developing DO criteria, including the reference condition approach (EPA, 2001), the Virginian Province approach (EPA, 2000), and the Chesapeake Bay approach (EPA, 2003a). The Virginian Province approach was the basis for DO criteria developed and adopted in the mid-2000s by other States on the East Coast, including Connecticut, New York, and Rhode Island. MassDEP is evaluating approaches that build on the Virginian Province approach while considering information from the National Marine Fisheries Service and other literature sources. Additional factors that may be considered include whether there is the occurrence of threatened or endangered species in a waterbody, such as Atlantic or shortnose sturgeon, and whether and whether sufficient data exist to indicate that higher DO concentrations are needed to support the growth and reproduction of aggregate fish communities.
Recent EPA guidance for marine DO (EPA, 2000, 2003a) recommends that in addition to establishing the magnitude of DO criteria, revised aquatic-life criteria for DO should also specify the frequency and duration of allowable exceedances. Here, the term “frequency” refers to the allowable number of exceedances of each criterion and the term “duration” refers to the time frame used to evaluate an exceedance of each criterion. To adequately protect aquatic life, including endangered coastal and marine species in Massachusetts, potential revisions to the marine DO criteria in the Massachusetts SWQS 314 CMR 4.00, may include acute and chronic DO criteria magnitudes, as well as frequency and duration components. Continuous DO data will be necessary to provide the time-series data needed for evaluating the frequency and duration of DO conditions.
MassDEP convened several meetings of stakeholders during 2018–19 (https://www.mass.gov/guides/watershed-planning-program-surface-water-quality-standards-review-and-development-activities, accessed June 25, 2023). The MassDEP meetings were held to keep stakeholders informed during the ongoing review of existing coastal and marine DO criteria. The stakeholder meetings also provided important input to the WQMS for Mount Hope Bay and the Taunton River Estuary. The stakeholders and TAC helped MassDEP to identify five management topics, described in the next section, that are related to water quality and environmental health within the study area and that were important to the WQMS for Mount Hope Bay and the Taunton River Estuary.
Water-Quality Monitoring Strategy for Mount Hope Bay and Taunton River Estuary
Large estuaries like Mount Hope Bay and the Taunton River Estuary that demonstrate high spatial and temporal variability require a comprehensive monitoring approach to characterize water-quality conditions. A monitoring approach that includes monthly discrete water-quality sampling, collection of continuous data at selected stations, and spatial surveys collecting vertical profile data at targeted locations would provide a representative description of seasonal patterns in water quality that may exist in an estuary in relation to eutrophication or stratification. Data from discrete water-quality monitoring networks offer flexibility in the selection of station locations and the ability to provide wide spatial coverage, providing a snapshot of water-quality conditions in an estuary (Fisher and others, 2018). Monitoring stations collecting continuous water-quality measurements capture tidal, daily, and seasonal variations in water-quality constituents and can detect sudden or long-term changes that could be missed by discrete sampling. Only a limited number of water-quality properties can be measured continuously, however, and the expense of equipment and time required to maintain stations that measure continuous multiple water-quality data often limit the number of stations that can be installed.
Water-quality indicators that are important to monitor the health of Mount Hope Bay and the Taunton River Estuary include DO, nutrients (organic and inorganic nitrogen, phosphorus), dissolved silica, chlorophyll a, pH, and one or more measures of water clarity (Secchi depth, percentage transmission of photosynthetically active radiation [known as PAR]) and suspended solids (turbidity, total organic carbon, total suspended solids, total dissolved solids). Water-quality indicators determined from analysis of discrete water samples include organic and inorganic nitrogen (ammonia, ammonia and organic nitrogen [whole and filtered], nitrite, nitrate, total nitrogen, total particulate nitrogen), phosphorus (whole and filtered, orthophosphate), dissolved silica, carbon, total suspended solids, biological oxygen demand, chlorophyll a phytoplankton, and pheophytin a phytoplankton. Water-quality properties that can be monitored continuously include water temperature, pH, specific conductance, salinity, DO, barometric pressure (for calculation of DO percentage saturation), and turbidity. Water-quality indicators should be supported by collection of basic ancillary data including field-measured water-quality properties (water temperature, specific conductance, salinity) and physical properties (sampling depth, tidal water level, water velocity, river discharge). Periodic analysis of basic water-chemistry constituents (major ions, trace metals, alkalinity) is also needed to characterize the estuarine system.
The Mount Hope Bay and Taunton River Estuary WQMS developed for this report considers five management objectives developed by MassDEP. To meet these objectives, 19 stations are identified for potential monitoring to characterize water-quality conditions in the Massachusetts part of Mount Hope Bay and in the Taunton River Estuary. The 19 stations include 4 stations in Mount Hope Bay, 4 stations in the Cole and Lee River embayments adjacent to Mount Hope Bay, 9 stations in the Taunton River Estuary, 1 station in the Assonet River, and 1 station in the freshwater part of the Taunton River just upstream from the boundary between AUs MA62–02 and MA62–01 (figs. 2–6). The WQMS was developed assuming that data collection at the Cole and Taunton buoys in Mount Hope Bay as part of the NBFSMN would continue. The potential locations of stations are listed in table 4, and the monitoring design and the frequency of data collection are listed in table 5. Water-quality constituents to be sampled are described in the following sections and in appendix 2. Monitoring and environmental sampling are costly and resources are limited. All 19 stations cannot be monitored for all water-quality constituents every year; consequently, data collection efforts will need to be completed in phases and coordinated among the 5 management objectives. Possible approaches for meeting each objective are discussed separately and sampling stations that can meet overlapping objectives are identified. Final selection of monitoring station locations and discrete sampling and equipment to be deployed at each station requires consultation with MassDEP. Development of an online map tool to document ongoing data collection in the Taunton River Basin, Taunton River Estuary, and Mount Hope Bay would provide a platform to facilitate existing and future collaboration and outreach.
Table 4.
Potential monitoring stations, including waterbodies, assessment units, station identifier, station types, water depths, and water-quality sampling locations, for Mount Hope Bay and the Taunton River Estuary, southeastern Massachusetts (shown in fig. 2).[Water depth determined from National Oceanic and Atmospheric Administration Mount Hope Bay chart 13226 (National Oceanic and Atmospheric Administration, 2023). AU, assessment unit; ID, station identifier; ft, foot; —, no data; MA, Massachusetts; RI, Rhode Island; US, upstream; MassDEP, Massachusetts Department of Environmental Protection; DS, downstream; WWTF, wastewater treatment facility; E., East; Ave., Avenue]
| Waterbody | AU | ID | Historic station ID and reference | Station type | Water depth (ft) | Location description | Latitude | Longitude |
|---|---|---|---|---|---|---|---|---|
| Cole River | MA61–04 | 1 | MHB6 (Howes and Samimy, 2007) | Moored, rotating | 18 | Cole River, inside harbor, deep hole (figs. 2 and 3) | 41.72891 | −71.22514 |
| Lee River | MA61–01 | 2 | — | Shore, fixed | 4 | Lee River, north of Route 6, right bank (figs. 2 and 3) | 41.7419 | −71.18765 |
| Lee River | MA61–02 | 3 | MHB17 (Howes and Samimy, 2007) | Shore, fixed | 4 | Lee River, northeast side of Wilber Avenue (figs. 2 and 3) | 41.72812 | −71.19165 |
| Lee River | MA61–02 | 4 | MHB4 (Howes and Samimy, 2007) | Buoy, rotating | 9 | Lee River embayment, out from Riverview Avenue (figs. 2 and 3) | 41.7147 | −71.19787 |
| Mount Hope Bay | MA61–07 | 5 | MHB7 (Howes and Samimy, 2007) | Buoy, rotating | 34 | Mount Hope Bay, out from center of mouth of Cole River embayment (figs. 2 and 3) | 41.71773 | −71.21857 |
| Mount Hope Bay | MA61–07 | 6 | MHB5 (Howes and Samimy, 2007) | Buoy, rotating | 16 | Mount Hope Bay, out from Center of mouth of Lee River Embayment (figs. 2 and 3) | 41.7040 | −71.20307 |
| Mount Hope Bay | MA61–06 | 7 | — | Buoy, rotating | 20 | Mount Hope Bay, deep area near MA/RI border (figs. 2 and 3) | 41.68523 | −71.19255 |
| Mount Hope Bay | MA61–06 | 8 | — | Shore, rotating | 20 | Mount Hope Bay, Borden Light Marina, or pier off Ferry Street (figs. 2 and 3) | 41.70026 | −71.17448 |
| (Lower) Taunton River Estuary | MA62–04 | 9 | — | Buoy, rotating | 16 | Taunton River, 1,000 ft US from Braga Bridge, near center of channel (figs. 2–4) | 41.71064 | −71.16661 |
| (Lower) Taunton River Estuary | MA62–04 | 10 | Near TR48/49 (MWRC, 1971) | Moored, rotating | 14 | Taunton River, near left bank, in bend between tower and pier, edge of deep channel, DS from Steep Brook (figs. 2–4) | 41.73789 | −71.13487 |
| (Lower) Taunton River Estuary | MA62–04 | 11 | — | Shore, fixed | 17 | Taunton River, right bank, near Bristol Marine (figs. 2–4) | 41.76385 | −71.12708 |
| Assonet River | MA62–20 | 12 | Near TR45 (MWRC, 1971) | Shore, rotating | 6 | Assonet River, between Osprey Drive and Narrows Road (private property) (figs. 2 and 5) | 41.79099 | −71.10205 |
| (Middle) Taunton River Estuary | MA62–03 | 13 | TR44 (MWRC, 1971) TR18 (Dorfman, 1988) | Moored, rotating | 5 | Taunton River, between Shawomet Yacht Club and Pierces Point (DS from Dighton Boat Ramp) (figs. 2 and 5) | 41.79333 | −71.12139 |
| (Middle) Taunton River Estuary | MA62–03 | 14 | TR42 (MWRC, 1971) | Moored, rotating | 5 | Taunton River, right side of channel, off Peters Point (figs. 2 and 5) | 41.81917 | −71.11611 |
| (Middle)/(Upper) Taunton River Estuary | MA62–03 | 15 | TR41 (MWRC, 1971) | Bridge, fixed | 5 | Taunton River, DS side of Berkley Bridge (figs. 2, 5, and 6) | 41.8349 | −71.10817 |
| (Upper) Taunton River Estuary | MA62–02 | 16 | TR40 (MWRC, 1971) | Moored, rotating | 4 | Taunton River, left side of channel, on bend US from Railroad Ave, US from Threemile River and DS from Power canal and Taunton WWTF (figs. 2 and 6) | 41.85928 | −71.10706 |
| (Upper) Taunton River Estuary | MA62–02 | 17 | TNT–02, TR14 (Dorfman, 1988) | Moored, rotating | 4 | Taunton River, Plain Street Bridge, DS right side, US from Taunton WWTF (figs. 2 and 6) | 41.88593 | −71.08899 |
| (Upper) Taunton River Estuary | MA62–02 | 18 | TR35 | Shore, rotating | 4 | Taunton River, Route 24 (figs. 2 and 6) | 41.90321 | −71.07502 |
| Taunton River | MA62–01 | 19 | TR34 | Bridge, rotating | 4 | Taunton River, South Street E./Old Colony Ave. Bridge, US side (figs. 2 and 6) | 41.88602 | −71.02993 |
Table 5.
Potential monitoring schedule for stations in Mount Hope Bay and the Taunton River Estuary, southeastern Massachusetts.[Water depth determined from National Oceanic and Atmospheric Administration Mount Hope Bay chart 13226 (National Oceanic and Atmospheric Administration, 2023). Water-quality constituents to be sampled at each station are identified in appendix 2 and are associated with objective 1, assessment of dissolved oxygen conditions in Mount Hope Bay and the Taunton River Estuary; objective 2, water-quality evaluation of assessment units; and objective 3, delineation of the salt-front and head of tide in the Taunton River Estuary. AU, assessment unit; ID, identifier; C–bottom, continuous–bottom; VP, vertical profiles; R, rotating; —, samples not collected during month; X, samples collected during month; C–surface, continuous–surface; F, fixed]
Field reconnaissance would be needed before the start of any sampling effort. The field reconnaissance should evaluate station locations relative to factors that may affect water quality such as confluences with tributaries and permitted point-source and stormwater discharges. Each station should be evaluated for site conditions (water depth, velocity, tidal range, and field-measured water-quality properties), factors affecting sampling logistics (availability of shore infrastructure such as docks and bridges that could be used for monitoring equipment, boat launch availability), and safety considerations (position relative to navigation channels, potential hazards such as fast current, rocks, and winter ice). The USACE maintains two navigation channels along the southeastern shore of Mount Hope Bay, with a northern and a southern channel (see USACE hydrographic surveys for Fall River Harbor and Taunton River, https://www.arcgis.com/apps/dashboards/4b8f2ba307684cf597617bf1b6d2f85d, accessed June 25, 2023). Any buoys collecting water-quality data in these areas would need to be outside of the navigation channels. Once potential locations for monitoring stations are identified, MassDEP will need to approve locations, and any necessary permissions or permits for installations will need to be obtained. Installations on public or private shore infrastructure or docks may require written landowner permission. Installations of monitoring equipment on State-owned bridges may require a State Highway Access Permit System permit from the Massachusetts Department of Transportation, and installations on town bridges or public lands may require permission from town public works departments or conservation commissions. Deployment of buoys for collection of water-quality data may require communication with local harbormasters and approval from the U.S. Coast Guard for a Private Aid to Navigation permit to ensure the buoy will be placed on Local Notices to Mariners Lists and Weekly Light Lists.
Monitoring to Support Review of Coastal and Marine Dissolved Oxygen Criteria
Monitoring stations collecting continuous DO data will be needed to provide the time-series data needed for evaluating the frequency and duration of DO conditions in Mount Hope Bay and the Taunton River Estuary to support MassDEP’s review of coastal and marine DO criteria. As part of the review, MassDEP is interested in evaluating spatial and temporal variations in DO concentrations.
Continuous data for monitoring DO conditions in the Massachusetts part of Mount Hope Bay are provided by two NBFSMN long-term monitoring stations (B10 and B11), as previously discussed. Currently (2023), no monitoring programs collect continuous DO data in the Taunton River Estuary, and information on stratification and DO conditions in the Taunton River Estuary is limited. Available resources are limited, however, and the addition of long-term fixed-site monitoring stations in the Taunton River Estuary collecting a full suite of water-quality data like the NBFSMN buoys may not be possible because of the expense of these stations. The need for additional long-term fixed stations could be reevaluated, however, once data have been collected at short-term monitoring stations. Short-term (month to years), long-term (decades), and targeted sampling stations are discussed in appendix 3.
A monitoring approach that includes a combination of short-term and targeted monitoring stations with accompanying discrete water-quality sampling and spatial surveys collecting vertical water-quality profiles to assess DO conditions during periods when stratification may be a concern would provide the flexibility needed to characterize DO conditions in Mount Hope Bay and the Taunton River Estuary. One or more short-term monitoring stations could be selected to monitor conditions at surface and bottom depths. Sensors could be installed on a range of platforms including buoys, moorings with bottom sensors, piers, pilings, or floats (shore-based platforms or marine docks). Telemetered data would be needed at a few stations to help inform targeted monitoring. These stations could be complemented by additional monitoring stations equipped with instruments that collect a limited set of constituents such as water temperature, DO, and salinity from near-bottom waters—the depth most at risk for hypoxia. These stations could use lower cost instrumentation that is not telemetered and internally log data that can be downloaded upon retrieval.
Continuous water-quality data collection for DO should, at a minimum, include a DO sensor equipped with a mechanical wiper and accompanying sensors to measure specific conductance, water temperature, and water depth. The specific conductance, water temperature, and depth data provide the means to correct DO concentration data, calculate DO saturation, and relate DO conditions to water levels (tidal stage). A separate sensor is needed to measure atmospheric barometric pressure. One or two barometric pressure sensors would likely be sufficient to correct depth sensors (during postprocessing of data) for all sites on Mount Hope Bay and the Taunton River Estuary. Before deployment, temperature sensors should be checked against a National Institute of Standards and Technology-certified thermometer. Any new continuous DO data should be collected at a frequency and duration that supports potential revisions to the existing coastal and marine DO criteria in the Massachusetts SWQS, and raw data must be evaluated and meet data-quality objectives before final approval.
Dissolved Oxygen Monitoring in Mount Hope Bay and the Cole and Lee Embayments
The WQMS identifies eight potential monitoring stations for monitoring DO concentrations in Mount Hope Bay and the Cole and Lee Rivers (tables 4 and 5; figs. 2 and 3). Three of these stations are near the mouths of the Cole and Lee embayments (stations 4–6; figs. 2 and 3) where low DO conditions have been previously reported (Deacutis and others, 2006). The northwestern part of Mount Hope Bay is a shallow shelf (less than 20 ft deep). During neap tides, winds that counter the direction of water currents may increase water residence time on the shelf and in the embayments and, in combination with warmer shallow water, make these areas susceptible to stratification and hypoxia. Two stations near the mouth of the Taunton River were also identified (stations 7 and 8; figs. 2 and 3). Historical DO data have indicated hypoxic conditions in this area (Deacutis and others, 2006). Freshwater discharges from the Taunton River can cause differences in salinity and, therefore, density between surface and bottom waters. These density differences can cause reduced mixing that leads to stratification and hypoxia. The station nearest the mouth of the Taunton River (station 8) could potentially be mounted on shore or a dock and would be a good candidate for a long-term (fixed) station if DO conditions were similar to those measured at the Cole and Taunton buoys. A second station could be located along the southeastern shore of Mount Hope Bay in an area that receives effluent discharge from the Fall River WWTF (station 7; figs. 2 and 3) and in a deep area near the shipping channel where Deacutis and others (2006) measured low DO conditions.
Dissolved Oxygen Monitoring in the Taunton River Estuary
The WQMS identifies 11 potential monitoring stations in the Taunton River Estuary, Assonet Bay, and the Taunton River (figs. 2–6; tables 4 and 5). These potential monitoring stations include nine short-term (rotating) monitoring stations and two stations on a shore, dock, or bridge that could potentially be long-term (fixed) monitoring stations. Continuous DO sensors, deployed on the river bottom at selected upstream and downstream stations in each AU would provide a dataset that could be used to evaluate whether low DO conditions exist in the Taunton River Estuary. For the short-term (rotating) stations, DO sensors could be rotated between alternate AUs every other month (table 5). For example, during June and August, DO sensors could be deployed at stations 9 and 10 in the lower Taunton River Estuary (AU MA62–04) and stations 16 and 17 in the upper Taunton River Estuary (AU MA62–02) and during July and September, DO sensors could be installed at stations 13 and 14 in the middle Taunton River Estuary (AU MA62–03), station 12 in the Assonet River (AU MA62–20), and stations 18 and 19 in the freshwater Taunton River (AU MA62–01) (table 5). Two monitoring stations, stations 11 and 15, could potentially be operated as long-term stations. Station 11, in the reach downstream from where the former Old Colony-New Haven Railroad crossed the Taunton River (table 4, figs. 3 and 4), would represent water-quality conditions in the deeper (20–30 ft), more saline parts of the lower Taunton River Estuary. A potential location for the station could be at or near the Bristol Marine docks. Station 15, at the Berkley Bridge, would represent water-quality conditions in the boundary between the middle and upper Taunton River Estuary (table 4, figs. 5 and 6). The Berkley Bridge could also potentially serve as a location for estimating nutrient loads in the Taunton River Estuary. The presence of the bridge structure could allow for installation of continuous water-quality monitoring equipment and an acoustic Doppler velocity meter for measuring velocities used to compute discharge. The bridge structure would also facilitate manual collection of isokinetic, depth-integrated water samples using the equal-width increment method to ensure that samples collected automatically at a single point were representative of the entire cross section of the river.
Targeted Dissolved Oxygen Monitoring in Mount Hope Bay and the Taunton River Estuary
Water-quality conditions in Mount Hope Bay have been documented by continuous data collected at the Cole and Taunton buoys as part of the NBFSMN from 2016 to 2022 (MassDEP, 2020; figs. 2 and 3). These datasets can be used to provide an indication of the daily, seasonal, and annual variability of water quality in Mount Hope Bay. Additional analysis of DO data collected by the NBFSMN from 2005 to 2019 that include data from the Mount Hope buoy (B12) in the Rhode Island part of Mount Hope Bay is provided by Codiga (2021).
Targeted water-quality monitoring and spatial surveys collecting vertical water-quality profiles could collect DO data that would help in understanding hypoxic conditions in Mount Hope Bay and the Taunton River Estuary and answer specific questions that would support MassDEP’s review of coastal and marine DO criteria, including the following:
-
• How well are water-quality conditions in Mount Hope Bay represented by the data collected by the MassDEP Cole and Taunton buoys? Do hypoxic conditions observed at the Cole and Taunton buoys in Mount Hope Bay indicate DO conditions in the Taunton River Estuary?
-
• How long do acute episodes of hypoxia last, and where do they exist most often?
-
• Are DO conditions measured in Mount Hope Bay from June to mid-September representative of “worst-case” DO concentrations or representative of seasonal conditions at other times of the year?
Targeted monitoring could be completed using several different approaches, such as collection of continuous data at additional selected locations or times, or by collection of vertical profiles over a greater spatial area on a routine (quarterly) basis or during selected periods. For example, to assess how well the water-quality data measured at the Cole and Taunton buoys represent DO conditions in different seasons, sondes at a shore station (such as station 8) could be operated for a longer period (April–November) (table 5).
A targeted monitoring approach that would help answer questions regarding hypoxia would be to complete synoptic water-quality surveys to measure vertical water-column profiles at selected locations throughout Mount Hope Bay and the Taunton River Estuary. Vertical water-column profiles are typically measured early in the morning, generally during the 3 hours around mid-ebb tide. Multiple sampling teams may be needed to collect profiles throughout a large area. DO surveys were completed historically in Mount Hope Bay as part of a monitoring effort in Narragansett Bay that included nighttime and daytime surveys by multi-institutional volunteer teams (Deacutis and others, 2006; Saarman and others, 2008; Prell and others, 2015). These synoptic surveys, last made in 2013, were completed for as many as 27 stations at a mix of deep and shallow sites in Mount Hope Bay (table 1.1) Data were reported for salinity, water temperature, density, DO concentration, and DO saturation. Repeating these surveys at selected stations measured previously would allow comparison to historic data. If resources are limited, periodic DO surveys could be limited to 1 or more months in late summer (July–August) or during selected periods of high temperature (heat waves).
Monitoring to Evaluate Water-Quality Conditions in Assessment Units in Mount Hope Bay and the Taunton River Estuary for the Clean Water Act
Water-quality data collected at monitoring stations can support multiple monitoring objectives. MassDEP is obligated by the CWA to evaluate water-quality conditions in waterbodies of the State, including the Massachusetts part of Mount Hope Bay and the Taunton River Estuary. Section 305(b) of the CWA requires each State to monitor, assess, and report on the quality of its waters relative to designated uses established in accordance with the Massachusetts water-quality standards. Section 303(d) of the CWA requires each State to list waters not meeting water-quality standards and prioritize those waters for development of total maximum daily load (commonly referred to as “TMDL”) or other management plans for restoration or protection. The 19 stations discussed previously for monitoring DO conditions (fig. 2, table 4) could also be used to evaluate water-quality conditions in the AUs of Mount Hope Bay and the Taunton River Estuary to support monitoring required by the CWA. Constituents used to evaluate water-quality conditions in the AUs include in situ continuous (15-minute) measurements of water-quality properties (water temperature, DO, percentage saturation, pH, specific conductance) and collection of discrete water-quality samples for analysis of nutrients (nitrate, ammonia, total nitrogen, and total phosphorus) and physicochemical constituents (total dissolved solids, total suspended solids, total alkalinity, total hardness, and chlorides) (MassDEP, 2001). In addition to water-quality data, monitoring to assess the compliance of waters with applicable criteria in the Massachusetts SWQS typically requires use of a multi-indicator approach that also considers physical and microbiological data (MassDEP, 2001, 2018, 2022; EPA, 2002a, b). Where possible, stations selected for use in the WQMS are monitoring stations that had been sampled previously so that comparisons could be made to historic water-quality data (MWRC, 1971; MDEQE, 1982; Dorfman, 1988; Rojko and others, 2005).
When evaluating the water-quality conditions in the AUs, MassDEP is obligated by the CWA to list all impairments and subsequently develop TMDLs for those impairments that are defined by the CWA as pollutants. Consequently, when reported in the CWA Section 303(d) list, a segment may in some cases be listed as impaired when only a small part of an AU demonstrates the impairment (EPA, 2020). More detailed monitoring of AUs may be necessary in some locations to determine localized impairments.
Water-quality monitoring stations can be configured in several different ways to collect necessary data and still be cost effective. Although continuous water-quality monitoring data at surface and bottom depths provide the best data for evaluation of stratification, to reduce costs, the measurement of a limited number of constituents, such as DO, conductivity, and water temperature, could be limited to bottom-depth locations at selected stations. If necessary, a cost-effective approach for monitoring water-quality conditions could include moving (or rotating) instrumentation for the collection of continuous water-quality data between stations during alternating months (June and August or July and September; table 5), as previously discussed. If equipment is moved or rotated between stations, however, one or more stations in Mount Hope Bay and the Taunton River Estuary should be selected to collect data throughout the sampling period.
Water-quality monitoring is needed at several locations within the large AUs in Mount Hope Bay. Stations 5 and 6 in AU MA61–07 were prioritized for locations near the boundaries between AUs in areas near the mouths of the Cole and Lee River embayments that have demonstrated low DO conditions in the past (Deacutis and others, 2006; fig. 3). Two potential monitoring locations were identified for MA61–06 (fig. 3, table 4). The station near the Massachusetts-Rhode Island border (station 7) is in deeper water (about 30 ft) near the outfall for the Fall River WWTF. The station would need to be outside the mixing zone of the Fall River WWTF discharge and outside the shipping navigation channel. A second station (station 8) was near the mouth of the Taunton River. This station could potentially be onshore or on a dock structure such as a breakwater barge at Borden Light Marina. One station was used to represent water-quality conditions in the smaller AUs in the Cole and Lee Rivers (stations MA61–04 and MA61–01, respectively). Two stations (stations 3 and 4) were identified in the Lee River (MA61–02) because of the long open-water boundary between AUs at the mouth of the Lee River embayment. Water depths at these locations are shallow, and conditions could potentially be characterized using bottom sensors only.
Monitoring stations in the three AUs in the Taunton River Estuary (MA62–04, MA62–03, and MA2–02) were selected to be near the upstream and downstream boundaries of the AUs (figs. 2–6) to allow comparison of the quality of water coming into the AU during outgoing tides with water leaving the reach at the downstream boundary of the segment, and vice versa for incoming tides. An additional station was near the center of each AU. One station was selected in the Taunton River upstream of State Route 24 (MA62–01; figs. 2, 6) to document conditions upstream of tidal effect.
Data collection at monitoring stations could be supplemented by spatial surveys of DO conditions in the Taunton River Estuary that would collect vertical water-column profiles at selected locations throughout the estuary. Potential areas to assess include deep reaches of the channel and areas near embayments off the main channel that may have less mixing, such as Assonet Bay or reaches of the Taunton River adjacent to Broad Cove (fig. 5). If low DO conditions are detected in a reach of the Taunton River during the first year of data collection and more detailed information is desired, monitoring equipment collecting continuous DO data could potentially be installed in subsequent years.
Monitoring to Characterize Salt Intrusion in the Taunton River Estuary
The intrusion of saltwater into an estuary is referred to as a “salt wedge” because of the profile shape assumed by the leading edge of saltwater, which is denser than freshwater and pushes under overlying river water as the tide moves upstream. The leading edge of a salt intrusion into the Taunton River Estuary is diluted seawater and is more of a diffuse boundary than a sharp boundary. To allow comparisons among water-quality surveys that do not reach the head of the salt or where the leading edge is hard to identify, the salt front is often defined by the location where the salinity is 5 practical salinity units or the chloride concentration is 100 mg/L. Water movement along the salt wedge can be complex, with saltwater moving upstream along the river bottom and less saline water flowing downstream at the surface.
Turbulence following the leading edge of a salt intrusion typically causes resuspension of sediments and other particulate matter and elevated concentrations of flocculent material and suspended solids. This zone of high turbidity in a salt wedge is referred to as the “estuary turbidity maximum.” If present, this feature can increase particle residence time in estuaries and affect water-quality conditions and estuarine biogeochemical and biological processes (Uncles, 2002; Ralston and others, 2017). However, Boucher (1991) found little evidence of a permanent turbidity maximum in the Taunton River Estuary.
The location and movement of the salt intrusion in the Taunton River Estuary have received little attention over the past three decades. Historic water-quality data for the salt wedge in the Taunton River Estuary, collected during 1970, 1981, and 1986 (table 6; MWRC, 1971; MDEQE, 1982; Dorfman, 1988), determined that the leading edge of the salt intrusion (the salt front) tended to exist in the reach between the Berkley Bridge and a location just upstream from the Taunton WWTF where salinities ranged from 15 to 0.1 ppt, respectively (fig. 6, table 6). An additional resource documenting the salt front in the reach between the Berkley Bridge and the Taunton WWTF is provided by the draft National Pollutant Discharge Elimination System permit for the Taunton Municipal Lighting Plant, which indicated that the salinities in the Taunton River near the Taunton Municipal Lighting Plant (about 0.9 mi downstream of the Taunton WWTF) consistently have low values in the range of 0–2 ppt (EPA, 2006). Additional water-quality data indicating the extent of the salt wedge may be available from Marine Research, Inc. (1983), Boucher (1991), the Taunton WWTF, and the Aquaria Taunton River Desalination Plant. The Taunton River Estuary is freshwater upstream from the salt front, although backwater conditions brought about by the incoming tide create a long reach of tidal freshwater habitat that extends upstream to State Route 24 and the Raynham Oxbow (fig. 6). Salinity data collected weekly at low tide in 2004 by SMAST (Howes and Samimy, 2007) from the Taunton River Estuary at the Weir Village Bridge (station 17) indicated that location to be above the effect of saltwater at low tide (average low tide salinity of 0.2 ppt), and salinity data indicated no stratification of the water column at the site (Howes and Samimy, 2007). Moving downstream from the Berkley Bridge, salinities increase steadily to the former Old Colony-New Haven Railroad jetty in Somerset (figs. 4 and 5), then increase more slowly approaching the river’s mouth until the average salinity at all depths is about 30 ppt at the Brightman Street Bridge (figs. 3 and 4).
Table 6.
Salinity data collected previously by the Massachusetts Department of Environmental Protection at stations on the Taunton River Estuary. Data include the 1970 survey (Massachusetts Water Resources Commission, 1971), the 1981 survey (Massachusetts Department of Environmental Quality Engineering, 1982), and the 1986 survey (Dorfman, 1988), which help delineate the salt wedge in the Taunton River Estuary, southeastern Massachusetts.[The 1981 salinity values are converted from chloride ion concentration (Cl−) using the following formula: salinity (ppt)=0.0018066*(Cl−). Dates are given in month/day/year format; avg, average; ppt, parts per thousand; —, no data or not applicable; WWTF, wastewater treatment facility; USGS, U.S. Geological Survey; NA, not applicable; no., number]
| Station | Location description | River mile | High tide salinity avg (ppt) | Low tide salinity avg (ppt) | Date |
|---|---|---|---|---|---|
| TR34 | East Taunton Bridge, Raynham/Taunton (fig. 6) | 24.7 | — | — | — |
| TR35 | Route 24 Bridge, Raynham/Taunton (fig. 6) | 21.7 | — | — | — |
| TR37 | Bridge opposite South Main Street, Taunton (fig. 6) | 19.9 | — | — | — |
| TR39 | Above Taunton WWTF, Taunton (fig. 6) | 16.5 | 0.3 | 0.2 | 7/24, 27–30, 1970 |
| TR40 | Above confluence with Threemile River, Taunton (figs. 2, 6) | 14.9 | 6.5 | 0.3 | 7/24, 27–30, 1970 |
| TR41 | Berkley Bridge, Berkley/Dighton (USGS site 414949071065301; figs. 2, 5, and 6) | 13 | 14.5 | 0.5 | 7/24, 27–30, 1970 |
| TR42 | Off Peters Point, Berkley (top; fig. 5) | 11.6 | 15 | 4.9 | 7/24, 27–30, 1970 |
| TR42 | Off Peters Point, Berkley (bottom; fig. 5) | 11.6 | 18.1 | 6 | 8/3–7/1970 |
| TR44 | Off Pierces Point, Berkley (fig. 5) | 9.5 | 24.3 | 19.7 | 8/3–7/1970 |
| TR46 | Old Bridge, Somerset (top; figs. 4, 5) | 7.5 | 24.6 | 24 | 8/3–7/1970 |
| TR47 | Old Bridge, Somerset (bottom; figs. 4, 5) | 7.5 | 29.3 | 27.3 | 8/3–7/1970 |
| TR48 | Off Pottersville, Somerset (top; fig. 4) | 6.5 | 27 | 25.9 | 8/3–7/1970 |
| TR49 | Off Pottersville, Somerset (bottom; fig. 4) | 6.5 | 29.7 | 29.4 | 8/3–7/1970 |
| TR50 | Brightman Street Bridge, Fall River (top; fig. 3) | 4 | 28.7 | 27.5 | — |
| TR51 | Brightman Street Bridge, Fall River (bottom; fig. 3) | 4 | 30.3 | 30.2 | — |
| TR12A | Bridge at Honorable Gordon M. Owen Riverway (fig. 6) | 19.2 | 0.0 | 0.1 | 8/4–6/1981 |
| TR13 | County Street (Route 140) bridge, Taunton (fig. 6) | 18.3 | 0.0 | 0.0 | 8/4–6/1981 |
| TR14 | Plain Street bridge, Taunton (fig. 6) | 17.3 | 0.1 | 0.1 | 8/4–6/1981 |
| TR15 | Above WWTF, Taunton (fig. 6) | 16.5 | 0.4 | 0.1 | 8/4–6/1981 |
| TR16 | Below WWTF, Taunton (fig. 6) | 15.5 | 1.6 | 0.1 | 8/4–6/1981 |
| TR17 | Berkley Bridge, Dighton (fig. 6) | 13 | 15 | 0.8 | 8/4–6/1981 |
| TR18 | Off Peter’s Point, buoy no. 18, Berkley (fig. 6) | 11.4 | 14.2 | 8.6 | 8/4–6/1981 |
| TR19 | Off Old Town landing, buoy no. 11, Dighton (fig. 6) | 10.1 | 24.4 | 13.8 | 8/4–6/1981 |
| TR15 | Above WWTF outfall, Taunton (fig. 6) | 16.5 | — | NA | 7/1/1986 |
| TR16A | Below WWTF outfall, Taunton (fig. 6) | 15.5 | — | 0 | 7/1/1986 |
| TR16 | Below Power Plant on west riverbank at bend, Taunton (fig. 6) | 15.1 | — | 0 | 7/1/1986 |
| TR17 | Berkley Bridge, Dighton (fig. 6) | 13 | — | NA | 7/1/1986 |
| TR18 | Below confluence with Segreganset River, off Peters Point, Berkley (fig. 6) | 11.4 | — | 10 | 7/1/1986 |
| TR18B | Below confluence with Muddy Cove Brook, off Ferry Point, at buoy no. 13, Dighton (fig. 5) | 10.3 | — | 13.5 | 7/1/1986 |
| TR21B | Below Winslow Point, Freetown (fig. 5) | 8.3 | — | 22 | 7/1/1986 |
| TR22 | Across from Somerset Power Plant, Somerset (fig. 3) | 4.8 | — | 22.5 | 7/1/1986 |
| TR24B | Above Fall River outfall, buoy no. 8, Fall River (fig. 3) | NA | — | 27.5 | 7/1/1986 |
| TR24C | Below Fall River outfall, buoy no. 5, Fall River (fig. 3) | NA | — | 29 | 7/1/1986 |
A new effort to collect water-quality data in the Taunton River Estuary would update the location and movement of the salt intrusion in the estuary; improve the understanding of the relations between river discharge, stratification, and hypoxic conditions in the Taunton River Estuary and Mount Hope Bay; and provide a baseline to inform future investigations of salt-wedge excursion distance resulting from hurricane storm surges or sea-level rise. Estuary tidal conditions are continually changing, and stratification patterns may differ considerably between spring and neap tides and between seasons with high or low river flow conditions. To fully assess the movement and extent of the salt wedge in the Taunton River Estuary, a monitoring program was designed to collect longitudinal and depth profiles over a monthly tidal cycle (table 7). Data should be collected from near-surface and near-bottom depths in the river and should include continuous (5- to 15-minute) measurements of specific conductance, water temperature, DO, and water level. The monitoring survey should be completed several times a year (such as May and August) during different flow conditions. Periodic measurement of vertical water-quality profiles collected from bridges or boats at these stations would provide more detailed information about water-quality conditions and stratification within the wedge. The monitoring program includes data collection at many of the same locations used historically by MassDEP and SMAST to allow a comparison of current water-quality conditions to water quality during these historic surveys.
Table 7.
Potential monitoring schedule for assessment of the salt wedge in the Taunton River Estuary, southeastern Massachusetts.[Location descriptions of stations are provided in table 4. Water depth determined from National Oceanic and Atmospheric Administration Mount Hope Bay chart 13226 (National Oceanic and Atmospheric Administration, 2023). Water-quality constituents to be sampled at each station are identified in appendix 2 in the report and are associated with objective 1, assessment of dissolved oxygen conditions in Mount Hope Bay and the Taunton River Estuary; objective 2, water-quality evaluation of assessment units; and objective 3, delineation of the salt-front and head of tide in the Taunton River Estuary. ID, station identifier; AU, assessment unit; ft, foot; C–SB, continuous, surface and bottom; R, rotating; —, samples not collected during month; X, samples collected during month; F, fixed; C–B, continuous, bottom]
Two areas of interest along the Taunton River Estuary may warrant a higher density and frequency of data collection. The first of these is the reach that includes the farthest extent of the salt front, and the second is the reach that includes the head of tide. Collection of continuous water-quality data at stations 16 and 17 and of continuous water-level data at station 18 would help to evaluate the variability of the salt wedge in these reaches (fig. 6, table 7). One or more additional stations between stations 16 and 17 and between stations 18 and 19 would help define the movement of the salt front and the head of tide in these reaches of the river, respectively.
The structure and variability of the salinity and DO distribution in estuaries also can be estimated using hydrodynamic models, which are discussed in the “Monitoring to Develop Hydrodynamic and Water-Quality Models in Narragansett Bay” section. The use of these models typically requires collection of data such as water-surface elevations, water temperature, and salinity at high temporal resolution (5- or 6-minute frequency) to simulate short-term processes whose concentrations can have wide spatial or temporal variations such as chlorophyll a and DO cycles. Collection of data that could be used to develop a model of the salt wedge in the Taunton River Estuary would require measurement of additional information such as channel bathymetry, river discharge, velocity, and turbidity (Ralston and others, 2008, 2010, 2017).
Monitoring to Assess Nutrient Loading to Mount Hope Bay and the Taunton River Estuary
Sources of nutrients to the Taunton River Estuary and Mount Hope Bay include effluent from wastewater treatment plants, agricultural runoff, stormwater runoff, groundwater seepage from septic systems, and atmospheric deposition. Excess nutrients in estuaries, particularly nitrogen, contribute to algal blooms, stimulate bacteria growth, and can lead to reduction in DO concentrations through increased respiration and decomposition of organic matter. Additional implications of excess nutrients include loss of critical habitats (aquatic vegetation such as eelgrass), macroalgae blooms, toxic algal blooms, alteration of benthic substrates and macroinvertebrate community structure, and loss or depletion of shellfisheries (Fisher and others, 2018). The Massachusetts SWQS include site-specific numeric criteria for nitrogen and phosphorus for certain waterbodies. Although generally applicable numeric nutrient criteria are not included in the Massachusetts SWQS, narrative criteria specify that waters “shall be free from nutrients in concentrations that would cause or contribute to impairment of existing or designated uses” (MassDEP, 2021b, p. CMR 80). MassDEP analysts rely on a variety of indicators of nutrient enrichment in a weight-of-evidence approach when assessing water-quality conditions (MassDEP, 2022).
Estimates of nutrient loading can be developed through direct sampling of surface waters coupled with flow data from streamgages. In a fixed-frequency sampling program, discrete samples are manually collected, and given sufficient years of sampling, a wide range of flow and water-quality conditions at a location can be collected. The USGS, in cooperation with MassDEP, collected water-quality and streamflow data during 2019–21 from the Taunton River Basin to provide a dataset of selected constituents that could be used for the general assessment of water-quality conditions and for the estimation of constituent loads from specific subdrainage basins (MassDEP, 2018). Data were collected from monitoring stations at or near four existing USGS streamgages (Taunton River near Bridgewater [station 01108000], Mill River at Spring Street at Taunton [station 01108410], Threemile River at North Dighton [station 01109060], and Segreganset River near Dighton [station 01109070]; fig. 2). The USGS collected discrete samples at these sites from January 2019 through December 2021. Discrete samples were collected monthly for phosphorus (including total phosphorus and orthophosphate) and nitrogen (including particulate nitrogen, total dissolved nitrogen, ammonia plus organic nitrogen, and nitrate plus nitrite). Continuous (15-minute) data were also collected at the Taunton River (01108000) and Mill River (01108410) stations from October 2019 through September 2020. Continuous water-quality constituents included water temperature, specific conductance, pH, and DO. Water-quality data for these stations are available in the USGS NWIS database (https://doi.org/10.5066/F7P55KJN). Data collected to support nitrogen loading estimates at these USGS streamgages in the Taunton River Basin provide the means to estimate the freshwater loads from about 75.5 percent of the total drainage area of the Taunton River Basin. The stations are above tidal effect, however, and loading from areas downstream from the streamgages to the estuary would be needed to estimate nutrient loads for the entire Taunton River basin (Codiga, 2021). Estimates of total nitrogen loads at a daily resolution for 2001–17 were derived by Codiga (2021) and used to investigate hypoxia in Narragansett Bay (Codiga, 2020b).
Another approach for estimating nutrient loading is through flow-proportional sampling or a combination of manual sampling and flow-proportional composite sampling. Composite samples are more cost effective and are less sensitive to environmental extremes (such as high-flow and low-flow conditions) than those collected at a single discrete point in time. Composite samples collected using an automated flow-proportional sampling approach capture daily variations and provide the high resolution needed to develop accurate concentration and loading information for different periods (such as a 4-day, biweekly, monthly, annual, or tidal period[s]). A combination of traditional manual discrete sampling and flow-proportional composite sampling has been determined to result in robust monthly and annual loading values that are less susceptible to extreme conditions and reduce uncertainties (Sorenson and others, 2018). Automated flow-proportional sampling at the Taunton River near Bridgewater (01108000; fig. 2) and at an additional streamgage in the Taunton River Estuary would be needed to provide estimates of monthly and annual nutrient loads from the freshwater part of the main stem and for the Taunton River Basin draining into Mount Hope Bay. This sampling could also potentially provide a better understanding of the circulation of nutrients between Mount Hope Bay and the Taunton River Estuary. A station equipped with automated flow-proportional sampling capability could be configured to collect two composite samples, with one composite representing the inflowing tide and the other the outflowing tide. Flow and water-quality data collected at a streamgage in the Taunton River Estuary could also be used to facilitate future water-quality modeling or to verify the performance of hydrodynamic models of Mount Hope Bay, as discussed in the next section.
Total nitrogen yield-duration plots, developed by Barbaro and Sorenson (2013), indicated that measured yields, in pounds per square mile per day, collected between 1997 and 2008 at lower flows from the Taunton River near Bridgewater (station 01108000) were substantially higher than threshold yields at higher flows (based on the 25th percentile concentration of 0.57 mg/L for EPA subecoregion 59). Furthermore, differences in total nitrogen yields were minor at the Taunton River near the Berkley Bridge (TR41), about 19 mi downstream in the middle of the Taunton River Estuary (figs. 2, 5, and 6; table 4). This pattern in total nitrogen yields indicates that point sources in surface water and diffuse sources in groundwater were the primary contributors of nitrogen during this 11-year period. Updating the water-use data in Massachusetts for freshwater and saline water withdrawals from groundwater and surface water and return flows from wastewater discharges would allow the Hydrological Simulation Program–FORTRAN (HSPF) model used in Barbaro and Sorenson (2013) to be updated and fully calibrated for the basin. Estimated streamflow output by the HSPF model could be used to estimate nitrogen loads at ungaged stations where sufficient water quality data have been collected.
Monitoring to Develop Hydrodynamic and Water-Quality Models in Mount Hope Bay and Taunton River Estuary
EPA guidelines specify the kinds of data and information that should be used when making decisions to list waters as impaired, and this information is not restricted to direct observations, such as water-quality monitoring data. Rather, waters can be listed if evaluations such as dilution calculations or predictive simulation models forecast nonattainment of water-quality standards. Because of the complex and site-specific nature of water-quality impairments (for example, excessive nutrients or low DO), predictive models have limited value in identifying impaired waters. Most modeling is carried out for waters where impairments have already been confirmed by actual water-quality or fecal indicator data; however, predictive models can be used in combination with field data to fully assess water-quality conditions and to derive acceptable contaminant loadings from point and nonpoint sources (Chen and others, 2008). Model results are considered in the CWA Section 303(d) listing process in cases where verified or quality-assured modeling forecast unconfirmed water-quality conditions.
Accurate simulation of water-quality conditions in estuaries typically requires a water-quality model coupled with a hydrodynamic model to evaluate the effects of physical characteristics such as tidal forcing, variable river discharge, and wind to simulate estuarine flushing, residence time, and other factors that affect the flow, transport, mixing, and dispersion of constituents (Warner and others, 2005; Ralston and others, 2010; Ganju and others, 2016). In many estuaries, stratification caused by differences in salinity and water temperature modifies the rates of vertical mixing, and thus, it is important to use models that can incorporate the effects of stratification on transport (Ganju and others, 2016). A three-dimensional hydrodynamic model is needed to simulate estuaries that are stratified or that have complex flows where vertical variations of variables are important.
Hydrodynamic models are driven by tidal, discharge, wave, and meteorological forcing and require considerable data to apply, calibrate, and validate simulations of estuaries. Input data to models include channel geometry and bathymetry data to describe the shape and depth of the estuary and substrate composition to estimate bed roughness. Boundary conditions for the seaward extent of the estuary must also be established to characterize semidiurnal tides, water temperature, salinity conditions, current velocities, and tide elevations (Abdelrhman, 2015). Hydrodynamic models for estuaries open to offshore waves such as Narragansett Bay also require wave simulation. Water-level and discharge information are needed at model boundaries and along the length of the estuary. Freshwater inflows to the estuary include discharge from rivers, riparian areas, groundwater, and discharges from WWTFs. Meteorological data are needed for variables such as precipitation, solar radiation, wind speed and direction, air temperature, atmospheric pressure, evaporation rate, and relative humidity. To model the structure and variability of the salinity distribution in estuaries, data are needed from continuous water-quality records together with data for water discharge, velocity, and turbidity. One or more stations would need to be equipped with an upward looking acoustic Doppler current profiler (ADCP) to collect data on current speed, direction, water temperature, and pressure. Velocity measurements at a fixed site should be supplemented by velocity profiles measured in a transect across the channel or estuary using a second ADCP operated at the water surface (Ralston and others, 2008, 2010).
Water-quality models coupled with hydrodynamic models are needed to assess ecosystem processes and interactions in estuaries and the dynamic feedbacks between biotic and physical processes that are important within estuarine systems such as the effect of nutrients on phytoplankton growth and oxygen production, sediment-water interactions (settling, resuspension, sediment nutrient release), and denitrification (Ganju and others, 2016; Dettmann and others, 2020). Coupled hydrodynamic and water-quality models can be used to simulate future scenarios and to evaluate alternatives for remedial action in response to nutrient loading, eutrophication, habitat loss, and freshwater diversion (Ganju and others, 2016).
Simulations generated by an updated hydrodynamic model coupled with a water-quality model would increase understanding of (1) the exchange of flow and, therefore, nutrients and algal blooms between Mount Hope Bay and the Taunton River Estuary and between Mount Hope Bay and Narragansett Bay, including the Sakonnet River; (2) the circulation patterns in Mount Hope Bay and in the Taunton River Estuary; (3) the residence time of water/particles in the Taunton River Estuary and Mount Hope Bay; and (4) the effect of freshwater inputs from the Taunton River Estuary on Mount Hope Bay water quality.
Several hydrodynamic models and water-quality models have been developed to investigate DO and nutrient issues in Narragansett Bay, and some of these models could be updated to improve model performance in the Mount Hope Bay region. The existing Regional Ocean Modeling System (ROMS) hydrodynamic model of Narragansett Bay (Kincaid and Rogers, 2009; Kincaid, 2012) could be refined to develop a more accurate model of Mount Hope Bay and the Taunton River Estuary. ROMS is a three-dimensional free surface terrain-following numerical model that solves finite-difference approximations of the Reynolds-averaged Navier-Stokes equations on a curvilinear orthogonal grid with vertical stretched terrain-following coordinates (Warner and others, 2005). The ROMS model requires continuous records of sea-level surface, water temperature, and salinity to parameterize the model; these data are available at selected locations and could be applied to model refinement. ROMS models also require further information regarding boundary conditions, advection schemes, turbulence parameterizations, and submodels (Fall and others, 2014). Sea-level elevation and velocity must be defined at open boundaries of the model, such as at the East Passage at the southwestern end of Mount Hope Bay and at the Sakonnet River narrows.
Data for development of ROMS models are typically collected at buoy stations or mooring arrays equipped with instruments such as bottom-mounted ADCP to measure velocity; vertical profiling units fitted with conductivity, water temperature, and depth sensors; optical backscatter sensors for measuring near-bottom and near-surface salinity and sediment concentrations; and pressure sensors for water level. Additional data may be collected by tilt current meters or from moving boat ADCP surveys. Although the ROMS models can be used to inform analysis of the movement of phytoplankton, zooplankton, and nitrogen, they do not have the capability to model water quality or ecological processes, and other models would be needed to provide these capabilities. The communication process between ROMS and other models is challenging and labor intensive.
An example of a linked hydrodynamic and water-quality model is the model of Narragansett Bay completed for the year 2009 by the EPA Atlantic Coastal Environmental Sciences Division (Abdelrhman, 2015, 2017; Rashleigh and others, 2015). The hydrodynamic model used for this modeling effort was the Environmental Fluid Dynamics Code (EFDC) model linked to a Water Quality Analysis Simulation Program (WASP) model, which was then used to simulate chlorophyll a, DO, and nitrogen in Narragansett Bay (Abdelrhman, 2015, 2017; Rashleigh and others, 2015; Dettmann and others, 2020; Knightes, 2023).
The ability of hydrodynamic models to represent physical processes depends on the spatial resolution. To account for the complex water movement and rapidly changing conditions within an estuary, hydrodynamic models typically require a fine grid (on the scale of tens of meters) and run on a short time step. For example, the model grid for the Narragansett Bay hydrodynamic model included 754 horizontal segments and 8 vertical layers (a total of 6,032 segments) with a typical segment size of 642 m in width and 1,218 m in length (Abdelrhman, 2015). The model was run for 365 days using a 120-second (2-minute) time step. This model grid for the Narragansett Bay hydrodynamic model is considered too coarse to be used to accurately simulate water quality in Mount Hope Bay and the Taunton River Estuary, but the model could be used to generate boundary conditions if a more refined model were to be developed (Brenda Rashleigh, Assistant Director for Water, U.S. Environmental Protection Agency, written commun., 2018). Predictions for a full-year simulation for the Narragansett hydrodynamic EFDC model took 13 hours on a desktop computer (Rashleigh and others, 2015). Once calibrated and validated, an EFDC model could be used to predict water-surface elevation at 2-hour increments, velocity distributions of surface and bottom velocities at 2-hour increments, bimonthly distributions of surface and bottom temperature, top and bottom salinity distribution at 2-hour increments, density gradient and stratification strength, and flushing time for the estuary. Other models that potentially could be used for simulating the Taunton River Estuary and Mount Hope Bay include Delft3D, and the Finite-Volume Community Ocean Model (FVCOM) (Zhao and others, 2006). These hydrodynamic models differ in many ways, including computational schemes (finite difference, finite element, finite volume) and grid resolution.
The continuous water-quality data collection in Mount Hope Bay and the Taunton River Estuary discussed in other sections of this report could be used to update and refine hydrodynamic and water-quality models. Note that the time step typically required for hydrodynamic models (2 minutes) or water-quality models (5–6 minutes) is more frequent than that used for water-quality data collection at buoys or streamgages, which is generally 15-minute data but could be configured to collect at higher frequencies with additional power sources. Water-quality data collected at buoy stations or mooring arrays would be more valuable for modeling efforts if the sites also are equipped with instruments such as a bottom-mounted ADCP to monitor water velocity and water-level data.
Summary
The U.S. Geological Survey (USGS), in cooperation with the Massachusetts Department of Environmental Protection (MassDEP), developed a water-quality monitoring strategy (WQMS) for Mount Hope Bay and the Taunton River Estuary in southeastern Massachusetts to address multiple management needs and the core requirements of the Clean Water Act. The WQMS was specifically designed to identify monitoring needed to meet five MassDEP management objectives:
-
1. Support MassDEP’s review of coastal and marine dissolved oxygen (DO) criteria,
-
2. Assess conditions within MassDEP waterbody assessment units (AUs) in Mount Hope Bay and the Taunton River Estuary with respect to selected Massachusetts Surface Water Quality Standards,
-
3. Assess conditions along the freshwater/saltwater interface (salt wedge) of the Taunton River Estuary and delineate the boundary between the freshwater and saltwater waterbody AUs,
-
4. Estimate data requirements needed to determine nutrient loads to Mount Hope Bay and the Taunton River Estuary, and
-
5. Evaluate data requirements needed to support hydrodynamic and water-quality models for Mount Hope Bay and the Taunton River Estuary.
The WQMS identifies 19 stations for monitoring concentrations of DO and nutrients in Mount Hope Bay and the Taunton River Estuary. Four of the stations are in the Cole and Lee River embayments adjacent to Mount Hope Bay, four are in Mount Hope Bay, one is in the Assonet River, nine are in the Taunton River Estuary, and one is in the Taunton River. Water-quality data collected at three long-term monitoring stations that are part of the Narragansett Bay Fixed Site Monitoring Network provide continuous water-quality data in Mount Hope Bay that would be complementary to the data provided by the monitoring stations identified in this report. Six water-quality constituents were identified for monitoring the health of the estuary. These include DO, nutrients (organic and inorganic nitrogen, phosphorus), dissolved silica, chlorophyll a, pH, and one or more measures of water clarity (Secchi depth, percentage transmission of photosynthetically active radiation, turbidity) or suspended solids (total suspended solids, total dissolved solids, total organic carbon) along with ancillary properties including specific conductance, salinity, and water temperature and physical properties including sensor depth, tidal water level, and river discharge.
Continuous DO data collected at the monitoring stations in Mount Hope Bay and the Taunton River Estuary proposed in the WQMS would provide an understanding of the temporal variability in DO concentrations, characterize the extent and duration of hypoxia, or low DO concentrations, and allow MassDEP to determine exceedances of the proposed chronic and acute coastal and marine DO criteria. Discrete sampling for nutrients and other water-quality indicators at the monitoring stations could be used by MassDEP to characterize the MassDEP AUs in Mount Hope Bay, the Cole and Lee River embayments, the Assonet River, and the Taunton River Estuary, and to report whether the assessment units meet Massachusetts Surface Water Quality Standards to the U.S. Environmental Protection Agency and the public. Salinity data collected at monitoring stations at selected reaches proposed in the WQMS would provide updated data on the location and movement of the salt front and the head of tide in the Taunton River. Water-quality data collected by the USGS from January 2019 through December 2021 at four USGS streamgages in Massachusetts (Taunton River near Bridgewater [station 01108000], Mill River at Spring Street at Taunton [station 01108410], Threemile River at North Dighton [station 01109060], and Segreganset River near Dighton [station 01109070]) can be used to calculate nutrient loads at these stations. If data are needed for hydrodynamic and water-quality models to assess nutrient and DO concentrations in the Taunton River Estuary and Mount Hope Bay, water-quality instrumentation at the continuous monitoring stations proposed in the WQMS could be configured to collect data at the higher frequencies needed by the models. The WQMS can be used to guide MassDEP’s approach for monitoring estuaries in Massachusetts and other coastal areas in Massachusetts and the northeastern United States facing similar environmental challenges.
References Cited
Abdelrhman, M.A., 2015, Three-dimensional modeling of hydrodynamics and transport in Narragansett Bay: Washington, D.C., U.S. Environmental Protection Agency, EPA/600/R–15/152, 175 p., accessed June 23, 2022, at https://cfpub.epa.gov/si/si_public_record_report.cfm?Lab=NHEERL&dirEntryId=308340.
Abdelrhman, M.A., 2017, Three-dimensional modeling of water quality and ecology in Narragansett Bay: Washington, D.C., U.S. Environmental Protection Agency, EPA/600/R–16/203, 139 p., accessed June 23, 2022, at https://cfpub.epa.gov/si/si_public_record_report.cfm?Lab=NHEERL&dirEntryId=339253.
Barbaro, J.R., and Sorenson, J.R., 2013, Nutrient and sediment concentrations, yields, and loads in impaired streams and rivers in the Taunton River Basin, Massachusetts, 1997–2008: U.S. Geological Survey Scientific Investigations Report 2012–5277, 89 p., accessed June 18, 2023, at https://doi.org/10.3133/sir20125277.
Barrett, S.B., Graves, B.C., and Blumeris, B., 2006, The Mount Hope Bay tidal restriction atlas—Identifying man-made structures which potentially degrade coastal habitats in Mount Hope Bay, Massachusetts: Northeastern Naturalist, v. 13, no. 4 (special issue), p. 31−46, accessed June 23, 2022, at https://www.jstor.org/stable/4130971?seq=1.
Benoit, J., and Fox-Kemper, B., 2021, Contextualizing thermal effluent impacts in Narragansett Bay using Landsat-derived surface temperature: Frontiers in Marine Science, v. 8, article 705204, 15 p., accessed December 9, 2022, at https://doi.org/10.3389/fmars.2021.705204.
Boucher, J.M., 1991, Nutrient and phosphorus geochemistry in the Taunton River Estuary, Massachusetts: [Narragansett, R.I.], University of Rhode Island, Ph.D. dissertation, 316 p., accessed June 23, 2022, at https://doi.org/10.23860/diss-boucher-joceline-1991.
Cantwell, M.G., King, J.W., Burgess, R.M., and Appleby, P.G., 2007, Reconstruction of contaminant trends in a salt wedge estuary with sediment cores dated using a multiple proxy approach: Marine Environmental Research, v. 64, no. 2, p. 225–246, accessed June 23, 2022, at https://doi.org/10.1016/j.marenvres.2007.01.004.
Chen, C., Zhao, L., Cowles, G., and Rothschild, B., 2008, Critical issues for circulation modeling of Narragansett Bay and Mount Hope Bay, chap. 9 of Desbonnet, A., and Costa-Pierce, B.A., eds., Science for ecosystem-based management—Narragansett Bay in the 21st century: New York, Springer, p. 281–300. [Also available at https://link.springer.com/chapter/10.1007/978-0-387-35299-2_9.]
City of Fall River, 2017, Executive summary for the draft integrated wastewater and stormwater master plan: City of Fall River Department of Community Utilities, 38 p., accessed November 30, 2022, at https://cms2.revize.com/revize/fallriver/Document%20Center/Departments/Water%20&%20Sewer/Sewer/IMP%20Executive%20Summary/IMP_Executive_Summary-1.pdf.
Codiga, D.L., 2020a, Daily resolution 2001–2017 time series of total nitrogen load to Narragansett Bay (RI/MA USA) from bay-wide treatment facility and watershed sources: Narragansett Bay Estuary Program technical report NBEP–20–231B, 34 p., accessed June 23, 2022, at http://neiwpcc.org/wp-content/uploads/2020/10/Codiga-NBEP-20-231B.pdf.
Codiga, D.L., 2020b, Further analysis and synthesis of Narragansett Bay (RI/MA USA) oxygen, chlorophyll, and temperature: Narragansett Bay Estuary Program technical report NBEP–20–231A, 161 p., accessed June 23, 2022, at https://neiwpcc.org/wp-content/uploads/2020/10/Codiga-NBEP-20-231A.pdf.
Codiga, D.L., 2021, Analysis and synthesis of eutrophication-related conditions in Narragansett Bay (RI/MA USA)—Updated through 2019: Narragansett Bay Estuary Program technical report NBEP–21–243, 127 p., accessed June 23, 2022, at https://doi.org/10.6084/m9.figshare.14830890.
Codiga, D.L., Stoffel, H.E., Deacutis, C.F., Kiernan, S., and Oviatt, C.A., 2009, Narragansett Bay hypoxic event characteristics based on fixed-site monitoring network time series—Intermittency, geographic distribution, spatial synchronicity, and interannual variability: Estuaries and Coasts, v. 32, no. 4, p. 621–641, accessed June 23, 2022, at https://doi.org/10.1007/s12237-009-9165-9.
Deacutis, C.F., Murray, D., Prell, W., Saarman, E., and Korhun, L., 2006, Hypoxia in the upper half of Narragansett Bay, RI, during August 2001 and 2002: Northeastern Naturalist, v. 13, no. 4 (special issue), p. 173–198, accessed June 23, 2022, at https://www.jstor.org/stable/4130977?seq=1.
Deleo, W., 2001, Investigation of the physical mechanisms controlling exchange between Mount Hope Bay and the Sakonnet River: [Narragansett, R.I.], University of Rhode Island, master’s thesis, 117 p., accessed June 23, 2022, at https://doi.org/10.23860/thesis-deleo-william-2001.
Desbonnet, A., and Costa-Pierce, B.A., eds., 2008, Science for ecosystem-based management—Narragansett Bay in the 21st century: New York, Springer, 570 p., accessed June 23, 2022, at https://doi.org/10.1007/978-0-387-35299-2.
Desbonnet, A., Lazinsky, D., Codi, S., Baisden, C., and Cleary, L., 1992, An action plan for the Taunton River Watershed—Assessment and recommendations: National Oceanic and Atmospheric Administration, prepared by the University of Massachusetts Boston, [variously paged; 97 p.], accessed June 23, 2022, at https://vc.bridgew.edu/taunton_riv_ref/2/.
Dettmann, E.H., Charlestra, L., and Abdelrhman, M.A., 2020, Seasonal and diel oxygen and phytoplankton dynamics in an estuarine water quality model: Narragansett, R.I., U.S. Environmental Protection Agency, EPA/600/R–18/378, 77 p., accessed June 23, 2022, at https://nepis.epa.gov/Exe/ZyPDF.cgi/P100YSKQ.PDF?Dockey=P100YSKQ.PDF.
Diaz, R.J., and Rosenberg, R., 1995, Marine benthic hypoxia—A review of its ecological effects and the behavioural responses of benthic macrofauna: Oceanography and Marine Biology—An Annual Review, v. 33, p. 245–303, accessed June 23, 2022, at https://www.researchgate.net/publication/236628341_Marine_benthic_hypoxia_A_review_of_its_ecological_effects_and_the_behavioural_response_of_benthic_m acrofauna.
Diaz, R.J., and Rosenberg, R., 2008, Spreading dead zones and consequences for marine ecosystems: Science, v. 321, no. 5891, p. 926–929, accessed June 23, 2022, at https://doi.org/10.1126/science.1156401.
Fall, K.A., Harris, C.K., Friedrichs, C.T., Rinehimer, J.P., and Sherwood, C.R., 2014, Model behavior and sensitivity in an application of the cohesive bed component of the community sediment transport modeling system for the York River Estuary, VA, USA: Journal of Marine Science and Engineering, v. 2, no. 2, p. 413–436, accessed June 23, 2022, at https://doi.org/10.3390/jmse2020413.
Fisher, S.C., Welk, R.J., and Finkelstein, J.S., 2018, Long Island South Shore Estuary Reserve Coordinated Water Resources Monitoring Strategy: U.S. Geological Survey Open-File Report 2017–1161, 105 p., accessed June 17, 2023, at https://doi.org/10.3133/ofr20171161.
Frimpter, M.H., 1973, Ground-water management, Taunton River basin, Massachusetts: U.S. Geological Survey Open-File Report 73–84, 35 p. [Also available at https://doi.org/10.3133/ofr7384.]
Ganju, N.K., Brush, M.J., Rashleigh, B., Aretxabaleta, A.L., del Barrio, P., Grear, J.S., Harris, L.A., Lake, S.J., McCardell, G., O’Donnell, J., Ralston, D.K., Signell, R.P., Testa, J.M., and Vaudrey, J.M.P., 2016, Progress and challenges in coupled hydrodynamic-ecological estuarine modeling: Estuaries and Coasts, v. 39, no. 2, p. 311–332, accessed June 23, 2022, at https://doi.org/10.1007/s12237-015-0011-y.
GeoSyntec Consultants, 2006, Five-year watershed action plan for the Taunton River watershed: Boston, Mass., Massachusetts Executive Office of Environmental Affairs, prepared by GeoSyntec Consultants, Acton, Mass., 67 p., accessed June 23, 2022, at https://vc.bridgew.edu/taunton_riv_ref/1.
Gibson, M.R., 1996, Comparison of trends in the finfish assemblage of Mt. Hope Bay and Narragansett Bay in relation to operations at the New England Power Brayton Point Station: Rhode Island Division Fish and Wildlife Research reference document 95/1, [variously paged; 43 p.], accessed December 23, 2022, at https://dem.ri.gov/sites/g/files/xkgbur861/files/programs/bnatres/marine/pdf/Gibson_BraytonPoint.pdf.
Hale, S.S., Cicchetti, G., and Deacutis, C.F., 2016, Eutrophication and hypoxia diminish ecosystem functions of benthic communities in a New England estuary: Frontiers in Marine Science, v. 3, article 249, 14 p., accessed June 23, 2022, at https://doi.org/10.3389/fmars.2016.00249.
Hicks, S.D., 2006, Understanding tides: U.S. Department of Commerce, National Oceanic and Atmospheric Administration and National Ocean Service, 66 p., accessed June 23, 2022, at https://tidesandcurrents.noaa.gov/publications/Understanding_Tides_by_Steacy_finalFINAL11_30.pdf.
Howes, B.L., and Samimy, R., 2007, Summary of water quality monitoring program for the Mount Hope Bay embayment system (2004–2006): Dartmouth, Mass., University of Massachusetts-Dartmouth, School of Marine Science and Technology, 78 p., accessed September 22, 2020, at https://yosemite.epa.gov/oa/eab_web_docket.nsf/Attachments%20By%20ParentFilingId/DF70AFDDE7E11EF485257E6500529691/$FILE/ExJ_MtHopeBay_604bReport_FINAL 081607.pdf.
Howes, B.L., Samimy, R., and Dudley, B., 2003, Site-specific nitrogen thresholds for southeastern Massachusetts embayments—Critical indicators, interim report: Massachusetts Department of Environmental Protection, 25 p., accessed May 19, 2022, at https://yosemite.epa.gov/OA/EAB_WEB_Docket.nsf/Verity%20View/DE93FF445FFADF1285257527005AD4A9/$File/Memorandum%20in%20Opposition%20...89.pdf.
Kincaid, C., 2006, The exchange of water through multiple entrances to the Mount Hope Bay estuary: Northeastern Naturalist, v. 13, no. 4 (special issue), p. 117–144, accessed June 23, 2022, at https://www.jstor.org/stable/4130975?seq=1.
Kincaid, C., 2012, The development and application of the Full Bay ROMS hydrodynamic model for simulations of chemical transport with multiple freshwater sources: Narragansett, R.I., University of Rhode Island, Graduate School of Oceanography, [variously paged; 100 p.], accessed June 23, 2022, at http://snapshot.narrabay.com/Services/MossFile.ashx?file=/s/emda/snapshot/Documents/Publications/Modeling%20Project/2012-11_NBC_roms_dye_report_draft1 6.pdf.
Kincaid, C., and Rogers, J., 2009, ROMS hydrodynamic-transport model development for the Providence and Seekonk Rivers—Final report: Narragansett, R.I., University of Rhode Island, [variously paged; 43 p.], accessed June 23, 2022, at http://snapshot.narrabay.com/Services/MossFile.ashx?file=/s/emda/snapshot/Documents/Publications/Modeling%20Project/2009_Kincaid_Rogers_Final_Report.p df.
Knightes, C.D., 2023, Simulating hypoxia in a New England estuary—WASP8 Advanced Eutrophication Module (Narragansett Bay, RI, USA): Water, v. 15, no. 6, accessed August 21, 2024, at https://doi.org/10.3390/w15061204.
Krahforst, C., and Carullo, M., 2008, An ecosystem-based perspective of Mount Hope Bay, chap. 13 of Desbonnet, A., and Costa-Pierce, B.A., eds., Science for ecosystem-based management—Narragansett Bay in the 21st century: New York, Springer, p. 383–417, accessed June 23, 2022, at https://doi.org/10.1007/978-0-387-35299-2_13.
Lapham, W.W., 1988, Yield and quality of ground water from stratified-drift aquifers, Taunton River basin, Massachusetts: U.S. Geological Survey Water-Resources Investigations Report 86–4053, 69 p., 2 pls. [Also available at https://doi.org/10.3133/wri864053.]
Marine Research, Inc., 1983, Final report Taunton River Estuary study, May 1982–April 1983, Volume II—Appendices: Falmouth, Mass., Marine Research, Inc., [variously paged; 206 p.], accessed June 18, 2023, at https://archives.lib.state.ma.us/bitstream/handle/2452/834174/ocm74725174-v2.pdf?sequence=1&isAllowed=y.
Massachusetts Department of Environmental Protection [MassDEP], 2001, Appendix A—Taunton River watershed DWM year 2001 water quality monitoring data: Massachusetts Department of Environmental Protection Technical Memorandum TM–62–6, [variously paged; 45 p.], accessed June 23, 2022, at https://www.mass.gov/doc/taunton-river-watershed-2001-water-quality-assessment-report-appendices-0/download.
Massachusetts Department of Environmental Protection [MassDEP], 2009, Narragansett and Mount Hope Bay watersheds 2004–2008 water-quality assessment report: Massachusetts Department of Environmental Protection report 61/53–AC–2, 51 p., accessed June 23, 2022, at https://archives.lib.state.ma.us/bitstream/handle/2452/264357/ocn319062229.pdf?sequence=1&isAllowed=y.
Massachusetts Department of Environmental Protection [MassDEP], 2010, Final pathogen TMDL for the Narragansett/Mt. Hope Bay watershed July 2010: Massachusetts Department of Environmental Protection, CN no. 351.0, Report no. 61–TMDL–2, 102 p., accessed June 23, 2022, at https://www.mass.gov/doc/final-pathogen-tmdl-for-the-narragansettmt-hope-bay-watershed/download.
Massachusetts Department of Environmental Protection [MassDEP], 2011, Final pathogen TMDL for the Taunton River watershed June 2011: Massachusetts Department of Environmental Protection, CN 0256.0, 102 p., accessed June 23, 2022, at https://www.mass.gov/doc/final-pathogen-tmdl-report-for-the-taunton-watershed-0/download.
Massachusetts Department of Environmental Protection [MassDEP], 2012, Taunton River watershed 2006 DWM water quality monitoring data: Massachusetts Department of Environmental Protection technical memorandum CN 234.1, 103 p., accessed June 23, 2022, at https://www.mass.gov/doc/technical-memorandum-cn-2341-taunton-river-watershed-2006-dwm-water-quality-monitoring-data/download.
Massachusetts Department of Environmental Protection [MassDEP], 2018, A strategy for monitoring and assessing the quality of Massachusetts’ waters to support multiple water resource management objectives 2016–2025: Massachusetts Department of Environmental Protection, CN 203.5, 57 p., accessed June 23, 2022, at https://www.mass.gov/doc/water-quality-monitoring-strategy-2016-2025/download.
Massachusetts Department of Environmental Protection [MassDEP], 2020, Mount Hope Bay buoy data report—2017 and 2018 fixed-site continuous monitoring: Massachusetts Department of Environmental Protection, CN 530.0, 31 p., accessed November 29, 2022, at https://www.mass.gov/doc/technical-memorandum-cn-5300-mount-hope-bay-buoy-data-report/download.
Massachusetts Department of Environmental Protection [MassDEP], 2021a, Appendix 24—Taunton River watershed assessment and listing decision summary—Final Massachusetts integrated list of waters for the Clean Water Act 2018/2020 reporting cycle: Massachusetts Department of Environmental Protection, CN 505.1, 199 p., accessed May 10, 2022, at https://www.mass.gov/doc/20182020-integrated-list-of-waters-appendix-24-taunton-river-watershed-assessment-and-listing-decision-summary/download.
Massachusetts Department of Environmental Protection [MassDEP], 2021b, 314 CMR 4.00—Massachusetts Surface Water Quality Standards: Massachusetts Department of Environmental Protection, 179 p., accessed September 14, 2022, at https://www.mass.gov/doc/314-cmr-400/download.
Massachusetts Department of Environmental Protection [MassDEP], 2022, Massachusetts Consolidated Assessment and Listing Methodology (CALM) guidance manual for the 2022 reporting cycle: Massachusetts Department of Environmental Protection, CN 564.0, 81 p., 11 app., accessed June 19, 2023, at https://www.mass.gov/doc/2022-consolidated-assessment-and-listing-methodology-guidance/download.
Massachusetts Department of Environmental Protection [MassDEP], 2023, Final Massachusetts integrated list of waters for the Clean Water Act 2022 reporting cycle: Massachusetts Department of Environmental Protection, CN 568.0, 216 p., accessed June 25, 2023, at https://www.mass.gov/doc/final-massachusetts-integrated-list-of-waters-for-the-clean-water-act-2022-reporting-cycle/download.
Massachusetts Department of Environmental Quality Engineering [MDEQE], 1982, Lower Taunton River basin, 1981 water quality surveys: Massachusetts Department of Environmental Quality Engineering report no. 13204–53–50–5–83–CR, 53 p., accessed June 23, 2022, at https://archives.lib.state.ma.us/bitstream/handle/2452/833065/ocm%ef%bb%bf10566261.pdf?sequence=1&isAllowed=y.
Mustard, J.F., Carney, M.A., and Sen, A., 1999, The use of satellite data to quantify thermal effluent impacts: Estuarine, Coastal and Shelf Science, v. 49, no. 4, 509–524, accessed June 23, 2022, at https://doi.org/10.1006/ecss.1999.0517.
Narragansett Bay Commission [NBC], 2019, Narragansett Bay Commission 2018 data report: Narragansett Bay Commission, Environmental Monitoring and Data Analysis Section, [variously paged; 186 p.], accessed June 23, 2022, at https://www.narrabay.com/media/1807/2018_data_report.pdf.
Narragansett Bay Estuary Program [NBEP], 2017, State of Narragansett Bay and its watershed: Providence, R.I., Narragansett Bay Estuary Program, 499 p., accessed June 23, 2022, at https://www.nbep.org/state-of-the-bay#technical-reports.
National Oceanic and Atmospheric Administration [NOAA], 2023, Chart 13226 Mount Hope Bay: National Oceanic and Atmospheric Administration, Office of Coast Survey, 1 sheet, scale 1:20,000, accessed June 27, 2023, at https://www.charts.noaa.gov/OnLineViewer/13226.shtml.
Nixon, S.W., Granger, S.L., and Nowicki, B.L., 1995, An assessment of the annual mass balance of carbon, nitrogen, and phosphorus in Narragansett Bay: Biogeochemistry, v. 31, no. 1, p. 15–61, accessed June 23, 2022, at https://doi.org/10.1007/BF00000805.
Oczkowski, A., Schmidt, C., Santos, E., Miller, K., Hanson, A., Cobb, D., Krumholz, J., Pimenta, A., Heffner, L., Robinson, S., Chaves, J., and McKinney, R., 2018, How the distribution of anthropogenic nitrogen has changed in Narragansett Bay (RI, USA) following major reductions in nutrient loads: Estuaries and Coasts, v. 41, no. 8, p. 2260–2276, accessed June 23, 2022, at https://doi.org/10.1007/s12237-018-0435-2.
Oviatt, C., Smith, L., Krumholz, J., Coupland, C., Stoffel, H., Keller, A., McManus, M.C., and Reed, L., 2017, Managed nutrient reduction impacts on nutrient concentrations, water clarity, primary production, and hypoxia in a north temperate estuary: Estuarine, Coastal and Shelf Science, v. 199, p. 25–34, accessed June 23, 2022, at https://doi.org/10.1016/j.ecss.2017.09.026.
Oviatt, C., Stoffel, H.E., Huizenga, K., Reed, L., Codiga, D.L., and Fields, L., 2022, A tale of two spring blooms in a northeast estuary of the USA—How storms impact nutrients, multiple trophic levels, and hypoxia: Hydrobiologia, v. 849, no. 5, p. 1131–1148, accessed June 23, 2022, at https://doi.org/10.1007/s10750-021-04768-7.
Pinckney, J.L., Paerl, H.W., Tester, P., and Richardson, T.L., 2001, The role of nutrient loading and eutrophication in estuarine ecology: Environmental Health Perspectives, v. 109, supplement 5, p. 699–706, accessed June 23, 2022, at https://www.jstor.org/stable/pdf/3454916.pdf.
Prell, W.L., Murray, D.W., and Howell, P., 2015, Reanalysis of the Narragansett Bay spatial survey (day trippers) water column data for temperature, salinity, density, and dissolved oxygen (2005 to 2013): Narragansett Bay Estuary Program, NBEP–15–128, 26 p., accessed June 17, 2023, at https://static1.squarespace.com/static/5eea260cea828333324dba1c/t/5f96d79d40312d5914065cfc/1603721118803/NBEP-15-128.pdf.
Ralston, D.K., Cowles, G.C., Geyer, W.R., and Holleman, R.C., 2017, Turbulent and numerical mixing in a salt wedge estuary—Dependence on grid resolution, bottom roughness, and turbulence closure: Journal of Geophysical Research, v. 122, no. 1, p. 692–712, accessed June 23, 2022, at https://doi.org/10.1002/2016JC011738.
Ralston, D.K., Geyer, W.R., and Lerczak, J.A., 2008, Subtidal salinity and velocity in the Hudson River Estuary—Observations and modeling: Journal of Physical Oceanography, v. 38, no. 4, p. 753–770, accessed June 23, 2022, at https://doi.org/10.1175/2007JPO3808.1.
Ralston, D.K., Geyer, W.R., and Lerczak, J.A., 2010, Structure, variability, and salt flux in a strongly forced salt wedge estuary: Journal of Geophysical Research, v. 115, no. C6, 21 p., accessed June 23, 2022, at https://doi.org/10.1029/2009JC005806.
Raposa, K.B., and Schwartz, M.L., eds., 2007, An ecological profile of the Narragansett Bay National Estuarine Research Reserve: Narragansett, R.I., Narragansett Bay National Estuarine Research Reserve, 176 p., accessed October 1, 2020, at https://www.researchgate.net/profile/Kenneth_Raposa/publication/283721727_An_Ecological_Profile_of_the_Narragansett_Bay_National_Estuarine_Research_Re serve/links/5644da5b08aef646e6cbf208/An-Ecological-Profile-of-the-Narragansett-Bay-National-Estuarine-Research-Reserve.pdf.
Raposa, K.B., and Schwartz, M.L., eds., 2009, An ecological profile of the Narragansett Bay National Estuarine Research Reserve: Narragansett, R.I., Narragansett Bay National Estuarine Research Reserve, 176 p., accessed June 23, 2022, at https://coast.noaa.gov/data/docs/nerrs/Reserves_NAR_SiteProfile_Ch1-7.pdf and https://coast.noaa.gov/data/docs/nerrs/Reserves_NAR_SiteProfile_Ch8-13.pdf.
Rashleigh, B., Walker, H., and Gleason, T., 2015, Quantitative models describing past and current nutrient fluxes and associated ecosystem level responses in the Narragansett Bay ecosystem: U.S. Environmental Protection Agency, EPA/600/R–15/174, 50 p., accessed June 23, 2022, at https://cfpub.epa.gov/si/si_public_record_report.cfm?Lab=NHEERL&dirEntryId=309504.
Rhode Island Department of Environmental Management [RIDEM], 2010, Total maximum daily load study for bacteria—Mount Hope Bay and the Kickamuit River Estuary: Rhode Island Department of Environmental Management, Office of Water Resources, Surface Water Protection Section, 88 p., accessed September 23, 2020, at http://www.dem.ri.gov/programs/benviron/water/quality/rest/pdfs/mthope.pdf.
Rhode Island Department of Environmental Management [RIDEM], 2021, Final 2018–2020 delisting document waterbody impairments removed from the impaired waters lists: Rhode Island Department of Environmental Management, Office of Water Resources, 26 p., accessed April 14, 2023, at https://dem.ri.gov/sites/g/files/xkgbur861/files/programs/benviron/water/quality/pdf/iwlr1820.pdf.
Rojko, A.M., Tamul, S.D., and Kennedy, L.E., 2005, Taunton River watershed, 2001 water quality assessment report: Massachusetts Department of Environmental Protection report no. 62–AC–1, 24 p., accessed June 23, 2022, at https://www.mass.gov/doc/taunton-river-watershed-2001-water-quality-assessment-report-executive-summary/download.
Rountree, R., Borkman, D., Brown, W., Fan, Y., Goodman, L., Howes, B., Rothschild, B., Sundermeyer, M., and Turner, J., 2003, Framework for formulating the Mt. Hope Bay natural laboratory—A synthesis and summary: University of Massachusetts Dartmouth, School for Marine Science and Technology, SMAST Technical Report no. SMAST–03–0501, 306 p., accessed June 23, 2022, at http://www.fishecology.org/cv/MHBFactfinding6aug03.pdf.
Rountree, R.A., and MacDonald, D.G., 2006, Introduction to the special issue—Natural and anthropogenic influences on the Mount Hope Bay ecosystem: Northeastern Naturalist, v. 13, no. 4 (special issue), p. 1–26, accessed June 23, 2022, at https://www.jstor.org/stable/4130969.
Saarman, E., Prell, W.L., Murray, D.W., and Deacutis, C.F., 2008, Summer bottom water dissolved oxygen in Upper Narragansett Bay, chap. 11 of Desbonnet, A., and Costa-Pierce, B.A., eds., Science for ecosystem-based estuarine management—Narragansett Bay in the 21st century: New York, Springer, p. 325–347, accessed June 23, 2022, at https://link.springer.com/content/pdf/10.1007%2F978-0-387-35299-2.pdf.
Savenije, H.H.G., 2005, Salinity and tides in alluvial estuaries: Boston, Mass., Elsevier, 194 p., accessed June 23, 2022, at https://www.sciencedirect.com/book/9780444521071/salinity-and-tides-in-alluvial-estuaries.
Sorenson, J.R., Granato, G.E., and Smith, K.P., 2018, Nutrient and metal loads estimated by using discrete, automated, and continuous water-quality monitoring techniques for the Blackstone River at the Massachusetts-Rhode Island State line, water years 2013–14: U.S. Geological Survey Scientific Investigations Report 2017–5094, 41 p. [Also available at https://doi.org/10.3133/sir20175094.]
Spaulding, M.L., and Swanson, C., 2008, Circulation and transport dynamics in Narragansett Bay, chap. 8 of Desbonnet, A., and Costa-Pierce, B.A., eds, Science for ecosystem-based management—Narragansett Bay in the 21st century: New York, Springer, p. 233–280, accessed June 23, 2022, at https://doi.org/10.1007/978-0-387-35299-2_8.
Spaulding, M.L., and White, F.M., 1990, Circulation dynamics in Mt. Hope Bay and the lower Taunton River, in Cheng, R.T., ed., Residual currents and long-term transport: New York, Springer, p. 494–510. [Also available at https://doi.org/10.1007/978-1-4613-9061-9_34.]
Taunton Wild & Scenic River Study Committee, 2005, Taunton River stewardship plan—Taunton River Wild & Scenic River Study: National Park Service, Northeast Region, Taunton River Watershed Project reference documents, item 6, 186 p., accessed June 23, 2022, at https://vc.bridgew.edu/taunton_riv_ref/6.
Trench, E.C.T., 2005, The Thames science plan—Suggested hydrologic investigations to support nutrient-related water-quality improvements in the Thames River Basin, Connecticut: U.S. Geological Survey Open-File Report 2005–1208, 47 p. [Also available at https://doi.org/10.3133/ofr20051208.]
Uncles, R.J., 2002, Estuarine physical processes research—Some recent studies and progress: Estuarine, Coastal and Shelf Science, v. 55, no. 6, p. 829–856, accessed June 23, 2022, at https://doi.org/10.1006/ecss.2002.1032.
U.S. Court of Appeals for the First Circuit, 2018, City of Taunton, Massachusetts, v. U.S. Environmental Protections Agency: U.S. Court of Appeals for the First Circuit Court petition no. 16–2280, July 9, 2018, 46 p., accessed June 23, 2022, at https://cases.justia.com/federal/appellate-courts/ca1/16-2280/16-2280-2018-07-09.pdf?ts=1531166405.
U.S. Environmental Protection Agency [EPA], 2000, Ambient aquatic life water quality criteria for dissolved oxygen (saltwater)—Cape Cod to Cape Hatteras: Washington, D.C., U.S. Environmental Protection Agency, EPA–822–R–00–012, [variously paged; 140 p.], accessed December 27, 2022, at https://www.epa.gov/sites/production/files/2018-10/documents/ambient-al-wqc-dissolved-oxygen-cape-code.pdf.
U.S. Environmental Protection Agency [EPA], 2001, Nutrient criteria technical guidance manual—Estuarine and coastal marine waters: U.S. Environmental Protection Agency, EPA–822–B–01–003, [variously paged; 362 p.], accessed December 27, 2022, at https://www.epa.gov/sites/default/files/2018-10/documents/nutrient-criteria-manual-estuarine-coastal.pdf.
U.S. Environmental Protection Agency [EPA], 2002a, Consolidated assessment and listing methodology—Toward a compendium of best practices: U.S. Environmental Protection Agency, [variously paged], accessed June 23, 2022, at https://archive.epa.gov/water/archive/web/html/calm.html.
U.S. Environmental Protection Agency [EPA], 2002b, Developing and implementing an estuarine water quality monitoring, assessment, and outreach program—The MYSound Project: U.S. Environmental Protection Agency, EPA/625/R–02/010, [variously paged; 81 p.], accessed May 5, 2020, at https://nepis.epa.gov/Exe/ZyPDF.cgi/30004IUR.PDF?Dockey=30004IUR.PDF.
U.S. Environmental Protection Agency [EPA], 2003a, Ambient water quality criteria for dissolved oxygen, water clarity and chlorophyll a for the Chesapeake Bay and its tidal tributaries: U.S. Environmental Protection Agency, EPA 903–R–03–002, [variously paged; 343 p.], accessed December 27, 2022, at https://d38c6ppuviqmfp.cloudfront.net/content/publications/cbp_13142.pdf.
U.S. Environmental Protection Agency [EPA], 2003b, Responses to comments, public review of Brayton Point station, NPDES permit no. MA0003654: Boston, Mass., U.S. Environmental Protection Agency, [variously paged; 375 p.], accessed December 23, 2022, at https://www3.epa.gov/region1/npdes/braytonpoint/pdfs/finalpermit/ResponsesToComments.pdf.
U.S. Environmental Protection Agency [EPA], 2006, Draft National Pollutant Discharge Elimination System (NPDES) permit to discharge to waters of the United States: Boston, Mass., U.S. Environmental Protection Agency, Region 1, 52 p., accessed June 6, 2023, at https://www3.epa.gov/region1/npdes/permits/2006/finalma0002241fs.pdf.
U.S. Environmental Protection Agency [EPA], 2016, Green infrastructure implementation in Fall River, Massachusetts: U.S. Environmental Protection Agency, EPA 832–R–16–002, [variously paged; 61 p.], accessed June 17, 2023, at https://www.epa.gov/sites/production/files/2016-06/documents/epa-gi_fall_river_final-508.pdf.
U.S. Environmental Protection Agency [EPA], 2020, EPA review of Massachusetts’ 2016 Section 303(d) list: Boston, Mass., U.S. Environmental Protection Agency, Region 1, 94 p., accessed June 6, 2023, at https://www.epa.gov/sites/default/files/2020-01/documents/2016-ma-303d-approval-docs.pdf.
U.S. Geological Survey, 2023, National Hydrography Dataset: U.S. Geological Survey digital data, accessed July 2023 at https://www.usgs.gov/national-hydrography/national-hydrography-dataset.
Vaquer-Sunyer, R., and Duarte, C.M., 2008, Thresholds of hypoxia for marine biodiversity: Proceedings of the National Academy of Sciences of the United States of America, v. 105, no. 40, p. 15452–15457, accessed June 23, 2022, at https://doi.org/10.1073/pnas.0803833105.
Wandle, S.W., and Keezer, G.R., 1984, Gazetteer of hydrologic characteristics of streams in Massachusetts—Taunton and Ten Mile River basins and coastal river basins of Mount Hope Bay, Narragansett Bay, and Rhode Island Sound: U.S. Geological Survey Water-Resources Investigations Report 84–4283, 42 p. [Also available at https://doi.org/10.3133/wri844283.]
Warner, J.C., Geyer, W.R., and Lerczak, J.A., 2005, Numeric modeling of an estuary—A comprehensive skill assessment: Journal of Geophysical Research, v. 110, no. C5, 13 p., accessed June 23, 2022, at https://doi.org/10.1029/2004JC002691.
Williams, J.R., 1968, Availability of ground water in the northern part Tenmile and Taunton River basins, southeastern Massachusetts: U.S. Geological Survey Hydrologic Atlas 300, scale 1:48,000, accessed June 23, 2022, at https://doi.org/10.3133/ha300.
Williams, J.R., Farrell, D.F., and Willey, R.E., 1973, Water resources of the Taunton River basin, southeastern Massachusetts: U.S. Geological Survey Hydrologic Atlas 460, scale 1:48,000. [Also available at https://doi.org/10.3133/ha460.]
Williams, J.R., and Willey, R.E., 1973, Bedrock topography and texture of unconsolidated deposits, Taunton River basin, southeastern Massachusetts: U.S. Geological Survey Miscellaneous Geologic Investigations Map I–742, scale 1:48,000. [Also available at https://doi.org/10.3133/i742.]
Zhao, L., Chen, C., and Cowles, G., 2006, Tidal flushing and eddy shedding in Mount Hope Bay and Narragansett Bay—An application of FVCOM: Journal of Geophysical Research, v. 111, article C10015, 16 p., accessed June 23, 2022, at https://agupubs.onlinelibrary.wiley.com/doi/10.1029/2005JC003135.
Appendix 1. Current (2023) Water-Resource and Environmental Monitoring and Sample Collection Programs
References Cited
Rhode Island Department of Environmental Management [RIDEM], 2021, Bay Water Quality Report: Rhode Island Department of Environmental Management web page, accessed June 23, 2022, at http://www.dem.ri.gov/programs/emergencyresponse/bart/latest.php.
U.S. Geological Survey, 2021, USGS water data for the Nation: U.S. Geological Survey National Water Information System database, accessed September 17, 2020, at https://doi.org/10.5066/F7P55KJN.
Appendix 2. Water-Quality Indicators
Chemical Constituents
Dissolved oxygen (in milligrams per liter and percent saturation).—DO is measured as a field parameter in vertical profiles and by continuous sampling. To read accurately, optical DO probes generally require moving water and a wiper on the sonde to keep sensors clean of biofouling when deployed for continuous monitoring. DO is measured as a concentration (in milligrams per liter) and is also reported as the percentage of saturation, the amount of oxygen in the water relative to a theoretical maximum (about 7–9 milligrams per liter at temperatures of 20 to 30 degrees Celsius during summer and 14 milligrams per liter at temperatures near 0 degrees Celsius in colder months). Calculations of percentage of saturation require concurrent measurements of barometric pressure, water temperature, and salinity. DO generally has daily variations with peaks in late afternoon because of production of oxygen by algae and minima at dawn because of respiration (consumption) of oxygen at night by algae and other organisms in the water and bottom sediments. During the day, when algae are photosynthesizing, oxygen can be produced faster than it escapes into the atmosphere, leading to short-term saturation levels of greater than 100 percent (supersaturation). Temperature and salinity also affect DO concentration. Warmer water cannot dissolve as much oxygen as colder water, and the solubility of oxygen decreases as temperature and salinity increase. Deeper waters naturally have lower DO than surface waters because of restricted mixing and decomposition in bottom sediments. DO concentrations at depth can be exacerbated by nutrient-fueled algal blooms that die and sink into bottom waters where bacteria and other decomposer organisms break down the organic matter, using oxygen in the process.
Nutrient concentrations (organic and inorganic nitrogen and phosphorus, and dissolved silica, in milligrams per liter).—Nutrient concentrations are measured in the laboratory from discrete water-quality samples. Total dissolved nitrogen and total dissolved phosphorus are the most important components of nitrogen and phosphorus to measure regarding eutrophication. The diversity of nitrogen species and their distributions between dissolved and particulate phases complicates sample collection and laboratory analyses required to measure their concentrations, transport, and cycling in environmental aquatic systems (Rus and others, 2013). Commonly measured nitrogen analytes include organic nitrogen, ammonia, nitrate, and nitrite; total nitrogen is determined as the sum of these analytes. Ammonia nitrogen is particularly important because it can exert a high biochemical oxygen demand and can be toxic to aquatic organisms under certain conditions. Ammonia toxicity in sea water increases when the pH of sea water is lowered, in contrast to freshwater where toxicity increases with increasing pH (Eddy, 2005). Ammonia is the primary form of sewage-derived nitrogen and is also generated from the decomposition of organic nitrogen. It can also be formed when nitrites and nitrates are reduced. Nitrite is an intermediate product in the oxidation product of ammonia or the microbial reduction of nitrate. It has a low oxygen demand and is rapidly converted to nitrate. The presence of nitrite usually indicates that active decomposition is taking place. Nitrate is important because it is the end-product of the aerobic decomposition of nitrogenous matter; nitrogen in this form is readily available to plants.
Long-term trends in nitrogen are important to understand the effects of wastewater treatment facility upgrades. Monthly discrete samples only provide a limited amount of information on nutrient variation. Nitrate can be measured continuously by use of optical sensors such as a Submersible Ultraviolet Nitrate Analyzer V2 nitrate sensor or similar equipment. Fouling can cause the Submersible Ultraviolet Nitrate Analyzer V2 sensors to read erroneously high, so a wiper should be used with these sensors. Salinity and turbidity affect sensor results, so proper setting configuration and calibration of these sensors is also critical for their use in estuaries.
Nutrients can vary considerably in estuaries, spatially and temporally. High amounts of nutrients heighten productivity, stimulate bacteria growth, and cause eutrophication through stimulation of algal blooms. A comparison of nitrogen to phosphorus ratios to the Redfield ratio (16:1; Redfield and others, 1963) can indicate which nutrients are limiting for seasonal phytoplankton growth. Phytoplankton production in estuary systems and coastal waters is typically limited by nitrogen availability whereas productivity in freshwater systems is typically phosphorus limited (Howarth and Marino, 2006). Phosphorous plays a limited role in algal blooms in estuaries, but phosphorus can contribute to eutrophication in estuaries if overlying waters become anoxic and phosphorus in estuarine sediments is released back into the water column.
Silica is considered an essential nutrient to diatoms, which use it as a component of their cell walls. The amount of silica relative to nitrogen and phosphorus in estuaries and coastal waters is an important factor dictating the productivity of diatoms. Diatoms accumulate silica in the same proportion as nitrogen and can draw down dissolved silica concentrations in the water column to near zero during high growth periods, producing a silica-limited system (Carey and Fulweiler, 2014; Williams and others, 2022). Imbalances in the ratios of nitrogen, phosphorus, and dissolved silicon may affect cyanobacteria blooms (Davidson and others, 2012).
pH (in standard units).—The pH of water, a measure of how acidic (or basic) water is, is measured on a log scale ranging from 0 to 14 standard units (SU). A pH of 7 SU is considered neutral, and most organisms tolerate a range of 5.5 to 8.5 SU. Sharp variations outside of this range can be detrimental. Because most aquatic plants and animals are adapted to a specific range of pH and alkalinity, pH is important to ecosystem health. Eutrophication can contribute to coastal acidification. Excess nutrients fuel algae and phytoplankton growth, and microbial degradation of this organic matter produces carbon dioxide, which enters the water and forms carbonic acid and dissociates into bicarbonate ions, carbonate ions, and hydrogen ions that cause acidification (Wallace and others, 2014).
The pH in estuaries generally fluctuates on a daily cycle because of chemical processes associated with photosynthesis, particularly in low-salinity waters that are poorly buffered. The pH will typically rise during the day (to levels sometimes exceeding 8.4 SU) and decline during the night (to levels of about 7 SU; Pimenta and Grear, 2018). Moderate to high salinities usually buffer pH in the range of 7 to 8 SU. This buffering capacity of seawater generally protects estuaries and coastal waters against pH changes large enough to affect organisms, so pH is not generally used as a water-quality indicator in coastal waters (Sheldon and Alber, 2011).
Physicochemical Properties
Water temperature (in degrees Celsius).—Water temperature is an important habitat characteristic and undergoes wide variations seasonally. Shallower waters warm more quickly, and warmer waters encourage phytoplankton growth. Temperature also controls rates of chemical reactions and the solubility of gases in estuarine water. For example, increased temperature decreases the level of oxygen that can be dissolved in the water column. Water temperature typically plays a major role in the timing and severity of hypoxia events. Temperature also is an important moderator of biological processes in estuaries and affects the rate of plant photosynthesis, the metabolic rates of aquatic organisms, and the sensitivity of organisms to toxic wastes, parasites, diseases, and other stresses (U.S. Environmental Protection Agency, 2012).
Salinity (in parts per thousand or practical salinity units).—Salinity is the total concentration of dissolved ions in water. The major ions in seawater are chloride, sodium, magnesium, sulfate, calcium, potassium, bicarbonate, and bromide. Freshwater generally has a salinity value of less than 0.5 part per thousand (ppt) whereas seawater has an average salinity of 35 ppt. Salinity was traditionally measured in parts per thousand (or 0/00) based on chloride concentrations, but when determined from specific conductance, salinity is reported in practical salinity units. The calculation of salinity from specific conductance requires information on water temperature (in degrees Celsius). Salinity controls the type of species that can live in an estuary and affects physical and chemical processes. For example, oxygen solubility decreases as salinity increases.
Specific conductance (in microsiemens per centimeter or millisiemens per centimeter).—Specific conductance is a measure of a water sample’s capacity to convey an electrical current at 25 degrees Celsius and is an indicator of total dissolved solids (Hem, 1985; U.S. Geological Survey, 2019). It is dependent on temperature and the concentration of ionized substances in the water. Specific conductance is usually measured in microsiemens or millisiemens per centimeter. Seawater in open ocean waters has a conductance of around 55 millisiemens per centimeter.
Water clarity.—Water clarity, a measure of light penetration through the water column, is an indicator of light availability for photosynthesis by phytoplankton and can be measured visually using a Secchi disk, an 8-inch (20-centimeter) circular plate that is divided into quarters that are painted alternately black and white. The Secchi disk is lowered into the water to a depth where it is no longer visible. The resulting measurement is called the Secchi disk transparency depth. High Secchi depth values indicate clearer water, and low Secchi depths indicate high turbidity.
Another measure of water clarity is the measurement of the depth of the potential subsurface zone available for photosynthesis. Light availability is an important environmental variable because low light availability limits photosynthetic activity, and thereby the primary productivity of an aquatic ecosystem (Kirk, 2011). Light availability is a key indicator for assessing aquatic ecosystem conditions and is the principal environmental control on submerged aquatic vegetation, such as eelgrass. Photosynthetically active radiation is the part of the light spectrum (390–710 nanometers) used by plants for photosynthesis and is measured in micromoles per second. Light penetration is a function of the concentrations of suspended particles, colored dissolved organic matter, and chlorophyll a and other photosynthetic pigments in phytoplankton in the water column. Photosynthetically active radiation attenuation is calculated from a profile of photosynthetically active radiation through the water column. Because of the effect of solar angle, photosynthetically active radiation monitoring is typically completed during a target sampling window of within 3 hours of local apparent noon (the time when the sun crosses the local meridian; Kopp and others, 2009).
Turbidity (in nephelometric turbidity units [NTU] or formazin nephelometric units [FMU]).—Turbidity is an optical determination of water clarity and is a measure of the amount of light that is scattered or absorbed by suspended matter in the water column. Turbidity is measured with a turbidity meter, called a nephelometer, and reported in NTU or FMU. Higher turbidity generally means lower transparency, but there is no consistent quantifiable relationship or correlation between turbidity and water clarity and relations must be determined for each waterbody. Turbidity is measured by use of a calibrated probe using standards for expected turbidity ranges. Turbidity can be caused by suspended sediment, inorganic materials, or organic matter such as algae, phytoplankton, and decaying material and dissolved organic matter. Estuaries tend to be areas of sediment accumulation and are generally more turbid than open ocean.
Suspended solids.—The amount of material that is suspended in the water column is measured as the amount of material retained on a 0.45-micrometer filter. Smaller particles that pass through the filter are considered dissolved solids. Total suspended solids is a specific measurement of all suspended solids, organic and inorganic, by mass. The sum of suspended and dissolved solids is referred to as “total solids.” Tides pushing saltwater upstream can cause fine sediments to become trapped by the turbulent resuspension of sediments and flocculation of particulate material. Suspended solids in estuaries are often made up mostly of resuspended sediment, although bacteria, phytoplankton, algae, and organic particles from decomposing materials can also contribute to the total solids concentration. Suspended particles (sediments, particulate organic material) reduce light transmission through the water column and can absorb heat from sunlight, raising water temperatures and decreasing DO concentrations.
Depth of measurement (in feet).—Depth of measurement is important to record for discrete sampling and continuous water-quality measurements. Vertical profiles should be collected at each visit to a sampling station and provide important information indicating how water-quality constituents vary within the water column. Recording depth of measurement is particularly necessary when measuring vertical profiles of DO, specific conductance, and water temperature to identify when stratification may be present between water at the surface with different temperature and salinity than water at the bottom. Stratification reduces mixing and can restrict DO from reaching bottom layers of water. Cross-sectional profiles are important at riverine water-quality data-collection sites as well (Wagner and others, 2006).
Tidal cycle.—Tidal cycles are an important factor in the variability of water-quality constituents in estuaries. The date and time of sampling and tidal gage used for reference should be recorded along with water-quality data. Tidal information, such as tidal phase (high water, ebb, low water, and flood), tidal amplitude (neap tides and spring tides), water velocity, and direction can provide valuable insight in interpreting changes in other physical and chemical properties when sampling in estuarine waters.
Biological Properties
Chlorophyll a (in micrograms per liter).—Chlorophyll a is a green pigment in phytoplankton and is the main chemical responsible for photosynthesis in plants. The amount of chlorophyll a in the water column is a general indication of the biomass of phytoplankton. Many factors affect the amount of chlorophyll a in the water column including nutrient concentration, light intensity, light penetration, water temperature, and the hydrodynamics (tidal flushing, residence time) of the waterbody. In estuarine and coastal environments, low, medium, and high chlorophyll concentrations are considered as less than 5 micrograms per liter (μg/L), 5–20 μg/L, and greater than 20 μg/L, respectively (Bricker and others, 1999; Kopp and others, 2009). Elevated chlorophyll can be a signal of declining water quality. Chlorophyll a concentrations greater than 50 μg/L represent an algal bloom, and concentrations greater than 100 μg/L represent a severe bloom (Moore and Reblin, 2010). To accurately measure chlorophyll a, water samples are filtered in the field (with filters shipped immediately), and chlorophyll is measured in a laboratory by spectrophotometry, fluorometry, or high-performance liquid chromatography. Chlorophyll a may also be approximated in situ by use of instruments that measure relative fluorescence (in percent); however, measurement of chlorophyll a by fluorometry should be regarded as an approximation and used as a proxy for chlorophyll a and phytoplankton activity. The relations between chlorophyll a and nutrient variability are complex, and many other factors exert strong controls on phytoplankton population (Kopp and Neckles, 2009).
Phycoerythrin and phycocyanin (in relative fluorescent units).—Phycoerythrin and phycocyanin are pigments commonly measured as indicators for blue-green algae (cyanobacteria) abundance. Phycocyanin are typically used in freshwater environments; whereas, sensors for phycoerythrin are more suited for estuarine and coastal water because of the different pigment distribution among marine algae. Phycoerythrin and phycocyanin concentrations are measured from water samples analyzed in a laboratory by spectrophotometry, and sample processing times and the expense of the monitoring program create limitations for providing public health notifications. Continuous sensors that measure florescence of the phycoerythrin and phycocyanin pigments can be used to provide instantaneous estimates of cyanobacterial conditions, however, these measurements must be related to cell counts and toxin concentrations measured from samples to estimate cyanobacteria concentrations.
Pathogens (bacteria, viruses, and protozoans).—The presence of pathogenic (disease-producing) microorganisms is the result of fecal contamination from untreated waste and stormwater, including human and nonhuman sources. Presence of pathogens is a concern in areas where waters are used for primary contact recreation such as wading and swimming (where the human body may come in direct contact with raw water), secondary contact recreation such as boating and fishing (where contact with the water is minimal and where ingestion of the water is not probable), consuming shellfish, or other activities that involve human contact or food consumption. The potential concentrations of pathogens are tracked by monitoring fecal coliform, total coliform, and fecal coliform indicator bacteria such as Escherichia coli and enterococci. Enterococcus bacteria have a slower decay rate, are more likely to survive longer in highly saline waters and have a greater correlation to swimming-associated illnesses than fecal coliform. While not typically harmful, indicator bacteria provide a measure of the extent of fecal contamination in the water and are used for regulatory purposes and beach closures. Values are recorded as the number of bacteria colony-forming units per 100 mL (CFU/100 mL) of water, or as the most probable number per 100 mL (MPN/100 mL).
References Cited
Bricker, S.B., Clement, C.G., Pirhalla, D.E., Orlando, S.P., and Farrow, D.R.G., 1999, National estuarine eutrophication assessment—Effects of nutrient enrichment in the nation’s estuaries: Silver Spring, MD, NOAA National Ocean Service Special Projects Office and the National Centers for Coastal Ocean Science, 71 p., accessed April 4, 2024, at https://coastalscience.noaa.gov/data_reports/national-estuarine-eutrophication-assessment-effects-nutrient-enrichment-nations-estuaries/.
Carey, J.C., and Fulweiler, R.W., 2014, Salt marsh tidal exchange increases residence time of silica in estuaries: Limnology and Oceanography, v. 59, no. 4, p. 1202–1212, accessed January 6, 2023, at https://doi.org/10.4319/lo.2014.59.4.1203.
Davidson, K., Gowen, R.J., Tett, P., Bresnan, E., Harrison, P.J., McKinney, A., Milligan, S., Mills, D.K., Silke, J., and Crooks, A.-M., 2012, Harmful algal blooms—How strong is the evidence that nutrient ratios and forms influence their occurrence?: Estuarine, Coastal and Shelf Science, v. 115, p. 399–413, accessed January 6, 2023, at https://doi.org/10.1016/j.ecss.2012.09.019.
Eddy, F.B., 2005, Ammonia in estuaries and effects on fish: Journal of Fish Biology, v. 7, no. 6, p. 1495-1513 accessed April 15, 2024, at https://doi.org/10.1111/j.1095-8649.2005.00930.x.
Hem, J.D., 1985, Study and interpretation of the chemical characteristics of natural water: U.S. Geological Survey Water-Supply Paper 2254, 3d ed., 263 p. [Also available at https://pubs.usgs.gov/publication/wsp2254.]
Howarth, R.W., and Marino, R., 2006, Nitrogen as the limiting nutrients for eutrophication in coastal marine ecosystems—Evolving views over three decades: Limnology and Oceanography, v. 51, no. 1, part 2, p. 364–376, accessed June 23, 2022, at https://doi.org/10.4319/lo.2006.51.1_part_2.0364.
Kirk, J.O., 2011, Light and photosynthesis in aquatic ecosystems: Cambridge, U.K., Cambridge University Press, 649 p. [Also available at https://www.cambridge.org/core/books/light-and-photosynthesis-in-aquatic-ecosystems/C19B28AE07B1CDEBDA5593194DE4E304.]
Kopp, B.S., and Neckles, H.A., 2009, A protocol for monitoring estuarine nutrient enrichment in coastal parks of the National Park Service Northeast Region: Fort Collins, Colo., National Park Service, Natural Resource Report NPS/NCBN/NRR—2009/110, 247 p., accessed July 14, 2022, at https://irma.nps.gov/DataStore/DownloadFile/152594.
Kopp, B.S., Nielsen, M., Glisic, D., and Neckles, H.A., 2009, Estuarine water quality in parks of the Northeast Coastal and Barrier Network—Development and early implementation of vital signs estuarine nutrient-enrichment monitoring, 2003–06: Fort Collins, Colo., National Park Service, Natural Resource Technical Report NPS/NCBN/NRTR—2009/266, 135 p., accessed July 14, 2022, at https://irma.nps.gov/DataStore/DownloadFile/154165.
Moore, S., and Reblin, J., 2010, The Kennebec Estuary—Restoration challenges and opportunities: Bowdoinham, Maine, Biological Conservation, 119 p., accessed June 23, 2022, at https://www.kennebecestuary.org/publications.
Massachusetts Department of Environmental Protection [MassDEP], 2018, A strategy for monitoring and assessing the quality of Massachusetts’ waters to support multiple water resource management objectives 2016–2025: Massachusetts Department of Environmental Protection, CN 203.5, 57 p., accessed January 16, 2024, at https://www.mass.gov/doc/water-quality-monitoring-strategy-2016-2025/download.
Pimenta, A.R., and Grear, J.S., 2018, Guidelines for measuring changes in seawater pH and associated carbonate chemistry in coastal environments of the eastern United States: Washington, D.C., U.S. Environmental Protection Agency, EPA/600/R–17/483, 52 p., accessed January 13, 2023, at http://www.necan.org/sites/default/files/EPA600_R17_483coastalAcidificationMonitoringGuidelinesFinal%20041318%20%282%29.pdf.
Redfield, A.C., Ketchum, B.H., and Richards, F.A., 1963, The influence of organisms on the composition of seawater, in Hill, M.H., ed., The sea: New York, Wiley, p. 26–77. [Also available at https://www.vliz.be/en/imis?module=ref&refid=28944&printversion=1&dropIMIStitle=1.]
Rus, D.L., Patton, C.J., Mueller, D.K., and Crawford, C.G., 2013, Assessing total nitrogen in surface-water samples—Precision and bias of analytical and computational methods: U.S. Geological Survey Scientific Investigations Report 2012–5281, 38 p., accessed June 19, 2023, at https://doi.org/10.3133/sir20125281.
Sheldon, J.E., and Alber, M., 2011, Recommended indicators of estuarine water quality for Georgia: Proceedings of the 2011 Georgia Water Resources Conference, Athens, Ga., University of Georgia, April 11–13, 2011, 6 p., accessed September 22, 2020, at https://repository.gatech.edu/server/api/core/bitstreams/dbbec834-6486-43cd-a08d-fcafb1657d51/content#:~:text=The%20seven%20recommended%20indicators%2 0of,%2C%20salinity%2C%20specific%20conductance).
U.S. Environmental Protection Agency, 2002, Developing and implementing an estuarine water quality monitoring, assessment, and outreach program—The MYSound Project: U.S. Environmental Protection Agency, EPA/625/R–02/010, [variously paged; 81 p.], accessed May 5, 2020, at https://nepis.epa.gov/Exe/ZyPDF.cgi/30004IUR.PDF?Dockey=30004IUR.PDF.
U.S. Environmental Protection Agency, 2012, Water quality standards handbook—Chapter 2—Designation of uses: U.S. Environmental Protection Agency, Office of Water, EPA–823–B–12–002, 36 p., accessed September 23, 2020, at https://www.epa.gov/sites/production/files/2014-10/documents/handbook-chapter2.pdf.
U.S. Geological Survey, 2019, Specific conductance: U.S. Geological Survey Techniques and Methods, book 9, chap. A6.3, 15 p., https://doi.org/10.3133/tm9A6.3. [Supersedes USGS Techniques of Water-Resources Investigations, book 9, chap. A6.3, version 1.2.] accessed April 2, 2024, at https://doi.org/10.3133/tm9A6.3.
Wagner, R.J., Boulger, R.W., Jr., Oblinger, C.J., and Smith, B.A., 2006, Guidelines and standard procedures for continuous water-quality monitors—Station operation, record computation, and data reporting: U.S. Geological Survey Techniques and Methods 1–D3, 51 p. + 8 attachments; accessed April 4, 2004, at https://pubs.usgs.gov/tm/2006/tm1D3/pdf/TM1D3.pdf.
Wallace, R.B., Baumann, H., Grear, J.S., Aller, R.C., and Gobler, C.J., 2014, Coastal ocean acidification—The other eutrophication problem: Estuarine, Coastal and Shelf Science, v. 148, p. 1–13, accessed June 23, 2022, at https://doi.org/10.1016/j.ecss.2014.05.027.
Williams, O.L., Kurtz, A.C., Eagle, M.J., Kroeger, K.D., Tamborski, J.J., and Carey, J.C., 2022, Mechanisms and magnitude of dissolved silica release from a New England salt marsh: Biogeochemistry, v. 161, no. 3, p. 251–271, accessed June 23, 2022, at https://doi.org/10.1007/s10533-022-00976-y.
Appendix 3. Monitoring Designs for Estuaries
Probabilistic Monitoring
A commonly used probabilistic sample design overlays a grid of equal area tessellated hexagons over an estuary. One random site is selected for monitoring within each hexagon, and each point in the estuary has a known probability of being sampled. This approach is known as a Generalized Random Tessellation Stratified design strategy. Random sampling locations in the estuary are generated using ArcInfo software. If a station cannot be sampled (for example, if a random location in the hexagon falls on land), then the station is replaced with the next random station from the list until the decided number of random stations has been selected. An advantage of a Generalized Random Tessellation Stratified design is that it tends to have less clumping of stations than other random sampling designs. Statistics determined from probabilistic monitoring data can be used to make inferences about conditions throughout a resource with a stated level of confidence. For example, a probabilistic design could provide the percentage of an estuary attaining water-quality standards and supporting designated uses (Kopp and Neckles, 2009; MassDEP, 2018). The number of sites chosen for probabilistic monitoring determines the overall confidence that can be placed in extrapolating up to a scale beyond the individual sites or waters sampled.
Probabilistic sampling networks for estuaries have been used in eastern Massachusetts by the Massachusetts Bays National Estuary Program for 3 bays and 47 sub-embayments from Salisbury to Provincetown, Massachusetts; in New Hampshire to assess estuary waters (https://www.des.nh.gov/sites/g/files/ehbemt341/files/documents/a23-prob-assess-est.pdf, accessed April 26, 2024); and in coastal parks of the National Park Service Northeast Region (Kopp and Neckles, 2009; Kopp and others, 2009). A probabilistic design for the Massachusetts coastal zone was developed by the Massachusetts Bays National Estuary Program and MassDEP (https://www.mass.gov/guides/surface-water-quality-monitoring#-massachusetts%E2%80%99-probabilistic-monitoring-and-assessment-program-(map2)-, accessed June 25, 2023). The target population is all coastal waters within MassDEP and Massachusetts Bays National Estuary Program estuarine assessment units. These waters have a nearshore boundary defined by a maximum distance from the Massachusetts shoreline of 3 miles and a maximum depth of 33 feet. The survey design stratifies the assessment units into three geographic regions. The Massachusetts Bays National Estuary Program pilot study began in 2020 with 15 sampling sites and selected a minimum of 25 sites for sampling each year, from 2021 to 2023. The sampling plan consisted of visiting each site three times in the same year (once a month during June, July, and August) to collect in situ measurements and water-chemistry samples; collection of sediment samples for sediment chemistry and toxicity, as well as benthic infauna, (during July), and monitoring of Zostera marina L. (eelgrass) at each site during the peak growing season for eelgrass (in August).
Although probabilistically derived sampling networks determine the percentage of estuary acres that are meeting water-quality standards, they are not as useful as long-term fixed-site, short-term rotating, or targeted monitoring for assessing the status of designated uses in accordance with the requirements of Section 305(b) or identifying individual impaired waters for listing pursuant to Section 303(d) of the Clean Water Act.
Long-Term Fixed-Site Monitoring Stations
Long-term (decades) fixed-site and short-term (months to years) rotating and targeted monitoring networks are needed to confirm causes and identify sources of impairments or, alternatively, to demonstrate that previously impaired waters support their beneficial uses and can be removed from the 303(d) list. They also can be used to develop and implement control strategies, such as total maximum daily loads, drainage basin-based plans, National Pollutant Discharge Elimination System permits, and best management practices. Furthermore, targeted monitoring may provide data to define new and emerging issues or to support the development of water-quality standards and policies, such as for the marine dissolved oxygen criteria discussed in this report. Long-term and short-term rotating and targeted sampling networks use nonrandom site selection based on previous knowledge of conditions at the sites.
Long-term fixed-site monitoring stations are generally limited to a small number of locations selected to represent generalized water-quality conditions and identify long-term water-quality trends in coastal waterbodies. Monitoring programs also refer to long-term fixed-site monitoring stations as trend stations. Water-quality monitoring at long-term fixed-site monitoring stations measure a broad set of physical, chemical, and biological properties that provide information on the movement of marine water and dissolved contaminants. Long-term fixed-site monitoring stations are typically located away from the shoreline to be outside the effect of individual point sources and are often placed in areas that meet multiple management objectives. For example, stations may be established in areas that have different physical characteristics (deep or shallow areas, embayments), hydrodynamic conditions (circulation patterns, mixing characteristics), or water quality (estuary inflows and outflows) or that have different regulatory objectives (State jurisdictions, different assessment units).
Long-term fixed-site monitoring stations may be deployed as moored buoys or attached to coastal infrastructure such as jetties, docks, bridges, or lighthouses. Data collection activity generally includes continuous sensor-based in situ monitoring supplemented by discrete water-quality sampling. Continuous water-quality measurements are typically measured at the surface and at bottom depth. As monitoring needs change, stations may be enhanced to monitor conditions at additional depths and (or) measure additional constituents. Measurements made at long-term fixed-site stations include field-measured water-quality properties collected to calibrate sensors. Vertical profiles are typically also collected for conductivity, water temperature, and depth to provide more detailed resolution of water-quality conditions throughout the water column. Additional properties such as pH, dissolved oxygen, turbidity, and chlorophyll relative fluorescence may also be measured in vertical profiles by use of multiparameter water-quality sondes.
Long-term fixed-site monitoring stations are expensive and typically limited in number, so they do not provide sufficient geographic coverage of coastal waters on their own. In most monitoring networks, long-term fixed-site monitoring stations are complimented by short-term rotating and targeted monitoring stations and water-quality surveys, which complement the data collected at the long-term stations by monitoring water-quality conditions at additional locations or during particular periods.
Short-Term Rotating and Targeted Monitoring Stations
Short-term rotating and targeted monitoring stations are established to complement data collection at fixed-site stations. Monitoring programs also refer to short-term monitoring stations as deterministic stations. Short-term rotating monitoring stations are named because State monitoring programs typically monitor waterbodies on a rotating cycle and the stations are activated periodically when the waterbody is being evaluated. Use of short-term rotating stations allows comparison to historic water-quality conditions at the same location. The periods of data collection for rotating stations are short relative to long-term fixed-site stations and generally range from a single season to several years. Data collection activities at the short-term rotating stations generally include continuous monitoring at surface and bottom depths supplemented by discrete water-quality sampling and collection of field-measured water-quality properties. Equipment design and water-quality data collected at rotating stations may be identical to fixed-site stations or may be designed for a reduced set of water-quality properties to reduce costs. Short-term rotating stations are typically in areas where water-quality conditions may not be well represented by fixed-site monitoring stations. If water-quality problems are detected by a rotating station, the location may be retained or enhanced as part of a targeted monitoring project or reclassified as a long-term fixed-site monitoring station. To provide greater geographic coverage, short-term rotating monitoring stations may also be moved between several locations over the course of a year and operated for even shorter periods such as over a monthly tidal cycle.
Short-term targeted monitoring can be designed to address or target a particular question or hypothesis and could be selected on an annual basis to supplement existing data. For example, targeted stations could be located to collect water-quality data in an embayment or small estuary where water-quality conditions are previously unknown or to bracket a particular point source such as a National Pollutant Discharge Elimination System discharge, nonpoint source (such as specific land uses or tributaries), or nearby to fixed-site or rotating stations to characterize how well the stations represent local water-quality conditions.
Data collection activities at targeted stations may include collection of continuous water-quality data, discrete water-quality sampling, or collection of field-measured water-quality properties. Targeted monitoring stations can also be deployed for a specific research objective such as to follow the dynamics and ecological and biogeochemical consequences of a spring phytoplankton bloom or to document water-quality conditions during a particular period such as in late summer when algal blooms and low dissolved oxygen are a concern or during a specific event where data need to be collected over a short time frame (for example, a few days) such as to help understand the cause and extent of water-quality conditions associated with a fish kill. Targeted monitoring should be flexible. If water-quality conditions are acceptable during a critical period, targeted stations can be moved to another location.
References Cited
Kopp, B.S., and Neckles, H.A., 2009, A protocol for monitoring estuarine nutrient enrichment in coastal parks of the National Park Service Northeast Region: Fort Collins, Colo., National Park Service, Natural Resource Report NPS/NCBN/NRR—2009/110, 247 p., accessed July 14, 2022, at https://irma.nps.gov/DataStore/DownloadFile/152594.
Kopp, B.S., Nielsen, M., Glisic, D., and Neckles, H.A., 2009, Estuarine water quality in parks of the Northeast Coastal and Barrier Network—Development and early implementation of vital signs estuarine nutrient-enrichment monitoring, 2003–06: Fort Collins, Colo., National Park Service, Natural Resource Technical Report NPS/NCBN/NRTR—2009/266, 135 p., accessed July 14, 2022, at https://irma.nps.gov/DataStore/DownloadFile/154165.
Massachusetts Department of Environmental Protection [MassDEP], 2018, A strategy for monitoring and assessing the quality of Massachusetts’ waters to support multiple water resource management objectives 2016–2025: Massachusetts Department of Environmental Protection, CN 203.5, 57 p., accessed June 23, 2022, at https://www.mass.gov/doc/water-quality-monitoring-strategy-2016-2025/download.
Conversion Factors
U.S. customary units to International System of Units
Temperature in degrees Celsius (°C) may be converted to degrees Fahrenheit (°F) as follows: °F = (1.8 × °C) + 32.
Supplemental Information
Specific conductance is given in either millisiemens per centimeter at 25 degrees Celsius (mS/cm at 25 °C) or microsiemens per centimeter at 25 degrees Celsius (µS/cm at 25 °C).
Concentrations of chemical constituents in water are given in either milligrams per liter (mg/L) or micrograms per liter (µg/L).
Values of pH are given in standard units (SU).
Salinity is given in either parts per thousand (ppt) or practical salinity units (psu).
Photosynthetically active radiation (PAR) is given in micromoles per second (µmol/s).
The U.S. Geological Survey follows the convention of identifying left and right sides of a stream as viewed facing downstream.
Abbreviations
ADCP
acoustic Doppler current profiler
AU
assessment unit
BPPS
Brayton Point Power Station
CSO
combined sewer overflow
CWA
Clean Water Act
DO
dissolved oxygen
E. coli
Escherichia coli
EFDC
Environmental Fluid Dynamics Code
EPA
U.S. Environmental Protection Agency
HSPF
Hydrological Simulation Program–FORTRAN
MassDEP
Massachusetts Department of Environmental Protection
MDEQE
Massachusetts Department of Environmental Quality Engineering
MWRC
Massachusetts Water Resources Commission
NBC
Narragansett Bay Commission
NBEP
Narragansett Bay Estuary Program
NBFSMN
Narragansett Bay Fixed Site Monitoring Network
NOAA
National Oceanic and Atmospheric Administration
NWIS
National Water Information System
QAPP
quality-assurance project plan
RIDEM
Rhode Island Department of Environmental Management
ROMS
Regional Ocean Modeling System
SMAST
University of Massachusetts-Dartmouth School for Marine Science and Technology
SWQS
Surface Water Quality Standards
TAC
technical advisory committee
TRWA
Taunton River Watershed Alliance
USACE
U.S. Army Corps of Engineers
USGS
U.S. Geological Survey
WASP
Water Quality Analysis Simulation Program
WQMS
water-quality monitoring strategy
WWTF
wastewater treatment facility
314 CMR 4.00
Massachusetts SWQS, 314 Code of Massachusetts Regulations 4.00.
For more information, contact
Director, New England Water Science Center
U.S. Geological Survey
10 Bearfoot Road
Northborough, MA 01532
dc_nweng@usgs.gov
or visit our website at
https://www.usgs.gov/centers/new-england-water-science-center
Publishing support provided by the Pembroke, Rolla, and Sacramento Publishing Service Centers
Disclaimers
Any use of trade, firm, or product names is for descriptive purposes only and does not imply endorsement by the U.S. Government.
Although this information product, for the most part, is in the public domain, it also may contain copyrighted materials as noted in the text. Permission to reproduce copyrighted items must be secured from the copyright owner.
Suggested Citation
Armstrong, D.S., 2024, Water-quality monitoring strategy for Mount Hope Bay and the Taunton River Estuary, southeastern Massachusetts: U.S. Geological Survey Scientific Investigations Report 2024–5049, 48 p., https://doi.org/10.3133/sir20245049
ISSN: 2328-0328 (online)
ISSN: 2328-031X (print)
Study Area
| Publication type | Report |
|---|---|
| Publication Subtype | USGS Numbered Series |
| Title | Water-quality monitoring strategy for Mount Hope Bay and the Taunton River Estuary, southeastern Massachusetts |
| Series title | Scientific Investigations Report |
| Series number | 2024-5049 |
| ISBN | 978-1-4113-4582-9 |
| DOI | 10.3133/sir20245049 |
| Publication Date | September 04, 2024 |
| Year Published | 2024 |
| Language | English |
| Publisher | U.S. Geological Survey |
| Publisher location | Reston, VA |
| Contributing office(s) | New England Water Science Center |
| Description | Report: ix, 48 p.; 2 Tables |
| Country | United States |
| State | Massachusetts |
| Other Geospatial | Mount Hope Bay, Taunton River Estuary |
| Online Only (Y/N) | N |
| Additional Online Files (Y/N) | Y |