

Water-Quality Trends in the Kansas River, Kansas, since Enactment of the Clean Water Act, 1972–2020
Links
- Document: Report (3.1 MB pdf) , HTML , XML
- Dataset: USGS National Water Information System database —USGS water data for the Nation
- Data Release: USGS data release - Water-quality data and computed flow-normalized and low-flow concentrations and loads in the Kansas River, Kansas, 1972–2020
- NGMDB Index Page: National Geologic Map Database Index Page (html)
- Download citation as: RIS | Dublin Core
Acknowledgments
The authors thank the Kansas Water Office, the Kansas Department of Health and Environment (KDHE), The Nature Conservancy, the City of Lawrence, the City of Manhattan, the City of Olathe, the City of Topeka, WaterOne, and Evergy for a beneficial and lasting partnership in monitoring water-quality conditions in the Kansas River. The authors are grateful for the assistance of Tony Stahl and the KDHE Watershed Planning, Monitoring, & Assessment Program with the collection and compilation of KDHE water-quality data used in this report.
The authors thank U.S. Geological Survey technical reviewers Teresa Rasmussen (Lawrence, Kansas), Kyle Juracek (Lawrence, Kansas), Mandy Stone (Lawrence, Kansas), Courtney Lauderback (Lee’s Summit, Missouri), and Ariele Kramer (Lawrence, Kansas) for reviewing previous drafts of this report and associated data release. Lastly, this report would not have been possible without the hard work of past and present KDHE and U.S. Geological Survey Kansas Water Science Center staff that assisted with data collection, analyses, and project and database management.
Abstract
The Clean Water Act was passed by Congress in 1972 to regulate pollution within the waters of the United States. The U.S. Geological Survey (USGS), in cooperation with the Kansas Department of Health and Environment (KDHE), the Kansas Water Office, the Nature Conservancy, the City of Lawrence, the City of Manhattan, the City of Olathe, the City of Topeka, WaterOne, and Evergy, compiled and analyzed historical streamflow and water-quality data collected by USGS and KDHE to characterize trends in water-quality constituents of interest because of their relation to water supply, drinking-water treatment, and sediment and nutrient transport, among others (total dissolved solids, chloride, ammonia, dissolved inorganic nitrogen [ammonia and nitrate plus nitrite], total nitrogen, orthophosphate, total phosphorus, total suspended solids, and fecal coliform bacteria) during mean- and low-flow conditions in the Kansas River since the passage of the Clean Water Act in 1972 through 2020. Trends in water-quality concentrations, or densities, and loads were analyzed using the Exploration and Graphics for RivER Trends R package and Weighted Regressions on Time, Discharge, and Season (WRTDS) model at upstream (Kansas River at Wamego, Kansas; USGS station 06887500) and downstream (Kansas River at De Soto, Kansas; USGS station 06892350) locations along the Kansas River using streamflow and water-quality data collected by the USGS and KDHE during 1972 through 2020. The Exploration and Graphics for RivER Trends Confidence Intervals R package and WRTDS bootstrap test estimated direction, uncertainty, and likelihood of trends in concentration and loads for each water-quality constituent of interest.
Downward trends in concentration and load were observed for 5 of the 9 water-quality constituents at both sites during mean-flow conditions during the study period. During low-flow conditions, 7 of the 9 constituents exhibited downward trends, possibly reflecting reductions in point-source contributions to the Kansas River. Downward trends in ammonia, dissolved inorganic nitrogen, and total nitrogen during mean- and low-flow conditions were observed at both Kansas River sites, which were similar to patterns observed nationally. Upward trends were generally observed for orthophosphate and total phosphorus, which were similar to patterns observed at sites in the Mississippi River Basin. Downward trends, or no trend, were observed for chloride. Upward and downward trends were observed for total dissolved solids. Downward trends in total suspended solids and fecal coliform bacteria were observed at both sites, which were also similar to patterns observed nationally. The long-term trend analyses in this report are an essential step to understanding how water-quality conditions have changed in the Kansas River since the passage of the Clean Water Act.
Introduction
The Clean Water Act (CWA; Public Law 92–500; formally referred to as the Federal Water Pollution Control Act) was passed by Congress in 1972 to provide a structure for regulating the discharge of pollutants into United States waters (U.S. Environmental Protection Agency, 1972; U.S. Environmental Protection Agency, 2023a). Pollution control programs, construction of municipal sewage-treatment plants, and water-quality standards were implemented by the CWA and subsequent amendments with the intent to prevent, reduce, and eliminate contamination of the Nation’s waters (U.S. Environmental Protection Agency, 1972). The CWA also mandated that States provide water-quality assessment reports that include documentation of all point sources (direct discharge into stream at a known location) of discharge, water-quality goals, established total maximum daily loads (maximum amount of a pollutant allowed in a water body while continuing to meet associated water-quality standards [U.S. Environmental Protection Agency, 2023b]), and recommendations for nonpoint-source (discharge into stream across several widespread locations) pollution control to the U.S. Environmental Protection Agency. Long-term water-quality data collection and monitoring are necessary to comply with these mandates.
The Kansas River is an essential water resource for eastern Kansas and provides recreational and industrial uses, food procurement, groundwater recharge, irrigation, livestock water use, and drinking water to more than 950,000 people (Josh Olson, Kansas Water Office, written commun., July 21, 2022) in northeastern Kansas (Kansas Department of Health and Environment, 2017). During the last 50 years, numerous water-quality-related projects and sampling networks in the State of Kansas have collected data to address CWA requirements. These efforts have culminated in a consistent, long-term dataset that can be utilized to assess decadal-scale changes in the quality of the Kansas River. The Kansas Department of Health and Environment (KDHE) Stream Chemistry monitoring program has been collecting water-quality samples from the Kansas River, among other locations, since the early 1970s, to be used for CWA and Kansas water-quality standards compliance; identification of potential point and non-point sources of pollution; documentation of trends in surface-water quality; development of defensible standards, permits, pollution-control plans, and total maximum daily loads; and for evaluating pollution control and remediation/restoration efforts (Kansas Department of Health and Environment, 2020). Numerous U.S. Geological Survey (USGS) investigations of the Kansas River have collected water-quality samples for several purposes since the early 1970s, including the characterization of water-quality conditions and trends, sediment transport, and waste-water discharge (Briggs and Ficke, 1977; Pope, 1994; Jordan, 1995; Jordan and Stamer, 1995; Helgesen, 1996; Rasmussen and Ziegler, 2003; Rasmussen and Christensen, 2005; Rasmussen and others, 2005; Graham and others, 2012; Foster and Graham, 2016; Graham and others, 2018; Williams, 2021, 2023). Three USGS national sampling networks have also collected water-quality samples in the Lower Kansas River Basin since the passage of the CWA in 1972: the National Stream Quality Accounting Network (Briggs and Ficke, 1977); the National Water-Quality Assessment (Hirsch and others, 1988); and the National Water Quality Network (Lee and others, 2017). These sampling networks were established by the USGS to collect a nationally consistent dataset that can be used to characterize water-quality conditions and long-term trends in the Nation’s waters.
The USGS, in cooperation with KDHE, the Kansas Water Office, the Nature Conservancy, the City of Lawrence, the City of Manhattan, the City of Olathe, the City of Topeka, WaterOne, and Evergy, compiled and analyzed historical streamflow and water-quality data collected by USGS and KDHE to quantify and characterize trends in water-quality constituents of interest (total dissolved solids, chloride, ammonia, dissolved inorganic nitrogen, total nitrogen, orthophosphate, total phosphorus, total suspended solids, and fecal coliform bacteria) in the Kansas River since the passage of the CWA in 1972. Data collected from the previously mentioned KDHE (Kansas Department of Health and Environment, 2020) and USGS (Briggs and Ficke, 1977; Hirsch and others, 1988; Pope, 199431; Jordan, 1995; Jordan and Stamer, 1995; Helgesen, 1996; Rasmussen and Ziegler, 2003; Rasmussen and Christensen, 2005; Rasmussen and others, 2005; Graham and others, 2012; Foster and Graham, 2016; Lee and others, 2017; Graham and others, 20185; Williams, 2021, 2023) programs have all contributed to the long-term Kansas River water-quality dataset used in this report.
Purpose and Scope
The purpose of this report is to provide a characterization of trends in water-quality constituents of interest during mean- and low-flow conditions using long-term data collected by the USGS and KDHE during 1972 through 2020 (Williams and others, 2024), since the passage of the CWA. Water-quality trends were quantified using flow-normalized concentrations and loads of total dissolved solids, chloride, ammonia, dissolved inorganic nitrogen, total nitrogen, orthophosphate, total phosphorus, total suspended solids, and fecal coliform bacteria densities. Trends were analyzed using the Weighted Regressions on Time, Discharge, and Season (WRTDS; Hirsch and others, 2010; Hirsch and De Cicco, 2015) model. Low-flow conditions were investigated to characterize potential effects of point-source pollution. The constituents of interest were identified by the USGS and KDHE for their importance related to water-quality issues, including water-supply, drinking-water treatment, and sediment and nutrient transport. The long-term data and trend analysis conducted herein is an essential step to understanding how water-quality conditions have changed in the Kansas River since the passage of the CWA. However, detailed attribution of specific causes for observed trends, such as changes in point sources or landscape practices, is beyond the scope of this report. The results documented in this report can be used to compare with water-quality trends in other streams across the Nation.
Description of Study Area
The Kansas River Basin consists of about 60,100 square miles (mi2) of northern Kansas and parts of Colorado and Nebraska (fig. 1). The Kansas River is formed by the confluence of the Smoky Hill and Republican Rivers near Junction City, Kansas, and flows about 174 miles (mi) east to its confluence with the Missouri River (not shown) in Kansas City, Kansas (fig. 1). The study area, or Lower Kansas River Basin, consists of a 5,450 mi2 area downstream from the confluence of the Smoky Hill and Republican Rivers. Four reservoirs within the Lower Kansas River Basin (Milford Lake, Tuttle Creek Lake, Perry Lake, and Clinton Lake; fig. 1) regulate streamflow in the Kansas River and were constructed during the 1960s through the 1970s for flood control, public water supply, and recreation (U.S. Army Corps of Engineers, 2017). About 80 percent of the study area is used for agricultural purposes (cropland [primarily corn, soybeans, and wheat; Kansas Department of Agriculture, 2023] and grassland) and about 10 percent is represented by urban areas (Fry and others, 2011). Four major urban and industrial areas are located along the Kansas River (Manhattan, Topeka, Lawrence, and the Kansas City metropolitan area, Kans.) along with several smaller municipalities that use the river and its alluvial aquifer as a water supply. The study area is described in additional detail by Rasmussen and Christensen (2005), Rasmussen and others (2005), and Graham and others (2012).
WRTDS models that compute flow-normalized and low-flow concentrations and loads of water-quality constituents of interest were developed near the headwaters (Kansas River at Wamego, Kans.; USGS station 06887500; hereafter referred to as “Wamego”) and mouth (Kansas River at De Soto, Kans.; USGS station 06892350; hereafter referred to as “De Soto”) of the main-stem Kansas River (fig. 1) to characterize trends in water-quality since the passage of the CWA. Wamego is about 50 mi and 38 mi downstream from Milford and Tuttle Creek Lakes (Reservoirs), respectively, (fig. 1) and has a drainage area of about 55,300 mi2 (Graham and others, 2018). De Soto is downstream from all four reservoirs (Milford, Tuttle Creek, Perry, and Clinton Lakes), about 98 river miles downstream from the Wamego site, and has a drainage area of about 59,800 mi2 (Graham and others, 2018).
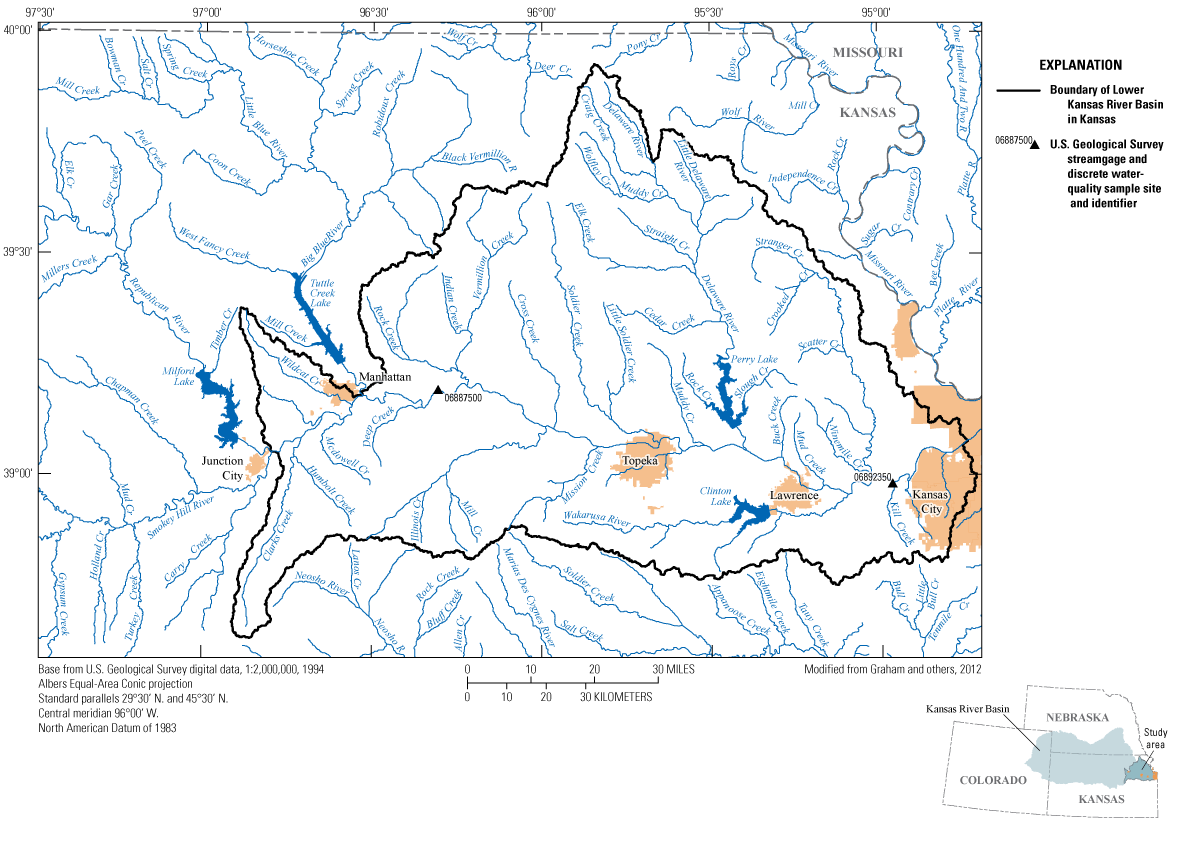
Location of the Kansas River at Wamego, Kansas, and Kansas River at De Soto, Kansas, streamgages (U.S. Geological Survey stations 06887500 and 06892350, respectively) and discrete water-quality sampling sites in the Lower Kansas River Basin.
The Kansas River was listed as an impaired waterway by KDHE in 2022 (Kansas Department of Health and Environment, 2022). Impairments in the main stem of the Kansas River include total suspended solids, total phosphorus, and nutrients and oxygen demand for aquatic life; fecal indicator bacteria for recreation; chloride and sulfate for water supply; and polychlorinated biphenyls for food procurement (Kansas Department of Health and Environment, 2022). The main stem of the Kansas River has defined total maximum daily loads for total phosphorus, chloride, fecal indicator bacteria, sulfate, ammonia, and nutrients and oxygen demand impact on aquatic life (Kansas Department of Health and Environment, 2017).
Methods
The USGS and KDHE collected discrete water-quality and streamflow (USGS only) data at Wamego and De Soto during 1972 through 2020. These data were collected over a range of streamflow conditions during historical sampling projects. The entire range and lower 10 percent (used for analysis of low-flow water-quality trends) of streamflow conditions and frequencies of exceedance observed at Wamego and De Soto during 1972 through 2020 are shown in figure 2 and figure 3, respectively. USGS data were retrieved from the USGS National Water Information System database (U.S. Geological Survey, 2023) and KDHE data were provided by KDHE (Tony Stahl, KDHE, written commun., September 23, 2022). The discrete water-quality data used in this report were collected by the USGS and KDHE during 1972 through 2020; however, the duration and extent of sampling were inconsistent for a given constituent owing to the associated project study design and scope, so not all constituents of interest spanned the entire study period.
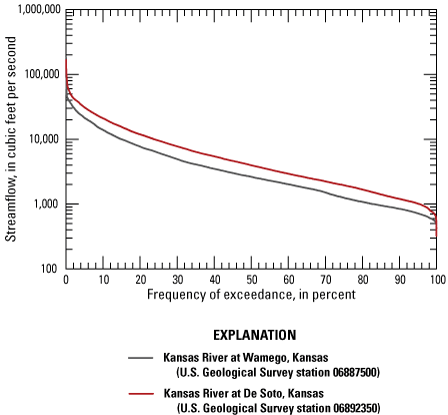
Streamflow duration curves at the Kansas River at Wamego, Kansas, and Kansas River at De Soto, Kansas, streamgages (U.S. Geological Survey stations 06887500 and 06892350, respectively) during 1972 through 2020. Data from U.S. Geological Survey (2023).
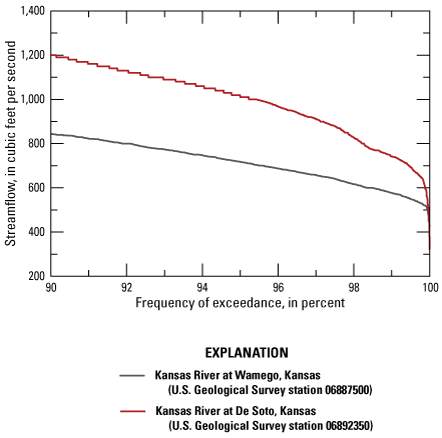
Lower 10 percent of streamflow duration curves at the Kansas River at Wamego, Kansas, and Kansas River at De Soto, Kansas, streamgages (U.S. Geological Survey stations 06887500 and 06892350, respectively) during 1972 through 2020. Data from U.S. Geological Survey (2023).
Streamflow Monitoring and Trends
All streamflow data at Wamego and De Soto were collected by the USGS using standard methods (Sauer and Turnipseed, 2010; Turnipseed and Sauer, 2010). Daily streamflow data have been collected at Wamego and De Soto since January 1919 and July 1917, respectively (U.S. Geological Survey, 2023). Daily streamflow data collected during January 1972 through December 2020 were used in combination with discrete water-quality data to compute flow-normalized and low-flow concentrations and loads of water-quality constituents of interest and characterize water-quality trends at Wamego and De Soto since the CWA was enacted in 1972.
Potential trends in streamflow could affect trends in flow-normalized water-quality concentrations and loads. Streamflow trends were examined using Quantile-Kendall plots (Hirsch, 2018). Each point on a Quantile-Kendall plot represents the trend in an annual order statistic. These annual order statistics range from the annual maximum flows (0-percent exceedance) on the left side of the plot to the annual minimum flows (100-percent exceedance) on the right side of the plot. Thus, a Quantile-Kendall plot shows the direction and magnitude of streamflow trends over the range of flow conditions. The daily streamflow values for each year are ordered by streamflow value, and the percent slope of the trend in the streamflow value at each rank was calculated. For example, the maximum daily streamflow value in each year was determined, the percentage slope was calculated for those maximum streamflows, and that percentage slope and the rank (expressed as an exceedance percentage) are plotted as a point on the Quantile-Kendall plot. These steps were repeated for the annual second-largest daily streamflow values and so on through to the annual minimum daily streamflow values. The slope is calculated using the Thiel-Sen slope estimator (Hirsch, 2018; Helsel and others, 2020) and a probability value (p-value) is calculated using the Mann-Kendall trend test (Mann, 1945). Quantile-Kendall plots that characterize potential trends in streamflow, shown in figures 4A–B, revealed no significant trends (p-values>0.1) in streamflow at Wamego and De Soto during 1972 through 2020.
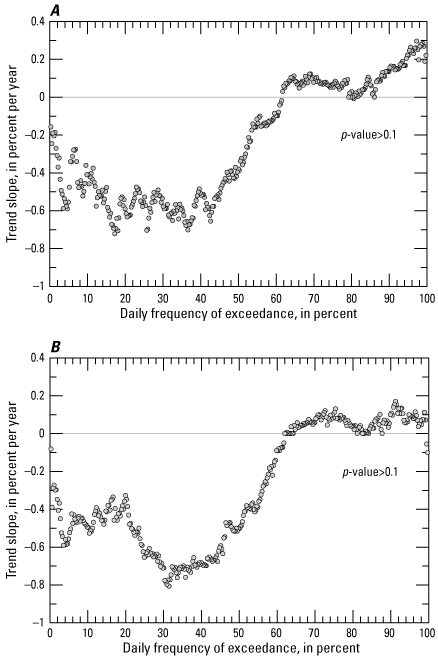
Quantile-Kendall plot of streamflow trends during 1972 through 2020. A, Kansas River at Wamego, Kansas, streamgage (U.S. Geological Survey station 06887500). B, Kansas River at De Soto, Kansas, streamgage (U.S. Geological Survey station 06892350).
Streamflow trends were also examined using streamflow duration curves showing streamflow conditions and frequencies of exceedance observed during the first (1972 through 1996) and second (1997 through 2020) halves of the study period at Wamego and De Soto (fig. 5). The second-half duration curves for both sites lie lower than the first-half curves, indicating that flows were lower during the second half of the period. However, trends in daily flows during the study period were not statistically significant (all p-values>0.1) using the Mann-Kendall trend test (fig. 4).
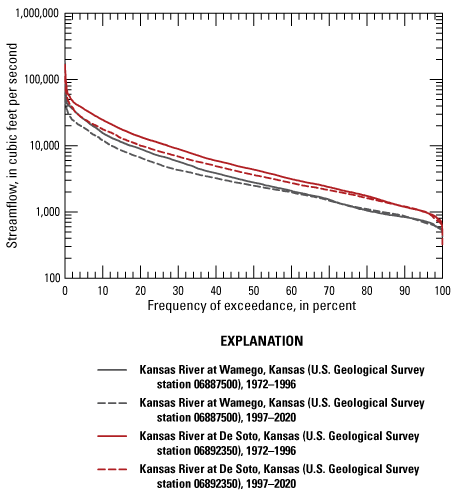
Streamflow duration curves at the Kansas River at Wamego, Kansas, and Kansas River at De Soto, Kansas, streamgages (U.S. Geological Survey stations 06887500 and 06892350, respectively) during 1972 through 1996 and during 1997 through 2020. Data from U.S. Geological Survey (2023).
Water-Quality Sample Collection
The USGS water-quality samples used in this report were collected at Wamego and De Soto as part of multiple historical USGS projects and networks during 1972 through 2020 (Briggs and Ficke, 1977; Rasmussen and others, 2005; Foster and Graham, 2016; Graham and others, 2018; Williams, 2021; Lee, 2022, among others). USGS water-quality samples were primarily collected using depth- and width-integrated isokinetic sampling techniques (U.S. Geological Survey, 2006), except for fecal coliform bacteria samples, which were collected at the centroid of flow using a weighted basket. Occasionally, nonisokinetic sampling techniques (including single and multiple verticals or grab samples; U.S. Geological Survey, 2006) were used during extreme low-flow conditions or for safety purposes during extreme cold conditions. USGS discrete water-quality data are available from the USGS National Water Information System database (U.S. Geological Survey, 2023).
USGS samples collected during 1972 through 2020 were analyzed for total dissolved solids (USGS parameter code 70300), chloride (USGS parameter code 00940), ammonia (USGS parameter codes 00610 during September 1977 through September 1979; 00608 during October 1979 through October 1980; 00610 during November 1980; and 00608 during December 1980 onward), nitrate plus nitrite (USGS parameter codes 00630 during September 1977 through August 1979; and 00631 during September 1979 onward), total Kjeldahl nitrogen (USGS parameter code 00625), orthophosphate (USGS parameter code 00671), total phosphorus (USGS parameter code 00665), total suspended solids (USGS parameter code 00530), and fecal coliform bacteria (USGS parameter code 31616 during October 1974 through September 1976; and 31625 during October 1976 onward). USGS parameter codes for ammonia and nitrate plus nitrite consist of a combination of unfiltered (total) and filtered (dissolved) analyses because of differences in analytical procedures. The substitution of filtered analyses of ammonia and nitrate plus nitrite for unfiltered analyses was appropriate because the difference was minimal between unfiltered and filtered sample results according to the evaluation of methods described in the USGS Office of Water Quality Technical Memorandum 93.04 (U.S. Geological Survey, 1992). USGS samples of total dissolved solids, chloride, ammonia, nitrate plus nitrite, total Kjeldahl nitrogen, orthophosphate, total phosphorus, and total suspended solids were analyzed at the USGS National Water-Quality Laboratory using the methods described by Fishman and Friedman (1989). USGS samples of fecal coliform bacteria were analyzed by the USGS Kansas Water Science Center using the methods described by Myers and others (2014).
The KDHE water-quality samples used in this report were collected at Wamego and De Soto on a biweekly to quarterly basis during 1972 through 2020 as part of the Kansas Stream Chemistry Monitoring Program to characterize physical, chemical, and bacteriological conditions in the Kansas River (Kansas Department of Health and Environment, 2020). KDHE water-quality samples were collected at the centroid of flow using a weighted stainless-steel bucket (Kansas Department of Health and Environment, 2020). KDHE discrete water-quality data used in this report are available in Williams and others (2024).
KDHE samples collected during 1972 through 2020 were analyzed for total dissolved solids, chloride, ammonia, nitrate plus nitrite, total Kjeldahl nitrogen, orthophosphate, total phosphorus, total suspended solids, and fecal coliform bacteria, among other analytes. Unlike the USGS nitrate plus nitrite samples (reported as a combination of total and dissolved concentrations), the KDHE nitrate plus nitrite samples were reported as exclusively total, rather than dissolved, concentrations. However, filtration was required prior to analysis, particularly on high turbidity samples, to prevent damage to the analytical instrumentation (Tony Stahl, KDHE, written commun., August 27, 2023). Additionally, KDHE does not consider there to be a difference in total or dissolved nitrate plus nitrite concentrations from a regulatory or management standpoint (Tom Stiles, KDHE, written commun., August 18, 2023). Therefore, it was deemed appropriate to combine the USGS and KDHE nitrate plus nitrite datasets for the purposes of this report. KDHE samples of total dissolved solids, chloride, ammonia, nitrate plus nitrite, total Kjeldahl nitrogen, orthophosphate, total phosphorus, and total suspended solids were analyzed by the Kansas Health and Environmental Laboratory using methods described by the Kansas Department of Health and Environment (2020).
The combination of USGS and KDHE samples used for trend analyses in this report allowed for a larger and higher frequency dataset that reduced some uncertainties in estimated water-quality trends during the study period. These datasets were used to identify and investigate long-term water-quality trends of constituents of interest during 1972 through 2020. The constituents of interest in this report consisted of total dissolved solids, chloride, ammonia, dissolved inorganic nitrogen (computed by summing ammonia and nitrate plus nitrite), total nitrogen (computed by summing total Kjeldahl nitrogen and nitrate plus nitrite), orthophosphate, total phosphorus, total suspended solids, and fecal coliform bacteria. Dissolved inorganic nitrogen or total nitrogen results were not computed if both counterparts (ammonia and nitrate plus nitrite, or total Kjeldahl nitrogen and nitrate plus nitrite, respectively) were not available for a given USGS or KDHE sample. The number of samples and duration of sample collection during the study period for each constituent of interest are shown in table 1. USGS and KDHE sample results for these constituents were used to compute associated flow-normalized and low-flow trend likelihood results during 1972 through 2020.
Table 1.
Water-quality constituents of interest collected by the U.S. Geological Survey and Kansas Department of Health and Environment at the Kansas River at Wamego, Kansas, and Kansas River at De Soto, Kansas, streamgages (U.S. Geological Survey stations 06887500 and 06892350, respectively) during 1972 through 2020.[N, number of samples; mg/L, milligram per liter; USGS, U.S. Geological Survey; --, no data collected; X, data available; KDHE, Kansas Department of Health and Environment; cfu/100 mL, colony forming units per 100 milliliters]
Quality Assurance and Quality Control of Streamflow and Water-Quality Data
All streamflow data collected by the USGS at Wamego and De Soto during 1972 through 2020 were quality assured using standard USGS methods (Sauer and Turnipseed, 2010; Turnipseed and Sauer, 201040; Painter and Loving, 2015). These data were analyzed, reviewed, and approved following USGS guidance (U.S. Geological Survey, 2017).
Water-quality data preparation for the trend analyses described in this report involved data compilation, and identification and removal of inappropriate samples. Two USGS ammonia results and three USGS nitrate plus nitrite samples collected from De Soto had concentrations of zero, and, for reasons documented by Lee and Henderson (2020), these results were assumed to be missing and were not used in the trend analysis. If more than one sample of a constituent was collected on the same day (not including replicate samples for quality-control purposes), only the first sample of the day was retained in the trend analysis dataset. To reduce uncertainty caused by extended periods without sample collection, samples collected during 1972 through 2020 were not used in the trend analysis if no other USGS or KDHE samples were collected within 2 years of the sample. There were no other instances or justification of removal of USGS or KDHE samples from the trend analysis dataset. All USGS and KDHE data used in the WRTDS trend analysis are included in a USGS data release (Williams and others, 2024).
Quality-control samples, including concurrent replicates and field blanks, were collected at Wamego and De Soto by the USGS and KDHE to characterize variability and bias in sample results potentially introduced by equipment cleaning and rinsing procedures, sample-collection methods, sample-processing techniques, and analytical methods (Mueller and others, 2015). Relative percentage difference (RPD) among concurrent replicate sample pairs was used to quantify variability in constituent concentrations and was calculated by dividing the absolute difference of a pair of replicate samples by their associated mean concentration or density and then multiplying by 100 (Zar, 1999). RPDs were calculated for concurrent replicate pairs of samples only if sample times were within 30 minutes of each other. RPD could not be calculated for replicate pairs that contained one or more censored (data reported as less than the laboratory minimum reporting limit [MRL]) result. Median RPDs among USGS and KDHE concurrent replicate pairs of total dissolved solids and chloride were less than 2 percent (table 2). USGS nutrient (nitrogen and phosphorus species) median concurrent replicate RPDs were less than 7 percent (table 2). KDHE nutrient (nitrogen and phosphorus species) median concurrent replicate RPDs were less 10 percent, except for ammonia, which had a median RPD of about 29 percent (table 2), likely due to low concentrations that were less than the highest ammonia MRL (0.1 milligram per liter [mg/L]) during the study period. Median RPDs among USGS and KDHE concurrent replicate pairs of total suspended solids were less than 10 percent (table 2). Median RPDs were less than 40 percent for all fecal coliform bacteria replicate paired samples collected by USGS and KDHE (table 2).
Table 2.
Summary of quality-control results for discrete replicate and blank samples collected by the U.S. Geological Survey and Kansas Department of Health and Environment at the Kansas River at Wamego, Kansas, and Kansas River at De Soto, Kansas, streamgages (U.S. Geological Survey stations 06887500 and 06892350, respectively) during 1972 through 2020.[QC, quality control; mg/L, milligram per liter; cfu/100 mL, colony forming units per 100 milliliters; USGS, U.S. Geological Survey; --, no data collected; MRL, minimum reporting limit; RPD, relative percentage difference; KDHE, Kansas Department of Health and Environment]
Field blank samples were collected by USGS and KDHE to characterize bias potentially introduced by contamination from the sample environment, sampling procedures, and analytical methods (Mueller and others, 2015). All USGS total dissolved solids and chloride field blank sample results were less than two times the associated maximum MRL (table 2). All KDHE field blank sample results for total dissolved solids were greater than two times the associated maximum MRL; however, all these results were less than 7 percent of the associated environmental discrete sample concentration (table 2). One KDHE chloride field blank sample result was greater than 10 percent of the associated environmental discrete sample concentration. All USGS and KDHE nutrient (nitrogen and phosphorus species) field blank sample results were less than two times the associated maximum MRL, except for KDHE nitrate, total Kjeldahl nitrogen, and total phosphorus (table 2). Three KDHE nitrate field blank sample results were greater than two times the associated maximum MRL and greater than 10 percent of the associated environmental discrete sample concentration. Two KDHE total Kjeldahl nitrogen field blank sample results were greater than two times the associated maximum MRL and greater than 10 percent of the associated environmental discrete sample concentration. Four KDHE total phosphorus field blank sample results were greater than two times the associated maximum MRL and greater than 10 percent of the associated environmental discrete sample concentration. All USGS and KDHE total suspended solids field blank sample results were less than two times the associated maximum MRL (table 2). All USGS and KDHE fecal coliform bacteria field blank sample results were less than two times the associated maximum MRL (table 2).
Comparison of Water-Quality Data
Trend analyses in this report included samples collected and analyzed by USGS and KDHE personnel and laboratories. It is important to determine whether differences in sample collection and analytical procedures among agencies have the potential to affect trend analyses. However, without concurrently collected samples it is difficult to determine if observed differences are related to environmental conditions or agency-specific collection and (or) analytical procedures, particularly when sample concentrations are below laboratory reporting levels. The potential for the sampling agency and analytical laboratory to affect trend results across the range of streamflow conditions was indirectly characterized using analysis of covariance (ANCOVA) of the natural logarithm of sample concentrations relative to the natural logarithm of streamflow conditions. ANCOVA can be used to evaluate the effect of qualitative factors, such as sampling agency, on a dependent variable (such as water-quality constituents) within the context of other potentially influential independent variables (such as streamflow; Helsel and others, 2020). KDHE and USGS agencies were compared during years when water-quality sample data were available from both agencies and when KDHE samples had a USGS sample within 20 percent of the streamflow in which it was collected (table 3). In addition, to account for different laboratory reporting levels among agencies and sampling years, data below the median censoring level for a given constituent, and all results denoted as less than the laboratory reporting level, were not included in the analysis. ANCOVA was performed for a given site and constituent if the dataset had at least 20 sample pairs during the study period. Limited sample collection and censored data did not allow sampling-agency comparisons for ammonia and fecal coliform bacteria at Wamego, or for comparison of dissolved inorganic nitrogen, orthophosphate, and total nitrogen at both sites. To assess the comparability of nitrogen species, ANCOVA was performed on nitrate and total Kjeldahl nitrogen. The datasets for each study site were evaluated to determine if there was a significant (p-value<0.05) difference in the slope and intercept of constituent concentration versus streamflow regression relation lines between sampling agencies.
Table 3.
Results of analysis of covariance comparing U.S. Geological Survey and Kansas Department of Health and Environment datasets. Data from Williams and others (2024).[N, number of paired samples for comparison; p-value, probability value; <, less than; --, not presented; KDHE, Kansas Department of Health and Environment; USGS, U.S. Geological Survey]
Of the 14 site and constituent pairs, 5 had significant (p-value<0.05) differences in the slope (nitrate at De Soto and total Kjeldahl nitrogen at Wamego) or intercept (nitrate at Wamego, and total suspended solids at Wamego and De Soto) of constituent concentrations among agencies relative to streamflow conditions (table 3). Total dissolved solids, chloride, and total phosphorus concentrations varied similarly between agencies with respect to similar streamflows; although not enough data were available to compare fecal coliform densities and ammonia concentrations at Wamego, the slope and intercept among USGS and KDHE for these constituents were relatively similar at De Soto. USGS-sampled total suspended solids concentrations were significantly larger than KDHE-sampled suspended-solids concentrations during similar flow conditions at Wamego and De Soto. The slope of the relation between total Kjeldahl nitrogen and streamflow was significantly larger for USGS than KDHE data at the Wamego site. KDHE nitrate concentrations were higher across the range of streamflows at Wamego, but the slope of nitrate concentrations across flows was higher for USGS data at De Soto; different results among sites may indicate that agency-specific factors other than nitrate analytical methods are influencing concentrations, or that more data are needed to determine if observed differences are consistent.
Because samples among agencies were not concurrently collected, these comparisons do not necessarily mean that trend results using data from both agencies are affected by sampling agency (or that sites/constituents without significant differences are not), but that the proportion of data among the sampling agencies across the period of record should be considered when interpreting trend results. For these reasons, all USGS and KDHE data described in the Water-Quality Sample Collection section were retained in the trend analysis dataset (Williams and others, 2024) used in this report.
Computation of Water-Quality Trends
Water-quality trends in concentrations and loads of total dissolved solids, chloride, ammonia, dissolved inorganic nitrogen, total nitrogen, orthophosphate, total phosphorus, total suspended solids, and fecal coliform bacteria densities were computed and analyzed using the Exploration and Graphics for RivER Trends (EGRET) R package (Hirsch and De Cicco, 2015). The EGRET R package uses WRTDS (Hirsch and others, 2010; Hirsch and De Cicco, 2015) to compute flow-normalized trends of water-quality concentrations and loads while removing the effects of seasonality and year-to-year variations related to streamflow.
WRTDS models estimate daily concentrations and loads of water-quality constituents by creating a weighted regression model for each day in the model period. The model inputs are time (in decimal years), daily discharge (streamflow), and season (time of year). Data points are weighted based on the distances in these three dimensions between the sample day and the model estimate day. Data points that are closer to the model estimate day have higher weights. There is a distance in each dimension called the “half-window width” (Hirsch and others, 2010) beyond which the weight goes to zero. The data points that are within the half-window width have nonzero weights which, increase depending on the closeness in time, discharge, and season between the sampled day and model estimate day. These weighted data points are used to fit a regression equation that is used for estimating the concentration for that day. Flow-normalized daily concentrations and loads are calculated by producing model estimates for each streamflow during the model period on the calendar date of the day being estimated (using the time and season of the day being estimated for all of them) and calculating the mean of those estimates. For example, the flow-normalized concentration for January 1, 2010, would be the mean of the estimated daily concentrations calculated using the daily streamflows from every January 1 in the model period and the time and season of January 1, 2010. Flow-normalized concentrations and loads are used to examine water-quality trends while accounting for the effect of variations in streamflow.
To estimate the uncertainty and likelihood of upward or downward trends in concentrations and loads, the Exploration and Graphics for RivEr Trends Confidence Intervals (EGRETci) R package (Hirsch and others, 2015) uses a block-sampling bootstrap method called the WRTDS bootstrap test (WBT; Hirsch and others, 2015) to produce 500 replicate models. Rather than relying on the results of a single realization of the model, the large number of replicate models created with the WBT method allow for distributions of model results to be used to estimate probabilities of trends and confidence intervals. The difference between the annual means of the flow-normalized model results from the first and last years of the model period was used to determine if a replicate model exhibited an upward or downward trend. The distribution of positive and negative trends from all the replicate models was used to estimate the probabilities of upward and downward trends. Because the discrete water-quality samples used in this report did not span the first and last full years (that is, January 1 through December 31) of a given constituent’s dataset, WBT estimates were not computed for the first and last year in which discrete samples were collected to avoid extrapolating in time. For example, samples collected in 2020 were used in the WRTDS model, but WBT results were available only through 2019. Likelihood descriptors, ranging from highly likely to highly unlikely, were then assigned based on trend probabilities (table 4).
Table 4.
Trend likelihood descriptor definitions using the Weighted Regressions on Time, Discharge, and Season bootstrap test (Hirsch and others, 2015).[≥, greater than or equal to; ≤, less than or equal to; <, less than; > greater than]
Water-quality trends during low-flow conditions can be indicative of changes in point-source pollution. The WBT method also was used to estimate water-quality trend likelihoods at low flow by using a constant low-flow value (instead of using flow-normalized model results) to estimate low-flow concentrations and loads throughout the model period. The 10th-percentile (90-percent exceedance) streamflows during 1972 through 2020 were used for the low-flow values. The actual daily flows were used to develop the model, and then the model was used to make predictions of what the concentrations would have been if the flow was the 10th percentile value for every day. These streamflow values for the study period were 840 cubic feet per second (ft3/s) at Wamego and 1,200 ft3/s at De Soto. This approach followed the KDHE total maximum daily load methodology for determination of base-flow conditions (Kansas Department of Health and Environment, 2017), where water-quality constituents are more likely to be affected by potential point-source pollution.
Water-Quality Trend Results
The EGRET R package and WRTDS method allowed for the characterization of concentration and load as a function of time, discharge, and season (Hirsch and De Cicco, 2015). WRTDS was used to compute annual mean, flow-normalized, and low-flow (10th-percentile of streamflows during 1972 through 2020 at Wamego and De Soto [840 ft3/s and 1,200 ft3/s, respectively]) estimates of water-quality constituent concentrations and loads for total dissolved solids, chloride, ammonia, dissolved inorganic nitrogen, total nitrogen, orthophosphate, total phosphorus, total suspended solids, and fecal coliform bacteria densities using data collected by the USGS and KDHE during 1972 through 2020 at Wamego and De Soto (Williams and others, 2024). Mean annual concentrations and loads were calculated from the model-estimated daily concentrations during the study period. Flow-normalized and low-flow trend results for total dissolved solids, chloride, ammonia, dissolved inorganic nitrogen, total nitrogen, orthophosphate, total phosphorus, total suspended solids, and fecal coliform bacteria densities at Wamego and De Soto are summarized in tables 5–6.
Table 5.
Results of flow-normalized concentration and load trends at the Kansas River at Wamego, Kansas, and Kansas River at De Soto, Kansas, streamgages (U.S. Geological Survey stations 06887500 and 06892350, respectively) during 1973 through 2019.[mg/L, milligram per liter; --, no likely trend direction; ton/yr, ton per year; cfu/100 mL, colony forming units per 100 milliliters; cfu/yr, colony forming units per year]
Table 6.
Results of low-flow concentration trends at the Kansas River at Wamego, Kansas, and Kansas River at De Soto, Kansas, streamgages (U.S. Geological Survey stations 06887500 and 06892350, respectively) during 1973 through 2019.[mg/L, milligram per liter; cfu/100 mL, colony forming units per 100 milliliters]
Estimated annual mean, flow-normalized, and low-flow concentrations with 90-percent confidence intervals for total dissolved solids, chloride, ammonia, dissolved inorganic nitrogen, total nitrogen, orthophosphate, total phosphorus, total suspended solids, and fecal coliform bacteria densities at Wamego and De Soto are shown in figures 6–14. Confidence intervals may widen or diverge at the beginning and end of the plotted time period when prior and subsequent data points are lacking (causing increased uncertainty in streamflow and time), or throughout the plotted time period because of potential changes in process, sample frequency and density, or changes in drainage basin management (Hirsch and others, 2015).
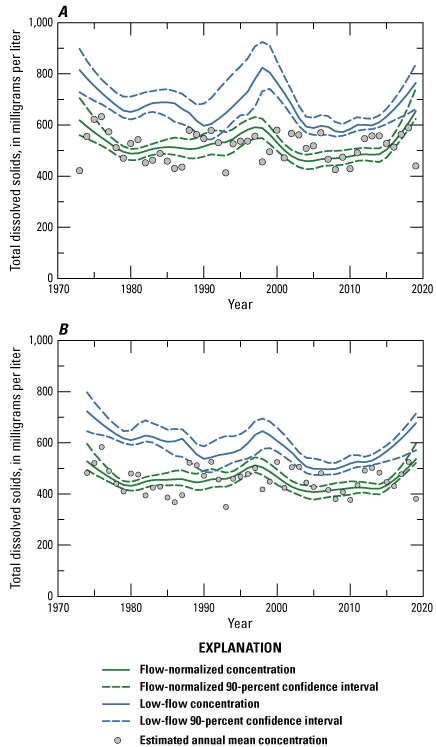
Estimated annual mean, flow-normalized, and low-flow concentrations with 90-percent confidence intervals for total dissolved solids during 1973–2019. A, The Kansas River at Wamego, Kansas, streamgage (U.S. Geological Survey station 06887500). B, The Kansas River at De Soto, Kansas, streamgage (U.S. Geological Survey station 06892350).
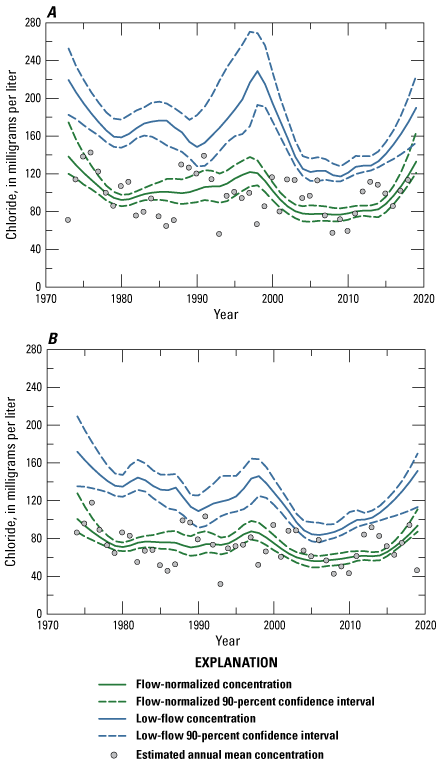
Estimated annual mean, flow-normalized, and low-flow concentrations with 90-percent confidence intervals for chloride during 1973–2019. A, The Kansas River at Wamego, Kansas, streamgage (U.S. Geological Survey station 06887500). B, The Kansas River at De Soto, Kansas, streamgage (U.S. Geological Survey station 06892350).
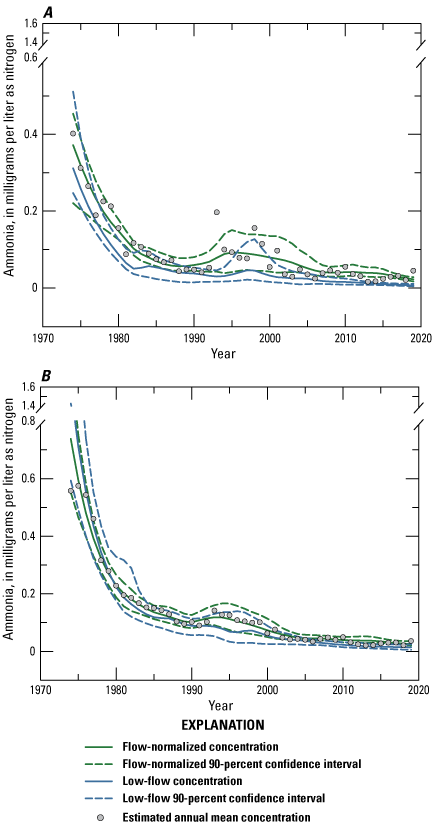
Estimated annual mean, flow-normalized, and low-flow concentrations with 90-percent confidence intervals for ammonia during 1974–2019. A, the Kansas River at Wamego, Kansas, streamgage (U.S. Geological Survey station 06887500). B, the Kansas River at De Soto, Kansas, streamgage (U.S. Geological Survey station 06892350).
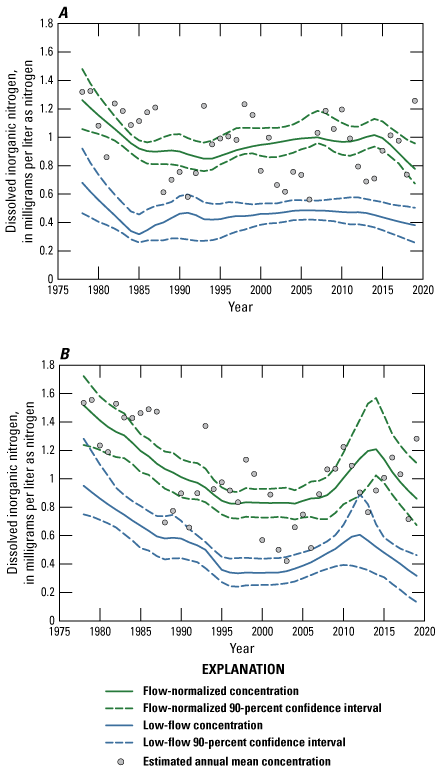
Graphs showing estimated annual mean, flow-normalized, and low-flow concentrations with 90-percent confidence intervals for dissolved inorganic nitrogen during 1978–2019. A, The Kansas River at Wamego, Kansas, streamgage (U.S. Geological Survey station 06887500). B, The Kansas River at De Soto, Kansas, streamgage (U.S. Geological Survey station 06892350).
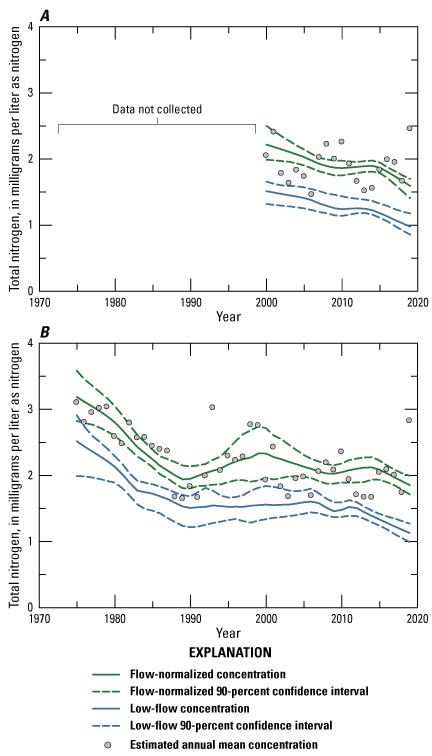
Estimated annual mean, flow-normalized, and low-flow concentrations with 90-percent confidence intervals for total nitrogen during 1975–2019. A, The Kansas River at Wamego, Kansas, streamgage (U.S. Geological Survey station 06887500). B, the Kansas River at De Soto, Kansas, streamgage (U.S. Geological Survey station 06892350).
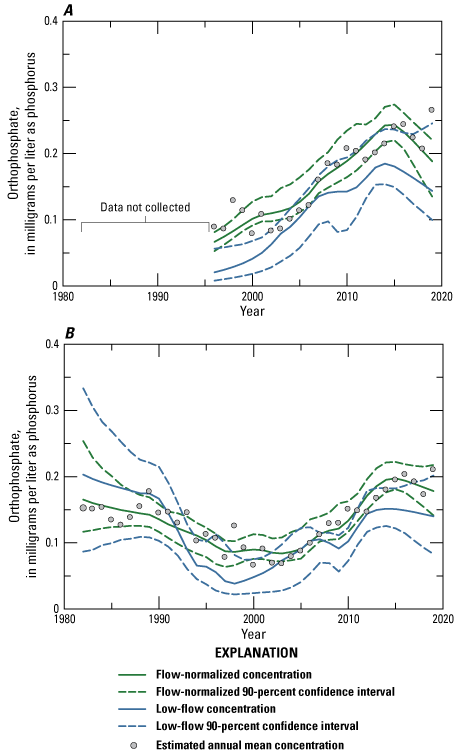
Estimated annual mean, flow-normalized, and low-flow concentrations with 90-percent confidence intervals for orthophosphate during 1982–2019. A, The Kansas River at Wamego, Kansas, streamgage (U.S. Geological Survey station 06887500). B, the Kansas River at De Soto, Kansas, streamgage (U.S. Geological Survey station 06892350).
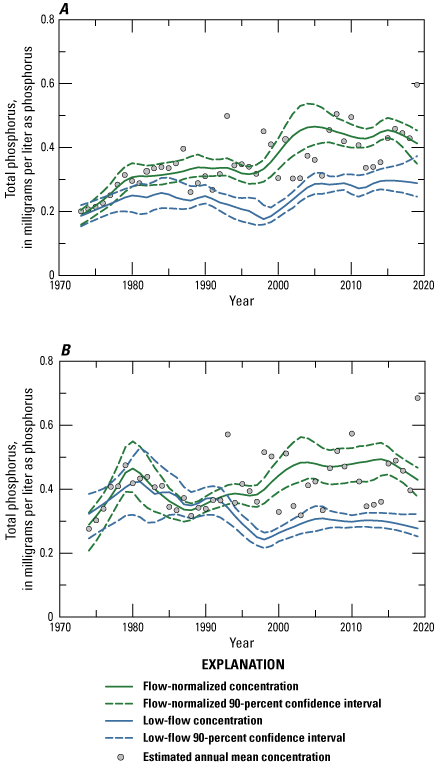
Estimated annual mean, flow-normalized, and low-flow concentrations with 90-percent confidence intervals for total phosphorus during 1973–2019. A, The Kansas River at Wamego, Kansas, streamgage (U.S. Geological Survey station 06887500). B, the Kansas River at De Soto, Kansas, streamgage (U.S. Geological Survey station 06892350).
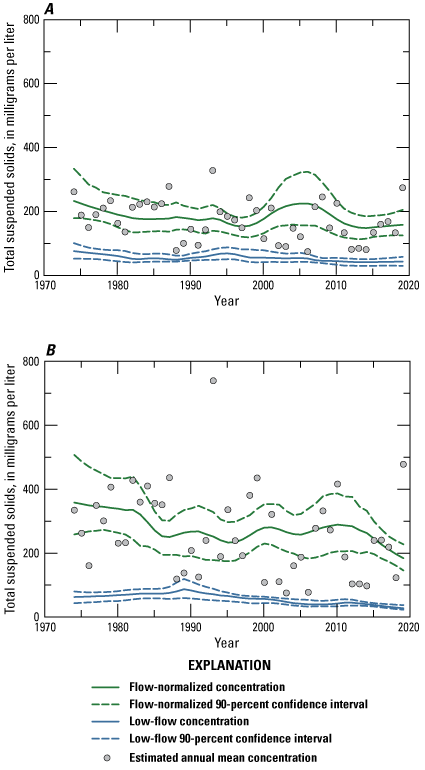
Estimated annual mean, flow-normalized, and low-flow concentrations with 90-percent confidence intervals for total suspended solids during 1974–2019. A, The Kansas River at Wamego, Kansas, streamgage (U.S. Geological Survey station 06887500). B, the Kansas River at De Soto, Kansas, streamgage (U.S. Geological Survey station 06892350).
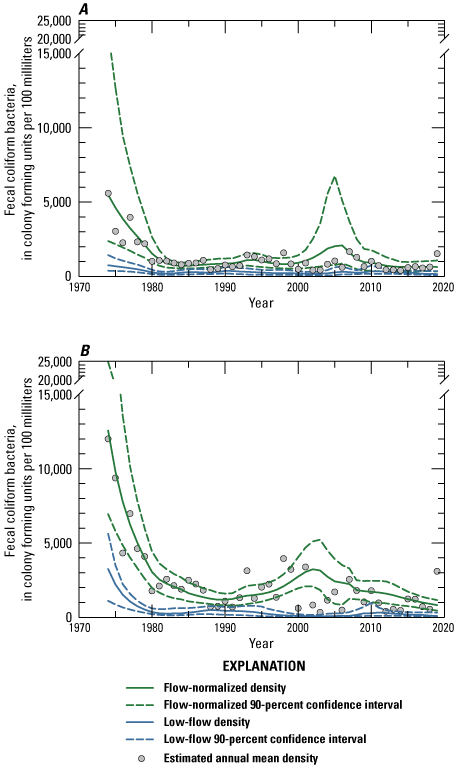
Estimated annual mean, flow-normalized, and low-flow densities with 90-percent confidence intervals for fecal coliform bacteria during 1974–2019. A, The Kansas River at Wamego, Kansas, streamgage (U.S. Geological Survey station 06887500). B, The Kansas River at De Soto, Kansas, streamgage (U.S. Geological Survey station 06892350).
Total Dissolved Solids and Chloride
Based on the WBT trend likelihood descriptors (Hirsch and others, 2015; table 4), flow-normalized total dissolved solids concentrations were likely to have an upward trend at Wamego (5.7-percent increase) between 1973 and 2019 and not likely to have a trend (upward trend is about as likely as not) at De Soto between 1974 and 2019 (table 5). During the same time periods, flow-normalized total dissolved solids loads were likely to have upward trends at both sites (4.9- and 6.3-percent increases at Wamego and De Soto, respectively; table 5). Low-flow (10th percentile of streamflows during 1972 through 2020 at Wamego and De Soto [840 ft3/s and 1,200 ft3/s, respectively]) total dissolved solids concentrations were likely to have downward trends at Wamego and De Soto (6.2- and 6.3-percent decreases, respectively) during the same time periods (table 6). Estimated annual mean, flow-normalized, and low-flow total dissolved solids concentrations with 90-percent confidence intervals at Wamego and De Soto are shown in figures 6A–B.
Flow-normalized chloride concentrations were not likely to have a trend at Wamego between 1973 and 2019 and were likely to have a downward trend at De Soto (7-percent decrease) between 1974 and 2019 (table 5). Similarly, flow-normalized chloride loads were not likely to have a trend at Wamego and were likely to have a downward trend at De Soto (6.7-percent decrease) during the same time periods (table 5). Low-flow chloride concentrations were likely to have downward trends at Wamego (13-percent decrease) and De Soto (12-percent decrease) during the same time periods (table 6). Estimated annual mean, flow-normalized, and low-flow chloride concentrations with 90-percent confidence intervals at Wamego and De Soto are shown in figures 7A–B.
Nutrients
All flow-normalized concentrations and loads of nitrogen species (ammonia, dissolved inorganic nitrogen, and total nitrogen) were very likely or highly likely to have downward trends at Wamego and De Soto. Similarly, all low-flow concentrations of nitrogen species were highly likely to have downward trends at both sites. Flow-normalized ammonia concentrations were highly likely to have downward trends at Wamego (94-percent decrease) and De Soto (97-percent decrease) between 1974 and 2019 (table 5). Similarly, flow-normalized ammonia loads were very likely to have a downward trend at Wamego (89-percent decrease) and were highly likely to have a downward trend at De Soto (94-percent decrease) during the same time period (table 5). Low-flow ammonia concentrations were also highly likely to have downward trends at Wamego and De Soto (98-percent decreases at both sites) during the same time period (table 6). Flow-normalized dissolved inorganic nitrogen concentrations were highly likely to have downward trends at Wamego (38-percent decrease) and De Soto (43-percent decrease) between 1978 and 2019 (table 5). Flow-normalized dissolved inorganic nitrogen loads were also highly likely to have downward trends at both sites (27- and 38-percent decreases at Wamego and De Soto, respectively) during the same time period (table 5). Low-flow dissolved inorganic nitrogen concentrations were highly likely to have downward trends at Wamego (44-percent decrease) and De Soto (67-percent decrease) during the same time period (table 6). Flow-normalized total nitrogen concentrations were highly likely to have downward trends between 2000 and 2019 at Wamego (28-percent decrease) and between 1975 and 2019 at De Soto (42-percent decrease; table 5). Similarly, flow-normalized total nitrogen loads were highly likely to have downward trends at Wamego (23-percent decrease) and De Soto (31-percent decrease) during the same time periods (table 5). Low-flow total nitrogen concentrations were highly likely to have downward trends at Wamego (36-percent decrease) and De Soto (55-percent decrease) during the same time periods (table 6). Percent decreases in flow-normalized and low-flow concentrations and loads of nitrogen species were generally larger at De Soto. Estimated annual mean, flow-normalized, and low-flow ammonia, dissolved inorganic nitrogen, and total nitrogen concentrations with 90-percent confidence intervals at Wamego and De Soto are shown in figures 8A–10B.
Flow-normalized concentrations and loads of phosphorus species (orthophosphate and total phosphorus) generally had upward trends at both sites during the study period. Low-flow trends in concentration were less consistent at the De Soto site, with results indicating likely downward trends. Flow-normalized orthophosphate concentrations were highly likely to have an upward trend at Wamego between 1996 and 2019 (180-percent increase) and were not likely to have a trend at De Soto between 1982 and 2019 (table 5). Flow-normalized orthophosphate loads were highly likely to have upward trends at Wamego (120-percent increase) and De Soto (39-percent increase) during the same time periods (table 5). Low-flow orthophosphate concentrations were highly likely to have an upward trend at Wamego (590-percent increase) and were likely to have a downward trend at De Soto (31-percent decrease) during the same time periods (table 6). Flow-normalized total phosphorus concentrations were highly likely to have upward trends between 1973 and 2019 at Wamego (120-percent increase) and between 1974 and 2019 at De Soto (49-percent increase; table 5). Similarly, flow-normalized total phosphorus loads were highly likely to have upward trends at Wamego (220-percent increase) and De Soto (150-percent increase) during the same time periods (table 5). Low-flow total phosphorus concentrations were highly likely to have an upward trend at Wamego (55-percent increase) and were likely to have a downward trend at De Soto (14-percent decrease) during the same time periods (table 6). Percentage increases in flow-normalized concentrations and loads were consistently larger at the Wamego site for orthophosphate and total phosphorus. Estimated annual mean, flow-normalized, and low-flow orthophosphate and total phosphorus concentrations with 90-percent confidence intervals at Wamego and De Soto are shown in figures 11A–12B.
Total Suspended Solids
Flow-normalized total suspended solids concentrations were highly likely to have a downward trend at Wamego (32-percent decrease) and De Soto (49-percent decrease) between 1974 and 2019 (table 5). Similarly, flow-normalized total suspended solids loads were likely to have a downward trend at Wamego (28-percent decrease) and were very likely to have a downward trend at De Soto (49-percent decrease) during the same time period (table 5). Low-flow total suspended solids concentrations were highly likely to have downward trends at Wamego (45-percent decrease) and De Soto (55-percent decrease) during the same time period (table 6). Percentage decreases in flow-normalized and low-flow concentrations and loads were consistently larger at De Soto. Estimated annual mean, flow-normalized, and low-flow total suspended solids concentrations with 90-percent confidence intervals at Wamego and De Soto are shown in figures 13A–B.
Fecal Coliform Bacteria
Flow-normalized fecal coliform bacteria densities were very likely to have a downward trend at Wamego (88-percent decrease) and were highly likely to have a downward trend at De Soto (93-percent decrease) between 1974 and 2019 (table 5). Similarly, flow-normalized fecal coliform bacteria loads were likely to have a downward trend at Wamego (76-percent decrease) and De Soto (85-percent decrease) during the same time period (table 5). Low-flow fecal coliform bacteria densities were highly likely to have downward trends at Wamego (79-percent decrease) and De Soto (97-percent decrease) during the same time period (table 6). Percentage decreases in flow-normalized and low-flow densities and loads were consistently larger at De Soto. Estimated annual mean, flow-normalized, and low-flow fecal coliform bacteria densities with 90-percent confidence intervals at Wamego and De Soto are shown in figures 14A–B.
Discussion
Since the passage of the CWA in 1972, 5 of the 9 priority constituents evaluated in this report exhibited downward trends in concentration at upstream (Wamego) and downstream (De Soto) locations on the Kansas River during mean-flow conditions. Seven of the 9 constituents exhibited downward trends at both sites during low-flow conditions, potentially reflecting reductions in point-source contributions to the Kansas River, similar to findings in other U.S. surface waters (Litke, 1999; Stets and others, 2020). Particularly notable were 94–97-percent decreases in ammonia concentrations (table 5), including a 98-percent reduction at both sites during low-flow conditions (table 6), which are similar to patterns observed nationally (Stets and others, 2020; Lee, 2022) and locally in the Little Arkansas River, Kans. (Stone and Klager, 2023). In addition to ammonia, downward trends in dissolved inorganic nitrogen and total nitrogen during mean- and low-flow conditions have been observed in streams and rivers in the Mississippi River Basin (Stackpoole and others, 2021; Lee, 2022). Compared to Wamego, somewhat larger decreases in dissolved inorganic nitrogen and total nitrogen concentrations observed at De Soto, particularly during low-flow conditions, may reflect reductions in point-source contributions in the intervening basin. Downward trends in ammonia, dissolved inorganic nitrogen, and total nitrogen loads were generally smaller than corresponding reductions in concentration on a percentage basis, further indicating that observed trends in these constituents are primarily at low-flow conditions. However, significant differences among USGS and KDHE nitrate results during similar periods and hydrologic conditions (table 3) should warrant consideration when interpreting dissolved inorganic nitrogen and total nitrogen trends when high proportions of data were collected by one agency (table 1). Additionally, USGS total Kjeldahl nitrogen results were significantly larger than those reported by KDHE during similar periods and hydrologic conditions at Wamego (table 3) and, thus, the observed downward trend in total nitrogen at Wamego could be because more KDHE results were utilized during 2000 through 2020 (table 1).
Orthophosphate and total phosphorus generally had upward trends at Wamego and De Soto; concentrations increased at both sites during mean-flow conditions, except for orthophosphate at De Soto, which had no likely trend. Concentrations also increased at Wamego during low-flow conditions (tables 5–6). Long-term, upward orthophosphate and total phosphorus trends have also been observed at the North Fork Ninnescah River in south-central Kansas (Kramer and others, 2021) and at sites in the Mississippi River Basin (Stackpoole and others, 2021; Lee, 2022). Upward trends in the Mississippi River Basin have been attributed to tile drains, decreased ability of soils and other terrestrial sinks to store phosphorus, and no-till farming practices that may increase the potential for phosphorus delivery to freshwater streams by way of groundwater leaching or surface runoff (Sabo and others, 2021; Stackpoole and others, 2021). Increasing total phosphorus concentrations were documented at Wamego and De Soto during mean-flow conditions. Increasing total phosphorus concentrations during low-flow conditions at Wamego can primarily be attributed to changes in orthophosphate, which increased at both sites (and during mean- and low-flow conditions) during 2005 through 2019 (figs. 11A–B). Additionally, the increase in flow-normalized orthophosphate was larger than observed for total phosphorus at Wamego and De Soto during years when annual flow-normalized concentrations of both constituents were available (1996–2019), indicating that increasing mean total phosphorus concentrations during this time can also primarily be explained by increases in orthophosphate. Increasing total phosphorus concentrations during mean flows and increasing total phosphorus loads may indicate that changes in the application and (or) transport of nonpoint sources could be a driver of these trends. Recent improvements in nutrient reduction technologies used during wastewater treatment along the Kansas River (Tom Stiles, KDHE, written commun., February 23, 2024) have the potential to affect orthophosphate and total phosphorus trends moving forward. Reevaluation of these trends would be beneficial after additional data are collected that could be affected by these wastewater-treatment improvements.
Trends in chloride concentration and load ranged from no likely trend at Wamego to a likely downward trend at De Soto during mean-flow conditions, and likely downward trends in concentration at both sites during low-flow conditions (tables 5–6). These trends are dissimilar to upward chloride trends observed across most land-use types nationally (Stets and others, 2020) and at most sites in the Mississippi River Basin during a similar time span (Lee, 2022). However, long-term downward trends in chloride have been observed at two sites in the Little Arkansas River, Kans., during 1995 through 2019 (43- and 54-percent decreases; Stone and Klager, 2023) and at the North Canadian River near Harrah, Oklahoma, during 1971 through 2021 (42-percent decrease; Lee, 2022). Upward trends during mean-flow conditions were observed for total dissolved solids concentrations and loads, and downward trends were observed during low-flow conditions (tables 5–6). The downward trends in total dissolved solids during low-flow conditions were smaller in magnitude than those observed for chloride (table 6). Divergent trends among chloride and total dissolved solids during mean-flow conditions could be explained by an observed decrease in the percentage of chloride anions in the cation-anion balance between the beginning and end of the study period. Unlike the patterns observed with nutrients, trends in chloride and total dissolved solids loads were similar in magnitude to trends in concentration (table 5). Fluctuations in the contribution of streamflow from the naturally saline Smoky Hill River (Whittemore and others, 1993) may be driving the chloride and total dissolved solids trends in the Kansas River.
Decreasing total suspended solids concentrations in the Kansas River were similar to patterns observed nationally (Lee, 2022) and in the Mississippi River Basin (Mize and others, 2018) for suspended sediment, and have been attributed to reservoir construction, channel improvements, and soil conservation practices (Meade and Moody, 2010; Mize and others, 2018). Decreasing total suspended solids concentrations in the Kansas River were primarily observed during 1974 through 2000; flow-normalized concentrations were somewhat static at both sites during 2000 through 2019 (figs. 13A–B). However, USGS total suspended solids results were significantly larger than those reported by KDHE during similar periods and hydrologic conditions (table 3) and, thus, a continued downward trend in concentration could be masked by utilizing more USGS results during 2000 through 2020 (table 1).
Similar to total suspended solids, downward trends in fecal coliform bacteria were predominantly observed during mean-flow conditions and during 1974 through 1985 at Wamego and during 1974 through 1990 at De Soto (figs. 14A–B). Mean fecal coliform densities in 1974 were much higher at De Soto (approximately 12,000 colony forming units per 100 milliliters) than Wamego (approximately 5,600 colony forming units per 100 milliliters) and, thus, had more opportunity for improvement. Long-term downward trends in fecal indicator bacteria have also been observed in the Little Arkansas River, Kans. (Stone and Klager, 2023). Fecal coliform densities are highly correlated to turbidity and associated suspended sediment in the Kansas River (Rasmussen and Ziegler, 2003), and, thus, downward trends are likely related to those observed for total suspended solids in addition to potential improvements in wastewater disinfection and point-source management.
Summary
The Clean Water Act (CWA; formally referred to as the Federal Water Pollution Control Act) was passed by Congress in 1972 to provide a structure for regulating the discharge of pollutants into United States waters. The Kansas River, an essential water resource for eastern Kansas, provides recreational and industrial uses, food procurement, groundwater recharge, irrigation, livestock water use, and drinking water to more than 950,000 people in northeastern Kansas. The U.S. Geological Survey (USGS), in cooperation with the Kansas Department of Health and Environment (KDHE), the Kansas Water Office, the Nature Conservancy, the City of Lawrence, the City of Manhattan, the City of Olathe, the City of Topeka, WaterOne, and Evergy, compiled and analyzed historical streamflow and water-quality data collected by USGS and KDHE to characterize trends in water-quality constituents of interest in the Kansas River since the passage of the CWA in 1972.
Data collected by the USGS and KDHE during 1972 through 2020 were used to characterize trends in concentrations and loads of total dissolved solids, chloride, ammonia, dissolved inorganic nitrogen, total nitrogen, orthophosphate, total phosphorus, total suspended solids, and fecal coliform bacteria densities. These data were analyzed during mean- and low-flow conditions using the Weighted Regressions on Time, Discharge, and Season (WRTDS) model. WRTDS models that compute flow-normalized and low-flow concentrations and loads of water-quality constituents of interest were developed near the headwaters (Kansas River at Wamego, Kansas; USGS station 06887500; hereafter referred to as “Wamego”) and mouth (Kansas River at De Soto, Kansas; USGS station 06892350; hereafter referred to as “De Soto”) of the main-stem Kansas River to characterize trends in water-quality since the passage of the CWA. The USGS and KDHE collected streamflow (USGS only) and discrete water-quality data at Wamego and De Soto during 1972 through 2020 over a range of streamflow conditions during several historical sampling projects. Quantile-Kendall plots that characterized potential trends in streamflow over time revealed no significant trends in streamflow at Wamego and De Soto during 1972 through 2020.
Water-quality trends in concentrations and loads of total dissolved solids, chloride, ammonia, dissolved inorganic nitrogen, total nitrogen, orthophosphate, total phosphorus, total suspended solids, and fecal coliform bacteria densities were computed and analyzed using the Exploration and Graphics for RivER Trends (EGRET) R package. The EGRET R package uses WRTDS to compute flow-normalized trends of water-quality concentrations and loads while removing the effects of seasonality and year-to-year variations related to streamflow. The Exploration and Graphics for RivEr Trends Confidence Intervals (EGRETci) R package and WRTDS bootstrap test were used to estimate the uncertainty and likelihood of upward or downward trends in concentrations and loads for the constituents of interest. To characterize the effects of point-source pollution, water-quality trends during low-flow conditions were also investigated.
Since the passage of the CWA in 1972, 5 of the 9 priority constituents evaluated in this report exhibited downward trends in concentration and load at upstream (Wamego) and downstream (De Soto) locations on the Kansas River during mean-flow conditions. Seven of the 9 constituents exhibited downward trends at both sites during low-flow conditions, potentially reflecting reductions in point-source contributions to the Kansas River. Downward trends in ammonia, dissolved inorganic nitrogen, and total nitrogen during mean- and low-flow conditions were similar to patterns observed in other streams and rivers in the Mississippi River Basin and nationally. Downward trends in ammonia, dissolved inorganic nitrogen, and total nitrogen loads were generally smaller than corresponding reductions in concentration, potentially indicating that observed trends in these constituents occurred primarily during low-flow conditions. Orthophosphate and total phosphorus generally had upward trends at both sites. Increasing total phosphorus concentrations during mean flows and increasing total phosphorus loads likely indicate that changes in the application and (or) transport of nonpoint sources may be the primary driver of these trends. Chloride trends ranged from no likely trend to downward during mean-flow conditions and downward during low-flow conditions. Upward trends during mean-flow conditions were observed for total dissolved solids concentrations and loads, and downward trends were observed during low-flow conditions. Unlike the patterns observed with nutrients, trends in chloride and total dissolved solids loads were similar in magnitude to trends in concentration. Downward trends in total suspended solids concentrations and loads were observed, similar to patterns observed nationally and in the Mississippi River Basin for suspended sediment. Downward trends in fecal coliform bacteria were predominantly observed during mean-flow conditions and are likely related to those observed for total suspended solids in addition to potential improvements in wastewater disinfection and point-source management.
The water-quality constituents investigated in this study were identified by the USGS and KDHE for their importance related to water-quality issues, including water-supply, drinking-water treatment, and sediment and nutrient transport. The long-term data and trend analyses conducted herein were an essential step to understanding how water-quality conditions have changed in the Kansas River since the passage of the CWA. However, detailed attribution of specific causes for observed trends is beyond the scope of this report.
References Cited
Briggs, J.C., and Ficke, J.F., 1977, Quality of rivers of the United States, 1975 water year based on the National Stream Quality Accounting Network (NASQAN): U.S. Geological Survey Open-File Report 78–200, 436 p., accessed August 2023 at https://pubs.usgs.gov/of/1978/0200/report.pdf.
Fishman, M.J., and Friedman, L.C., 1989, Methods for determination of inorganic substances in water and fluvial sediments (3d ed.): U.S. Geological Survey Techniques of Water-Resources Investigations, book 5, chap. A1, 545 p., accessed August 2023 at https://doi.org/10.3133/twri05A1.
Foster, G.M., and Graham, J.L., 2016, Logistic and linear regression model documentation for statistical relations between continuous real-time and discrete water-quality constituents in the Kansas River, Kansas, July 2012 through June 2015: U.S. Geological Survey Open-File Report 2016–1040, 27 p., accessed August 2023 at https://doi.org/10.3133/ofr20161040.
Fry, J.A., Xian, G.S., Jin, S., Dewitz, J., Homer, C.G., Yang, L., Barnes, C.A., Herold, N.D., and Wickham, J.D., 2011, Completion of the 2006 National Land Cover Database for the conterminous United States: Photogrammetric Engineering and Remote Sensing, v. 77, no. 9, p. 858–864. [Also available at https://cfpub.epa.gov/si/si_public_file_download.cfm?p_download_id=506292&Lab=NERL.]
Graham, J.L., Foster, G.M., Williams, T.J., Mahoney, M.D., May, M.R., and Loftin, K.A., 2018, Water-quality conditions with an emphasis on cyanobacteria and associated toxins and taste-and-odor compounds in the Kansas River, Kansas, July 2012 through September 2016: U.S. Geological Survey Scientific Investigations Report 2018–5089, 55 p., accessed August 2023 at https://doi.org/10.3133/sir20185089.
Graham, J.L., Ziegler, A.C., Loving, B.L., and Loftin, K.A., 2012, Fate and transport of cyanobacteria and associated toxins and taste-and-odor compounds from upstream reservoir releases in the Kansas River, Kansas, September and October 2011: U.S. Geological Survey Scientific Investigations Report 2012–5129, 65 p., accessed September 2023 at https://doi.org/10.3133/sir20125129.
Helgesen, J.O., 1996, Surface-water-quality assessment of the lower Kansas River basin, Kansas and Nebraska-results of investigations, 1987–90: U.S. Geological Survey Water-Supply Paper 2451, 129 p., accessed September 2023 at https://doi.org/10.3133/wsp2451.
Helsel, D.R., Hirsch, R.M., Ryberg, K.R., Archfield, S.A., and Gilroy, E.J., 2020, Statistical methods in water resources: U.S. Geological Survey Techniques and Methods, book 4, chap. A3, 458 p., accessed July 2023 at https://doi.org/10.3133/tm4A3. [Supersedes USGS Techniques of Water-Resources Investigations, book 4, chap. A3, ver. 1.1.]
Hirsch, R.M., 2018, Daily streamflow trend analysis: U.S. Geological Survey Office of Water Information Blog, accessed September 2023 at https://waterdata.usgs.gov/blog/quantile-kendall/.
Hirsch, R.M., Alley, W.M., and Wilber, W.G., 1988, Concepts for a national water-quality assessment program: U.S. Geological Survey Circular 1021, 42 p., accessed September 2023 at https://doi.org/10.3133/cir1021.
Hirsch, R.M., Archfield, S.A., and De Cicco, L.A., 2015, A bootstrap method for estimating uncertainty of water quality trends: Environmental Modelling & Software, v. 73, p. 148–166, accessed July 2023 at https://doi.org/10.1016/j.envsoft.2015.07.017.
Hirsch, R.M., and De Cicco, L.A., 2015, User guide to Exploration and Graphics for RivEr Trends (EGRET) and dataRetrieval—R packages for hydrologic data (ver. 2.0, February 2015): U.S. Geological Survey Techniques and Methods, book 4, chap. A10, 93 p., accessed July 2023 at https://doi.org/10.3133/tm4A10.
Hirsch, R.M., Moyer, D.L., and Archfield, S.A., 2010, Weighted regressions on time, discharge, and season (WRTDS), with an application to Chesapeake Bay River inputs: Journal of the American Water Resources Association, v. 46, no. 5, p. 857–880, accessed July 2023 at https://doi.org/10.1111/j.1752-1688.2010.00482.x.
Jordan, P.R., 1995, Surface-water-quality assessment of the lower Kansas River Basin, Kansas and Nebraska—Suspended-sediment conditions, May 1987 through April 1990, and trends, 1963 through April 1990: U.S. Geological Survey Water-Resources Investigations Report 94–4187, 36 p., accessed September 2023 at https://doi.org/10.3133/wri944187.
Jordan, P.R., and Stamer, J.K., 1995, Surface-water-quality assessment of the lower Kansas River Basin, Kansas and Nebraska, analysis of data through 1986: U.S. Geological Survey Water-Supply Paper 2352–B, 161 p., accessed September 2023 at https://doi.org/10.3133/wsp2352B.
Kansas Department of Agriculture, 2023, Kansas farm facts 2022: Kansas Department of Agriculture, 144 p., accessed December 2023 at https://agriculture.ks.gov/docs/default-source/ag-marketing/farm-facts-2022-final.pdf?sfvrsn=218398c1_4.
Kansas Department of Health and Environment, 2017, Kansas-Lower Republican River Basin [total maximum daily load]: Kansas Department of Health and Environment web page, accessed August 2023 at https://www.kdhe.ks.gov/1455/Kansas-Lower-Republican-River-Basin.
Kansas Department of Health and Environment, 2020, Stream Chemistry Monitoring Program quality assurance management plan: 128 p., accessed August 2023 at https://www.kdhe.ks.gov/DocumentCenter/View/14394/Stream-Chemistry-Monitoring-Program---Part-III-PDF.
Kansas Department of Health and Environment, 2022, 303(d) list of all impaired & potentially impaired waters: Kansas Department of Health and Environment web page, 70 p., accessed February 2024 at https://www.kdhe.ks.gov/DocumentCenter/View/22777/2022-303d-List-PDF?bidId=.
Kramer, A.R., Klager, B.J., Stone, M.L., and Eslick-Huff, P.J., 2021, Regression relations and long-term water-quality constituent concentrations, loads, yields, and trends in the North Fork Ninnescah River, south-central Kansas, 1999–2019: U.S. Geological Survey Scientific Investigations Report 2021–5006, 51 p., accessed January 2024 at https://doi.org/10.3133/sir20215006.
Lee, C.J., 2022, Nutrient and pesticide data collected from the USGS National Water Quality Network and previous networks, 1950–2021: U.S. Geological Survey, accessed August 2023 at https://doi.org/10.5066/P948Z0VZ.
Lee, C.J., and Henderson, R.J., 2020, Tracking water quality in U.S. streams and rivers—Methods and glossary: U.S. Geological Survey web page, accessed September 2023 at https://nrtwq.usgs.gov/nwqn/#/TECH.
Lee, C.J., Murphy, J.C., Crawford, C.G., and Deacon, J.R., 2017, Methods for computing water-quality loads at sites in the U.S. Geological Survey National Water Quality Network (ver. 1.2, November 2020): U.S. Geological Survey Open-File Report 2017–1120, 20 p., accessed September, 2023, at https://doi.org/10.3133/ofr20171120.
Litke, D.W., 1999, Review of phosphorus control measures in the United States and their effects on water quality: U.S. Geological Survey Water-Resources Investigations Report 99–4007, 38 p. [Also available at https://doi.org/10.3133/wri994007.]
Mann, H.B., 1945, Nonparametric tests against trend: Econometrica, v. 13, no. 3, p. 245–259, accessed February 2024 at https://doi.org/10.2307/1907187.
Meade, R.H., and Moody, J.A., 2010, Causes for the decline of suspended-sediment discharge in the Mississippi River system, 1940–2007: Hydrological Processes, v. 24, no. 1, p. 35–49, accessed September 2023, at https://doi.org/10.1002/hyp.7477.
Mize, S.V., Murphy, J.C., Diehl, T.H., and Demcheck, D.K., 2018, Suspended-sediment concentrations and loads in the lower Mississippi and Atchafalaya Rivers decreased by half between 1980 and 2015: Journal of Hydrology, v. 564, p. 1–11, accessed September 2023 at https://doi.org/10.1016/j.jhydrol.2018.05.068.
Mueller, D.K., Schertz, T.L., Martin, J.D., and Sandstrom, M.W., 2015, Design, analysis, and interpretation of field quality-control data for water-sampling projects: U.S. Geological Survey Techniques and Methods, book 4, chap. C4, 54 p., accessed July 2023 at https://doi.org/10.3133/tm4C4.
Myers, D.N., Stoeckel, D.M., Bushon, R.N., Francy, D.S., and Brady, A.M.G., 2014, Chapter A7.1, Fecal indicator bacteria (ver. 2.1, May 2014): U.S. Geological Survey Techniques of Water-Resources Investigations, book 9, chap. A7.1., accessed August 2023 at https://doi.org/10.3133/twri09A7.1.
Painter, C.C., and Loving, B.L., 2015, U.S. Geological Survey quality-assurance plan for surface-water activities in Kansas, 2015: U.S. Geological Survey Open-File Report 2015–1074, 33 p., accessed July 2013 at https://doi.org/10.3133/ofr20151074.
Pope, L.M., 1994, Surface-water quality assessment of the lower Kansas River Basin, Kansas and Nebraska—Dissolved oxygen and Escherichia coli bacteria in streams during low flow, July 1988 through July 1989: U.S. Geological Survey Water-Resources Investigations Report 94–4077, 102 p., accessed September 2023 at https://doi.org/10.3133/wri944077.
Rasmussen, P.P., and Christensen, V.G., 2005, Hydrologic and water-quality conditions in the Kansas River, northeast Kansas, November 2001–August 2002, and simulation of ammonia assimilative capacity and bacteria transport during low flow: U.S. Geological Survey Scientific Investigations Report 2005–5188, 111 p., accessed August 2023 at https://doi.org/10.3133/sir20055188.
Rasmussen, T.J., Ziegler, A.C., and Rasmussen, P.P., 2005, Estimation of constituent concentrations, densities, loads, and yields in lower Kansas River, northeast Kansas, using regression models and continuous water-quality monitoring, January 2000 through December 2003: U.S. Geological Survey Scientific Investigations Report 2005–5165, 117 p., accessed August 2023 at https://doi.org/10.3133/sir20055165.
Sabo, R.D., Clark, C.M., Gibbs, D.A., Metson, G.S., Todd, M.J., LeDuc, S.D., Greiner, D., Fry, M.M., Polinsky, R., Yang, Q., Tian, H., and Compton, J.E., 2021, Phosphorus inventory for the conterminous United States (2002–2012): Journal of Geophysical Research—Biogeosciences, v. 126, no. 4, 21 p., accessed September 2023 at https://doi.org/10.1029/2020JG005684.
Sauer, V.B., and Turnipseed, D.P., 2010, Stage measurement at gaging stations: U.S. Geological Survey Techniques and Methods, book 3, chap. A7, 45 p., accessed July 2023 at https://doi.org/10.3133/tm3A7.
Stackpoole, S., Sabo, R., Falcone, J., and Sprague, L., 2021, Long-term Mississippi River trends expose shifts in the river load response to watershed nutrient balances between 1975 and 2017: Water Resources Research, v. 57, no. 11, 19 p., accessed September 2023 at https://doi.org/10.1029/2021WR030318.
Stets, E.G., Sprague, L.A., Oelsner, G.P., Johnson, H.M., Murphy, J.C., Ryberg, K., Vecchia, A.V., Zuellig, R.E., Falcone, J.A., and Riskin, M.L., 2020, Landscape drivers of dynamic change in water quality in U.S. rivers: Environmental Science & Technology, v. 54, no. 7, p. 4336–4343, accessed September 2023at https://doi.org/10.1021/acs.est.9b05344.
Stone, M.L., and Klager, B.J., 2023, Long-term water-quality constituent trends in the Little Arkansas River, south-central Kansas, 1995–2021: U.S. Geological Survey Scientific Investigations Report 2023–5102, 103 p., accessed January 2024 at https://doi.org/10.3133/sir20235102.
Turnipseed, D.P., and Sauer, V.B., 2010, Discharge measurements at gaging stations: U.S. Geological Survey Techniques and Methods, book 3, chap. A8, 87 p., accessed July 2023 at https://doi.org/10.3133/tm3A8.
U.S. Army Corps of Engineers, 2017, Kansas City district lakes: U.S. Army Corps of Engineers web page, accessed August 2023 at https://www.nwk.usace.army.mil/Locations/District-Lakes/.
U.S. Environmental Protection Agency, 1972, EPA history—Water—The challenge of the environment—A primer on EPA's statutory authority: U.S. Environmental Protection Agency archived web page, accessed September 2023 at https://www.epa.gov/archive/epa/aboutepa/epa-history-water-challenge-environment-primer-epas-statutory-authority.html.
U.S. Environmental Protection Agency, 2023a, Summary of the Clean Water Act – 33 U.S.C. §1251 et seq. (1972): U.S. Environmental Protection Agency web page, accessed September 2023 at https://www.epa.gov/laws-regulations/summary-clean-water-act.
U.S. Environmental Protection Agency, 2023b, Overview of Total Maximum Daily Loads (TMDLs): U.S. Environmental Protection Agency web page, accessed February 2024 at https://www.epa.gov/tmdl/overview-total-maximum-daily-loads-tmdls.
U.S. Geological Survey, 1992, Discontinuation of the National Water Quality Laboratory determinations for “total” nitrite, “total” nitrite plus nitrate, “total” ammonia, and “total” orthophosphate (using the four-channel analyzer): U.S. Geological Survey Office of Water Quality Technical Memorandum 93.04, accessed August 2023 at https://water.usgs.gov/admin/memo/QW/qw93.04.html.
U.S. Geological Survey, 2006, Collection of water samples (ver. 2.0, September 2006): U.S. Geological Survey Techniques of Water-Resources Investigations, book 9, chap. A4, 166 p., accessed August 2023 at https://doi.org/10.3133/twri09A4.
U.S. Geological Survey, 2017, Procedures for processing, approving, publishing, and auditing time-series records for water data: U.S. Geological Survey Office of Water Quality Technical Memorandum 2017.07, accessed July 2023 at https://water.usgs.gov/admin/memo/QW/qw2017.07.pdf.
U.S. Geological Survey, 2023, USGS water data for the Nation: U.S. Geological Survey National Water Information System database, accessed August 2023 at https://doi.org/10.5066/F7P55KJN.
Whittemore, D.O., Macfarlane, P.A., Doveton, J.H., Butler, J.J., Chu, T., Bassler, R., Smith, M., Mitchell, J., and Wade, A., 1993, The Dakota Aquifer Program Annual Report, FY92: Kansas Geological Survey Open-File Report 93–1, accessed February 2024 at https://www.kgs.ku.edu/Dakota/vol3/fy92/OFR93_1.pdf.
Williams, T.J., 2021, Linear regression model documentation and updates for computing water-quality constituent concentrations or densities using continuous real-time water-quality data for the Kansas River, Kansas, July 2012 through September 2019: U.S. Geological Survey Open-File Report 2021–1018, 18 p., accessed July 2023 at https://doi.org/10.3133/ofr20211018.
Williams, T.J., 2023, Linear regression model documentation for computing water-quality constituent concentrations or densities using continuous real-time water-quality data for the Kansas River above Topeka Weir at Topeka, Kansas, November 2018 through June 2021: U.S. Geological Survey Scientific Investigations Report 2022–5130, 14 p., accessed September 2023 at https://doi.org/10.3133/sir20225130.
Williams, T.J., Klager, B.J., and Stiles, T.C., 2024, Water-quality data and computed flow-normalized and low-flow concentrations and loads in the Kansas River, Kansas, 1972–2020: U.S. Geological Survey data release, accessed June 2024 at https://doi.org/10.5066/P9WVZ8X1.
Conversion Factors
U.S. customary units to International System of Units
Temperature in degrees Celsius (°C) may be converted to degrees Fahrenheit (°F) as follows:
°F = (1.8 × °C) + 32.
Supplemental Information
Concentrations of chemical constituents in water are given in milligrams per liter (mg/L).
Densities of fecal coliform bacteria are given in colony forming units per 100 milliliters (cfu/100 mL).
Abbreviations
ANCOVA
analysis of covariance
CWA
Clean Water Act
EGRET
Exploration and Graphics for RivER Trends
EGRETci
Exploration and Graphics for RivER Trends Confidence Intervals
KDHE
Kansas Department of Health and Environment
MRL
minimum reporting limit
p-value
probability value
RPD
relative percentage difference
USGS
U.S. Geological Survey
WBT
Weighted Regressions on Time, Discharge, and Season bootstrap test
WRTDS
Weighted Regressions on Time, Discharge, and Season
For more information about this publication, contact:
Director, USGS Kansas Water Science Center
1217 Biltmore Drive
Lawrence, KS 66049
785–842–9909
For additional information, visit: https://www.usgs.gov/centers/kswsc
Publishing support provided by the
Rolla Publishing Service Center
Disclaimers
Any use of trade, firm, or product names is for descriptive purposes only and does not imply endorsement by the U.S. Government.
Although this information product, for the most part, is in the public domain, it also may contain copyrighted materials as noted in the text. Permission to reproduce copyrighted items must be secured from the copyright owner.
Suggested Citation
Williams, T.J., Klager, B.J., and Stiles, T.C., 2024, Water-quality trends in the Kansas River, Kansas, since enactment of the Clean Water Act, 1972–2020: U.S. Geological Survey Scientific Investigations Report 2024–5050, 29 p., https://doi.org/10.3133/sir20245050.
ISSN: 2328-0328 (online)
Study Area
| Publication type | Report |
|---|---|
| Publication Subtype | USGS Numbered Series |
| Title | Water-quality trends in the Kansas River, Kansas, since enactment of the Clean Water Act, 1972–2020 |
| Series title | Scientific Investigations Report |
| Series number | 2024-5050 |
| DOI | 10.3133/sir20245050 |
| Publication Date | July 02, 2024 |
| Year Published | 2024 |
| Language | English |
| Publisher | U.S. Geological Survey |
| Publisher location | Reston, VA |
| Contributing office(s) | Kansas Water Science Center |
| Description | Report: viii, 29 p.; Data Release; Dataset |
| Country | United States |
| State | Kansas |
| Other Geospatial | Kansas River |
| Online Only (Y/N) | Y |
| Additional Online Files (Y/N) | N |