

Low-Flow Statistics for Selected Streams in New York, Excluding Long Island
Links
- Document: Report (2.39 MB pdf) , HTML , XML
- Data Release: USGS data release - Low-flow statistics for New York State, excluding Long Island, computed through March 2022
- NGMDB Index Page: National Geologic Map Database Index Page (html)
- Download citation as: RIS | Dublin Core
Acknowledgments
The authors would like to thank the New York State Department of Environmental Conservation for providing funding for this work. In addition, we would like to thank Rob Dudley, John Hammond, and Neil Terry of the U.S. Geological Survey for their detailed reviews of this manuscript and data release.
Abstract
The U.S. Geological Survey, in cooperation with the New York State Department of Environmental Conservation, updated low-streamflow statistics for New York, excluding Long Island and including hydrologically connected watersheds in bordering States, for the first time since 1972. Historical daily streamflow data for active and inactive gages were considered for this study with periods of record as recent as March 31, 2022, adding 50 years of data to the last published low-streamflow statistics report for New York and including 119 new gages where low-streamflow statistics are calculated for the first time. Gages were evaluated across several criteria to identify gages that were not suitable for low-streamflow frequency analysis. In addition, gages were evaluated for the presence of alteration within the streamflow period of record based on previous studies and U.S. Geological Survey National Water Information System site metadata including peak flow codes.
A trend analysis was performed using the Wilcoxon rank-sum hypothesis test comparing data from the most recent 30 years of record to data from 30 years and earlier for each long-record gage (30 years or more of available data). Results from the trend analysis indicated that 45 unaltered and 32 altered long-record sites had a statistically significant trend for the annual minimum n-day time series; most gages showed increasing trends in the annual minimum n-day time series. Low-streamflow statistics were calculated using the most recent 30 years of record for gages with a statistically significant trend. Before and after 1972, the lowest annual 7-day and 30-day average streamflow that occurs (on average) once every 10 years (7Q10 and 30Q10 statistics respectively) increased significantly at 41 unaltered gages and decreased significantly at 3 unaltered gages where data were available.
Introduction
Reliable information about the magnitude, frequency, and duration of low streamflow is critical for water-supply management; reservoir design; waste-load allocation; and the preservation of water quality and quantity for irrigation, recreation, and ecological conservation purposes. Low-streamflow frequency and duration information are particularly important in regions and States that are periodically affected by drought, including New York. As part of their mission to protect public health and aquatic ecosystems, State agencies such as the New York State Department of Environmental Conservation (NYSDEC) need accurate and representative low-streamflow statistics to establish realistic and applicable criteria for both water quality and water quantity (NYSDEC, [1998]). For example, low-streamflow statistics, such as the lowest annual 7-day or 30-day average streamflow that occurs (on average) once every 10 years (7Q10 or 30Q10, respectively), have been used by NYSDEC water-resource managers and planners as a threshold criterion for applying for regulatory measures affecting chronic aquatic life (for which 7Q10 data are used) or chronic human health (for which 30Q10 data are used). These statistics are further used by NYSDEC to regulate waste-load allocations for point sources and total maximum daily loads for streams (NYSDEC, [1998]). To that end, the U.S. Geological Survey calculated low-streamflow statistics of New York with the NYSDEC.
Given the importance of these applications, it is critical to effectively measure and document low-streamflow data for characterizing low-streamflow frequency relations on a regular basis, preferably every 10 years, and especially after periods of extremely low streamflow (Feaster and Lee, 2017; Farmer and others, 2019). Recent droughts (2016, 2020, and 2022) in New York (U.S. Drought Monitor, 2023) have heightened the need for pertinent low-streamflow information for State and local agencies to make critical water-resources decisions. Low-streamflow statistics in New York have not been updated statewide since 1972 (Eissler, 1978), and low-streamflow characteristics in New York may have been changing since that time (Suro and Gazoorian, 2011; Dudley and others, 2020). The objective of this study was to compute new 7Q10 and 30Q10 low-streamflow statistics for New York (excluding Long Island) and hydrologically connected watersheds in bordering States.
Study Area and Gage Selection
The study area consists of the State of New York and hydrologically connected streams from bordering States of Pennsylvania, New Jersey, Connecticut, Massachusetts, and Vermont (fig. 1). Site-specific metadata and daily average streamflow data were accessed using the R package dataRetrieval (R Core Team, 2020; De Cicco and others, [2014]) from the U.S. Geological Survey (USGS) National Water Information System (NWIS) database (USGS, 2016) for 684 active or discontinued gages across New York, and an additional 79 gages from bordering States. A total of 763 gages with daily average streamflow data were available in the study area. Based on the gage-selection criteria described throughout this section, 394 gages met all gage-selection criteria.
First, 29 Long Island gages were removed from this study because Long Island has unique hydrologic characteristics and those gages are affected by varying degrees of urbanization and regulation (Glas and others, 2023). Accurate low-streamflow statistics for Long Island would require additional analysis beyond the scope of this study.
Second, 270 gages with less than 10 years, or 3,652 days, of available daily streamflow records were removed from the study. Typically, low-streamflow statistics are computed for streams when at least 10 years of continuous daily record are available (Lukasz, 2021; Williams-Sether, 2021; Hammond and others, 2022a). However, statistics computed from longer-term records (typically 30 years or more of available data) are preferred because they are likely to be more representative of a broader range of hydrologic conditions. Thus, long-term streamflow data are better suited for trend assessments, but to be more inclusive of available data, gages with at least 10 years of data were included in this study.
Third, 29 gages had more than 20 percent of the period of record missing. Missing data is a common problem in hydrologic data analysis and there are several existing methods and guidance frameworks established for filling in or developing procedures to remove missing data (Gustard and Demuth, 2008). However, this study took a conservative approach in not estimating missing daily streamflow records. Based on Gustard and Demuth (2008), a threshold of 20 percent of missing days in the streamflow record was used to consider the record incomplete and exclude gages from the study.
Fourth, 94 gages had records with days of zero streamflow and would therefore not be suitable to calculate low-streamflow statistics because log transformations are required to calculate 7Q10 and 30Q10. An exception was made for the Housatonic River at Stevenson, Conn. (station 01205500) gage which has a long period of record that includes one day with a recorded zero streamflow near the beginning of the period of record. The zero-streamflow observation for this gage was considered an outlier in magnitude when compared with the entire period of record, so to avoid disqualifying this record entirely, the time series was truncated to remove the zero-streamflow observation. Although including gages with observed zero-streamflow measurements is outside the scope of this study, an avenue for potential further study would include performing a logistic regression to better understand the probability of zero-streamflow observations occurring within these basins.
Fifth, nine gages were discontinued, where all recorded data were transferred to a nearby new gage. Novak (1985) indicated that two discharge records could be considered equivalent if they are on the same stream and there is less than a 5 percent difference in drainage area between the gages or differences in monthly discharge between the two gages could be expected to be less than 5 percent. These nine gages were not included in the study to avoid double counting their record.
Sixth, 16 gages were removed due to having less than 10 recorded climatic years. Low-streamflow metrics were computed on a climatic-year basis. A climatic year is a continuous 12-month period selected for the presentation of data relative to a hydrological or meteorological phenomenon of interest and is usually designated by the year of the first month in the 12-month period (Langbein and Iseri, 1960). In the Northeast, streamflow is typically lowest during the late summer months and highest during the earlier spring months, thus the climatic year from April 1 to March 31 was used for low-streamflow frequency analysis to increase the likelihood that the lowest streamflow values were captured within each climatic year.
In total, 369 gages were removed from this study given the gage-selection criteria (numerous gages met multiple removal criteria), and 394 gages remain for further analysis; this reflects an additional 119 gages analyzed since low-streamflow statistics were last calculated in 1972 (Eissler, 1978).
Developing models to estimate low-streamflow statistics for ungaged locations is difficult where streamflow has been altered by human influence and not reflected by natural basin characteristics, which are the primary predictors used to create a model. Therefore, the gages meeting selection criteria for this study were classified into two groups: 181 altered and 213 unaltered gages (fig. 1), where all historical data available were obtained up to March 31, 2022. Altered gages have documented alterations of observed daily streamflow due to human-related water use and management such as reservoir operations, surface water or groundwater withdrawals, diversions, engineered drainage systems, and impervious areas from urban development. For this analysis, altered gages were determined from previous work by Suro and Gazoorian (2011), and analysis of remark comments in the water-year summaries of individual gages on the USGS Water Data for the Nation website (U.S. Geological Survey, 2016) by flagging words associated with alteration (for example, “regulation,” “pumping,” and “diversion”). All gages classified as unaltered were compared with gage lists and regulation designations from statewide flood-frequency studies (Wall and others, 2014; Lumia and others, 2006) to determine whether peak streamflow values at the gage have been affected by some degree of regulation or diversion (specifically, peak streamflow codes 5 and 6; https://nwis.waterdata.usgs.gov/nwis/peak?help). In addition, all gages were evaluated for alteration by analyzing satellite imagery for the presence of upstream dams or other visible signs of alteration (for example, power plants or wastewater facilities) and by considering site information provided in databases including the Geospatial Attributes of Gages for Evaluating Streamflow, version II (GAGES-II; Falcone, 2011).
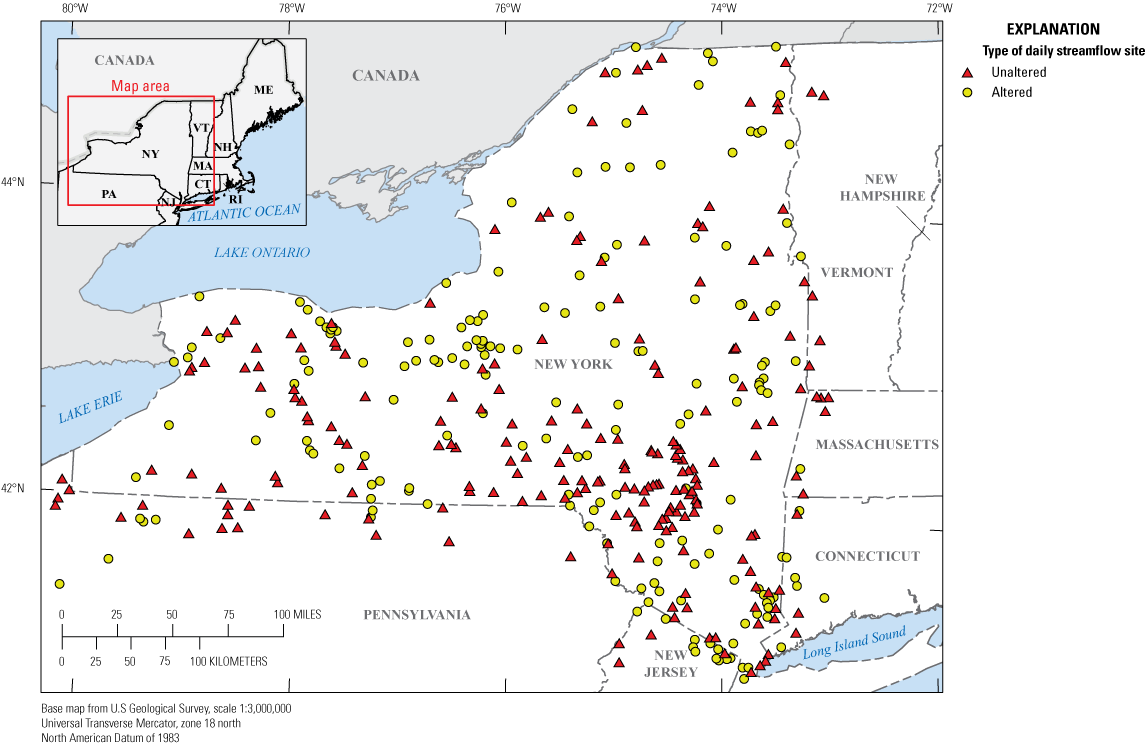
Map showing the 213 unaltered and 181 altered gages with daily streamflow evaluated for this study in New York and adjacent States.
Methods for Calculating At-Site Low-Streamflow Statistics
The most common low-streamflow statistics used by organizations across the United States to inform decisions during low-streamflow periods are calculated using a moving average across a standard interval (typically a 7-day or 30-day period) of the daily average streamflow values (U.S. Environmental Protection Agency, 1986; Smakhtin, 2001). Low-streamflow statistics calculated using the moving average n-day values are representative of persistent low-streamflow periods within the daily streamflow record. The moving average 7-day and 30-day streamflow time series were calculated using daily average streamflow data available across all gages for this study, and the annual minimum 7-day and 30-day values were determined for each climatic year across the period of record.
Data Handling for Missing and Irregular Streamflow Values
Missing data within a daily streamflow time series are a persistent problem for hydrologic frequency analysis (Gustard and Demuth, 2008). Missing data can be present within a USGS daily streamflow time series for multiple reasons. For example, the gage may have only operated on a seasonal basis, the intention of the gage may have only been to measure a limited range of streamflow, or the gage may have been temporarily discontinued due to equipment failure, lost funding, or other related issues (Novak, 1985). For this study, missing daily streamflow data were classified as not available directly within the raw data time series obtained from NWIS. In addition, a streamflow value was classified as not available if a date or multiple dates were missing from the raw data time series obtained from NWIS, and the missing dates were added to the time series to create a set of continuous dates for all gages. Missing daily data and irregular timing of low streamflow (for example, lowest streamflow values occur during typical high-streamflow months) were flagged to determine if an individual climatic year should be removed if the data met any of the following criteria:
-
• The low-streamflow months of July, August, September, and October included any missing daily values.
-
• The annual minimum n-day value included missing daily values within the moving average n-day period.
-
• The annual minimum n-day value was within the first 7 or 30 days of April (the beginning of the climatic year), and the moving average window included daily data from the previous climatic year.
The annual minimum 7-day and 30-day time series for unaltered gages did not include any gages with missing daily data within any annual minimum n-day moving average values across all climatic years. The altered gages included 12 gages where at least one annual minimum 7-day (5 gages) or 30-day (7 gages) value for a climatic year includes at least one missing value within the moving average window; a climatic year meeting this criterion was removed from the period of record.
Figure 2 is a histogram of the month that the annual minimum 7-day values occurred for each climatic year across the period of record for all unaltered gages. The unaltered gages were used to determine the low-streamflow months because they are the most representative of natural climatic conditions within the study area. As expected, the annual minimum 7-day values occurred most often during July, August, September, and October. At least 1 climatic year was removed for 13 unaltered and 22 altered gages that had missing daily data during the low-streamflow months.
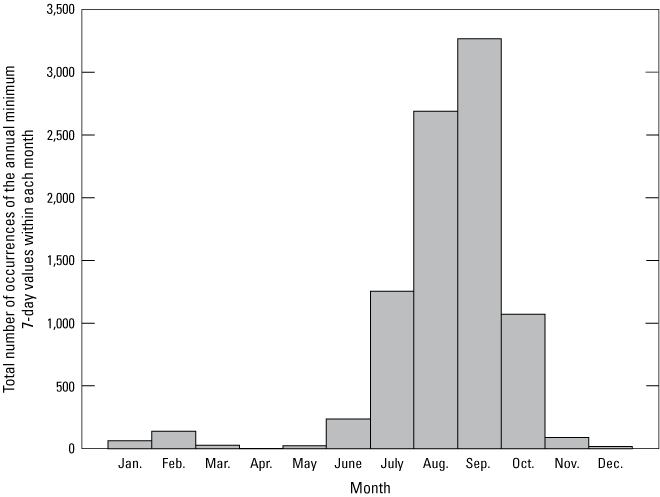
Graph showing the total number of occurrences of the annual minimum 7-day values within each month for all available data across unaltered gages in New York, excluding Long Island, that were included in this study.
Any annual minimum n-day time series that spanned the end of one climatic year and the start of the next (March 31 to April 1) were not included in the annual minimum time series for a gage. The unaltered gages included 12 where at least 1 climatic year was removed for annual minimum 7-day (3 gages) or 30-day (9 gages) values near the start of a climatic year. Unaltered gages typically would not have annual minimum n-day values during the high-streamflow months. These gages were further evaluated, and it was determined that these values were high outliers when compared with the annual minimum values across the period of record.
The altered gages included 82 where at least 1 climatic year was removed for annual minimum 7-day (31 gages) and 30-day (51 gages) values near the start of a climatic year. Altered or minimally altered gages are more likely to include annual minimum streamflow values near the start of the climatic year during typically high-streamflow months because the observed streamflow may be consistent with the alteration patterns of a specific gage where the lowest streamflow values occur during the high-streamflow months (for example, station 01357499 is a diversion channel for the Erie Canal, where the locks are closed during the winter; the streamflow of station 01325000 is regulated by the Conklingville Dam, where the lowest streamflow values typically occur during the winter months).
The same climatic years were removed for the annual minimum 7-day and 30-day time series to ensure that the same years were used to calculate the 7Q10 and 30Q10 statistics for any gage to avoid a mismatch in the climatic years used to calculate each low-streamflow statistic. In total, 20 unaltered and 69 altered gages have at least 1 climatic year removed from the annual minimum 7-day and 30-day time series because of missing data during the low-streamflow months, missing daily data within the annual minimum n-day moving average window, or annual minimum n-day values near the start of the climatic year. Across all 213 unaltered and 181 altered gages, a total of 32 and 363 climatic years, respectively, were removed given the criteria listed in this section.
Trend Analysis
Recent studies have documented changes in precipitation patterns across the Northeast, and the need to account for trends in hydrologic frequency analysis to calculate accurate low-streamflow statistics (Dethier and others, 2020; Dudley and others, 2020; Hammond and others, 2022b). McCabe and Wolock (2021) investigated drought and pluvial periods using a simple water balance model across the conterminous United States from 1900 through 2014. Across most of the conterminous United States and in the Northeast, most severe drought events occurred before 1970 and the region has been in a sustained pluvial period for the last 50 years (McCabe and Wolock, 2021). In addition, Seager and others (2012) study precipitation patterns in the Catskill Mountains region and determined that a severe drought occurred during the mid-1960s, followed by a wet period that continues through the end of their study period (2007). Affecting most of the Northeast, the severe 1960s drought created long-lasting water supply issues and shaped future water policy across the region (Barksdale, 1968).
Blum and others (2019) and Vogel and Kroll (2020) find that using a recent subset of the period of record for frequency analysis improves the accuracy of low-streamflow frequency statistics when nonstationary conditions are observed. Blum and others (2019) use Monte Carlo simulation experiments with monotonic trends observed at gages in the Chesapeake Bay watershed and observe that, when a statistically significant trend in low streamflow was present, the best estimate of the 7Q10 statistic was more accurately computed using the most recent 30 years of historical record. Blum and others (2019) suggest a simple adaptive framework for computing 7Q10: use the most recent 30 years of the record when a statistically significant (α) trend was detected (at α≤0.1) or use the full historical record.
Similar to the adaptive method developed by Blum and others (2019), this study used the Wilcoxon rank-sum hypothesis test to determine whether data from the most recent 30 years of record are statistically different from data from 30 years ago and earlier. The Mann-Kendall trend test was explored for this study but was ultimately not used because data gaps are included within the annual minimum n-day (7-day or 30-day values) datasets and this trend test requires little to no missing data to provide an accurate test result (Helsel and others, 2020). In addition, the two-sample t-test was explored for this study, but the log-transformed annual minimum n-day time series for each group appeared abnormal for most gages. The nonparametric two-sample Wilcoxon rank-sum hypothesis test compares two groups without any prior knowledge that either group would be higher or lower than one another (Helsel and others, 2020). The null hypothesis for this study states that the annual minimum n-day streamflow values from the most recent 30 years of available data come from the same distributions as data from 30 years and earlier within the period of record. A less stringent α=0.1 was used for this study to determine statistical significance of the hypothesis test.
Low-Streamflow Frequency Analysis
The low-streamflow statistics for 7Q10 and 30Q10 were calculated using the annual minimum 7-day and 30-day moving average of the daily average values for each climatic year across the available period of record for each gage. The Wilcoxon rank-sum hypothesis test results were used to determine which set of years were used to calculate the statistics, and then the annual minimum 7-day and 30-day time series were fit to a probability distribution to calculate the streamflow value associated with a specific probability of nonexceedance. The log-Pearson type III probability distribution was used to fit the n-day low-streamflow values for the low-streamflow frequency analysis (Bhatti and others, 2019). The log-Pearson type III distribution has been widely used to model low- and peak-streamflow statistics throughout the country (England and others, 2019; Helsel and others, 2020). The log-Pearson type III distribution of the n-day time series to determine the streamflow of the 10-year recurrence interval (Q10) is defined as:
whereK10 is a frequency factor approximated by the Wilson-Hilferty transformation, which is a function of the nominal skew G (Kirby, 1972) defined as:
and whereLow-Streamflow Nonexceedance Frequency Analysis
The nonexceedance probability tables were determined for the daily moving average 7-day and 30-day values for the 102 altered gages determined not to be suitable for low-streamflow frequency analysis (Stagnitta and others, 2024). The nonexceedance probabilities of the n-day average time series were determined using Weibull’s plotting position to rank the daily n-day average streamflow values constructing an empirical cumulative distribution (Langbein and Iseri, 1960). These nonexceedance percentiles should not be construed to be a representation of a low-streamflow frequency, but as an empirical representation of recorded n-day average streamflow values.
Results
Low-streamflow frequency analysis requires detailed methods to account for missing data or trends to ensure that low-streamflow statistics are accurately calculated to represent current conditions. Results from the trend analysis are detailed in the following section, including a comparison of 7Q10 values calculated pre- and post-1972.
Trend Analysis
Low-streamflow statistics for New York State were last calculated using data from 1972 and earlier (Eissler, 1978). The comparison of the 7Q10 values for 91 long-record (30 years or more of available data) unaltered gages where data were available pre- and post-1972 is shown in figure 3. Across 83 of the 91 gages, 7Q10 values have increased since 1972, with the largest changes occurring in the western, Catskill, and Adirondack regions of the State. Of the 83 unaltered sites with an increase, 41 of the increases were statistically significant (α≤0.1) and averaged 46 and 48 percent for the 7Q10 and 30Q10 values, respectively. Of the 8 unaltered sites with a decrease, 3 of the decreases were statistically significant (α≤0.1) and averaged 9 and 8 percent for the 7Q10 and 30Q10 values, respectively.
Of the 213 unaltered gages, 121 gages had at least 30 years of available data and were evaluated for nonstationarity. The null hypothesis was rejected for 45 unaltered gages at α=0.1 significance level and the most recent 30 years of available data were used to calculate low-streamflow statistics for these gages. The remaining 76 unaltered gages failed to reject the null hypothesis, and the entire period of record was used to calculate low-streamflow statistics. In addition, for the remaining 92 unaltered gages where no hypothesis testing was performed, the entire period of record was used to calculate low-streamflow statistics because these gages had less than 30 years of available data.
The annual minimum 7-day time series for all altered gages were visually inspected to determine whether there was an irregular change in the annual minimum values and whether the overall trend displayed was inconsistent with the underlying natural condition of increasing low-streamflow values in the study area (fig. 3; for example, the annual minimum values showed an irregular pattern due to inconsistent surface water withdrawals near the gage). Of the 181 altered gages inspected, 79 displayed consistent trends of the annual minimum 7-day time series and were suitable for low-streamflow frequency analysis. Of the 79, 73 had at least 30 years of available data and were evaluated for nonstationarity. The null hypothesis was rejected for 32 altered gages at α=0.1 and the most recent 30 years of available data were used to calculate low-streamflow statistics. The remaining 41 altered gages failed to reject the null hypothesis, and the entire period of record was used to calculate low-streamflow statistics. In addition, for the remaining six altered gages where no trend analysis was performed, the entire period of record was used to calculate low-streamflow statistics because these gages had fewer than 30 years of available data.
For gages that exhibited different hypothesis test results for trends in the annual minimum 7-day and 30-day time series, the entire period of record was used to calculate low-streamflow statistics and the same set of years were used for each n-day time series.
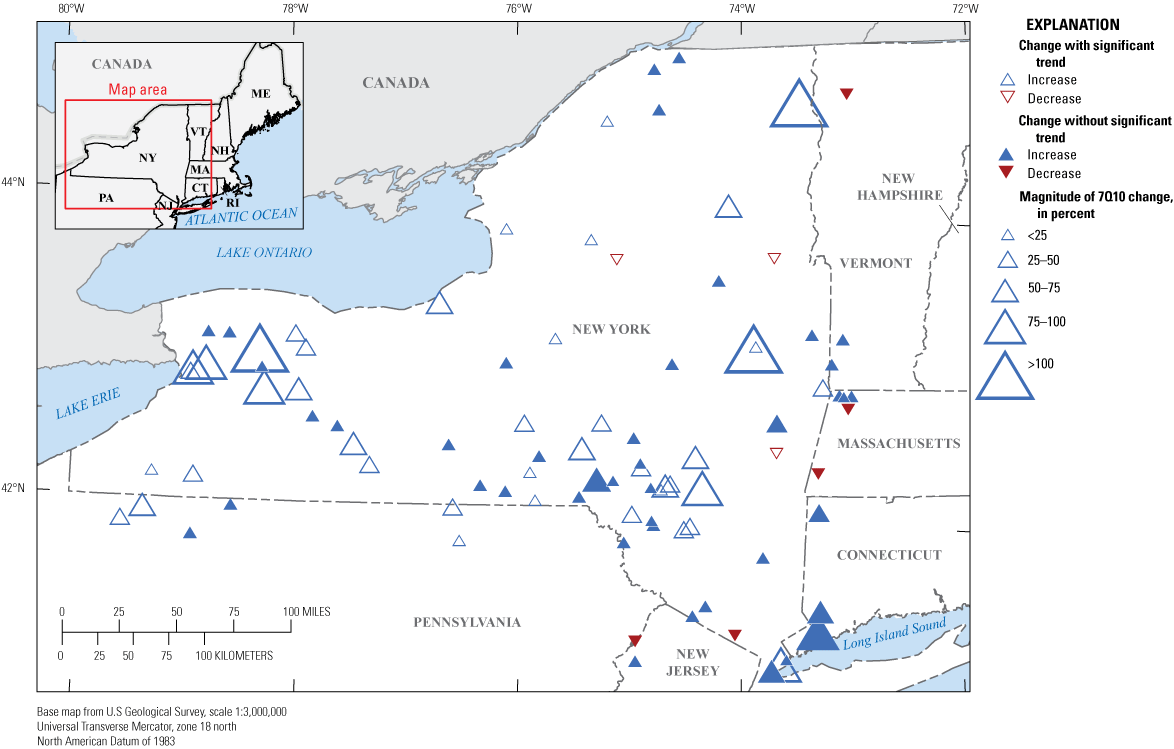
Map showing a comparison of the lowest annual 7-day average streamflow that occurs (on average) once every 10 years (7Q10) values for 91 long-record (30 years or more of available data) unaltered gages with data available pre- and post-1972. 7Q10 values were calculated with data from before 1972 and data available from the entirety or a subset of the period of record depending on results from Wilcoxon rank-sum hypothesis test. Gages where 7Q10 increased from pre-1972 data are marked with an upward blue triangle. Gages where 7Q10 decreased from pre-1972 data are marked with a downward red triangle. The size of the triangle corresponds to the positive or negative percent change from pre-1972 7Q10 versus 7Q10 calculated for this study. Gages marked with a filled triangle indicate that no significant trend (α>0.1) was found at the gage. >, Greater than; <, less than.
Low-Streamflow Frequency Analysis
Stagnitta and others (2024) and table 1.1, located in appendix 1, include the 7Q10 and 30Q10 values calculated for all 213 unaltered and 79 altered gages.
Discussion
Methods for handling missing and irregular data ensure accurate and consistent streamflow values are included to calculate low-streamflow statistics that best represent low-streamflow conditions observed within the study area. This analysis provides methods to flag and remove outlier annual minimum n-day values from the low-streamflow time series. Most climatic years were included across all gages for this study, where only 20 unaltered and 69 altered gages were flagged to remove at least 1 climatic year from the period of record.
A trend analysis of the annual minimum n-day values ensures that the low-streamflow frequency analysis using historical annual values represents current conditions observed within the stream. Performing a low-streamflow frequency analysis may not yield the most accurate and least biased estimate of current n-day low streamflow when there are statistically significant trends in the data. More than half of the gages had long records (30 years or more of available data), where 45 unaltered and 32 altered gages had a statistically significant trend in the data, and the most recent 30 years of available data were used to calculate low-streamflow statistics.
The rise in values of low-streamflow statistics statewide is consistent with findings from other studies across the Northeast and may be attributed to increased precipitation across the region for much of the last 50 years (McCabe and Wolock, 2021; Seager and others, 2012). Further analysis is needed to understand the drivers and covariates of trends in low streamflow across New York. A trend analysis of low-streamflow statistics along with precipitation, groundwater storage, anthropogenic variables, and other variables of interest is needed to better understand the causes of changes to low streamflow at both unaltered and altered gages across the State and is beyond the scope of this study. Such work would help better define the selection of period of record for computing low-streamflow statistics. For example, selecting a period of record that begins with the advent of a dam, diversion, or step change in precipitation may present different results. Record extension for unaltered gages was initially explored for this study but was not pursued to permit the potential for further research using the low-streamflow statistics.
Summary
The U.S. Geological Survey updated low-streamflow statistics in New York with the cooperation of the New York Department of Environmental Conservation. Low-streamflow statistics are used for several applications including wastewater permitting, withdrawal permitting, determining total maximum daily loads, setting in-stream flow criteria to protect aquatic life, and drought monitoring. Using streamflow data available through the U.S. Geological Survey National Water Information System, the low-streamflow statistics, such as the lowest annual 7-day average streamflow that occurs (on average) once every 10 years (7Q10 and 30Q10, respectively), were calculated for 213 unaltered and 79 altered gages. Nonexceedance probabilities for the daily moving average 7-day and 30-day values were calculated for the remaining 102 altered gages that were not suitable for low-streamflow frequency analysis.
Three categories of situations resulted in missing or irregular daily data and the removal of a climatic year from the period of record for selected gages: missing daily data within the low-streamflow months of July, August, September, and October; missing daily data within the moving average window for an annual minimum 7-day or 30-day value; and an annual minimum 7-day or 30-day value, where the moving average spans the end of one and start of the next climatic year. A trend analysis was performed to account for nonstationarity present within the period of record for long-record sites. A hypothesis test using the Wilcoxon rank-sum hypothesis test was used to compare data from the most recent 30 years of record to data from 30 years ago and earlier to determine whether there was a statistically significant trend. Statistically significant trends (α≤0.1) were observed for 45 unaltered and 32 altered gages; data from the most recent 30 years of record were used to calculate low-streamflow statistics for these gages. The remaining unaltered and altered gages used the entire period of record to calculate low-streamflow statistics.
References Cited
Barksdale, H.C., 1968, The Northeast water supply crisis of the 1960s: U.S. Geological Survey monograph, 14 p., accessed August 15, 2023, at https://doi.org/10.3133/70039594.
Bhatti, S.J., Kroll, C.N., and Vogel, R.M., 2019, Revisiting the probability distribution of low streamflow series in the United States: Journal of Hydrologic Engineering, v. 24, no. 10, article no. 04019043, 11 p., accessed February 21, 2024, at https://doi.org/10.1061/(ASCE)HE.1943-5584.0001844.
Blum, A.G., Archfield, S.A., Hirsch, R.M., Vogel, R.M., Kiang, J.E., and Dudley, R.W., 2019, Updating estimates of low-streamflow statistics to account for possible trends: Hydrological Sciences Journal, v. 64, no. 12, p. 1404–1414, accessed February 21, 2024, at https://doi.org/10.1080/02626667.2019.1655148.
De Cicco, L.A., Hirsch, R.M., Lorenz, D., Watkins, W.D., and Johnson, M., [2014], dataRetrieval—Retrieval functions for USGS and EPA hydrologic and water quality data (v. 2.7.13, 2023): U.S. Geological Survey software release, accessed November 1, 2023, at https://doi.org/10.5066/P9X4L3GE.
Dethier, E.N., Sartain, S.L., Renshaw, C.E., and Magilligan, F.J., 2020, Spatially coherent regional changes in seasonal extreme streamflow events in the United States and Canada since 1950: Science Advances, v. 6, no. 49, 8 p., accessed February 21, 2024, at https://doi.org/10.1126/sciadv.aba5939.
Dudley, R.W., Hirsch, R.M., Archfield, S.A., Blum, A.G., and Renard, B., 2020, Low streamflow trends at human-impacted and reference basins in the United States: Journal of Hydrology, v. 580, 13 p., accessed February 21, 2024, at https://doi.org/10.1016/j.jhydrol.2019.124254.
Eissler, B.B., 1978, Low-flow data and frequency analysis of streams in New York excluding New York City and Long Island: New York State Department of Environment Conservation Bulletin 74, 176 p. [Also available at https://archive.org/details/usgswaterresourcesnewyork-nydec_bull_74/nydec_bull_74/page/n1/mode/2up.]
England, J.F., Jr., Cohn, T.A., Faber, B.A., Stedinger, J.R., Thomas, W.O., Jr., Veilleux, A.G., Kiang, J.E., and Mason, R.R., Jr., 2019, Guidelines for determining flood flow frequency—Bulletin 17C (ver. 1.1, May 2019): U.S. Geological Survey Techniques and Methods, book 4, chap. B5, 148 p., accessed February 21, 2024, at https://doi.org/10.3133/tm4B5.
Falcone, J.A., 2011, GAGES-II—Geospatial attributes of gages for evaluation streamflow: U.S. Geological Survey data release, accessed October 15, 2014, at https://doi.org/10.5066/P96CPHOT.
Farmer, W.H., Kiang, J.E., Feaster, T.D., and Eng, K., 2019, Regionalization of surface-water statistics using multiple linear regression (ver. 1.1, February 2021): U.S. Geological Survey Techniques and Methods, book 4, chap. A12, 40 p., accessed February 21, 2024, at https://doi.org/10.3133/tm4A12.
Feaster, T.D., and Lee, K.G., 2017, Low-flow frequency and flow-duration characteristics of selected streams in Alabama through March 2014: U.S. Geological Survey Scientific Investigations Report 2017–5083, 371 p., accessed February 21, 2024, at https://doi.org/10.3133/sir20175083.
Glas, R., Hect, J., Simonson, A., Gazoorian, C., Scheubert, C., 2023, Adjusting design floods for urbanization across groundwater-dominated watersheds of Long Island, NY: Journal of Hydrology, v. 618, article 129194, 18 p., accessed March 27, 2024, at https://doi.org/10.1016/j.jhydrol.2023.129194.
Gustard, A., and Demuth, S., eds., 2008, Manual on low-flow estimation and prediction—Operational hydrology report no. 50: World Meteorological Organization, Geneva, Switzerland, v. 1029, 136 p. [Also available at https://library.wmo.int/idurl/4/32176.]
Hammond, J.C., Doheny, E.J., Dillow, J.J.A., Nardi, M.R., Steeves, P.A., and Warner, D.L., 2022a, Peak-flow and low-flow magnitude estimates at defined frequencies and durations for nontidal streams in Delaware: U.S. Geological Survey Scientific Investigations Report 2022–5005, 46 p., accessed February 21, 2024, at https://doi.org/10.3133/sir20225005.
Hammond, J.C., Simeone, C., Hecht, J.S., Hodgkins, G.A., Lombard, M., McCabe, G., Wolock, D., Wieczorek, M., Olson, C., Caldwell, T., Dudley, R., and Price, A.N., 2022b, Going beyond low flows—Streamflow drought deficit and duration illuminate distinct spatiotemporal drought patterns and trends in the U.S. during the last century: Water Resources Research, v. 58, no. 9, 20 p. accessed February 21, 2024, at https://doi.org/10.1029/2022WR031930.
Helsel, D.R., Hirsch, R.M., Ryberg, K.R., Archfield, S.A., and Gilroy, E.J., 2020, Statistical methods in water resources: U.S. Geological Survey Techniques and Methods, book 4, chapter A3, 458 p., accessed September 2023, at https://doi.org/10.3133/tm4A3. [Supersedes USGS Techniques of Water-Resources Investigations, book 4, chapter A3, version 1.1.]
Kirby, W., 1972, Computer‐oriented Wilson‐Hilferty transformation that preserves the first three moments and the lower bound of the Pearson type 3 distribution: Water Resources Research, v. 8, no. 5, p. 1251–1254, accessed February 21, 2024, at https://doi.org/10.1029/WR008i005p01251.
Langbein, W.B., and Iseri, K.T., 1960, General surface-water techniques, part 1 of General introduction and hydrologic definitions—Manual of hydrology: U.S. Geological Survey Water-Supply Paper 1541-A, 29 p., accessed February 21, 2024, at https://doi.org/10.3133/wsp1541A.
Lukasz, B.S., 2021, Methods for estimating low-flow frequency statistics, mean monthly and annual flow, and flow-duration curves for ungaged locations in Kansas: U.S. Geological Survey Scientific Investigations Report 2021–5100, 69 p., accessed February 21, 2024, at https://doi.org/10.3133/sir20215100.
Lumia, R., Freehafer, D.A., and Smith, M.J, 2006, Magnitude and frequency of floods in New York: U.S. Geological Survey Scientific Investigations Report 2006–5112, 152 p., accessed February 21, 2024, at https://doi.org/10.3133/sir20065112.
McCabe, G.J., and Wolock, D.M., 2021, Multi‐year hydroclimatic droughts and pluvials across the conterminous United States: International Journal of Climatology, v. 41, no. 3, 15 p., accessed February 21, 2024, at https://doi.org/10.1002/joc.6925.
New York State Department of Environmental Conservation [NYSDEC], [1998], Technical and operational guidance series 1.3.1—Total maximum daily loads and water quality based effluent limits: New York State Department of Environmental Conservation Division of Water web page, accessed August 2, 2023, at https://extapps.dec.ny.gov/docs/water_pdf/togs131.pdf.
Novak, C.E., 1985, WRD data reports preparation guide: U.S. Geological Survey Open-File Report 85-480, 333 p., accessed August 2023 at https://doi.org/10.3133/ofr85480.
R Core Team, 2020, R—A language and environment for statistical computing: R Foundation for Statistical Computing web page, accessed September 2023 at https://www.R-project.org/.
Seager, R., Pederson, N., Kushnir, Y., Nakamura, J. and Jurburg, S., 2012, The 1960s drought and the subsequent shift to a wetter climate in the Catskill Mountains region of the New York City watershed: Journal of Climate, v. 25, no. 19, 21 p., accessed February 21, 2024, at https://doi.org/10.1175/JCLI-D-11-00518.1.
Smakhtin, V.U., 2001, Low flow hydrology—A review: Journal of Hydrology, v. 240, 39 p., accessed February 21, 2024, at https://doi.org/10.1016/S0022-1694(00)00340-1.
Stagnitta, T.J., Graziano, A.P., Woda, J.C., Glas, R.L., and Gazoorian, C.L., 2024, Low-flow statistics for New York State, excluding Long Island, computed through March 2022:U.S. Geological Survey data release, at https://doi.org/10.5066/P9NOM6FR.
Suro, T.P., and Gazoorian, C.L., 2011, Changes in low-flow frequency from 1976–2006 at selected streamgages in New York, excluding Long Island: U.S. Geological Survey Scientific Investigations Report 2011–5112, 21 p., accessed February 21, 2024, at https://doi.org/10.3133/sir20115112.
U.S. Drought Monitor, 2023, Data tables—Percent area in U.S. drought monitor categories [New York]: National Drought Mitigation Center dataset, accessed August 14, 2023, at https://droughtmonitor.unl.edu/DmData/DataTables.aspx.
U.S. Environmental Protection Agency, 1986, Stream design flow for steady-state modeling (updated), chap. 1 of Design Considerations, book VI in Technical guidance manual for performing waste load allocations: U.S. Environmental Protection Agency, [variously paged; 65 p.]. [Also available at https://nepis.epa.gov/Exe/ZyPDF.cgi/P100BK6P.PDF?Dockey=P100BK6P.PDF.]
U.S. Geological Survey [USGS], 2016, USGS water data for the nation: U.S. Geological Survey National Water Information System database, accessed December 19, 2023, at https://doi.org/10.5066/F7P55KJN.
Vogel, R.M., and Kroll, C.N., 2020, A comparison of estimators of the conditional mean under non-stationary conditions: Advances in Water Resources, v. 143, article 103672, 10 p., accessed February 21, 2024, at https://doi.org/10.1016/j.advwatres.2020.103672.
Wall, G.R., Murray, P.M., Lumia, R., and Suro, T.P., 2014, Maximum known stages and discharges of New York streams and their annual exceedance probabilities through September 2011: U.S. Geological Survey Scientific Investigations Report 2014–5084, 16 p., accessed February 21, 2024, at https://doi.org/10.3133/sir20145084.
Williams-Sether, T., 2021, Estimating flow-duration statistics and low-flow frequencies for selected streams and the implementation of a StreamStats web-based tool in Puerto Rico: U.S. Geological Survey Scientific Investigations Report 2021–5054, 18 p., accessed February 21, 2024, at https://doi.org/10.3133/sir20215054.
Appendix 1. Low-Streamflow Statistics for 213 Unaltered and 79 Altered Gages
Table 1.1.
Low-streamflow statistics for the lowest annual 7-day and 30-day average streamflow that occurs (on average) once every 10 years (7Q10 or 30Q10, respectively) for 213 unaltered and 79 altered gages.[Data from Stagnitta and others (2024). The calculated nonexceedance probabilities column refers to altered sites where no low-streamflow statistics were calculated and the tables of daily nonexceedance probabilities are available in Stagnitta and others (2024). Station names appear as listed in the U.S. Geological Survey National Water Information System (U.S. Geological Survey, 2016). CT, Connecticut; MA, Massachusetts; NJ, New Jersey; NY, New York; PA, Pennsylvania; Ave., avenue; Bl, below; Blw, below; Blvd, boulevard; Bk, brook; Br, branch; Cr, creek; E, east; L, lake; Nr, near; R, river; Rd, road; St., street; St., Saint; Trib, tributary; W, West; @, at; mi2, square mile; H0, null hypothesis; α, significance level; ≤, less than or equal to; Q, discharge; ft3/s, cubic foot per second; —, not calculated]
References Cited
Stagnitta, T.J., Graziano, A.P., Woda, J.C., Glas, R.L., and Gazoorian, C.L., 2024, Low-flow statistics for New York State, excluding Long Island, computed through March 2022: U.S. Geological Survey data release, https://doi.org/10.5066/P9NOM6FR.
U.S. Geological Survey, 2016, USGS water data for the nation: U.S. Geological Survey National Water Information System data system, accessed December 19, 2023, at https://doi.org/10.5066/F7P55KJN.
Abbreviations
α
statistical significance level
30Q10
the lowest annual 30-day average streamflow that occurs (on average) once every 10 years
7Q10
the lowest annual 7-day average streamflow that occurs (on average) once every 10 years
NWIS
National Water Information System
NYSDEC
New York State Department of Environmental Conservation
USGS
U.S. Geological Survey
For more information, contact
Director, New York Water Science Center
U.S. Geological Survey
425 Jordan Road
Troy, NY 12180–8349
dc_ny@usgs.gov
or visit our website at
https://www.usgs.gov/centers/ny-water
Publishing support provided by the Pembroke Publishing Service Center
Disclaimers
Any use of trade, firm, or product names is for descriptive purposes only and does not imply endorsement by the U.S. Government.
Although this information product, for the most part, is in the public domain, it also may contain copyrighted materials as noted in the text. Permission to reproduce copyrighted items must be secured from the copyright owner.
Suggested Citation
Stagnitta, T.J., Graziano, A.P., Woda, J.C., Glas, R.L., and Gazoorian, C.L., 2024, Low-flow statistics for selected streams in New York, excluding Long Island: U.S. Geological Survey Scientific Investigations Report 2024–5055, 39 p., https://doi.org/10.3133/sir20245055.
ISSN: 2328-0328 (online)
Study Area
| Publication type | Report |
|---|---|
| Publication Subtype | USGS Numbered Series |
| Title | Low-flow statistics for selected streams in New York, excluding Long Island |
| Series title | Scientific Investigations Report |
| Series number | 2024-5055 |
| DOI | 10.3133/sir20245055 |
| Publication Date | August 02, 2024 |
| Year Published | 2024 |
| Language | English |
| Publisher | U.S. Geological Survey |
| Publisher location | Reston, VA |
| Contributing office(s) | New York Water Science Center |
| Description | Report: vi, 39 p.; Data Release |
| Country | United States |
| State | New York |
| Online Only (Y/N) | Y |
| Additional Online Files (Y/N) | N |