

Two-Dimensional Hydraulic Model for the Chain of Lakes on the Fox River near McHenry, Illinois
Links
- Document: Report (3.5 MB) , HTML , XML
- Dataset: USGS National Water Information System database —USGS water data for the Nation
- Data Release: USGS data release - Archive of the hydraulic model used in the two-dimensional simulation of the Chain of Lakes on the Fox River near McHenry, Illinois:
- NGMDB Index Page: National Geologic Map Database Index Page (html)
- Download citation as: RIS | Dublin Core
Acknowledgments
The authors wish to acknowledge funding provided by the Illinois Department of Natural Resources–Office of Water Resources for this study along with the continued support in funding the U.S. Geological Survey streamgages within the Chain of Lakes and at the Stratton Dam near McHenry, Illinois.
Abstract
Forecasts of flows entering and leaving the Chain of Lakes on the Fox River in northeastern Illinois are critical information to water-resource managers operating the Stratton Dam at McHenry, Illinois. These managers determine the optimal operation of the Stratton Dam at McHenry, Ill., to manage Chain of Lakes pool levels and to help mitigate flooding in the Chain of Lakes system. In 2020, the U.S. Geological Survey (USGS) and the Illinois Department of Natural Resources–Office of Water Resources (IDNR–OWR) began a cooperative study to develop a system to enable engineers and planners to simulate and communicate water-surface elevations and flows and to proactively prepare for runoff events forecasted for the Chain of Lakes. The hydraulic model described in this report may be helpful to the IDNR–OWR for optimizing the operation of the Stratton Dam and includes the implementation of three newly installed torque-tube crest gates that became operational in 2020.
The hydraulic model for the Chain of Lakes was developed using the Hydrologic Engineering Center–River Analysis System program (version 6.5). The hydraulic model was used to simulate water-surface elevations and flows through the 18.5-mile Chain of Lakes system to 1.7 miles downstream from the Stratton Dam. Five USGS streamgages within the study area were used as reference points for model calibration and initial water-surface elevations for beginning a simulation. The hydraulic model was calibrated to three runoff events that incorporated the design specifications and observed gate operations of the Stratton Dam; furthermore, the hydraulic model simulated a validation event and a substantial flooding event during July 2017. The July 2017 event predated the torque-tube crest gate installation but nevertheless tested the performance of the model for such a substantial event. The model simulation results were a good fit to observed records at USGS streamgages with simulated peak water-surface elevations within −0.36–0.15 foot of observed events. The hydraulic model was then implemented into a forecast workflow that streamlines implementation of model inputs and documents the model outputs tailored to IDNR–OWS Stratton Dam operations and interpretations of simulated water-surface elevations and flows.
Introduction
The Chain of Lakes is a reservoir system on the Fox River in northeastern Illinois with a total surface area of about 6,900 acres (Kothandaramon and others, 1977; fig. 1). As the Fox River flows south near the Illinois-Wisconsin border, it transforms from a river channel environment into a series of interconnected lakes known as the Chain of Lakes. At the Pistakee Lake outlet near Johnsburg, Illinois, the Chain of Lakes naturally constricts back to the Fox River channel and flows south about 7 miles (mi) to the Stratton Dam at McHenry, Ill. (fig. 1). The Stratton Dam controls the outflow from the Chain of Lakes to maintain pool levels in the reservoir system. The Chain of Lakes is primarily used for recreation with some downstream flood control benefits. There are about 1,250 square miles (mi2) of drainage area upstream from the Stratton Dam with contributions from the Fox River, Nippersink Creek, and local drainage areas (fig. 1).
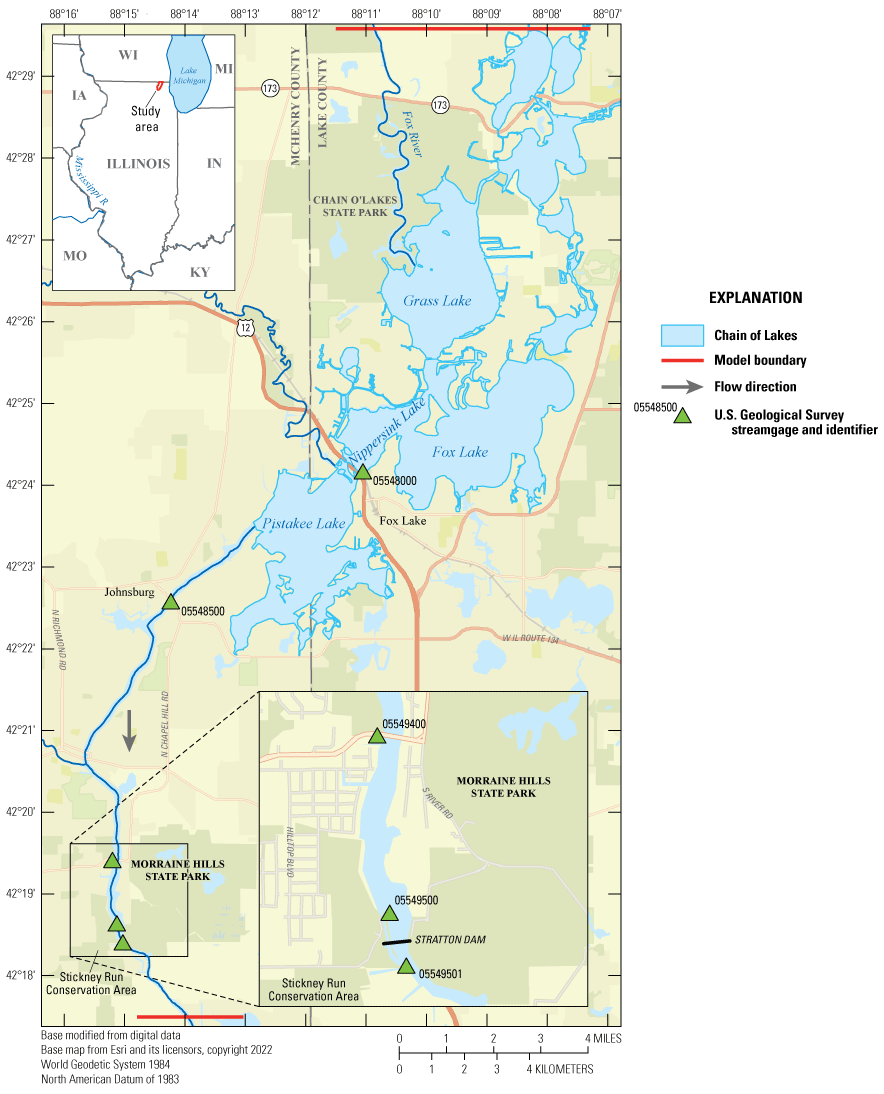
Study area for the Chain of Lakes in northeastern Illinois, and U.S. Geological Survey streamgages used in the hydraulic model.
The Stratton Dam has been operated by the Illinois Department of Natural Resources–Office of Water Resources (IDNR–OWR) since 1939. The IDNR–OWR has a target pool level of 736.8–737.2 feet (ft) and winter drawdown of 735.5 ft above the National Geodetic Vertical Datum of 1929, and the Chain of Lakes provides about 14,400 acre-feet of storage between those stages (Illinois Department of Natural Resources, 2012). The National Geodetic Vertical Datum of 1929 was used for the “Operation of the Stratton & Algonquin Dams” report (Illinois Department of Natural Resources, 2012) and was the datum used for the USGS streamgages in the study area pre-2022. These USGS streamgages were surveyed to the North American Vertical Datum of 1988 in 2022, which is the referenced datum hereinafter used in the report. The target pool level converts to about 736.6–737.0 ft and the winter drawdown to 735.3 ft (North American Vertical Datum of 1988). Hydrologic forecasts entering and leaving the Chain of Lakes are critical to the optimal operation of the Stratton Dam. The National Weather Service–North Central River Forecasting Center (NWS–NCRFC) provides the IDNR–OWR with 0–7-day hydrologic forecasts for inflows entering the Chain of Lakes which is used to develop gate operations to manage Chain of Lakes pool levels and to help mitigate flooding in the Chain of Lakes system.
In 2020, the U.S. Geological Survey (USGS) and IDNR–OWR began a cooperative study to update modeling techniques developed from a previous USGS study (Domanski, 2017). In this study, a hydraulic model was constructed and used to develop a system that enables engineers and planners to simulate and communicate predicted water-surface elevations and flows and to proactively prepare for runoff events forecasted for the Chain of Lakes. The Hydrologic Engineering Center–River Analysis System (HEC–RAS) program (version 6.5; U.S. Army Corps of Engineers, 2022) was used to simulate water-surface elevations and flows through the Chain of Lakes to 1.7 mi downstream from the Stratton Dam (fig. 1). Extending the downstream distance allowed the normal-depth slope to stabilize and not propagate upstream to the Stratton Dam tailwater where it could affect the hydraulic model performance of the Stratton Dam control structures.
The NWS–NCRFC provided simulated flow hydrographs to account for the inflows entering the Chain of Lakes. These simulated flow hydrographs for selected events were used to calibrate the hydraulic model. Five USGS streamgages within the model extent were used to calibrate the hydraulic model (fig. 1; table 1). Because the Chain of Lakes consists of several largely connected lakes, they can be modeled as a single reservoir from the inlet for the Fox River at Grass Lake to the Pistakee Lake outlet (fig. 1). The USGS streamgage Nippersink Lake at Fox Lake, Ill., (USGS station 05548000; U.S. Geological Survey, 2023f) provided Chain of Lakes pool level elevations for the hydraulic model. A low gradient in channel elevation exists for the 7-mi reach of the Fox River from Johnsburg to the Stratton Dam so the USGS streamgage Fox River at Johnsburg, Ill. (USGS station 05548500; U.S. Geological Survey, 2023b), was used for water-level stages at Johnsburg, and the USGS streamgage Fox River near McHenry, Ill. (USGS station 05549500; U.S. Geological Survey, 2023d), provided headwater stages at the Stratton Dam. The Stratton Dam tailwater stages are recorded at the USGS streamgage Fox River (tailwater) near McHenry, Ill. (USGS station 05549501; U.S. Geological Survey, 2023e). The USGS streamgage Fox River at Miller Bridge near McHenry, Ill. (USGS station 05549400; U.S. Geological Survey, 2023c), is an index-velocity gage (Levesque and Oberg, 2012) that also records flows and was used for model calibration.
Table 1.
Description of U.S. Geological Survey streamgages used for calibration and validation of the Chain of Lakes hydraulic model, Illinois.[Station location is shown in figure 1. Latitude and longitude are given in degrees (°), minutes (ʹ), and seconds (ʺ). USGS, U.S. Geological Survey; NAD 83, North American Datum of 1983; ft, foot; NAVD 88, North American Vertical Datum of 1988; “present” refers to the time of publication (2024); Site information from U.S. Geological Survey (2023g)]
Purpose and Scope
The purpose of this report is to document the development and evaluation of the two-dimensional HEC–RAS model of the Chain of Lakes and the Fox River. The hydraulic model described in this report may be used by the IDNR–OWR to optimize the operation of Stratton Dam to maintain Chain of Lakes pool levels and to help mitigate flooding in the Chain of Lakes system. The hydraulic model includes three newly installed torque-tube crest gates, which became operational in 2020 and replaced five sluice gate structures at the dam. The hydraulic model was calibrated using USGS stage-only streamgages and an index-velocity streamgage that collects continuous flow data. The hydraulic model uses hydrologic forecasts from the NWS–NCRFC, which enables engineers and planners to simulate and communicate predicted water-surface elevations and flows and to proactively prepare for runoff events in near real time. The hydraulic model was incorporated into a forecast workflow that streamlines implementation of model inputs and documents the model outputs in a manner tailored to the IDNR–OWR Stratton Dam operations and interpretations of simulated water-surface elevations and flows.
Previous Studies
In 2016, a reservoir model was developed to allow the IDNR–OWR to simulate Stratton Dam operations with predicted inflows from the NWS–NCRFC and to proactively prepare for precipitation events (Domanski, 2017). The reservoir model used a linear regression model of the complex relation of headwater elevations at the dam and reservoir pool elevations (Domanski, 2017). Flow ratings were developed for the hinged-crest gate, broad-crested weir, and sluice gates at the Stratton Dam along with the control structure (Algonquin Dam) at Algonquin, Ill. (fig. 2). The ratings were determined by measuring headwater stage, tailwater stage, and a wide range of flows at different gate openings. Standard control structure rating techniques were used to rate each control structure (Fisk, 1988; Straub and others, 200924).
Since the development of previous computational model and control structure ratings, technology has advanced with two-dimensional modeling and computer processing power. Along with these advancements, the USGS streamgages continue to record data and captured additional high-flow events in the Chain of Lakes system. With the USGS index-velocity gage installation in 2020, continuous flow data can now be included in model calibration. Finally, the new torque-tube crest gates are also incorporated and calibrated to the hydraulic model.
Model Development
The hydraulic model was constructed using the U.S. Army Corps of Engineers modeling system HEC–RAS (version 6.5; U.S. Army Corps of Engineers, 2022). The HEC–RAS modeling system allows one- or two-dimensional models with steady-state or unsteady-state computation options; the two-dimensional and unsteady-state options were used for the Chain of Lakes hydraulic model. The HEC–RAS model was used to simulate water-surface elevations and flows through the Chain of Lakes using gate specifications and gate operations at the Stratton Dam and is available at Cigrand (2024).
Topographic and Bathymetric Data
The elevation data for the area surrounding the Chain of Lakes were obtained from a 2-ft resolution digital elevation model that was derived from light detecting and ranging (lidar) data collected in 2017 by Dewberry, a privately held professional services firm (Dewberry, 2019). The lidar specifications were based on USGS Quality Level 1 (QL1) standards (version 1.2; Heidemann, 2014). The QL1 lidar data required a nonvegetated vertical accuracy root mean square error (RMSE) not to exceed 10.0 centimeters (cm) (actual was 5.1 cm) with a nonvegetated vertical accuracy not to exceed 19.6 cm (actual was 10.1 cm) and a vegetated vertical accuracy not to exceed 29.4 cm (actual was 10.2 cm) at the 95th percent confidence level (Dewberry, 2019). The specification for aggregate nominal pulse spacing of one point every 35 cm was met for the QL1 lidar.
The IDNR–OWR furnished bathymetric data and structure surveys to incorporate into the digital elevation model and provided geometry files in the hydraulic model. The bathymetric data and structure surveys were collected by IDNR–OWR survey crews during 2020 and 2022 (Wes Cattoor, IDNR–OWR, written commun., 2022).
Hydraulic Structures
The various hydraulic structures composing the Stratton Dam were represented in the hydraulic model with structure specifications furnished by the IDNR–OWR. These structures include three torque-tube crest gates with an average width of 28 ft and height of 6.25 ft each, a 50-ft-wide hinged-crest gate with a height of 6.7 ft, and a 221-ft-long broad-crested weir.
In the HEC–RAS model, each of the torque-tube crest gates was represented as an open-air overflow gate and sharp-crested weir. The Rehbock (1929) equation developed for a rectangular weir was selected for defining the weir discharge coefficient for the torque-tube crest gates and the hinged-crest gate. The Rehbock (1929) equation and a definition of the variables in the equation are listed below.
whereCd
is the coefficient of discharge of the weir,
h
is the energy head over the weir crest, and
P
is the spillway approach height.
The torque-tube gate crest elevation is 737.07 ft, and the approach elevation to the gates is about 729.02 ft, so P is 8.05 ft for the torque-tube crest gates. The hinged-crest gate was included in the model as a sharp-crested weir; the gate crest elevation is 737.02 ft and the approach elevation is 729.32 ft, so P is 7.7 ft. (Illinois Department of Natural Resources, 2012). The Rehbock equation works well for h/P less than 5 and is applicable up to h/P=10 when Cd is about 1.135 (Rouse, 1950; Henderson, 1966). The torque-tube crest gates and the hinged-crested gate have a maximum opening of 6.25 and 6.7 ft, respectively, so the gate specifications fit under the guidance for h/P less than 5.
For the broad-crested weir, a weir coefficient of 2.94 from Fisk (1988) was used where a free-weir-flow coefficient equation was developed from stage and flow measurements taken at the hinged-crest gate and broad-crested weir at the Stratton Dam. For bridges upstream from the dam, only the bridge piers are affected for the full range of flow depths and not the bridge superstructures; consequently, bridges were not incorporated into the model to minimize model run times because the IDNR–OWR intends to run model simulations in near real time with a range of gate operations (different gate opening heights throughout an event) for forecasted events.
Energy-Loss Factors
Hydraulic analyses require the estimation of energy losses that result from frictional resistance exerted by a channel on flow. These energy losses are quantified by the Manning’s roughness coefficient (n-value). Initial (precalibration) n-values were selected based on field observations, high-resolution aerial photographs collected through the U.S. Department of Agriculture National Agriculture Imagery Program and available through the U.S. Department of Agriculture Geospatial Data Gateway (U.S. Department of Agriculture, 2019), and tabulated (Chow, 1959) and photographic (Barnes, 1967) estimates of n-values. During model calibration, channel and Chain of Lakes n-values were adjusted to 0.020 to route the flow through the low-velocity reservoir system. The 0.020 channel n-values are considered low for natural stream channels (Chow, 1959) but were necessary for the simulated flows to replicate the timing of the observed data at the USGS streamgages. These channel n-values were also essential for model stability as it allowed consistent flow to be routed through the Chain of Lakes reservoir system to the gated structures at the Stratton Dam. When channel n-values greater than 0.020 were used, the flow routed through the low-gradient system to the gated structures was insufficient and produced model instabilities. The final overbank n-values ranged from 0.030 for barren lands to 0.120 for forested and high-intensity developed areas.
Model Boundary Conditions
Flow hydrographs were used within the two-dimensional mesh as internal boundary conditions to account for inflows entering the Chain of Lakes system. The use of internal boundary conditions (as opposed to external boundary conditions) allowed the inflows to disperse among the multichannel-connected lakes more readily. This approach allowed model simulations to closely replicate the timing of stage hydrographs at the USGS streamgages. The three main sources of inflows were the Fox River, Nippersink Creek, and local runoff. The NWS–NCRFC provided flow data from three hydrologic basins labeled WMTW3, NIPI2, and JHNI2 (fig. 2). The WMTW3 basin accounts for Fox River flows from the headwaters to Wilmot, Wisconsin, and the NIPI2 basin represents the Nippersink Creek basin and associated flows. Flow hydrographs for both basins are gage corrected to USGS streamgages near the basin outlets during and after an event. The JHNI2 basin accounts for local runoff and small ungaged tributaries in the areas surrounding the Chain of Lakes (fig. 2).
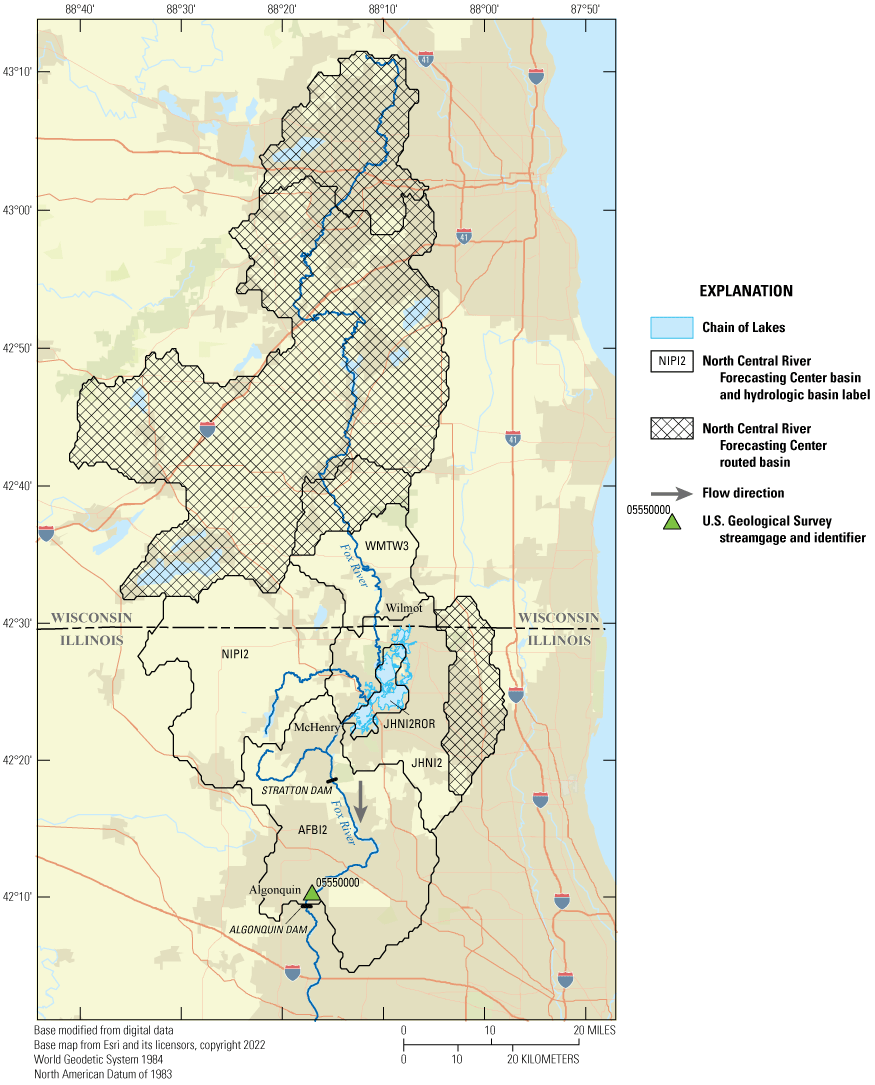
The National Weather Service–North Central River Forecasting Center hydrologic basins for the Fox River upstream from Algonquin, Illinois.
The Stratton Dam tailwater conditions are affected by water levels at the Algonquin Dam about 17 mi downstream at Algonquin, Ill. (fig. 2; Wes Cattoor, Illinois Department of Natural Resources–Office of Water Resources, oral commun, 2023). Normal depth computed from an estimated average water-surface slope was used as the downstream boundary condition. An initial normal-depth slope value (hereinafter referred to simply as “normal depth”) of 0.000020 was calculated by comparing streamgage data at the Stratton Dam tailwater (USGS station 05549501) and Algonquin Dam headwater (Fox River at Algonquin, Ill.; USGS station 05550000; U.S. Geological Survey, 2023a). The normal depth was lowered to 0.000019 during model calibration. The Stratton Dam tailwater in the hydraulic model was determined to be responsive to 0.000001 adjustments to normal depth.
Model Inputs and Initial Conditions
Input simulation data consisted of flow hydrographs, boundary conditions, initial conditions (water-surface elevations), and gate operations. A subcritical (tranquil) flow regime was assumed for the simulations. The hydraulic model used initial condition points for starting water-surface elevations at the beginning of a simulation at the four USGS stage only streamgage locations (table 1) and the downstream extent of the model. The initial condition points used observed water-surface elevations from USGS stations 05548000, 05548500, and 05549500. The initial condition points for the USGS station 05549501 (Stratton Dam tailwater) and the downstream model extent used the USGS station 05549500 (Stratton Dam headwater) observed water-surface elevation up to 736 ft. Using the higher water-surface elevations at USGS station 05549500 allowed the gates headwater and tailwater to become fully submerged and stabilize the model during the model simulation warm-up period. Early iterations of the model indicated a starting elevation above 736 ft at the Stratton tailwater produced large areas of inundation downstream that did not fully draw-down to observed conditions during the model warm-up period; however, an initial tailwater condition of 736 ft was determined to be adequate in keeping the model stable during the warm-up and provided no substantial difference in model results at USGS station 05549501.
A model warmup of 20,000 5-second time steps was needed to get the model inflows through the Chain of Lakes reservoir to the Stratton Dam control structures by the start of the model simulation. Hydraulic model computation options were set to the diffusion wave equation (U.S. Army Corps of Engineers, 2022) with a 5-second time-step increment, which produced stable model results and allowed faster run times than a smaller time step.
Model Calibration and Validation
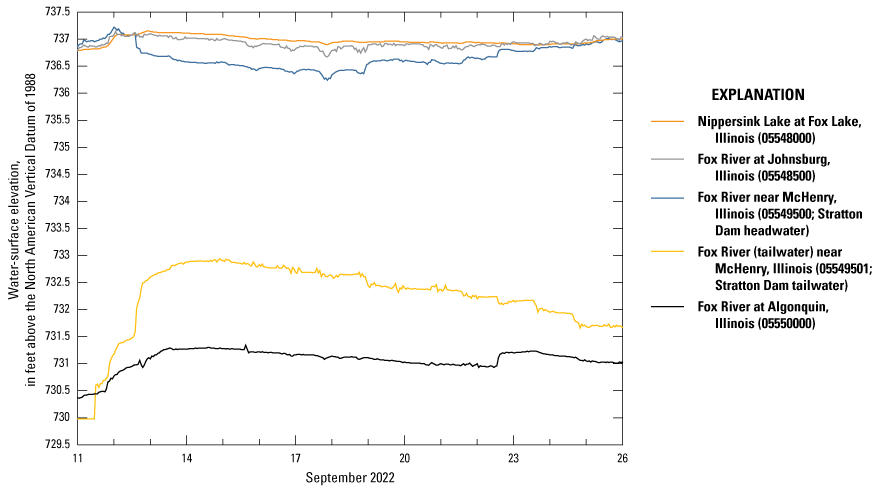
Model calibration was completed by adjusting n-values, normal depth, two-dimensional mesh cell size and alignment, and initial conditions with model warmup until the results of the hydraulic computations closely agreed with the observed water-surface elevations and flows at the streamgage locations. The HEC–RAS model was calibrated to three observed events that were detected after the torque-tube crest gates became operational in 2020. These calibration events include April–May 2022 (April 23–May 3), September 2022 (September 9–26), and March 2023 (February 28–March 15) (figs. 3, 4, and 5, respectively). The differences between observed and simulated peak water-surface elevations of the three calibration events at the USGS streamgage locations ranged from −0.32 to 0.15 ft (table 2). The differences between observed and simulated peak flow at the Miller Bridge near McHenry streamgage ranged from −236 to 50 cubic feet per second (ft3/s; table 3).
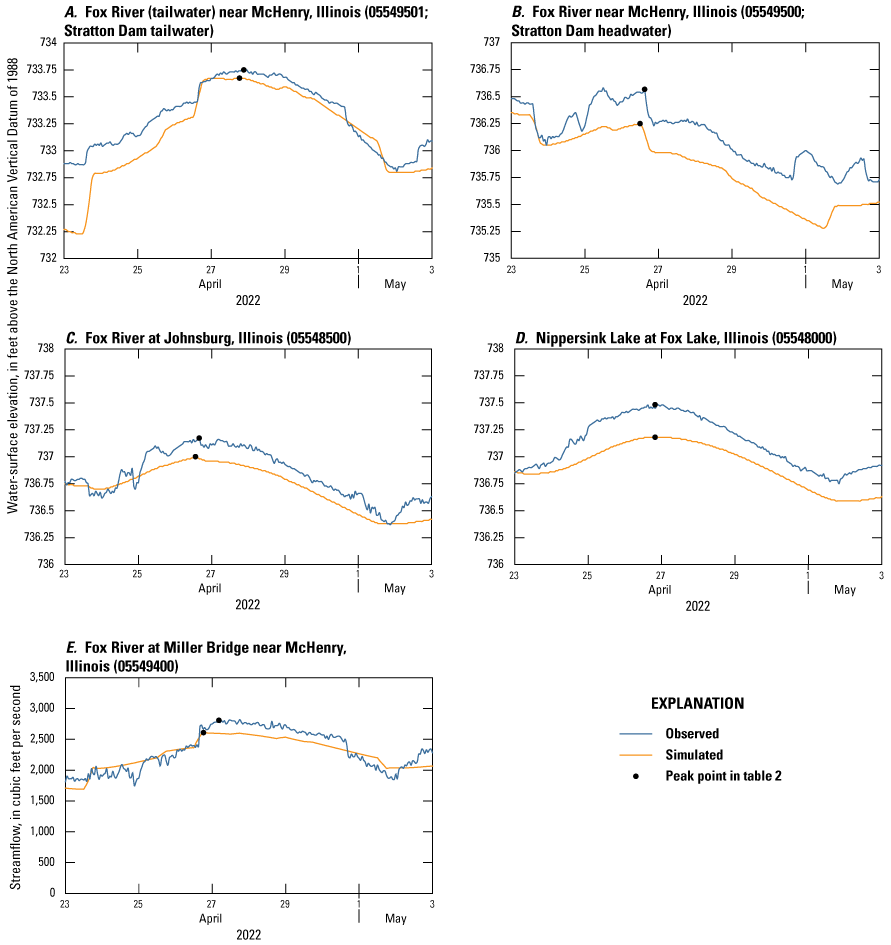
April–May 2022 calibration event simulated and observed continuous water-surface elevations and flows at U.S. Geological Survey streamgages. A, Fox River (tailwater) near McHenry, Illinois (05549501; Stratton Dam tailwater); B, Fox River near McHenry, Ill. (05549500; Stratton Dam headwater); C, Fox River at Johnsburg, Ill. (05548500); D, Nippersink Lake at Fox Lake, Ill. (05548000); E, Fox River at Miller Bridge near McHenry, Ill. (05549400).
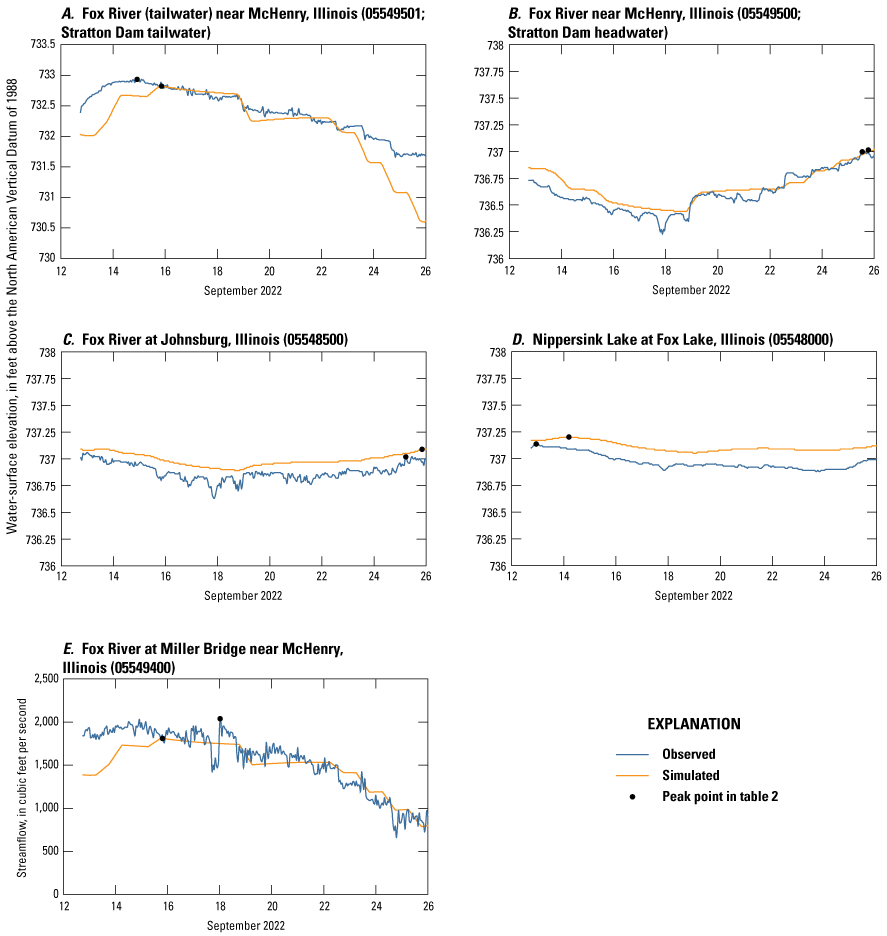
September 2022 calibration event simulated and observed continuous water-surface elevations and flows at U.S. Geological Survey streamgages. A, Fox River (tailwater) near McHenry, Illinois (05549501; Stratton Dam tailwater); B, Fox River near McHenry, Ill. (05549500; Stratton Dam headwater); C, Fox River at Johnsburg, Ill. (05548500); D, Nippersink Lake at Fox Lake, Ill. (05548000); E, Fox River at Miller Bridge near McHenry, Ill. (05549400).
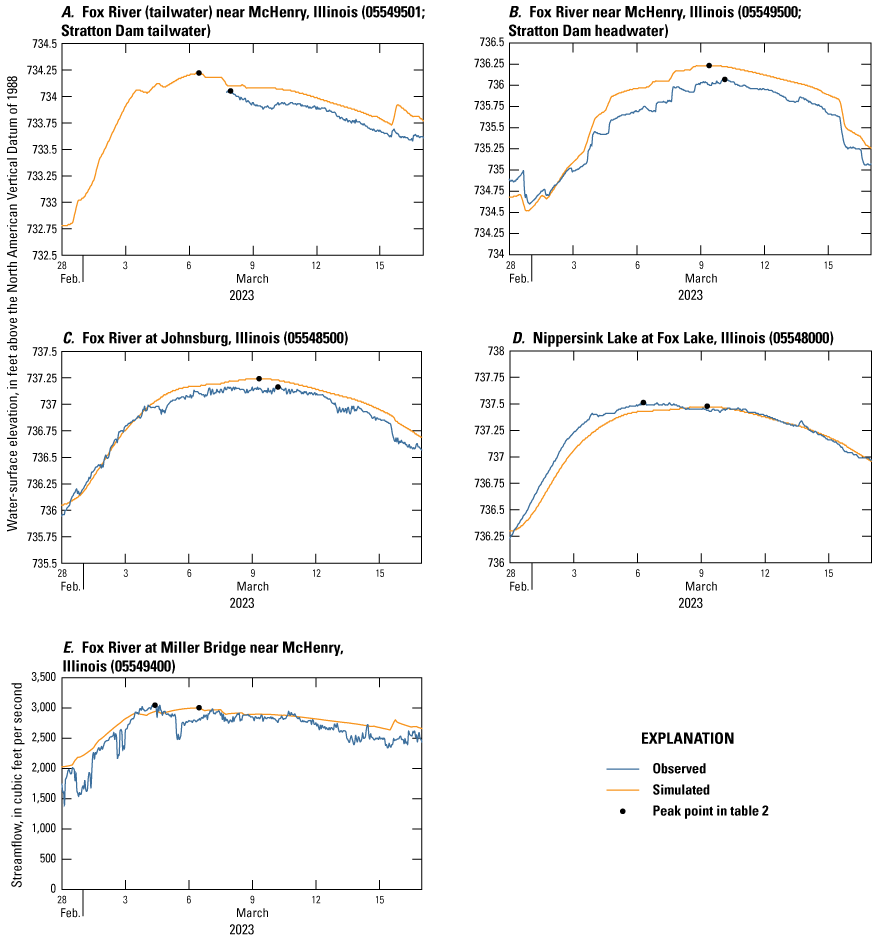
March 2023 calibration event simulated and observed continuous water-surface elevations and flows at U.S. Geological Survey streamgages. A, Fox River (tailwater) near McHenry, Illinois (05549501; Stratton Dam tailwater); B, Fox River near McHenry, Ill. (05549500; Stratton Dam headwater); C, Fox River at Johnsburg, Ill. (05548500); D, Nippersink Lake at Fox Lake, Ill. (05548000); E, Fox River at Miller Bridge near McHenry, Ill. (05549400).
Table 2.
Comparison of target and simulated peak water-surface elevations and model performance statistics (root mean square error) at U.S. Geological Survey streamgage locations for the Chain of Lakes hydraulic model, Illinois.[USGS, U.S. Geological Survey; ft, foot; NAVD 88, North American Vertical Datum of 1988; RMSE, root mean square error; Streamgage data from U.S. Geological Survey (2023g)]
Table 3.
Comparison of target and simulated peak flow and model performance statistics (root mean square error and percentage bias) at U.S. Geological Survey streamgage Fox River at Miller Bridge near McHenry, Illinois (station 05549400), for the Chain of Lakes hydraulic model.[ft3/s, cubic foot per second; RMSE, root mean square error; PBIAS, percentage bias; Streamgage data from U.S. Geological Survey (2023g)]
The RMSE and percentage bias (PBIAS) were used for model evaluation statistics (Gupta and others, 1999; table 3). The RMSE describes the difference between model simulations and observations in the units of the variable, and values close to zero indicate a perfect fit (Singh and others, 2005). The calibrated model had RMSE values ranging from 0.09 to 0.49 ft in water-surface elevation and 150 to 185 ft3/s for flow (tables 2 and 3). The USGS station 05549501 at the Stratton Dam tailwater had the three highest RMSE values ranging from 0.49 to 0.36 ft. The remaining USGS stations had low RMSE values of 0.31 ft or less. The PBIAS is a measure of the simulated data’s average tendency to be larger or smaller than observed values. Values of PBIAS can vary from −∞ to ∞ (where ∞ represents infinity) with an optimum value of 0. The calibrated model yielded PBIAS values of –5.41 to 4.27 percent for flow at USGS station 05549400, indicating a good model fit. The results demonstrate that the model can simulate accurate water levels throughout the Chain of Lakes and Stratton Dam headwater and tailwater areas.
After calibration, the model was used to simulate conditions for a validation event in January–February 2024 (January 28–February 22, specifically) to confirm model performance (fig. 6). The differences between observed and simulated peak water-surface elevations for this validation event at USGS streamgages ranged from −0.24 to −0.04 ft (table 2). The difference between observed and simulated peak flow at the Miller Bridge near McHenry (USGS station 05549400) was −219 ft3/s. The validation event yielded a PBIAS value of 2.15 percent for flow and an RMSE value of 242 ft3/s at USGS station 05549400 (table 3). The validation event had RMSE values of 0.09–0.49 ft of water-surface elevation (table 2). In the beginning of the event simulation, the Stratton Dam tailwater (USGS station 05549501) was 1.21 ft lower than observed measurements. The tailwater area improved during the simulation with a depth that was 0.21 ft lower than observed measurements at the end of the simulation. The estimated flow values resulting from effects of ice debris and missing time series data created a larger margin of error when comparing simulated and observed flows. This is a conservative validation in a sense that the model performance statistics are exaggerated high because of the added fluctuations at Stratton Dam tailwater and uncertainty in observed data as a result of the ice conditions.
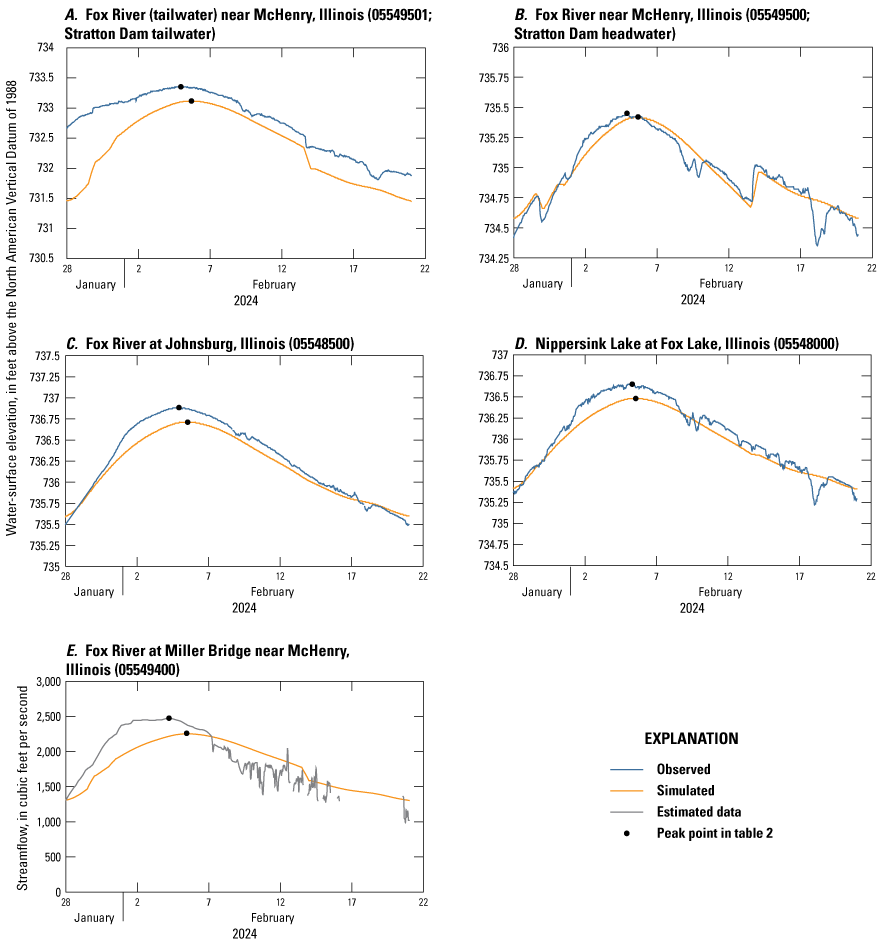
January–February 2024 validation event of simulated and observed continuous water-surface elevations and flows at U.S. Geological Survey streamgages. A, Fox River (tailwater) near McHenry, Illinois (05549501; Stratton Dam tailwater); B, Fox River near McHenry, Ill. (05549500; Stratton Dam headwater); C, Fox River at Johnsburg, Ill. (05548500); D, Nippersink Lake at Fox Lake, Ill. (05548000); E, Fox River at Miller Bridge near McHenry, Ill. (05549400).
A second validation event was simulated for the July 2017 historical flooding event which produced one of the top three record peaks at USGS stations 05548000, 05548500, and 05549501, all of which have a record of more than 80 years (table 1). This event predates the construction of the torque-tube crest gates but was an important flooding event to simulate because no substantial flooding has been detected since the torque-tube crest gates became operational. Because the five sluice gates were of similar size in gate height and cumulative widths (Illinois Department of Natural Resources, 2022), the percentage the sluice gates were opened in 2017 can be applied to the torque-tube crest gates openings and operation. The differences between observed and simulated peak water-surface elevations for this validation event at the USGS streamgage locations ranged from −0.36 to 0.05 ft (fig. 7; table 2). The historical flooding event had RMSE values of 0.19–0.49 ft of water-surface elevation; however, no flow hydrographs could be compared because this event predates USGS station 05549400.
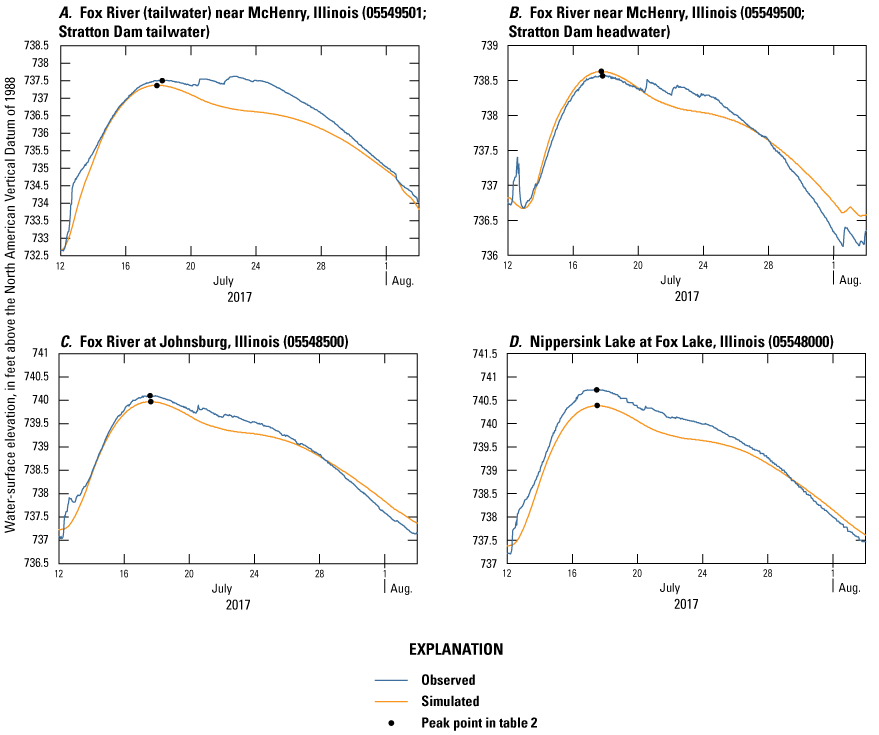
July 2017 historical flood simulated and observed continuous water-surface elevations and flows at U.S. Geological Survey streamgages. A, Fox River (tailwater) near McHenry, Illinois (05549501; Stratton Dam tailwater); B, Fox River near McHenry, Ill. (05549500; Stratton Dam headwater); C, Fox River at Johnsburg, Ill. (05548500); D, Nippersink Lake at Fox Lake, Ill. (05548000).
Model Sensitivity, Uncertainties, and Limitations
The sensitivity of the hydraulic model was assessed using changes in n-values and normal depth. The n-values and normal depth were modified by +10 and −10 percent, and the March 2023 calibration event was used for the base simulation in the sensitivity analysis. The difference in peak water-surface elevations from the base simulation ranged from −0.34 to 0.29 ft (table 4; fig. 8). The percentage difference in peak flow from the base simulation varied from −4.2 to 4.6 percent. The USGS station 05549501 at the Stratton Dam tailwater was the most sensitive to change; the tailwater decreased by 0.34 and 0.16 ft for the lower n-value and higher normal depth, respectively, and increased by 0.29 and 0.18 ft from the higher n-value and lower normal depth, respectively. The USGS station 05549500 at the Stratton Dam headwater was sensitive to n-values with an increase and decrease of 0.12 ft for higher and lower n-values, respectively. The USGS stations 05548500 and 05548000, farthest upstream in the Chain of Lakes, were also sensitive to n-values with about a 0.20-ft increase with the higher n-value and a similar decrease with the lower n-value. The USGS station 05549400 had changes in peak flow with a 4.6-percent increase from the lower n-value and 4.2-percent decrease from the higher n-value. Normal depth had no significant effect at the USGS stations upstream from the Stratton Dam.
Table 4.
Hydraulic model sensitivity analysis results for the Chain of Lakes hydraulic model, Illinois.[ft, foot; NAVD 88, North American Vertical Datum of 1988; ft3/s, cubic foot per second; USGS, U.S. Geological Survey; –, not computed; n, Manning’s n-value; ND, normal depth]
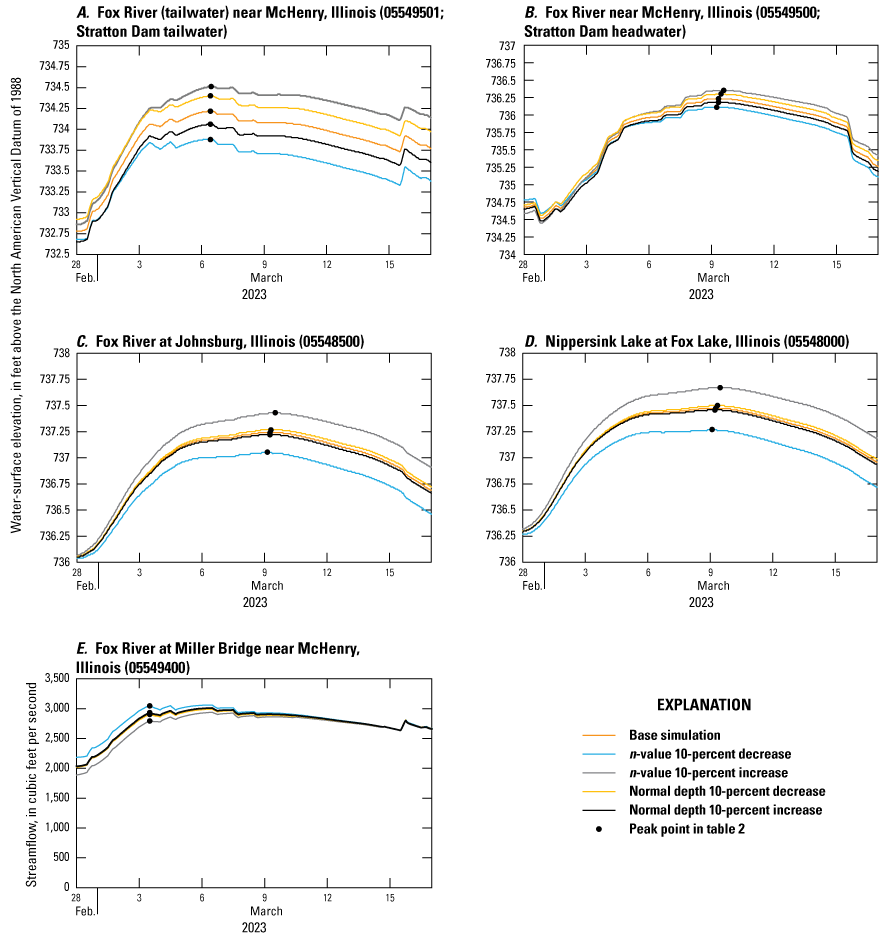
Hydraulic model sensitivity analysis for Manning’s n-values and normal depth at U.S. Geological Survey streamgages. A, Fox River (tailwater) near McHenry, Illinois (05549501; Stratton Dam tailwater); B, Fox River near McHenry, Ill. (05549500; Stratton Dam headwater); C, Fox River at Johnsburg, Ill. (05548500); D, Nippersink Lake at Fox Lake, Ill. (05548000); E, Fox River at Miller Bridge near McHenry, Ill. (05549400).
The Chain of Lakes can pose challenging conditions for model simulations. Because of the basin’s low-gradient slope, the upstream observed streamgages (USGS stations 05548000 and 05548500) on the Chain of Lakes are at times lower than the Stratton Dam headwater (USGS station 05549500; fig. 9). This phenomenon was often detected immediately after heavy precipitation and produced negative slope values near the Stratton Dam headwater. The most likely cause is local inflows that take place near McHenry, Ill., such as Boone Creek (fig. 2).
U.S. Geological Survey streamgage comparison for water-surface elevations during the September 2022 calibration event.
Several peaks from the calibration and validation events are underestimated (figs. 3–7; tables 2–3), which may be the result of additional drainage areas not covered by the three NWS–NCRFC hydrologic basins used in the model. The hydrologic basins from the NWS–NCRFC used for the model boundary conditions do not include any areas downstream from the natural outlet of Nippersink Lake near Johnsburg, Ill. This area is instead included in the AFBI2 hydrologic basin which covers the Fox River basin downstream to the Algonquin Dam (fig. 2). A ratio of this hydrologic basin could not be used for the accounted drainage area on the Chain of Lakes because the inflows and runoff are routed to the basin outlet at the Algonquin Dam and would likely produce attenuated flows from the smaller drainage areas such as Boone Creek. Secondly, the hydrologic basin JHNI2 does not account for rain that falls directly on the reservoir system and instead only simulates runoff and baseflow. Finally, the NWS hydrologic forecasts have their own uncertainties, and the operational hydrologists rely on experience and intuition to adjust hydrologic model inputs and parameters. These model adjustments are called “modifiers” by National Weather Service hydrologists. The most common modifiers are precipitation, antecedent soil moisture, and shape of the unit hydrograph for a basin (Zhu and others, 2021). These modifiers can affect peak flows, timing, and total volume of the hydrograph inputs to the Chain of Lakes model.
The Stratton Dam tailwater also is affected by the Algonquin Dam (fig. 2). The low-gradient water-surface slope of the 17-mi reach from the Stratton Dam tailwater to the Algonquin Dam headwater affects the normal-depth values computed for the model. On September 11, 2022, the recorded water levels were higher at the Algonquin Dam headwater than at the Stratton Dam tailwater (fig. 9) and produced negative slope values. The simulation for the September 2022 calibration event started on September 12 when the Stratton Dam tailwater began to have higher water levels than the Algonquin Dam headwater. At the end of the September 2022 calibration event, the observed headwater at the Algonquin Dam water-surface elevation was only 0.36 ft lower than the Stratton Dam tailwater, and similar water level elevations were observed from the Stratton Dam upstream to the Chain of Lakes. Because the model simulation uses a constant normal-depth slope value (fig. 4), the model could not replicate the observed values at USGS station 05549501 that resulted from variable normal-depth slopes during an event. The model could diverge from the observed tailwater conditions without accounting for variable normal-depth slopes as a downstream boundary condition during a simulation.
The Chain of Lakes can also produce negative flows from strong southwestern winds that push the water upstream (Schrader and Holmes, 2000). Streamgage data have unsteady fluctuations during windy days; the fluctuations have the potential to affect the hydraulic model performance when using the observed data for model output comparisons or model inputs.
Additions to the hydraulic model might help account for some of these limitations. A model extension to the Algonquin Dam would help simulate the interactions of water-surface elevations in the river reach between the Stratton and Algonquin Dams and allow the Stratton Dam tailwater to not be constrained to a single normal-depth slope. The model extension would include the hydrologic basin AFBI2 to account for additional runoff to the Algonquin Dam (fig. 2); furthermore, the NWS–NCRFC has the hydrologic basin JHNI2ROR to account for rain that has fallen on the reservoir system. The datasets for this basin are in a precipitation time series, and a rain-on-grid feature could be added to the two-dimensional mesh in the hydraulic model to account for this input. Wind forces on moving water is another function that could be implemented in the hydraulic model to account for the wind and streamflow interaction.
Workflow Development
A workflow was developed in Python to facilitate efficient model scenario testing for the Chain of Lakes HEC–RAS model. This model was developed to assess how gate operations at the Stratton Dam affect water levels within the Chain of Lakes and flow rates downstream from the dam. The workflow uses a combination of input data and customized functions to do the following:
-
1. Update model files,
-
2. Run a model simulation,
-
3. Extract and summarize model outputs, and
-
4. Graph the results.
The primary inputs to the workflow are Standard Hydrologic Exchange Format (SHEF) files obtained from the NWS–NCRFC and Excel files supplied by the end user. The SHEF files contain observed and predicted flow rates from NWS–NCRFC hydrologic basins that flow into the Chain of Lakes (WMTW3, NIPI2, and JHNI2), and the Excel files contain hourly time series of gate openings for three torque-tube crest gates and one hinged-crest gate at the Stratton Dam. The workflow incorporates these new time series into the model files and uses their start and end dates to modify the model simulation period and to obtain initial water-surface elevations at five reference locations within the model domain (at USGS stations 05548000, 05548500, 05549500, and 05549501 and at the downstream extent of the model). As mentioned in the “Model Inputs and Initial Conditions” section, the initial conditions at USGS station 05549500 were used for the initial conditions at the Stratton Dam tailwater (USGS station 05549501) and downstream extent to a maximum value of 736 ft. Using these initial conditions allowed the model to stabilize and draw down during the model warmup period. The primary outputs of the workflow are hourly time series and graphical representations of hydrographs for the Stratton Dam tailwater and water-surface elevations at the five reference locations.
The key Python libraries used in this workflow include pyhecdss, dataretrieval, rascontrol, and h5py. Pyhecdss is used to edit and update Hydrologic Engineering Center–Digital Storage System (HEC–DSS) files with the new flow time series provided by the NWS–NCRFC (Sandhu and others, 2019). Dataretrieval is used to obtain initial water-surface elevations at the four USGS streamgage reference points (Hodson and others, 2023). Rascontrol is used to run HEC–RAS simulations through Python (Bannister, 2019), and h5py (version 2.7.1) is used to extract model results from the Hierarchical Data Format output files (Collette and others, 2018). These libraries were used to complete the core series of tasks involved in HEC–RAS modeling; however, common Python libraries like Pandas (The Pandas Development Team, 2024) and Numpy (Harris and others, 2020) were used to resolve workflow complexities, such as time zone conflicts and unit conversions. The workflow converts all time series to coordinated universal time for simulations but converts back to central daylight time before generating results. The workflow was designed so that end users only operate in central daylight time.
End users will interact with the workflow by first providing pathways to a variety of files, including the SHEF files, the model files (that is, u-, p-, prj-, and Hierarchical Data Format-files), and gate operation files. Next, the user will select a HEC–DSS file to use for scenario testing. The user will then run predefined lines of code to generate an Excel template for entering the gate operations data. Once the user has populated these Excel files, they will simply run the remaining code in the workflow, which will run the model and output the results. The workflow also has the capacity to supply unique date ranges for model simulation periods and to supply multiple gate operation files in advance for batch processing.
The product of this workflow is four Python scripts. The first script contains all the backend functions needed to perform the data formatting tasks described previously, and the second script contains the workflow that executes these functions. The two remaining Python scripts are identical to the first two scripts but are used for simulations involving the 3-, 5-, and 7-day scenarios provided by the NWS–NCRFC. These latter scripts prompt users to select a forecast scenario they wish to simulate from the HEC–DSS file, but they otherwise function the same as the first two scripts. These scripts were separated to avoid end-user confusion. The output Python files document the hydraulic model outputs tailored to IDNR–OWS Stratton Dam operations and interpretations of the simulated water-surface elevations and flows. The workflow streamlines implementation of hydraulic model inputs and provides an efficient way to simulate and assess a range of hydrologic forecasts and gate operations.
Summary
Hydrologic forecasts entering and leaving the Chain of Lakes are critical to the optimal operation of the Stratton Dam at McHenry, Illinois. The National Weather Service–North Central River Forecasting Center provides the Illinois Department of Natural Resources–Office of Water Resources (IDNR–OWR) with 0–7-day hydrologic forecasts of inflows entering the Chain of Lakes. The IDNR–OWR uses the hydrologic forecasts to develop gate operations to manage Chain of Lakes pool levels and to help mitigate flooding in the Chain of Lakes system. In 2020, the U.S. Geological Survey (USGS) and IDNR–OWR began a cooperative study to develop a system that enables engineers and planners to simulate and communicate predicted water-surface elevations and flows and to proactively prepare for runoff events forecasted for the Chain of Lakes. This hydraulic model and forecast workflow may be helpful to the IDNR–OWR for optimizing the operation of the Stratton Dam and includes the implementation of three newly installed torque-tube crest gates that became operational in 2020.
The Hydrologic Engineering Center–River Analysis System program (version 6.5) was used to simulate water-surface elevations and flows through the 18.5-mile Chain of Lakes system to 1.7 miles downstream from the Stratton Dam. Five USGS streamgages within the study area were used as reference points for model calibration and initial water-surface elevations for the beginning of the simulation. The hydraulic model was calibrated to runoff events in April–May 2022, September 2022, and March 2023 and incorporated the design specifications and observed gate operations of the Stratton Dam. The hydraulic model was validated by simulating a January–February 2024 event and a significant flooding event during July 2017. The July 2017 event predated the torque-tube crest gate installation but nevertheless tested the performance of the model for such a significant event. The model simulation results were a good fit to observed records at USGS streamgages with peak water-surface elevations within −0.36–0.15 foot of observed events. The hydraulic model was implemented into a forecast workflow that streamlines implementation of model inputs and documents the model outputs in a manner that is tailored to the IDNR–OWR Stratton Dam operations and interpretations of the simulated water-surface elevations and flows.
References Cited
Bannister, M., 2019, Rascontrol: GitHub software release, accessed May 8, 2023, at https://github.com/mikebannis/rascontrol/tree/master.
Barnes, H.H., Jr., 1967, Roughness characteristics of natural channels: U.S. Geological Survey Water-Supply Paper 1849, 219 p. [Also available at https://doi.org/10.3133/wsp1849.]
Cigrand, C.V., 2024, Archive of the hydraulic model used in the two-dimensional simulation of the Chain of Lakes on the Fox River near McHenry, Illinois: U.S. Geological Survey data release, accessed June 2024 at https://doi.org/10.5066/P16H3TDH.
Collette, A., and others, 2018, h5py documentation, version 2.7.1: GitHub web page, accessed May 8, 2023, at https://docs.h5py.org/en/stable/build.html#source-installation-on-windows.
Dewberry, 2019, Northeast Illinois lidar—Report produced for U.S. Geological Survey: Rolla, Mo., U.S. Geological Survey, prepared by Dewberry, Task Order G16PD00498, 57 p., accessed March 5, 2024, at https://rockyweb.usgs.gov/vdelivery/Datasets/Staged/Elevation/metadata/IL_4_County_QL1_LiDAR__2016_B16/IL_4County_McHenry_2018/reports/G16PD00498_Nort heast_Illinois_Project_Report_20190719.pdf.
Domanski, M.M., 2017, Development and evaluation of a reservoir model for the Chain of Lakes in Illinois: U.S. Geological Survey Scientific Investigations Report 2016–5155, 21 p., accessed May 13, 2024, at https://doi.org/10.3133/sir20165155.
Fisk, G.G., 1988, Discharge ratings for control structures at McHenry Dam on the Fox River, Illinois: U.S. Geological Survey Water-Resources Investigations Report 87–4226, 24 p., accessed May 13, 2024, at https://doi.org/10.3133/wri874226.
Gupta, H.V., Sorooshian, S., and Yapo, P.O., 1999, Status of automatic calibration for hydrologic models—Comparison with multilevel expert calibration: Journal of Hydrologic Engineering, v. 4, no. 2, p. 135–143. [Also available at https://doi.org/10.1061/(ASCE)1084-0699(1999)4:2(135).]
Harris, C.R., Millman, K.J., van der Walt, S.J., Gommers, R., Virtanen, P., Cournapeau, D., Wieser, E., Taylor, J., Berg, S., Smith, N.J., Kern, R., Picus, M., Hoyer, S., van Kerkwijk, M.H., Brett, M., Haldane, A., Fernández del Río, J., Wiebe, M., Peterson, P., Gérard-Marchant, P., Sheppard, K., Reddy, T., Weckesser, W., Abbasi, H., Gohlke, C., and Oliphant, T.E., 2020, Array of programming with NumPy: Nature, v. 585, p. 357–362. [Also available at https://doi.org/10.1038/s41586-020-2649-2.]
Heidemann, H.K., 2014, Lidar base specification (ver. 1.2, November 2014): U.S. Geological Survey Techniques and Methods, book 11, chap. B4, 67 p., accessed May 13, 2024, at https://doi.org/10.3133/tm11B4.
Hodson, T.O., Hariharan, J.A., Black, S., and Horsburgh, J.S., 2023, dataretrieval (Python)—A Python package for discovering and retrieving water data available from U.S. federal hydrologic web services: U.S. Geological Survey software release, accessed May 8, 2023, at https://doi.org/10.5066/P94I5TX3.
Illinois Department of Natural Resources, 2012, Stratton Lock and Dam—Public information for Stratton and Algonquin Dams: Illinois Department of Natural Resources web page, accessed March 5, 2024, at https://dnr.illinois.gov/waterresources/strattonlockanddam.html.
Illinois Department of Natural Resources, 2022, Stratton Lock and Dam improvements ensure Fox River Chain O’ Lakes boaters experience shorter wait times in lock—$22M improvement project benefits thousands of recreational boaters annually: Illinois Department of Natural Resources web page, accessed March 5, 2024, at https://www2.illinois.gov/IISNews/25180-Stratton_Lock_and_Dam_improvements_ensure_Fox_River_Chain_O%E2%80%99_Lakes_boaters_experience_shorter_wait_tim es_in_lock.pdf.
Kothandaramon, V., Evans, R.L., Bhowmik, N.G., Stall, .B., Gross, D.L., Lineback, J.A., and Dreher, G.B., 1977, Fox Chain of Lakes investigation and water quality management plan: Urbana, Ill., Illinois State Water Survey, 200 p. [Also available at https://www.ideals.illinois.edu/items/35456.]
Levesque, V.A., and Oberg, K.A., 2012, Computing discharge using the index velocity method: U.S. Geological Survey Techniques and Methods, book 3, chap. A23, 148 p., accessed March 27, 2024, at https://doi.org/10.3133/tm3A23.
The Pandas Development Team, 2024, pandas-dev/pandas—Pandas, Zenodo software release, accessed May 8, 2023, at https://doi.org/10.5281/zenodo.10957263.
Rehbock, T., 1929, Discussion of “precise measurements”: Transactions of the American Society of Civil Engineers, v. 93, p. 1143–1162. [Also available at https://archive.org/details/sim_american-society-of-civil-engineers-transactions_1929_93/page/1142/mode/2up.]
Sandhu, N., Nam, K., and Oling, H., 2019, pyhecdss, California Department of Water Resources Delta Modeling Section: GitHub software release, accessed May 8, 2023, at https://github.com/CADWRDeltaModeling/pyhecdss.
Schrader, D.L., and Holmes, R.R., Jr., 2000, Suspended-sediment budget, flow distribution, and lake circulation for the Fox Chain of Lakes in Lake and McHenry Counties, Illinois, 1997–99: U.S. Geological Survey Water-Resources Investigations Report 2000–4115, 23 p., accessed May 13, 2024, at https://doi.org/10.3133/wri004115.
Singh, J., Knapp, H.V., Arnold, J.G., and Demissie, M., 2005, Hydrologic modeling of the Iroquois River watershed using HSPF and SWAT: Journal of the American Water Resources Association, v. 41, no. 2, p. 343–360. [Also available at https://doi.org/10.1111/j.1752-1688.2005.tb03740.x.]
Straub, T.D., Johnson, G.P., Hortness, J.E., and Parker, J.R., 2009, Control-structure ratings on the Fox River at McHenry and Algonquin, Illinois: U.S. Geological Survey Scientific Investigations Report 2009–5186, 61 p., accessed May 13, 2024, at https://doi.org/10.3133/sir20095186.
U.S. Army Corps of Engineers, 2022, HEC–RAS—River analysis system: U.S. Army Corps of Engineers software release, accessed October 15, 2023, at https://www.hec.usace.army.mil/software/hec-ras/download.aspx.
U.S. Department of Agriculture, 2019, Geospatial Data Gateway: U.S. Department of Agriculture database, accessed April 8, 2019, at https://datagateway.nrcs.usda.gov/.
U.S. Geological Survey, 2023a, Fox River at Algonquin, IL—05550000, in USGS water data for the Nation: U.S. Geological Survey National Water Information System database, accessed March 20, 2023, at https://doi.org/10.5066/F7P55KJN. [Site information directly accessible at https://waterdata.usgs.gov/monitoring-location/05550000/#parameterCode=00065&showMedian=false&period=P7D.]
U.S. Geological Survey, 2023b, Fox River at Johnsburg, IL—05548500, in USGS water data for the Nation: U.S. Geological Survey National Water Information System database, accessed March 20, 2023, at https://doi.org/10.5066/F7P55KJN. [Site information directly accessible at https://waterdata.usgs.gov/monitoring-location/05548500/#parameterCode=00065&showMedian=false&period=P7D.]
U.S. Geological Survey, 2023c, Fox River at Miller Bridge near McHenry, IL—05549400, in USGS water data for the Nation: U.S. Geological Survey National Water Information System database, accessed March 20, 2023, at https://doi.org/10.5066/F7P55KJN. [Site information directly accessible at https://waterdata.usgs.gov/monitoring-location/05549400/#parameterCode=00060&showMedian=false&period=P7D.]
U.S. Geological Survey, 2023d, Fox River near McHenry, IL—05549500, in USGS water data for the Nation: U.S. Geological Survey National Water Information System database, accessed March 20, 2023, at https://doi.org/10.5066/F7P55KJN. [Site information directly accessible at https://waterdata.usgs.gov/monitoring-location/05549500/#parameterCode=00065&showMedian=false&period=P7D.]
U.S. Geological Survey, 2023e, Fox River (tailwater) near McHenry, IL—05549501, in USGS water data for the Nation: U.S. Geological Survey National Water Information System database, accessed March 20, 2023, at https://doi.org/10.5066/F7P55KJN. [Site information directly accessible at https://waterdata.usgs.gov/monitoring-location/05549501/#parameterCode=00065&showMedian=false&period=P7D.]
U.S. Geological Survey, 2023f, Nippersink Lake at Fox Lake, IL—05548000, in USGS water data for the Nation: U.S. Geological Survey National Water Information System database, accessed March 20, 2023, at https://doi.org/10.5066/F7P55KJN. [Site information directly accessible at https://waterdata.usgs.gov/monitoring-location/05548000/#parameterCode=00065&showMedian=false&period=P7D.]
U.S. Geological Survey, 2023g, USGS surface-water data for the Nation, in USGS water data for the Nation: U.S. Geological Survey National Water Information System database, accessed May 13, 2024, at https://doi.org/10.5066/F7P55KJN. [Surface-water data directly accessible at https://waterdata.usgs.gov/nwis/sw.]
Zhu, Z., Wasti, A., Schade, T., Ray, P., 2021, Techniques to evaluate the modifier process of National Weather Service flood forecasts: Journal of Hydrology X, v. 11, 12 p. [Also available at https://doi.org/10.1016/j.hydroa.2020.100073.]
Conversion Factors
U.S. customary units to International System of Units
Datums
Vertical coordinate information is referenced to the North American Vertical Datum of 1988 (NAVD 88).
Horizontal coordinate information is referenced to the North American Datum of 1983 (NAD 83).
These are the vertical and horizontal datums used in the report unless specified otherwise.
Abbreviations
HEC–DSS
Hydrologic Engineering Center–Digital Storage System
HEC–RAS
Hydrologic Engineering Center–River Analysis System
IDNR–OWR
Illinois Department of Natural Resources–Office of Water Resources
lidar
light detection and ranging
n-value
Manning’s roughness coefficient
NWS–NCRFC
National Weather Service–North Central River Forecasting Center
PBIAS
percentage bias
RMSE
root mean square error
SHEF
standard hydrologic exchange format
USGS
U.S. Geological Survey
For more information about this publication, contact:
Director, USGS Central Midwest Water Science Center
1400 Independence Road
Rolla, MO 65401
573–308–3667
For additional information, visit: https://www.usgs.gov/centers/cm-water
Publishing support provided by the
Rolla Publishing Service Center
Disclaimers
Any use of trade, firm, or product names is for descriptive purposes only and does not imply endorsement by the U.S. Government.
Although this information product, for the most part, is in the public domain, it also may contain copyrighted materials as noted in the text. Permission to reproduce copyrighted items must be secured from the copyright owner.
Suggested Citation
Cigrand, C.V., and Ament, M.R., 2024, Two-dimensional hydraulic model for the Chain of Lakes on the Fox River near McHenry, Illinois: U.S. Geological Survey Scientific Investigations Report 2024–5056, 20 p., https://doi.org/10.3133/sir20245056.
ISSN: 2328-0328 (online)
Study Area
| Publication type | Report |
|---|---|
| Publication Subtype | USGS Numbered Series |
| Title | Two-dimensional hydraulic model for the Chain of Lakes on the Fox River near McHenry, Illinois |
| Series title | Scientific Investigations Report |
| Series number | 2024-5056 |
| DOI | 10.3133/sir20245056 |
| Publication Date | June 25, 2024 |
| Year Published | 2024 |
| Language | English |
| Publisher | U.S. Geological Survey |
| Publisher location | Reston, VA |
| Contributing office(s) | Central Midwest Water Science Center |
| Description | Report: vii, 20 p.; Data Release; Dataset |
| Country | United States |
| State | Illinois |
| Other Geospatial | Fox River |
| Online Only (Y/N) | Y |
| Additional Online Files (Y/N) | N |