

Chloride Concentrations in Groundwater From the Western Part of the Southern Hills Regional Aquifer System, Louisiana, 2021–22
Links
- Document: Report (3.29 MB pdf) , HTML , XML
- Data Releases:
- USGS Data Release - Chloride concentration data for the western part of the Southern Hills regional aquifer system, Louisiana, 2021–22, and selected historical data
- USGS NWIS database - USGS water data for the Nation
- NGMDB Index Page: National Geologic Map Database Index Page (html)
- Download citation as: RIS | Dublin Core
Acknowledgments
The author gratefully acknowledges the support of the Capital Area Groundwater Conservation Commission for this work and the generous help from well owners for allowing access to their properties and accommodating the data collection effort.
Additional thanks are given to U.S. Geological Survey hydrologists Paul Frederick, Angela Robinson, and Vincent White, who assisted with sample collection and processing.
Abstract
Groundwater is heavily used for public supply and industrial uses in the Baton Rouge, Louisiana, area. Lowered water levels resulting from groundwater withdrawals have induced the movement of saltwater towards wells in East Baton Rouge and West Baton Rouge Parishes. Saltwater intrusion has the potential to affect water supply infrastructure, reduce water availability for some uses, and increase treatment costs. To document current conditions, samples were collected from 161 wells screened in 10 aquifers of the Southern Hills regional aquifer system during November 2021 through February 2022. The results were compared with historical data to identify where chloride concentrations are increasing, which could indicate that saltwater intrusion is occurring. Saltwater intrusion, to varying degrees and areal extents, was observed in most of the 10 aquifers. The limited availability of monitoring wells near or within some of the known saltwater plume areas restricts tracking of the movement or delineation of the plumes’ current extents.
Introduction
The Southern Hills regional aquifer system is the primary source of water for the northern parishes of southeastern Louisiana (Buono, 1983) (fig. 1). In East Baton Rouge, West Baton Rouge, East Feliciana, West Feliciana, and Pointe Coupee Parishes, estimated groundwater withdrawals in 2015 were about 203 million gallons per day (Mgal/d) (Collier, 2018). Withdrawals were concentrated in East Baton Rouge Parish for industrial (72.6 Mgal/d) and public supply (72.2 Mgal/d) use.
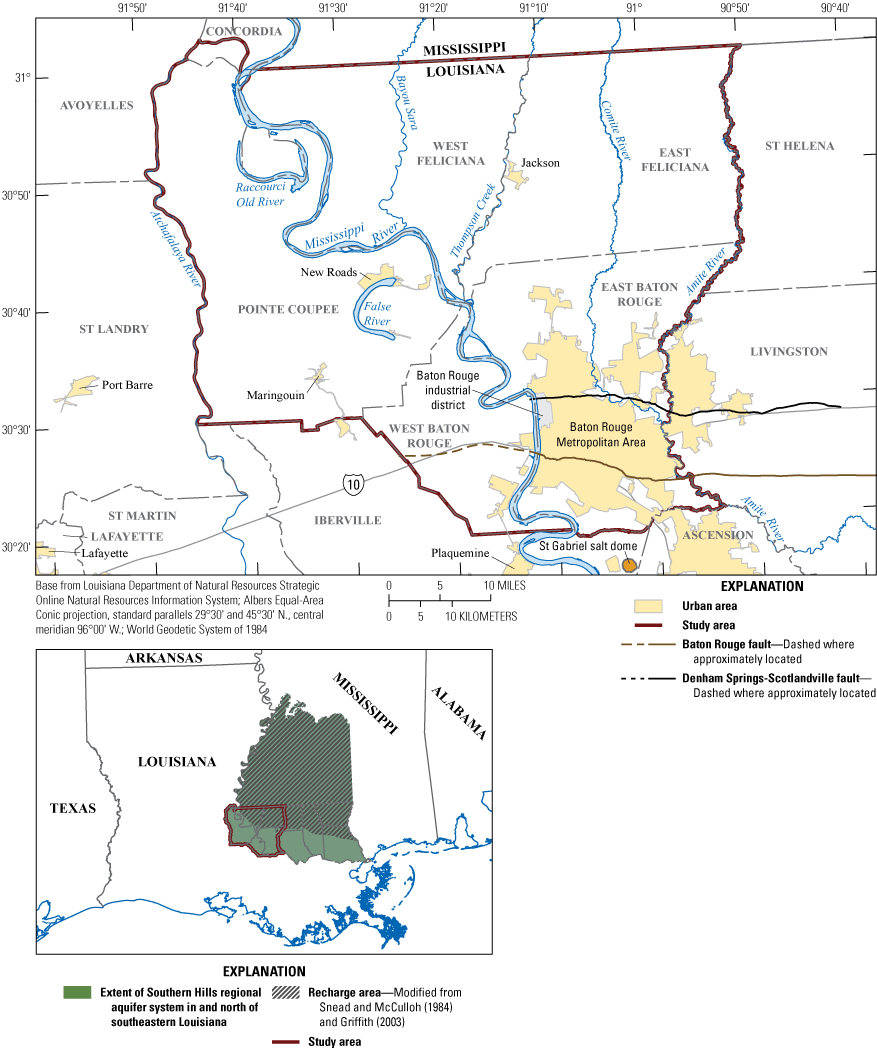
Study area in southeastern Louisiana.
Saltwater intrusion, or the movement of saltwater1 into aquifers, has been documented in multiple aquifers underlying East Baton Rouge and West Baton Rouge Parishes (Whiteman, 1979; Tomaszewski, 1996; Lovelace, 2007). Withdrawals of groundwater have lowered water levels and induced the movement of saltwater towards producing wells in parts of the aquifer system. High concentrations of dissolved solids can increase water treatment costs and accelerate corrosion of infrastructure such as pipes, water heaters, and pumps. As concentrations increase, treatment may become economically unviable, and users would need to develop alternative water sources. The U.S. Geological Survey (USGS), in cooperation with the Capital Area Groundwater Conservation Commission (CAGWCC), monitors concentrations of chloride in groundwater through an annual sampling network that includes 41 wells (as of 2022) in East Baton Rouge and West Baton Rouge Parishes to monitor water quality at locations near known saltwater plumes. Periodic data collection from additional wells could be used to document conditions in the aquifers beyond these locations.
For the purposes of this report, the terms “saltwater” and “freshwater” refer to water containing a chloride concentration greater or less than 250 milligrams per liter, respectively.
Purpose and Scope
This report describes chloride concentrations in groundwater samples collected in East Baton Rouge, West Baton Rouge, Pointe Coupee, East Feliciana, and West Feliciana Parishes. Samples were collected from November 2021 through February 2022 from 161 wells screened in 10 aquifers of the Southern Hills regional aquifer system: the “400-foot,” “600-foot,” “800-foot,” “1,000-foot,” “1,200-foot,” “1,500-foot,” “1,700-foot,” “2,000-foot,” “2,400-foot,” and “2,800-foot” sands of the Baton Rouge area2 (fig. 2). The results of sample analyses were compared with historical concentrations and previous interpretations (Whiteman, 1979; Tomaszewski, 1996; Lovelace, 2007) to identify areas where chloride concentrations are increasing in groundwater. This information is intended to help water managers identify risks to water supply infrastructure, provide basic data for groundwater solute transport models, and inform monitoring well network design. Chloride concentration data collected during this study and some historical data are available in an accompanying data release (Lindaman, 2024). USGS-collected data, including additional water quality data for the study area, are also available from the USGS National Water Information System (USGS, 2023).
The phrase “of the Baton Rouge area” with reference to the “sand” aquifers will be subsequently omitted in this report for brevity.
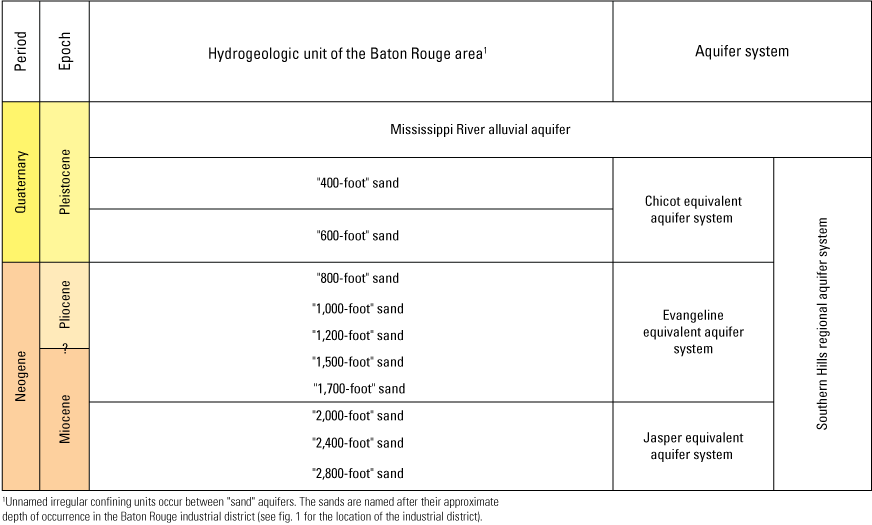
Hydrogeologic units of the study area in southeastern Louisiana. Modified from Griffith (2003).
Hydrogeology
The aquifers and confining units of the Southern Hills regional aquifer system (fig. 2) are beds of unconsolidated sediments that generally dip towards the south from their outcrop or subcrop areas in southern Mississippi and southeastern Louisiana (fig. 1 inset map), where the aquifers are recharged by precipitation (Buono, 1983). Within the study area, the aquifers are named after their approximate depth in the Baton Rouge industrial district (fig. 1). Because the aquifers dip towards the south, their depth of occurrence changes through the study area and their name does not reflect their depth at all locations. The aquifers consist of fine to coarse sand and are generally separated by silt or clay confining units. The aquifers and confining units may locally interfinger, pinch out, or change abruptly in thickness, forming a complex interconnected system (Griffith, 2003). In the Baton Rouge area, the individual aquifers are usually greater than 75 feet (ft) thick and can be more than 200 ft thick, and the confining units are usually at least 100 ft thick and can be up to 400 to 500 ft thick (Tomaszewski, 1996). The Mississippi River alluvial aquifer overlies the Southern Hills regional aquifer system west of the Mississippi River.
The Baton Rouge fault (fig. 1) is an east-to-west-trending listric fault that is downthrown to the south and functions as a leaky hydrologic barrier (Whiteman, 1979). The fault is active and has formed an escarpment that can be traced at land surface (McCulloh, 2001), except for west of the Mississippi River (fig. 1) where the escarpment has been removed by erosion. Displacement along the fault has caused bed discontinuity, and the sands on the north side of the fault can be hydraulically connected to different sands on the south side or laterally adjoined with relatively impermeable silt or clay beds such that the horizontal flow of groundwater is impeded. Aquifers on the north side of the fault generally contain freshwater, except for areas of saltwater intrusion and the “2,800-foot” sand at the base of the aquifer system which contains a transitional zone where saltwater extends several miles north of the fault (Whiteman, 1979). South of the fault, sands in the subsurface generally contain saltwater except for shallow aquifers or zones of fresh groundwater in deeper sands. The original source of saltwater in the aquifer system is possibly from fluids upwelling from the St. Gabriel salt dome located about 9 miles (mi) south of Baton Rouge (fig. 1) (Anderson and others, 2013). A second fault in the Baton Rouge area, the Denham Springs-Scotlandville fault, is north of the Baton Rouge fault but causes less offset and is not known to affect groundwater quality.
By the 1960s, groundwater withdrawals had lowered water levels in several aquifers north of the Baton Rouge fault and created a hydraulic gradient favorable for northward movement of saltwater across the fault line at certain locations and depths. Saltwater intrusion into one or more wells north of the fault has been documented for most of the 10 aquifers of the Baton Rouge area (Whiteman, 1979; Tomaszewski, 1996; Lovelace, 2007). The pathways and rates of saltwater intrusion depend on several factors, such as (1) continuity between sands on the downthrown side and sands on the north side at locations along the fault line; (2) the configuration of the base of the aquifer; (3) the permeability of the aquifer; and (4) the hydraulic gradient (Whiteman, 1979). Saltwater plumes are wedge shaped because saltwater is denser than freshwater, with a thinner leading edge that travels along the base of an aquifer, such that an aquifer can contain saltwater through only a fraction of its total thickness. In addition to lateral movement, saltwater can move vertically upwards within an aquifer or from an underlying sand into the screen of a pumping well. Similarly, downward leakage of saltwater from one sand into another is possible under the influence of gravity or a vertical hydraulic gradient.
Previous Studies
Saltwater intrusion into aquifers north of the Baton Rouge fault was first observed after a production well screened in the “600-foot” sand was abandoned because of rising salinity in 1948 (Whiteman, 1979). Subsequent investigative work has outlined groundwater conditions through the aquifer system or described the hydrogeologic controls on saltwater intrusion (for example, Meyer and Turcan, 1955; Morgan and Winner, 1964; Rollo, 1969; Whiteman, 1979). Updates on chloride concentrations in groundwater in the Baton Rouge area were provided by Tomaszewski (1996) and Lovelace (2007). Several numerical models have been developed to test management scenarios, simulate water levels, or estimate saltwater intrusion rates and directions in one or more aquifers (Torak and Whiteman, 1982; Huntzinger and others, 1985; Halford and Lovelace, 1994; Heywood and others, 2014, 2015, 2019; Pham and Tsai, 2017; Chen and others, 2023).
Methods
Samples were collected from production wells through discharge outlets and from monitoring wells without pumps by using an air compressor. Wells were purged prior to sampling, and specific conductance and temperature were measured in the field following the procedures described in USGS (1997–2024). A sample from each well was filtered through a 0.45-micron-membrane filter with a vacuum pump, and the filtered and unfiltered samples were shipped to the USGS National Water Quality Laboratory in Denver, Colorado. The samples were then analyzed for dissolved chloride concentration and specific conductance following the methods described in Fishman and Friedman (1989). Sequential replicates were collected for about 1 out of every 12 samples for quality control and to assess method variability. The chloride concentrations of the 14 sequential replicates were no more than 0.03 milligram per liter (mg/L) different from their corresponding samples.
Some of the wells that were selected for sampling were part of a previous survey of chloride concentrations in groundwater conducted during 2004–05 in East Baton Rouge and West Baton Rouge Parishes (Lovelace, 2007). Additional wells were identified and sampled to include wells beyond East Baton Rouge and West Baton Rouge Parishes and to collect data at several key wells that have been drilled since the Lovelace (2007) study. The aquifer associated with each well was determined from its local aquifer code designation in the USGS National Water Information System (USGS, 2023). For wells that were newly entered into this system as part of this study, the aquifer assignment was made by using information from the Louisiana Department of Natural Resources’ Strategic Online Natural Resources Information System (SONRIS) well registration database (Louisiana Department of Natural Resources, 2023). Some wells are screened in two aquifers, either through a single long screen or two or more noncontiguous screened intervals. The assignment of an aquifer code to a sand on the south side of the Baton Rouge fault does not imply that there is lateral continuity or hydraulic connection to similarly coded aquifers on the north side of the fault. The aquifer assignment for wells south of the fault is based off correlation of sands that were likely continuous prior to being offset by movement along the Baton Rouge fault.
Groundwater quality information, including chloride concentration, is also collected by the Louisiana Department of Health (Louisiana Department of Health, 2023), and these data were compiled and used to support the interpretation of the data collected for this study. Chloride concentrations in groundwater in the Southern Hills regional aquifer system north of the Baton Rouge fault are typically less than 10 mg/L (Tomaszewski, 1996; Lovelace, 2007). This value was used as a lower threshold to identify areas where saltwater intrusion may be occurring.
Results and Discussion
Samples were collected from 161 wells; 154 were located north of the Baton Rouge fault and 7 were located south of the fault. The median chloride concentration for all the samples was 3.62 mg/L. Samples from 27 wells north of the Baton Rouge fault had a chloride concentration greater than 10 mg/L. The range of chloride concentrations in samples from seven wells south of the fault was 11.4–736 mg/L. This range is not broadly representative of groundwater south of the fault given the small sample size and the limited subset of aquifers sampled. Of the 34 samples that had chloride concentrations greater than 10 mg/L, 9 samples had concentrations that exceeded the U.S. Environmental Protection Agency’s secondary maximum contaminant level3 (SMCL) for chloride of 250 mg/L (U.S. Environmental Protection Agency, 2023).
The U.S. Environmental Protection Agency’s secondary maximum contaminant levels (SMCLs) are nonmandatory water quality standards for contaminants that are intended as guidelines for public water supply systems for aesthetic considerations such as taste, color, and odor.
In northwestern East Baton Rouge Parish, seven wells that are used by a paper mill were sampled: one screened in the “1,200-foot” sand, one screened in the “1,500-foot” and “1,700-foot” sands, and five screened in the “2,800-foot” sand. All but one of these wells (EB-846, “2,800-foot” sand) had chloride concentrations greater than 10 mg/L, with concentrations ranging from 12.3 to 22.2 mg/L. Chloride concentrations in historical samples from these wells and others within the paper mill ranged from less than 10 mg/L to 26.5 mg/L, except for concentrations in samples from well EB-1247 (“2,800-foot” sand), which reached a maximum of 50.5 mg/L in 2017 (USGS, 2023).
“400-Foot” Sand of the Baton Rouge Area
Eight samples were collected from wells screened in the “400-foot” sand (fig. 3). None of the samples from wells located north of the Baton Rouge fault had a chloride concentration greater than 10 mg/L. The sample from well EB-1298, a production well located south of the Baton Rouge fault, had a concentration of 25 mg/L. Historical chloride concentrations in 11 samples collected from this well during 2001–22 ranged from 17.1 to 26.2 mg/L, without indicating that concentrations are increasing. Another sample from a well located south of the fault (EB-1246) had a concentration of 305 mg/L, but the well is only used sporadically to provide water to a decorative pond fountain. The potential for saltwater intrusion northward across the fault into the “400-foot” sand in East Baton Rouge Parish is thought to be low because the downthrown sands on the south side of the fault that connect with the “400-foot” sand on the north side generally contain freshwater (Whiteman, 1979; Griffith, 2003; Lovelace, 2007).
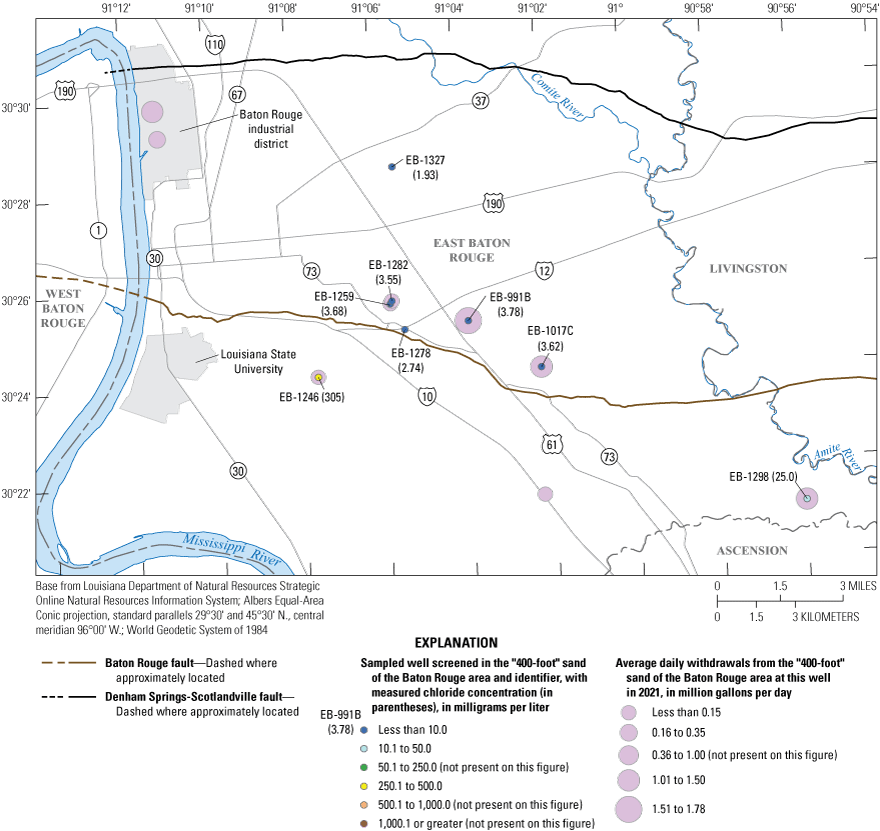
Chloride concentrations in water from wells screened in the “400-foot” sand of the Baton Rouge area collected during November 2021 through February 2022 and reported annual withdrawals from wells screened in the aquifer for 2021 in southeastern Louisiana (Capital Area Groundwater Conservation Commission, 2022).
“600-Foot” Sand of the Baton Rouge Area
Six samples were collected from wells screened in the “600-foot” sand (fig. 4), including one well (EB-1261) screened in the “600-foot” and “800-foot” sands. One sample from a monitoring well (EB-434) had a chloride concentration of 36.3 mg/L. This well is located near the probable western margin of a saltwater plume in the “600-foot” sand (Whiteman, 1979; Tomaszewski, 1996). Concentrations at this well were at their highest in the 1970s, up to 120 mg/L, but have since remained below this level (fig. 5A). The well screen is likely near the top of the aquifer (Whiteman, 1979, pl. 4), and the concentration may be higher at the base of the aquifer at this location.
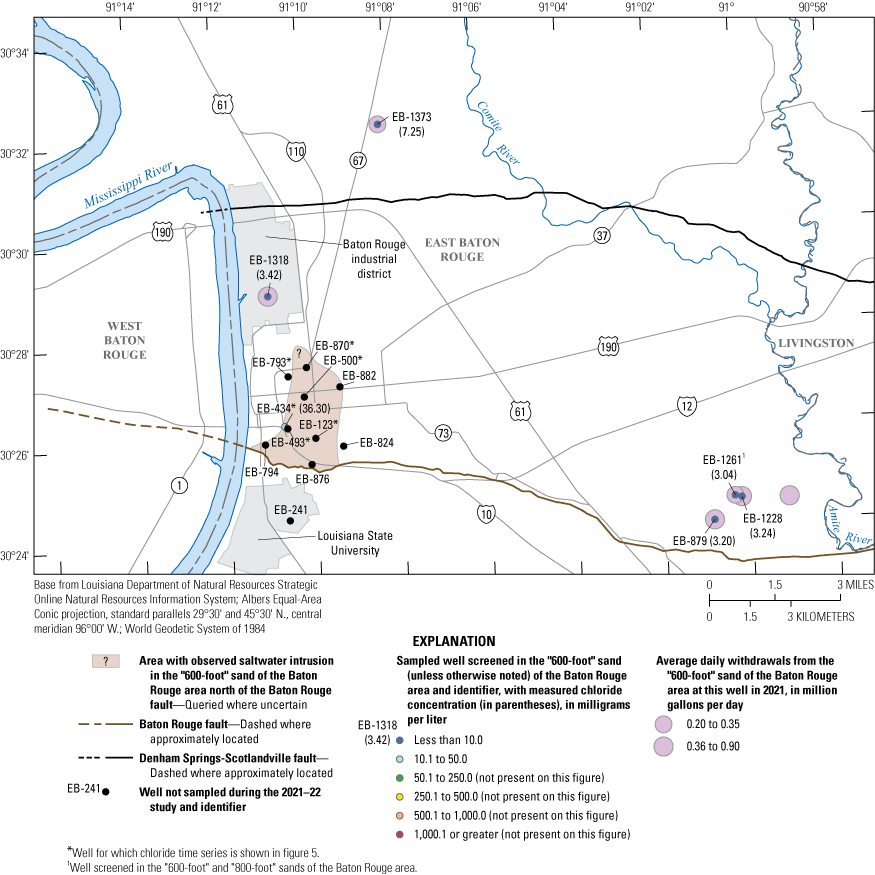
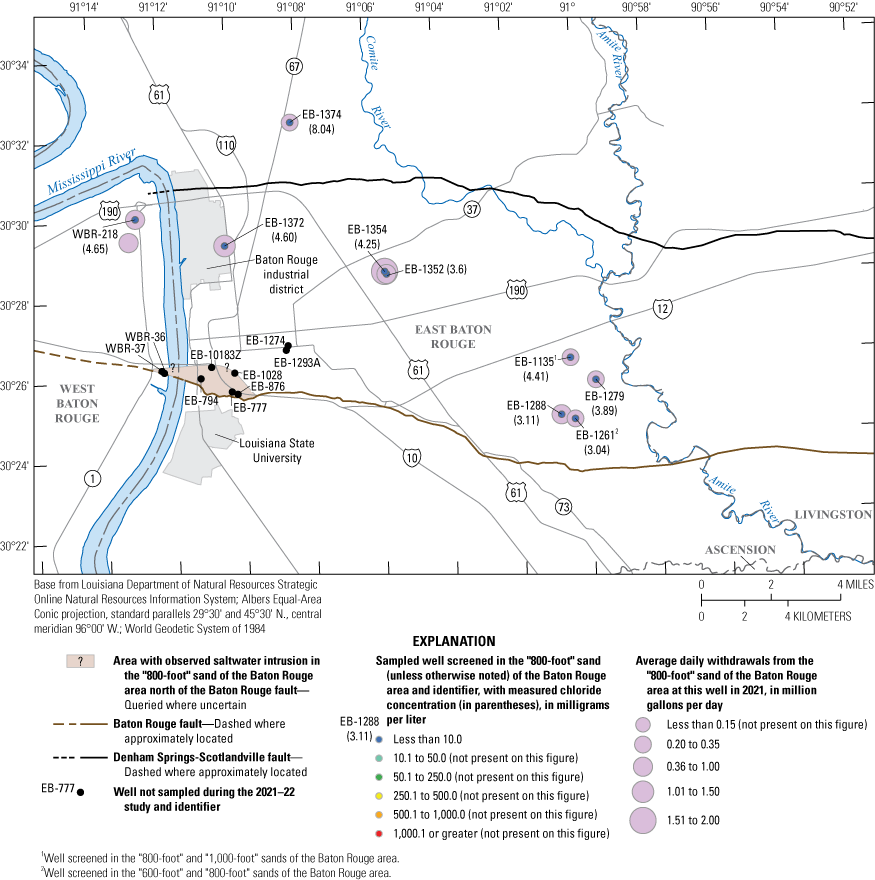
Chloride concentrations in water from wells screened in the “600-foot” sand of the Baton Rouge area collected during November 2021 through February 2022 and reported annual withdrawals from wells screened in the aquifer for 2021 in southeastern Louisiana (Capital Area Groundwater Conservation Commission, 2022).
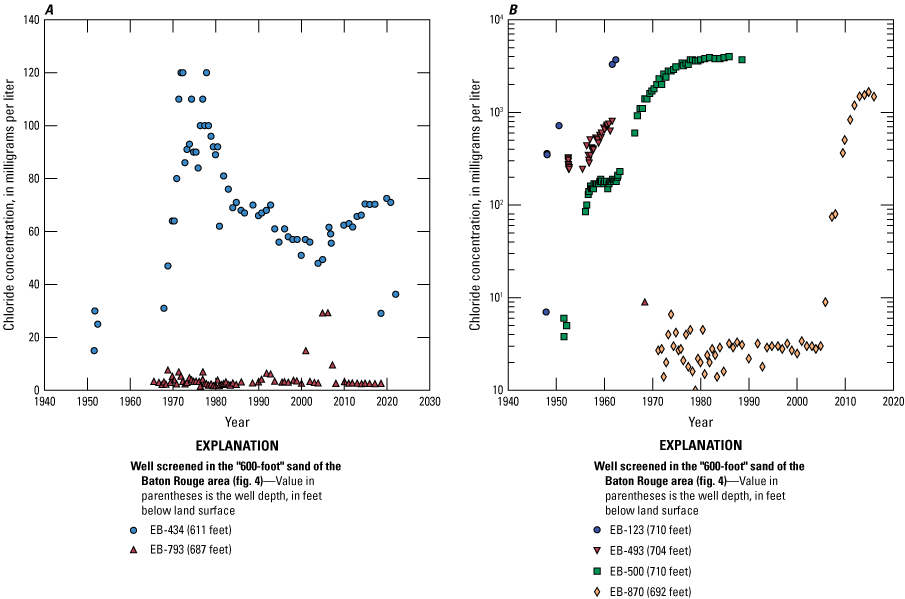
Time series of chloride concentrations in water from selected wells screened in the “600-foot” sand of the Baton Rouge area, southeastern Louisiana (see fig. 4 for well locations).
Historical data from several of these wells indicate that the saltwater plume has moved northward from the Baton Rouge fault towards the industrial district (figs. 4, 5B). The highest measured chloride concentration within the plume area was 4,100 mg/L at EB-876 in 1971. EB-870 is the northernmost well where saltwater has been detected in the “600-foot” sand; chloride concentrations at this well increased sharply beginning in around 2005, and the last sample from 2015 had a concentration of 1,480 mg/L. No wells were available to sample between EB-870 and the nearest active well (EB-1318) (fig. 4) in the industrial district to determine the plume’s current northern extent or to monitor its movement. The northwestern edge of the plume is partially constrained, as indicated by chloride concentrations in samples from EB-793 (fig. 5A), which have remained less than 10 mg/L except for a sample in 2004 (29.2 mg/L) and another in 2006 (29.3 mg/L). The most recent sample, which was collected in 2018, had a concentration of 2.64 mg/L. On the northeastern side of the plume, concentrations as high as 2,400 mg/L were detected in monitoring well EB-882 in 1973 before it was plugged. Southeast of the plume, well EB-824 had nine samples with chloride concentrations less than 10 mg/L, with the most recent sample collected during 2005 having a concentration of 3.05 mg/L. On the southwestern side near the fault, a geophysical log collected at well EB-794 indicates that the plume may extend westward to this location (Whiteman, 1979).
Two large-diameter wells screened in the “600-foot” sand in the industrial district were plugged in 2019, and user-reported groundwater withdrawal data for major facilities compiled by the CAGWCC specify that only one well was withdrawing from the aquifer within the industrial district as of 2021 (CAGWCC, 2022) (fig. 4). Although withdrawals from the “600-foot” sand have decreased through time, any large withdrawals from this aquifer in or near the industrial district are likely to cause saltwater to move towards the production wells.
“800-Foot” Sand of the Baton Rouge Area
Nine samples were collected from wells screened in the “800-foot” sand (fig. 6), including a well (EB-1261) screened in the “800-foot” and “600-foot” sands and a well (EB-1135) screened in the “800-foot” and “1,000-foot” sands. No samples had a chloride concentration greater than 10 mg/L.
Chloride concentrations in water from wells screened in the “800-foot” sand of the Baton Rouge area collected during November 2021 through February 2022 and reported annual withdrawals from wells screened in the aquifer for 2021 in southeastern Louisiana (Capital Area Groundwater Conservation Commission, 2022).
Whiteman (1979) described an area along the northern side of the Baton Rouge fault where qualitative geophysical log characteristics indicate that saltwater occurs in the “800-foot” sand. Griffith (2003, pl. 3) also interpreted a thin saltwater-bearing sand from a log (EB-1028) in this area, and a more recent log collected for a deep monitoring well (EB-10183Z) indicates that the “800-foot” sand might contain saltwater based on a leftward deflection in the gamma curve coupled with low resistivity. The locations of wells with associated geophysical logs that indicate saltwater in the “800-foot” sand are shown in the plume area in figure 6. The “800-foot” sand is interconnected with the “600-foot” sand in the vicinity (Kuniansky and others, 1989), and a source of saltwater could be downward leakage from the overlapping plume in the “600-foot” sand (Tomaszewski, 1996). Alternatively, saltwater may have moved laterally from the downthrown “600-foot” sand on the south side of the fault. A chloride concentration of 3,900 mg/L was measured in the “600-foot” sand about 1.2 mi south of the fault at EB-241 in 1943 (fig. 4). Saltwater in the “800-ft” sand has not been observed through direct sampling because no wells are screened in the aquifer near the plume area; therefore, it is unknown if saltwater is migrating. Wells that are withdrawing from the “800-foot” sand as of 2021 are located at least 3.5 mi from the probable plume area (fig. 6).
“1,000-Foot” Sand of the Baton Rouge Area
Thirteen samples were collected from wells screened in the “1,000-foot” sand (fig. 7), including a well (EB-772) screened in the “1,000-foot” and “1,200-foot” sands and a well (EB-1135) screened in the “800-foot” and “1,000-foot” sands. Three samples had chloride concentrations greater than 10 mg/L. EB-805, a monitoring well located near the Baton Rouge fault, had the highest concentration (10,400 mg/L) measured among all wells sampled for this study. The measured concentration is also the highest of the historical record at this well (fig. 8A). Water levels at EB-805 have decreased by about 46 ft from April 1966 to December 2022 (USGS, 2023) and are low enough in the vicinity to induce saltwater movement into the area. EB-1328, a production well screened in the “1,000-foot” sand about 2 mi east of EB-805 (fig. 7), was not available for sampling during the timeframe of this study, but three samples taken shortly after the well was completed during 2004–06 had chloride concentrations ranging from 66.4 to 224 mg/L.
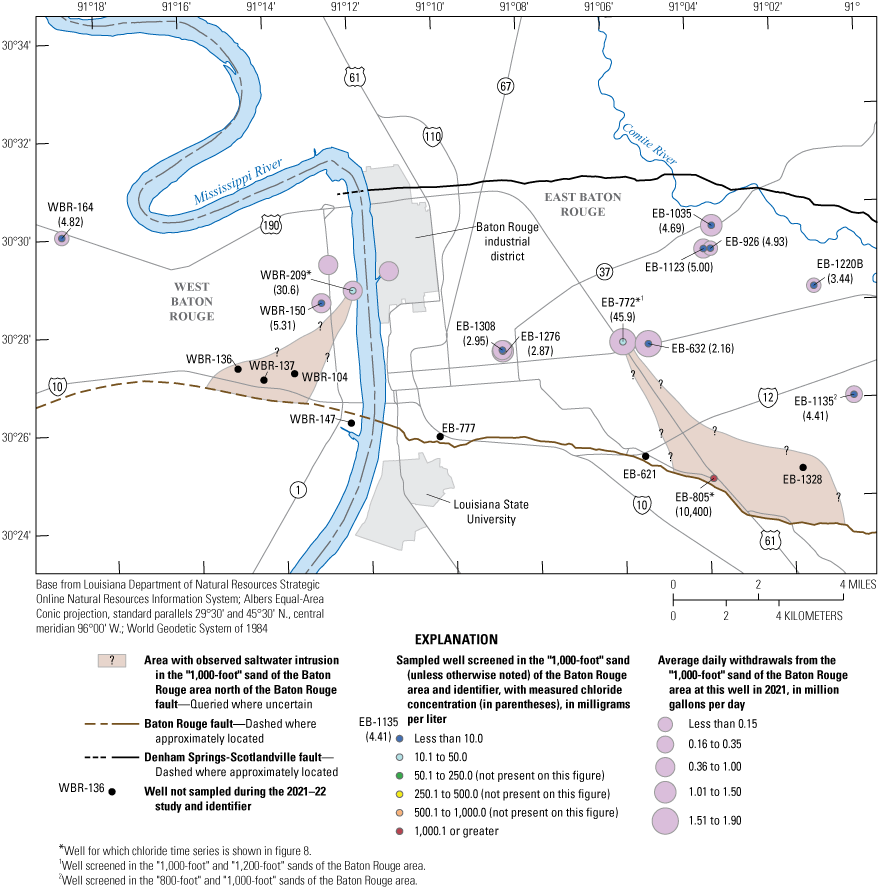
Chloride concentrations in water from wells screened in the “1,000-foot” sand of the Baton Rouge area collected during November 2021 through February 2022 and reported annual withdrawals from wells screened in the aquifer for 2021 in southeastern Louisiana (Capital Area Groundwater Conservation Commission, 2022).
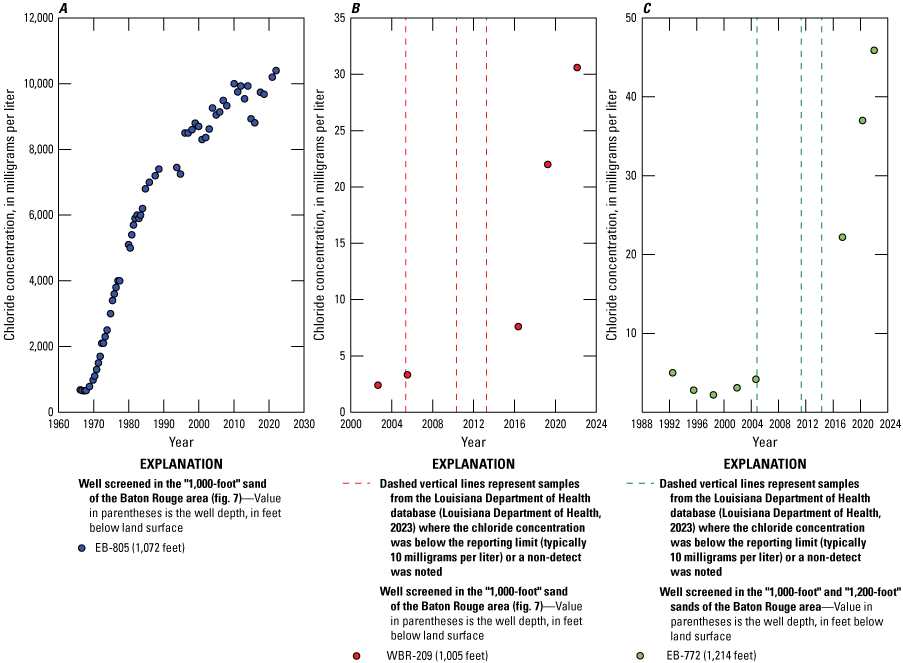
Time series of chloride concentrations in water from A, B, two wells screened in the “1,000-foot” sand and C, a well screened in the “1,000-foot” and “1,200-foot” sands of the Baton Rouge area, southeastern Louisiana (see fig. 7 for well locations). Dashed vertical lines represent samples from the Louisiana Department of Health database (Louisiana Department of Health, 2023) where the chloride concentration was below the reporting limit (typically 10 mg/L) or a nondetect was noted.
A sample collected from a production well (EB-772) screened in the “1,000-foot” and “1,200-foot” sands had a chloride concentration of 45.9 mg/L. This well has been active since 1964, and concentrations began to increase during 2014–17 (fig. 8C). Because the well is screened in two aquifers that both have documented saltwater intrusion to the south near the Baton Rouge fault, it is not clear at what depth saltwater intrusion is occurring. The plume area for the “1,000-foot” sand in East Baton Rouge Parish shown in figure 7 assumes that the increasing concentrations at EB-772 are from saltwater intrusion in the “1,000-ft” sand, although the extent of the plume is uncertain because no wells are screened in the “1,000-foot” sand between EB-805 and EB-772. Geophysical logs from wells EB-1287 and EB-1297 (Louisiana Department of Natural Resources, 2023) (fig. 9), which extend through the depth of the “1,000-ft” sand, did not indicate the presence of saltwater in the “1,000-foot” sand at the time the logs were collected in 1998 and 1999, respectively.
Saltwater is also known to occur in the “1,000-foot” sand in West Baton Rouge Parish (fig. 7). The presence of saltwater was first confirmed by samples collected during 1966–75 at a now-plugged monitoring well (WBR-104) where chloride concentrations were as high as 360 mg/L. A sample collected for this study from production well WBR-209 had a concentration of 30.6 mg/L, and concentrations at this well began increasing around 2016 (fig. 8B), indicating potential expansion of the known plume area in the “1,000-foot” sand in West Baton Rouge Parish. A sample from another production well (WBR-150) less than 1 mi to the west-southwest had a concentration of 5.31 mg/L, and concentrations have not increased in 11 samples collected during 1978–2019.
“1,200-Foot” Sand of the Baton Rouge Area
Twenty-four samples were collected from wells screened in the “1,200-foot” sand (fig. 9), including a well (EB-1297) screened in the “1,200-foot” and “1,500-foot” sands and a well (EB-772) screened in the “1,000-foot” and “1,200-foot” sands. Four samples had chloride concentrations greater than 10 mg/L.
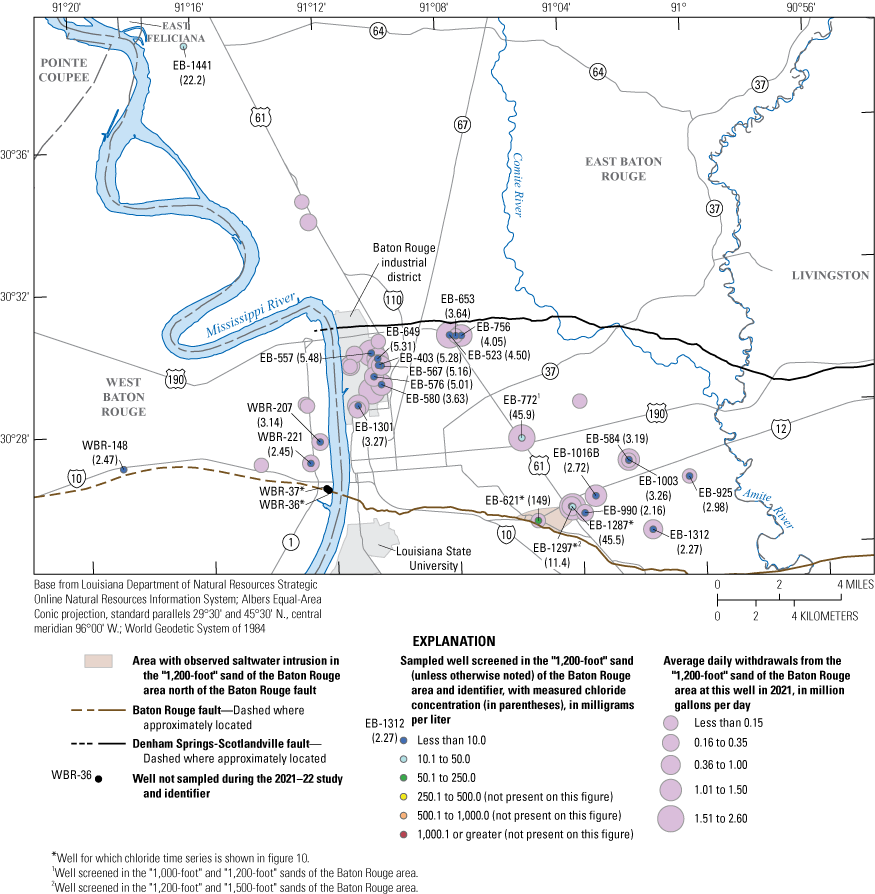
Chloride concentrations in water from wells screened in the “1,200-foot” sand of the Baton Rouge area collected during November 2021 through February 2022 and reported annual withdrawals from wells screened in the aquifer for 2021 in southeastern Louisiana (Capital Area Groundwater Conservation Commission, 2022).
A chloride concentration of 149 mg/L was measured in a sample from EB-621, an older production well that was completed in 1956 about 650 ft north of the Baton Rouge fault. The maximum concentration measured at EB-621 was 297 mg/L in 2019. Chloride concentrations vary considerably in this well (fig. 10A) and are related to pumping at this well and nearby wells in the weeks or months prior to when samples were collected. Concentrations began to increase around 1978, accompanying a period of increased withdrawals from the well during 1975–87 (Heywood, 2019). The concentrations decreased during 1988–99 but have increased and decreased in the following years, possibly in response to additional withdrawals at two nearby wells (EB-1287 and EB-1297) constructed in 1998 and 1999 in the “1,200-foot” sand.
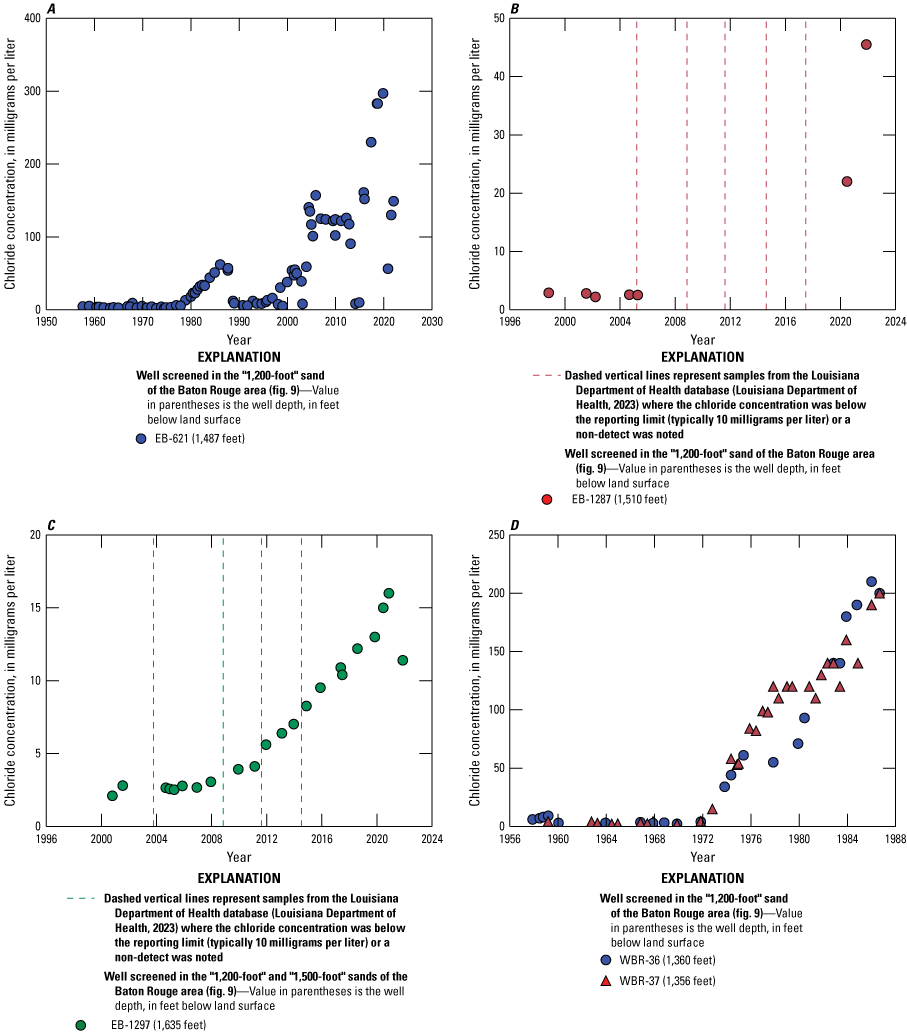
Time series of chloride concentrations in water from A, B, D, four wells screened in the “1,200-foot” sand and C, one well screened in the “1,200-foot” and “1,500-foot” sands of the Baton Rouge area, southeastern Louisiana.
At EB-1287, a production well that is about 1.2 mi northeast of EB-621, the measured chloride concentration was 45.5 mg/L in 2021, which was substantially more than the 22-mg/L concentration measured in 2020 (fig. 10B). The sample collected in 2021 from well EB-1297, which is in the same facility and screened in the “1,200-foot” and the “1,500-foot” sands, had a concentration of 11.4 mg/L. Concentrations at EB-1297 started to gradually increase beginning around the year 2007 (fig. 10C). The lower concentration at EB-1297 compared to EB-1287 may be caused by the contribution of fresher water from the “1,500-foot” sand. Increasing concentrations at EB-1287 and EB-1297 are likely from movement of saltwater from a source area in the “1,200-foot” sand near EB-621. Because the “1,000-foot” sand is known to contain saltwater near these wells (well EB-805, fig. 7), downward leakage of saltwater into the “1,200-foot” sand is possible. Downward leakage could result from density effects or from a hydraulic gradient created by lower water levels in the “1,000-foot” sand relative to the “1,200-foot” sand. Insufficient water level data were available for comparison with the current potentiometric surfaces in the “1,000-foot” and “1,200-foot” sands in this area. Available geophysical logs (Louisiana Department of Natural Resources, 2023) indicate that the confining unit between the “1,000-foot” and “1,200-foot” sands in this area has an average thickness of about 200 ft but the presence of windows in the confining unit is possible.
In West Baton Rouge Parish, historical samples from two wells (WBR-36 and WBR-37) screened in the “1,200-foot” sand near the Baton Rouge fault on its northern side had chloride concentrations greater than 10 mg/L beginning in the early 1970s (fig. 10D). The wells were connected to each other by a line to move water from one well to the other for priming the pumps, which may explain the similar chloride concentrations. Whiteman (1979) removed this connection and observed that chloride concentrations decreased in WBR-36 when it was pumped heavily even though it is closer to the Baton Rouge fault than WBR-37. Based on this result, it was tentatively concluded that saltwater intrusion across the fault was not occurring at this location and that the increasing chloride in both wells could be from a casing leak in WBR-37 adjacent to the “800-foot” sand, which may contain saltwater in this area (fig. 6). Chloride concentrations in both wells reached a maximum of 200–210 mg/L in 1986, when sampling was discontinued. Pumping from these wells stopped by 1988 and the wells were plugged in 1991.
Whiteman (1979) also noted that logs from a monitoring well (WBR-147) installed in the downthrown “1,000-foot” sand south of the fault and about 0.25 mi from WBR-36 (fig. 7) showed that there was little sand on the south side of the fault adjacent to the “1,200-foot” sand on the north side and concluded that the risk of saltwater intrusion across the fault was low in this area. Chloride concentrations in 17 samples from WBR-147 ranged from 740 to 800 mg/L during 1977–92. Concentrations greater than 10 mg/L have not been observed in the area north of WBR-36 and WBR-37 in the “1,200-foot” sand, but no wells are currently available for sampling between WBR-36 and WBR-37 and the industrial district where withdrawals from the aquifer are concentrated.
“1,500-Foot” Sand of the Baton Rouge Area
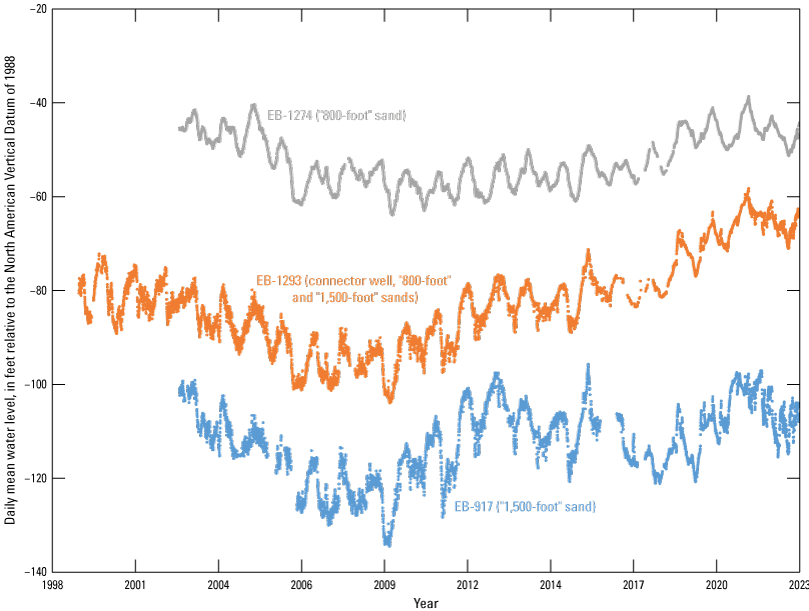
Twenty-one samples were collected from wells screened in the “1,500-foot” sand (fig. 11A, B), including 1 from a well screened in the “1,200-foot” and “1,500-foot” sands (EB-1297), and 2 from wells screened in the “1,500-foot” and “1,700-foot” sands (EB-1248, EB-1295C). Ten samples had chloride concentrations greater than 10 mg/L. Samples from three production wells located south of the Baton Rouge fault had concentrations that ranged from 14.4 to 203 mg/L. Seven of the 10 samples with a chloride concentration greater than 10 mg/L were from wells that are located north of the Baton Rouge fault within a saltwater plume in the “1,500-foot” sand that is moving northward towards the Lula Street and Government Street pumping stations (fig. 11B) (Moore and others, 2011; Heywood and others, 2019). The highest chloride concentration measured in the plume area was 3,900 mg/L at well EB-807A in 1996, and historical concentrations measured in several other nearby wells began to level out close to this value; therefore, 3,900 mg/L may be the approximate maximum concentration of saltwater from the source area south of the fault (fig. 12A).
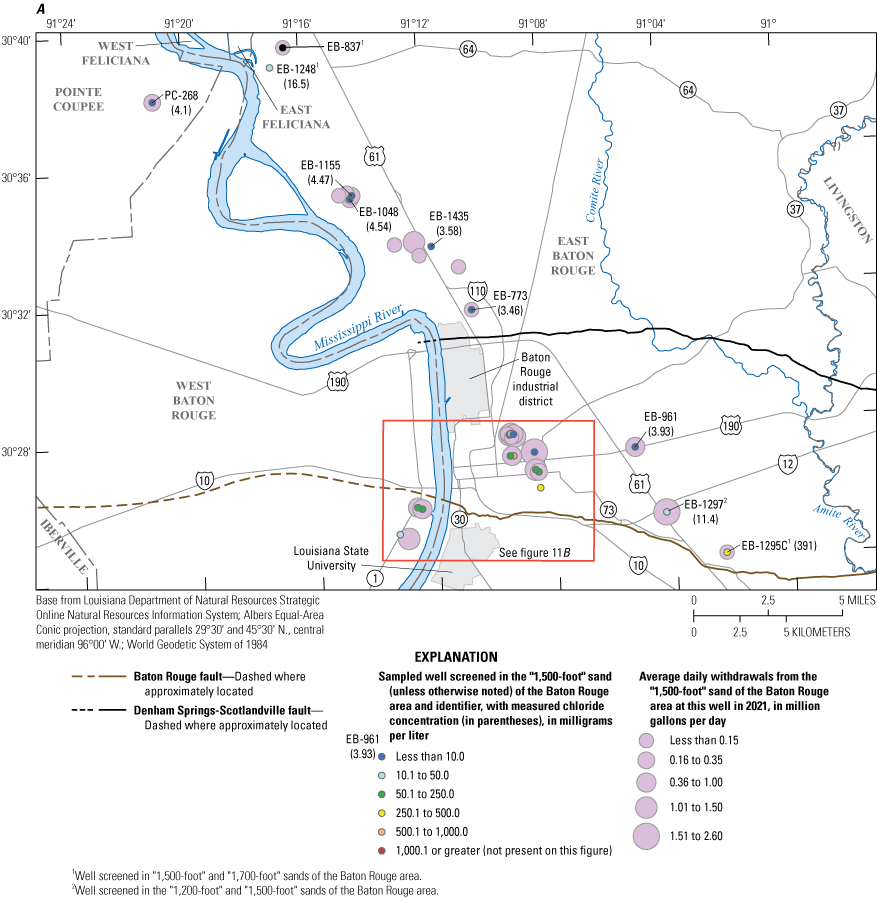
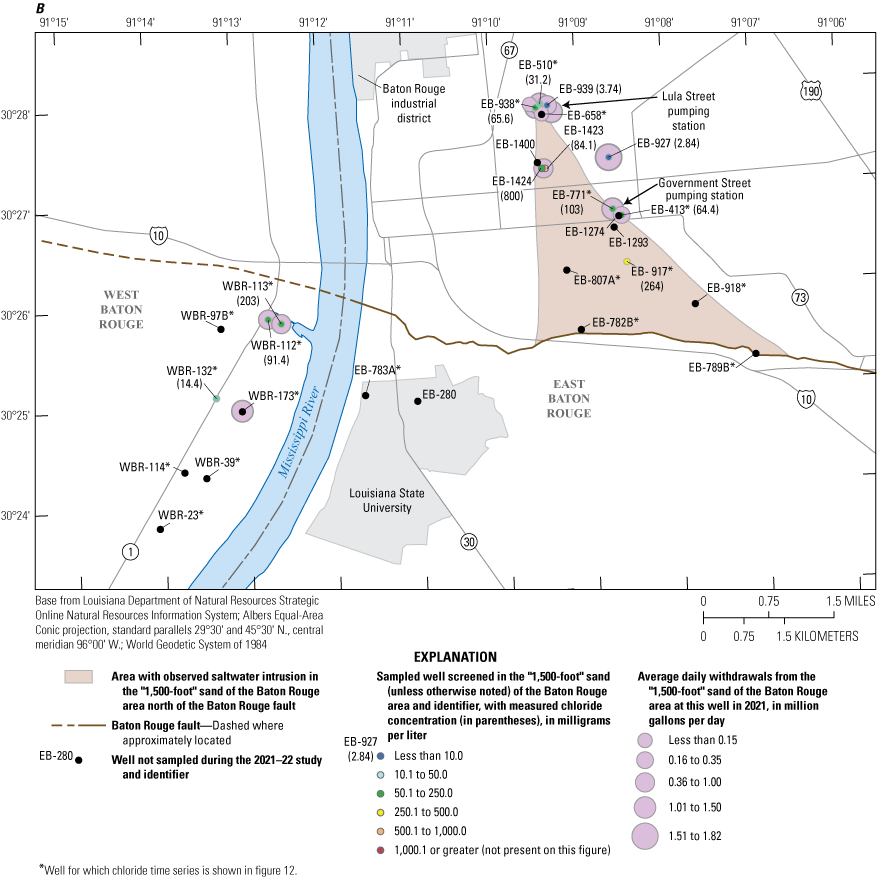
Chloride concentrations in water from wells screened in the “1,500-foot” sand of the Baton Rouge area collected during November 2021 through February 2022 and reported annual withdrawals from wells screened in the aquifer for 2021 in southeastern Louisiana (Capital Area Groundwater Conservation Commission, 2022).
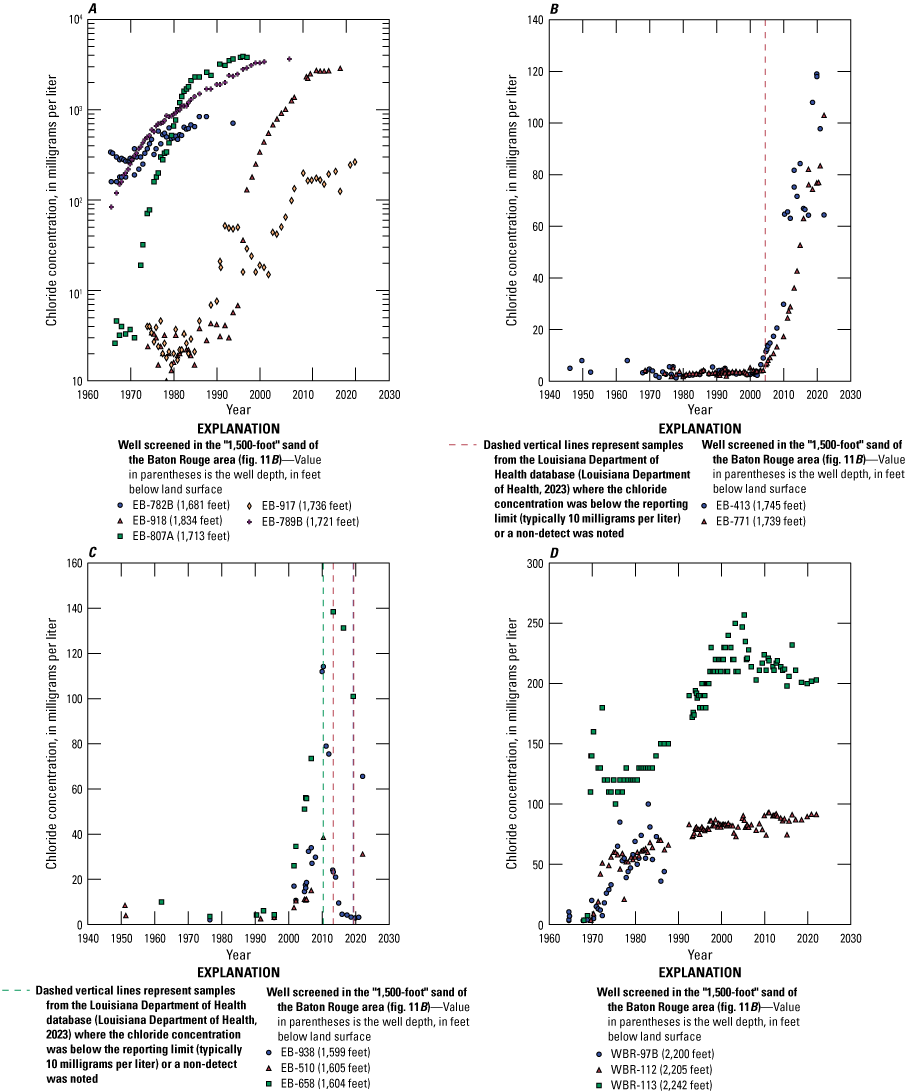
Time series of chloride concentrations in water from wells screened in the “1,500-foot” sand of the Baton Rouge area A, within the plume area north of the Baton Rouge fault, B, at the Government Street pumping station, C, at the Lula Street pumping station, and D, E, F, south of the Baton Rouge fault, southeastern Louisiana.
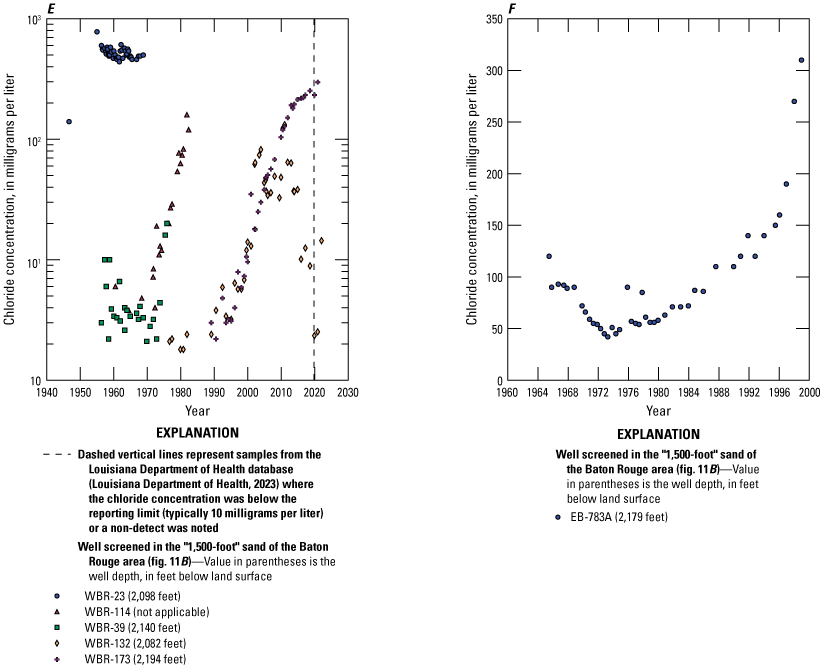
Two different mitigation technologies have been used to delay the effect of saltwater intrusion on the two pumping stations: a “connector” well to recharge the “1,500-foot” sand and a scavenger well system to remove saltwater. The connector well (EB-1293) was installed in 1998 south of the Government Street pumping station (fig. 11B) and connects the “800-foot” and “1,500-foot” sands to induce recharge into the “1,500-foot” sand to raise the water level in the aquifer (Dial and Cardwell, 1999). The placement of this well was designed to create a hydraulic barrier to divert the flow of the plume westward away from the Government Street pumping station towards the more distant Lula Street pumping station. Chloride concentrations at the two wells (EB-413 and EB-771) in the Government Street pumping station began to increase during 2003–04, and samples collected for this study had concentrations of 64.4 mg/L and 103 mg/L, respectively (fig. 12B). The flow rate through the connector well depends on the water level difference between the “800-foot” and “1,500-foot” sands at the location of the well and the integrity of the well screens. Daily water levels are recorded in the connector well (EB-1293) and in nearby monitoring wells screened in the “800-foot” (EB-1274) and “1,500-foot” (EB-917) sands to monitor and quantify the connector well’s effect on both aquifers (USGS, 2023). The water levels in both monitoring wells and EB-1293 covary (fig. 13), indicating that the two aquifers are hydraulically connected through EB-1293. Since about 2017, the water level in EB-1293 has slightly increased, possibly indicating sediment buildup along the lower screen, which would reduce outflow to the “1,500-foot” sand and bring its composite water level closer to that of the “800-foot” sand.
Time series of daily mean water levels in wells screened in the “800-foot” sand of the Baton Rouge area (EB-1274), in the “1,500-foot” sand of the Baton Rouge area (EB-917), and in a connector well screened in both sands (EB-1293), southeastern Louisiana.
In 2005, a scavenger well pair was installed within the plume area and south of the Lula Street pumping station to intercept saltwater and extend the lifespan of the pumping station. The scavenger system has a well at the base of the aquifer (EB-1424) that removes denser saltwater and disposes it into the Mississippi River, and a second well with a shallower screen (EB-1423) skims fresher water from the top part of the aquifer. Samples were collected from both wells for this study; the sample from the shallower well (EB-1423) had a chloride concentration of 84.1 mg/L, and the sample from the deeper well (EB-1424) had a concentration of 800 mg/L. Chloride concentrations in samples recently collected from wells in the Lula Street pumping station have remained below their historical peaks (fig. 12C), but it is unknown if the more concentrated basal layer of the plume has moved past the scavenger well pair. A monitoring well between the scavenger well pair and the Lula Street pumping station (EB-1400, “Progress Park well #1”) (fig. 11B), about 535 ft from the scavenger well system, was not sampled for this study because the well is capped. EB-1400 was completed in 2011, prior to the construction of the scavenger well system, and water quality samples collected before the well was completed in April 2010 indicated that the saltwater plume at this location was stratified with a chloride concentration of 1,955 mg/L at the base of the aquifer and a depth-averaged concentration of about 400 mg/L (Moore and others, 2011).
Four production wells (WBR-132, WBR-173, WBR-112, and WBR-113) screened in the “1,500-foot” sand tap into a zone of fresh groundwater south of the Baton Rouge fault (fig. 11B). Three of these wells were sampled during this study. Chloride concentrations at the northernmost two of the four wells (WBR-113 and WBR-112) started to increase shortly after the wells were completed in 1968, indicating that a body of higher chloride water was nearby (fig. 12D). Another well located half a mile away that was plugged in 2011 (WBR-97B) shows a similar pattern (fig. 12D). Because WBR-113 has a deeper screen than WBR-112 and WBR-97B, the higher concentrations observed at WBR-113 are likely from density effects. The southernmost two wells (WBR-132 and WBR-173) are also screened at different depths within the “1,500-foot” sand. Concentrations at the deeper well (WBR-173) began to increase around the mid- to late 1990s and have exceeded the SMCL of 250 mg/L, whereas the concentrations at WBR-132 have been more erratic and generally lower, with the sample collected during this study having a chloride concentration of 14.4 mg/L (fig. 13D). Historical samples from older plugged wells to the south and to the east of the currently active wells indicate a movement of saltwater into this zone of freshwater south of the fault (fig. 12E). To the south of WBR-173, concentrations at WBR-23 ranged from 140 to 780 mg/L during 1946–68. About 0.7 mi north of WBR-23, concentrations at well WBR-114 began to increase about 1972 and reached a maximum of 160 mg/L in 1981 before the well was plugged in 1985 (fig. 12E). The increasing concentrations observed at WBR-173 are likely the result of continued northward movement of this body of saltwater. Across the Mississippi River to the east, chloride concentrations in three samples from EB-280 collected during 1943–57 ranged from 3,000 to 3,100 mg/L, and the increasing concentrations at monitoring well EB-783A observed during its period of record (fig. 12F) may be from the westward movement of saltwater towards the previously or currently active wells across the Mississippi River.
“1,700-Foot” Sand of the Baton Rouge Area
Fourteen samples were collected from wells screened in the “1,700-foot” sand north of the Baton Rouge fault, including 2 wells that are screened in the “1,500-foot” and the “1,700-foot” sands (EB-1295C, EB-1248) (fig. 14). A sample from EB-1295C, a production well near the fault, had a chloride concentration of 391 mg/L. Concentrations have been increasing at EB-1295C since the well was first sampled in 2004 (fig. 15). Because the well is screened in two aquifers, the depth at which saltwater intrusion is occurring is uncertain. The depiction of the plume shown in figure 15 assumes that intrusion is occurring at the level of the “1,700-foot” sand.
Chloride concentrations in water from wells screened in the “1,700-foot” sand of the Baton Rouge area collected during November 2021 through February 2022 and reported annual withdrawals from wells screened in the aquifer for 2021 in southeastern Louisiana (Capital Area Groundwater Conservation Commission, 2022).
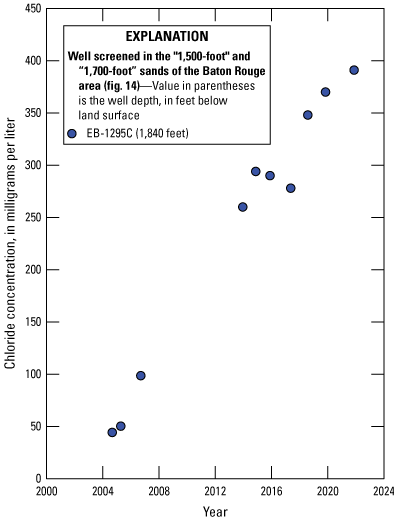
Time series of chloride concentrations in water from well EB-1295C screened in the “1,500-foot” and “1,700-foot” sands of the Baton Rouge area, southeastern Louisiana.
“2,000-Foot Sand” of the Baton Rouge Area
Twenty-eight samples were collected from wells screened in the “2,000-foot” sand (fig. 16A, B), including 3 wells (EB-733, EB-1253, EB-1445) screened in the “2,000-foot and “2,400-foot” sands. One production well (EB-1150) north of the Baton Rouge fault had a chloride concentration of 270 mg/L (fig. 17).
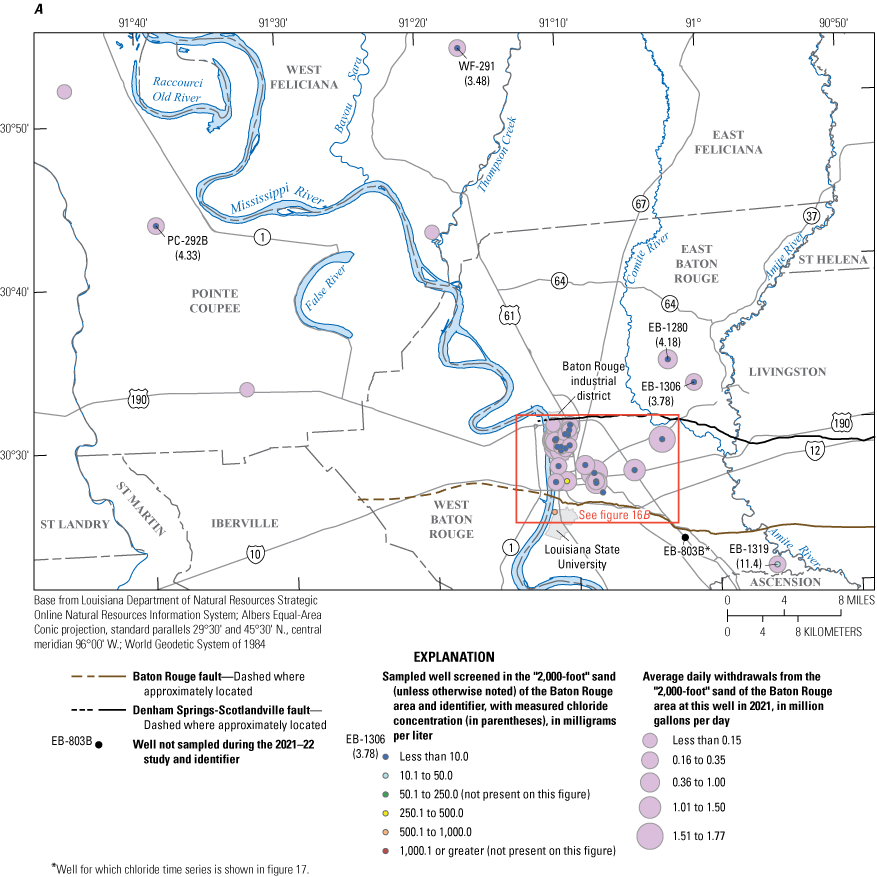
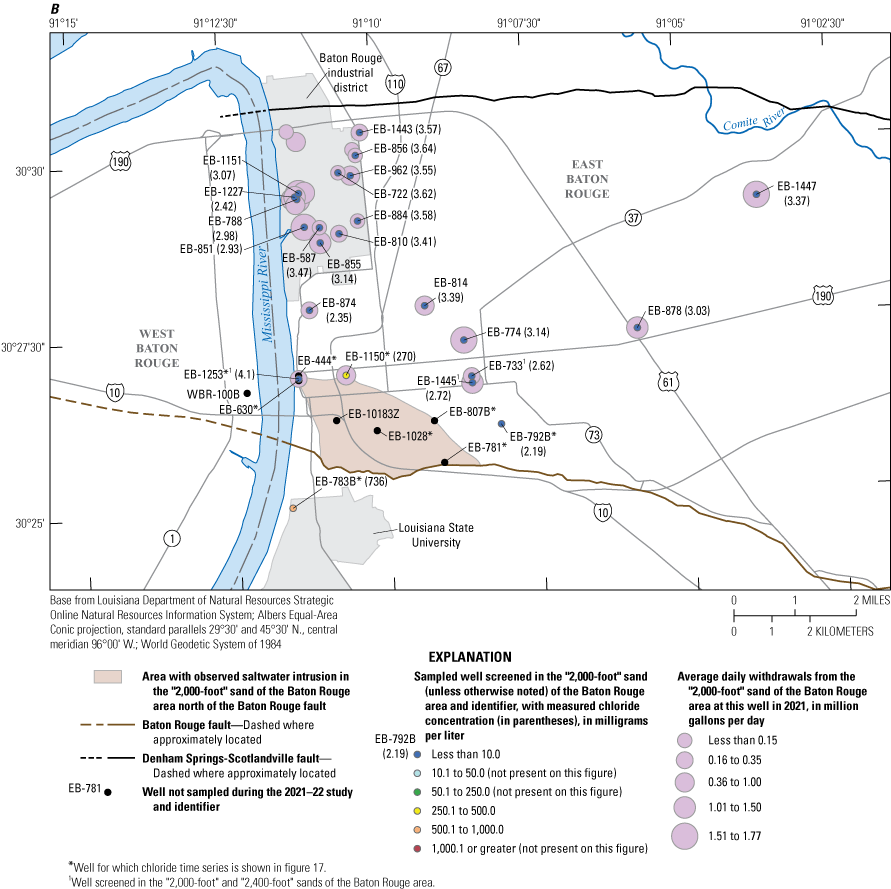
Chloride concentrations in water from wells screened in the “2,000-foot” sand of the Baton Rouge area collected during November 2021 through February 2022 and reported annual withdrawals from wells screened in the aquifer for 2021 in southeastern Louisiana (Capital Area Groundwater Conservation Commission, 2022).
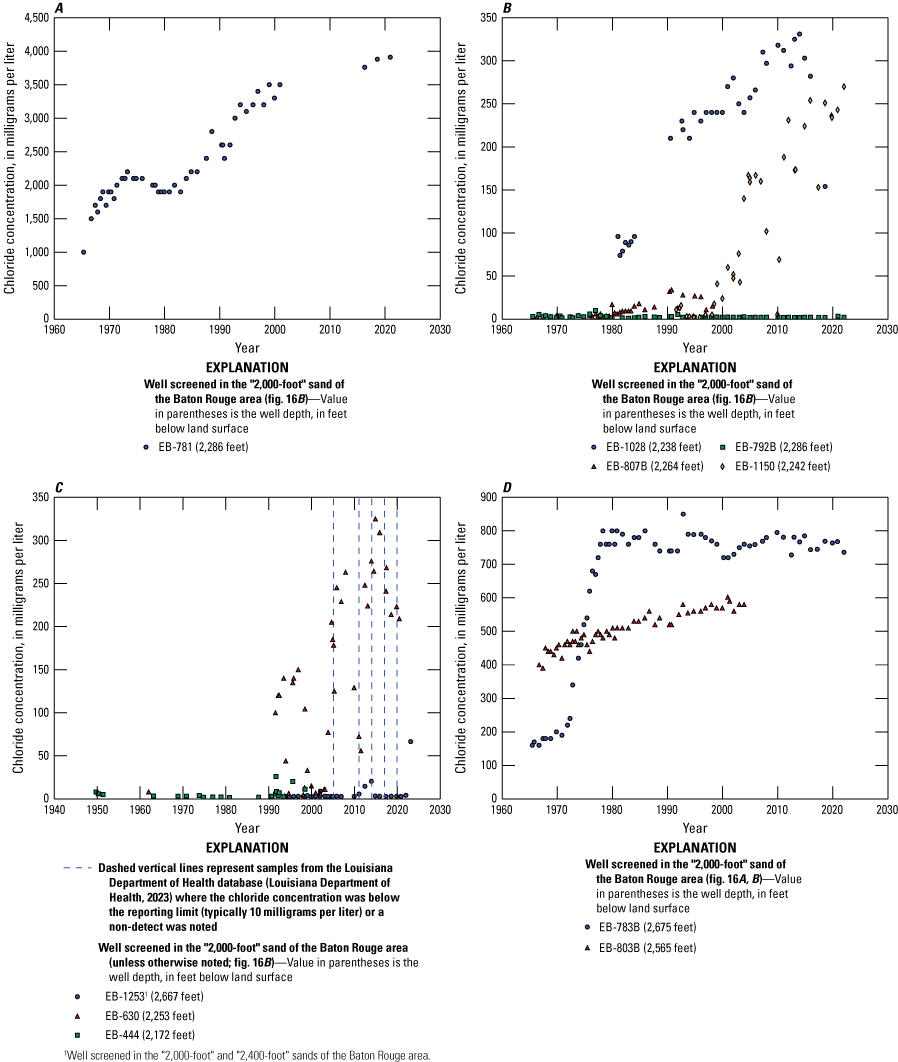
Time series of chloride concentrations in water from A, B, D, wells screened in the “2,000-foot” sand of the Baton Rouge area and C, one well screened in the “2,000-foot” and “2,400-foot” sands of the Baton Rouge area, southeastern Louisiana.
Saltwater was first detected north of the fault by a test drilling program during 1965–66, and a monitoring well (EB-781) (fig. 16B) was installed near the area where saltwater was thought to be crossing the fault. Since then, chloride concentrations at EB-781 have increased and reached 3,910 mg/L when last measured in 2020 (fig. 17A). Additional monitoring wells screened in the “2,000-foot” sand were installed during 1965–66 (EB-792B and EB-807B) and in 1981 (EB-1028) between EB-781 and various pumping centers to provide advance warning of saltwater movement (fig. 16B). Chloride concentrations greater than 10 mg/L have been detected in EB-807B and EB-1028, but not in the easternmost well, EB-792B (fig. 17B), indicating that the plume is traveling along a curved path towards the industrial district. Farther along this path to the north, production wells screened in the “2,000-foot” sand have been affected by saltwater (EB-1150, fig. 17B; EB-444 and EB-630, fig. 17C). EB-1150 is still active, and concentrations were continuing to increase in 2022. EB-444 and EB-630 were plugged in 2000 and 2021, respectively.
Chloride concentrations in samples from a production well (EB-1253) screened in the “2,000-foot” and “2,400-foot” sands at the same facility as EB-630 have generally remained less than 10 mg/L, except for samples collected in 2012 (14.6 mg/L) and 2013 (20.4 mg/L). The higher concentrations observed at EB-630 are likely the result of its deeper screen depth. Although the sample collected from EB-1253 in 2022 for this study had a concentration of 4.1 mg/L, a subsequent sample collected in January 2023 was substantially higher with a concentration of 66.6 mg/L. This increase may be related to recent changes in the relative water levels in the “2,000-foot” and “2,400-foot” sands. The volume of flow into the well from each aquifer is dependent on the water level in each aquifer at the location. Water levels measured at EB-1028 screened in the “2,000-foot” sand about 1.5 mi from EB-1253 (fig. 16B) have generally increased since about 2001 but have historically been lower than the water levels at WBR-100B screened in the “2,400-foot” sand (about 0.9 mi from EB-1253, fig. 16B). This relation changed during the summer of 2021 when the water levels in EB-1028 began to surpass those at WBR-100B, and measurements taken at both wells in May 2022 showed a difference of about 28 ft (USGS, 2023). As the water level in the “2,000-foot” sand increases relative to the water level in the “2,400-ft” sand, more flow from the “2,000-ft” sand into EB-1253 is expected, and this could contribute to increased chloride concentrations in EB-1253 because the edge of the saltwater plume in the “2,000-foot” sand is at this location. The recent increase in chloride concentration at EB-1253 may also be a consequence of the plugging of EB-630 in 2021; EB-630 may have been intercepting saltwater from the base of the “2,000-ft” sand before the saltwater could move vertically upwards in the aquifer toward the shallower screen of EB-1253.
The CAGWCC has considered a scavenger well system to slow the advance of the plume in the “2,000-foot” sand (Heywood and others, 2015). In 2020, a test hole was drilled at a candidate location for a scavenger well, but the aquifer was relatively thin and fine grained at this location, so a monitoring well was completed instead (EB-10183Z) (fig. 16B). Samples taken from this monitoring well had chloride concentrations as high as 230 mg/L in March 2020 (Louisiana Department of Natural Resources, 2023).
Two wells south of the Baton Rouge fault screened in the “2,000-foot” sand were sampled during this study (fig. 16A, B). One is a monitoring well (EB-783B, fig. 16B) where chloride concentrations increased sharply from 160 mg/L at the beginning of its measured period in 1965 until about 1978, when the concentrations started to level off to the 700–800-mg/L range (fig. 17D). The other is a production well (EB-1319, fig. 16A) that withdraws from a zone of freshwater south of the fault in the southeastern corner of East Baton Rouge Parish. The sample from this well had a chloride concentration of 11.4 mg/L, marginally higher than previous concentrations which ranged from 7.85 to 11 mg/L.
“2,400-Foot” Sand of the Baton Rouge Area
Twenty-four samples were collected from wells screened in the “2,400-foot” sand (fig. 18A, B), including 1 well (EB-1187) screened in the “2,400-foot” and “2,800-foot” sands and 3 wells (EB-1445, EB-733, EB-1253) screened in the “2,000-foot” and “2,400-foot” sands. One sample from a monitoring well north of the Baton Rouge fault had a chloride concentration greater than 10 mg/L; a sample from EB-804B had a concentration of 382 mg/L (fig. 18B). Chloride concentrations in this well began to increase around 1993 and have continued increasing to the present (fig. 19). About 2.1 mi southeast of EB-804B and south of the Baton Rouge fault, chloride concentrations in a monitoring well screened in the downthrown “2,000-foot sand” (EB-803B, fig. 16A) generally increased through the well’s period of record during 1966–2003, reaching a maximum of 602 mg/L in 2000 (fig. 17D). Because the “2,400-foot” sand is partially connected to the downthrown “2,000-foot” sand south of the fault in some areas (Whiteman, 1979; Griffith, 2003), the increasing concentrations at EB-803B may indicate the movement of saltwater past this location into the “2,400-foot” sand north of the fault.
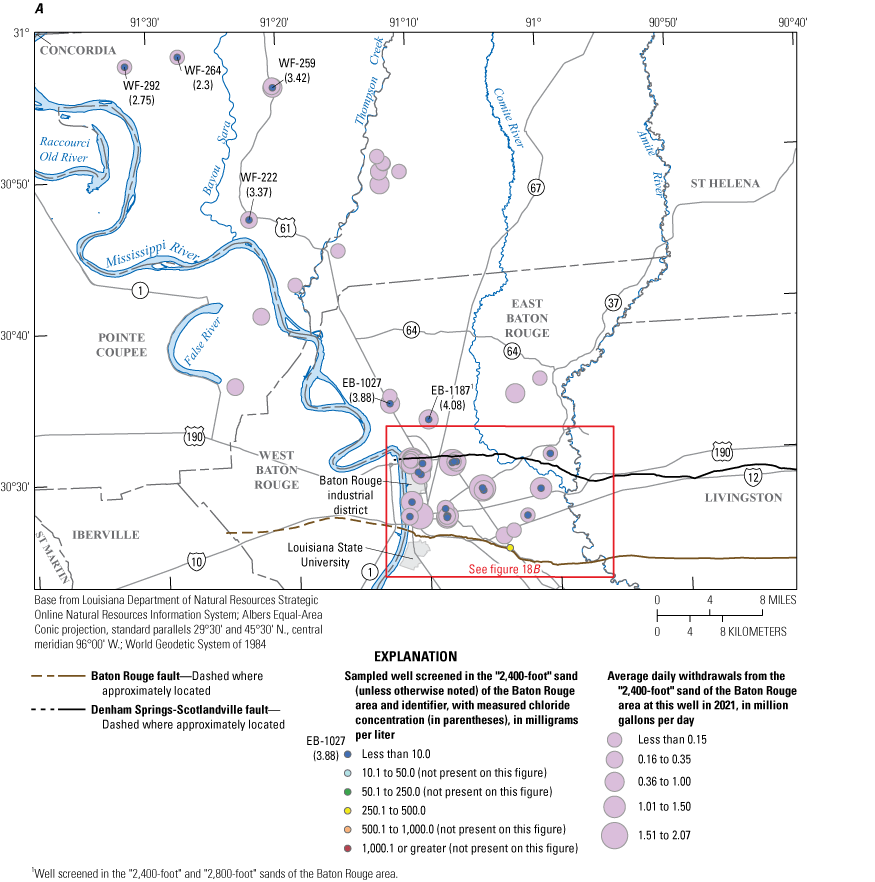
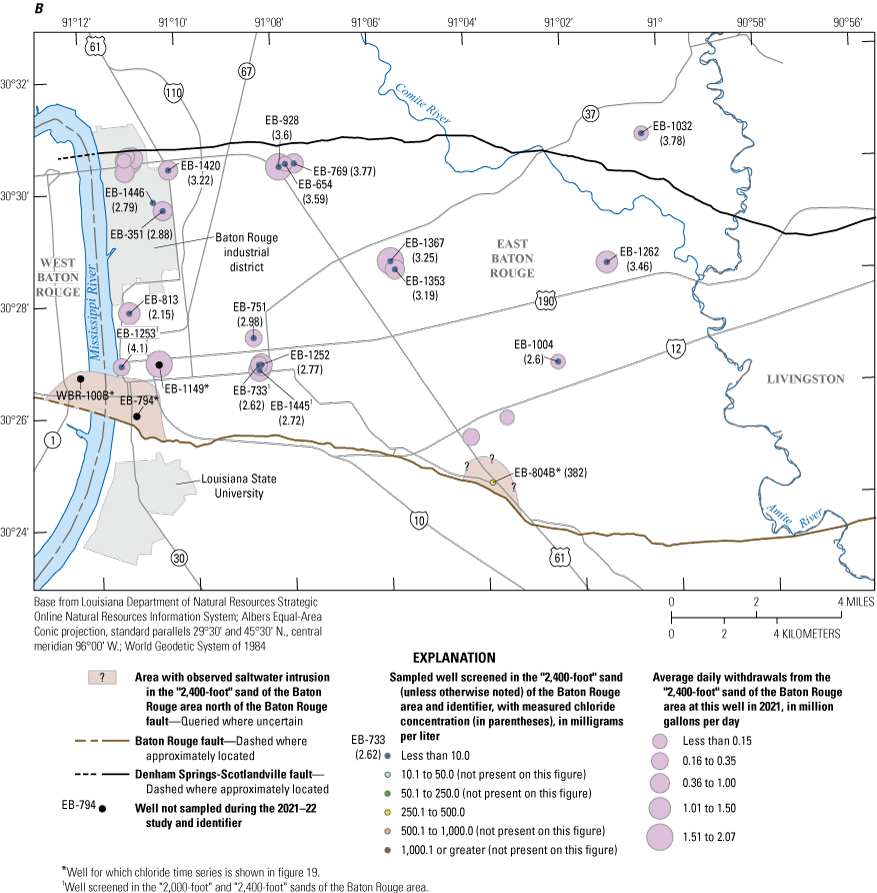
Chloride concentrations in water from wells screened in the “2,400-foot” sand of the Baton Rouge area collected during November 2021 through February 2022 and reported annual withdrawals from wells screened in the aquifer for 2021 in southeastern Louisiana (Capital Area Groundwater Conservation Commission, 2022).
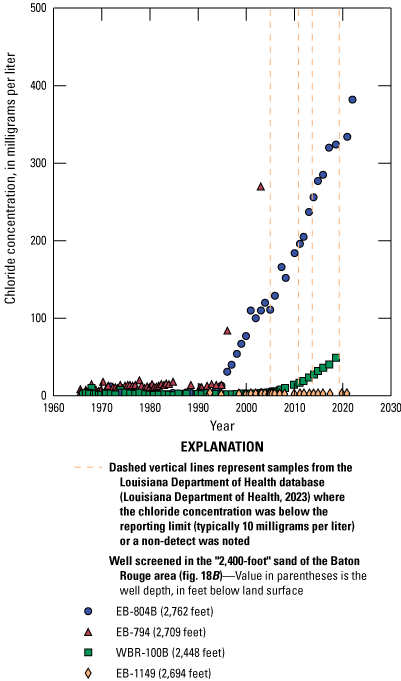
Time series of chloride concentrations in water from wells screened in the “2,400-foot” sand of the Baton Rouge area, southeastern Louisiana.
Saltwater in the “2,400-foot” sand has also been observed in two other monitoring wells north of the fault. In EB-794 (fig. 18B), chloride concentrations sharply increased about 1994–95 and were at 270 mg/L when the well was last sampled in 2002 (fig. 19). About 1.4 mi away across the Mississippi River in West Baton Rouge Parish, concentrations in a monitoring well (WBR-100B) gradually increased beginning in about 2004, with the most recent sample from 2018 at 49.1 mg/L (fig. 19). If the source of saltwater to this plume is the downthrown “2,000-foot” sand on the other side of the Baton Rouge fault, then the chloride concentrations may approach the upper limit observed in well EB-783B (about 800 mg/L; fig. 17D), which is screened in the “2,000-foot” sand directly south of this area, about a mile from the fault line (fig. 16B).
“2,800-Foot” Sand of the Baton Rouge Area
Twenty-four samples were collected from wells screened in the “2,800-foot” sand (fig. 20A, B), including a sample from a well screened in the “2,400-foot” and “2,800-foot” sands (EB-1187). Of these, eight samples had chloride concentrations that were greater than 10 mg/L. The “2,800-foot” sand contains a broad freshwater-saltwater transition zone extending about 2–7 mi north of the Baton Rouge fault (Whiteman, 1979; Tomaszewski, 1996; Lovelace, 2007) (fig. 20B). For this reason, wells that currently withdraw from the “2,800-foot” sand are located north of the industrial district (fig. 20A).
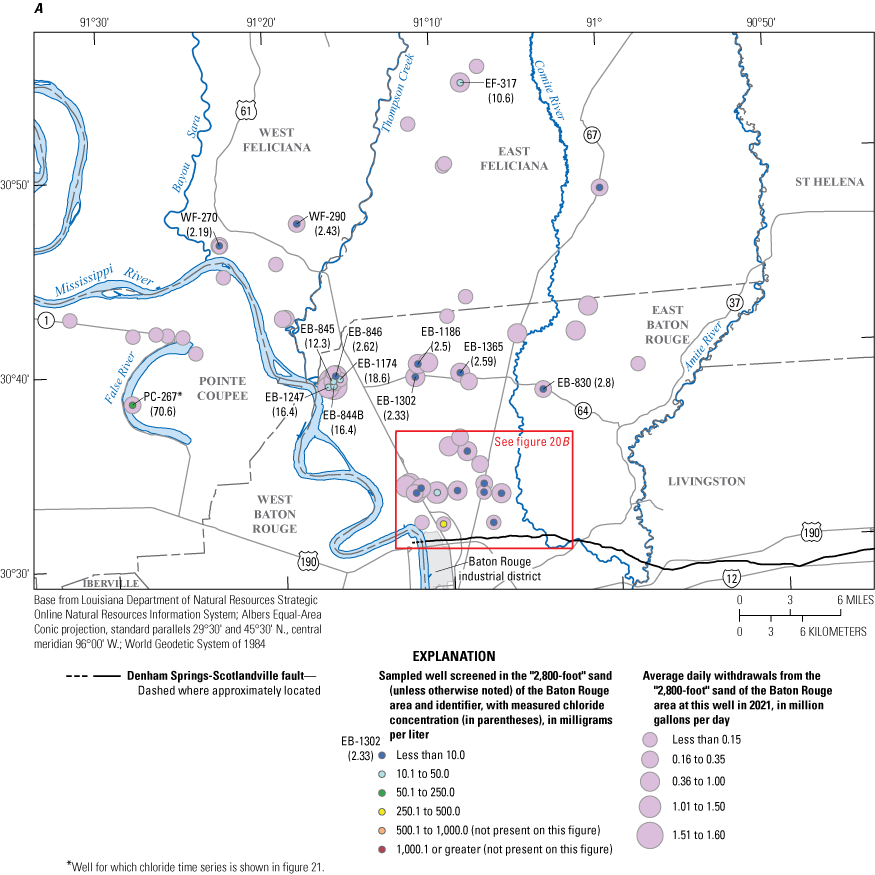
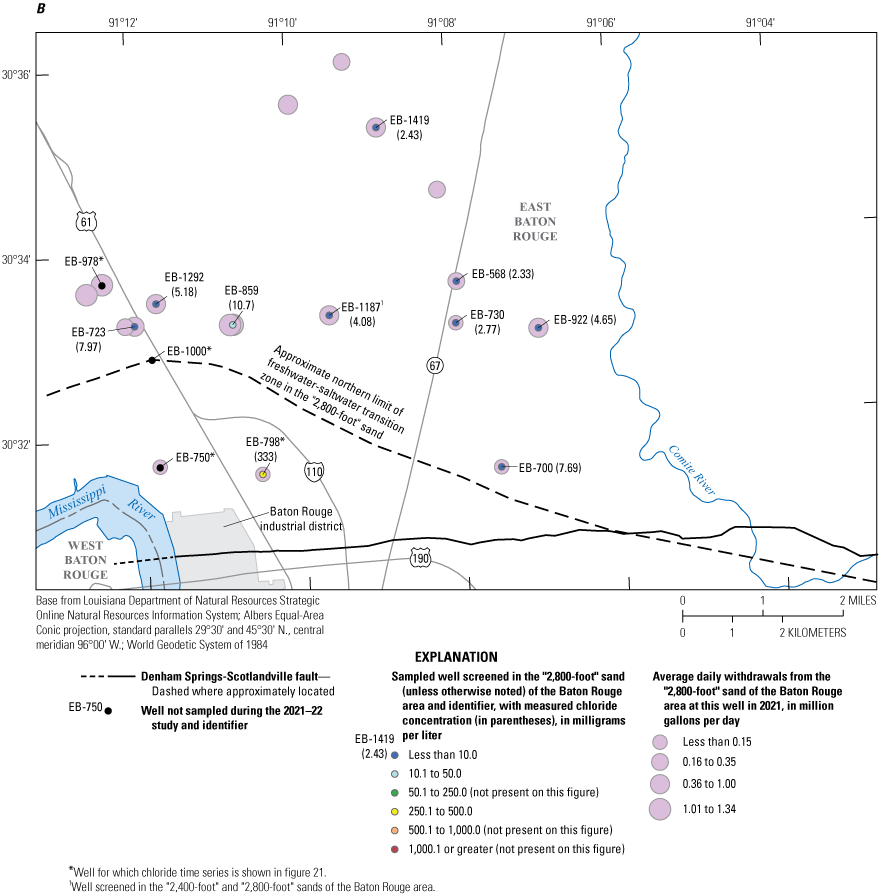
Chloride concentrations in water from wells screened in the “2,800-foot” sand of the Baton Rouge area collected during November 2021 through February 2022 and reported annual withdrawals from wells screened in the aquifer for 2021 in southeastern Louisiana (Capital Area Groundwater Conservation Commission, 2022).
Just north of the industrial district, chloride concentrations have been increasing at two production wells (EB-798 and EB-750) that are within the transition zone (fig. 20). A sample collected for this study from EB-798 had a concentration of 333 mg/L, and the most recent sample from EB-750 had a concentration of 80.5 mg/L (fig. 21A, B). Concentrations as high as 110 mg/L have been measured in samples from monitoring well EB-1000, and concentrations as high as 24 mg/L have been measured in samples from production well EB-978 (fig. 21B), which is farther north. Chloride concentrations in samples from other wells in this area have generally remained below 10 mg/L or were only slightly greater than 10 mg/L.
In Pointe Coupee Parish, a chloride concentration of 70.6 mg/L was measured in a sample from production well PC-267 near False River (fig. 20A). Concentrations in samples collected from this well during 1995–2022 have ranged from 57.1 to 74.1 mg/L but are not increasing (fig. 21C). According to well registration documents, a sample collected in 1986 before the well was completed had a concentration of 42.4 mg/L (Louisiana Department of Natural Resources, 2023). Several other historical samples from wells screened in the “2,800-foot” sand around False River also had chloride concentrations that were greater than 10 mg/L.
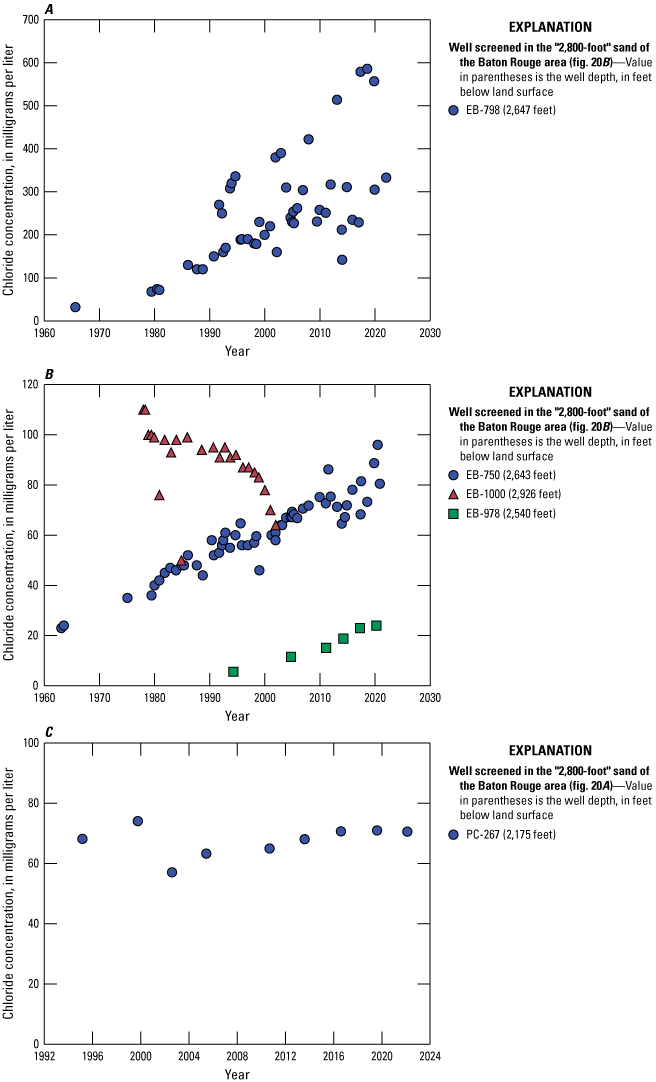
Time series of chloride concentrations in water from wells screened in the “2,800-foot” sand of the Baton Rouge area, southeastern Louisiana.
Summary
High chloride concentrations in groundwater can potentially reduce water availability for certain uses. Saltwater intrusion has been documented in East and West Baton Rouge Parishes in southeastern Louisiana, where groundwater withdrawals have lowered water levels and caused saltwater to move northward across the Baton Rouge fault at different depths and locations. The U.S. Geological Survey, in cooperation with the Capital Area Groundwater Conservation Commission, monitors concentrations of chloride in groundwater through an annual sampling network at wells near known saltwater plumes. To supplement this routine data collection, additional water samples were collected during November 2021 through February 2022. A total of 161 wells screened in the 10 named aquifers of the Southern Hills regional aquifer system were sampled to document chloride concentrations in groundwater. The sample results were compared to historical data to determine where chloride concentrations are increasing.
Continued saltwater intrusion at one or more wells north of the Baton Rouge fault was observed for the “1,000-foot,” “1,200-foot,” “1,500-foot,” “2,000-foot,” “2,400-foot,” and “2,800-foot” sands of the Baton Rouge area. The current extents and rates of movement of known plumes in the “600-foot” and “800-foot” sands of the Baton Rouge area are uncertain because of the limited availability of monitoring wells screened in these aquifers near or within the plumes. Increasing chloride concentrations have been observed in one well screened in both the “1,500-foot” and “1,700-foot” sands of the Baton Rouge area, but it is unknown at which stratigraphic level saltwater intrusion is occurring at this location. Saltwater intrusion has not been observed in the “400-foot” sand of the Baton Rouge area. Since the previous expanded chloride sampling effort during 2004–06, the observed plume areas for the “1,000-foot” and “1,200-foot” sands of the Baton Rouge area have likely expanded northward to additional production wells.
The plume areas are estimated from data collected at a limited number of wells, and their extents are uncertain. In several cases, saltwater intrusion is inferred from increasing concentrations at a single well. In all cases, the leading edges of the known plumes are either untracked or are known from analysis of samples from active wells that have increasing chloride concentrations. There are few operable monitoring wells between known areas of intrusion and currently producing wells to provide advance warning, information on the rate of encroachment, or water level data to constrain hydraulic gradients. Because of the wide range of depths from which groundwater is withdrawn in the Baton Rouge area and the degree of urban and residential development, construction of new monitoring wells may be challenging. The results presented herein serve to inform future data collection activities, the selection of new monitoring well locations, and the formulation of numerical models to simulate chloride transport. Additionally, these data could be used by water managers to assess the relative risk of saltwater intrusion to existing water supply infrastructure at different depths within the Southern Hills regional aquifer system.
References Cited
Buono, A., 1983, The Southern Hills regional aquifer system of southeastern Louisiana and southwestern Mississippi: U.S. Geological Survey Water-Resources Investigations Report 83–4189, 38 p. [Also available at https://doi.org/10.3133/wri834189.]
Capital Area Groundwater Conservation Commission [CAGWCC], 2022, Historic Water Data: Capital Area Groundwater Conservation District database, accessed June 6, 2021, at https://www.capitalareagroundwater.com/water-use.
Chen, Y., Vahdat-Aboueshagh, H., Tsai, F.T.-C., Dausman, A., and Runge, M.C., 2023, Unstructured-grid approach to develop high-fidelity groundwater model to understand groundwater flow and storage responses to excessive groundwater withdrawals in the Southern Hills aquifer system in southeastern Louisiana (USA): Journal of Hydrology, Regional Studies, v. 46, article 101342, 22 p.
Collier, A.L., 2018, Water withdrawals by source and category in Louisiana Parishes, 2014–2015: U.S. Geological Survey data release, accessed October 13, 2020, at https://doi.org/10.5066/F78051VM.
Fishman, M.J., and Friedman, L.C., eds., 1989, Methods for determination of inorganic substances in water and fluvial sediments: U.S. Geological Survey Techniques of Water-Resources Investigations, book 5, chap. A1, 545 p. [Also available at https://pubs.water.usgs.gov/twri/. Chapters originally published from 1997 to 1999; updates and revisions are ongoing and are summarized at https://water.usgs.gov/owq/FieldManual/mastererrata.html.]
Griffith, J.M., 2003, Hydrogeologic framework of southeastern Louisiana: Louisiana Department of Transportation and Development Water Resources Technical Report no. 72, 21 p., 18 pls. [Also available at https://wise.er.usgs.gov/dp/pdfs/TR72.pdf.]
Halford, K.J., and Lovelace, J.K., 1994, Analysis of ground-water flow in the “1,200-foot” aquifer, Baton Rouge area, Louisiana: Louisiana Department of Transportation and Development Water Resources Technical Report no. 54, 68 p. [Also available at https://wise.er.usgs.gov/dp/pdfs/TR54.pdf.]
Heywood, C.E., Griffith, J.M., and Lovelace, J.K., 2014, Simulation of groundwater flow in the “1,500-foot” sand and “2,000-foot” sand, with scenarios to mitigate saltwater migration in the “2,000-foot” sand of the Baton Rouge area, Louisiana (ver. 1.2, June 2014): U.S. Geological Survey Scientific Investigations Report 2013–5227, 63 p. [Also available at http://dx.doi.org/10.3133/sir20135227.]
Heywood, C.E., 2019, SEAWAT Model of Flow and Chloride Transport in the 1,500-Foot, 2,400-Foot, and 2,800-Foot Sands of the Baton Rouge Area, Louisiana: U.S. Geological Survey data release, https://doi.org/10.5066/P9URJ38Q.
Heywood, C.E., Lindaman, M.A., and Lovelace, J.K., 2019, Simulation of groundwater flow and chloride transport in the “1,500-foot” sand, “2,400-foot” sand, and “2,800-foot” sand of the Baton Rouge area, Louisiana: U.S. Geological Survey Scientific Investigations Report 2019–5102, 49 p. [Also available at https://doi.org/10.3133/sir20195102.]
Heywood, C.E., Lovelace, J.K., and Griffith, J.M., 2015, Simulation of groundwater flow and chloride transport in the “1,200-foot” sand with scenarios to mitigate saltwater migration in the “2,000-foot” sand in the Baton Rouge area, Louisiana (ver. 1.1, September 2015): U.S. Geological Survey Scientific Investigations Report 2015–5083, 69 p. [Also available at https://doi.org/10.3133/sir20155083.]
Kuniansky, E.L., Dial, D.C., and Trudeau, D.A., 1989, Maps of the “400-foot,” “600-foot,” and adjacent aquifers and confining beds, Baton Rouge area, Louisiana: Louisiana Department of Transportation and Development Water Resources Technical Report no. 48, 16 p. [Also available at https://wise.er.usgs.gov/dp/pdfs/TR48.pdf.]
Lindaman, M.A., 2024, Chloride concentration data for the western part of the Southern Hills regional aquifer system, Louisiana, 2021–22, and selected historical data: U.S. Geological Survey data release, https://doi.org/10.5066/P9A9OBT6.
Louisiana Department of Health, 2023, Health Data Explorer: Louisiana Department of Health database, accessed February 2023 at https://healthdata.ldh.la.gov/.
Louisiana Department of Natural Resources, 2023, Strategic Online Natural Resources Information System (SONRIS): Louisiana Department of Natural Resources database, accessed from November 2021 through March 2023 at https://www.sonris.com/.
Lovelace, J.K., 2007, Chloride concentrations in ground water in East and West Baton Rouge Parishes, Louisiana, 2004–05: U.S. Geological Survey Scientific Investigations Report 2007–5069, 27 p. [Also available at https://pubs.usgs.gov/sir/2007/5069/.]
Moore, R., Kelson, V., and Anderson, E., 2011, Remedial options for saltwater encroachment in the 1,500-foot sand—Final project report: Baton Rouge Water Company, prepared by Layne Hydro, Bloomington, Indiana, 215 p. [Also available at https://www.dnr.louisiana.gov/assets/OC/env_div/gw_res/ENV2012_01_01/BRWC_REPORT_20120103.pdf.]
Tomaszewski, D.J., 1996, Distribution and movement of saltwater in aquifers in the Baton Rouge area, Louisiana, 1990–92: Louisiana Department of Transportation and Development Water Resources Technical Report no. 59, 44 p. [Also available at https://wise.er.usgs.gov/dp/pdfs/TR59.pdf.]
Torak, L.J., and Whiteman, C.D., Jr., 1982, Applications of digital modeling for evaluating the ground-water resources of the “2,000-foot” sand of the Baton Rouge area, Louisiana: Louisiana Department of Transportation and Development Water Resources Technical Report no. 27, 87 p. [Also available at https://wise.er.usgs.gov/dp/pdfs/TR27.pdf.]
U.S. Environmental Protection Agency, 2023, Secondary Drinking Water Standards—Guidance for nuisance chemicals: U.S. Environmental Protection Agency web page, accessed March 2023 at https://www.epa.gov/sdwa/secondary-drinking-water-standards-guidance-nuisance-chemicals.
U.S. Geological Survey [USGS], 1997–2024, National field manual for the collection of water-quality data: U.S. Geological Survey Techniques of Water-Resources Investigations, book 9, chaps. A1–A9, [variously paged]. [Also available at https://pubs.water.usgs.gov/twri/. Chapters originally published from 1997 to 1999; updates and revisions are ongoing and are summarized at https://water.usgs.gov/owq/FieldManual/mastererrata.html.]
U.S. Geological Survey [USGS], 2023, USGS water data for the Nation: U.S. Geological Survey National Water Information System database, accessed from September 2022 through March 2023 at https://doi.org/10.5066/F7P55KJN.
Whiteman, C.D., Jr., 1979, Saltwater encroachment in the “600-foot” and “1,500-foot” sands of the Baton Rouge area, Louisiana, 1966–78, including a discussion of saltwater in other sands: Louisiana Department of Transportation and Development, Office of Public Works Water Resources Technical Report no. 19, 49 p. [Also available at https://wise.er.usgs.gov/dp/pdfs/TR19.pdf.]
Conversion Factors
U.S. customary units to International System of Units
Datums
Vertical coordinate information is referenced to the North American Vertical Datum of 1988 (NAVD 88).
Horizontal coordinate information is referenced to the World Geodetic System of 1984 (WGS 84).
Supplemental Information
Concentrations of chloride in water are reported in milligrams per liter (mg/L).
For more information about this publication, contact
Director, Lower Mississippi-Gulf Water Science Center
U.S. Geological Survey
640 Grassmere Park, Suite 100
Nashville, TN 37211
For additional information, visit
https://www.usgs.gov/centers/lmg-water/
Publishing support provided by
Lafayette Publishing Service Center
Disclaimers
Any use of trade, firm, or product names is for descriptive purposes only and does not imply endorsement by the U.S. Government.
Although this information product, for the most part, is in the public domain, it also may contain copyrighted materials as noted in the text. Permission to reproduce copyrighted items must be secured from the copyright owner.
Suggested Citation
Lindaman, M.A., 2024, Chloride concentrations in groundwater from the western part of the Southern Hills regional aquifer system, Louisiana, 2021–22: U.S. Geological Survey Scientific Investigations Report 2024–5057, 33 p., https://doi.org/10.3133/sir20245057.
ISSN: 2328-0328 (online)
Study Area
| Publication type | Report |
|---|---|
| Publication Subtype | USGS Numbered Series |
| Title | Chloride concentrations in groundwater from the western part of the Southern Hills regional aquifer system, Louisiana, 2021–22 |
| Series title | Scientific Investigations Report |
| Series number | 2024-5057 |
| DOI | 10.3133/sir20245057 |
| Publication Date | September 05, 2024 |
| Year Published | 2024 |
| Language | English |
| Publisher | U.S. Geological Survey |
| Publisher location | Reston, VA |
| Contributing office(s) | Lower Mississippi-Gulf Water Science Center |
| Description | Report: viii, 33 p.; 2 Data Releases |
| Country | United States |
| State | Louisiana |
| Online Only (Y/N) | Y |