Groundwater Flow Model for the Des Moines River Alluvial Aquifer near Des Moines, Iowa
Links
- Document: Report (15 MB pdf) , HTML , XML
- Dataset: USGS National Water Information System database —USGS water data for the Nation
- Data Releases:
- USGS data release - MODFLOW 6 groundwater flow model for the Des Moines River alluvial aquifer near Des Moines, Iowa
- USGS data release - Geophysical data collected in the Des Moines River, Beaver Creek, and the Des Moines River floodplain, Des Moines, Iowa, 2018
- USGS data release - MODFLOW-NWT model used to simulate groundwater levels in the Des Moines River alluvial aquifer near Des Moines, Iowa
- Download citation as: RIS | Dublin Core
Acknowledgments
This report was prepared in cooperation with Des Moines Water Works, and the authors thank Des Moines Water Works staff, specifically Vern Rash, for their support and for providing valuable information for this study.
Abstract
Des Moines Water Works (DMWW) is a regional municipal water utility that provides residential and commercial water resources to about 600,000 customers in Des Moines, Iowa, and surrounding municipalities in central Iowa. DMWW has identified a need for increased water supply and is exploring the potential for expanding groundwater production capabilities in the Des Moines River alluvial aquifer, where it operates two radial collector wells (RCWs). The U.S. Geological Survey, in cooperation with DMWW, completed a study of the Des Moines River alluvial aquifer and interactions of the RCWs with the aquifer; no previously published model has included the existing well locations, which is the focus of this model. A conceptual and numerical groundwater flow model have been developed to characterize the Des Moines River alluvial aquifer under existing conditions, to simulate water levels observed in the RCWs, and to provide publicly accessible hydrologic data and research that advance understanding of the regional hydrologic system and can potentially be used in the future to evaluate groundwater production scenarios. Model performance was assessed by comparing observed and simulated groundwater levels that included water level elevations, water level changes, water level inequality observations, surface water streamflow, and change in surface water volume from upstream to downstream. Water table elevation in the aquifer layers is on average slightly overestimated with average absolute value error less than 1.5 meters at both RCWs and less than 2.5 meters for all observation wells in the alluvial aquifer layers. The model also accurately simulated water tables greater than the RCW design minimum (a water level threshold at which RCW pumping is reduced) in all timesteps for which water level observation data existed. Water table elevation error was higher in other model layers that were not the focus of the study, and the model did not accurately match streamflow targets.
Introduction
Des Moines Water Works (DMWW) is a regional municipal water utility that provides residential and commercial water resources to about 600,000 customers in Des Moines, Iowa, and surrounding municipalities in central Iowa (fig. 1; DMWW, 2024). Des Moines, current population of about 211,000, is in Polk County which has a population of about 501,000 (U.S. Census Bureau, 2023). DMWW has several production facilities that draw upon surface water and groundwater resources, including two radial collector wells (RCWs) that withdraw water from the Des Moines River alluvial aquifer. DMWW has identified a need for increased water supply and is exploring the potential for expanding groundwater production capabilities in the Des Moines River alluvial aquifer.
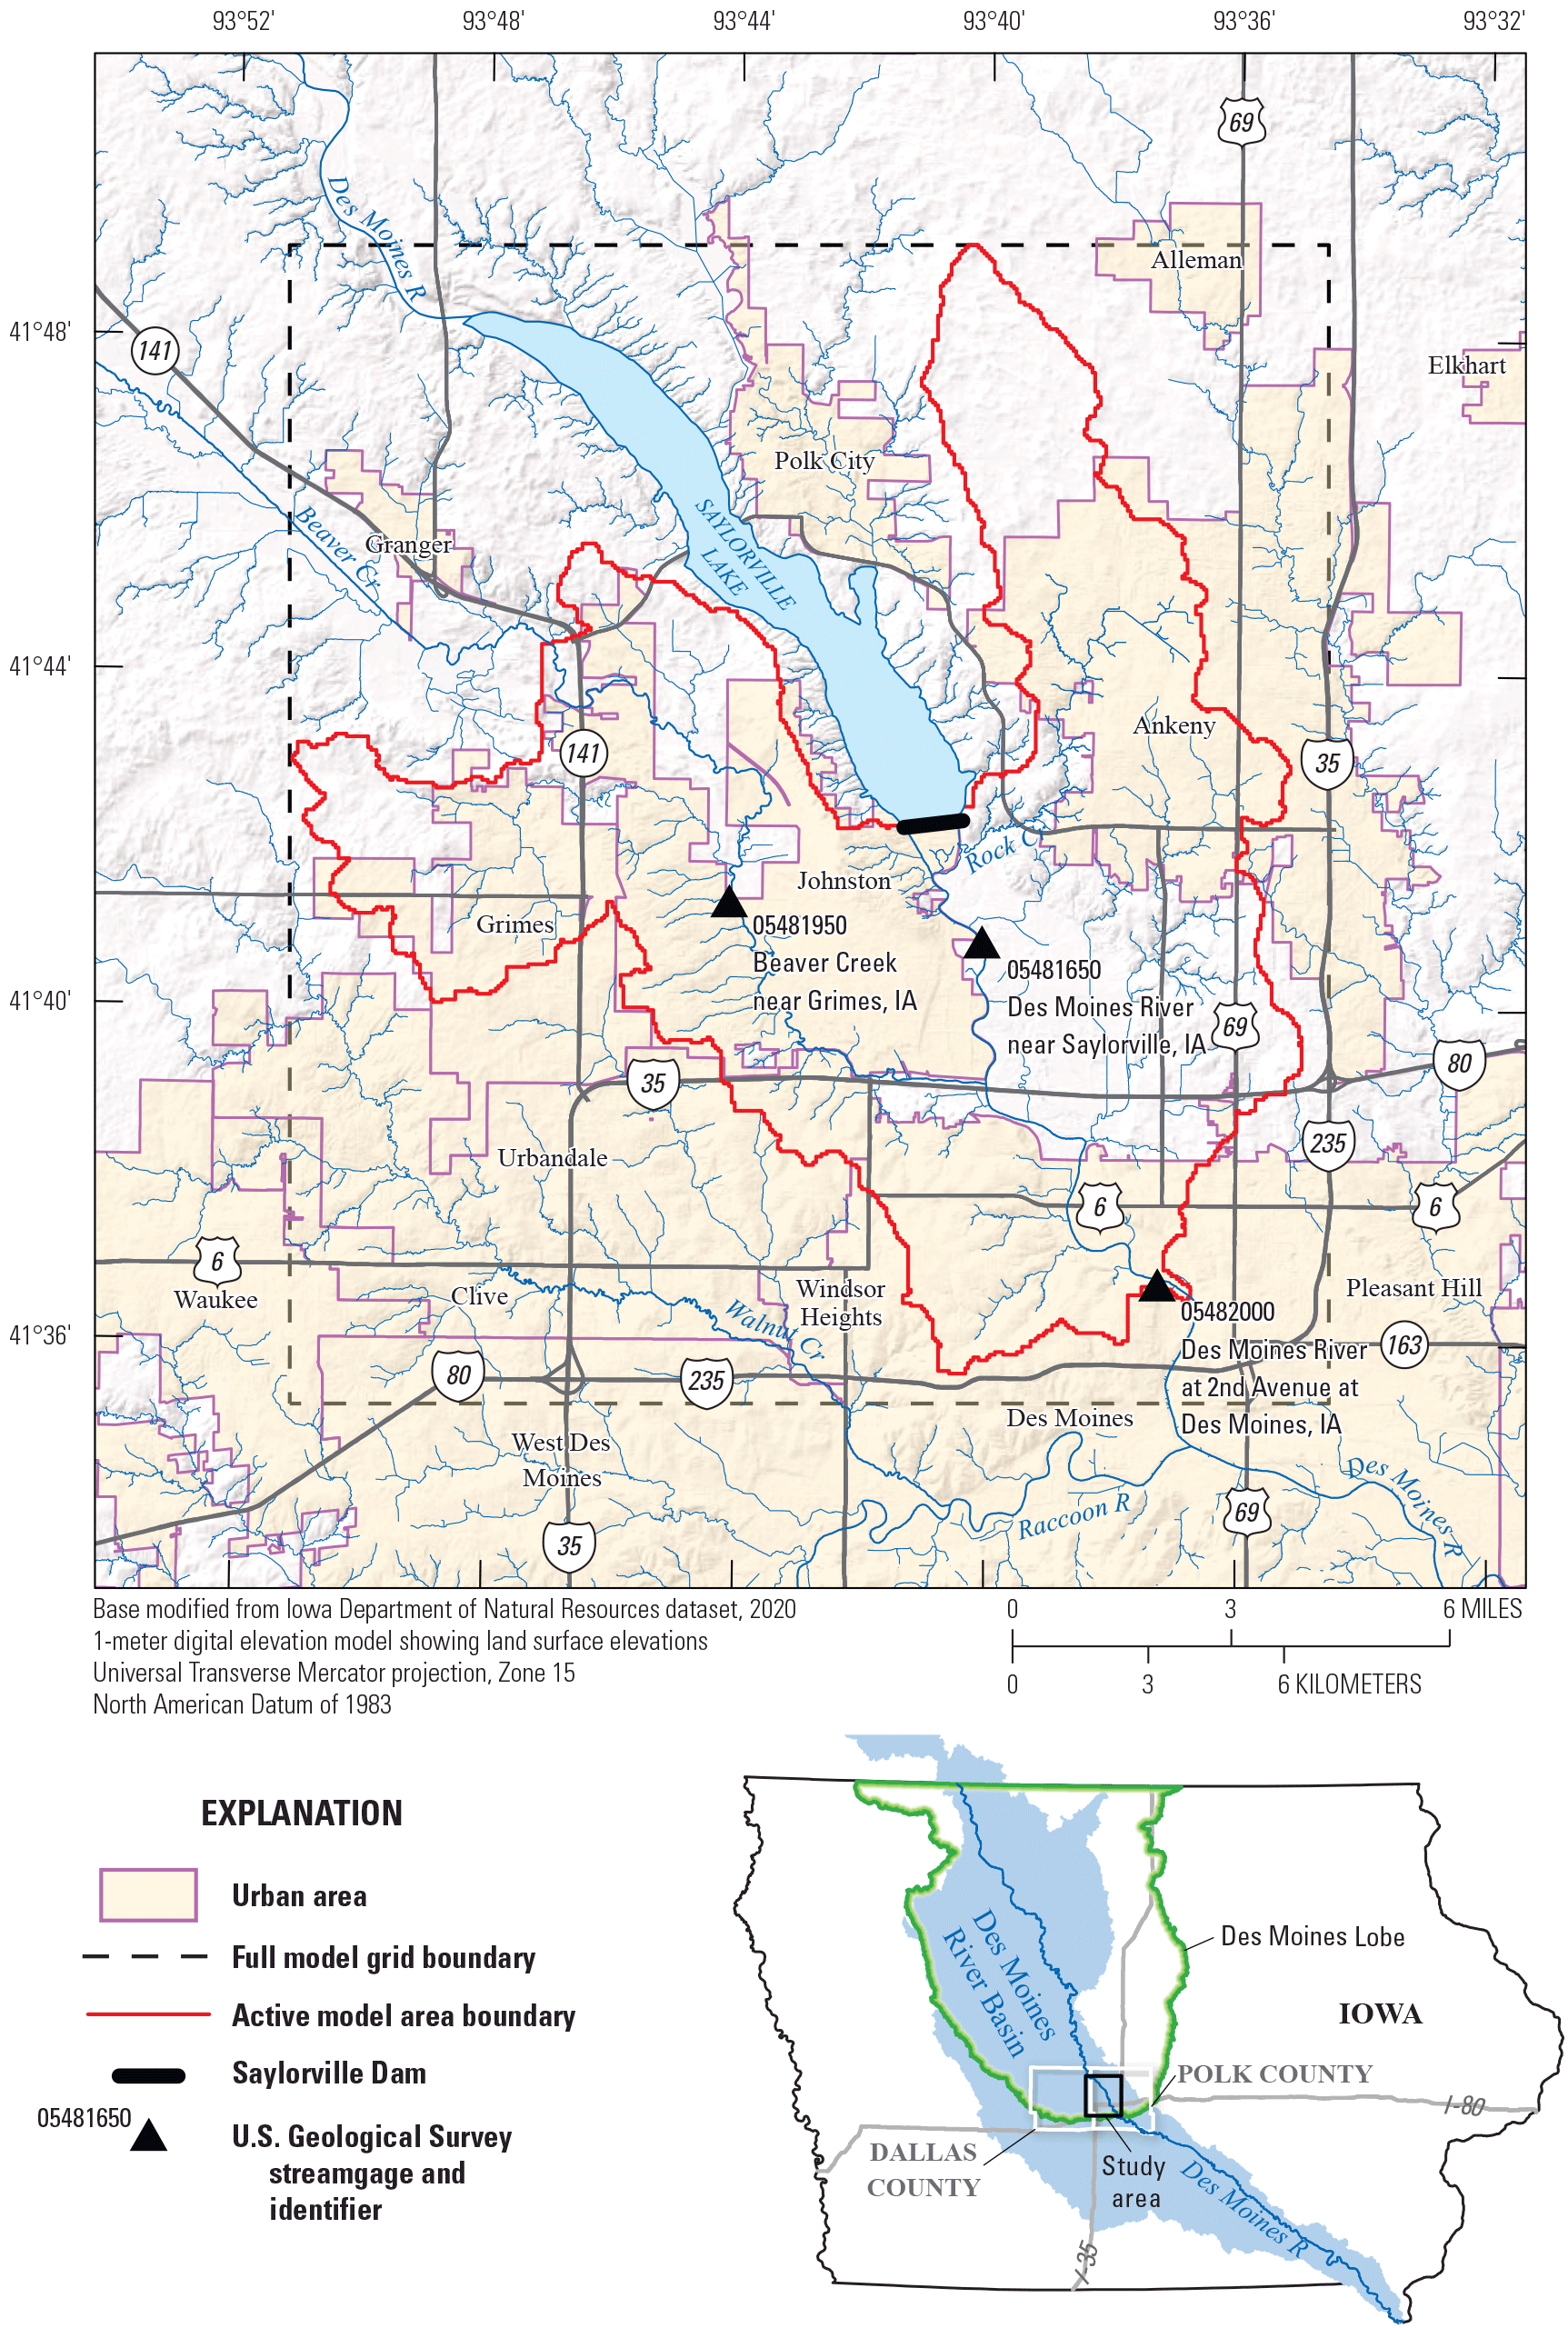
Map showing study area, cities, rivers, lake, dam, streamgages, major roads, and surface-shaded relief. A secondary map shows the study area location within Iowa, including Polk and Dallas Counties, the Des Moines Lobe, the Des Moines River, and its drainage area.
The U.S. Geological Survey (USGS), in cooperation with DMWW, completed a study of the Des Moines River alluvial aquifer and the interactions of the current RCWs with the aquifer. Previously published groundwater models that inform some of the framework and hydrogeologic parameters for this model do not include the RCW locations, which is the focus of this study. A conceptual and numerical groundwater flow model have been developed to characterize the Des Moines River alluvial aquifer under existing conditions, to simulate water levels observed in the RCWs, and to provide publicly accessible hydrologic data and research that advance understanding of the regional hydrologic system and can potentially be used in the future to evaluate groundwater production scenarios. This report details the groundwater flow model’s conceptual hydrogeologic framework, water budget, construction, calibration, and results.
Purpose and Scope
The purpose of this report is to describe the conceptual and numerical groundwater flow models and the numerical model scenario results for each month from January 1980 through July 2022 for the Des Moines River alluvial aquifer. The conceptual model includes a hydrogeologic framework, hydrogeologic units, and water budget components. The numerical model documentation includes explanations of boundary conditions, model input parameters, calibration approach, water budget calculations, and sensitivity analysis. Documentation and run instructions for the Des Moines River alluvial aquifer groundwater flow model are provided in an accompanying data release (Davis and Bristow, 2024). Geophysical data used in this model were documented in a USGS data release (Gruhn and others, 2021). The model detailed here simulates the interaction of the existing RCWs with the Des Moines River alluvial aquifer and could be used to evaluate future groundwater withdrawal scenarios.
Description of Study Area
The study area for the Des Moines River alluvial aquifer investigation described in this report is in northwest Polk County and eastern Dallas County, Iowa, and has an area of approximately 223 square kilometers (km2; fig. 1). Its boundary is delineated mostly along surface water drainage divides within the Des Moines River Basin. The model area includes approximately 15 kilometers (km) of the Des Moines River, approximately 22.5 km of Beaver Creek starting from its mouth on the Des Moines River, and smaller tributaries of the Des Moines River and Beaver Creek. Des Moines River inflow to the model area comes from Saylorville Dam, which is at the upstream boundary of the model. The U.S. Army Corps of Engineers manages flow through Saylorville Dam (U.S. Army Corps of Engineers, 2023). Three USGS streamgages are in the study area boundary (table 1; fig. 1): Des Moines River at 2nd Avenue at Des Moines, Iowa (USGS streamgage 05482000; hereafter referred to as the “2nd Avenue gage,” USGS, 2023a) is on the Des Moines River at the downstream outlet of the model; Des Moines River near Saylorville, Iowa (USGS streamgage 05481650; hereafter referred to as the “Saylorville gage,” USGS, 2023b) is on the Des Moines River slightly downstream from the Saylorville Dam outlet; and the Beaver Creek near Grimes, Iowa (USGS streamgage 05481950; hereafter referred to as the “Beaver Creek gage,” USGS, 2023c) is partway upstream the Beaver Creek reach. The model area also has 13 monitoring wells with USGS records (USGS, 2023d; table 1), 10 wetland monitoring wells managed by DMWW (Vern Rash, DMWW, written commun., 2022; Davis and Bristow, 2024), and several private wells with lithologic or water level data (Iowa Geological Survey [IGS], 2022) used for the numerical model (fig. 2). DMWW has operated two RCWs in the model area next to the Des Moines River since 2011 (fig. 2). Several other commercial or institutional groundwater users are in the area with combined withdrawals around 1 percent of the RCW withdrawals (Iowa Department of Natural Resources, 2023).
Table 1.
U.S. Geological Survey streamgages and monitoring wells in the study area.[Streamgage and well site numbers and names are from the U.S. Geological Survey (USGS) National Water Information System database (USGS, 2023a, b, c, d). Dates are given in year-month; IA, Iowa]
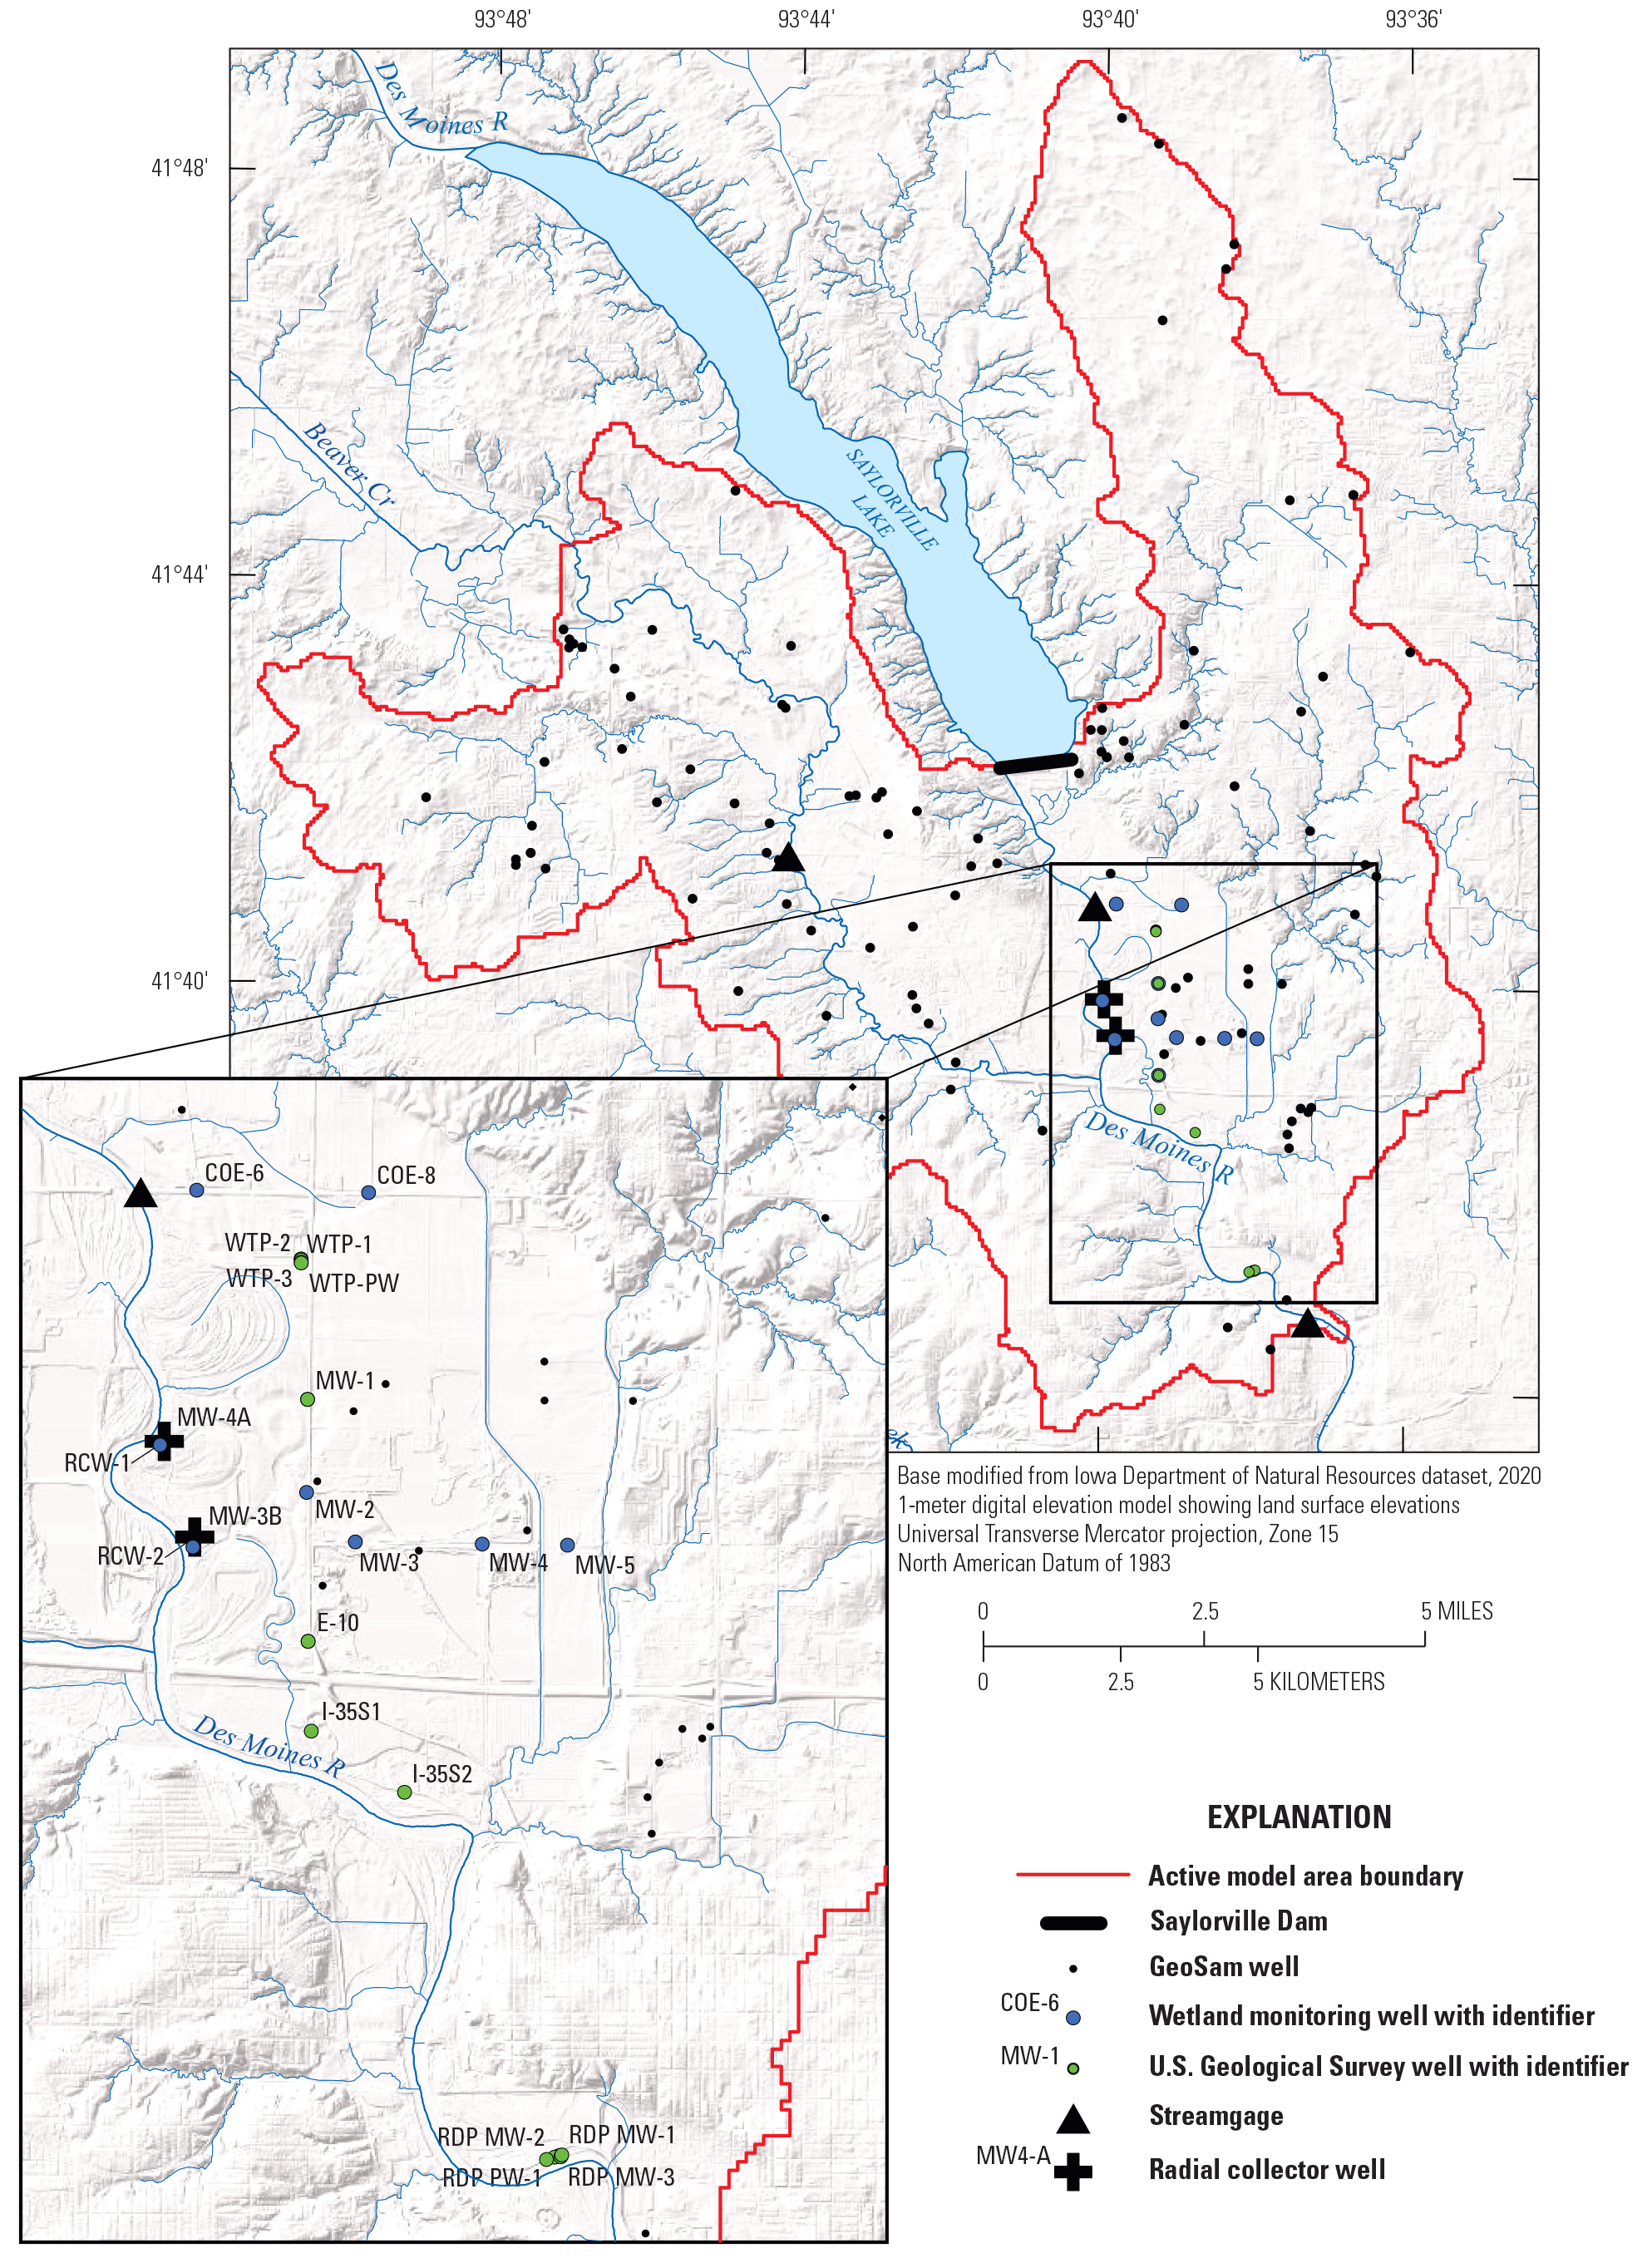
Map showing radial collector wells, U.S. Geological Survey streamgages (U.S. Geological Survey, 2023a, b, c), monitoring wells (U.S. Geological Survey, 2023d), Iowa Geological Survey (2022) GeoSam wells, and wetland habitat monitoring wells (Vern Rash, Des Moines Water Works, written commun., 2018) in the study area.
The Des Moines River flows approximately 845 km from its headwaters in southern Minnesota to its outlet at the Mississippi River in southeastern Iowa. The 2nd Avenue gage at the downstream end of the model area is 315 km upstream from the mouth of the river and has a drainage area of about 16,174 km2 (USGS, 2023a). In and upstream from the model area, the Des Moines River flows through the Des Moines Lobe (fig. 1), a relatively flat-to-irregular Iowa landform region characterized by knob and kettle topography formed by glacial deposition and retreat in the Wisconsin Glacial Period of the late Pleistocene (Prior, 1991). The bedrock surface in the area is the Middle Pennsylvanian-aged Cherokee Group, which consists of shale with some areas of coal and sandstone (Pope and others, 2002). Despite a small amount of groundwater withdrawal from local sandstone units in the Cherokee Group bedrock, the Cherokee Group is considered a hydrogeologic confining unit; the primary bedrock aquifers in use in the model area are the Mississippian aquifer, which is beneath the Cherokee Group, and the much deeper Cambrian Ordovician aquifer (Prior and others, 2003). Driller and strip logs from private bedrock wells in the study area indicate that the Cherokee Group is more than 100-feet (ft) thick with a uniformly shale surface (IGS, 2022).
Iowa has a subhumid continental climate characterized by extreme seasonal variations. Based on data collected from 1991 to 2020, the average annual temperature in Des Moines is 50.9 degrees Fahrenheit (°F), and monthly average temperatures range from a high of 76.3 °F in July to a low of 22.6 °F in January (National Oceanic and Atmospheric Administration, 2020). The average annual precipitation in Des Moines for 1991–2020 is about 36 inches per year. More than two-thirds of precipitation in the model area falls between April and September, generally peaking in June (National Oceanic and Atmospheric Administration, 2021). The model area includes parts of several cities with a mix of developed and agricultural land. Based on the 2020 U.S. Department of Agriculture (USDA) Cropland Data Layer, 49.8 percent of the model area is classified as developed, 23.0 percent as row crops, 12.8 percent as grass or pasture, 11.6 percent forested, 2.5 percent as open water, and 0.3 percent as barren land (USDA, 2020).
Previous Investigations
Previous numerical groundwater models in the region from Gannon (2011, 2013) and FitzGerald and others (2022) provide some insight into regional hydrogeology and material characteristics; however, these models do not include the part of the Des Moines River alluvial aquifer targeted in this report. Gannon (2011) modeled a part of the Des Moines River alluvial aquifer about 200 km upstream from the model area studied in this report. Gannon (2011) estimated drawdown and sustainable pumping rates in that region under various climate conditions and determined that induced recharge from the Des Moines River and its tributaries accounted for about 58 percent of water to the pumping wells during severe drought conditions, an increase from about 11 percent during normal rainfall conditions. The induced recharge from the river prevented high drawdowns at irrigation wells during severe drought conditions. Gannon (2013) modeled the lower Raccoon River alluvial aquifer (not shown) to identify source water capture zones, evaluate surface water and groundwater interaction, and estimate maximum sustainable well pumping rates in periods of drought. The Raccoon River is a tributary that discharges into the Des Moines River about 4 km downstream from the downstream outlet of the Des Moines River alluvial aquifer model presented in this report. Gannon (2013) determined that during periods of severe drought, an average of 81 percent of water withdrawn from the alluvial aquifer came from induced recharge in the river and nearby quarries, and the remaining 19 percent was sourced from precipitation recharge and groundwater inflow into the model area; however, this partitioning varied substantially between different well sites based on local aquifer characteristics. The alluvial aquifers in both Gannon studies consisted of sand and gravel underlain by less permeable bedrock or glacial till; however, although similar in material and climate to the Des Moines River alluvial aquifer, they lack the deeper buried valley aquifer that underlies and contacts the alluvial aquifer in this report.
FitzGerald and others (2022) described a steady-state numerical groundwater flow model developed as part of the present cooperative study between USGS and DMWW. The study area in FitzGerald and others (2022) is within the study area defined for this report and includes a smaller area along the downstream reach of the Des Moines River near Prospect Park (not shown) in Des Moines. The model was constructed to simulate the water table in the Des Moines River alluvial aquifer during low-flow conditions that typically happen during the winter months. The Prospect Park numerical groundwater flow model does not include the area of the Des Moines River alluvial aquifer that contacts the buried valley, which is where the DMWW RCWs are located. The Prospect Park numerical groundwater flow model and supporting data are available in the USGS groundwater model data release associated with FitzGerald and others (2022; Ha, 2022).
Geophysical Methods
Geophysical data collected in 2018 were used to help characterize lithologic boundaries and hydrologic parameters within the study area. Land-based surveys including electrical resistivity tomography (ERT) and horizontal-to-vertical spectral ratio (HVSR) were used to investigate bedrock depth and topography at several sites in the Des Moines River floodplain; waterborne continuous resistivity profiling (CRP) and continuous seismic profiling (CSP) were used to investigate the subsurface beneath the Des Moines River. These datasets and method explanations are available in a USGS data release (Gruhn and others, 2021).
The ERT survey method measures apparent electrical resistivity of the subsurface beneath a survey line and yields a two-dimensional profile of electrical resistivity for that location. Processed and inverted ERT profiles can be interpreted to locate geologic contacts and characterize subsurface topography (Loke, 2000). HVSR surveys measure vertical and horizontal components of ambient seismic noise. These data were processed using methods described in Koller and others (2004) to find the subsurface resonance frequency at the survey location. Sediment thickness was calculated from the determined subsurface resonance frequency using the methods described by Johnson and Lane (2016) and a seismic velocity of 150 meters per second (m/s). HVSR measurements were made at intervals along each of the ERT transects, and at other sites in the Des Moines River floodplain. Boreholes drilled at three of the ERT survey sites gave bedrock depth that was used to calculate seismic velocity for the HVSR processing and help interpret ERT results (Gruhn and others, 2021).
Waterborne geophysical surveys (CRP and CSP) were done on the Des Moines River and part of Beaver Creek in the model area to determine the elevation of the top of the streambed and characterize the material that make up the streambed (Gruhn and others, 2021). Georeferenced CRP and CSP data were collected simultaneously during three surveys and processed with the methods described in Gruhn and others (2021). As with land-based ERT, the apparent resistivity measured by CRP is a function of the composition of the subsurface material, and the quantity and chemistry of pore water (Johnson and White, 2007). Based on these criteria, CRP data for the top meter of the streambed material was used to determine the relative spatial variation in streambed hydraulic conductivity for the part of the Des Moines River included in the waterborne geophysical surveys. Applying the CRP survey data to the variation on streambed hydraulic conductivity is discussed further in the “Boundary Conditions and Flow Processes” section of this report.
Conceptual Model and Hydrogeologic Framework
A simple conceptual model of the landscape, its hydrogeologic materials, and water budget components was developed to illustrate the hydrogeologic framework and describe groundwater inflows and outflows for the study area (fig. 3). Bedrock and surficial sediments in the model area were conceptualized as six layered hydrogeologic units. Four of the hydrogeologic units are based on Quade and others (2003): (1) a surface layer with soil or fill (subdivided based on mapped surface material); (2) Des Moines River alluvial deposits; (3) glacial outwash sand and gravel; and (4) glacial till. The remaining two units are (5) buried valley alluvium (described in Bettis and Hoyer, 1986) and (6) shale bedrock (Pope and others, 2002). The lateral extents and vertical stratigraphy of these hydrogeologic units in the model area were conceptualized using mapping completed by Quade and others (2003), hydrogeologic unit descriptions from Bettis and Hoyer (1986), and well logs from the IGS’s well database (GeoSam; IGS, 2022). Three hydrogeologic units are primarily considered as aquifers in the model area: (1) Des Moines River alluvial deposits, (2) glacial outwash sand and gravel, and (3) buried valley alluvium. The glacial till and bedrock hydrogeologic units are less permeable and are considered as confining units in the model area.
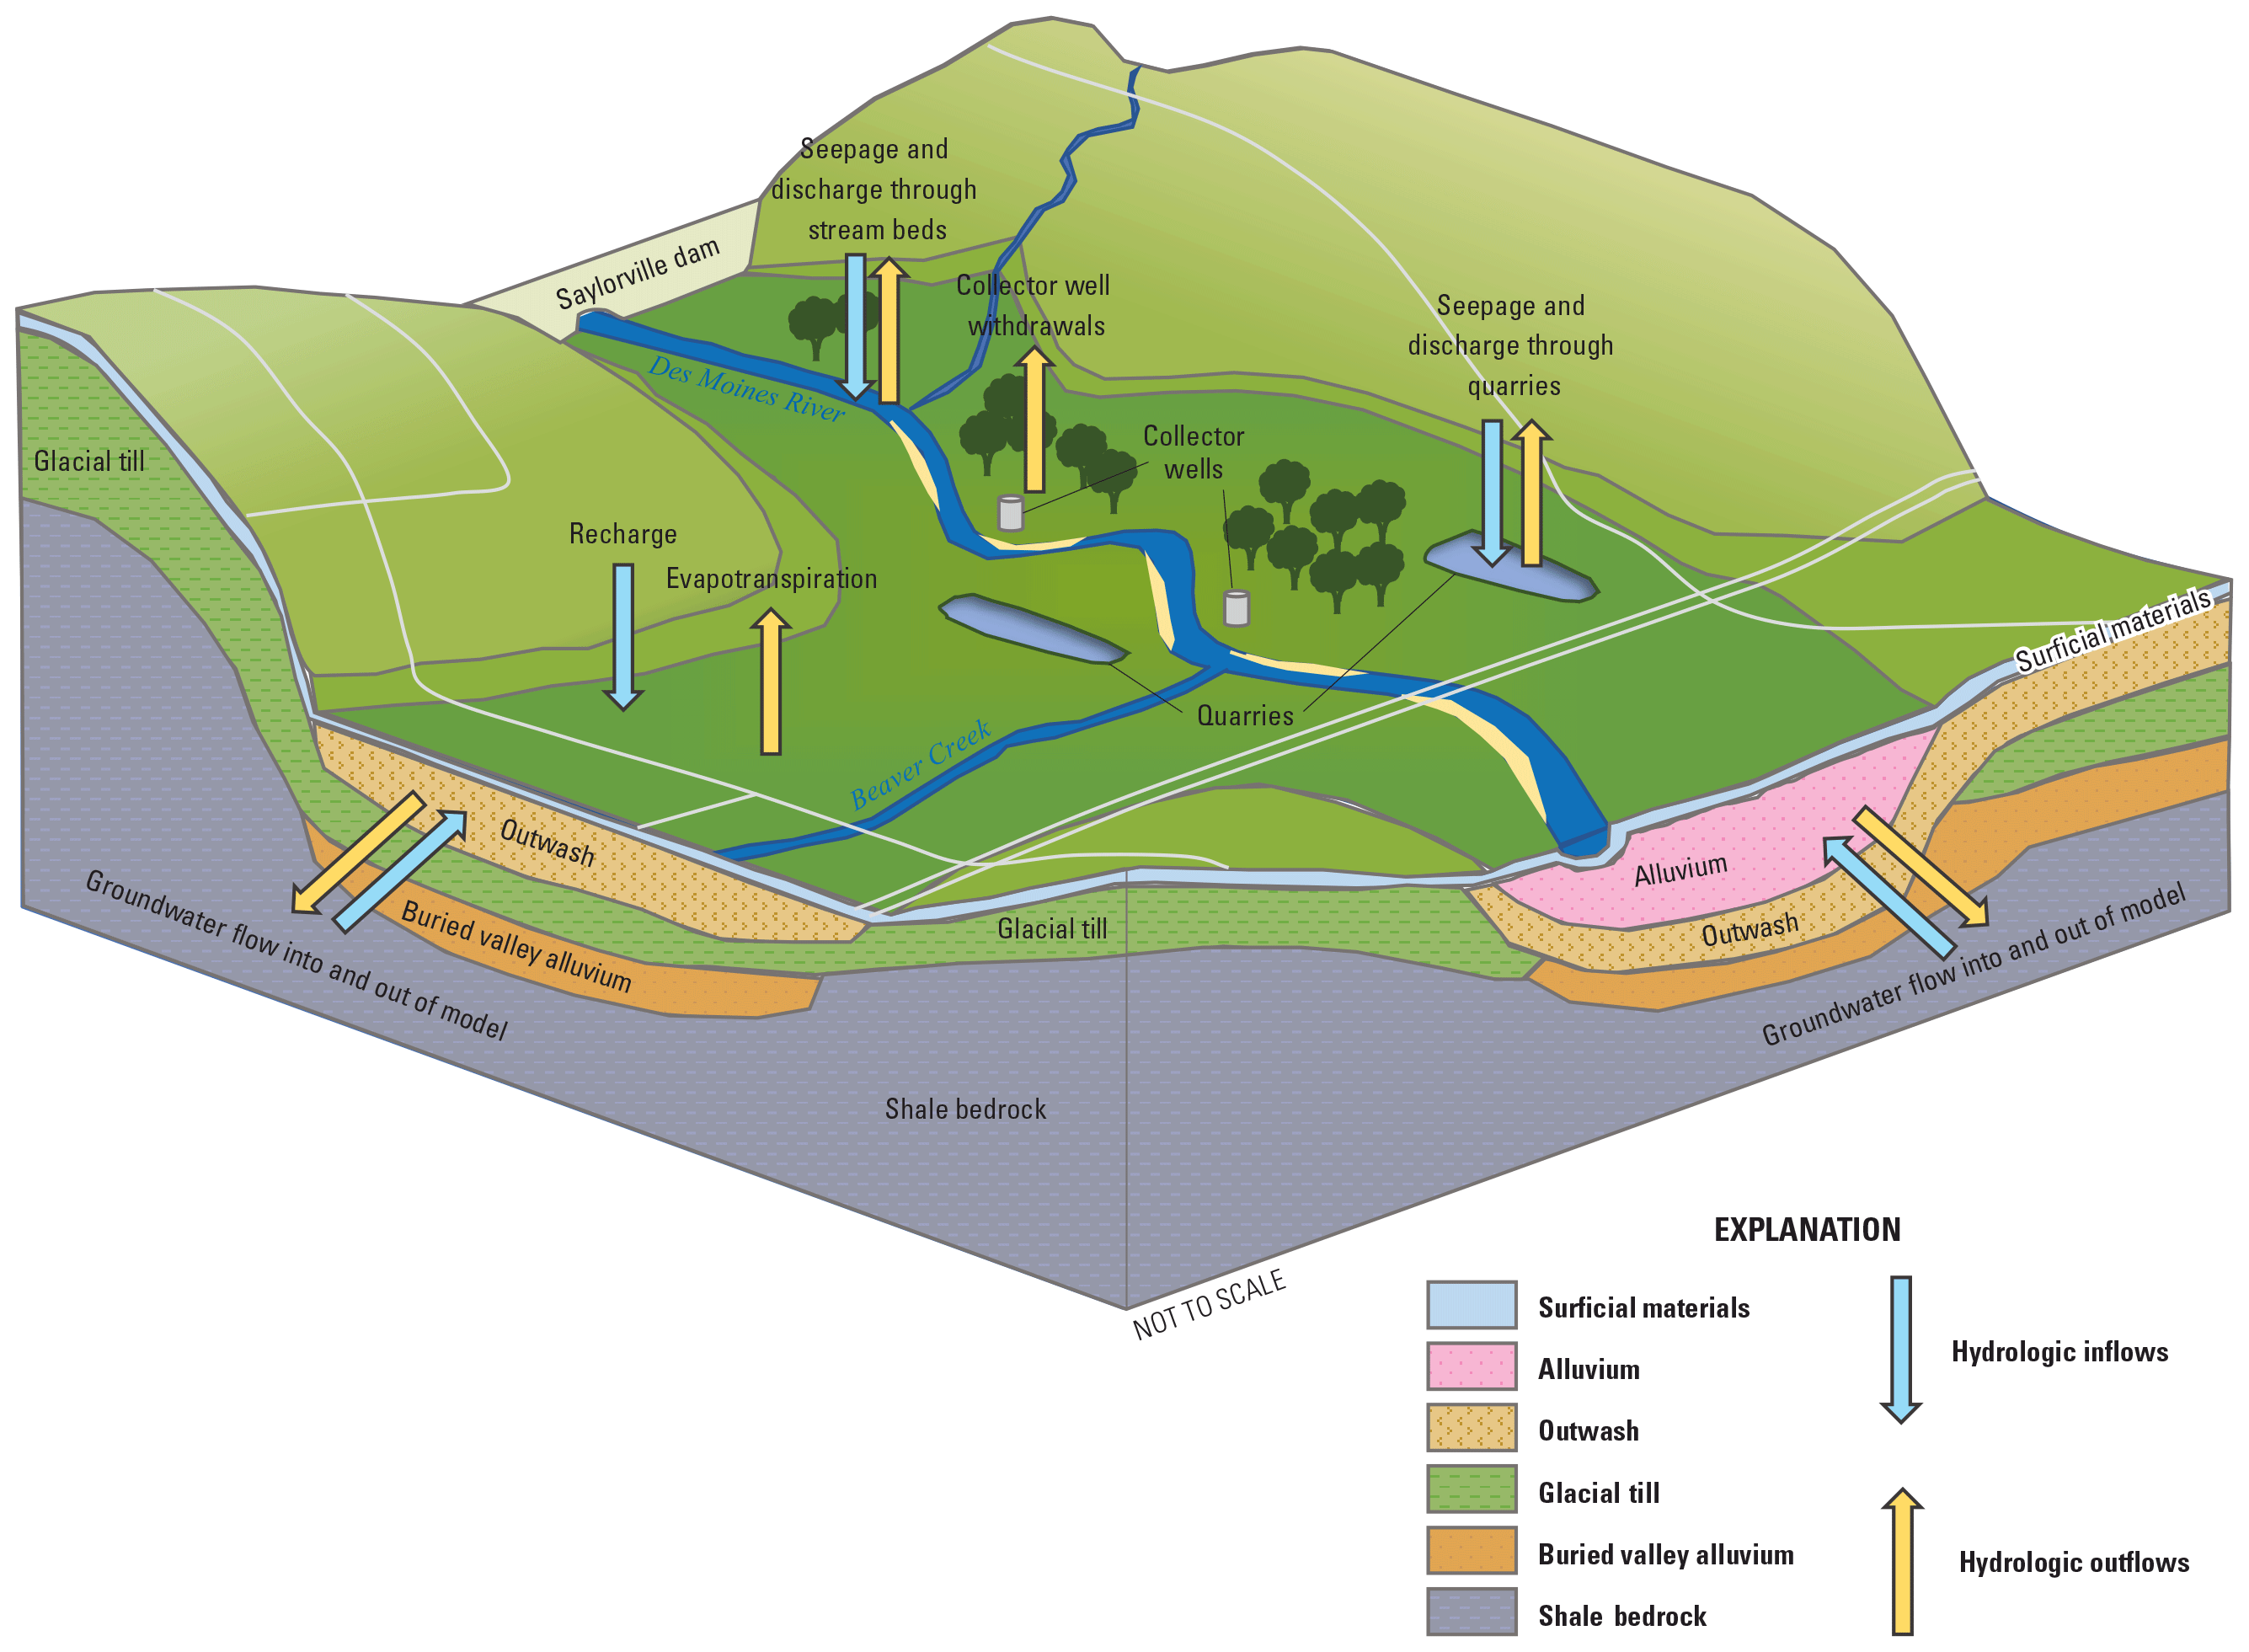
Representation of the conceptual model for six hydrogeologic units in the study area near Des Moines, Iowa.
The buried valley alluvium in this report is in a buried bedrock valley that intersects the study area trending from northwest to southeast. The buried valley underlies the Beaver Creek valley in the northwestern part of the model area, crosses beneath the Des Moines River, and continues toward the southeast (Bettis and Hoyer, 1986). The buried valley contains ancient alluvial and glacial deposits, including an upper sequence of sand and gravel glacial outwash overlying glacial till with relatively low permeability and a lower sequence of sand and gravel. Bettis and Hoyer (1986) conclude that the buried valley is an abandoned pre-Wisconsinan segment of the ancient Des Moines River channel and acted as an outwash channel when the Des Moines Lobe icesheet was present. This buried valley extends beyond the boundary of this model in the northwest and southeast.
From the Saylorville Dam outlet to just downstream from Interstate 80 (fig. 1), the Des Moines River has a relatively wide floodplain with three distinct alluvial terraces. The alluvium in this area overlies the older sand and gravel units like those in the buried valley (Bettis and Hoyer, 1986). The morphology of Beaver Creek valley, the buried valley, and the upstream reach of the Des Moines River was created by erosional and depositional glacial processes that carved valleys into bedrock and deposited sand and gravel that now underlie alluvium and other surficial materials. Unlike in the buried bedrock valley where the outwash and buried valley alluvium aquifer units are separated by glacial till, in the Des Moines River floodplain the till has been eroded away and the buried alluvium directly underlies glacial outwash and Des Moines River alluvial deposits, and the three aquifer units are vertically hydraulically connected (fig. 3). The Des Moines River valley has narrower geometry and lacks buried glacial sand and gravel deposits in its downstream reach, from just downstream from Interstate 80 to the outlet of the river at the southern model boundary. This indicates that the glacial processes active upstream did not happen in this downstream part (Bettis and Hoyer, 1986). The uplands and valley walls beyond the Des Moines River floodplain and outwash channel are composed of low-permeability glacial till sitting on bedrock (Quade and others, 2003).
All groundwater inflows and outflows that correspond to the hydrologic inputs and outputs for the numerical model were included as part of the conceptual model. Sources of recharge to the groundwater system (groundwater gains) in the model area include seepage from streams (streamflow loss) and water-filled quarries, infiltration of precipitation, and groundwater inflow from outside of the model area. Sources of discharge from the groundwater system (groundwater losses) include groundwater seepage to streams (streamflow gain) and quarries, groundwater evapotranspiration (ETg), withdrawals from wells, and groundwater outflow out of the model area. The bottom of the model and topographic highs bounding the model area laterally are conceptualized as no-flow boundaries. Hydrologic boundaries represented in the conceptual model include streams (Des Moines River, Beaver Creek, and their tributaries), quarries, and places where groundwater flows in and out of the model domain (at the upstream end of the Beaver Creek valley, the downstream end of the Des Moines River valley, and where the buried valley intersects the model boundary). The regional potentiometric surface in the model area generally follows land surface topography, and groundwater flows toward the Des Moines River (Gannon, 2011).
Hydrogeologic Framework
A hydrogeologic framework is a three-dimensional model of the hydrogeologic units within the model area, and of their hydrologic inflows and outflows and interconnections. The framework was constructed using the hydrogeologic units and water budgets from the conceptual model, along with bedrock elevation data, maps of surficial geology and soil types, previously published hydrologic characteristics, well drillers’ logs, and geophysical survey data (Pope and others, 2002; Quade and others, 2003; Witzke and others, 2010). The framework was discretized to the numerical model grid with 60-meter (m) square cells.
Hydrogeologic Units as Model Layers
The hydrogeologic framework consists of the six hydrogeologic units described in the conceptual model: (1) surficial materials, (2) Des Moines River alluvium, (3) glacial outwash, (4) glacial till, (5) buried valley alluvium, and (6) bedrock. These hydrogeologic units were incorporated as distinct layers in the hydrogeologic framework and numerical model. Hydrologic parameter zones were assigned to each layer; the glacial outwash, glacial till, and bedrock layers contain only one zone each, whereas surficial materials, alluvium, and buried valley alluvium layers were subdivided into multiple hydrogeologic zones based on compositional or landform variations within the layer.
Layer 1: Land-Surface Material
The top model layer (layer 1) represents the hydrogeologic materials that exist at the land surface in the model area (fig. 4). The top elevation of this layer was determined using the average land surface elevation over the 60-m model cell size from a digital elevation model (DEM; Iowa Geospatial Data, 2022) The bottom elevation for layer 1 was set to the top of the underlying units. Median thickness for the surface layer is 2.0 m, with a range from 1.0 m to 53.0 m. In most areas of the model, surficial deposits are conceptualized as 2.0 m thick. In general, the cells in layer 1 with high thickness are cells representing Saylorville Dam (where the full height of the dam down to bedrock is included in layer 1) and in some surface stream cells (where layer 1 was thickened to accommodate a reasonable stream gradient along streamflow paths). Layer 1 was delineated into four hydrogeologic zones based on general soil permeability classifications: alluvial and outwash-based soils (zone 1), till-based soils (zone 2), areas of fill (zone 3), and quarries (zone 4). Although quarries were delineated as a separate hydrogeologic zone within layer 1, they were ultimately represented in the model using a separate boundary condition package and so zone 4 was not included in model parameterization.
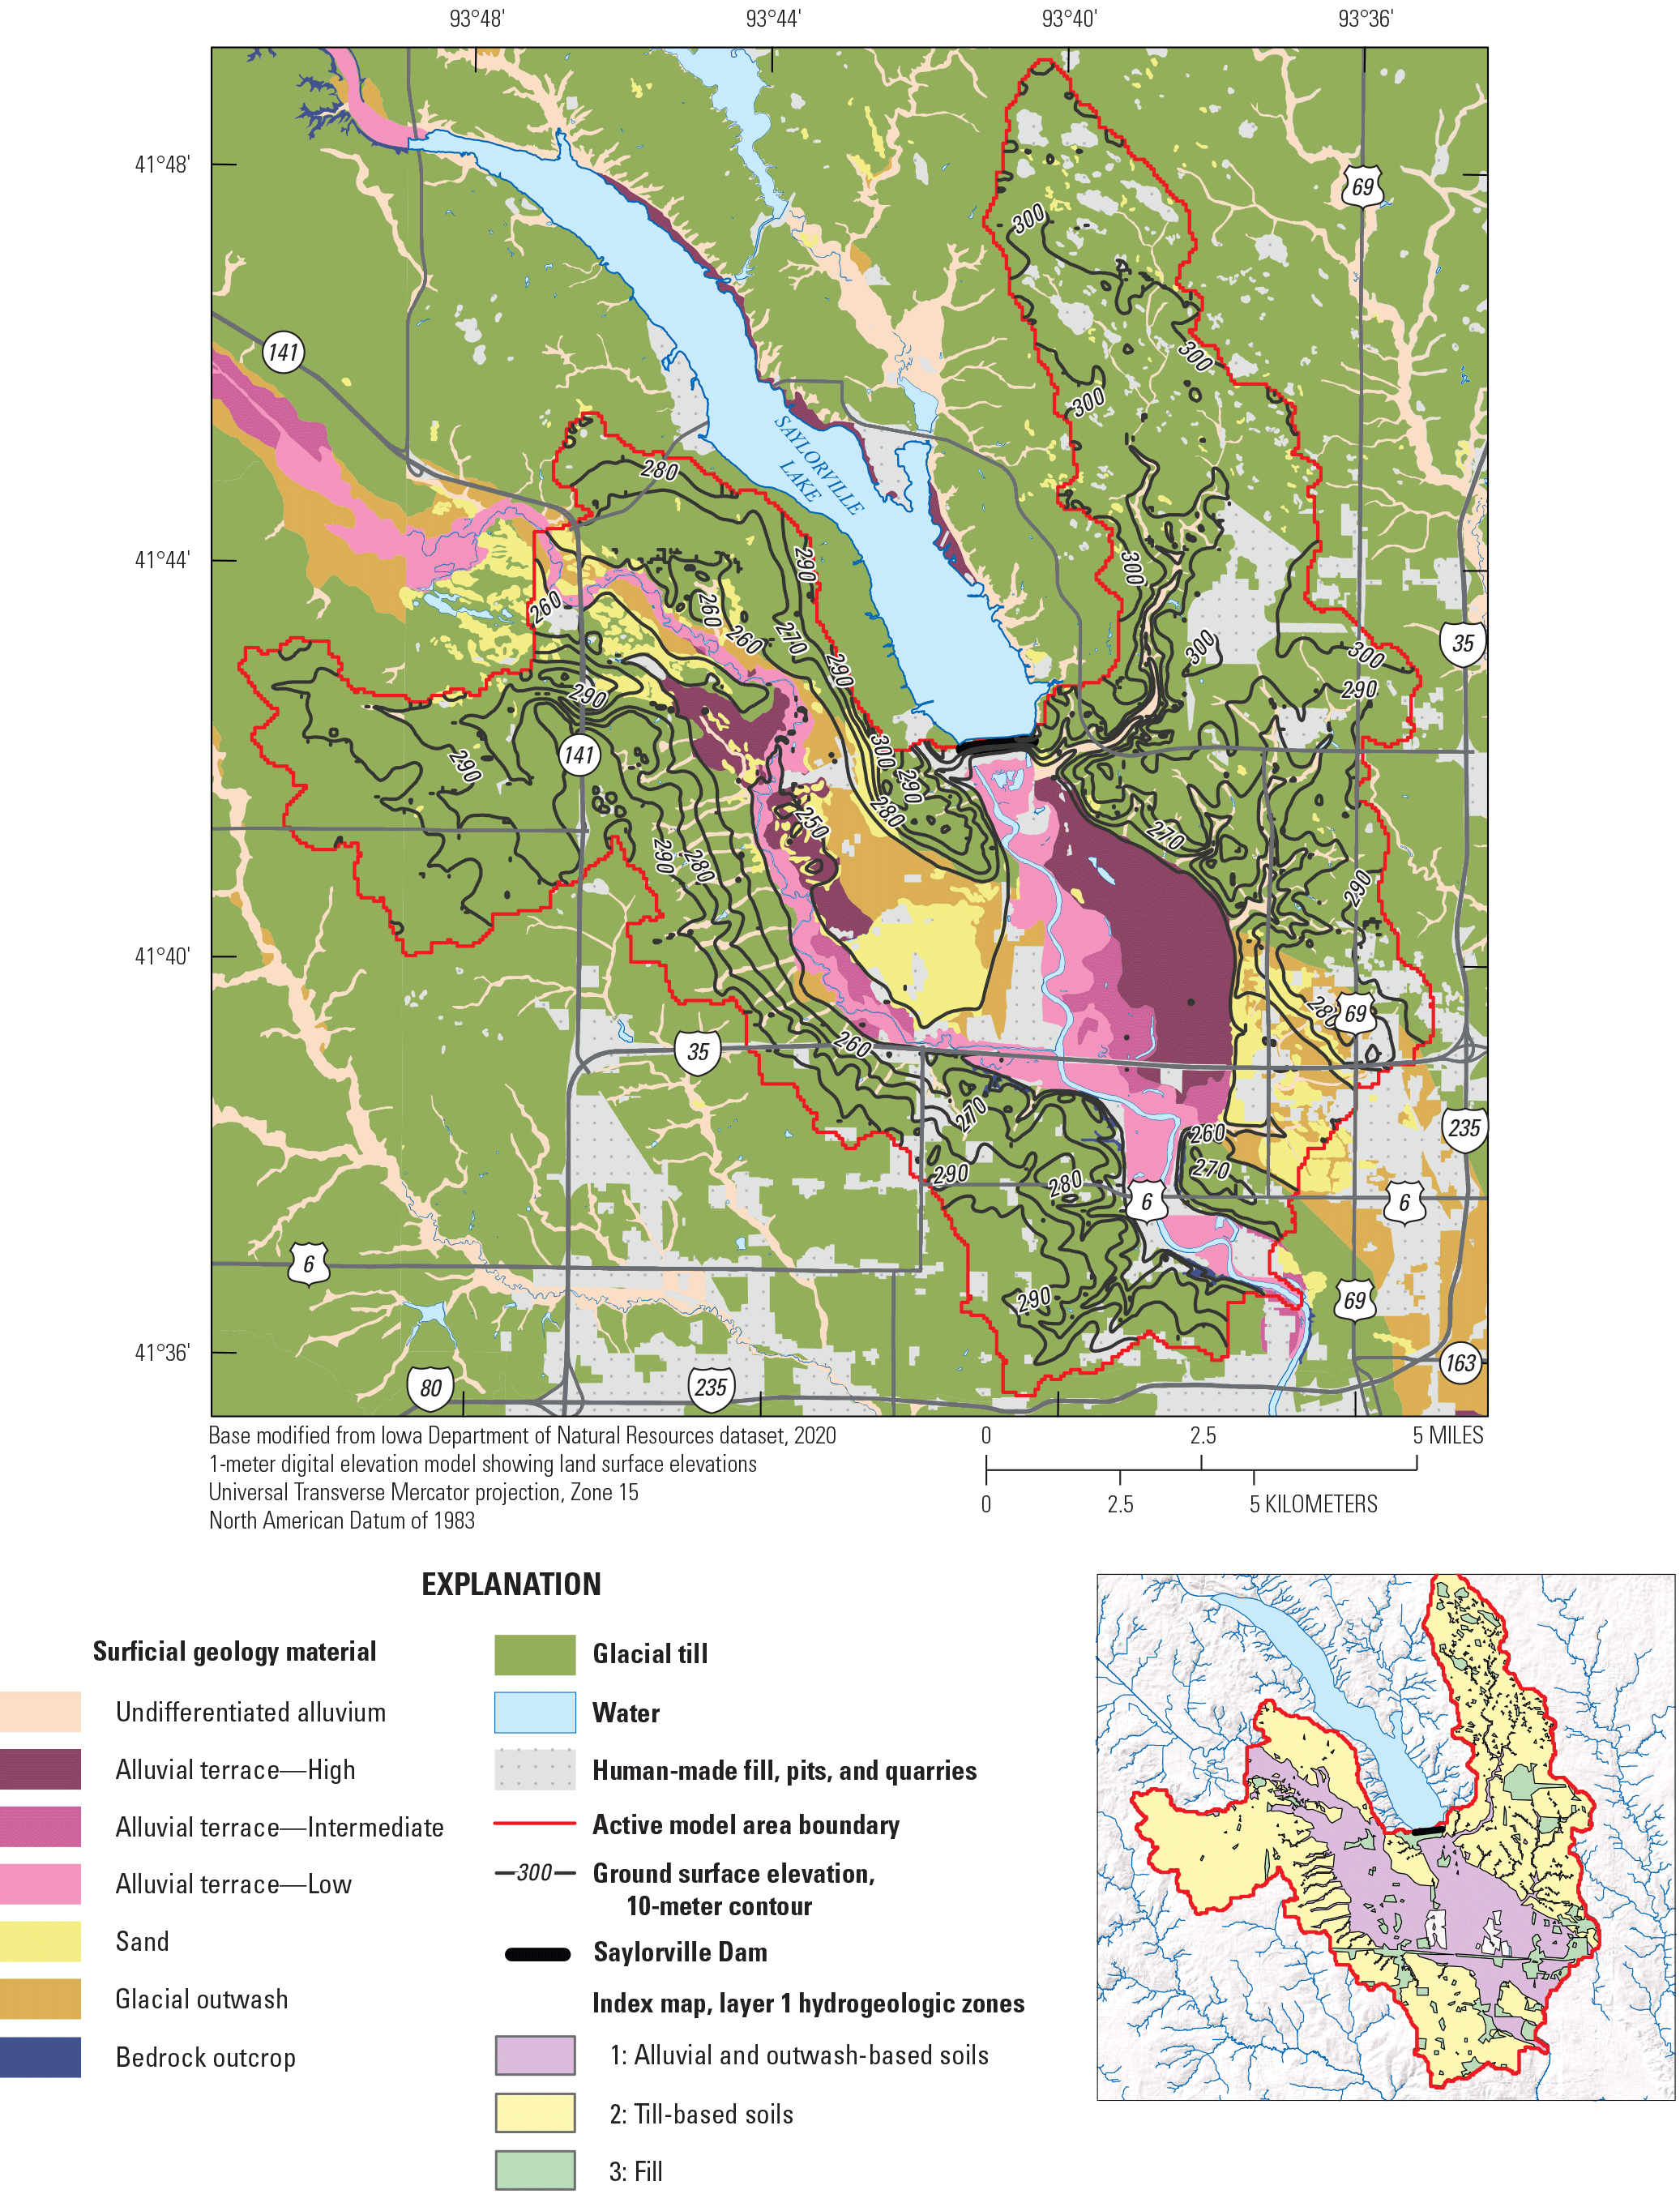
Elevation contours of layer 1 (surface materials) and surface geologic materials in the model area, from Soil Survey Staff (2022) and Quade and others (2003).
Layer 2: Des Moines River Alluvium
Layer 2 is the top layer of alluvium in the Des Moines River alluvial plain and consists primarily of Holocene-age sediments that were deposited by the Des Moines River (fig. 5). This unit was subdivided into three hydrogeologic zones: low (zone 5), intermediate (zone 6), and high (zone 7) alluvial terraces identified as the DeForest Formation in Quade and others (2003). DeForest Formation alluvial terraces are described as 1ؘ–5 or 7 m of silty clay loam, clay loam, or loam overlying the Noah Creek formation (Quade and others, 2003; glacial outwash sand and gravel). This material was delineated within the Des Moines River alluvial plain only. Beaver Creek also has associated alluvium deposits, but in this model, these are included in the surface material layer because well lithology logs indicate that the Beaver Creek alluvium is relatively thinner than the alluvium associated with the Des Moines River. This unit is part of the Des Moines River alluvial aquifer, along with underlying older sands and gravels.
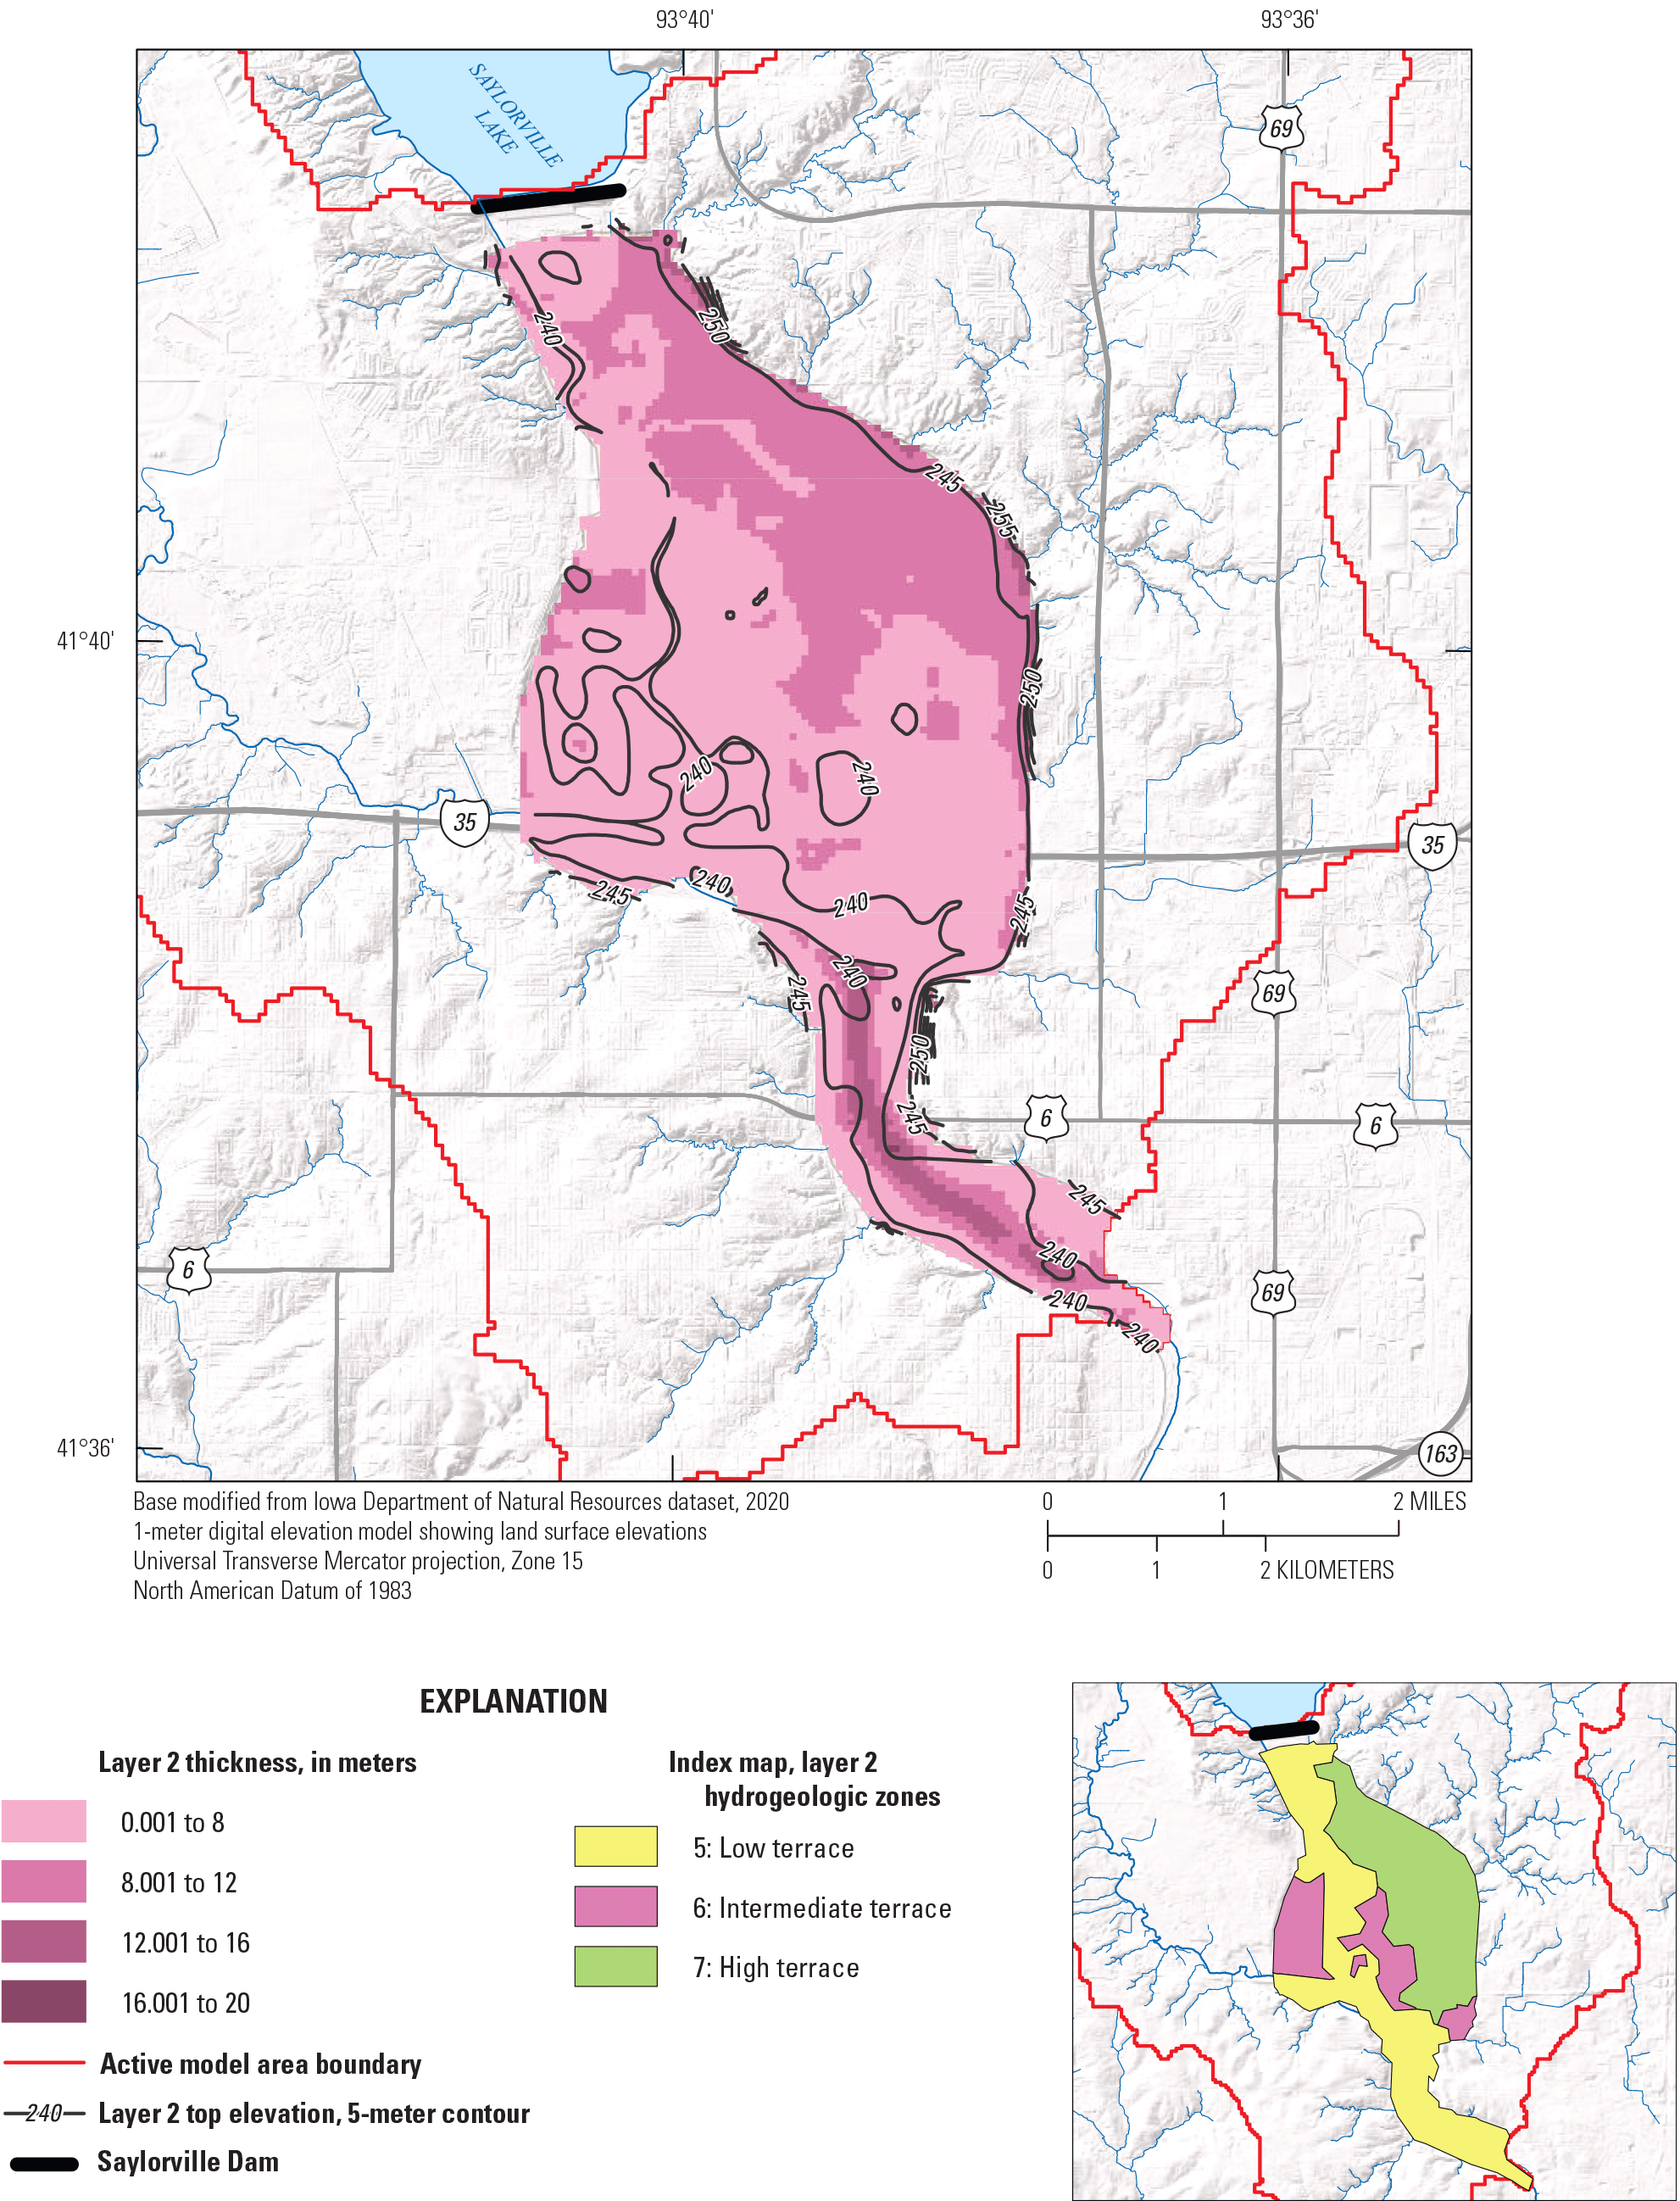
Top elevation, thickness (meters), and extent of layer 2 (Des Moines River alluvium) in the model area, modified from Quade and others (2003).
The surface elevation of this unit was set to 3 m beneath a smoothed land surface DEM sampled to a 60-m raster grid, with a median elevation of 242 m. In the upstream part of the Des Moines River alluvial plain within the model, where the valley is relatively wide, alluvium overlies older glacial outwash sand and gravel and, in some areas, buried valley alluvium. Elevation data for these lower units are sparse, so the alluvium unit bottom elevation was fixed to 234 m in most cells and higher only where necessary to accommodate higher bedrock elevation.
Layer 3: Glacial Outwash
Layer 3 in the model represents glacial outwash deposits in the Beaver Creek valley and buried valley outside of the Des Moines River valley. Glacial outwash in this model is identified as the Noah Creek formation, described as 3–15 m of coarse-grained sand and gravel overlying Dows formation glacial till or bedrock (fig. 6; Quade and others, 2003). In the glacial outwash channel and Beaver Creek valley, this unit overlies a layer of fine-grained massive glacial till. Glacial outwash also is present in the river valley, where outwash overlies either bedrock or buried valley alluvium. For this model, glacial outwash in the Des Moines River valley has been included with buried valley alluvium in layer 5. The glacial outwash and buried valley alluvium are distinct units with separate depositional histories, and outside of the river valley they are separated by a layer of glacial till; however, within the Des Moines River Valley these units are in direct contact and form a single aquifer (along with the overlying more modern alluvium). Additionally, glacial outwash in the Des Moines River valley has greater thickness and depth than the glacial outwash assigned to the Beaver Creek valley and the buried channel outside the river valley, and the glacial outwash in the river valley is horizontally and vertically disconnected from these other outwash deposits. Glacial outwash within the Des Moines River valley was therefore modeled as a single unit with underlying buried valley alluvium (layer 5) to better represent the layer connectivity in the numerical model.
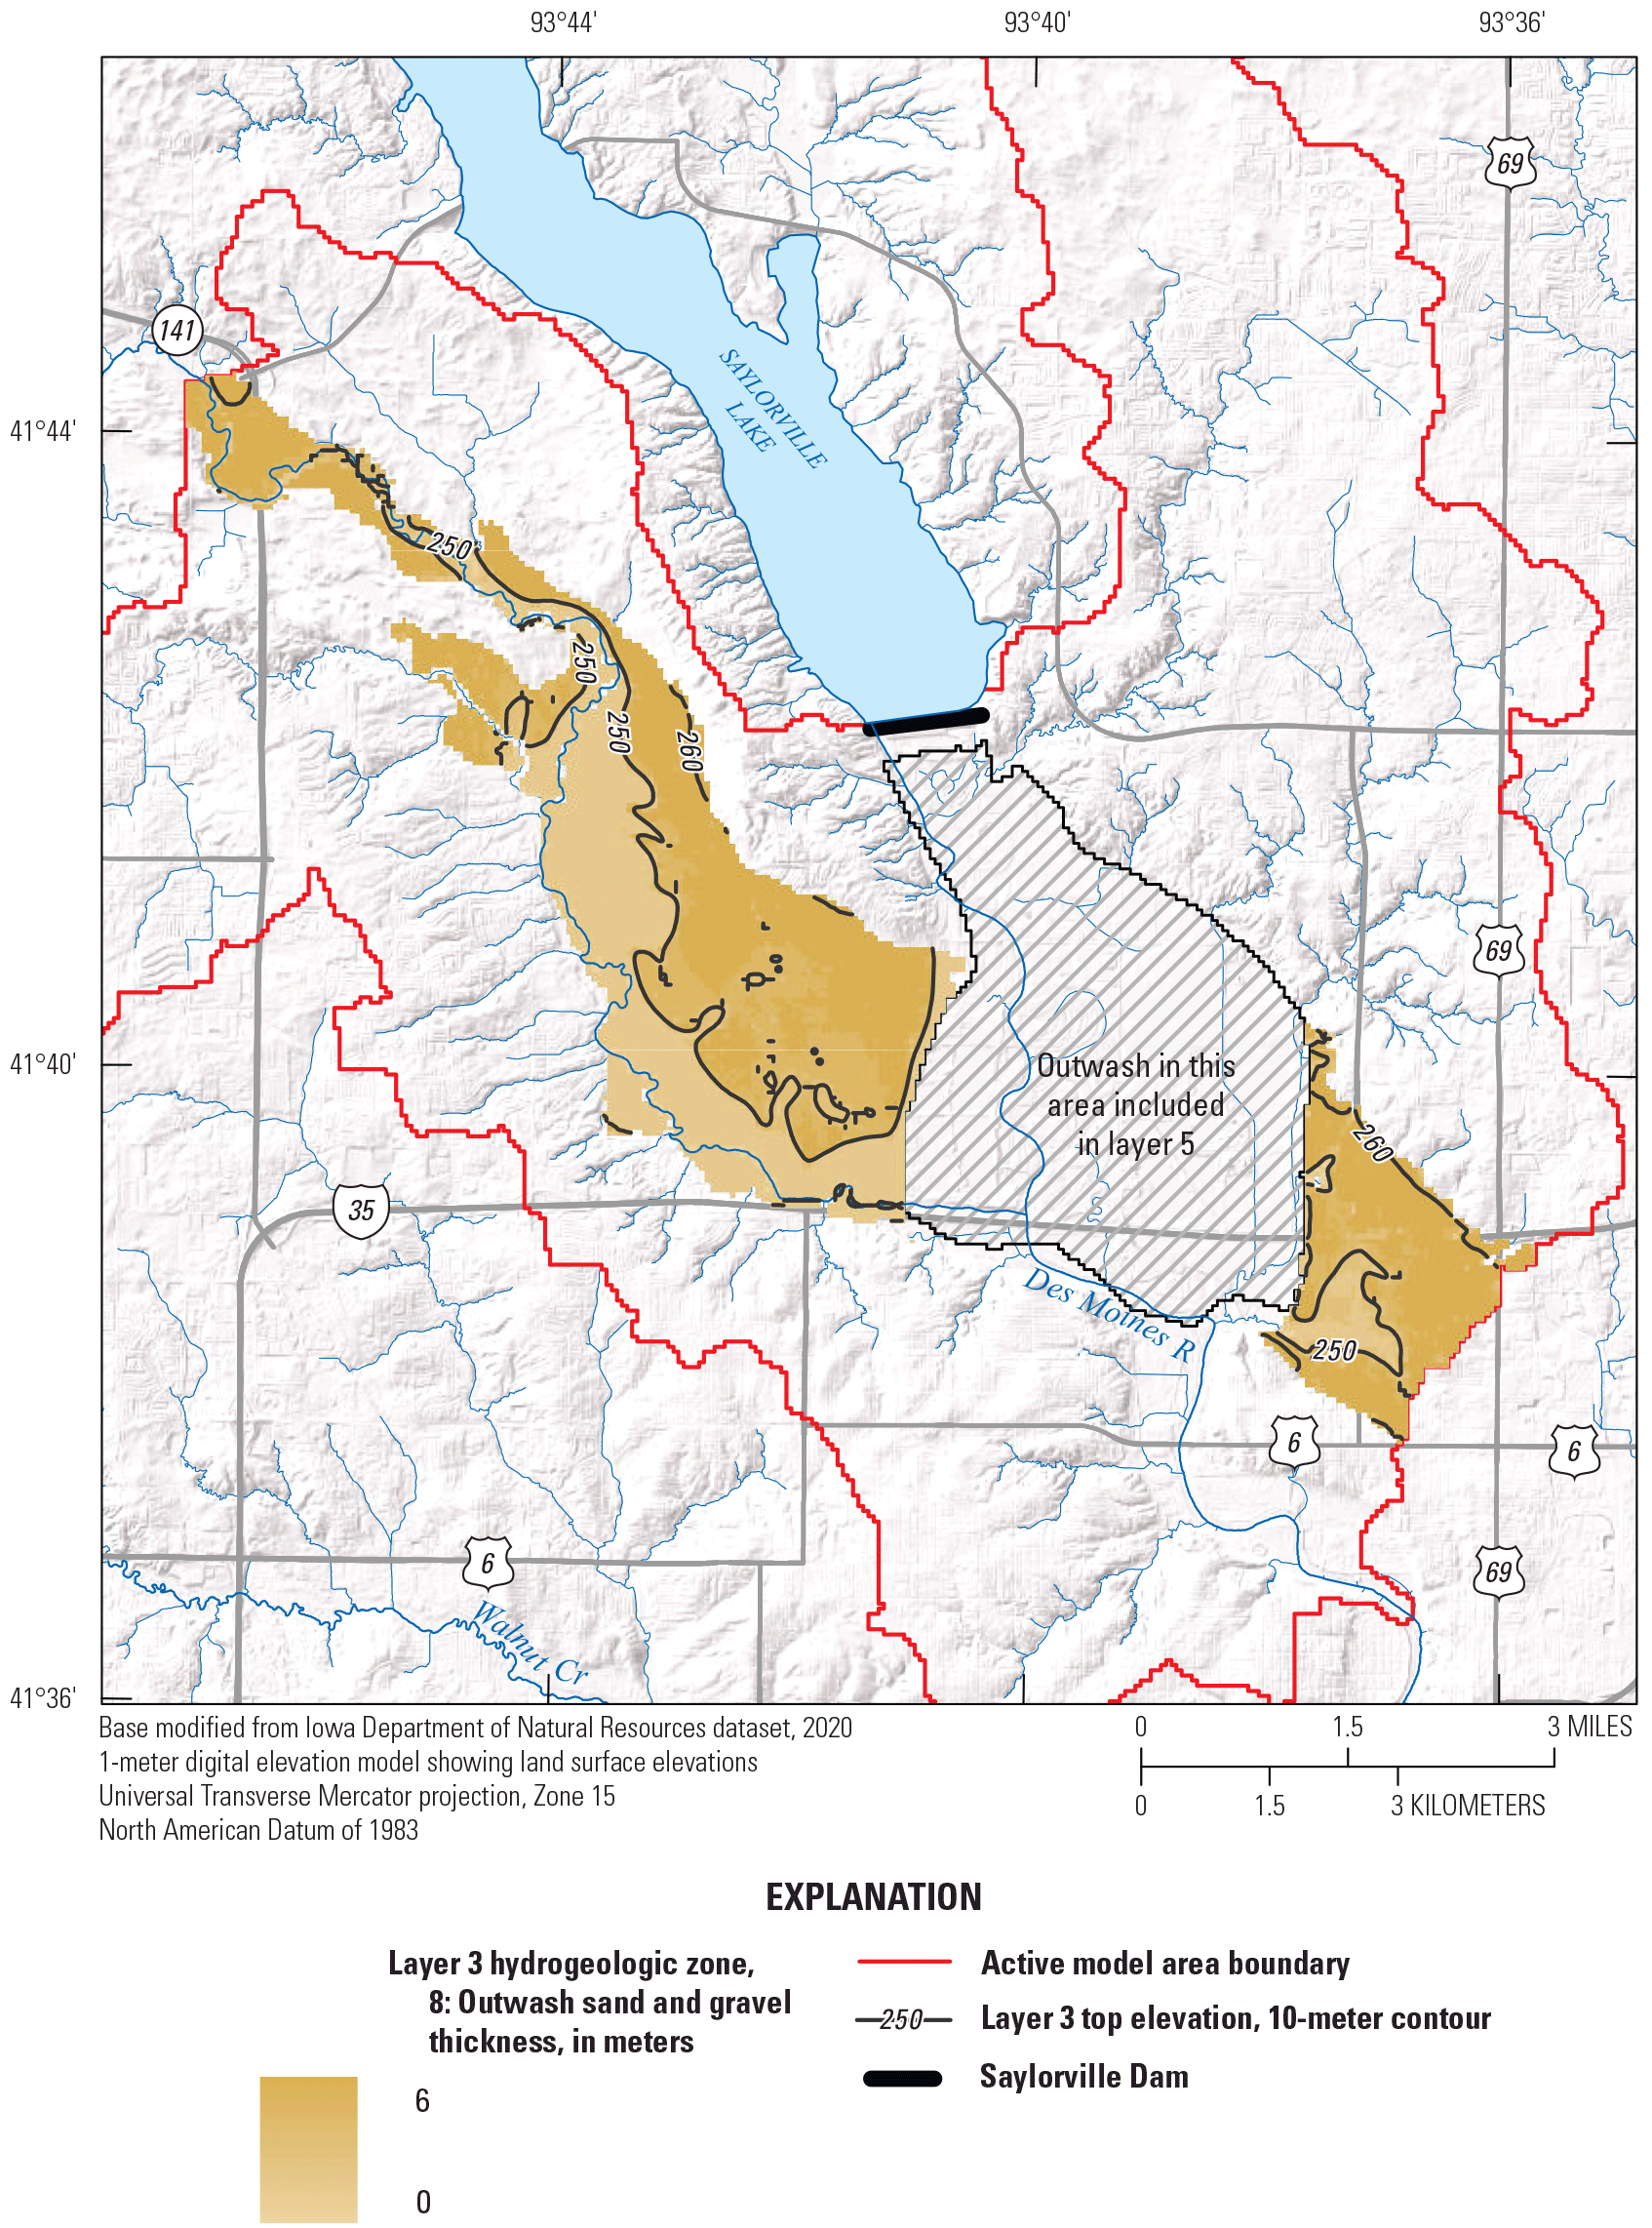
Thickness and extent of layer 3 (glacial outwash) in the model area, modified from Quade and others (2003).
Outside of the Des Moines River valley, the outwash surface elevation was set to 2 m below a smoothed land surface elevation grid, and the base elevation was set to the surface elevation of the underlying till unit. The outwash was pinched out in areas where shallow depth to bedrock prevented at least 1 m of unit thickness. Layer 3 contains only one hydrogeologic zone (zone 8).
Layer 4: Glacial Till
Layer 4 in the model represents Wisconsin-age glacial till that underlies uplands surrounding the Des Moines River valley and parts of lowland areas (Quade and others, 2003). Quade and others (2003) identified this as the Dows formation and describes different Dows formation subunits within the bounds of this model, each consisting of surface sediments overlying massive, dense loam diamicton (till). For the purposes of this model, these units are combined into one homogenous glacial till material, and the associated surficial sediments form part of the surface layer of the model (fig. 7).
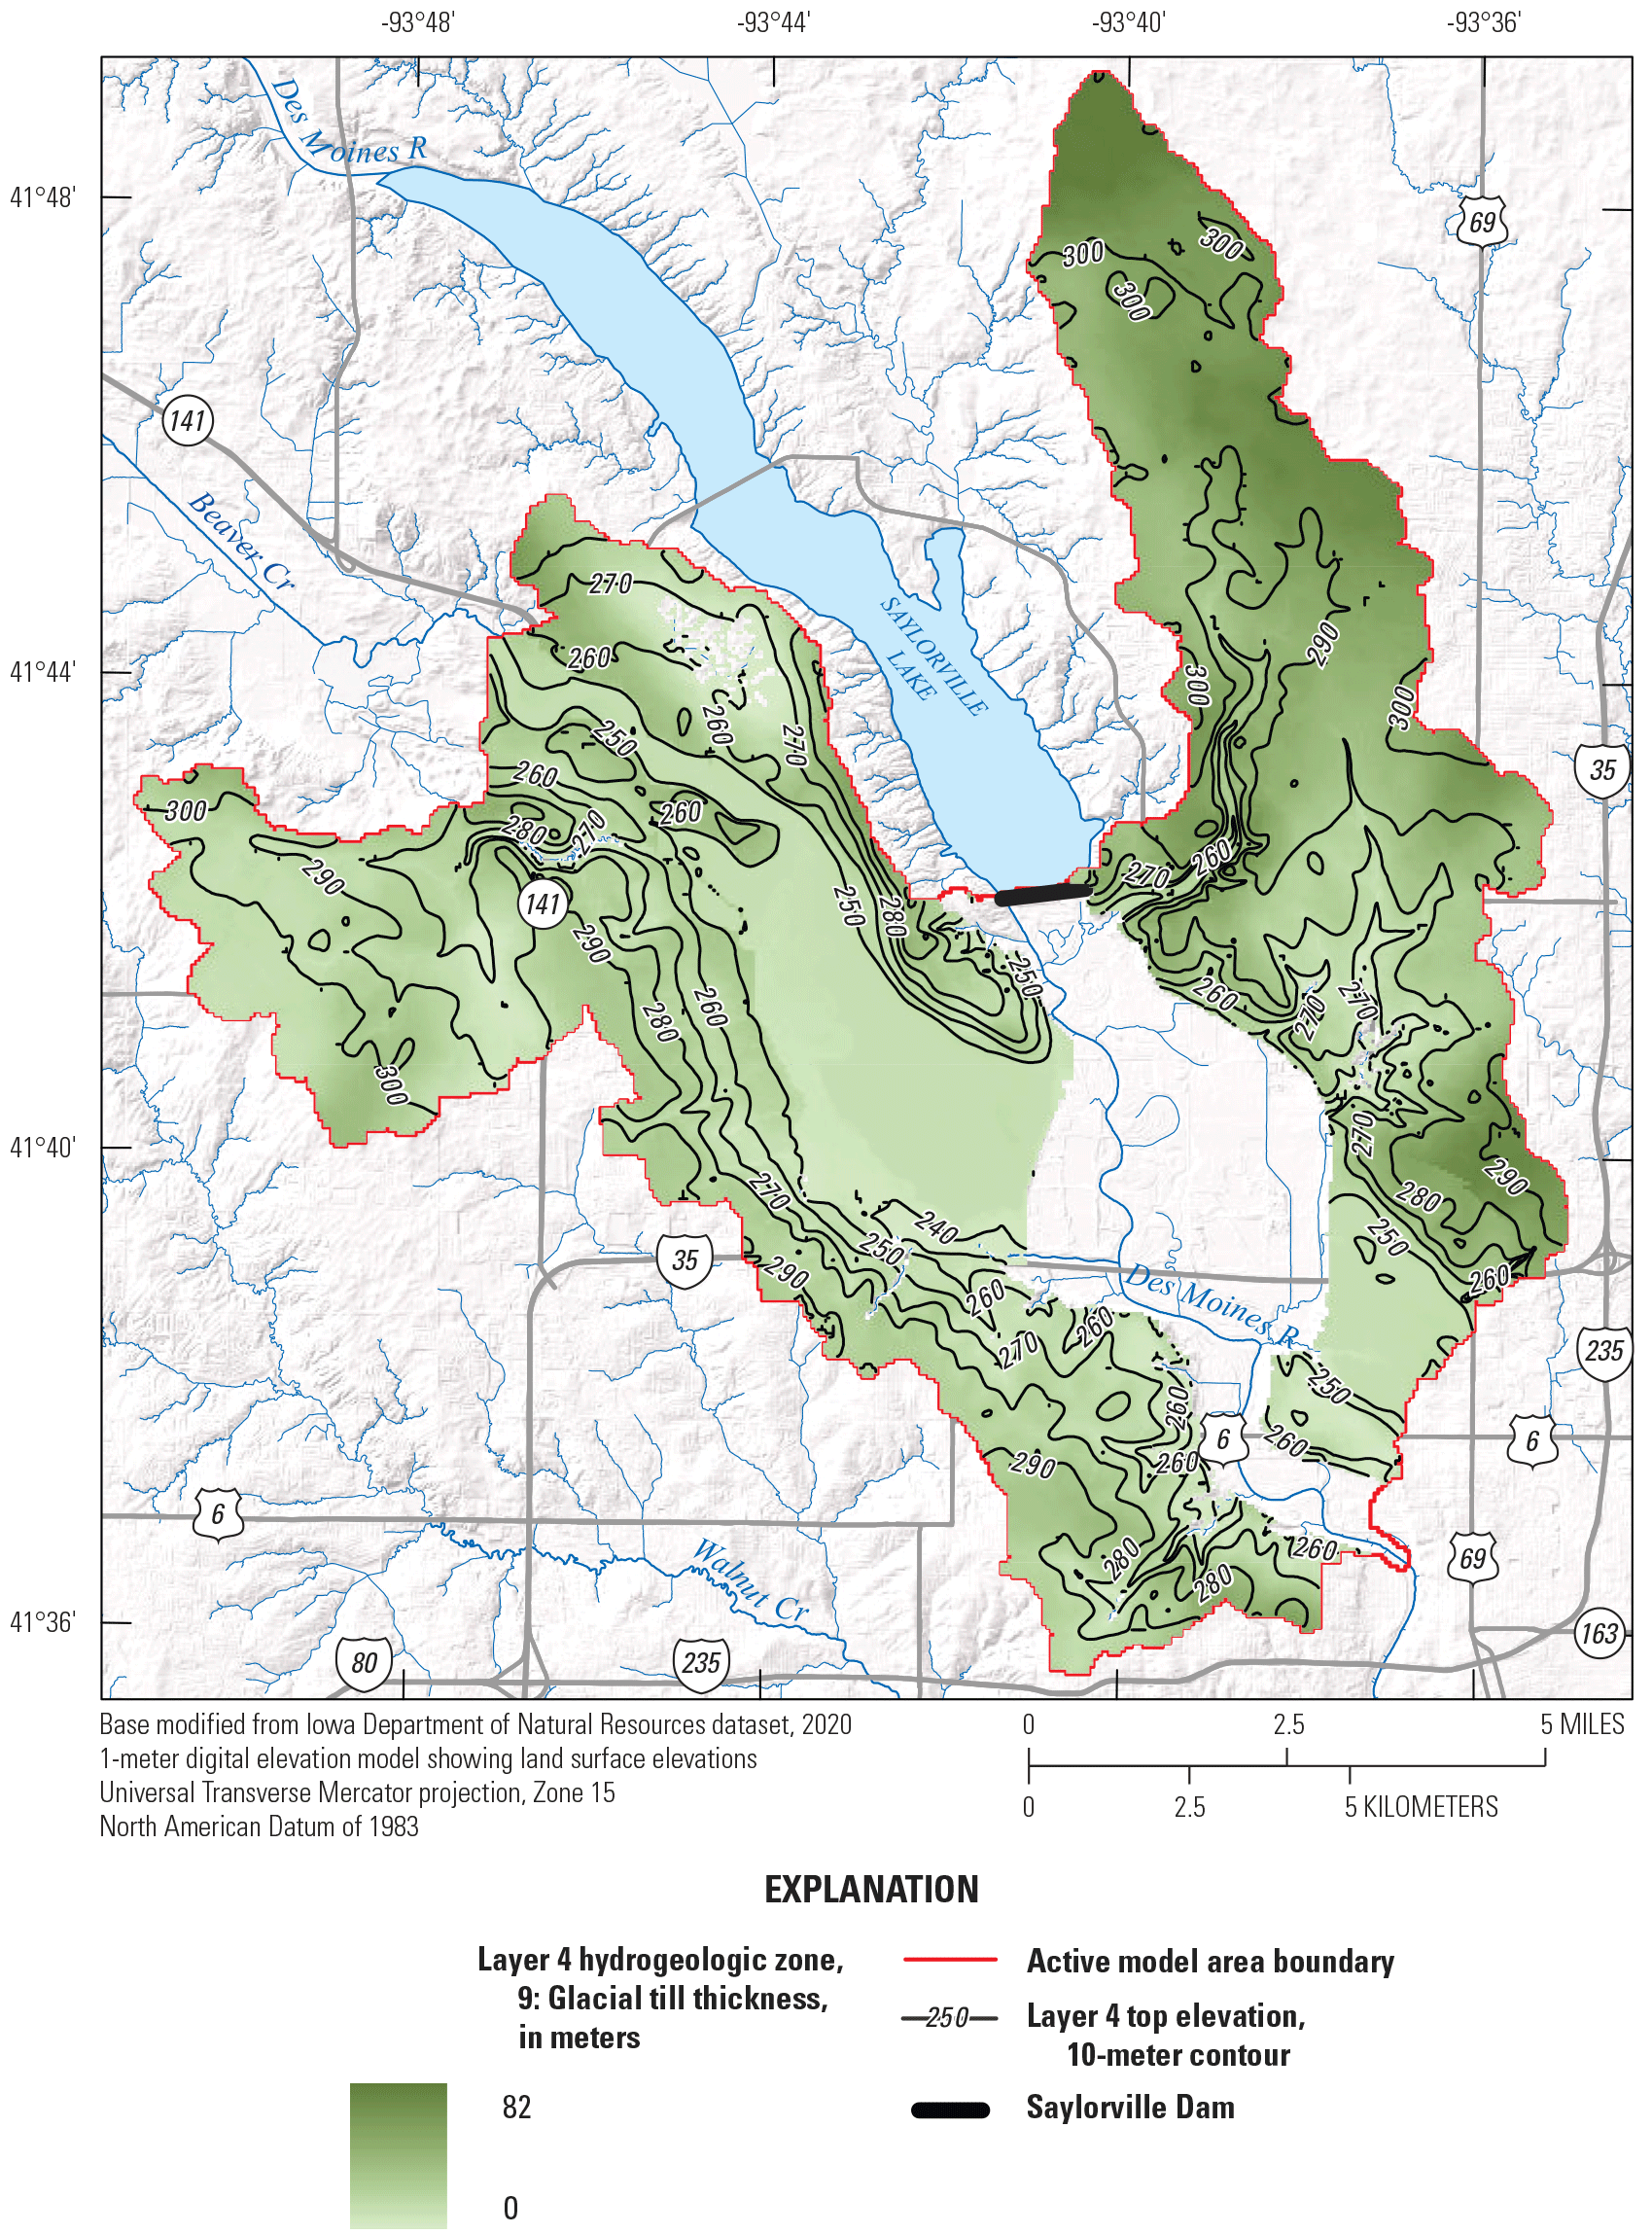
Thickness and extent of layer 4 (glacial till) in the model area, modified from Quade and others (2003).
Glacial till is present throughout the model except in the Des Moines River alluvial plain and in places where shallow depth to bedrock precludes adequate accommodation space for till. In the upland areas, glacial till top elevation was set to 2 m below a smoothed surface DEM and adjusted to maintain at least 2 m for the overlying surficial materials model layer. Till bottom elevation in uplands was set to the bedrock surface, and the unit was set to zero thickness in any cell where it was not possible to have at least 1 m of thickness. In the Beaver Creek valley and the buried valley areas, the surface elevation of the till unit was initially fixed at 247 m then adjusted to be no more than 8 m or less than 4 m lower than the smoothed land surface. As with upland cells, till thickness was set to zero in cells without accommodation space for at least 1 m of till. Layer 4 contains only one hydrogeologic zone (zone 9).
Layer 5: Buried Valley Alluvium
Layer 5 represents a layer of pre-Wisconsinan alluvial sand and gravel at the bottom of the Quaternary sequence, overlying the shale bedrock of the buried channel that underlies Beaver Creek valley in the study area and extends into the southeast part of the model area (fig. 8). This buried channel and its sand and gravel fill have been noted in a geologic study (Bettis and Hoyer, 1986) and in well lithologic logs from the area (IGS, 2022). In most places, this buried channel deposit is overlain by glacial till and another sequence of sand and gravel outwash (the Dows and Noah Creek formations); however, where the buried channel deposit crosses the Des Moines River valley, the glacial till layer is absent and this buried channel alluvium directly contacts overlying outwash sand and gravel or more modern alluvium.
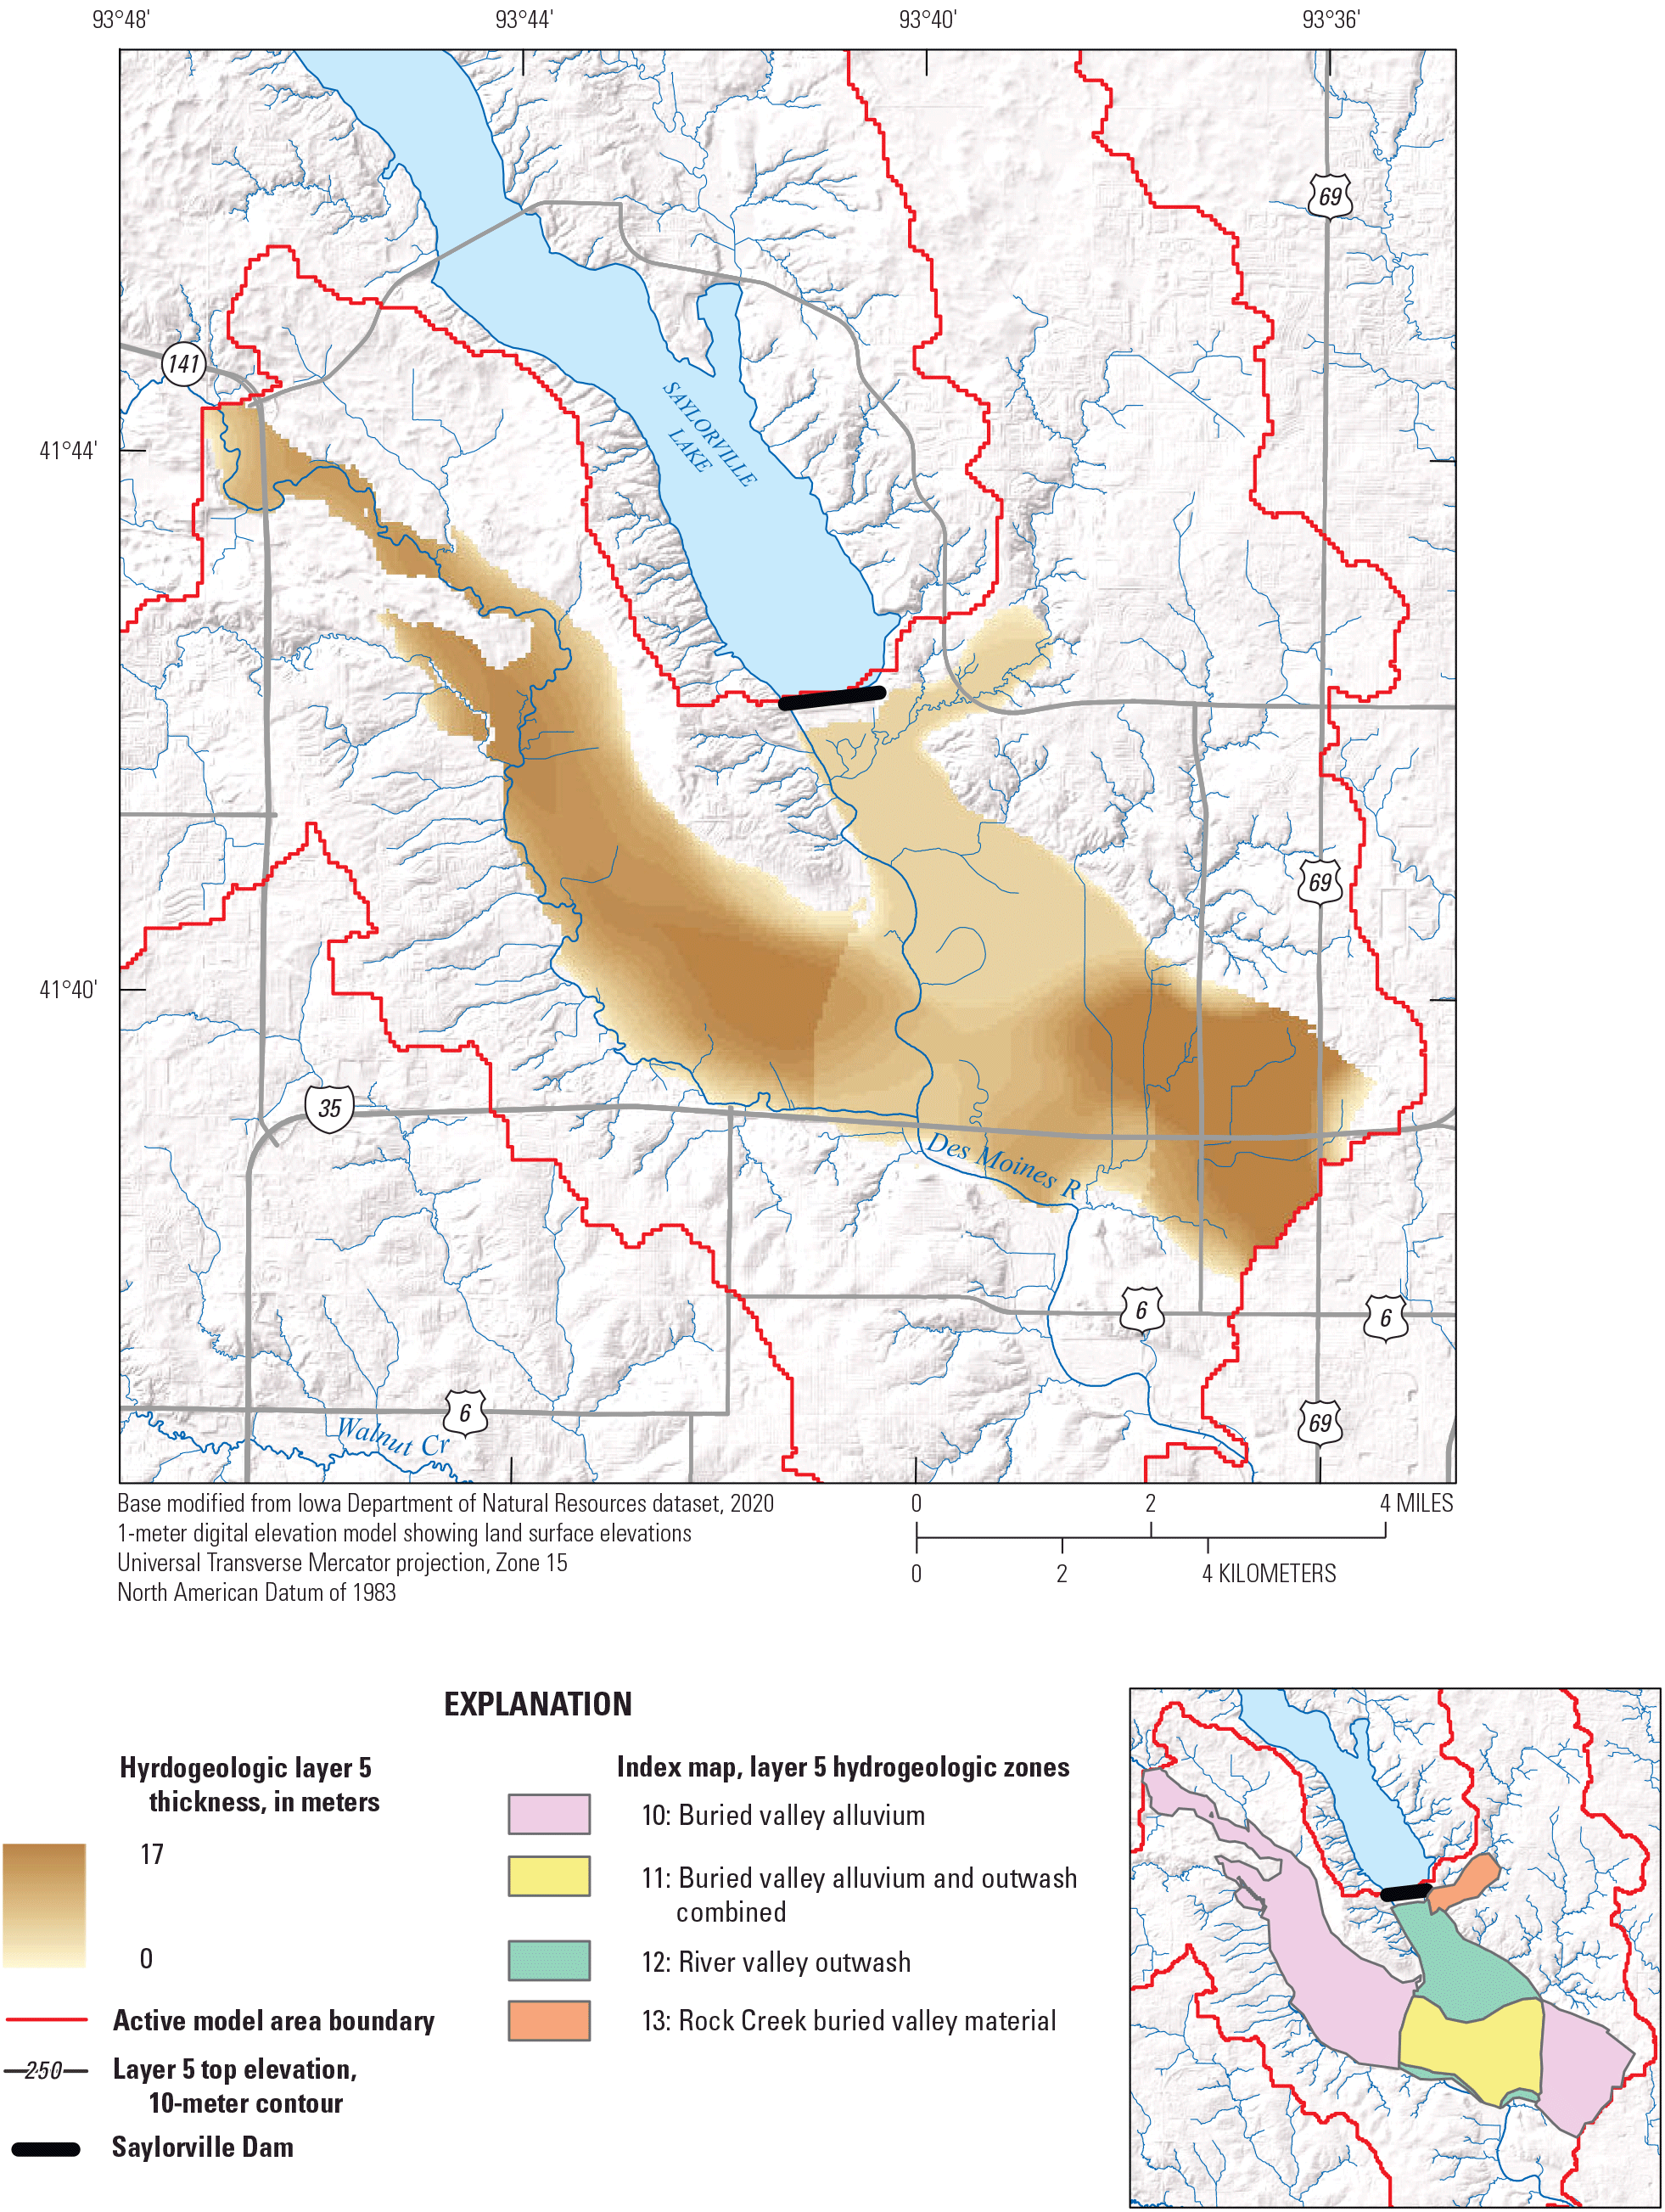
Thickness and extent of layer 5 (buried valley alluvium) in the model area, modified from Bettis and Hoyer (1986) and Iowa Geological Survey (2022).
In the buried valley where this alluvium is present, its top surface elevation was fixed at 237 m. This is consistent with lithologic log data where the alluvium has been noted (IGS, 2022). Bottom elevation for this unit was set to the bedrock surface elevation. The thickness of this unit in the model ranges from 1 to 17 m, and the layer is precluded in areas within the valleys where bedrock top elevation is higher than 236 m. This material also underlies part of the Des Moines River alluvial plain, where it forms an aquifer with overlying glacial outwash and more modern alluvium. Within the river valley, the surface elevation of the combined glacial outwash and buried valley alluvium unit was fixed at 234 m, its base elevation was set to the bedrock surface elevation, and the unit was pinched out in areas at the valley margin with shallow depth to bedrock. These values were all generalized from existing well logs, which are sparse in some areas. Layer 5 was subdivided into four zones: buried valley alluvium (zone 10); combined buried valley alluvium and glacial outwash in areas of the river valley where they are both present (zone 11); glacial outwash in the Des Moines River valley (zone 12); and a small region of buried valley fill underlying Rock Creek (zone 13, fig. 1).
Layer 6: Bedrock
Layer 6 in the model represents shale of the Cherokee Group that underlies the model area (fig. 9). The elevation of the bedrock surface was determined using a published bedrock elevation map (Witzke and others, 2010), lithologic logs from the GeoSam database (IGS, 2022), the published bedrock surface from the 2021 Des Moines River groundwater model (FitzGerald and others, 2022), and geophysical data collected in the model area by the USGS (Gruhn and others, 2021). For this model, bedrock is assumed to be a single homogenous unit with low hydraulic conductivity. Bottom elevation of this unit was set to 100 m above North American Vertical Datum of 1988 in every active cell. Layer 6 contains just one hydrogeologic parameterization zone (zone 14).
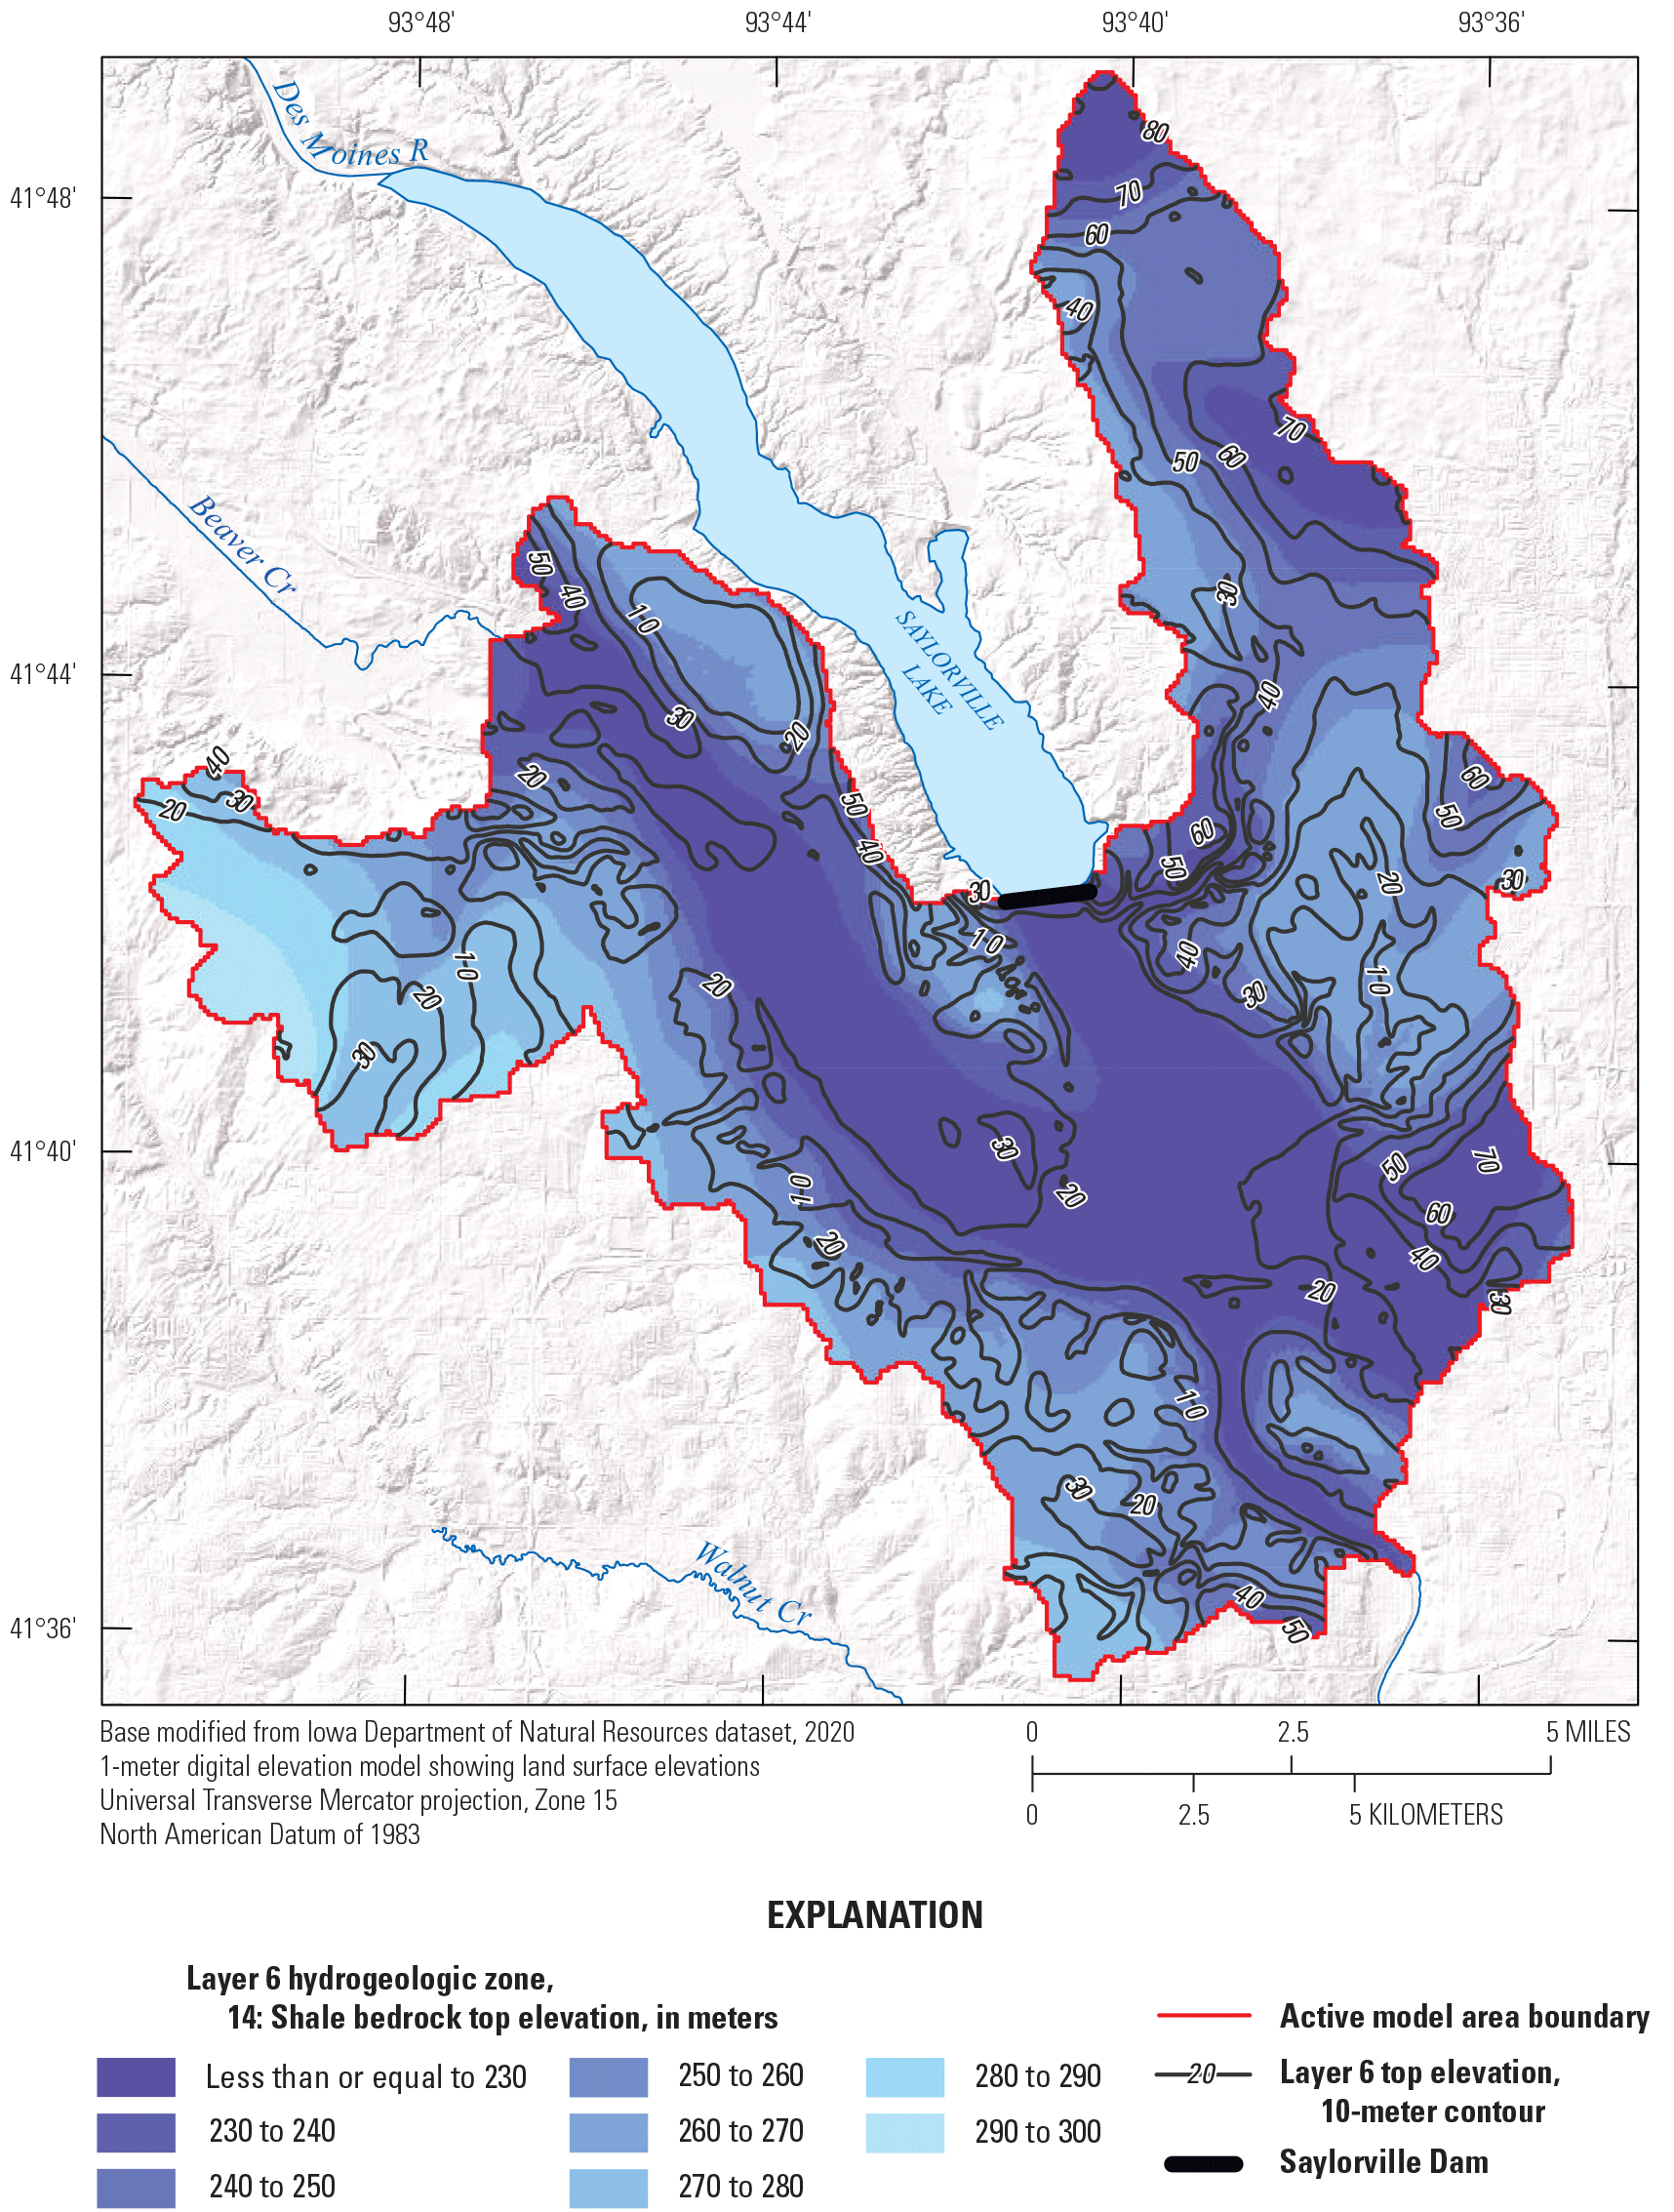
Elevation, depth to layer, and extent of layer 6 (bedrock) in the model area, from Witzke and others (2010), Gruhn and others (2021), FitzGerald and others (2022), and Iowa Geological Survey (2022).
Water Budget Components
Water budget components for this model include sources of recharge to groundwater and sources of groundwater loss. In this model, sources of recharge to groundwater include seepage from streams, infiltration of precipitation, and groundwater inflow from outside the model boundary. Sources of groundwater loss include discharge to streams and other surface water bodies including quarries, ETg, withdrawals from wells, and groundwater flow outward through the model area boundary. Recharge and evapotranspiration estimates were generated using a previously published Precipitation Modelling Runoff System (PRMS) model of the Des Moines River Basin (Haj and others, 2015). Streamflow data used to estimate streambed seepage (streambed flux) were assembled from records of three USGS streamgages in the model area with continuous data for all or part of the model period (USGS, 2023a, b, c; fig. 2). Groundwater withdrawal rates were compiled from records furnished by DMWW (Dylan Hart, Black & Veatch Corporation, written commun., 2023; Davis and Bristow, 2024) and records retrieved from the State of Iowa Water Allocation Compliance and Online Permitting system (Iowa Department of Natural Resources, 2023).
Recharge and Evapotranspiration from PRMS
PRMS is a modeling program that uses climate and land use data to simulate daily streamflow and hydrologic processes including evapotranspiration, runoff, and infiltration at the drainage basin and subbasin scale (Markstrom and others, 2008, 2015). In a PRMS model, the landscape and drainage network are delineated into hydrologic response units (HRUs) and associated stream segments based on topography and other physical characteristics, with each HRU representing an internally homogenous part of the overall drainage basin. The active model area in this report contains 20 HRUs and 10 stream segments from a previously published Des Moines River Basin PRMS model (Linhart and others, 2012; Haj and others, 2015). PMRS input datasets include elevation, land cover, and land use in addition to precipitation and streamflow at streamgage locations. Output from PRMS includes daily calculations of streamflow in ungaged stream segments and of hydrologic characteristics and fluxes in each HRU. The Des Moines River valley PRMS model was calibrated for the period October 2002 through September 2012 (Haj and others, 2015).
Several input datasets for the Des Moines River alluvial aquifer model were generated by running the existing PRMS model with a temporally expanded input dataset to generate output from January 1980 through July 2022 (USGS, 2023e). PRMS output variables used for this report include “recharge,” which is recharge to groundwater reservoirs in linear units (meters per day) for each HRU, and “potet,” potential evapotranspiration (in meters per day) for each HRU. These daily PRMS HRU output values were sampled to the model grid at each model cell center and added together into monthly rates to match the monthly model timestep. An additional recharge multiplier for each cell was applied based on three generalized surficial geology classes to better represent spatial variability of the recharge rates for individual cells within the PRMS HRUs: (1) areas of manmade fill were assigned a multiplier of 0.05; (2) till and bedrock surfaces were assigned a multiplier of 0.5; and (3) alluvial terraces, eolian sediment, and outwash surfaces were initially assigned a recharge multiplier of 1.0.
Streamflow and Its Interaction with the Groundwater System
Streams in the model area are hydrologically connected to the underlying aquifers and contribute water to and drain water from the groundwater system. Streamflow gains and losses were calculated by subtracting upstream discharge at the Beaver Creek and Saylorville gages from the downstream discharge at the 2nd Avenue gage (fig. 10). The stretch of Beaver Creek and the Des Moines River between these three gages gained an average of 306,000 cubic meters (m3) per month in combined groundwater discharge and overland runoff from October 1986 through July 2022. Streamflow gain happened in 225 of the 310 months of this period and streamflow loss, because of recharge to the aquifer from river seepage or evapotranspiration, happened in 85 of 310 months (fig. 10A). The average monthly streamflow gain is highest in April through July (fig. 10B). In winter months (October through March), average monthly streamflow gain is 132,000 m3.
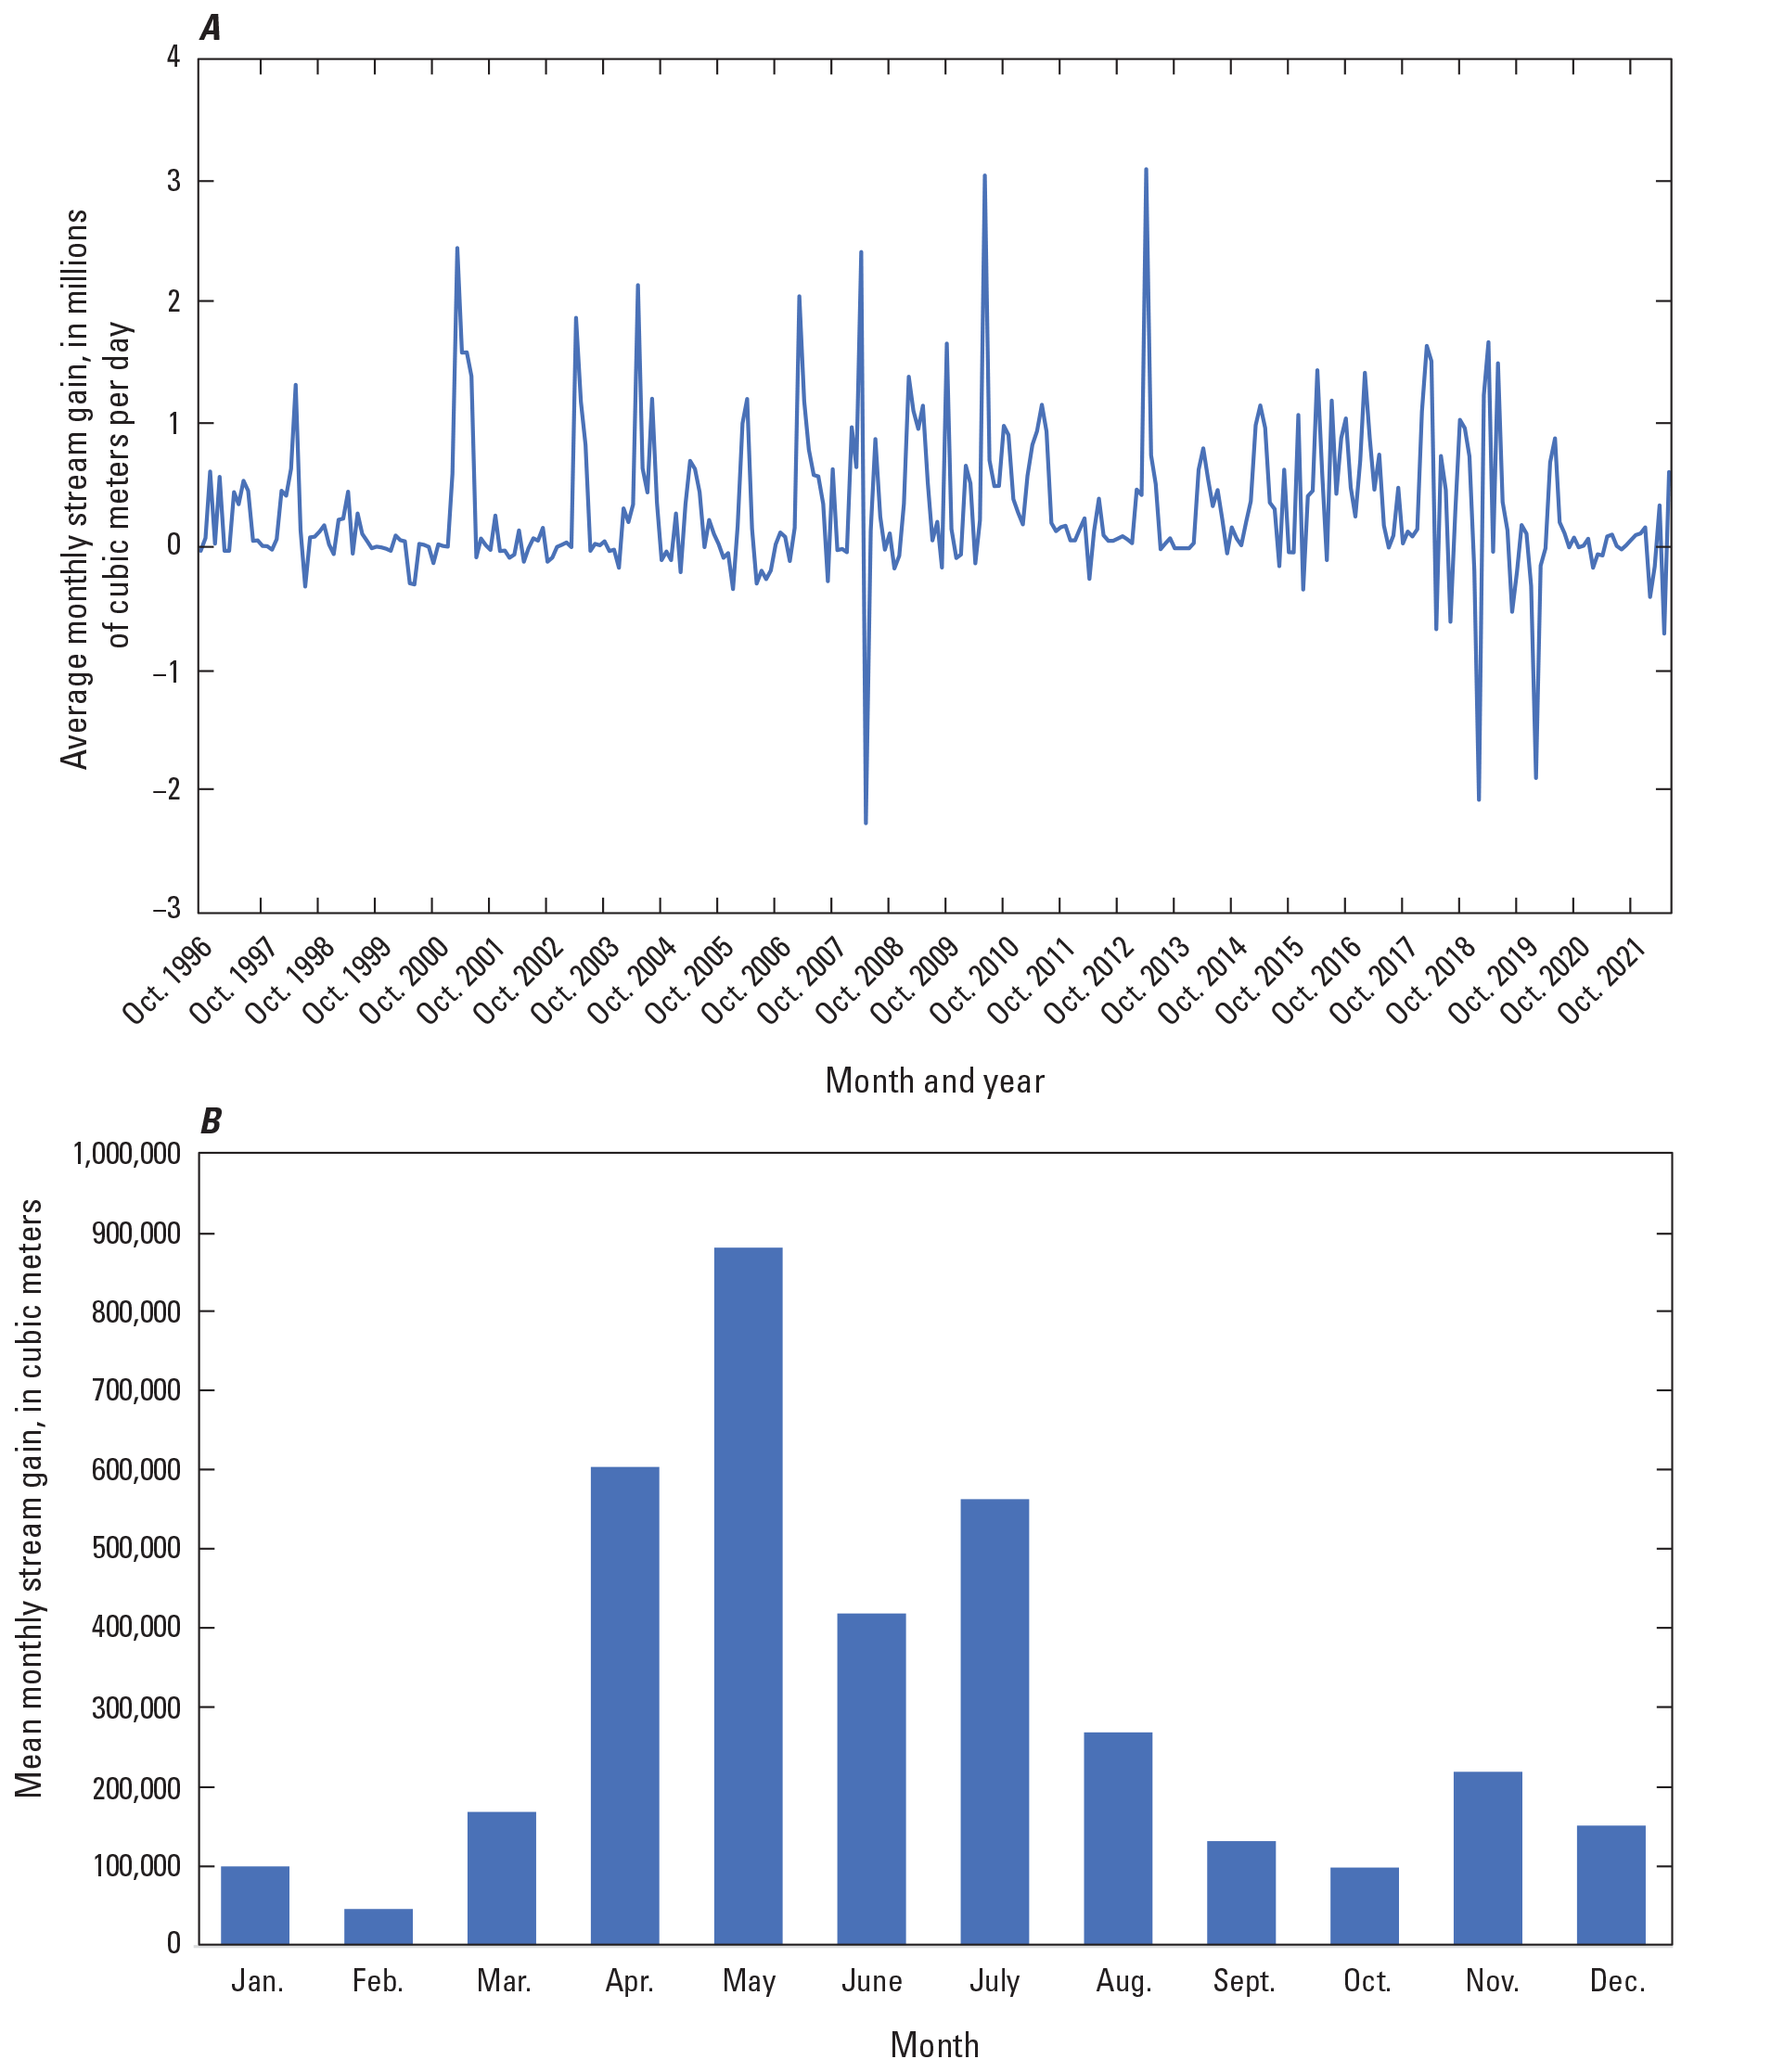
A, observed monthly average streamflow gain, and B, average monthly streamflow gain for Beaver Creek and Des Moines River for October 1986–July 2022 between the Beaver Creek, Saylorville, and 2nd Avenue streamgages in the model area.
The Saylorville gage is approximately 3 km downstream from the Saylorville Dam outlet structure. One important ungaged creek, Rock Creek, flows into the Des Moines River between the dam outlet and the gage (fig. 1). Input streamflow for the MODFLOW model Streamflow Routing (SFR) Package for the Des Moines River below the Saylorville Dam was calculated by subtracting the PRMS-calculated streamflow for Rock Creek from the observed Des Moines River streamflow at the Saylorville gage.
Groundwater Withdrawal
DMWW withdraws water from the Des Moines River alluvial aquifer within the study area at its two Saylorville RCWs on the east bank of the Des Moines River downstream from Saylorville Dam and upstream from the Interstate-80 bridge (fig. 2). These wells are screened in layer 5 in this model, which is a combined unit of buried valley alluvium and glacial outwash and represents the lower parts of the Des Moines River alluvial aquifer. These wells were constructed in late 2010, and a log of daily water supply pumping of the two wells began in October 2011 (Vern Rash, DMWW, written commun., 2018). The combined average withdrawal from the two RCWs from October 2011 through December 2022 was 21,274 cubic meters (5.62 million gallons) per day (m3/d; Davis and Bristow, 2024). Eight other commercial and public groundwater withdrawal locations in the model area were identified using the Water Allocation Compliance and Online Permitting system (Iowa Department of Natural Resources, 2023), with annual withdrawal data available for calendar years 2014–22. Groundwater withdrawal at these other eight wells is minimal compared to the RCWs; combined average withdrawal is around 209 m3/d for the years with available data (Iowa Department of Natural Resources, 2023). Estimated daily well withdrawal data are available in an accompanying data release (Davis and Bristow, 2024).
Numerical Groundwater Flow Model
A numerical model was constructed to represent hydrologic conditions and simulate the groundwater flow components from the hydrogeologic framework for each month (hereafter called stress periods) for January 1980 through July 2022. The model was constructed using the USGS modular hydrologic simulation program MODFLOW 6 (Langevin and others, 2017) and calibrated using the parameter estimation program PEST++ (Welter and others, 2015; White and others, 2020). All numerical model input and output files are available in an accompanying USGS data release (Davis and Bristow, 2024). MODFLOW 6 solves the groundwater flow equation for discrete blocks, called “cells,” and balances all inflows and outflows for each cell in the model area. MODFLOW 6 software includes “Packages,” which are parts of the model that manage a single aspect of the simulation (table 2). Of the four types of packages available in MODFLOW 6, three are Hydrologic Packages, including Internal Packages, which calculate terms required to solve the groundwater flow equation for each cell or to store information needed for these calculations. Stress Packages and Advanced Stress Packages that formulate coefficients describing a particular external or boundary flow were used to simulate aquifer stress. The fourth type of Packages, called Output Packages, sets parameters for writing model output. All available MODFLOW 6 Packages (including those not used in this model) are described in detail in Langevin and others (2017).
Table 2.
MODFLOW 6 packages used in the numerical groundwater flow model.Internal Packages used for the model were the Discretization (DIS), Time Discretization (TDIS), Initial Conditions (IC), Node Property Flow (NPF), and Storage (STO) Packages. The DIS Package was used to define the horizontal and vertical extent of the model layers and cells; the TDIS Package was used to set the time step and stress period lengths for the simulation; the IC Package was used to specify initial hydraulic heads for each cell; the NPF Package was used to define horizontal hydraulic conductivity and vertical anisotropy for each cell; and the STO Package was used to define aquifer storage properties (including specific storage and specific yield) for each cell.
Stress Packages used for the model include the Recharge (RCH), Evapotranspiration (EVT), Well (WEL), and General Head Boundary (GHB) Packages, along with the Streamflow routing (SFR) Advanced Stress Package. The RCH Package was used to simulate recharge from precipitation to model cells; the EVT Package was used to represent ETg from model cells; and the GHB Package was used to simulate inflow from or outflow to external sources. The SFR Package was used to simulate streams in the model area by routing streamflow through stream channels and calculating flow through the streambed between the aquifers and streams.
Output Packages used in the model were the Observation (OBS) and Output Control (OC) Packages. The OBS Packages direct MODFLOW to write simulated hydraulic heads for individual cells or flows for individual cells or groups of cells to an output file, whereas the OC Package specifies the stress periods for which model-wide hydraulic heads and cell-by-cell groundwater flows are to be saved.
Spatial Discretization
The model area was spatially discretized into square cells measuring 60 m on a side with variable thickness and arranged in a grid with 427 rows and 383 columns oriented north-south. The model was vertically discretized into six layers of variable thickness based on the extent and thickness of each of the six hydrogeologic layers and the hydrogeologic parameter zones described in the “Hydrologic Framework” section of this report. The spatial and vertical discretization of the model resulted in a total of 372,222 cells among the 6 model layers, of which 208,056 had nonzero thickness and were included in the simulation. In model cells where a hydrogeologic unit was absent and the overlying and underlying layers were active, the thickness was set to 0 m and designated as a “pass-through” or “pinched” cell. Pass-through cells in MODFLOW 6 are removed from the simulation and the overlying and underlying cells are numerically connected.
Temporal Discretization
This model is a combined steady-state and transient model, which means it approximates steady-state (predevelopment) conditions and transient (time-varying) conditions as they change with time. The model consisted of a single steady-state stress period, representative of pre-1980 conditions, followed by 512 monthly transient stress periods, representative of monthly conditions for January 1, 1980, through July 31, 2022. Time-variable input data and model outputs were discretized into these monthly stress periods. The steady-state part of the model was representative of pre-1980 conditions; however, recharge and streamflow were calculated by averaging the stresses used during the transient part of the model.
Hydrogeologic Properties
Each hydrogeologic unit or subunit from the hydrogeologic framework was assigned values for horizontal hydraulic conductivity, vertical anisotropy, specific yield, and specific storage, and initial values for these properties were based on previously published estimates. Values were distributed to the model grid using the method of pilot points, as described in Fienen and others (2009); hydrologic parameters were assigned at pilot point locations that were evenly distributed throughout each hydrogeologic unit zone in the model area, then properties were interpolated to the model grid using a kriging method.
Horizontal hydraulic conductivity values for the four hydrogeologic zones of layer 1 (zones 1 through 4) were generalized from Soil Survey Geographic Database hydraulic conductivity values for soil units in the model area (table 3; Soil Survey Staff, 2022). Alluvial and outwash-based soils (zone 1) were assigned 25 meters per day (m/d); upland and slopes underlain by glacial till (zone 2) were assigned 0.78 m/d; and areas of manmade fill or dense impervious surfaces (zone 3) were assigned hydraulic conductivity of 0.26 m/d. Zone 4 was reserved for water-filled quarries that were represented in the model using the GHB Package and therefore was not assigned hydrologic properties at this stage. Vertical anisotropy (vertical hydraulic conductivity divided by horizontal hydraulic conductivity) for all hydrogeologic zones initially was set to one-tenth (0.1) of the horizontal hydraulic conductivity value. Initial horizontal hydraulic conductivity for layers 2, 4 (zone 9), and 6 (zone 14) were assigned based on the calibrated values for equivalent units from FitzGerald and others (2022). The three zones of layer 2 (zones 5, 6, and 7 [low, intermediate, and high terrace alluvium, respectively]), were initially assigned the same horizontal hydraulic conductivity of 10 m/d, and values for layers 3 (zone 8) and 5 (zones 10–13) were based on values for similar hydrogeologic materials suggested in Freeze and Cherry (1979). Initial values for specific yield and specific storage for all layers were from published ranges (such as those in Freeze and Cherry [1979]) for similar hydrogeologic materials. Horizontal hydraulic conductivity, vertical anisotropy, specific yield, and specific storage at pilot points were properties adjusted during model calibration.
Table 3.
Initial hydraulic property values assigned to hydrogeologic zones represented in the model.[Data are from Freeze and Cherry, 1979, FitzGerald and others, 2022, and Soil Survey Staff, 2022. Layers and zones are shown on figures 4–9. Kx, horizontal hydraulic conductivity; m/d, meter per day; Kz, vertical hydraulic conductivity; Kx/Kz, vertical anisotropy; Ss, specific storage; Sy, specific yield; E, times 10 to the power of]
Boundary Conditions and Flow Processes
Boundary conditions and aquifer stresses were simulated using several MODFLOW 6 Packages (fig. 11). Lateral and lower boundaries were represented as no-flow boundaries. Aquifer boundaries at the edge of the model where groundwater inflow or outflow is likely were simulated using the GHB Package. Recharge from precipitation infiltration was simulated using the RCH Package, ETg was simulated using the EVT Package, interaction of groundwater and surface water in the model was simulated using the SFR and GHB Packages, and groundwater withdrawal was simulated using the WEL Package.
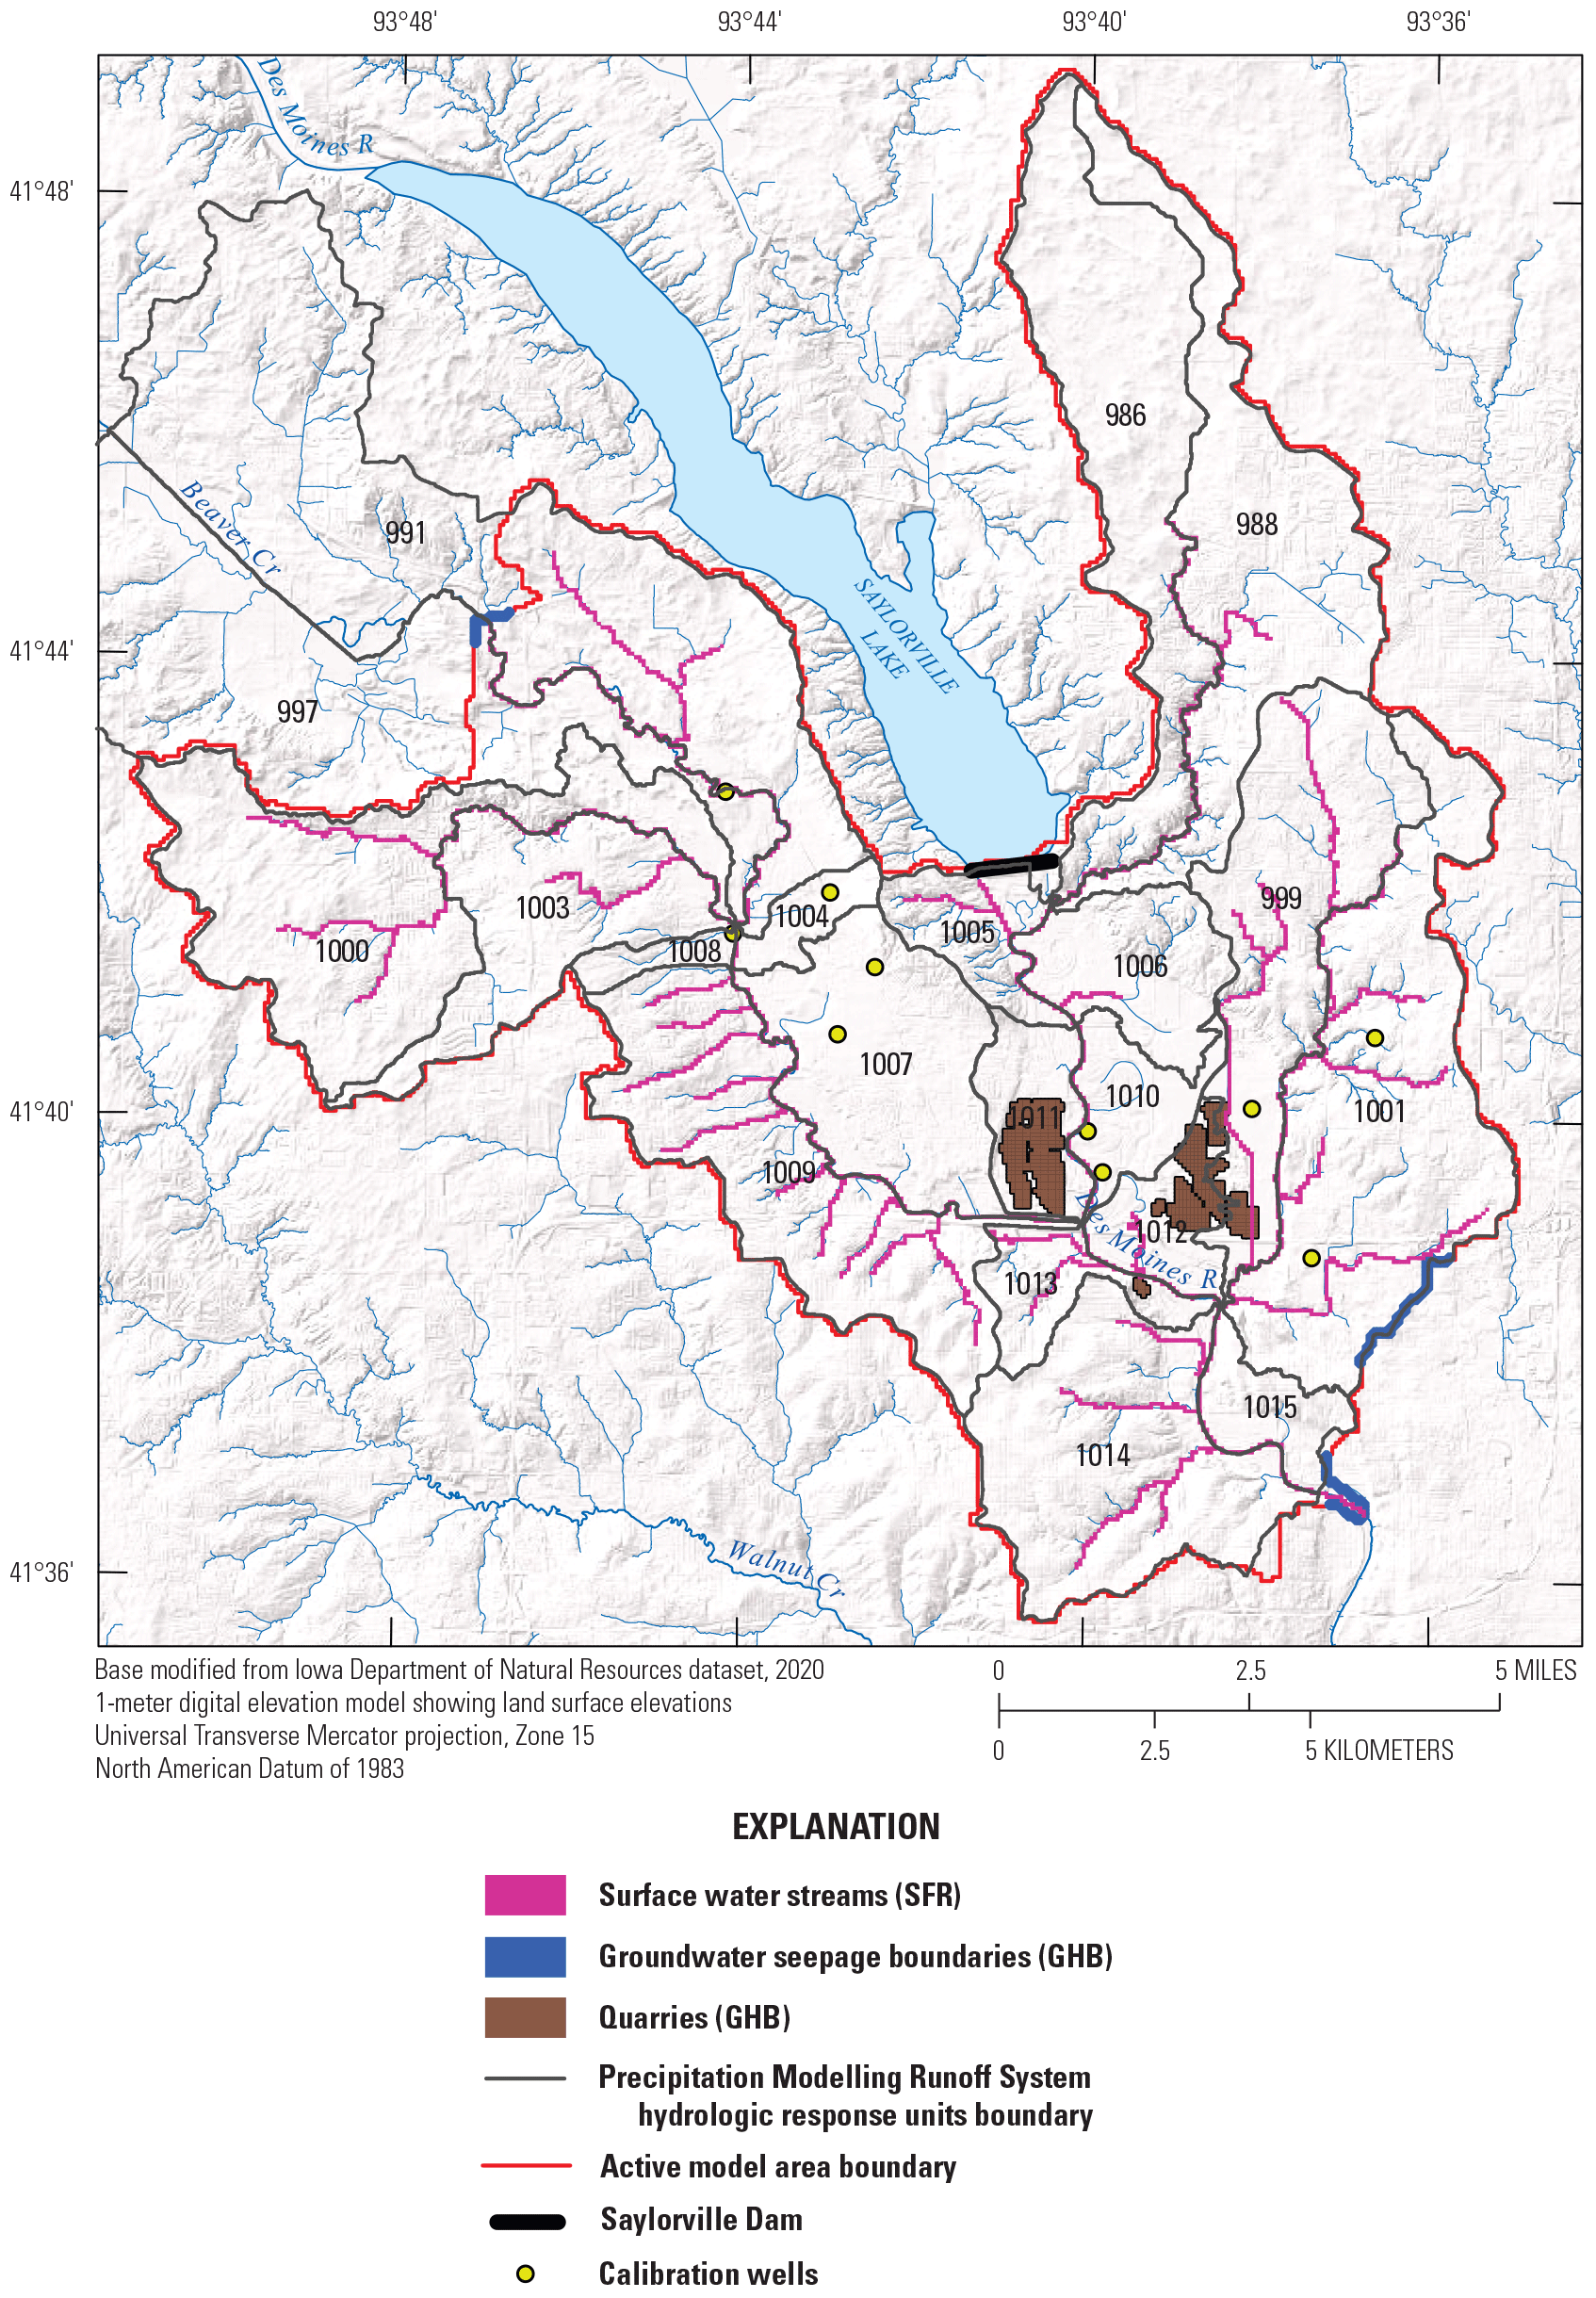
Hydrologic features and corresponding MODFLOW 6 boundary condition packages used in the numerical model, including boundaries representing groundwater seepage through the edge of the model (GHB), surface water streams (SFR), wells (WEL), quarries (GHB), and Precipitation Modelling Runoff System model hydrologic response units used in calculation of recharge (RCH) and evapotranspiration (EVT).
Lateral and Lower Boundaries
Most of the active model area boundary is a no-flow boundary following topographic highs underlain by glacial till or bedrock (model layers 4 and 6), with the assumption that the groundwater drainage basin is coincident with the surface water drainage basin in the model area. The base of the model also is represented as a no-flow boundary. Lateral no-flow model boundaries are established by deactivating cells outside the boundary.
Groundwater Inflow and Outflow Boundaries
Aquifers in the model intersect the model boundary in three locations: the Des Moines River alluvial aquifer intersects the model boundary at the southeast edge of the model where the river exits the model area; and the buried valley aquifer intersects the model boundary in the northwest and southeast. Groundwater movement in and out of the model for these three boundaries was represented in the model using the MODFLOW 6 GHB Package (Langevin and others, 2017). The downstream alluvial aquifer GHB boundary was assigned to model layer 2 and head for each cell was assigned a constant value based on the average Des Moines River stage at the 2nd Avenue gage plus an elevation offset ranging from 0 to 0.79 m to approximate the floodplain topography and maintain a water table gradient toward the river. The GHB boundaries representing the buried valley alluvium were assigned to layer 5, the lowest aquifer in those cells. Hydraulic head for the northwest boundary was assigned a constant value equal to the approximate surface elevation of Beaver Creek in that area (255 m), plus an elevation offset ranging from 0 to 0.6 m to make a slight gradient in the water table toward Beaver Creek. Hydraulic head for the southeast buried valley boundary was fixed at 246.5 m for all cells associated with the southeast buried valley boundary.
Recharge from Precipitation
Recharge from precipitation infiltration into the aquifers was simulated using the MODFLOW 6 RCH Package. The RCH Package is designed to simulate aerially distributed recharge to the groundwater system (Langevin and others, 2017). Recharge was specified for each cell for each monthly stress period in units of meters per day and was applied to the top cell throughout the model. Recharge rates were calculated using the PRMS model (as described in the “Water Budget Components” section) for each PRMS HRU polygon and then each grid cell was assigned the recharge rate of the nearest PRMS HRU. An additional multiplier based on surficial geology was applied for each cell, as described in the “Water Budget Components” section. These combined spatially distributed rates were used as initial estimates of recharge to the numerical model and included as parameters for calibration.
Surface Water Interaction
Streams in the model were simulated using the MODFLOW 6 SFR Package, which calculates streamflow and streambed seepage (streambed flux) using the continuity equation. SFR calculations assume piecewise steady (nonchanging in discrete time periods), uniform (nonchanging in location), and constant-density streamflow, such that volumetric inflow and outflow rates are always equal, and no water is added to or removed from storage in the surface channels. The numerical model routes streamflow through a network of rectangular channels (which may include rivers, streams, canals, and ditches and are referred to collectively as reaches in the remainder of this report; Langevin and others, 2017). Reaches represent a stream associated with a particular cell in the numerical groundwater flow model. A stream on the landscape is represented in the numerical model by reaches delineated within individual model cells, numbered sequentially from upstream to downstream, and assigned uniform physical and hydrologic properties. Rates of overland flow, precipitation, and evaporation also can be assigned for each reach in the SFR Package; however, these rates are not assigned for this model. In this report, segments are conceptually defined as groups of one or more individual reaches between stream confluences. Streambed hydraulic conductivity values were assigned uniformly to the reaches that make up stream segments, except for segments of the Des Moines River, which had values of streambed hydraulic conductivity uniquely assigned to reaches based on CRP surveys, discussed later in this section.
Streams including the Des Moines River, Beaver Creek, and perennial tributary creeks at least 1-m wide were included in this model as sequentially numbered SFR reaches, with each reach corresponding to a single model cell as described in the previous paragraph. All SFR reaches were assigned to layer 1, the top-most layer in each cell. Each reach was assigned physical characteristics of length, width, gradient, top elevation of streambed, streambed thickness, Manning’s roughness for the channel, and streambed hydraulic conductivity. Length for each reach was calculated by intersecting each stream channel center line with model grid cells, and width was approximated from aerial imagery (Google Earth, 2022). Streambed top elevations for stream segment endpoints were determined using a 3-m resolution DEM and interpolated to individual reaches along each stream segment (Iowa Geospatial Data, 2022). Bed thickness for each reach was nominally fixed at 1 m. In cases where the bottom of the streambed was below the bottom of layer 1, the elevation of the bottom of layer 1 was adjusted to 1 m below the elevation of the bottom of the streambed to accommodate the reach. Manning’s roughness coefficient (n) was fixed at 0.037 for all reaches (Arcement and Schneider, 1989), and streambed hydraulic conductivity was initially set to 0.0154 m/d for all stream segments in the SFR Package. Streambed hydraulic conductivity for each stream segment was included as a parameter for calibration.
Streambed hydraulic conductivity in streams can differ based on differences in deposition and accumulation of sediment, and these natural variations in streambed hydraulic conductivity can affect seepage rates (Hatch and others, 2010). To better characterize variation in the Des Moines River streambed, apparent resistivity of the top 1 m of the streambed was used to generate a multiplier to linearly scale streambed hydraulic conductivity for individual reaches in areas where CRP data were collected (fig. 12). This approach assumes a linear correlation of unconsolidated sediment grain size to apparent electrical resistivity and hydraulic conductivity. The hydraulic conductivity multiplier for each SFR reach was calculated as the ratio of average streambed resistivity within a 60-m radius around the reach’s center point to average streambed resistivity for all reaches. This means that SFR reaches with lower-than-average apparent resistivity have a multiplier of less than 1.0, resulting in a hydraulic conductivity value lower than the uniform segment hydraulic conductivity value, and reaches with greater-than-average apparent resistivity have a multiplier greater than 1.0, resulting in a hydraulic conductivity value greater than the uniform segment hydraulic conductivity. Apparent resistivity values less than 50 ohm-meter (ohm-m) were identified as water column points, so the streambed was identified at each reach midpoint as the topmost data point with resistivity greater than 50 ohm-m, and apparent resistivity of the streambed was averaged from the top meter of the streambed. An additional scaling factor was used to define the slope of the linear relation between hydraulic conductivity and apparent resistivity of the streambed. The slope scaling factor was initially set to 1.0 and included as a parameter used in model calibration. If this relation resulted in a streambed hydraulic conductivity less than 1.0x10⁻³ m/d, streambed hydraulic conductivity was assigned to a minimum of 1.0x10⁻³ m/d.
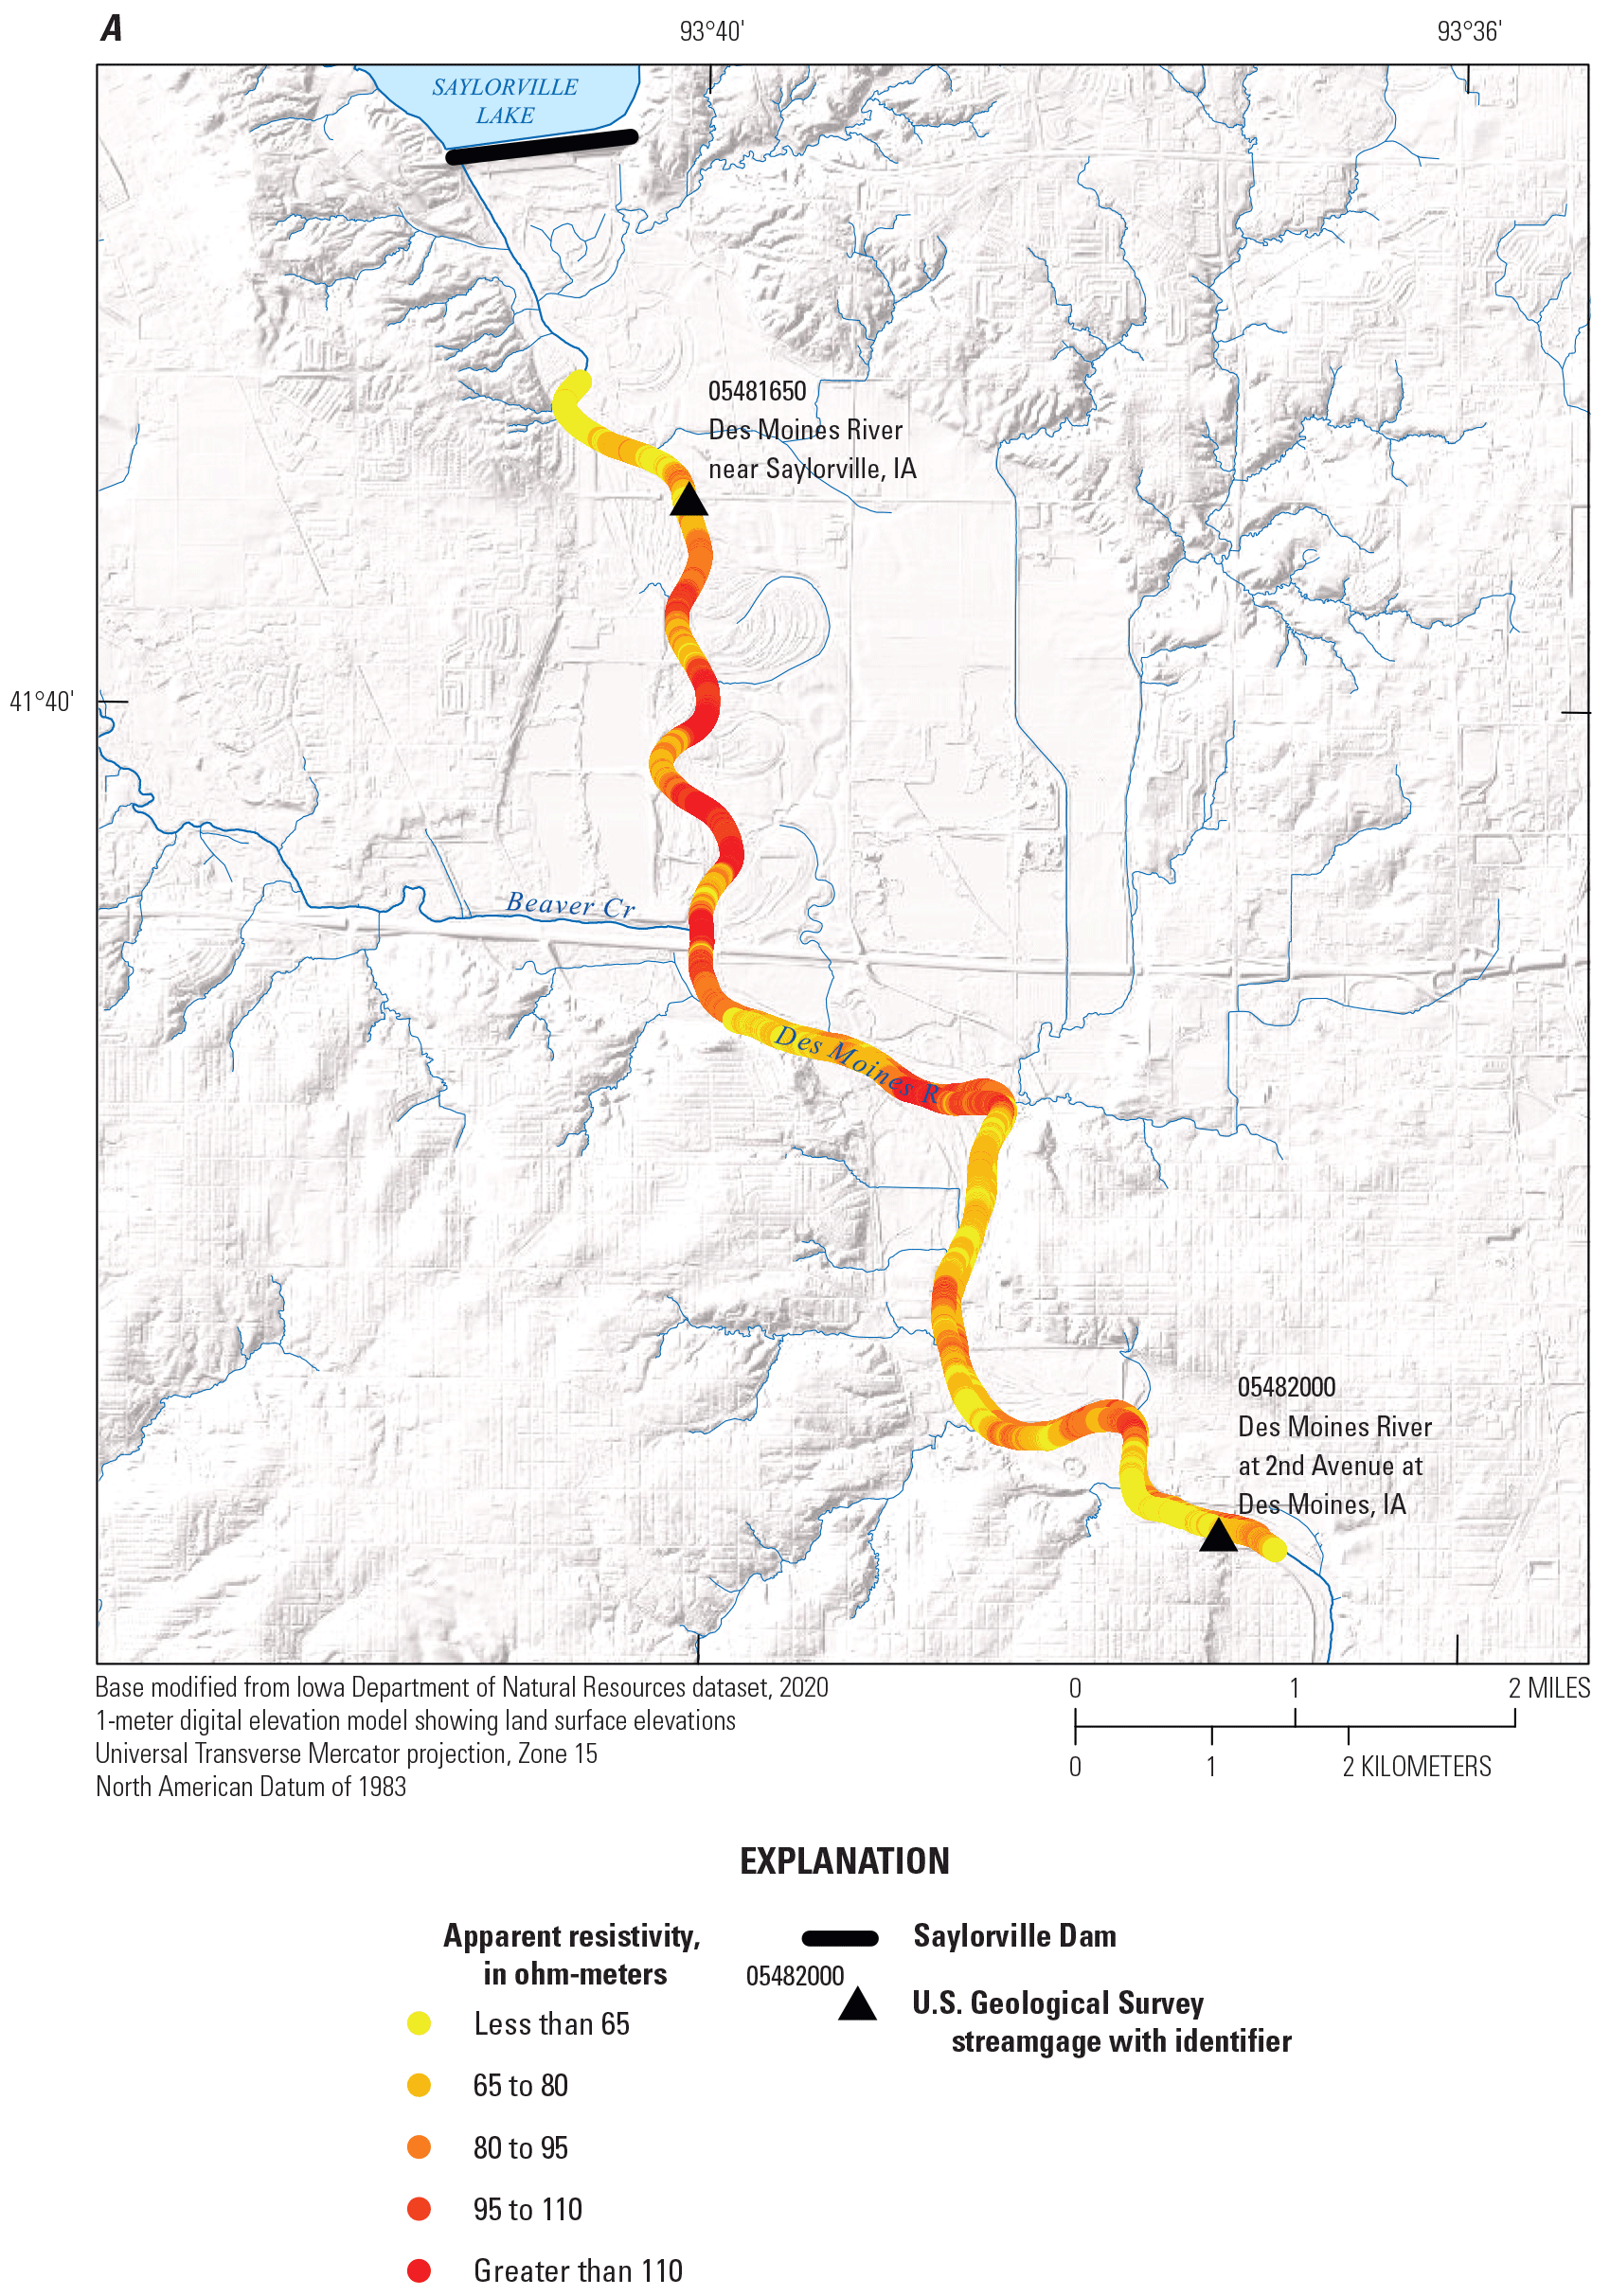
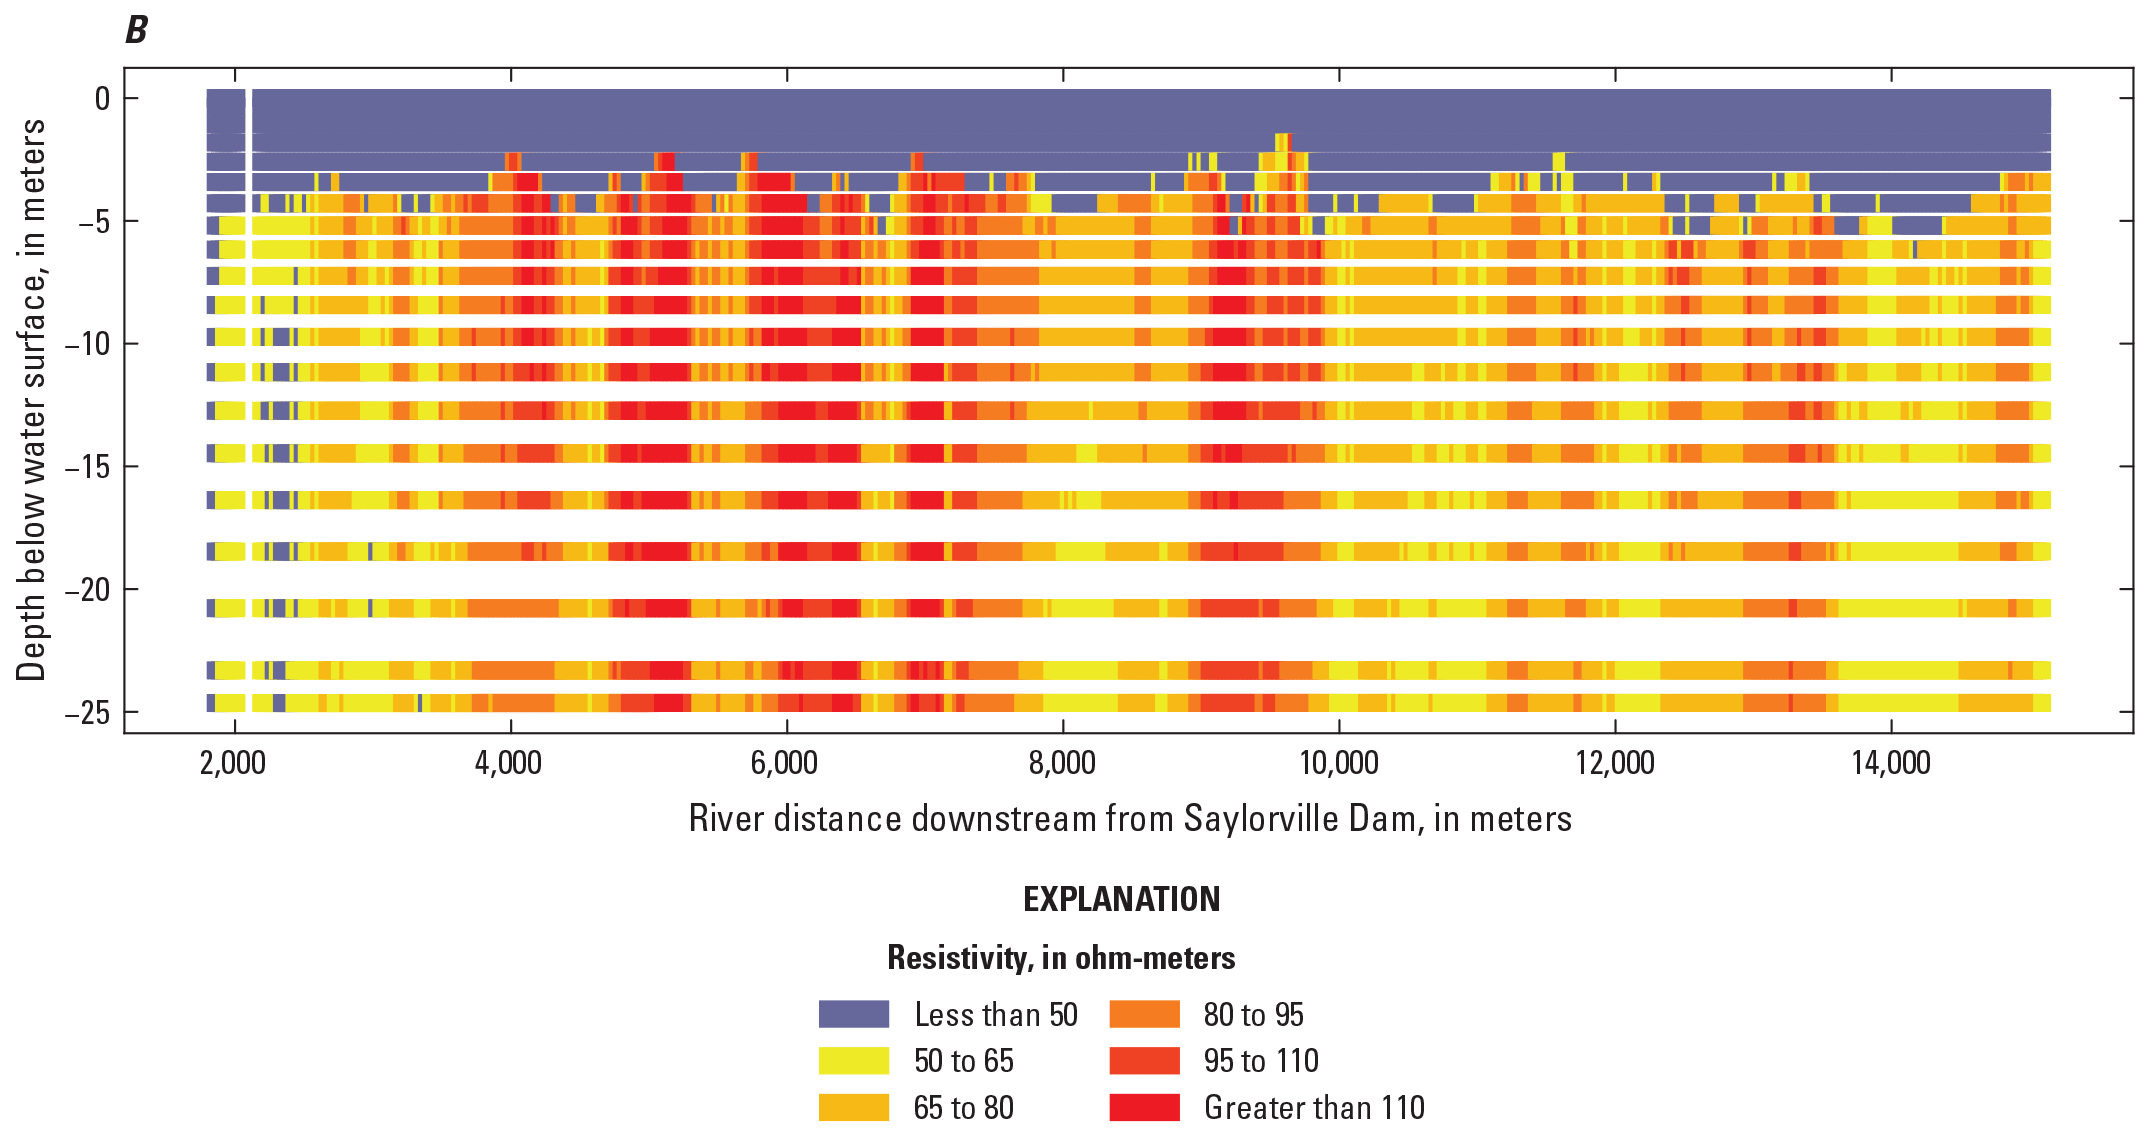
A, location of continuous resistivity profiling (CRP) data collection, and B, CRP cross-sectional profile of Des Moines River apparent resistivity in ohm-meters at depth below water surface. Resistivity values less than 50 ohm-meters at the top of the profile are interpreted as water. In these figures, red shows higher electrical resistivity material and yellow shows lower resistivity material; for the model, these are correlated to higher and lower streambed hydraulic conductivity, respectively.
Several water-filled quarries on the surface of the alluvial plain were represented using the MODFLOW 6 GHB Package, which simulates flow into or out of a cell from an external source as a proportion of the difference between the hydraulic head in the cell and the hydraulic head assigned to the external source (Langevin and others, 2017). GHB cells representing the quarries were assigned to layer 2 (river alluvium), and layer 1 was inactive in these areas. The water level for these quarry boundary cells was fixed at land surface elevation as determined by the DEM (Iowa Geospatial Data, 2022).
Groundwater Evapotranspiration (ETg)
ETg was simulated with the MODFLOW 6 EVT Package and applied to the uppermost cell in the model (at the land surface) in units of meters per day (Langevin and others, 2017). The EVT Package simulates the effects of plant transpiration and direct evaporation by removing water from the saturated groundwater regime (Langevin and others, 2017). Simulation of ETg was based on the following assumptions (Langevin and others, 2017): (1) when the water table is at or above a specified elevation (the evapotranspiration surface), ETg loss is at a specified fixed rate (the maximum ETg rate); (2) when the depth of the water table below the evapotranspiration surface exceeds a specified value (called the “extinction depth” in this report), ETg ceases; and (3) when between the evapotranspiration surface and the extinction depth, ETg varies in a piecewise-linear fashion with water table elevation. Extinction depths were assigned on the basis of land cover, as defined using a simplified classification of the 2020 USDA Cropland Data Layer (USDA, 2020): the extinction depth of grassland, barren land, and developed areas was set to 1 m; farmland to 1.5 m; woodland to 3 m; and areas of open water were set to 0 m. Initial maximum monthly ETg rates were assigned uniformly to the PRMS HRUs in the model area and were calculated using the PRMS model outputs that were sampled to each model cell from the nearest HRU polygon.
Groundwater Withdrawal
Groundwater withdrawal was represented with the MODFLOW 6 WEL Package (Langevin and others, 2017). RCWs were assigned to the cell closest to the center of the collector well, and other wells were assigned to the cell in which they were located. Monthly average groundwater withdrawal rates were specified for each well in units of cubic meters per day. The “auto flow reduction” option for the WEL Package reduces the groundwater withdrawal rate as the water level in a well approaches the bottom of the cell. The auto flow reduction option was set to 0.2 for all WEL Packages in the model, meaning the withdrawal rates could be reduced when the water level in a WEL Package cell was simulated at or less than 20 percent of the vertical cell thickness.
Model Calibration Approach
Model calibration is the process of adjusting model parameters within specified ranges to minimize the differences between simulated model results and real-world observations (calibration targets). The groundwater flow model was calibrated using PESTPP–IES (version 5.0.9; White and others, 2020) with calibration targets selected from observed or estimated values from available hydrologic data. PESTPP–IES is a member of the PEST++ suite of calibration programs first developed by Welter and others (2015). White (2018) describes the background and methods used by PESTPP–IES. PESTPP–IES iterates ensembles of random model parameter values to minimize the difference (or residuals) between observed (measured observation) values and simulated (model-computed) values. The ensemble of model parameters is modified iteratively until an acceptable model to measurement fit is obtained through a “base” set of model parameters. An advantage of PESTPP–IES is its efficiency compared to traditional least squares methods in that the model only runs once for each user-selected number of ensemble members instead of one or more times for each model parameter (Hunt and others, 2021). Hunt and others (2021) used a test problem to demonstrate that the traditional least squares method (singular value decomposition) required more than 25 times the number of model forward runs compared to more efficient methods, including an iterative ensemble smoother approach, to obtain an acceptable model to measurement fit.
Calibration Targets
Observed values for calibration were determined for the steady-state and transient model stress periods. The first stress period of the model representing steady-state conditions was calibrated for hydrologic conditions before the 1980s and before substantial development of groundwater resources in the model area. The remaining monthly transient stress periods simulated monthly conditions for January 1, 1980, through July 31, 2022. Transient observations were consolidated into monthly values.
Observation data used for model calibration targets included groundwater levels, changes in groundwater levels, pumping rates for the RCWs, streamflow, and streambed flux (table 4). Groundwater level observations included water level elevations, water level changes, and water level inequality observations. Water level data were acquired from 13 USGS monitoring wells, including 4 with single measurements and 11 with multiple months of data (table 1; fig. 2). Additional water level data were from RCW records furnished by DMWW (Dylan Hart, Black & Veatch Corporation, written commun., 2023; Davis and Bristow, 2024), 10 monitoring wells in the alluvial plain used as part of a wetland habitat monitoring project between 2010 and 2015 (Vern Rash, DMWW, written commun., 2022 and Davis and Bristow, 2024), and 97 wells from the State of Iowa’s GeoSam database that had single water level measurements, generally collected at the time the well was drilled (Davis and Bristow, 2024). Water level elevation observations were assigned from wells with single water level measurements or from the first measurement for wells with a series of measurements. Monthly water level change observations were calculated for wells with multiple measurements. Daily pumping rates at the RCWs, averaged into monthly observations, were also used as calibration targets. Minimum design water levels for the collector wells, representing threshold groundwater levels below which pumping is reduced, were used as inequality observations. Inequality observations are a unique observation type implemented in PESTPP–IES (White and others, 2020) in which the residual is zero unless model output is greater than or less than the calibration target; the user specifies which inequality condition applies. In this case, the minimum water level for the collector well operations were used as a “greater than” observation, so simulated water levels greater than the minimum design water level were not penalized in calibration, but those lower than the minimum water level generated a residual.
Table 4.
Calibration observation data groups with counts and weight for each observation.[Data are from Iowa Geological Survey, 2022, U.S. Geological Survey, 2023d, Dylan Hart, Black & Veatch Corporation, written commun., Vern Rash, DMWW, written commun., 2022. GeoSam, Iowa Geological Survey well database; USGS, U.S Geological Survey; RCW, radial collector wells]
Streambed flux (streamflow gain or loss) calibration targets were calculated as change in streamflow between the upstream and downstream USGS gages in the model area, and cumulative monthly streambed flux was calculated from the monthly streambed flux values. The Saylorville and Beaver Creek gages have monthly streamflow data available for the entire model period, January 1980 through July 2022, while the 2nd Avenue gage has streamflow data for October 1996 through July 2022; gage streamflow differences were calculated for the period from 1996 to 2022 with data for all three gages. Additionally, only measurements for October–March of each year were used during calibration to reduce expected effect of overland runoff on streamflow measured at gages.
Because this model is designed to simulate water levels in the alluvial aquifer in the area of the RCWs, groundwater observations from the alluvial aquifer materials were assigned the highest weights in calibration (observation groups wl_alt_obs(1), wl_alt_obs(3), and wl_alt_obs(4), table 4). Water level elevation observations for wells in layer 6 (wl_alt_obs(2); bedrock) were assigned a lower weight than those from the other layers because these are likely representative of bedrock aquifer units that underlie the shale bedrock confining layer at the bottom of this model and therefore are not well-connected to the Des Moines River alluvial aquifer. Streamflow targets were given relatively low weight in calibration because the model’s objective was to simulate groundwater levels rather than streamflow targets.
Calibration Parameters
Parameters adjusted during model calibration include hydrogeologic properties (horizontal hydraulic conductivity, vertical anisotropy, specific storage, and specific yield), streambed hydraulic conductivity, recharge multipliers, evapotranspiration multipliers, well withdrawal multipliers, quarry bed hydraulic conductivity, and groundwater flux boundary hydraulic conductivity (table 5). Horizontal hydraulic conductivity, vertical anisotropy, specific storage, and specific yield were distributed among the layers using a combination of hydrogeologic unit zones and pilot points (shown in figs. 13 through 18 in “Calibration and Numerical Model Results”). Distribution of pilot points and starting parameter values are described in the “Hydrogeologic Properties” section. Streambed hydraulic conductivity for the SFR Package was assigned uniformly between stream confluences for all streams other than the Des Moines River, which used variable streambed hydraulic conductivity based on the variation of cell apparent electrical resistivity using a multiplier. An additional calibrated parameter was used to adjust the slope of the resistivity multiplier relation. Recharge and evapotranspiration rate multipliers were assigned by HRU; recharge rate multipliers for soil type zones were also used. Well pumping rate multipliers were used for individual wells. Calibration parameters also included quarry-bed hydraulic conductivity for each quarry, and GHB hydraulic conductivity for groundwater flux boundaries was assigned uniquely for each boundary. All calibration parameters, weights, and target observations are included in the associated groundwater model data release (Davis and Bristow, 2024).
Table 5.
Type and distribution of parameters adjusted during model calibration.[SFR, Streamflow Routing Package; HRU, hydrologic response unit; PRMS, Precipitation Modelling Runoff System model]
Calibration and Numerical Model Results
Model calibration results include optimal estimated values for all calibration parameters, comparison of calibration targets to model-simulated values, and parameter sensitivity analysis. The calibrated model was used to simulate water levels for each stress period, and these results were compared to observed water levels for two RCWs in the model area. Model-simulated groundwater budgets were qualitatively assessed. Model parameter sensitivity analysis is a process completed using PEST++ (White and others, 2020) that indicates which parameters have the greatest effect on model outputs.
Optimal Parameter Estimates
Optimal model parameters were selected from the “base” realization of the second PESTPP-IES iteration. In general, calibration of the model resulted in parameter values similar to initial estimates. Calibrated parameter values are summarized in tables 6 and 7, and complete calibration results are included in the data release accompanying this report (Davis and Bristow, 2024). Calibrated horizontal conductivity values for each model layer (table 6) are illustrated along with pilot points and hydrologic parameter zones in figures 13 through 18. In layers 2 and 5, areas of the highest hydraulic conductivity were near the river channel and RCWs.
Table 6.
Calibrated model parameter values, including zone horizontal hydraulic conductivity (Kx) and other parameters.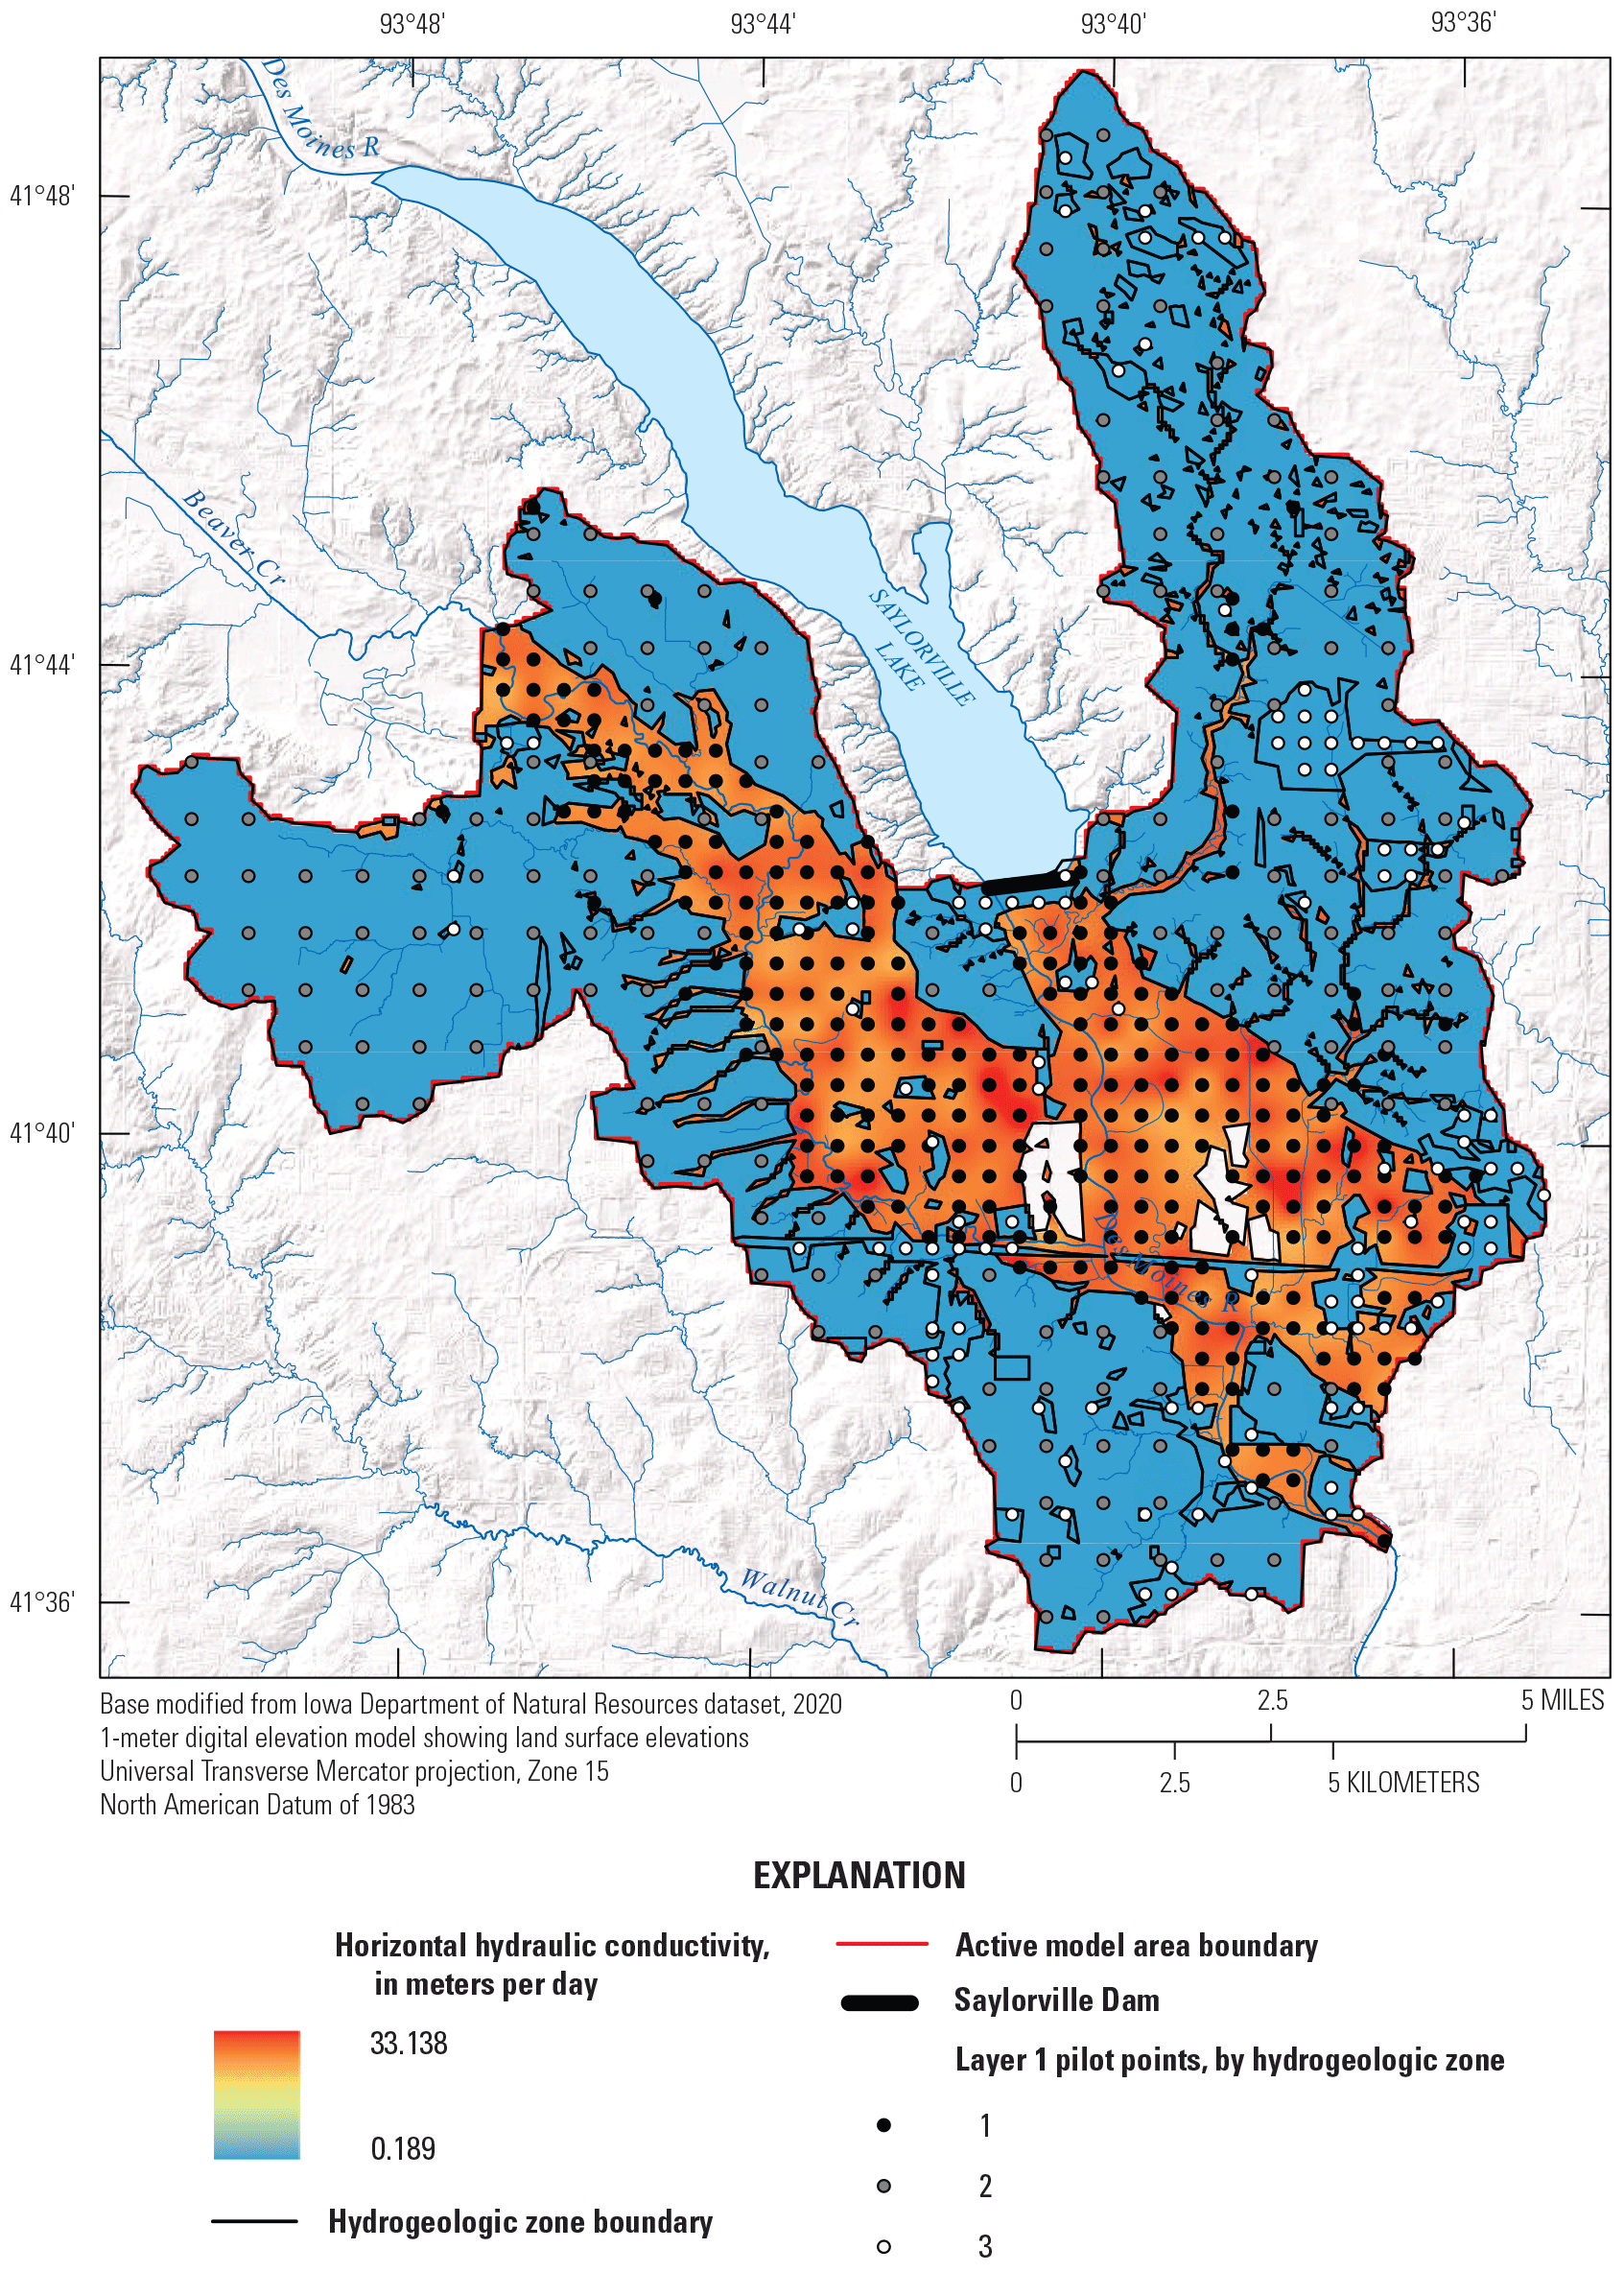
Calibrated horizontal hydraulic conductivity and pilot point locations for layer 1.
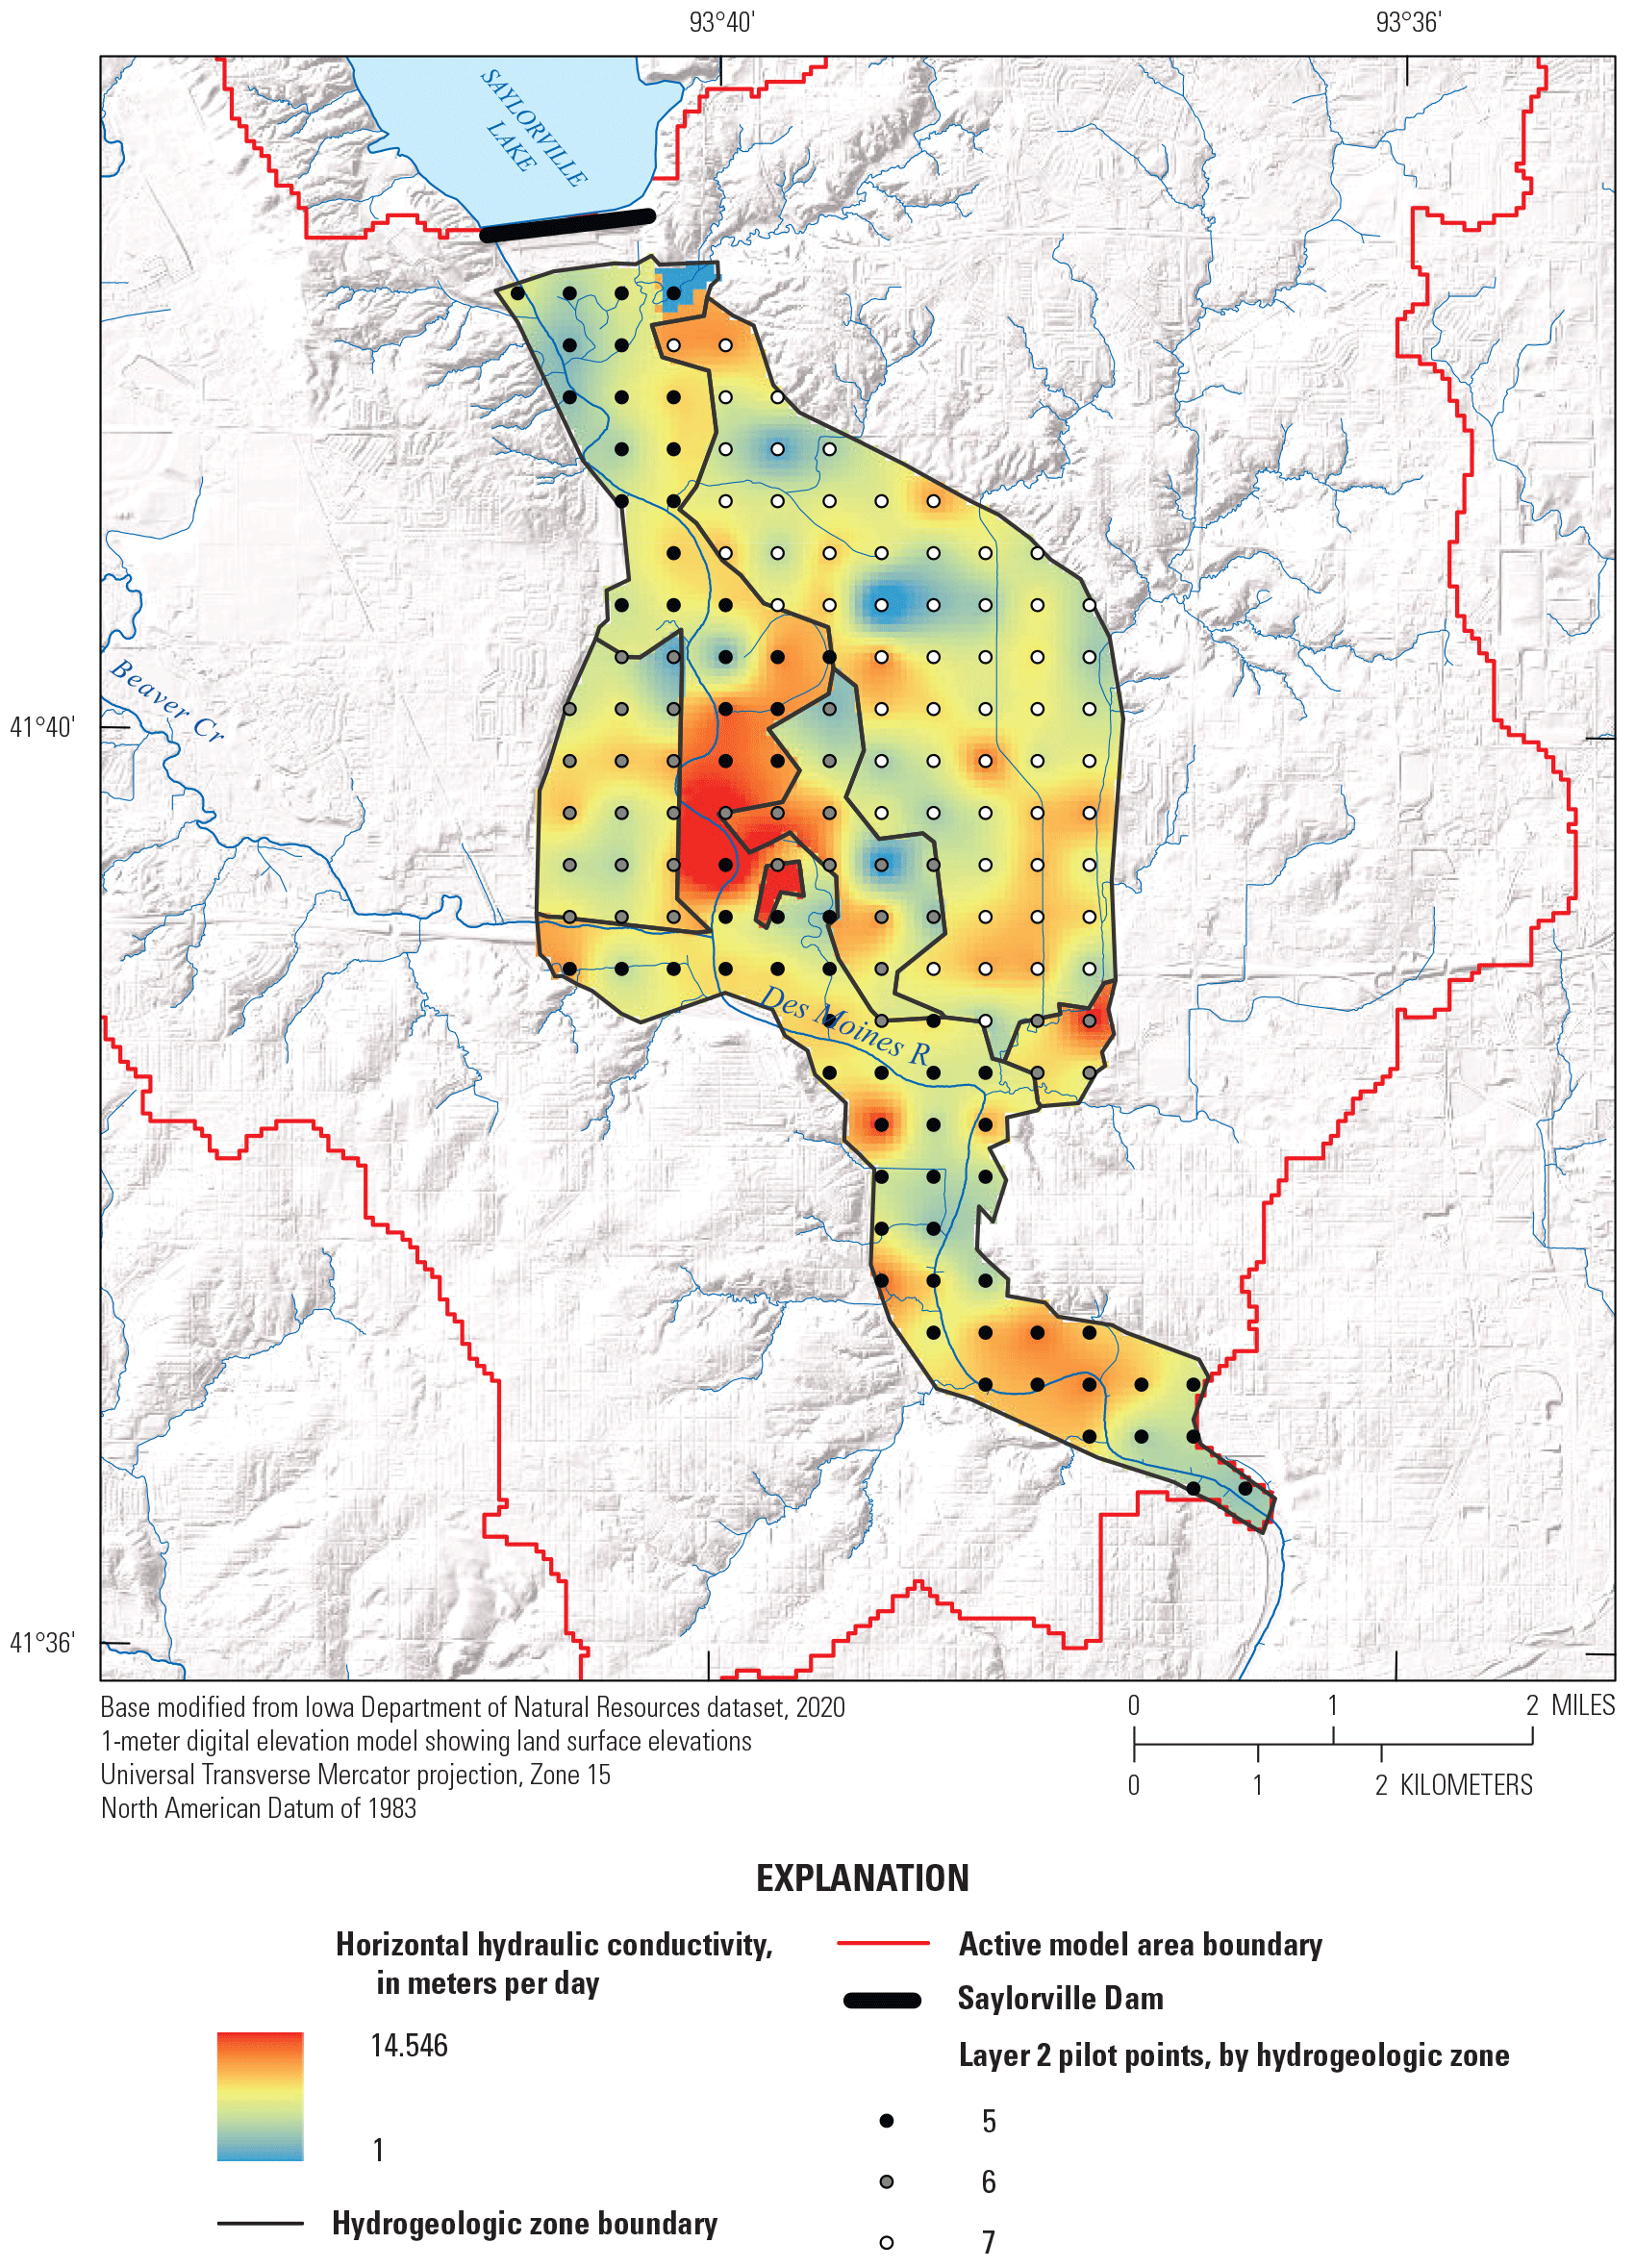
Calibrated horizontal hydraulic conductivity and pilot point locations for layer 2.
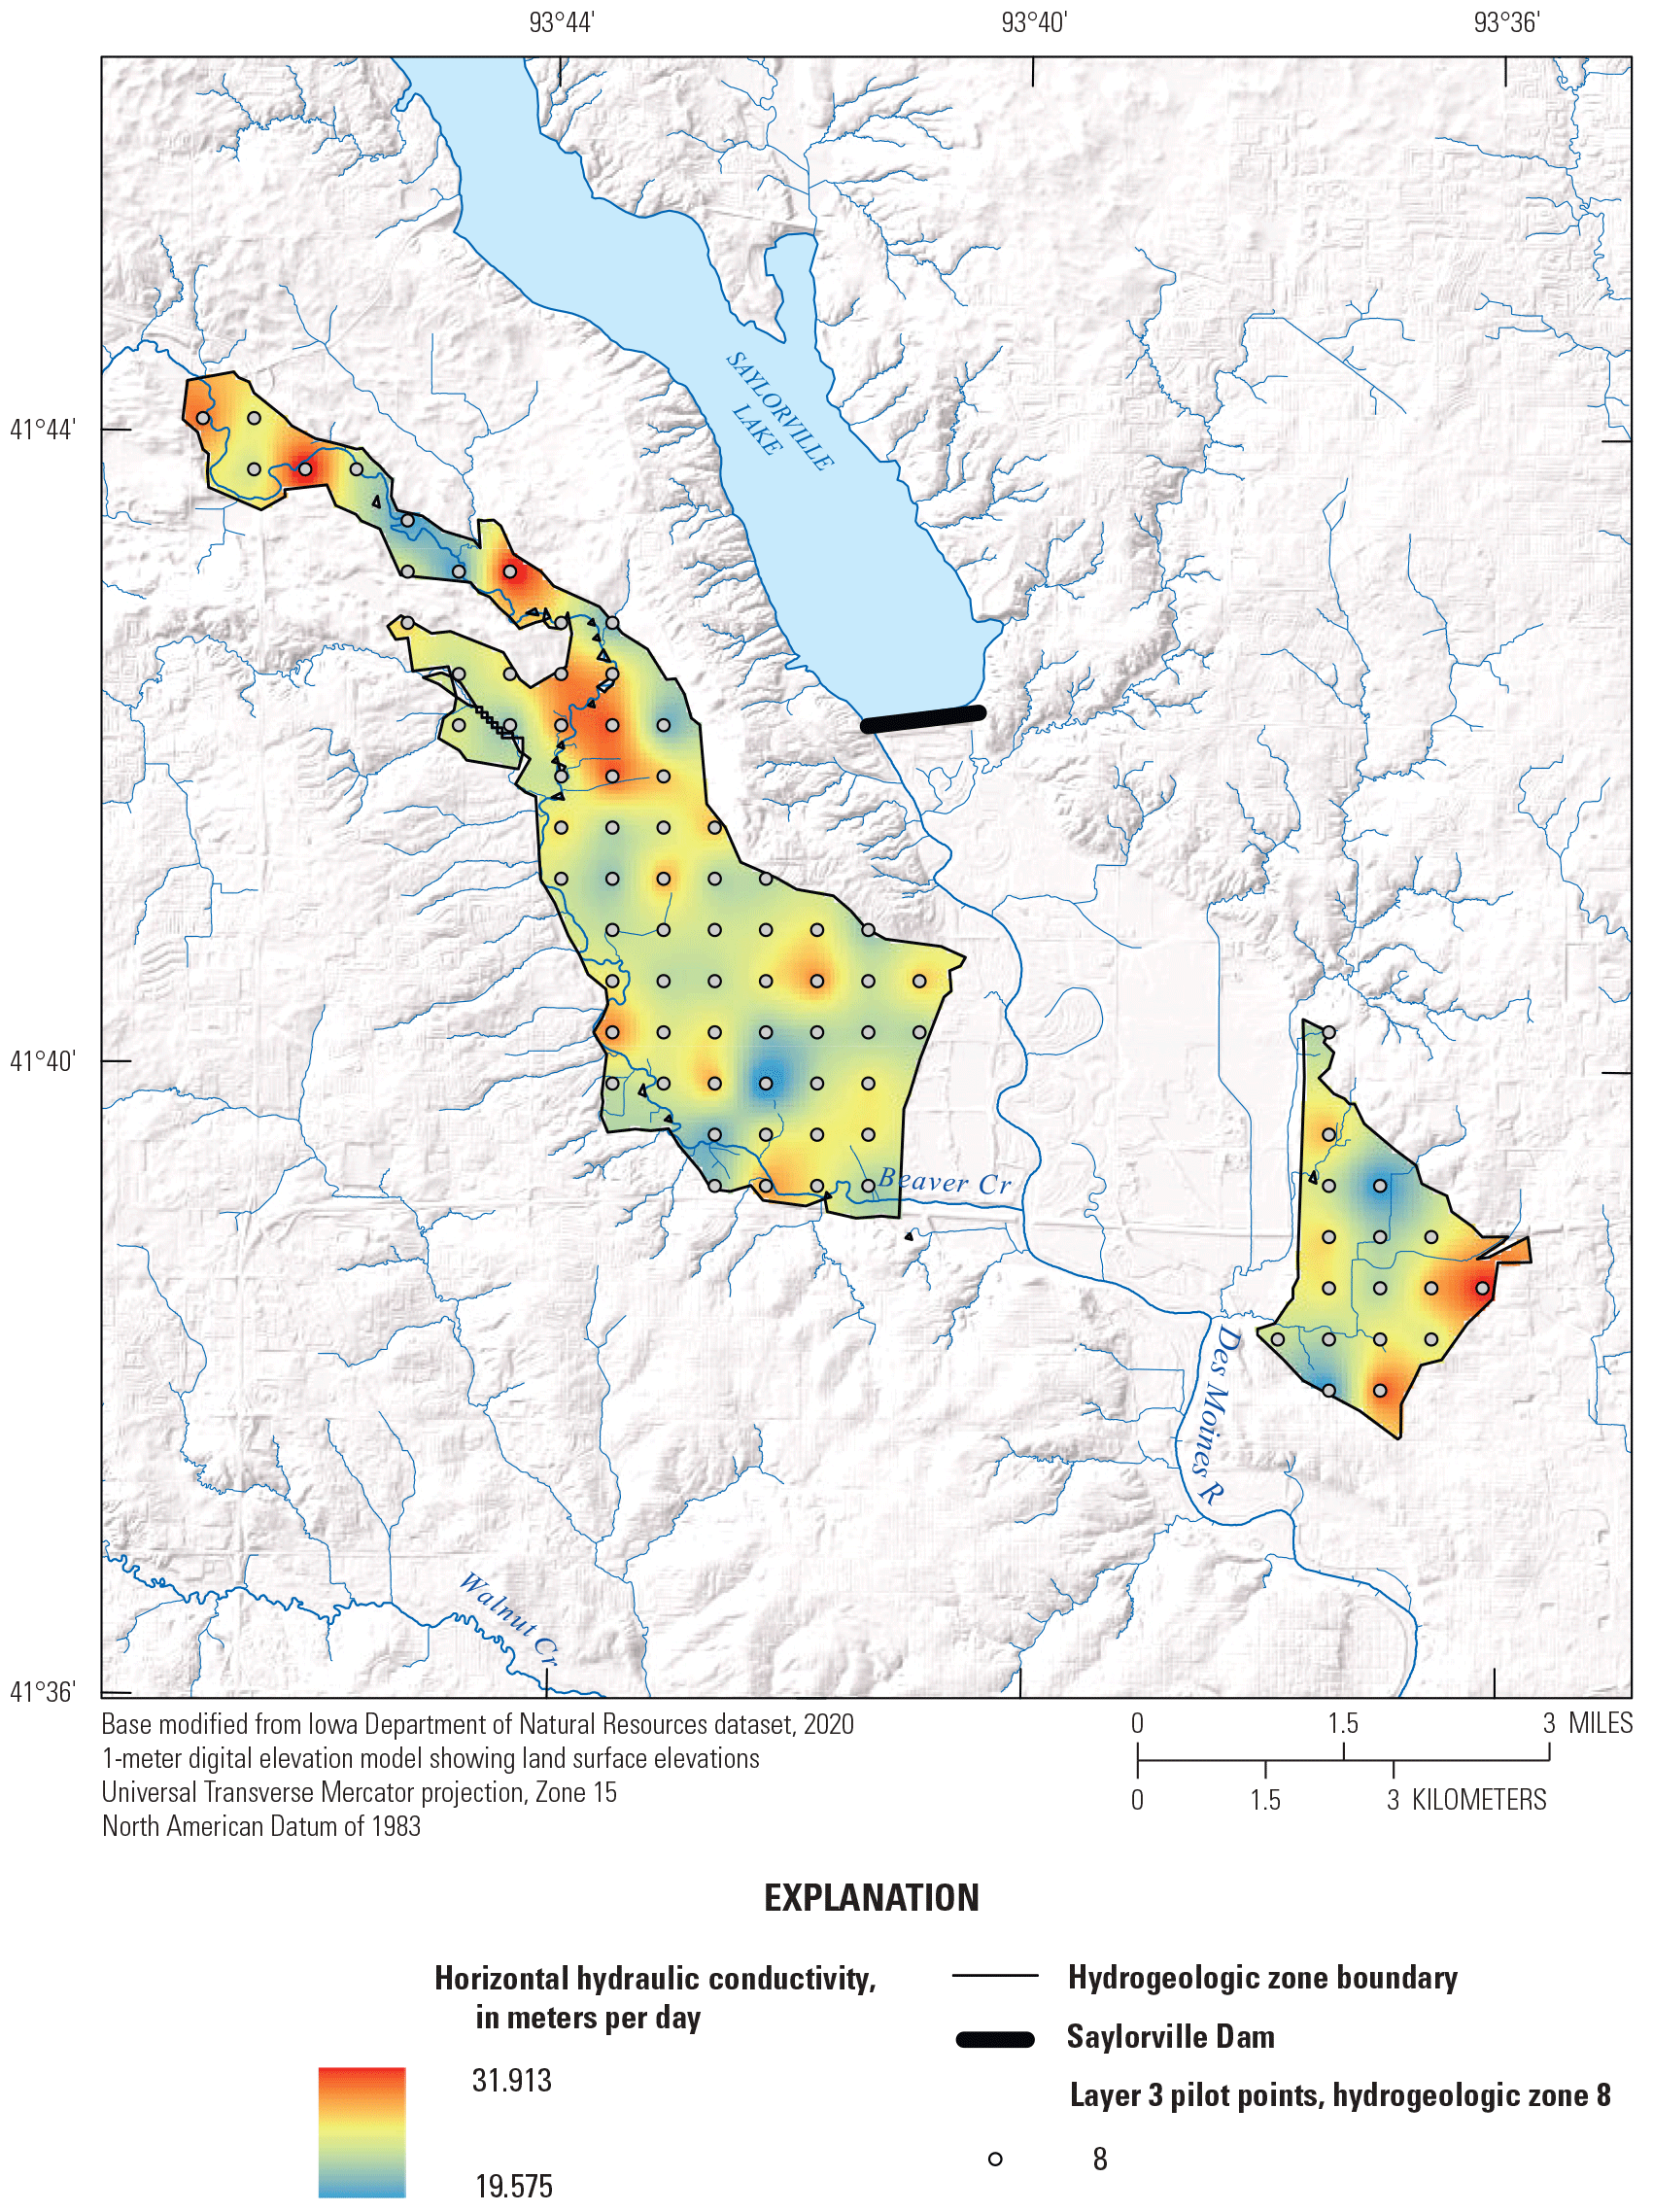
Calibrated horizontal hydraulic conductivity and pilot point locations for layer 3.
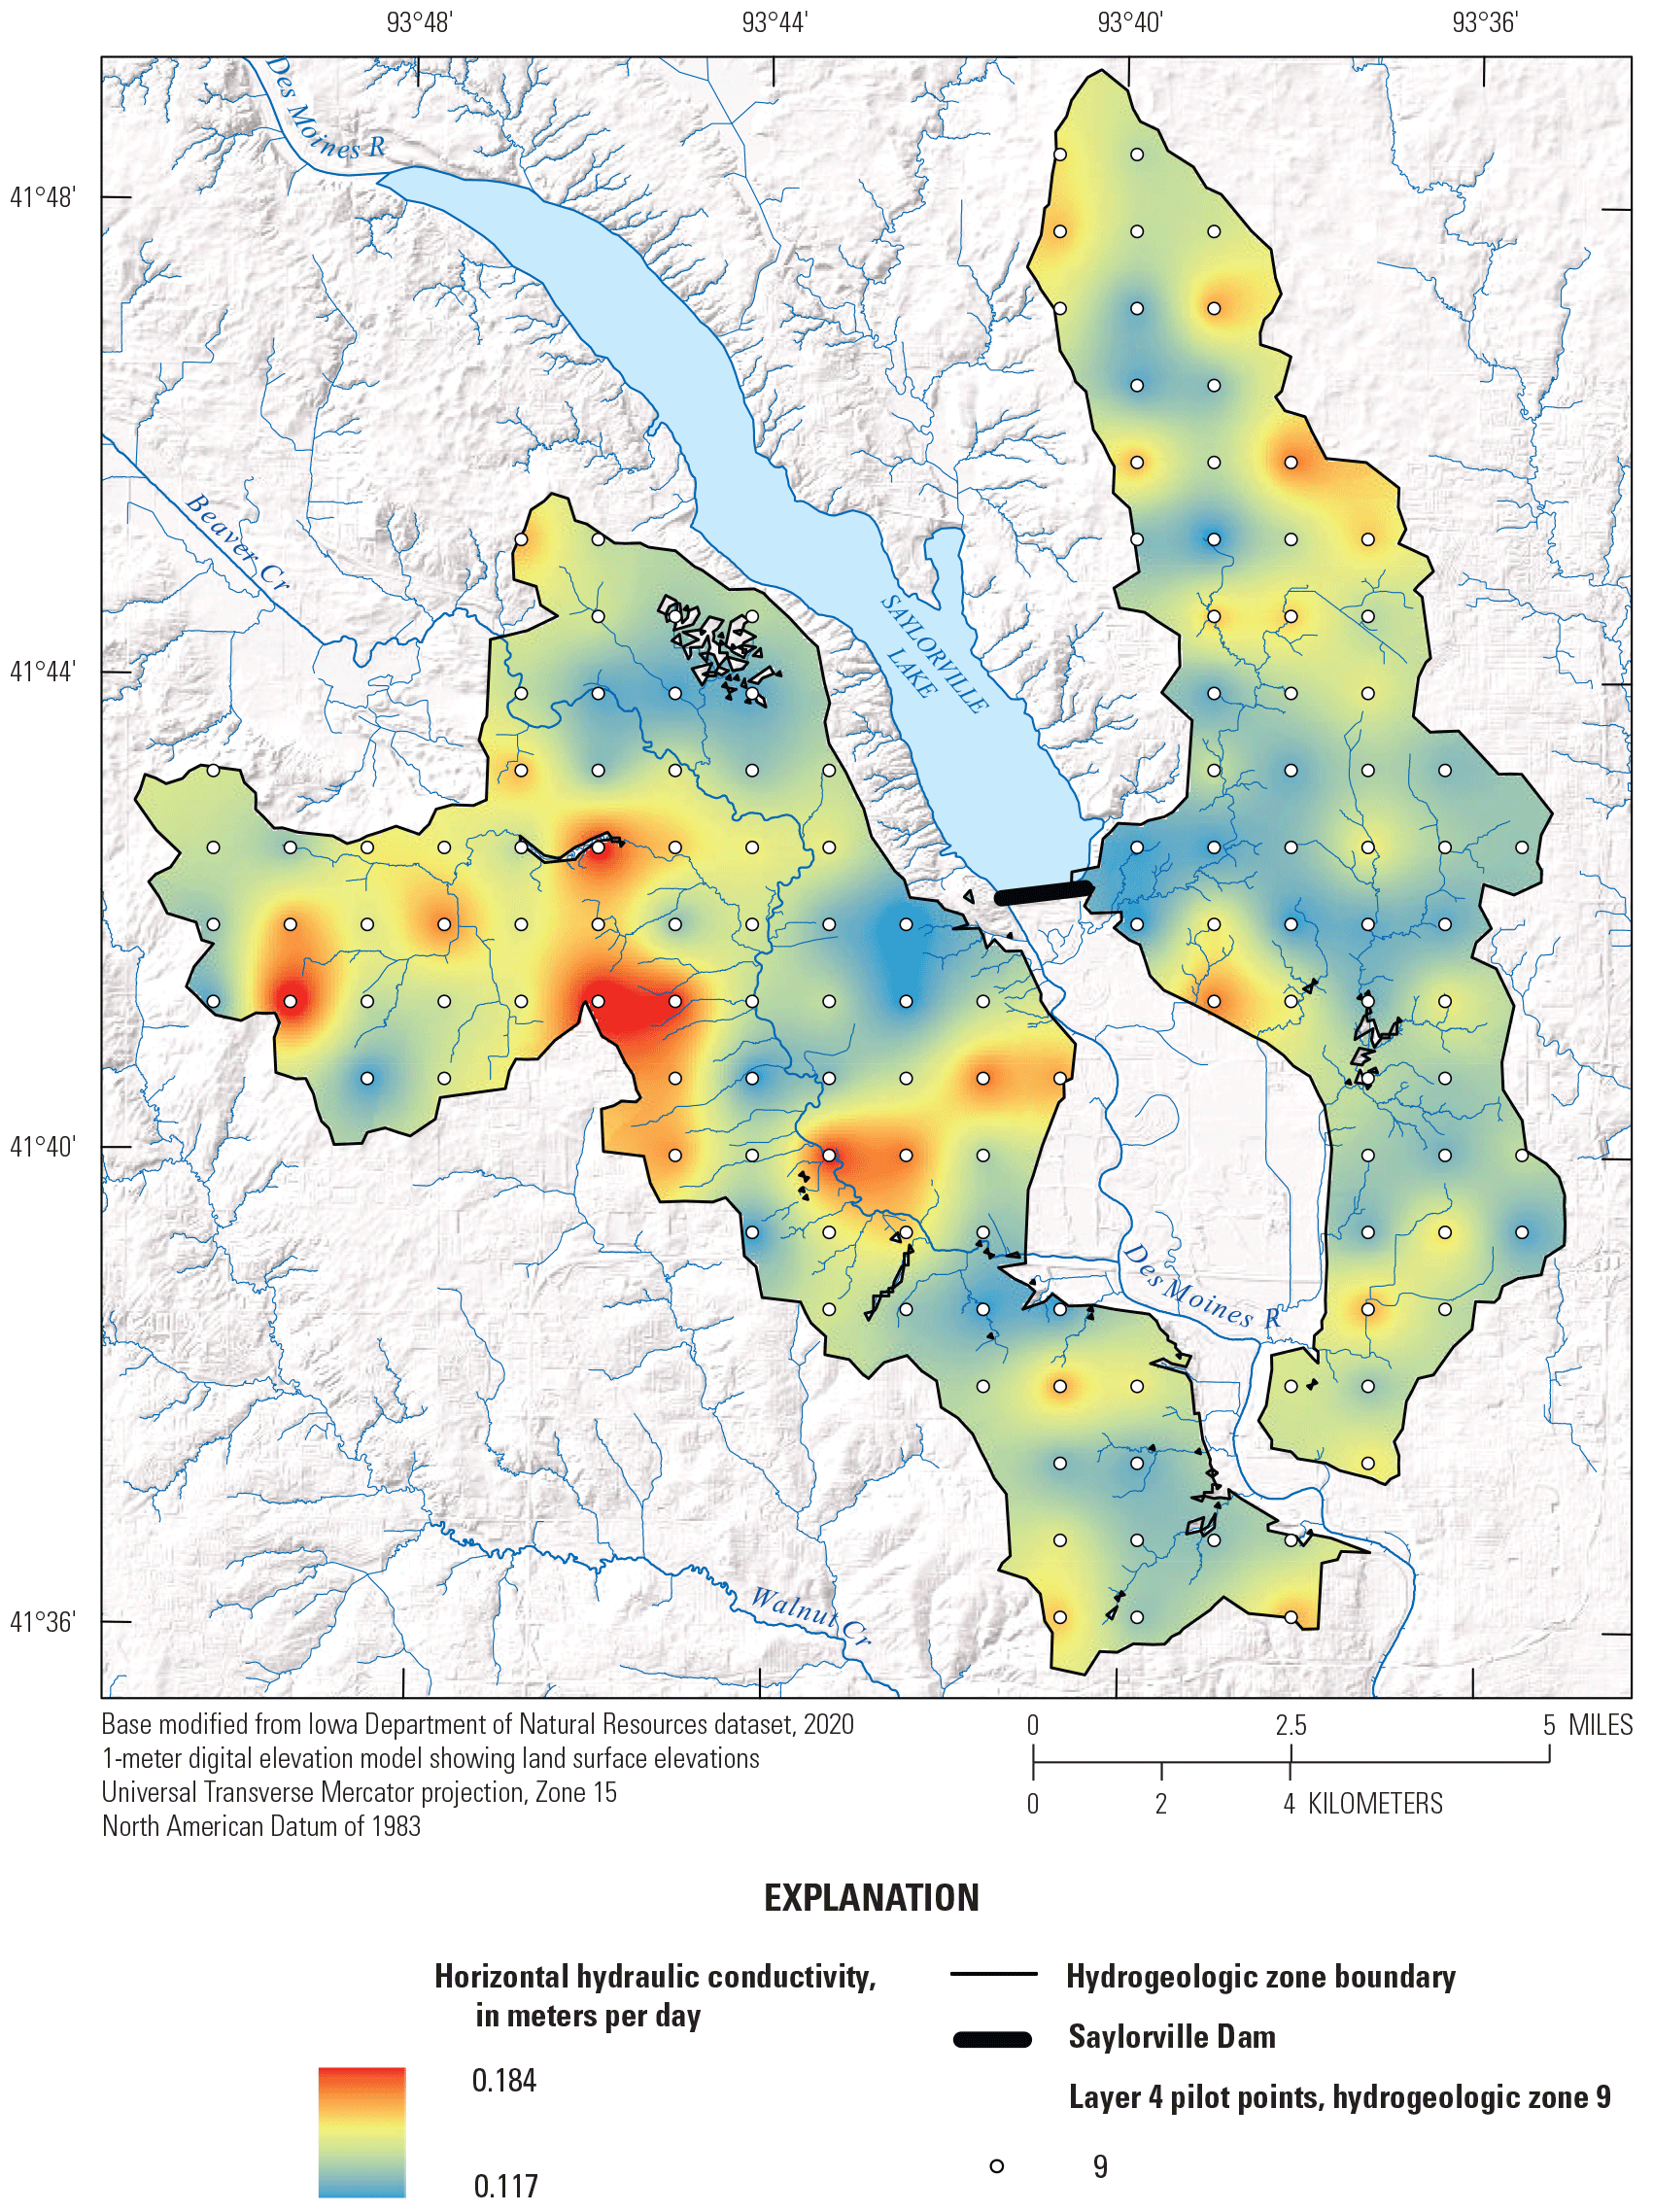
Calibrated horizontal hydraulic conductivity and pilot point locations for layer 4.
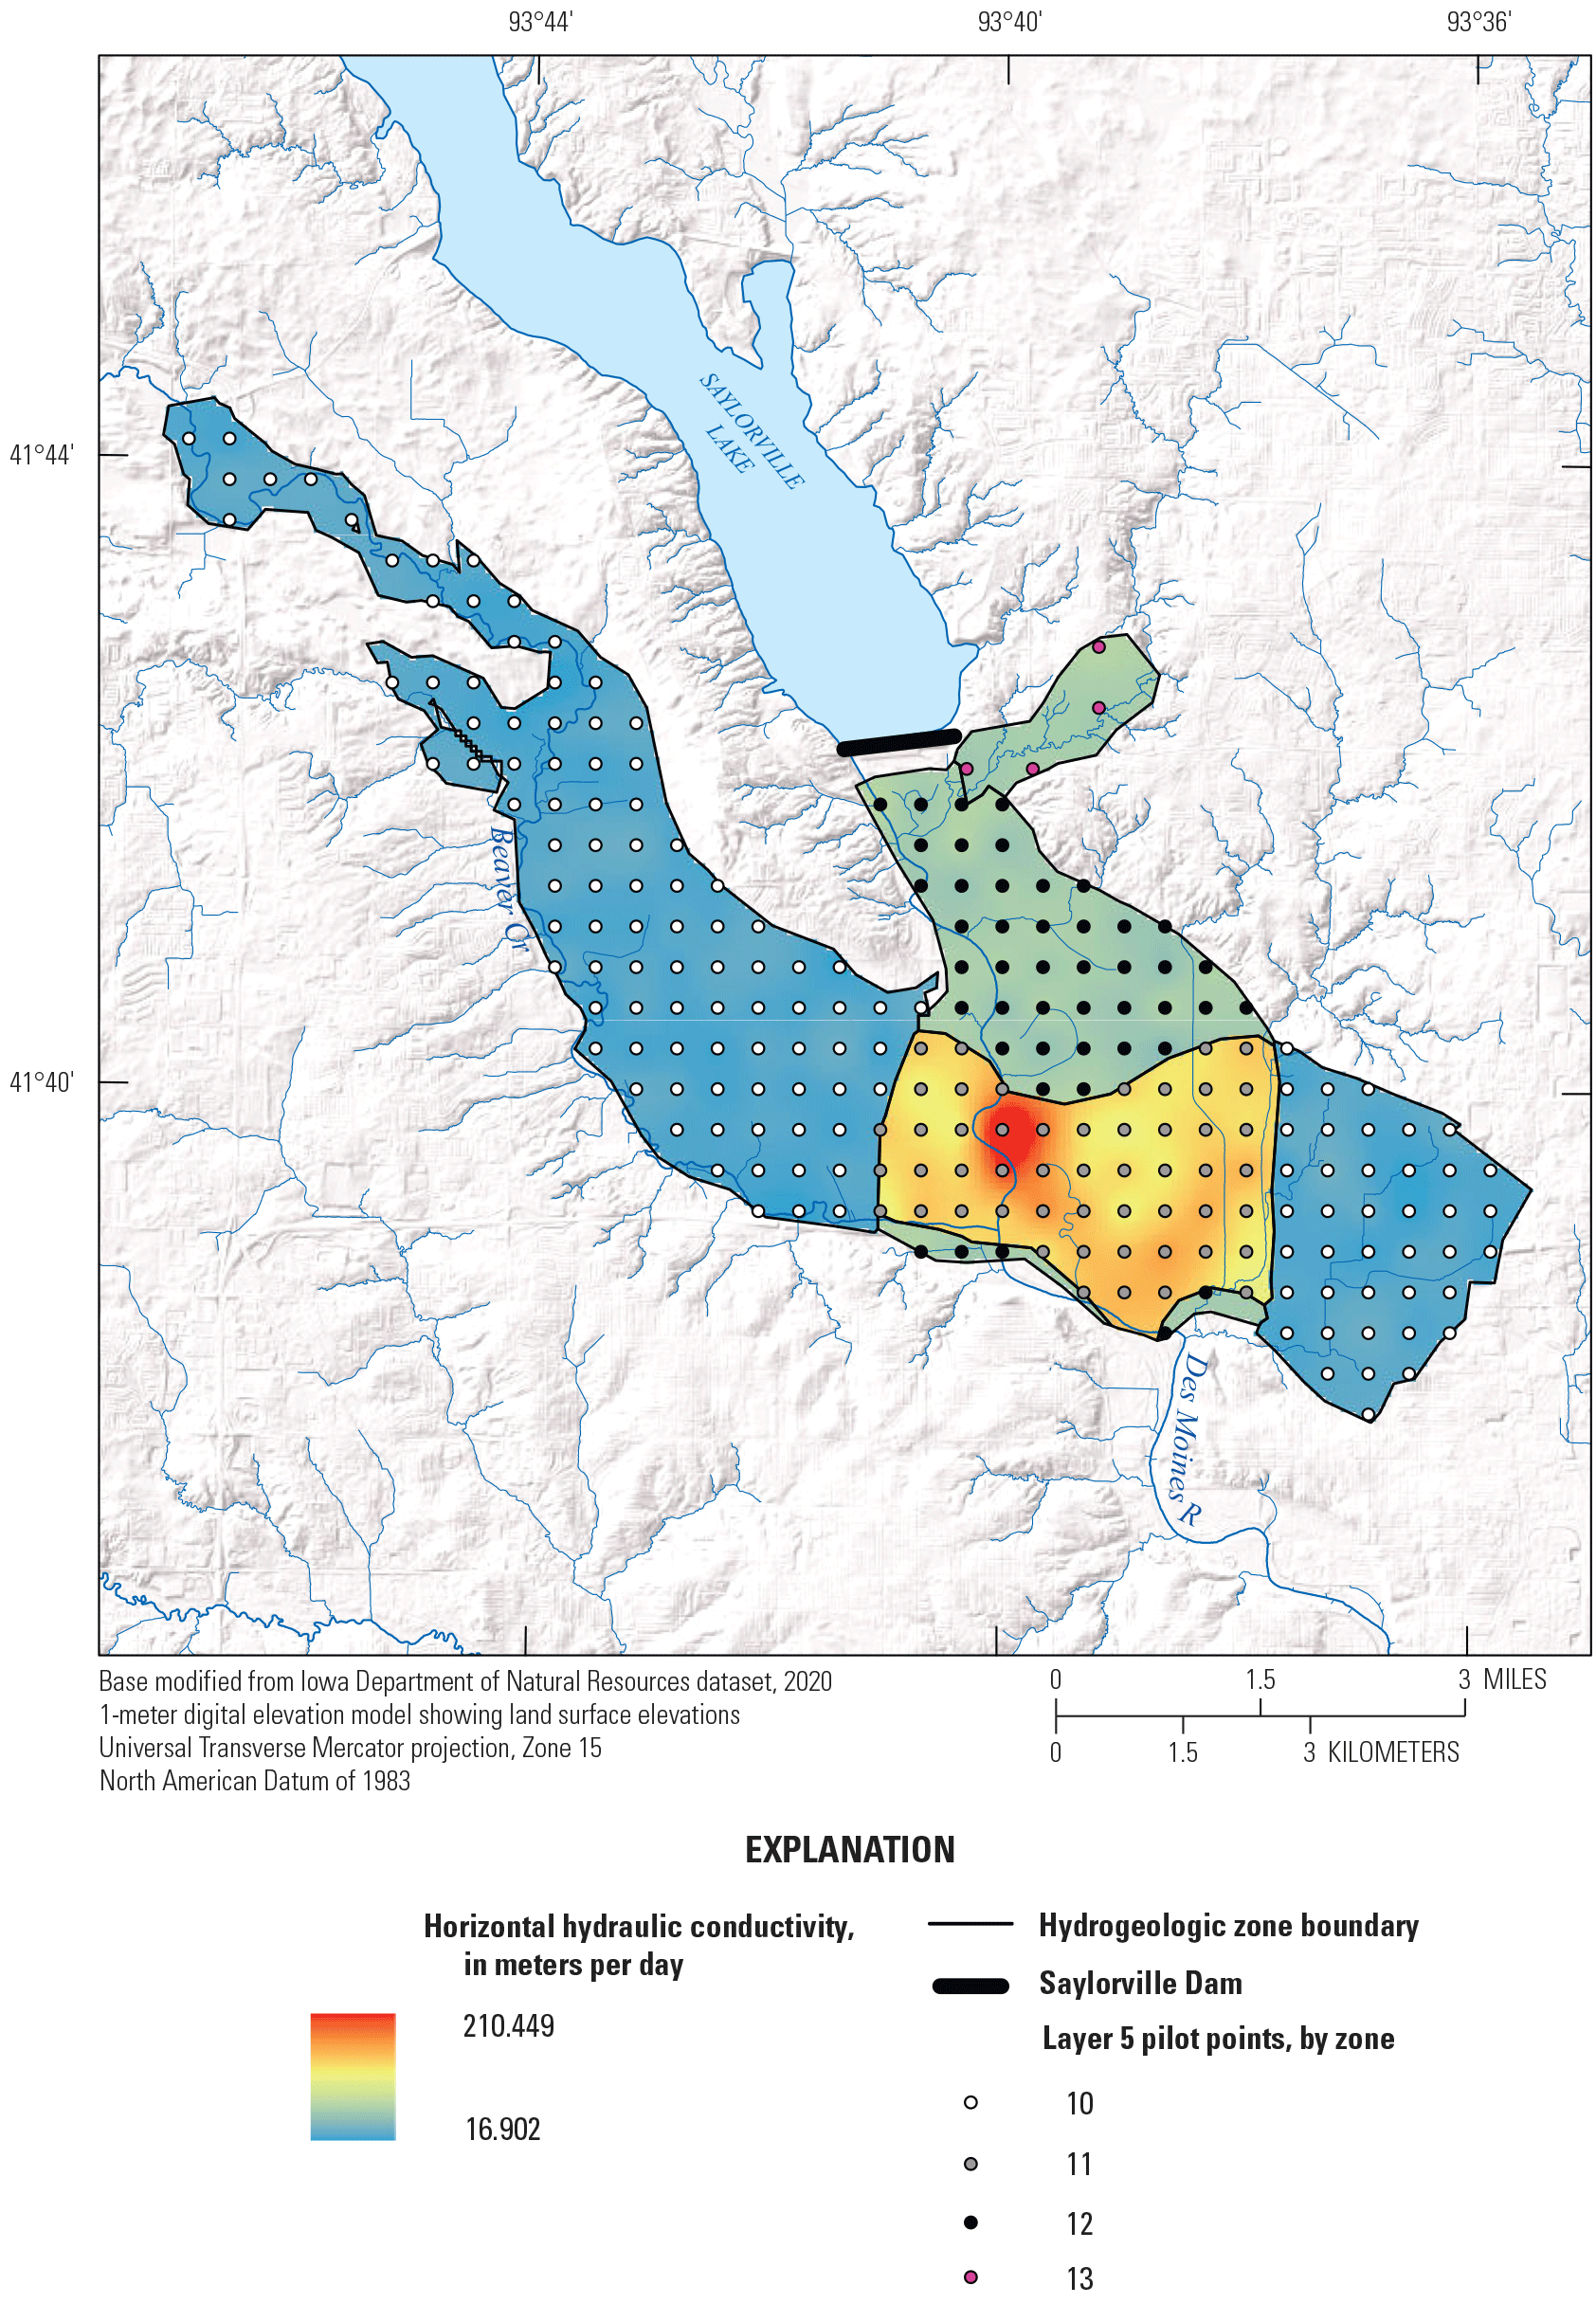
Calibrated horizontal hydraulic conductivity and pilot point locations for layer 5.
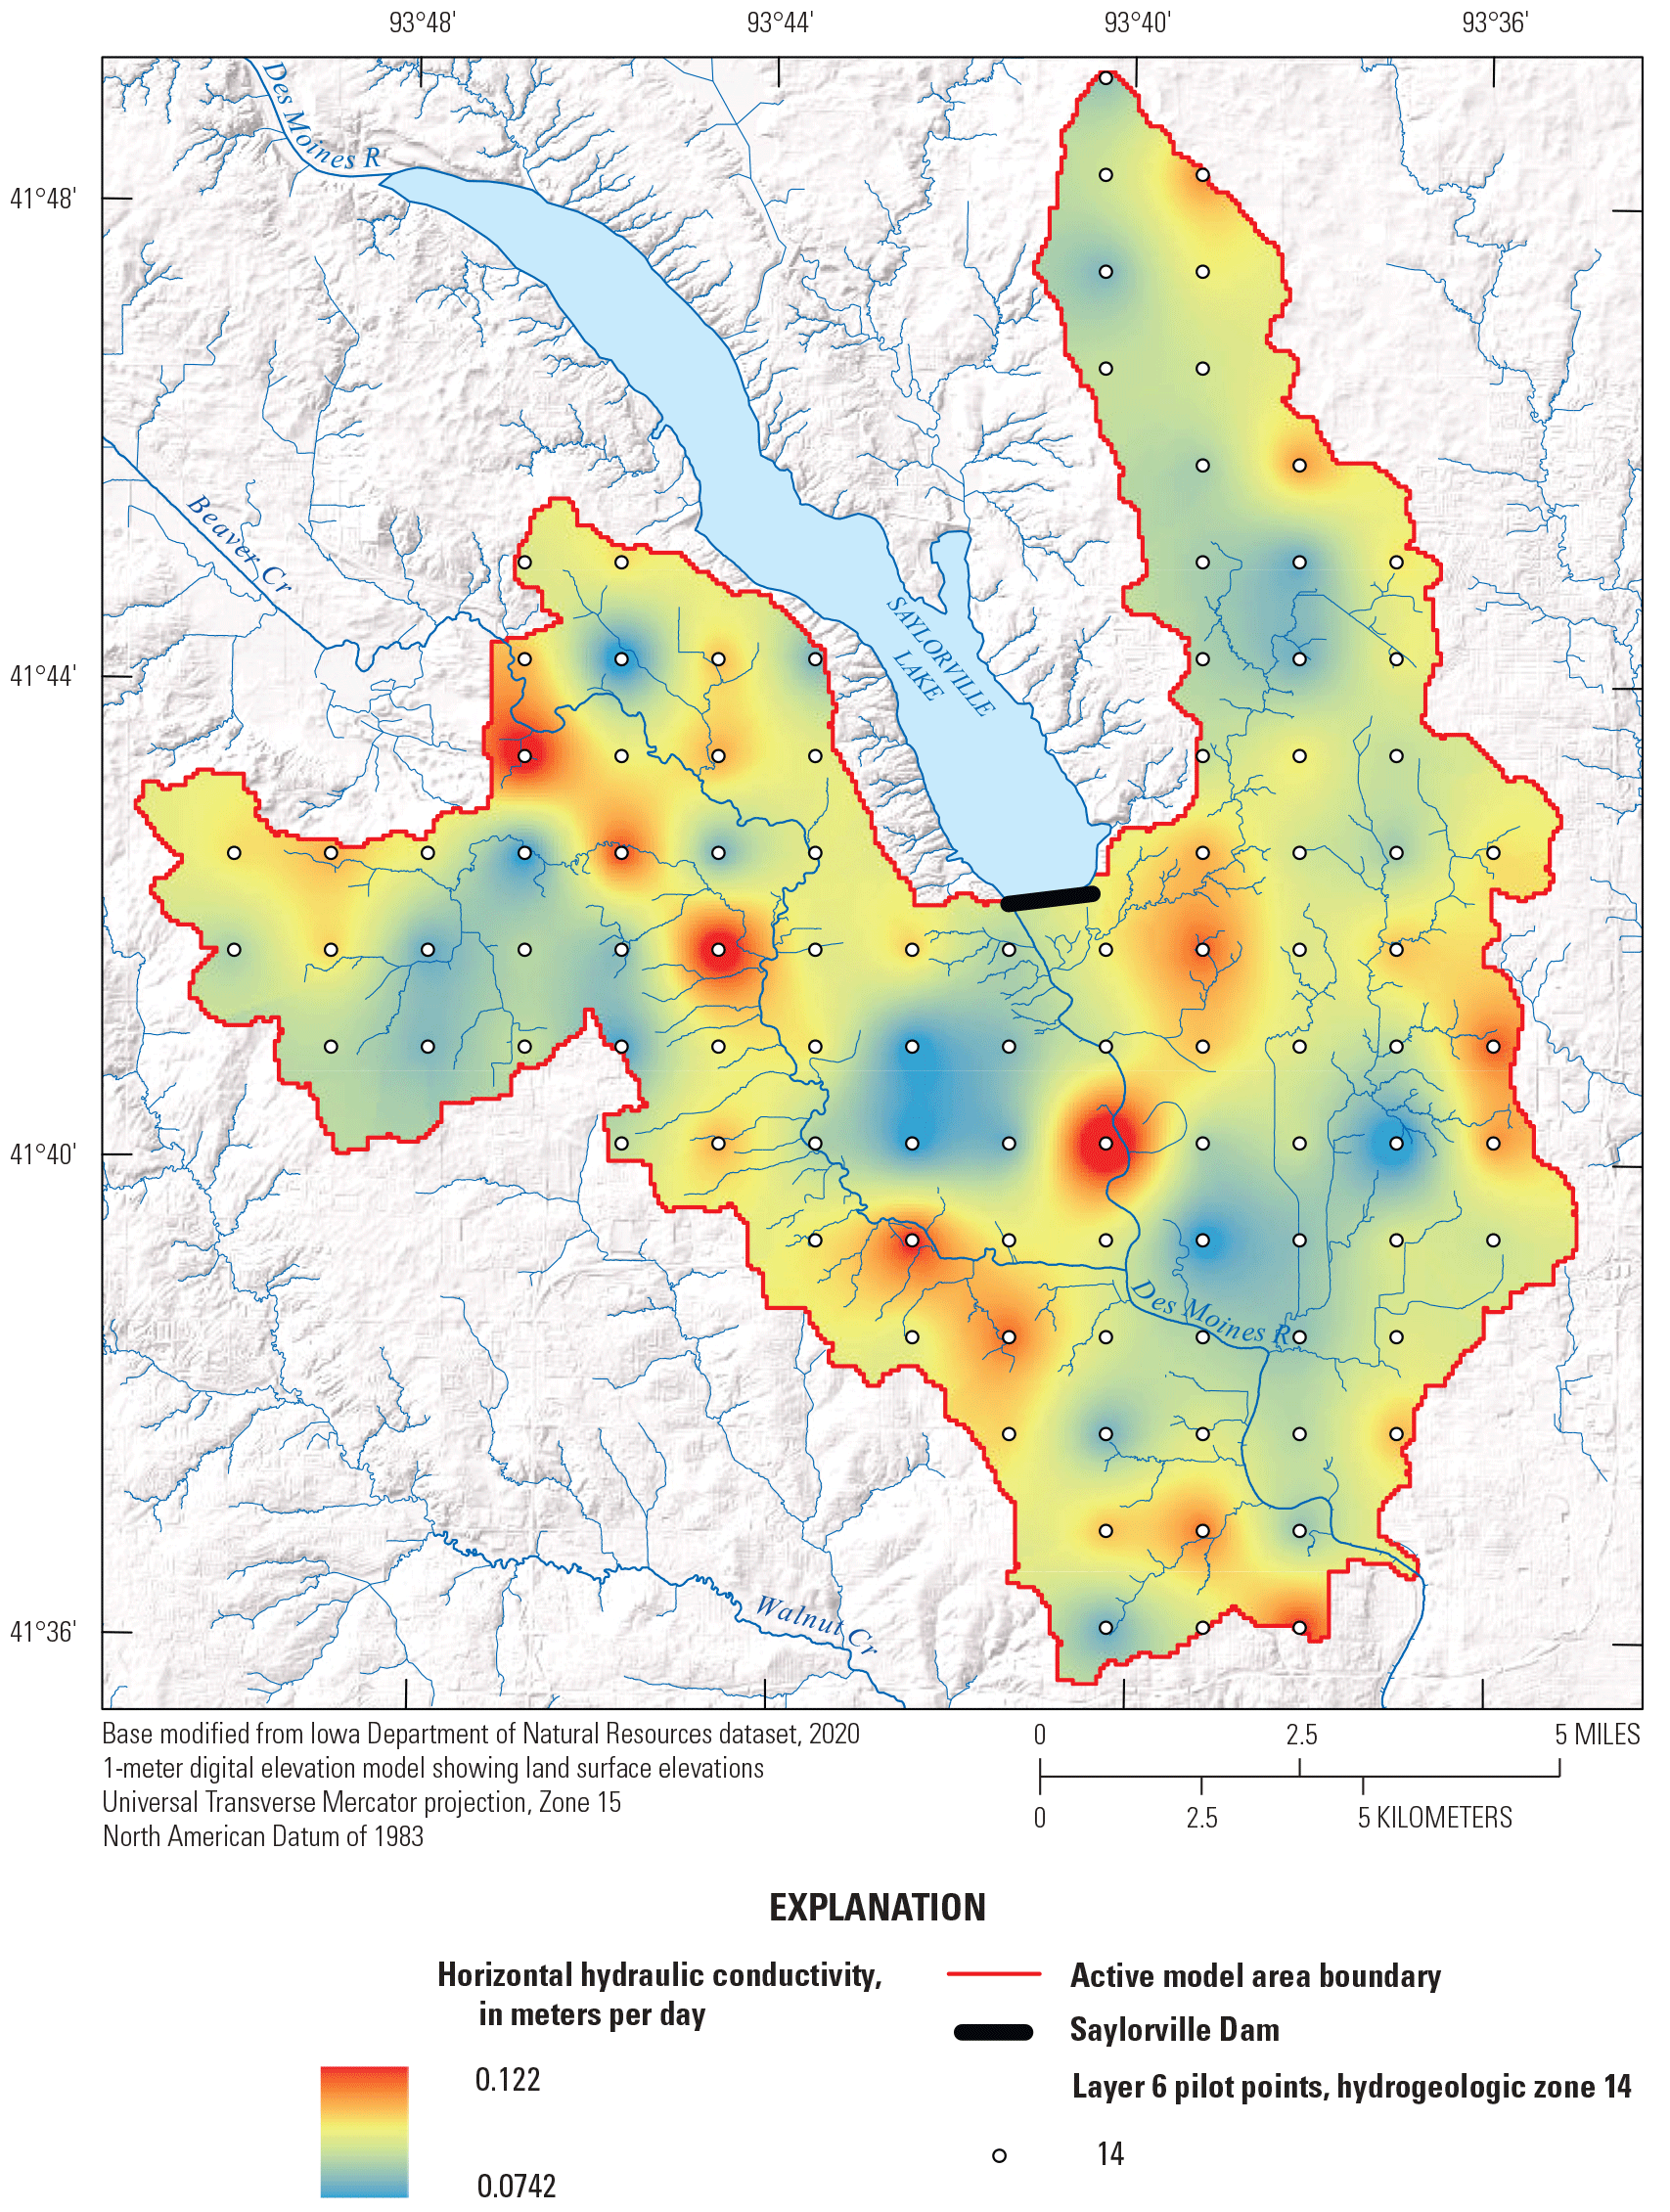
Calibrated horizontal hydraulic conductivity and pilot point locations for layer 6.
Calibrated recharge multipliers for the three soil type zones in layer 1—(1) manmade fill, (2) till and bedrock-based surficial material, and (3) alluvial, eolian, and outwash-based surficial material—were 0.05, 0.208, and 2.09, respectively. These zones are the same as the hydraulic conductivity parameterization zones in layer 1, delineated in figure 13. The calibrated recharge multiplier for till- and bedrock-based surficial material (0.208) is much smaller than the initial estimate of 0.5, while the calibrated value for alluvial, eolian, and outwash-based surficial material (2.09) is higher than the initial estimate of 1 (table 7).
Table 7.
Initial and calibrated model parameter values for other parameters.[SFR, Streamflow Routing Package; --, no data or not applicable; HRU, hydrologic response units; SE, southeast; NW, northwest]
Comparison of Observed and Simulated Water levels
Model performance was assessed on its ability to match hydraulic observations of interest, including water level elevations, monthly average changes in water levels (water level changes), minimum design water levels for the RCWs, and monthly average streambed flux. Plots comparing observed and simulated water levels at the RCWs (fig. 19) and other observation wells (fig. 20) demonstrate the ability of the model to simulate observed water levels at the RCWs and to satisfy the RCW minimum design water level (figs. 19–20). In addition, observed and simulated water table elevations were plotted and compared to a 1:1 perfect-fit line for 119 wells with single water level measurements used as calibration data (figs. 21A, B; table 4). The model accurately simulated water levels and seasonal water level fluctuations at the RCWs, and it accurately simulated water table levels above the RCW design minimum level for all stress periods with RCW water level observation data (figs. 19A, B). Average absolute value water level residuals for the model period with available observations are 1.20 m at RCW1 and 1.49 m at RCW2 (Davis and Bristow, 2024). The water level scatter plot demonstrates a slight positive bias in simulated water levels (figs. 21A, B). Comparison of model output water levels to observed values by layer is instructive. The average absolute value of residuals in layers 2 and 5 (the model layers representing the alluvial aquifer) is 1.57 m and 2.47 m, respectively, while that in layer 6 (bedrock) is 24.22 m (table 8). Layer 6 represents a homogenous shale bedrock confining unit for this model, which is appropriate for the model’s focus on the alluvial aquifer. Water level observations assigned to layer 6 are likely representative of water levels in deeper bedrock aquifers that are not connected to the alluvial aquifer targeted in this model and are thus poorly simulated by this model.
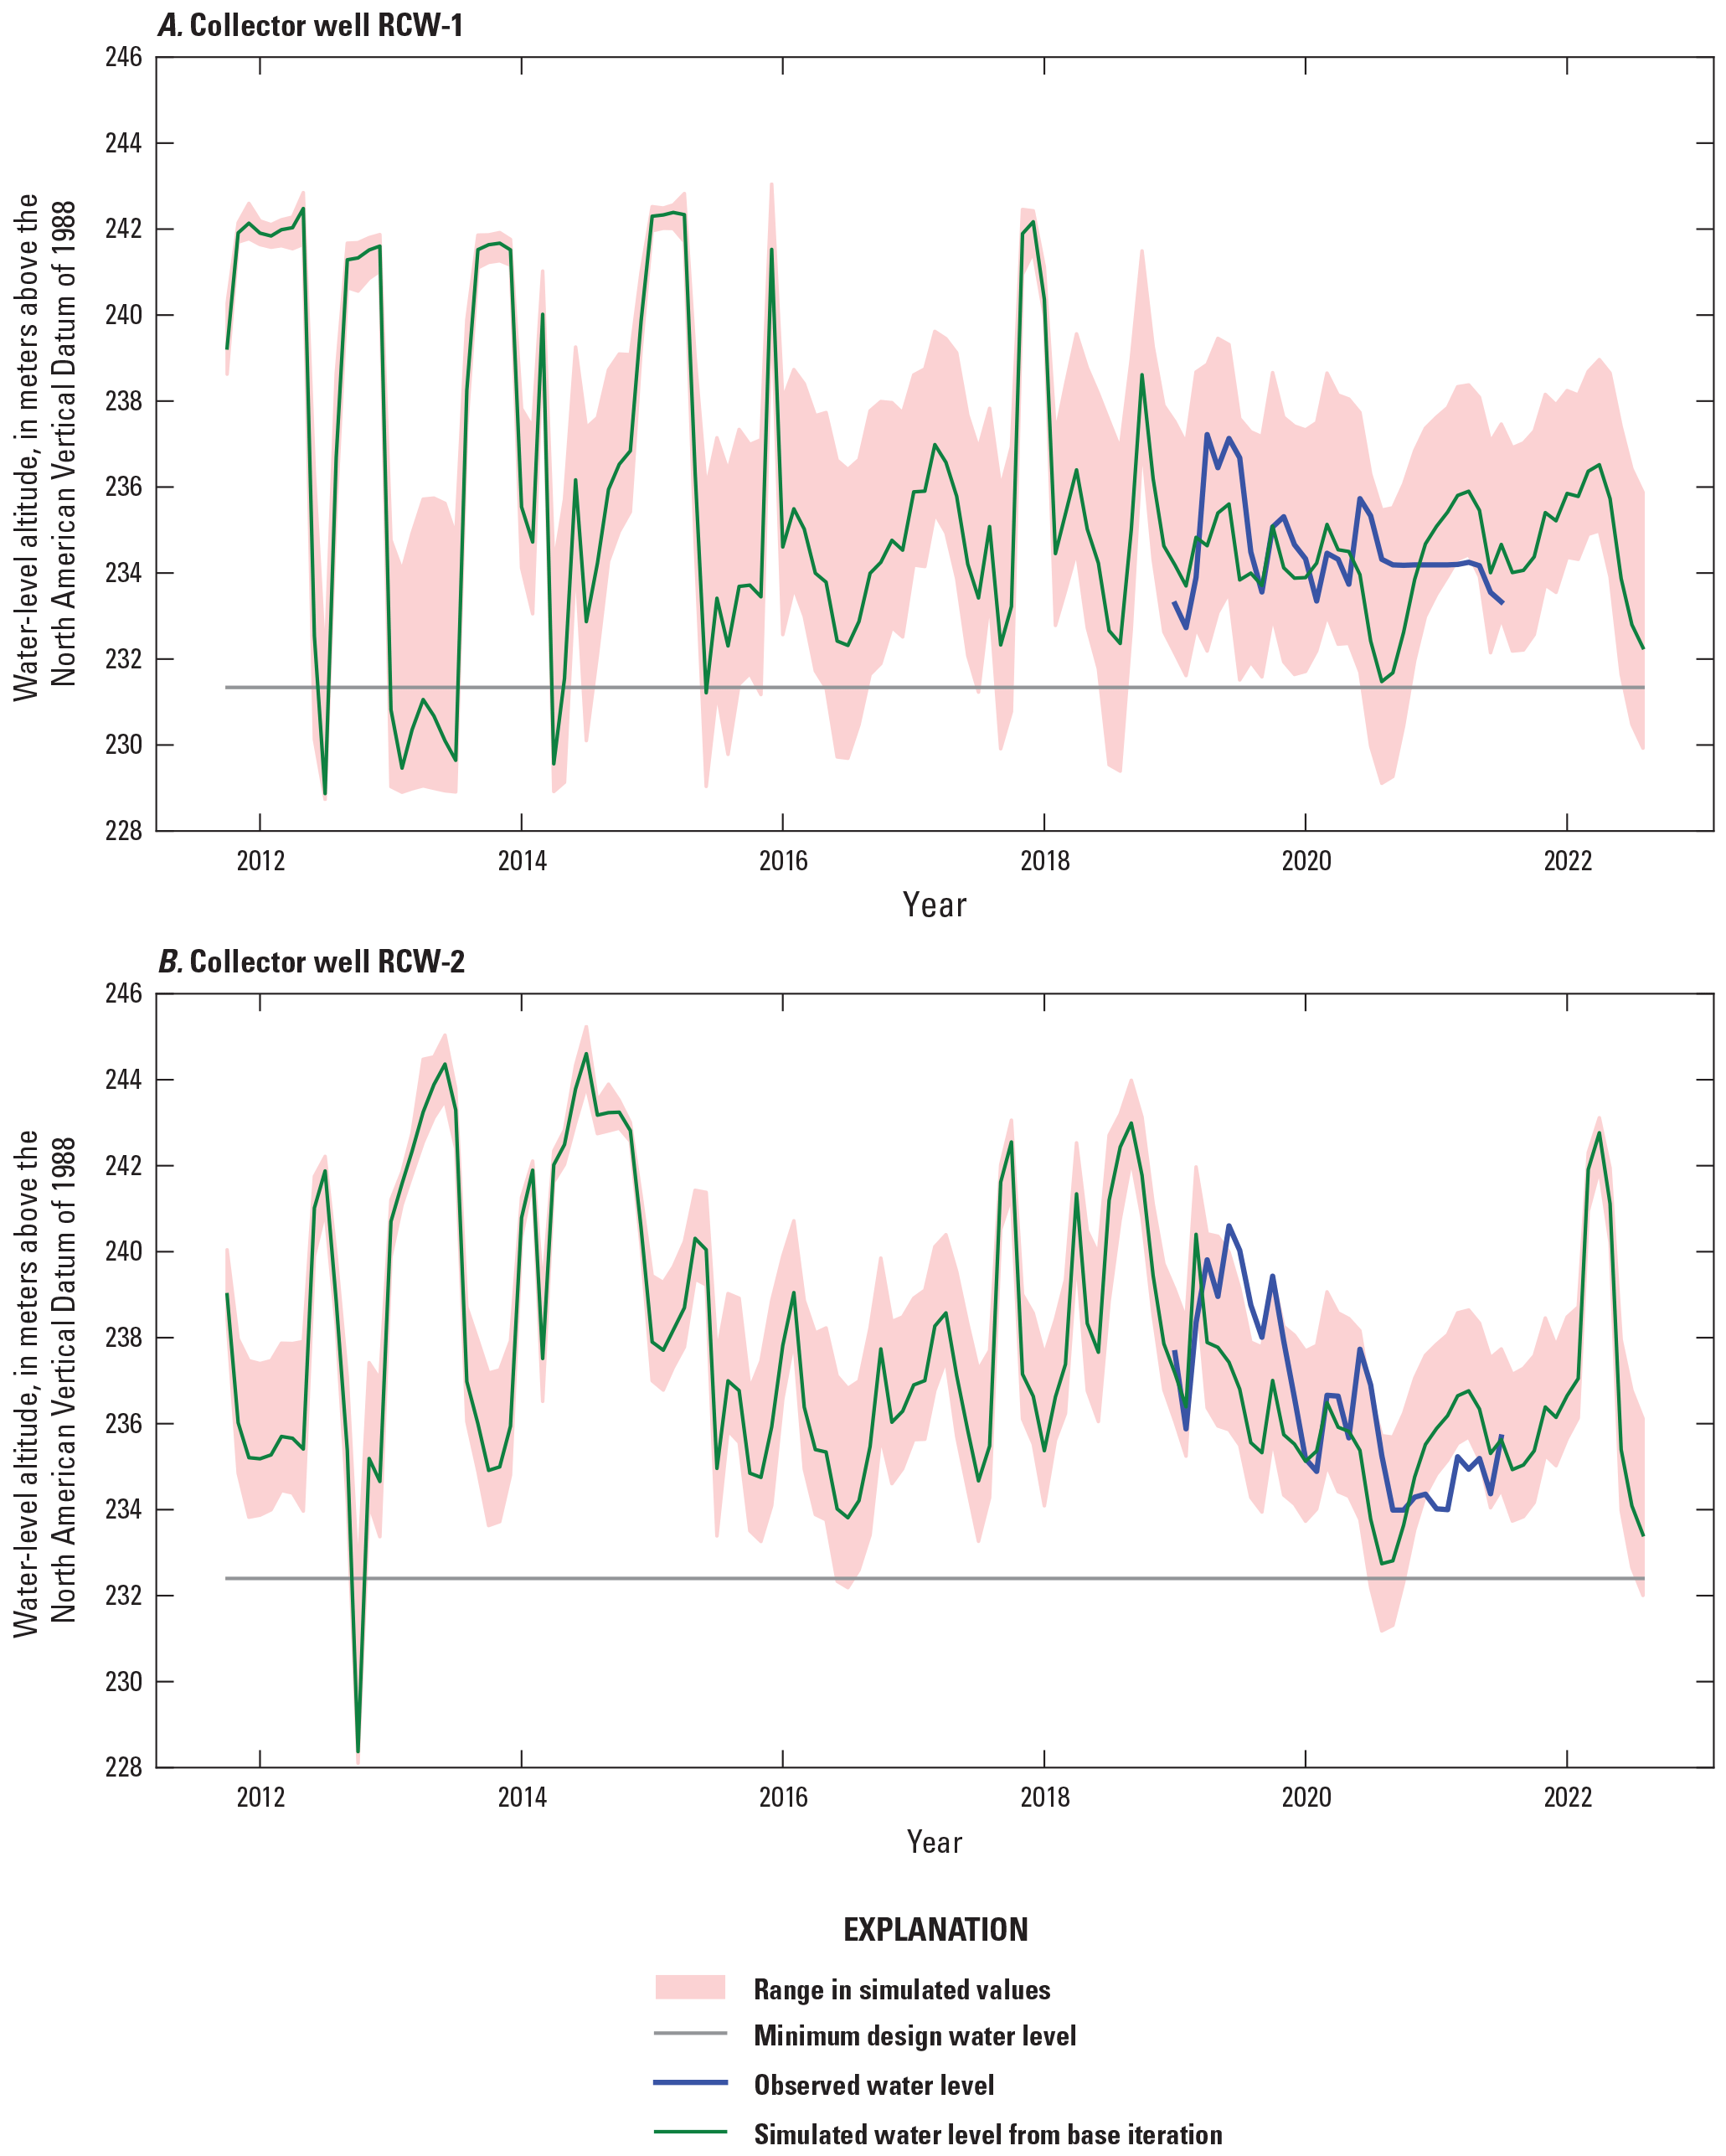
Comparison of observed (Dylan Hart, Black & Veatch Corporation, written commun., 2023) and simulated (Davis and Bristow, 2024) water levels for Radial Collector Wells (RCW[s]), A, RCW1 and, B, RCW2, with minimum design water level elevations shown for each well.
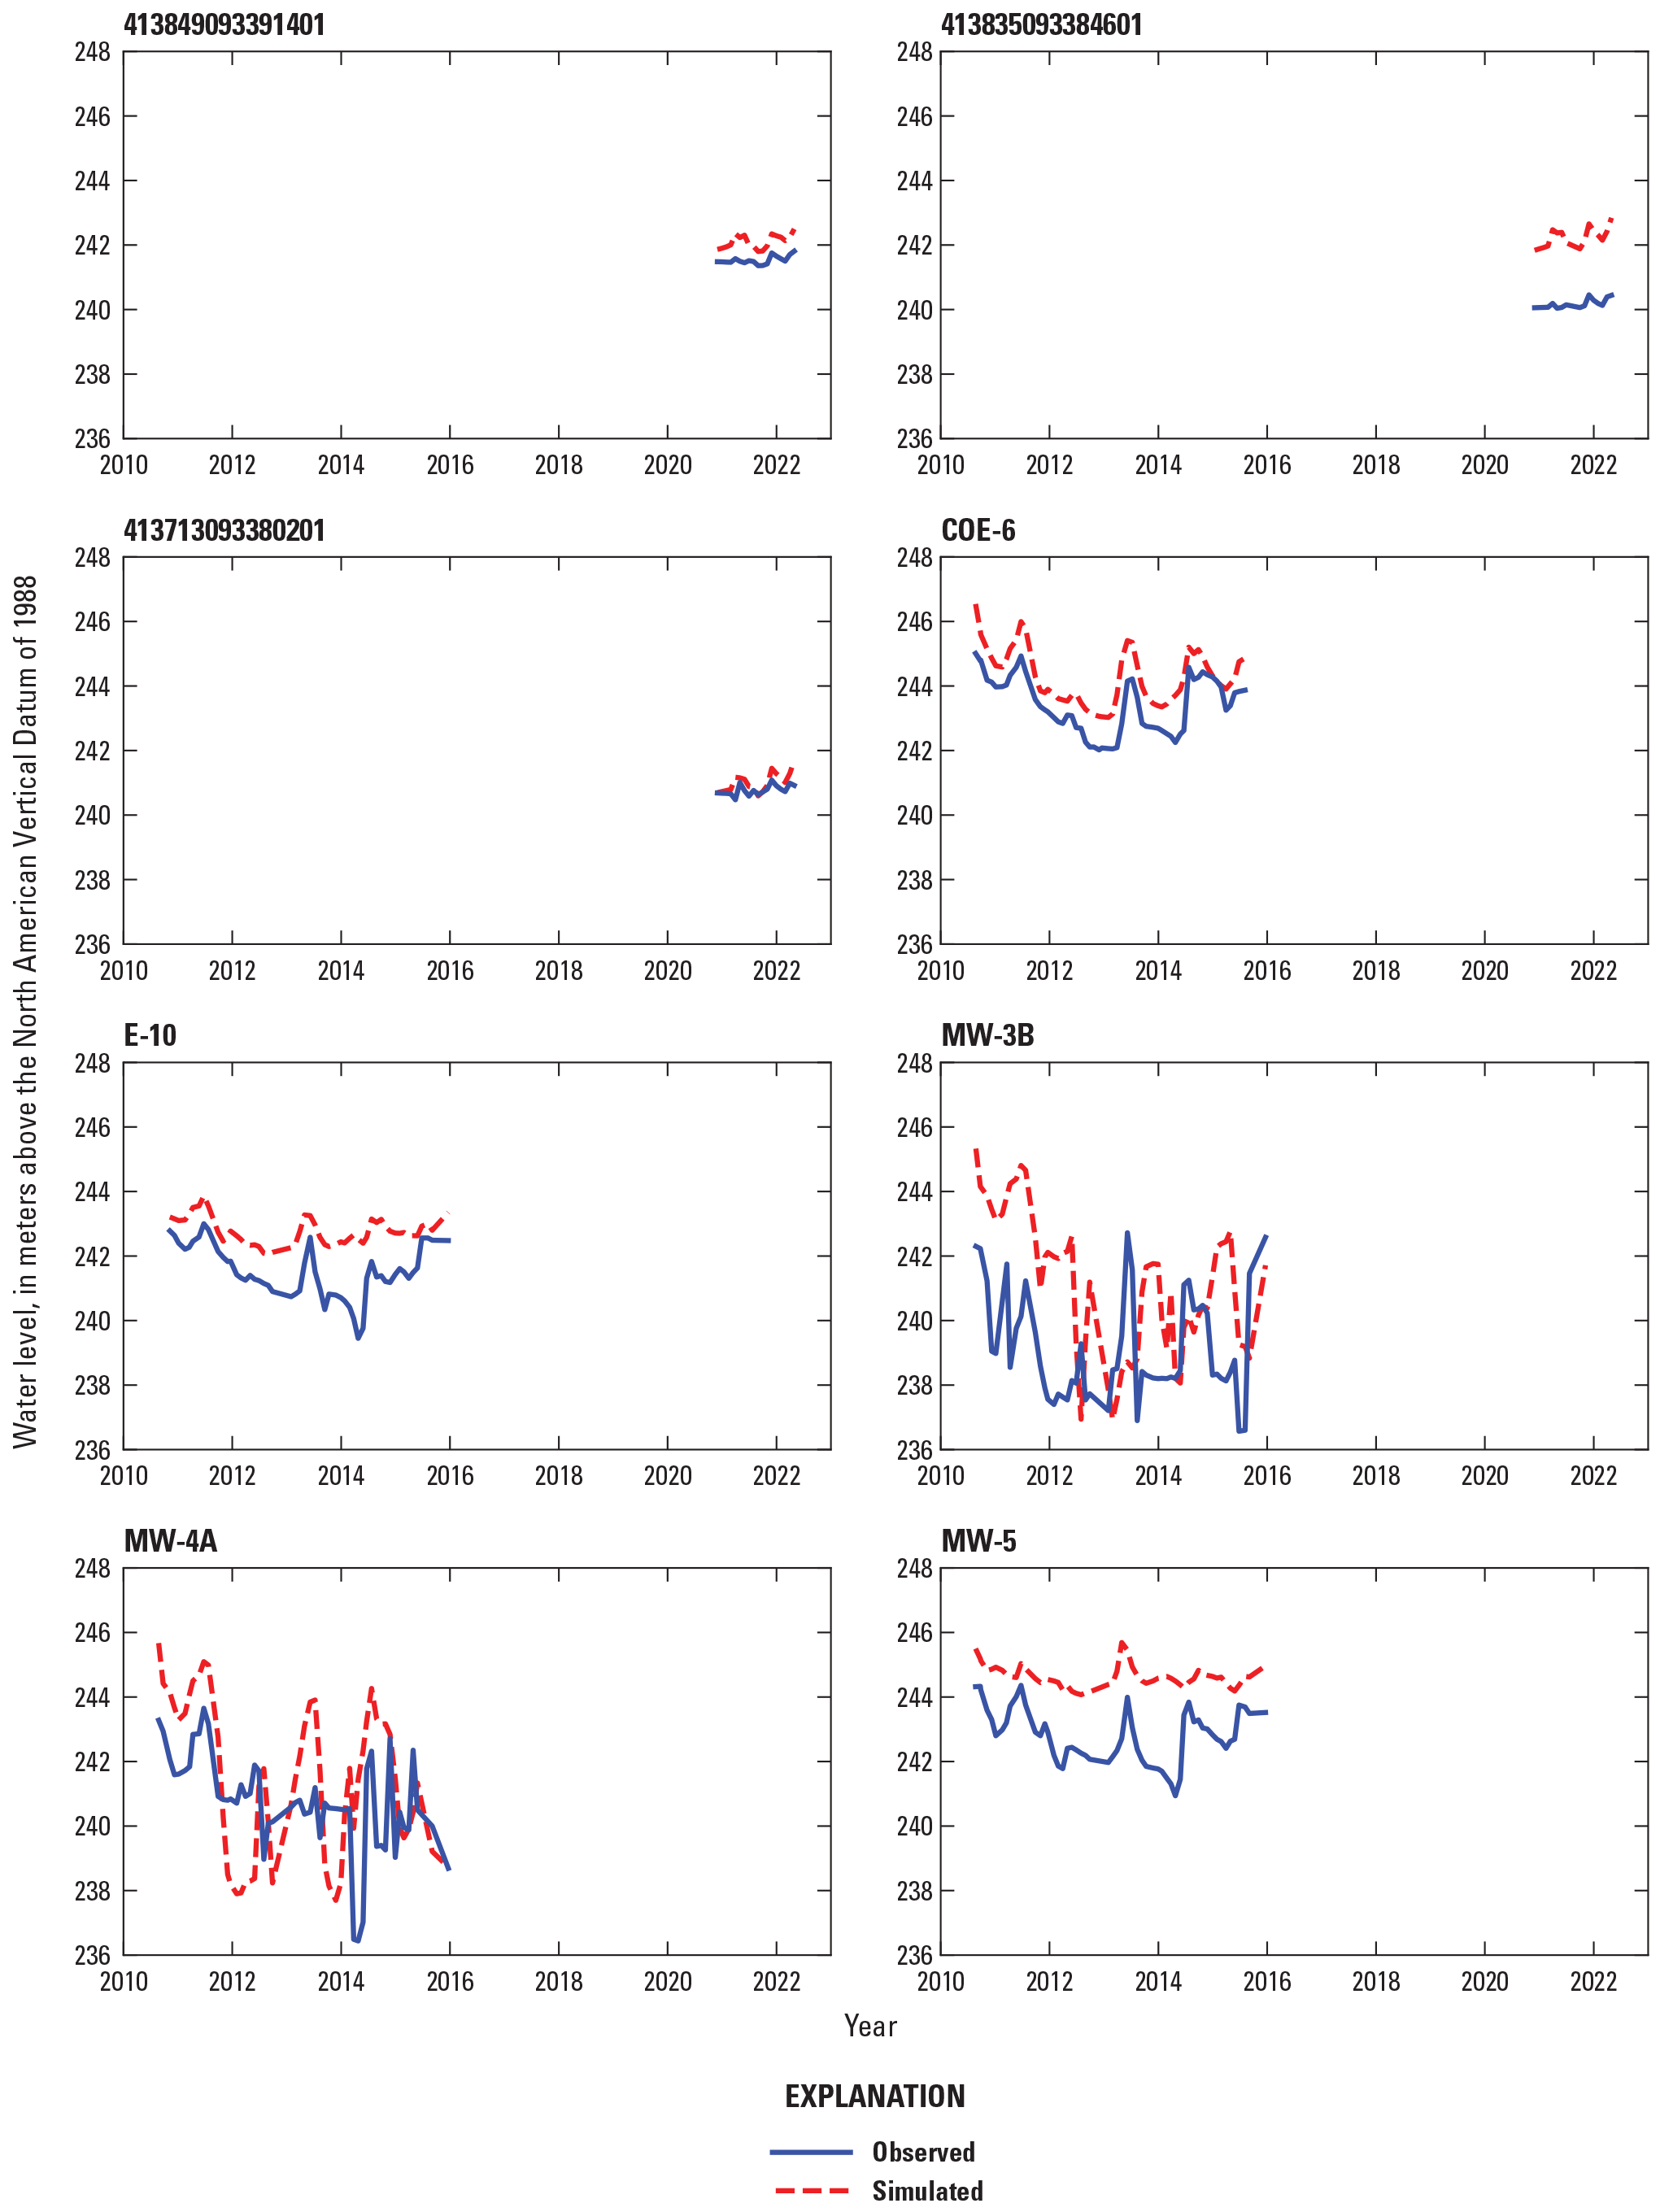
Hydrographs of observed (U.S. Geological Survey, 2023d) and simulated (Davis and Bristow, 2024) water levels for selected wells used as water level and water level change observations during numerical groundwater model calibration. Data shown for 2010 through 2023. All these wells are screened in model layer 5.
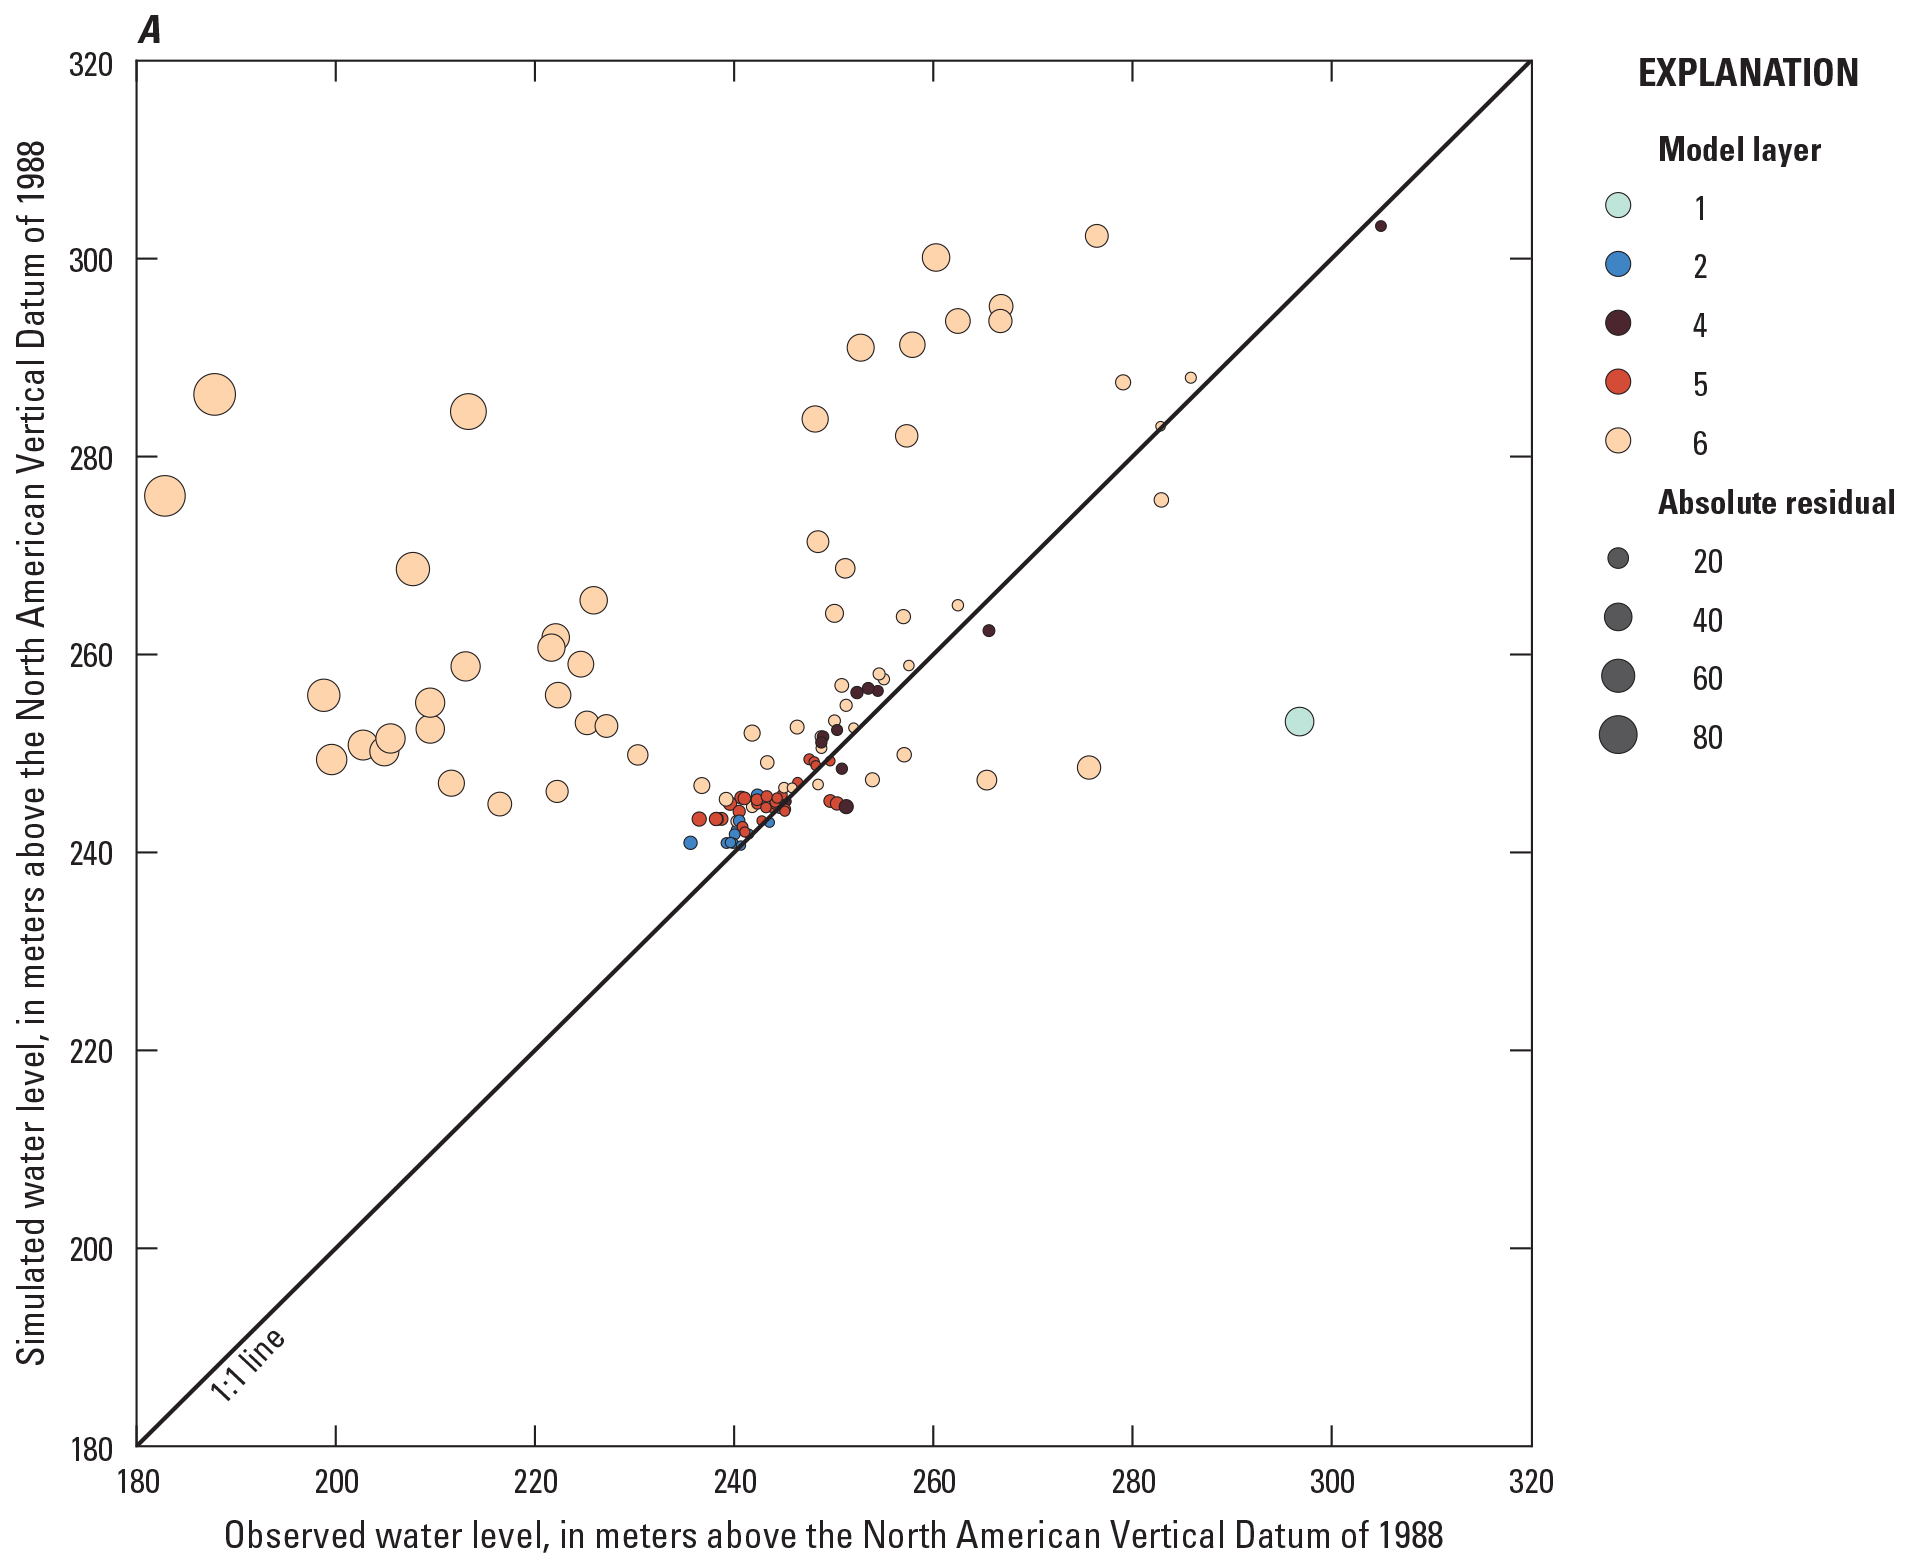
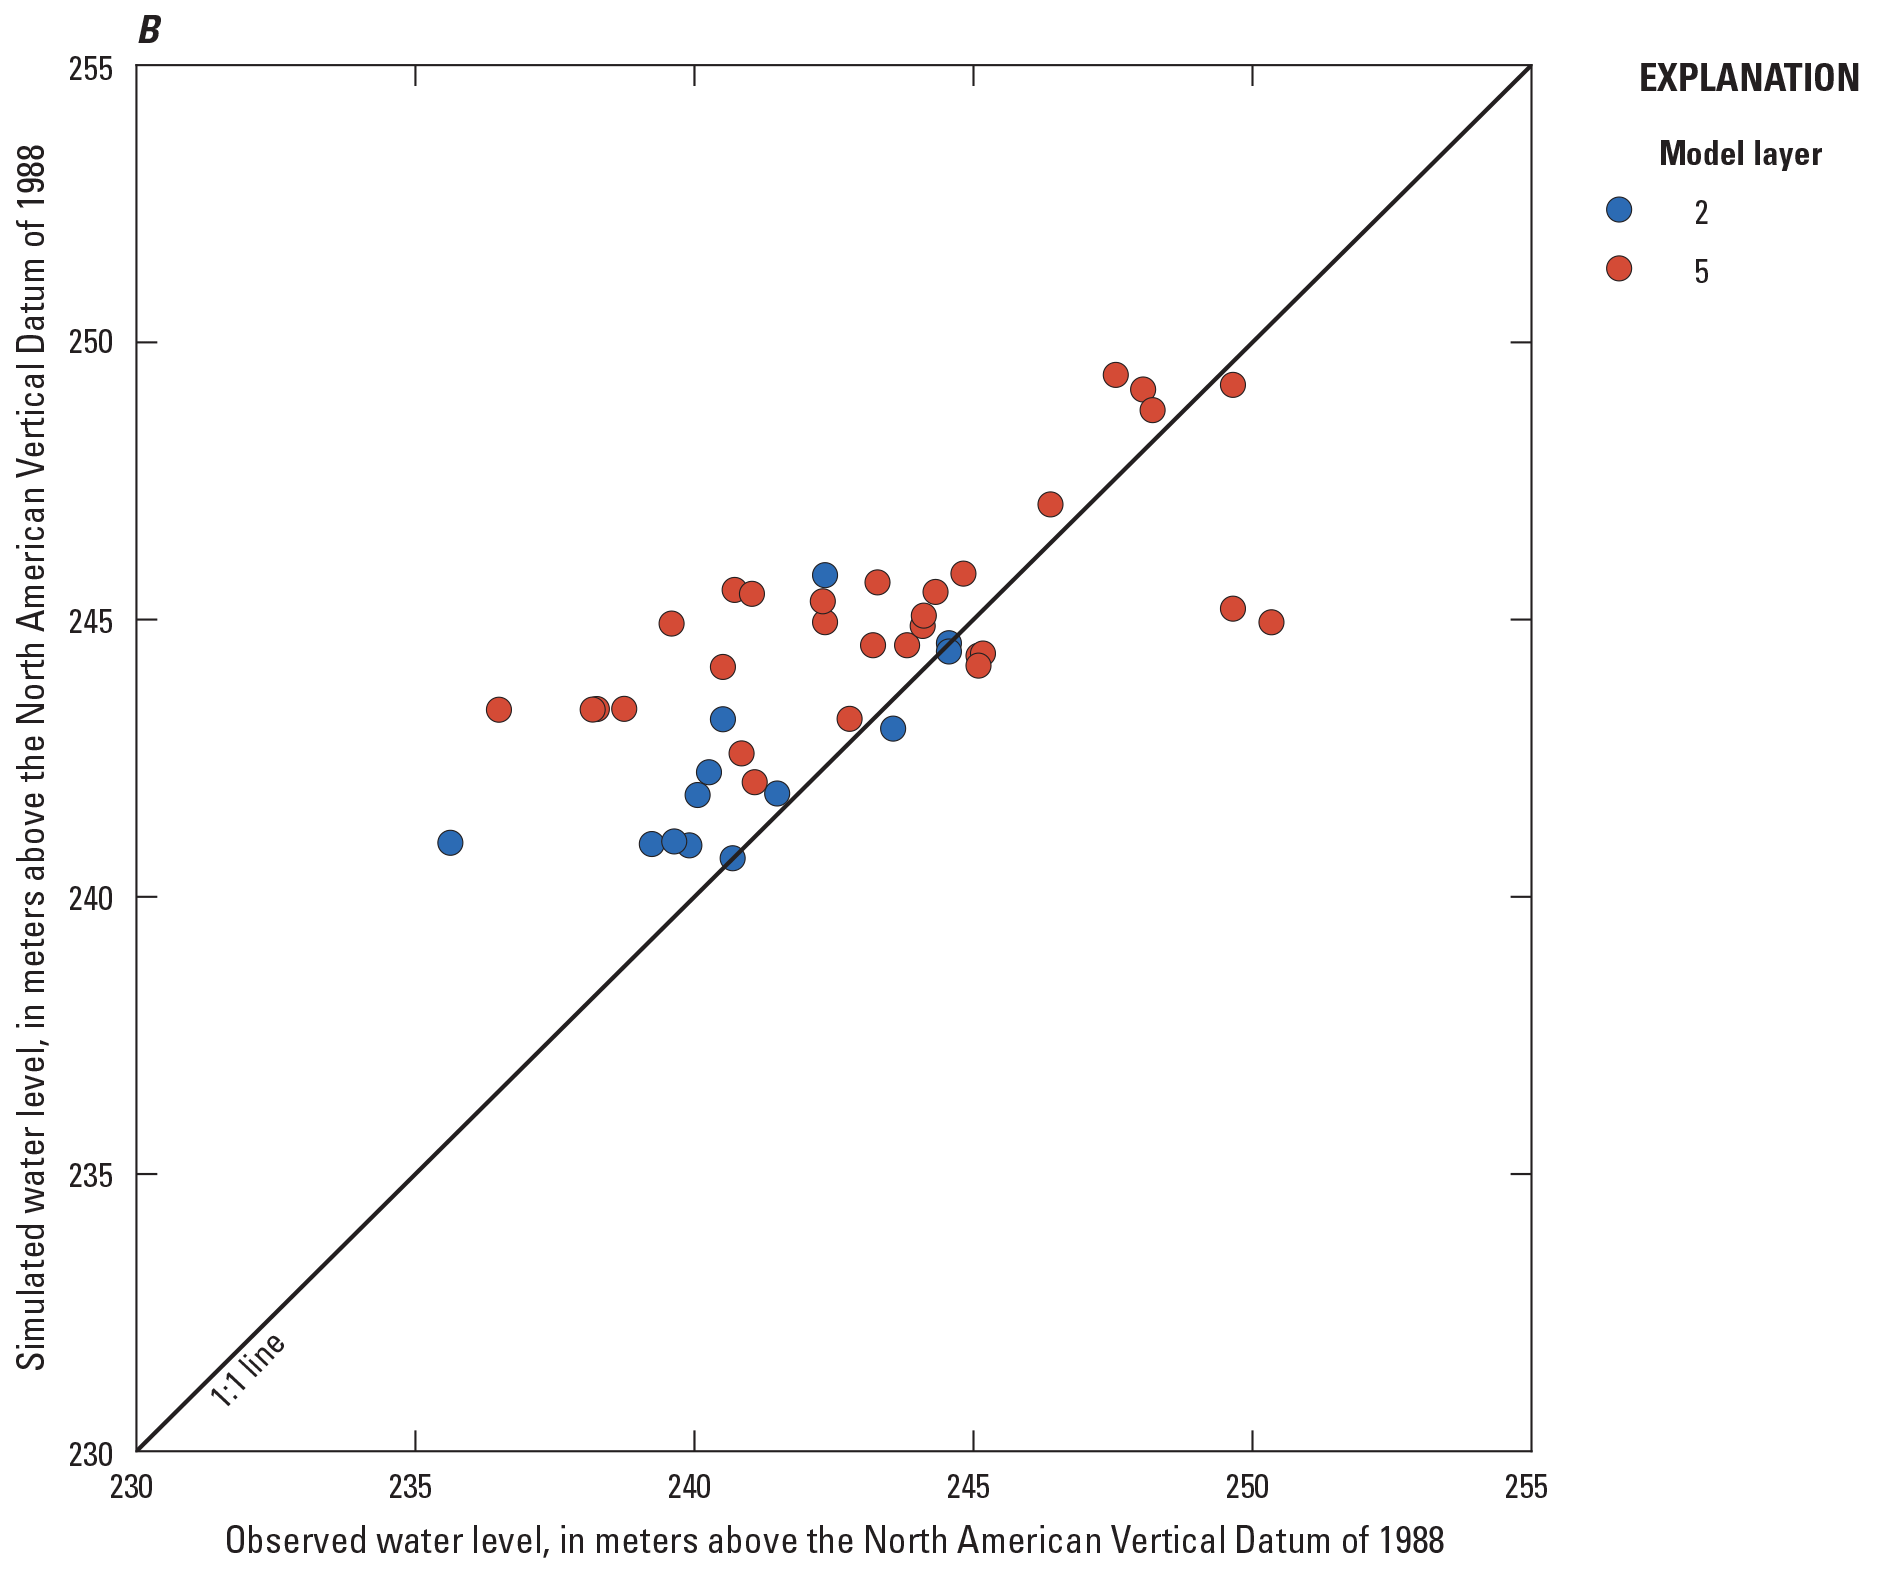
Comparison of observed (Iowa Geological Survey, 2022; Vern Rash, Des Moines Water Works, written commun., 2022; U.S. Geological Survey, 2023d) and simulated (Davis and Bristow, 2024) water level elevations for observation wells in A, all model layers in the model area and, B, at observation wells in the Des Moines River alluvial aquifer.
Simulated Groundwater Budgets
Simulated groundwater budgets were calculated using Zone Budget version 6, a program packaged with MODFLOW 6 that characterizes model inflows and outflows specified in the model output files. Water budgets with model inflows and outflows were calculated for each monthly stress period of the transient model (table 9; fig. 22). The average water budget, in cubic meters per day, for the entire transient model period (1980 through 2022) is provided in table 9, along with the average water budget before and after the introduction of RCWs. Water budgets were also averaged into annual total flux volumes (fig. 22). All zone budget output files are available in the data release accompanying this report (Davis and Bristow, 2024).
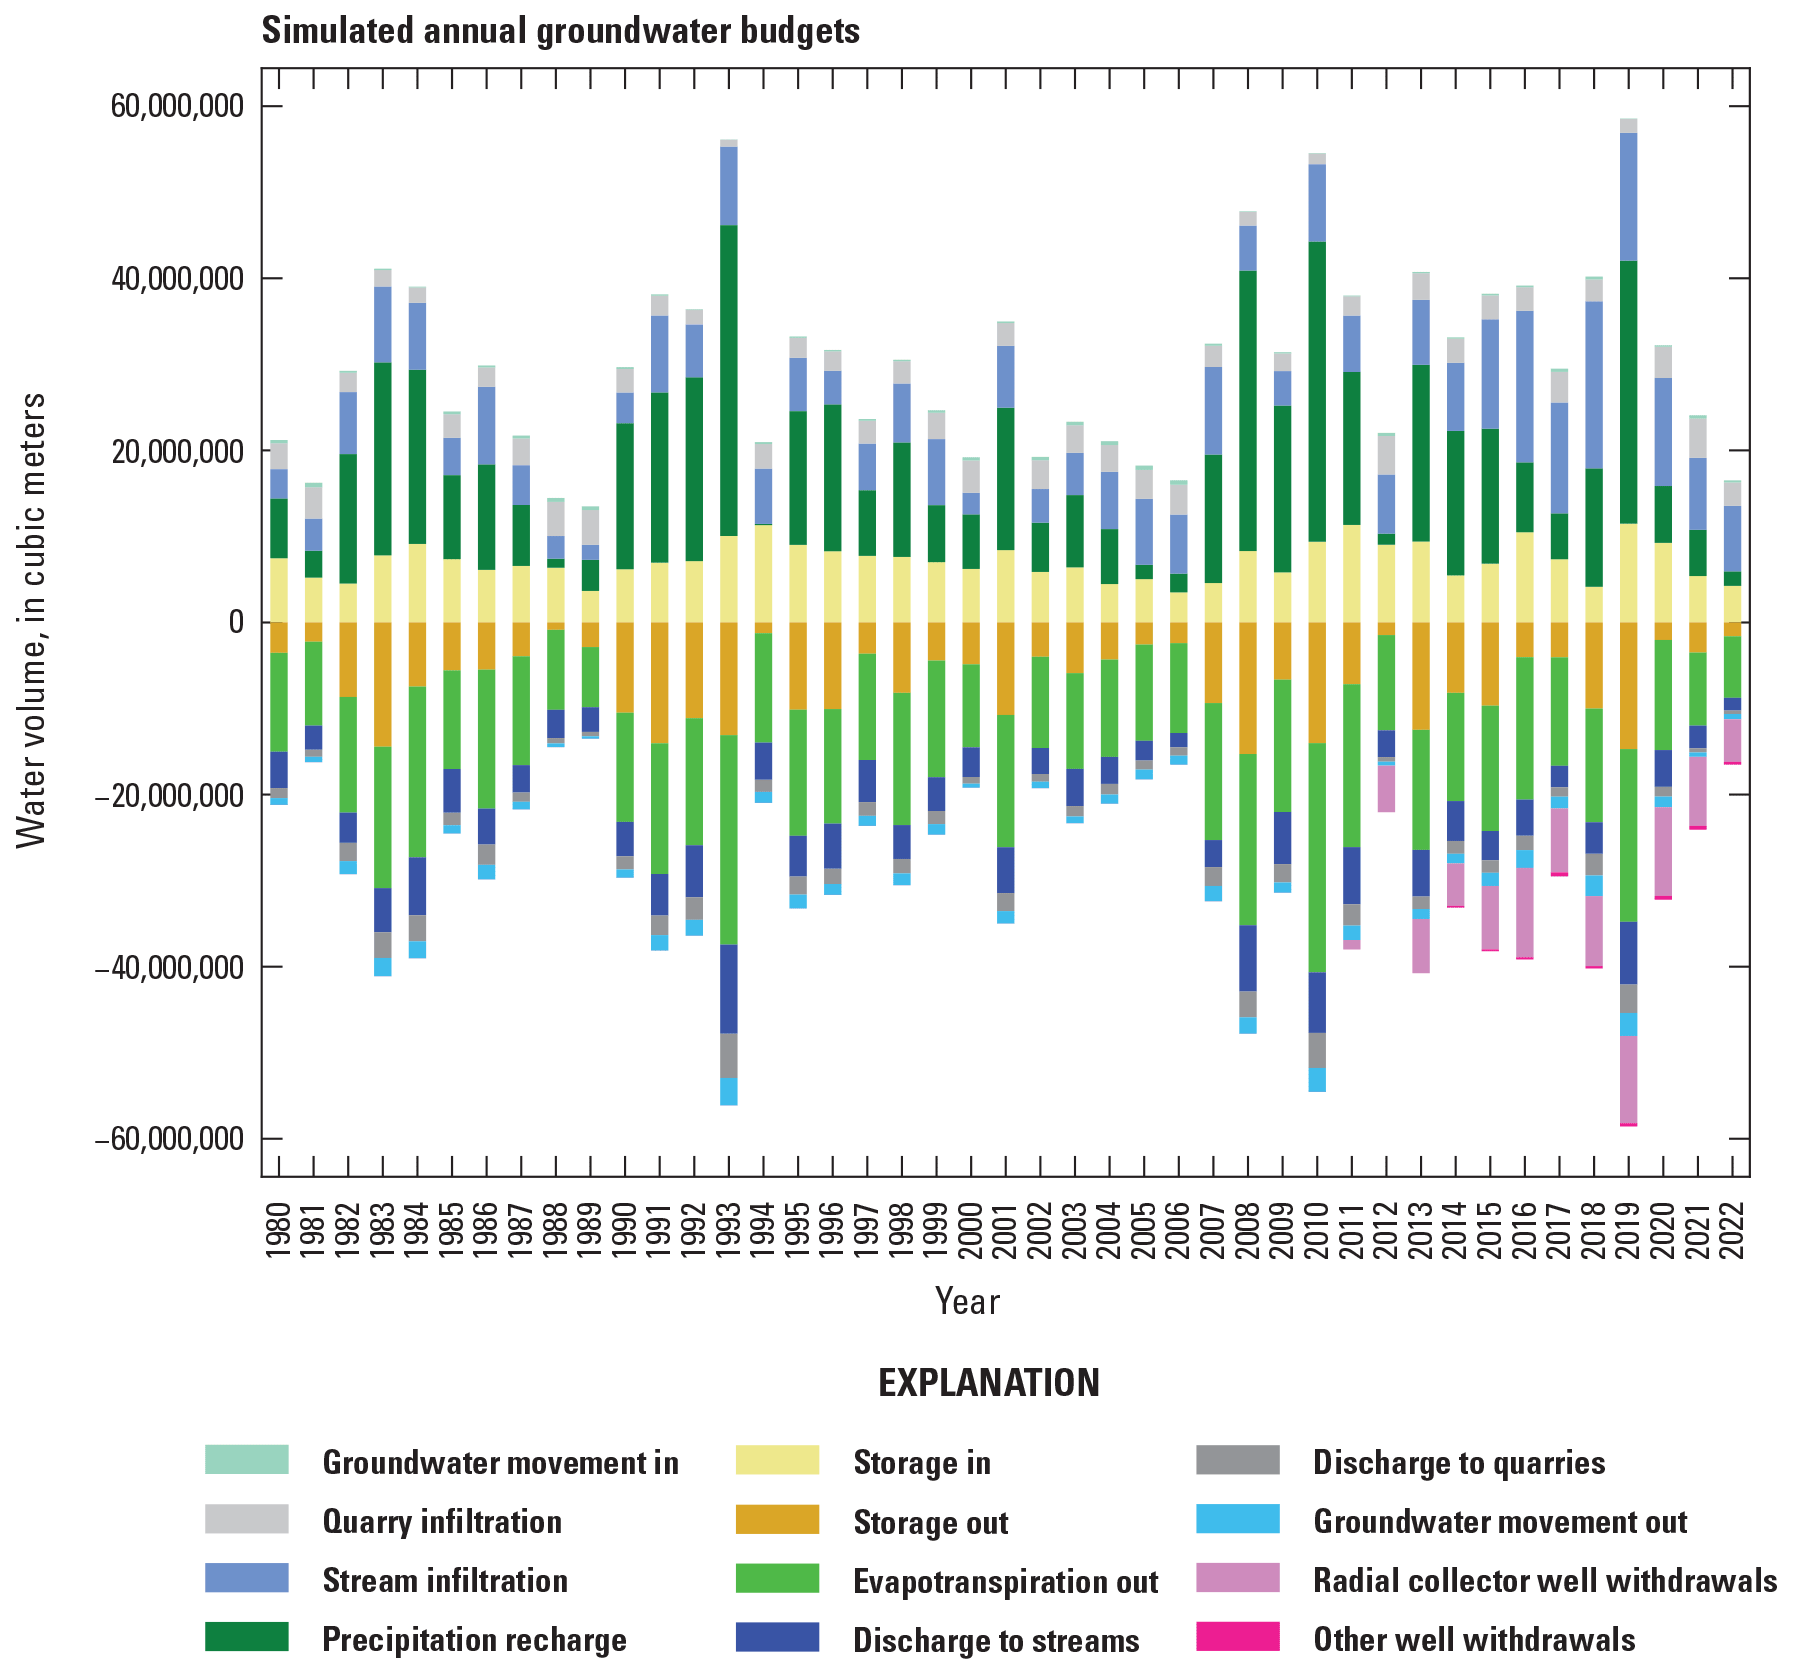
Simulated annual total groundwater flow budgets, in cubic meters per year (data from Davis and Bristow [2024]).
Table 9.
Simulated average groundwater flux, in cubic meters per day, for entire model period and before and after radial collector wells introduction.[RCW, radial collector wells; --, no data or not applicable]
Simulated inflows to the transient model include recharge from precipitation, infiltration from streams, infiltration from quarries, groundwater inflow through flux boundaries at the model edge, and gain from storage. Outflows include evapotranspiration, discharge to streams, discharge to quarries, outflow through flux boundaries, groundwater withdrawal, and loss to storage. The largest average model inflows for the entire transient period were recharge from precipitation (35,210 m3/d or 5.8 centimeters per year [cm/y] across the active model area) and infiltration from streams (20,573 m3/d; table 9). The largest average model outflows for the entire transient period were evapotranspiration (38,242 m3/d or 6.3 cm/y) and discharge to streams (12,176 m3/d). RCWs became operational in late 2011 and after that date, withdrawals average 21,177 m3/d (table 9). The largest magnitude of change from the period before RCW initial operation to after is in storage. Before October 2011, average net gain from storage (gain into the aquifer from storage minus loss from the aquifer to storage) was negative in every layer (−524 m3/d), and after that date average net gain is positive in every layer (a combined average of 3,437 m3/d). Other notable changes in groundwater fluxes after the initiation of RCW operation include an increase in infiltration from quarries and decrease in discharge to quarries and increase in infiltration through streambeds. The water budget also indicates substantial seasonal and annual fluctuation in net storage and other budget components (fig. 22) before and after the initiation of RCW groundwater withdrawals. Loss from the aquifer to storage is highest in the late spring and early summer months, and withdrawals from storage highest in later summer and autumn months.
Comparison of observed streambed flux with simulated net discharge through streambeds (discharge minus infiltration) indicates a substantial mismatch in the magnitude of the values (fig. 23; note the different Y-axis scales for each dataset). Because this model was designed to simulate water levels at the RCWs in the Des Moines River alluvial aquifer and not streamflow, streamflow calibration targets were weighted much lower than groundwater level targets in calibration (table 4). Observation data for seepage to streams were calculated as the difference between upstream and downstream streamflow measurements, ignoring the contribution of overland surface runoff to streamflow. Observation data were calculated for late fall and winter months only (October through March) in an effort to minimize the contribution of runoff to this net streamflow calculation, but this may have been insufficient to control for overland runoff.
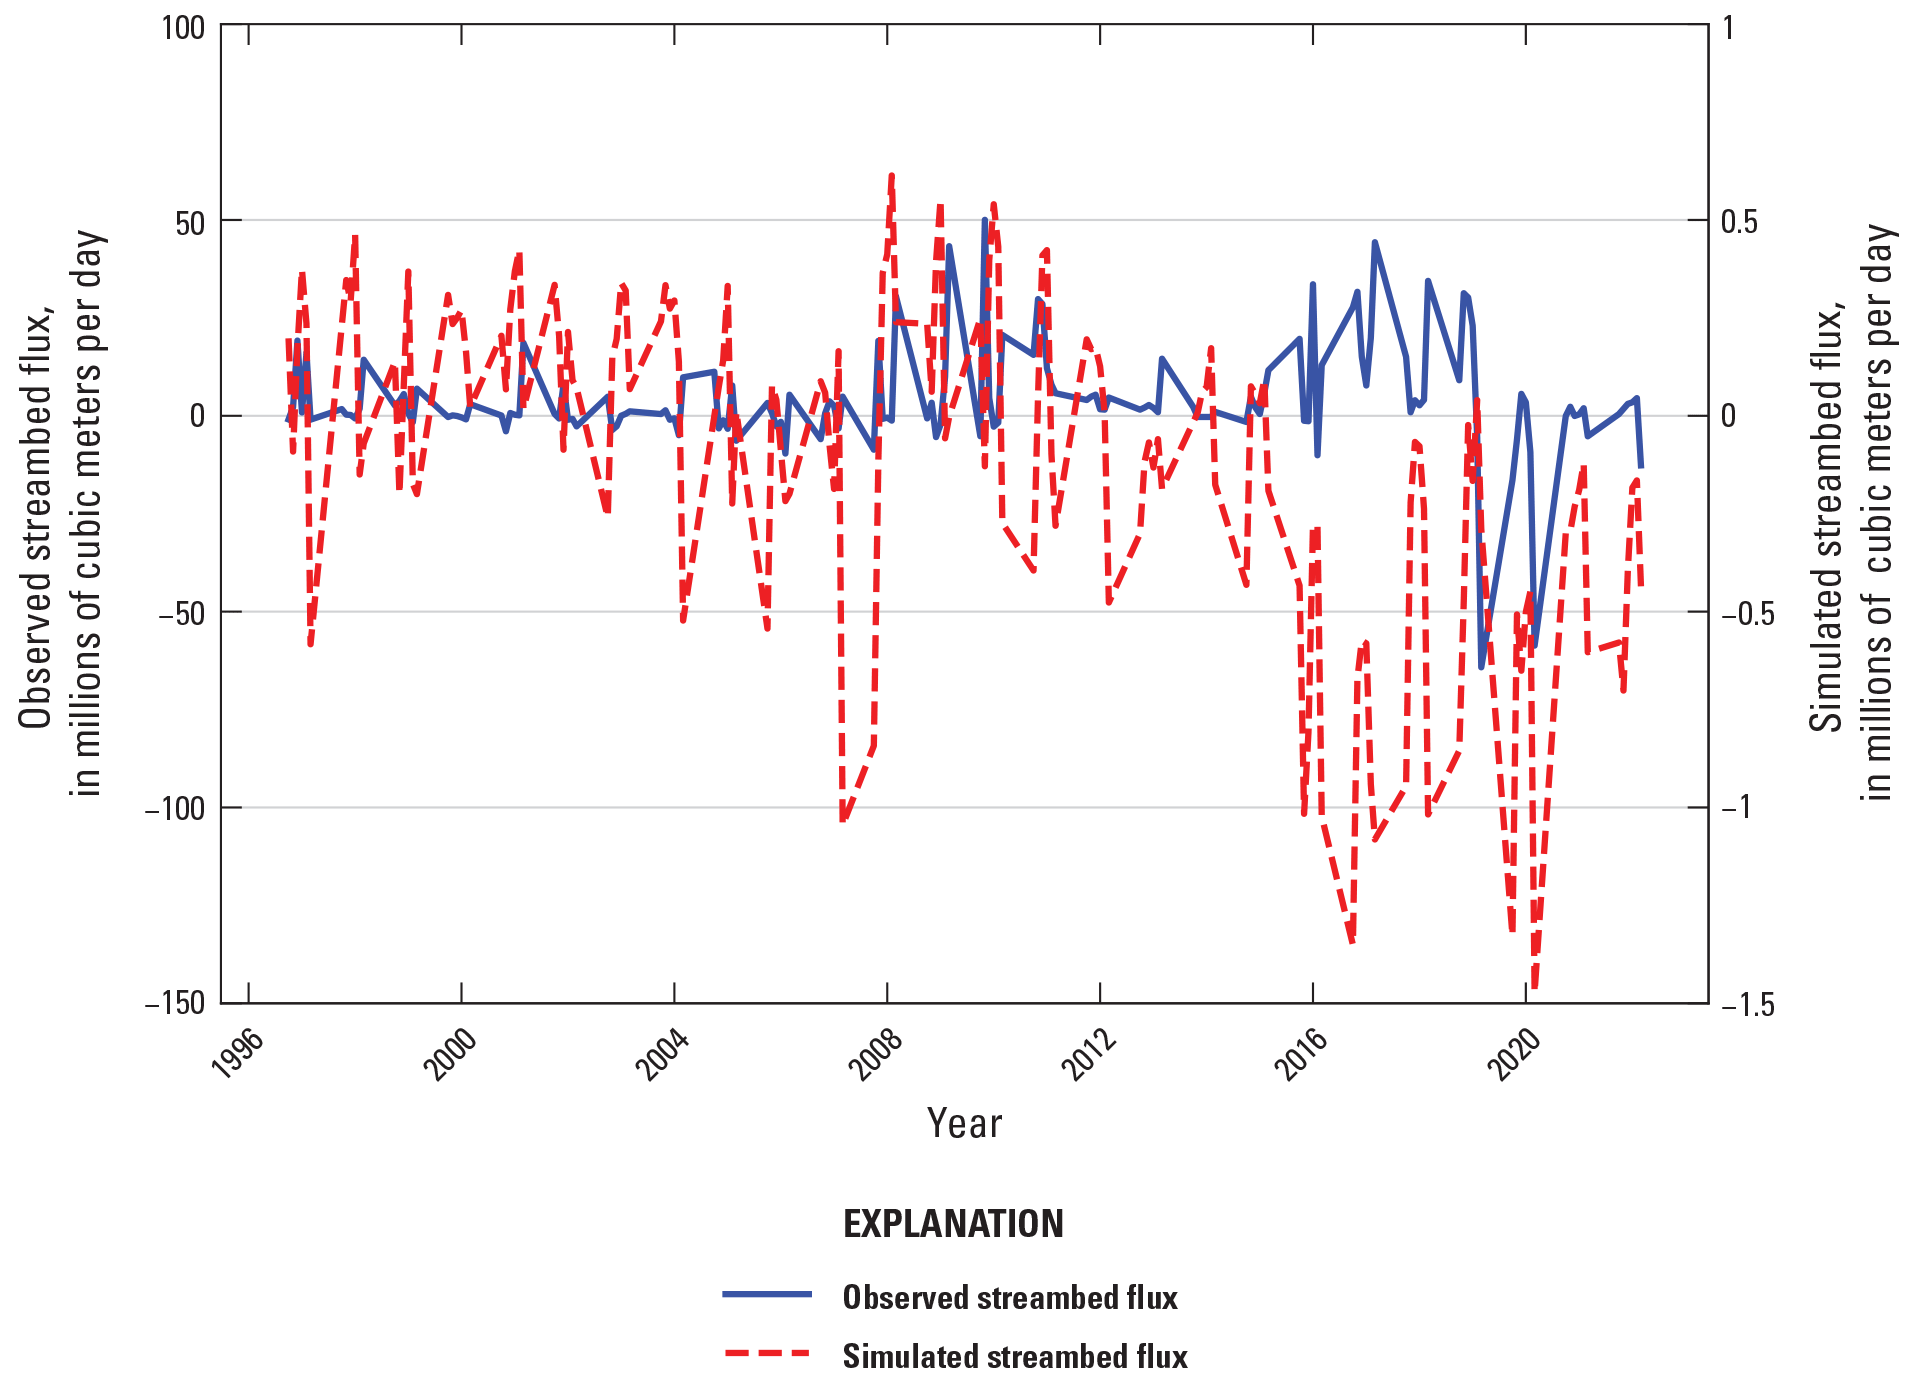
Comparison of observed upstream to downstream streamflow change and simulated discharge through streambeds. Note the datasets are shown at different scales, as indicated on the axis labels.
Sensitivity of Model Parameters
Model parameter sensitivity is a measure of the effect that a change in model input, such as changes to parameter values, has on outputs, such as calibration targets. During calibration, PESTPP–IES runs the model repeatedly while slightly adjusting parameter values for each run and then compares model output results to output from the previous model run. Parameter sensitivity is a measure of how much output values change in proportion to how much a parameter has changed; high sensitivity parameters have a relatively higher effect on model results than low sensitivity parameters. Parameter sensitivity tests for this model indicated that horizontal hydraulic conductivity for pilot points in three zones of layer 5 (zones 10, 11, and 13) were the most sensitive calibration parameters (fig. 24). These zones represent buried valley alluvium, buried valley and alluvium and outwash combined, and buried valley fill in the Rock Creek valley. The RCWs targeted by this study withdraw water from zone 11, which represents the bottom part of the alluvial aquifer around where the wells are located. SFR streambed hydraulic conductivity also had relatively high sensitivity. Parameter sensitivity was analyzed by parameter group averages; for parameter groups with more than one individual value, such as hydraulic conductivities distributed to pilot points or recharge multipliers for each HRU, the sensitivity value presented here is the average of all group members. All parameter sensitivity results are included in the accompanying model archive data release (Davis and Bristow, 2024).
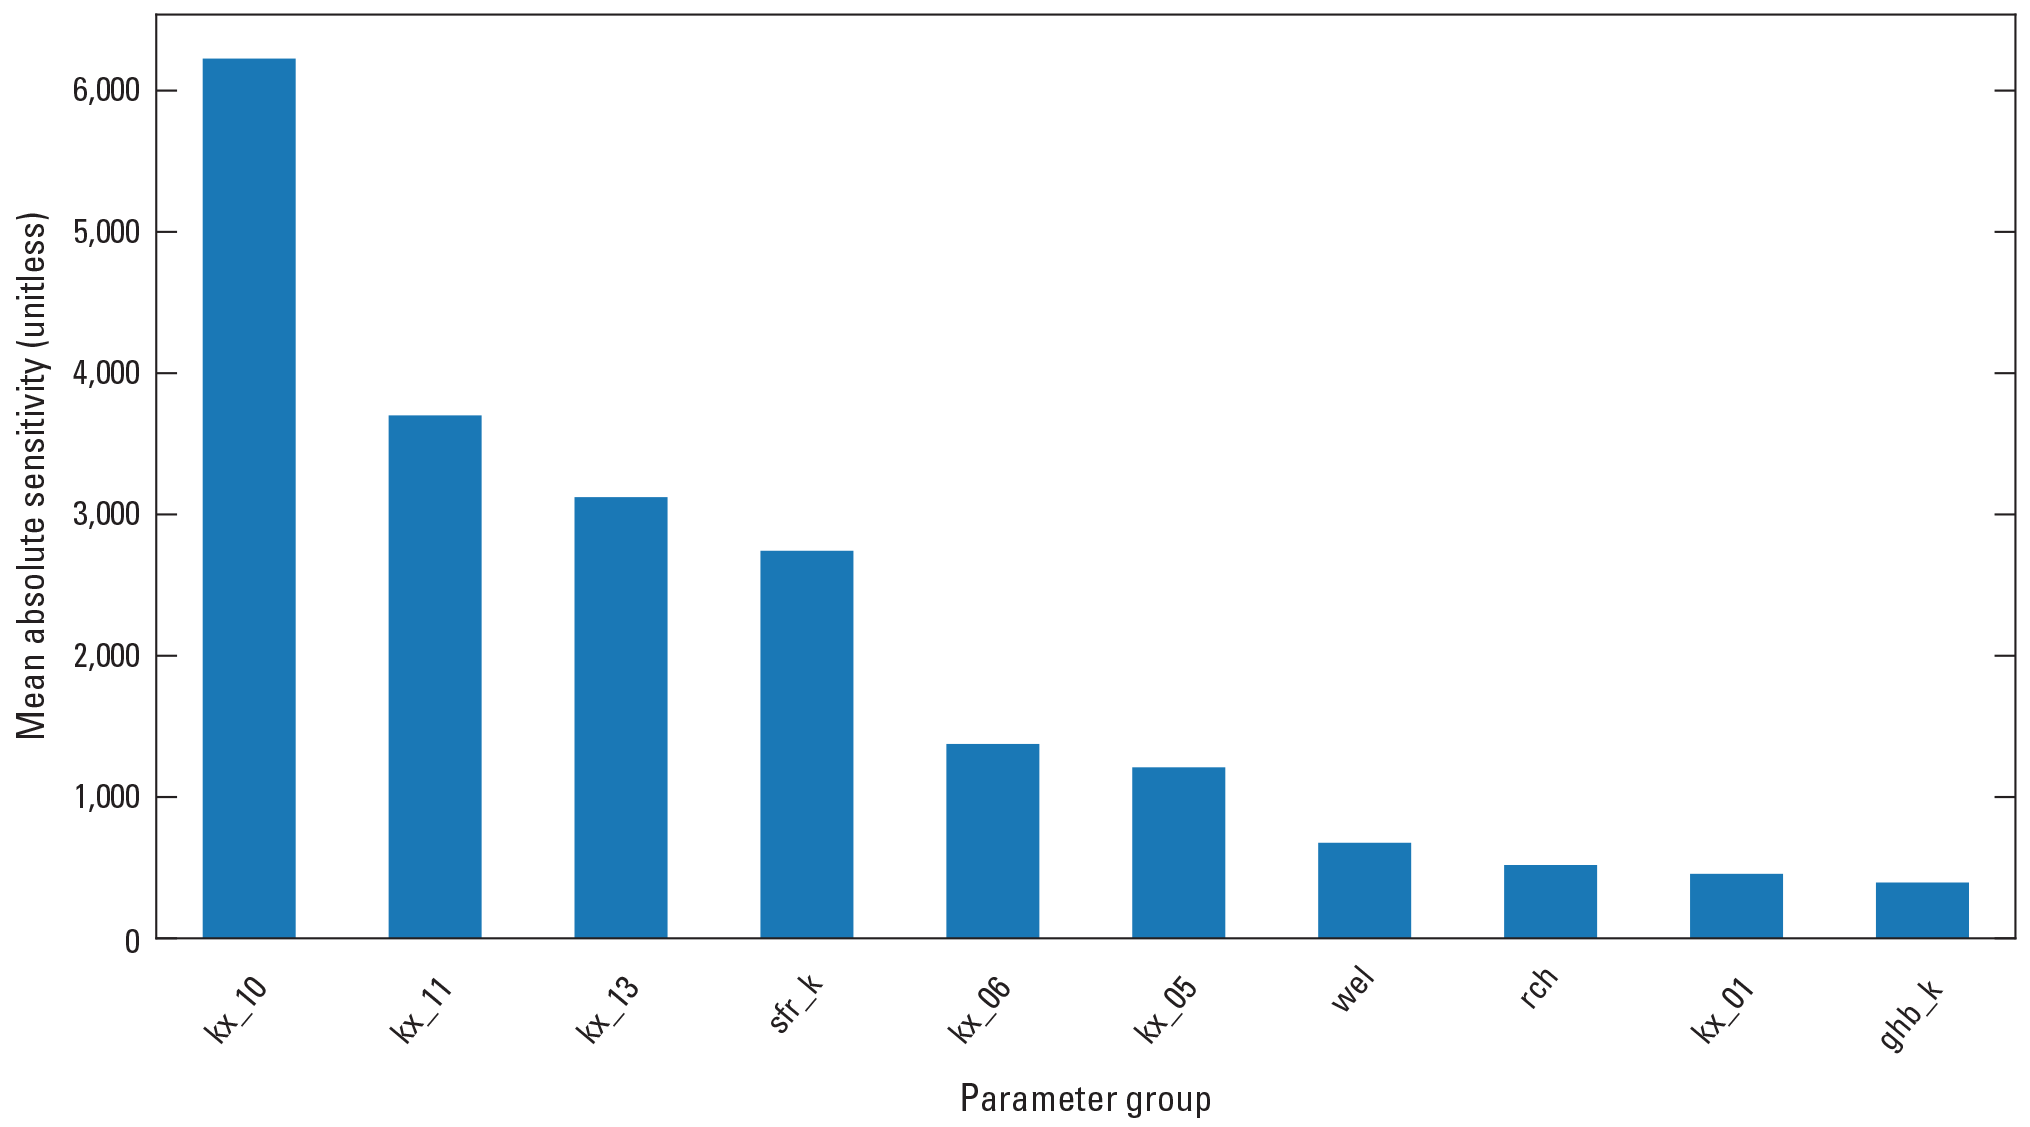
Average absolute sensitivity (unitless indicator of effect on model output) for the 10 most sensitive parameter groups used in model calibration (kx, horizontal hydraulic conductivity; 1, 5, 6, 10, 11, 13, zone number; sfr_k, streambed hydraulic conductivity for Streamflow Routing [Package]; wel, Well [Package]; rch, Recharge [Package]; ghb_k, hydraulic conductivity for General-Head Boundary [Package] elements).
Numerical Groundwater Model Limitations
Numerical groundwater flow models are simplified representations of complex natural systems and are necessarily constructed with assumptions that lead to limitations in their use and introduce uncertainty in model results. Simplifications included interpolation and inference of hydrogeologic unit elevations, averaging of geologic properties into 60-m square cells, and averaging of hydrologic data into monthly stress periods. Assumptions included bedrock homogeneity, seepage characteristics at the model boundary, and streambed shape and uniformity.
The conceptual model and hydrologic framework were based on land surface maps and published descriptions of geologic structures and materials in addition to published well logs and geophysical data where available. Where well logs and geophysical data were not available or provided ambiguous data, hydrogeologic unit elevations were interpolated and inferred. Simplification and assumptions in delineating hydrologic layers for the model framework created inaccuracies in aquifer volume and contacts. Bedrock in the area was assumed to be shale. Reported interbedded limestone and fine-grained sandstone were not represented in the hydrogeologic framework, potentially excluding areas of bedrock aquifer or preferential pathways within the bedrock layer from the model. This model is focused on the alluvial aquifer and is not appropriate for use to better understand bedrock or bedrock aquifers in the model area.
Discretization of the model area into a grid of 60-m square cells resulted in a simplified representation of the hydrogeologic units. Hydrogeologic properties and cell elevations were assumed to be uniform within each cell; however, actual properties could be variable within each cell. This spatial simplification can create inaccuracies in aquifer volumes and contacts, especially at a local scale, and could lead to misrepresentations of volumes and fluxes in the model. Temporal discretization into monthly stress periods required the averaging of input and calibration time-series datasets into monthly rates. Recharge, evapotranspiration, streamflow, and radial collector well withdrawals were averaged from daily values into monthly average rates, resulting in smoothing of daily fluctuations in these rates. This limited the model’s ability to represent hydrologic processes on time scales shorter than months, and likely limited the model’s ability to represent extremes of water levels and streamflow. The model is designed to simulate conditions monthly at the scale of the model cells and is not appropriate for use to better understand shorter-term or higher spatial resolution water level dynamics nor surface water flood scenarios.
No observation data were available of groundwater flow at the model boundaries. Representation of groundwater seepage in the alluvial aquifer at the downstream outlet of the river and in the buried valley at the model northwest and southeast edges required assumptions about water levels in these units. Connectivity between the buried valley alluvium, glacial outwash, and surficial materials layers in Beaver Creek and the buried valley was also assumed. Groundwater seepage laterally through model boundaries into glacial till and bedrock layers was assumed to be zero.
Stream locations were interpolated and simplified, and streambed elevations were interpolated and smoothed to ensure stream segments always flowed to lower elevations. Stream channels were assumed to be rectangular and uniform in roughness and bed conductivity, and stream widths were interpolated along segments on the basis of endpoint values estimated from aerial imagery. Groundwater withdrawal data, apart from at the RCWs, were not available before 2014, and withdrawal was assumed to be zero before that date. Groundwater withdrawals for these other wells for the period of existing data were a relatively small part of the overall model water budget and most of the wells were not in the targeted alluvial aquifer, so withdrawal of zero was considered a reasonable assumption. Withdrawals from wells other than the RCWs were provided as annual volumes and distributed evenly to the monthly stress periods for this model, potentially introducing inaccuracy because of seasonal water use differences.
The inability to characterize processes, properties, and hydrologic outputs in a complex numeric groundwater system can result in a nonuniqueness of the calibration process (Leaf and others, 2015). This means different combinations of hydraulic properties could be applied to the model that could result in an acceptable level of fit between calibration targets and model-simulated values. The hydraulic properties determined through numerical model calibration minimized the difference between observations and model results, and these properties compared well with expected parameter values. The final distribution of model parameters determined during model calibration and the resulting water levels were based on the spatial and temporal availability of hydrologic data. In areas of the model where hydrologic data were not available, the results of the model as determined through the calibration process could be substantially different from observations in those areas.
Summary
Des Moines Water Works (DMWW) is a regional municipal water utility that provides residential and commercial water resources to approximately 600,000 customers in Des Moines, Iowa, and surrounding municipalities in central Iowa. DMWW has identified a need for increased water supply and is exploring the potential for expanding groundwater production capabilities in the Des Moines River alluvial aquifer, where it operates two radial collector wells (RCWs). The U.S. Geological Survey, in cooperation with DMWW, completed a study of the Des Moines River alluvial aquifer and the interaction of the current RCWs with the aquifer. No previously published model has included the location of the existing wells in the Des Moines River alluvial aquifer, which is the focus of this model. Conceptual and numerical groundwater flow models have been developed to characterize the Des Moines River alluvial aquifer under existing conditions, simulate water levels observed in the DMWW RCWs, and to provide publicly accessible hydrologic data and research that advance understanding of the regional hydrologic system and can potentially be used in the future to evaluate groundwater production scenarios.
A simple conceptual model of the landscape, its hydrogeologic materials, and water budget components was developed to illustrate the hydrogeologic framework and describe groundwater inflows and outflows for the study area. Bedrock and surficial sediments in the model area were conceptualized as six layered hydrogeologic units: (1) a surface layer with soil or fill (subdivided based on mapped surface material); (2) Des Moines River alluvial deposits; (3) glacial outwash sand and gravel; (4) glacial till; (5) buried valley alluvium; and (6) shale bedrock. Sources of recharge to the groundwater system (groundwater gains) in the model area include seepage from streams (streamflow loss) and water-filled quarries, infiltration of precipitation, and groundwater inflow from outside of the model area. Sources of discharge from the groundwater system (groundwater losses) include groundwater seepage to streams (streamflow gain) and quarries, groundwater evapotranspiration, withdrawals from wells, and groundwater outflow out of the model area.
A hydrogeologic framework adapted the hydrogeologic units and water budget from the conceptual model into a three-dimensional layered structure for the MODFLOW 6 numerical groundwater flow model. Model layers were assigned hydrogeologic parameter zones to spatially distribute hydrogeologic parameters to the layered materials. Some of the layers were subdivided into multiple zones and others have one zone only. Recharge and evapotranspiration values were calculated from a previously published Precipitation Modelling Runoff System model of the Des Moines River. The model was designed with one initial steady state stress period representing average conditions before 1980 and 512 monthly stress periods from January 1980 through July 2022.
The model was calibrated using the software package PESTPP-IES, which adjusts model parameters within specified ranges to minimize the differences between simulated model results and actual real-world observations (calibration targets). Calibration targets included water level elevations at the RCWs and at other wells, RCW water level design minimum water level changes, water level inequality observations, surface water streamflow, and change in surface water volume from upstream to downstream. Parameters adjusted during model calibration include hydrogeologic properties (horizontal hydraulic conductivity, vertical anisotropy, specific storage, and specific yield), streambed hydraulic conductivity, recharge multipliers, evapotranspiration multipliers, well withdrawal multipliers, quarry bed hydraulic conductivity, and groundwater flux boundary hydraulic conductivity. Parameters for hydrogeologic zones were spatially distributed using pilot points to allow for spatial variability within zones. In general, calibration of the model resulted in parameter values similar to initial estimates.
Model performance was assessed on its ability to match hydraulic observations of interest, including water level elevations, monthly average changes in water levels (water level changes), minimum design water levels for the RCWs, and monthly average streambed flux. The model accurately simulated water levels and seasonal water level fluctuations at the RCWs, and it accurately simulated water table levels above the RCW design minimum level for all stress periods with existing RCW water level observation data. Average absolute value water level residuals for the model period with available observations are 1.20 meters (m) at RCW1 and 1.49 m at RCW2. Water levels at observations in layers 2 and 5, representing the alluvial aquifer, were simulated with slight positive bias and 1.57 m and 2.47 m average absolute value residual, respectively. Water level observations in other model layers that were not the target of this investigation had higher residuals. The model did not accurately match streamflow targets, possibly because of unaccounted effect of surface runoff in the streamflow observations. Comparison of water budgets from before and after the initiation of groundwater withdrawals at the RCWs indicates increases in the removal of water from storage, infiltration from quarries, and infiltration through streambeds after the initiation of withdrawals at the RCWs in 2011.
References Cited
Arcement, G.J., and Schneider, V.R., 1989, Guide for selecting Manning’s roughness coefficients for natural channels and flood plains: U.S. Geological Survey Water Supply Paper 2339, 38 p. [Also available at https://doi.org/10.3133/wsp2339.]
Bettis, E.A., III, and Hoyer, B.E., 1986, Late Wisconsinan and Holocene landscape evolution and alluvial stratigraphy in the Saylorville Lake area, central Des Moines River Valley, Iowa: Iowa Geological Survey Open File Report 86–1, 82 p., plus appendixes. [Also available at https://publications.iowa.gov/26432/1/OFR-1986-1.pdf.]
Davis, K.W., and Bristow, E.L., 2024, MODFLOW 6 groundwater flow model for the Des Moines River alluvial aquifer near Des Moines, Iowa: U.S. Geological Survey data release, https://doi.org/10.5066/P13ZDDVY.
Des Moines Water Works [DMWW], 2024, About us - Overview: Des Moines Water Works web page, accessed February 27, 2024, at https://dmww.com/about_us/overview.php.
Fienen, M.N., Muffels, C.T., and Hunt, R.J., 2009, On constraining pilot point calibration with regularization in PEST: Groundwater, v. 47, no. 6, p. 835–844. [Also available at https://doi.org/10.1111/j.1745-6584.2009.00579.x.]
FitzGerald, K.M., Ha, W.S., Haj, A.E., Gruhn, L.R., Bristow, E.L., and Weber, J.R., 2022, A steady-state groundwater flow model for the Des Moines River alluvial aquifer near Prospect Park, Des Moines, Iowa: U.S. Geological Survey Open-File Report 2021–1110, 20 p. [Also available at https://doi.org/10.3133/ofr20211110.]
Gannon, J.M., 2011, Groundwater availability modeling, Des Moines River aquifer, Palo Alto and Emmet Counties, Iowa: Iowa Geological and Water Survey Water Resources Investigation Report no. 4, 41 p., accessed May 2020 at http://publications.iowa.gov/26587/.
Gannon, J.M., 2013, Groundwater availability modeling under drought conditions, Lower Raccoon River aquifer, Dallas and Polk Counties, Iowa—Drought assessment: Iowa Geological and Water Survey Water Resources Investigation Report 7, 53 p., accessed May 2020 at http://publications.iowa.gov/id/eprint/26590.
Google Earth, 2022, Polk and Dallas Counties, Iowa, USA. 41°37’40.23”N, 93°30’1.24”W, Eye alt 37 mi., Borders and labels; Roads layers: Google Earth 10.42, accessed February 19, 2022, at https://earth.google.com/web.
Gruhn, L.R., Bristow, E.L., and White, E.A., 2021, Geophysical data collected in the Des Moines River, Beaver Creek, and the Des Moines River floodplain, Des Moines, Iowa, 2018: U.S. Geological Survey data release, accessed August 2022 at https://doi.org/10.5066/P9B9AVKJ.
Ha, W.S., 2022, MODFLOW-NWT model used to simulate groundwater levels in the Des Moines River alluvial aquifer near Des Moines, Iowa: U.S. Geological Survey data release, accessed September 8, 2023, at https://doi.org/10.5066/P9F3CKLC.
Haj, A.E., Christiansen, D.E., and Hutchinson, K.J., 2015, Simulation of daily streamflow for nine river basins in eastern Iowa using the Precipitation-Runoff Modeling System: U.S. Geological Survey Scientific Investigations Report 2015–5129, 29 p. [Also available at https://doi.org/10.3133/sir20155129.]
Hatch, C.E., Fisher, A.T., Ruehl, C.R., and Stemler, G., 2010, Spatial and temporal variations in streambed hydraulic conductivity quantified with time-series thermal methods: Journal of Hydrology, v. 389, no. 3–4, p. 276–288. [Also available at https://doi.org/10.1016/j.jhydrol.2010.05.046.]
Hunt, R.J.White, J.T., Duncan, L.L., Haugh, C.J., and Doherty, J., 2021, Evaluating lower computational burden approaches for calibration of large environmental models: Groundwater, v. 59, no. 6, p. 788–798. [Also available at https://doi.org/10.1111/gwat.13106.]
Iowa Department of Natural Resources, 2023, WACOP—Home Page: Iowa Department of Natural Resources web page, accessed May 5, 2023, at https://programs.iowadnr.gov/wacop/.
Iowa Geological Survey [IGS], 2022, GeoSam lithologic database: Iowa Geological Survey web page, accessed September 16, 2022, at https://www.iihr.uiowa.edu/igs/geosam/home.
Iowa Geospatial Data, 2022, Three meter digital elevation model of Polk and Dallas Counties, Iowa, derived from LiDAR: Iowa Geospatial Data, accessed February 19, 2022, at https://geodata.iowa.gov/pages/438d547cdba742818ad23ee76e92716d.
Johnson, C.D., and Lane, J.W., Jr., 2016, Statistical comparison of methods for estimating sediment thickness from horizontal-to-vertical spectral ratio (HVSR) seismic methods—An example from Tylerville, Connecticut, USA, in Symposium on the Application of Geophysics to Engineering and Environmental Problems, March 20–24, 2016, Denver, Colorado, Proceedings: Denver, Colo., Environmental and Engineering Geophysical Society, p. 317–323. [Also available at https://doi.org/10.4133/SAGEEP.29-057.]
Johnson, C.D., and White, E.A., 2007, Marine geophysical investigation of selected sites in Bridgeport, Harbor, Connecticut, 2006: U.S. Geological Survey Scientific Investigations Report 2007–5119, 32 p. [Also available at https://doi.org/10.3133/sir20075119.]
Koller, M.G., Chatelain, J.-L., Guillier, B., Duval, A.-M., Atakan, K., Lacave, C., and Bard, P.-Y., 2004, Practical user guidelines and software implementation of the H/V ratio technique: Measuring conditions, processing method and results interpretation: 13th World Conference on Earthquake Engineering, Vancouver.
Langevin, C.D., Hughes, J.D., Banta, E.R., Niswonger, R.G., Panday, S., and Provost, A.M., 2017, Documentation for the MODFLOW 6 Groundwater Flow Model: U.S. Geological Survey Techniques and Methods, book 6, chap. A55, 197 p. [Also available at https://doi.org/10.3133/tm6A55.]
Leaf, A.T., Fienen, M.N., Hunt, R.J., and Buchwald, C.A., 2015, Groundwater/surface-water interactions in the Bad River Watershed, Wisconsin: U.S. Geological Survey Scientific Investigations Report 2015–5162, 110 p. [Also available at https://doi.org/10.3133/sir20155162.]
Linhart, S.M., Nania, J.F., Sanders, C.L., Jr., and Archfield, S.A., 2012, Computing daily mean streamflow at ungaged locations in Iowa by using the Flow Anywhere and Flow Duration Curve Transfer statistical methods: U.S. Geological Survey Scientific Investigations Report 2012–5232, 50 p. [Also available at https://doi.org/10.3133/sir20125232.]
Loke, M.H., 2000, Electrical imaging surveys for environmental and engineering studies—A practical guide to 2D and 3D surveys, short course training notes: Penang, Malaysia, University Sains Malaysia, 67 p. [Also available at https://www.academia.edu/11991713/Electrical_imaging_surveys_for_environmental_and_engineering_studies_A_practical_guide_to_2_D_and_3_D_surveys.]
Markstrom, S.L., Niswonger, R.G., Regan, R.S., Prudic, D.E., and Barlow, P.M., 2008, GSFLOW—Coupled water and surface-water flow model based on the integration of the Precipitation-Runoff Modeling System (PRMS) and the Modular Ground-Water Flow Model (MODFLOW-2005): U.S. Geological Survey Techniques and Methods, book 6, chap. D1, 240 p. [Also available at https://doi.org/10.3133/tm6D1.]
Markstrom, S.L., Regan, R.S., Hay, L.E., Viger, R.J., Webb, R.M.T., Payn, R.A., and LaFontaine, J.H., 2015, PRMS-IV, the precipitation-runoff modeling system, version 4: U.S. Geological Survey Techniques and Methods, book 6, chap. B7, 158 p. [Also available at https://doi.org/10.3133/tm6B7.]
National Oceanic and Atmospheric Administration, 2020, Data tools—1981–2010 normals: National Centers for Environmental Information digital data, accessed May 11, 2020, at https://www.ncei.noaa.gov/access/us-climate-normals/.
National Oceanic and Atmospheric Administration, 2021, NOWData—NOAA online weather data: National Weather Service digital data, accessed June 1, 2021, at https://www.weather.gov/wrh/climate?wfo=dmw.
Quade, D.J., Giglierano, J.P., Bettis, E.A., III, and Artz, J.A., 2003, Surficial geologic materials of Polk County, Iowa: Iowa Geological Survey Open File Map 2003–3, scale 1:100,000, accessed May 28, 2020, at http://publications.iowa.gov/26206/1/ofm-2003-3.pdf.
Pope, J.P., Witzke, B.J., Anderson, R.R., Ludvigson, G.A., Bunker, B.J., and Greeney, S., 2002, Bedrock geology of south-central Iowa: Iowa Geological Survey Open File Map 02–1, prepared by Iowa Department of Natural Resources, scale 1:250,000. [Also available at https://www.iihr.uiowa.edu/igs/publications/uploads/ofm-2002-1.pdf.]
Prior, J.C., 1991, Landforms of Iowa: Iowa City, Iowa, University of Iowa Press, 153 p. [Also available at https://archive.org/details/landformsofiowa00prio_0.]
Prior, J.C., Boekhoff, J.L., Howes, M.R., Libra, R.D., and VanDorpe, P.E., 2003, Iowa’s groundwater basics: Iowa Geological Survey Educational Series 6, Iowa City, Iowa, Iowa Dept. of Natural Resources, 83 p. [Also available at https://s-iihr34.iihr.uiowa.edu/publications/uploads/2014-08-24_08-08-21_es-06.pdf.]
Soil Survey Staff, 2022, Soil Survey Geographic (SSURGO) database for Polk and Dallas Counties, Iowa: U.S Department of Agriculture web page, accessed February 19, 2022, at https://sdmdataaccess.nrcs.usda.gov/.
U.S. Army Corps of Engineers, 2023, Saylorville Lake—About us: U.S. Army Corps of Engineers web page, accessed June 6, 2023, at https://www.mvr.usace.army.mil/Missions/Recreation/Saylorville-Lake/About-Us/.
U.S. Census Bureau, 2023, QuickFacts—Polk County, Iowa; Des Moines, Iowa: U.S. Census Bureau web page, accessed February 27, 2024, at https://www.census.gov/quickfacts/fact/table/polkcountyiowa,desmoinescityiowa/.
U.S. Department of Agriculture [USDA], 2020, National CDL’s: U.S. Department of Agriculture web page, accessed on November 9, 2022, at https://www.nass.usda.gov/Research_and_Science/Cropland/Release/.
U.S. Geological Survey [USGS], 2023a, USGS 05482000 Des Moines River at 2nd Avenue at Des Moines, IA, in USGS water data for the Nation: U.S. Geological Survey National Water Information System database, accessed November 28, 2023, at https://doi.org/10.5066/F7P55KJN. [Site information directly accessible at https://waterdata.usgs.gov/nwis/uv?site_no=05482000.]
U.S. Geological Survey [USGS], 2023b, USGS 05481650 Des Moines River near Saylorville, IA, in USGS water data for the Nation: U.S. Geological Survey National Water Information System database, accessed November 28, 2023, at https://doi.org/10.5066/F7P55KJN. [Site information directly accessible at https://waterdata.usgs.gov/nwis/uv?site_no=05481650.]
U.S. Geological Survey [USGS], 2023c, USGS 05481950 Beaver Creek Near Grimes, IA, in USGS water data for the Nation: U.S. Geological Survey National Water Information System database, accessed November 28, 2023, at https://doi.org/10.5066/F7P55KJN. [Site information directly accessible at https://waterdata.usgs.gov/nwis/uv?site_no=05481950.]
U.S. Geological Survey [USGS], 2023d, USGS groundwater data for the Nation, in USGS water data for the Nation: U.S. Geological Survey National Water Information System database, accessed November 28, 2023, at https://doi.org/10.5066/F7P55KJN. [Groundwater data directly accessible at https://waterdata.usgs.gov/nwis/gwt.]
U.S. Geological Survey [USGS], 2023e, StreamEst: U.S. Geological Survey web page, accessed August 17, 2023, at https://wim.usgs.gov/streamest/.
Welter, D.E., White, J.T., Hunt, R.J., and Doherty, J.E., 2015, Approaches in highly parameterized inversion—PEST++ Version 3, a Parameter ESTimation and uncertainty analysis software suite optimized for large environmental models: U.S. Geological Survey Techniques and Methods, book 7, chap. C12, 54 p. [Also available at https://doi.org/10.3133/tm7C12.]
White, J.T., 2018, A model-independent iterative ensemble smoother for efficient history-matching and uncertainty quantification in very high dimensions: Environmental Modelling & Software, v. 109, p. 191–201. [Also available at https://doi.org/10.1016/j.envsoft.2018.06.009.]
White, J.T., Hunt, R.J., Fienen, M.N., and Doherty, J.E., 2020, Approaches to highly parameterized inversion: PEST++ Version 5, a software suite for parameter estimation, uncertainty analysis, management optimization and sensitivity analysis: U.S. Geological Survey Techniques and Methods, book 7, chap. C26, 52 p. [Also available at https://doi.org/10.3133/tm7C26.]
Witzke, B.J., Anderson, R.R., and Pope, J.P., 2010, Iowa bedrock geologic map: Iowa Geological and Water Survey Open File Map 2010–1, prepared by Iowa Department of Natural Resources, accessed May 28, 2020, at https://iowageodata2.s3.us-east-2.amazonaws.com/geoscientificInformation/bedrock/Bedrock_Geologic_Map.zip.
Conversion Factors
International System of Units to U.S. customary units
Temperature in degrees Fahrenheit (°F) may be converted to degrees Celsius (°C) as follows:
°C = (°F – 32) / 1.8.
Datums
Vertical coordinate information is referenced to the North American Vertical Datum of 1988 (NAVD 88).
Horizontal coordinate information is referenced to the North American Datum of 1983 (NAD 83).
Abbreviations
CRP
continuous resistivity profiling
CSP
continuous seismic profiling
DEM
digital elevation model
DMWW
Des Moines Water Works
ERT
electrical resistivity tomography
ETg
groundwater evapotranspiration
EVT
Evapotranspiration (Package)
GHB
General-Head Boundary (Package)
HRU
hydrologic response unit
HVSR
horizontal-to-vertical spectral ratio
IGS
Iowa Geological Survey
PRMS
Precipitation Modelling Runoff System model
RCH
Recharge (Package)
RCW
radial collector well
SFR
Streamflow Routing (Package)
Ss
specific storage
Sy
specific yield
USDA
U.S. Department of Agriculture
USGS
U.S. Geological Survey
WEL
Well (Package)
For more information about this publication, contact:
Director, USGS Central Midwest Water Science Center
400 South Clinton Street, Suite 269
Iowa City, IA 52240
319–337–4191
For additional information, visit: https://www.usgs.gov/centers/cm-water
Publishing support provided by the
Rolla Publishing Service Center
Disclaimers
Any use of trade, firm, or product names is for descriptive purposes only and does not imply endorsement by the U.S. Government.
Although this information product, for the most part, is in the public domain, it also may contain copyrighted materials as noted in the text. Permission to reproduce copyrighted items must be secured from the copyright owner.
Suggested Citation
Bristow, E.L., and Davis, K.W., 2024, Groundwater flow model for the Des Moines River alluvial aquifer near Des Moines, Iowa: U.S. Geological Survey Scientific Investigations Report 2024–5059, 47 p., https://doi.org/10.3133/sir20245059.
ISSN: 2328-0328 (online)
Study Area
| Publication type | Report |
|---|---|
| Publication Subtype | USGS Numbered Series |
| Title | Groundwater flow model for the Des Moines River alluvial aquifer near Des Moines, Iowa |
| Series title | Scientific Investigations Report |
| Series number | 2024-5059 |
| DOI | 10.3133/sir20245059 |
| Publication Date | July 12, 2024 |
| Year Published | 2024 |
| Language | English |
| Publisher | U.S. Geological Survey |
| Publisher location | Reston, VA |
| Contributing office(s) | Central Midwest Water Science Center |
| Description | Report: ix, 47 p.; 3 Data Releases; 1 Dataset |
| Country | United States |
| State | Iowa |
| City | Des Moines |
| Online Only (Y/N) | Y |
| Additional Online Files (Y/N) | N |


