Pesticide Occurrence in Shallow Groundwater in Three Regions of Agricultural Land Use: Baldwin County, the Wiregrass Region, and the Tennessee River Valley Region of Alabama, 2009–20
Links
- Document: Report (5.64 MB pdf) , HTML , XML
- Data Releases:
- USGS Data Release - Pesticide concentration and related water-quality data for selected groundwater sites near areas of agricultural land use in Alabama, 2009–2020
- USGS NWIS Data Release - USGS water data for the Nation
- NGMDB Index Pages:
- Download citation as: RIS | Dublin Core
Abstract
As part of a cooperative investigation between the U.S. Geological Survey and the Alabama Department of Agriculture and Industries, a network of 22 groundwater wells were sampled from 2014 through 2020 for about 230 pesticide and pesticide degradate compounds. Wells were located in three regions of intensive agricultural land use in Alabama: Baldwin County, the Wiregrass region, and the Tennessee River valley region.
Metolachlor sulfonic acid, a degradate of the herbicide metolachlor, was the most frequently detected compound, occurring in about 70 percent of the samples. Three other compounds, metolachlor, atrazine, and 2-chloro-4-isopropylamino-6-amino-s-triazine, were also detected in more than half of the samples. Metolachlor and its degradates accounted for 33 of the 50 greatest compound concentrations study-wide, including the maximum pesticide concentration across all compounds (62,500 nanograms per liter). The frequency and magnitude of detections of many specific pesticide compounds varied among the three regions, but all detected pesticide concentrations were well below the U.S. Environmental Protection Agency maximum contaminant levels and applicable human health benchmarks.
Sample results were combined with results of previous (2009–13) sampling to provide a continuous time-series of data for 2009–20. More than half of the 289 pesticide compounds analyzed during 2009–20 were not detected in any samples. Only four compounds were detected at great enough frequency throughout the 10 sampling years to evaluate patterns of change through time. Metolachlor and its degradate, metolachlor sulfonic acid, were frequently detected in all regions. Atrazine and its degradate, 2-chloro-4-isopropylamino-6-amino-s-triazine, were also detected in wells from all regions, but the variability and magnitude of concentrations were greatest in the Tennessee River valley region. No apparent temporal pattern in concentrations was found.
Introduction
Agriculture is a major sector of the economy of the State of Alabama and contributed $70.4 billion to the State economy in 2010 (Auburn University Department of Agricultural Economics and Rural Sociology, 2013). Crop agriculture generates approximately $1.2 billion in annual sales and accounts for about 2.8 million acres of land cover in the State (U.S. Department of Agriculture [USDA] National Agricultural Statistics Service, 2019c). Major crops in Alabama include cotton, soybeans, peanuts, and corn. Historically, the use of agricultural pesticides has limited the effects of pests, such as insects, competitive weeds, and fungi, on crops and has enabled increases in production (Tudi and others, 2021). Although there are significant agricultural benefits to the use of pesticides, many have the potential to migrate from intended application areas into other environmental compartments. Leaching through soils and into groundwater supplies is one example of unwanted movement of pesticides and can limit future uses of the affected waters (Arias-Estévez and others, 2008; Tudi and others, 2021).
The Alabama Department of Agriculture and Industries (ADAI) is responsible for permitting the use of agricultural pesticides in the State. Monitoring the environmental fate of agricultural pesticides has been ongoing for many years as part of the agency’s pesticide management plan. Since 2009, the ADAI and U.S. Geological Survey (USGS) have cooperated on a project to investigate pesticide occurrence in shallow groundwater in areas of Alabama with intensive agricultural land use (fig. 1). The project is intended to evaluate the number, types, and magnitude of pesticide compound detections in a network of wells and to identify any apparent patterns of change over time.
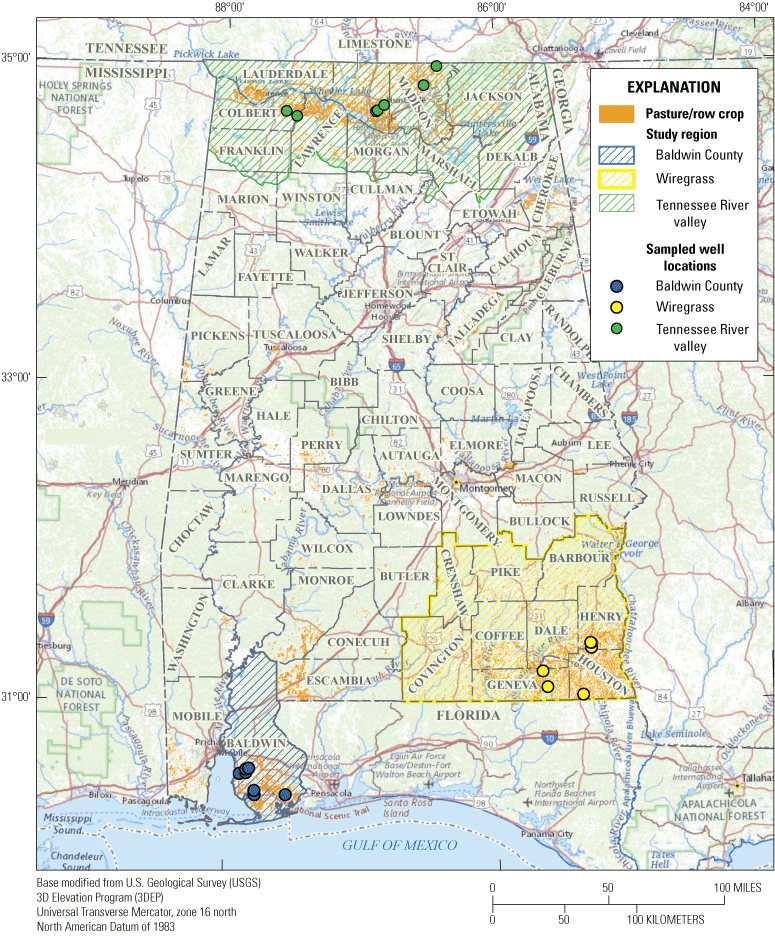
Study regions and groundwater sampling sites in relation to areas of intensive agricultural land use in Alabama (National Agricultural Statistics Service, 2019a).
Monitoring the occurrence and concentrations of pesticides in shallow groundwater underlying agricultural areas provides valuable data to understand the potential migration and persistence of these compounds in the groundwater system. The USGS places priority on collecting data to support the preservation of water resources for future uses (U.S. Geological Survey, 2021). The datasets produced by this study help to support USGS goals to monitor the quality of the Nation’s freshwater supplies.
Purpose and Scope
This report documents the pesticide occurrence in shallow groundwater in three regions of agricultural land use: Baldwin County, the Wiregrass region, and the Tennessee River valley region of Alabama, during 2009–20. The report summarizes the results of sampling in project wells since the publication of previous project reports (Moreland, 2011; Welch, 2015). Samples included in the summary are those collected from the summer of 2014 through the summer of 2020. Field parameters and nitrate concentrations are presented first; then pesticide detection frequencies and concentrations are discussed. After discussion of the 2014–20 sampling, pesticide results from the entire project period of record (2009–20) are examined to identify compounds frequently detected in environmental samples. Concentrations of the most frequently detected compounds are plotted through time to identify any apparent temporal patterns in detections. Data supporting the analysis in this report are available through the National Water Information System (NWIS) and through a companion data release (Gill, 2023).
Previous Investigations
Previous studies by the USGS have investigated sources and occurrences of pesticides in groundwater systems. The National Water Quality Assessment (NAWQA) Program has conducted nationwide and regional assessments of the occurrence of pesticides in groundwater (Gilliom and others, 2006), including an evaluation of groundwater quality in a monitoring network in areas of agricultural land use within northern Alabama and central Tennessee (Kingsbury, 2003). The study identified fluometuron and atrazine as commonly detected pesticide compounds and noted that pesticide detections were correlated with dissolved oxygen concentrations but not with nitrate concentrations. A subset of the Tennessee River valley region agricultural land use well network was included as sampling sites for this study. The NAWQA program also supported the Pesticide National Synthesis Project, which has produced compilations of nationwide county-level summaries of agricultural pesticide application (Stone, 2013; Thelin and Stone, 2013; Baker and Stone, 2015; Wieben, 2019) to help evaluate the relation between pesticide application to cropland and detected pesticide concentrations in groundwater.
Previous reports documenting the cooperative effort between the USGS and the ADAI include summaries of data collection for the first year (Moreland, 2011) and the first 5 years (Welch, 2015) for this project. Those studies identified fluometuron and atrazine as the most commonly detected parent pesticides, and metolachlor degradates, metolachlor sulfonic acid (SA) and metolachlor oxanilic acid (OA), as the most commonly detected pesticide degradates. Bentazon, metolachlor, fluometuron, and norflurazon were the pesticides having the greatest detected concentrations in study wells. Fewer pesticide degradates were evaluated during the first 5 years of the project than during the subsequent years, but the frequency of their detection indicated the importance of evaluating degradate compounds as part of the assessment of pesticide environmental fate.
Description of Study Regions
Groundwater wells sampled in this project were located in three regions of intensive row-crop agricultural land use in Alabama: Baldwin County, the Wiregrass Region, and the Tennessee River valley region. These three regions are distributed geographically across the State. Baldwin County lies in the extreme southwestern part of the State, the Wiregrass region is in the southeastern corner of the State, and the Tennessee River valley region extends from east to west across the northern part of the State (fig. 1).
Baldwin County lies between the eastern shore of Mobile Bay and the Florida State line and extends south to the Gulf of Mexico (fig. 1). Soils in the area are ancient marine and fluvial sediments of the coastal plain (Mitchell, 2017). Crops in Baldwin County are varied, with common cultivation of soybeans, peanuts, and cotton but also fruit and vegetable crops (table 1; USDA National Agricultural Statistics Service, 2019a). From 1991 to 2020, mean monthly temperatures in Baldwin County ranged from a low of 51 degrees Fahrenheit (°F) in January to a high of almost 82 °F in July (fig. 2A; National Centers for Environmental Information, 2021a). From 1991 to 2020, mean monthly precipitation in Baldwin County was lowest in the fall and greatest in the summer, ranging from about 3.9 in. for October to more than 8.1 in. for July (fig. 2B; National Centers for Environmental Information, 2021a).
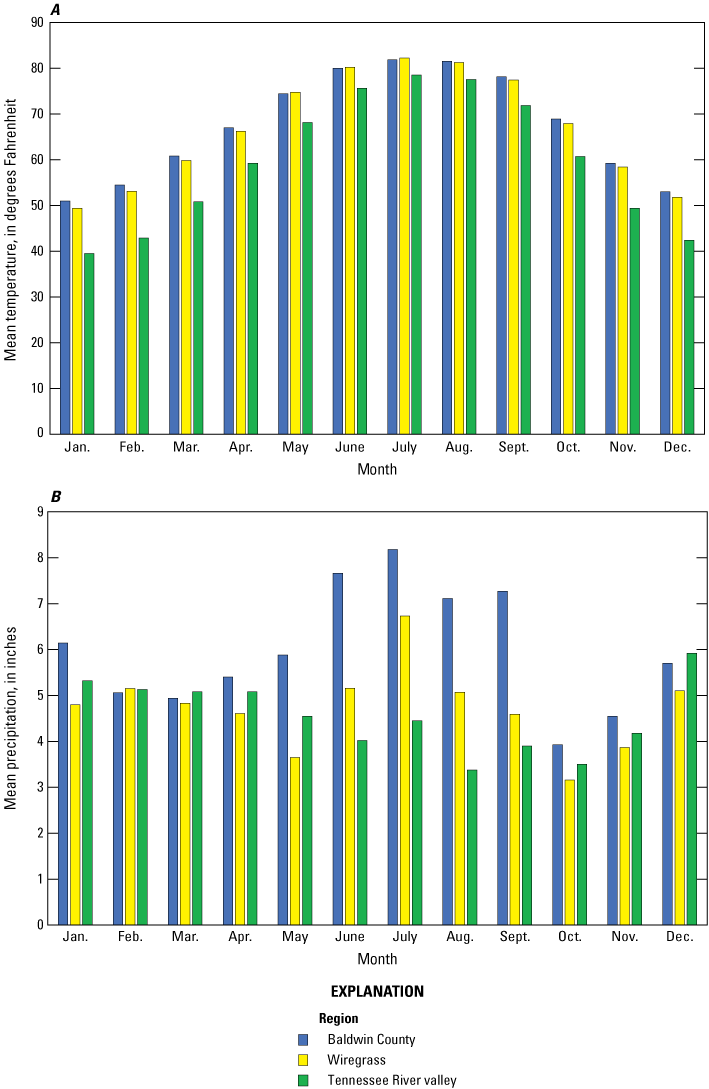
Monthly mean, A, temperature and, B, precipitation during 1991-2020 for the Baldwin County, Wiregrass, and Tennessee River valley study regions in Alabama.
Table 1.
Major crops, based on percentage of harvested cropland, in study regions in Alabama (U.S. Department of Agriculture [USDA] National Agricultural Statistics Service, 2019a).The Wiregrass region extends into parts of nine southeastern Alabama counties (fig. 1; Olliff, 2018). The study sites were located in agricultural areas of three counties in the Wiregrass region, namely Henry, Houston, and Geneva Counties near the City of Dothan, Alabama (fig. 1). Soils in the Wiregrass region are loamy or sandy loam and support the cultivation of peanuts, cotton, soybeans, and vegetable crops (table 1; Mitchell, 2017). From 1991 to 2020, mean monthly temperatures are very similar to temperatures in Baldwin County, ranging from 49 °F in January to 82 °F in July (fig. 2A; National Centers for Environmental Information, 2021c). From 1991 to 2020, mean monthly precipitation in the Wiregrass region was lowest in the fall and greatest in the summer, ranging from about 3.2 in. for October to 6.7 in. for July (fig. 2B; National Centers for Environmental Information, 2021c).
The Tennessee River valley region extends across multiple counties in northern Alabama (fig. 1). Fertile soils formed from the weathering of limestone are used to produce cotton, soybeans, corn, and wheat (table 1; Mitchell, 2017; USDA National Agricultural Statistics Service, 2019a). From 1991 to 2020, mean monthly temperatures in the Tennessee River valley region ranged from about 40 °F in January to about 79 °F in July (fig. 2A; National Centers for Environmental Information, 2021b). From 1991 to 2020, mean monthly rainfall in the Tennessee River valley region was lowest in the summer and greatest in the winter, ranging from about 3.4 in. for August to almost 6.0 in. for December (fig. 2B; National Centers for Environmental Information, 2021b).
Agricultural Row Crops and Estimated Pesticide Use in Study Regions
The frequency and magnitude of pesticide detections in groundwater are related to the application of pesticides, which will tend to increase with increases in cropland area. Total cropland data reported in the 2017 Census of Agriculture (USDA National Agricultural Statistics Service, 2019a) are summarized in figure 3A–B for the counties with wells documented in this report. Limestone County (in the Tennessee River valley region) had the greatest acreage of cropland (fig. 3A), totaling about 160,000 acres and covering about 40 percent of the total county area (fig. 3B). Baldwin County had the third greatest cropland acreage but had the lowest percentage of county area in cropland. As much as possible, study wells were located near denser concentrations of cropland (fig. 1).
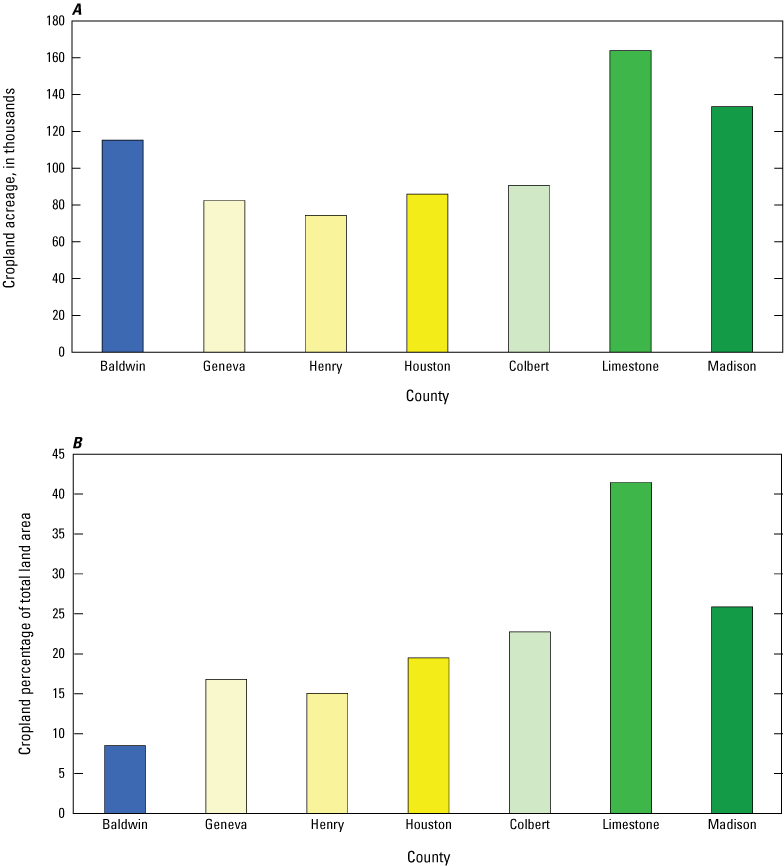
Acreage of A, total cropland and, B, percentage of total land in cropland in counties in Alabama where sampling sites are located (U.S. Department of Agriculture National Agricultural Statistics Service, 2019a).
The cropland data layer (CDL) is produced by the USDA from remotely sensed data to identify crop types in the conterminous United States. CDL data allow for a more detailed view of specific crops in the vicinity of the study wells. Major crop types identified within a 1-kilometer radius of study wells in the 2018 CDL (USDA National Agricultural Statistics Service, 2021) were summarized by region (fig. 4) and evaluated as a potential predictor of pesticide compound detections. Cotton, peanuts, soybeans, corn, and grassland/pasture were the primary agricultural crops around study wells. Some regional differences in crop type were evident. On average, cotton accounted for about 15 percent of the buffer areas around the Baldwin County wells, and about 30 percent of the buffer areas around the Wiregrass region and Tennessee River valley region wells. Peanuts represented 10–15 percent of well buffer areas of Baldwin County and the Wiregrass region but were not present in the Tennessee River valley region well buffer areas. Soybeans and corn were much more prevalent in the Tennessee River valley region than in the other two regions. Grassland/pasture crops accounted for approximately 13 percent of land use in buffer areas around Baldwin County wells and more than 7 percent of buffer areas in the Tennessee River valley, but only about 1 percent of buffer areas in the Wiregrass region.
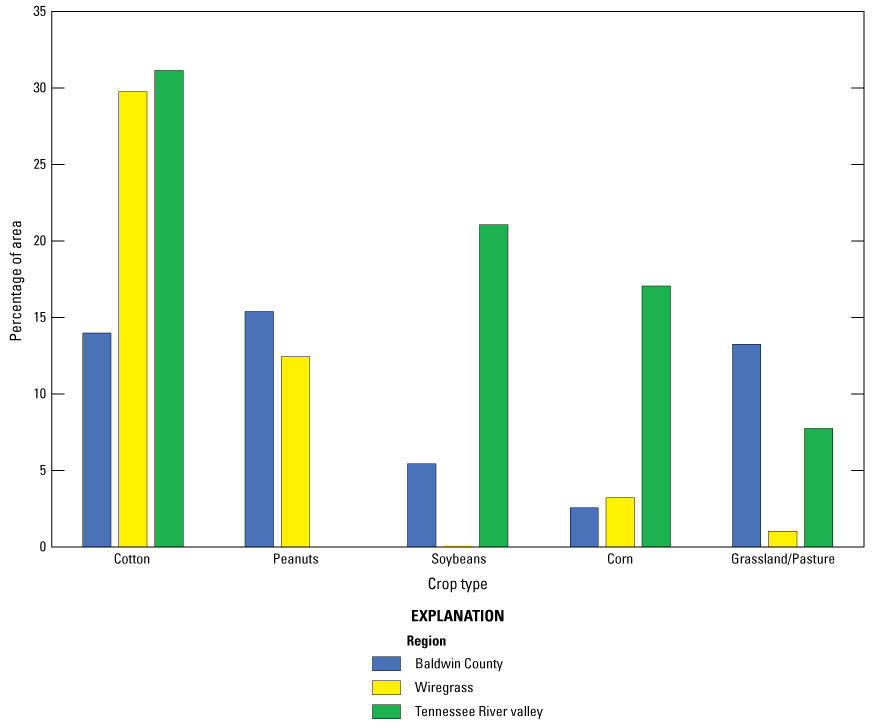
Regional average percentages of common crop types within 1-kilometer buffer areas around sampled wells in Alabama.
Estimates of agricultural pesticide use have been compiled by the USGS for the conterminous United States (Thelin and Stone, 2013; Baker and Stone, 2015; Wieben, 2019). County-level pesticide use was calculated using methods outlined in Thelin and Stone (2013) and Baker and Stone (2015) and crop-specific acreage and pesticide application rates estimated by the U.S. Department of Agriculture (Wieben, 2019). Pesticide use was estimated for 70 of the pesticides evaluated in this study. Total estimated use for the 70 pesticides was calculated by year and county for 2013–17 for the Alabama counties with study wells (fig. 5; Wieben, 2019). Total pesticide use was greatest in the Tennessee River valley region counties of Limestone and Madison during all years except 2014, when use in Baldwin County exceeded use in Madison County, and 2017, when use in Baldwin County exceeded use in Limestone and Madison Counties. Pesticide use in Limestone, Madison, and Baldwin Counties was consistently greater than use in Colbert County or any of the Wiregrass region counties (specifically, Henry, Houston, and Geneva Counties).
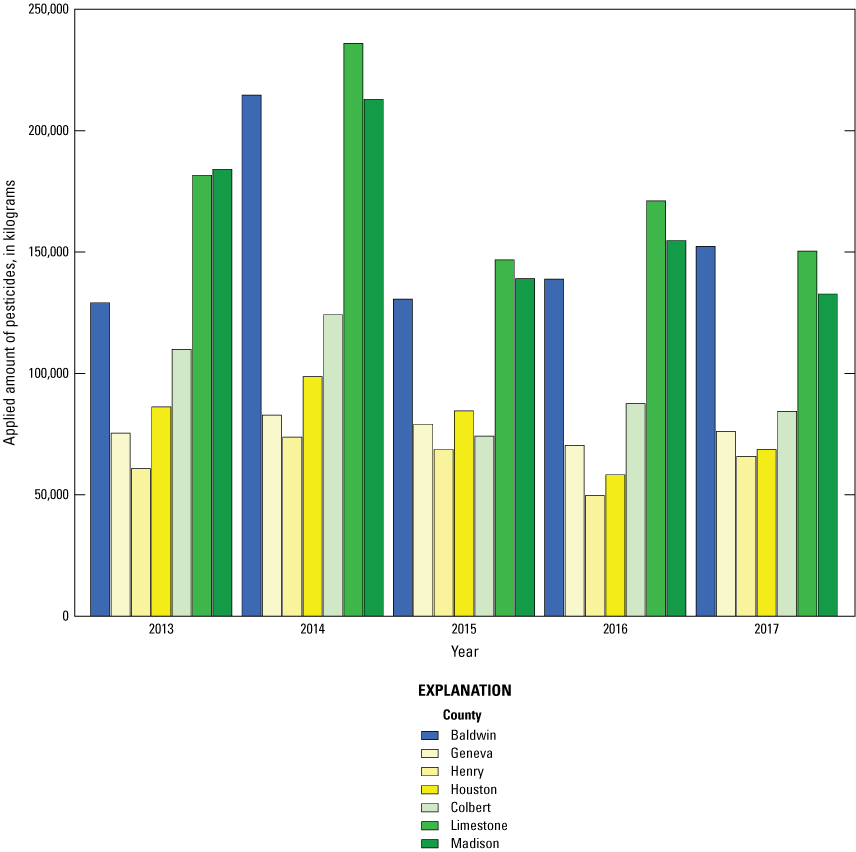
Total pesticide use by county and year in counties with study wells in Alabama, 2013–17 (Wieben, 2019).
The pesticide compounds with the top five total greatest estimated use during 2013–17 in the study counties were all herbicides: glyphosate, pendimethalin, 2,4-D, atrazine, and acetochlor (table 2). Glyphosate, an herbicide widely used on broadleaf weeds and grasses, had the highest use estimates, almost six times greater than those for the next most commonly used pesticides in Alabama. Glyphosate use has been increasing since the introduction of genetically engineered glyphosate-resistant strains of soybeans, corn, cotton, and other crops in the mid-1990s. Because these crop strains are resistant to its effects, glyphosate can be applied throughout the growing season to control weeds (Benbrook, 2016). In the environment, glyphosate binds tightly to soils and has a half-life of a few days, so it is often not detected in groundwater (Henderson and others, 2010). Pendimethalin is used as a pre-emergent herbicide to control broadleaf weeds and grasses. The U.S. Environmental Protection Agency has noted that pendimethalin strongly binds to soils and has a low potential to contaminate groundwater (U.S. Environmental Protection Agency, 1997). The herbicide 2,4-D kills primarily broadleaf weeds by affecting plant cell division. The persistence of 2,4-D in the environment depends upon the chemical form used, with half-lives ranging from a few days to about half a year (Jervais and others, 2008). Atrazine is another pre-emergent herbicide commonly used on corn. Because of its longer half-life, medium solubility in water, and poor binding to soils, atrazine is often found in groundwater (Hanson and others, 2020). Acetochlor is a chloroacetanilide pre-emergent herbicide often used on corn, cotton, soybeans, and other crops to control annual grasses and some broadleaf weeds. Acetochlor is often used along with another pre-emergent herbicide, commonly atrazine, to achieve control of a broader array of weed types (Meyer and Scribner, 2009; Minnesota Department of Agriculture, 2022). Other pesticides with high total use in the study counties included the herbicides metolachlor and dicamba, insecticides chlorpyrifos and acephate, and fungicide tebuconazole.
Table 2.
Pesticides with greatest total estimated use in the study counties in Alabama for 2013–17.[Data from Wieben, 2019. H, herbicide; I, insecticide; F, fungicide]
Methods
Project design included site selection, routine sampling, and recurring data evaluation. The selection of sites was largely unchanged from the previous site selection description (Welch, 2015), but some sites were dropped from the network and replaced with substitute wells for 1 year or on a permanent basis. The years sampled for each well are listed in table 3 and in Gill (2023). Sample collection and field analysis methods followed standard USGS procedures. Laboratory methods were used to determine pesticide concentrations and some nitrate concentrations. Changes and improvements in laboratory analyses that affected sample collection and determination of pesticide concentrations are described in the “Laboratory Methods” section.
Site Selection
The project design included collecting samples from 5 wells in each of the regions for a total network size of 15 wells. Because of changes in well accessibility and availability for sampling, wells were added or removed from the network during the project, so from 2009 to 2020, samples were collected from 24 distinct well sites (table 3; figs. 6–8). All project data supporting this report were published as a data release (Gill, 2023). All sampled wells were in the target agricultural regions except NAWQA LUSCR1-9, an existing agricultural monitoring well in Macon County that was substituted for a disabled well in the Wiregrass region during sampling in 2016. No pesticide compounds were detected in the sample collected from NAWQA LUSCR1-9. Results of the single sample from NAWQA LUSCR1-9 are included in the accompanying data release (Gill, 2023) but are not included further in this analysis. Study wells were either installed specifically for monitoring and evaluating water-quality on a recurring basis (monitoring wells) or routinely used to supply water for domestic, agricultural, or other uses located near areas of agricultural land use (production wells). Well types and depths varied across each of the three study regions.
Table 3.
Groundwater sites sampled as part of pesticide occurrence study near areas of agricultural row cropping in Alabama, 2009–20 (Gill, 2023; U.S. Geological Survey, 2023).[ID, identifier; cnty, county; AL, Alabama; P, agricultural and (or) domestic water uses; M, monitoring use only]
In Baldwin County, samples were collected from domestic or agricultural production wells ranging in depth from 45 to 240 feet (ft) below land surface (table 3), with a median depth of 130 ft below land surface. All Baldwin County wells were completed in the interbedded sand and gravel layers of the Miocene-Pliocene aquifers (Miller, 1990; Robinson and others, 1996).
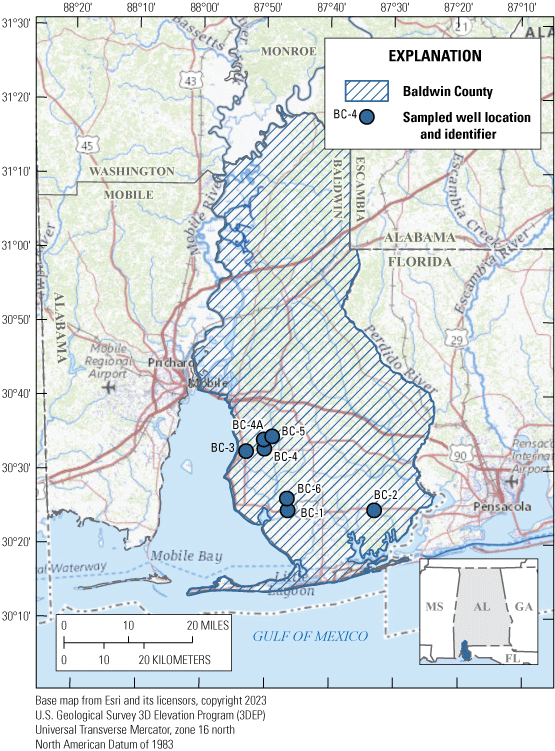
Baldwin County extent and locations of Baldwin County wells sampled during 2009–20.
In the Wiregrass region, samples were collected from 6 production wells and 3 monitoring wells (table 3). Depths in the production wells ranged from 95 to 310 ft below land surface, with a median depth of 186 ft. Depths in the monitoring wells ranged from 44 to 54 ft below land surface. Deeper production wells access water from the Ocala Limestone or Lisbon aquifers, whereas monitoring wells are completed in the overlying sand and gravel alluvium and residuum (Scott and Cobb, 1988; Scott and others, 1967).
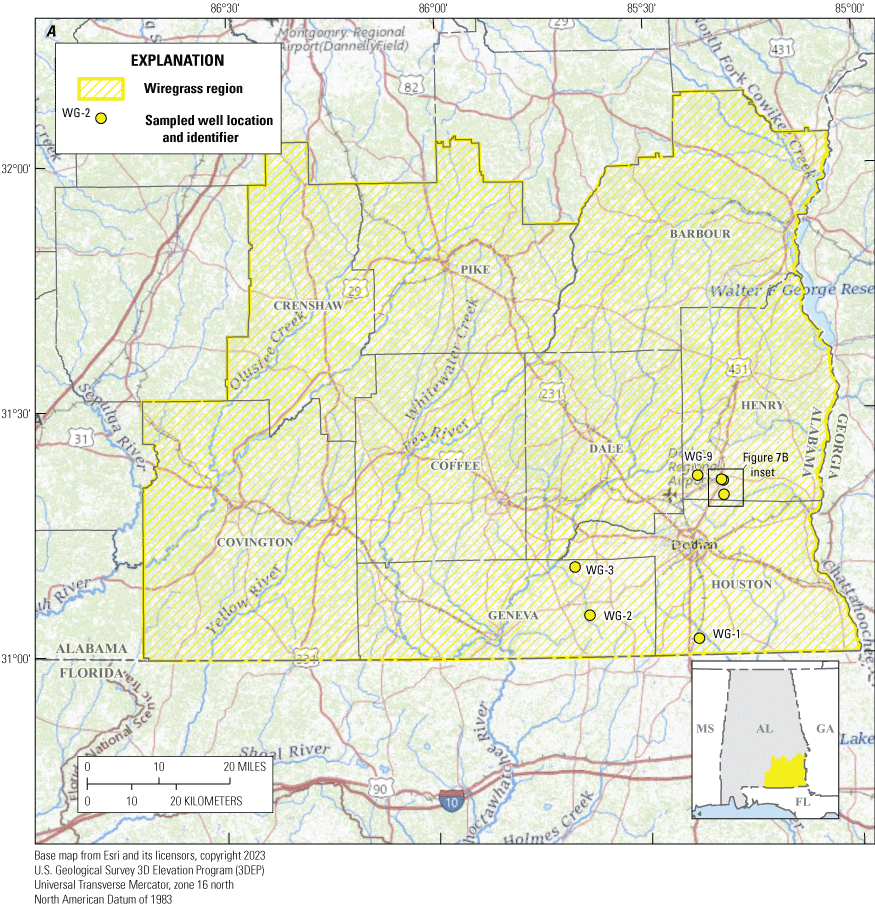
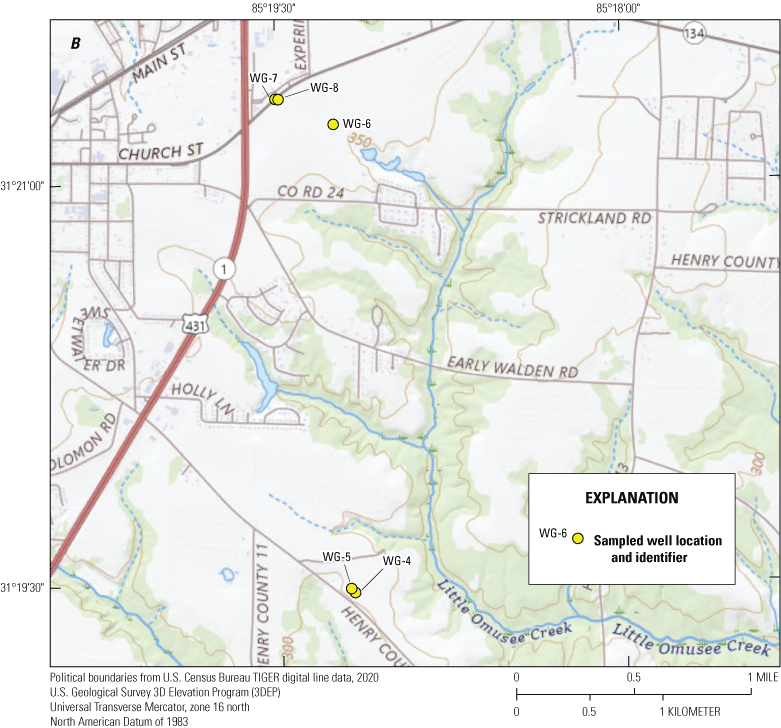
Wiregrass region extent and locations of Wiregrass wells sampled during 2009–20. A, Primary map; B, inset map.
In the Tennessee River valley region, samples were collected from 7 monitoring wells and 1 deeper agricultural production well (table 3). Depths in the monitoring wells ranged from 24 to 53 ft below land surface, with a median depth of 43 ft. The monitoring wells were finished in a regolith composed of clay, silt, and variously sized chert that overlies, and was formed by weathering of, Mississippian-age Tuscumbia Limestone and Fort Payne Chert bedrock (Kingsbury, 2003). The depth of the production well was 107 ft below land surface. This well was screened in the Fort Payne Chert and was sampled in 2016, 2018, and 2020 as a substitute location for a monitoring well that was dry.
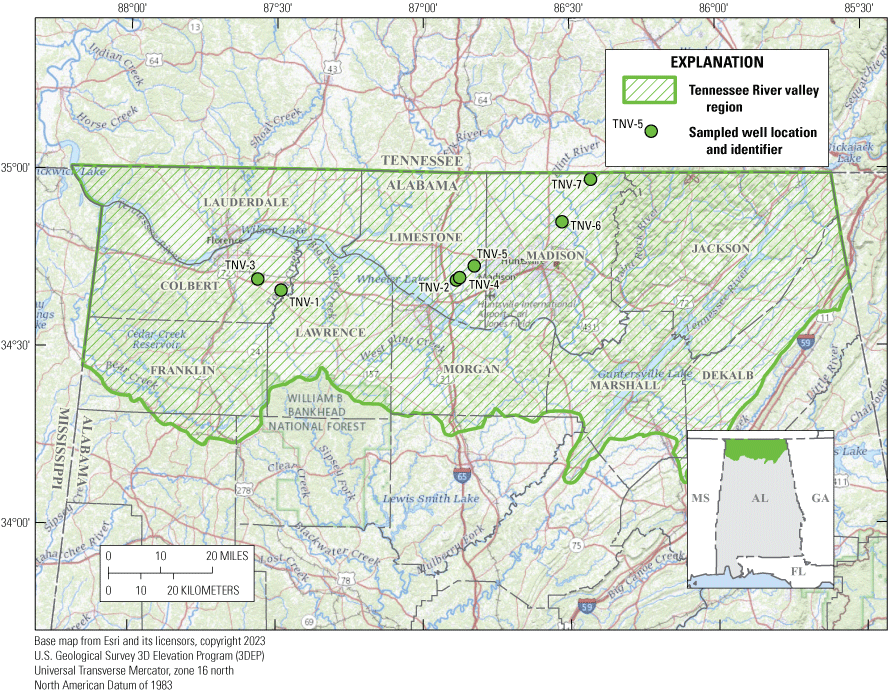
Tennessee River valley region extent in Alabama and location of sampled wells in the region, 2009–20.
Sample Collection and Field Analysis Methods
Samples were collected using techniques to ensure each sample was representative of groundwater conditions at the site and remained uncontaminated by contact with sampling equipment (U.S. Geological Survey, 2018). Samples from production wells were collected from spigots located near the wellheads. Spigots were rinsed with methanol and either allowed to air-dry or rinsed with organic-free water before sampling. Samples from monitoring wells were collected using a portable submersible pump. Water was conveyed from the sample spigot or submersible pump through a length of clean Teflon tubing and stainless-steel connectors to a clean environment for field sample filtration and processing. Water samples collected for laboratory analysis of pesticides were filtered through 0.7-micron pore-size glass-fiber filters in the field into baked-glass containers for transport to the laboratory.
The portable submersible pump and tubing were cleaned between sites by pumping detergent solution, tap water rinse, deionized water rinse, approximately 1 liter of methanol, and approximately 1 gallon of organic-free water through the entire length of tubing. Cleaned equipment was wrapped in foil at any openings in the tubing and the entire length wrapped in a clean plastic bag to prevent contamination.
Field measurement of water properties and chemistry included parameters evaluated by field meters during water sample collection and field colorimetric analysis of samples for concentrations of nitrate. Water temperature, pH, specific conductance, and dissolved oxygen were measured in pumped well water diverted to a flow-through chamber containing a multiparameter water-quality sonde. Turbidity was measured in sample water collected from the outflow of the sonde chamber. Alkalinity and nitrate were evaluated in water collected from the sample processing chamber. Alkalinity concentrations in the water samples were determined by field inflection point titrations (Rounds, 2012). Filtered and unfiltered alkalinity results were combined in this report. Nitrate was determined in the field using Hach reagents and DR 850 field colorimeter. Reagents were added to the samples, and treated samples were analyzed according to the manufacturer’s methods (Hach, 2019).
Laboratory Methods
Water samples were submitted to the USGS National Water Quality Laboratory (NWQL) in Denver, Colorado, for analysis of pesticide concentrations. From 2009 through 2013, samples were analyzed for 82 pesticide compounds by capillary-column gas chromatography/mass spectrometry with selected-ion monitoring (NWQL schedule 2033; Zaugg and others, 1995; Sandstrom and others, 2001). Some of these samples were also analyzed for 63 polar pesticides using a solid-phase extraction and high-performance liquid chromatography/mass spectrometry method (NWQL schedule 2060; Furlong and others, 2001). Beginning in 2014, project samples were analyzed using a direct aqueous-injection liquid chromatography/tandem mass spectrometry method (Sandstrom and others, 2015; NWQL laboratory schedule 2437). The NWQL laboratory schedule 2437 method evaluated more than 200 pesticide and pesticide degradate compounds at concentrations in nanogram-per-liter ranges. In 2018 and 2020, samples also were submitted to the USGS Organic Geochemistry Research Laboratory in Lawrence, Kansas, for analysis of glyphosate, glufosinate, and glyphosate degradate, aminomethylphosphonic acid (AMPA), using isotope dilution and online solid-phase extraction and liquid chromatography/tandem mass spectrometry (Organic Geochemistry Research Laboratory schedule LGCY; USGS method 0-2141-09; Meyer and others, 2009).
In 2018 and 2020, filtered samples were sent to the NWQL for analysis of nitrate concentrations. USGS laboratory colorimetric methods described in Fishman (1993) and Patton and Kryskalla (2011) were used to confirm the magnitude of field-determined nitrate concentrations.
Nitrate Field and Laboratory Method Comparison
In 2018 and 2020, nitrate concentrations in 30 samples were determined by both laboratory and rapid field test methods (Gill, 2023). Differences between laboratory and field results were less than 1 milligram per liter (mg/L) for all but six sample pairs, and linear regression between the two methods had a coefficient of determination (R2) of 0.71. Deviation in field-determined nitrate concentration could be caused by many factors, such as a presence of particulates in unfiltered well water, extended holding times before field analyses, variation between in situ and analysis temperatures, and water chemistry of the sample, but the higher variance between laboratory and field methods for the six samples could not be attributed to a particular cause. When the six high-variance sample pairs were excluded, laboratory and field nitrate concentrations were in strong agreement (R2 = 0.987; fig. 9). The agreement between laboratory and field methods confirmed the suitability of field-determined nitrate concentrations for screening high nitrate occurrence, so all field-determined nitrate concentration data from 2014 to 2020 were incorporated in site-by-site comparisons of nitrate.
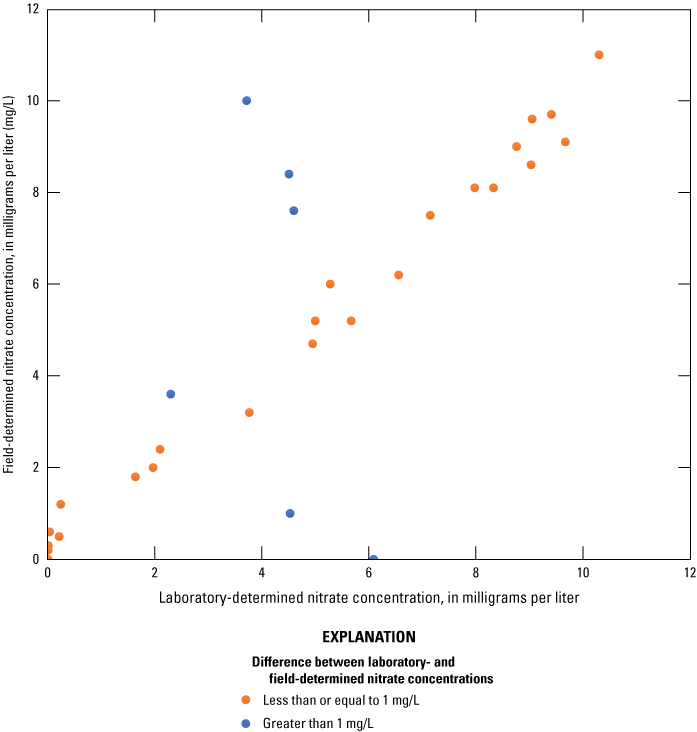
Field and laboratory nitrate concentrations at selected well sites in Alabama, 2014–20.
Pesticide Quality Assurance and Quality Control, 2014–20
During each sample-collection summer, multiple quality-assurance samples were collected to evaluate the variation in sample analyses and the presence and magnitude of any sample contamination. Blank samples were used to determine if sample collection practices caused contamination in the samples. Replicate samples were used to determine variation between samples from the same source and analyzed by the same methods. Spike samples were used to evaluate the ability of laboratory methods to recover pesticide compounds when the compounds are present in samples.
Only three pesticide compounds, namely an insecticide degradate compound, disulfoton oxon sulfoxide, and the herbicides metolachlor and simazine, were detected in field blanks collected for this project between 2014 and 2020 (Gill, 2023). Each compound was detected in only 1 of 13 field blanks. Detections of disulfoton oxon sulfoxide and simazine were less than the reporting limits in effect at the time of sampling. The detection of metolachlor was 9.8 nanograms per liter (ng/L), slightly greater than the detection limit in effect at the time of sampling but below 10 ng/L, the greatest reporting limit for metolachlor during 2014–20 (table 4; Gill, 2023).
Table 4.
Pesticide compounds detected in field blank samples collected as part of the U.S. Geological Survey (USGS)-Alabama Department of Agriculture and Industries cooperative monitoring project between 2014 and 2020.[Data from Gill, 2023. ng/L, nanogram per liter; I, insecticide; H, herbicide; <, less than.]
Since 2014, a total of 16 replicate samples were collected along with environmental samples and analyzed for pesticide concentrations (Gill, 2023). Fifty-six pesticide compounds were detected at least once among these replicated sample pairs. Twenty-six of the detected compounds were not always detected in both samples in a replicate pair, and of these 26 compounds, 10 were only detected in one of the samples in a single pair. Only 4 of the 10 single detections of compounds in replicate sample pairs were at concentrations above their respective minimum reporting limits. The four compounds were
-
• 1H-1,2,4-triazole, detected in the BC-2/Ag & Industries 8, September 2018 environmental sample only at an estimated concentration of 55.3 ng/L (minimum reporting level [MRL] 50 ng/L);
-
• 2-isopropyl-6-methyl-4-pyrimidinol, detected in the WG-4/Well AG & Industries 1, May 2015 replicate sample only at an estimated concentration of 44.4 ng/L (MRL 20 ng/L);
-
• diuron, detected in the TNV-6/EHR-LUS13, June 2015 environmental sample only at a concentration of 6.85 ng/L (MRL 6.65 ng/L); and
-
• indoxacarb, detected in the BC-2/Well Ag & Industries 8, September 2014 replicate sample only at a concentration of 21.5 ng/L (MRL 10 ng/L).
Relative percent differences (RPDs) were calculated for the 168 replicate pairs with quantified pesticide compound detections to describe the variability between samples (Mueller and others, 2015; Gill, 2023). The RPDs ranged from 0 to 112 percent, with a median of 8.1 percent. About 89 percent of the replicate pairs with quantified detections had RPDs less than 30 percent (table 5). RPDs were greater than 50 percent in one replicate pair for each of four compounds: 1H-1,2,4-triazole (111.54 percent), dimethenamid sulfinylacetic acid (62.07 percent), imidacloprid (55.25 percent), and N-(3,4-Dichlorophenyl)-N'-methylurea (52.48 percent) (Gill, 2023).
Table 5.
Summary of relative percent differences between detected pesticide concentrations in replicate samples collected from selected groundwater wells in Alabama during 2014–20.[Data from Gill, 2023. RPD, relative percent difference; >, greater than; %, percent.]
During 2014–20, six pesticide samples were collected in duplicate and one sample of each pair was spiked in either the field or the laboratory with a solution having known elevated concentrations of pesticides of interest (Gill, 2023). The analysis of differences in compound recoveries between the spiked and unspiked samples indicated whether interactions in the sample matrix could affect the detection of target pesticide compounds. Most compounds had median percent recoveries within plus or minus 30 percent of the expected concentration. Fifteen compounds had median recoveries less than 70 percent of the expected concentration (table 6; Gill, 2023). The low recovery indicates that for these compounds there could be degradation or interactions with the sample matrix that result in low bias in the reported results. No compounds had median spike recoveries greater than 125 percent of the expected concentration (Gill, 2023).
Table 6.
Pesticide compounds with percent recoveries less than 70 percent in spiked samples collected from selected groundwater wells in Alabama during 2014–20 (Gill, 2023).Field Tests and Nitrate Results
Basic field parameters (temperature, specific conductance, pH, turbidity, and dissolved oxygen) were measured during sample collection at all sites. In addition, rapid field chemical tests of nitrate concentrations were performed on raw water samples from the sites. Shallow groundwater collected at 19 shallow groundwater sites in Alabama during 2018 and 2020 was analyzed for nitrate concentration by laboratory methods to confirm nitrate results provided by field chemical tests in previous years.
Field Parameters
Field parameters were measured at regular intervals from the start of pumping to sample collection to determine when adequate purging of water standing in the well had been achieved and sample water would be representative of aquifer conditions near the well. Once parameter values stabilized, a set of measurements was collected at the start of sampling to describe general water quality in the aquifer. Measurements collected at the time of sampling are summarized here.
Field parameter values varied across the study area, but values in individual wells remained similar across multiple years during 2014–20 (Gill, 2023; fig. 10). Water temperatures ranged from 20.6 to 29.1 degrees Celsius (°C) in the Baldwin County wells, from 21.3 to 26.2 °C in the Wiregrass region wells, and from 16.5 to 19.6 °C in the Tennessee River valley region wells (fig. 10A). Cooler temperatures were recorded in the Tennessee River valley region wells that are more northerly and these wells generally were sampled during cooler spring months. Specific conductance ranged from 30 to 162 microsiemens per centimeter at 25 degrees Celsius (μS/cm at 25 °C) in Baldwin County wells, from 49 to 245 μS/cm in Wiregrass region wells, and from 64 to 282 μS/cm in Tennessee River valley region wells (fig. 10B). Median specific conductance in the Baldwin County wells was 125 μS/cm, lower than in the Wiregrass and Tennessee River valley regions, where median specific conductivity was 226 and 215 μS/cm, respectively. pH ranged from 4.2 to 5.3 standard units in Baldwin County wells, from 4.3 to 8.0 standard units in Wiregrass region wells, and from 4.7 to 7.1 standard units in Tennessee River valley region wells (fig. 10C). Low pH values were recorded in the Baldwin County region wells, which were completed in the less-buffered sands of the Miocene-Pliocene aquifers. Median pH values in the Wiregrass and Tennessee River valley regions were 7.5 and 6.5, respectively, reflecting the presence of soils having greater buffering capacity than those in the vicinity of Baldwin County region wells. Dissolved oxygen concentrations ranged from 5.9 to 8.9 mg/L in Baldwin County wells, from 1.3 to 9.5 mg/L in Wiregrass region wells, and from 2.7 to 9.7 mg/L in Tennessee River valley region wells, with most lower values occurring in the deeper wells (fig. 10D). Many of the dissolved oxygen values may have been affected by aeration during well purging. Turbidity for most wells was less than 20 nephelometric turbidity units (ntu), ranging from 0.8 to 22 ntu in Baldwin County wells, from 0 to 60 ntu in Wiregrass region wells, and from 0 to 100 ntu in the Tennessee River valley wells (fig. 10E). Wells BC-4A, TNV-6, and WG-8 had readings above 20 ntu. Alkalinity was not evaluated in many well samples, especially in Baldwin County, because low pH indicated very low alkalinity. Measured field alkalinity values ranged from 0 to 4 mg/L as calcium carbonate (CaCO3) in Baldwin County wells, from 0 to 114 mg/L as CaCO3 in Wiregrass region wells, and from 4 to 120 mg/L as CaCO3 in Tennessee River valley region wells (fig. 10F).
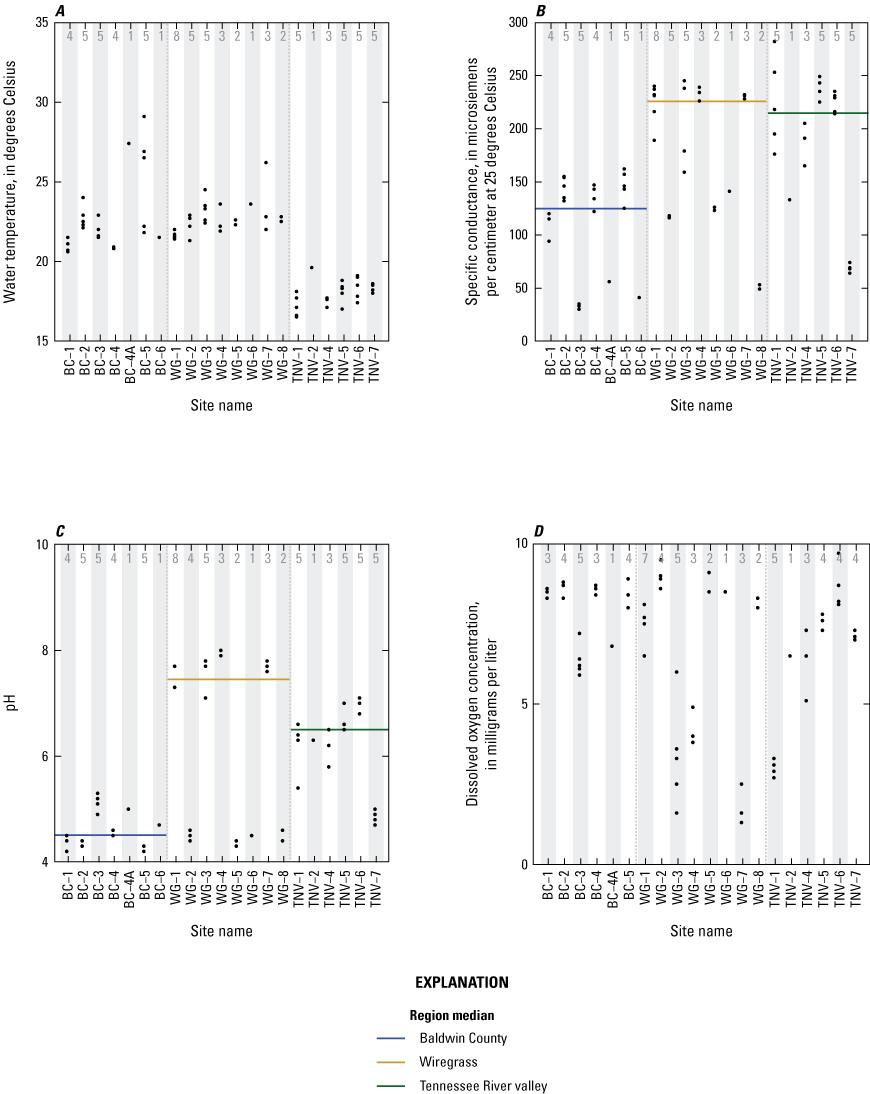
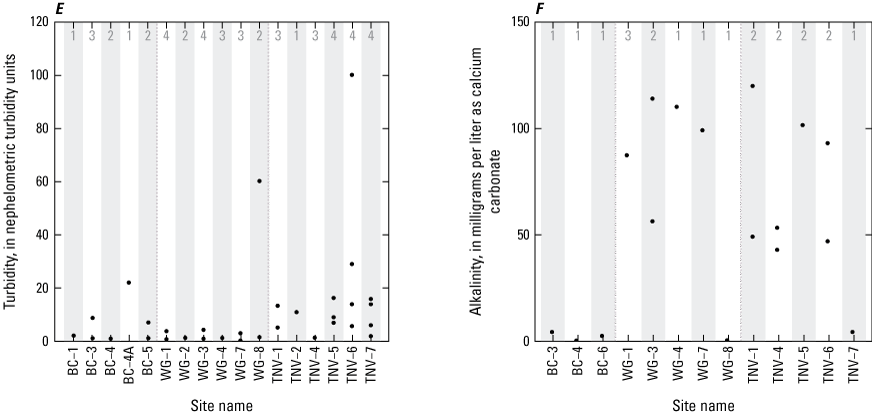
Dot plots of, A, temperature, B, specific conductance, C, pH, D, dissolved oxygen, E, turbidity, and F, alkalinity in groundwater measured at selected sites in Alabama, 2014–20.
Nitrate Concentrations
Nitrate concentrations greater than 10 mg/L in drinking water are linked to an increased incidence of methemoglobinemia, a serious blood disorder that disrupts the supply of oxygen to cells in infants and young children (U.S. Environmental Protection Agency, 2009). Other studies have indicated that elevated nitrate concentrations in drinking water may cause health problems in adults as well (Ward and others, 2018). During the first several years of sampling, field rapid chemical tests of samples from some study wells indicated that nitrate concentrations approached or exceeded the drinking-water standard of 10 mg/L (Gill, 2023).
In 2018 and 2020, nitrate concentrations in 30 samples collected from 19 wells were determined by laboratory methods as well as by the rapid chemical tests (Gill, 2023). Laboratory results for nitrate as nitrogen ranged from 0.01 to 10.3 mg/L. Field test concentrations for the same samples ranged from 0 to 11 mg/L nitrate as nitrogen.
Measured concentrations of nitrate in a few study wells were close to the drinking-water maximum contaminant level of 10 mg/L and are a cause for concern if well water is used as a drinking-water source (fig. 11). Field nitrate concentrations of 10 mg/L or greater were measured at BC-1, BC-2, BC-5, WG-6, and TNV-6. A field nitrate concentration of 22 mg/L, almost double the drinking-water limit for nitrate, was recorded once each at wells BC-2 and WG-6 (fig. 11, Gill, 2023). Field nitrate concentrations were generally less variable and lower with increasing well depth (fig. 12).
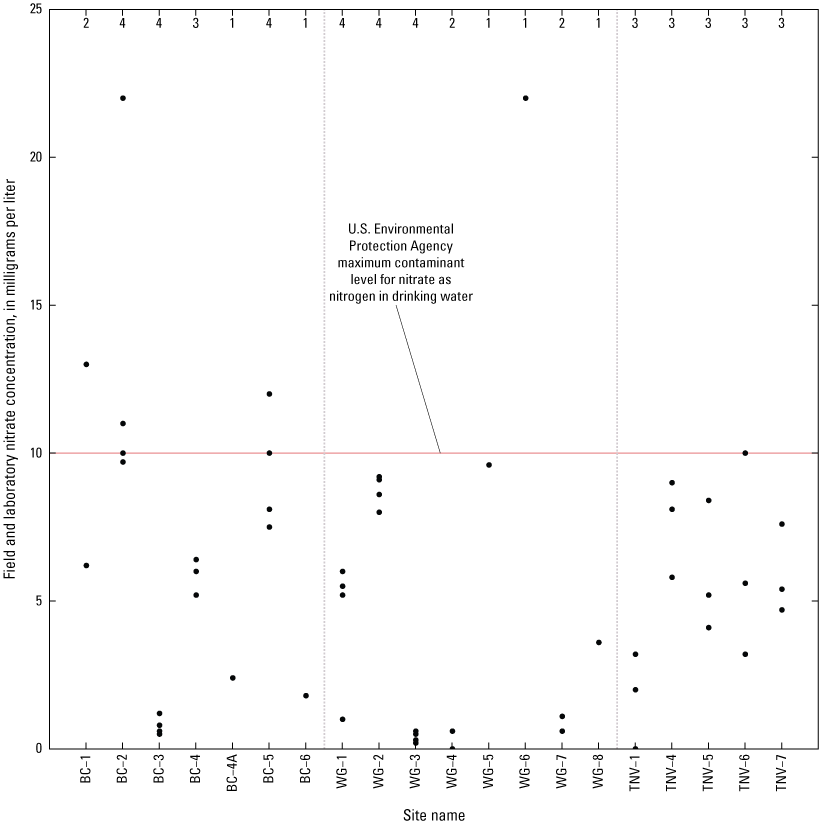
Dot plots of field-determined nitrate concentrations in groundwater at selected sites in Alabama during 2014–20. BC, Baldwin County; WG, Wiregrass; TNV, Tennessee River valley.
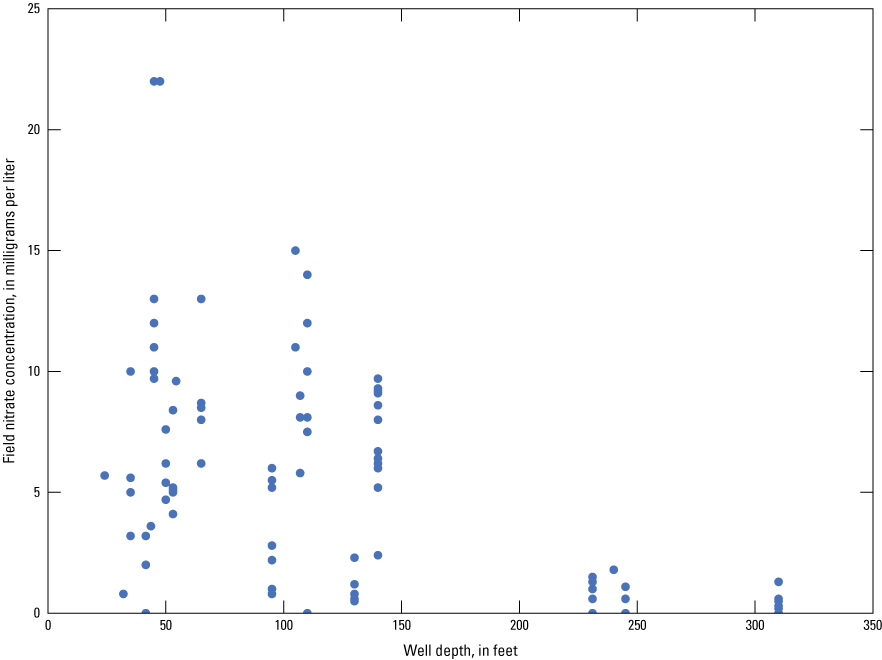
Field nitrate concentration in groundwater and well depth at selected sites in Alabama, 2014–20.
Pesticide Environmental Sampling Results, 2014–20
From 2014 to 2020, a total of 75 environmental samples were collected from 22 groundwater sites. Concentrations of 230 pesticide and pesticide degradate compounds were determined (Gill, 2023). Some compounds were not analyzed in all samples, so the number of samples analyzed is listed along with the number of detections for each compound in table 7. The results of these analyses are summarized by the frequency of pesticide detections, magnitude of pesticide concentrations, and relation of the results to well locations and characteristics.
Table 7.
Pesticide compounds detected in samples collected from groundwater wells as part of the U.S. Geological Survey (USGS)-Alabama Department of Agriculture and Industries cooperative monitoring project between 2014 and 2020 (USGS, 2023).[MRL, minimum reporting level; ng/L, nanogram per liter; BC, Baldwin County; WG, Wiregrass; TRV, Tennessee River valley; F, fungicide; H, herbicide; I, insecticide; <, less than; --, not applicable]
Additional compound information from Kim and others (2019).
Frequency of Detections
The occurrence of environmental pesticides is often evaluated by the percentage of samples with detections, or the detection frequency, of pesticide compounds. Pesticide compound detection frequencies were evaluated for the entire study area. The overall evaluation is presented herein and followed by a discussion of regional differences. Detections are summarized by the type of pesticide use and the most commonly detected individual compounds.
Study-Wide Pesticide Detection Frequency
Of the 230 compounds analyzed, 92 were detected in at least one of the environmental samples collected between 2014 and 2020 (table 7). Forty-two parent pesticides (9 fungicides, 24 herbicides, and 9 insecticides) were detected, and 50 pesticide degradates were detected. Many compounds were detected infrequently in the environmental samples, including 37 compounds detected only once.
The most commonly detected compound in samples collected from 2014 to 2020 was the herbicide degradate metolachlor SA, present in about 70 percent of the samples. The parent herbicide metolachlor was detected less often, in almost 58 percent of the samples. Rose and others (2018) noted that metolachlor and its degradates were commonly detected in previous pesticide occurrence studies and that metolachlor SA has a higher water solubility than the parent compound. Another herbicide, atrazine, and 2-hydroxy-4-isopropylamino-6-amino-s-triazine (OIAT), an atrazine degradate, were also detected in more than 50 percent of samples for this time period.
Twenty-four pesticide or degradate compounds were detected in more than 15 percent of samples (fig. 13). Within these 24 most commonly detected compounds, 9 were parent pesticide compounds and 15 were pesticide degradates. Nineteen of the compounds were herbicides or herbicide degradates, 3 were insecticides or insecticide degradates, and 2 were fungicides or fungicide degradates.
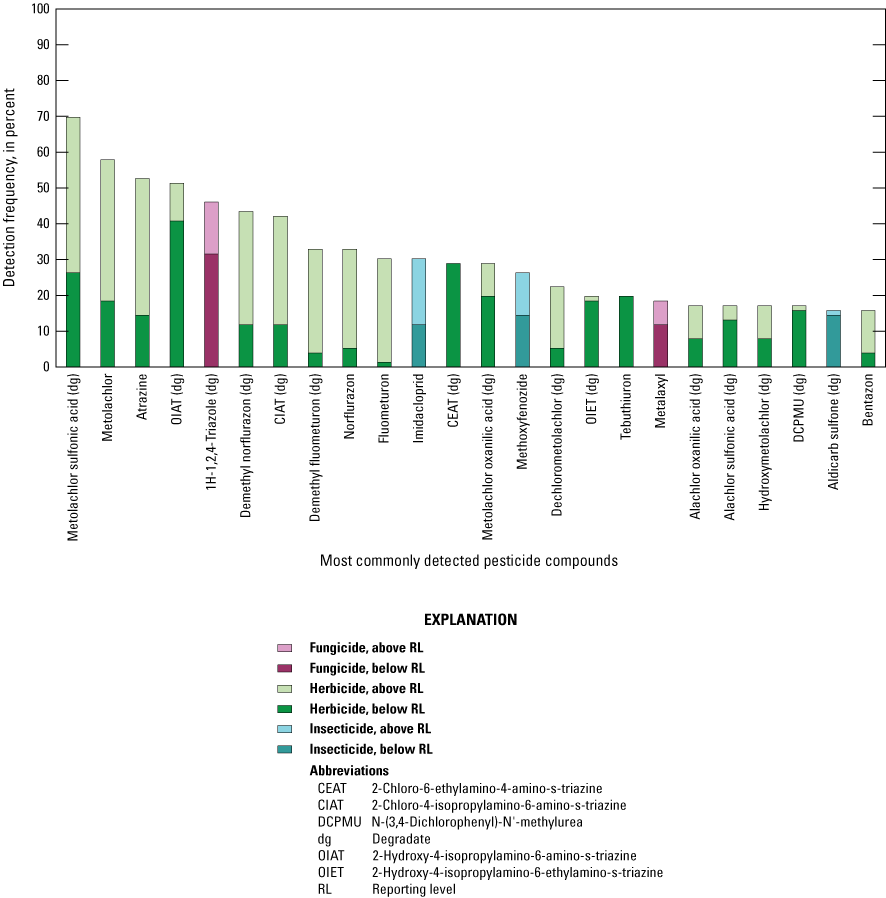
Detection frequencies and type of pesticide compounds detected in 15 percent or more of groundwater samples collected from selected sites in Alabama in 2014–20.
The most commonly applied pesticide compounds were not always the most frequently detected. For instance, glyphosate had the greatest estimated application (table 3), but out of 30 samples collected in 2018 and 2020, glyphosate was only detected once, at TNV-1. The glyphosate degradate AMPA was detected twice, also at TNV-1. The other analyzed pesticides with the greatest application rates were evaluated in all 75 samples collected during 2014–20. Neither parent nor degradate compounds were detected for pendimethalin, 2,4-D, or dicamba. Acetochlor and an acetochlor degradate were detected once each. Acephate was detected once, and tebuconazole was detected three times. Chlorpyrifos was not detected, but its degradate was detected once. Parent and degradate compounds of atrazine and metolachlor were frequently detected (table 7; Gill, 2023).
Pesticide Detection Frequency by Region
Mobility and persistence of agricultural pesticides may be affected by the differences in soil types, weather, crop types, and pesticide use among the regions. Detection frequency was examined for the 230 analyzed pesticides and revealed variations between each of the regions.
Baldwin County was the region having the greatest number of unique pesticide compound detections. Fifty-seven pesticide compounds were detected in at least one environmental sample, and 34 of the detected compounds were pesticide degradates. There were 31 herbicides (14 parent herbicides and 17 herbicide degradates), 21 insecticides (5 parent insecticides and 16 insecticide degradates), and 5 fungicides (4 parent fungicides and 1 fungicide degradate) detected in samples collected from Baldwin County wells (Gill, 2023). In order of descending frequency of detection, the five most frequently detected compounds in the Baldwin County region were metolachlor SA (a metolachlor degradate), metolachlor, 1H-1,2,4-Triazole, OIAT (an atrazine degradate), and metolachlor OA (a metolachlor degradate) (table 8). Four of the five most frequently detected compounds were herbicides or herbicide degradates.
Table 8.
Five most frequently detected compounds within each study region in Alabama (U.S. Geological Survey, 2023).[NWIS, National Water Information System; H, herbicide; I, insecticide; F, fungicide; %, percent]
In the Wiregrass region wells, 43 pesticide compounds were detected in project groundwater samples. Sixteen parent pesticide compounds, 26 pesticide degradates, and 1 compound that is both a parent pesticide and a degradate of another pesticide were detected. Most of the detected compounds were herbicides (13 parent herbicides and 19 herbicide degradates). There also were 7 insecticide compounds (2 parent insecticides and 5 insecticide degradates) and 4 fungicide compounds (1 parent fungicide, 2 fungicide degradates, and 1 compound that was either a parent or degradate) detected in Wiregrass region samples (Gill, 2023). The five most frequently detected compounds in the Wiregrass region well samples were metolachlor SA, atrazine, 1-H-1,2,4-triazole, OIAT, and metolachlor (table 8).
In the Tennessee River valley region wells, 48 pesticide compounds were detected in project groundwater samples. Twenty-five of the detected compounds were parent pesticides and an almost equal number (23) were pesticide degradates. Thirty-three of the detected compounds were herbicides (14 parent compounds and 19 degradates), 8 were insecticides (5 parent compounds and 3 degradates), and 7 were fungicides (6 parent compounds and 1 degradate) (Gill, 2023). The five most frequently detected pesticide compounds in the Tennessee River valley region were atrazine, 2-chloro-4-isopropylamino-6-amino-s-triazine (CIAT), deethyl norflurazon, metolachlor, and imidacloprid. Imidacloprid is an insecticide and the other four of the top five compounds are herbicides or herbicide degradates (table 8).
The amount of applied pesticides and the crop types grown may explain the high frequencies of detection for the most frequently detected compounds. The herbicides atrazine and metolachlor were commonly used in all three regions and were, respectively, the 2nd and 8th most heavily used pesticides in Baldwin County, the 9th and 12th most heavily used in the Wiregrass region, and the 4th and 7th most heavily used in the Tennessee River valley (Wieben, 2019). The degradate of the fungicide propiconazole, 1H-1,2,4-triazole, was the third most commonly detected pesticide in Baldwin County and the Wiregrass region. Fungicides are used on many crops, but peanut crops, in particular, are heavily treated with fungicides (USDA National Agricultural Statistics Service, 2019b). The common cultivation of peanuts in Baldwin County and the Wiregrass region may explain the frequent detection of this fungicide degradate (fig. 4; USDA National Agricultural Statistics Service, 2021). Norflurazon, an herbicide commonly used on cotton, peanuts, and soybeans (U.S. Environmental Protection Agency, 1996), was applied in similar amounts in the Tennessee River valley and the Wiregrass regions, at about three times the rate of use in Baldwin County (Wieben, 2019). The common detection of the norflurazon degradate demethyl norflurazon in Tennessee River valley wells but not in Wiregrass region wells may be due to the shallower well depths in the Tennessee River valley region (Gill, 2023). Frequent detections of the insecticide imidacloprid also appear to be related to shallow well depths. Imidacloprid is recommended to control aphids, plant bugs, and whiteflies in cotton (Alabama Cooperative Extension System, 2023) and to control an array of soybean pests (Greene, 2017). Cotton is common near Wiregrass region wells, and both crop types are common near Tennessee River valley wells (fig. 4). Although imidacloprid use in the Wiregrass region was approximately twice the use in the Tennessee River valley (Wieben, 2019), detections of imidacloprid occurred almost exclusively in the Tennessee River valley wells, with only two other detections, both in well WG-5, a shallow well installed for this project (Gill, 2023).
Magnitude of Detections
Study-Wide Pesticide Concentrations
Many of the individual detections of pesticide compounds were concentrations of very small magnitude. More than half (409 of 753) of individual detections of pesticide compounds in environmental samples were below the greatest applicable compound reporting limits in effect during the project (Gill, 2023). Detected concentrations above reporting limits were compared to benchmarks and limits determined by U.S. Environmental Protection Agency and USGS for individual compounds (U.S. Environmental Protection Agency, 2009; Norman and others, 2018).
Ten compounds accounted for the 50 greatest detected concentrations in samples collected during 2014–20 (table 9; Gill, 2023). Metolachlor and three metolachlor degradates accounted for 33 of the 50 greatest magnitude detections. Metolachlor was the compound with the second greatest magnitude of use in the study area (Wieben, 2019), and, as noted previously, metolachlor degradates are likely to be detected frequently in groundwater because of their chemical characteristics. The greatest detected concentration of a single pesticide compound in this study was 62,500 ng/L of metolachlor in the June 2020 sample from TNV-1. Metolachlor SA was the compound with the second greatest detected concentration (14,800 ng/L) and the most frequently detected at the greatest concentrations, with 19 detections in the top 50 by magnitude. Most of the high detections of metolachlor SA occurred in Baldwin County wells BC-1, BC-2, and BC-5 (Gill, 2023).
Table 9.
Frequency of detection for each pesticide compound among the 50 greatest concentrations of individual pesticide compounds in groundwater collected from selected wells in Alabama during 2014–20 (U.S. Geological Survey, 2023).[ng/L, nanogram per liter]
Maximum contaminant levels (MCLs) and human-health benchmarks (HHBPs) set by the U.S. Environmental Protection Agency are limits for contaminant concentrations intended to protect human and environmental health. Health-based screening levels (HBSLs) determined by the USGS (Norman and others, 2018) are non-enforceable thresholds that indicate similar human health risks for compounds that do not have U.S. Environmental Protection Agency MCLs and HHBPs. When guidelines are expressed as a range of concentrations, comparisons in this report have been made to the lower limit of the defined range. Fifty of the pesticides detected during 2014 through 2020 have at least one benchmark. Six compounds have applicable MCLs, 30 have assigned HHBPs (chronic noncancer or carcinogenic), and 20 have HBSLs (noncancer or cancer). All pesticide detections during 2014 through 2020 were at concentrations below assigned MCLs, HHBPs, and HBSLs, and for 40 of the compounds with assigned benchmarks, all pesticide detections were less than 1 percent of the benchmark concentration.
Although no detected concentrations were great enough to warrant human health concerns, a comparison of maximum detected environmental concentrations to the benchmark concentrations was made as a preliminary screening of compounds that might approach problematic levels in the future. Concentrations for 10 detected compounds equaled or exceeded 1 percent of their respective guideline concentrations (table 10). Maximum detected concentrations of alachlor and atrazine were 2 and 12.4 percent, respectively, of their MCLs. Maximum detected concentrations of 1H-1,2,4-triazole and norflurazon were 9.4 and 1.39 percent, respectively, of their chronic noncancer HHBPs. Maximum detected concentrations of five compounds, aldicarb sulfone, aldicarb sulfoxide, fentin, fluometuron, and metolachlor, were between 3 and 16 percent of their respective noncancer HBSL guideline minimums. Diuron, fentin, and fluometuron maximum concentrations were approximately 5.45, 91.5, and 32.2 percent, respectively, of the lower limit of the range of concentrations for cancer HBSL. Fentin, the compound detected at a concentration closest to an applicable benchmark, was only detected once during 2014–20.
Table 10.
Comparison to human health benchmark concentrations for compounds with maximum detected concentration in groundwater samples from selected wells in Alabama equal to 1 percent or more of benchmark concentration (U.S. Geological Survey, 2023; U.S. Environmental Protection Agency, 2009; Norman and others, 2018).[USGS, U.S. Geological Survey; ng/L, nanogram per liter; MCL, U.S. Environmental Protection Agency maximum contaminant level; HHBP, U.S. Environmental Protection Agency human-health benchmark for pesticides; HBSL, U.S. Geological Survey health-based screening level; --, no defined benchmark concentration]
Pesticide Detections and Concentrations by Region
The compound most frequently detected in the top 50 greatest concentrations in all regions was metolachlor SA, but there were some differences between the regions for other pesticide compounds detected at maximum concentrations (table 11). Atrazine, fluometuron, and their degradates were among the greatest detected concentrations in the Tennessee River valley but not in Baldwin County or the Wiregrass region. Norflurazon and demethyl norflurazon were detected in the top 50 concentrations in the Wiregrass and Tennessee River valley regions but not in Baldwin County. Concentrations of several disulfoton degradates occurred once in the top 50 concentrations for Baldwin County. AMPA, a degradate of glyphosate, was detected in the top 50 greatest concentrations in the Tennessee River valley region.
Table 11.
Compounds detected at the top 50 greatest detected pesticide concentrations in groundwater samples from each study region of Alabama during sample years 2014–20 (U.S. Geological Survey, 2023; Gill, 2023).Pesticide Detections and Concentrations by Site
The number and total concentration of detected pesticides were computed for each sample, and the median number of detected pesticides and median total pesticide concentration were determined for each well. The median number of detections and median total concentrations were used to describe differences between sites.
At least one pesticide compound was detected in 70 of 75 samples. Twenty-three pesticides, the maximum number of compounds in an individual sample, were detected in the single sample from BC-4a. No pesticides were detected in five samples from WG-3 or WG-4, the first and fourth deepest wells, respectively. The low numbers of compounds detected in samples from these wells may be related to the distance between the sources of pesticides at the land surface and the aquifer system in which the wells are completed.
The overall median number of detected compounds in a single sample was 10. All wells in the Tennessee River valley region had median numbers of detected compounds greater than the overall median, whereas in Baldwin County and the Wiregrass regions there was a mix of wells with median numbers of detected compounds well below and well above the overall median (fig. 14). There was a significant, moderate, inverse relation (Spearman rho = −0.59, p <0.001) between the number of compounds detected and well depth (fig. 15).
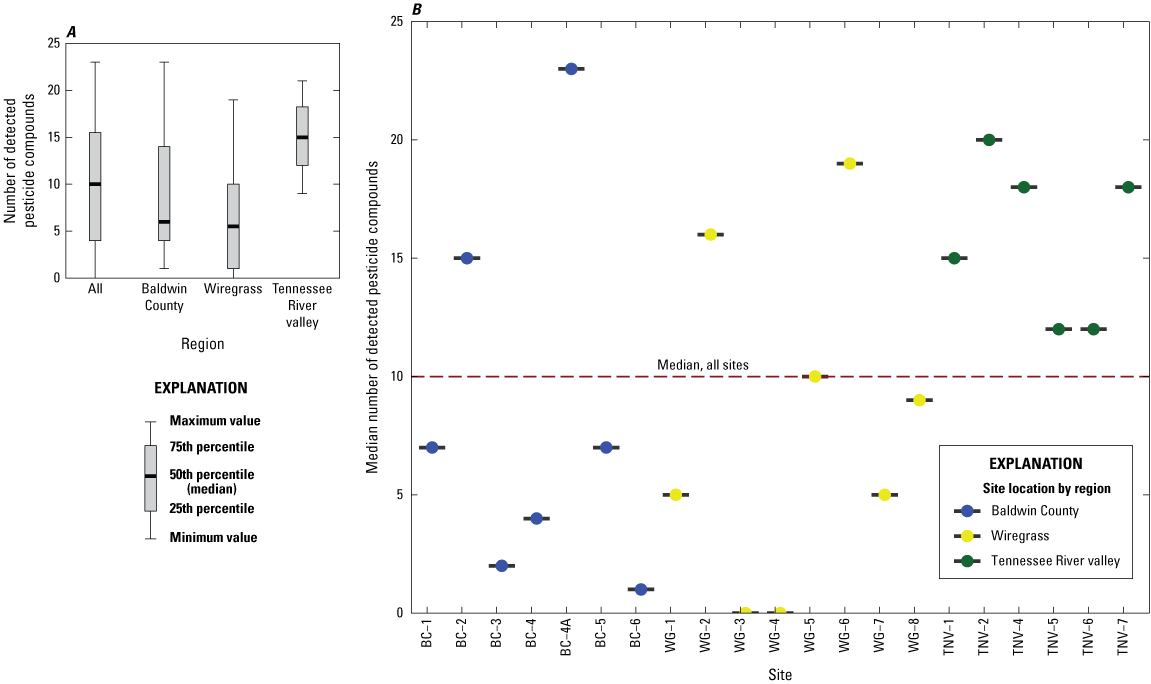
Regional boxplots of number of pesticide compound detections, A, and median number of pesticide compound detections by well, B, for 2014–20 samples from selected groundwater wells in Alabama.
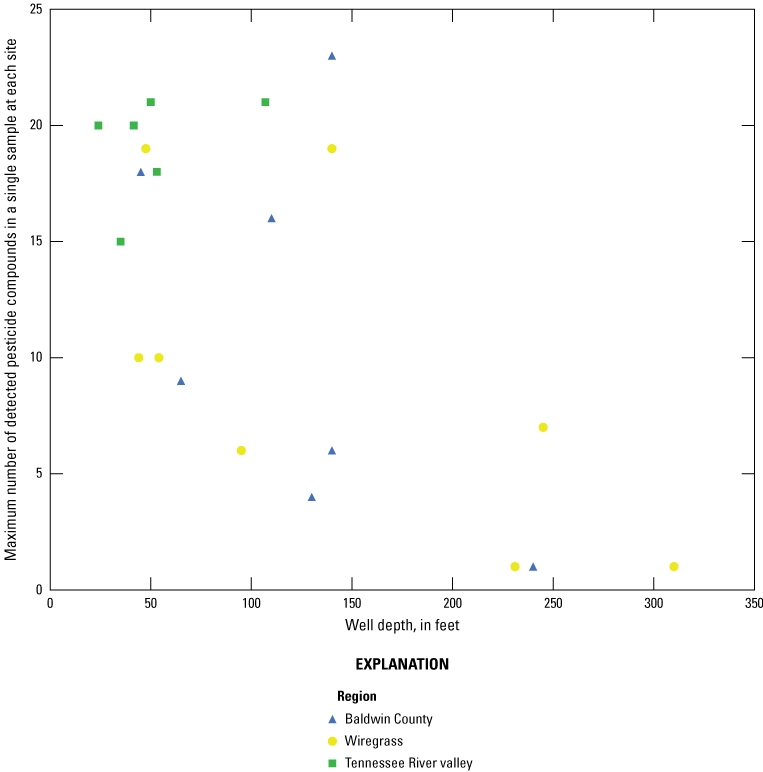
Maximum number of pesticide compounds detected in a single groundwater sample and well depth for selected sites in Alabama sampled in 2014–20.
Total detected concentrations have remained similar for wells that have been sampled multiple years over the last 5 years of sampling (fig. 16). BC-2 had the greatest median total concentration. About 92 percent of the total concentrations at BC-2 were from detections of metolachlor and five metolachlor degradates. The most variable total concentrations have occurred at TNV-1, with total detected pesticide concentrations ranging from 381 ng/L in 2015 to about 87,300 ng/L in 2020 (Gill, 2023).
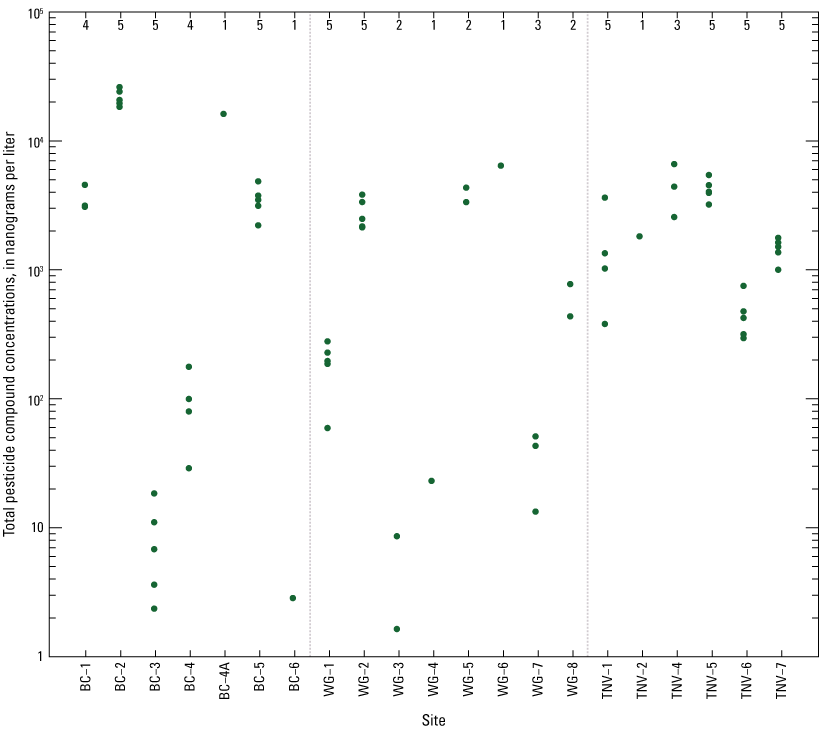
Dot plots of total detected pesticide concentration by groundwater sample for selected wells in Alabama sampled in 2014–20. BC, Baldwin County; WG, Wiregrass; TNV, Tennessee River valley.
The sum of detected pesticide concentrations in single samples were significantly and moderately inversely correlated to well depth in Baldwin County (Spearman rho = −0.75, p-value <0.01) and the Wiregrass region (Spearman rho = −0.75, p-value <0.01; fig. 17). In these two regions, wells having depths greater than about 125 ft had much lower single sample pesticide concentrations. In the Tennessee River valley region, a significant, strong, positive correlation was found between the single-sample sum of detected pesticide concentrations and well depth (Spearman rho = 0.70, p-value <0.001). Most study wells in the Tennessee River valley region were shallow monitoring wells having very similar depths, with the deepest being 107 ft.
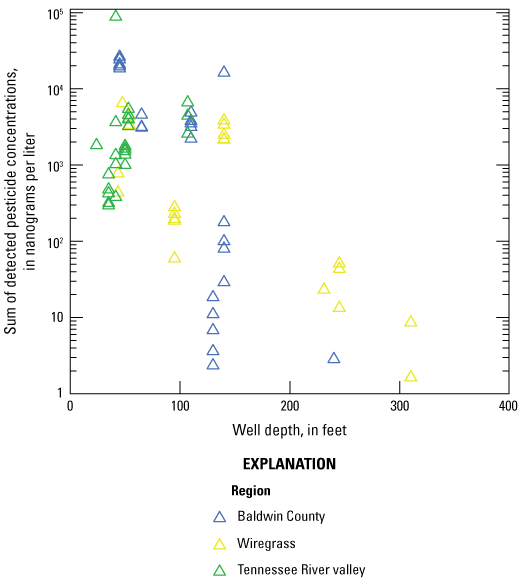
Sum of total detected pesticide concentrations in single groundwater samples and well depth for selected sites in Alabama in 2014–20.
Pesticide Environmental Sampling Results, 2009–20
From the beginning of this project in 2009 through the summer of 2020, a total of 178 environmental samples were collected from 24 shallow groundwater sites in Alabama and evaluated for concentrations of 289 distinct pesticide compounds (Gill, 2023). Only a few of the analyzed pesticide compounds were detected frequently throughout the project timeframe. More than half (178) of the analyzed compounds were not detected in any of the environmental samples, and an additional 38 compounds were only detected once. Five compounds, metolachlor SA, atrazine, CIAT, metolachlor, and OIAT, were detected in more than 50 percent of the samples during the project timeframe (Gill, 2023).
As described in the methods, samples collected before 2014 were analyzed for about 145 pesticide compounds, and samples collected from 2014 through 2020 were analyzed for more than 200 pesticide and pesticide degradate compounds. Detections using the earlier methods were reported as concentrations in micrograms per liter, whereas under the newer method, they were reported as concentrations in nanograms per liter. A USGS comparative study of field methods attempted to link datasets produced by both of the methods and identified problems with censored data resulting from the great difference in method reporting limits (Martin and others, 2017). Despite these concerns, datasets from the entire period of record for this study were converted to common units of nanograms per liter and results of the two methods combined for the 230 pesticide compounds analyzed by both methods (Gill, 2023). The combined datasets were used to make a preliminary assessment of changes in pesticide compound detection frequencies and concentrations through time.
Twenty-seven pesticide or degradate compounds were detected in more than 15 percent of samples during the 2009–20 time period (fig. 18). There were only slight changes in the ranks of the most frequently detected compounds when the entire study period was compared to the 2014–20 period, suggesting that the occurrence of these compounds is consistent over time. Metolachlor, atrazine, and their degradates were among the most frequently detected compounds and were detected across all regions. Norflurazon, fluometuron, and their degradates were also commonly detected, but most of the detections occurred in the Tennessee River valley region, where estimated use was greater. The fungicide degradate 1H-1,2,4-triazole was also commonly detected throughout the project, with detections observed across all regions.
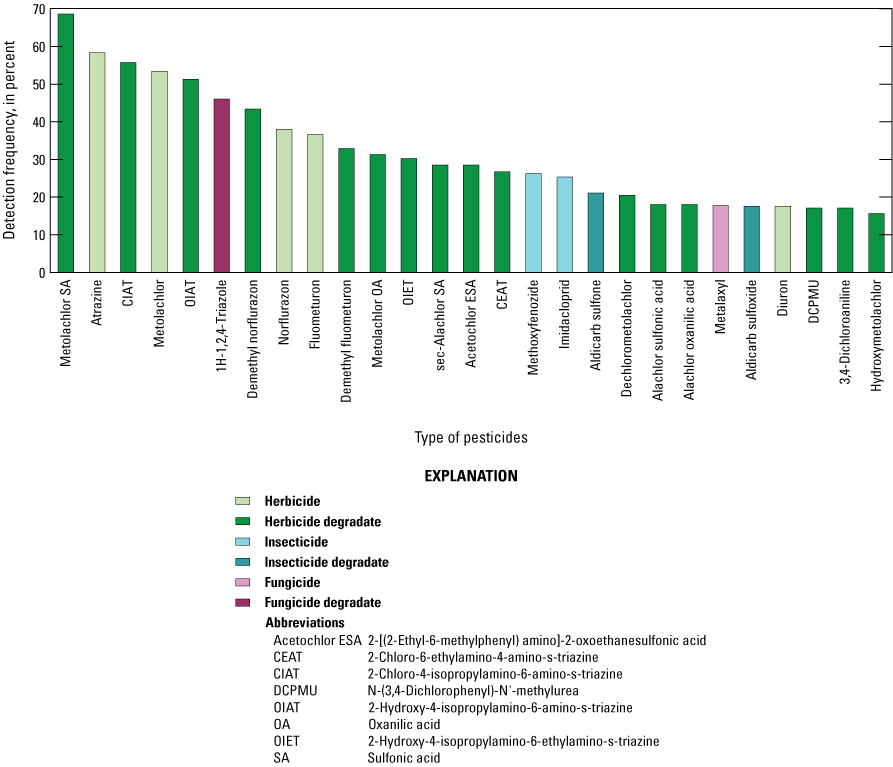
Detection frequency and type of pesticides detected in 15 percent or more of groundwater samples collected from selected sites in Alabama during 2009–20.
Although most compounds were detected at similar frequencies, a few compounds were detected in more than 15 percent of samples in only 1 of the 2 periods (figs. 13 and 18). Five compounds were detected in more than 15 percent of samples during 2009–13 but not during 2014–20. Analyses of 3 of these 5 compounds (sec-alachlor sulfonic acid, acetochlor ESA, and 3,4-dichloroaniline) were not continued through the later part of the study period. Aldicarb sulfoxide and diuron were analyzed throughout the project but were detected less frequently in samples collected during 2014–20. Two herbicides, tebuthiuron and bentazon, were detected in more than 15 percent of samples collected during 2014–20 but not during 2009–20. Tebuthiuron was detected in wells in all regions, but all detections in Baldwin County were from well BC-3. Bentazon was also detected in all regions, but most detections were in Baldwin County and the Wiregrass region.
Concentration data for compounds having a consistent record of sample detections throughout the project were examined for any apparent temporal patterns in the magnitude of concentrations. For each pesticide compound, the number of years analyzed, number of years with detections, and number of samples with detections were determined overall, by region, and by individual well. Only four compounds were detected during the first and second 5-year periods of the project, in more than 20 percent of sampled years, and in more than 40 percent of analyzed samples. For atrazine, CIAT (deethylatrazine), metolachlor, and metolachlor SA, detections and changes in detections through time were examined in detail. Compound concentrations in each well were plotted (figs. 19–22), and annual concentrations were plotted for TNV-5 (fig. 23), a well with frequent detections of all four compounds. Metolachlor SA was only analyzed during 2012 and 2014–20. Inclusion of the four detections from 2012 did not alter conclusions drawn from the discussion of 2014–20 results; however, metolachlor SA concentrations in individual wells also were plotted for comparison to parent compound concentrations.
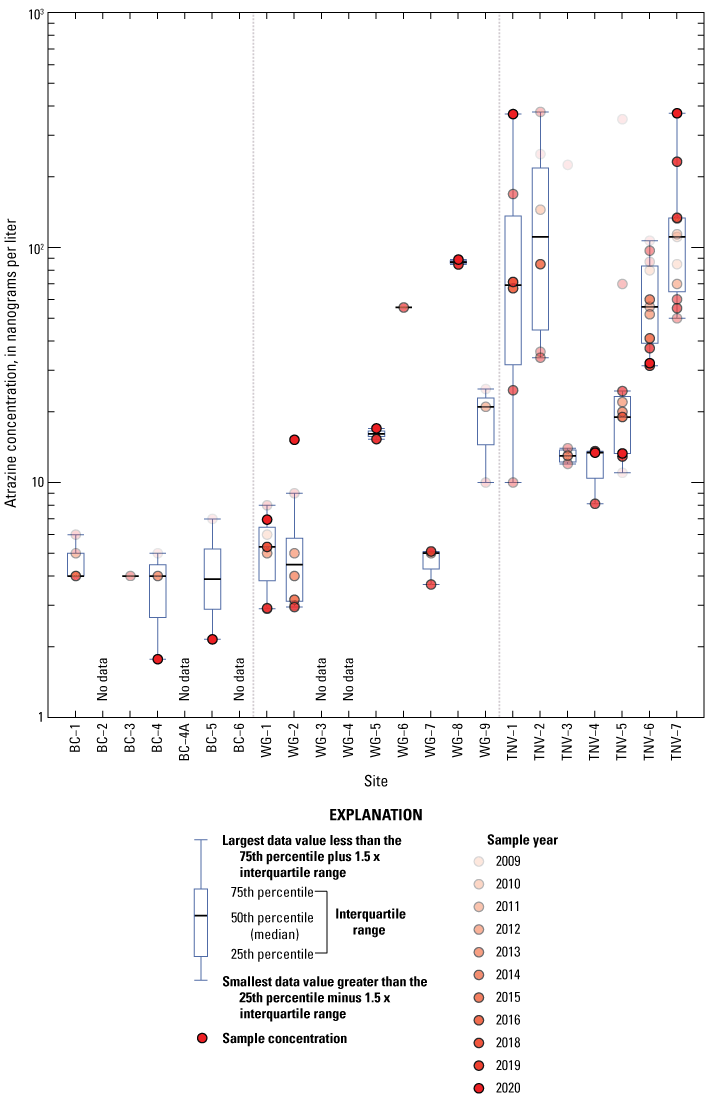
Boxplots and individual sample concentrations of atrazine in groundwater by well for samples collected in Alabama for 2009–20. BC, Baldwin County; WG, Wiregrass; TNV, Tennessee River valley.
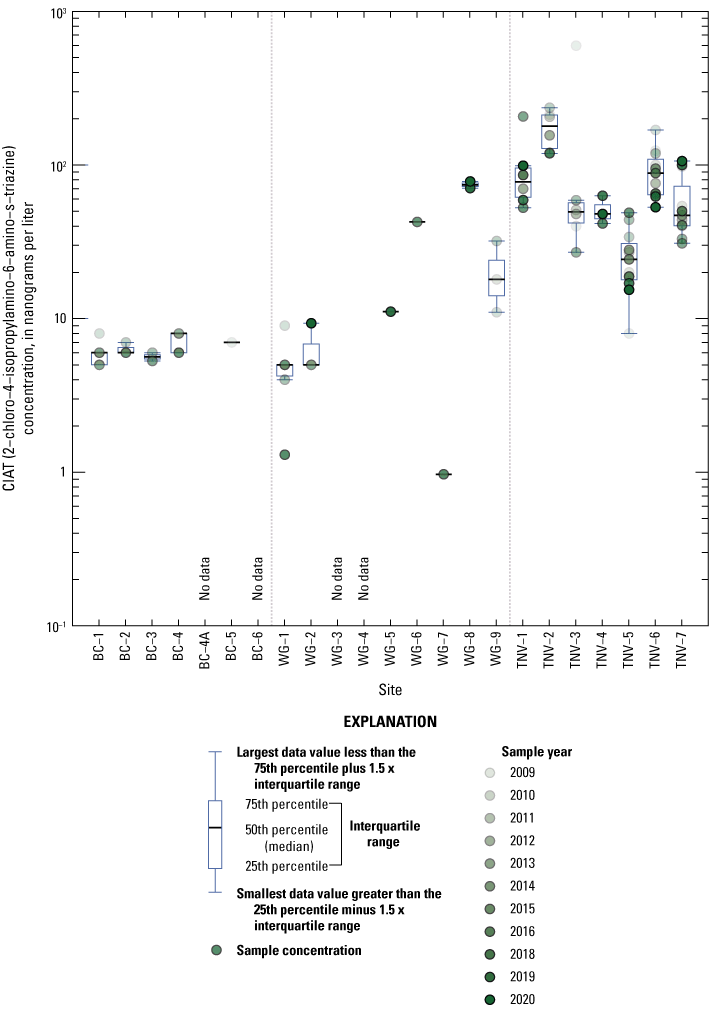
Boxplots and individual sample concentrations of 2-chloro-4-isopropylamino-6-amino-s-triazine (CIAT) in groundwater by well for samples collected in Alabama for 2009–20. BC, Baldwin County; WG, Wiregrass; TNV, Tennessee River valley.
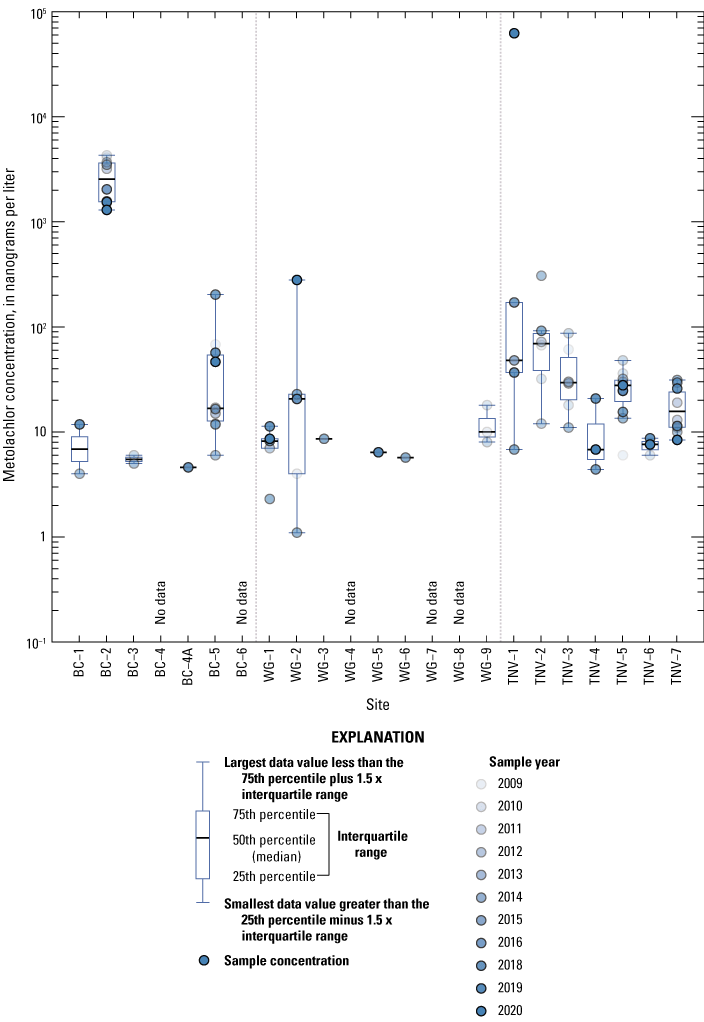
Boxplots and individual sample concentrations of metolachlor in groundwater by well for samples collected in Alabama for 2009–20. BC, Baldwin County; WG, Wiregrass; TNV, Tennessee River valley.
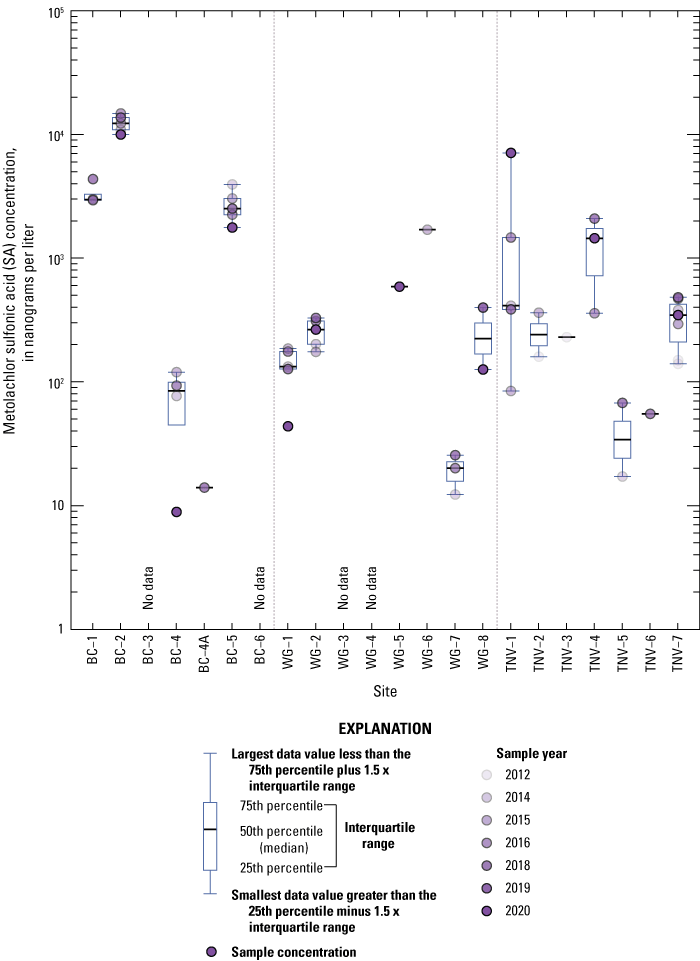
Boxplots and individual sample concentrations of metolachlor sulfonic acid (SA) in groundwater by well for samples collected in Alabama in 2012 and 2014–20. BC, Baldwin County; WG, Wiregrass; TNV, Tennessee River valley.
Atrazine was frequently detected in all three regions but occurred at lower concentrations in the Baldwin County wells than in the other two regions. The greatest concentrations and variations in concentration over time occurred in wells in the Tennessee River valley region (fig. 19). The greater prevalence of cotton, corn, and soybean crops in the Tennessee River valley region (fig. 4) relative to Baldwin County and the related use of atrazine are likely explanatory factors for the differences between concentrations in Baldwin County and the Tennessee River valley region.
The variability of concentrations and occurrence of CIAT, a degradate of atrazine, was similar to that of the parent compound (fig. 20). Median concentrations of CIAT, like atrazine, were consistently lower in the Baldwin County sites than in the Tennessee River valley region sites. Concentrations in the Tennessee River valley region wells also were generally more variable from year to year than in wells in the other regions. Concentrations of atrazine and CIAT varied widely among the Wiregrass region wells, and median concentrations were greatest in WG-6 and WG-8, two shallow monitoring wells installed for this project.
Metolachlor was one of the most commonly used pesticides in the study area and was commonly detected at the study sites (fig. 21). Metolachlor concentrations were most variable in the Tennessee River valley region sites, but a similar range in concentration was observed in all the regions. One well, BC-2, had a median metolachlor concentration of 2,620 ng/L, two orders of magnitude greater than all other median values. Greater metolachlor concentrations at BC-2 may be related to the well’s shallow depth and the location beside a wetland area that is a local topographic low. Metolachlor concentrations at this site decreased slightly through time but still exceeded most other detections. Median concentrations of metolachlor at the other sites ranged from 4.6 to 69.5 ng/L.
As noted previously, metolachlor SA is a persistent and commonly detected degradate of metolachlor. Metolachlor SA was analyzed in 2012 and 2014–20 and was generally present more frequently and at greater concentrations than the parent compound (fig. 22). Metolachlor SA was the most commonly detected compound during 2014–20. Only a few additional samples were collected in 2012. Median concentrations varied widely within all regions. The greatest median concentration occurred at BC-2, which, as noted above, also had the greatest median concentration of the parent compound metolachlor. Concentrations of metolachlor SA were not strongly related to well depth and did not appear to increase or decrease consistently through time.
Atrazine, CIAT, and metolachlor were frequently detected in samples collected at well TNV-5 during 2009–20 (fig. 23). Detected concentrations of these three compounds were plotted by year. There were relatively small variations between years, but most changes in concentrations were within a range of about 20–30 ng/L. Atrazine was the most variable, having a difference of almost 350 ng/L between spring and summer samples collected in 2009. No distinct pattern of decreasing or increasing concentrations of these compounds was observed during the study period.
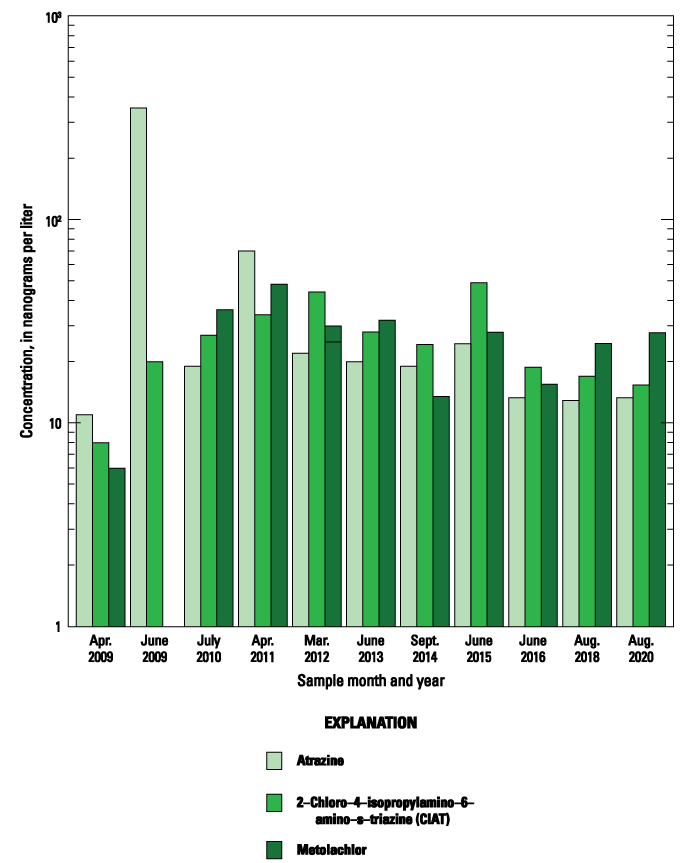
Concentrations of atrazine, 2-chloro-4-isopropylamino-6-amino-s-triazine (CIAT), and metolachlor in groundwater at well TNV-5 in Alabama, 2009–20.
Pesticide and Degradate Detections
The importance of analyzing for pesticide degradates was noted by Scribner and others (2004) in their survey of parent and degradate pesticide occurrence and by Meyer and Scribner (2009) in their review of water-quality techniques and surveys used to evaluate the environmental transport and fate of pesticides. Some transformation products of pesticides can have differing chemical characteristics that make them more persistent or more biologically harmful in the environment than the parent pesticide compound (Anagnostopoulou and others, 2022). Laboratory schedule 2437 included analyses for 119 degradates of the most commonly used pesticides. There were 42 parent pesticides with at least one degradate compound that was also evaluated, and 4 degradate compounds analyzed without an analyzed parent compound. During 2014–20, there were 22 parent pesticides detected in study wells, and degradate compounds were detected for 18 of these parent pesticides. In addition, eight degradates were detected in samples without detections of their parent compound.
Some pesticide degradate compounds, such as metolachlor SA, were detected more frequently and at greater concentrations than the parent compounds in this study. The most frequently detected degradates were metolachlor SA, OIAT, 1H-1,2,4-triazole, and demethyl norflurazon. For these compounds, degradates were detected 120, 102, 4,200, and 135 percent as frequently, respectively, as the parent compounds. Maximum detected concentrations of 14 degradates were greater than maximum concentrations of the parent compounds. Continued monitoring of these commonly detected degradate compounds will be helpful to evaluate the long-term effects of agricultural pesticide use on groundwater resources.
Summary and Conclusions
Since 2009, the U.S. Geological Survey and the Alabama Department of Agriculture and Industries have partnered to monitor pesticide occurrence in groundwater near areas of agricultural land use in Alabama. Groundwater samples have been collected from a small network of wells located in three regions of the State with concentrated areas of agricultural land use: Baldwin County, the Wiregrass region, and the Tennessee River valley region. Samples collected during 2014–20 were examined to identify the compounds most frequently detected and those detected in the greatest concentrations. Results of the first 5 years of sampling were summarized in a previous report and were combined with the more recent results in this report to evaluate apparent patterns of pesticide occurrence through time. In each year of sample collection, 15 wells were sampled, but because of changes in sites, 23 wells were sampled in the three regions during the course of the project.
Groundwater samples collected from 22 wells during 2014–20 were analyzed for concentrations of 230 pesticide and pesticide degradate compounds. Ninety-two compounds were detected at least once in environmental samples, but 37 of those compounds were detected in only one sample. Two additional pesticide compounds were not detected in environmental samples but were detected in one replicate sample each. Metolachlor sulfonic acid (SA), a degradate of the herbicide metolachlor, was the most commonly detected compound, occurring in about 70 percent of samples. Metolachlor, atrazine, and 2-chloro-4-isopropylamino-6-amino-s-triazine (CIAT), an atrazine degradate, were also detected in more than 50 percent of samples. Metolachlor and metolachlor degradates were some of the compounds detected frequently at the greatest concentrations. The maximum detected concentration of a pesticide was 62,500 nanograms per liter (ng/L) of metolachlor. Metolachlor SA was detected at the next greatest concentration, 14,800 ng/L, and was also the most frequently detected compound among the 50 greatest concentrations.
There were differences among the study regions in the most frequent detections and greatest concentrations of pesticide compounds, most likely related to regional differences in factors such as prevalent crop types, types and amounts of pesticides used, and well characteristics. In Baldwin County, the most frequently detected compounds were metolachlor, metolachlor degradates, 2-hydroxy-4-isopropylamino-6-amino-s-triazine (a degradate of atrazine), and 1H-1,2,4-triazole, and the greatest concentrations were metolachlor and its degradates. In the Wiregrass region, the most frequently detected compounds were metolachlor SA, atrazine, 1H-1,2,4-triazole, 2-hydroxy-4-isopropylamino-6-amino-s-triazine, and metolachlor, and the single greatest detected concentration was 1H-1,2,4-triazole. In the Tennessee River valley region, the most frequently detected compounds were atrazine, CIAT (an atrazine degradate), demethyl norflurazon (a degradate of norflurazon), metolachlor, and imidacloprid, and the greatest detected concentrations were of metolachlor, metolachlor degradates, norflurazon, fluometuron, and their degradates.
All detected concentrations of pesticide compounds were below their U.S. Environmental Protection Agency maximum contaminant levels and human-health benchmarks, as well as U.S. Geological Survey health-based screening levels (HBSLs), and concentrations do not currently warrant any human health concerns. Detected concentrations of a few compounds were more than 10 percent of applicable benchmarks. The single detection of fentin was 18.3 ng/L, approximately 92 percent of the lower limit of the HBSL cancer range (20 ng/L). The maximum concentration of fluometuron was 645 ng/L, approximately 32 percent of the lower limit of the HBSL cancer range (2,000 ng/L). The maximum concentration of atrazine was 373 ng/L, or 12.4 percent of the maximum contaminant level (3,000 ng/L). The maximum detected concentrations of aldicarb sulfone (947 ng/L) and metolachlor (62,500 ng/L) were more than 10 percent of their noncancer HBSLs, 6,000 and 600,000 ng/L, respectively.
Results produced using multiple laboratory methods were combined to provide a continuous time series of data from the beginning of the project in 2009 through sampling in 2020. More than half of the 289 pesticide compounds analyzed during this period were not detected in any samples. Only four compounds were detected at great enough frequency throughout the 10 sampling years to evaluate patterns of change through time. Metolachlor and its degradate, metolachlor SA, were frequently detected in all regions. Concentrations detected in samples from representative wells from each region suggested that there was not a pattern to the changes in concentration through time. Atrazine and its degradate, CIAT, were detected in wells from all regions, but the variability and magnitude of concentrations were greatest in the Tennessee River valley region. There was no clear pattern of change in concentrations through time in these wells.
Pesticide degradates were commonly detected and many detected degradates were present at greater concentrations than the parent compounds. Many degradate compounds have similar or greater detrimental effects to human and environmental health, and some may be more likely to persist in groundwater systems. Continued monitoring of degradate compounds will be an important part of the assessment of effects of pesticide use on groundwater quality.
Selected water sampling results were evaluated with respect to well depths. The number of detected pesticide compounds and the sum of detected pesticide concentrations were determined for each sample. Field analyses of nitrate concentrations were made to compare water-quality to the U.S. Environmental Protection Agency maximum contaminant level for nitrate. Overall, well depths appeared to be inversely related to detections of pesticide compounds and nitrate concentrations. Increasing well depth may offer some protection from surface application of pesticides and fertilizers.
Acknowledgments
The U.S. Geological Survey would like to gratefully acknowledge the efforts of employees of the Alabama Cooperative Extension Service to locate potential sites and the generosity of landowners who allowed us to sample their wells. This project would not be possible without their cooperation.
References Cited
Alabama Cooperative Extension System, 2023, Cotton—Insect, disease, nematode, and weed recommendations for 2021: Alabama Cooperative Extension System guide IPM–0415, accessed May 7, 2024, at https://www.aces.edu/wp-content/uploads/2019/10/IPM-0415_Cotton2023_012523L-G.pdf.
Anagnostopoulou, K., Nannou, C., Evgenidou, E., and Lambropoulou, D., 2022, Overarching issues on relevant pesticide transformation products in the aquatic environment—A review: Science of the Total Environment, v. 815, article 152863, accessed October 31, 2023, at https://doi.org/10.1016/j.scitotenv.2021.152863.
Arias-Estévez, M., López-Periago, E., Martínez-Carballo, E., Simal-Gándara, J., Mejuto, J., and García-Río, L., 2008, The mobility and degradation of pesticides in soils and the pollution of groundwater resources: Agriculture, Ecosystems & Environment, v. 123, no. 4, p. 247–260, accessed February 22, 2022, at https://doi.org/10.1016/j.agee.2007.07.011.
Auburn University Department of Agricultural Economics and Rural Sociology, 2013, Economic impacts of Alabama’s agricultural, forestry, and related industries: Alabama Cooperative Extension System web page, accessed May 7, 2024, at https://forestry.alabama.gov/Pages/Management/Forms/Economic_Impact.pdf.
Baker, N.T., and Stone, W.W., 2015, Estimated annual agricultural pesticide use for counties of the conterminous United States, 2008–12: U.S. Geological Survey Data Series 907, 9 p., accessed on November 9, 2021, at https://doi.org/10.3133/ds907.
Benbrook, C.M., 2016, Trends in glyphosate herbicide use in the United States and globally: Environmental Sciences Europe, v. 28, no. 3, 15 p., accessed on November 25, 2022, at https://doi.org/10.1186/s12302-016-0070-0.
Fishman, M.J., ed., 1993, Nitrogen, nitrite, colorimetry, diazotization, automated-segmented flow [Method I-2540-90] in Methods of analysis by the U.S. Geological Survey National Water Quality Laboratory—Determination of inorganic and organic constituents in water and fluvial sediments: U.S. Geological Survey Open-File Report 93–125, 217 p.
Furlong, E.T., Anderson, B.D., Werner, S.L., Soliven, P.P., Coffey, L.J., and Burkhardt, M.R., 2001, Methods of analysis by the U.S. Geological Survey National Water Quality Laboratory—Determination of pesticides in water by graphitized carbon-based solid-phase extraction and high-performance liquid chromatography/mass spectrometry: U.S. Geological Survey Water-Resources Investigations Report 2001–4134, 73 p., accessed May 5, 2021, at https://doi.org/10.3133/wri014134.
Gill, A.C., 2023, Pesticide concentration and related water-quality data for selected groundwater sites near areas of agricultural land use in Alabama, 2009–2020: U.S. Geological Survey data release, https://doi.org/10.5066/P96OOHNZ.
Gilliom, R.J., Barbash, J.E., Crawford, C.G., Hamilton, P.A., Martin, J.D., Nakagaki, N., Nowell, L.H., Scott, J.C., Stackelberg, P.E., Thelin, G.P., and Wolock, D.M., 2006, The quality of our Nation's waters—Pesticides in the Nation's streams and ground water, 1992–2001: U.S. Geological Survey Circular 1291, 184 p., accessed November 9, 2021, at https://doi.org/10.3133/cir1291.
Greene, J.K., 2017, Soybean insect control, in South Carolina pest management handbook for field crops—2017: Clemson University, Cooperative Extension Service, 323 p., accessed November 27, 2022, at http://dc.statelibrary.sc.gov/handle/10827/24248.
Hach, 2019, Nitrate—HR cadmium reduction method 8039—Powder pillows or AccuVac Ampuls: Loveland, Colo., Hach Company, DOC316.53.01066, 8 p., accessed February 25, 2022, at https://www.hach.com/resources/water-analysis-handbook?origin=dropdown&c1=support&c2=information-center&c3=water-analysis-handbook-wah&clickedon=water -analysis-handbook-wah.
Hanson, W., Strid, A., Gervais, J., Cross, A., and Jenkins, J., 2020 Atrazine fact sheet: National Pesticide Information Center, Oregon State University Extension Services web page, accessed May 7, 2024, at http://npic.orst.edu/factsheets/atrazine.html.
Henderson, A.M., Gervais, J.A., Luukinen, B., Buhl, K., Stone, D., Cross, A., and Jenkins, J., 2010, Glyphosate general fact sheet: National Pesticide Information Center, Oregon State University Extension Services web page, accessed May 7, 2024, at http://npic.orst.edu/factsheets/glyphogen.html.
Jervais, G., Luukinen, B., Buhl, K., and Stone, D., 2008, 2,4-D General fact sheet: National Pesticide Information Center, Oregon State University Extension Services web page, accessed May 7, 2024, at http://npic.orst.edu/factsheets/24Dgen.html.
Kim, S., Chen, J., Cheng, T., Gindulyte, A., He, J., He, S., Li, Q., Shoemaker, B.A., Thiessen, P., Yu, B., Zaslavsky, L., Zhang, J., and Bolton, E.E., 2019, PubChem in 2021—New data content and improved web interfaces: Nucleic Acids Research, v. 49, p. D1, D1388–D1395, accessed May 8, 2024, at https://doi.org/10.1093/nar/gkaa971.
Kingsbury, J.A., 2003, Shallow ground-water quality in agricultural areas of northern Alabama and middle Tennessee, 2000–2001: U.S. Geological Survey Water-Resources Investigations Report 2003–4181, 38 p., accessed November 3, 2020, at https://doi.org/10.3133/wri034181.
Martin, J.D., Norman, J.E., Sandstrom, M.W., and Rose, C.E., 2017, A field study of selected U.S. Geological Survey analytical methods for measuring pesticides in filtered stream water, June–September 2012: U.S. Geological Survey Scientific Investigations Report 2017–5049, 106 p., accessed July 22, 2021, at https://doi.org/10.3133/sir20175049.
Meyer, M.T., Loftin, K.A., Lee, E.A., Hinshaw, G.H., Dietze, J.E., and Scribner, E.A., 2009, Determination of glyphosate, its degradation product aminomethylphosphonic acid, and glufosinate, in water by isotope dilution and online solid-phase extraction and liquid chromatography/tandem mass spectrometry: U.S. Geological Survey Techniques and Methods, book 5, chap. A10, 32 p., accessed May 7, 2024, at https://pubs.usgs.gov/publication/tm5A10.
Meyer, M.T., and Scribner, E.A., 2009, The evolution of analytical technology and its impact on water-quality studies for selected herbicides and their degradation products in water, chap. 13 of Ahuja, S., ed., Handbook of water purity and quality: Academic Press, p. 289–313, accessed November 16, 2022, at https://doi.org/10.1016/B978-0-12-374192-9.00013-3.
Miller, J.A., 1990, Ground water atlas of the United States—Segment 6, Alabama, Florida, Georgia, South Carolina: U.S. Geological Survey Hydrologic Atlas 730–G, 28 p., accessed May 7, 2024, at https://doi.org/10.3133/ha730G.
Minnesota Department of Agriculture, 2022, Acetochlor—General information: Minnesota Department of Agriculture web page, accessed November 16, 2022, at https://www.mda.state.mn.us/acetochlor-general-information.
Mitchell, C.C., Jr., 2017, Soils of Alabama: Alabama Cooperative Extension System web page, accessed May 7, 2024, at https://www.aces.edu/wp-content/uploads/2018/12/ANR-0340.REV_.2.pdf.
Moreland, R.S., 2011, Pesticide occurrence in groundwater in areas of high-density row crop production in Alabama, 2009: U.S. Geological Survey Open-File Report 2011–1102, 17 p., accessed January 13, 2020, at https://doi.org/10.3133/ofr20111102.
Mueller, D.K., Schertz, T.L., Martin, J.D., and Sandstrom, M.W., 2015, Design, analysis, and interpretation of field quality-control data for water-sampling projects: U.S. Geological Survey Techniques and Methods, book 4, chap. C4, 54 p., accessed May 7, 2024, at https://doi.org/10.3133/tm4C4.
National Centers for Environmental Information, 2021a, U.S. monthly climate normals (1991–2020) for station USC00010583_Bay Minette: National Oceanic and Atmospheric Administration, National Centers for Environmental Information web page, accessed September 15, 2021, at https://www.ncei.noaa.gov/access/search/data-search/normals-monthly-1991-2020.
National Centers for Environmental Information, 2021b, U.S. monthly climate normals (1991–2020) for station USC00010655_BelleMina: National Oceanic and Atmospheric Administration, National Centers for Environmental Information web page, accessed September 15, 2021, at https://www.ncei.noaa.gov/access/search/data-search/normals-monthly-1991-2020.
National Centers for Environmental Information, 2021c, U.S. monthly climate normals (1991–2020) for station USC00013761_Headland: National Oceanic and Atmospheric Administration, National Centers for Environmental Information web page, accessed September 15, 2021, at https://www.ncei.noaa.gov/access/search/data-search/normals-monthly-1991-2020.
Norman, J.E., Toccalino, P.L., and Morman, S.A., 2018, Health-based screening levels for evaluating water-quality data (2d ed.): U.S. Geological Survey web page, accessed November 30, 2021, at https://doi.org/10.5066/F71C1TWP.
Olliff, M.T., 2018, Wiregrass Region: Alabama Humanities Alliance, Encyclopedia of Alabama website, accessed November 30, 2021, at https://encyclopediaofalabama.org/article/h-4048.
Robinson, J.L., Moreland, R.S., and Clark, A.E., 1996, Ground-water resources data for Baldwin County, Alabama: U.S. Geological Survey Open-File Report 96–487, 68 p. [Also available at https://doi.org/10.3133/ofr96487.]
Rose, C.E., Coupe, R.H., Capel, P.D., and Webb, R.M., 2018, Holistic assessment of occurrence and fate of metolachlor within environmental compartments of agricultural watersheds: Science of the Total Environment, v. 612, p. 708–719, accessed October 4, 2023, at https://doi.org/10.1016/j.scitotenv.2017.08.154.
Rounds, S.A., 2012, Alkalinity and acid neutralizing capacity (ver. 4.0, September 2012): U.S. Geological Survey Techniques of Water-Resources Investigations, book 9, chap. A6.6, 53 p., accessed May 7, 2024, at https://doi.org/10.3133/twri09A6.6.
Sandstrom, M.W., Kanagy, L.K., Anderson, C.A., and Kanagy, C.J., 2015, Determination of pesticides and pesticide degradates in filtered water by direct aqueous-injection liquid chromatography-tandem mass spectrometry: U.S. Geological Survey Techniques and Methods, book 5, chap. B11, 54 p., accessed July 22, 2021, at https://doi.org/10.3133/tm5B11.
Sandstrom, M.W., Stroppel, M.E., Foreman, W.T., and Schroeder, M.P., 2001, Methods of analysis by the U.S. Geological Survey National Water Quality Laboratory—Determination of moderate-use pesticides and selected degradates in water by C-18 solid-phase extraction and gas chromatography/mass spectrometry: U.S. Geological Survey Water-Resources Investigations Report 2001–4098, 70 p., accessed July 22, 2021, at https://doi.org/10.3133/wri20014098.
Scott, J.C., and Cobb, R.H., 1988, Geohydrology and susceptibility of major aquifers to surface contamination in Alabama—Area 12: U.S. Geological Survey Water-Resources Investigations Report 88–4078, 51 p., accessed October 3, 2023, at https://doi.org/10.3133/wri884078.
Scott, J.C., Avrett, J.R., and McCain, J.F., 1967, Water availability in Houston County, Alabama: Geological Survey of Alabama Special Map 59, accessed October 3, 2023, at https://alabamamaps.ua.edu/historicalmaps/counties/houston/houston.html.
Stone, W.W., 2013, Estimated annual agricultural pesticide use for counties of the conterminous United States, 1992–2009: U.S. Geological Survey Data Series 752, 1-p. pamphlet, 14 tables, accessed November 9, 2021, at https://doi.org/10.3133/ds752.
Thelin, G.P., and Stone, W.W., 2013, Estimation of annual agricultural pesticide use for counties of the conterminous United States, 1992–2009: U.S. Geological Survey Scientific Investigations Report 2013–5009, 54 p., accessed November 9, 2021, at https://doi.org/10.3133/sir20135009.
Tudi, M., Ruan, H.D., Wang, L., Lyu, J., Sadler, R., Connell, D., Chu, C., and Phung, D.T., 2021, Agriculture development, pesticide application and its impact on the environment: International Journal of Environmental Research and Public Health, v. 18, no. 3, article 1112, 23 p., accessed September 16, 2021, at https://doi.org/10.3390/ijerph18031112.
U.S. Department of Agriculture [USDA] National Agricultural Statistics Service, 2019a, 2017 Census of agriculture: U.S. Department of Agriculture National Agricultural Statistics Service web page, accessed September 23, 2021, at https://www.nass.usda.gov/AgCensus.
U.S. Department of Agriculture [USDA] National Agricultural Statistics Service, 2019b, 2018 Agricultural chemical use survey—Peanuts: NASS Highlights no. 2019–2, 2 p., accessed September 23, 2021, at https://www.nass.usda.gov/Surveys/Guide_to_NASS_Surveys/Chemical_Use/2018_Peanuts_Soybeans_Corn/ChemUseHighlights_Peanuts_2018.pdf.
U.S. Department of Agriculture [USDA] National Agricultural Statistics Service, 2019c, 2017 Census of agriculture State profile—Alabama: U.S. Department of Agriculture National Agricultural Statistics Service web page, accessed September 23, 2021, at https://www.nass.usda.gov/Publications/AgCensus/2017/Online_Resources/County_Profiles/Alabama/cp99001.pdf.
U.S. Department of Agriculture [USDA] National Agricultural Statistics Service, 2021, Cropscape—Cropland data layer, 2018: U.S. Department of Agriculture, Ag Data Commons database, accessed October 7, 2021, at https://nassgeodata.gmu.edu/CropScape/.
U.S. Environmental Protection Agency, 2009, National primary drinking water regulations: U.S. Environmental Protection Agency, EPA 816F–09–004, accessed February 24, 2022, at https://www.epa.gov/ground-water-and-drinking-water/national-primary-drinking-water-regulations.
U.S. Environmental Protection Agency, 1996, Reregistration eligibility decision facts—Norflurazon: U.S. Environmental Protection Agency, EPA–738–F–96–012, 14 p., accessed November 27, 2022, at https://www3.epa.gov/pesticides/chem_search/reg_actions/reregistration/fs_PC-105801_1-Jul-96.pdf.
U.S. Environmental Protection Agency, 1997, Reregistration eligibility decision facts—Pendimethalin: U.S. Environmental Protection Agency, EPA–738–F–97–007, 9 p., accessed October 4, 2023, at https://www3.epa.gov/pesticides/chem_search/reg_actions/reregistration/fs_PC-108501_1-Jun-97.pdf.
U.S. Geological Survey, 2018, National field manual for the collection of water-quality data, section A of Handbooks for water-resources investigations: U.S. Geological Survey Techniques and Methods, book 9, 10 chap. (A0–A8, A10), accessed on May 7, 2024, at https://www.usgs.gov/mission-areas/water-resources/science/national-field-manual-collection-water-quality-data-nfm.
U.S. Geological Survey, 2021, U.S. Geological Survey 21st-century science strategy 2020–2030: U.S. Geological Survey Circular 1476, 20 p., accessed April 11, 2023, at https://doi.org/10.3133/cir1476.
U.S. Geological Survey, 2023, USGS water data for the Nation: U.S. Geological Survey National Water Information System database, accessed April 21, 2023, at https://doi.org/10.5066/F7P55KJN.
Ward, M.H., Jones, R.R., Brender, J.D., de Kok, T.M., Weyer, P.J., Nolan, B.T., Villanueva, C.M., and van Breda, S.G., 2018, Drinking water nitrate and human health—An updated review: International Journal of Environmental Research and Public Health, v. 15, no. 7, article 1557, 31 p., accessed May 7, 2024, at https://doi.org/10.3390/ijerph15071557.
Wieben, C.M., 2019, Estimated annual agricultural pesticide use for counties of the conterminous United States, 2013–17 (ver. 2.0, May 2020): U.S. Geological Survey data release, accessed November 9, 2021, at https://doi.org/10.5066/P9F2SRYH.
Welch, H.L., 2015, Occurrence of pesticides in groundwater underlying areas of high-density row-crop production in Alabama, 2009–2013: U.S. Geological Survey Scientific Investigations Report 2015–5014, 35 p. [Also available at https://doi.org/10.3133/sir20155014.]
Zaugg, S.D., Sandstrom, M.W., Smith, S.G., and Fehlberg, K.M., 1995, Methods of analysis by the U.S. Geological Survey National Water Quality Laboratory—Determination of pesticides in water by C-18 solid-phase extraction and capillary-column gas chromatography/mass spectrometry with selected-ion monitoring: U.S. Geological Survey Open-File Report 95–181, 49 p., accessed July 22, 2021, at https://pubs.usgs.gov/publication/ofr95181.
Conversion Factors
Temperature in degrees Celsius (°C) may be converted to degrees Fahrenheit (°F) as follows: °F = (1.8 × °C) + 32.
Temperature in degrees Fahrenheit (°F) may be converted to degrees Celsius (°C) as follows: °C = (°F – 32) / 1.8.
Supplemental Information
Specific conductance is given in microsiemens per centimeter at 25 degrees Celsius (µS/cm at 25 °C).
Concentrations of chemical constituents in water are given in milligrams per liter (mg/L), micrograms per liter (µg/L), or nanograms per liter (ng/L).
Abbreviations
ADAI
Alabama Department of Agriculture and Industries
AMPA
aminomethylphosphonic acid
CDL
cropland data layer
CIAT
2-Chloro-4-isopropylamino-6-amino-s-triazine
HBSLs
health-based screening levels
HHBP
human-health benchmarks
MCL
maximum contaminant level
MRL
minimum reporting level
NAWQA
National Water Quality Assessment Program
ntu
nephelometric turbidity units
NWIS
National Water Information System
NWQL
National Water Quality Laboratory
OIAT
2-Hydroxy-4-isopropylamino-6-amino-s-triazine
R2
coefficient of determination
SA
sulfonic acid
USDA
U.S. Department of Agriculture
USGS
U.S. Geological Survey
For more information about this publication, contact
Director, Lower Mississippi-Gulf Water Science Center
U.S. Geological Survey
640 Grassmere Park, Suite 100
Nashville, TN 37211
For additional information, visit
https://www.usgs.gov/centers/lmg-water/
Publishing support provided by
Lafayette Publishing Service Center
Disclaimers
Any use of trade, firm, or product names is for descriptive purposes only and does not imply endorsement by the U.S. Government.
Although this information product, for the most part, is in the public domain, it also may contain copyrighted materials as noted in the text. Permission to reproduce copyrighted items must be secured from the copyright owner.
Suggested Citation
Gill, A.C., 2024, Pesticide occurrence in shallow groundwater in three regions of agricultural land use: Baldwin County, the Wiregrass region, and the Tennessee River valley region of Alabama, 2009–20: U.S. Geological Survey Scientific Investigations Report 2024–5069, 50 p., https://doi.org/10.3133/sir20245069.
ISSN: 2328-0328 (online)
Study Area
| Publication type | Report |
|---|---|
| Publication Subtype | USGS Numbered Series |
| Title | Pesticide occurrence in shallow groundwater in three regions of agricultural land use: Baldwin County, the Wiregrass region, and the Tennessee River valley region of Alabama, 2009–20 |
| Series title | Scientific Investigations Report |
| Series number | 2024-5069 |
| DOI | 10.3133/sir20245069 |
| Publication Date | October 04, 2024 |
| Year Published | 2024 |
| Language | English |
| Publisher | U.S. Geological Survey |
| Publisher location | Reston, VA |
| Contributing office(s) | Lower Mississippi-Gulf Water Science Center |
| Description | Report: viii, 50 p.; 2 Data Releases |
| Country | United States |
| State | Alabama |
| Online Only (Y/N) | Y |


