

Substrate Enhancement Pilot Project—Monitoring Summary and Evaluation, Kootenai River, Idaho, 2012–22
Links
- Document: Report (12 MB pdf) , HTML , XML
- Data Release: USGS data release - Kootenai river substrate enhancement pilot projects near Bonners Ferry, ID (ver. 3.0, January 2023)
- Version History: Version History
- NGMDB Index Page: National Geologic Map Database Index Page (html)
- Download citation as: RIS | Dublin Core
Acknowledgments
The U.S. Geological Survey would like to thank the Kootenai Tribe of Idaho for assisting with data collection, data analysis, and support in developing this report. Their work and dedication continue to be foundational to the success of all restoration efforts on the Kootenai River. Field data collection and processing efforts were made possible by the dedicated efforts of Peter Elliott, Rhonda Fosness, John Gralow, Deena Green, Ezra Grey, Daniel Hess, Michael Michelotti, William Nuckoles, and Marshall Williams of the U.S. Geological Survey. The author would like to acknowledge and thank Ryan Fosness (previous U.S. Geological Survey employee) who provided extensive mentoring, knowledge, and expertise that was crucial for the data collection and interpretation of this study.
Abstract
To assess changes in substrate conditions and the efficacy of artificially placed substrates at select sites on the Kootenai River near Bonners Ferry, Idaho, the U.S. Geological Survey, in cooperation with the Kootenai Tribe of Idaho, completed repeat bathymetric, velocimetric, and underwater videography surveys. Collectively, three project sites throughout the Kootenai River make up the Substrate Enhancement Pilot Project (SEPP), an effort intended to improve spawning and egg incubation viability at locations identified to be aquatic habitat limited for the endangered Kootenai River white sturgeon (Acipenser transmontanus). Following the placement of coarse substrates at each site, bathymetric, velocimetric, and underwater videography data were collected from 2012 to 2022 to assess the role of deposition and erosion on maintaining suitable white sturgeon spawning and incubation substrates. Minimal erosion and deposition occurred at all Substrate Enhancement Pilot Project sites, according to interannual and intra-annual net volumetric changes between bathymetric surveys. Depending on the timing of bathymetric surveys relative to the annual peak streamflow conditions, isolated locations of deposition or erosion were observed at each site and the potential for deposition or erosion was supported by measured mean depth-averaged velocities. This study concluded that variability of deposition and scour were common at each site throughout the monitoring period and may be attributed to fluctuations in streamflow. Repeat bathymetric, underwater videography, and velocity mapping surveys were used to verify the interstitial spaces and surfaces of substrates at each SEPP site remained free of fine sediments for intervals longer than a year but were susceptible to deposition between high streamflow events.
Introduction
The Kootenai River has a history of geomorphic changes resulting from natural and human-induced influences. Following the construction of Libby Dam in the 1970s, regulated streamflow conditions altered downstream ecosystem processes. This regulation of the streamflow regime directly affected river hydraulics and sediment transport processes resulting in measurable geomorphic changes to aquatic and terrestrial habitat in and near the Kootenai River. These effects were recognized as limiting factors of a healthy ecosystem by an interdisciplinary adaptive management and monitoring team as outlined in the Kootenai River Habitat Restoration Project Master Plan in 2009 (Kootenai Tribe of Idaho, 2009). The reduced transport capacity of coarse sediments and increased deposition of fine sediments resulting from changes in the flow regime were identified as aquatic habitat limiting factors and used to support the need of a habitat action in the Kootenai River (Kootenai Tribe of Idaho, 2009).
Physical habitat historically used by the Kootenai River white sturgeon (Acipenser transmontanus) has been altered resulting from regulated streamflow conditions in the Kootenai River leading to rapid decline in the population size and their listing in 1994 under the Endangered Species Act (U.S. Fish and Wildlife Service, 2008). Previous studies by the Kootenai Tribe of Idaho and Idaho Fish and Game identified approximate locations (1) of eggs from the endangered Kootenai River white sturgeon and, in turn, (2) where restoration efforts could be focused for improving white sturgeon spawning substrate conditions (Paragamian and others, 2001, 2002; Rust and Wakkinen, 2009, 2011). The management and monitoring teams recognized these locations did not have coarse sediments that were most suitable for spawning and early life stages for white sturgeon during periods of the year that are critical for their survival and outlined the need for improving those conditions (Anders and others, 2007).
Following the completion of a feasibility study evaluating cost-effective, self-sustaining ecosystem restoration actions (U.S. Army Corps of Engineers, 2012), the Substrate Enhancement Pilot Project (SEPP) was initiated with a focus on Shorty’s Island, Myrtle Bend, and later the Straight Reach near Bonners Ferry, Idaho. These SEPP sites (fig. 1) were (1) areas of relatively higher white sturgeon adults and egg occurrence than other locations in the Kootenai River during known spawning periods (Paragamian and others, 2001, 2002) and (2) suitable for testing the sustainability and effectiveness of substrate enhancements placed on the riverbed.
Previous bathymetric studies identified dominant sediment features, such as clay steps and sand dunes, at the Myrtle Bend and Shorty’s Island SEPP sites that were used to model the effects of flow and sediment transport (Barton, 2004; Barton and others, 2004; Fosness, 2014). Other geomorphic studies also concluded that high-magnitude long-duration streamflow events similar to those before the construction of Libby Dam were sufficient for scouring the bed and exposing coarse gravel deposits near Shorty’s Island and Myrtle Bend that were considered suitable substrates for white sturgeon egg incubation while also noting that relatively lower streamflow conditions could result in the burial of the coarse substrates (Barton and others, 2005; McDonald and others, 2010). Additional hydraulic modeling of the Kootenai River in 2005 described the location of the transition between backwater conditions imposed by the downstream Kootenay Lake water surface elevation and free-flowing water of the Kootenai River near Bonners Ferry (Berenbrock, 2005) and helped to define the sediment transport regime throughout the Kootenai River.
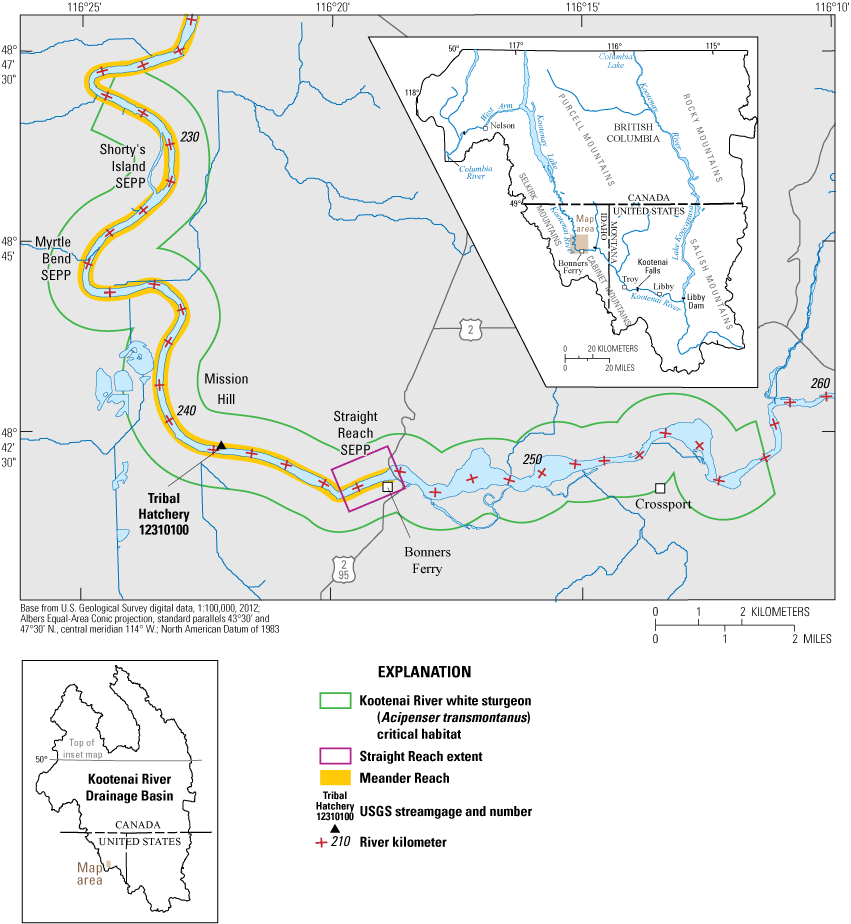
Substrate Enhancement Pilot Project (SEPP) sites on the Kootenai River near Bonners Ferry, Idaho.
In cooperation with the Kootenai Tribe of Idaho, this report summarizes the efficacy of substrate enhancements since their placement at three locations in the Kootenai River between 2014 and 2022. Bathymetric, velocimetric, and underwater videography data at each SEPP site yielded quantitative and qualitative assessments of substrate conditions. This report focuses on geomorphic and hydraulic variability following the placement of substrates in known Kootenai River white sturgeon spawning reaches from these monitoring data. Results from these data collection efforts may provide insight for the development and monitoring of future substrate enhancement projects aimed at increasing habitat and hydromorphic heterogeneity or improving habitat conditions for aquatic species of various life stages in environments, like the Kootenai River.
Study Sites
Substrates were placed at three locations in the Kootenai River and monitored to verify the substrate interstitial spaces and surfaces remained free of fine sediments. The Shorty’s Island SEPP, the furthest downstream study site at river kilometer (rkm) 231 (fig. 1) was constructed in 2014 and is composed of 2,400 cubic meters (m3) of substrate across a 1-acre patch near the east bank of the Meander Reach in the Kootenai River. The substrate is composed of two 0.3-meter (m) thick layers of riprap with a median grain size (D50) of 0.2 m and two layers of smaller sized cobbles (D50 = 0.08 m) to fill the voids of the larger riprap. Collectively, the substrate was placed on pre-existing clay shelves. Similar to the Shorty’s Island SEPP, construction of the Myrtle Bend SEPP site at rkm 234 (fig. 1) in the Meander Reach was completed in 2014 using the same volume and gradation of riprap and placed on pre-existing clay shelves. The most upstream SEPP site, in the Straight Reach near Bonners Ferry, Idaho at rkm 245 (fig. 1), consisted of 2 groups of 10 substrate piles composed of riprap with a D50 of approximately 0.13 m that were placed in 2016. The piles were placed in groups near the channel thalweg, where upstream coarse gravels transition to fine sands. The piles were positioned to provide hydraulic refugia and channel roughness suitable for spawning and migrating sturgeon.
Methods
Field Data Collection
Quantitative and qualitative monitoring data were collected at each SEPP site from 2012 to 2022. The frequency of field data collection efforts are summarized in table 1 and figure 2. Monitoring data included bathymetric surveys covering the entire SEPP site, velocity mapping at select cross-sections, and underwater videography/photography to qualitatively assess the substrate conditions including embeddedness, deposition, scour, and algae growth on the substrate surface. These monitoring data may provide a way of quantitatively and qualitatively evaluating their efficacy at maintaining consistent conditions for egg attachment and incubation of the Kootenai River white sturgeon.
Table 1.
Monitoring data collection summary at three Substrate Enhancement Pilot Project sites on the Kootenai River near Bonners Ferry, Idaho, 2012–22.[All data are accessible in Dudunake and Fosness (2018) and Fosness and others (2019). Abbreviations: SEPP, Substrate Enhancement Pilot Project; B, bathymetric data; VM, velocity mapping; UV, underwater videography; --, no data]
Collected as part of previous study (Fosness and others, 2019)
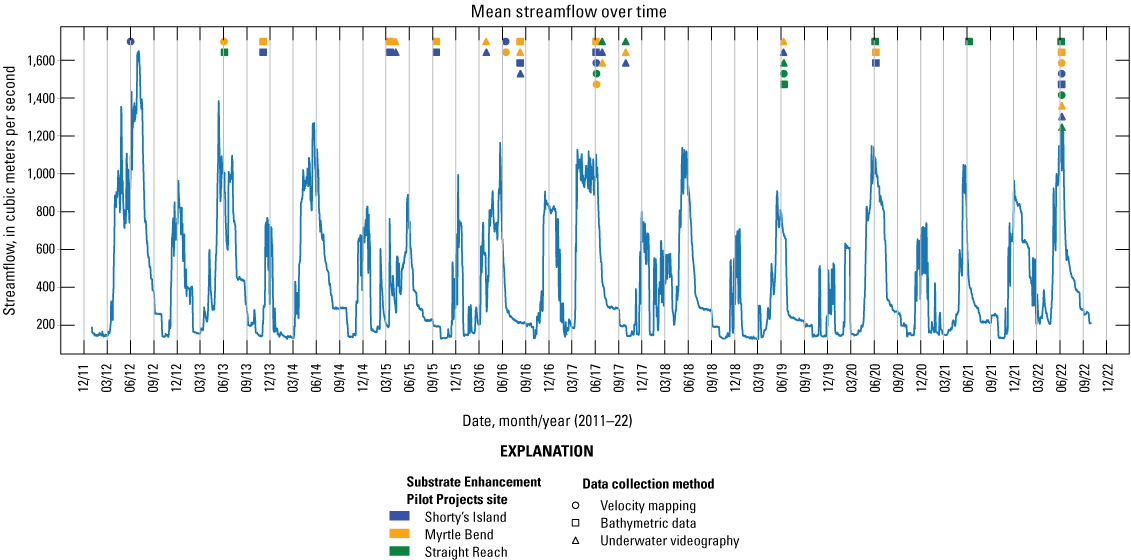
Daily mean streamflow at Kootenai River at Tribal Hatchery near Bonners Ferry (USGS 12310100) from 2012 to 2022 and the timing of field data collection at each Substrate Enhancement Pilot Project site. All data are accessible in Dudunake and Fosness (2018), Fosness and others (2019), and U.S. Geological Survey (2023).
Bathymetric elevation data were collected using a multibeam echosounder (MBES), navigation system, and a data acquisition computer. An Odom ES3 and Norbit iWBMS MBES were used to collect the bathymetric data throughout a swath range of 100–150 degrees on longitudinal transects to provide full data coverage of each SEPP site. The navigation system included global navigation satellite system receivers, an inertial measurement unit, a controller/processor, a cellular data connection or radio link to a nearby base station providing real-time kinematic corrections, or a series of each to provide an accurate and precise position during each bathymetric survey. In addition to the real-time kinematic corrections, post-processed kinematic positioning was also used to provide precise vertical and horizontal position for each bathymetric survey. Detailed procedures required for determining precise and accurate horizontal and vertical positioning during the bathymetric surveys are described in Rydlund and Densmore (2012). These procedures generally include determining a stable location for the base station with a clear view of the sky, establishing survey control throughout the study reach, and performing quality-assurance and quality control checks on the survey equipment. Hypack (2022) and the Norbit Data Collection Tool software packages (Norbit, 2023) were used to collect bathymetric data on an acquisition computer. When possible, bathymetric surveys were completed during peak streamflow conditions at each SEPP site (fig. 2). A complete description of bathymetric data collection and processing methods, quality-assurance and quality-control, and available data for this study are described in Fosness (2013); Dudunake and Fosness (2018); Fosness and others (2019). Processed point-cloud bathymetric datasets were used with the Topo to Raster tool in ArcGIS Pro to develop gridded bathymetric surfaces in the form of digital elevation models (DEMs) with a cell resolution of 0.15 meters for each survey (Esri, 2023).
Velocity mapping surveys were completed using an acoustic Doppler current profiler (ADCP) equipped with a differential global positioning system and used WinRiver II software (Teledyne RD Instruments, 2007) to measure water velocity at selected cross-sections at each SEPP site. Velocity data collection required proper initialization of the equipment with compass calibrations and other pre-measurement field procedures. All methods used for ADCP data collection, quality-assurance, and quality-control are consistent with and described in Mueller and others (2013). Relatively high streamflow conditions were the target for velocity mapping surveys except, in 2016 when the survey was completed during near-baseflow conditions as determined by daily mean streamflow observations at Kootenai River at Tribal Hatchery near Bonners Ferry (fig. 1, USGS 12310100; fig. 2). Velocity data were processed using the Velocity Mapping Toolbox (Parsons and others, 2013) to produce depth-averaged velocity magnitude values at a 1-meter horizontal spacing (Dudunake and Fosness, 2018). Data were clipped to the extent of each SEPP site to quantify the mean depth-averaged velocity at each site.
Beginning in 2015, qualitative data were collected in the form of underwater photos (hereinafter referred to as underwater videography) using a GoPro Hero4 waterproof camera affixed to a bedload sediment sampler and set to capture images on an interval as the camera was lowered to the riverbed. A scale (hose clamps separated by 0.1 meters) was fixed to the bedload sediment sampler, within the field-of-view of the camera, to provide a reference for estimating sediment size in each image. The camera clock was synchronized with a survey-grade global position system that was later used to georeference each image. The global position system was also used to (1) navigate within the SEPP extent and (2) ensure images were of the SEPP substrate material and not existing sediment. These qualitative data were used to capture a snapshot of substrate embeddedness, scour, and deposition at each SEPP site that could not be detected in the MBES bathymetric data, such as in the interstitial spaces of the substrate (Dudunake and Fosness, 2018).
Geomorphic Change Detection
A geomorphic change detection analysis was completed for each site to further investigate long term changes in conditions and resiliency of substrates placed at each SEPP site between their placement and the final survey. The Geomorphic Change Detection (GCD) stand-alone tool was used to compute elevation differences and volumetric changes in sediment between two DEMs (Riverscapes Consortium, 2020). Because uncertainty was not calculated for each point in the original point-cloud bathymetric datasets, a minimum level of detection threshold technique was used to calculate changes between surfaces. A threshold value of 0.09 meters, determined from the propagation of sensor, environmental, and other systematic error sources (Huang and others, 2017), best approximated changes between bathymetric surveys (Wheaton and others, 2010). Change detection metrics included (1) the total volume of surface lowering and raising greater than the threshold value (hereinafter referred to as thresholded total volume of surface lowering or raising), (2) total net volume difference, and (3) the average net thickness of difference, where positive (+) indicates deposition and negative (˗) indicates erosion, at each SEPP site. The average net thickness of difference was calculated by dividing the net volume of difference by the area of detectible change. The volumetric error associated with the detected change was calculated using the DEM cell area (0.05 square meters) and minimum level of detection and added for all erosional and depositional cells.
Results
Deposition and Scour
Deposition and scour processes were observed through the collection of quantitative and qualitative data at each SEPP site. Years when more than one bathymetric or underwater videography surveys were completed (2015 and 2016, respectively) provided intra-annual assessments of these processes for the Shorty’s Island and Myrtle Bend SEPP sites.
Bathymetric surveys completed following the construction of the Shorty’s Island SEPP on March 18, 2015 (fig. 1) and June 9, 2022 provided an interannual volumetric estimate of deposition and scour. Results from GCD using the 2015 and 2022 bathymetric surveys in GCD indicated a thresholded volume of surface lowering and raising of ˗68 plus or minus (±)30 m3 and +290±160 m3, respectively, and a net volume difference of +220±161 m3 within the extent of the SEPP site (fig. 3). The thresholded average net thickness of difference was +0.11±0.08 m. Visual inspection of images collected during underwater videography surveys at the Shorty’s Island SEPP site indicated that the substrates generally remained exposed across the surveyed area and had localized areas of minimal embeddedness (fig. 3). To further discern the deposition and scour on an intra-annual timescale, the volume of deposition and scour was determined using bathymetric surfaces from 2015 collected before and after annual peak streamflow conditions (figs. 2, 4). The intra-annual analysis characterizes the possible fluctuations in deposition and erosion within a year. The first bathymetric survey was completed on March 18, 2015, at the Shorty’s Island SEPP site, when the daily mean streamflow at USGS 12310100 was about 540 meters per second (m3/s) and preceded the annual peak streamflow of about 890 m3/s for the water year (fig. 2). The second bathymetric survey was completed on September 15, 2015, when the daily mean streamflow was about 192 m3/s. Over the 6 months between bathymetric surveys at the Shorty’s Island SEPP site, the thresholded volume of surface lowering and raising was ˗165±68 m3 and +251±110 m3, respectively. The net volume of difference between each bathymetric survey was +86±127 m3 and +0.05±0.07 m thresholded averaged net thickness of difference. Images collected during the underwater videography survey on April 9, 2015, when the daily mean streamflow was about 280 m3/s, indicated that substrates remained relatively free of sand throughout the extent of the Shorty’s Island SEPP site except near areas of localized deposition (fig. 4).
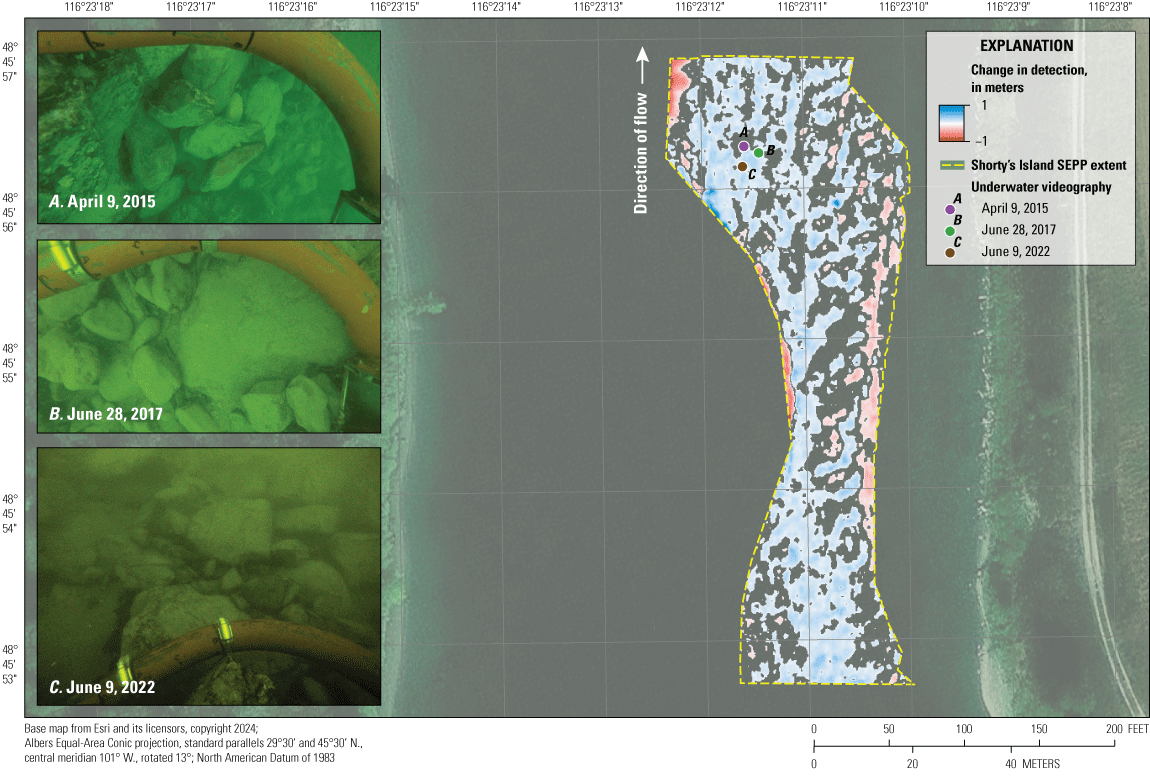
Detectable elevation change from March 18, 2015, to June 9, 2022, at the Shorty’s Island Substrate Enhancement Pilot Project (SEPP) site and location of images collected during underwater videography surveys. All data are accessible in Dudunake and Fosness (2018), Fosness and others (2019).
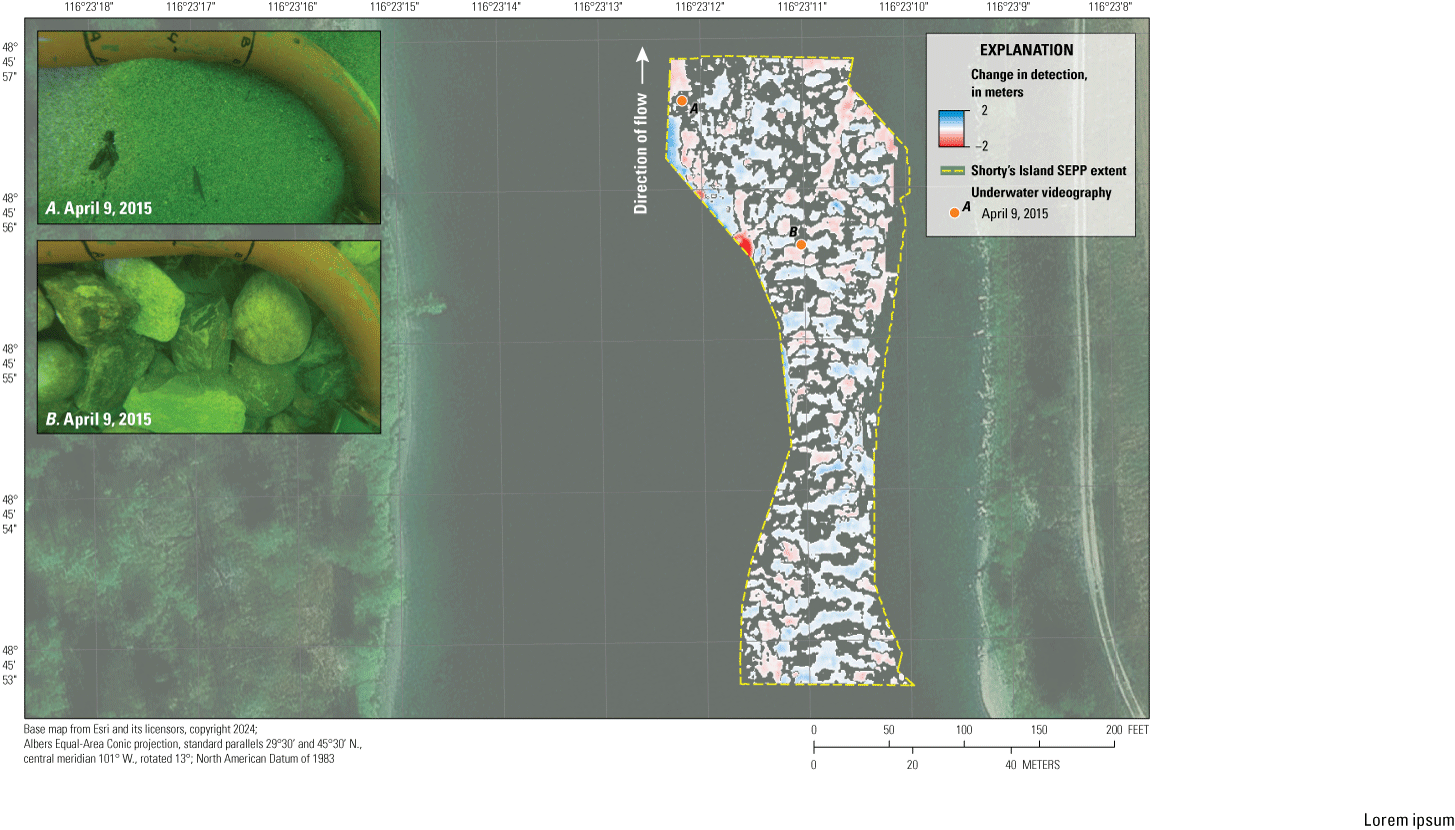
Detectable elevation change from March 18, 2015 to September 15, 2015, at the Shorty’s Island Substrate Enhancement Pilot Project (SEPP) site and location of image collected during underwater videography surveys. All data are accessible in Dudunake and Fosness (2018), Fosness and others (2019).
Results from bathymetric surveys completed at the Myrtle Bend SEPP site (fig. 1) were generally consistent with the variable distribution of deposition and erosion at the Shorty’s Island SEPP site; however, localized areas of deposition were more apparent at the Myrtle Bend SEPP site. Bathymetric surveys completed on March 18, 2015 and June 9, 2022 following the construction of the Myrtle Bend SEPP provided an interannual volumetric estimate of deposition and scour. Using these two bathymetric surveys in GCD, results indicated a thresholded volume of surface lowering and raising of ˗0.52±0.44 m3 and +650±260m3, respectively, and a net volume difference of +650±260 m3 within the extent of the SEPP site. A majority of deposition calculated using GCD occurred near the eastern boundary of the extent near the center of the channel (fig. 5), previously identified as being sand-dominated (Fosness, 2014). The sand-dominated nature of the channel near the Myrtle Bend SEPP site was observed in images from underwater videography surveys. Intra-annual deposition and erosion was calculated using two bathymetric surveys completed on March 18, 2015 and September 15, 2015 during similar flow conditions to those during repeat bathymetric surveys at the Shorty’s Island SEPP. Over the 6 months between bathymetric surveys at the Myrtle Bend SEPP site, the thresholded volume of surface lowering and raising was ˗127±73m3 and +77±48 m3, respectively (fig. 6). The net volume of difference between each bathymetric survey was ˗50±88 m3 and ˗0.04±0.07 m thresholded averaged net thickness of difference. Images collected during the underwater videography survey on April 8, 2015, when the daily mean streamflow was about 290 m3/s, indicated that substrates remained relatively free of sand throughout the extent of the Shorty’s Island SEPP site (fig. 6).
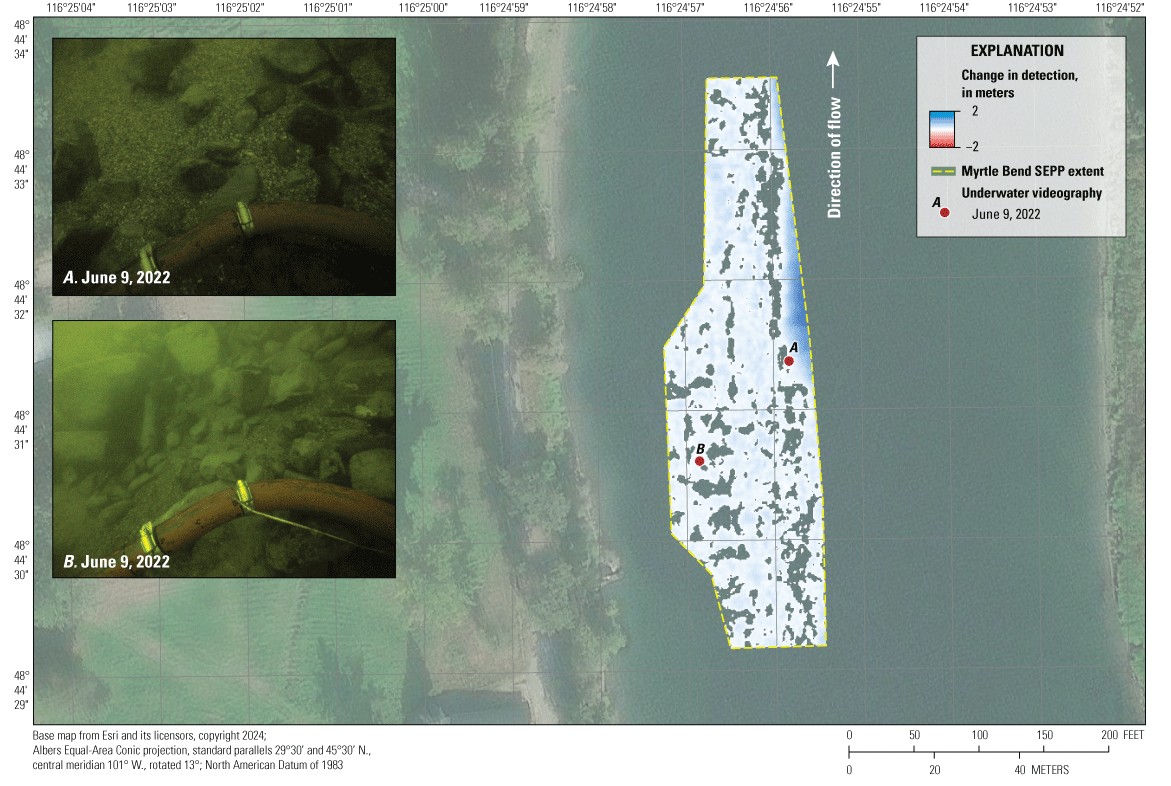
Map and images showing detectable elevation change from March 18, 2015, to June 9, 2022, at the Myrtle Bend Substrate Enhancement Pilot Project (SEPP) site and location of image collected during underwater videography surveys. All data are accessible in Dudunake and Fosness (2018), Fosness and others (2019).
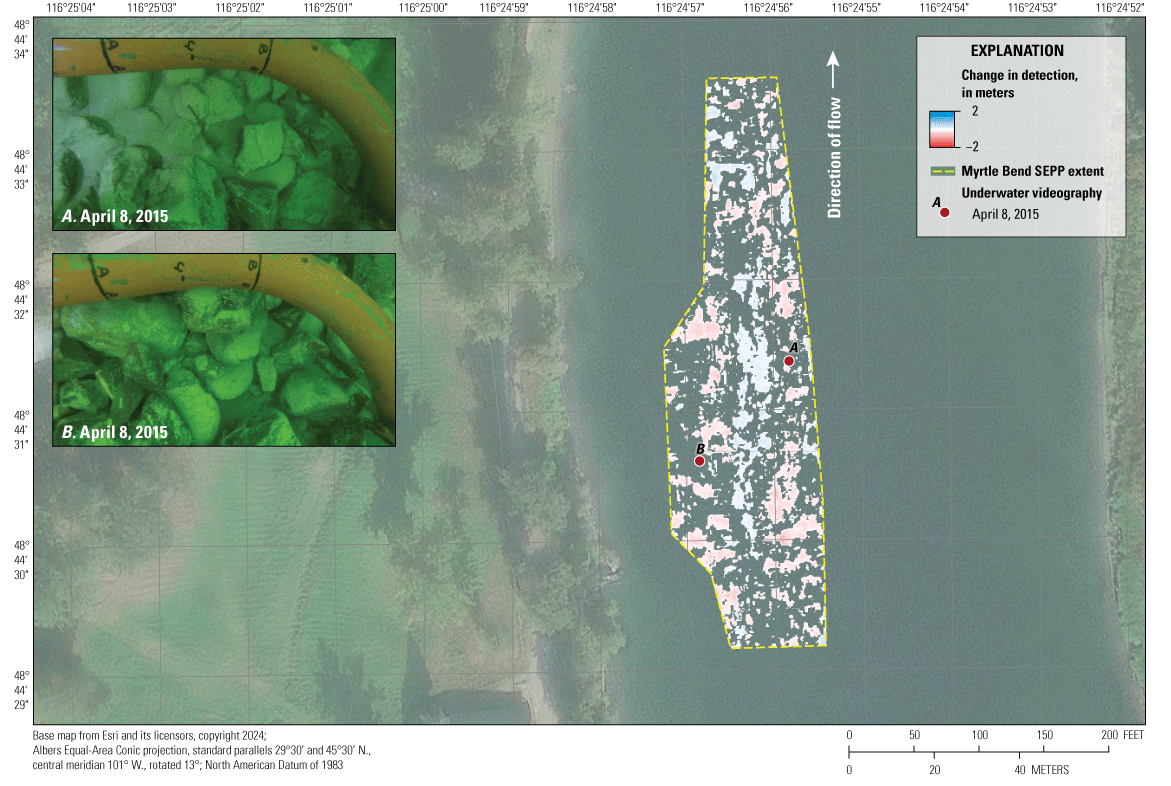
Detectable elevation change between March 18, 2015, and September 15, 2015, at the Myrtle Bend Substrate Enhancement Pilot Project (SEPP) site and location of image collected during underwater videography surveys. All data are accessible in Dudunake and Fosness (2018), Fosness and others (2019).
Bathymetric surveys completed after the construction of the Straight Reach SEPP site (fig. 1) provided useful insight into the variability of deposition and scour on an interannual basis. Using two bathymetric surveys completed during near-peak streamflow conditions (June 5, 2020, and June 6, 2022), estimates of deposition and scour were calculated within the extent of each substrate pile. Results from GCD indicated a thresholded volume of surface lowering and raising of ˗0.47±22 m3 and +71±41 m3, respectively, and a net volume difference of +24±46 m3 within the extent of the Straight Reach SEPP clusters. Overall, the thresholded average net thickness of difference between the bathymetric surfaces was 0.04±0.07 m (fig. 7). Images collected during the underwater videography survey on June 9, 2022, when the daily mean streamflow was about 1,000 m3/s, provided evidence that substrates remained relatively free of notable deposition despite the presence of small woody debris (fig. 7).
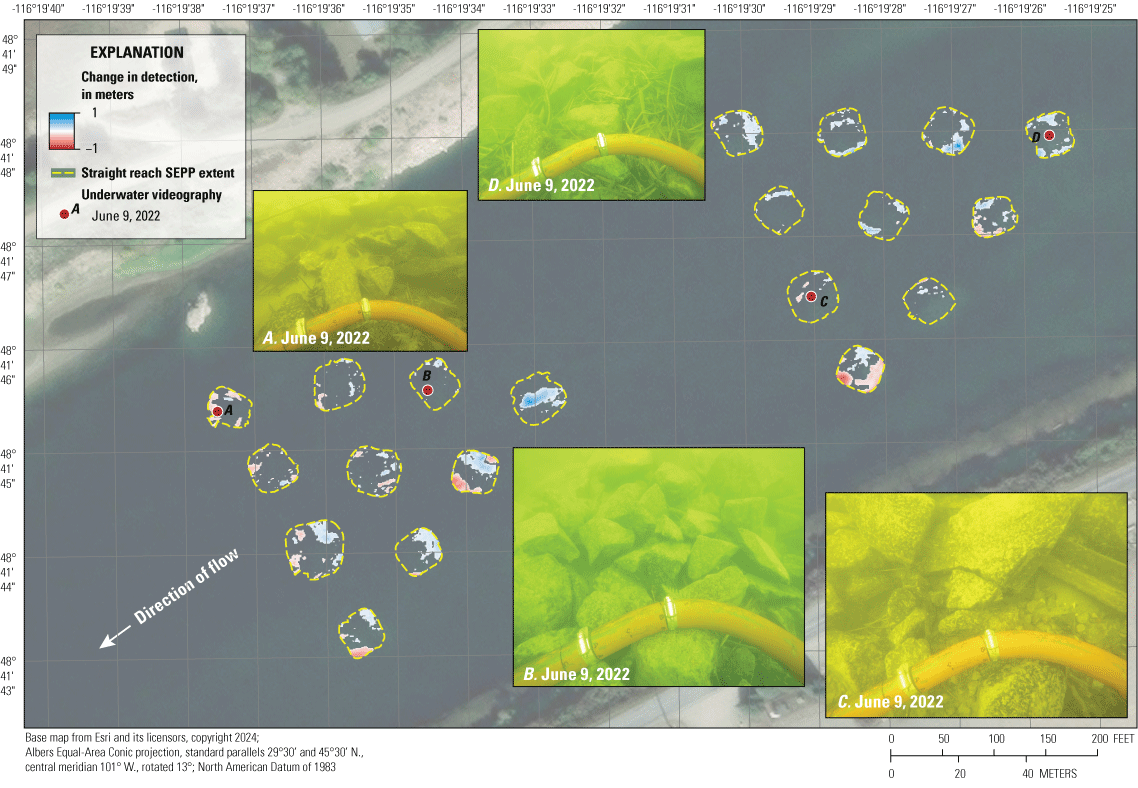
Detectable elevation change between June 5, 2020, and June 6, 2022, at the Straight Reach Substrate Enhancement Pilot Project (SEPP) site and location of image collected during underwater videography surveys. All data are accessible in Dudunake and Fosness (2018), Fosness and others (2019).
Hydraulic Variability
Velocity data collected during velocity mapping surveys (fig. 2) provided insight into the hydraulics at each SEPP site, which may help explain the variability in deposition and erosion. The mean depth-averaged velocity at each SEPP site varied between about 0.38 and 1 meters per second (m/s) and generally increased during high daily mean streamflow conditions. However, backwater conditions imposed by water levels in Kootenay Lake downstream of each SEPP site typically increased during spring runoff; therefore, high daily mean streamflow did not always correlate with the highest depth averaged velocity. For example, the highest observed mean depth-averaged velocity (1.02 m/s) at the Shorty’s Island SEPP site occurred on June 1, 2012, during rising streamflow conditions. The highest daily mean streamflow that occurred during the velocity mapping surveys (1,100 m3/s) occurred on June 8, 2022, with mean depth-averaged velocities between 0.92 to 0.97 m/s, increasing from downstream to upstream SEPP sites (fig. 8). The highest mean depth-averaged velocity at the Straight Reach SEPP site was about 1.0 m/s and occurred during the 2017 peak daily mean streamflow conditions, which was about 100 m3/s less than the highest daily mean streamflow during the velocity mapping surveys. The mean depth-averaged velocity was about 0.97 m/s, which is attributed to the increased water levels in Kootenay Lake. The slowest mean depth-averaged velocity (0.38 m/s) occurred at the Myrtle Bend SEPP site, when the streamflow was about 300 m3/s and decreasing on June 15, 2016 (fig. 8). Similarly, the slowest mean-depth averaged velocity at the Shorty’s Island SEPP site was 0.43 m/s on June 14, 2016, when the streamflow was about 320 m3/s (fig. 8). Additionally, the mean depth-averaged velocity was greater in 2017 than in 2022 at the Straight Reach SEPP site, when the daily mean streamflow and stage was lower (fig. 8).
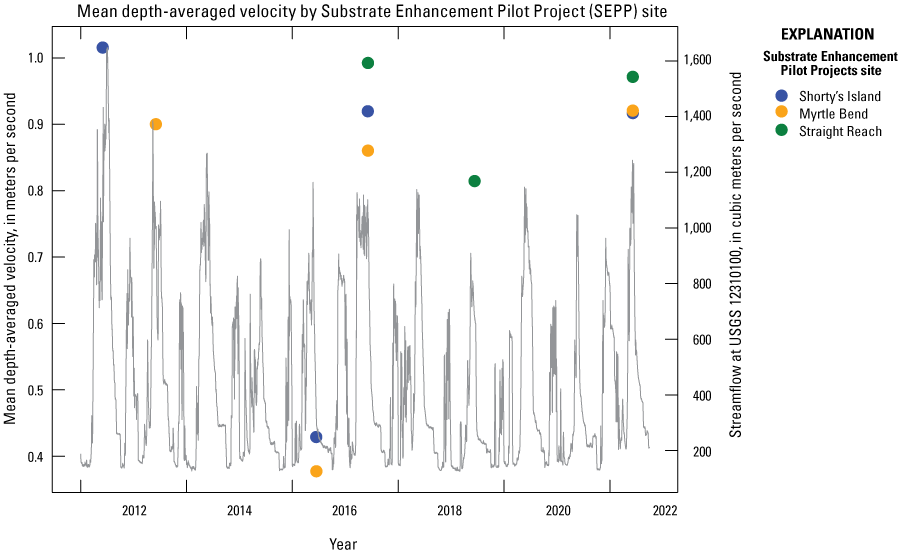
Daily mean streamflow at Kootenai River at Tribal Hatchery near Bonners Ferry (USGS 12310100) from 2012 to 2022 and the mean depth-averaged velocity measured at each Substrate Enhancement Pilot Project site. All data are accessible in Dudunake and Fosness (2018), Fosness and others (2019), and U.S. Geological Survey (2023).
The hydraulic variability provided evidence of fine sediments settling during lower streamflow, higher stage, and slower mean depth-averaged velocities. For example, the mean depth-averaged velocity on June 5, 2017, was 0.92 m/s (fig. 9A) at the Shorty’s Island SEPP site, when daily mean streamflow was about 1,100 m3/s. Preceding the velocity mapping survey, images were collected during an underwater videography survey on June 28, 2017 (fig. 3), which showed minimal deposition of fine-grained sediments and algae. After streamflow receded to about 190 m3/s, images collected on September 29, 2017, showed fine sediments and algae on the substrate surfaces (fig. 9A). Similar observations were made at the Myrtle Bend SEPP site. The mean depth-averaged velocity on June 15, 2016 was 0.38 m/s. After the streamflow decreased from about 300 m3/s to about 220 m3/s, images collected during the underwater videography on August 10, 2016 showed that fine sediments and algae settled on the surface of the substrate (fig. 9B), which was observed in most locations within the Myrtle Bend SEPP extent.
Results of underwater videography and velocity mapping surveys at the Straight Reach SEPP site were similar to the other SEPP sites. Underwater videography surveys completed on June 28, 2017, when the daily mean streamflow was about 430 m3/s, showed substrates were relatively free of surface algae and fine sediments, similar to observations in 2019 and 2022, when streamflow was higher (fig. 7). After the streamflow receded to about 190 m3/s on September 29, 2017, subsequent images showed that algae and fine-grained sediments began settling on the substrate surface (fig. 9C). Velocity mapping surveys provided insight about the timing of fine sediment settling on SEPP substrate surfaces. The mean depth-averaged velocity varied from 0.81 to 0.99 m/s between the three velocity mapping surveys (fig. 8). The highest mean depth-averaged velocity observed in 2017 (fig. 9C) occurred when streamflow was about 110 m3/s less than the next highest mean depth-averaged velocity (0.97 m/s) observed in 2022.
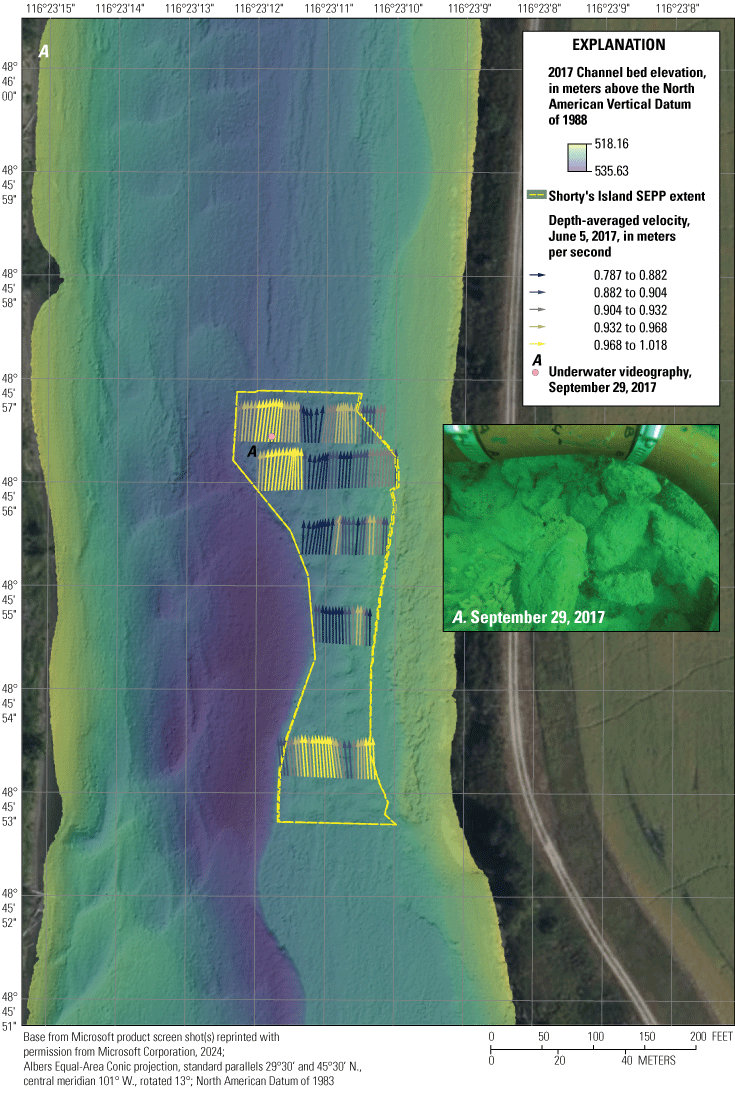
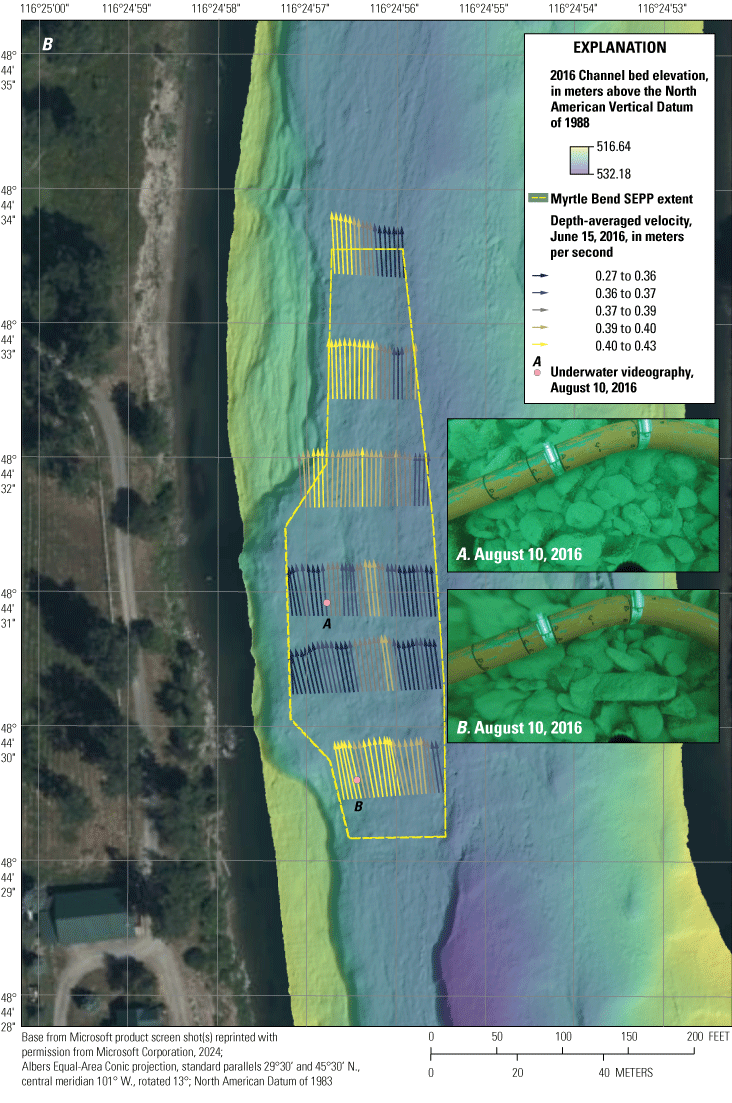
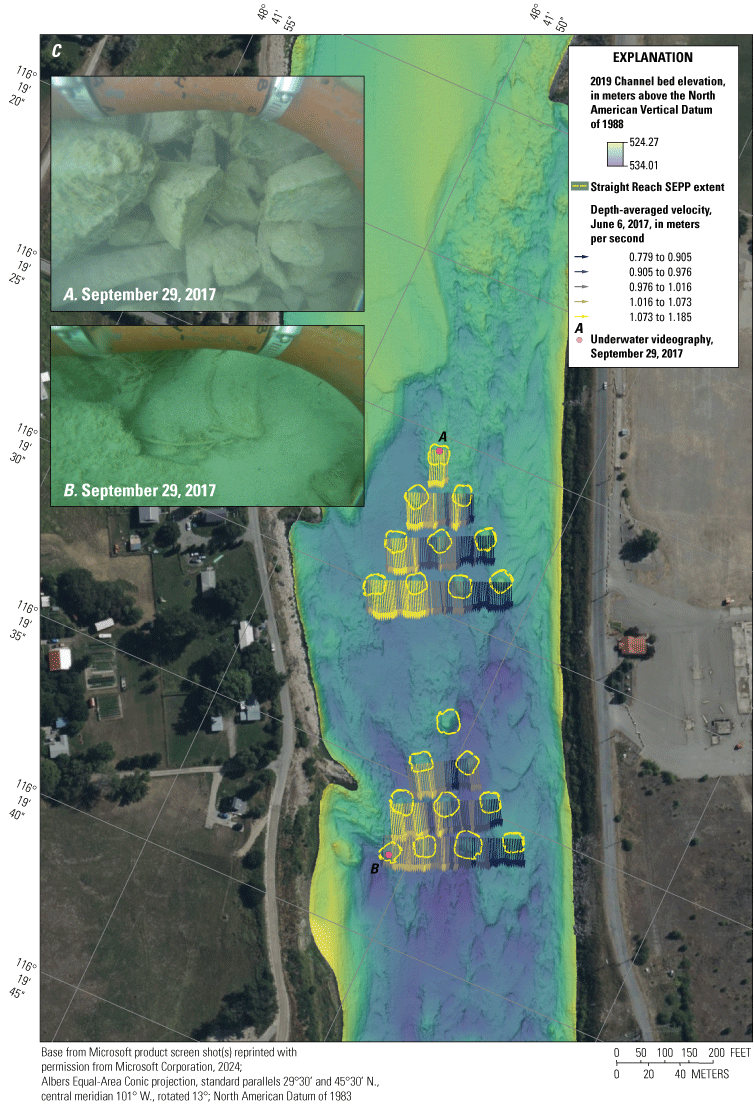
Bathymetry, underwater videography, and depth-averaged velocities at the Shorty’s Island (A), Myrtle Bend (B), and Straight Reach (C) Substrate Enhancement Pilot Project (SEPP) sites. All data are accessible in Dudunake and Fosness (2018), Fosness and others (2019), and U.S. Geological Survey (2023).
The relation between daily mean streamflow and stage with the observed mean depth-averaged velocity at each SEPP site were characterized by linear regression (fig. 10). In general, a positive linear relation between mean depth-averaged velocity and streamflow was observed (R2=0.89) and mean depth-averaged velocity and stage (R2=0.83). These relations demonstrated how the effects of backwater from Kootenay Lake, about 100 kilometers downstream, may alter the hydraulics and, in turn, the deposition of fine sediments at each SEPP site. For example, velocity mapping surveys in 2013 and 2017, at the Myrtle Bend SEPP site, occurred at about the same daily mean streamflow (1,000 m3/s) but the stage at USGS 12310100 was about 0.6 m higher in 2017 resulting in a slower mean depth-averaged velocity associated with the increased backwater. Although the Myrtle Bend SEPP site was not constructed and underwater videography surveys were not completed in 2013, the mean depth-averaged velocity and developed regression may provide understanding about the depositional environment at the Myrtle Bend SEPP site and the other SEPP sites when the backwater is increased and the streamflow is decreased.
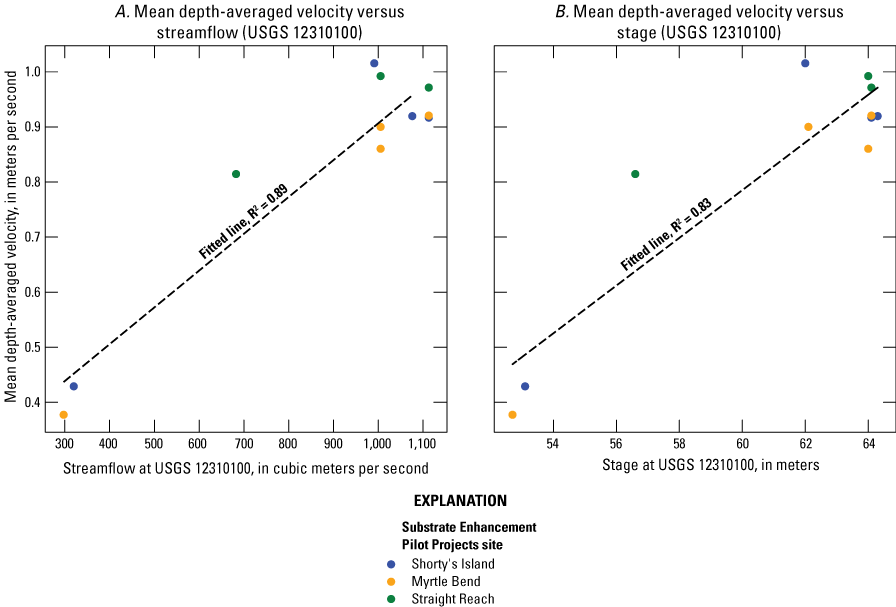
Relation between calculated mean depth-averaged velocity and streamflow (A) and stage (B) measured at Kootenai River at Tribal Hatchery near Bonners Ferry (USGS 12310100). All data are accessible in Dudunake and Fosness (2018), Fosness and others (2019), and U.S. Geological Survey (2023).
Summary and Conclusions
The U.S. Geological Survey, in cooperation with the Kootenai Tribe of Idaho, summarized the efficacy of substrate enhancements since their placement at three locations in the Kootenai River between 2014 and 2016. Bathymetric, velocimetric, and underwater photographs collected at each Substrate Enhancement Pilot Project site provided quantitative and qualitative data for assessment of the substrate conditions. These monitoring data provided evidence that each SEPP site was self-sustaining and maintained a surface free of fine-grained deposition during high spring runoff events, a period that is crucial for spawning white sturgeon (Acipenser transmontanus) and egg incubation. Sediments often accumulated at the SEPP sites during late summer baseflow and high backwater conditions.
Bathymetric surveys provided a mechanism to quantitatively assess interannual and intra-annual changes in substrate conditions using the Geomorphic Change Detection tool. Uncertainty and thresholding the calculated volumetric changes showed interannual net volumetric changes were +220±161 m3 (2015–22), +650±260 m3 (2015–22), and +24±46 m3 (2020–22) at the Shorty’s Island, Myrtle Bend, and Straight Reach SEPP sites, respectively. Intra-annual net volumetric changes tended to be less than interannual volumetric changes; +86±127 m3 (2015), and ˗50±88 m3 (2015) at the Shorty’s Island and Myrtle Bend SEPP sites, respectively. In most cases, the interannual and intra-annual net volumetric changes between surveys were within the bounds of uncertainty when accounting for the thresholded values, thus indicating that differences in bathymetric surfaces were likely equivocal. Exceptions to this equivocal difference include Shorty’s Island and Myrtle Bend between 2015 and 2020 and may be attributed to the timing of the bathymetric surveys relative to the streamflow and hydraulic conditions. The March 2015 bathymetric surveys were completed during the brief increase in streamflow that may have caused a scour event across the surface resulting in substrates generally free of fine sediments. The June 2022 bathymetric surveys were completed during longer duration peak daily mean streamflow and stage conditions and intermediate mean depth-averaged velocities that may have deposited fine sediments on the substrate surface. The collection of images during underwater videography surveys provided useful qualitative verification of changes in deposition and erosion on the surface substrates at each SEPP site. The cyclic patterns of deposition and scour were common observations at each SEPP site throughout the monitoring period and may be attributed to the hydraulic variability associated with changes in streamflow. Overall, repeat bathymetric, underwater videography, and velocity mapping surveys were used to verify the interstitial spaces and surfaces of substrates at each SEPP site remained free of fine sediments for intervals longer than a year but demonstrated that the substrates were susceptible to deposition on intra-annual periods of time.
References Cited
Barton, G.J., 2004, Characterization of channel substrate, and changes in suspended-sediment transport and channel geometry in white sturgeon spawning habitat in the Kootenai River near Bonners Ferry, Idaho, following the closure of Libby Dam: U.S. Geological Survey Water-Resources Investigations Report 2003–4324, 102 p., accessed December 20, 2023, at https://doi.org/10.3133/wri034324.
Barton, G.J., McDonald, R.R., Nelson, J.M., and Dinehart, R.L., 2005, Simulation of flow and sediment mobility using a multidimensional flow model for the White Sturgeon critical-habitat reach, Kootenai River near Bonners Ferry, Idaho: U.S. Geological Survey Scientific Investigations Report 2005–5230, 54 p., accessed December 21, 2023, at https://doi.org/10.3133/sir20055230.
Barton, G.J., Moran, E.H., and Berenbrock, C., 2004, Surveying cross sections of the Kootenai River between Libby Dam, Montana, and Kootenay Lake, British Columbia, Canada: U.S. Geological Survey Open-File Report 2004–1045, 42 p., accessed December 20, 2023, at https://doi.org/10.3133/ofr20041045.
Berenbrock, C., 2005, Simulation of hydraulic characteristics in the white sturgeon spawning habitat of the Kootenai River near Bonners Ferry, Idaho: U.S. Geological Survey Scientific Investigations Report 2005–5110, 30 p., accessed December 5, 2023, at https://doi.org/10.3133/sir20055110.
Dudunake, T.J., and Fosness, R.L., 2018, Kootenai river substrate enhancement pilot projects near Bonners Ferry, ID (ver. 3.0, January 2023): U.S. Geological Survey data release, accessed December 1, 2023, at https://doi.org/10.5066/F7ZC824R.
Esri, 2023, An overview of the Spatial Analyst Toolbox: Esri web page, accessed December 5, 2023, at https://desktop.arcgis.com/en/arcmap/latest/tools/spatial-analyst-toolbox/an-overview-of-the-spatial-analyst-toolbox.htm.
Fosness, R.L., 2013, Bathymetric surveys of the Kootenai River near Bonners Ferry, Idaho, water year 2011: U.S. Geological Survey Data Series 694, 26 p., accessed December 8, 2023, at https://doi.org/10.3133/ds694.
Fosness, R.L., 2014, Maps and geospatial data for the Shorty’s Island and Myrtle Bend substrate enhancement pilot projects, Kootenai River near Bonners Ferry, Idaho: U.S. Geological Survey Data Series 889, 9 p., accessed November 30, 2023, at https://doi.org/10.3133/ds889.
Fosness, R.L., Dudunake, T.J., Nuckoles, W.P., and Grey, E.I., 2019, Kootenai river habitat restoration project bathymetric surveys near Bonners Ferry, ID (ver 4.0, January 2023): U.S. Geological Survey data release, accessed December 1, 2023, at https://doi.org/10.5066/P9OC5QMH.
Huang, C., Bian, G., Lu, X., Wang, M., Huang, X., and Wang, K., 2017, The analysis of error sources and quality assessment for multibeam sounding products: The International Hydrographic Review, 16 p., accessed December 21, 2023, at https://journals.lib.unb.ca/index.php/ihr/article/view/26299/1882519052.
Hypack, 2022, HYPACK hydrographic survey software user manual: Middletown, Conn., HYPACK, Inc., 2434 p., accessed December 20, 2023, at https://www.xylem.com/siteassets/brand/hypack/resources/manual/hypack-2021-user-manual.pdf
Kootenai Tribe of Idaho, 2009, Kootenai River Habitat Restoration Project Master Plan: Bonners Ferry, ID, Kootenai Tribe of Idaho, 291 p., accessed December 20, 2023, at http://www.kootenai.org/fish_restoration.html.
McDonald, R., Nelson, J., Paragamian, V., and Barton, G., 2010, Modeling the effect of flow and sediment transport on white sturgeon spawning habitat in the Kootenai River, Idaho: Journal of Hydraulic Engineering, v. 136, no. 12, p. 1077–1092, accessed January 4, 2024, at https://doi.org/10.1061/(ASCE)HY.1943-7900.0000283.
Mueller, D.S., Wagner, C.R., Rehmel, M.S., Oberg, K.A., and Rainville, F., 2013, Measuring discharge with acoustic Doppler current profilers from a moving boat (ver. 2.0, December 2013): U.S. Geological Survey Techniques and Methods, book 3, chap. A, accessed December 1, 2023, at https://doi.org/10.3133/tm3A22.
Paragamian, V.L., Kruse, G., and Wakkinen, V., 2001, Spawning habitat of Kootenai River white sturgeon, Post-Libby Dam: North American Journal of Fisheries Management, v. 21, no. 1, p. 22–33, accessed January 4, 2024, at https://doi.org/10.1577/1548-8675(2001)021<0022:SHOKRW>2.0.CO;2.
Paragamian, V.L., Wakkinen, V.D., and Kruse, G., 2002, Spawning locations and movement of Kootenai River white sturgeon: Journal of Applied Ichthyology, v. 18, nos. 4–6, p. 608–616, accessed January 5, 2024, at https://doi.org/10.1046/j.1439-0426.2002.00397.x.
Parsons, D.R., Jackson, P.R., Czuba, J.A., Engel, F.L., Rhoads, B.L., Oberg, K.A., Best, J.L., Mueller, D.S., Johnson, K.K., and Riley, J.D., 2013, Velocity Mapping Toolbox (VMT)—A processing and visualization suite for moving-vessel ADCP measurements: Earth Surface Processes and Landforms, v. 38, no. 11, p. 1244–1260.
Riverscapes Consortium, 2020, Geomorphic change detection software: Riverscapes Consortium, accessed December 20, 2023, at http://gcd.riverscapes.xyz/.
Rust, P., and Wakkinen, V., 2009, Kootenai River white sturgeon spawning and recruitment evaluation—Annual progress report, May 1, 2008–April 30, 2009: Idaho Department of Fish and Game Report Number 09-12, 44 p., accessed December 4, 2023, at https://collaboration.idfg.idaho.gov/FisheriesTechnicalReports/Res09-12Rust2009%20Kootenai%20River%20White%20Sturgeon%20Spawning%20and%20Recruitment%2 0Evalutation.pdf.
Rust, P., and Wakkinen, V., 2011, Kootenai River white sturgeon spawning and recruitment evaluation—Annual progress report, May 1, 2009–April 30, 2010: Idaho Department of Fish and Game Report Number 09-12, 44 p., accessed December 4, 2023, at https://collaboration.idfg.idaho.gov/FisheriesTechnicalReports/Res11-01Rust2009-2010%20K%20River%20Sturgeon.pdf.
Rydlund, P., and Densmore, B., 2012, Methods of practice and guidelines for using survey-grade global navigation satellite systems (GNSS) to establish vertical datum in the United States Geological Survey: US Geological Survey Techniques and Methods 11–D1, p. 102., accessed December 4, 2023, at https://doi.org/10.3133/tm11D1.
U.S. Army Corps of Engineers, 2012, Draft continuing authorities program section 1135 detailed project report and integrated environmental assessment, Shorty’s Island/Meander Reach ecosystem restoration Kootenai River, Idaho: Walla Walla, Washington, U.S. Army Corps of Engineers, Seattle District, 260 p.
U.S. Fish and Wildlife Service, 2008, Endangered and threatened wildlife and plants; critical habitat revised designation for the Kootenai river population of the white sturgeon (Acipenser transmontanus): Federal Register, v. 73, p. 39505–39523, accessed January 4, 2024, https://www.federalregister.gov/d/E8-15134.
U.S. Geological Survey, 2023, USGS surface-water data for the Nation, in USGS water data for the Nation: U.S. Geological Survey National Water Information System database, accessed November 2023, at https://doi.org/10.5066/F7P55KJN. [Surface-water data are directly accessible at https://waterdata.usgs.gov/nwis/sw.]
Wheaton, J.M., Brasington, J., Darby, S.E., and Sear, D.A., 2010, Accounting for uncertainty in DEMs from repeat topographic surveys: improved sediment budgets: Earth Surface Processes and Landforms, v. 35, no. 2, p. 136–156, accessed November 27, 2023, at https://doi.org/10.1002/esp.1886.
Conversion Factors
International System of Units to U.S. customary units
Datums
Vertical coordinate information is referenced to the North American Vertical Datum of 1988 (NAVD 88).
Horizontal coordinate information is referenced to the North American Datum of 1983 (NAD 83).
Elevation, as used in this report, refers to distance above the vertical datum.
For information about the research in this report, contact the
Director, Idaho Water Science Center
U.S. Geological Survey
230 Collins Rd
Boise, Idaho 83702-4520
https://www.usgs.gov/centers/id-water
Manuscript approved on July 18, 2024
Publishing support provided by the U.S. Geological Survey
Science Publishing Network, Tacoma Publishing Service Center
Edited by Nate Severance
Layout and illustration support by Luis Menoyo
Cover design by Yanis X. Castillo
Disclaimers
Any use of trade, firm, or product names is for descriptive purposes only and does not imply endorsement by the U.S. Government.
Although this information product, for the most part, is in the public domain, it also may contain copyrighted materials as noted in the text. Permission to reproduce copyrighted items must be secured from the copyright owner.
Suggested Citation
Dudunake, T.J., 2024, Substrate Enhancement Pilot Project—Monitoring summary and evaluation, Kootenai River, Idaho, 2012–22 (ver. 1.1, March 6, 2025): U.S. Geological Survey Scientific Investigations Report 2024–5070, 18 p., https://doi.org/10.3133/sir20245070.
ISSN: 2328-0328 (online)
Study Area
| Publication type | Report |
|---|---|
| Publication Subtype | USGS Numbered Series |
| Title | Substrate Enhancement Pilot Project—Monitoring summary and evaluation, Kootenai River, Idaho, 2012–22 |
| Series title | Scientific Investigations Report |
| Series number | 2024-5070 |
| DOI | 10.3133/sir20245070 |
| Edition | Version 1.0: August 29, 2024; Version 1.1: March 6, 2025 |
| Publication Date | August 29, 2024 |
| Year Published | 2024 |
| Language | English |
| Publisher | U.S. Geological Survey |
| Publisher location | Reston, VA |
| Contributing office(s) | Idaho Water Science Center |
| Description | Report: vii, 18 p.; Data Release |
| Country | United States |
| State | Idaho |
| Other Geospatial | Kootenai River |
| Online Only (Y/N) | Y |