Water-Quality Constituent Concentrations and Loads Computed Using Real-Time Water-Quality Data for the Republican River, Clay Center, Kansas, August 2018 through July 2023
Links
- Document: Report (2.8 MB pdf) , HTML , XML
- Dataset: USGS National Water Information System database —USGS water data for the Nation
- Download citation as: RIS | Dublin Core
Abstract
Milford Lake, the largest reservoir by surface area in Kansas, has had confirmed harmful algal blooms every summer since reporting began in 2011, except 2018–19. Milford Lake has been listed as impaired and designated hypereutrophic under section 303(d) of the 1972 Clean Water Act. In 2014, the Kansas Department of Health and Environment established a total maximum daily load for eutrophication and dissolved oxygen impairments. In 2018, the Natural Resources Conservation Service funded the Regional Conservation Partnership Program for the Milford Lake Watershed to focus on best management practices in the Lower Republican River Basin. The U.S. Geological Survey, in cooperation with the Kansas Water Office, completed this study to assess and quantify water-quality constituent concentration “s and loads for total nitrogen (TN), total phosphorus (TP), and suspended sediment (SS) using previously published models for the Republican River near Clay Center, Kansas (U.S. Geological Survey station 06856600), about 15 miles upstream from Milford Lake, during August 1, 2018, through July 31, 2023. TN, TP, and SS concentrations and loads were monitored because of their relation to water supply and water-quality issues in Milford Lake, including nutrient and sediment transport, taste-and-odor events, potentially toxic cyano-harmful algal bloom events, and subsequent downstream transport of contaminants. Data from this report can be used to evaluate changing conditions, provide science-based information for decision making, and help meet regulatory requirements.
The study mean annual loads for TN and TP were greater than the reported mean annual total maximum daily load and exceeded the watershed reduction goals as well as Kansas nonpoint source reduction goals defined by the Watershed Restoration and Protection Strategy for the Lower Republican watershed. TN and TP annual loads during 2019–20 were greater than the defined mean annual total maximum daily load. During 2022, TN and TP annual loads were less than the Kansas nonpoint source reduction goal and during 2023 were less than the watershed reduction goal. SS loads were less than the mean annual sedimentation rate computed from the total maximum daily load for the entirety of the study period, and the study mean annual load was 72 percent less than the designed annual reservoir sedimentation rate for Milford Lake.
Data collected during the study period represented a wide range of streamflow and water-quality conditions at the Clay Center site, ranging from low-flow with less frequent runoff during 2023 to high-flow with frequent runoff during 2018. Nutrient reduction goals were only met in the final 2 years of the study period when annual mean flow conditions were lower than normal, indicating that goals may be unattainable during average or high-flow conditions. In all years except 2019, the annual mean SS load was less than the 20-year sediment load reduction target. Although annual SS loads at the Clay Center site generally decreased over time, corresponding reductions in annual streamflow indicated that these reductions may primarily be related to less frequent runoff from the upstream basin. Continued water-quality monitoring and tracking of best management practices are necessary to understand the success of Regional Conservation Partnership Program efforts to reduce nutrient transport in the Milford Lake Watershed.
Introduction and Background
Milford Lake, the largest reservoir by surface area in Kansas, has had confirmed harmful algal blooms (HABs) every summer from 2011 through 2017 and from 2020 through 2023 (fig. 1; Kansas Department of Health and Environment [KDHE], 2023). No HABs were detected or reported by the KDHE during 2018–19 despite greater than mean annual total streamflow. During development of the 2012 303(d) list, the KDHE determined that excessive nutrients in Milford Lake are impairing aquatic life and domestic water supply and contributing to HABs that result in the eutrophication and impairment of contact recreation within Milford Lake (Kansas Alliance for Wetlands and Streams, 2019). The KDHE developed a nutrient total maximum daily load (TMDL) for Milford Lake eutrophication and dissolved oxygen impairments in 2014 (KDHE, 2014). The Republican River is the primary inflow to Milford Lake and drains areas of Kansas, Nebraska, and Colorado. The Lower Republican River Basin includes only the Kansas part of the Republican River Basin (basin will be hereafter referenced as watershed) in Clay, Cloud, Dickinson, Geary, Jewell, Mitchell, Republic, Riley, and Washington Counties (fig. 2).
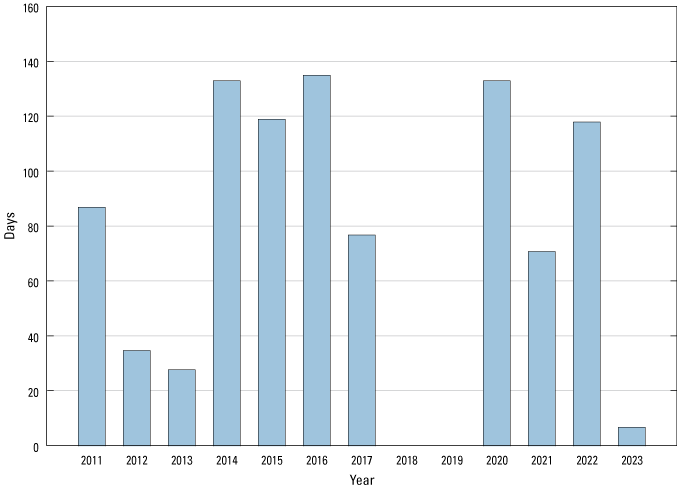
Number of days with harmful algal bloom advisories at Milford Lake, Kansas, during 2011–23. Data from Kansas Department of Health and Environment (2023).
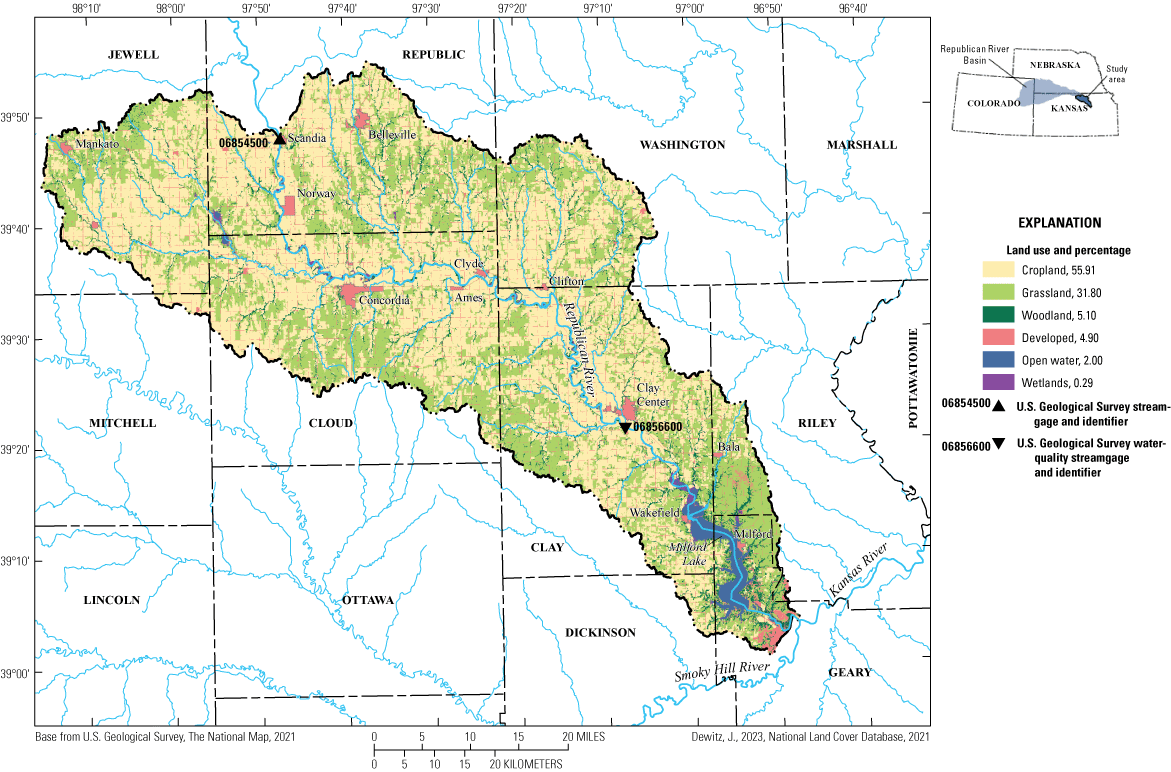
Land use in the Republican River Basin upstream from Milford Lake, Kansas.
The Watershed Restoration and Protection Strategy (WRAPS) for the Lower Republican watershed was developed to outline a plan of restoration and protection goals and actions for the surface waters of the watershed. The original WRAPS plan was developed in 2011, and TMDLs were approved in 2014 (KDHE, 2014; Kansas Alliance for Wetlands and Streams, 2019). WRAPS defines watershed restoration for surface waters that do not meet water-quality standards; watershed restoration for areas of the watershed that need improvement in habitat, land management, or other attributes; and watershed protection for surface waters that currently meet water-quality standards but need protection from future degradation (Kansas Alliance for Wetlands and Streams, 2019).
In 2015, the Kansas Water Office Regional Advisory Committees were established to develop broad goals to guide activities to improve water quality and quantity. In 2018, the Kansas Water Office submitted an application to the Kansas Forest Service Regional Conservation Partnership Program (RCPP) for the Milford Lake watershed, which was approved for funding by the Natural Resources Conservation Service (Kansas Alliance for Wetlands and Streams, 2019). The focus of the RCPP is to reduce phosphorus and align with goals set by WRAPS and the Regional Advisory Committees. The focus includes additional funding for the implementation of best management practices (BMPs) in the Milford Lake watershed (Kansas Alliance for Wetlands and Streams, 2019). The Milford Lake watershed RCPP primarily focuses on the Lower Republican River watershed (Kansas Water Office, 2023). Because the majority watershed land use is cropland (Dewitz, 2023), the Environmental Quality Incentives Program, through the Natural Resources Conservation Service, provides funding for eligible Milford Lake watershed RCPP BMPs with a cropland and livestock focus. Some of the eligible core practices of the Environmental Quality Incentives Program include implementing comprehensive nutrient management plans, fencing, cover crops, access controls, watering facilities, heavy use areas, and residue and tillage management (reduced till or no till) practices (Unruh, 2020).
The Milford Lake TMDL-estimated mean annual loading to the reservoir is 4,875,835 pounds per year of total nitrogen (TN) and 1,216,912 pounds per year of total phosphorus (TP) based on data collected during 2008–12 (table 1; KDHE, 2014). The Milford Lake TMDL estimated a slower than designed sedimentation rate of 1,007 acre-feet per year (acre-ft/yr; equivalent of 2,014,000 tons per year; KDHE, 2014). To improve the trophic condition and water quality of Milford Lake and meet desired endpoints, the TMDL estimates a necessary watershed reduction in TP and TN of 88 and 86 percent, respectively (KDHE, 2014). The Milford WRAPS plan addresses only the Kansas part of load reductions needed using a mass balance evaluation to remove the part of the load originating in Nebraska, resulting in a TP reduction goal of 617,204 pounds (lb) and a TN reduction goal of 2,341,263 lb annually from Kansas sources (table 1; Kansas Alliance for Wetlands and Streams, 2019). The plan also outlines a 20-year sediment load reduction goal of 630,612 tons (Kansas Alliance for Wetlands and Streams, 2019). The Milford Lake watershed RCPP project goal is to reduce watershed phosphorus loading with riparian area BMP prioritization based on the Milford Lake WRAPS watershed plan (table 1; Kansas Alliance for Wetlands and Streams, 2019; Unruh, 2020).
Table 1.
Mean annual loads and concentrations for total phosphorus and total nitrogen, Kansas Department of Health and Environment total maximum daily loads, and Watershed Restoration and Protection Strategy Kansas nonpoint source reduction goals for the Milford Lake watershed, Kansas.[Mean annual loads and concentrations based on data collected during 2008–12. TMDL, total maximum daily load; TP, total phosphorus; lb/yr, pound per year; µg/L, microgram per liter; --, no data; TN, total nitrogen]
Purpose and Scope
The purpose of this report is to quantify and characterize water-quality constituent concentrations and loads using models previously published in Leiker (2022) for the Republican River near Clay Center, Kansas (U.S. Geological Survey [USGS] station 06856600; hereinafter “Clay Center site”), located about 15 miles upstream from Milford Lake, during August 1, 2018, through July 31, 2023. Water-quality constituents of concern include suspended sediment (SS), TN, and TP and were selected for their relation to water supply and water-quality issues in Milford Lake, including nutrient and sediment transport, taste-and-odor events, potentially toxic cyano-HAB events, and subsequent downstream transport of contaminants. Water-quality monitoring is essential to measure nutrient load changes, maintain modeled relations, deliver data to the public in real time, and monitor potential changes that may be related to conservation efforts such as those implemented by the Milford Lake watershed RCPP in the Republican River. The water-quality information presented in this report is important to the Kansas Water Office because it quantifies and characterizes nutrient and sediment transport into Milford Lake. In addition, the methods and results used in this study contribute to understanding the effects of agricultural land-use practices on surface-water resources and could be applied to other sites regionally, nationally, and globally.
Description of Study Area
Milford Lake was constructed in 1967, has a maximum depth of 59 feet, has a mean depth of about 24 feet, and is the largest reservoir by surface area in Kansas at 15,498 acres (KDHE, 2014). Milford Lake has been listed as impaired and designated hypereutrophic by the KDHE under section 303(d) of the 1972 Clean Water Act (KDHE, 2022b).
During 2011–23, Milford Lake had HAB advisories during 11 out of 13 years (KDHE, 2023), and the annual number of days under a HAB advisory ranged from 7 to 135 (fig. 1). Milford Lake algal abundance substantially increased from 2009 to 2012 and was almost always dominated by cyanobacteria during 1991 through 2012 (KDHE, 2014). Reservoir capacity in 2009 was 11 percent less than the constructed capacity at a designed sedimentation rate of 1,730 acre-ft/yr (KDHE, 2014). The TN to TP ratio in Milford Lake varies between nitrogen limited and nitrogen and phosphorus colimited (KDHE, 2014).
The Lower Republican River watershed has a drainage area of 2,361 square miles (KDHE, 2014). The drainage area of the Lower Republican River watershed begins at Scandia, Kans. (USGS station 06854500; fig. 2), and continues about 10 river miles downstream from Milford Lake to where the Republican River and the Smoky Hill River combine to form the Kansas River (fig. 2). The drainage area for the Lower Republican River between Scandia and Clay Center, Kans., is 982 square miles. Land use in the Lower Republican River watershed is predominantly agriculture (fig. 2; Dewitz, 2023). Mean annual precipitation at Clay Center is 31.9 inches; most precipitation (23.5 inches, 74 percent) typically falls during the spring and summer (April 1 through September 30 for years 1991–2020; PRISM Climate Group, 2024). Thirty-year mean monthly normal temperatures range from 28.8 degrees Fahrenheit in January to 79.6 degrees Fahrenheit in July (for years 1991–2020; PRISM Climate Group, 2024).
KDHE listed the Clay Center site (fig. 2) as impaired water under section 303(d) of the 1972 Clean Water Act for total suspended solids, biology, Escherichia coli, eutrophication, and TP. The impairment affects river uses for aquatic life and recreation (KDHE, 2022b). All surface waters in this watershed are generally used for aquatic life support (fish), human health purposes, domestic water supply, recreation (fishing, boating, and swimming), groundwater recharge, industrial water supply, irrigation, or livestock watering (KDHE, 2022b).
Previous Investigations
The KDHE and USGS cooperative efforts in the Lower Republican River watershed have been ongoing because of recurring HAB events in Milford Lake since 2011. Foster and others (2019) evaluated agency differences in sampling location and methods for determining the HAB status of Milford Lake. Foster and others (2019) and Leiker and others (2021) assessed spatial and temporal variability of nutrients and algae in the Republican River and Milford Lake in 2016 and 2017–18, respectively. Leiker and others (2021) determined the Republican River was not contributing nutrients greater than concentrations detected in the main body of Milford Lake. Leiker (2022) documented linear regression models developed for SS, TP, TN, and total carbon concentrations at the Clay Center site (USGS station 06856600). The previously developed models were used in this report.
Methods
Continuous and discrete water-quality data were collected at the Clay Center site from August 2018 through July 2023. The annual periods are designated by the calendar year in which they end; for example, August 1, 2018, through July 31, 2019, is called 2019 for the purpose of this report. Streamflow, water temperature, specific conductance, pH, dissolved oxygen, and turbidity were measured continuously in stream. Discrete water-quality samples were collected over a range of streamflows (appendix 1, fig. 1.1). Previously published linear regression models (Leiker, 2022) were used to compute water-quality constituent concentrations and loads using continuous water-quality data.
Continuous Streamflow and Water-Quality Monitoring
Continuously measured (15-minute intervals) streamflow data were collected from August 2018 through July 2023 at the study site(s) according to standard USGS methods (Sauer and Turnipseed, 2010; Turnipseed and Sauer, 2010; Painter and Loving, 2015). Streamflow daily mean values were used for load computations because of occasional missing or deleted continuous streamflow data. Daily mean values were computed using an aggregated time-weighted average approach. If continuously measured streamflow data were missing within a 24-hour period, daily mean values were estimated, reviewed, and approved following Turnipseed and Sauer (2010) and Painter and Loving (2015).
Continuously measured (15-minute intervals) water-quality data were collected at the Clay Center site from August 2018 through July 2023 using a YSI, Inc., EXO multiparameter sonde (water-quality monitor) equipped with water temperature, specific conductance, pH, dissolved oxygen, and turbidity sensors (YSI, Inc., 2017). The water-quality monitor was suspended from the downstream side of the bridge at the Clay Center site in the Republican River thalweg. The water-quality monitor was operated and maintained according to USGS standard methods (Wagner and others, 2006; Bennett and others, 2014). Daily mean values were computed using an aggregated time-weighted average approach. Daily mean water-quality data were computed unless more than 25 percent of the continuously measured data were missing or the daily maximum or minimum values were not accurately represented. Continuously measured water-quality data were occasionally censored or not collected because of cold weather leading to ice conditions, water-quality monitor malfunctions, or routine maintenance visits. All streamflow and continuous water-quality data for the Clay Center site (USGS station 06856600) are available in near-real time (updated hourly) from the USGS National Water Information System database (USGS, 2023).
Discrete Water-Quality Sampling
Discrete water-quality samples were collected over a range of streamflow conditions at the Clay Center site during August 2018 through June 2023 using equal-width-increment collection techniques (appendix 1, fig. 1.1; table 2; as described in USGS [2006]). Samples were collected from the downstream side of the bridge using a Federal Interagency Sedimentation Project depth-integrated sampler with a Teflon bottle, cap, and nozzle. Discrete samples collected during low-flow conditions were collected as wading samples within 100 feet of the bridge. During conditions unsuitable for wading, samples were collected from the bridge using a manually operated reel. Subsamples collected from 10 equally horizontally spaced verticals were composited into a Teflon churn. Sample collection was generally completed in 1 hour or less. Concomitant water-quality data were collected near the water surface during discrete sampling at each cross-section sampling location. Discrete water-quality samples were collected monthly to biweekly, and sampling was generally more frequent during May through October.
Table 2.
Summary statistics for discrete sample data collected at the Republican River near Clay Center, Kansas (U.S. Geological Survey station 06856600), during August 1, 2018, through June 26, 2023.[Discrete water-quality data are available in the U.S. Geological Survey National Water Information System database (U.S. Geological Survey, 2023). n, number of samples; mg/L, milligram per liter]
Discrete water-quality samples were analyzed for total and particulate nitrogen and phosphorus species at the USGS National Water Quality Laboratory in Lakewood, Colorado, according to standard methods (Patton and Truitt, 1992, 2000; Fishman, 1993; U.S. Environmental Protection Agency, 1997; Patton and Kryskalla, 2003, 2011). TN was manually calculated as the sum of two components: dissolved nitrate plus nitrite (USGS parameter code 00631) and total Kjeldahl nitrogen (USGS parameter code 00625). Suspended-sediment concentration and percentage of fine particles less than 0.00625 millimeter in diameter, were analyzed at the USGS Iowa Sediment Laboratory in Iowa City, Iowa, using methods described by Guy (1969). All discrete water-quality sample data at the Clay Center site (USGS station 06856600) are available from the USGS National Water Information System database (USGS, 2023).
Quality Assurance and Quality Control of Continuous and Discrete Water-Quality Data
About 12.5 percent (229 days) of the daily turbidity values were unavailable during the period of analysis (table 3). Of those missing days, 58 percent were missing because of equipment removal during periods with ice formation on the river, 30 percent because of biofouling, and the remaining 12 percent because of other causes including equipment malfunction or vandalism.
Table 3.
Summary statistics for variables measured continuously at the Republican River near Clay Center, Kansas (U.S. Geological Survey station 06856600), during August 1, 2018, through July 31, 2023.[Continuous real-time water-quality data are available in the U.S. Geological Survey National Water Information System database (U.S. Geological Survey, 2023). n, number of measurements; ft3/s, cubic foot per second; °C, degrees Celsius; µS/cm, microsiemens per centimeter at 25 degrees Celsius; mg/L, milligram per liter; --, no data; FNU, formazin nephelometric units]
A subset of samples during April 2020 through December 2021 was collected using modified protocols because of the COVID-19 pandemic. Eight samples were collected by a single person using a modified clean hands/dirty hands technique (USGS, 2006) where gloves were frequently changed by the sample collector to avoid sample contamination. In total, 23 samples, including the previously described 8 samples, were processed using a modified clean hands/dirty hands technique by a single individual because of social distancing requirements. Results from blank and replicate samples (number of samples [n] = 3) collected during the period of affected samples did not indicate a bias from modified collection protocols.
All discrete sample results were reviewed and approved following USGS guidance (Rasmussen and others, 2014). Concurrent replicate samples were collected for about 10 percent of all discretely collected water-quality samples to characterize variability potentially introduced by sample collection techniques and analytical method (Rasmussen and others, 2014; Mueller and others, 2015). Relative percentage difference (RPD; Zar, 1999) was used to quantify variability among paired concurrent replicate samples. Quality-control objectives were considered met if the median RPDs of nutrient and suspended-sediment concentration concurrent replicate pairs were less than or equal to 10 percent. The median RPD of the TN concurrent replicate pairs collected from the Clay Center site during July 2018 through June 2023 was about 0.8 percent (n=4; minimum=0.4 percent; maximum=3.2 percent). The median RPD of the TP concurrent replicate pairs was about 1.5 percent (n=4; minimum=0.4 percent; maximum=2.5 percent). The median RPD of the SS concentration concurrent replicate pairs was about 2.8 percent (n=3; minimum=0.1 percent; maximum=9.6 percent). Four blank samples were collected during the study period (one per year), and all results except for one dissolved nitrate plus nitrite (USGS parameter code 00631) were less than the minimum reporting level (0.01 milligram per liter [mg/L]). The sample with a detection for dissolved nitrate plus nitrite was near the minimum reporting level.
Computation of Annual Constituent Concentrations and Loads
Computed annual total streamflow, in acre-feet, was computed using daily mean streamflow (in cubic feet per second), multiplied by a unit conversion factor (approximately 1.9835 to calculate load in acre-feet day) and summed over monthly and annual timesteps (table 4). The historical mean annual total streamflow for the Clay Center site was computed using the mean annual flow from water year 1917 through water year 2015 (a water year is the period from October 1 to September 30 and is designated by the year in which it ends) of 905 cubic feet per second (ft3/s; Granato and others, 2017), multiplied by a unit conversion, and then multiplied by 365 days for a standard year.
Concentrations and loads were computed from water-quality and streamflow data collected at the Clay Center site, about 15 miles upstream from Milford Lake, during August 2018 through July 2023. Daily concentrations of SS, TN, and TP were computed using previously published regression models (Leiker, 2022) and water-quality daily mean values. Daily mean streamflow and daily water-quality values were used to compute concentrations and loads for the analysis period because of unavailable instantaneous streamflow data and periods of unavailable continuously measured water-quality data. Constituent loads, in tons for SS and pounds for TN and TP, were calculated for August 1, 2018, through July 31, 2023, by multiplying computed daily concentrations (in milligrams per liter) by daily streamflow (in cubic feet per second) and a unit conversion factor (0.0027 to calculate the load in tons per day; 5.4 to calculate the load in pounds per day). Annual loads were calculated by summing the daily loads. Using daily mean values smooths some of the inherent variability in the denser continuous datasets; however, differences are expected to be minimal as evidenced by similar mean and median values between the continuous and daily mean water-quality datasets (table 3).
About 13 percent of the study period days did not have daily mean water-quality values (table 4); for these instances, values were computed using the Weighted Regressions on Time, Discharge, and Season method with Kalman filtering using default model parameters (WRTDS_K; Kalman, 1960; Hirsch and others, 2015) and substituted to maintain a complete daily record. Lee and others (2019) determined the WRTDS_K method generally produced the most accurate annual load estimates compared to other estimation methods using streamflow as an explanatory variable.
Table 4.
Computed monthly mean concentrations, total loads, and yields of streamflow, total nitrogen, total phosphorus, and suspended sediment at the Republican River near Clay Center, Kansas (U.S. Geological Survey station 06856600), during August 2018 through July 2023.[All concentrations and loads are estimated and rounded to standard significant figures. Yield is calculated using the contributing drainage area in the drainage basin upstream from U.S. Geological Survey station 06856600. Number of days with missing turbidity daily values and concentration and load estimates are substituted with Weighted Regressions on Time, Discharge, and Season method with Kalman filtering estimation. ft-3/s, cubic foot per second; mg/L, milligram per liter; lb, pound; lb/mi2, pound per square mile]
RPDs between turbidity-based linear regression and WRTDS_K estimates were computed to characterize the degree to which unavailable sensor values affected loads computed over the study period. The RPDs of the dataset median for TN, TP, and SS loads were 10, 4, and 8 percent, respectively, with linear regression computed loads being larger. Filtering the dataset to look only at loads computed during the range of streamflows with unavailable values yielded the same results. A Mann-Whitney Rank Sum test (Mann and Whitney, 1947) indicated no statistically significant differences (p-values>0.05) between total loads computed using different methods (TN [p=0.155], TP [p=0.14], SS [p=0.985]). The assumption can be made that the two methods produced statistically similar total loads for all constituents during the study period, and substituting daily loads from the WRTDS_K method for missing days is an acceptable and valid approach.
Continuous and Discretely Monitored Water-Quality Variables
Continuously measured streamflow ranged from 35 to 23,000 ft3/s with a mean of 968 ft3/s during the study period (table 3). Continuously measured water temperature ranged from −0.2 to 37.7 degrees Celsius (°C) with a mean of 15.6 °C during the study period (table 3). Continuously measured specific conductance ranged from 145 to 1,500 microsiemens per centimeter at 25 °C (µS/cm) and had a mean value of 881 µS/cm (table 3). Kansas aquatic-life-support criteria require that pH values in streams not measure less than 6.5 or more than 8.5 standard units (KDHE, 2022a). Continuously measured pH ranged from 7.2 to 9.4 and had a median of 8.4 during the analysis period (table 3). Measured pH was never lower than 6.5 but exceeded 8.5 about 21 percent of the time during the study period, primarily during low-flow conditions (fig. 3). Continuously measured dissolved-oxygen concentrations ranged from 3.3 to 18.8 mg/L and had a mean of 10 mg/L (table 3). Kansas aquatic-life-support criteria require that dissolved-oxygen concentrations are not less than 5.0 mg/L (KDHE, 2022a). Dissolved-oxygen concentrations were less than the minimum aquatic-life-support criterion less than 1 percent of the time and generally were detected during periods of increased water temperature (greater than 20 °C; fig. 3). Dissolved oxygen is an important factor for the survival of aquatic organisms (USGS, 2020). Continuously measured turbidity ranged from 1.3 to 1,080 formazin nephelometric units and had a mean of 74.0 formazin nephelometric units (table 3).
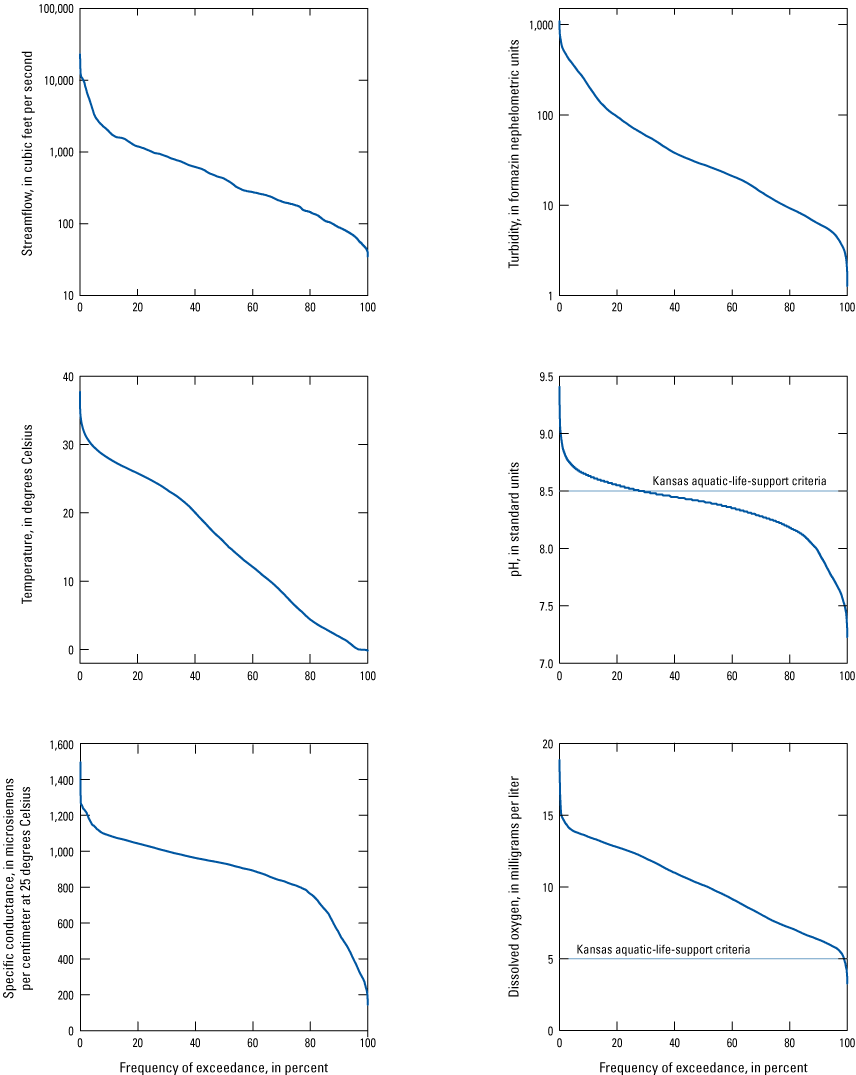
Duration curves for continuously measured constituents at the Republican River near Clay Center, Kansas (U.S. Geological Survey station 06856600), August 1, 2018, through July 31, 2023.
Discrete water-quality samples were analyzed for TN, TP, and SS. TN concentrations (n=63) ranged from 0.51 to 10.6 mg/L with a mean of 2.77 mg/L (table 2). TP concentrations (n=63) ranged from 0.15 to 2.43 mg/L with a mean of 0.67 mg/L (table 2). SS concentrations (n=61) ranged from 5.0 to 2,350 mg/L with a mean of 405 mg/L (table 2). Although TP and TN did have new maximum and minimum values, mean values of TN, TP, and SS did not vary substantially from the datasets that were used to develop the linear regression models (Leiker, 2022).
Concentrations and loads for TN, TP, and SS were primarily computed using previously developed linear regression models (Leiker, 2022). Since publication of the models, 20 additional discrete samples have been collected at the Clay Center site during April 2021 through June 2023. These samples were not included in the original model calibration dataset for model development but were compared to model estimated concentrations. Of the 20 samples collected after model development, 6 TN, 2 TP, and 3 SS samples plotted outside the 90-percent prediction interval (appendix 1, fig. 1.2). All samples that plotted outside of the prediction intervals were new minimum or maximum values or near the upper or lower range for the sample dataset. In general, for the model validation results, model predicted values tended to overestimate concentrations compared to observed values in the lower range of conditions, and model predicted values near the upper range tended to underpredict observed concentrations. The potential effect on this analysis could result in underestimated loads. Future analyses would benefit from updated linear models to account for a greater range of observed conditions.
Computed Concentrations, Loads, and Comparison to Watershed Goals
Annual total streamflows ranged from 76,400 to 1,650,000 acre-ft/yr (table 4). Compared to the historical mean annual total streamflow at the Clay Center site, annual total streamflows in 2019–20 were 1.7–2.5 times greater than historical mean annual total streamflow and 2021–23 streamflows were less than the historical mean annual total streamflow by 25–88 percent (fig. 4). TN, TP, and SS concentrations and loads were monitored for their relation to water supply an water-quality issues in Milford Lake, including nutrient and sediment transport, taste-and-odor events, potentially toxic cyano-HAB events, and subsequent downstream transport of contaminants.
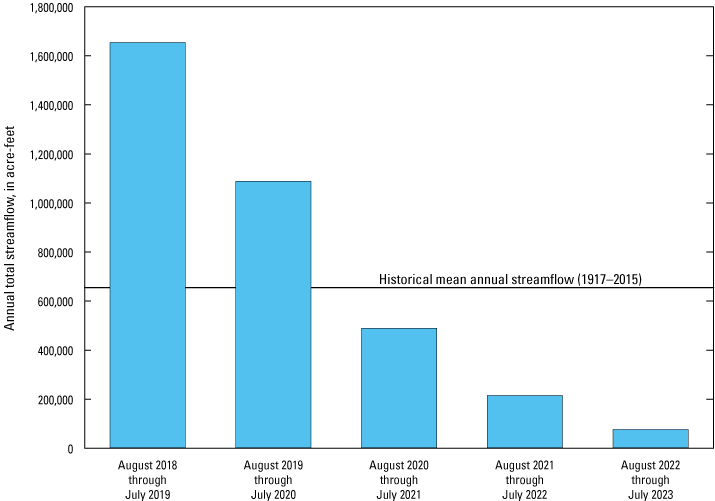
Annual total streamflows at the Republican River near Clay Center, Kansas (U.S. Geological Survey station 06856600), during August 2018 through July 2023. Data summarized from U.S. Geological Survey (2023); historical mean annual streamflow from Granato and others (2017).
All constituents of interest (TN, TP, and SS) had the smallest annual mean concentrations and loads in 2023 and the largest in 2019. Annual mean TN concentrations ranged from 1.40 to 2.62 mg/L with a study mean of 2.04 mg/L. Annual mean TP concentrations ranged from 0.34 to 0.61 mg/L with a study mean of 0.47 mg/L. Annual mean SS concentrations ranged from 69 to 365 mg/L with a study mean of 210 mg/L. Total annual loads for TN ranged from 336,000 to 17,000,000 lb with a study total load of 30,800,000 lb. Total annual loads for TP ranged from 80,900 to 4,600,000 lb with a study total load of 7,860,000 lb. Total annual loads for SS ranged from 12,300 to 1,810,000 tons with a study total load of 2,810,000 tons (table 4).
Annual loads of TN, TP, and SS for the study period are compared to TMDL-defined mean annual loads from 2008 to 2012, Kansas nonpoint source reduction goals defined by WRAPS, and TMDL-defined watershed reduction goals in figures 5–7 (KDHE, 2014; Kansas Alliance for Wetlands and Streams, 2019). TN and TP annual loads were greater than the TMDL-defined mean annual load during 2019–20 and less than the TMDL-defined mean annual load during 2021–23 (figs. 5–6; KDHE, 2014). The study mean annual loads (August 2018 through July 2023) for TN and TP were greater than the TMDL-defined mean annual load and exceeded the watershed reduction goals and the Kansas nonpoint source reduction goals (KDHE, 2014; Kansas Alliance for Wetlands and Streams, 2019). Annual loads of TN and TP were below the Kansas nonpoint source reduction goal in 2022 and below the watershed reduction goal in 2023.
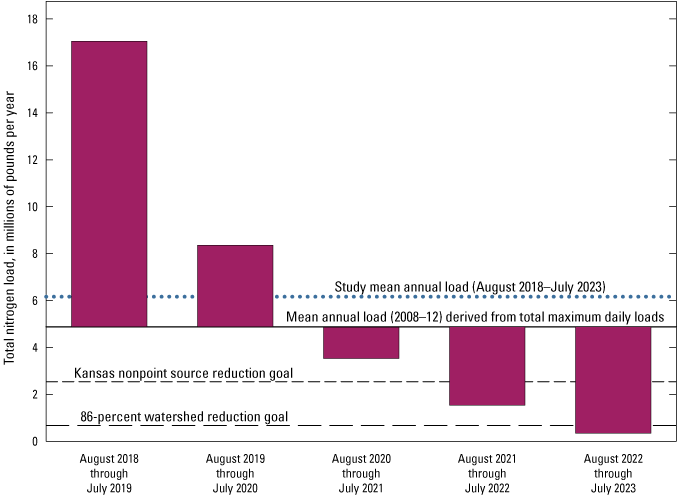
Annual total nitrogen loads at the Republican River near Clay Center, Kansas (U.S. Geological Survey station 06856600), during August 2018 through July 2023.
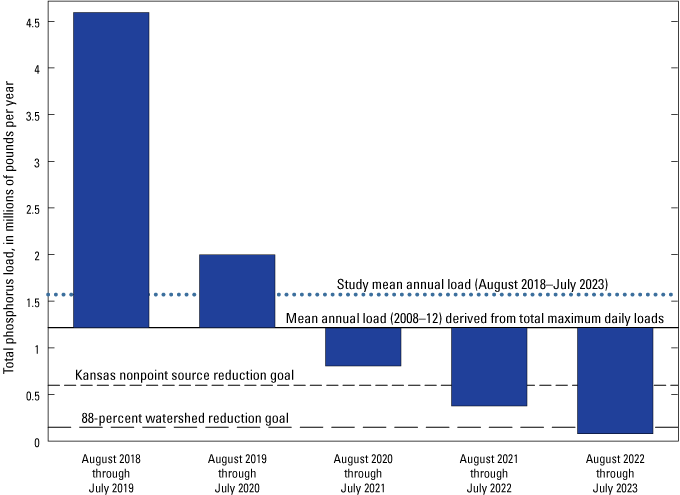
Annual total phosphorus loads at the Republican River near Clay Center, Kansas (U.S. Geological Survey station 06856600), during August 2018 through July 2023.
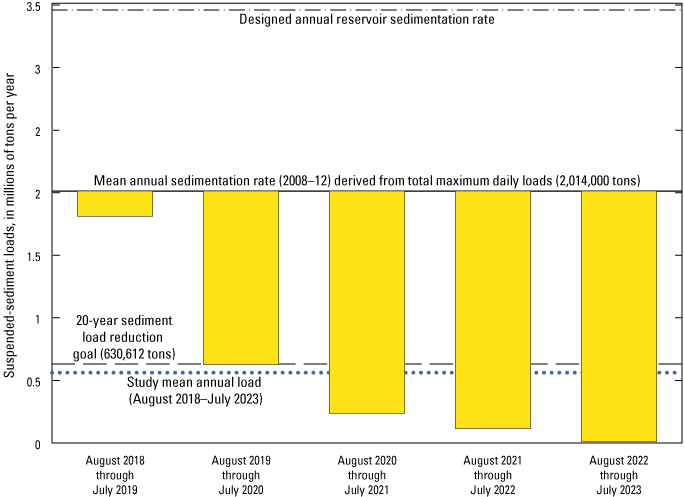
Annual suspended-sediment loads at the Republican River near Clay Center, Kansas (U.S. Geological Survey station 06856600), during August 2018 through July 2023.
Annual mean streamflow during the study period ranged from 2,270 ft3/s in 2019 to 105 ft3/s in 2023. Compared to flow-duration streamflow statistics for the Clay Center site, those annual mean streamflows correspond to the approximately 7 and 90 percent exceedance rates, respectively (table 4; appendix 1, fig. 1.1; Granato and others, 2017). The data collected during the study period represent a wide range of conditions at the Clay Center site with the first year (2019) representative of high-flow conditions with frequent runoff and the last year (2023) representative of low-flow conditions with less frequent runoff. About 51, 58, and 68 percent of the total loads were delivered during the top 5 percent of loading days (91 days) for TN, TP, and SS, respectively. Nutrient reduction goals were only met in the final 2 years of the study period when annual mean flow conditions were lower than normal, indicating that goals may not be met during average or high-flow conditions (figs. 5–6). The wide range of flows captured during this study would allow for future comparison to varying flow conditions. Continued data collection could allow further investigation regarding the attainability of the nutrient reduction goals under different flow regimes.
SS loads were less than the TMDL-computed mean annual sedimentation rate for the entirety of the study period and much less than the designed annual reservoir sedimentation rate (August 2018 through July 2023; fig. 7; KDHE, 2014). In all years except 2019, the annual mean SS load, in addition to the study mean, was at or below the 20-year sediment load reduction target (Kansas Alliance for Wetlands and Streams, 2019). Given the substantial range of annual flow conditions combined with the annual SS loads frequently not exceeding the 20-year target during the study period, it is likely the sediment load reduction target is attainable under similar streamflow conditions.
Despite periods of increased runoff and nutrient loading into Milford Lake (figs. 4–6), no HABs were reported or detected during 2018–19 (fig. 1). Data collection and analysis efforts to compare inflow and nutrient loading at the Clay Center site to subsequent HAB formation and severity in Milford Lake is beyond the scope of this report. However, increased nutrient loading and availability of nutrients may support formation and proliferation of HABs (Anderson and others, 2002; Watson and others, 2015). The lack of reported or detected HABs during the period of increased runoff could be attributed to short water residence times that precluded sustained algal growth. HABs may also not have been observed due to increased runoff events causing system alterations (shifts in food webs, habitat changes, light limitations because of increased turbidity, and so on) that affect the extent to which HABs can accumulate; and (or) the timing, distribution, and bioavailability of the external nutrient load (Heisler and others, 2008; Roelke and Pierce, 2011; Watson and others, 2015).
Although annual loads at the Clay Center site generally decreased during the study period (figs. 5–7), corresponding reductions in annual streamflows (fig. 4) indicate that these reductions may primarily be related to less frequent runoff from the upstream basin. To better quantify the degree to which trends in constituent loads may be related to changes in upstream landscape practices, a flow-normalized procedure such as that used in the Weighted Regressions on Time, Discharge, and Season package is often recommended (Hirsch and others, 2010; Hirsch and De Cicco, 2015). Quantification of potential nonpoint source trends in water-quality generally require the collection of streamflow and water-quality data over decades (Hirsch and others, 2010). Continued water-quality monitoring and tracking of BMPs will be helpful to understand the success of RCPP efforts to reduce nutrient transport in the Milford Lake watershed.
Summary
Milford Lake, the largest reservoir by surface area in Kansas, has had confirmed harmful algal blooms every summer from 2011 to 2017 and 2020 to 2023. Milford Lake has been listed as impaired and designated hypereutrophic under section 303(d) of the 1972 Clean Water Act. Kansas Department of Health and Environment developed a nutrient total maximum daily load (TMDL) for Milford Lake eutrophication and dissolved oxygen impairments in 2014. The Watershed Restoration and Protection Strategy for the Lower Republican watershed was developed to outline a plan of restoration and protection goals and actions for the surface waters of the watershed. In 2018, the Regional Conservation Partnership Program for the Milford Lake watershed was funded by the Natural Resources Conservation Service, focusing on advancing implementation of best management practices in the Lower Republican River watershed.
Continuous and discrete water-quality data were collected at the Republican River at the Clay Center site from August 2018 through July 2023 from a range of streamflow conditions. Streamflow and in situ water-quality data were used to compute total nitrogen (TN), total phosphorus (TP), and suspended sediment (SS) concentrations and loads using previously developed linear regression models. TN, TP, and SS concentrations and loads were evaluated relative to water supply and water-quality issues in Milford Lake, including nutrient and sediment transport, taste-and-odor events, potentially toxic cyano-harmful algal bloom events, and subsequent downstream transport of contaminants.
The data collected during the study period represent a wide range of conditions at the Clay Center site; the first year (2019) was representative of high-flow conditions with frequent runoff and the last year (2023) was representative of low-flow conditions with less frequent runoff. TN and TP annual loads were greater than the TMDL-defined mean annual load during 2019–20 and less than the TMDL-defined mean annual load during 2021–23. The study mean annual loads (August 2018 through July 2023) for TN and TP were greater than the TMDL-defined mean annual load and exceeded the watershed reduction goals and the Kansas nonpoint source reduction goals. TN and TP annual loads fell below the Kansas nonpoint source reduction goal in 2022 and below the watershed reduction goal in 2023. Nutrient reduction goals were only met in the final 2 years of the study period when annual mean flow conditions were lower than normal, indicating the goals may be difficult to attain during average or high-flow conditions. SS loads were less than the TMDL-computed mean annual sedimentation rate for the entirety of the study period and much less than the designed annual reservoir sedimentation rate. With the exception of 2019, the mean annual SS load was less than the 20-year sediment load reduction target.
Although annual loads at the Clay Center site generally decreased over time, corresponding reductions in annual streamflow indicate that these reductions may primarily be related to less frequent runoff from the upstream basin. Quantification of potential nonpoint source trends in water quality generally require the collection of streamflow and water-quality data over decades. Continued water-quality monitoring and tracking of best management practices would be helpful to understand the success of Regional Conservation Partnership Program efforts to reduce nutrient transport in the Milford Lake watershed.
References Cited
Anderson, D.M., Glibert, P.M., and Burkholder, J.M., 2002, Harmful algal blooms and eutrophication—Nutrient sources, composition, and consequences: Estuaries, v. 25, p. 704–726, accessed April 10, 2024, at https://doi.org/10.1007/BF02804901.
Bennett, T.J., Graham, J.L., Foster, G.M., Stone, M.L., Juracek, K.E., Rasmussen, T.J., and Putnam, J.E., 2014, U.S. Geological Survey quality-assurance plan for continuous water-quality monitoring in Kansas, 2014: U.S. Geological Survey Open-File Report 2014–1151, 34 p. plus 15 appendixes, accessed November 2023 at https://doi.org/10.3133/ofr20141151.
Dewitz, J., 2023, National Land Cover Database (NLCD) 2021 products: U.S. Geological Survey data release, accessed April 10, 2024, at https://doi.org/10.5066/P9JZ7AO3.
Fishman, M.J., ed., 1993, Methods of analysis by the U.S. Geological Survey National Water Quality Laboratory—Determination of inorganic and organic constituents in water and fluvial sediments: U.S. Geological Survey Open-File Report 93–125, 217 p. [Also available at https://doi.org/10.3133/ofr93125.]
Foster, G.M., Graham, J.L., and King, L.R., 2019, Spatial and temporal variability of harmful algal blooms in Milford Lake, Kansas, May through November 2016: U.S. Geological Survey Scientific Investigations Report 2018–5166, 36 p., accessed April 10, 2024, at https://doi.org/10.3133/sir20185166.
Granato, G.E., Ries, K.G., III, and Steeves, P.A., 2017, Compilation of streamflow statistics calculated from daily mean streamflow data collected during water years 1901–2015 for selected U.S. Geological Survey streamgages: U.S. Geological Survey Open-File Report 2017–1108, 17 p., accessed April 10, 2024, at https://doi.org/10.3133/ofr20171108.
Guy, H.P., 1969, Laboratory theory and methods for sediment analysis: U.S. Geological Survey Techniques of Water-Resources Investigations, book 5, chap. C1, 58 p. [Also available at https://doi.org/10.3133/twri05C1.]
Heisler, J., Glibert, P., Burkholder, J., Anderson, D., Cochlan, W., Dennison, W., Gobler, C., Dortch, Q., Heil, C., Humphries, E., Lewitus, A., Magnien, R., Marshall, H., Sellner, K., Stockwell, D., Stoecker, D., Suddleson, M., 2008, Eutrophication and harmful algal blooms—A scientific consensus: Harmful Algae, v. 8 no. 1, p. 3–13, accessed July 11, 2024, at https://doi.org/10.1016/j.hal.2008.08.006.
Hirsch, R.M., Archfield, S.A., and De Cicco, L.A., 2015, A bootstrap method for estimating uncertainty of water quality trends: Environmental Modelling & Software, v. 73, p. 148–166. [Also available at https://doi.org/10.1016/j.envsoft.2015.07.017.]
Hirsch, R.M., and De Cicco, L.A., 2015, User guide to Exploration and Graphics for RivEr Trends (EGRET) and dataRetrieval—R packages for hydrologic data (ver. 2.0, February 5, 2015): U.S. Geological Survey Techniques and Methods, book 4, chap. A10, 93 p., accessed December 2023 at https://doi.org/10.3133/tm4A10.
Hirsch, R.M., Moyer, D.L., and Archfield, S.A., 2010, Weighted regressions on time, discharge, and season (WRTDS), with an application to Chesapeake Bay River inputs: Journal of the American Water Resources Association, v. 46, no. 5, p. 857–880, accessed December 2023 at https://doi.org/10.1111/j.1752-1688.2010.00482.x.
Kalman, R.E., 1960, A new approach to linear filtering and prediction problems: Journal of Basic Engineering, v. 82, no. 1, p. 35–45. [Also available at https://doi.org/10.1115/1.3662552.]
Kansas Alliance for Wetlands and Streams, 2019, Milford Reservoir—Watershed restoration and protection strategy—Lower Republican watershed: Kansas Alliance for Wetlands and Streams, 214 p., accessed December 2023 at https://kswraps.org/wp-content/uploads/2020/10/Milford-WRAPS-Plan-Update-2018-Final.pdf.
Kansas Department of Health and Environment [KDHE], 2014, Kansas-Lower Republican Basin total maximum daily load: Kansas Department of Health and Environment, 57 p., accessed October 2023 at https://www.kdhe.ks.gov/DocumentCenter/View/14056/Milford-Lake-EU-PDF.
Kansas Department of Health and Environment [KDHE], 2022a, Kansas surface water quality standards: Kansas Department of Health and Environment, Bureau of Water, 107 p., accessed December 2023 at https://www.kdhe.ks.gov/DocumentCenter/View/27075/Kansas-Surface-Water-Quality-Standards-2022-PDF.
Kansas Department of Health and Environment [KDHE], 2022b, 303(d) List of all impaired and potentially impaired waters: Kansas Department of Health and Environment, 70 p. [Also available at https://www.kdhe.ks.gov/DocumentCenter/View/22777/2022-303d-List-PDF?bidId=.]
Kansas Department of Health and Environment [KDHE], 2023, KDHE HABs historical data: Kansas Department of Health and Environment web page, accessed November 12, 2023, at https://www.kdhe.ks.gov/829/KDHE-HABs-Historical-Data.
Kansas Water Office, 2023, Milford Lake Watershed Regional Conservation Partnership Program: Milford Watershed Regional Conservation Partnership Program web page, accessed December 2023 at https://www.milfordwatershed.org/rcpp.
Lee, C.J., Hirsch, R.M., and Crawford, C.G., 2019, An evaluation of methods for computing annual water-quality loads: U.S. Geological Survey Scientific Investigations Report 2019–5084, 59 p., accessed April 10, 2024, at https://doi.org/10.3133/sir20195084.
Leiker, B.M., 2022, Linear regression model documentation for computing water-quality constituent concentrations using continuous real-time water-quality data for the Republican River, Clay Center, Kansas, July 2018 through March 2021: U.S. Geological Survey Scientific Investigations Report 2022–5016, 13 p., accessed April 10, 2024, at https://doi.org/10.3133/sir20225016.
Leiker, B.M., Abel, J.R., Graham, J.L., Foster, G.M., King, L.R., Stiles, T.C., and Buley, R.P., 2021, Spatial and temporal variability of nutrients and algae in the Republican River and Milford Lake, Kansas, June through November 2017 and May through November 2018: U.S. Geological Survey Scientific Investigations Report 2020–5135, 53 p., accessed April 10, 2024, at https://doi.org/10.3133/sir20205135.
Mann, H.B., and Whitney, D.R., 1947, On a test of whether one of two random variables is stochastically larger than the other: Annals of Mathematical Statistics, v. 18, no. 1, p. 50–60, accessed October 2019 at https://doi.org/10.1214/aoms/1177730491.
Mueller, D.K., Schertz, T.L., Martin, J.D., and Sandstrom, M.W., 2015, Design, analysis, and interpretation of field quality-control data for water-sampling projects: U.S. Geological Survey Techniques and Methods, book 4, chap. C4, 54 p., accessed November 2023 at https://doi.org/10.3133/tm4C4.
Painter, C.C., and Loving, B.L., 2015, U.S. Geological Survey quality-assurance plan for surface-water activities in Kansas, 2015: U.S. Geological Survey Open-File Report 2015–1074, 33 p., accessed June 17, 2021, at https://doi.org/10.3133/ofr20151074.
Patton, C.J., and Kryskalla, J.R., 2003, Methods of analysis by the U.S. Geological Survey National Water Quality Laboratory—Evaluation of alkaline persulfate digestion as an alternative to Kjeldahl digestion for determination of total and dissolved nitrogen and phosphorus in water: U.S. Geological Survey Water-Resources Investigations Report 2003–4174, 33 p. [Also available at https://doi.org/10.3133/wri034174.]
Patton, C.J., and Kryskalla, J.R., 2011, Colorimetric determination of nitrate plus nitrite in water by enzymatic reduction, automated discrete analyzer methods: U.S. Geological Survey Techniques and Methods, book 5, chap. B8, 34 p. [Also available at https://doi.org/10.3133/tm5B8.]
Patton, C.J., and Truitt, E.P., 1992, Methods of analysis by the U.S. Geological Survey National Water Quality Laboratory—Determination of total phosphorus by a Kjeldahl digestion method and an automated colorimetric finish that includes dialysis: U.S. Geological Survey Open-File Report 92–146, 39 p. [Also available at https://doi.org/10.3133/ofr92146.]
Patton, C.J., and Truitt, E.P., 2000, Methods of analysis by the U.S. Geological Survey National Water Quality Laboratory—Determination of ammonium plus organic nitrogen by a Kjeldahl digestion method and an automated photometric finish that includes digest cleanup by gas diffusion: U.S. Geological Survey Open-File Report 2000–170, 31 p. [Also available at https://doi.org/10.3133/ofr00170.]
PRISM Climate Group, 2024, Time series values for individual locations: PRISM Climate Group, Oregon State University web page, accessed February 2024 at https://www.prism.oregonstate.edu/explorer/.
Rasmussen, T.J., Bennett, T.J., Stone, M.L., Foster, G.M., Graham, J.L., and Putnam, J.E., 2014, Quality-assurance and data-management plan for water-quality activities in the Kansas Water Science Center, 2014: U.S. Geological Survey Open-File Report 2014–1233, 41 p., accessed November 2023 at https://doi.org/10.3133/ofr20141233.
Roelke, D.L., and Pierce, R.H., 2011, Effects of inflow on harmful algal blooms—Some considerations: Journal of Plankton Research, v. 33, no. 2, p. 205–209, accessed April 10, 2024, at https://doi.org/10.1093/plankt/fbq143.
Sauer, V.B., and Turnipseed, D.P., 2010, Stage measurement at gaging stations: U.S. Geological Survey Techniques and Methods, book 3, chap. A7, 45 p., accessed June 17, 2021, at https://doi.org/10.3133/tm3A7.
Turnipseed, D.P., and Sauer, V.B., 2010, Discharge measurements at gaging stations: U.S. Geological Survey Techniques and Methods, book 3, chap. A8, 87 p., accessed June 17, 2021, at https://doi.org/10.3133/tm3A8.
Unruh, M., [2020], Building local partnerships to implement collaborative conservation programs: The Milford Lake Watershed Regional Conservation Partnership Program (RCPP)—Great Plains and Midwest Harmful Algal Blooms Conference, Overland Park, Kans., [February 4–5, 2020], 13-slide presentation, accessed December 2023 at https://www.epa.gov/sites/default/files/2020-03/documents/1.2.2_unruh_greatplainshab_milfordrcpp_020420_mu.pdf.
U.S. Environmental Protection Agency, 1997, Method 440.0—Determination of carbon and nitrogen in sediments and particulates of estuarine/coastal waters using elemental analysis (revision 1.4): Cincinnati, Ohio, U.S. Environmental Protection Agency, 10 p., accessed November 2023 at https://permanent.fdlp.gov/lps68138/m440_0.pdf.
U.S. Geological Survey [USGS], 2006, Collection of water samples (ver. 2.0, September 2006): U.S. Geological Survey Techniques of Water-Resources Investigations, book 9, chap. A4, 166 p., accessed June 17, 2021, at https://doi.org/10.3133/twri09A4.
U.S. Geological Survey [USGS], 2020, Dissolved oxygen: U.S. Geological Survey Techniques and Methods, book 9, chap. A6.2, 33 p. [Also available at https://doi.org/10.3133/tm9A6.2 Supersedes USGS Techniques of Water Resources Investigations, book 9, chap. A6.2, version 3.0.]
U.S. Geological Survey [USGS], 2023, USGS water data for the Nation: U.S. Geological Survey National Water Information System database, accessed December 2023 at https://doi.org/10.5066/F7P55KJN.
Wagner, R.J., Boulger, R.W., Jr., Oblinger, C.J., and Smith, B.A., 2006, Guidelines and standard procedures for continuous water-quality monitors—Station operation, record computation, and data reporting: U.S. Geological Survey Techniques and Methods, book 1, chap. D3, 51 p. plus 8 attachments, accessed October 2023 at https://doi.org/10.3133/tm1D3. [Supersedes USGS Water-Resources Investigations Report 2000–4252.]
Watson, S.B., Whitton, B.A., Higgins, S.N., Paerl, H.W., Brooks, B.W., and Wehr, J.D., 2015, Harmful algal blooms, in Freshwater Algae of North America (2d ed): Cambridge, Mass., Academic Press, p. 873–920, accessed April 10, 2024, at https://doi.org/10.1016/B978-0-12-385876-4.00020-7.
YSI, Inc., 2017, EXO user manual—Advanced water quality monitoring platform (rev. K): Yellow Springs, Ohio, YSI, Inc., 154 p., accessed October 2023 at https://www.ysi.com/file%20library/documents/manuals/exo-user-manual-web.pdf.
{ label needed for book-app[@id='a1'] }
Appendix 1. Supplemental Data for Discrete Water-Quality Samples Collected at the Republican River near Clay Center, Kansas
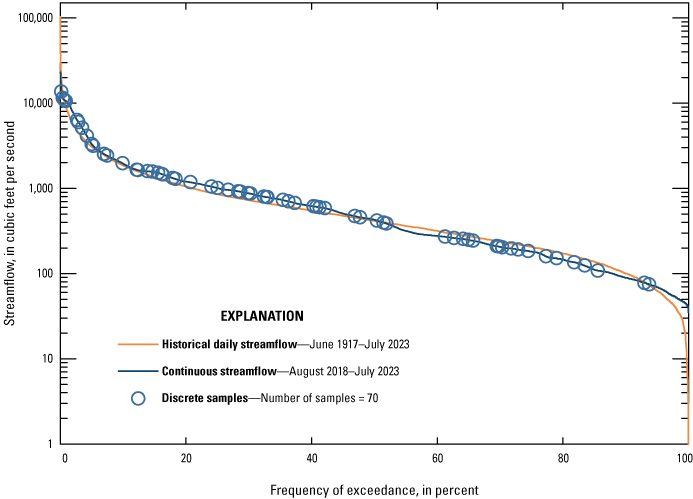
Streamflow duration curve and discrete water-quality samples collected at the Republican River near Clay Center, Kansas (U.S. Geological Survey station 06856600), during August 2018 through July.
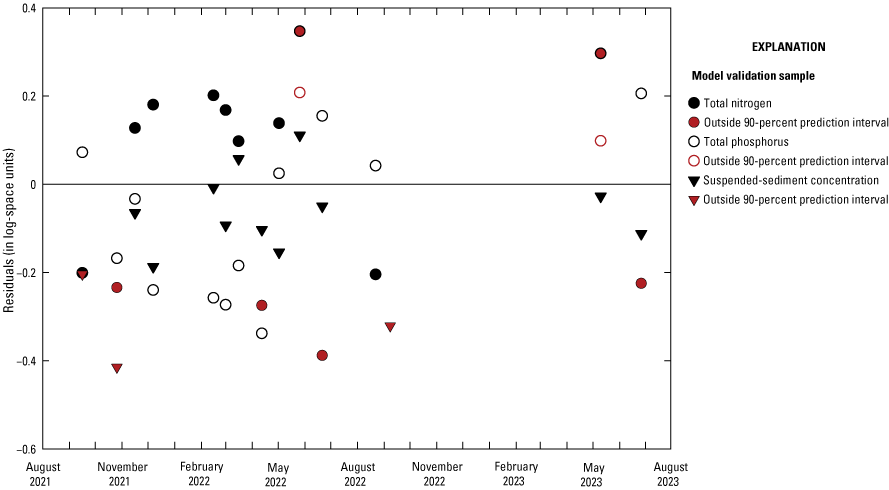
Model validation sample residuals for total nitrogen, total phosphorus, and suspended-sediment concentration.
Conversion Factors
U.S. customary units to International System of Units
Temperature in degrees Fahrenheit (°F) may be converted to degrees Celsius (°C) as follows:
°C = (°F – 32) / 1.8.
Supplemental Information
Specific conductance is given in microsiemens per centimeter at 25 degrees Celsius (µS/cm at 25 °C).
Concentrations of chemical constituents in water are given in milligrams per liter (mg/L).
Loads of chemical constituents are given in either short tons or pounds (lb).
A water year is the period from October 1 to September 30 and is designated by the year in which it ends; for example, water year 2015 was from October 1, 2014, to September 30, 2015.
Abbreviations
BMPs
best management practices
HAB
harmful algal bloom
KDHE
Kansas Department of Health and Environment
n
number of samples
RCPP
Regional Conservation Partnership Program
RPD
relative percentage difference
SS
suspended sediment
TMDL
total maximum daily load
TN
total nitrogen
TP
total phosphorus
USGS
U.S. Geological Survey
WRAPS
Watershed Restoration and Protection Strategy
WRTDS_K
Weighted Regressions on Time, Discharge, and Season method with Kalman filtering
For more information about this publication, contact:
Director, USGS Kansas Water Science Center
1217 Biltmore Drive
Lawrence, KS 66049
785–842–9909
For additional information, visit: https://www.usgs.gov/centers/kswsc.
Publishing support provided by the Rolla Publishing Service Center
Disclaimers
Any use of trade, firm, or product names is for descriptive purposes only and does not imply endorsement by the U.S. Government.
Although this information product, for the most part, is in the public domain, it also may contain copyrighted materials as noted in the text. Permission to reproduce copyrighted items must be secured from the copyright owner.
Suggested Citation
Kramer, A.R., and Abel, J.R., 2024, Water-quality constituent concentrations and loads computed using real-time water-quality data for the Republican River, Clay Center, Kansas, August 2018 through July 2023: U.S. Geological Survey Scientific Investigations Report 2024–5072, 21 p., https://doi.org/10.3133/sir20245072.
ISSN: 2328-0328 (online)
Study Area
| Publication type | Report |
|---|---|
| Publication Subtype | USGS Numbered Series |
| Title | Water-quality constituent concentrations and loads computed using real-time water-quality data for the Republican River, Clay Center, Kansas, August 2018 through July 2023 |
| Series title | Scientific Investigations Report |
| Series number | 2024-5072 |
| DOI | 10.3133/sir20245072 |
| Publication Date | August 15, 2024 |
| Year Published | 2024 |
| Language | English |
| Publisher | U.S. Geological Survey |
| Publisher location | Reston, VA |
| Contributing office(s) | Kansas Water Science Center |
| Description | Report: v, 21 p.; Dataset |
| Country | United States |
| State | Kansas |
| Other Geospatial | Clay Center, Republican River |
| Online Only (Y/N) | Y |
| Additional Online Files (Y/N) | N |


