

Comparison of Water Quality in Shallow Groundwater Near Agricultural Areas in the Delaware Coastal Plain, 2014 and 2019
Links
- Document: Report (4.47 MB pdf) , HTML , XML
- NGMDB Index Page: National Geologic Map Database Index Page (html)
- Download citation as: RIS | Dublin Core
Acknowledgments
The authors wish to extend special thanks to Michael Scuse of the Delaware Department of Agriculture (DDA) for initiating and supporting this study. Thanks to Michael Brownley and Deborah Bringman of the U.S. Geological Survey (USGS) for collecting much of the data for this report. The authors appreciate the assistance of Andrew Sekellick in writing this report and reviews by Chris Brosch of DDA as well as Matthew Conlon, Judy Denver (emeritus), and Scott Ator of the USGS.
Abstract
The State of Delaware has encouraged agricultural conservation practices to improve nutrient uptake by crops and mitigate nutrient transport to groundwater in the surficial aquifer. To study recent changes in groundwater quality, the U.S. Geological Survey and the Delaware Department of Agriculture (DDA) developed a network of shallow wells near agricultural areas throughout the Delaware Coastal Plain. This network was designed to characterize water quality related to agricultural practices and to detect any recent changes in shallow groundwater quality, in particular groundwater nitrate concentrations. The shallow well network was first sampled in 2014 and resampled in 2019. In 2019, field parameters (including dissolved oxygen, pH, specific conductance, and temperature), major ions, nutrients, stable isotopes of water, and isotopes of nitrate were measured in groundwater samples collected between October and December. Wells were organized into three groups based on their geochemical characteristics measured in 2014: the Agricultural, Urban, and Mixed Groups. Results from the 2019 sampling showed little change in water quality from the 2014 sampling. Land-use factors continued to be the driving influence between groups. Groundwater moves slowly and changes in groundwater quality are likely to respond slowly to changes in conservation practices. Continued sampling of both groundwater quality in this network and monitoring land management practices can help detect groundwater quality trends in the future.
Introduction
Delaware’s surficial aquifer provides a readily available source of water for the state but is sensitive to chemistry changes driven by land management (Ator and Denver, 2012; Masterson and others, 2016; Fleming and others, 2017). Groundwater from the surficial aquifer provides drinking water to rural and urban residents, irrigation for farms, baseflow to streams, and water for thermoelectric generation and industry (Dieter and others, 2018). As the dominant source of surface water within the state, the surficial aquifer also plays a critical role in controlling water quality in streams, rivers, and estuaries like the Delaware Bay and Chesapeake Bay.
Water quality within the surficial aquifer is susceptible to leaching of chemicals applied to or near the land surface because of its shallow water table, generally transmissive sandy sediments, and Delaware’s abundant rainfall. These factors create a strong hydrologic connection between the land surface and the surficial aquifer (Fleming and others, 2017). Land management decisions that lead to changes in the water chemistry of the surficial aquifer, such as nutrient applications for crop growth or deicing agents on roadways, are well reported across the greater Peninsula of Delaware, Maryland, and Virginia (referred to hereafter as the Delmarva Peninsula) (Denver, 1986; Denver, 1989; Andres, 1991; Shedlock and others, 1999; Blaier and Baxter, 2000; Denver and others, 2004; Debrewer and others, 2008; Denver and others, 2018; Lindsey and others, 2023). Dissolved constituents in groundwater can travel through the aquifer to wells used for public and domestic drinking-water supplies. A previous study on public-supply wells screened in the surficial aquifer detected nitrate in 90 percent of the wells sampled and a median nitrate concentration of 5.2 milligrams per liter (mg/L); pesticides or pesticide derivatives were also detected in many wells (Reyes, 2010). A national analysis of historical groundwater quality data by the U.S. Geological Survey (USGS) National Water Quality Program (NWQP) characterized the unconfined North Atlantic Coastal Plain on the Delmarva Peninsula as being moderately to highly susceptible to changes in nitrate concentration because of short groundwater flow paths and generally oxic conditions (McMahon, 2012).
Much of Delaware’s annual streamflow is provided by groundwater discharging to streams, making groundwater the dominant source of nitrate in streams and coastal waters (Andres, 1992; Ullman and others, 2007; Ator and Denver, 2012). Nitrate is a soluble, negative ion (NO3-) that is easily transported through the root zone to groundwater and is unlikely to bind to soil, which generally has a negative charge (Weil and Brady, 2017). Nitrate may be consumed and converted into dinitrogen (N2) gas by microorganisms in groundwater through a process called denitrification; however, this process is anaerobic and is generally limited to anoxic waters. In oxic groundwater, nitrate is generally preserved over the flow path and delivered to streams. Nitrate in groundwater is a concern to the State of Delaware as elevated nitrate concentrations may affect the suitability of water for human consumption (Schullehner and others, 2018; Ward and others, 2018; Deridder and others, 2021) and is linked to adverse environmental outcomes (Ator and Denver, 2012). Controlling groundwater quality is integral to managing surface-water quality. The surficial aquifer of Delaware contains both oxic groundwater, which allows for nitrogen transport to streams, and low carbon concentrations, which are related to higher baseflow nitrate values and reduced denitrification (Wherry and others, 2020). Ator and Denver (2012) estimated that baseflow nitrate fluxes represented 70 percent of the total nitrogen flux headwater streams of the Delmarva Peninsula. Owing to the detrimental impacts that high nitrate concentrations can incur on both groundwater and surface water resources, the State has a vested interest in managing groundwater quality.
The State of Delaware has invested and continues to invest in management practices that aim to increase crop production and improve groundwater quality by reducing the leaching of nitrate and other ions. However, previous studies indicate that changes in nutrient management practices on the land surface may take decades to improve the surface water quality on the Delmarva Peninsula owing to the slow movement of groundwater (Shedlock, 1993; Sanford and Pope, 2013). Increasing concentrations of nitrate in the shallow groundwater of the surficial aquifer has been related to increases in nutrient inputs on the land surface of the Delmarva Peninsula over time between 1988 and 2001–03 prior to the implementation of nutrient management practices (Denver and others, 2018).
Previous groundwater monitoring networks in Delaware were designed to evaluate the occurrence of a broad range of contaminants in both oxic and anoxic shallow groundwater in the Delmarva Peninsula (Hamilton and others, 1993; Debrewer and others, 2007; Ator and Denver, 2012) and in Delaware (Blaier and Baxter, 2000). These networks included, but did not focus on, young, oxic groundwater where recent land management changes had been observed. Identifying the need for a network focused on these characteristics, the USGS and Delaware Department of Agriculture (DDA) designed a shallow well network of 48 wells for the purpose of detecting changes in shallow groundwater quality (Fleming and others, 2017). This shallow aquifer network was first sampled in 2014 by Fleming and others (2017). In 2019, 45 of the original 48 wells were resampled and an additional well (Ib32-08) was added (fig. 1; table 1).
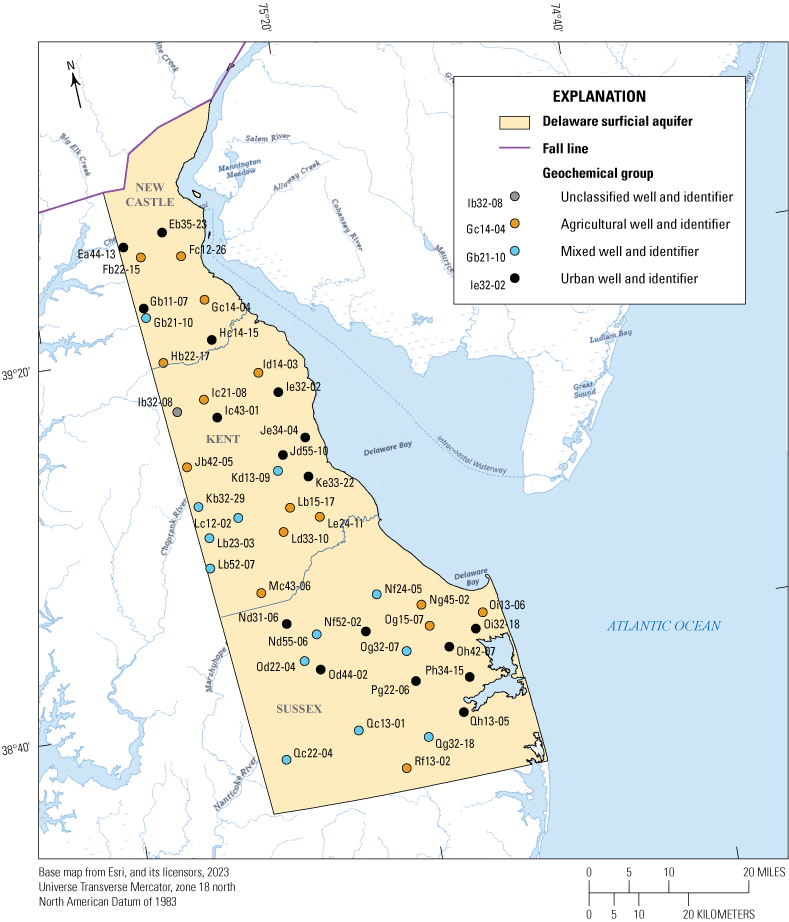
Map showing the locations and geochemical classifications of 46 wells sampled during the 2019 sampling event of the Delaware shallow aquifer network, wells with a group classification were sampled in 2014 and 2019 while one unclassified well (Ib32-08) was only sampled in 2019.
Table 1.
Site information for wells sampled in the surficial aquifer of the Delaware Coastal Plain, 2019.[USGS, U.S. Geological Survey; DGS, Delaware Geological Survey; DNREC, Delaware Department of Natural Resources and Environmental Control; ft bls, feet below land surface]
The water chemistry of samples collected by Fleming and others (2017) during the 2014 sampling effort were used in a correlation and cluster analysis that identified three groups based on relative concentrations of dominant ions (Fleming and others, 2017). Group 1 (Agricultural) was identified as having a calcium-magnesium-nitrate water type, which has been related to agricultural land uses (Denver, 1989; Hamilton and others, 1993; Böhlke, 2002; Fleming and others, 2017). Group 3 (Urban) is a sodium-potassium-chloride water type and was found in wells that generally had a relatively high urban land use and road density (Fleming and others, 2017). Group 2 (Mixed) had a mixture of characteristics from the Agricultural and Urban Groups. The highest median nitrate concentration 10.15 mg/L as nitrogen (N) was observed in the Agricultural Group followed by the Mixed Group with a median of 5.55 mg/L and Urban Group with that of 1.56 mg/L as N (Fleming and others, 2017). The Urban Group had the highest concentrations of chloride with a median of 89.7 mg/L; the Mixed and Agricultural Groups had median chloride concentrations of 79.6 mg/L and 14.65 mg/L, respectively (Fleming and others, 2017).
Purpose and Scope
Geochemistry in shallow groundwater of the Delaware Coastal Plain is summarized in this report. Of the 46 wells sampled in 2019, 45 were previously sampled in 2014 (Fleming and others, 2017). Repeated sampling of the shallow aquifer network provides an opportunity to begin comparing water-quality conditions over time and to better understand the effectiveness of conservation practices.
In this report, sources of nitrogen in groundwater are suggested and shallow groundwater quality conditions between the two sampling periods of 2014 and 2019 are compared. This study focuses on groundwater chemistry from shallow wells near agricultural areas and divides the resampled wells into three groups based on chemical similarities outlined in Fleming and others (2017). Results presented include samples collected and analyzed for field parameters, nutrients, major ions, and stable isotopes of hydrogen and oxygen, and isotopes of nitrate-nitrogen.
Description of Study Area
The study area falls entirely in the Delaware portion of the Northern Atlantic Coastal Plain Physiographic Province which extends south of the fall line in Delaware (fig. 1). Over 90% of Delaware is underlain by an extensive unconfined surficial aquifer that is present at the land surface in some areas (fig. 1). Precipitation across Delaware averages between 41 and 45 inches per year and is relatively evenly distributed over time (Sanford and Pope, 2013). The topography of Delaware is relatively flat and agriculture is the predominant land use. In 2019, approximately 38 percent of Delaware was classified as cropland (U.S. Department of Agriculture National Agriculture Statistics Service [USDA-NASS], undated).
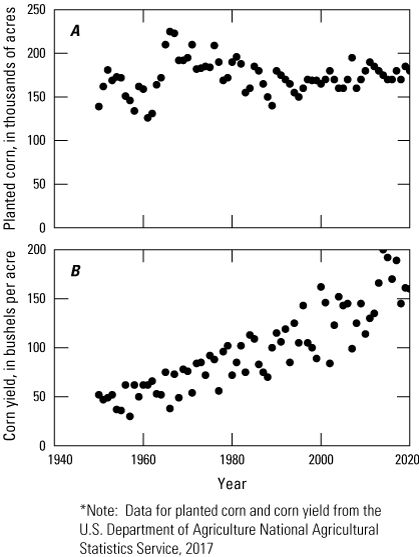
The main crops produced in the state are corn, soybeans, and winter wheat, a majority of which is harvested to support the broiler chicken industry (Delaware Department of Agriculture and USDA-NASS, 2020). In 2019, Delaware farmers harvested 180,000 acres of corn, 104,000 acres of soybeans, 50,000 acres of winter wheat, which supported the production of 268.8 million broiler chickens (Delaware Department of Agriculture and USDA-NASS, 2020). Irrigated land is common in Delaware; of the 180,000 acres of corn, 49.4 percent (89,000 acres) were irrigated (Delaware Department of Agriculture and USDA-NASS, 2020). Crop production in Delaware has intensified over the last 40 years, with corn grain yields increasing from approximately 80 bushels per acre in 1980 to 150 bushels per acre in 2019 despite acreage of fields remaining relatively stable (fig. 2A, fig. 2B). Trends in Delaware’s agricultural production are similar to national trends; farmland area is decreasing but production per unit of area is increasing (fig. 2).
Historically, greater nutrient applications were required for increased yields, suggesting an overall increase in the mass balance of nutrients cycled in farmland (Mueller and others, 2019). The exact quantities of nutrients applied to the land surface are unknown as most estimates rely on imperfect sales data. Advances in both technology and genetics have improved crop nutrient use efficiency allowing for lower nutrient input for similar yields (Mueller and others, 2019). Concurrent with changing agricultural technology is the implementation and encouragement of conservation practices which aim to maintain farm profitability while building soil health and nutrient retention within the field. The State of Delaware founded a nutrient management program in 1999 that focuses on improving both farm profitability and environmental outcomes through education and increasing conservation practice adoption (University of Delaware, 2023). Conservation practices within the state of Delaware include but are not limited to nutrient management plans, vegetated riparian areas, manure storage facilities, drainage management, cover crops, and stream buffers.
Graphs showing, A, acres of corn planted and, B, bushels of corn harvested in Delaware between 1950 and 2019.
Water Use
In 2015, groundwater withdrawals in the State of Delaware totaled 170 million gallons per day (Mgal/d) (Dieter and others, 2018), an 11.1 percent increase from the 2010 estimate of 151 Mgal/d (Masterson and others, 2016). The allocation of Delaware groundwater withdrawals is summarized in figure 3.
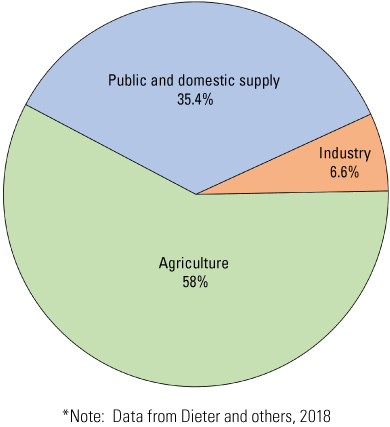
Pie chart showing the percentage of groundwater withdrawn per general-use category in Delaware.
Hydrogeologic Setting
The unconfined surficial aquifer thickens from north to south and lies over several confining units and confined aquifers (Denver and Nardi, 2016). Flow paths within Delaware’s surficial aquifer are relatively short, with a majority of estimated groundwater ages between 30 and 50 years (Sanford and Pope, 2013). Younger groundwater is present near the surface of the aquifer, whereas older groundwater from upgradient recharge areas is present at depth in the aquifer beneath the younger water (Ator and Denver, 2012). Flow paths in the confined aquifers are much longer, corresponding to much older groundwater ages (Sanford and Pope, 2013). Recharge to the surficial aquifer occurs over most of the land’s surface because of the sandy nature of the overlying soil and aquifer sediment, with mean annual recharge estimated between 14 and 17 inches per year (Sanford and Pope, 2013). Recharge to the surficial aquifer can occur throughout the year and has a relatively equal distribution between the growing (March to September) and non-growing seasons (October to February) (Stahl and others, 2020). Recharge to the aquifer is possible even with the high evapotranspiration demand of summer, as groundwater levels respond to precipitation during intense rainfall events (Denver and others, 2018). Descriptions of geologic formations that compose the surficial aquifer and lower confining units and aquifers may be found in Fleming and others (2017).
Groundwater Chemistry
Groundwater chemistry is influenced by the dissolution of minerals in aquifer sediments, inputs from the land surface, and reduction-oxidation (redox) conditions. Relatively insoluble siliciclastic sediments dominate the Delaware surficial aquifer and their dissolution results in naturally dilute groundwater with specific conductance values less than 60 microsiemens per centimeter (µS/cm) and nitrate concentrations of less than 0.4 mg/L (Denver, 1989; Hamilton and others 1993; Ator, 2008). Due to its proximity to the land’s surface, groundwater of the surficial aquifer is susceptible to transport of chemicals from the land surface through the soil zone during recharge events. As a result, land management practices are commonly the dominant driver of shallow groundwater quality in the surficial aquifer; for example, salt and salt-brines applied to reduce ice on roadways can dissolve and infiltrate the soil, causing an increase in groundwater concentrations of sodium and chloride ions (Ator and Denver, 2012; Fleming and others, 2017). In 2014, wells sampled near urban areas and high road density also had higher specific conductance related to sodium, potassium, and chloride (Fleming and others, 2017).
In agricultural areas, soil amendments such as fertilizer, manure, and lime are applied to boost soil fertility and meet crop growing needs. Macronutrients such as nitrogen, phosphorous, calcium, magnesium, and sulfur, as well as minor nutrients such as boron and manganese, are commonly applied to improve soil fertility (Abaye and others, 2006). Sources of nitrogen and phosphorus that are applied to cropland include commercial fertilizers and poultry litter. Historically, most of the nitrogen delivered to cropland came from manure, but concerns related to phosphorus buildup in soil from these inputs resulted in restrictions on manure application (U.S. Department of Agriculture Natural Resources Conservation Service, 2013). As the allowance for manure applications decreased within the state, the nitrogen required for plant nutrition was supplied through the application of commercial fertilizers. Crop fields in Delaware also receive soil acidity treatments in the form of calcium and magnesium rich limestone. The combination of the soil fertility treatments used in modern agriculture leads to groundwater chemistry being dominated by magnesium, calcium, and nitrate in areas influenced by agriculture (Denver, 1989; Hamilton and others, 1993; Böhlke 2002; Fleming and others, 2017).
Method of Study
Data were collected to support the comparison of water quality between sampling events in 2014 and 2019 in the shallow aquifer network in the State of Delaware. Of the 48 wells sampled in the fall of 2014, 45 wells were available for resampling during the fall of 2019 (table 1). An additional well was added to the shallow aquifer network bringing the total number of wells sampled in 2019 to 46. Groundwater was collected in October and December for both the 2014 and 2019 sampling events. Samples were analyzed for field parameters, nutrients, major ions, alkalinity, stable isotopes of hydrogen and oxygen in water, and of nitrogen and oxygen isotopes in nitrate.
Network Design
The shallow aquifer well network is composed of wells previously used to monitor pesticides (Blaier and Baxter, 2000) and water quality within the surficial aquifer (Koterba and others, 1995; Shedlock and others, 1999; Debrewer and others, 20074612). The original 48 wells were selected owing to their shallow screened depth (11–34 feet), proximity to agricultural areas, and their likely high oxygen content (Fleming and others, 2017). Much of the previously reported and documented spatial variability in groundwater nitrate concentrations on the Delmarva Peninsula included results from networks with wells in both oxic and anoxic groundwater (Debrewer and others, 2007). The sampling of the shallow aquifer network in 2014 and 2019 was designed to represent shallow, oxic groundwater conditions in Delaware’s surficial aquifer. In 2019, samples were collected between October and December for a direct comparison to the sampling time frame in 2014. Wells with higher oxygen content were sought for this network as low dissolved oxygen leads to the removal of nitrogen from water through microbial activity. The original 48 wells sampled in 2014 (Fleming and others, 2017) were revisited in 2019 to assess for resampling following USGS protocols (USGS, variously dated). An initial reconnaissance of available wells from the 2014 sampling event was completed and three wells were determined to be unusable for sampling; one well was found dry (Pf41-02), one was destroyed (Fa45-07), and one well owner could not be reached for permission (Oc21-03). A well identified as Ib32-08 was added to the group of wells to sample (table 1). A total of 46 groundwater wells were sampled for this study.
Groundwater Sample Collection and Analysis
Groundwater samples were collected using methods outlined in the USGS National Field Manual for the Collection of Water-Quality Data (USGS, variously dated) and the sampling protocol outlined in Fleming and others (2017). All groundwater samples were collected using Teflon tubing and a 0.45-micrometer capsule filter inside a clean sampling chamber. Filtered water samples for major inorganics analysis were preserved using nitric acid to a pH below 2. All samples were analyzed for field parameters, nutrients, major ions, and stable isotopes of water including hydrogen and oxygen, and the δ15N and δ18O isotopes of the nitrate.
All samples were maintained at a temperature below 4 degrees Celsius in a sealed cooler during shipment to the laboratory. Samples from all wells were analyzed for major ions and nutrients at the USGS National Water Quality Laboratory (NWQL) in Denver, Colorado using methods described in Fishman (1993), and samples for stable isotopes were analyzed at the USGS Stable Isotope Laboratory using methods described in Coplen and others (2012) and Révész and others (2012). Sampling results from this study are available for comparison to sampling results from past and future studies, data collected during this study are available through the Water Quality Portal (National Water Quality Council, undated).
Quality Control
Equipment blanks, field blanks, and sequential replicate samples were collected following protocols described in Koterba and others (1995) to estimate potential contamination bias and measurement variability from water-quality data-collection processes. An equipment blank was collected prior to the commencement of sampling. Four field blanks and five replicates were collected during field activities at selected wells.
The field blanks were collected to ensure that sample collections and processing did not result in contamination. No nutrients or major ions were detected in the field blanks. Replicate samples measure the combined precision of sampling and laboratory analysis procedures. Replicate samples demonstrated consistent chemistry with their paired environmental sample. A relative percent difference (RPD) of 20 percent between environmental and replicate sample chemistry was used as an indication of variability from sampling procedures for this study. In the 2019 sampling event, the only instances of greater than 20-percent RPD occurred near the reporting limit of analytic instrumentation.
During this study an issue was discovered in quality assurance at the NWQL for a single dissolved orthophosphate (OP) result for one site. An error in the calibration procedure of the analytical instrument led to a result that the NWQL suggested was biased low, meaning the actual OP concentration was likely higher. The affected site, Nf52-02, had an OP concentration of 0.051 mg/L. Although the 2019 OP concentration from well Nf52-02 was withheld from the statistics table, it’s concentration of 0.051 mg/L is nearly identical to the well’s 2014 concentration of 0.05 mg/L.
Data Analysis
A nonparametric matched pair test, the Wilcoxon Signed Rank (WSR) test (Helsel and others, 2020), was applied to compare nutrient or major ion concentrations between 2014 and 2019 for wells that had been resampled. The Wilcoxon Rank Sum (WRS) test for unpaired samples was used to determine statistical difference between the Agricultural, Mixed, and Urban Groups. Resampled wells in 2019 were also grouped based on previously assigned geochemical classification described in Fleming and others (2017) for agricultural, mixed, and urban water types. Stable isotopes of water sampled in 2019 were examined and compared against modeled isotope data (Bowen, 2018) to estimate the source of sampled water. Nitrogen isotope ratios from sampled nitrate were evaluated to identify sources of nitrate in groundwater, including inputs from synthetic fertilizers, manure, septic discharge, or natural processes (Böhlke, 2002).
Spatial Analysis
Spatial analysis was used to relate observed water quality to potential influences at the land surface. Agronomic survey and census data related to the acreage of various crops and years of production were provided by USDA-NASS (undated). Spatial datasets of estimated enrichment ratios of stable isotopes within precipitation were used to estimate approximate season of groundwater recharge (Bowen, 2018)
Comparison of Water Quality in Shallow Groundwater, 2014 and 2019
Fleming and others (2017) identified and described three major geochemical types of groundwater during the 2014 study. The same grouping applied to the 2014 sampling of wells was utilized for the 45 resampled wells in 2019 and allowed for a paired comparison between years (Fleming and others, 2017). For reference, the Agricultural Group is a calcium-magnesium-nitrate water type, which was previously identified as an agricultural signature in the Delmarva Peninsula (Denver, 1989; Hamilton and others, 1993; Böhlke, 2002), The Urban Group of wells had a sodium-potassium-chloride water type, and the Mixed Group is a mixture of Agricultural and Urban Groups (Fleming and others, 2017). Although the wells were selected for their locations in predominantly agricultural settings, the Urban Group generally had the highest percentage of urban land use and road density (Fleming and others, 2017).
Field Parameters
Samples had a median specific conductance of 220 µS/cm and ranged from 80 to 667 µS/cm in 2019 (table 2). The Urban Group had higher specific conductance concentrations than the Mixed Group (WRS p<0.05) and the Agricultural Group (WRS p=0.09). The median specific conductance of all samples in 2019 were slightly lower than 2014 but the difference was not statistically significant. The differences within groups between the 2014 and 2019 sampling events were not statistically significant.
Table 2.
Summary statistics for water-chemistry from the 2014 and 2019 sampling of shallow wells within the Delaware surficial aquifer network.[Geochemical groups were identified by Fleming and others (2017). Data from 2014 are from U.S. Geological Survey (2016). uS/cm, microsiemens per centimeter; min, minimum; max, maximum; mg/L, milligrams per liter; N, nitrogen; P, phosphorus; <, less than]
In 2019, samples had a median pH of 5.2 and ranged from 4.4 to 6.7 (table 2). The Urban Group had a higher median pH of 5.6 than the Mixed Group with a median of 4.85 (WRS p<0.05) and the Agricultural Group with a median 5.05 (WRS p=0.07). There was no statistically significant difference between median concentrations in 2014 and 2019 or, within groups between 2014 and 2019.
Dissolved oxygen values for the 2019 sampling event ranged from 1.7 to 9.6 mg/L and had a median concentration of 5.3 mg/L (table 2). Although there were slight differences between groups, the differences were not statistically significant (WRS p>0.05). Although the 2019 sampling event had lower median than the 6.3 mg/L found in 2014, this difference was also not significantly different (WRS p=0.2).
Nitrate
In 2019, as in 2014, nitrate was the dominant form of nitrogen found within the shallow aquifer network of the Delaware Coastal plain. Samples from the entire network had a median nitrate concentration of 5.09 mg/L in 2019, with a range from 0.45 to 30.7 mg/L. When the wells were split into their geochemical groups and compared, water sampled from the Agricultural Group had a median nitrate concentration of 10.7 mg/L, higher than that of the Mixed Group (4.95 mg/L; WRS p<0.05) and the Urban Group (1.75 mg/L; WRS p<0.0001); the difference between the Mixed and Urban Groups was also statistically significant (WRS p<0.05) (table 2; fig. 4). The difference between groups in 2019 was similar to the 2014 sampling, where nitrate concentrations between groups were significantly different from one another (Fleming and others, 2017; WRS p<0.05). When the respective Agricultural, Mixed, and Urban Groups of 2014 and 2019 were compared, no significant changes were found (fig. 4). The median nitrate concentration of all samples in 2019 was slightly higher than that observed in 2014, but not statistically significant (WSR p=0.56; table 2). Eleven samples collected in 2019 had nitrate concentrations above 10 mg/L, the U.S. Environmental Protection Agency (EPA) primary drinking water quality threshold (EPA, 2024a). All but 2 of the 11 samples from the Agricultural Group were higher than the threshold.
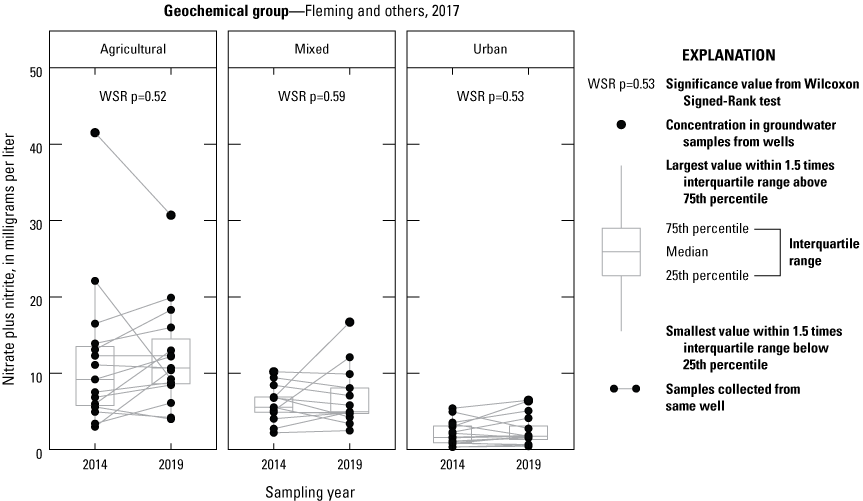
Boxplots showing the concentration of nitrate plus nitrite as nitrogen in groundwater samples gathered between 2014 and 2019 from the Delaware shallow aquifer network.
Relationships Between Specific Conductance, Nitrate, and Chloride
In 2014, specific conductance was positively correlated with concentrations of chloride in the Urban Group and both chloride and nitrate in the Agricultural Group (Fleming and others, 2017). Data from 2019 showed the same relationship between chloride and specific conductance in the Urban Group of wells, where a linear regression indicated that specific conductance described a high degree of variability in chloride concentrations (r2=0.87). Wells within the Urban Group maintained a significantly higher median concentration of chloride than wells in the other groups (WRS P < 0.05). Correlations between specific conductance and nitrate among groups varied from weak (r2=0.041) in the Urban Group to moderate (r2=0.68) in the Agricultural Group. When data from 2014 and 2019 were combined and the linear regression was repeated, the relationships within groups remained consistent (fig. 5). A multivariate regression using both specific conductance and magnesium as explanatory variables increased the r2 value to 0.82 within the Agricultural Group (table 3). The power of specific conductance and magnesium to predict nitrate concentrations decreased in the Mixed and Urban Groups (table 3), which have lower magnesium concentrations than the Agricultural Group (WRS p<0.01; table 2).
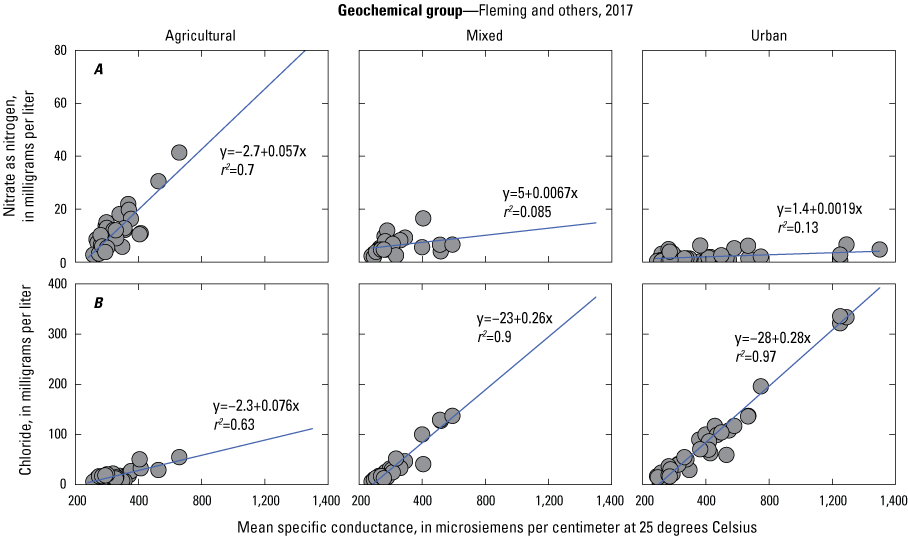
Bivariate plots with regression lines and equations demonstrate the relationship between specific conductance and, A, nitrate as nitrogen concentration and, B, chloride concentration data collected in 2014 and 2019 for each geochemical group.
Table 3.
Estimated coefficients for a regression predicting nitrate concentrations using magnesium and specific conductance in microsiemens per centimeter at 25 degrees Celsius.[Geochemical groups were identified by Fleming and others (2017).]
Orthophosphate
Groundwater concentrations of OP were generally low; with 18 of the 46 samples above the detection limit of 0.004 mg/L (table 2). Most OP detections occurred in the Agricultural and Urban Groups where almost half of the samples collected had a detection of OP. Orthophosphate concentrations within groundwater are generally low as OP is easily bound to ionic exchange sites on soil and sediment (Sharpley and others, 2013). Soils that have received repeated phosphorus applications may experience a saturation of available binding sites and OP may be released to subsurface transport and groundwater (Kleinman and others, 2007). Although OP concentrations measured in the 2019 sampling were generally low, three sites had OP concentrations above the recommended regional criteria for total phosphorus of 0.031 mg/L (EPA, 2000). The three sites with high OP concentrations in 2019 also had OP concentrations above 0.031 mg/L in the 2014 sampling effort. Orthophosphate concentrations at or above eco-region specific criteria are likely the result of sediments that are near or above saturation of adsorbed phosphorus (Domagalski and Johnson, 2011). In comparison, the Choptank River at Greenboro, Maryland, surface-water gaging station (station 01491000), which has a majority of its watershed in Delaware, had a median OP concentration of 0.041 mg/L and a mean of 0.048 mg/L for all environmental samples collected from 2014 to 2019, respectively (USGS, undated).
Chloride, Sodium and Chloride-to-Bromide Ratios
Chloride observed in 2019 had a median concentration of 17.75 mg/L, which was less than the 2014 median of 27.15 mg/L but not significantly different (WRS p=0.2; table 2). Wells within the Agricultural Group had a similar chloride concentration in both sampling years; the Mixed and Urban Groups had lower concentrations in 2019 compared with that in 2014 (table 2). Unlike in 2014, there were no samples which exceeded the chloride EPA Secondary Drinking Water Standard of 250 mg/L in 2019 (EPA, 2024b). In both 2014 and 2019, samples with high sodium also had higher chloride concentrations (fig. 6A). Wells from the Mixed and Urban Groups had consistently higher concentrations of sodium and chloride regardless of spatial position (WRS P <0.05; fig. 6A); this relationship suggests that proximity to urban land use and roadways is a stronger indicator of sodium and chloride concentrations than latitude in Delaware.
Previous studies have used the mass ratio of chloride to bromide as an indicator of chloride source (Mullaney and others, 2009). The ratio of chloride to bromide generally found in the Agricultural well Group (fig. 6B) are similar to agricultural areas surveyed by Mullaney and others (2009), which received both animal manure and potash fertilizer (which contains high concentrations of potassium). In 2019, values from the Urban Group (fig. 6B) were indicative of land that received deicing treatments (Mullaney and others, 2009). In areas with dilute groundwater, ratios of chloride to bromide are relatively low (below 1000) and increase as anthropogenic sources of chloride are added (Mullaney and others, 2009). The chloride-to-bromide ratio increases because anthropogenic sources of chloride such as deicing agents and water softeners have high concentrations of chloride and little bromide.
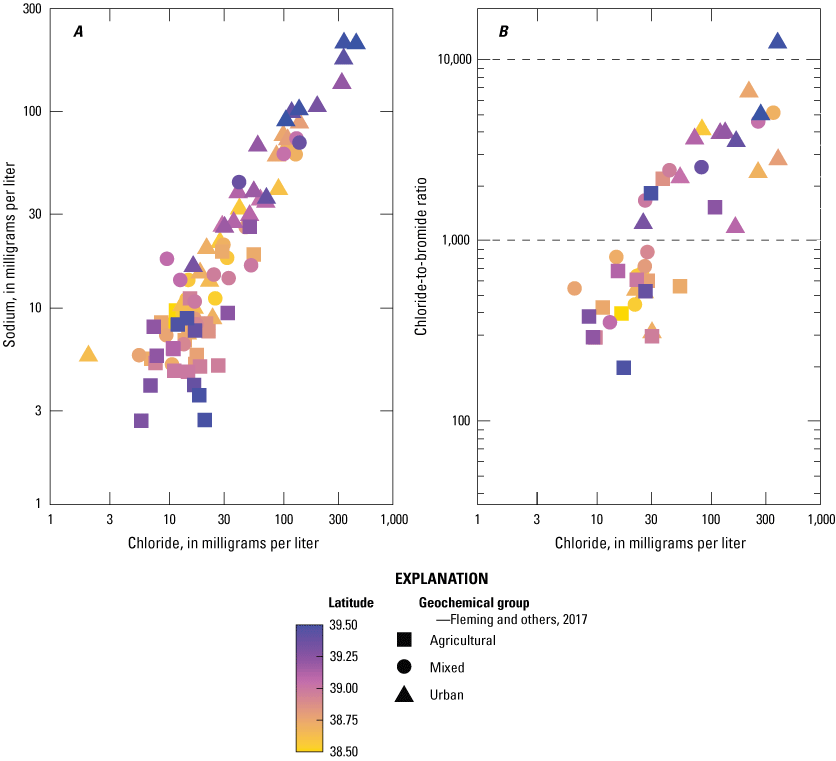
Bivariate plots demonstrating the relationship between, A, sodium and chloride data collected in 2014 and 2019 and, B, chloride-to-bromide mass ratios and chloride concentration data collected in 2019 for each geochemical group.
Silica
Silica in groundwater comes from the dissolution of silicate minerals that dominate soil and aquifer sediments and has previously been related to estimated groundwater age (Denver and others, 2018). In 2014, 18 samples from the shallow network were analyzed for estimated groundwater age using sulfur hexafluoride (SF6; Fleming and others, 2017). Figure 7A shows the relationship between silica concentrations and estimated groundwater age and shows a wide range of silica concentrations indicated similar groundwater age and a weak relationship driven by an outlying data point. The high variation in silica to groundwater age is likely because of the variation in aquifer properties within the shallow well network compared to that of an individual field (Denver and others, 2018). In addition, a WRS test found significant differences between the Urban and Mixed Groups, and the Urban and Agricultural Groups in both 2014 (fig. 7B) and 2019 (fig. 7C). The differences observed between these groups suggest that, although silica may be a reliable surrogate for age on a local scale, there is insufficient evidence to estimate groundwater age from silica on a state-wide basis. The differences between geochemical groups suggest that land use may also influence silica concentrations. Despite the weak relationship between silica concentrations and relative groundwater age calculated from SF6 concentrations, the relative ages (fig. 7A) of samples collected from this network suggest that all water sampled was modern in nature.
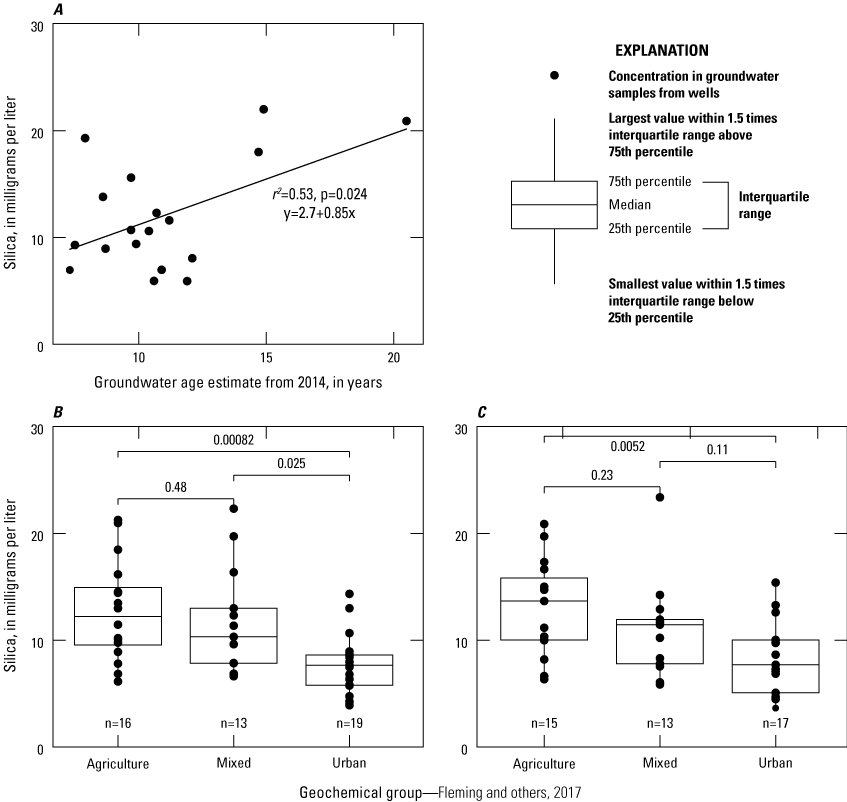
A, line graph showing silica concentrations with estimated groundwater ages from 2014 and boxplots showing silica concentrations versus geochemical group for, B, 2014 and, C, 2019. Horizontal lines above individual boxplots indicate the comparison between groups with a p value shown above the comparison line from the Wilcoxon Rank Sum test.
Isotopes
Stable Isotopes of Water
The isotopes δ2H and δ18O are naturally occurring variations of hydrogen and oxygen and are found in low concentrations within water molecules. These molecules are heavier than their counterparts δ1H and δ16O because they contain additional neutrons within the nucleus. The relative enrichment of water with δ2H and δ18O isotopes is determined by physical processes such as evaporation and precipitation. The ratios of isotope occurrence in water are known as “enrichment ratios” and they can indicate the source and possibly timing of groundwater recharge from precipitation. Previous studies on stable isotopes indicate that recharge may occur year-round in Delaware (Stahl and others, 2020), which is supported by recharge estimates by Sanford and Pope (2013).
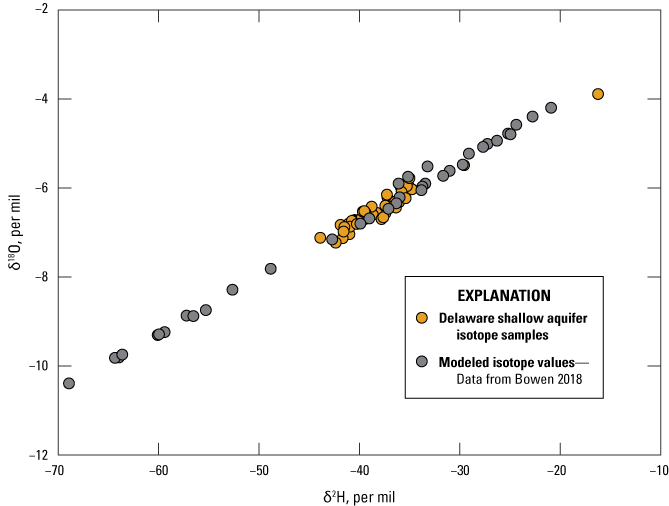
Stable isotope samples analyzed from the shallow aquifer network were compared against monthly isotope data modeled from the Isomaps Program (fig. 8; Bowen, 2018). Water sampled during 2019 fell within the range of previously sampled groundwater on the Delmarva Peninsula. One well, Ph34-15, stood out from the other samples owing to its low enrichment of both δ2H and δ18O compared to the rest of the network (fig. 8). This well is close to the Delaware inland bays (fig. 1) and it is possible that the water is influenced by them; oceanic sources of water are generally less enriched than water from continental land masses (Stahl and others, 2020). When compared with the Water Isotope Program data, the Delaware shallow isotopes were in the middle of the range of values estimated by the Isomaps data, suggesting that the water sampled was from mixed time periods and or sources. This would be expected as water samples from a well with a 3-foot screened interval, such as those in this network, which represent a composite of water from several recharge events that occurred over a longer time frame than a single recharge event.
Bivariate plot comparing delta (δ)18O and δ2H isotope values of water samples collected during the 2019 Delaware Shallow Aquifer Network sampling event and modeled isotope values.
Nitrate Isotopes
Nitrate isotopes δ15N and δ18O are naturally occurring isotopes of nitrogen and oxygen. Their abundance is determined by the sources of nitrogen and biological transformations such as denitrification (Böhlke and Denver, 1995). Sources of nitrogen added to the landscape and in the atmosphere provide the basis for δ15N concentrations in water. Synthetic nitrogen fertilizers (such as urea or ammonium sulphate) are created from atmospheric N2 gas and generally range from −3 per mil (‰) δ15N to +7‰ δ15N (Michalski and others, 2015). A survey of 270 different synthetic fertilizers sold in the United States in 2015 indicated that 80 percent of fertilizers had −3‰ δ15N to +3‰ δ15N (Michalski and others, 2015). Once in the soil profile, nitrification processes alter the commercial fertilizer such that the commonly found range of isotopes are −5‰ δ15N to +5‰ δ15N (Michalski and others, 2015). Other sources of nitrogen that come through biological pathways, such as manure or septic systems, typically have higher δ15N (Kendall and others, 2007). Previous literature indicates that manure and septic systems have a range of 10‰ δ15N to 20‰ δ15N (Böhlke and Denver, 1995; Kendall and others, 2007). Denitrification can produce nitrate values between 10‰ and 30‰ δ15N and similarly raise δ18O isotopes fractions compared to the groundwater pool of nitrate (Kendall and others, 2007).
The nitrogen isotopes measured in nitrate from water samples in 2019 indicate the main source of nitrogen measured in the shallow aquifer network appears to be a mixture of synthetic fertilizer and manure in all groups (fig. 9, table 4). There was no significant difference between groups when comparing nitrate isotopes. Partial denitrification was evident in some of the water samples owing to their greater enrichment of both nitrate isotopes (fig. 9). Greater enrichment of nitrate isotopes can occur as microbes preferentially metabolize isotopes with less mass (Kendall and others, 2007). Water from well Gc14-04 had the highest δ15N and δ18O values; this well is located near wetlands and had a relatively low dissolved oxygen value of 1.8 mg/L in 2019 compared to the rest of the network. Despite the relatively low oxygen content and the enriched isotopic signature, the 2019 sample from Gc14-04 contained 6.1 mg/L nitrate.
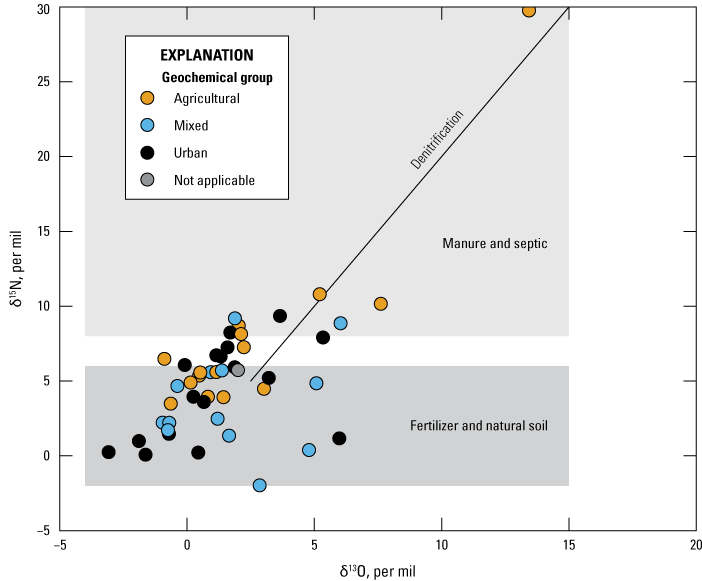
Bivariate plot showing delta (δ)15N and δ18O isotope values for nitrate in samples collected during the 2019 Delaware Shallow Aquifer Network sampling effort.
Table 4.
Summary Statistics for stable isotopes of water and the nitrogen and oxygen isotopes of nitrate from the 2019 sampling of the Delaware Shallow Aquifer Network, samples are split into geochemical groups.[Geochemical groups were identified by Fleming and others (2017). N, number of samples; min, minimum; max, maximum; δ, delta]
Factors Influencing Groundwater Chemistry
The Delaware Shallow Aquifer Network was designed to sample shallow groundwater across the State of Delaware to better understand spatial and temporal variation in groundwater chemistry through repeated sampling over time. Sampling the recently formed groundwater within the shallow well network would demonstrate changes in water chemistry driven by land management (fig. 7). However, results from the second sampling of the network in 2019 suggest that there was little change in nutrients and most other major ion concentrations.
Age-dating techniques determined that the groundwater sampled during this study generally formed within 10 years of the sampling time (fig. 7A). Assuming the wells not analyzed for age-dating characteristics had similar ages owing to their depth and placement in the aquifer, the sampling of this network included groundwater that recharged to this aquifer between 2004 to 2014 for the first round of sampling and 2009 to 2019 for the second (fig. 10). The range of corn yields over each 10-year period indicates that there were factors influencing nutrient utilization of crops, which varied inter-annually. In 2014, for example, the water samples reflected years where Delaware corn yields varied from 99 bushels per acre in 2007 to 200 bushels per acre in 2014. This variation in yield is likely related to variable growing conditions and not drastic changes in farming practices in the state. This inter-annual variation in crop production may have implications for water quality on shorter time scales, as previous research has shown considerable variation in groundwater chemistry within the growing seasons (Denver and others, 2018).
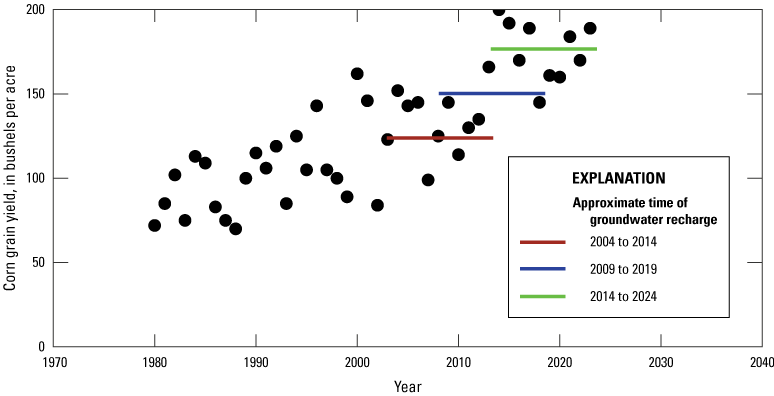
Plot comparing the approximate time of recharge of groundwater for the Delaware Shallow Aquifer Network for wells sampled in 2014 and 2019 to corn yields between 1980 and 2024.
Shallow groundwater chemistry may vary over short timeframes as there is a short travel distance between land management activities and the groundwater reservoir. Due to the variable nature of management activities and timing of precipitation, recharge events can concentrate or dilute water chemistry. Variations in groundwater nitrate concentrations on a seasonal basis were shown by Denver and others (2018), who demonstrated near Bucks Branch in Delaware that nitrate-nitrogen concentrations were the highest in both soil and very shallow groundwater during the main growing season. The increased nitrate concentrations in soil and groundwater at Bucks Branch were related to nutrient application timing and precipitation events (Denver and others, 2018). The higher concentrations near the water-table surface decreased later in the growing season as more recharge reached the aquifer. One of the monitoring wells included in this study, Ng45-02, had daily conductance and nitrate values collected from 2014 to 2020 and 2016 to 2020, respectively (fig. 11, fig 12.). The variability in conductance demonstrated at Ng45-02 demonstrates relatively rapid changes in water quality. In figure 11, greater depth to groundwater indicates a relatively dry period, while wetter conditions lead to higher groundwater levels. Daily conductance data from Ng45-02 showed that a single recharge event may either increase ionic concentrations or dilute them (fig. 11). Increases in groundwater level frequently corresponded to increases in specific conductance (fig. 11). Owing to the strong relationship (r2=0.92) between specific conductance and nitrate at this site (fig. 12), we may infer that nitrate concentrations were also variable. Discrete samples of nitrate at Ng45-02 showed an increase in maximum observed concentrations from 13.1 mg/L in 2014 to 18.3 mg/L in 2019. This increase was likely caused by a change in cropping practice from consistent hay production to a corn and soybean rotation in 2014. This example from Ng45-02 illustrates how nitrate concentrations can change in groundwater in a relatively short timeframe when agricultural practices change significantly. Although samples collected in 2014 and 2019 targeted the same timeframe (October–December), there were differing antecedent moisture conditions leading into the sampling event.
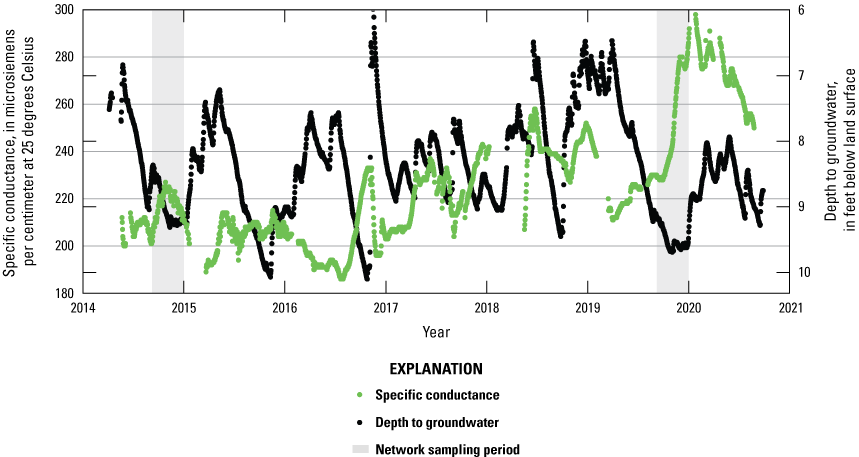
Plot showing specific conductance and depth to groundwater data from monitoring well Ng45-02 near Milton, Delaware between 2014 and 2020.
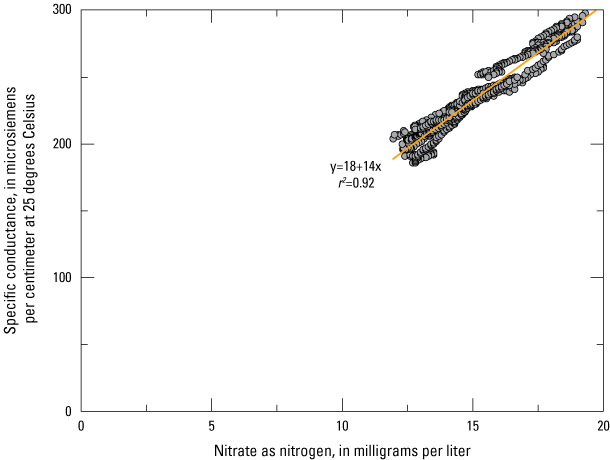
Plot showing daily values of specific conductance and nitrate as nitrogen from 2016 to 2020 in monitoring well Ng45-02 near Milton, Delaware.
The Palmer Drought Severity Index (PDSI) reflects the relative availability of moisture at a given point in time (Palmer, 1965). Positive PDSI values indicate wetter-than-average conditions and negative PDSI values indicate drier-than-average conditions. During the sampling events for 2014 and 2019, Delaware started the calendar year with relatively wet conditions (figs. 11, 13) that dried out over the summer growing season. This pattern of greater dryness towards the end of the growing season is consistent with daily groundwater elevations reported from Ng45-02 (fig. 11). In 2019, the calendar year started relatively wet compared to 2014 (fig. 13) but by late spring in 2014 and 2019, PDSI values were decreasing in the State of Delaware (fig. 13). During and after periods of typical nitrogen applications, the state experienced similar hydrologic conditions but there was greater antecedent moisture in 2014 during the period of sampling (fig. 13).
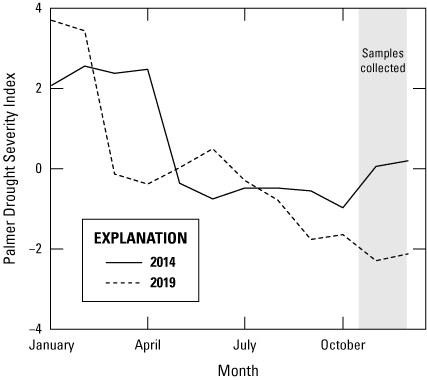
Plot showing weekly Palmer Drought Severity Index values for the State of Delaware in 2014 and 2019. Data are from National Oceanic and Atmospheric Association National Centers for Environmental information (undated).
Although the groundwater chemistry is variable, the wells within the shallow aquifer network maintained relatively consistent concentrations of nitrate, magnesium, and chloride, which were defining characteristics of the geochemical groups in 2014 and 2019. Wells that had high nitrate and phosphorus in 2014 also had high nitrogen and phosphorus in 2019; the same was true for chloride concentrations. The sampling method of the shallow aquifer network was designed for a relatively short timeframe to control for seasonal variability in groundwater variability and changes in antecedent moisture conditions (fig. 13). This relatively short sampling window provided a synoptic of water quality across the state. Despite variation in groundwater chemistry between sampling events appearing limited, repeated sampling of groundwater networks allows for the detection of a trend despite variable weather signals (Lindsey and others, 2023). Continued sampling of the shallow aquifer network should indicate changes in long-term shallow groundwater chemistry.
Summary and Conclusions
The U.S. Geological Survey, in cooperation with the Delaware Department of Agriculture, resampled a network of wells designed to monitor shallow groundwater quality in the surficial aquifer of the Delaware Coastal Plain in 2019. The shallow aquifer network of wells was selected to assess changes in Delaware’s shallow water quality in areas with oxic water that was influenced by agricultural land use. This network was first sampled in 2014, and results from this sampling event were used to classify the water into three main groups that reflected agricultural type water, water with high urban land cover, and a mix of the previous groups’ chemistry (Fleming and others, 2017). This network was resampled in 2019 to compare groundwater quality between 2014 and 2019. Of the original 48 wells, 45 were resampled and an additional well was added.
When compared, a few statistically significant changes in water-quality constituents between the 2014 and 2019 sampling events were found at the network level or between groups. Land-use factors continue to be a driving influence on groundwater quality. The Agricultural Group continued to have the highest concentration of nitrate-nitrogen. There were no statistically significant differences in nitrate concentrations between 2014 and 2019. The Urban Group had the highest chloride values. The Urban and Mixed Groups showed decreases in chloride and the Agricultural Group showed no change. Unlike the 2014 sampling, which showed higher chloride concentrations at more northern latitudes (Fleming and others, 2017), the values from 2019 appeared mixed spatially and may have been affected by antecedent moisture conditions (Lindsey and others, 2023). Nitrate concentrations were similar in 2014 and 2019 at the network level and within groups. The isotopic signatures of nitrate-nitrogen indicate that there were a mix of contributing sources and there was no difference observed between groups. Silica concentrations compared to groundwater age dates estimated from sulfur hexafluoride indicated that there was a relationship between silica and age; however, this relationship was weak and silica concentrations varied between groups of wells. One well, with daily water-quality results between the two sampling periods, showed how groundwater can vary on a sub-seasonal basis. This well also indicated that change can be detected in groundwater over a five-year period if changes in nutrient input and land management practices result in significant changes in nutrient leaching to groundwater.
The network targets groundwater conditions where nitrogen as nitrate is present (oxic) and where changes may be observed on the scale of years and not decades (young groundwater). Between the two sampling events (2014 and 2019), relatively few changes in groundwater quality were observed. The overall concentration of nitrate did not change at the network level, and the distribution of geochemical properties remained consistent within well groups. Although changes in groundwater water quality may take years or decades to respond to changes on the landscape, tracking landscape conservation practices and accounting for hydrologic variability can improve our understanding of the effectiveness of agricultural conservation practices on shallow groundwater quality. The lack of difference between groundwater nutrient chemistry between 2014 and 2019 presents a challenge to understanding how changes to land management practices have affected the aquifer. However, studies on the impact of conservation practices on regional water quality indicate varying and limited effectiveness (Ator and others, 2020; Fox and others, 2021; Sekellick and others, 2023). Continued sampling of the relatively young water within the shallow aquifer network should indicate long-term changes in water quality.
References Cited
Abaye, A.O., Basden, T.J., Beegle, D., Binford, G.D., Daniels, W.L., Duiker, S.W., Evanylo, G.K., Hearing, K.C., Hansen, D.J., Mullins, G., and Taylor, R.W., 2006, The Mid-Atlantic nutrient management handbook: Mid-Atlantic Regional Water Program, 252 p., accessed March 14, 2024, at https://extension.psu.edu/programs/nutrient-management/educational/nutrient-management-general/mid-atlantic-nutrient-management-handbook.
Andres, A.S., 1991, Results of the coastal Sussex County, Delaware ground-water quality survey: Delaware Geological Survey Report of Investigation No. 49, 28 p. accessed February 10, 2024, at https://udspace.udel.edu/server/api/core/bitstreams/6a2c455a-4ecf-4350-8bc2-a0c0b3f71b9a/content.
Andres, A.S., 1992, Estimate of nitrate flux to Rehoboth and Indian River Bays, Delaware, through direct discharge of ground water: Delaware Geological Survey Open File Report No. 35, 36 p. accessed February 10, 2024, at https://www.dgs.udel.edu/sites/default/files/publications/OFR35.pdf.
Ator, S.W., 2008, Natural and human influences on water quality in a shallow regional unconsolidated aquifer, northern Atlantic Coastal Plain: U.S. Geological Survey Scientific Investigations Report 2008–5190, 19 p. [Also available at https://doi.org/10.3133/sir20085190.]
Ator, S.W., García, A.M, Schwarz, G.E., Blomquist, J., and Sekellick, A., 2019, Toward explaining nitrogen and phosphorus trends in Chesapeake Bay tributaries, 1992–2012: Journal of the American Water Resources Association, v. 55, no. 5, p. 1149–1168, accessed November 10, 2022, at https://doi.org/10.1111/1752-1688.12756.
Blaier, S.C., and Baxter, S.J., 2000, The occurrence and distribution of several agricultural pesticides in Delaware’s shallow ground water: Delaware Geological Survey Report of Investigations No. 61, 23 p. accessed February 10, 2024, at https://www.dgs.udel.edu/sites/default/files/publications/ri61.pdf.
Böhlke, J.,K., 2002, Groundwater recharge and agricultural contamination: Hydrogeology Journal, v. 10, no. 1, p. 153–179, accessed March 4, 2021, at https://doi.org/10.1007/s10040-001-0183-3.
Bowen, G.J., 2018, Global and regional precipitation—U.S. high-resolution precipitation: University of Utah, accessed December 10, 2022, at https://wateriso.utah.edu/waterisotopes/pages/data_access/ArcGrids.html.
Coplen, T.B., Qi, H., Révész, K., Casciotti, K., and Hannon, J.E., 2012, Determination of the δ15N and δ18O of nitrate in water; RSIL lab code 2900 [version 1.1, September 2012]: U.S. Geological Survey Techniques and Methods, book 10, chap. C17, 35 p., accessed March 27, 2023, at https://pubs.usgs.gov/tm/2006/tm10c17/. [Supersedes version 1.0 released in 2007.]
Debrewer, L.M., Ator, S.W., and Denver, J.M., 2007, Factors affecting spatial and temporal variability in nutrient and pesticide concentrations in the surficial aquifer on the Delmarva Peninsula: U.S. Geological Survey Scientific Investigations Report 2005–5257, 45 p. [Also available at https://doi.org/10.3133/sir20055257.]
Delaware Department of Agriculture and the U.S. Department of Agriculture National Agricultural Statistics Service [USDA-NASS], 2020, Delaware agricultural statistics bulletin: Delaware Department of Agriculture and the U.S. Department of Agriculture National Agricultural Statistics Service, 17 p., accessed December 5, 2023, at https://www.nass.usda.gov/Statistics_by_State/Delaware/Publications/Annual_Statistical_Bulletin/2019/2019-2020-Delaware-Agricultural-Statistics-Bullet in.pdf.
Denver, J.M., 1986, Hydrogeology and geochemistry of the unconfined aquifer, west-central and southwestern Delaware: Delaware Geological Survey Report of lnvestigations No. 41, 100 p., accessed September 10, 2022 at https://www.dgs.udel.edu/sites/default/files/publications/RFI%2041.jpg.
Denver, J.M., 1989, Effects of agricultural practices and septic-system effluent on the quality of water in the unconfined aquifer in parts of eastern Sussex County, Delaware: Delaware Geological Survey Report of lnvestigations No. 45, 66 p., accessed September 10, 2022, at https://www.dgs.udel.edu/sites/default/files/publications/ri45.pdf.
Denver, J.M., and Nardi, M.R., 2016, Thickness of the Surficial Aquifer, Delmarva Peninsula, Maryland and Delaware: U.S. Geological Survey Data Release, accessed September 10, 2022, at https://doi.org/10.5066/F7610XFT.
Denver, J.M., Ator, S.W., Debrewer, L.M., Ferrari, M.J., Barbaro, J.R., Hancock, T.C., Brayton, M.J., and Nardi, M.R., 2004, Water quality in the Delmarva Peninsula, Delaware, Maryland, and Virginia, 1999–2001: Reston, Va: U.S. Geological Survey Circular 1228, 36 p. accessed September 10, 2022, at https://pubs.usgs.gov/circ/2004/1228/pdf/circular1228.pdf.
Deridder, A., Kalluri, S., and Holdai, V., 2021, A retrospective chart review evaluating the relationship between cancer diagnosis and residential water source on the lower eastern short of Maryland, USA: International Journal of Environmental Research and Public Health, v. 18, no. 1, 13 p., accessed November 10, 2022, at https://doi.org/10.3390/ijerph18010145.
Dieter, C.A., Maupin, M.A., Caldwell, R.R., Harris, M.A., Ivahnenko, T.I., Lovelace, J.K., Barber, N.L., and Linsey, K.S., 2018, Estimated use of water in the United States in 2015: U.S. Geological Survey Circular 1441, 65 p., accessed January 21, 2022, at https://doi.org/10.3133/cir1441. [Supersedes USGS Open-File Report 2017–1131.]
Denver, J.M., Soroka, A.M., Reyes, B., Lester, T.R., Bringman, D.A., and Brownley, M.S., 2018, Monitoring the water-quality response of agricultural conservation practices in the Bucks Branch watershed, Sussex County, Delaware, 2014–16: U.S. Geological Survey Scientific Investigations Report 2018–5020, 43 p., at https://doi.org/10.3133/sir20185020.
Domagalski, J., and Johnson, H. M., 2011, Subsurface transport of orthophosphate in five agricultural watersheds, USA: Journal of Hydrology, v. 409, no. 1–2, p. 157–171, accessed October 20, 2022, at https://doi.org/10.1016/j.jhydrol.2011.08.014.
Fishman, M.J., ed., 1993, Methods of analysis by the U.S. Geological Survey National Water Quality Laboratory—Determination of inorganic and organic constituents in water and fluvial sediments: U.S. Geological Survey Open File Report 93–125, 217 p., accessed April 11, 2017, at https://nwql.usgs.gov/rpt.shtml?OFR-93-125. [Now available at https://pubs.usgs.gov/publication/ofr93125.]
Fleming, B.J., Mensch, L.L., Denver, J.M., Cruz, R.M., and Nardi, M.R., 2017, Water quality in the surficial aquifer near agricultural area in the Delaware Coastal Plain, 2014: U.S. Geological Survey Scientific Investigations Report 2017–5054, 28 p., accessed September 13, 2021, at https://doi.org/10.3133/sir20175054.
Fox, R.J., Fisher, T.R., Gustafson, A.B., Koontz, E.L., Lepori-Bui, M. & Kvalnes, K.L., Bunnell-Young, D.E., Gardner, J.R., Lewis, J., Winsten, J.R., Fisher, K.A., Silaphone, K., 2021, An evaluation of the Chesapeake Bay management strategy to improve water quality in small agricultural watersheds: Journal of Environmental Management, v. 299, no. 113478, accessed October 14, 2022, at https://doi.org/10.1016/j.jenvman.2021.113478.
Hamilton, P.A., Denver, J.M., Phillips, P.J., and Shedlock, R.J., 1993, Water-quality assessment of the Delmarva Peninsula, Delaware, Maryland, and Virginia—Effects of agricultural activities on, and distribution of, nitrate and other inorganic constituents in the surficial aquifer: U.S. Geological Survey Open-File Report 93–40, 87 p. [Also available at https://doi.org/10.3133/ofr9340.]
Helsel, D.R., Hirsch, R.M., Ryberg, K.R., Archfield, S.A., and Gilroy, E.J., 2020, Statistical methods in water resources: U.S. Geological Survey Techniques and Methods, book 4, chap. A3, 458 p., accessed October 12, 2022, at https://doi.org/10.3133/tm4A3. [Supersedes USGS Techniques of Water-Resources Investigations, book 4, chap. A3, version 1.1.]
Kendall, C., Elliot, E.M., and Wankel, S.D., 2007, Tracing anthropogenic inputs of nitrogen to ecosystems, chap. 12 of Michener, R., and Lajtha, K., eds., Stable isotopes in ecology and environmental science (2d ed.): Malden, Massachusetts, Black Well Publishing Ltd, p. 375–449, accessed November 10, 2022, at https://doi.org/10.1002/9780470691854.ch12.
Koterba, M.T., Wilde, F.D., and Lapham, W.W., 1995, Ground-water data-collection protocols and procedures for the national water-quality assessment program: collection and documentation of water-quality samples and related data: U.S. Geological Survey Open file Report 95–399, 113 p., accessed December 5, 2023 at https://pubs.usgs.gov/of/1995/ofr-95-399/pdf/of95-399.pdf.
Lindsey, B.D., Fleming, B.J., Goodling, P.J., Dondero, A.M., 2023, Thirty years of regional groundwater-quality trend studies in the United States—Major findings and lessons learned: Journal of Hydrology, v. 627, Part A, accessed December 10, 2023, at https://doi.org/10.1016/j.jhydrol.2023.130427.
Masterson, J.P., Pope, J.P., Fienen, M.N., Monti, J., Jr., Nardi, M.R., and Finkelstein, J.S., 2016, Assessment of groundwater availability in the Northern Atlantic Coastal Plain aquifer system from Long Island, New York, to North Carolina: U.S. Geological Survey Professional Paper 1829, 76 p., accessed April 14, 2017, at https://doi.org/10.3133/pp1829.
McMahon, P.B., 2012, Use of classes based on redox and groundwater age to characterize the susceptibility of principal aquifers to changes in nitrate concentrations, 1991 to 2010: U.S. Geological Survey Scientific Investigations Report 2012–5220, 41 p. [Also available at https://doi.org/10.3133/sir20125220.]
Michalski, G., Kolanowski, M., and Riha, K.M., 2015, Oxygen and nitrogen isotopic composition of nitrate in commercial fertilizers, nitric acid, and reagent salts: Isotopes in Environmental and Health Studies, v. 51, no. 3, p. 382–391, accessed November 10, 2022, at https://doi.org/10.1080/10256016.2015.1054821.
Mueller, S.M., Messina, C.D., and Vyn, T.J., 2019, Simultaneous gains in grain yield and nitrogen use efficiency over 700 years of maize genetic improvement: Scientific Reports, v. 9, no. 9095, accessed April 12, 2022, at https://doi.org/10.1038/s41598-019-45485-5.
Mullaney, J.R., Lorenz, D.L., and Arntson, A.D., 2009, Chloride in groundwater and surface water in areas underlain by the glacial aquifer system, northern United States: U.S. Geological Survey Scientific Investigations Report 2009–5086, 41 p., accessed April 18, 2021, at https://pubs.usgs.gov/sir/2009/5086/.
National Water Quality Monitoring Council, [undated], Water quality portal: National Water Quality Monitoring Council, United States Geological Survey (USGS), and U.S. Environmental Protection Agency (EPA) database, accessed December 1, 2023, at https://doi.org/10.5066/P9QRKUVJ.
National Oceanic and Atmospheric Association National Centers for Environmental Information, [undated], Climate at a Glance Statewide Time Series: National Oceanic and Atmospheric Association National Centers for Environmental Information database, accessed August 29, 2024, at https://www.ncei.noaa.gov/access/monitoring/climate-at-a-glance/statewide/time-series.
Palmer, W.C., 1965, Meteorological drought: U.S. Weather Bureau Research Paper No. 45, 58 p., accessed January 5, 2021, at https://www.droughtmanagement.info/literature/USWB_Meteorological_Drought_1965.pdf.
Révész, K.M., Buck, B., and Coplen, T.B., 2012, Determination of the δ2H and δ18O of soil water and water in plant matter; RSIL lab code1700: U.S. Geological Survey Techniques and Methods, book 10, chap. C19, 21 p., accessed September 5, 2022, at https://pubs.usgs.gov/tm/10c19/.
Reyes, B., 2010, Occurrence and distribution of organic chemicals and nutrients and comparison of water-quality data from public drinking-water supplies in the Columbia aquifer in Delaware, 2000–08: U.S. Geological Survey Scientific Investigations Report 2010–5206, 64 p. [Also available at https://doi.org/10.3133/sir20105206.]
Sekellick, A.J., Ator, S.W., Devereux, O.H., Keisman, J.L., 2023, Estimated reduction of nitrogen in streams of the Chesapeake Bay in areas with agricultural conservation practices: PLOS Water, v. 2, no. 5, accessed December 10, 2023, at https://doi.org/10.1371/journal.pwat.0000108.
Sharpley, A., Jarvie, H.P., Buda, A., May, L., Spears, B., Kleinman, P. 2013, Phosphorus legacy—Overcoming the effects of past management practices to mitigate future water quality impairment: Journal of Environmental Quality, v. 42, no. 5, p. 1308–1326, accessed December 10, 2023, at https://doi.org/10.2134/jeq2013.03.0098.
Shedlock, R.J., Denver, J.M., Hayes, M.A., Hamilton, P.A., Koterba, M.T., Bachman, L.J., Phillips, P.J., and Banks, W.S.L., 1999, Water-quality assessment of the Delmarva Peninsula, Delaware, Maryland, and Virginia—Results of investigations, 1987–91: U.S. Geological Survey Water Supply Paper 2355–A, 41 p. [Also available at https://doi.org/10.3133/wsp2355A.]
Stahl, M.O., Gehring, J., Jameel, Y., 2020, Isotopic variation in groundwater across the conterminous United States—Insight into hydrologic processes: Hydrological Processes, v. 34, no. 16, p. 3506– 3523, accessed December 10, 2023, at https://doi.org/10.1002/hyp.13832.
Schullehner, J., Hansen, B., Thygesen, M., Pedersen, C.B., Sigsgaard, T., 2018, Nitrate in drinking water and colorectal cancer risk—A nationwide population-based cohort study: International Journal of Cancer, v. 143, no. 1, p. 73–79, accessed December 10, 2023, at https://doi.org/10.1002/ijc.31306.
Ullman, W.J., Andres, A.S., Scudlark, J.R., and Savidge, K.B., 2007, Storm-water and base-flow sampling and analysis in the Nanticoke River Watershed—Preliminary report of findings 2002–2004: Delaware Geological Survey Open File Report R4, 14 p. Accessed August, 28, 2023, at https://www.dgs.udel.edu/sites/default/files/publications/OFR46.pdf.
University of Delaware, 2023, Nutrient management: University of Delaware website, accessed December 21, 2023, at https://www.udel.edu/academics/colleges/canr/cooperative-extension/environmental-stewardship/nutrient-management/.
U.S. Department of Agriculture National Agricultural Statistics Service [USDA-NASS], 2017, Quick Stats: U.S. Department of Agriculture National Agricultural Statistics Service, accessed August 26, 2021, at https://quickstats.nass.usda.gov/.
U.S. Department of Agriculture National Agricultural Statistics Service [USDA-NASS], [undated], CropScape—Cropland Data Layer: U.S. Department of Agriculture National Agricultural Statistics Service, accessed August 26, 2021, at https://nassgeodata.gmu.edu/CropScape/.
U.S. Department of Agriculture Natural Resources Conservation Service, 2013, Natural Resources Conservation Service Conservation Practice Standard—Nutrient Management (Ac.) Code 590: U.S. Department of Agriculture Natural Resources Conservation Service, 12 p., accessed February 20, 2021, at https://agriculture.delaware.gov/wp-content/uploads/sites/108/2017/12/Nutrient-Management-590.pdf.
U.S. Environmental Protection Agency [EPA], 2000, Ambient water quality criteria recommendations—Information supporting the development of state and tribal nutrient criteria—Rivers and streams in nutrient ecoregion XIV: U.S. Environmental Protection Agency EPA 822-B-00-022, [variously paged, 84 p.], accessed December 10, 2023, at https://www.epa.gov/sites/default/files/documents/rivers14.pdf.
U.S. Environmental Protection Agency [EPA], 2024a, National primary drinking water regulations, accessed February 28, 2024, at https://www.epa.gov/ground-water-and-drinking-water/national-primary-drinking-water-regulations.
U.S. Environmental Protection Agency [EPA], 2024b, Secondary drinking water standards—Guidance for nuisance chemicals, accessed February 28, 2023, at https://www.epa.gov/sdwa/secondary-drinking-water-standards-guidance-nuisance-chemicals.
U.S. Geological Survey [USGS], [variously dated], National field manual for the collection of water-quality data: U.S. Geological Survey Techniques of Water-Resources Investigations, book 9, chaps. Al–A9, accessed May 19, 2014, at https://pubs.water.usgs.gov/twri9A.
U.S. Geological Survey [USGS], [undated], Choptank River Near Greensboro, MD—01491000: U.S. Geological Survey National Water Information System, accessed February 2, 2022, at https://waterdata.usgs.gov/monitoring-location/01491000/#parameterCode=00065&period=P7D&showMedian=false.
U.S. Geological Survey [USGS], 2016, U.S. Geological Survey National Water Information System, accessed February 2, 2022, at https://waterdata.usgs.gov/nwis/qw.
Ward, M.H., Jones, R.R., Brender, J.D., De Kok, T.M., Weyer, P.J., Nolan, B.T., Villanueva, C.M., and Van Breda, S.G., 2018, Drinking water nitrate and human health—An updated review: International Journal of Environmental Research and Public Health, v. 15, no. 7, 31 p., accessed November 10, 2022, at https://doi.org/10.3390/ijerph15071557.
Wherry, S.A, Tesoriero, A.J., Terziotti, S., 2021, Factors affecting nitrate concentrations in stream base flow: Environmental Science and Technology, v. 55, no. 2, p. 902–911, accessed November 10, 2022, at https://doi.org/10.1021/acs.est.0c02495.
Datum
Vertical coordinate information is referenced to North American Vertical Datum of 1988 (NAVD 88). Elevation, as used in this report, refers to distance above the vertical datum.
Horizontal coordinate information is referenced to the North American Datum of 1983 (NAD 83), universe trans mercator (UTM) zone 18 North.
Supplemental Information
Specific conductance is given in microsiemens per centimeter at 25 degrees Celsius (µS/cm at 25 °C).
Concentrations of chemical constituents in water are given in either milligrams per liter (mg/L) or micrograms per liter (µg/L).
Definitions
Abbreviations and Symbols
‰
per mil
δ
delta
DDA
Delaware Department of Agriculture
EPA
U.S. Environmental Protection Agency
NWQL
National Water Quality Laboratory
PDSI
Palmer Drought Severity Index
RPD
relative percent difference
USDA
U.S. Department of Agriculture
USDA-NASS
U.S. Department of Agriculture National Agricultural Statistics Service
USGS
U.S. Geological Survey
WRS
Wilcoxon Rank Sum
WSR
Wilcoxon Signed Rank
For more information about this report, contact,
Director, Maryland-Delaware-DC Water Science Center,
U.S. Geological Survey,
5522 Research Park Dr.,
Baltimore, Maryland 21228
Or visit to our website at
https://www.usgs.gov/centers/md-de-dc-water
Publishing support provided by the Baltimore Publishing Service Center
Disclaimers
Any use of trade, firm, or product names is for descriptive purposes only and does not imply endorsement by the U.S. Government.
Although this information product, for the most part, is in the public domain, it also may contain copyrighted materials as noted in the text. Permission to reproduce copyrighted items must be secured from the copyright owner.
Suggested Citation
Soroka, A.M., Reyes, B., Fleming, B., and Brownley, M., 2024, Comparison of water quality in shallow groundwater near agricultural areas in the Delaware Coastal Plain, 2014 and 2019: U.S. Geological Survey Scientific Investigations Report 2024–5076, 23 p., https://doi.org/10.3133/sir20245076.
ISSN: 2328-0328 (online)
Study Area
| Publication type | Report |
|---|---|
| Publication Subtype | USGS Numbered Series |
| Title | Comparison of water quality in shallow groundwater near agricultural areas in the Delaware Coastal Plain, 2014 and 2019 |
| Series title | Scientific Investigations Report |
| Series number | 2024-5076 |
| DOI | 10.3133/sir20245076 |
| Publication Date | October 01, 2024 |
| Year Published | 2024 |
| Language | English |
| Publisher | U.S. Geological Survey |
| Publisher location | Reston, VA |
| Contributing office(s) | Maryland-Delaware-District of Columbia Water Science Center |
| Description | viii, 23 p. |
| Country | United States |
| State | Delaware |
| Online Only (Y/N) | Y |
| Additional Online Files (Y/N) | N |