

Quantifying Fine Sediment Infiltration in Spawning Gravel Used by Chinook Salmon (Oncorhynchus tshawytscha) in the Sauk River Basin, Washington, 2018–21
Links
- Document: Report (6.3 MB pdf) , HTML , XML
- Data Release: USGS data release - Sediment and dissolved oxygen data to support fine sediment intrusion in Chinook salmon spawning gravels, Sauk River, Washington
- Download citation as: RIS | Dublin Core
Acknowledgments
This study was funded by the Sauk-Suiattle Indian Tribe and the U.S. Geological Survey using Cooperative Matching Funds. Brett Barkdull from Washington Department of Fish and Wildlife provided guidance in study site selection. Kristin Bunte (Colorado State University) facilitated discussions of methods of bulk sediment sampling and study design. Chris Johnson (Washington Department of Fish and Wildlife) provided guidance on installation and extraction of Whitlock-Vibert boxes. Chauncey Anderson and Heather Bragg (US Geological Survey) provided infiltration bags and guidance on fabrication for new bags. Roger Peters (U.S. Fish and Wildlife Service) provided the bulk sediment sampling shield. Alex Headman, Sarah Dunn, Lynn Bell, Katie Seguin, Andrew Spanjer, Valerie Bright, Caitlin Johnson, Norm Peterson, James Foreman, and Julia David of the U.S. Geological Survey provided substantial help during field campaigns throughout the project. The staff from the Sauk-Suiattle Indian Tribe Natural Resources Department provided substantial help during field campaigns throughout the project.
Abstract
Fine sediment can infiltrate into river substrate that salmonid fish species (Oncorhynchus spp.) use to spawn. High levels of sediment infiltration can increase egg-to-fry mortality, which corresponds to the period when salmonids are still residing in the subsurface gravels. This study quantifies fine sediment infiltration of Chinook salmon (Oncorhynchus tshawytscha) spawning habitat during the egg-to-fry emergence period over three years in the Sauk River, which has naturally high fine sediment loads and important native salmon populations. Additionally, this study qualitatively assesses how grain size distribution of the riverbed and adjacent gravel bars compare to grain size distribution following fine sediment infiltration to evaluate if riverbed or gravel bar grain size distributions may provide information on the potential for fine sediment infiltration in spawning gravels.
Fine sediment infiltration into spawning gravels was quantified using sediment boxes and infiltration bags that were installed in artificial redds constructed at known Chinook salmon spawning locations at three study sites on the Sauk River over the expected egg-to-fry period. Over the three-year study period (August 2018–April 2021), fraction finer of sediment (grain sizes of less than 2 millimeters), ranged from 0.12 to 0.23 across the three study sites and years. Based on a comparison of field observations from this study and percentage egg-to-fry survival curves found in the literature, the expected survival for Chinook salmon eggs in the Sauk River is roughly 30 percent. Expected survival increases to approximately 90 percent if eggs are eyed and thus farther along in their development. Our field study did not evaluate the progression of infiltration, so it is unknown if observed fine sediment infiltration was at this relatively high rate during the period that corresponded to early egg development, when eggs are more sensitive to fine sediment infiltration. Dissolved oxygen in the gravels is largely above critically low levels (4 milligrams per liter) during sensitive periods corresponding to egg development and is interpreted not to affect egg-to-fry mortality. Active channel morphology in the middle reaches of the Sauk River may pose an additional challenge to pre-emergence survival. Channel change, deposition, and potential scour at the middle Sauk River study site likely contributed to low recovery rates of both sediment boxes and infiltration bags in two of the three study years.
In terms of grain size distributions of riverbed sediment and adjacent gravel bars representing the potential for fine sediment infiltration into spawning gravels, both riverbed and gravel bar bulk subsurface sediment samples had higher fraction finer for the representative fine grain size of two millimeters compared to the sediment boxes and infiltration bags. Therefore, riverbed and gravel bar samples may serve as a conservative first order proxy for potential fine sediment infiltration into spawning gravels, with the understanding that these samples may overestimate fine sediment infiltration by up to 15 percent.
Introduction
The Sauk River is a federally designated Wild and Scenic River, and it drains a relatively undeveloped landscape in the north Cascade Range of Washington State, which includes Glacier Peak, a glaciated stratovolcano (fig. 1). In Washington State, glaciated stratovolcanoes are dominant sources of regional sediment loads and can have significant consequences on morphology, flow-conveyance, and ecosystems in downstream rivers and estuaries (Czuba and others, 2010; 2012). Additionally, glaciated mountain basins have been shown to be sensitive to climatic change, which can alter the (1) areal extent and advance/retreat rates of glaciers, (2) seasonal extent of snowpacks, and (3) peak-flow hydrology. These changes in turn affect water and sediment regimes in these glaciated mountain basins (Beamer and others, 2005; Finger and others, 2012; Micheletti and others, 2015; Lane and others, 2017; Anderson and Shean, 2021, Schwat and others, 2023).
Jaeger and others (2017) reported on suspended-sediment regimes in the Sauk River Basin, including major tributaries. The results of this study indicated the Suiattle River tributary contributes approximately 80 percent of the suspended-sediment load in the Sauk River system. In addition, the sediment-rich east flank of Glacier Peak, a headwater to the Suiattle River, is likely responsible for about half of the suspended-sediment load exiting the Sauk River Basin and entering the Skagit River and Puget Sound. Suspended-sediment loads are highly variable from year to year, driven by the autumn-to-early-winter storm activity and the incident geomorphic conditions in the basin, such as recent debris flows that are important sediment sources to the river (Jaeger and others, 2017; Fordham and others, 2023). Under these conditions, turbidity monitoring, as a surrogate for suspended sediment, can be useful for identifying the events that contribute to variability in sediment loads, which in turn provide important context of catchment conditions and sediment availability that can have ecological implications, such as fine sediment infiltration, in salmon (Oncorhynchus spp.) spawning habitat.
Several salmonid species spawn in the Sauk River Basin, including three populations of endangered Chinook salmon (Oncorhynchus tshawytscha; Beamer and others, 2005; National Marine Fisheries Service, 2005; 2007). The three Chinook salmon populations are Suiattle River spring Chinook salmon, which spawn in the tributary confluences of the Suiattle River; upper Sauk River spring Chinook salmon, which spawn in the Sauk River main stem at distinct locations upstream from the Suiattle River confluence and extend to upstream from the White Chuck River confluence; and lower Sauk River summer Chinook salmon, which spawn in the Sauk River main stem and its tributaries upstream and downstream from the Suiattle River (fig. 1; Beamer and others, 2005). Limited documented spawning in the lower Sauk River downstream from the Suiattle River is attributed to the high sediment loads delivered by the Suiattle River and elevated sediment loads in tributaries associated with relatively recent mass wasting (for example, early 2000s) and timber harvest activities (Beamer and others, 2000, 2005).
Fine sediment deposition and infiltration into redds can adversely affect egg-to-fry survival (Wesche and others, 1989; Jensen and others, 2009; Chapman and others, 2014). Based on a meta-analysis of existing studies that measured the effect of fine sediment on egg-to-fry survival, a 1-percent increase in fine sediment, variously defined within the different studies as material from less than (<) 0.85 to <6.4 millimeters (mm), within spawning gravels can decrease the predicted chance of egg-to-fry survival by 4–18 percent for Chinook salmon, coho salmon (Oncorhynchus kisutch), chum salmon (Oncorhynchus keta), and steelhead trout (Oncorhynchus mykiss), with larger decreases associated with the finer sediment size (fig. 2; Jensen and others, 2009). In general, spawning gravels with 12–14 percent fine sediments <1 mm are thresholds that would reduce emergence success to <50 percent (Kondolf, 2000) and emergence successes substantially drop when fine sediments reach from 20 to 30 percent (Jensen and others, 2009). In addition, high representation of slightly coarser fine sediment (3, 6, and 10 mm) can limit fry emerging from gravels (reviewed by Kondolf, 2000). Consequently, salmonid species are moderately intolerant to intolerant relative to fine sediment infiltration into gravels during the fry emergence and eyed periods (Chapman and others, 2014).
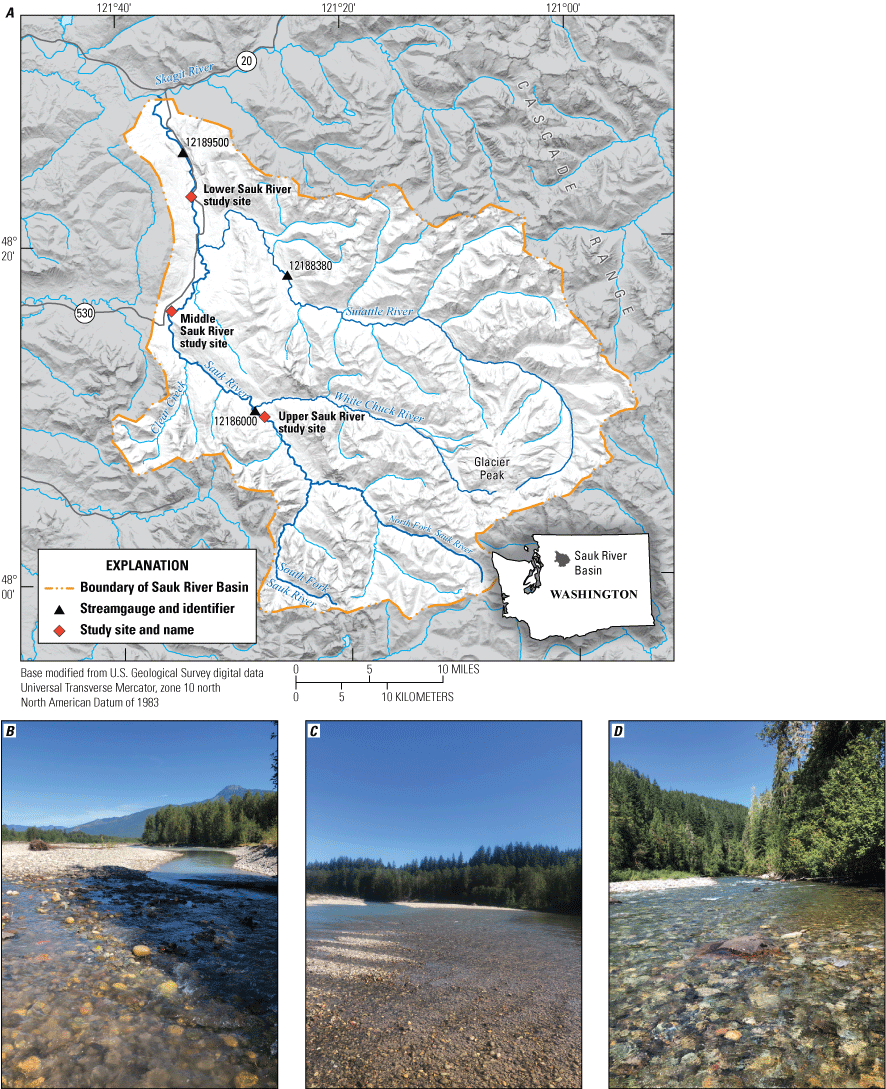
Study locations in the Sauk River Basin, northwestern Washington (A), which include the lower Sauk River study site downstream from Suiattle River confluence (B), middle Sauk River study site upstream from Suiattle River confluence (C), and upper Sauk River study site upstream from White Chuck River (D).
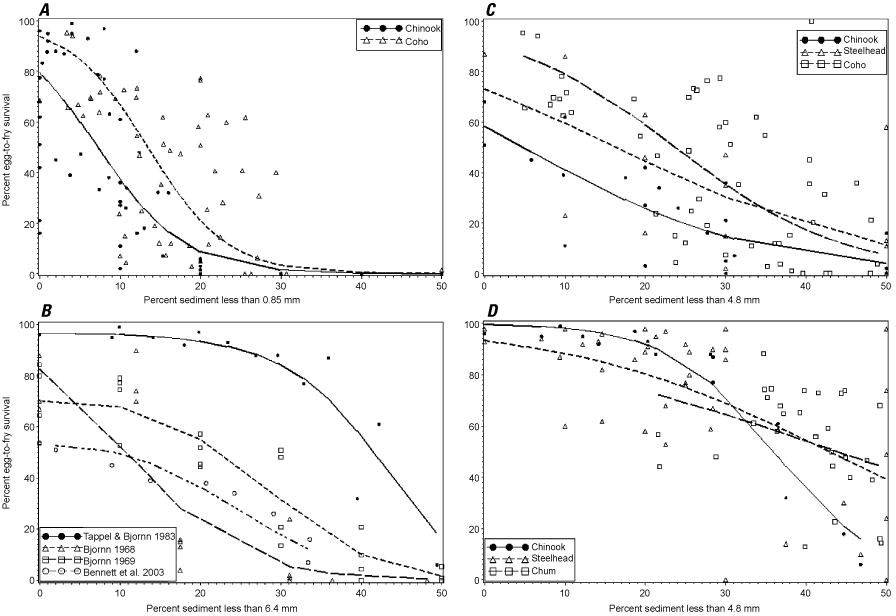
Percentage egg-to-fry survival curves as a function of percentage finer grain size classes less than (<) 0.85 millimeter (mm) (A), <6.4 mm (B), <4.8 mm that correspond to the green egg life period (C), and <4.8 mm for the eyed egg life period (D) for Chinook salmon (Oncorhynchus tshawytscha), steelhead trout (O. mykiss), Coho salmon (O. kisutch), and chum salmon (O. keta) (adapted from Jensen and others, 2009).
Purpose and Scope
The primary purpose of this study is to quantify fine sediment infiltration into Chinook salmon spawning gravels in the Sauk River during the incubation and pre-emergence periods. The Sauk River was selected because of its relatively pristine watershed conditions as an unregulated, forested mountain river that has robust populations of Chinook salmon along Sauk River main stem. The Sauk River has naturally high fine sediment loads because of basin geology and headwaters draining Glacier Peak, a heavily glaciated stratovolcano. A secondary purpose of the study is to determine if fine sediment infiltration of salmon redds can be qualitatively assessed by more easily measured factors, such as subsurface sediment samples within the channel at salmon spawning sites or on nearby exposed bars.
Study Area Description
The study was conducted in the main stem Sauk River (drainage area 1,896 square kilometers [km2]), which is free flowing and drains a relatively undeveloped landscape in the northern Cascade Range of Washington State (fig. 1). Principal tributaries are the White Chuck River (drainage area 222 km2) and the Suiattle River (drainage area 890 km2), which both drain Glacier Peak.
Basin geology is characterized by a north-south-trending fault that separates different geologic units (Tabor and others, 2002). The western half of the basin, which comprises the Sauk River main stem and downstream portions of the White Chuck and Suiattle Rivers, is composed of a diverse combination of sedimentary, intrusive, volcanic, and metasedimentary and metavolcanic units. The eastern half of the basin, which underlies most the White Chuck and Suiattle River Basins, is composed of intrusive and high-grade metamorphic units. The heavily glaciated Glacier Peak is composed of younger volcanic rocks relative to the surrounding area and lahars (volcanic debris flows). The eastern flank of Glacier Peak, feeding the headwaters of the Suiattle River, is particularly geomorphically active (Slaughter, 2004) and is a dominant source of sediment transported through the Suiattle River.
The Sauk River valley upstream from the White Chuck River confluence is unconsolidated glacial drift. Downstream from the White Chuck River, the river valley is mostly unconsolidated alluvium, landslide deposits, and glacial drift. The Sauk River is a coarse-grained, gravel-bedded alluvial mountain river that is single-thread meandering with pool-riffle morphology (Keck and others, 2022) with multi-threaded reaches that correspond to widened valley sections and extensive gravel bars downstream from the Suiattle River confluence, attributed in part to the high sediment loads delivered by the Suiattle River. The Suiattle River, which represents approximately 47 percent of the Sauk River Basin area, accounts for approximately 80 percent of the suspended-sediment load for Sauk River (Jaeger and others, 2017). Suspended-sediment load is approximately equal between the White Chuck River Basin and the upper Sauk River, despite headwaters of the White Chuck River draining Glacier Peak (Jaeger and others, 2017).
Watershed land cover is forested and primarily under U.S. Forest Service jurisdiction, with private ownership in the lower river. The Sauk River Basin climate is temperate, with cold, wet winters and warm, dry summers. Mean annual precipitation ranges from approximately 1,500 millimeters per year in river valleys to 3,300 millimeters per year at higher elevation ridges (Livneh and others, 2013). The streamflow regime has peak flows occurring during the autumn–winter (November–February) precipitation, additional high flows during spring snowmelt (April–June), and low summertime-based flows (July–September) that include glacial meltwater.
The three study sites are distributed along the main stem river to capture (1) the high elevation, mountain river conditions of the upper Sauk River upstream from the White Chuck River confluence (river kilometer [RKM] 51), (2) the middle alluvial reach upstream from the Suiattle River confluence (RKM 31), which does not have the high sediment loads from that river, and (3) the sediment rich lower river that has higher contributions of sand and finer sediments from the Suiattle River (RKM 15) relative to the Sauk River main stem. All three study sites have an adjacent gravel bar and correspond to the top of a riffle where Chinook salmon are known to spawn (Brett Barkdull, Washington Department of Fish and Wildlife, oral communication, 2018). The upper and middle Sauk River study sites are at the downstream end of gravel bars in a single-threaded reach of the river. The lower Sauk River study site is at the upstream end of a gravel bar of a side channel from the main stem. The channels are gravel and cobble bedded in a matrix of coarse sand with lower Sauk River characterized by a sandier matrix (fig. 1).
Methods
To address the primary objective of quantifying fine sediment infiltration in Chinook salmon spawning habitat, sediment boxes and infiltration bags were installed in artificial redds, which were constructed at known Chinook salmon spawning locations, to capture fine sediment infiltration during the incubation and pre-emergence periods (table 1). Artificial redds mimicked the physical design of Chinook salmon spawning redds, including removal of finer grained sediment (small gravel and finer) in the sediment matrix, which was typically achieved passively in the stream current. Dissolved oxygen sensors were installed within artificial redds in study years 2 and 3 (table 1). To address the secondary objective to evaluate if fine sediment infiltration can be determined based on study site sediment conditions, subsurface sediment sampling within the channel and on the adjacent gravel bar was conducted during each installation and retrieval effort of the sediment boxes and infiltration bags. Turbidity monitoring in the lower Sauk and Suiattle Rivers occurred throughout the study period (August 2018–April 2021) as a proxy for sediment transport in the river. The study captured three annual field campaigns that bracketed the incubation and pre-emergence period with continuous streamflow and turbidity monitoring.
Table 1.
Sample sizes of field-monitoring components at each of the three study sites (upper, middle, and lower Sauk River) throughout the study period (August 2018–April 2021).[Numbers represent the sample size of each component. Installation period was in August of each year. Recovery period was during late February to early April, once water temperatures at each study site had reached between 980 and 1,000 accumulated thermal units.]
Installation, Recovery, and Data Collection
To avoid disturbance of spawning activity, which typically begins in autumn, installation of the infiltration boxes, infiltration bags, and dissolved oxygen sensors occurred in August 2018, 2019, and 2020 when streamflow was minimal (table 2). The August timing of installation was constrained by permitting guidelines that require activities in the channel to occur outside of important life history windows for Chinook salmon. At the time of installation, the geographic location of all data collection equipment buried in the channel bed were mapped either by recording the distances of two intersecting field tapes from two different locations along the bank or were recorded using real-time kinematic positioning.
Table 2.
Installation and recovery dates at each of the three study sites throughout the three-year study period (August 2018–April 2021).[Installation dates represent period of installation across the three study sites. Recovery period was during late February to early April, once water temperatures at each study site had reached between 900 and 980 accumulated thermal units.]
Recovery of monitoring features occurred at the three study sites when water temperatures reached 900–980 accumulated thermal units (ATUs; measured in degrees Celsius), which approximately corresponds to the period of at least 50 percent emergence of Chinook salmon alevins from the subsurface (Geist and others, 2006; Beacham and Murray, 1989). This pre-emergence period includes the time to hatch from embryo to alevin, which occurs at approximately 525 ATUs (Beacham and Murray, 1989), after which, the alevins remain in the subsurface for further development. Accumulated thermal units are calculated by summing daily mean water temperature forward in time from the estimated mid-point of the spawning period at each study site. Dates demarcating the mid-point of the spawning season were informed by Washington Department of Fish and Wildlife expertise of Chinook salmon spawning in the Sauk River (Brett Barkdull, Washington Department of Fish and Wildlife, written commun., 2018–20). For study year 1, spawning mid-point dates were September 15 for upper Sauk River study site, October 1 for middle Sauk River study site, and October 15 for lower Sauk River study site. For study years 2 and 3, spawning mid-point dates were September 20 for upper Sauk River study site, September 25 for middle Sauk River study site, and October 1 for lower Sauk River study site. Later spawning dates for the downstream study sites is driven by higher downstream water temperatures such that spawning activity is delayed until water temperatures have cooled sufficiently (Baisez and others, 2011). The period between installation and the assigned mid-point spawning period date was not included in the ATU calculation because it would have resulted in an earlier recovery date that did not correspond with the approximate emergence period. Accumulated thermal units for upper Sauk River study site were based on daily temperature summarized from 15-minute temperature data at streamflow station Sauk River AB White Chuck River NR Darrington, WA (12186000, U.S. Geological Survey, 2022a), which was less than 1 kilometer (km) downstream from upper Sauk River study site. Accumulated thermal units for the middle and lower Sauk River study sites were based on daily temperature summarized from 15-minute temperature data at streamflow station Sauk River near Sauk, WA (12189500, U.S. Geological Survey, 2022b), which was approximately 22 and 6 km, downstream from the middle and lower Sauk River study sites, respectively. Recovery was generally in late February at upper Sauk River study site and early March to mid-April at middle and lower Sauk River study sites and occurred during winter low flow conditions.
Sediment Infiltration Boxes
Fine sediment infiltration during the incubation/pre-emergence period was measured using modified Whitlock-Vibert (WV) boxes, which were buried in constructed artificial redds in known Chinook salmon spawning locations. WV boxes were 13.5 × 6.0 × 8.7 (length × width × height) centimeters (cm) perforated polypropylene boxes used for fish egg planting in streams (Garrett and Bennett, 1996), but have been used for measuring fine sediment infiltration in streams (Wesche and others, 1989; Johnson and others, 2012). The top portion of the WV box included an egg tray with a protected egg chamber in which salmon embryos were placed for incubation (fig. 3). Alevins then drop down into the lower portion of the box in a protected nursery chamber, before exiting the box as fry during the emergence period. Use of the WV boxes followed methods similar to other studies (Johnson and others, 2012; Wesche and others, 1989) in which the egg tray was removed and the bottom of the box was lined with duct tape to prevent finer sediment exiting the box from the bottom. Each box contained a capped vial containing a passive integrated transponder (PIT tag, Biomark 23 mm) (fig. 1B–D). Leashed to the outside of the box was an approximately 20-cm long nylon string to which a second vial contained a second PIT tag; one to two additional strings with neon-colored floats (0.5-inch Worden Lil Corky) attached to the box to aid in retrieval (fig. 3C).
Each box was (1) pre-filled with sediment with a target total mass of 1050 grams and (2) approximately matched the grain size distribution of each study site with grain sizes less than 8 mm removed. The sediment grade scale that includes grain sizes between 8 and 4 mm correspond to fine gravel (Julien, 2010). Grain sizes 4.8 mm or less, which are on the small end of this grade class of fine gravel, have been included in fine sediment egg-to-fry survival curves (Jensen and others, 2009). Grain size distributions for each of the three study sites were derived from bulk sediment samples on exposed gravels bars at each study site conducted in the summer of study year 1, prior to the first installation. Grain size distribution specific to each of the three study study sites (hereafter, “pre-installed” grain size distributions) was used for all three study years.
WV boxes were buried in artificial redds that mimic Chinook salmon redds (Johnson and others, 2012; Buxton and others, 2015, Julien and Bergeron, 2006). Artificial redds were constructed by excavating approximately 30 cm into the riverbed and depositing displaced sediment directly downstream (fig. 4A). WV boxes were installed at the base of the excavated hole. The hole was then carefully backfilled with part of the displaced sediment placed downstream from the excavated hole with fines removed by the streamflow current to create the tailspill zone that is consistent with salmon redd construction (fig. 4B). Sediment immediately upstream from the filled hole containing the buried WV box was excavated to a depth of approximately 15 cm to create the pot zone (fig. 4B). In study year 1, a subset of WV boxes was installed at approximately 10 cm depth to evaluate if fine sediment infiltration was limited to the higher portion of the redd. In study years 2 and 3, all WV boxes were buried at 30 cm depth. WV boxes were installed in an approximately rectangular array within the study area, with spacing sufficient that installation and subsequent retrieval were not expected to affect adjacent study sites of buried monitoring features.
WV boxes were recovered by first identifying their approximate location using either triangulation with the taped distances or using the real-time kinematic positioning in combination with a handheld PIT tag detector. Some careful shoveling was usually necessary in combination with the PIT tag detector until the visual markers of the WV boxes were identified. A four-sided plywood shield was positioned immediately upstream from the exposed egg box to create a localized area of no flow around the WV box. A sealing plastic approximately 3.8-liter (1-gallon) bag (study year 1) or an 1,893 cubic centimeter (cm3) plastic lidded container (study years 2 and 3) was submerged immediately downstream from the exposed WV box. The WV box was then gently lifted, and the plastic bag or rigid container brought under the WV box to enclose the box. The bag or rigid container was then carefully brought to the surface and carried to the bank. Excess water was poured into additional labeled containers to be included in the analysis for that individual WV box and the bag or rigid container was labeled.
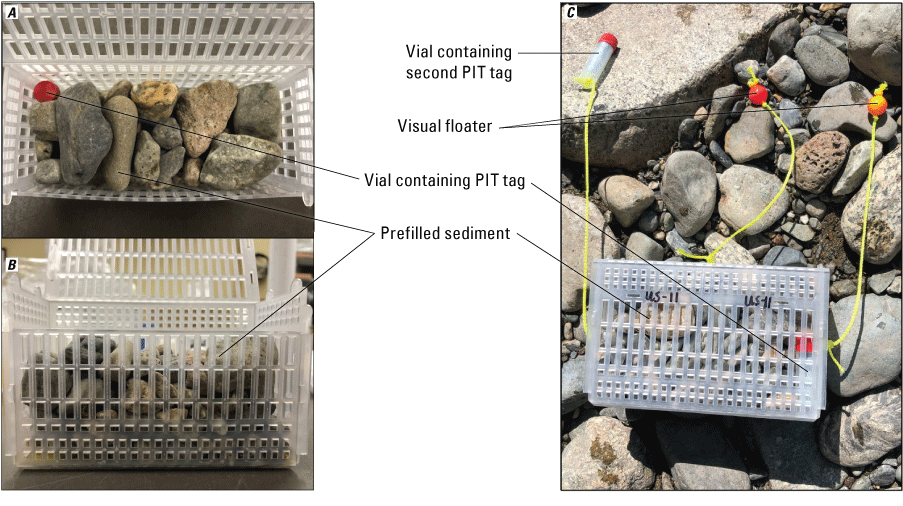
Whitlock-Vibert boxes with internal passive integrated transponder (PIT) tag (A), approximately three-quarters full side view (B), and unfilled with internal PIT tag (C).
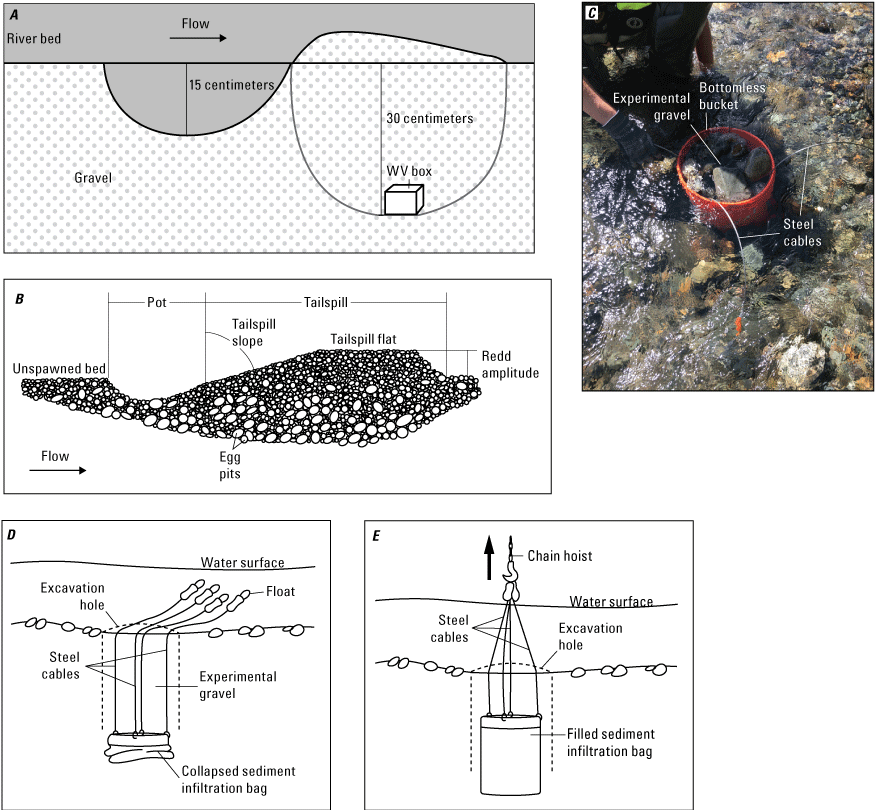
Artificial Chinook salmon (Oncorhynchus tshawytscha) redd and Whitlock-Vibert box placement (A, adapted from Johnson and others, 2012) to mimic salmon redd architecture (B, adapted from Buxton and others, 2015), infiltration bag installation (C, upper Sauk River study site, August 2020), and infiltration bag installation and extraction at the upper, middle, and lower Sauk River study sites (D and E, adapted from Lisle and Eads, 1991).
Sediment Infiltration Bags
There was concern that the extraction method of the WV box, which required excavation down to the WV box, may have inadvertently contributed additional fine sediment to the box that would not represent fine sediment infiltration that the study was intending to capture. Therefore, in study years 2 and 3 of the study, infiltration bags were installed at the study sites following methods described by Lisle and Eads (1991) and Anderson (2007) as an additional measure of fine sediment infiltration into the Chinook salmon spawning gravels (fig 4C–E). The extraction method of the infiltration bag eliminated the potential for additional fine sediment because the sediment column above the bag and extending to the surface was included in the sample. Infiltration bags were added for comparison to WV boxes.
Infiltration bags used in Anderson (2007) were installed in study year 2 (table 1). The approximate dimensions of the bags were 30.5-cm diameter and 46-cm depth. Additional bags were made following the design of Anderson (2007) to expand the sample size in study year 3 and replace unrecovered bags from study year 2 (table 1). Each infiltration bag had four stainless steel cables that were looped at the end extending from the top rim of the bag. PIT tags enclosed in capped vials were taped to the base and top of each of the four cables.
Infiltration bags were installed similarly to the WV boxes; however, a larger excavated area was required to accommodate the bags’ larger footprint. Excavated substrate was agitated in water to remove finer clast sizes and temporarily placed in a 19-liter (5-gallon) bucket. The collapsed bag was placed at the base of the pit at a depth of approximately 30 cm and held down with a bottomless 19-liter bucket with four stainless steel cables extending out (fig. 4C–E). The bottomless bucket and pit surrounding it was backfilled with substrate temporarily stored in the 19-liter buckets. The stainless steel cables extended through the backfilled substrate to lay on the surface of the riverbed.
Infiltration bags were recovered using the same location methods for locating the WV boxes until all four cables of an individual bag were located. Infiltration bags were extracted from the riverbed using a chain hoist (Kill Shot Tripod Game Hoist) positioned over the center of the bag (fig. 5). The four-sided plywood shield was placed immediately upstream from the hoist and infiltration bag location to create a localized area of no flow. Field assistants held down the plywood shield, which was buoyant when flow depths were higher than approximately 0.5 m. Water inside of the sediment infiltration bags was decanted into wide-mouth, 3.8-liter plastic jars; the substrate contents of the infiltration bags were poured into 19-liter lidded buckets, and the bags were placed in 19-liter lidded buckets to be included as part of the samples because of residual sediment adhering to the bags.
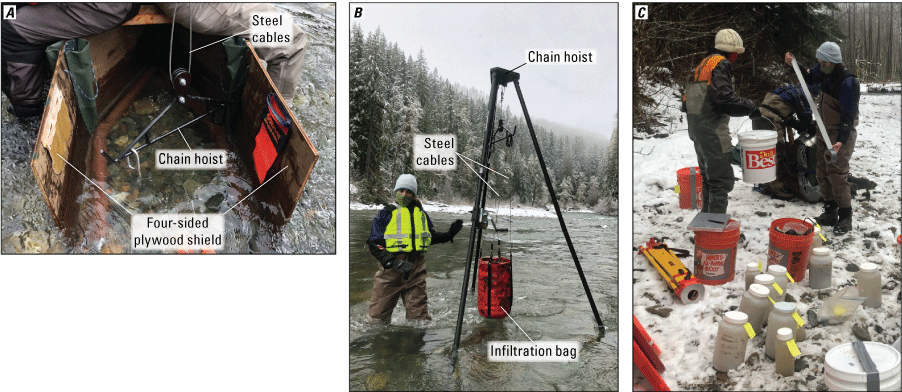
A four-sided plywood shield is installed immediately upstream from buried infiltration bag and chain hoist centered over buried infiltration bag (A), the infiltration bag hanging from chain hoist (B), and all material in the infiltration bag, including water and sediment, is packaged in on-site containers (C), upper Sauk River study site, March 2021.
Subsurface Bulk Sediment Sampling
Grain size distribution of bulk sediment (subsurface) is more representative of substrate conditions for salmon during redd construction than surface sediments alone (Kondolf, 2000). Bulk sediment sampling occurred within the wetted channel at the three study sites in identified spawning areas. The spawning areas were co-located with the artificial redds that house monitoring features (for example, WV boxes, infiltration bags, and dissolved oxygen [DO] sensors). Sampling occurred during low flow conditions prior to spawning activity upon August installation of in-channel monitoring features and again during recovery of those features to capture potential changes in grain size distribution at study sites (table 1). Subsurface samples collected at the three study sites include (1) the submerged channel, which were referred to as “wet sediment samples,” and (2) adjacent gravel bars, which were referred to as “dry sediment samples.” Sediment sampling and analysis followed established methods for sampling in submerged and dry areas (Bunte and Abt, 2001; Peters and others, 2017). Subsurface samples in submerged areas were collected following methods described in Peters and others (2017) and used a four-sided plywood shield to create a local area of no-flow for the sediment sampling (fig. 6). Subsurface samples in the submerged in-channel locations and dry gravel bars both included removing surface grains at a depth that was approximately equivalent to the largest clast on the surface (Bunte and Abt, 2001). Submerged samples were collected at approximately 30 cm, which is consistent with the installation depths of the WV boxes and infiltration bags. Gravel bar samples were collected at depths that approached 50–100 cm. Submerged samples were approximately 27–45 kilograms (60–100 pounds, approximately equivalent to a single, filled 19-liter bucket); gravel bar samples were approximately 91–113 kilograms (200–250 pounds). Clast sizes larger than 16 mm were sieved at half-phi intervals (logarithm to the base two of the particle diameter) and weighed in the field (fig. 7). The remaining portions of the samples were dried, subsetted, and sieved at full-phi intervals to 0.063 mm by the USGS Cascades Volcano Observatory (CVO) sediment lab. Turbid water associated with the submerged samples, and some dry gravel bar samples, was included as part of the sample analyzed by CVO sediment lab.
A single water grab sample was collected using a wide-mouthed one-liter container in the water column defined by bottomless bucket (29.2-cm maximum depth) that corresponded to the water column immediately above each bulk subsurface sample area (fig. 6B). The grab sample was processed for suspended-sediment concentration (SSC) analysis to account for fine sediments within the riverbed that had gone into suspension during the sampling process following Peters and others (2017). The suspended-sediment volume was derived by taking the product of the SSC and the volume of the bucket. One additional grab sample was collected adjacent to the sampling zone at a similar depth that did not exceed approximately 29 cm at each of the upper, middle, and lower Sauk River study sites for a representative background level suspended-sediment concentration. The single, background SSC was differenced from each of the grab samples from the bulk subsurface samples. The resulting SSC and volume of the 5-gallon bucket was used to compute mass of suspended sediment associated with the bulk subsurface sampling.
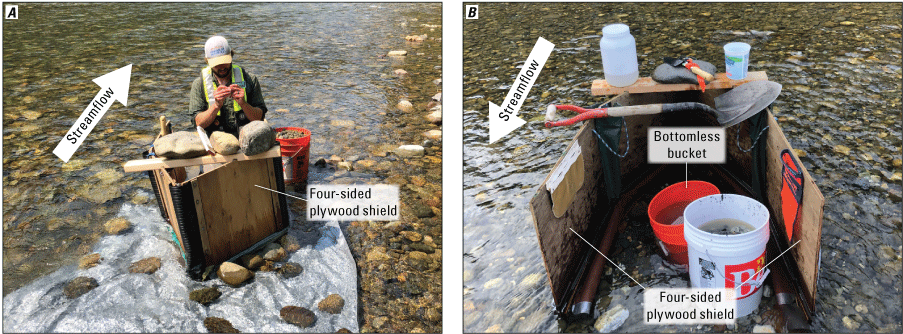
Four-sided plywood shield used for in-channel submerged subsurface bulk sediment sampling, upper Sauk River study site, August 2018.
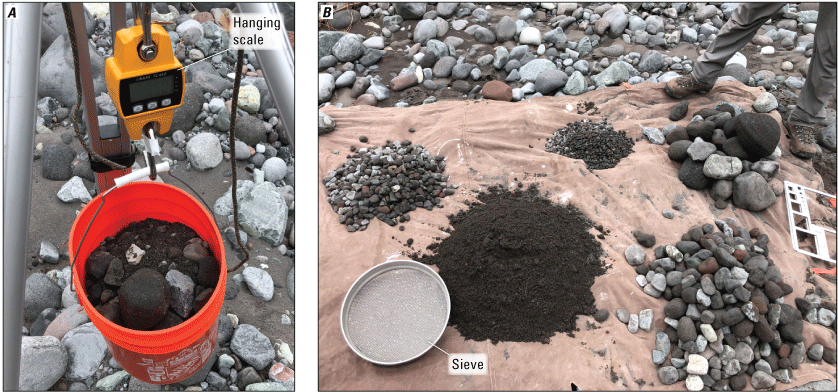
In situ set up of field weighing (A) and sieving (B) subsurface bulk sediment sampling.
Turbidity Monitoring
Turbidity monitoring occurred at Sauk River near Sauk, WA (12189500), and data are available from the USGS National Water Information System (NWIS, U.S. Geological Survey 2022b) for the three-year study period. Additionally, turbidity monitoring occurred at Sauk River AB White Chuck River NR Darrington, WA (12186000), during most of the three-year study (NWIS, U.S. Geological Survey 2022c). Turbidity monitoring at 12188380 was conducted by the Sauk-Suiattle Indian Tribe and the data were provided to USGS as a furnished record. Furnished records are provided by cooperating agencies for review to ensure the data have an accuracy comparable to data collected by USGS. Turbidity monitoring sites were both equipped with a Forest Technology Systems DTS-12 turbidimeter and operated according to standard USGS protocols (Wagner and others, 2006). Turbidity monitoring serves as a proxy for fine sediment in transit through the Sauk River, and qualitatively provides context on relative sediment availability on a seasonal and year-to-year timescale. Because the Sauk River near Sauk, WA gage is downstream from the Suiattle River, turbidity monitoring in the Suiattle River provides the contribution of this tributary allowing for deriving turbidity conditions in the Sauk River main stem that include the upper and middle Sauk River study sites by simple loading comparisons.
Instream Dissolved Oxygen Monitoring
DO sensors (Onset DO Data Loggers U26-001) were installed at study sites in study years 2 and 3 to monitor if and by how much dissolved oxygen concentration in the subsurface changed during the subsurface pre-emergence and presumed fine sediment infiltration period. DO concentration was collected hourly in units of milligrams per liter (mg/L). The DO sensors require replaceable caps that expire seven months after initialization; data collection of DO continues after the expiration date but may be considered unreliable. In this study, the pre-emergence period for upper Sauk River study site fit within the seven-month window of the DO sensors; the pre-emergence periods for middle and lower Sauk River study sites extending beyond March were outside of the seven-month expiration window.
Prior to field installation, DO sensors were calibrated in the lab according to the manufacturer’s specifications and following U.S. Geological Survey (2020), which included installation of a new sensor cap and calibrating of the sensor in saturated air and in a zero dissolved oxygen solution. Calibration and initialization occurred immediately prior to field deployment to maximize the seven-month period before the sensor caps expire. Initialized DO sensors were placed together in a 19-liter non-aerated bucket of water for approximately 18 hours prior to installation and following recovery to detect potential drift in individual sensors. A one-time field check of the DO sensors for each year of deployment was conducted using an In Situ Aqua Troll 600(C) multi-parameter water-quality sonde. The sonde was calibrated in the lab and attached to a peristaltic pump via a flow-through chamber and clean, flexible plastic tubing. A stainless-steel probe was inserted near the deployed DO sensors and interstitial waters pumped, at very low flow, to the flow-through chamber. Three field measurements of DO were collected at each DO sensor location after allowing the sonde to equilibrate. Field checks of subsurface DO occurred at depths between 0.25 and 0.5 m below the riverbed surface. Field checks were conducted on 25 February 2020 for the upper Sauk River study site and 19 April 2020 for the lower Sauk River study site for study year 2 and on 21 January 2021 for all three study sites in study year 3. No field checks were conducted in study year 2 at the middle Sauk River study site because DO sensors were not recovered at this study site due to excessive burial.
DO sensors were installed in the riverbed in a horizontal (prone) position in artificial redds (similar to the WV boxes and infiltration bags) at approximately 30-cm depth. DO sensors were housed in 50-cm long sections of slotted polyvinyl chloride (PVC) well screen capped at both ends and tethered to a 2.54-cm diameter, 0.46-meter-long rebar with a 0.5-meter-long stainless steel cable for an anchor, similar to Gendaszek and Sheibley (2021). The rebar piece was either (1) driven vertically into the riverbed when possible (middle and lower Sauk River study sites) or (2) shallowly buried horizontal in the subsurface and parallel to the flow direction to minimize being displaced by scour during high flows. Placement of the rebar anchor was immediately upstream from the DO sensor, based on the length of the tethering cable. PIT tags were attached to the cables (similar to the WV boxes and infiltration bags) to aid in recovery from the field.
Analysis
Sediment Infiltration Boxes and Bags and Bulk Subsurface Sediment Samples
All sediment and associated water poured off as part of each infiltration box or bag was analyzed at the USGS sediment laboratory at the CVO in Vancouver, Washington. A sub sample of bulk subsurface sediment samples that were field sieved to less than 8 mm were also analyzed at the CVO sediment laboratory. Analysis included full grain size distributions at the half-phi and extending to less than 0.063 mm to include the fraction of silt and clay for WV boxes, infiltration bags, and the in-channel and dry gravel bar subsurface sediment samples. Results from the bulk subsurface sediment samples analyzed at CVO were reconciled with the field-sieved samples to generate full grain size distributions.
Fine sediment infiltration in the WV boxes was measured as differences in grain size distributions of sediment in the WV boxes between deployment and retrieval time periods, including changes in percent fines (<1, <2, and <4 mm because these grain sizes are standard phi clast sizes). Fine sediment (the proportion of the grain size distribution that is smaller than a specific grain size, ranging from 0.063 to 256 mm) in the infiltration bags was evaluated by grain size distribution from the retrieval time periods. Fraction finer was compared between WV boxes, infiltration bags, and bulk subsurface sediment samples and one sample t-tests were applied to mean fraction finer for select fraction finer grain sizes to identify statistical differences between WV boxes and infiltration bags and wet and dry subsurface samples. There were no pre-deployment period grain size distributions of the sediments that were used to back fill the holes in which the infiltration bags were deposited; however, we assume that field agitating to remove finer sediments prior to backfilling limited most grain sizes to larger than 8 mm. Fraction finer is compared to threshold values reported for egg-to-fry survival (Jensen and others, 2009).
Turbidity and Suspended-Sediment Load Estimates
The turbidity time series at Sauk River near Sauk, WA (12189500), and Suiattle River Above All Creek NR Darrington, WA (12188380) were visually inspected to identify periods of high or low turbidity. Annual suspended-sediment loads were estimated for each water year of the study (2019, 2020, 2021) based on suspended-sediment concentration -turbidity regressions that were established for water years 2012–2016 (Jaeger and others, 2017). SSC was estimated using Model No 3.1 (Jaeger and others, 2017) when turbidity data were available. SSC was then applied to the 15-min discharge record at USGS 12189500 to estimate suspended-sediment load for each water year. A SSC-discharge relation was fit (segmented linear relation on log-transformed data), following methods in Anderson and others (2022), to fill gaps when turbidity data are missing.
Dissolved Oxygen Concentration
For this study, minimum dissolved oxygen concentration for Chinook salmon was 4 mg/L, following Geist and others (2006). Frequency and duration of dissolved oxygen concentration below the 4-mg/L threshold were identified and summarized. In addition, the dissolved oxygen concentration time series was plotted with water temperature and streamflow to assess trends.
Results
Instream Conditions During the Study—Discharge, Turbidity, and Water Temperature
Study year 1 had relatively small peak flows compared to study years 2 and 3, with no flows exceeding the 0.5 annual exceedance probability (fig. 8A). Study year 2 had four smaller flow events that did not exceed the 0.5 annual exceedance probability but had a flow exceeding the 0.2 annual exceedance probability occurred in February (fig. 8A). Substantial bank erosion, which occurred upstream from the middle Sauk River study site and the study site showed channel bed aggradation. Study year 3 had a moderately active peak-flow season, with one flow exceeding the 0.5 annual exceedance probability.
The turbidity time series reflects the typical seasonal patterns of elevated turbidity during the late summer associated with glacial melt from Glacier Peak and again during high flow events during autumn and winter seasons (fig. 8B; Jaeger and others, 2017). Late summer turbidity values in the Suiattle River are higher than the main stem Sauk River, revealing the dominating influence of Glacier Peak on glacial melt in the Suiattle River; turbidity is lower in the lower Sauk River study site because of mixing with the Sauk River main stem, which is less turbid although it does receive glacial melt from the White Chuck River. Turbidity values are still high in the late summer (July, August, and early-September) during low streamflow, which may create opportunity for fine sediment deposition and infiltration in-channel bed gravels during this pre-spawning period. However, high turbidity during late summer is largely characterized by glacial fines (silts and clays, <0.063 mm) that remain in suspension, even during low flows and are not expected to show fine sediment mobility and deposition during this low flow period.
Based on existing SSC-Turbidity and SSC-discharge relations for the Sauk River near Sauk, WA, we use turbidity and discharge to estimate suspended-sediment loads for the lower Sauk River study site for Water years 2019–2021 that approximately correspond to study years 1, 2, and 3 (table 3). Comparing these estimates to the five-year mean annual load, based on water years 2012–2016 (Jaeger and others, 2017), these estimated loads are approximately 0.36, 1.20, and 0.85 of the mean load for study years 1, 2, and 3, respectively and approximately correspond to the relative activity of peak-flow hydrology over the three-year study period.
Table 3.
Estimated suspended-sediment loads in metric tons for Sauk River near Sauk, WA (12189500) for water years 2019–21.[Mean annual load in calendar years. Abbreviation: WY, water year]
| Study site | WY2019 | WY2020 | WY2021 | Mean annual load (2012–16)* |
|---|---|---|---|---|
| Sauk River near Sauk, WA* | 343,000 | 1,109,000 | 802,000 | 940,000 |
Suspended-sediment loads are based on suspended-sediment concentration and discharge relations published for Sauk River near Sauk, WA in Jaeger and others (2017).
Table 4.
Daily maximum and minimum water temperature in degrees Celsius for study years 1 through 3 at Sauk River near Sauk, WA (12189500) and Sauk River AB White Chuck River NR Darrington, WA (12186000).[For study year dates, see table 2]
Water temperatures were similar at the Sauk River near Sauk, WA and Sauk River AB White Chuck River NR Darrington, WA (fig. 8C; table 4). Maximum water temperatures were warmest in study year 2 at both study sites (19.5 °C) and more than a degree cooler in study year 3 (18.4 °C). Minimum temperature was also warmer in study year 2 at both study sites compared to study year 1, although daily minimum water temperature Sauk River near Sauk, WA remained similar to that of study year 2 (2.2 °C, table 3). Minimum temperature was the same for study years 1 and 2 at the lower Sauk River study site (0.3 °C) but was warmer (1.4 °C) in study year 3. In addition, mean daily temperatures cooled to 10 °C earlier in study year 3 (September 28 in study year 3 compared to October 12 in study year 1 and October 11 in study year 2) at upper Sauk Rive study site, but remained relatively similar in timing at lower Sauk River study site (October in study year 3 compared to October 12 in study year 1 and October 11 in study year 2).
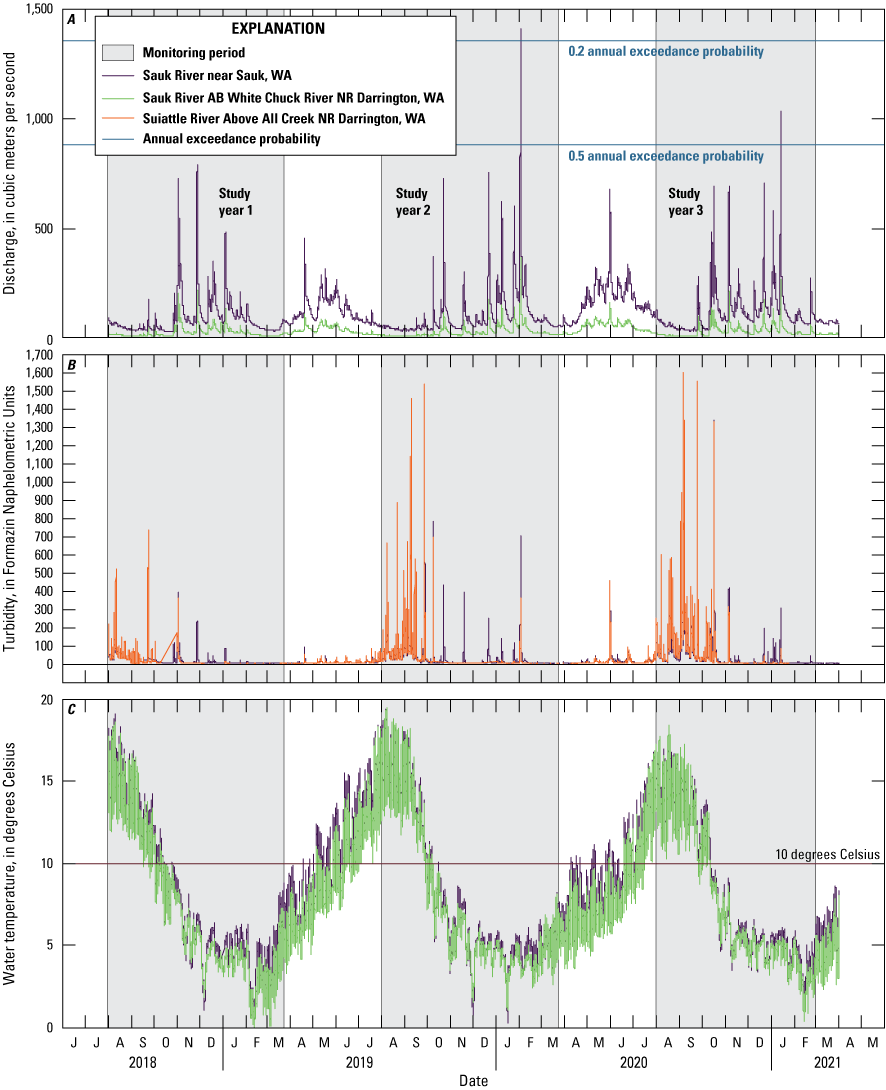
Instantaneous discharge at Sauk River near Sauk, WA (12189500) and Sauk River AB White Chuck River NR Darrington, WA (12186000) (A), turbidity at Sauk River near Sauk, WA and Suiattle River Above All Creek NR Darrington, WA (12188380) (B), and water temperature at Sauk River near Sauk, WA and Sauk River AB White Chuck River NR Darrington, WA (C) for August 2018–April 2021.
Sediment Infiltration into WV Boxes and Infiltration Bags
All WV boxes and infiltration bags recovered across all study sites for all three study years show substantial fine sediment infiltration into the boxes and sediment infiltration bags (fig. 9). The grain size distribution of WV boxes post-recovery was markedly finer than pre-filled grain size distributions with more than 0.1 fraction of grain size <8 mm compared to the pre-filled grain size distribution of these boxes (fig. 9). Visual observations of recovered WV boxes suggest that large void spaces of prefilled WV boxes were filled with smaller size gravel, sand, silt, and finer (fig. 10). Grain size distributions of Whitlock-Vibert, infiltration bags, and subsurface sediment samples can be found in Jaeger and others (2024).
Silt clast sizes (<0.063 mm) account for less than 0.01 fraction finer (less than one percent) of the sediment grains in the WV boxes at middle and upper Sauk River study sites, but account for 0.03– 0.05 fraction finer of grains (three to five percent) in WV boxes at lower Sauk River study site across the three study years (table 5). Fraction finer of grains when including sand or smaller (size classes <2 mm) range from 0.12 to 0.23 across the three study sites and years, with the highest fraction finer corresponding to lower Sauk River study site (fig. 11; table 5). Higher fraction finer in lower Sauk River study site agrees with increasing suspended-sediment yields in the downstream direction (Jaeger and others, 2017), including fine gravel grain sizes in (<4 mm or smaller) increased fraction finer that range from 0.14 to 0.28 across all study sites and years. Fraction finer of fine sediment was higher for study years 2 and 3 at lower and upper Sauk River study sites, whether considering classes of sand or smaller (<2 mm) or classes of fine gravel or smaller (<4 mm) (table 5). Fraction finer was also higher at middle Sauk River for study year 2 (0.22 and 0.28 in study year 2 compared to 0.13 and 0.16 in study year 1 for <2 and <4 mm classes, respectively). However, average values for middle Sauk River study site are based on only three recovered WV boxes compared to an average from nine to 13 boxes recovered from upper and lower Sauk River study sites (table 1). Fraction finer values from middle Sauk River study site may be biased toward higher fraction finer because of the substantial excavation that was required to recover the WV boxes, which may have erroneously introduced additional fine-grained sediment into the WV box.
Comparisons in grain size distributions between infiltration bags and WV do not yield consistent differences for study sites or the two study years that infiltration bags were used and there is substantial variability in the grains size distribution of the infiltration bags and WV boxes at certain study sites and years (figs. 10–11). Fraction finer values for small clast sizes are similar between WV boxes and infiltration bags for upper Sauk River study site for study years 2 and 3, when both sediment infiltration features were installed. Fraction finer values are also similar at lower Sauk River study site for study year 3, but infiltration bags have higher fraction finer values for a representative small grain size in study year 2 relative to WV boxes. Additionally, the variability in fraction finer is wider across the 4 infiltration bags retrieved in study years 2 and 3 at the lower Sauk River study site compared to the WV boxes (very fine sand) (fig. 11; table 5). Limited recovery of boxes and bags at middle Sauk River study site for study years 2 and 3 limits comparison between WV boxes and infiltration bags at this study site. Additionally, the grain size distributions for the infiltration bags are based on a small sample size, which is approximately one-third that of the WV boxes. Therefore, given the variability in grain size distributions among bags within a single study site, grains size distributions should likely be interpreted as rough approximations with high uncertainty.
During the study year 2 recovery of WV boxes and infiltration bags at upper Sauk River study site in late February 2020, salmon alevin that had migrated into some WV boxes at this study site post installation were identified. The presence of alevin in the WV boxes indicates that despite high fine sediments at this study site, salmon were living in the gravels. Live salmon alevins were also in substrate captured by the infiltration bags at upper Sauk River study site during the extraction process from the riverbed.
Grain size distributions were derived for all bulk subsurface samples (fig. 12). We use the same representative grain sizes ranging between 0.063 and 4 mm for consistent comparison with the WV boxes and infiltration bags and for identification of potential differences in grain size distribution between (1) in-channel wet samples versus dry gravel bar samples, (2) seasons within a year (for example, late summer baseflow conditions versus late winter/early spring conditions), (3) across study years, and (4) across study sites (figs. 13–14).
There seems to be some differences between wet and dry samples depending on the season and study site. We had expected that wet in-channel bulk subsurface samples would be finer than subsurface samples from dry gravel bars adjacent to the wetted channel. This expectation is because the sampling area, constrained by the diameter of a bottomless 19-liter bucket in the in-channel samples, could limit extracting larger size clasts compared to the dry gravel bar samples, which were not similarly constrained. Conversely, there is potential that wet samples may be coarser than dry gravel bar samples if fine sediments were lost in the in-channel sampling process, despite the involved field sampling set up (fig. 6) to mitigate this bias. Wet samples were not consistently finer for all study sites and at all seasons as had been expected. Wet samples were notably finer than dry samples at lower Sauk River study site, and most markedly so during the late summer installation period in study years 2 and 3 (figs. 12–13). This late summer period corresponds with low flows and high turbidity from glacial melt. In contrast to lower Sauk River study site, there does not seem to be a meaningful difference between wet and dry samples at upper Sauk River study site (figs. 12–13; table 5). Wet and dry samples at middle Sauk River study site were similar throughout study years 1 and 2 installation, but the grain size distributions for the wet samples were noticeably finer compared to the dry observations in the study year 2 spring recovery and study year 3 installation periods (figs. 12–13; table 5). Study year 2 had more occurrences of larger magnitude flows and middle Sauk River study site showed substantial channel change and aggradation during this period, which likely is the cause of increased fining at this study site. There were no year 3 recovery period dry samples to compare with recovery period wet samples. Despite careful sampling, field methods for dry and wet bulk subsurface samples are both coarse and likely include measurable error. Nevertheless, the samples are an approximations of grain size distributions at the study sites. Further, we interpret finer grains size distributions in lower and middle Sauk River study site to reflect geomorphic differences between channel and adjacent gravel bar rather than differences in sampling methods between the channel and adjacent gravel bar.
Seasonal differences between grain size differences were apparent at lower Sauk River study site for the wet and dry samples (figs. 12–13; table 5). Wet and dry samples both had higher values of fraction finer for representative small grains during the installation (late summer) periods compared to the spring recovery periods following the winter storm season and prior to the spring runoff season for study years 1 and 2 (figs. 12–13; table 5). There did not seem to be seasonal differences in grain size distributions or fraction finer of representative small grain sizes at either upper or middle Sauk River study sites.
In terms of differences in grain size distributions between the wet and dry bulk surface samples across study years, wet samples are finer than dry samples in study year 2 recovery period and extending through study year 3 installation period at middle and lower Sauk River study site. Differences in dry samples are limited to study years 1 and 2 because of the lack of study year 3 samples. However, there does not seem to be differences in fraction finer of smaller grains in the dry gravel sites beginning at study year 2 recovery period that had been observed in the wet samples (figs. 12–13; table 5). Dry samples at upper Sauk River study sites were slightly finer in study year 2 with a higher fraction of fines for representative small size clasts, but the grain size seems to have coarsened by study year 3.
For differences in grain size distributions across study sites, lower Sauk River study site is notably finer than upper and middle Sauk River study sites across all study years, although these differences are most notable during the installation period than during the recovery period (fig. 13; table 5).
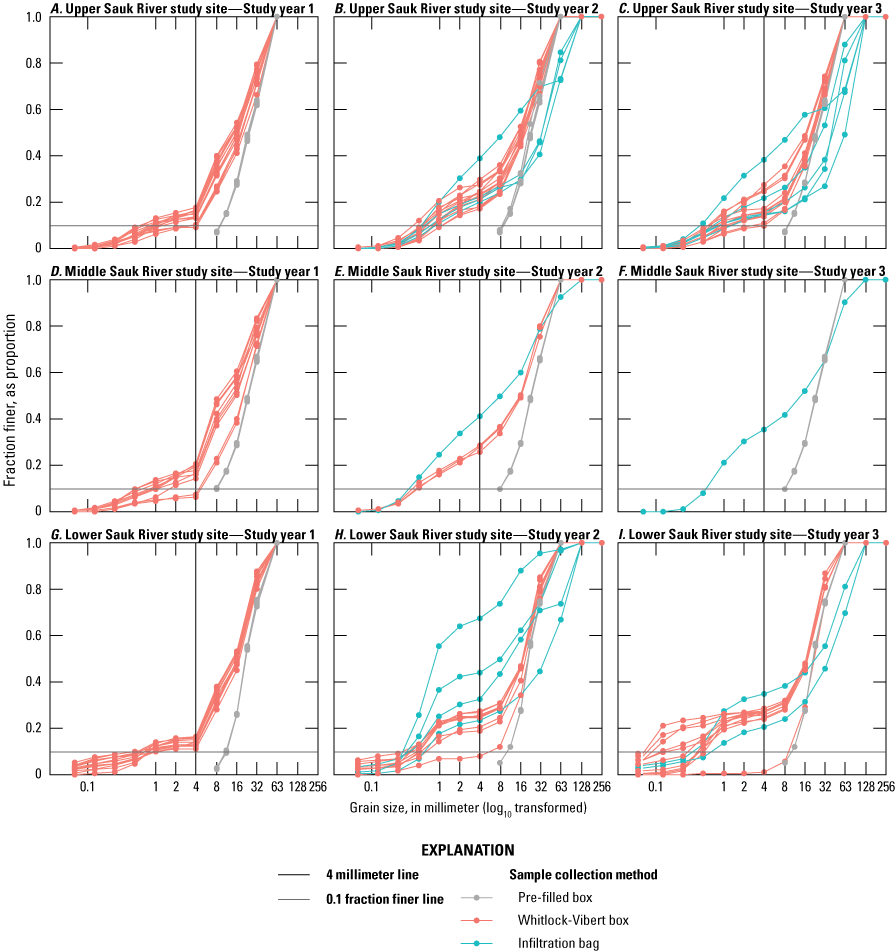
Fraction finer (proportion of the grain size distribution that is smaller than a specific grain size) of sediment inside Whitlock-Vibert boxes and infiltration bags post-recovery for all three study sites for August 2018–April 2021. Distribution lines that are left of 4 millimeters and that exceed 0.10 fraction finer would be considered a risk to increased mortality during the pre-emergence period.
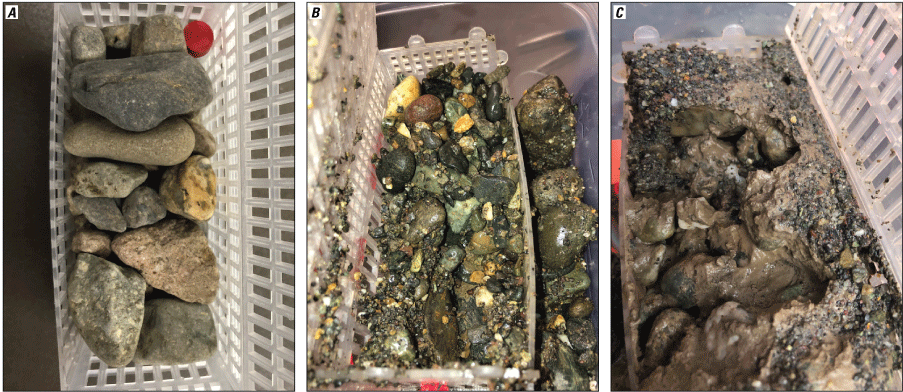
Whitlock-Vibert (WV) boxes for study year 1 (August 2018–April 2019) representative prefilled WV box pre-field installation (A), partially deconstructed WV box recovered from middle Sauk River study site (B), and partially deconstructed WV recovered from lower Sauk River study site (C).
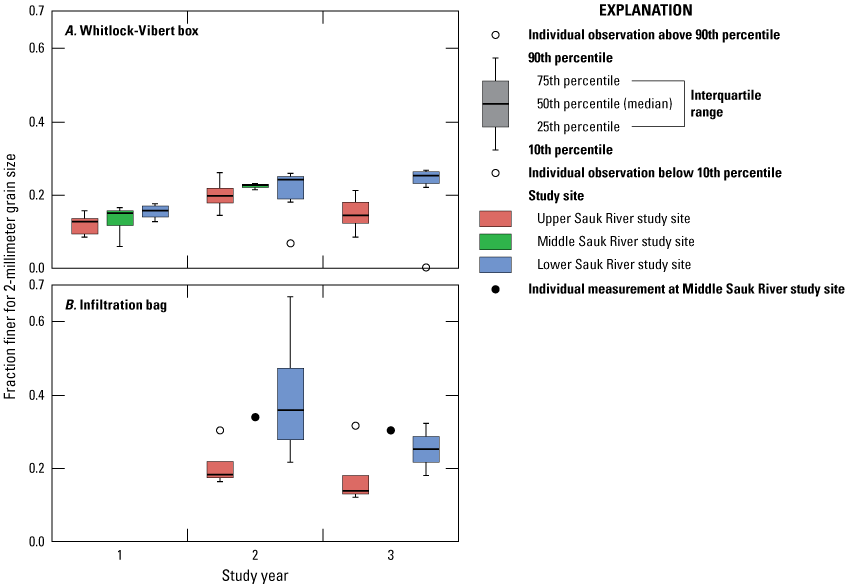
Fraction finer for 2-millimeter grain size for Whitlock-Vibert (WV) boxes and infiltration bags for each study site across the three study years (August 2018–April 2021). No WV boxes and a single infiltration bag were recovered in study year 3 (August 2020–April 2021) at the middle Sauk River study site.
Table 5.
Fraction finer for select small-grained sediment classes across recovered Whitlock-Vibert boxes and infiltration bags for the three study sites (upper, middle, and lower Sauk River) and the three study years (August 2018–April 2021).[All values reflect new sediments infiltration into Whitlock-Vibert boxes or bags; pre-filled boxes did not include grain sizes less than 8 millimeters; small grain sizes (for example, approximately 8 millimeters or less) were removed from backfill sediment for infiltration bags. See table 1 for number of recovered Whitlock-Vibert boxes and infiltration bags for each study site and year. Abbreviations: mm, millimeter; NA, not applicable]
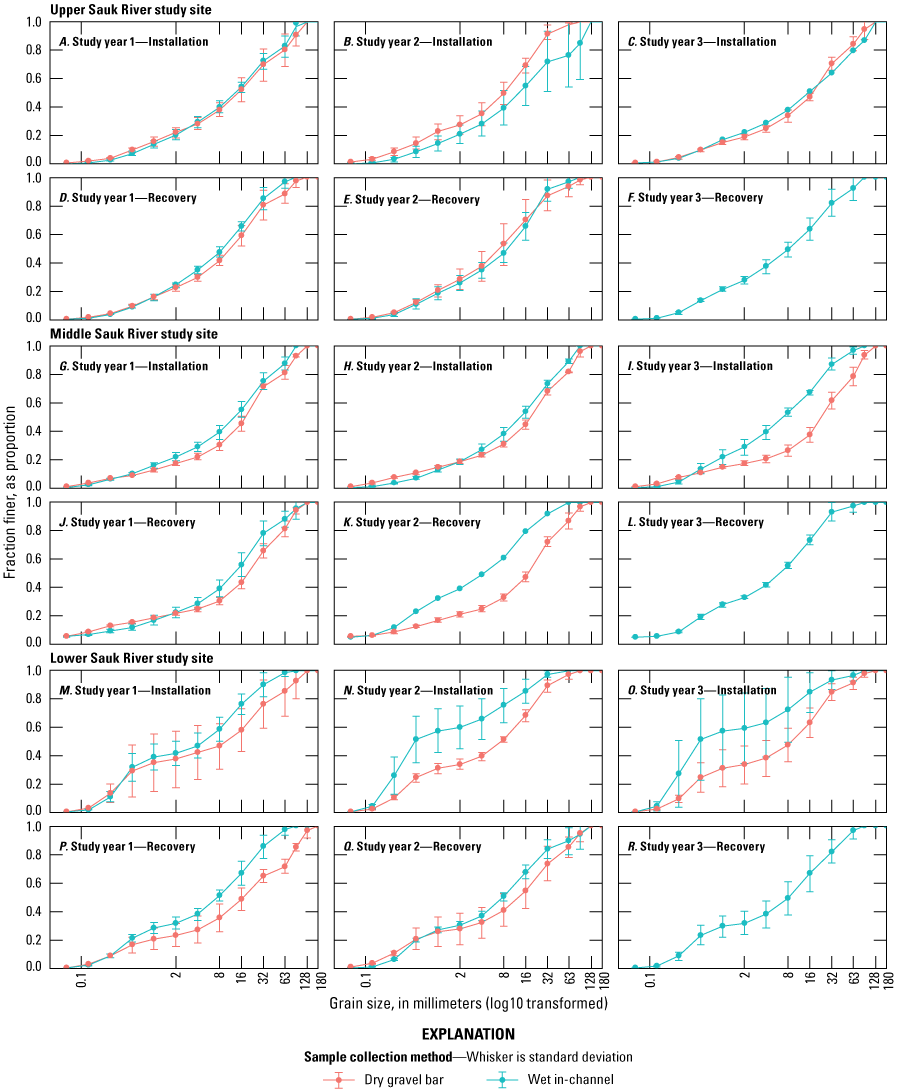
Average fraction finer (proportion of the grain size distribution that is smaller than a specific grain size; three samples for each grain size clast) of in-channel subsurface sediment samples by wet in-channel and dry gravel bar across all study years (August 2018–April 2021), sampling periods (installation and recovery), and study sites (lower, middle, and upper Sauk River).
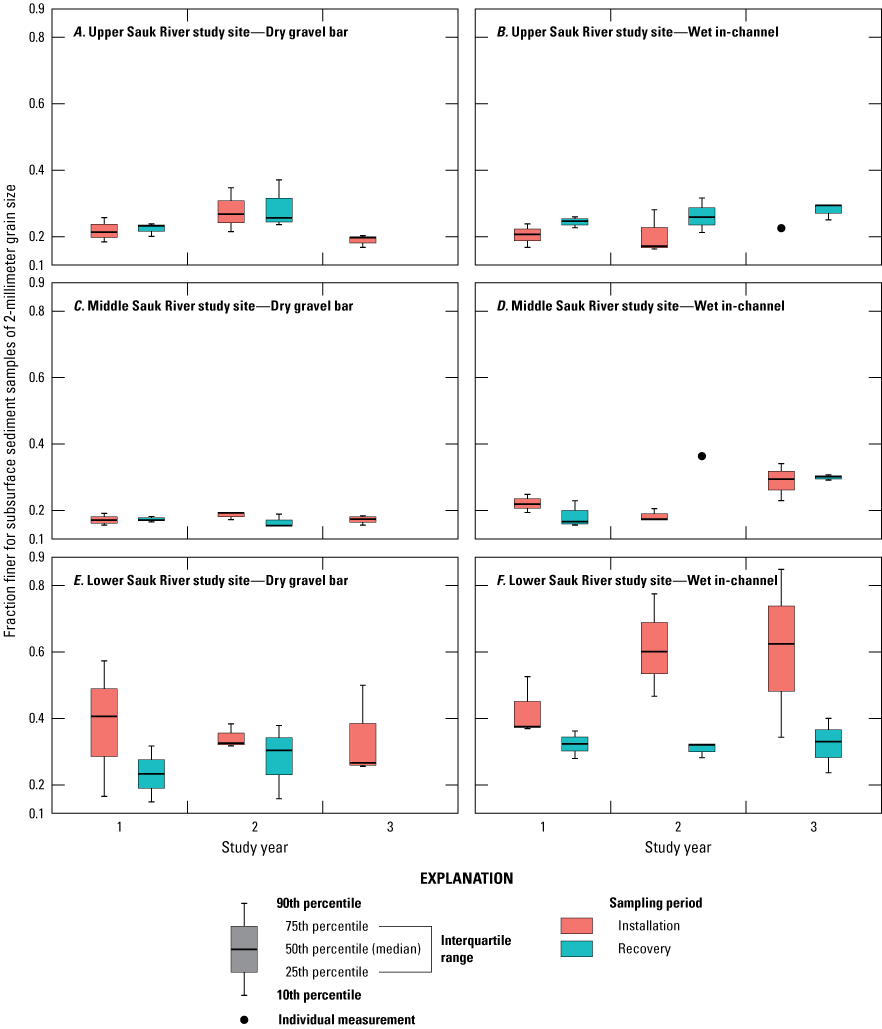
Fraction finer for representative small grain from subsurface sediment samples for wet in-channel and dry gravel bar samples across all study years (August 2018–April 2021), sampling periods (installation and recovery), and study sites (lower, middle, and upper Sauk River).
Subsurface Sediment Conditions Within the Wetted Channel and Adjacent Gravel Bars
Due to the onset of Covid19 in late winter 2020, field efforts for the study year 2 recovery were delayed at middle and lower Sauk River study site. An in-channel bulk sediment sample at lower Sauk River study site was taken in March 2020 and compared to in-channel subsurface samples in April during the recovery campaign of WV boxes and infiltration bags. There do not seem to be substantial differences between the grain size distribution of in March compared to those of the April samples (fig. 14); therefore, the April samples are considered an equivalent substitution for bed conditions during March 2020, when Chinook salmon were expected to still reside in the subsurface gravels at lower Sauk River study site.
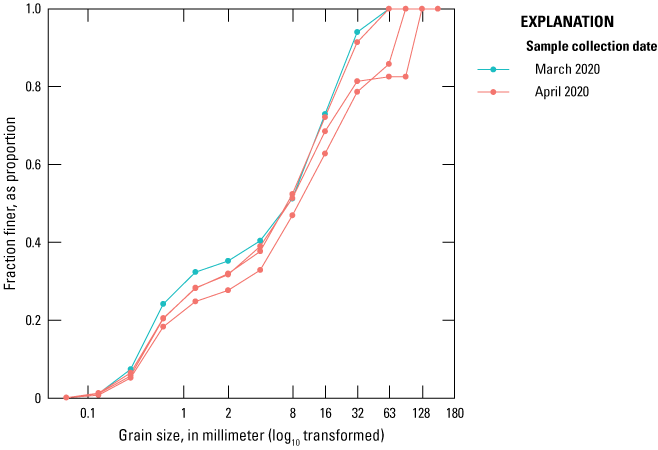
Fraction finer of in-channel subsurface sediment samples at lower Sauk River study site in March and April 2020 (end of study year 2).
Comparison between WV Boxes, Infiltration bags, and Bulk Subsurface Samples
We compare grain size distributions of the bulk subsurface samples to the WV boxes and infiltration bags to evaluate if bulk grain size distributions can be a proxy for the potential of sediment infiltration into spawning gravels, which is represented by the WV boxes and infiltration bags (fig. 15). Wet and dry bulk samples both have a higher fraction finer for the representative fine grain size (2 mm) than the WV boxes (fig. 15) and are generally finer for other small grain size classes (tables 5–7). One-sample t-test confirmed statistical differences between WV boxes and bulk subsurface samples, but only identified significant differences in the finest class of <0.063 between WV boxes and infiltration bags (table 7). Absence of statistical differences between infiltration bags and subsurface samples is attributed to low sample size of infiltration bags (no bags in study year 1 and recovery of only a single bag at middle Sauk River study site in study years 2 and 3) (table 6). When looking at individual study sites, it seems that fraction finer values for WV boxes and infiltration bags are similar to each other but are generally coarser than either wet or dry subsurface samples regardless of seasonal sampling.
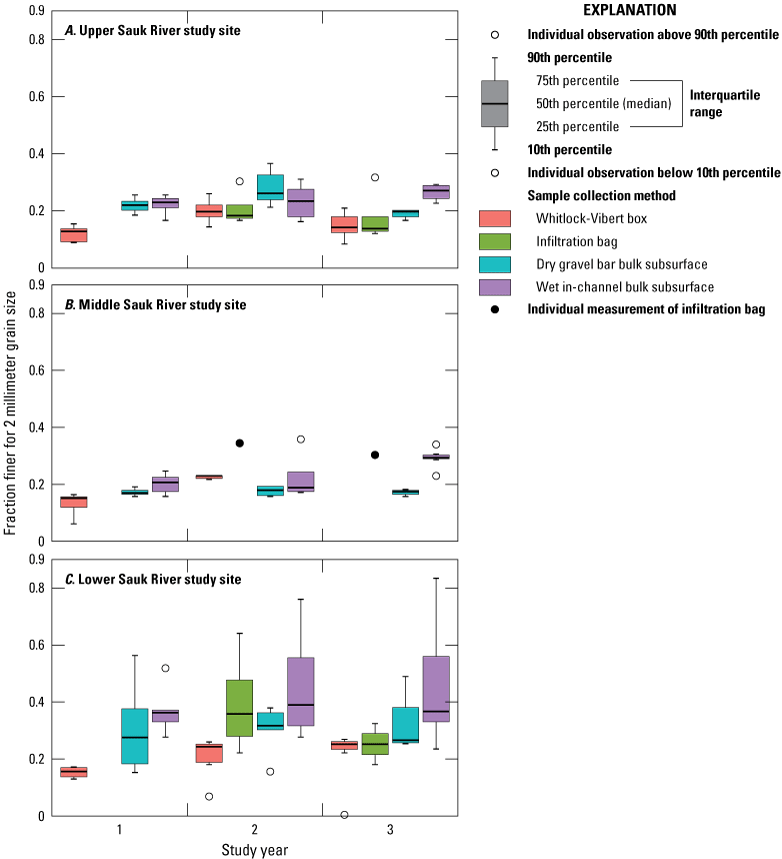
Boxplots showing fraction finer for representative grain size for Whitlock-Vibert boxes, infiltration bags, and wet in-channel and dry gravel bar bulk subsurface samples across study years (August 2018–April 2021) and study sites (lower, middle, and upper Sauk River).
Table 6.
Mean fraction finer for representative small grain sizes for the dry and wet bulk subsurface sediment samples for the three study years (August 2018–April 2021) and the three study sites (lower, middle, and upper Sauk River).[Grain size is less than 2 millimeters. For list of installation and recovery periods, see table 2. Abbreviations: mm, millimeter; NA, not applicable]
Table 7.
Difference in mean fraction finer of select grain sizes between Whitlock-Vibert boxes and wet and dry subsurface bulk sediment samples or between infiltration bags and wet and dry subsurface bulk sediment samples.[Differences based on one sample t-test. Negative values indicate that Whitlock-Vibert boxes and infiltration bags have lower mean fraction finer for a given grain size compared to the subsurface sample. Abbreviations: mm, millimeter; Dry, dry subsurface sample; Wet, wet subsurface sample; NA, not applicable]
Dissolved Oxygen Concentrations in Chinook Salmon Spawning Gravels
All recovered DO sensors remained operational except for one sensor (Sensor 3) at upper Sauk River study site in study year 2 when the sensor seems to have fouled on February 1, 2020, during which the DO record had a sharp decline. The field check indicated an average DO concentration of 11.7 mg/L and the sensor had a strong odor when recovered, suggesting fouling. DO values were removed from the record that are presumed to be during sensor fouling. All calibrated DO sensors were within 0.2 mg/L of the calibrated sonde and are within the USGS specifications for continuous DO measurements (plus or minus 0.3 mg/L; Wagner and others, 2006). Dissolved oxygen data can be found in Jaeger and others (2024).
Dissolved oxygen levels remained above 4 mg/L for most sensors for most of the study years 2 and 3 monitoring periods (figs. 16–17). Dissolved oxygen standards are considered “Fair” above 4 mg/L (Washington Department of Ecology, 2002). Dissolved oxygen levels increased with seasonal decreases in water temperature during the autumn and early winter, but individual sensors fluctuated substantially following this seasonal increase that corresponded to cooling water temperatures.
Aside from the fouled sensor at upper Sauk River study site in study year 2, 1 sensor in the upper Sauk River study site record DO was at or below 4 mg/L 5 times for periods ranging between 1 and 30 hours (table 8). One of the four sensors in lower Sauk River study site in study year 2 also recorded DO at or below 4 mg/L for 3 periods ranging from 3 to 79 hours. No sensors were recovered from the middle Sauk River study site in study year 2. In study year 3, the single sensor recovered from middle Sauk River study site recorded 4 periods at or below 4 mg/L ranging from 1 to 13 hours (table 8). In study year 2, periods of low DO occurred in the latter half of the pre-emergence period (ATU greater than 500) and presumably, embryos had hatched into alevins. Although hatching has high oxygen demands, oxygen demands decline post hatching (Rombough, 1988, cited in Greig and others, 2007) so increasing distance from this 500 ATU midpoint represent periods of less vulnerability for mobile alevin, presuming that there are other areas of higher DO to migrate to. The incubation period is more vulnerable to low DO conditions since embryos are not mobile, whereas post hatching, alevins can move in the subsurface away from areas of low DO (Greig and others, 2007).
Abrupt increases and decreases in DO correspond to high flow events, although sharp changes also occur even in the absence of events, which are presumed to reflect local changes in DO conditions associated with riverbed perturbations (figs. 18–19). The location of individual dissolved oxygen sensors may be unstable based on the large fluctuations and therefore may be more sensitive to shifts caused by high flows or local shifts in the bed conditions.
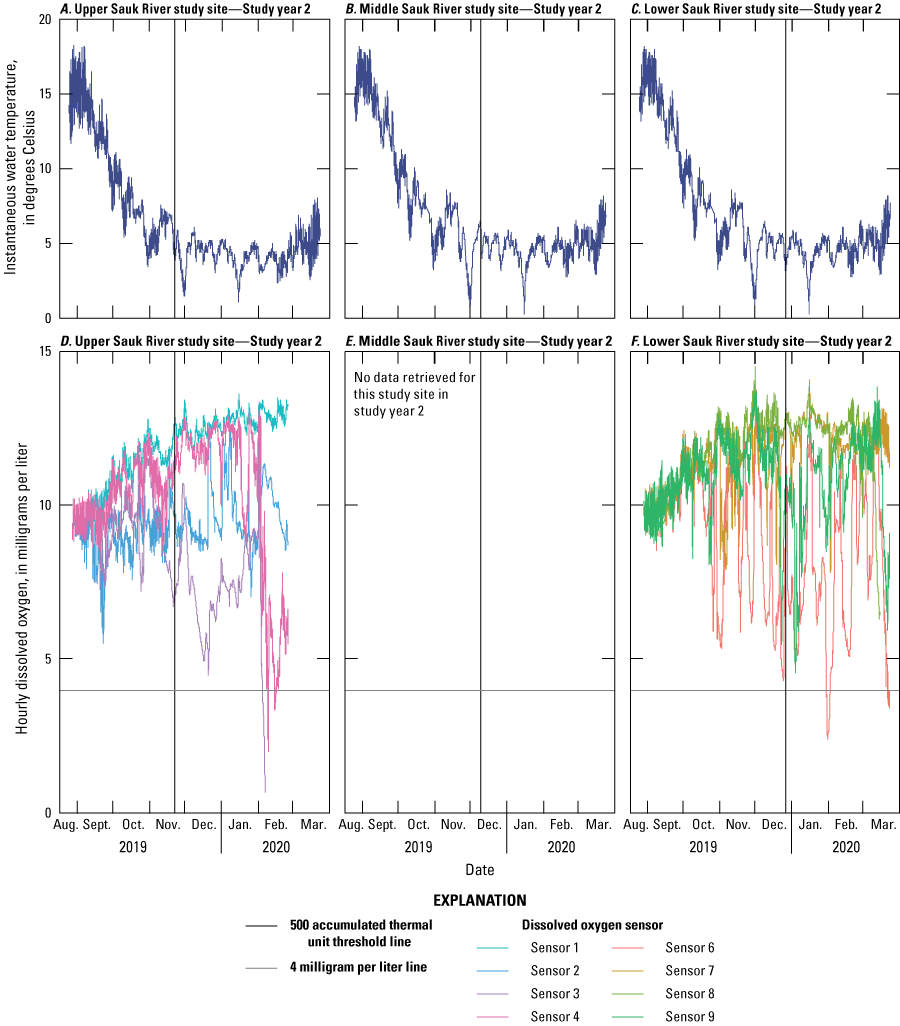
Instantaneous water temperature representative for each study site and hourly dissolved oxygen of recovered dissolved oxygen sensors buried in the riverbed during the pre-emergence period at the three study sites for study year 2.
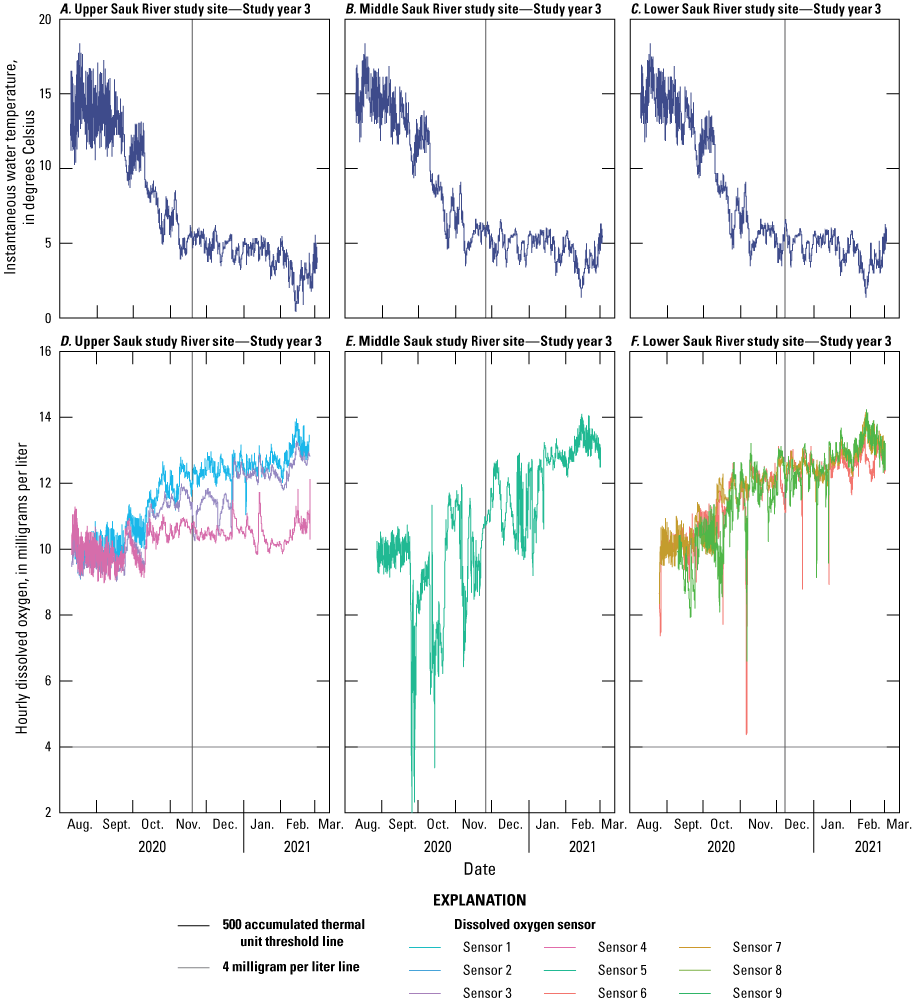
Instantaneous water temperature representative for each study site and hourly dissolved oxygen (DO) of recovered dissolved oxygen sensors buried in the riverbed during the pre-emergence period at the three study sites for study year 2.
Table 8.
Summary of locations, dates, and duration when dissolved oxygen sensors recorded 4 milligrams per liter or less.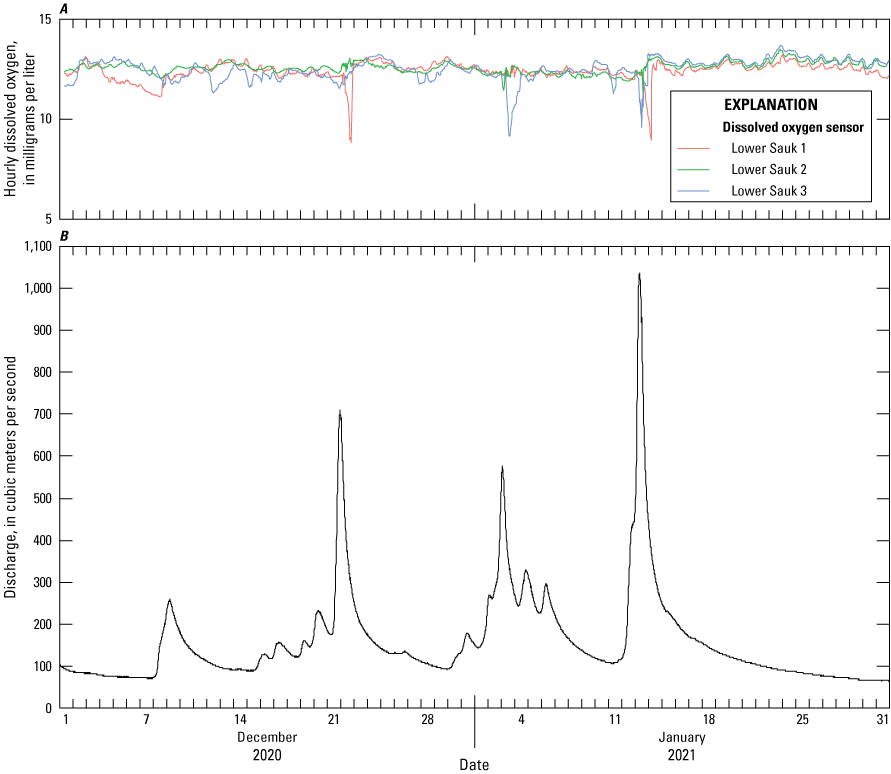
Study year 3 (August 2020–April 2021) hourly dissolved oxygen of recovered dissolved oxygen sensors buried in the riverbed during the pre-emergence period (A) and instantaneous discharge at Sauk River Near Sauk, WA (12189500) (B).
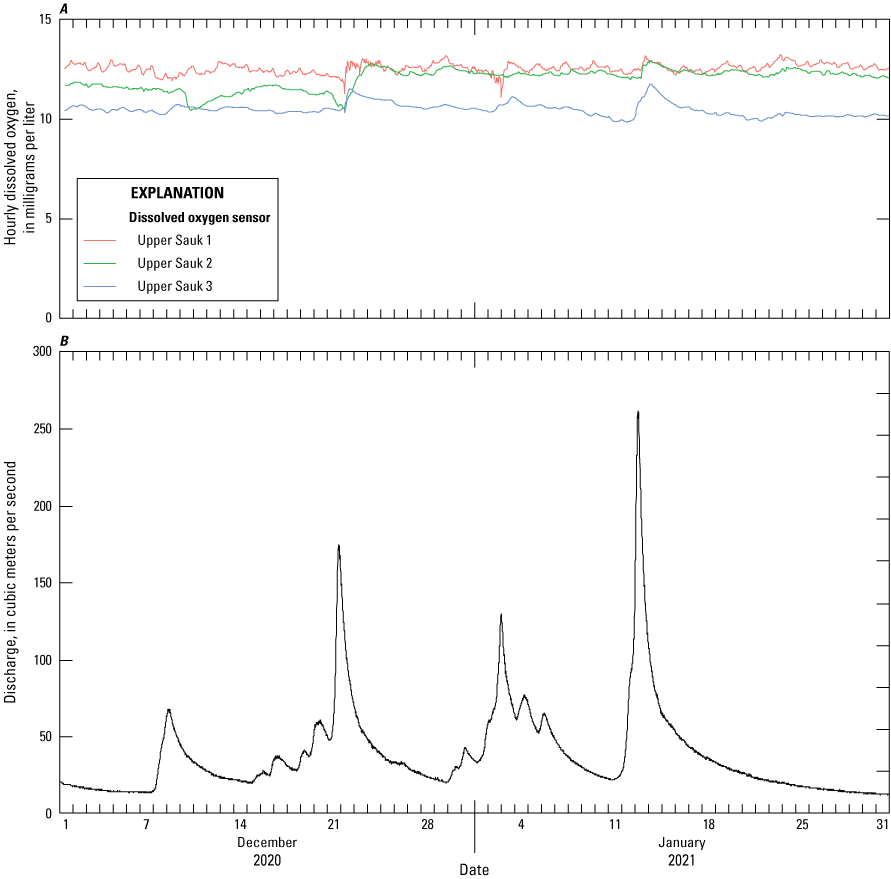
Hourly dissolved oxygen of recovered dissolved oxygen sensors buried in the riverbed during the pre-emergence period (A) and instantaneous discharge at Sauk River Near Sauk, WA (12189500) (B).
Discussion—Fine Sediment Infiltration in Chinook Salmon Spawning Gravels
Naturally high fine sediment infiltration into Chinook salmon spawning gravels that exceed 0.10 fraction finer for grain sizes of 1 and 4 mm are observed in WV boxes and infiltration bags across all three study sites. Based on fraction finer sediment and percent egg-to-fry survival curves, expected survival for Chinook salmon eggs are roughly 30 percent, with increased expected survival to approximately 90 percent if eggs are eyed and therefore further along in their development (fig. 20). The timing of fine sediment infiltration was not able to be tracked in this study so it is unknown if infiltration occurred during the earlier, potentially more sensitive period of egg development relative to the later eyed egg stage that may be less sensitive to fine sediment infiltration.
The potential impact of naturally high levels of fine sediment may have different effects depending on the location of the river. In particular, live alevins that had migrated into the WV boxes after they were buried were observed in upper Sauk River study site in study year 2 and were live in the substrate matrix of the infiltration bags despite the presence of ample fines. Although survival rates were unknown, alevin migration into the boxes and presence in the samples from the infiltration bags indicate that fine sediment infiltration, and any potentially associated decrease in dissolved oxygen, did not eliminate 100 percent viability through the advanced stages of the post-hatching pre-emergence period. In middle Sauk River study site, fine grain size distributions are similar to upper Sauk River study site. However, the active channel morphology at the middle Sauk River study site could play a role in pre-emergence mortality, given that most WV boxes and infiltration bags were not retrieved at this study site in two of the three study years, which was attributed to erosion and deposition exceeding dimension of the redds (approximately 30 cm). Lower Sauk River study site has slightly higher fractions of fines compared to the two upstream study sites. Lower Sauk River study site was geomorphically stable throughout the study period, which may buffer from mortality caused by scour or burial that may be a larger influence in the middle Sauk River reach. Although lower Sauk River study site seems to meet criteria for Chinook salmon spawning, spawning in the lower Sauk River downstream from the Suiattle River confluence is largely unknown, in part because of the poor visibility through the water that limits identifying during aerial spawner surveys.
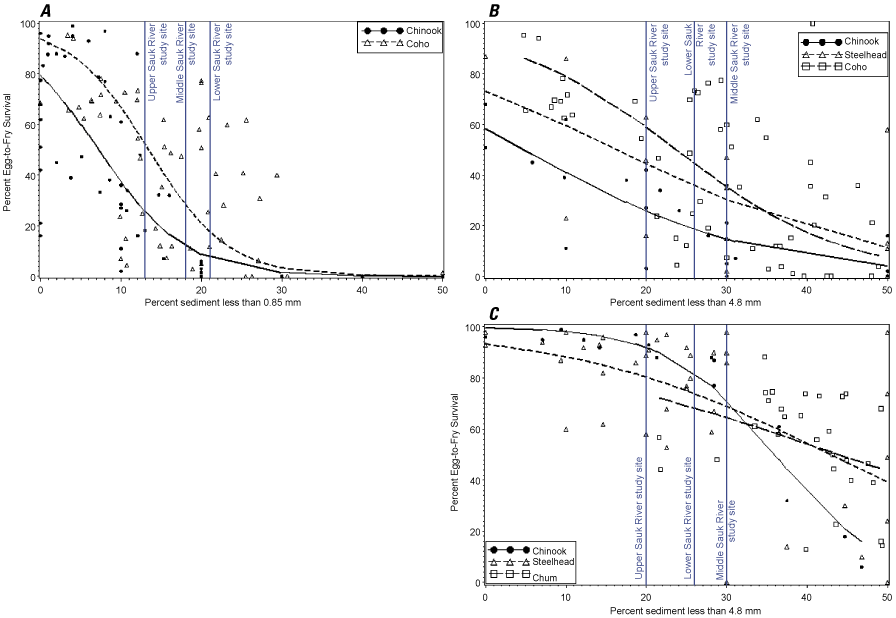
Percent egg-to-fry survival curves as a function of percent finer grain size classes that include 0.85 millimeters and 4.8 millimeter for several salmonid species (Jensen and others, 2009, fig. 1) and location along the survival curves of percent finer (converted from fraction finer) for the upper, middle, and lower Sauk River study sites. In this study green eggs correspond to early egg development stage; eyed egg corresponds to later egg development stage when a black dot representing the eye is visible.
Upper Sauk River site seems to be the most stable study site compared to middle and lower Sauk River study sites. The upper Sauk River study site had the lowest variability in fraction finer for the representative fine grain size of 2 mm between seasons and across study years (fig. 11) and showed virtually no geomorphic channel change during the three study years. In addition, upper Sauk River study site had relatively high levels of dissolved oxygen during the study years 2 and 3 monitoring periods (figs. 16–17). Despite high background rates in the proportions of fine sediment within known Chinook salmon spawning gravels, the stability of upper Sauk River study site and observed presence of live alevins in study year 2 suggests that the substrate conditions of the available spawning habitat at this study site may not be a limiting factor to pre-emergence survival. An in situ egg-to-fry survival study on the Yakima River in Washington did not identify a negative relation between fine sediment and survival for most years of the study, although the authors reported that sediment loads did not exceed 20 percent and therefore may have been below thresholds that affect egg-to-fry survival (Roni and others, 2016).
Middle Sauk River study site is a geomorphically dynamic study site with a highly mobile bed. Substantial channel change occurred in study year 2 in response to an active peak-flow season during winter and early spring 2020 that resulted in substantial sediment deposition along the channel and development of a new in-channel riffle from the extension of the downstream gravel bar. Locations where WV boxes and infiltration bags had been installed in study year 2 were no longer part of the wetted channel in study year 3 and instead were part of the higher elevation gravel bar. The limited recovery of WV boxes and infiltration bags in study years 2 and 3 at middle Sauk River study site is attributed to the geomorphically dynamic character of this reach. Gendaszek (2021) reported a study reach approximately 4.6 km upstream from middle Sauk River study site that showed lateral migration and substantial scour and deposition. Therefore, the geomorphically dynamic nature may be a limiting factor in terms of survival to emergence in this section of the river. The DO record indicates that the riverbed instability (and perhaps fine sediment) may contribute to temporary low DO conditions.
Dissolved oxygen was generally higher than 4 mg/L during the pre-emergence period, but there were long periods (from several hours to more than 1 day) of low DO that could affect viability. However, decreases in dissolved oxygen were limited to individual sensors. Dissolved oxygen conditions seem to be spatially variable, with periods of low dissolved oxygen at specific locations and sensors, but not throughout a given study site at several sensors. Critical oxygen concentrations for metabolic processes seem to be highest prior to hatching and then seem to decline post-hatching for steelhead (Rombough, 2011) and may be expected to be similar in Chinook salmon. In addition, after hatching, alevins can move within the substrate and therefore have the potential to migrate from areas of low dissolved oxygen to areas of higher dissolved oxygen (Greig and others, 2007). Therefore, it is uncertain how limiting low dissolved oxygen concentrations during the later stages of the pre-emergence period are for Chinook salmon. Apparent correspondence of DO with flows underscores the influence of flow on hydraulic and local geomorphic conditions. In upper Sauk River study, high flows seem to temporarily increase DO, whereas DO had sharp increases and decreases in middle and lower Sauk River study sites (fig. 18). The opposing correspondence may reflect channel stability and fine sediment supply between upper Sauk River study site and the other two study sites. Lower Sauk River study site is downstream from the Suiattle River confluence and the abundance of sand may locally change DO conditions.
Results indicated that bulk subsurface samples from in-channel and dry samples from adjacent gravel bars generally were both finer with greater values of fraction finer for sediment grain sizes of 4 mm or less compared to what was observed to infiltrate into the WV boxes and infiltration bags. Dry gravel samples may serve as a conservative proxy for potential fine sediment infiltration, with the expectation that fraction finer may be up to 0.15 more for fine sediments (for example, 4 mm or less) compared to infiltration in the bed. However, there is a potential that WV boxes may limit infiltration of very fine sediment (for example, a layer of finer sediment formed at the top of the WV boxes with coarser sediments below in the voids between the larger pre-filled clasts) (fig. 10). This fine top layer could block further infiltration of small clasts sizes (<2 mm) into the WV box. Additional work is needed to evaluate relative influences of WV box construction on fine sediment infiltration, and whether these influences are a function of the sampling method, bed disturbance, or some other factor.
This study recorded fine sediment infiltration into artificial redds in a natural river. In one flume study, the architecture of fish-constructed redds facilitated flushing of fines, oxygenation, and hydraulic stability, although this analysis was on local conditions that were under a sediment supply limited condition in which new sediment was not added to the flume (Buxton and others, 2015). Sediment infiltration observed in this study may be lower than what would occur in a real-world fish-constructed redd or mass spawning scenario. Real-world redds likely have different shape, alignment with flow, and different boundaries to adjacent unspawned locations, all of which affect stability, hyporheic flow, and potential fine sediment infiltration (Kondolf, 2000; Buxton and others, 2015). However, more information about local hydraulics, rate of fine sediment infiltration, and discharge flow rate through redds is needed to evaluate redd architecture in a river condition with ample natural sediment supply, such as the Sauk River. This study contributes data to a field of study that is relatively data sparse in part because of challenging logistics.
Considerations of the Level of Effort Among Different Sampling Methods
We had presumed that subsurface methods would be more easily measured and therefore a desirable alternative to the presumed logistically more complex methods involving WV boxes and infiltration bags. To evaluate if subsurface sampling methods were a physically less intensive and logistically less complex alternative to the WV boxes or infiltration bags, we developed a qualitative ranking based on factors we identified as representing physical labor and logistical complexity of all four methods (table 9). We ranked each factor subjectively from one to five corresponding to a range of relatively easy (1) to hard (5) such that a low overall sum of ranks assigned to each factor represent methods that are less physically laborious or logistically complex. This ranking may help when considering applying subsurface, WV box, and infiltration bag methods in future sediment infiltration field studies. Based on the assigned rankings derived from our personal experience in the study, the WV box method and dry gravel bar subsurface sample method had similarly low overall ranks, with all factors evaluated as either easy or moderate although differences existed between rankings of individual factors. Wet in-channel subsurface methods had rankings that were slightly higher because of moderate-to-hard and hard rankings for field logistical complexity and post field processing logistical complexity, respectively. The infiltration bag ranked higher, reflecting the challenges associated with the physical recovery of the bag and subsequent logistical challenges of managing the relatively large sample mass and volumes, which included many containers of associated river water. Based on this subjective, qualitative assessment of the different field method, fine sediment distributions of the river, and particularly the adjacent gravel bars, may be logistically easier alternative to using infiltration bags and potentially for WV boxes, depending on if the factors are ranked or weighted differently.
Table 9.
Subjective ranks for factors that represent physical labor and logistical complexity of the methods involving Whitlock-Vibert boxes, infiltration bags, and both dry, adjacent subsurface samples and wet, in-channel subsurface samples.[Ranks for each factor ranged from 1 (easy) to 5 (hard)]
Summary
This study reported on fine sediment infiltration during the egg-to-fry emergence period (fall to late winter) for Chinook salmon (Oncorhynchus tshawytscha) at three study sites along the Sauk River from 2018 to 2021. Infiltration boxes and sediment bags indicated that fine sediment infiltration resulted in approximately 0.12–0.39 fraction finer for less than 2-millimeter grain size (sand), which is the representative fine sediment size. Fraction finer exceeding 0.1 suggests that fine sediment infiltration may be a limiting factor for egg-to-fry survival, based on previously reported values. However, dissolved oxygen concentrations largely remained above minimum levels of 4 milligrams per liter, particularly through the earlier incubation phases, when eggs are more sensitive to low dissolved oxygen concentrations. Low dissolved oxygen concentrations recorded at some study sites later in the monitoring period may be mitigated by alevins who are able to migrate away from these study sites within the gravel. In geomorphically dynamic river reaches, such as in the middle Sauk River study site (Gendaszek, 2021), mobile channel beds subject to scour and deposition potentially impose an additional challenge for egg-to-fry survival.
In-channel and adjacent gravel bar sediment grain size distributions both overestimate but may be a reasonable first order approximation of the potential of fine sediment infiltration in spawning gravel. For this study, the effort associated with using Whitlock-Vibert boxes compared to the dry gravel bar sampling was approximately similar, based on subjective evaluation, and may be a preferred alternative in studies that focus on characterizing the potential of fine sediment infiltration in spawning gravels. Evaluating the level of effort and logistical complexity associated with each of the field methods may help when considering different methods for future studies.
References Cited
Anderson, S.W., Jaeger, K.L., Rasmussen, N., Seguin, C.M., Wilkerson, O.A., and Curran, C.A., 2022, Suspended-Sediment Data for the Bogachiel and Calawah Rivers, WA for Water Years 2019–2021: U.S. Geological Survey data release, accessed March 3, 2024, at https://doi.org/10.5066/P9YT9CN2.
Anderson, S.W., and Shean, D., 2021, Spatial and temporal controls on proglacial erosion rates—A comparison of four basins on Mount Rainier, 1960 to 2017: Earth Surface Processes and Landforms, v. 47, no. 2, p. 596–617, accessed March 3, 2024, at https://doi.org/10.1002/esp.5274.
Baisez, A., Bach, J.-M., Leon, C., Parouty, T., Terrade, R., Hoffmann, M., and Laffaille, P., 2011, Migration delays and mortality of adult Atlantic salmon Salmo salar en route to spawning grounds on the River Allier, France: Endangered Species Research, v. 15, no. 3, p. 265–270, accessed March 3, 2024, at https://doi.org/10.3354/esr00384.
Beacham, T.D., and Murray, C.B., 1989, Variation in developmental biology of sockeye salmon (Oncorhynchus nerka) and chinook salmon (O. tshawytscha) in British Columbia: Canadian Journal of Zoology, v. 67, no. 9, p. 2081–2089, accessed March 3, 2024, at https://doi.org/10.1139/z89-297.
Beamer, E.M., Beechie, T., Perkowski, B., and Klochak, J., 2000, Application of the Skagit Watershed Council’s Strategy—River basin analysis of the Skagit and Samish basins—Tools for salmon habitat restoration and protection: Mount Vernon, Washington, Habitat Restoration and Protection Committee of the Skagit Watershed Council, p. 80.
Bunte, K., and Abt, S.R., 2001, Sampling surface and subsurface particle-size distributions in wadable gravel-and cobble-bed streams for analyses in sediment transport, hydraulics, and streambed monitoring: Fort Collins, Colorado, U.S. Department of Agriculture, Forest Service, Rocky Mountain Research Station, Gen. Tech. Rep. RMRS-GTR-74, v.74, 428 p.
Buxton, T.H., Buffington, J.M., Yager, E.M., Hassan, M.A., and Fremier, A.K., 2015, The relative stability of salmon redds and unspawned streambeds: Water Resources Research, v. 51, no. 8, p. 6074–6092, accessed March 3, 2024, at https://doi.org/10.1002/2015WR016908.
Chapman, J.M., Proulx, C.L., Veilleux, M.A.N., Levert, C., Bliss, S., André, M.-È., Lapointe, N.W.R., and Cooke, S.J., 2014, Clear as mud—A meta-analysis on the effects of sedimentation on freshwater fish and the effectiveness of sediment-control measures: Water Research, v. 56, p. 190–202, accessed March 3, 2024, at https://doi.org/10.1016/j.watres.2014.02.047.
Czuba, J.A., Czuba, C.R., Magirl, C.S., and Voss, F.D., 2010, Channel-conveyance capacity, channel change, and sediment transport in the lower Puyallup, White, and Carbon Rivers, western Washington, in Channel-conveyance capacity, channel change, and sediment transport in the lower Puyallup, White, and Carbon Rivers, western Washington: U.S. Geological Survey Scientific Investigations Report 2010–5240, 104 p., accessed March 3, 2024, at https://doi.org/10.3133/sir20105240.
Czuba, J.A., Magirl, C.S., Czuba, C.R., Curran, C.A., Johnson, K.H., Olsen, T.D., Kimball, H.K., and Gish, C.C., 2012, Geomorphic analysis of the river response to sedimentation downstream of Mount Rainier, Washington, in Geomorphic analysis of the river response to sedimentation downstream of Mount Rainier, Washington: U.S. Geological Survey Open-File Report 2012–1242, 150 p., accessed March 3, 2024, at https://doi.org/10.3133/ofr20121242.
National Marine Fisheries Service, 2005, Endangered and threatened species—Final listing determinations for 16 ESUs of west coast salmon, and final 4(d) protective regulations for threatened salmonid ESUs: Federal Register, v. 70, no. 123, p. 37160–37204, accessed July 8, 2024 at https://www.federalregister.gov/documents/2005/06/28/05-12351/endangered-and-threatened-species-final-listing-determinations-for-16-esus-of-west-coast -salmon-and.
National Marine Fisheries Service, 2007, Endangered and threatened species—Final listing determination for Puget Sound steelhead: Federal Register, v. 72, no. 91, p, 26722–26735, accessed July 8, 2024 at https://www.federalregister.gov/documents/2007/05/11/E7-9089/endangered-and-threatened-species-final-listing-determination-for-puget-sound-steelhead.
Finger, D., Heinrich, G., Gobiet, A., and Bauder, A., 2012, Projections of future water resources and their uncertainty in a glacierized catchment in the Swiss Alps and the subsequent effects on hydropower production during the 21st century: Water Resources Research, v. 48, no. 2, 20 p., accessed March 3, 2024, at https://doi.org/10.1029/2011WR010733.
Fordham, E.M., Pfeiffer, A.M., Bunn, A.G., and Novak, S.J., 2023, Recurrent debris flows and their downstream fate—Geomorphic drivers of an anomalous sediment load, Suiattle River, Washington State, USA: Earth Surface Processes and Landforms, v. 48, no. 7, p. 1307–1320, accessed March 3, 2024, at https://doi.org/10.1002/esp.5551.
Garrett, J.W., and Bennett, D.H., 1996, Evaluation of fine sediment intrusion into Whitlock-Vibert bBoxes: North American Journal of Fisheries Management, v. 16, no. 2, p. 448–452, accessed March 3, 2024, at https://doi.org/10.1577/1548-8675(1996)016<0448:EOFSII>2.3.CO;2.
Geist, D.R., Abernethy, C.S., Hand, K.D., Cullinan, V.I., Chandler, J.A., and Groves, P.A., 2006, Survival, development, and growth of fall Chinook salmon embryos, alevins, and fry exposed to variable thermal and dissolved oxygen regimes: Transactions of the American Fisheries Society, v. 135, no. 6, p. 1462–1477, accessed March 3, 2024, at https://doi.org/10.1577/T05-294.1.
Gendaszek, A.S., 2021, Streambed scour of salmon (Oncorhynchus spp.) redds in the Sauk River, Northwestern Washington, in Streambed scour of salmon (Oncorhynchus spp.) redds in the Sauk River, northwestern Washington: U.S. Geological Survey Scientific Investigations Report 2021–5133, 19 p., accessed March 3, 2024, at https://doi.org/10.3133/sir20215133.
Gendaszek, A.S., and Sheibley, R.W., 2021, Substrate particle-size distribution, dissolved-oxygen concentrations, sediment temperatures, and groundwater/surface-water exchange in shoreline spawning habitat of sockeye salmon (Oncorhynchus nerka) of Lake Ozette, Western Washington: U.S. Geological Survey Scientific Investigations Report 2021–5134, 21 p., accessed March 3, 2024, at https://doi.org/10.1002/hyp.6188.
Greig, S.M., Sear, D.A., and Carling, P.A., 2007, A review of factors influencing the availability of dissolved oxygen to incubating salmonid embryos: Hydrological Processes, v. 21, no. 3, p. 323–334, accessed March 3, 2024, at https://doi.org/10.1002/hyp.6188.
Jaeger, K.L., Anderson, S.W., Leach, A.C., Headman, A.O., Dunn, S.B., Wilkerson, O.A., Seguin, C.M., and Foreman, J., 2024, Sediment and dissolved oxygen data to support fine sediment intrusion in Chinook salmon spawning gravels, Sauk River, Washington: U.S. Geological Survey Scientific Data Release, https://doi.org/10.5066/P9RV73FO.
Jaeger, K.L., Curran, C.A., Anderson, S.W., Morris, S.T., Moran, P.W., and Reams, K.A., 2017, Suspended sediment, turbidity, and stream water temperature in the Sauk River Basin, western Washington, water years 2012–16: U.S. Geological Survey Scientific Investigations Report 2017–5113, 60 p., accessed March 3, 2024, at https://doi.org/10.3133/sir20175113.
Jensen, D.W., Steel, E.A., Fullerton, A.H., and Pess, G.R., 2009, Impact of fine sediment on egg-to-fry survival of Pacific salmon—A meta-analysis of published studies: Reviews in Fisheries Science, v. 17, no. 3, p. 348–359, accessed March 3, 2024, at https://doi.org/10.1080/10641260902716954.
Johnson, C.L., Roni, P., and Pess, G.R., 2012, Parental effect as a primary factor limiting egg-to-fry survival of spring Chinook salmon in the Upper Yakima River Basin: Transactions of the American Fisheries Society, v. 141, no. 5, p. 1295–1309, accessed March 3, 2024, at https://doi.org/10.1080/00028487.2012.690815.
Julien, H.P., and Bergeron, N.E., 2006, Effect of fine sediment infiltration during the incubation period on Atlantic salmon (Salmo salar) embryo survival: Hydrobiologia, v. 563, no. 1, p. 61–71, accessed March 3, 2024, at https://doi.org/10.1007/s10750-005-1035-2.
Keck, J., Istanbulluoglu, E., Lundquist, J., Bandaragoda, C., Jaeger, K., Mauger, G., & Horner-Devine, A., 2022, How does precipitation variability control bedload response across a mountainous channel network in a maritime climate?: Water Resources Research, v. 58, no. 8, 28 p., accessed March 3, 2024, at https://doi.org/10.1029/2021WR030358.
Kondolf, G.M., 2000, Assessing salmonid spawning gravel quality: Transactions of the American Fisheries Society, v. 129, no. 1, p. 262–281, accessed March 3, 2024, at https://doi.org/10.1577/1548-8659(2000)129<0262:ASSGQ>2.0.CO;2.
Lane, S.N., Bakker, M., Gabbud, C., Micheletti, N., and Saugy, J.-N., 2017, Sediment export, transient landscape response and catchment-scale connectivity following rapid climate warming and Alpine glacier recession: Geomorphology, v. 277, p. 210–227, accessed March 3, 2024, at https://doi.org/10.1016/j.geomorph.2016.02.015.
Lisle, T.E., and Eads, R.E., 1991, Methods to measure sedimentation of spawning gravels: Berkeley, California, Pacific Southwest Research Station, U.S. Department of Agriculture, U.S. Forest Service, Research Note PSW-411, 7 p., accessed March 3, 2024, at https://www.fs.usda.gov/research/treesearch/7859.
Livneh, B., Rosenberg, E.A., Lin, C., Nijssen, B., Mishra, V., Andreadis, K.M., Maurer, E.P., and Lettenmaier, D.P., 2013, A long-term hydrologically based dataset of land surface fluxes and states for the conterminous United States—Update and extensions: Journal of Climate, v. 26, no. 23, p. 9384–9392, accessed March 3, 2024, at https://doi.org/10.1175/JCLI-D-12-00508.1.
Micheletti, N., Lambiel, C., and Lane, S.N., 2015, Investigating decadal-scale geomorphic dynamics in an alpine mountain setting: Journal of Geophysical Research. Earth Surface, v. 120, no. 10, p. 2155–2175, accessed March 3, 2024, at https://doi.org/10.1002/2015JF003656.
Peters, R.J., Liermann, M., McHenry, M.L., Bakke, P., and Pess, G.R., 2017, Changes in streambed composition in salmonid spawning habitat of the Elwha River during dam removal: Journal of the American Water Resources Association, v. 53, no. 4, p. 871–885, accessed March 3, 2024, at https://doi.org/10.1111/1752-1688.12536.
Rombough, P.J., 2011, Growth, aerobic metabolism, and dissolved oxygen requirements of embryos and alevins of steelhead, Salmo gairdneri: Canadian Journal of Zoology, v. 66, no. 3, 10 p., accessed March 3, 2024, at https://doi.org/10.1139/z88-097.
Roni, P., Johnson, C., De Boer, T., Pess, G., Dittman, A., and Sear, D., 2016, Interannual variability in the effects of physical habitat and parentage on Chinook salmon egg-to-fry survival: Canadian Journal of Fisheries and Aquatic Sciences, v. 73, no. 7, p. 1047–1059, accessed March 3, 2024, at https://doi.org/10.1139/cjfas-2015-0372.
Schwat, E., Istanbulluoglu, E., Horner-Devine, A., Anderson, S., Knuth, F., and Shean, D., 2023, Multi-decadal erosion rates from glacierized watersheds on Mount Baker, Washington, USA, reveal topographic, climatic, and lithologic controls on sediment yields: Geomorphology, v. 438, 17 p., accessed March 3, 2024, at https://doi.org/10.1016/j.geomorph.2023.108805.
U.S. Geological Survey, 2020, Dissolved oxygen: U.S. Geological Survey Techniques and Methods, book 9, chap. A6.2, 33 p., accessed March 3, 2024, at https://doi.org/10.3133/tm9A6.2. [Supersedes USGS Techniques of Water-Resources Investigations, book 9, chap. A6.2, version 3.0.]
U.S. Geological Survey, 2022a, USGS 12186000 Sauk River AB White Chuck River NR Darrington, WA: U.S. Geological Survey National Water Information System, accessed December 14, 2022, at https://doi.org/10.5066/F7P55KJN. [Site information directly accessible at https://waterdata.usgs.gov/monitoring-location/12186000/#parameterCode=00065&period=P7D&showMedian=false.]
U.S. Geological Survey, 2022b, USGS 12189500 Sauk River Near Sauk, WA: U.S. Geological Survey National Water Information System, accessed December 14, 2022, at https://doi.org/10.5066/F7P55KJN. [Site information directly accessible at https://waterdata.usgs.gov/monitoring-location/12189500/#parameterCode=00065&period=P7D&showMedian=false.]
U.S. Geological Survey, 2022c, USGS 12188380 Suiattle River Above All Creek NR Darrington, WA: U.S. Geological Survey National Water Information System, accessed December 14, 2022, at https://doi.org/10.5066/F7P55KJN. [Site information directly accessible at https://waterdata.usgs.gov/monitoring-location/12188380/#parameterCode=63680&startDT=2018-07-01&endDT=2021-04-30&showMedian=true.]
Wagner, R.J., Boulger, R.W., Jr., Oblinger, C.J., and Smith, B.A., 2006, Guidelines and standard procedures for continuous water-quality monitors: Station operation, record computation, and data reporting, in Guidelines and standard procedures for continuous water-quality monitors—Station operation, record computation, and data reporting: U.S. Geological Survey Techniques and Methods 1-D3, accessed March 3, 2024, at https://doi.org/10.3133/tm1D3.
Washington Department of Ecology, 2002, Focus—Dissolved Oxygen and the Water Quality Standards: Washington Department of Ecology Publication Number 02-10-001, accessed March 3, 2024, at https://apps.ecology.wa.gov/publications/publications/0210001.pdf.
Wesche, T.A., Reiser, D.W., Hasfurther, V.R., Hubert, W.A., and Skinner, Q.D., 1989, New Technique for Measuring Fine Sediment in Streams: North American Journal of Fisheries Management, v. 9, no. 2, p. 234–238, accessed March 3, 2024, at https://doi.org/10.1577/1548-8675(1989)009<0234:NTFMFS>2.3.CO;2.
Conversion Factors
International System of Units to U.S. customary units
Temperature in degrees Celsius (°C) may be converted to degrees Fahrenheit (°F) as follows:
°F = (1.8 × °C) + 32.
Temperature in degrees Fahrenheit (°F) may be converted to degrees Celsius (°C) as follows:
°C = (°F – 32) / 1.8.
Supplemental Information
Concentrations of dissolved oxygen and suspended sediments are in milligrams per liter (mg/L).
Abbreviations
ATU
accumulated thermal unit
CVO
U.S. Geological Survey Cascades Volcano Observatory
DO
Dissolved Oxygen
NWIS
U.S. Geological Survey National Water Information System
PIT
passive integrated transponder
RKM
river kilometer
SSC
suspended-sediment concentration
SSL
suspended-sediment load
USGS
U.S. Geological Survey
WV
Whitlock-Vibert
For information about the research in this report, contact the
Director, Washington Water Science Center
U.S. Geological Survey
934 Broadway, Suite 300
Tacoma, Washington 98402
https://www.usgs.gov/centers/washington-water-science-center
Manuscript approved on August 7, 2024
Publishing support provided by the U.S. Geological Survey
Science Publishing Network, Tacoma Publishing Service Center
Disclaimers
Any use of trade, firm, or product names is for descriptive purposes only and does not imply endorsement by the U.S. Government.
Although this information product, for the most part, is in the public domain, it also may contain copyrighted materials as noted in the text. Permission to reproduce copyrighted items must be secured from the copyright owner.
Suggested Citation
Jaeger, K.L., Anderson, S.W., Leach, A.C., and Morris, S.T., 2024, Quantifying fine sediment infiltration in spawning gravel used by Chinook salmon (Oncorhynchus tshawytscha) in the Sauk River Basin, Washington, 2018–21: U.S. Geological Survey Scientific Investigations Report 2024–5077, 36 p., https://doi.org/10.3133/sir20245077.
ISSN: 2328-0328 (online)
Study Area
| Publication type | Report |
|---|---|
| Publication Subtype | USGS Numbered Series |
| Title | Quantifying fine sediment infiltration in spawning gravel used by Chinook salmon (Oncorhynchus tshawytscha) in the Sauk River Basin, Washington, 2018–21 |
| Series title | Scientific Investigations Report |
| Series number | 2024-5077 |
| DOI | 10.3133/sir20245077 |
| Publication Date | October 01, 2024 |
| Year Published | 2024 |
| Language | English |
| Publisher | U.S. Geological Survey |
| Publisher location | Reston, VA |
| Contributing office(s) | Washington Water Science Center |
| Description | Report: viii, 36 p.; Data Release |
| Country | United States |
| State | Washington |
| Other Geospatial | Sauk River Basin |
| Online Only (Y/N) | Y |