Estimating Groundwater Level Records Using MOVE.1 and Computing Monthly Percentiles From Estimated Groundwater Records in Massachusetts
Links
- Document: Report (7.73 MB) , HTML , XML
- Data Release: USGS data release - Data and R code to derive estimates of groundwater levels using MOVE.1 regression and compute monthly percentiles for select wells in Massachusetts
- NGMDB Index Page: National Geologic Map Database Index Page (html)
- Download citation as: RIS | Dublin Core
Abstract
The U.S. Geological Survey, in cooperation with the Massachusetts Department of Environmental Protection, performed record extensions on groundwater levels at select wells using the Maintenance of Variance Extension type 1 (MOVE.1) method. The groundwater levels estimated from these record extensions were used to compute monthly percentiles to improve future determinations of a groundwater index. In Massachusetts, 27 of 29 short-record study wells with continuous groundwater levels between 0.8 and 8.1 years were suitable for record extensions; 37 long-record index wells were used to extend the groundwater level records at the study wells. The index well selected to pair with a study well was chosen based on Pearson correlation coefficient values; cross-correlation between the two wells; geologic and topographic similarity; and smallest distance spanning the wells. Each study well and its corresponding index well have 1 or more years of concurrent, overlapping data; a Pearson correlation coefficient that exceeded a threshold value of 0.8; and a similar aquifer type and hydrologic characteristics. Of the 29 study wells, 2 showed poor correlations with all index wells and were not considered for record extensions.
Performance metrics used to assess the accuracy of the MOVE.1 models indicated that most models provided reasonable estimates of groundwater levels. Root mean square error values ranged from 0.097 to 2.292 feet, with a median of 0.536 foot. Nash-Sutcliffe efficiency coefficient values ranged from 0.623 to 0.996, with a median value of 0.759. Generally, study wells in close geographical proximity to their index well resulted in stronger model performance.
The average length of groundwater level records was extended by 14.1 years to a new average of 18.1 years. The estimated groundwater level records from the MOVE.1 models resulted in an increase in the range of highest and lowest groundwater levels at 23 of 27 wells. The increase in range of groundwater levels was between 0.08 to 7.95 feet. Monthly percentiles for State drought indices were computed from the estimated MOVE.1 records and observed records through December 31, 2021. Percentiles computed from estimated records show an average groundwater level about 1.0 foot lower than observed data at the 2d percentile and 0.1 foot lower at the 30th percentile.
Introduction
The principal source of information for understanding groundwater conditions and characterizing the severity of a drought in Massachusetts comes from the records of groundwater levels from a statewide network of groundwater wells. Groundwater levels can vary greatly from season to season and from year to year in response to climatic and hydrologic conditions. Currently [2023], 72 wells in the U.S. Geological Survey (USGS) Climate Response Network (CRN) are used for monitoring groundwater levels in Massachusetts (fig. 1). CRN wells maximize the State’s ability to effectively prepare for and respond to drought conditions (Massachusetts Executive Office of Energy and Environmental Affairs and Massachusetts Emergency Management Agency, 2019).
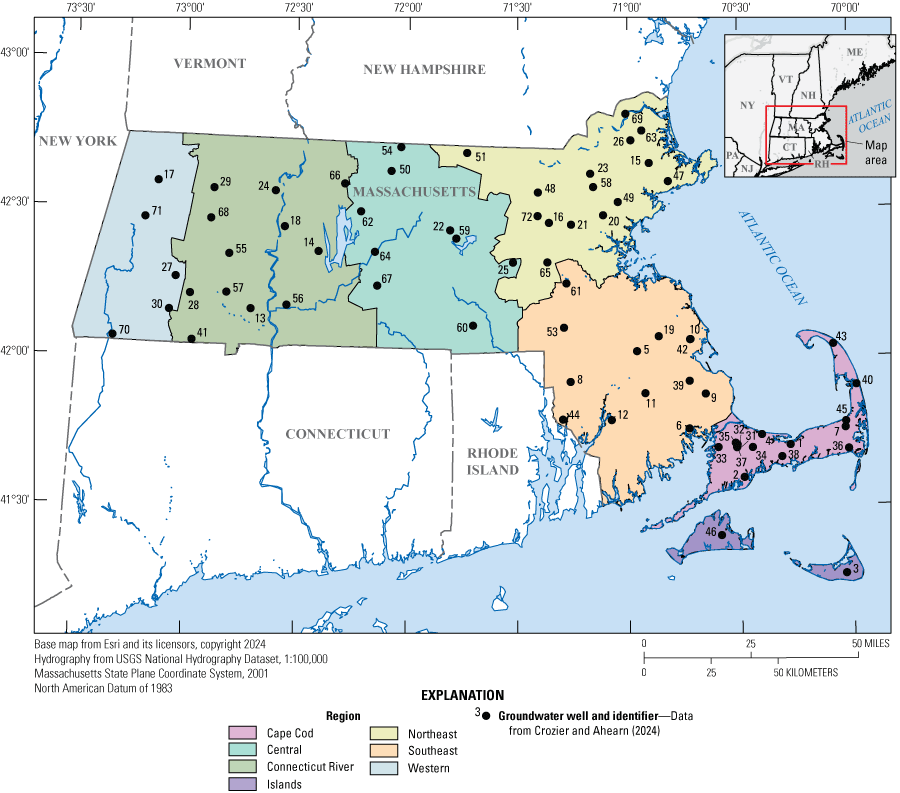
Map showing the locations of U.S. Geological Survey Climate Response Network wells and drought regions for monitoring groundwater levels in Massachusetts. Wells are listed in appendix 1, table 1.1.
Groundwater levels are monitored using a combination of continuous monitoring wells and noncontinuous monitoring, discrete wells. Noncontinuous monitoring wells (with no automatic sensing or recording devices) require manual measurements. In Massachusetts, measurements are typically made at a scheduled monthly interval. With monthly monitoring, however, extreme water level fluctuations cannot be determined with certainty and hydraulic responses to groundwater stresses that happen between measurements may be missed. Continuous-monitoring wells provide the finest resolution, typically hourly or subhourly, of water level fluctuations and are the most helpful to use for monitoring fluctuations in groundwater levels during droughts. Since 2013, 29 wells have been equipped with 15-minute-interval recording devices and currently [2023] have between 0.8 and 8.1 years of continuous record. Many of the installations were prompted by the 2016–7 statewide drought and an increased awareness of the need for data for future drought analyses.
Massachusetts has experienced widespread, severe drought many times. Single-season droughts in the State are becoming more common, with the majority of Massachusetts experiencing droughts in 2016, 2020, and 2022 (Lombard and others, 2020; McCarthy and others, 2023). In Massachusetts, groundwater levels are one of six indices (precipitation, streamflow, groundwater, lakes and impoundments, fire danger, and evapotranspiration) used to assess the severity of a drought (Massachusetts Executive Office of Energy and Environmental Affairs and Emergency Management Agency, 2019). The methods for calculating the groundwater index are described in the Massachusetts drought management plan (Massachusetts Executive Office of Energy and Environmental Affairs and Emergency Management Agency, 2019). The 2019 plan aligns the drought categories and percentile ranges with the U.S. Drought Monitor, adopting a frequency of occurrence approach to determine drought severity as is used by the U.S. Drought Monitor and the USGS (National Drought Mitigation Center, 2023). The approach requires the computation of the monthly percentiles for individual CRN wells. Groundwater conditions are then characterized at a regional scale by the median of all the individual well percentiles within that region.
Evaluating the potential effects of declining groundwater levels due to drought requires records beyond the observed groundwater levels available for many of the study CRN wells. Wells with shorter records generally do not capture the full range of long-term groundwater conditions. This lack of range renders drought determinations based on short-record wells less accurate than those based on long-record wells. Natural variations in groundwater levels at an annual scale, coupled with decadal variations, increase the need for the longest period of record possible. When monthly percentiles are computed from short records, particularly where the groundwater record excludes periods of droughts, the monthly percentiles for drought assessment can be unreliable.
Robust estimation procedures such as record extensions use data from a well site with a long period of record to extend the data at a nearby well site with a shorter period of record when the sites are closely correlated. Historically, record extension methods have been widely used throughout the hydrologic community to extend streamflow records (Colarullo and others, 2018; Olson and Meyerhofer, 2019). Methods for extending groundwater levels have been developed to meet the needs for drought management and improvements in deriving the groundwater index (Dudley and others, 2018).
The purpose of this study is to extend the groundwater level records at select study wells and compute monthly percentiles from the estimated historical groundwater level records to increase the State’s ability to characterize drought conditions in the seven drought regions in Massachusetts. This report presents the results of record extension efforts and includes (1) an overview of the selection of the study wells and long-term wells designated in this report as index wells; (2) discussion of the Maintenance of Variance Extension type 1 (MOVE.1) method to extend groundwater level records at wells on the basis of concurrent records at hydrologically similar index wells located in Massachusetts or surrounding States; and (3) evaluation of the MOVE.1 model accuracy. The report includes two appendices: appendix 1 contains a list of groundwater wells in Massachusetts that are part of the USGS CRN and appendix 2 contains the monthly percentiles of groundwater levels for the study wells.
Well Network
In 2023, the USGS operated a network of 79 wells in Massachusetts for monitoring groundwater levels. A subset of these wells (72 of 79) is part of the USGS CRN (U.S. Geological Survey, 2024). The CRN includes about 680 wells nationwide that report water level conditions that are minimally affected by human activities. The primary purpose of the USGS CRN is to monitor the effect of climate on groundwater levels. Because CRN wells are minimally affected by human activities, the groundwater level fluctuations reflect climatic variation rather than, for example, groundwater withdrawals or human-induced recharge. CRN wells provide critical information on groundwater levels for drought management.
For this study, CRN wells in Massachusetts were reviewed and compiled as study wells or as index wells based on the individual lengths of continuous daily water level record. CRN wells in surrounding States with record lengths greater than 10 years and several undesignated CRN wells (sites 414831072173002 [CT–MS 80 Mansfield, Conn.], 414741072134501 [CT–MS 44 Mansfield, Conn.], 425024071413001 [NH–MOW 36, N.H.], 422622073410901 [Local number, Cb-1072, at Niverville, N.Y.], 414128073475201 [Local number, Du-1009, ST Park, Pleasant Valley, N.Y.], and 414737073563301 [Local number, Du-321, near Hyde Park, N.Y.]) with record lengths greater than 10 years were included as index wells to increase the spatial coverage and density of index wells in the study. Well data, including data from undesignated CRN wells, used in the study are considered to be predominantly natural, with no or little human-caused stresses.
Most of the study wells include both continuous data and discrete data. Continuous data provide more accurate estimates of maximum and minimum water level fluctuations than discrete data. Discrete data include groundwater-level records based on measurements generally made at monthly intervals. For this study, study wells had continuous daily water-level data records 0.8 to 8.1 years long, as of December 31, 2021 (table 1). The average record length for the study wells is 4.0 years. An index well was required to have 9 or more years (consecutive or nonconsecutive) of daily water level records as of December 31, 2021 (table 2). The average record length for an index well was 20.8 years. On the basis of proximity of the paired wells and minimum data criteria, 29 study wells and 39 index wells were included in this study (fig. 2). The index wells include 26 wells in Massachusetts and 13 wells in nearby States: 4 in Connecticut, 3 in New Hampshire, 4 in New York, and 2 in Rhode Island (fig. 2).
Table 1.
U.S. Geological Survey groundwater wells selected for record extensions for monitoring groundwater levels in Massachusetts.[Data are from Crozier and Ahearn (2024). ID, identifier; no., number; MA, Massachusetts]
Table 2.
U.S. Geological Survey long-term groundwater wells in and near Massachusetts selected as index wells for extending groundwater level records at study wells for monitoring groundwater levels in Massachusetts.[Data are from Crozier and Ahearn (2024). ID, identifier; no., number; CT, Connecticut; MA, Massachusetts; NY, New York; RI, Rhode Island]
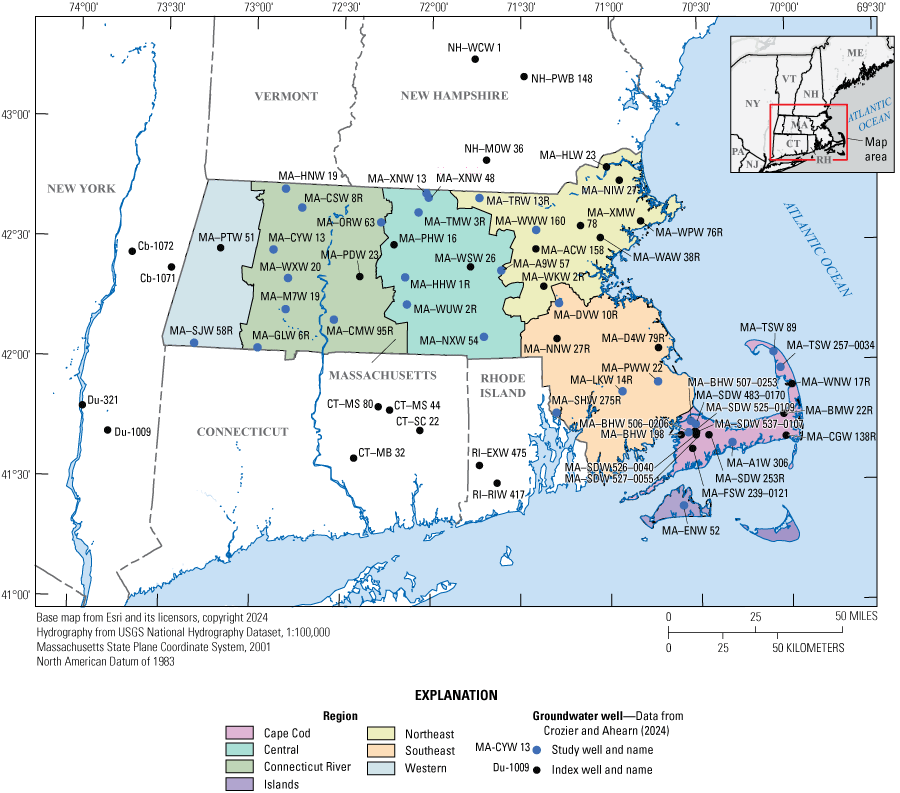
Map showing the locations of 29 U.S. Geological Survey groundwater wells selected for possible record extensions and 39 U.S. Geological Survey wells selected as index wells in and near Massachusetts for monitoring groundwater levels in Massachusetts. Site names are in shortened forms; full study well site names are listed in table 1 and full index well site names are listed in table 2.
Development of MOVE.1 Models for the Extension of Groundwater Level Records
Record extension uses information from a nearby longer-record index well site to extend the record (daily time-series data) at a short-record well site when the cross-correlation between the two sites is high. The index well characteristics of distribution shape, serial correlation, and seasonality are transferred to the short-record well site, with adjustments of location and scale appropriate to the short-record well site. If the index well site and short-record well site have substantial differences in the characteristics, the record extension will perform poorly because these index well characteristics will be inaccurately attributed to the short-record well site.
Selection of Well Pairs
It is important that the index well selected for extending groundwater-level records is hydrologically similar to the study well and characterized by similar types of groundwater level fluctuations. As an indicator of hydrologic similarity, this study required that the index well and study well share the same physiographic province. The straight-line, Euclidean distance between individual study wells and index wells was calculated using geographic information system tools (tables 3 and 4). For this study, the maximum distance between paired wells for maintaining similar hydrologic characteristics was 30 miles (mi), which is about the average width of the drought regions in the Massachusetts drought management plan (Massachusetts Executive Office of Energy and Environmental Affairs and Emergency Management Agency, 2019). The paired wells more than 30 mi apart were flagged as suboptimal because the transfer of information from the index well to the study well may not be accurate over that distance (tables 3 and 4). In Massachusetts and its surrounding States, there are a very limited number of glacial till or bedrock wells. For this study, none of the well pairs in glacial till or bedrock aquifers were within a 30 mi span of one another and were therefore flagged as suboptimal.
Table 3.
U.S. Geological Survey study wells with paired index wells and descriptive parameters of the Maintenance of Variance Extension type 1 (MOVE.1) models for monitoring groundwater levels in Massachusetts.[Data are from Crozier and Ahearn (2024). Site names are in shortened forms; study well site names are listed in table 1 and index well site names are listed in table 2. ID, identifier; mi, mile; no., number; B, bedrock; Till, glacial till; SD, stratified drift]
Table 4.
U.S. Geological Survey study wells with paired index wells and performance metrics of the Maintenance of Variance Extension type 1 (MOVE.1) models for monitoring groundwater levels in Massachusetts.[Data are from Crozier and Ahearn (2024). Site names are in shortened forms; study well site names are listed in table 1 and index well site names are listed in table 2. ID, identifier; r, Pearson correlation coefficient; RMSE, root mean square error; NSE, Nash-Sutcliffe efficiency coefficient; Min, minimum; Q1, first quarter; Q3, third quarter; Max, maximum]
The criteria for selecting an index well to pair with a study well were (1) a Pearson correlation coefficient of 0.8 or greater; (2) similar geologic characteristics; (3) similar topographic characteristics, if applicable; and (4) a concurrent record of 1 or more years. A correlation coefficient exceeding a threshold value of 0.8 or greater is indicative of a strong linear relation between the index well and the study well; this provides reliable estimates of groundwater levels. Correlation testing was performed using all 37 index wells for each study well. Only well pairs with similar geologic characteristics and a correlation coefficient of 0.8 or greater were considered for further analysis. When multiple index wells show the same or similar correlation coefficient to a single study well, distance between the wells determined the most suitable index well. Well pairs with a shorter distance between the wells were given preference over well pairs that were further apart. In addition, well pairs with a longer concurrent record were preferred over well pairs with a shorter concurrent record. A longer concurrent record improves the MOVE.1 method to estimate groundwater levels because the model parameters can be estimated more precisely (Vogel and Kroll, 1991).
Results from correlation testing on all possible pairs of wells indicated that 27 of 29 study wells have a Pearson correlation coefficient of 0.8 or greater to one or more index wells (table 4). The initial correlation testing resulted in a total of 75 possible pairs. Many of the possible pairs were dropped from further analysis because they did not meet the criterion for similarity in geologic and topographic characteristics. Two study wells—sites 420610071421402 (MA–NXW 54 Northbridge, Mass.) and 421410072081101 (MA–WUW 2R West Brookfield, Mass.)—had poor correlation coefficients (less than 0.8) and were dropped from further analysis. In several cases where the correlation coefficient is only slightly weaker at one or more index wells and the distance between the wells is similar, record extensions were performed on both wells and the performance metrics (described in the “Accuracy and Limitations of Groundwater Level Records From MOVE.1” section of this report) from the MOVE.1 method were evaluated to determine the best index well to use for the final record extension.
Use of MOVE.1 for Record Extension
The MOVE.1 method was used to estimate groundwater levels at 27 of 29 wells initially selected for extension. The MOVE.1 method is based on developing a linear relationship between the study well and the index well by assuming that the sample mean and sample variance of groundwater levels are maintained over time for the study well (Hirsch, 1982). Only the means and standard deviations for the concurrent record are used to define the MOVE.1 relation. The concurrent record is defined using continuous and discrete records. The MOVE.1 equation is then written as follows:
whereYi
is the estimated groundwater level at the study well for day i,
Y̅
is the mean of the concurrent observed groundwater levels at the study well,
Sy
is the standard deviation of the concurrent observed groundwater levels at the study well,
Sx
is the standard deviation of the concurrent observed groundwater levels at the index well,
Xi
is the groundwater level at the index well for day i, and
X̅
is the mean of the concurrent observed groundwater levels at the index well.
The programming language R, along with the R package smwrStats, version 0.7.5 (Lorenz, 2017a, b, 20221213), was used to perform the record extensions. R is an open-source programming language and software environment for statistical computing and graphics supported by the R Foundation for Statistical Computing. The R script reads the station identifiers; extracts groundwater level data from the National Water Information System database for both the index well and the study well; loops through each index well associated with the study wells, performing the MOVE.1 method using the index and study wells; outputs estimated groundwater levels for the study wells; computes residual statistics; and generates model residuals.
Evaluation of MOVE.1 Models
Records were extended at 27 of the 29 wells initially selected for extensions. Plots of correlation, model fit, and statistical distribution of the residuals for the MOVE.1 models were evaluated for goodness of fit. The correlation plots of the concurrent records show the relation of index well to study well. The model-fit plots show the estimated groundwater levels and observed groundwater levels for the concurrent record. When extending records, the set of groundwater-level estimates and the statistical distribution of that set are important, rather than the individual estimates. Histogram plots were visually inspected and used to evaluate the data distribution. The distribution of residuals, representing the difference between the observed values and the estimated values, should be normally distributed with a mean of 0 for MOVE.1 modeling.
Figures 3 through 5 not only show how accurately the models represent the groundwater-level range and data distribution at the study well but also provide insight into how well the models estimate groundwater levels and statistics for drought management. The three figures are examples of models ranging in quality from excellent (fig. 3) to fair (fig. 5), with the distance between the pared wells spanning 2, 17, and 66 mi. Visual inspection of the model fit and the interquartile range of the residuals were considered when evaluating the quality of the model. The aquifer systems of the three well pairs are stratified drift, which is the primary aquifer type of the study wells. The mean and distribution of the residuals for all the models indicated no clear bias in the estimated records.
Figure 3 shows the correlation, model fit of the concurrent continuous data, and distribution of the residuals from the MOVE.1 method of the study well at site 414205070334701 (MA–BHW 506–0206 [MW–21M3] Bourne, Mass.) and the index well at site 414219070313601 (MA–SDW 525–0109 [MW–126S]). The paired wells are 2 mi apart with 2.5 years of concurrent data. The degree of correlation between study well and index well is considered very strong at 0.998 (fig. 3A). The model estimated daily groundwater levels from January 2002 to June 2018 (about 16 years of record). The model fit of the concurrent continuous data is considered excellent (fig. 3B). The residuals are very small, ranging from −0.37 to 0.22 foot (ft) with a mean of 0 ft and an interquartile range from −0.07 to 0.08 ft. The magnitude of the range of the groundwater data based on the record extension is 10.88 ft (a 6.08-ft change in range).
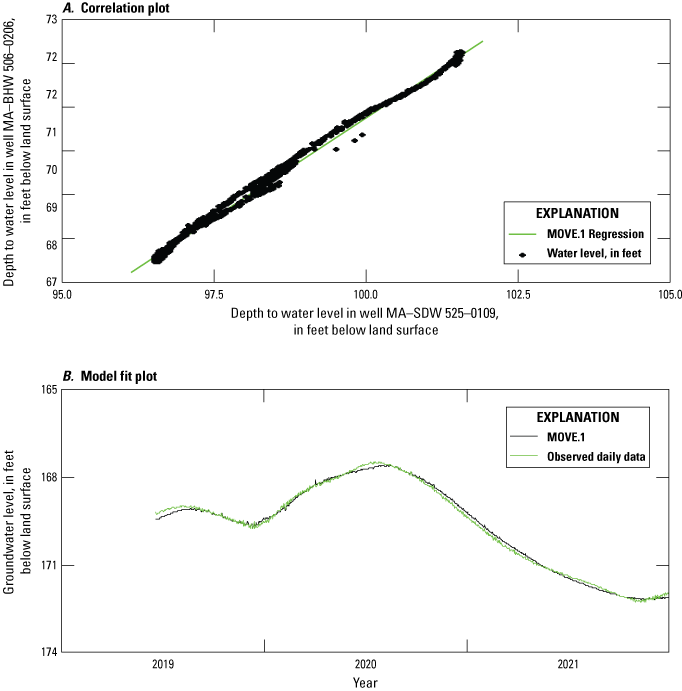
Graphs showing A, correlation and B, model fit of the concurrent continuous data from the Maintenance of Variance Extension type 1 (MOVE.1) method of the study well at site 414205070334701 (MA–BHW 506-0206 [MW–21M3] Bourne, Mass.) and the index well at site 414219070313601 (MA–SDW 525–0109 [MW–126S]), as part of a study for monitoring groundwater levels in Massachusetts. The paired wells are 2 miles apart with 2.5 years of concurrent data.
Figure 4 shows the correlation, model fit of the concurrent continuous data, and distribution of the residuals from the MOVE.1 method of the study well at site 413930070190901 (MA–A1W 306 Barnstable, Mass.) and the index well at site 414632070014901 (MA–BMW 22R Brewster, Mass.). The paired wells are 17 mi apart with 6.6 years of concurrent data. The degree of correlation between study well and index well is considered strong at 0.910 (fig. 4A). The model estimated daily groundwater levels from December 2001 to November 2015, along with several days in July 2016 and January 2019 (about 14 years of record). The estimated groundwater levels are considered a good model fit to the observed water levels (fig. 4B), with 50 percent of the estimated data within 0.5 ft of the observed data. The residuals range from −2.95 to 1.75 ft with an interquartile range of −0.46 to 0.53 ft. The magnitude of the range of the groundwater data based on the record extension is 8.35 ft (a 0.70-ft change in range).
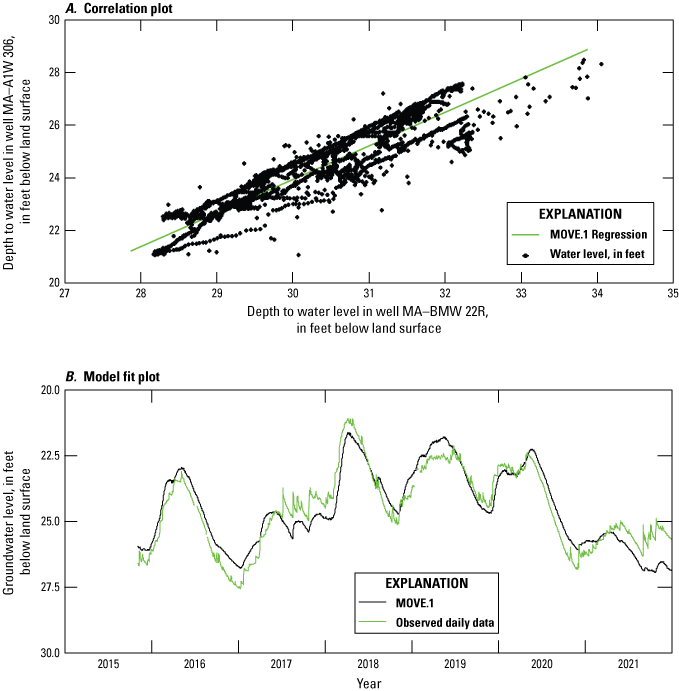
Graphs showing A, correlation and B, model fit of the concurrent continuous data from the Maintenance of Variance Extension type 1 (MOVE.1) method of the study well at site 413930070190901 (MA–A1W 306 Barnstable, Mass.) and the index well at site 414632070014901 (MA–BMW 22R Brewster, Mass.), as part of a study for monitoring groundwater levels in Massachusetts. The paired wells are 17 miles apart with 6.6 years of concurrent data.
Figure 5 shows the correlation, model fit of the concurrent continuous data, and distribution of the residuals from the MOVE.1 method of the study well at site 423810072435401 (MA–CSW 8R Colrain, Mass.) and the index well at site 431540071452801 (NH–WCW 1 Warner, N.H.). The paired wells are 66 mi apart with 4.1 years of concurrent data. Because the wells span more than 30 mi, the paired wells are considered nonideal for record extension. The model estimated daily groundwater levels from March 1999 to December 2017 (about 18 years of record). The degree of correlation between the paired wells is considered good at 0.866 (fig. 5A). Figure 5B shows the estimated water levels appear as a fair model fit to the observed water levels with 50 percent of the estimated data within 0.8 ft of the observed. However, the plot does show the estimated water levels typically 1 to 1.5 ft deeper than the observed water levels during dry periods. The residuals range from −2.51 to 2.24 ft with an interquartile range from −0.84 to 0.80 ft. The magnitude of the range of the groundwater data based on the record extension is 16.41 ft (a 6.53-ft change in range).
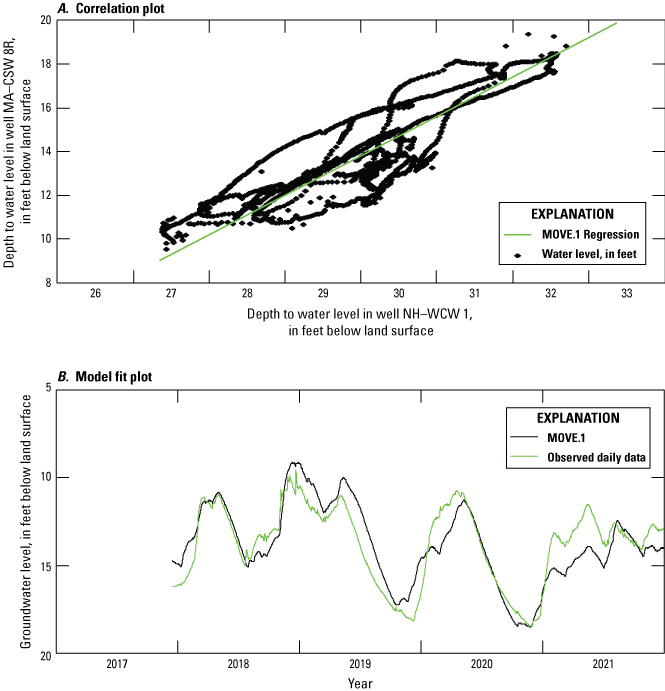
Graphs showing A, correlation and B, model fit of the concurrent continuous data from the Maintenance of Variance Extension type 1 (MOVE.1) method of the study well at site 423810072435401 (MA–CSW 8R Colrain, Mass.) and the index well at site 431540071452801 (NH–WCW 1 Warner, N.H.), as part of a study for monitoring groundwater levels in Massachusetts. The paired wells are 66 miles apart with 4.1 years of concurrent data.
Accuracy and Limitations of Groundwater Level Records From MOVE.1
The MOVE.1 models were developed from statistical variables (sample means and sample standard deviations of groundwater levels) that best explain the variability of groundwater levels and are subject to the limitations of the concurrent data used to develop the models. If the concurrent data used to calculate the sample mean and standard deviations are not representative of the population (true) mean and sample deviations of the two sites used in the record extension, the estimated values may not be very accurate. How well the estimated values represent the observed true values, or the accuracy of the MOVE.1 model, is an important consideration in the application of the model and the interpretation of the results.
The accuracy of the estimates of groundwater level records from the MOVE.1 model is indicated by two statistics: the root mean square error (RMSE) and the Nash-Sutcliffe efficiency coefficient (NSE). The RMSE represents the mean of the absolute distance between the observed and estimated values. A lower RMSE indicates a better fit between the observed and estimated data. The units of RMSE are the same units as the groundwater levels. NSE is a normalized statistic that provides a measure of how well model output matches measured data. NSE ranges from negative infinity to 1.0, with a value of 1.0 indicating a perfect match between model and observed data and a value of 0.0 or less indicating that the mean of the observed values is a better predictor than the model-estimated values. Both RMSE and NSE were reviewed collectively and used to determine whether the estimates of groundwater-level records are acceptable for the purpose of computing percentiles for drought determination. The Pearson correlation coefficient and the residual-regression statistics also provided a quantitative measure of the predictive value of data for each well. The Pearson correlation coefficient is a statistic that was used to determine how closely the concurrent data from index well and study well are related (table 4).
Overall, the performance metrics indicate the majority of MOVE.1 models estimated groundwater levels with reasonable accuracy (table 4). The interquartile range of the residuals shows that the groundwater level estimates are within 0.5 ft of the observed levels at about 20 wells. RMSE values ranged from 0.097 to 2.292 ft with a median of 0.536 ft. NSE values ranged from 0.623 to 0.996, with a median value of 0.759.
In general, performance of the MOVE.1 model improves the closer the index well and study well are and the more geomorphological characteristics the wells share. RMSE values were generally smaller for study wells located closer to their index wells and larger for study wells located further from their index wells. For example, four wells—sites 414205070334701 (MA–BHW 506–0206 [MW–21M3] Bourne, Mass.), 414455070325701 (MA–BHW 507–0253 [MW–67M1] Bourne, Mass.), 414405070312104 (MA–SDW 483–0170 [MW–17M3] Sandwich, Mass.), and 415808070024301 (MA–TSW 257–0034 Truro, Mass.)—have RMSE values less than 0.3 ft and are less than 6 mi from the index wells. Conversely, two wells—sites 423810072435401 (MA–CSW 8R Colrain, Mass.) and 415229070554301 (MA–LKW 14R Lakeville, Mass.)—have RMSE values greater than 1 ft and are 66 and 38 mi from the index wells, respectively. The RMSE and NSE values for site 421923072451001 (MA–WXW 20 Westhampton, Mass.) indicate low model accuracy. The poor performance of the model may be attributed to hydrologic differences and the distance from its index well (72 mi apart).
Because of the number of suitable index wells is limited, some index wells were used at more than one study well. Two index wells were used three or four times to extend the groundwater record at the study wells. One implication of using the same index well for multiple record extensions is the increase the intergroundwater level correlation in subsequent statistical analyses. When the estimates from the record extensions are compared to one another based on the same index well, the comparisons and inferences are unreliable. In any case, using the same index well for multiple record extensions will result in estimates that are all similar and introduce regional bias in the estimates.
Comparison of Groundwater Level Records From MOVE.1 and Observed Records
By using this method of record extension, the records for study wells—particularly those with very short records—were able to be substantially increased (table 3). Groundwater-level records averaged 4.0 years prior to the record extension and 18.1 years after the record extension. These longer records resulted in a wider range of groundwater levels for 23 of 27 wells (fig. 6; table 5). Higher (shallower) groundwater levels occurred at 18 wells and lower (deeper) groundwater levels occurred at 13 wells. Four wells—sites 421438071165601 (MA–DVW 10R Dover, Mass.), 422058072085101 (MA–HHW 1R Hardwick, Mass.), 415453070434901 (MA–PWW 22 Plymouth, Mass.), and 423715072042801 (MA–TMW 3R Templeton, Mass.)—showed no change in the range of groundwater levels after the record extensions. Although the records of these four wells are relatively short, the extreme highest and lowest groundwater levels were measured in the observed record. Even when the record extension results in no change in the range of groundwater levels, the extended records help minimize bias when certain data are overweighted, such as extremes in short-data records. With the additional data of an extended record, extremes are contextualized as outliers. The range of groundwater levels increased moderately in 16 wells, by between 0.1 and 3.0 ft, and increased substantially in 7 wells, by between 3.1 and 8.0 ft. Overall, the record extensions resulted in a much broader range of groundwater levels often associated with long-term conditions (fig. 6; table 5).
Table 5.
Range of highest and lowest groundwater levels from the estimated Maintenance of Variance Extension type 1 records and observed records for 27 study wells for monitoring groundwater levels in Massachusetts.[Data are from Crozier and Ahearn (2024). ID, identifier; ft, foot; MA, Massachusetts]
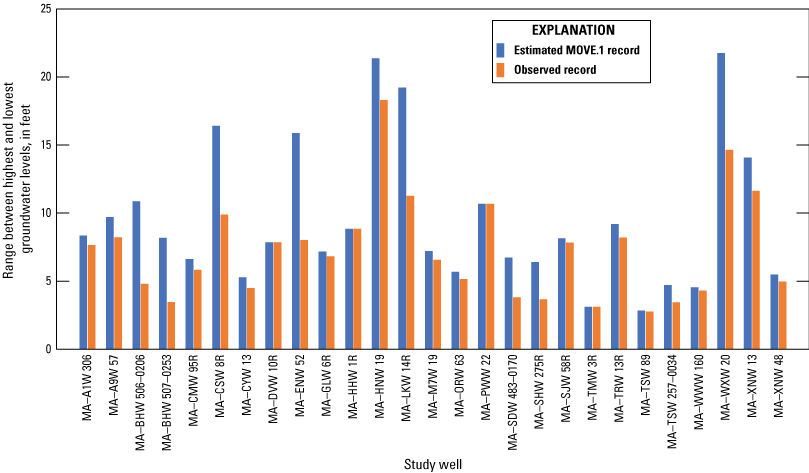
Graph of the magnitude of range of highest and lowest groundwater levels from the estimated Maintenance of Variance Extension type 1 (MOVE.1) and observed records for 27 study wells for monitoring groundwater levels in Massachusetts. Site names are in shortened forms; study well site names are listed in table 1.
Computation of Monthly Percentiles From Estimated Records
The composite record of observed and estimated values from the record extension was used to compute monthly percentiles, which can be used for the Groundwater Index in the Massachusetts drought management plan (Massachusetts Executive Office of Energy and Environmental Affairs and Emergency Management Agency, 2019). Monthly percentiles were computed as a value on a scale of 100 that indicates the percent of a distribution that is equal to or below it. For example, a monthly groundwater level at the 30th percentile is equal to or greater than 30 percent of the groundwater levels recorded in that month during all years with records. In addition, monthly percentiles were computed from available observed records for comparison purposes using records through December 31, 2021 (table 5). The R quantile function was used to compute the 2d, 10th, 20th, 30th, and 50th percentiles for each month of available data. This function allows the user to specify the type of interpolation (rounding) method to use to estimate percentiles. The type 6 interpolation method was used to perform the quantile function, and it is the commonly used interpolation method for hydrologic datasets (Helsel and others, 2020). The different interpolation methods to produce quantiles can be found in the R documentation on sample quantiles (R Core Team, 2023). With large sample sizes of greater than about 100 observations, the type of interpolation has very little effect on the results.
The 2d, 10th, 20th, and 30th monthly percentiles correspond with the index severity levels in the Massachusetts drought management plan (Massachusetts Executive Office of Energy and Environmental Affairs and Emergency Management Agency, 2019). Monthly percentiles were computed based on all continuous and discrete values parsed by month. Based on MOVE.1 record extensions, the average groundwater level is about 1.0 ft lower than the average groundwater level determined from observed data at index severity level 4, emergency drought, determined as the 2d percentile. Figure 7 shows the change in the groundwater level at 2d percentile for each well by month. For example, in January at the 2d percentile, study well 413930070190901 (MA–A1W 306 Barnstable, Mass.) has an estimated groundwater level of 28.7 ft and an observed groundwater level of 27.6 ft (a 1.1 ft decrease); study well 422248071362401 (MA–A9W 57, Berlin, Mass.) has an estimated level of 21.7 ft and an observed level of 19.4 ft (a 2.3 ft decrease); and study well 414205070334701 (MA–BHW 506–0206 [MW–21M3] Bourne, Mass.) has an estimated level of 175.8 ft and an observed level of 169.8 ft (a 6.0 ft decrease). The larger changes at 2d percentile tended to be in the winter months (January through March), as illustrated by the number of wells with points located outside the 1-ft change box (fig. 7). There is very little change at 30th percentile from the record extensions. The average extended-record groundwater level is about 0.1 ft lower than the average observed groundwater level at index severity level 0, mild drought, determined as the 30th percentile. Overall, the increase in the range of groundwater levels and the greater depths at many wells at the 2d percentile captures a broader range of groundwater conditions, typically observed with a longer climatic record.
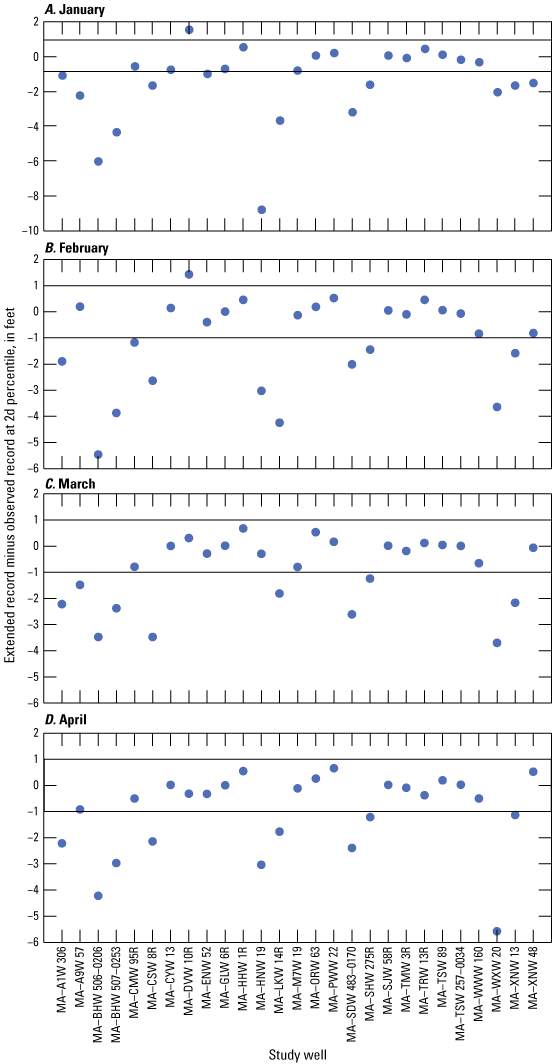
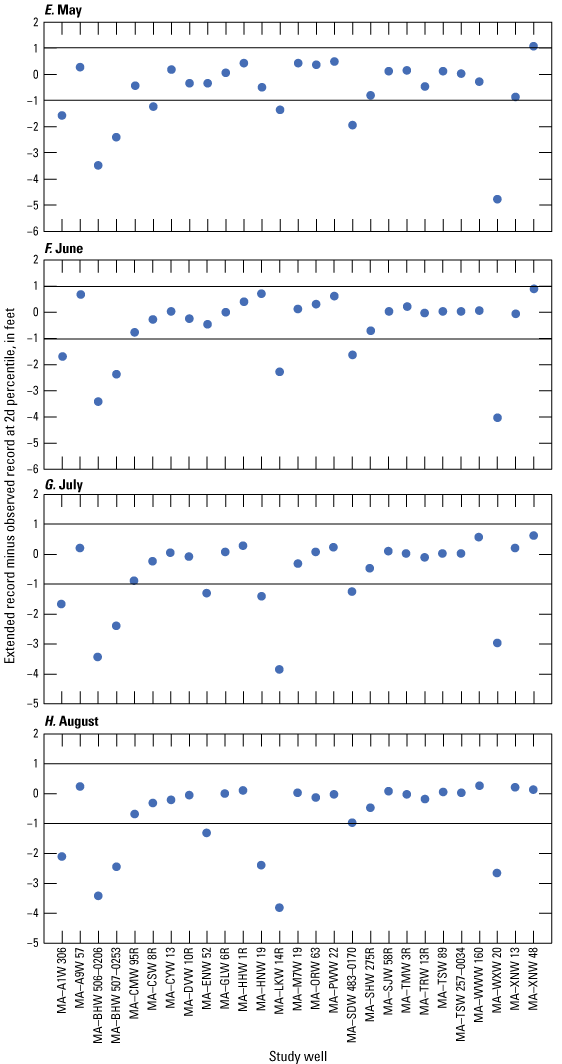
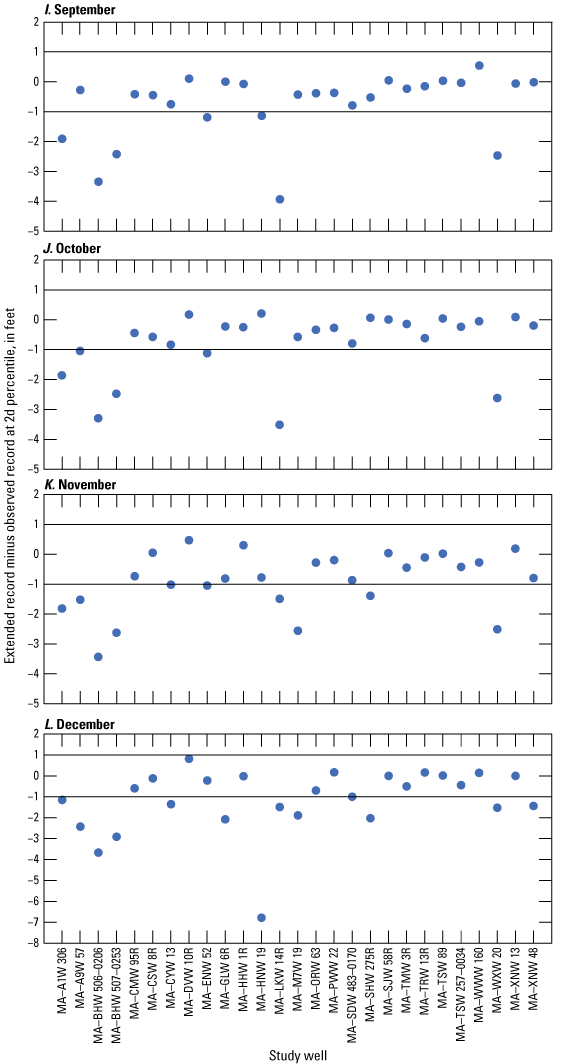
Graphs showing monthly depth changes for select wells for monitoring groundwater levels in Massachusetts at the 2d percentile attributed to the Maintenance of Variance Extension type 1 (MOVE.1) record extensions (parts A through L represent depth changes for months January through December). Site names are in shortened forms; study well site names are listed in table 1. The box represents a 1-foot depth change.
Future Studies for Estimating Monthly Percentiles
Estimated groundwater levels of several wells can be substantially overestimated or underestimated for some months, as shown by the monthly boxplots of MOVE.1 residuals (fig. 8). For example, monthly boxplots of the MOVE.1 residuals for study well at site 415453070434901 (MA–PWW 22 Plymouth, Mass.) and the paired index well at site 415228070554601 (MA–LKW 14 Lakeville, Mass.) show that 8 of 12 months contain a bias; months January to April and July to October show the interquartile range of the residuals had either overestimated or underestimated values (fig. 8). For this study, a single MOVE.1 model for each study well was developed to estimate the historical daily groundwater levels for the period of record. For future consideration, seasonal or month-specific MOVE.1 models could be developed to compute monthly percentiles more accurately. A recent study by Dudley and others (2018) estimating groundwater level records based on their relation to hydrologic and meteorological variables found including such variables in statistical models yielded successful models.
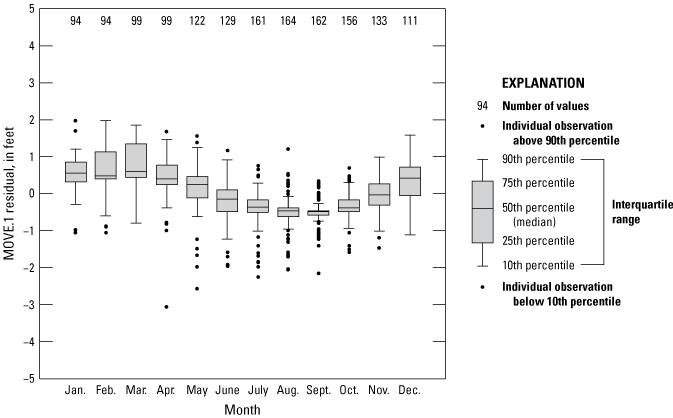
Boxplot graph showing monthly residuals for the Maintenance of Variance Extension type 1 (MOVE.1) model of the study well at site 415453070434901 (MA–PWW 22 Plymouth, Mass.) and the paired index well at site 415228070554601 (MA–LKW 14 Lakeville, Mass.).
Summary
In Massachusetts, the severity of a drought is based on several indices described in the drought management plan. One of the indices is the groundwater index. The groundwater index provides a general overview of the status of the water level in aquifers relative to long-term groundwater conditions. Although groundwater level records from wells in the U.S. Geological Survey Climate Response Network are used for determining the groundwater index, not all Climate Response Network wells have the long-term, continuous data necessary for computing reliable groundwater statistics. Groundwater wells with shorter records generally do not capture the broader range of groundwater conditions. This lack of range in groundwater conditions renders drought determinations based on short-record wells less accurate than those based on long-record wells. The U.S. Geological Survey, in cooperation with the Massachusetts Department of Environmental Protection, conducted this study to extend groundwater level records at select wells in Massachusetts and compute monthly percentiles for the wells with record extensions. The record extensions increase the number of Climate Response Network wells that can be used for determining the groundwater index severity level.
There are 29 study wells and 37 index wells included in this study. The criteria for record extension included that the study well and index well have one or more years of concurrent, overlapping data; a Pearson correlation coefficient that exceeded 0.8; and that they share similar aquifer type and hydrologic attributes. Paired wells that were more than 30 miles (mi) apart were considered suboptimal for record extensions because of the differences in climatic characteristics over that distance. About half of the study wells are within a 30-mi span of the index well used for the record extension. The Pearson correlation coefficients for 27 wells ranged from 0.812 to 0.998. Two study wells, sites 420610071421402 (MA–NXW 54 Northbridge, Mass.) and 421410072081101 (MA–WUW 2R West Brookfield, Mass.), had a correlation coefficient less than 0.8 and were dropped from further analysis. The Maintenance of Variance Extension type 1 (MOVE.1) method was used to perform the record extensions on the remaining 27 of 29 study wells that met the criteria for record extension.
Plots of correlation, model fit, and statistical distribution of the residuals for the MOVE.1 models indicated no clear bias in the estimated records. Performance metrics used to evaluate the MOVE.1 models include root mean square error (RMSE) and Nash-Sutcliffe efficiency coefficient (NSE). RMSE values ranged from 0.097 to 2.292 feet (ft), with a median of 0.536 ft. The median RMSE is about 50 percent smaller for paired wells less than 30 mi from one another than wells more than 30 mi apart. NSE values ranged from 0.623 to 0.996, with a median value of 0.759. Seven wells with NSE values less than 0.7 were considered to have moderate to poor predictor efficiency. Overall, smaller RMSE values and higher NSE values were found for study wells located nearer to their index well; model errors are less frequent when the paired wells are geographically close to one another, hydrologically similar, and share topographic characteristics.
Record extensions resulted in an increase in the groundwater level range at 23 of 27 wells. Higher (shallower) groundwater levels occurred at 18 wells and lower (deeper) groundwater levels occurred at 13 wells with records extensions. Four wells—sites 421438071165601 (MA–DVW 10R Dover, Mass.), 422058072085101 (MA–HHW 1R Hardwick, Mass.), 415453070434901 (MA–PWW 22 Plymouth, Mass.), and 423715072042801 (MA–TMW 3R Templeton, Mass.)—had no change in the range of highest and lowest groundwater levels. For the 27 study wells with record extensions, the average length of groundwater level records was extended by 14.1 years. Continuous-daily groundwater level records averaged 4.0 years prior to the record extension and 18.1 years after the record extension.
The 2d, 10th, 20th, and 30th monthly percentiles correspond with the index severity levels in the Massachusetts drought management plan. These monthly percentiles were computed from the extended records and observed records using data through December 31, 2022. At the 2d percentile (index severity level 4, emergency drought), the average groundwater level from the record extensions is about 1.0 ft lower than the average groundwater level determined from observed data. At the 30th percentile (index severity level 0, mild drought), the average groundwater level from the record extensions is about 0.1 ft lower than the average groundwater level determined from observed data.
Acknowledgments
The authors gratefully acknowledge Janet Barclay and John Mullaney of the U.S. Geological Survey for their assistance with the groundwater database and the R package smwrStats, which analyzes groundwater data. The authors deeply appreciate Janet Barclay and Robin Glas for their thorough peer reviews and thank U.S. Geological Survey personnel for their help collecting the groundwater data used in this report.
Selected References
Barclay, J.R., and Mullaney, J.R., 2020, Updating data inputs, assessing trends, and evaluating a method to estimate probable high groundwater levels in selected areas of Massachusetts: U.S. Geological Survey Scientific Investigations Report 2020–5036, 45 p., accessed September 2022 at https://doi.org/10.3133/sir20205036.
Colarullo, S.J., Sullivan, S.L., and McHugh, A.R., 2018, Implementation of MOVE.1, censored MOVE.1, and piecewise MOVE.1 low-flow regressions with applications at partial-record streamgaging stations in New Jersey: U.S. Geological Survey Open-File Report 2018–1089, 20 p., accessed June 5, 2022, at https://doi.org/10.3133/ofr20181089.
Crozier, D.E., and Ahearn, E.A., 2024, Data and R code to derive estimates of groundwater levels using MOVE.1 regression and compute monthly percentiles for select wells in Massachusetts: U.S. Geological Survey data release, https://doi.org/10.5066/P90PDI34.
Dudley, R.W., Hodgkins, G.A., Nielsen, M.G., and Qi, S.L., 2018, Estimating historical groundwater levels based on relations with hydrologic and meteorological variables in the U.S. glacial aquifer system: Journal of Hydrology, v. 562, p. 530–543, accessed November 2023 at https://doi.org/10.1016/j.jhydrol.2018.05.019.
Helsel, D.R., Hirsch, R.M., Ryberg, K.R., Archfield, S.A., and Gilroy, E.J., 2020, Statistical methods in water resources: U.S. Geological Survey Techniques and Methods, book 4, chap. A3, 458 p., accessed September 2022 at https://doi.org/10.3133/tm4A3. [Supersedes USGS Techniques of Water-Resources Investigations, book 4, chap. A3, version 1.1.]
Hirsch, R.M., 1979, An evaluation of some record reconstruction techniques: Water Resources Research, v. 15, no. 6, p. 1781–1790. [Also available at https://doi.org/10.1029/WR015i006p01781.]
Hirsch, R.M., 1982, A comparison of four streamflow record extension techniques: Water Resources Research, v. 18, no. 4, p. 1081–1088. [Also available at https://doi.org/10.1029/WR018i004p01081.]
Lombard, P.J., Barclay, J.R., and McCarthy, D.E., 2020, 2020 drought in New England (ver. 1.1, February 2021): U.S. Geological Survey Open-File Report 2020–1148, 12 p., accessed December 20, 2022, at https://doi.org/10.3133/ofr20201148.
Lorenz, D.L., 2015, smwrBase—An R package for managing hydrologic data, version 1.1.1: U.S. Geological Survey Open-File Report 2015–1202, 7 p., accessed September 13, 2022, at https://doi.org/10.3133/ofr20151202.
Lorenz, D.L., 2017a, Streamflow record extension example: U.S. Geological Survey software repository, 8 p., accessed September 13, 2022, at https://rdrr.io/github/USGS-R/smwrStats/f/inst/doc/RecordExtension.pdf.
Lorenz, D.L., 2017b, USGS-R/smwrStats—R functions to support statistical methods in water resources, version 0.7.6: U.S. Geological Survey software repository webpage, accessed September 13, 2022, at https://rdrr.io/github/USGS-R/smwrStats/.
Lorenz, D.L., 2022, R/smwrStats-package.R: U.S. Geological Survey software repository webpage, accessed May 23, 2024, at https://rdrr.io/github/USGS-R/smwrStats/src/R/smwrStats-package.R.
Matalas, N.C., and Jacobs, B., 1964, A correlation procedure for augmenting hydrologic data: U.S. Geological Survey Professional Paper 434–E, 7 p., accessed May 9, 2019, at https://doi.org/10.3133/pp434E.
McCarthy, D.E., LeNoir, J.M., and Lombard, P.J., 2023, 2022 drought in New England: U.S. Geological Survey Scientific Investigations Report 2023–5016, 34 p., accessed January 30, 2023, at https://doi.org/10.3133/sir20235016.
Massachusetts Executive Office of Energy and Environmental Affairs and Massachusetts Emergency Management Agency, 2019, Massachusetts drought management plan: Executive Office of Energy and Environmental Affairs, 115 p., accessed September 2022, at https://www.mass.gov/doc/massachusetts-drought-management-plan.
National Drought Mitigation Center, 2023, Drought classification: National Drought Mitigation Center U.S. Drought Monitor web page, accessed March 25, 2024, at https://droughtmonitor.unl.edu/About/AbouttheData/DroughtClassification.aspx.
Olson, S.A., and Meyerhofer, A.J., 2019, Development and evaluation of a record extension technique for estimating discharge at selected stream sites in New Hampshire: U.S. Geological Survey Scientific Investigations Report 2019–5066, 23 p., accessed September 12, 2022, at https://doi.org/10.3133/sir20195066.
R Core Team, 2020, R—A language and environment for statistical computing—Version 4.0.2.: R Foundation for Statistical Computing web page, accessed September 15, 2022, at http://www.r-project.org/index.html.
R Core Team, 2023, Sample quantiles: R Foundation for Statistical Computing web page, accessed May 23, 2024, at https://search.r-project.org/R/refmans/stats/html/quantile.html.
U.S. Geological Survey, 2018, USGS water data for the nation: U.S. Geological Survey National Water Information System database, accessed July 20, 2022, at https://doi.org/10.5066/F7P55KJN.
U.S. Geological Survey, 2023, Groundwater climate response network: U.S. Geological Survey website, accessed March 25, 2024, at https://rconnect.usgs.gov/crn-map/CRNmap.html.
U.S. Geological Survey, 2024, Groundwater climate response network: U.S. Geological Survey database map interface, accessed August 2, 2024, at https://rconnect.usgs.gov/crn-map/CRNmap.html.
U.S. Geological Survey, [undated], smwrStats: U.S. Geological Survey data repository, accessed July 15, 2022, at https://github.com/USGS-R/smwrStats.
Vogel, R.M., and Kroll, C.N., 1991, The value of streamflow record augmentation procedures in low-flow and flood-flow frequency analysis: Journal of Hydrology, v. 125, nos. 3–4, p. 259–276, accessed June 4, 2023, at https://doi.org/10.1016/0022-1694(91)90032-D.
Vogel, R.M., and Stedinger, J.R., 1985, Minimum variance streamflow record augmentation procedures: Water Resources Research, v. 21, no. 5, p. 715–723, accessed March 25, 2024, at https://doi.org/10.1029/WR021i005p00715.
Appendix 1. U.S. Geological Survey Climate Response Network of Groundwater Wells in Massachusetts, 2022
Table 1.1.
Groundwater wells of the U.S. Geological Survey Climate Response Network in Massachusetts in 2022.[Data are from Crozier and Ahearn (2024). Map label refers to the numbers of station labels on the map of figure 1. ID, identifier; MA, Massachusetts]
| Map label (fig. 1) | Site ID | Site name | Decimal latitude | Decimal longitude | County |
|---|---|---|---|---|---|
| 1 | 414154070165002 | MA–A1W 247R Barnstable, MA | 41.69833 | −70.28056 | Barnstable |
| 2 | 413525070291904 | MA–MIW 29 Mashpee, MA | 41.59039 | −70.48808 | Barnstable |
| 3 | 411555070021901 | MA–NBW 228 Nantucket, MA | 41.26540 | −70.03807 | Nantucket |
| 4 | 414400070242901 | MA–SDW 252R Sandwich, MA | 41.73333 | −70.40806 | Barnstable |
| 5 | 420056070575701 | MA–EBW 30 East Bridgewater, MA | 42.01566 | −70.96532 | Plymouth |
| 6 | 414518070435701 | MA–WFW 51 Wareham, MA | 41.75516 | −70.73202 | Plymouth |
| 7 | 414518070015801 | MA–BMW 21R Brewster, MA | 41.75500 | −70.03278 | Barnstable |
| 8 | 415449071155201 | MA–ATW 83R Attleboro, MA | 41.91361 | −71.26444 | Bristol |
| 9 | 415217070393102 | MA–PWW 494 Plymouth, MA | 41.87149 | −70.65809 | Plymouth |
| 10 | 420317070432901 | MA–D4W 80 Duxbury, MA | 42.05482 | −70.72421 | Plymouth |
| 11 | 415228070554601 | MA–LKW 14 Lakeville, MA | 41.87455 | −70.92893 | Plymouth |
| 12 | 414706071045001 | MA–F3W 23R Freetown, MA | 41.78500 | −71.08056 | Bristol |
| 13 | 420924072422602 | MA–WVW 152 Westfield, MA | 42.15676 | −72.70676 | Hampden |
| 14 | 422103072241102 | MA–PDW 23 Pelham, MA | 42.35092 | −72.40258 | Hampshire |
| 15 | 423845070542501 | MA–TQW 1 Topsfield, MA | 42.64629 | −70.90674 | Essex |
| 16 | 422650071213801 | MA–CTW 167R Concord, MA | 42.44722 | −71.36056 | Middlesex |
| 17 | 423503073075401 | MA–CJW 2 Cheshire, MA | 42.58438 | −73.13133 | Berkshire |
| 18 | 422559072332402 | MA–S6W 68 Sunderland, MA | 42.43314 | −72.55620 | Franklin |
| 19 | 420355070520201 | MA–HGW 76R Hanson, MA | 42.06528 | −70.86722 | Plymouth |
| 20 | 422819071065701 | MA–XOW 14 Winchester, MA | 42.47204 | −71.11533 | Middlesex |
| 21 | 422627071154002 | MA–LTW 104 Lexington, MA | 42.44093 | −71.26061 | Middlesex |
| 22 | 422520071483001 | MA–SYW 177 Sterling, MA | 42.42231 | −71.80785 | Worcester |
| 23 | 423641071102501 | MA–AJW 462 Andover, MA | 42.61148 | −71.17311 | Essex |
| 24 | 423311072355801 | MA–DFW 44R Deerfield, MA | 42.55314 | −72.59898 | Franklin |
| 25 | 421851071312601 | MA–SSW 12 Southborough, MA | 42.31426 | −71.52340 | Worcester |
| 26 | 424322070592201 | MA–GCW 168R Georgetown, MA | 42.72278 | −70.98944 | Essex |
| 27 | 421550073025101 | MA–A3W 12 Becket, MA | 42.26411 | −73.04685 | Berkshire |
| 28 | 421228072585301 | MA–BEW 9 Blandford, MA | 42.20787 | −72.98094 | Hampden |
| 29 | 423339072524101 | MA–HMW 8 Hawley, MA | 42.56092 | −72.87760 | Franklin |
| 30 | 420912072042801 | MA–OTW 7R Otis, MA | 42.15333 | −73.07444 | Berkshire |
| 31 | 414139070311501 | MA–SDW 526–0040 (MW–145S) | 41.69437 | −70.52044 | Barnstable |
| 32 | 414159070310501 | MA–SDW 537–0107 Sandwich, MA | 41.69998 | −70.51775 | Barnstable |
| 33 | 414129070361401 | MA–BHW 198 Bourne, MA | 41.69150 | −70.60336 | Barnstable |
| 34 | 414125070265901 | MA–SDW 253R Sandwich, MA | 41.69028 | −70.44972 | Barnstable |
| 35 | 414219070313601 | MA–SDW 525–0109 (MW–126S) | 41.70542 | −70.52600 | Barnstable |
| 36 | 414101070011001 | MA–CGW 138R Chatham, MA | 41.68361 | −70.01944 | Barnstable |
| 37 | 414124070311401 | MA–SDW 527–0055 (90MW0063) | 41.69013 | −70.52013 | Barnstable |
| 38 | 413930070190901 | MA–A1W 306 Barnstable, MA | 41.65844 | −70.31863 | Barnstable |
| 39 | 415453070434901 | MA–PWW 22 Plymouth, MA | 41.91493 | −70.72977 | Plymouth |
| 40 | 415354069585201 | MA–WNW 17R Wellfleet, MA | 41.89833 | −69.98111 | Barnstable |
| 41 | 420305072581401 | MA–GLW 6R Granville, MA | 42.05140 | −72.97068 | Hampden |
| 42 | 420316070433501 | MA–D4W 79R Duxbury, MA | 42.05444 | −70.72639 | Plymouth |
| 43 | 420206070045901 | MA–TSW 89 Truro, MA | 42.03523 | −70.08257 | Barnstable |
| 44 | 414714071175901 | MA–SHW 275 Seekonk, MA | 41.78732 | −71.29922 | Bristol |
| 45 | 414632070014901 | MA–BMW 22R Brewster, MA | 41.77556 | −70.03028 | Barnstable |
| 46 | 412346070353403 | MA–ENW 52 Edgartown, MA | 41.39623 | −70.59225 | Dukes |
| 47 | 423506070491401 | MA–WPW 76R Wenham, MA | 42.58500 | −70.82056 | Essex |
| 48 | 423257071243702 | MA–WWW 160 Westford, MA | 42.54915 | −71.41039 | Middlesex |
| 49 | 423058071025401 | MA–WAW 38R Wakefield, MA | 42.51611 | −71.04833 | Middlesex |
| 50 | 423715072042801 | MA–TMW 3R Templeton, MA | 42.62083 | −72.07444 | Worcester |
| 51 | 424055071435302 | MA–TRW 13R Townsend, MA | 42.68194 | −71.73139 | Middlesex |
| 52 | 422103072241103 | MA–PDW 24 Pelham, MA | 42.35092 | −72.40258 | Hampshire |
| 53 | 420544071173701 | MA–NNW 27R Norfolk, MA | 42.09556 | −71.29361 | Norfolk |
| 54 | 424204072015201 | MA–XNW 13 Winchendon, MA | 42.70102 | −72.03084 | Worcester |
| 55 | 421923072451001 | MA–WXW 20 Westhampton, MA | 42.34120 | −72.80621 | Hampshire |
| 56 | 421012072324301 | MA–CMW 95R Chicopee, MA | 42.17000 | −72.54528 | Hampden |
| 57 | 421240072490201 | MA–M7W 19 Montgomery, MA | 42.21127 | −72.81700 | Hampden |
| 58 | 423401071093801 | MA–XMW 78 Wilmington, MA | 42.56690 | −71.15997 | Middlesex |
| 59 | 422341071464901 | MA–WSW 26 West Boylston, MA | 42.39478 | −71.77985 | Worcester |
| 60 | 420610071421402 | MA–NXW 54 Northbridge, MA | 42.10287 | −71.70340 | Worcester |
| 61 | 421438071165601 | MA–DVW 10R Dover, MA | 42.24389 | −71.28222 | Norfolk |
| 62 | 422906072124301 | MA–PHW 16 Petersham, MA | 42.48508 | −72.21144 | Worcester |
| 63 | 424520070562401 | MA–NIW 27 Newbury, MA | 42.75537 | −70.93949 | Essex |
| 64 | 422058072085101 | MA–HHW 1R Hardwick, MA | 42.34944 | −72.14750 | Worcester |
| 65 | 421853071220501 | MA–WKW 2R Wayland, MA | 42.31472 | −71.36806 | Middlesex |
| 66 | 423441072170701 | MA–ORW 63 Orange, MA | 42.57814 | −72.28481 | Franklin |
| 67 | 421410072081101 | MA–WUW 2R West Brookfield, MA | 42.23611 | −72.13639 | Worcester |
| 68 | 422733072532601 | MA–CYW 13 Cummington, MA | 42.45946 | −72.89028 | Hampshire |
| 69 | 424841071004101 | MA–HLW 23 Haverhill, MA | 42.81161 | −71.01162 | Essex |
| 70 | 420350073193601 | MA–SJW 58R Sheffield, MA | 42.06389 | −73.32667 | Berkshire |
| 71 | 422745073112001 | MA–PTW 51 Pittsfield, MA | 42.46258 | −73.18844 | Berkshire |
| 72 | 422812071244401 | MA–ACW 158 Acton, MA | 42.47011 | −71.41188 | Middlesex |
Appendix 2. Monthly Percentiles at Study Wells With Record Extensions
Table 2.1.
Monthly percentiles for 27 groundwater wells with record extensions used in a study monitoring groundwater levels in Massachusetts.[Data are from Crozier and Ahearn (2024). P2, 2d percentile; P10, 10th percentile; P20, 20th percentile; P30, 30th percentile; P50, 50th percentile]
Datums
Vertical coordinate information is referenced to the North American Vertical Datum of 1988 (NAVD 88).
Horizontal coordinate information is referenced to the North American Datum of 1983 (NAD 83).
For more information, contact
Director, New England Water Science Center
U.S. Geological Survey
10 Bearfoot Road
Northborough, MA 01532
dc_nweng@usgs.gov
or visit our website at
https://www.usgs.gov/centers/new-england-water-science-center
Publishing support provided by the Pembroke Publishing Service Center
Disclaimers
Any use of trade, firm, or product names is for descriptive purposes only and does not imply endorsement by the U.S. Government.
Although this information product, for the most part, is in the public domain, it also may contain copyrighted materials as noted in the text. Permission to reproduce copyrighted items must be secured from the copyright owner.
Suggested Citation
Ahearn, E.A., and Crozier, D.E., 2024, Estimating groundwater level records using MOVE.1 and computing monthly percentiles from estimated groundwater records in Massachusetts: U.S. Geological Survey Scientific Investigations Report 2024–5080, 38 p., https://doi.org/10.3133/sir20245080.
ISSN: 2328-0328 (online)
Study Area
| Publication type | Report |
|---|---|
| Publication Subtype | USGS Numbered Series |
| Title | Estimating groundwater level records using MOVE.1 and computing monthly percentiles from estimated groundwater records in Massachusetts |
| Series title | Scientific Investigations Report |
| Series number | 2024-5080 |
| DOI | 10.3133/sir20245080 |
| Publication Date | September 27, 2024 |
| Year Published | 2024 |
| Language | English |
| Publisher | U.S. Geological Survey |
| Publisher location | Reston, VA |
| Contributing office(s) | New England Water Science Center |
| Description | Report: iv, 38 p.; Data Release |
| Country | United States |
| State | Massachusetts |
| Online Only (Y/N) | Y |
| Additional Online Files (Y/N) | N |


