

Correlation Analysis of Groundwater and Hydrologic Data, Kaloko-Honokōhau National Historical Park, Hawai‘i
Links
- Document: Report (10 MB pdf) , HTML , XML
- Download citation as: RIS | Dublin Core
Acknowledgments
Funding for this study was provided by the National Park Service (NPS), Water Rights Branch and Kaloko-Honokōhau National Historical Park. Patrick Casey and Robert Chenet from the Hawaiʻi Commission on Water Resource Management (CWRM) provided groundwater-level measurements for CWRM monitoring wells and reported pumpage data for production wells in the study area. The County of Hawaiʻi, Department of Environmental Management, Wastewater Division provided discharge data for the Kealakehe Wastewater Treatment Plant. Amanda McCutcheon, Anne Farahi, and David Raikow of NPS, and Adam Johnson, Jackson Mitchell, Sarah Rosa, and Jeff Perreault from the U.S. Geological Survey helped in collection of Kaloko-Honokōhau National Historical Park monitoring data.
Abstract
Designated in 1978, Kaloko-Honokōhau National Historical Park is located on the west coast of the Island of Hawaiʻi. The Kaloko-Honokōhau National Historical Park encompasses about 1,200 acres of coastal land and nearshore ecosystems, which include wetlands, anchialine pools (landlocked bodies of brackish water with hydrologic connections to the ocean), fishponds, a fishtrap, and coral reefs. These nearshore ecosystems are dependent on groundwater discharge with a freshwater component and provide habitat for threatened and endangered, endemic species, such as the orangeblack Hawaiian damselfly (Megalagrion xanthomelas) and the Hawaiian coot (ʻAlae keʻokeʻo, Fulica alai). The populations of these native species, however, are threatened because of habitat loss related to urban development and environmental changes. Kaloko-Honokōhau National Historical Park is within the Keauhou aquifer system and the North Kona District, which experienced a 52 percent resident-population increase between 2000 and 2020 and a 41 percent visitor increase between 2008 and 2019. To support the current water demand associated with this growing population, groundwater is the primary source of freshwater used in the North Kona District, with about 15 million gallons of groundwater withdrawn from the Keauhou aquifer system per day since 2009. With anticipated development, future (2015–35) groundwater withdrawal from the Keauhou aquifer system is projected to be about 55 percent greater than recent (2012–14) withdrawal. Because Kaloko-Honokōhau National Historical Park is located within a coastal aquifer, natural and human-induced changes can affect the quality and quantity of groundwater, which can threaten groundwater-dependent ecosystems.
To improve understanding of recent groundwater conditions, the U.S. Geological Survey, in cooperation with the National Park Service, undertook this study to document correlations between hydrologic time-series datasets from sites in and near Kaloko-Honokōhau National Historical Park using the nonparametric (distribution-free) Kendall’s tau statistical test.
For the statistical analyses, dependent variables representing the groundwater system include groundwater level, the groundwater-level difference between pairs of sites, and specific conductance, and independent variables include datasets of sea level, rainfall, and groundwater withdrawal. About 34 percent of the 140 non-time-lagged Kendall’s tau statistical tests evaluated in this report are statistically significant (p-value ≤ 0.050) with generally weak (0.1 ≤ tau ≤ 0.2) to moderate (0.2 ≤ tau ≤ 0.3) correlations. Groundwater levels measured at monitoring sites have the strongest correlation with the multivariate El Niño–Southern Oscillation index and withdrawal from production wells at the nearby Kohanaiki Private Club Community. Specific conductance is not consistently and significantly correlated with the independent hydrologic variables investigated in this report.
Because the relations between hydrologic variables are commonly not instantaneous, a second set of correlations was evaluated after applying a range of time lags to the independent variable datasets. Relative to the non-time-lagged case (the set of correlations that did not use time-lagged independent variables), some of the time-lagged independent variables improved correlations with some of the dependent variables. For a particular independent variable, similar time lags were expected between the independent variable and dependent variable at all four monitoring sites. However, different time lags among the four sites sometimes produced the strongest correlations.
This study identified several correlations that are statistically significant and hydrologically plausible, but the correlations could indicate that multiple concurrent factors are controlling the observed groundwater-system response, which might be better addressed using multivariate analyses. This study only investigates bivariate correlations, which may not explain all the variance in the data. The correlations analyzed in this report are limited by the quantity of available hydrologic data in the area near Kaloko-Honokōhau National Historical Park and are based on 14 years of time-series data, which were aggregated to a relatively coarse monthly temporal resolution that represents the minimum resolution common to all datasets.
Introduction
As one of five national park units in the State of Hawaiʻi, Kaloko-Honokōhau National Historical Park (KAHO) is located within the North Kona District, on the west coast of the Island of Hawaiʻi (fig. 1). The National Park Service (NPS) has assigned the 4-letter character code KAHO to identify Kaloko-Honokōhau National Historical Park (https://www.nps.gov/kaho/index.htm), and the KAHO code will be used herein in reference to the park. Following the submission of a study entitled, “The Spirit of Kaloko-Honokōhau” (Honokōhau Study Advisory Commission, 1974), KAHO was designated a park in 1978 “to provide a center for the preservation, interpretation, and perpetuation of traditional native Hawaiian activities and culture, and to demonstrate historic land use patterns as well as to provide a needed resource for the education, enjoyment, and appreciation of such traditional native Hawaiian activities and culture by local residents and visitors” (Public Law 95-625, 92 Stat. 3499, Sec. 505).
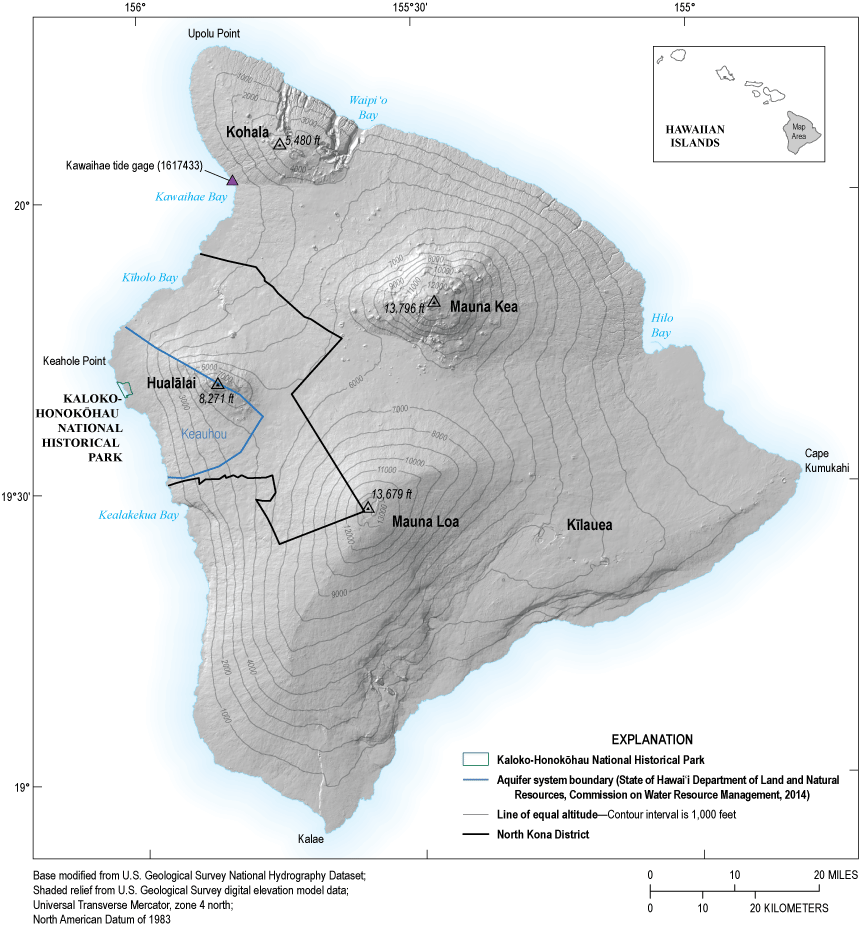
Map of the Island of Hawaiʻi, Hawaiʻi, showing Kaloko-Honokōhau National Historical Park within the Keauhou aquifer system and North Kona District.
KAHO encompasses about 1,200 acres of coastal land and nearshore ecosystems. Within the park boundaries, an ancient Hawaiian settlement area is protected, which includes historic trail networks, house platforms, heiau (religious temples), and kiʻi pōhaku (petroglyphs) (Honokōhau Study Advisory Commission, 1974; Kaloko-Honokōhau National Historical Park, 2021). KAHO also encompasses wetlands, over 180 anchialine pools, two large fishponds (Kaloko and ʻAimakapā), and over 590 acres of coral reefs (Knee and others, 2008; Oki, 2021). These various water bodies are dependent on groundwater discharge with a freshwater component and provide habitat for threatened and endangered, endemic species. The anchialine pools are landlocked brackish-water bodies that are hydrologically connected to the ocean and groundwater through a highly permeable volcanic aquifer (Brock and Kam, 1997; Holthuis, 1973). They vary in size, with surface areas that range from small (less than 107 square feet [ft2]) to large (greater than 1,076 ft2), and depths that range from shallow (less than 1.5-ft depth) to deep (greater than 5-ft depth) (Brock and Kam, 1997). The majority of the anchialine pools in KAHO are considered small and shallow (Brock and Kam, 1997; Oki, 2021). The anchialine pools support numeruous shrimp species, including the endemic Procaris hawaiana and the Hawaiian red shrimp Halocaridina rubra (ʻōpaeʻula), and provide habitat for the endangered orangeblack Hawaiian damselfly (Megalagrion xanthomelas). Although ʻōpaeʻula is one of the most abundant anchialine pool shrimp in Hawaiʻi, their population is threatened by habitat loss as anchialine pools are either filled or dried in response to urban development (H. T. Harvey and Associates, 2015). Anchialine pool habitat is also threatened by the introduction of non-native fish species and water-quality changes related to human activities (Marrack and others, 2015). The Kaloko and ʻAimakapā fishponds have areas of about 11.5 and 12 acres, respectively, and were historically used by Native Hawaiians for edible fish cultivation. These fishponds, along with the wetlands, are habitat for endangered waterbirds, including the endemic Hawaiian coot (ʻAlae keʻokeʻo, Fulica alai) and indigenous Hawaiian stilt (Aeʻo, Himantopus mexicanus knudseni) (Brock and Kam, 1997; Morin, 1994). Similarly to the ʻōpaeʻula, these waterbirds are threatened by habitat loss. About 31 percent of coastal plain wetlands across the State of Hawaiʻi was lost during 1901–2015 as this area shifted to other agricultural crops or land uses (H. T. Harvey and Associates, 2015).
In the 1970s and 1980s, around the time of KAHO’s designation, the North Kona District experienced a large population increase (Fukunaga and Associates, Inc., 2017; Oki, 2021). The North Kona population increased 33 percent from 2000 to 2010, and increased 52 percent from 2000 to 2020, with a total 2020 resident population of 43,313 (State of Hawaiʻi, 2022). Specifically, KAHO is located within the Kealakehe census tract 215.04 (fig. 2), which had a 2020 resident-population of 6,013 (State of Hawaiʻi, 2022). Additionally, between 2008 and 2021, the west (North Kona) side of the Island of Hawaiʻi received, on average, about 1,183,000 visitors per year (State of Hawaiʻi, 2023). Visitors to the North Kona area increased 41 percent from 2008 to 2019, then declined in 2020 (State of Hawaiʻi, 2023) because of the Coronavirus (COVID-19) global pandemic. To accomodate residents and visitors, about 6.1 percent of the land within the Keauhou aquifer system (fig. 1) is classified as either residential, industrial, commercial, or roads, and about 62.1 percent is classified as agricultural land, with the remaining land classified as either forest reserve or open (Fukunaga and Associates, Inc., 2017). The majority of future development in North Kona is expected to occur in growth opportunity areas (fig. 2), specifically in urban areas and areas along transit routes or to infill areas around existing development (Wilson Okamoto Corporation, 2008a). Based on Hawaiʻi’s Commission on Water Resource Managment (CWRM) 2012–14 withdrawal data and Hawaiʻi Department of Water Supply (HDWS) 2013–14 flow-meter data, about 15.37 million gallons of water per day (Mgal/d) are required to meet recent water demands in the Keauhou aquifer system in 2012–14, of which 14.86 Mgal/d is from groundwater (Fukunaga and Associates, Inc., 2017). Based on documented water entitlements (that is, installed service laterals to vacant lots, developer agreements, water commitments, approved open building permits), total future water demands for the Keauhou aquifer system (including current water demands) when approved development build-out is complete are anticipated to increase to 28.07 Mgal/d, which is about 55 percent more than water used during a recent period (2012–14) (Fukunaga and Associates, Inc., 2017).
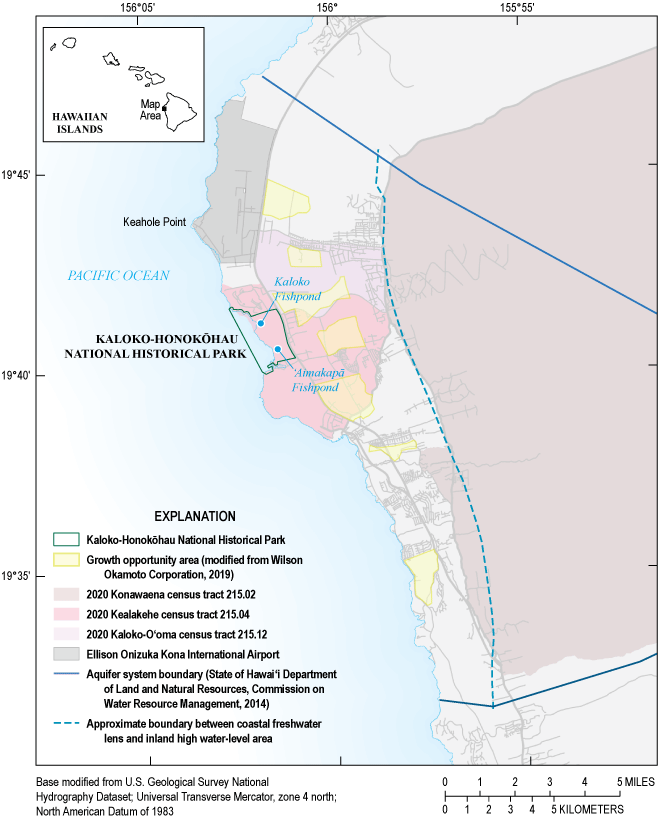
Map of Kaloko-Honokōhau National Historical Park within the context of urban development.
KAHO groundwater is located within a thin coastal freshwater-lens setting in which the important groundwater resources can be affected by various hydrologic processes. In a coastal aquifer, increased withdrawal or decreased rainfall can cause a decline in water levels and diminished groundwater discharge near the coast. Changes in groundwater quality and quantity can threaten critical groundwater resources that support the habitats of many indigenous and endemic species found in KAHO. The effects of various natural and human-related factors on groundwater quantity and quality in KAHO have not been fully quantified using existing data. Thus, a formal analysis of existing data is needed by water-, cultural-, and natural-resource managers to inform decisions that require an understanding of how natural and human-related factors affect groundwater conditions in and near KAHO.
Purpose and Scope
The purpose of this report is to document statistical trends of and correlations between hydrologic time-series datasets from sites in and near Kaloko-Honokōhau National Historical Park. To meet the objectives of this study, available hydrologic data were compiled, appropriately aggregated and combined to form additional time series, and statistically evaluated. The scope of this study is limited to analyses of publicly available data from 2008 to 2021 using the nonparametric Kendall’s tau statistical test (Kendall, 1938).
Setting
Located between latitude 18°54’–20°17’ N. and 156°04’–154°48’ W. (fig. 3), the Island of Hawaiʻi has the largest land area (4,028 square miles [mi2]) of the Hawaiian Islands (Juvik and Juvik, 1998). The island was primarily built by five shield volcanoes (Kohala, Mauna Kea, Hualālai, Mauna Loa, and Kīlauea), and the island’s surface has been radiometrically dated to be less than one million years old, thus making the Island of Hawaiʻi the youngest subaerial island in the Hawaiian Islands (Langenheim and Clague, 1987; Sherrod and others, 2021). Despite the distinct volcano boundaries indicated on surficial geology maps, some of the eruptions from each volcano occurred contemporaneously with those of a neighboring volcano, thus creating a complexly interbedded subsurface (Izuka and others, 2018). The North Kona District, located on the west side of the Island of Hawaiʻi, is formed by volcanics from the Hualālai and Mauna Loa volcanoes (fig. 3). KAHO is located within the Keauhou aquifer system, which is one of four aquifer systems (ʻAnaehoʻomalu, Kīholo, Keauhou, and Kealakekua, as defined by CWRM; fig. 3; State of Hawai‘i, 2019) that the North Kona District partly or fully covers.
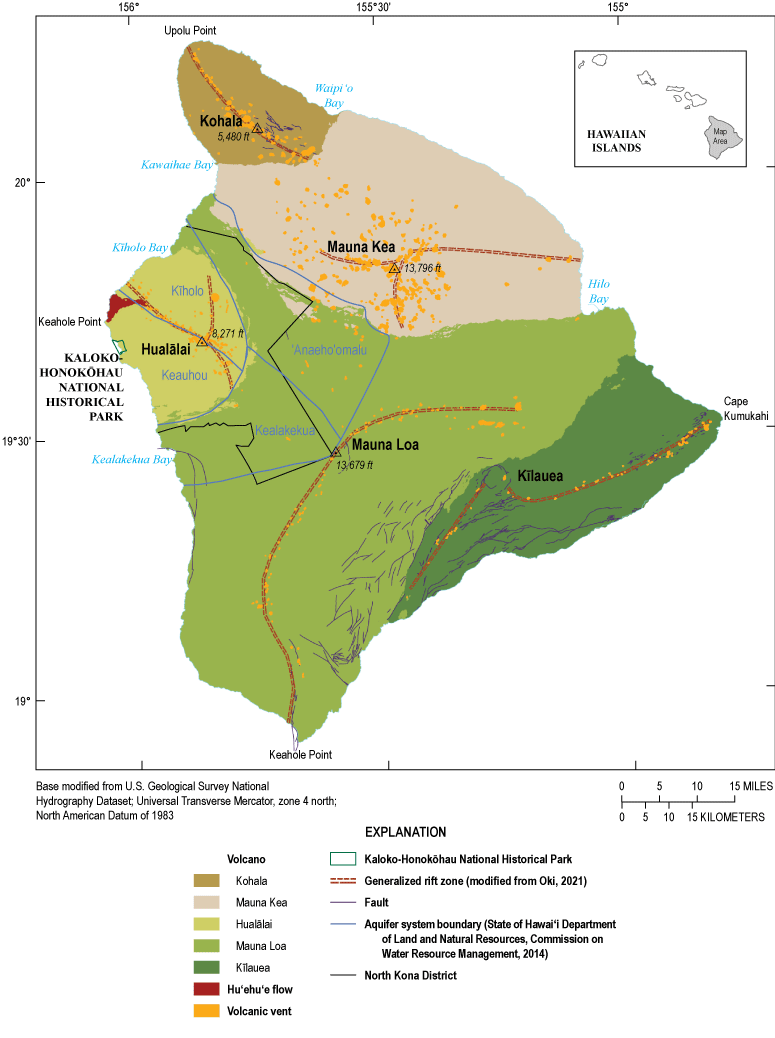
Map of the Island of Hawaiʻi, Hawaiʻi, showing generalized surficial volcano boundaries and hydrogeologic features (modified from Sherrod and others, 2021).
Geology
Hualālai is the third oldest volcano on the Island of Hawaiʻi and has a peak altitude of 8,271 ft. Hualālai underwent its shield-building stage 800,000 to 130,000 years ago (800 ka to 130 ka; Moore and Clague, 1992; Yamasaki and others, 2009), but about 25 percent of Hualālai’s surficial volcanic rocks are less than 1,000 years old (Moore and others, 1987). Hualālai is currently in its waning stage and is generally considered the least hazardous amongst the three active volcanoes (Hualālai, Mauna Loa, and Kīlauea) on the Island of Hawaiʻi (Moore and Clague, 1992; Kauahikaua and others, 2002). The last eruption from Hualālai occurred in 1801 (referred to as the “Huʻehuʻe flow” or the “1801 flow”), originating from a 0.4-mi long fissure system at an altitude of 1,500 ft (fig. 3; Clague and others, 1980; Kauahikaua and others, 2002). The Huʻehuʻe flow, which can typically be viewed while flying into the Ellison Onizuka Kona International Airport (fig. 2), proved to be destructive because it damaged local communities and buried culturally important Hawaiian fishponds (Kauahikaua and others, 2002).
Hualālai was built primarily from tholeiitic basalt during its shield stage and transitioned to alkali olivine basalt during its postshield stage (Moore and Clague, 1992). The volcanic rocks of Hualālai are grouped together as the Hualālai Volcanics. About 120 cinder cones delineate three rift zones on Hualālai, which trend in N. 60° W., N. 20° E., and S. 40° E. directions (fig. 3), and will be hereafter referred to as the northwest, north, and southeast rift zones, respectively (Stearns and Macdonald, 1946). The rift zones are also associated with dikes, which are dense, intrusive volcanic rocks that form near-vertical structures after the magma cools in the subsurface (Stearns and Macdonald, 1946; Izuka and others, 2018). Dikes typically have low permeability, which allows them to impound groundwater to higher levels that are atypical in dike-free aquifers. Models of gravity-survey data suggest the existence of a dense structure that trends northwest-southeast, parallel to the Kona coastline, about 2.5 mi south of the northwest rift zone (Kauahikaua and others, 2000; Flinders and others, 2013). Kauahikaua and others (1998) interpreted gravity data to be consistent with an asymmetrical structure that dips westward and might be a dense lava flow.
Climate
The North Kona District has a diverse climate. Because the area is located on the west side of the Island of Hawaiʻi, it is blocked from the prevailing northeasterly trade winds by Mauna Kea and Mauna Loa (Sanderson, 1993). Mean annual air temperature ranges from about 75.2 degrees Fahrenheit (°F; 24 degrees Celsius [°C]) at the coast to about 48.2 °F (9 °C) at the summit of Hualālai, and about 39.2 °F (4 °C) at the summit of Mauna Loa (Giambelluca and others, 2014). Air temperatures are typically highest during the month of August and lowest during the month of February (Giambelluca and others, 2014).
Rainfall over the western region of the Island of Hawaiʻi is affected by heating of the land surface, which produces sea breezes that transport moisture-laden air inland from the offshore area, resulting in afternoon precipitation (Blumenstock and Price, 1967; Sanderson, 1993). North Kona typically receives more rainfall during the summer months (May through October) compared to the winter months (November through April), because of intense heating and tradewinds that occur in the summer (Blumenstock and Price, 1967; Sanderson, 1993). The area in the Kīholo aquifer system, which is north of the Keauhou aquifer system (fig. 3), received an average of 0.55 to 2.45 inches of rainfall per month during 2008–19 (Longman and others, 2014, 202041; Lucas and others, 2022; fig. 4). Areas within the Keauhou and Kealakekua aquifer systems received an average 0.56 to 5.0 inches of rainfall per month for the period 2008–19 (Longman and others, 2014, 202041; Lucas and others, 2022).
The El Niño–Southern Oscillation (ENSO) phenomenon modulates rainfall in Hawaiʻi (Lu and others, 2020). ENSO is a climate pattern that causes fluctuations in tropical sea-level pressure every two to seven years, which affects rainfall and wind patterns across the tropics (Capotondi and others, 2015). The extremes are referred to as El Niño and La Niña. In Hawaiʻi, El Niño events are linked to drought conditions, specifically between October of the El Niño year to May of the following year (Chu, 1995). Comparatively, La Niña events are linked to above average rainfall (Lu and others, 2020).
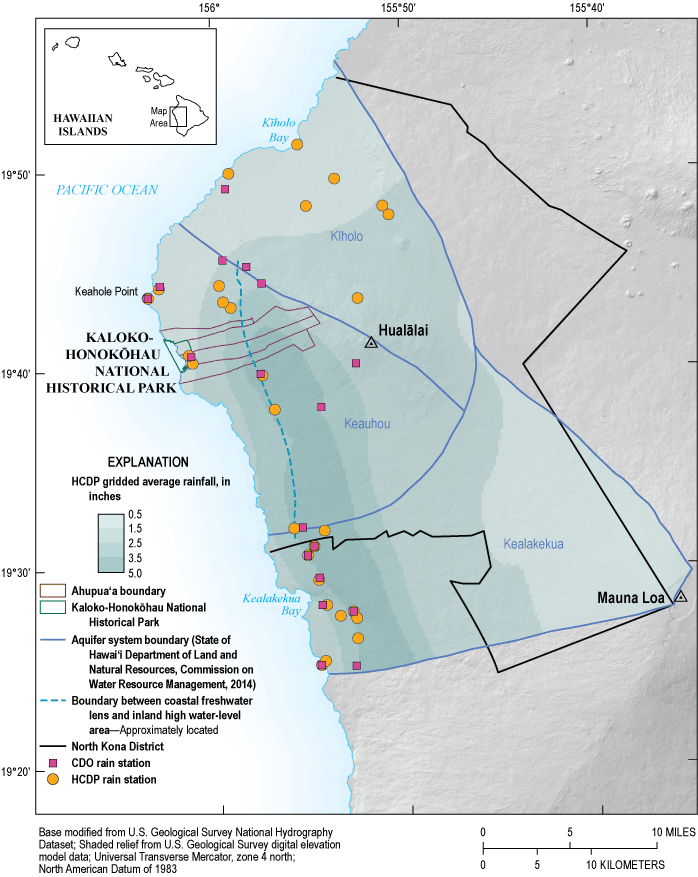
Map showing the locations of rainfall stations from Climate Data Online (CDO; National Oceanic and Atmospheric Administration, 2023a) and the Hawaiʻi Climate Data Portal (HCDP; https://www.hawaii.edu/climate-data-portal/data-portal/) with available data from 2008–21 and a gridded map of average monthly rainfall estimates (Longman and others, 2014, 202041; Lucas and others, 2022) within the Kīholo, Keauhou, and Kealakekua aquifer systems, Island of Hawai‘i.
Water Chemistry
Isotopic compositions of water (δ18O [“delta-O-18”] and δ2H [“delta-H-2”]) have been previously measured in monitoring and production wells across the North Kona District to determine approximate groundwater-recharge altitudes. Isotopes are distinct forms of the same element that have the same number of protons, but different number of neutrons, which changes the element mass. Oxygen has three stable isotopes (16O, 17O, 18O) and hydrogen has two stable isotopes (1H, 2H). A water sample’s isotopic composition indicates the ratio between a heavier isotope and lighter isotope, relative to a reference standard (Kendall and Caldwell, 1998).
Isotopic measurements suggest that groundwater withdrawn from the inland high water-level area of the Keauhou aquifer system might be recharged as high as the summit of Mauna Loa (fig. 3), whereas water measurements from the Kaloko-Honōkohau area suggest that groundwater is recharged near the summit of Hualālai (Fackrell and others, 2020). The stable isotope measurements also suggest that about three percent of the groundwater from the inland high water-level area indirectly recharges the Kaloko-Honokōhau area (Fackrell and others, 2020). Comparatively, on the basis of the stable isotope composition of the freshwater component of water samples from KAHO, Tillman and others (2014b) estimated about 25–70 percent of the freshwater is derived from the inland high water-level area (fig. 4).
Development
About 96.7 percent (14.86 Mgal/d) of total water use in the study area is withdrawn as groundwater (Fukunaga and Associates, Inc., 2017). Land use in the North Kona District can be categorized as urban development (high-density urban, medium-density urban, low-density urban, industrial, resort node, resort, and university development), urban expansion, rural, and open areas (important agricultural, extensive agricultural, orchard, conservation, and other open areas) (Wilson Okamoto Corporation, 2008a). Developed land area in the North Kona District increased nine percent annually on average from the mid-1990s to about 2008 (Wilson Okamoto Corporation, 2008a, b77). As of 2017, more than 95 percent of the North Kona District population resides within the Keauhou aquifer system (Fukunaga and Associates, Inc., 2017). About 15.37 Mgal/d of water is used across the Keauhou aquifer system—77.9 percent for municipal purposes, 18.3 percent for irrigation, 2.6 percent for agriculture, and 1.2 percent for domestic and industrial purposes (Fukunaga and Associates, Inc., 2017). The County of Hawai‘i Department of Water Supply (HDWS) manages 72.7 percent of the water categorized as municipal use, of which about 5.3 Mgal/d is further subcategorized as domestic use based on available meter data.
Varying intensities of development border KAHO—the Kohanaiki Private Club Community (hereafter referred to as Kohanaiki) to the north, the industrial and commercial area to the east, and the Honokōhau Small Boat Harbor and Kealakehe Wastewater Treatment Plant (WWTP) to the south. Kohanaiki is a private club community developed on 450 acres of coastal land that contains golf courses, clubhouses, and homes (Kohanaiki Realty LLC, 2023). Personnel at Kohanaiki also work to preserve cultural sites on the property, including ahu (shrines, altars), anchialine pools, and ancient trails (Kohanaiki Realty LLC, 2023). The Kealakehe WWTP is the primary municipal WWTP in the North Kona District. Using five aerated lagoons and chlorine disinfection, the Kealakehe WWTP is designed to treat about 5.3 Mgal/d of wastewater to secondary treatment standards, but as of 2018, only treats about 1.7 Mgal/d (Wilson Okamoto Corporation, 2008a). The wastewater effluent is disposed in a disposal pit near the WWTP (fig. 5) and percolates downward through the lava to the water table and then flows with the ambient groundwater toward the ocean. Additionally, about 9,400 on-site sewage disposal systems (OSDS) are located within the North Kona District, 9,000 of which are located specifically within the Keauhou aquifer system (Hawai‘i State Department of Health, 2017). The majority of the 9,400 OSDS are classified as Class I (soil treatment) and Class IV (cesspool) systems, which discharge nearly 6 Mgal/d of wastewater effluent into the land (Hawai‘i State Department of Health, 2017).
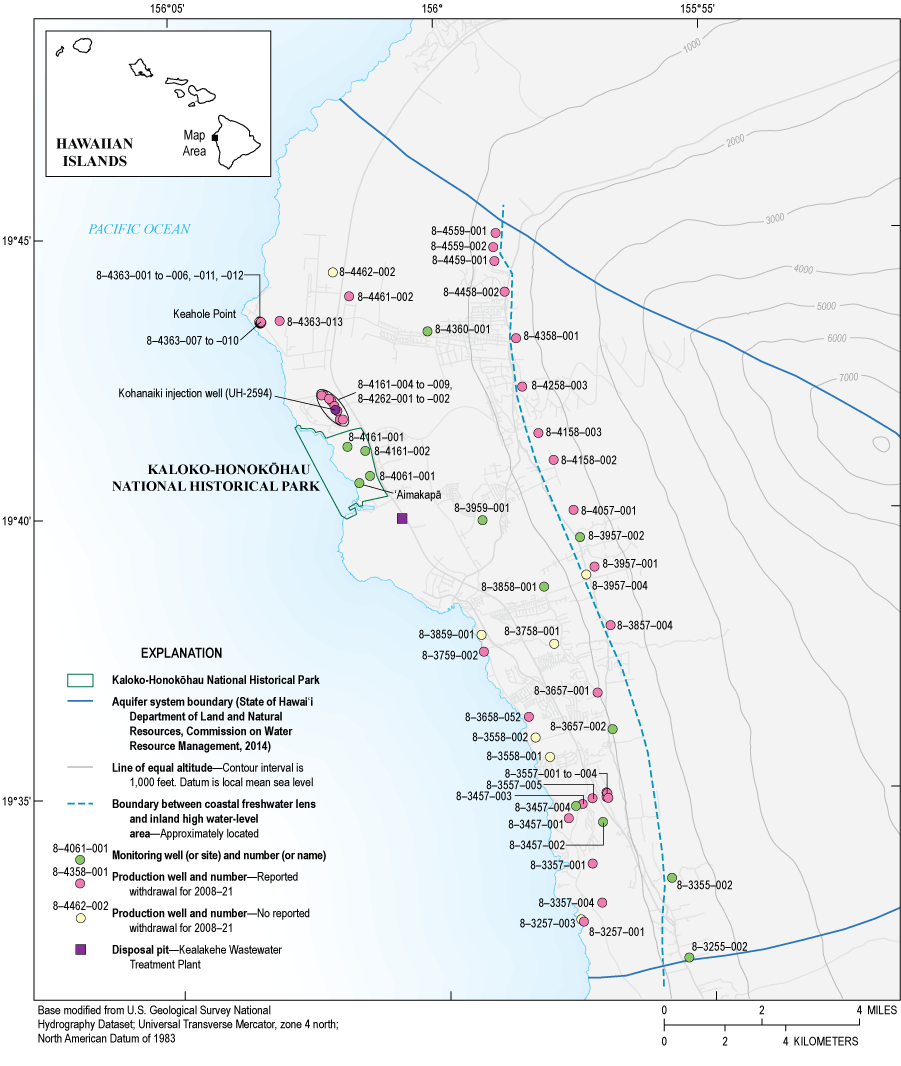
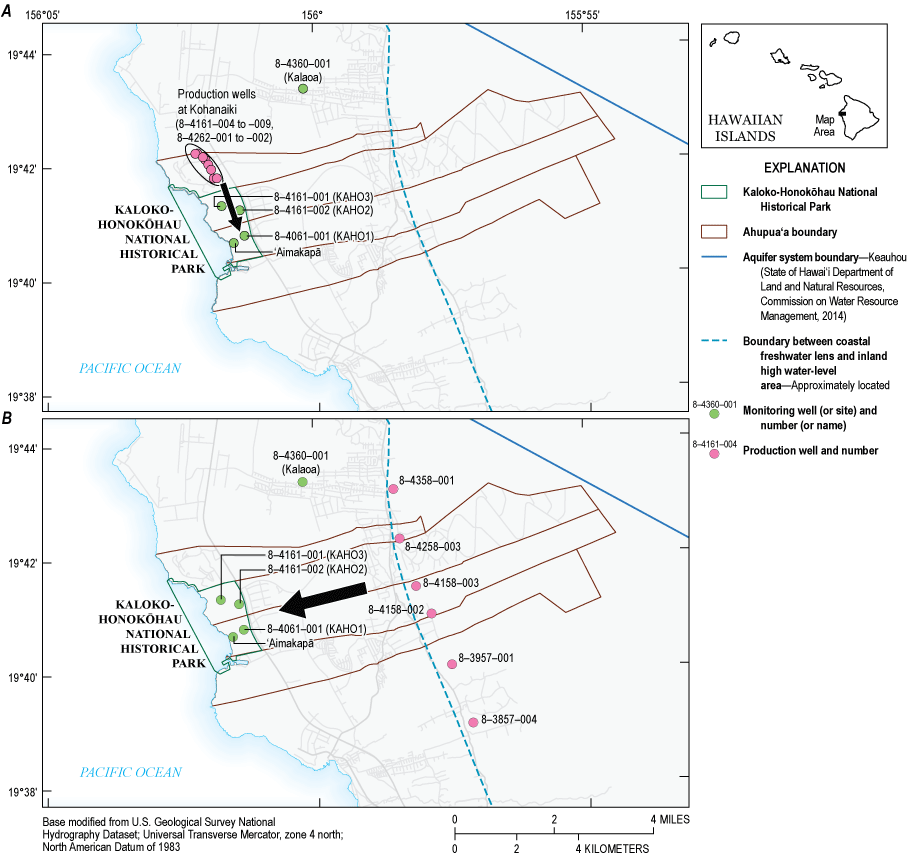
Map showing the approximate boundary between coastal freshwater-lens system and inland high water-level area in the Keauhou aquifer system, production wells, and selected monitoring wells on the Island of Hawai‘i.
Groundwater-Flow System
In the Kona area, fresh or brackish groundwater exists in three main forms: (1) a coastal freshwater-lens system, (2) a confined groundwater system beneath the coastal freshwater-lens system, and (3) water impounded inland to high levels (Oki, 2021). Most fresh groundwater resources developed across the State of Hawai‘i exist as a lens-shaped body that floats on top of the denser ocean-derived saltwater that intrudes into the dike-free lava flows of the shield volcanoes (Izuka and others, 2018). Freshwater and saltwater mix beneath the freshwater lens, creating a brackish mixing zone (commonly referred to as the transition zone) where salinity transitions from freshwater to saltwater (Izuka and others, 2018). The location and thickness of the transition zone is generally dependent on the aquifer’s hydraulic characteristics and groundwater-flow rate. The thickness of the transition zone in KAHO also could be affected by discharge or leakage from a deep confined freshwater body beneath the freshwater-lens system (Oki, 2021). Salinity profiles measured in a monitoring well (State well number 8–3959–001; fig. 5) provide evidence that a confined freshwater body exists beneath the freshwater-lens system. The salinity profile indicates brackish water at the water table, an increase in salinity with depth to near ocean-water salinity between altitudes of −500 to −950 ft, nearly freshwater between altitudes of −1,050 to −1,100 ft, and near ocean-water salinity below an altitude of −1,137 ft (Oki, 2021).
A productive high water-level area also exists inland of the coastal freshwater-lens system. The degree of hydrologic connectivity between these two groundwater bodies is not well understood. The boundary location, however, is generally near a land-surface altitude of about 1,500 ft based on water-level data (fig. 5). The hydrogeologic structure of this boundary (herein referred to as the approximate boundary between the coastal freshwater lens and inland high water-level area) is uncertain, but previous conceptual models suggest that the boundary might be formed by dikes, faults, or buried and dipping low-permeability lava flows or ash layers (Oki, 2021). Because very little information regarding the confined groundwater system is available, only the coastal freshwater-lens system and inland high water-level area will be discussed for the purpose of this study. Because groundwater levels are typically highest (greater than 40 ft above mean sea level [msl]) in the inland areas and lowest near the coast, the hydraulic gradient causes groundwater to flow from the inland area toward the coast, where it can discharge to production wells, or naturally from subaerial and submarine coastal springs and seeps, and wetlands (Izuka and others, 2018). Because the coastal freshwater-lens system in the Keauhou aquifer system is in highly permeable volcanic rocks, ocean tides have a profound effect on groundwater levels, which is readily observed in coastal wells, such as those at KAHO. The daily ocean tides recorded from tide gage 1617433 at Kawaihae (fig. 1) can vary by 3 ft (National Oceanic and Atmospheric Administration [NOAA], 2022b) and affect groundwater levels in wells more than 2 mi from the coast (Oki, 2021).
Study Area
The Keauhou aquifer system (164 mi2), as defined by CWRM (State of Hawai‘i, 2019; State of Hawaiʻi Department of Land and Natural Resources, 2014), is bounded to the north by the Kīholo aquifer system (147 mi2) and to the south by the Kealakekua aquifer system (231 mi2), all of which generally fall within the boundaries of the North Kona District (fig. 6). The study area mainly corresponds to the Keauhou aquifer system. Because groundwater can at least partially flow across aquifer boundaries (Fackrell and others, 2020), records and estimates of rainfall over the Kīholo, Keauhou, and Kealakekua aquifer systems are included in this study. In this report, the Keauhou aquifer system is divided into two groundwater areas, the coastal freshwater lens and the inland high water-level area (fig. 6), which are separated by the approximate boundary between the coastal freshwater lens and inland high water-level area. This boundary is uncertain but is generally constrained on the basis of the available water-level measurements from existing wells (Oki, 2021).
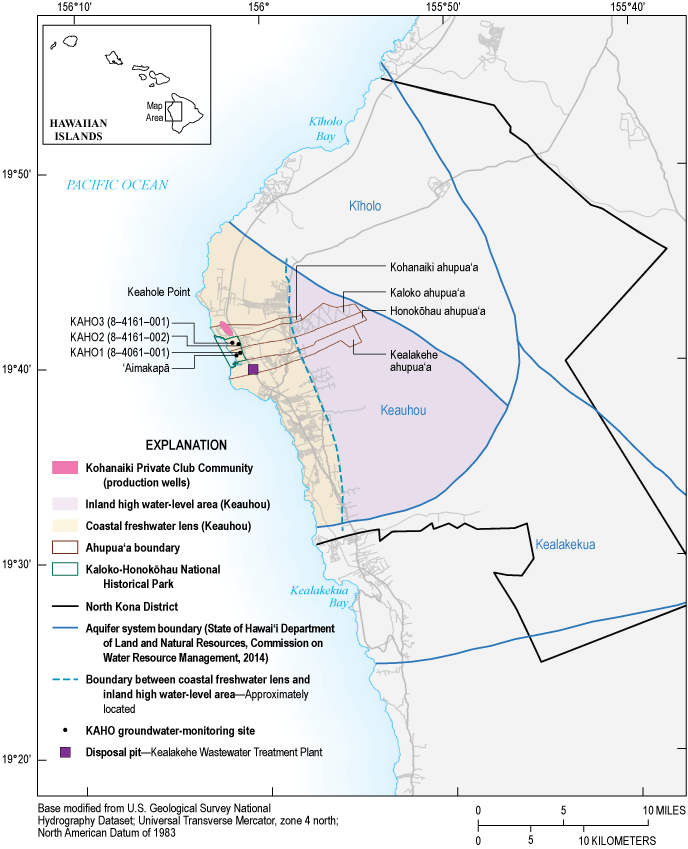
Map of the study area. The Kaloko-Honokōhau National Historical Park (KAHO) is located within the Kohanaiki, Kaloko, Honokōhau, and Kealakehe ahupuaʻa (traditional Hawaiian land subdivision), which are located within the State Keauhou aquifer system, which, along with the Kīholo and Kealakekua aquifer systems, is located within the North Kona District, on the west side of the Island of Hawaiʻi, Hawaiʻi. The Kohanaiki Private Club Community is located north of KAHO and the Kealakehe Wastewater Treatment Plant (WWTP) is located south of KAHO.
In addition to being divided by State aquifer-system boundaries, land in Hawaiʻi is also divided according to ahupuaʻa boundaries. An ahupuaʻa is a traditional Hawaiian land division that extends from the mountains to the near-coastal environment, and is considered a “culturally appropriate, ecologically aligned, and place specific unit with access to diverse resources,” thus partially influenced by watershed attributes (Mueller-Dombois, 2007; Gonschor and Beamer, 2014). KAHO is located within the Kohanaiki, Kaloko, Honokōhau, and Kealakehe ahupuaʻa, which have a combined area of 21 mi2 and extend across the coastal freshwater lens area and the inland high water-level area (fig. 6).
Available Data
The time-series data used in the analysis are categorized as dependent and independent variables. Because the available data for this study are monitored by different organizations and for different purposes (as will be later described), the data are measured at different time intervals. Therefore, datasets were aggregated to monthly intervals by averaging the data reported within the same month and year to a single monthly value. These methods will be further explained in the Data Processing section.
Dependent Variables
The dependent variables include groundwater level, groundwater-level difference, specific conductance, and temperature. Within KAHO, groundwater-level, specific-conductance, and water-temperature data from three monitoring wells (KAHO3 [State well number 8–4161–001], KAHO2 [State well number 8–4161–002], KAHO1 [State well number 8–4061–001]) and one fishpond site (ʻAimakapā) are used for this study (fig. 5). Because ʻAimakapā is a land-locked water body that is connected to groundwater, the measured water levels at that site are considered reflective of groundwater levels for this study. Groundwater level, specific conductance, and water temperature were measured at 10-minute intervals at KAHO3, KAHO2, KAHO1, and ʻAimakapā by the U.S. Geological Survey (USGS) beginning in 2008 following methods described in Wagner and others (2006) and Cunningham and Schalk (2011) (fig. 7). A gap in the data recorded by USGS exists from September 22, 2010, through December 3, 2014, for KAHO3, KAHO2, KAHO1, and ʻAimakapā because monitoring equipment was temporarily maintained and operated by the NPS (NPS, 2022) following protocol detailed in Izuka and others (2011). The Kalaoa N Kona monitoring well (State well number 8–4360–001), herein referred to as “Kalaoa” for brevity, is about 2.8 mi northeast of and uphill from the KAHO monitoring sites. Groundwater levels at the Kalaoa well were measured by the USGS during 2009–17 at 10- and 15-minute intervals (U.S. Geological Survey, 2023), and by CWRM during 2018–21 at a 1-hour interval. At the time of publication, groundwater levels measured by CWRM are not publicly available but can be requested from the agency.
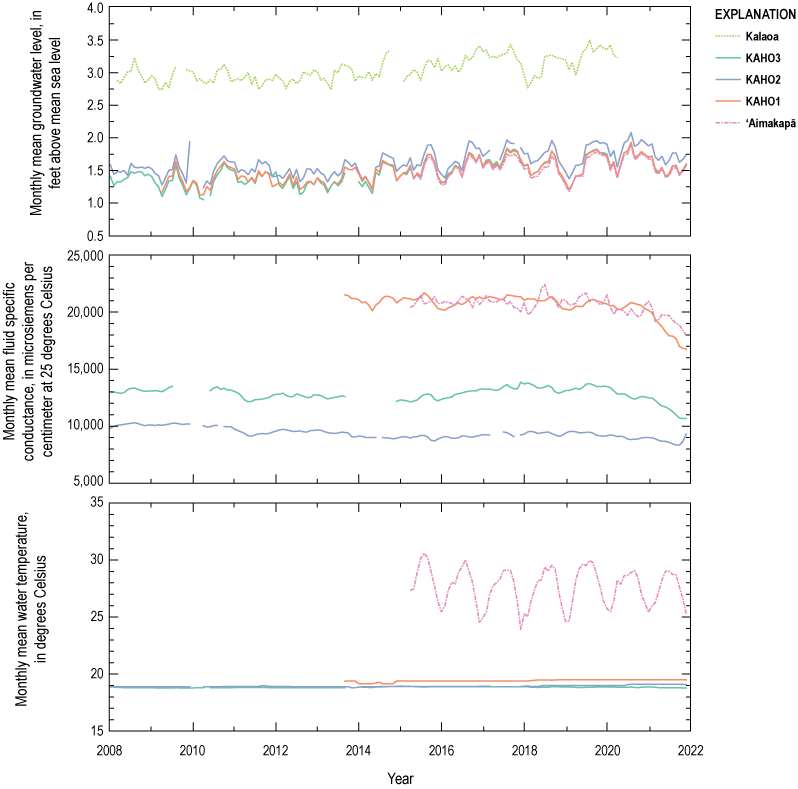
Graph of monthly mean groundwater levels (A), monthly mean fluid specific conductance (B), and monthly mean water temperature at selected monitoring wells in the Keauhou aquifer system (C), Island of Hawaiʻi, during 2008–21. Data from U.S. Geological Survey (2023), National Park Service (2022), and Hawai‘i Commission on Water Resource Management (CWRM). At the time of publication, groundwater levels measured by CWRM are not publicly available but can be requested from the agency.
Independent Variables
The independent variables include datasets of sea level, ENSO, rainfall, groundwater withdrawal, and wastewater discharge (table 1). The independent variables represent the explanatory variables that are potentially correlated with the dependent variables.
Table 1.
Descriptions of assessed independent variables.[Figure number refers to the figure that shows the corresponding time-series dataset; CDO, Climate Data Online; HCDP, Hawaiʻi Climate Data Portal; ahupua‘a area, combined area consisting of the Kohanaiki, Kaloko, Honokōhau, and Kealakehe land divisions; A, National Oceanic and Atmospheric Administration (2022b); B, National Oceanic and Atmospheric Administration (2022a); C, National Oceanic and Atmospheric Administration (2023a); D, Longman and others (2014, 2020)41, Lucas and others (2022); E, Hawaiʻi Commission on Water Resource Management; F, County of Hawaiʻi, Department of Environmental Management, Wastewater Division. At the time of publication, datasets from the Hawai‘i Commission on Water Resource Management and the County of Hawai‘i, Department of Environmental Management, Wastewater Division are not publicly available but can be requested from the agency.]
Sea Level
Sea level was measured at the Kawaihae tide gage (station 1617433; fig. 8) operated by the NOAA (NOAA, 2022b). At the Kawaihae tide gage, an audio signal travels down a sounding tube, and a recorder measures the time it takes for the signal to reflect off the water’s surface (NOAA, 2023b). The gage can measure acoustic water level, wind speed and direction, air temperature, water temperature, and barometric pressure, which are transmitted to NOAA headquarters (NOAA, 2023b). Sea level was measured at 1-minute intervals at the Kawaihae tide gage, but measurements were downloaded from the NOAA website as monthly averages.
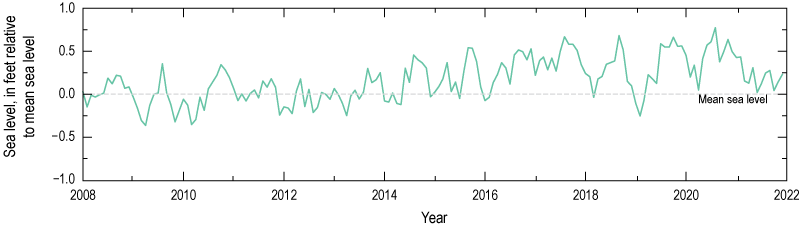
Graph of monthly sea level at the Kawaihae tide gage (station 1617433), Hawaiʻi, during 2008–21. Data from National Oceanic and Atmospheric Administration (2022b).
Multivariate El Niño–Southern Oscillation Index
The variability in ENSO is quantified by a multivariate ENSO index (MEI.v2, herein referred to as MEI for brevity), which is a bi-monthly time series of values that account for five variables (sea-level pressure, sea-surface temperature, zonal wind, meridional wind, and outgoing longwave radiation) measured over the tropical Pacific basin (30°S–30°N and 100°E–70°W), excluding the Atlantic Ocean and land regions (Zhang and others, 2019). The MEI values are determined using a combined principal-component analysis for 12 separate, partially overlapping 2-month “seasons” (for example, December-January, January-February, ... November-December; Zhang and others, 2019). Negative MEI values represent cold ENSO phases (that is, La Niña; fig. 9) whereas positive values represent warm ENSO phases (that is, El Niño; Wolter and Timlin, 2011). The ENSO MEI time-series data are managed by the NOAA Physical Sciences Laboratory (NOAA, 2022a).
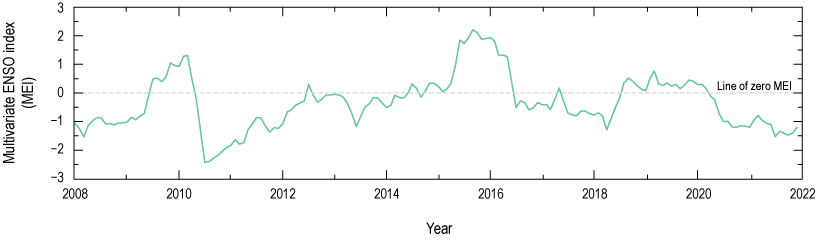
Graph of multivariate El Niño–Southern Oscillation (ENSO) index (MEI) during 2008–21. Data from National Oceanic and Atmospheric Administration (2022a).
Rainfall
Rainfall data in Hawaiʻi are available from numerous sources, including County, State, and Federal agencies and research institutions. Available rainfall station data have been used to create gridded rainfall maps (Hawai‘i Climate Data Portal [HCDP]; Longman and others, 2014, 202041; Lucas and others, 2022). Both gridded and station data are assessed in this report, and because measurements of stable isotopes of water suggest that groundwater from the inland high water-level area could be sourced as high as the summit of Mauna Loa, rainfall data from the Kīholo, Keauhou, and Kealakekua aquifer systems were included in the analysis.
Hawaiʻi Climate Data Portal
Station monthly rainfall data and gridded monthly rainfall maps for the North Kona District area were obtained from the HCDP (https://www.hawaii.edu/climate-data-portal/data-portal/; Longman and others, 2014, 202041; Lucas and others, 2022). The HCDP provides near-real-time monthly rainfall maps that are publicly available through an online data portal. HCDP acquires rainfall from various electronic sources, standardizes the data into a consistent format and time step, uses a machine learning approach to remove outliers and fill gaps, and interpolates the data to create gridded maps of monthly rainfall using an optimized geostatistical, climatological approach (Longman and others, 2014, 202041; Lucas and others, 2022). Rainfall data in the North Kona District area were acquired by HCDP from nine networks (Community Collaborative Rain, Hail, and Snow Network, Cooperative Observer Network, Hawaii Hydronet, Remote Automatic Weather Stations, National Renewable Energy Laboratory, National Weather Service, Hawaiʻi Permanent Plot Network, Soil Climate Analysis Network, USGS). Stations in the HCDP that have rainfall data from 2008 to 2021 include seven within Kīholo, 11 within Keauhou, and 11 within Kealakekua (fig. 4). Because the HCDP gridded rainfall maps are created based on the data collected at rainfall stations, only the gridded maps from the HCDP dataset will be used for analysis in this report.
Climate Data Online
Climate Data Online (CDO), operated by the NOAA National Centers for Environmental Information, provides access to the National Climatic Data Center climate data archive (NOAA, 2023a). Stations in the CDO that have daily rainfall data from 2008 to 2021 include two stations within Kīholo, nine stations within Keauhou, and seven stations within Kealakekua (fig. 4).
Groundwater Withdrawal
Within the Keauhou aquifer system, groundwater was only withdrawn from the coastal freshwater lens until 1994, when withdrawal from the high water-level area began. Groundwater withdrawal from the Keauhou aquifer system has increased from less than 6 Mgal/d in the early 1980s to about 15 Mgal/d by 2014 (Fukunaga and Associates, Inc., 2017; Oki, 2021). Groundwater-withdrawal data were obtained from CWRM, who currently (2023) receives monthly reports of groundwater-withdrawal rates from well owners of 39 active production wells (about 67 percent of all known production wells) in Keauhou. The production wells were installed in different years (as early as 1956 and as recent as 2011) and are not all continuously pumping groundwater, so have varying amounts of missing monthly data. Further, monthly pumping rates may be missing if withdrawal rates were not reported to CWRM by well owners. At the time of publication, groundwater withdrawal data are not publicly available from CWRM but can be requested from the agency.
Wastewater Discharge
A proportion of wastewater from the Keauhou area is treated at the Kealakehe WWTP, which is located about 1.4 mi from KAHO. Aerated lagoons are used to treat the sewage to secondary treatment standards before treated wastewater is discharged into a nearby percolation disposal pit (fig. 5) from which wastewater drains into the aquifer (Hunt, 2014; Wada and others, 2021). Wastewater effluent discharge rates (1-month intervals, fig. 10) since 2014 are monitored by and were obtained from the County of Hawaiʻi Wastewater Division. At the time of publication, wastewater discharge data are not publicly available from County of Hawai‘i Wastewater Division but can be requested from the agency.
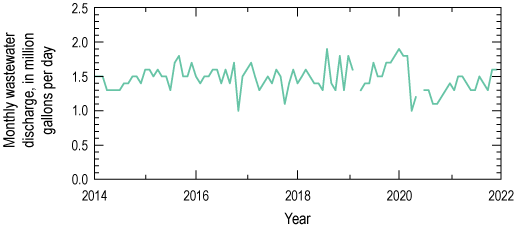
Graph of wastewater discharge at the Kealakehe Wastewater Treatment Plant, Island of Hawaiʻi, during 2014–21. At the time of publication, wastewater discharge data are not publicly available from the County of Hawai‘i, Department of Environmental Management, Wastewater Division, but can be requested from the agency.
Groundwater Injection
The groundwater withdrawn at the Kohanaiki Private Club Community is filtered through a reverse osmosis system, and the treated freshwater is used to irrigate property grounds. The reject water from the reverse osmosis system is injected back into the aquifer at well UH-2594 (fig. 5). Based on limited available injection rate data reported to CWRM, the monthly volume of injected water at Kohanaiki is highly correlated with the volume of groundwater withdrawn (tau = 0.70), and on average, about 34 percent of the monthly groundwater withdrawn at Kohanaiki is injected back into the aquifer. The groundwater withdrawal at Kohanaiki can therefore serve as an injection indicator and the injection rate will not be assessed in this study. At the time of publication, groundwater injection data are not publicly available from CWRM but can be requested from the agency.
Data Processing
Aggregation of Time-Series Data
As previously mentioned, the available data for this study are monitored by different organizations and for different purposes, and the data are measured at different time intervals. Groundwater monitoring data are reported in 10-, 15-, and 60-minute intervals; sea level is reported in 1-minute intervals but downloaded in monthly intervals; CDO rainfall station data are reported in hourly and daily intervals; MEI values, HCDP rainfall station and gridded maps, groundwater withdrawal, and wastewater discharge are reported in monthly intervals. Datasets obtained in sub-hourly, hourly, and daily intervals (groundwater monitoring and CDO rainfall) were aggregated to monthly intervals by averaging the data reported within the same month and year to a single monthly value.
Variables that consist of numerous sites (rainfall and groundwater withdrawal) were aggregated into representative areas of interest to better manage datasets and assess correlations. The CDO rainfall datasets were aggregated into two groups by adding monthly rainfall values from stations within the Kīholo, Keauhou, and Kealakekua aquifer systems (which generally covers the North Kona area) and stations within just the Keauhou aquifer system (fig. 11). The HCDP rainfall datasets were aggregated into three groups by adding monthly rainfall from stations within the North Kona area, Keauhou area, and ahupua‘a area, which consists of the Kohanaiki, Kaloko, Honokōhau, and Kealakehe ahupua‘a. The groundwater withdrawal dataset was aggregated into five groups by adding monthly withdrawal rates from production wells within the Keauhou area, the high water-level area of the Keauhou aquifer system, the ahupua‘a area which consists of the Kohanaiki, Kaloko, Honokōhau, and Kealakehe ahupua‘a, the coastal-lens area of the Keauhou aquifer system, and the Kohanaiki Private Club Community (fig. 12).
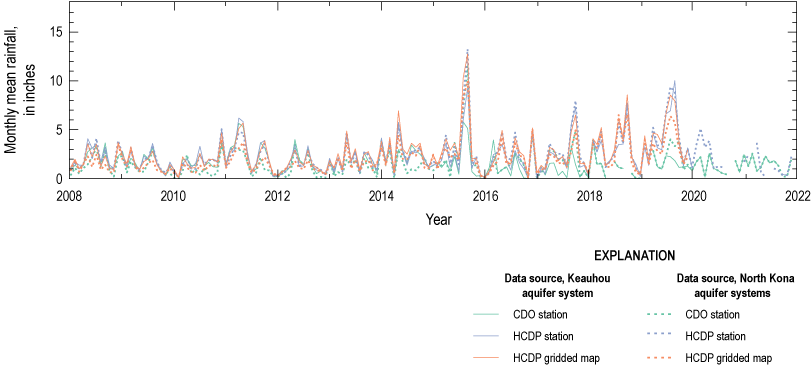
Graph of mean monthly rainfall measured at stations and derived from gridded maps of monthly rainfall over the Kīholo, Keauhou, and Kealakekua aquifer systems, Island of Hawaiʻi, during 2008–21. Average of monthly mean rainfall over the Keauhou aquifer system is represented by solid lines. Rainfall over the Kīholo, Keauhou, and Kealakekua aquifer systems (which generally covers the North Kona area) is represented by dotted lines. Sourced from Climate Data Online (CDO; National Oceanic and Atmospheric Administration, 2023a) and Hawaiʻi Climate Data Portal (HCDP; Longman and others, 2014, 202041; Lucas and others, 2022).
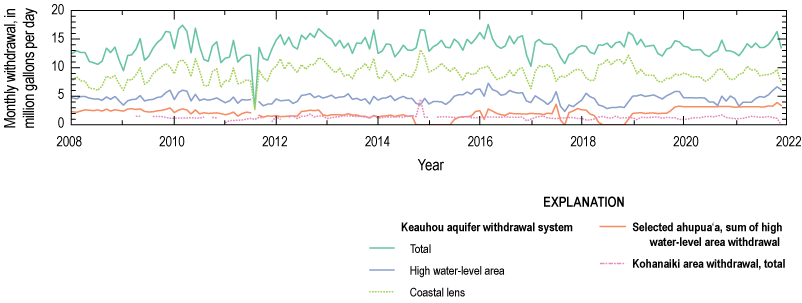
Graph of monthly groundwater withdrawals during 2008–21 in the Keauhou aquifer system, Island of Hawaiʻi. At the time of publication, groundwater withdrawal data are not publicly available from the Hawai‘i Commission on Water Resource Management but can be requested from the agency.
Determination of Representative Monthly Values
Available datasets have gaps of varying lengths because of monitoring equipment failure or maintenance for periods of time, or other reasons. Therefore, data available at refined timescales (for example, sub-hourly, hourly, daily) were inspected for level of completeness by calculating the percentage of data missing for each month. If more than 10 percent of the data were missing during a month, the aggregated average for that corresponding month was removed from the time-series dataset. This inspection was applied to groundwater level, specific conductance, temperature, and CDO rainfall.
As an example, KAHO3 groundwater levels published by the USGS were measured in 10-minute intervals, which corresponds to 144 measurements per day (6 measurements per hour, over the span of 24 hours). For the months of January, March, May, July, August, October, and December (which are 31-day months), a total of 4,464 groundwater-level measurements represents a complete dataset. This inspection process was also appropriately applied to 30-day months (April, June, September, and November) and to February during both non-leap years and leap years. The number of groundwater-level measurements was counted for each month, and the percentage of available measurements was calculated. If at least 90 percent of the data for a month were available, the monthly average was considered representative and suitable for the data analysis. If less than 90 percent of the data for a month were available (that is, more than 10 percent missing), the monthly average was considered unsuitable for the data analysis.
Removal of Sea-Level Effects from Groundwater Levels
As previously stated, ocean tides have a profound effect on groundwater levels, particularly in the KAHO monitoring wells, which are located near the coast. Lower frequency sea-level changes also affect groundwater levels, and the effects are attenuated less than those of ocean tides. In general, the effects of low-frequency ocean-level variations on groundwater levels at a particular location in the aquifer will tend to be less attenuated than the effects of high-frequency ocean-level variations of the same magnitude (Jacob, 1950). The effects of sea level on groundwater levels may obscure correlations with other external factors. A monthly mean sea-level time series with only concurrent months of data as the groundwater-level time series from a site was used to remove the effects of sea level from the groundwater-level record (appendix 1). The concurrent sea-level record was shifted upward by a constant value to have the same overall mean value as the groundwater-level record, and a least-squared error approach was used to determine a multiplier (constant value between 0 and 1) for the shifted-concurrent sea-level record that resulted in a best fit to the groundwater-level record. The best-fit shifted-concurrent sea-level record was then subtracted from the groundwater-level record to produce a residual groundwater-level record to be used for the statistical analyses (fig. 13). The calculated residual groundwater-level time series represent the groundwater levels with ocean-level variations removed and were used in the analysis in place of the raw groundwater-level time series at KAHO3, KAHO2, KAHO1, ʻAimakapā, and Kalaoa. Residual groundwater levels, therefore, will herein be referred to as groundwater levels.
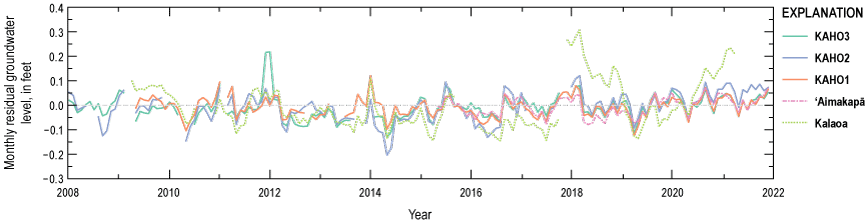
Graph of calculated residual groundwater levels at selected monitoring wells in the Keauhou aquifer system, Island of Hawaiʻi, during 2008–21.
Groundwater-Flux Indicators
Groundwater-flux indicators are equal to computed differences in concurrent monthly groundwater levels in well pairs (fig. 14). The groundwater-flux indicators are groundwater-level differences between selected pairs of wells to represent conceptual water-level gradients. The groundwater-flux indicators were calculated assuming two generalized water-level gradient directions: north-to-south and mauka-to-makai (mountain-to-ocean). North-to-south flux indicators were calculated for well pairs that align in a general north-to-south direction: KAHO3 to ʻAimakapā, KAHO2 to ʻAimakapā, KAHO2 to KAHO1, and KAHO3 to KAHO1 (fig. 15A). Mauka-to-makai flux indicators were calculated for well pairs that align in a general mauka-to-makai direction: KAHO2 to KAHO3, KAHO1 to ʻAimakapā, Kalaoa to KAHO3, Kalaoa to KAHO2, and Kalaoa to KAHO1 (fig. 15B). The Kalaoa well is located about 3 mi northeast of KAHO and is the closest long-term monitoring well situated between the KAHO monitoring wells and the upgradient production wells in the high water-level area.
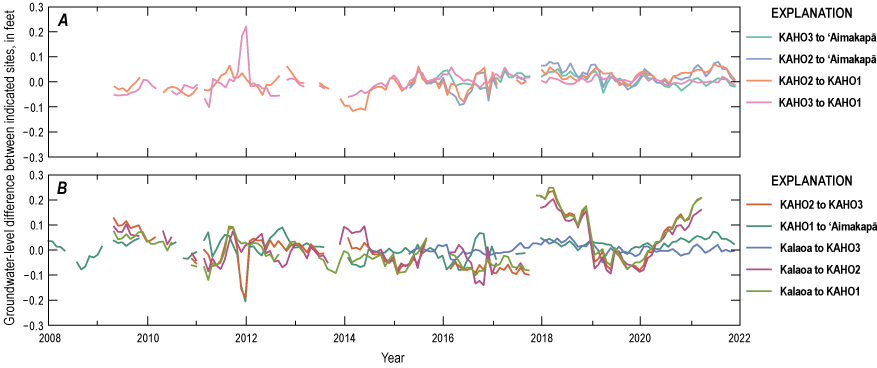
Graph of calculated groundwater-flux indicators at selected monitoring well pairs representing the (A) north-to-south and (B) mauka-to-makai (mountain-to-ocean) direction in the Keauhou aquifer system, Island of Hawaiʻi, during 2008–21.
Maps illustrating conceptual direction of water-level gradients (black arrows) associated with groundwater-flux indicators in the (A) north-to-south direction and (B) mauka-to-makai (mountain-to-ocean) direction, in the Keauhou aquifer system, Island of Hawai‘i.
Statistical Methods
A p-value (probability value) level of 0.05 is commonly used in statistical tests to indicate significance, or a one-in-20 error probability (Davis, 2002; Neumann and others, 2020). In other words, the p-value must be less than or equal to (≤) 0.05 for the test to be considered statistically significant for the purposes of this study.
Bivariate Nonparametric Statistical Tests
Bivariate (two variables) nonparametric (distribution-free) statistical tests were used to calculate correlation coefficients between monthly hydrologic time-series datasets from sites in and near KAHO. Correlation coefficients are dimensionless measurements of the strength of the relation between two continuous variables and are scaled to have values between −1 and 1 (Helsel and others, 2020). If two variables are positively correlated, they will vary in the same direction and have a positive correlation coefficient between 0 and 1, whereas if the variables are negatively correlated, they will vary in opposite directions and have a negative correlation coefficient between −1 and 0.
In this report, Kendall’s tau nonparametric rank correlations are calculated. Spearman’s rho is another nonparametric rank correlation considered for this study. Different scales are used to calculate tau and rho, which result in similar, but not identical, correlation coefficients. Typically, tau values will be smaller than the corresponding rho values. Kendall’s tau is essentially an extension of Spearman’s rho with similar properties, and can produce more accurate generalizations (Akoglu, 2018). Because similar results of tau and rho are produced and tau has been shown to have a narrower confidence interval (Puth and others, 2015), only tau was computed for this report.
Kendall’s Tau
Kendall’s tau is a rank-based correlation coefficient that measures monotonic correlation between the pair of variables x and y (Helsel and others, 2020). Kendall’s tau was calculated using the SciPy Kendall’s tau statistical function (scipy.stats.kendalltau, version 1.14.0; SciPy, 2015), which follows the equation:
where τb is variant b of Kendall’s tau, P is the number of concordant (in agreement) pairs, Q is the number of discordant (in disagreement) pairs, T is the number of ties only in variable x, and U is the number of ties only in variable y (Knight, 1966). The function returns Kendall’s tau (correlation value) and the associated p-value. Universally validated ranges to interpret the strength of tau coefficients have not been published, but for this report, the following interpretation is used (Botsch, 2011):
-
0 ≤ |tau| < 0.1; very weak correlation
-
0.1 ≤ |tau| < 0.2; weak correlation
-
0.2 ≤ |tau| < 0.3; moderate correlation
-
0.3 ≤ |tau| ≤ 1.0; strong correlation
where |tau| is the absolute value of tau. Thus, for this study, the p-value is used to characterize the statistical significance of a positive or negative correlation, and the sign (positive or negative) and magnitude of the tau coefficient is used to characterize the strength of a positive or negative correlation.
Time-Lag Analysis
Hydrologic changes are commonly not instantaneous, and time is required to observe changes in groundwater conditions related to various hydrologic influences. For example, when rain falls onto the island’s surface, water infiltrating the land surface will move down toward the water table over a finite time that is dependent on the land-surface altitude, all other factors being equal. A time lag was applied to the time-series datasets of independent hydrologic variables to account for a potential lagged relation with the dependent variables. The independent variable time series were offset at monthly intervals ranging from one to 60 months (five years) and separately correlated with the dependent variable time series.
Mann-Kendall Trend Test
The Mann-Kendall trend test is a nonparametric, rank-order statistical test used to determine whether a time-series dataset has a monotonic trend (that is, consistently increasing or decreasing, but not necessarily in a linear way; Mann, 1945). The Mann-Kendall trend was calculated using the Python Package Index (PyPI) original Mann-Kendall test (pyMannKendall, version 1.4.3), which does not consider seasonal effects or serial correlation (Hussain and Mahmud, 2019). The test returns multiple outputs that can be used for interpretation, including the trend (increasing, decreasing, no trend) and p-value.
Correlation Analysis
Four dependent variables (groundwater level, specific conductance, water temperature, and the groundwater-flux indicator) were correlated with five independent variables (sea level, ENSO, rainfall, groundwater withdrawal, and wastewater discharge) using the Kendall’s tau nonparametric rank correlation. In this study, 140 correlation coefficients were calculated, of which 47 correlations are statistically significant (p-value ≤ 0.050) and 27 correlations are both statistically significant and considered hydrologically plausible.
Water temperature correlations are included in appendix 2 but will not be discussed in this report. Average fresh groundwater has lower temperatures (about 20 °C) relative to ambient surface seawater (24–28 °C; Johnson and others, 2008; Richardson and others, 2017). Because water temperatures vary with depth in both the aquifer and ocean and are highly dependent on how groundwater circulates within the aquifer, the hydrologic plausibility of correlations is difficult to evaluate without further analysis. Furthermore, groundwater temperatures in the KAHO monitoring wells (excluding ‘Aimakapā) indicate little variability over time, which could make interpretations of correlations challenging.
Correlations with Non-Time-Lagged Variables
Groundwater level, the groundwater-flux indicator, and specific conductance were first correlated with non-time-lagged independent variables. These analyses were used to determine whether a response in the dependent variable is correlated with a change in the independent variable on a monthly time scale. Statistically significant and hydrologically plausible correlations were identified mainly for the dependent variables related to groundwater level and the derived groundwater-flux indicator.
Groundwater Level
Monthly groundwater levels measured at ‘Aimakapā, KAHO1, KAHO2, KAHO3, and Kalaoa were correlated with up to 13 monthly independent variables, producing 65 correlation pairs (table 2). Of the 65 pairs of correlation values, 15 of the tau correlations are statistically significant (p-value ≤ 0.050) and considered hydrologically plausible. Groundwater levels observed at ʻAimakapā, KAHO1, and KAHO2 have a statistically significant, weak-to-moderate negative correlation with MEI. An increase in MEI indicates a shift toward warm El Niño years, which are typically indicative of a decrease in rainfall in Hawai‘i (National Weather Service, 2023). A decrease in rainfall during El Niño years can result in a decrease in groundwater levels, consistent with the statistically significant, negative correlations between groundwater levels and MEI. Groundwater levels have statistically significant, weak-to-strong negative correlations with groundwater withdrawal from production wells at Kohanaiki, which are located adjacent to and north of KAHO. An increase in groundwater withdrawal typically results in a decline in nearby groundwater levels, consistent with the calculated negative correlations. The strongest correlations are observed for KAHO3 (tau = −0.31, p-value = 0.000) and KAHO2 (tau = −0.25, p-value = 0.000), which are located in closest proximity to the Kohanaiki production wells, relative to KAHO1 and ‘Aimakapā (fig. 5, table 2). Groundwater levels at ‘Aimakapā, KAHO1, and KAHO3 also have statistically significant, weak negative correlations with withdrawal from production wells in the coastal lens of the Keauhou aquifer system. This correlation, however, is likely a reflection of groundwater withdrawal at Kohanaiki, because about 67 percent of the groundwater withdrawn from the coastal lens in the Keauhou aquifer system comes from the five Kahalu‘u wells (State well number 8–3557–001 to –005; fig. 5), which are located 8 mi southeast of KAHO, and therefore likely have less influence on groundwater levels at KAHO than groundwater withdrawn at Kohanaiki. Correlations are limited by the number of concurrent monthly data pairs used in the analyses. The number of concurrent monthly pairs used for groundwater-level correlations range from 56 to 155, with an average of 123 pairs.
Table 2.
Kendall’s tau correlation coefficients for relations between groundwater levels and selected independent variables, Keauhou aquifer system, Island of Hawaiʻi, during 2008–21.[Number of monthly data pairs used for calculation (that is, the sample size) are displayed in parentheses. ENSO, El Niño–Southern Oscillation; CDO, Climate Data Online; HCDP, Hawaiʻi Climate Data Portal; ahupuaʻa area, combined area consisting of the Kohanaiki, Kaloko, Honokōhau, and Kealakehe land divisions; WWTP, wastewater treatment plant]
Groundwater-Flux Indicator
Nine groundwater-flux indicators were correlated with 13 independent variables, but only correlations between groundwater-flux indicators and selected independent variables will be discussed. The independent variables were selected on the basis of the way each independent variable influences the direction of groundwater flow. All tau correlations between groundwater-flux indicators and independent variables can be found in appendix 3.
The four north-to-south groundwater-flux indicators were correlated with two independent variables considered potentially relevant (withdrawal at Kohanaiki and discharge at the Kealakehe WWTP disposal pit), producing eight correlation pairs (table 3). These two independent variables were selected to assess north-to-south groundwater-flux correlation because Kohanaiki is located near and north of KAHO, and the Kealakehe WWTP disposal pit is located adjacent to and south of KAHO, thus generally aligning with the investigated direction of groundwater flux. Three of the four north-to-south groundwater-flux indicators (KAHO2 to KAHO1, KAHO3 to KAHO1, and KAHO3 to ‘Aimakapā) have a statistically significant, weak negative correlation with withdrawal at Kohanaiki, whereas only the KAHO2-to-‘Aimakapā indicator is not statistically significant (tau = −0.15, p-value = 0.062).
Withdrawal from Kohanaiki can cause groundwater to flow toward the production wells at Kohanaiki. Because Kohanaiki is north of KAHO, withdrawal from Kohanaiki can induce groundwater flow in a south-to-north direction within the KAHO area, producing a negative correlation between the north-to-south groundwater-flux indicators and Kohanaiki withdrawal. Injection of reverse-osmosis reject water at Kohanaiki is related to withdrawal at Kohanaiki (representing the source of water that is treated) and might partly counteract and obscure the effect of withdrawal on the groundwater-flux indicators.
Because the Kealakehe WWTP disposal pit is located south of KAHO, discharge of wastewater at the disposal pit can also produce a negative correlation with the north-to-south groundwater-flux indicators. Correlations between north-to-south groundwater-flux indicators and discharge at the Kealakehe WWTP disposal pit are either nonsignificant or non-plausible. Correlation between the KAHO3-to-KAHO1 groundwater-flux indicator and Kealakehe WWTP discharge is statistically significant, but not hydrologically plausible.
Table 3.
Kendall’s tau correlation coefficients for relations between groundwater-flux indicators and selected independent variables, Keauhou aquifer system, Island of Hawaiʻi, during 2008–21.[Number of monthly data pairs used for calculation (that is, the sample size) displayed in parentheses; Mauka-to-makai, mountain-to-ocean; ahupuaʻa area, combined area consisting of the Kohanaiki, Kaloko, Honokōhau, and Kealakehe land divisions; WWTP, wastewater treatment plant]
Indicates the independent variable is not hydrologically applicable to the direction of the corresponding groundwater-flux indicator.
The five mauka-to-makai groundwater-flux indicators were correlated with three independent variables considered potentially relevant (sea level, withdrawal from the high water-level area, and withdrawal from selected ahupuaʻa in the high water-level area), producing 15 correlation pairs (table 3). These three independent variables were selected to assess mauka-to-makai groundwater-flux correlation because sea-level variability occurs makai (ocean-side) of KAHO and variability in withdrawal from the high water-level area occurs mauka (mountainside) of KAHO, thus generally aligning with the investigated direction of groundwater flow. Four of the five groundwater-flux indicator pairs (KAHO1 to ‘Aimakapā, Kalaoa to KAHO3, Kalaoa to KAHO2, and Kalaoa to KAHO1) have a statistically significant, weak-to-moderate negative correlation with withdrawal from production wells in the high water-level area within the Keauhou aquifer system. Stronger correlations are observed for the KAHO1-to-‘Aimakapā (tau = −0.26, p-value = 0.001) and Kalaoa-to-KAHO2 (tau = −0.22, p-value = 0.000) indicators, relative to the Kalaoa-to-KAHO3 (tau = −0.12, p-value = 0.049) and Kalaoa-to-KAHO1 (tau = −0.12, p-value = 0.041) indicators. The KAHO1-to-‘Aimakapā groundwater-flux indicator also has a statistically significant, weak negative correlation with high water-level area withdrawal considering only production wells within selected ahupuaʻa (Kohanaiki, Kaloko, Honokōhau, and Kealakehe; fig. 6) (tau = −0.18, p-value = 0.017).
Groundwater in an isotropic aquifer naturally follows a hydraulic gradient from high water levels to low water levels, but increased withdrawal in the high water-level area can lower groundwater levels in the area, therefore reducing the hydraulic gradient and groundwater flux in the mauka-to-makai direction. This leads to an expected negative correlation between mauka-to-makai groundwater-flux indicators and high water-level area withdrawal.
A short-term rise in sea level can result in a rise in the water table in the coastal-lens area, therefore also reducing the hydraulic gradient in the mauka-to-makai direction. This could result in a negative correlation between mauka-to-makai groundwater-flux indicators and sea level. All mauka-to-makai groundwater-flux indicators have very weak to weak, negative correlations with sea level, but none are statistically significant.
Specific Conductance
Specific conductance measured at ‘Aimakapā, KAHO1, KAHO2, and KAHO3 was correlated with up to 13 independent variables, producing 52 correlation pairs (table 4). Of the 52 pairs, four of the tau correlations are statistically significant (p-value ≤ 0.050) and hydrologically plausible. Specific conductance generally does not have statistically significant correlations with the independent hydrologic variables.
Table 4.
Kendall’s tau correlation coefficients for relations between specific conductance and selected independent variables, Keauhou aquifer system, Island of Hawai‘i, during 2008–21.[Number of monthly data pairs used for calculation (that is, the sample size) displayed in parentheses; ENSO, El Niño–Southern Oscillation; CDO, Climate Data Online, HCDP, Hawai‘i Climate Data portal; ahupua‘a area, combined area consisting of the Kohanaiki, Kaloko, Honokōhau, and Kealakehe land divisions; WWTP, wastewater treatment plant]
The ocean water near KAHO has a specific-conductance value of about 50,000 microsiemens per centimeter (µS/cm) at 25 degrees Celsius (°C) (Tillman and others, 2014a), which is more than 70 times higher than the Environmental Protection Agency’s secondary standard for drinking water for chloride of 250 milligrams per liter (mg/L), equivalent to a specific conductance of about 700 µS/cm (U.S. Environmental Protection Agency, 2023; Oki, 2021). For typical freshwater-lens groundwater systems, an increase in sea level can increase specific conductance at a given point in the aquifer, which could lead to a positive correlation between specific conductance and sea level. Specific conductance and sea level have a statistically significant, moderate correlation at KAHO1 (tau = 0.26, p-value = 0.000) and KAHO3 (tau = 0.20, p-value = 0.001). Specific conductance at ʻAimakapā also has a positive, although nonsignificant and very weak, correlation with sea level (tau = 0.07, p-value = 0.360). Specific conductance at KAHO2, however, has a statistically significant, moderate negative correlation with sea level (tau = −0.27, p-value = 0.000), which is not considered hydrologically plausible, although the effects of sea level on mixing (spatially and temporally) of water in the aquifer are not fully understood.
An increase in groundwater withdrawal can cause saltwater intrusion near the coast, also resulting in increased specific conductance at a given point in the aquifer, which could lead to a positive correlation between specific conductance and withdrawal. Only five withdrawal-related correlations are hydrologically plausible, but none are statistically significant.
Rainfall has a specific conductance near 0 µS/cm at 25 °C, which is substantially lower than specific conductance measured in KAHO groundwater. An increase in rainfall would be expected to decrease specific conductance of groundwater at a given point in the aquifer (even if evapotranspiration-related increase in specific conductance of recharge is considered), which could lead to a negative correlation between specific conductance and rainfall. Of the 20 rainfall-related correlations in table 4, only seven are hydrologically plausible, whereas 13 have positive, rather than the expected negative, correlations. Only one rainfall-related tau correlation is hydrologically plausible and statistically significant—specific conductance at KAHO2 has a statistically significant, weak negative correlation (tau = −0.15, p-value = 0.026) with the HCDP gridded rainfall over the North Kona area (encompassing the Kīholo, Keauhou, and Kealakekua aquifer systems; fig. 6).
Correlations with Time-Lagged Variables
Lagged correlations, which are correlations between dependent variables and time-lagged independent variables, generally were stronger than the correlations that did not use time-lagged variables. Lagged correlations in monthly intervals for a given independent variable, however, were not consistent—a singular lag time was not associated with the strongest correlation at all sites (tables 5–7).
Table 5.
Largest Kendall’s tau correlation coefficients relating groundwater level and lagged independent variable time series, Keauhou aquifer system, Island of Hawai‘i, during 2008–21.[Time lag (in number of months within the tested range of 0 to 60 months) displayed in square brackets; all listed values are hydrologically plausible and statistically significant (p-value ≤ 0.050); “--“ indicates that a hydrologically plausible and statistically significant value was not computed for the variable pairing; ENSO, El Niño–Southern Oscillation; CDO, Climate Data Online, HCDP, Hawai‘i Climate Data portal; WWTP, wastewater treatment plant; ahupua‘a area, combined area consisting of the Kohanaiki, Kaloko, Honokōhau, and Kealakehe land divisions]
Table 6.
Largest Kendall’s tau correlation coefficients relating groundwater-flux indicator and lagged independent variable time series, Keauhou aquifer system, Island of Hawai‘i, during 2008–21.[Time lag (in number of months within the tested range of 0 to 60 months) displayed in square brackets; all listed values are hydrologically plausible and statistically significant (p-value ≤ 0.050); “--“ indicates that a hydrologically plausible and statistically significant value was not computed for the variable pairing; “N/A” indicates that the independent variable is not considered hydrologically applicable to the direction of the corresponding groundwater-flux indicator; Mauka-to-makai, mountain-to-ocean; ENSO, El Niño–Southern Oscillation; CDO, Climate Data Online, HCDP, Hawai‘i Climate Data portal]
Table 7.
Largest Kendall’s tau correlation coefficients relating specific conductance and lagged independent variable time series, Keauhou aquifer system, Island of Hawaiʻi, during 2008–21.[Time lag (in number of months) displayed in square brackets; all listed values are hydrologically plausible and statistically significant (p-value ≤ 0.050); “--“ indicates that a hydrologically plausible and statistically significant value was not computed for the variable pairing; ENSO, El Niño–Southern Oscillation; CDO, Climate Data Online; HCDP, Hawaiʻi Climate Data portal; WWTP, wastewater treatment plant; ahupua‘a area, combined area consisting of the Kohanaiki, Kaloko, Honokōhau, and Kealakehe land divisions]
Groundwater Level
Groundwater levels typically will not immediately respond to hydrologic changes. Some time is usually required to observe any change in groundwater conditions. Therefore, groundwater levels were tested for significant correlation with lagged sea level, wastewater discharge, MEI, rainfall, and withdrawal time series.
Lagged Sea Level and Wastewater Discharge
Generally, groundwater levels at KAHO have the strongest statistically significant correlations with sea level for lags of 39 to 52 months, with tau values ranging from 0.34 to 0.43 (table 5). This might reflect a low-frequency sea-level component (Jacob, 1950). Groundwater levels also have strong correlations with discharge at the Kealakehe WWTP for lags of 58 to 60 months, with tau values ranging from 0.27 to 0.37. These correlations, however, are based on a limited number of data pairs associated between groundwater levels and Kealakehe WWTP discharge (n = 36 to 38).
Lagged MEI
The strongest correlation between groundwater levels at KAHO and MEI is generally indicated with a 2-month lag in the MEI time series (table 5). Weak to moderate correlations are indicated between groundwater levels at KAHO1 (tau = −0.25, p-value = 0.000, n = 147), KAHO2 (tau = −0.18, p-value = 0.001, n = 147), and KAHO3 (tau = –0.12, p-value = 0.029, n = 153) with 2-month lagged MEI. Groundwater levels at ʻAimakapā also have a moderate correlation with MEI with a 2-month lag (tau = –0.26, p-value = 0.001, n = 80), but the strongest correlation between ʻAimakapā groundwater levels and MEI is indicated with a 42-month lag (tau = –0.28, p-value = 0.000, n = 80). The 42-month lag between ʻAimakapā groundwater levels and MEI might be the result of sea-level influences, which have the strongest correlation with a similar lag of 39 months.
Lagged Rainfall
In general, the strongest correlation between groundwater levels at KAHO and average gridded HCDP rainfall across the Keauhou aquifer system is indicated with a 28- to 30-month lag in the rainfall time series (table 5). Moderate-to-strong correlations are indicated with a 28-month lag at ʻAimakapā (tau = 0.33, p-value = 0.000, n = 80), and KAHO1 (tau = 0.23, p-value = 0.000, n = 135), and a 30-month lag at KAHO3 (tau = 0.26, p-value = 0.000, n = 130). A moderate correlation between groundwater levels at KAHO2 and HCDP rainfall across Keauhou is also indicated with a 28-month lag (tau = 0.21, p-value = 0.000, n = 130), but the strongest correlation is indicated with a lag of only 4 months (tau = 0.27, p-value = 0.000, n = 125).
Lagged Withdrawal
The strongest correlation between groundwater levels at KAHO and total withdrawal from the Keauhou aquifer system is generally indicated with a 4- to 5-month lag (table 5). Moderate-to-weak correlations are indicated between groundwater levels and Keauhou withdrawal for a 4-month lag at KAHO1 (tau = −0.21, p-value = 0.000, n = 147) and KAHO2 (tau = −0.24, p-value = 0.000, n = 145) and for a 5-month lag at KAHO3 (tau = −0.19, p-value = 0.000, n = 150). Comparatively, the strongest correlation between groundwater levels at ʻAimakapā and withdrawal from the Keauhou aquifer system is for a lag of 28 months (tau = −0.23, p-value = 0.003, n = 80). Correlations between groundwater levels at KAHO1, KAHO2, and KAHO3 are weakly correlated with 4- to 5-month lagged withdrawal from the coastal lens, whereas groundwater levels at all four monitoring sites (ʻAimakapā, KAHO1, KAHO2, and KAHO3) are weakly to moderately correlated with 37- to 38-month lagged withdrawal from production wells in the high water-level area (table 5). Groundwater levels likely have a delayed response to withdrawal from the high water-level area, relative to withdrawal from the coastal lens, because of the greater distance between KAHO and the high water-level area and the low-permeability hydrogeologic structure that impedes groundwater flow between the groundwater systems.
A time lag does not strengthen correlations, relative to the non-time-lagged case, between groundwater levels at KAHO1, KAHO2, and KAHO3 and withdrawal from Kohanaiki production wells (table 5). Groundwater levels at ʻAimakapā, however, have a moderate correlation with Kohanaiki withdrawal for a 44-month lag (tau = −0.26, p-value = 0.001, n = 77). KAHO2 and KAHO3 are located within the Kaloko ahupuaʻa (fig. 6), which is directly adjacent to the Kohanaiki ahupuaʻa, where the Kohanaiki Private Club Community is located. Thus, groundwater levels at KAHO2 and KAHO3 might be affected by Kohanaiki withdrawal almost immediately. In comparison, ʻAimakapā is located within the Honokōhau ahupuaʻa (fig. 6), farther from Kohanaiki. Thus, groundwater levels at ‘Aimakapā might be affected later (relative to KAHO2 and KAHO3) by Kohanaiki withdrawal. ʻAimakapā is also located near the coast, so the correlation may be a reflection of an incomplete removal of sea-level effects or the large storage of ʻAimakapā fishpond relative to monitor wells. Given the high permeability of the aquifer, however, lags exceeding 40 months are not reasonably explainable, which might indicate other factors are affecting the perceived correlation. Groundwater levels at KAHO1 are significantly correlated with Kohanaiki withdrawal for the non-time-lagged case (table 2), which is consistent with the implausibility of a 44-month lag associated with ʻAimakapā (table 5).
Groundwater-Flux Indicator
Correlations calculated between groundwater-flux indicators and lagged withdrawal time series resulted in inconsistent combinations of lagged monthly intervals and statistically significant tau values for a singular independent variable (table 6). The strongest correlations between the KAHO3-to-KAHO1, KAHO2-to-ʻAimakapā, and KAHO3-to-ʻAimakapā north-to-south indicators and Kohanaiki withdrawal are indicated with a 1-month lag, whereas the strongest correlation between the KAHO2-to-KAHO1 indicator and Kohanaiki withdrawal is indicated with an 18-month lag. A negative correlation exists between the KAHO2-to-KAHO1 indicator and Kohanaiki withdrawal with a 1-month lag but is not statistically significant (tau = –0.07, p-value = 0.223, n = 133). As previously mentioned, KAHO2 and KAHO3 are located within close proximity to the Kohanaiki Private Club Community, and therefore water levels at KAHO2 and KAHO3 likely respond to withdrawal relatively quickly. Also, injection at Kohanaiki might partly counteract and obscure the effect of withdrawal on the groundwater-flux indicators.
Correlations between four of the five mauka-to-makai groundwater-flux indicators (KAHO2 to KAHO3, KAHO1 to ʻAimakapā, Kalaoa to KAHO3, and Kalaoa to KAHO1) and lagged withdrawal from the high water-level area are strongest with a 5- to 7-month lag (table 6). A weak correlation between the Kalaoa-to-KAHO2 indicator and high water-level area withdrawal is also indicated with a 5-month lag (tau = −0.19, p-value = 0.002, n = 120), but the strongest correlation is indicated with a 41-month lag (tau = −0.32, p-value = 0.000, n = 104). Comparatively, correlations between the mauka-to-makai groundwater-flux indicators and lagged withdrawal from the ahupua‘a area were generally strongest with a 42- to 60-month lag. These lagged results are notable because the high water-level area withdrawal includes the ahupua‘a area withdrawal, but the lag times are substantially different. This could indicate that the mauka-to-makai groundwater-flux indicators are affected by withdrawals from the high water-level area beyond the ahupua‘a area or other contributing factors.
Specific Conductance
Correlations between specific conductance and lagged time series also resulted in inconsistent combinations of lagged monthly intervals and statistically significant tau values for a singular independent variable (table 7). Correlations between specific conductance and sea level only improved, relative to the non-time-lagged case, at KAHO3, with a 28-month lag (tau = 0.27, p-value = 0.000, n = 117). An increase in sea level could cause an increase in specific conductance, but that is not consistently observed, even with lagged sea level time-series data. Hydrologically plausible and statistically significant correlations between specific conductance and sea level were not indicated for either ʻAimakapā or KAHO2 throughout the range of lags tested.
Rainfall data were obtained from two different sources and summarized relative to three different area boundaries, but correlations for all four KAHO monitoring sites were inconsistent for each rainfall representation (table 7). For example, specific conductance correlations with gridded HCDP rainfall over the Keauhou aquifer system improved, relative to the non-time-lagged case, with a 31-month lag for ʻAimakapā (tau = −0.30, p-value = 0.000, n = 79), a 9-month lag for KAHO1 (tau = −0.27, p-value = 0.000, n = 81), and a 2-month lag for KAHO2 (tau = −0.26, p-value = 0.000, n = 99).
Similarly, withdrawal rates were summed according to five different area boundaries, but correlations across all four KAHO monitoring sites were inconsistent (table 7). For example, specific-conductance correlations with withdrawal from the high water-level area improved, relative to the non-time-lagged case, with a 35-month lag for ʻAimakapā (tau = 0.43, p-value = 0.000, n = 79), a 14- to 15-month lag for KAHO1 (tau = 0.23, p-value = 0.001, n = 95), a 35-month lag for KAHO2 (tau = 0.32, p-value = 0.000, n = 100), and a 48-month lag for KAHO3 (tau = 0.26, p-value = 0.000, n = 101).
Trends Over Time in Groundwater Levels
Residual groundwater levels significantly increased at ‘Aimakapā, KAHO2, and KAHO3, whereas no trends were detected at KAHO1 and Kalaoa (table 8). Specific conductance decreased at ‘Aimakapā, KAHO1, and KAHO2, whereas no trend was detected at KAHO3. Water temperature increased at KAHO1, KAHO2, and KAHO3, whereas no significant trend was detected at ‘Aimakapā, which is an open water body that is directly affected by insolation. The north-to-south groundwater-flux indicators generally increased during 2008–21, except for KAHO3 to ‘Aimakapā, which decreased. Generally, no trends were detected in mauka-to-makai groundwater-flux indicators, except for KAHO2 to KAHO3, which increased. Sea level increased during 2008–21, but no trend was detected for MEI (table 8). Rainfall based on HCDP gridded maps generally increased, although rainfall based on CDO stations in the Keauhou area decreased. Rainfall at CDO stations within the coastal-lens area of the Keauhou aquifer system increased, but no trends were detected in rainfall at CDO stations within the high water-level area. Trends were not detected for withdrawal from the Keauhou aquifer system, high water-level area, coastal lens, and Kohanaiki.
Table 8.
Mann-Kendall trends for hydrologic variables, Keauhou aquifer system, Island of Hawaiʻi, during 2008–21.[ENSO, El Niño–Southern Oscillation; CDO, Climate Data Online; HCDP, Hawaiʻi Climate Data Portal; ahupuaʻa area, combined area consisting of the Kohanaiki, Kaloko, Honokōhau, and Kealakehe land divisions; WWTP, wastewater treatment plant]
The Mann-Kendall test provides an overview of trends during the entire 2008–21 period, but these trends do not necessarily recognize the fluctuations that occur at finer temporal (that is, daily) scales. Therefore, the general trends cannot simply be compared between the hydrologic variables investigated in this report and may not necessarily have strong implications for the tau correlation results.
Study Limitations
The primary limitation of this study is the scarcity of available hydrologic data that can be used for statistical correlation analysis. Although the study period ranges from 2008–21, most datasets do not span the entire period, therefore containing numerous gaps for which datasets do not overlap. The average number of concurrent monthly data pairs used for groundwater-level correlations is 123, which is about 73 percent of the possible monthly data pairs. Analyses accounting for time lags in the independent time series have less available data. The lack of data collected at a fine temporal resolution also limits the temporal resolution used in the analyses. Although some datasets are available at finer temporal resolutions, the limiting temporal resolution is monthly because several datasets are available only at a monthly resolution. The quantity of data is reduced because the limiting temporal resolution is coarse.
This study only includes bivariate analyses, which might not explain all the variance in the data. As demonstrated in this report, some statistically significant correlations are difficult to reconcile, and other non-significant correlations might reasonably be expected to be significant. This inconsistency might be related to multiple hydrologic factors that affect groundwater conditions to different extents and at different time scales, which confounds the bivariate statistical analyses.
In this study, serial correlation was not accounted for in evaluating trends. However, uniformly consistent trends were generally not detected and accounting for serial correlation in the time series would be expected to further reduce the number of significant trends, as demonstrated in appendix 4. Interpretation of trends in this study also is uncertain because of the short record (14 years) avaialable for analysis. Analysis of trends would benefit from a longer available period of record in the time series.
Suggestions for Future Studies and Monitoring
Future studies could benefit from additional long-term hydrologic time-series datasets collected in the North Kona area. As more hydrologic data are collected over time, additional monitoring wells can be included in the monitoring network for future analysis. A wider distribution of monitoring wells can potentially better define groundwater-flow patterns and improve understanding of the entire aquifer system.
Additionally, future studies could benefit from the use of other chemical tracers, such as water isotopes or wastewater indicators, to investigate the quantity and quality of groundwater resources at KAHO. For example, water isotopes can be further investigated to better refine the percentage of groundwater sourced from the inland high water-level area that indirectly recharges the KAHO area. Strontium isotopes can also be used as a tracer of water-rock interactions to help define the local substrate which the groundwater traveled through and estimate the percentage of porewater contribution to the aquifer (Nigro and others, 2017; Christensen and others, 2018). Various geochemical tracers, such as radiocarbon and chlorofluorocarbons, can be used to estimate apparent groundwater age, which can help to better understand groundwater velocity as well as the fracture network through the aquifer system (Cook and others, 2005).
Additionally, future studies could benefit from the use of accurate submarine groundwater discharge measurements along the North Kona coastline. By quantifying the rate at which groundwater discharges into the ocean, future studies could gain insight into the full water budget of North Kona and improve understanding of how much groundwater is passing through KAHO (Dulai and others, 2016; McKenzie and others, 2021).
Future studies could also consider more sophisticated correlation analyses to assess how multiple hydrologic and environmental variables affect groundwater conditions in and around KAHO. The complex hydrogeology of the North Kona area likely influences various interworking factors. With the collection of more hydrologic data, groundwater-modeling studies have the potential to improve our understanding of the Keauhou aquifer system and the KAHO area. Improved modeling analyses that build upon Oki (2021) have the potential to provide a more holistic understanding of how groundwater is affected by natural and human-related factors in North Kona.
Summary
The Kaloko-Honokōhau National Historical Park (KAHO) is located within the Kohanaiki, Kaloko, Honokōhau, and Kealakehe ahupua‘a (traditional Hawaiian land division), the Keauhou aquifer system (as defined by the Hawai‘i Commission on Water Resource Management), and the North Kona District, on the west coast of the Island of Hawai‘i. KAHO was designated a park in 1978 to protect and preserve traditional and customary Hawaiian practices, land, resources, and native species within the park boundaries. KAHO encompasses about 1,200 acres of coastal land and nearshore ecosystems, including anchialine pools (landlocked bodies of brackish water with hydrologic connections to the ocean), fishponds, and coral reefs. The nearshore ecosystems and water bodies depend on groundwater discharge that contains a freshwater component. The ecosystems and resources protected within KAHO, however, are potentially threatened by natural and human-related factors associated with an increase in residents and visitors within the North Kona District.
The effects of natural and human-related factors on groundwater quantity and quality in KAHO have not been fully quantified using existing data, and thus an analysis is needed to better inform resource-management decisions. The purpose of this report is to document statistical trends of and correlations between hydrologic time-series datasets from sites in and near KAHO. To meet the objectives of this study, publicly available hydrologic data related to groundwater resources in KAHO were compiled, appropriately aggregated, and statistically evaluated using the nonparametric Kendall’s tau test.
The statistical analysis examined three dependent hydrologic variables (groundwater level, specific conductance, and water temperature) from four KAHO monitoring sites (KAHO3, KAHO2, KAHO1, and ʻAimakapā) and one dependent hydrologic variable (groundwater level) from a well (Kalaoa) inland from KAHO. Water temperature, however, is not discussed in depth because the plausibility of statistical results cannot be evaluated without further understanding of the groundwater circulation patterns in the study-area coastal aquifer that influence water temperatures. A fourth dependent hydrologic variable, groundwater-flux indicator, was calculated for site pairs to infer the conceptual direction of water-level gradients. The four dependent hydrologic variables were correlated with 13 independent hydrologic variables, which include sea level, multivariate El Niño–Southern Oscillation index (MEI), rainfall, groundwater withdrawal, and wastewater discharge. To account for non-instantaneous hydrologic changes, time lags ranging from one to 60 months were further applied to independent time-series datasets and correlated with the dependent variable time series.
Generally, residual groundwater levels, which are groundwater levels with sea-level variations removed, at KAHO increase during 2008–21, whereas specific conductance decreases. Groundwater-flux indicators, which are calculated as groundwater-level differences between site pairings, generally increase in the north-to-south direction but have no significant trends in the mauka-to-makai (mountain-to-ocean) direction. Sea level has an increasing trend during 2008–21, whereas rainfall trends vary, depending on the source of rainfall data and area of investigation. Further, significant trends in groundwater withdrawal were not detected. Identifying meaningful trends in the time series is limited by the short period of record available for analysis.
Overall, most of the correlations assessed in this report either do not indicate statistical significance or hydrologically plausible results. About 47 of the 140 calculated tau correlation coefficients are statistically significant (p-value ≤ 0.050), and 27 correlations are both statistically significant and considered hydrologically plausible. Further, correlation results lack consistency because a singular independent variable is not able to explain all variations in hydrologic conditions at all KAHO monitoring sites, although some of the statistical results are consistent with hydrologic conceptual understanding. Consistent tau coefficients were generally detected for correlations between groundwater levels at KAHO and MEI and withdrawal from Kohanaiki production wells. In both cases, correlations were statistically significant and negative.
The north-to-south groundwater-flux indicators (determined from water-level differences between pairs of sites) for KAHO2 to KAHO1, KAHO3 to KAHO1, and KAHO3 to ʻAimakapā have a significant negative correlation with withdrawal from Kohanaiki production wells. The mauka-to-makai groundwater-flux indicators for KAHO1 to ʻAimakapā, Kalaoa to KAHO3, Kalaoa to KAHO2, and Kalaoa to KAHO1 have significant negative correlations with withdrawal from the high water-level area of the Keauhou aquifer system.
Specific-conductance measurements at KAHO generally have insignificant or hydrologically implausible correlations with the independent variables. Only four of the 52 specific-conductance correlations are significant and plausible, and because these four correlations include three different independent variables, the results are inconclusive.
To account for non-instantaneous hydrologic changes, time lags ranging from one to sixty months were further applied to independent time-series datasets and a second set of correlations between the time-lagged independent variable time series and dependent variable time series were determined. Relative to the non-time-lagged case, time lags applied to independent variable time series generally improved correlations with dependent variables, but correlations were inconsistent because a singular lag time was not associated with the strongest correlation at all KAHO monitoring sites. For example, groundwater levels at ʻAimakapā, KAHO1, and KAHO3 have the strongest correlation with gridded rainfall (developed by the Hawai‘i Climate Data Portal) across the Keauhou aquifer system that is lagged 28 to 30 months. Groundwater levels at KAHO2 also correlate with gridded rainfall across the Keauhou aquifer system that is lagged 28 months, but the strongest correlation was associated with a 4-month lag to gridded rainfall. Groundwater levels at KAHO1, KAHO2, and KAHO3 have the strongest correlation with withdrawal from the Keauhou aquifer system that is lagged 4 to 5 months, whereas groundwater levels at ʻAimakapā correlate best with 28-month lagged withdrawal from the Keauhou aquifer system. In these two cases, at least one monitoring site does not have the strongest correlation at the same time lag as the rest. Inconsistent results were detected for groundwater-flux indicators and specific conductance correlated with time-lagged independent variables, for which different monthly lag times produced the strongest correlations. The lack of a consistent lag time associated with an individual independent variable could indicate that multiple factors are controlling the hydrologic response of the groundwater system as represented by the dependent variables.
The statistical analyses in this report have several limitations, primarily the lack of available hydrologic data. The minimum common temporal resolution of the datasets reduces the quantity of data that can be used in the analyses, therefore limiting the analyses to an average of 123 months of concurrent monthly data pairs. Additionally, this study only includes bivariate analyses, which might not explain the data variance and complexity of the concurrent processes that influence the properties of groundwater in and near KAHO. Future studies could benefit from longer time-series datasets to increase the data quantity, as well as additional chemical tracer datasets to investigate other related water properties.
References Cited
Akoglu, H., 2018, User’s guide to correlation coefficients: Turkish Journal of Emergency Medicine, v. 18, no. 3, p. 91–93, accessed March 28, 2023, at https://doi.org/10.1016/j.tjem.2018.08.001.
Botsch, R.E., 2011, Chapter 12—Significance and measures of association: University of Southern Carolina Aiken web page, accessed October 23, 2023, at http://polisci.usca.edu/apls301/Text/index.html.
Brock, R.E., and Kam, A.K.H., 1997, Biological and water quality characteristics of anchialine resources in Kaloko-Honokohau National Historical Park: Cooperative National Park Resources Studies Unit, University of Hawai‘i at Mānoa, Department of Botany, Technical Report 112, 110 p., accessed March 14, 2023, at http://hdl.handle.net/10125/7396.
Capotondi, A., Wittenberg, A.T., Newman, M., Di Lorenzo, E., Yu, J.Y., Braconnot, P., Cole, J., Dewitte, B., Giese, B., Guilyardi, E., Jin, F.F., Karnauskas, K., Kirtman, B., Lee, T., Schneider, N., Xue, Y., and Yeh, S.-W., 2015, Understanding ENSO diversity: Bulletin of the American Meteorological Society, v. 96, no. 6, p. 921–938, accessed March 20, 2023, at https://doi.org/10.1175/BAMS-D-13-00117.1.
Christensen, J.N., Dafflon, B., Shiel, A.E., Tokunaga, T.K., Wan, J., Faybishenko, B., Dong, W., Williams, K.H., Hobson, C., Brown, S.T., and Hubbard, S.S., 2018, Using strontium isotopes to evaluate the spatial variation of groundwater recharge: Science of The Total Environment, v. 637–638, p. 672–685, accessed November 1, 2023, at https://doi.org/10.1016/j.scitotenv.2018.05.019.
Chu, P.-S., 1995, Hawaii rainfall anomalies and El Niño: Journal of Climate, v. 8, no. 6, p. 1697–1703, accessed March 20, 2023, at https://doi.org/10.1175/1520-0442(1995)008<1697:HRAAEN>2.0.CO;2.
Clague, D.A., Jackson, E.D., and Wright, T.L., 1980, Petrology of Hualalai volcano, Hawaii—Implication for mantle composition: Bulletin of Volcanology, v. 43, no. 4, p. 641–656, accessed March 17, 2023, at https://doi.org/10.1007/BF02600363.
Cook, P.G., Love, A.J., Robinson, N.I., and Simmons, C.T., 2005, Groundwater ages in fractured rock aquifers: Journal of Hydrology, v. 308, p. 284–301, accessed November 1, 2023, at https://doi.org/10.1016/j.jhydrol.2004.11.005.
Cunningham, W.L. and Schalk, C.W., 2011, Groundwater technical procedures of the U.S. Geological Survey: U.S. Geological Survey Techniques and Methods 1–A1, 151 p., accessed November 16, 2023, at https://pubs.usgs.gov/tm/1a1/.
Dulai, H., Kamenik, J., Waters, C.A., Kennedy, J., Babinec, J., Jolly, J., and Williamson, M., 2016, Autonomous long-term gamma-spectrometric monitoring of submarine groundwater discharge trends in Hawaii: Journal of Radioanalytical and Nuclear Chemistry, v. 307, no. 3, p. 1865–1870, accessed April 7, 2023, at https://doi.org/10.1007/s10967-015-4580-9.
Fackrell, J.K., Glenn, C.R., Thomas, D., Whittier, R., Popp, B.N., 2020, Stable isotopes of precipitation and groundwater provide new insight into groundwater recharge and flow in a structurally complex hydrogeologic system—West Hawai‘i, USA: Hydrogeology Journal, v. 28, p. 1191–1207, accessed April 18, 2023, at https://doi.org/10.1007/s10040-020-02143-9.
Flinders, A.F., Ito, G., Garcia, M.O., Sinton, J.M., Kauahikaua, J., and Taylor, B., 2013, Intrusive dike complexes, cumulate cores, and the extrusive growth of Hawaiian volcanoes: Geophysical Research Letters, v. 40, no. 13, p. 3367–3373, accessed April 6, 2023, at https://doi.org/10.1002/grl.50633.
Fukunaga and Associates, Inc., 2017, Hawaii County Water Use and Development Plan update—Keauhou aquifer system: County of Hawai‘i Department of Water Supply, variously paged, accessed April 12, 2023, at https://www.hawaiidws.org/wp-content/uploads/2018/06/Combined-Ph-1-2-Keauhou-20170510_w-Appendix-final.pdf.
Giambelluca, T.W., Shuai, X., Barnes, M.L., Alliss, R.J., Longman, R.J., Miura, T., Chen, Q., Frazier, A.G., Mudd, R.G., Cuo, L., and Businger, A.D., 2014, Evapotranspiration of Hawaiʻi—Final report: Honolulu, University of Hawai‘i at Mānoa Department of Geography, submitted to the U.S. Army Corps of Engineers–Honolulu District, and the Commission on Water Resource Management, State of Hawaiʻi, 168 p., accessed March 20, 2023, at http://evapotranspiration.geography.hawaii.edu/assets/files/PDF/ET%20Project%20Final%20Report.pdf.
Gonschor, L., and Beamer, K., 2014, Toward an inventory of ahupuaʻa in the Hawaiian Kingdom—A survey of nineteenth- and early twentieth-century cartographic and archival records of the Island of Hawaiʻi: The Hawaiian Journal of History, vol. 48, p.58–87, accessed March 31, 2023, at https://evols.library.manoa.hawaii.edu/server/api/core/bitstreams/12aa1365-53ea-4b5d-9bdc-0510d85ec418/content.
H. T. Harvey and Associates, 2015, Anchialine ponds—Anchialine pond shrimps in Hawai‘i’s state wildlife action plan: Honolulu, Hawaiʻi Department of Land and Natural Resources prepared by H. T. Harvey and Associates, Ecological Consultants, accessed March 14, 2023, at https://dlnr.hawaii.gov/wildlife/files/2019/03/SWAP-2015-Anchialine-shrimp-Final.pdf.
Hawai‘i State Department of Health, 2017, 019—Utilities and networks—On-site sewage disposal systems (OSDS), for the islands of Hawaii, Kauai, Maui, and Molokai (2010): State of Hawaiʻi Office of Planning and Sustainable Development database, accessed October 12, 2023, at https://planning.hawaii.gov/gis/download-gis-data-expanded.
Helsel, D.R., Hirsch, R.M., Ryberg, K.R., Archfield, S.A., and Gilroy, E.J., 2020, Statistical methods in water resources: U.S. Geological Survey Techniques and Methods, book 4, chap. A3, 458 p., accessed April 6, 2023, at https://doi.org/10.3133/tm4A3. [Supersedes USGS Techniques of Water-Resources Investigations, book 4, chap. A3, version 1.1.]
Holthuis, L.B., 1973, Caridean shrimps found in land-locked saltwater pools at four Indo-West Pacific localities (Sinai Peninsula, Funafuti Atoll, Maui and Hawaii Islands), with the description of one new genus and four new species: Zoologische Verhandelingen, no. 128, 48 p., 7 pls., accessed March 14, 2023, at https://www.repository.naturalis.nl/document/149069.
Honokōhau Study Advisory Commission, 1974, The spirit of Ka-loko Hono-kō-hau—A proposal for the establishment of a Ka-loko Hono-kō-hau National Cultural Park, Island of Hawai‘i, State of Hawai‘i: National Park Service, 83 p., accessed March 14, 2023, at https://www.nps.gov/kaho/planyourvisit/upload/Spirit-report-reduced-size-pdf.pdf.
Hunt, C.D., Jr., 2014, Baseline water-quality sampling to infer nutrient and contaminant sources at Kaloko-Honokōhau National Historical Park, Island of Hawai‘i, 2009: U.S. Geological Survey Scientific Investigations Report 2014–5158, 52 p., accessed April 6, 2023, at https://doi.org/10.3133/sir20145158.
Hussain, M.M., and Mahmud, I., 2019, pyMannKendall—A python package for non parametric Mann Kendall family of trend tests: Journal of Open Source Software, v. 4, no. 39, article no. 1556, 3 p., accessed April 26, 2023, at https://doi.org/10.21105/joss.01556.
Izuka, S.K., Engott, J.A., Rotzoll, K., Bassiouni, M., Johnson, A.G., Miller, L.D., and Mair, A., 2018, Volcanic aquifers of Hawaiʻi—Hydrogeology, water budgets, and conceptual models (ver. 2.0, March 2018): U.S. Geological Survey Scientific Investigations Report 2015–5164, 158 p., accessed March 15, 2023, at https://doi.org/10.3133/sir20155164.
Izuka, S.K., Perreault, J.A., Jones, T., Kozar, K., 2011, Protocol for long term groundwater-hydrology monitoring in American Memorial Park, Commonwealth of the Northern Mariana Islands, and Kaloko-Honokōhau National Historic Park, Hawai‘i (ver. 1.0, December 2011): National Park Service Natural Resource Report NPS/PACN/NRR—2011/472, Fort Collins, Colorado, 109 p. plus appendix material, accessed November 30, 2023, at https://permanent.fdlp.gov/gpo134488/PACN_Groundwater_protocol.pdf.
Johnson, A.G., Glenn, C.R., Burnett, W.C., Peterson, R.N., and Lucey, P.G., 2008, Aerial infrared imaging reveals large nutrient-rich groundwater inputs to the ocean, Geophysical Research Letters, vol. 35, no. 15, article no. L15606, 6 p., accessed on April 7, 2023, at https://doi.org/10.1029/2008GL034574.
Juvik, S.O., and Juvik, J.O., eds., 1998, Atlas of Hawaiʻi (3d ed.): Honolulu, University of Hawaiʻi Press, 333 p., https://doi.org/10.1515/9780824841829.
Kaloko-Honokōhau National Historical Park, 2021, History and culture: National Park Service website, accessed on March 14, 2023, at https://www.nps.gov/kaho/learn/historyculture/index.htm.
Kauahikaua, J., Duarte, K., and Foster, J., 1998, A preliminary gravity survey of the Kailua-Kona area, Hawai‘i, for delineation of a hydrologic boundary: U.S. Geological Survey Open File Report 98–110, 21 p., accessed March 17, 2023, at https://pubs.usgs.gov/of/1998/0110/report.pdf.
Kauahikaua, J., Hildenbrand, T., and Webring, M., 2000, Deep magmatic structures of Hawaiian volcanoes, imaged by three-dimensional gravity models: Geology, v. 28, no. 10, p. 883–886, accessed March 17, 2023, at https://doi.org/10.1130/0091-7613(2000)28<883:DMSOHV>2.0.CO;2.
Kauahikaua, J., Cashman, K.V., Clague, D.A., Champion, D., and Hagstrum, J.T., 2002, Emplacement of the most recent lava flows on Hualālai Volcano, Hawaiʻi: Bulletin of Volcanology, v. 64, no. 3, p. 229–253, accessed March 17, 2023, at https://doi.org/10.1007/s00445-001-0196-8.
Kendall, C., and Caldwell, E.A., 1998, Fundamentals of isotope geochemistry, chap. 2 of Kendall, C., and McDonnell, J.J., eds., Isotope tracers in catchment hydrology: Amsterdam, Netherlands, Elsevier, Science, p. 51–86, https://doi.org/10.1016/B978-0-444-81546-0.50023-4.
Kendall, M.G., 1938, A new measure of rank correlation: Biometrika, vol. 30, no. 1/2, p. 81–93, accessed June 8, 2023, at https://doi.org/10.2307/2332226.
Knee, K.L., Street, J.H., Grossman, E.E., and Paytan, A., 2008, Submarine ground-water discharge and fate along the coast of Kaloko-Honokōhau National Historial Park, Island of Hawaiʻi—Part 2, spatial and temporal variations in salinity, radium-isotope activity, and nutrient concentrations in coastal waters, December 2003–April 2006: U.S. Geological Survey Scientific Investigations Report 2008–5128, 31 p., accessed March 14, 2023, at https://doi.org/10.3133/sir20085128.
Knight, W.R., 1966, A computer method for calculating Kendall’s tau with ungrouped data: Journal of the American Statistical Association, vol. 61, no. 314, part 1, p. 436–439, accessed March 27, 2023, at https://www.jstor.org/stable/2282833.
Kohanaiki Realty LLC, 2023, Kohanaiki Private Club Community: Kohanaiki Realty LLC website, accessed April 17, 2023, at https://kohanaiki.com.
Langenheim, V.A.M., and Clague, D.A., 1987, The Hawaiian-Emperor volcanic chain—Part II—Stratigraphic framework of volcanic rocks of the Hawaiian Islands, chap. 1 of Decker, R.W., Wright, T.L., and Stauffer, P.H., eds., Volcanism in Hawaii: U.S. Geological Survey Professional Paper 1350, v. 1, issue 7, p. 55–84, accessed March 15, 2023, at https://pubs.usgs.gov/pp/1987/1350/.
Longman, R.J.; Lucas, M.P.; Mclean, J.; Cleveland, S.B.; Kodama, K.; Frazier, A.G.; Kamelamela, K.; Schriber, A.; Dodge, M., II; Jacobs, G.; and Giambelluca, T.W., 2014, The Hawai‘i Climate Data Portal (HCDP): Bulletin of the American Meteorological Society, v. 105, no. 7, p. E1074–E1083, accessed February 27, 2023, at https://doi.org/10.1175/BAMS-D-23-0188.1.
Longman, R.J., Newman, A.J., Giambelluca, T.W., and Lucas, M., 2020, Characterizing the uncertainty and assessing the value of gap-filled daily rainfall data in Hawaii: Journal of Applied Meteorology and Climatology, v. 59, no. 7, p. 1261–1276, accessed February 27, 2023, at https://doi.org/10.1175/JAMC-D-20-0007.1.
Lu, B.-Y., Chu, P.-S., Kim, S.-H., and Karamperidou, C., 2020, Hawaiian regional climate variability during two types of El Niño: Journal of Climate, v. 33, no. 22, p. 9929–9943, accessed March 20, 2023, at https://doi.org/10.1175/JCLI-D-19-0985.1.
Lucas, M.P., Longman, R.J., Giambelluca, T.W., Frazier, A.G., Mclean, J., Cleveland, S.B., Huang, Y.-F., Lee, J., 2022, Optimizing automated kriging to improve spatial interpolation of monthly rainfall over complex terrain: Journal of Hydrometeorology, v. 23, no. 4, p. 561–572, accessed February 27, 2023, at https://doi.org/10.1175/JHM-D-21-0171.1.
Mann, H.B., 1945, Nonparametric tests against trend: Econometrica, v. 13, no. 3, p. 245–259, accessed April 23, 2023, at https://doi.org/10.2307/1907187.
Marrack, L., Beavers, S., and O’Grady, P., 2015, The relative importance of introduced fishes, habitat characteristics, and land use for endemic shrimp occurrence in brackish anchialine pool ecosystems: Hydrobiologia, v. 758, no. 1, p. 107–122, accessed April 6, 2023, at https://doi.org/10.1007/s10750-015-2277-2.
McKenzie, T., Dulai, H., and Fuleky, P., 2021, Traditional and novel time-series approaches reveal submarine groundwater discharge dynamics under baseline and extreme event conditions: Scientific Reports, v. 11, article no. 22570, 14 p., accessed April 4, 2023, at https://doi.org/10.1038/s41598-021-01920-0.
Moore, J.G., and Clague, D.A., 1992, Volcano growth and evolution of the island of Hawaii: Geological Society of America Bulletin, v. 104, no. 11, p. 1471–1484, accessed March 17, 2023, at https://doi.org/10.1130/0016-7606(1992)104<1471:VGAEOT>2.3.CO;2.
Moore, R.B., Clague, D.A., Meyer, R., and Bohrson, W.A., 1987, Hualalai volcano—A preliminary summary of geologic, petrologic, and geophysical data, chap. 20 of Decker, R.W., Wright, T.L., and Stauffer, P.H., eds., Volcanism in Hawaii: U.S. Geological Survey Professional Paper 1350, v. 1, p. 571–585, accessed March 15, 2023, at https://pubs.usgs.gov/pp/1987/1350/.
Mueller-Dombois, D., 2007, The Hawaiian ahupua‘a land use system—Its biological resource zones and the challenge for silvicultural restoration, in Evenhis, N.L., Fitzsimons, J.M., eds., Biology of Hawaiian Streams and Estuaries: Bishop Museum Bulletin in Cultural and Environmental Studies, v. 3, p. 23–33, accessed March 31, 2023, at https://citeseerx.ist.psu.edu/document?repid=rep1&type=pdf&doi=63c010089c5696b4b1dbd987461a1191ffc0ce1b#page=32.
National Oceanic and Atmospheric Administration, 2022a, El Niño Southern Oscillation (ENSO): National Oceanic and Atmospheric Administration web page, accessed October 13, 2022, at https://psl.noaa.gov/enso/.
National Oceanic and Atmospheric Administration, 2022b, Tides and currents, Kawaihae, HI—Station ID 1617433: National Oceanic and Atmospheric Administration web page, accessed December 20, 2022, at http://tidesandcurrents.noaa.gov/.
National Oceanic and Atmospheric Administration, 2023a, Climate Data Online: National Oceanic and Atmospheric Administration web page, accessed October 27, 2021, at https://www.ncei.noaa.gov/cdo-web/.
National Oceanic and Atmospheric Administration, 2023b, Tides and water levels: National Ocean and Atmospheric Administration web page, accessed October 17, 2023, at https://oceanservice.noaa.gov/education/tutorial_tides/tides11_newmeasure.html.
National Park Service [NPS], 2022, NPS continuous water data—AQUARIUS WebPortal (ver. 2022.4): National Park Service web page, accessed November 2, 2022 and January 18, 2023, at https://irma.nps.gov/aqwebportal/.
National Weather Service, 2023, El Niño and its impacts on Hawai‘i: National Weather Service, 2 p., accessed October 30, 2023, at https://www.weather.gov/media/peac/one_pagers/El%20Nino%20Impacts%20on%20Hawaii.pdf.
Neumann, N.M., Plastino, A., Pinto Jr., J.A., Freitas, A.A., 2020, Is p-value 0.05 enough? A study on the statistical evaluation of classifiers: The Knowledge Engineering Review, v. 36, 26 p., accessed March 29, 2023, at https://doi.org/10.1017/S0269888920000417.
Nigro, A., Sappa, G., Barbieri, M., 2017, Strontium isotope as tracers of groundwater contamination: Procedia Earth and Planetary Science, v. 17, p. 352–355, accessed November 1, 2023, at https://doi.org/10.1016/j.proeps.2016.12.089.
Oki, D.S., 2021, Numerical simulation of the effects of groundwater withdrawal and injection of high-salinity water on salinity and groundwater discharge, Kaloko-Honokōhau National Historical Park, Hawaiʻi: U.S. Geological Survey Scientific Investigations Report 2021–5004, 59 p., accessed March 8, 2023, at https://doi.org/10.3133/sir20215004.
Puth, M.-T., Neuhäuser, M., Ruxton, G.D., 2015, Effective use of Spearman’s and Kendall’s correlation coefficients for association between two measured traits: Animal Behaviour, v. 102, p. 77–84, accessed October 23, 2023, at https://doi.org/10.1016/j.anbehav.2015.01.010.
Richardson, C.M., Dulai, H., Popp, B.N., Ruttenberg, K., and Fackrell, J.K., 2017, Submarine groundwater discharge drives biogeochemistry in two Hawaiian reefs: Limnology and Oceanography, v. 62, no. S1, p. S348–S363, accessed April 7, 2023, at https://doi.org/10.1002/lno.10654.
Sanderson, M., ed., 1993, Prevailing trade winds—Weather and climate in Hawai‘i: Honolulu, University of Hawai‘i Press, 126 p., https://doi.org/10.1515/9780824841775.
SciPy, 2015, scipy.stats.kendalltau: SciPy, accessed March 27, 2023, at https://docs.scipy.org/doc/scipy-0.15.1/reference/generated/scipy.stats.kendalltau.html.
Sherrod, D.R., Sinton, J.M., Watkins, S.E., and Brunt, K.M., 2021, Geologic map of the State of Hawaiʻi: U.S. Geological Survey Scientific Investigations Map 3143, pamphlet 72 p., 5 sheets, scales 1:100,000 and 1:250,000, accessed April 6, 2023, at https://doi.org/10.3133/sim3143.
State of Hawaiʻi Department of Land and Natural Resources, 2014, Aquifer sector area and aquifer system area boundaries: Hawaii Statewide GIS Program database, accessed August 6, 2020, at https://geoportal.hawaii.gov/datasets/HiStateGIS::dlnr-aquifers/about.
State of Hawai‘i, 2019, Water resource protection plan, 2019 update: Hawai‘i Commission on Water Resource Management, Hawai‘i Water Plan, 72 p. plus appendixes, accessed June 5, 2023, at https://dlnr.hawaii.gov/cwrm/planning/hiwaterplan/wrpp/.
State of Hawaiʻi, 2022, 2021 The State of Hawaii data book—A statistical abstract: State of Hawaiʻi, Department of Business, Economic Development, and Tourism, accessed April 12, 2023, at https://dbedt.hawaii.gov/economic/databook/db2021.
State of Hawaiʻi, 2023, Visitor Statistics: Department of Business, Economic Development and Tourism, accessed March 14, 2023, at https://dbedt.hawaii.gov/visitor/ni-stats/.
Tillman, F.D., Oki, D.S., and Johnson, A.G., 2014a, Water-chemistry data collected in and near Kaloko-Honokōhau National Historical Park, Hawai‘i, 2012–2014: U.S. Geological Survey Open-File Report 2014–1173, 14 p., accessed March 14, 2023, at https://doi.org/10.3133/ofr20141173.
Tillman, F.D., Oki, D.S., Johnson, A.G., Barber, L.B., and Beisner, K.R., 2014b, Investigation of geochemical indicators to evaluate the connection between inland and coastal groundwater systems near Kaloko-Honokōhau National Historical Park, Hawai‘i: Applied Geochemistry, v. 51, p. 278–292, accessed March 14, 2023, at https://doi.org/10.1016/j.apgeochem.2014.10.003.
U.S. Environmental Protection Agency, 2023, Drinking water regulations and contaminants: U.S. Environmental Protection Agency, accessed October 30, 2023, at https://www.epa.gov/sdwa/drinking-water-regulations-and-contaminants.
U.S. Geological Survey, 2023, USGS water data for the Nation: U.S. Geological Survey National Water Information System database, accessed April 6, 2022, at https://doi.org/10.5066/F7P55KJN.
Wada, C.A., Burnett, K.M., Okuhata, B.K., Delevaux, J.M.S., Dulai, H., El-Kadi, A.I., Gibson, V., Smith, C., and Bremer, L.L., 2021, Identifying wastewater management tradeoffs—Costs, nearshore water quality, and implications for marine coastal ecosystems in Kona, Hawaiʻi: PloS ONE, v. 16, no. 9, article no. e0257125, 26 p., accessed March 22, 2023, at https://doi.org/10.1371/journal.pone.0257125.
Wagner, R.J., Boulger, R.W. Jr., Oblinger, C.J., Smith, B.A., 2006, Guidelines and standard procedures for continuous water-quality monitors—Station operation, record computation, and data reporting: U.S. Geological Survey Techniques and Methods 1–D3, 51 p. + 8 attachments, accessed November 16, 2023, at https://pubs.water.usgs.gov/tm1d3.
Wilson Okamoto Corporation, 2008a, Mapping Kona’s future, Kona Community Development Plan—Volume 1—Final [amended in September 18, 2019]: County of Hawaiʻi Planning Department prepared by Wilson Okamoto Corporation, accessed March 14, 2023, at https://www.planning.hawaiicounty.gov/home/showpublisheddocument/301809/637205633777570000.
Wilson Okamoto Corporation, 2008b, Background Information, in Mapping Kona’s future, Kona Community Development Plan—Volume 2—Final: County of Hawaiʻi Planning Department prepared by Wilson Okamoto Corporation, accessed April 17, 2023, at https://www.planning.hawaiicounty.gov/home/showpublisheddocument/301807/637205633747400000.
Wolter, K., and Timlin, M.S., 2011, El Niño/Southern Oscillation behaviour since 1871 as diagnosed in an extended multivariate ENSO index (MEI.ext) in Aguilar, E., and Collins, W., eds., Achievements in marine climatology: International Journal of Climatology Special Issue, v. 31, no. 7, p. 1074–1087, accessed March 22, 2023, at https://doi.org/10.1002/joc.2336.
Yamasaki, S., Kani, T., Hanan, B.B., and Tagami, T., 2009, Isotopic geochemistry of Hualalai shield-stage tholeiitic basalts from submarine North Kona region, Hawaii: Journal of Volcanology and Geothermal Research, v. 185, no. 3, p. 223–230, accessed March 17, 2023, at https://doi.org/10.1016/j.jvolgeores.2009.06.006.
Zhang, T., Hoell, A., Perwitz, J., Eischeid, J., Murray, D., Hoerling, M., and Hamill, T.M., 2019, Towards probabilistic multivariate ENSO monitoring: Geophysical Research Letters, v. 46, no. 17–18, p. 10532–10540, accessed March 22, 2023, at https://doi.org/10.1029/2019GL083946.
Appendix 1. Methods to Remove Sea Level from Groundwater Levels
-
Step 0: Monthly mean sea-level and monthly mean groundwater-level time series are required.
-
Step 1: Using the monthly mean groundwater-level time series for a well, calculate the average groundwater level for the period of record.
-
Step 2: Calculate the average sea level for the same period of record as the monthly mean groundwater-level time series (using only the monthly mean sea-level values concurrent with the monthly mean groundwater levels).
-
Step 3: Calculate the zero-mean sea level time series by subtracting the average sea level (from Step 2) from each monthly sea-level value in the concurrent sea level time series.
-
Step 4: Calculate the modified sea level by multiplying the series calculated in Step 3 by an initial, arbitrary multiplier (X) and adding the average groundwater level (from Step 1) to each data value.
-
Step 5: Calculate the squared differences between the modified sea level (from Step 4) and the concurrent groundwater levels.
-
Step 6: Sum the squared differences from Step 5.
-
Step 7: Minimize the sum of the squared differences (from Step 6) by varying the value of the multiplier X (from Step 4). This can be done using the Solver function in Microsoft Excel.
-
Step 8: Calculate the residual groundwater level by subtracting the modified sea-level time series from the monthly mean groundwater-level time series.
Appendix 2. Correlations between water temperature and independent variable time series
Table 2.1.
Kendall’s tau correlation coefficients for relations between water temperature and selected independent variables, Keauhou aquifer system, Island of Hawaiʻi, during 2008–21.[Number of monthly data pairs used for calculation (that is, the sample size) displayed in parentheses; ENSO, El Niño–Southern Oscillation; CDO, Climate Data Online; HCDP, Hawaiʻi Climate Data Portal; WWTP, wastewater treatment plant; ahupuaʻa area, combined area consisting of the Kohanaiki, Kaloko, Honokōhau, and Kealakehe land divisions]
Appendix 3. Correlations between the groundwater-flux indicator and independent variable time series
Table 3.1.
Kendall’s tau correlation coefficients for relations between groundwater-flux indicator and complete list of independent variables, Keauhou aquifer system, Island of Hawaiʻi, during 2008–21.[Number of monthly data pairs used for calculation (that is, the sample size) displayed in parentheses; Mauka-to-makai, mountain-to-ocean; ENSO, El Niño–Southern Oscillation; CDO, Climate Data Online; HCDP, Hawaiʻi Climate Data Portal; ahupuaʻa area, combined area consisting of the Kohanaiki, Kaloko, Honokōhau, and Kealakehe land divisions; WWTP, wastewater treatment plant]
Appendix 4. Month-to-month serial correlations of groundwater levels
Table 4.1.
Kendall’s tau correlation coefficients for relations between month-to-month groundwater level and selected independent variables, Keauhou aquifer system, Island of Hawaiʻi, during 2008–21.[Number of monthly data pairs used for calculation (that is, the sample size) displayed in parentheses; ENSO, El Niño–Southern Oscillation; CDO, Climate Data Online; HCDP, Hawaiʻi Climate Data Portal; WWTP, wastewater treatment plant; ahupuaʻa area, combined area consisting of the Kohanaiki, Kaloko, Honokōhau, and Kealakehe land divisions]
Conversion Factors
U.S. customary units to International System of Units
Temperature in degrees Celsius (°C) may be converted to degrees Fahrenheit (°F) as follows: °F = (1.8 × °C) + 32.
Temperature in degrees Fahrenheit (°F) may be converted to degrees Celsius (°C) as follows: °C = (°F – 32) / 1.8.
Datums
Vertical coordinate information is referenced to local mean sea level.
Horizontal coordinate information is referenced to the North American Datum of 1983 (NAD 83).
Altitude, as used in this report, refers to distance above the vertical datum.
Supplemental Information
Specific conductance is given in microsiemens per centimeter at 25 degrees Celsius (µS/cm at 25 °C).
Concentrations of chemical constituents in water are given in either milligrams per liter (mg/L) or micrograms per liter (µg/L).
Abbreviations
CDO
Climate Data Online
CWRM
Hawai‘i Commission on Water Resource Management
ENSO
El Niño–Southern Oscillation
HCDP
Hawai‘i Climate Data Portal
KAHO
Kaloko-Honokōhau National Historical Park
MEI
Multivariate El Niño–Southern Oscillation Index
NOAA
National Oceanic and Atmospheric Administration
NPS
National Park Service
USGS
U.S. Geological Survey
WWTP
Wastewater Treatment Plant
Disclaimers
Any use of trade, firm, or product names is for descriptive purposes only and does not imply endorsement by the U.S. Government.
Although this information product, for the most part, is in the public domain, it also may contain copyrighted materials as noted in the text. Permission to reproduce copyrighted items must be secured from the copyright owner.
Suggested Citation
Okuhata, B.K., and Oki, D.S., 2024, Correlation analysis of groundwater and hydrologic data, Kaloko-Honokōhau National Historical Park, Hawai‘i: U.S. Geological Survey Scientific Investigations Report 2024–5084, 38 p., https://doi.org/10.3133/sir20245084.
ISSN: 2328-0328 (online)
Study Area
| Publication type | Report |
|---|---|
| Publication Subtype | USGS Numbered Series |
| Title | Correlation analysis of groundwater and hydrologic data, Kaloko-Honokōhau National Historical Park, Hawai‘i |
| Series title | Scientific Investigations Report |
| Series number | 2024-5084 |
| DOI | 10.3133/sir20245084 |
| Publication Date | October 07, 2024 |
| Year Published | 2024 |
| Language | English |
| Publisher | U.S. Geological Survey |
| Publisher location | Reston, VA |
| Contributing office(s) | Pacific Islands Water Science Center |
| Description | ix, 38 p. |
| Country | United States |
| State | Hawaii |
| Other Geospatial | Kaloko-Honokōhau National Historical Park |
| Online Only (Y/N) | Y |