

Suspended Sediment and Trace Element Transport in the Big River Downstream from the Old Lead Belt in Southeastern Missouri, 2018–21
Links
- Document: Report (6.4 MB pdf) , HTML , XML
- Appendix: Appendixes 1–2 - Model Archives Summaries for Regression Models
- Dataset: UGSS National Water Information System database - USGS water data for the Nation
- Data Release: USGS data release - Geochemical analyses of water, mine tailings, fluvial suspended sediments, fluvial bed sediments, and fluvial flood deposit sediments from the Big River and Meramec River drainage basins, Missouri
- NGMDB Index Page: National Geologic Map Database Index Page (html)
- Download citation as: RIS | Dublin Core
Acknowledgments
The authors would like to thank the U.S. Environmental Protection Agency for providing technical guidance.
The authors also would like to acknowledge the staff from the U.S. Geological Survey Central Midwest Water Science Center who supported the project by assisting with data collection, administration, and technical reviews.
Abstract
The Big River in southeast Missouri drains the Old Lead Belt, an area of major lead mining from the 1860s until 1972 where more than 8.5 million tons of lead were mined. After active mining ceased, the effects of mining activities persisted in the Big River system because of large mine waste pile erosion, and floodplain sediment and streambank contamination along several tributaries and the main stem of the Big River. Lead-contaminated streambed and floodplain sediments extend more than 90 miles from the Old Lead Belt to the confluence of the Big River with the Meramec River. The waste piles and mine-waste contaminated streambed and floodplain sediments have been sources of high concentrations of several trace elements, primarily cadmium, lead, and zinc. The U.S. Environmental Protection Agency Region 7 has made several efforts to prevent further erosion of contaminated sediments into the Big River including the capping of major mine waste piles, reclaiming sediment deposits along the floodplains, and monitoring soil conditions of croplands and residential properties.
A cooperative effort began in 2011 between the U.S. Geological Survey and the U.S. Environmental Protection Agency Region 7 to characterize suspended sediment quantity and quality in the Big River downstream from the Old Lead Belt as reclamation activities in the drainage basin progressed. The study was completed in two phases, and each phase included continuous stage, turbidity, and water temperature monitoring at the Big River below Bonne Terre, Missouri, streamgage and sampling station. Periodic suspended sediment samples also were collected manually (discrete samples) during base flow and selected stormflow events. Continuous streamflow, turbidity, and discrete suspended sediment data were used to develop regression models to compute daily suspended sediment concentrations and loads. During both phases, the discrete stormflow event samples were also evaluated to determine particle size distribution and concentrations of select trace elements. Phase one was completed from October 2011 through September 2013, and phase two, which is the primary focus of this report, was completed from October 2018 through September 2021. Phase two also included time-integrated suspended sediment samples collected using passive samplers. Discrete samples (collected during stormflow events) and passive samples were analyzed for concentrations of barium, cadmium, lead, and zinc in two sediment size fractions (when possible) to estimate trace element loads. Suspended sediment concentrations and loads and select trace element concentration results computed during phase one were compared to those computed during phase two to identify trends in the Big River Basin during the full study period.
The concentrations of cadmium, lead, and zinc in nearly all discrete stormflow event suspended sediment samples and passive suspended sediment samples exceeded the threshold effect concentrations and the probable effect concentrations, which are two sediment quality guidelines. Most samples also exceeded the toxic effect threshold, the level at which sediment is considered to be heavily contaminated and problematic for sediment-dwelling organisms. Bulk cadmium concentrations (median of 7.90 milligrams per kilogram [mg/kg]) exceeded the toxic effect threshold (3.0 mg/kg) in 17 discrete stormflow event samples, and bulk lead concentrations (median of 1,070 mg/kg) exceeded the toxic effect threshold (170 mg/kg) in all 18 discrete stormflow event samples. Bulk zinc concentrations (median of 500 mg/kg) exceeded the toxic effect threshold (540 mg/kg) in eight discrete stormflow event samples. Bulk concentrations of these trace elements in passive suspended sediment samples were slightly greater, with concentrations of cadmium (median of 14.0 mg/kg) and lead (median of 1,860 mg/kg) exceeding the toxic effect threshold in all 18 samples. Bulk concentrations of zinc (median of 733 mg/kg) exceeded the toxic effect threshold in 15 passive samples. Compared to phase one (water years 2012–13), phase two (water years 2019–21) concentrations of lead and cadmium in the fine fraction of discrete suspended sediment samples collected at Big River below Bonne Terre were statistically similar; concentrations of barium and zinc were statistically smaller in samples collected during phase two (water years 2018–21).
Sediment quality data from passive samples and daily mean suspended sediment loads from the regression model were used to calculate annual loads of barium, cadmium, lead, and zinc at the Bonne Terre streamgage. Water year 2019 had the largest loads of barium, cadmium, lead, and zinc (58.6, 1.43, 194, and 76.5 tons, respectively). The total loads of barium, cadmium, lead, and zinc for phase two (water years 2019–21) were 149, 4.00, 520, and 213 tons, respectively. Less than 5 percent of the total lead load calculated for the study period was transported when daily mean streamflow was less than 455 cubic feet per second, which is the approximate flow at which the passive samplers were inundated and began sampling. This highlights that most of the lead load is transported during stormflow events and the effectiveness of using passive samplers for ongoing monitoring of the Big River.
Annual suspended sediment loads at the Bonne Terre streamgage computed using the regression model were 113,000 tons in water year 2019, 83,400 tons in water year 2020, and 96,500 tons in water year 2021. The event-based suspended sediment loads for the eight sampled stormflow events ranged from 45.3 to 32,500 tons. Although only a portion of all stormflow events during phase two were sampled, the loads accounted for during these eight stormflow events represented approximately 30.9 percent of the total suspended sediment load calculated for the study period, confirming that a large part of suspended sediments continue to be transported in the Big River during stormflow events. Event-based loads of barium, cadmium, lead, and zinc were greatest during the stormflow events sampled in January 2020 (event 4) and March 2021 (event 8). Event-based loads calculated for event 4 for barium, cadmium, lead, and zinc were 17.1, 0.206, 27.2, and 14.5 tons, respectively. During event 8, an estimated 15.6 tons of barium, 0.239 tons of cadmium, 34.0 tons of lead, and 13.6 tons of zinc were transported in suspended sediments. The continued high concentrations of lead in suspended sediments in the Big River, despite reclamation activities, is likely because of the continual transport from streambed and stream banks of lead-enriched sediment, which remain in the system from historical mining activities.
Introduction
The Southeast Missouri Mining District contains part of the world’s largest known lead deposits, and organized lead mining has taken place in the region since the mid-1860s (Pavlowsky and others, 2010). Initial mining in the region was mostly small, scattered surface excavations that began in the 1700s. In the 1860s, mining practices expanded substantially to large scale, multilevel subterranean mining when St. Joseph Lead Company purchased 964 acres of land near Bonne Terre, Missouri, in what would become known as the Old Lead Belt (OLB) subdistrict (fig. 1). At one time, the company operated the largest lead mill in the world (Federal Mill No. 3), and by the early 1900s, 15 companies were mining within the OLB (Missouri Department of Natural Resources, 2020, 2021). From 1869 through 1972, the OLB was the global leader in lead production (Pavlowsky and others, 2010). More than 8.5 million tons of lead were mined within the OLB before the last operation closed in 1972 (Missouri Department of Natural Resources, 2020, 2021).
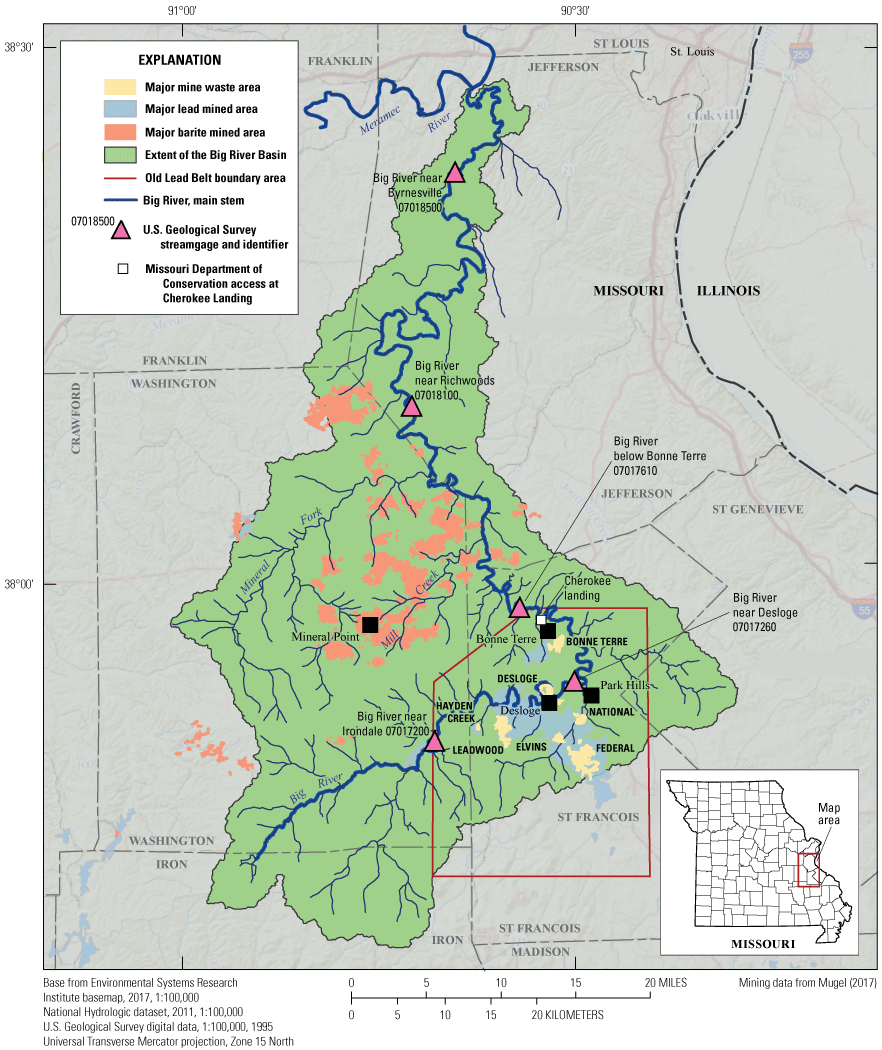
Study site and location of the Big River Basin.
More than 200 years of intense mining in the OLB and vicinity resulted in the disposal of mine waste that has been subject to wind and water erosion. Some mine waste was mechanically transported around the region and used in construction, such as in haul roads and rail spurs (U.S. Environmental Protection Agency [EPA], 2021). Early mining and mill methods were small operations that ground the ore into sand- to gravel-sized fragments, and the denser lead ore was gravity separated from the waste rock using large gigs or shaker tables (Mugel, 2017). Wastes from these early years of mining were called chat, and numerous small operations were scattered across the region. After the discovery of rich subsurface deposits in the 1860s near the towns now known as Bonne Terre and Park Hills, the scale of the mining and milling operations increased substantially. Ore was ground into smaller sizes, and larger gravity operations were used to concentrate the lead ore. The volume of mine waste increased as mining activities intensified, resulting in large waste piles as much as several hundred feet tall. Beginning in the early 1900s, the floatation process was introduced, which greatly improved the recovery of lead. Floatation required the grinding or milling of ore to fine powder (silt to fine sand). Waste from the floatation process, called tailings, was slurred into large impoundments, where the water eventually decanted. The tailings ponds were either constructed by building a dam across a tributary using coarser chat or building large berms along streams to hold the tailings (Pavlowsky and others, 2010).
Seven of the major mine waste areas within the OLB are located along the Big River or its tributaries and cover more than 2,800 acres (fig. 1) with an estimated volume of more than 39 million cubic yards (yd3; Mosby and Weber, 2009). The proximity of these waste areas to streams resulted in a continuous source of contamination to the drainage basin since the mid-1860s. Contaminants of interest include the trace elements cadmium, lead, and zinc. Lead is of greatest concern because it was the primary mined metal and is toxic with negative physical and neurological effects for humans, especially young children (EPA, 2022). Sediments from the mine waste areas and surrounding contaminated soils transported as wind and storm runoff resulted in these toxic metals entering the Big River and its tributaries. Because of a period of heavy rainfall in 1977, about 38,000 cubic meters (m3) of mine waste from the Desloge tailings pile slumped and was released into the Big River (EPA, 2021; fig. 1).
Several studies have investigated the extent of trace element contamination in the region since the 1970s, and metal-contaminated streambed and floodplain sediments have been documented along the approximately 90 miles (mi) of the Big River downstream from the OLB to the confluence with the Meramec River. A study by the U.S. Geological Survey (USGS) and the Missouri Department of Natural Resources included sampling of the Meramec River upstream and downstream from the Big River confluence. Samples collected downstream from the Big River-Meramec River confluence contained higher concentrations of lead than samples collected upstream from the confluence, indicating that contaminated sediments from the Big River were also moving into the Meramec River (Barr, 2016). Lead concentrations more than 1,000 milligrams per kilogram (mg/kg) were present in floodplain sediment along the lower Meramec River, and concentrations as large as 334 mg/kg have been recorded in recent floods (Pearson and Hanes, 2016). A study of channel sediment and floodplain deposits along 106 river miles of the Big River (from Leadwood, Mo., to the confluence with the Meramec River) concluded that approximately 3,700,000 m3 of contaminated sediment was stored in the channel and 86,800,000 m3 was stored in the floodplain. Floodplain sediments were contaminated above the residential soil threshold limits for lead (400 parts per million [ppm]) along the entire stretch of the Big River study area to a depth of 1–4 meters (m) or more (Pavlowsky and others, 2010).
The EPA and responsible parties have completed remedial actions at six of the eight major mine waste areas in the OLB. Remediation included reducing and stabilizing slopes, capping waste piles, and revegetating the areas to prevent further release of mine waste. Mine waste area remediation projects completed to date include: the Bonne Terre (2007); the Elvins pile (2009); the Leadwood pile (2010); the National pile (2012); and the Federal Pile (2021; EPA, 2021). The former Desloge pile (site of the 1977 release) was stabilized in 2000 and currently (2023) is being used as an onsite soil repository for lead-contaminated soils, as is the eastern area of the former Bonne Terre pile (EPA, 2023). All six of these remediation projects have taken place at mine waste areas next to the Big River or its tributaries. The EPA continues to test and cleanup lead-contaminated surficial soils at thousands of residential yards in the region. The EPA is assessing remedial actions for the contaminated streambed and floodplain sediment. Remedial actions for mine wastes used in construction, such as in railroad lines and spurs in the region, also are being assessed (EPA, 2021).
Both phases of this study sought to quantify suspended sediment and trace element contamination downstream from the OLB. During phase one (water years 2012 and 2013 [October 1, 2011, through September 30, 2013]), suspended sediment concentrations (SSCs) were measured and suspended sediment loads (SSLs) were computed at two sampling sites on the Big River. During stormflow events, select trace element concentrations also were measured and loads were calculated (Barr, 2016). Phase one sought to understand sediment transport processes and develop a baseline for suspended sediment and trace element loads as the six major mine waste areas were remediated. During phase one (water years 2012–13), nearly 30 percent of the total SSL at the downstream and upstream sites was accounted for in the six sampled stormflow events indicating that rain events transported a large portion of the sediment in the Big River. Additionally, trace element yields were higher at the upstream site indicating that contaminated sediments were more readily available in that area of the Big River drainage basin (Barr, 2016). The phase one study ended as the major mine waste pile remediation was being completed and thus was unable to quantify the effects of mine-waste pile remedial efforts. This, in addition to ongoing remedial activities in the drainage basin and legacy mine-waste contaminated streambed and floodplain sediments, necessitated continued data collection at the Big River below Bonne Terre sampling site to better quantify the effect of remediation on suspended sediment quantity and quality.
Using methods similar to those used by Barr (2016), the purpose of phase two was to continue monitoring the quantity and quality of suspended sediments transported in the Big River downstream from the OLB. The USGS, in cooperation with the EPA Region 7, completed this second phase of the intensive effort (water years 2019–21) to assess suspended sediment and trace element transport as remedial efforts continued; phase two used one station from the phase one study. Regression models were used to compute daily SSC and SSL for each study period. Discrete suspended sediment samples were obtained during base-flow and stormflow conditions. Suspended sediment quality was assessed by analyzing samples obtained during stormflow events for select trace element concentrations. Loads and yields of sediment and select trace elements also were calculated for the sampled stormflow events. Phase two incorporated passive samplers in the collection of sediment, from which samples were analyzed for trace element concentrations and were used to calculate loads of barium, cadmium, lead, and zinc.
Purpose and Scope
The purpose of this study was to monitor the quantity and quality of suspended sediments transported in the Big River downstream from the OLB as reclamation activities in the drainage basin progressed. Suspended sediment and trace element data were collected during water years 2019–21 (October 1, 2018, through September 30, 2021; phase two) downstream from the OLB at the Big River below Bonne Terre, Missouri (USGS site number 07017610; hereinafter referred to as the study site; table 1). This report describes the methods and techniques used in the collection and analysis of water quality samples during water years 2019–21 and presents the results and interpretations of that data. Comparisons of these data to results from phase one (water years 2012–13; Barr, 2016) also are presented to determine whether trace element concentrations have changed significantly in the Big River drainage basin in the OLB after major mine waste area remediation efforts.
Description of Study Area
The Big River drainage basin drains 955 square miles (mi2) of southeast Missouri (fig. 1) and is a tributary to the Meramec River. Land use within the Big River drainage basin is primarily forest and pasture, with some agriculture and urban land uses (Missouri Department of Conservation, 1997). The Big River headwaters are northeast of the city of Ironton, Iron County (not shown), where the river is as narrow as 50 feet (ft). The rugged topography and steep drainage divides create a streambed composed of mainly cobble, gravel, and sand. As the river meanders north towards the confluence with the Meramec River in Jefferson County, it widens to nearly 100 ft in some locations. The downstream topography transitions to floodplains, and the streambed changes to sand and silt (Barr, 2016).
The study site was chosen for consistency with phase one (Barr, 2016). The site is approximately 3 mi north of the city of Bonne Terre and is at the bridge crossing at County Highway E (fig. 1, Highway E not shown; table 1). The orifice line for the pressure transducer and continuous water-quality monitor is housed underneath the bridge and on the left riverbank (facing downstream). The site drains 409 mi2, and the river channel is 2–3 ft deep and as much as 60 ft wide during base-flow conditions. The riverbed is composed of fine sands, gravels, cobbles, and some boulders (Barr, 2016).
Table 1.
Location information for the study site at the Big River below Bonne Terre, Missouri.[Data are from the U.S. Geological Survey National Water Information System database (U.S. Geological Survey, 2023). Coordinates are given degrees, minutes, seconds. USGS, U.S. Geological Survey; mi2, square mile]
| USGS site number (fig. 1) | Station name | Latitude | Longitude | Drainage area (mi2) | County | Period of streamflow record used in this study |
|---|---|---|---|---|---|---|
| 07017610 | Big River below Bonne Terre, Missouri | 37°57′54.9″ | 90°34′28.2″ | 409 | St. Francois | October 2011–September 2021 |
Methods
To quantify the transport of sediment and select trace elements in the Big River, continuous stage and water-quality data and discrete and passive suspended sediment samples were collected at the study site. Field, laboratory, quality assurance, quality control, and data analysis methods are described.
Continuous Stage and Water-Quality Data Collection
During the entire study period (water years 2012–21 [October 1, 2011, through September 30, 2021]), the sampling site was equipped with a streamgaging station to measure streamflow and continuous water quality. Measurements of stage, temperature, and turbidity were recorded every 15 minutes although some periods are missing because of intermittent funding, equipment failures, low-flow conditions, biofouling, and (or) data corrections that exceeded calibration criteria. Continuous data collected during this study are available through the USGS National Water Information System (NWIS; USGS, 2023) database. Streamflow measurements were obtained every 4–6 weeks and during selected stormflow events using an acoustic Doppler current profiler. This information was used to maintain the stage-discharge relation following standard USGS methods and techniques (Rantz and others, 1982; Oberg and others, 2005; Turnipseed and Sauer, 2010; Mueller and others, 2013). Water temperature and turbidity were measured in phase one using a Yellow Springs Instruments (YSI) 6-series sonde and then upgraded in 2015 to an EXO2 sonde, which includes a central wiper. The temperature probe measures degrees Celsius (°C) and is calibrated using a three-point calibration with a National Institute of Standards and Technology thermometer. The turbidity probe measures formazin nephelometric units (FNU) and is calibrated using a three-point calibration and YSI’s calibration standards (Wagner and others, 2006). The YSI EXO2 was serviced approximately every 8–12 weeks, which included cleaning the sonde and calibration checks on the turbidity sensor. The temperature sensor calibration was checked approximately every 12 months.
The streamgage was equipped with a data collection platform that stored data from the pressure transducer that measured stage and the sonde that measured water temperature and turbidity. Data were transmitted hourly via satellite telemetry. The sonde was deployed using a polyvinyl chloride (PVC) pipe with several 1-inch (in.) holes drilled in it. Water from the river was able to flow through the pipe and around the sensors reducing issues associated with measuring stagnant water in the pipe.
Discrete Suspended Sediment Sample Collection
Traditional cross-sectional sampling methods were used to collect suspended sediment samples during base-flow and high flow conditions. During base-flow conditions, suspended sediment samples were collected approximately 40 ft upstream from the bridge by wading the stream and using the equal-width increment (EWI) method (USGS, 2006). The EWI method involves sampling at a minimum of 10 equally spaced locations (verticals) across the full width of the stream channel. A US DH-81, a depth-integrated and isokinetic sampler (a sampler in which stream water approaching and entering the sampling nozzle have the same velocity) was used. The US DH–81 consists of a 1-liter (L) sampling bottle with a 1/4-in. Teflon or polypropylene nozzle mounted on the end of a sampling rod. Samples were collected at each vertical with a consistent transit rate (vertical speed). The samples at each vertical were composited into one or more sampling bottles. If the minimum mean stream velocity was less than 1.5 feet per second (ft/s), the sample was collected using grab sample methodology because of the lack of isokinetic conditions (USGS, 2006). The equipment used are described in Wilde and others (2014). Streamflow measurements were collected in the same location as the sediment sample.
During stormflow events, measurements and samples were collected from the downstream side of the bridge deck on Highway E using the same EWI method. Samples were collected across the hydrologic event, targeting the rising limb, peak, and falling limb when possible. Streamflow was measured nearest to the peak as possible. Depending on stream conditions, either a US DH–95 or US DH–2 sampler was used. USGS personnel operated the sampler, which was attached to a reel and cable mechanism mounted on a vehicle. The sampler was raised and lowered at a constant speed according to the transit rate, which is calculated from the maximum stream velocity and depth. It should be noted that an unsampled zone exists when using these samplers (4 in. for the DH–81 and DH–2 and 4.8 in. for the DH–95; Davis, 2005; Wilde and others, 2014). The unsampled zone includes the area closest to the streambed that cannot be reached by the nozzle; this area can transport a higher concentration of coarse sediment than the rest of the water column. This part of unsampled suspended sediment may or may not account for a substantial portion of the total suspended sediment and is dependent upon stream velocity, depth, and turbulence (Edwards and Glysson, 1999).
Passive Suspended Sediment Sample Collection
Suspended sediment samples were collected passively during the duration of high-flow events using Walling tube samplers (Phillips and others, 2000). Passive sampling is ideal in situations when sampling teams cannot be onsite to collect suspended sediment. In some instances, smaller hydrologic events can happen quickly and without enough time to prepare for physical sampling. A Walling tube sampler can be set at a fixed height, and when inundated by the stream during an event, sediments are trapped inside as the velocity slows when water moves through the tube. Placement of the samplers at or near a streamgage allows for sampling a part of a hydrologic event. Samples collected by passive samplers are considered a general representation of a hydrologic event.
The sampling tubes were constructed from 1 m in length schedule 40 PVC well casings with an inner diameter of 98 millimeters (mm). A conical head is installed on the receiving end of the tube (facing upstream) that threads into the main tube body. A hole was drilled into the end of the conical head and threaded to accept a 1/4-in. USGS D–96 or D–74 sampler nozzle. A 4-in. PVC cleanout with a threaded plug was glued to the other end of the tube, and a 1/4-in. diameter hole was drilled in the center of the plug. Two samplers were secured to metal posts on the left stream bank (nozzles facing upstream) several feet above base-flow stage such that the lower sampler became inundated at a stage of about 4.82 ft (streamflow of approximately 445 cubic feet per second [ft3/s], per rating curve [relation between river stage flow] current for the deployment period) and the upper sampler was inundated at a stage of approximately 5.52 ft (streamflow of approximately 715 ft3/s).
If an event happened that would have inundated the samplers, a service visit was done to collect any suspended sediment trapped in the tube during the event(s). During servicing, the nozzle was removed and both openings on the sampler tubes were temporarily plugged before removing the samplers from the mounting posts and rocking them slowly to resuspend sediment within the tube. The tube was then held vertically, and the sediment slurry allowed to drain out the conical end into a clean 1- or 2-gallon plastic container. The plug on the rear of the tube was removed, and the inside of the tube was rinsed with 200–300 milliliters (mL) of native stream water using a small plastic 1-L sprayer. Sediment from the two samplers was composited before submission to the Central Midwest Water Science Center (CMWSC) Sediment Laboratory in Rolla, Mo., for further processing.
Suspended Sediment Laboratory Methods
All suspended sediment samples collected during this study were sent to the USGS CMWSC Sediment Laboratory in Rolla, Mo., for particle-size analyses, and all results are available via NWIS (USGS, 2023). Routine discrete samples were analyzed only for SSC using a filtration method (Guy, 1969). Discrete and passive stormflow event samples were analyzed for SSC and particle-size distribution of sands (2–0.063 mm) and fines (less than [<] 0.063 mm). All suspended sediment samples received at the laboratory were allowed to settle before excess water was decanted. Discrete stormflow event samples were analyzed for particle-size distribution using the wet-sieve method (Guy, 1969). Nylon sieves were used to reduce trace element contamination that could be introduced from the traditional brass sieves. Each portion was placed into separate glass dishes to dry at 80 °C and then for an hour at 103 °C (Guy, 1969). Passive sample sediments were analyzed for particle-size distribution by the dry-sieve method (Guy, 1969) also using nylon sieves after being air-dried and disaggregated.
Dried parts of sands and fines from discrete and passive samples were retained after analysis to be used for trace element analyses. The dried fractions of sediments from the passive samplers were split into two equal parts using a stainless-steel universal sample splitter. One portion was submitted for trace element analysis to the USGS Mineral Research Laboratory (MRL) in Denver, Colorado, and the other portion was retained and archived. Any discrete or passive stormflow event sample that had a mass of sands or fines larger than 0.5 gram was sent for trace element analysis on the individual fraction. If any dried size fraction did not meet the minimum mass requirement for trace element analysis, the two fractions were recombined and submitted as a bulk sample (sediment <2 mm in size). Samples were shipped in sealed plastic bags. Submitted samples were analyzed for 49 major and trace elements by inductively coupled plasma mass-spectrometry (Taggart, 2002). The results for the trace elements barium, cadmium, lead, and zinc are presented in this report. Results for the additional major and trace elements are available from the NWIS database (USGS, 2023) or Markland and others (2024).
Quality Assurance and Quality Control
Quality assurance (QA) and quality control protocols were followed during this study to ensure data met USGS quality standards. A QA plan, which is summarized here, was created to document techniques and methods. The study site was previously selected by Barr (2016) to reduce fouling, presence of low-flow conditions, and damage from flooding or vandalism. Data transmissions to NWIS were reviewed daily for erroneous data. All site visit and sampling information, including a description of tasks completed and additional notes, was documented and archived. Laboratory analysis request forms were used for the sediment laboratory and MRL for tracking and documentation purposes.
Streamflow and stage data from the streamgage were used to monitor and predict the need for stormflow event sampling and servicing of the continuous water-quality equipment. Calibration and maintenance of equipment was completed following USGS methods described by Wagner and others (2006). During each visit, equipment was cleaned and checked for damage and calibration drift. Corrections for calibration drift, fouling corrections, or both were applied to data as needed. If corrections exceeded USGS criteria, the erroneous data were removed from the record (Wagner and others, 2006).
Precautions were taken to minimize contamination of samples from sampling equipment, vehicles, and surroundings. The “clean hands/dirty hands” sampling technique was followed during sediment sampling (USGS, 2006). Sample containers were kept sealed and protected in a large plastic bag to prevent contamination by airborne debris introduced by wind, vehicle traffic, sampling equipment, bridge railings, and precipitation.
To identify and quantify any bias and variability associated with the sampling and processing techniques, quality control samples were collected in the form of field replicates, laboratory replicates, equipment blanks, and analysis of standard reference samples of known chemistry. Field replicate samples for the passive samples were collected by treating each Walling tube as a separate sample for selected periods, with one sample assigned as the regular sample and the other as the field replicate. Field blanks were not collected; however, pure silica and silica powder were used to prepare a source blank “sediment,” which was submitted to the USGS CMWSC Sediment Laboratory in Rolla, Mo., and to the MRL. In the sediment laboratory, the silica blanks were dried, sieved, and split in an identical manner to the environmental samples. A sample of the pure silica powder also was submitted as a source blank. Splits from the silica blanks were submitted to the MRL for chemical analysis. All USGS sediment laboratories undergo biannual QA tests to maintain consistency for all laboratories. Results from the QA tests are available from the USGS Branch of Quality Systems at https://bqs.usgs.gov/SLQA/. The MRL splits 10 percent of samples into split replicates and submits samples of known composition with each batch of samples submitted to the contract laboratory. Additional information on the methods used at the MRL can be found at https://minerals.cr.usgs.gov/. The reporting limits for laboratories used during the study are provided in table 2.
Table 2.
Reporting limits of laboratory analyses for suspended sediment samples analyzed by the U.S. Geological Survey Mineral Research Laboratory contracted laboratory.[ppm, part per million; mg/L, milligram per liter; USGS SDMO, U.S. Geological Survey Missouri Sediment Laboratory, mm, millimeter; %, percent]
| Constituent | Reporting limit | Analyzing laboratory | Analytical reference |
|---|---|---|---|
| Barium (Ba) | 1 ppm | aAGAT Labs | Taggart, 2002 |
| Cadmium (Cd) | 0.02 ppm | aAGAT Labs | Taggart, 2002 |
| Lead (Pb) | 0.1 ppm | aAGAT Labs | Taggart, 2002 |
| Zinc (Zn) | 0.5 ppm | aAGAT Labs | Taggart, 2002 |
| Suspended sediment concentration (SSC) | 0.5 mg/L | USGS SDMO | Guy, 1969 |
| Suspended sediment, percent finer than 0.063 mm | 0% | USGS SDMO | Guy, 1969 |
Each batch of samples analyzed at the MRL contract laboratory included the analysis of a standard reference sample with preferred/expected concentrations for barium, cadmium, lead, and zinc. The goal of the MRL program is for values in the reference samples to be reported within 15 percent of the preferred/expected value (recovery between 85 and 115 percent). The mean recoveries for the four trace elements ranged from 93.0 to 106 percent (table 3). It was noted that the analytical batch associated with most of the analyzed passive samples had reported maximum recoveries of barium and lead in the reference samples that were 117 and 129 percent of the expected/preferred values, respectively (table 3).
Table 3.
Percent recoveries of select trace elements in standard reference samples submitted with suspended sediment samples for analysis by the U.S. Geological Survey Mineral Research Laboratory contracted laboratory.[Data are from Markland and others, 2024. ppm, part per million]
The results of the replicate passive samples (n=9) had barium, cadmium, lead, and zinc relative percent differences of 5.2, 7.4, 6.0, and 4.9 percent, respectively. The results from the silica source blanks (n=12) that were processed in an identical manner to the environmental samples had average barium, cadmium, lead, and zinc concentrations of 12.6, <0.02, 6.1, and 5.3 mg/kg, respectively. The range of concentrations in the blanks were 8–23 mg/kg for barium, <0.02–0.03 mg/kg for cadmium, 1.4–34.5 mg/kg for lead, and 2.6–9.2 mg/kg for zinc. The lead concentration of 34.5 mg/kg was anomalous, as the lead concentration in the other 11 silica blanks sample results were less than 8 mg/kg. The results of the pure silica source material that was not processed but was submitted directly to the MRL for chemical analysis (n=3) had mean barium, cadmium, lead, and zinc concentrations of 10.7, 0.1, 12.6, and 10.9 mg/kg, respectively (Markland and others, 2024).
Data Analysis and Reporting
Streamflow, water temperature, and turbidity were recorded every 15 minutes during the study period, and these measurements were used to calculate daily mean, monthly mean, and annual mean values. Additionally, SSC and SSL data were used to compute daily, monthly, and annual mean values. Statistics for all daily data collected by USGS during the study period are available from the NWIS database (USGS, 2023). Monthly precipitation information used in this report was gathered from the National Oceanic and Atmospheric Administration (NOAA) and are cumulative monthly precipitation measurements (NOAA, 2022).
This study used turbidity, streamflow, and discrete SSC data from stormflow event and routine base-flow samples to develop regression models to estimate continuous (15-minute) SSCs and SSLs. Because the magnitude of turbidity in riverine systems is typically proportional to the SSC (Rasmussen and others, 2009), continuous turbidity measurements can be used to develop a regression model between turbidity and discrete SSC samples collected during base-flow conditions and stormflow events. Collection of suspended sediment samples across a range of hydrologic conditions increases the robustness of the regression models and confidence in the results (Rasmussen and others, 2009). Outliers were identified in the dataset after reviewing data for erroneous entries and errors in sampling or laboratory methods. Duration curves of turbidity data indicate that turbidity remained within the range of sensor accuracy (1,000 FNU) during the entirety of phase two (fig. 2).
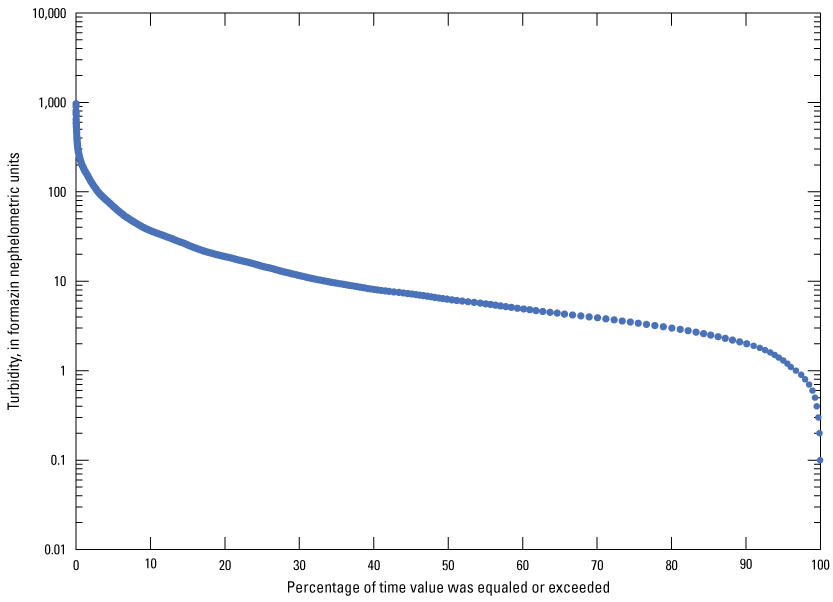
Turbidity duration curve for the study site at the Big River below Bonne Terre, Missouri, October 2018–September 2021. Data are from the U.S. Geological Survey National Water Information System database for site number 07017610 (U.S. Geological Survey, 2023).
During phase two (water years 2019–21), 40 discrete suspended sediment samples were collected, although only 35 were used in the development of the turbidity-derived regression model because of missing turbidity data from the sensor at the time of discrete sampling. Graphing nontransformed SSC against turbidity values identified a strong relation between the two properties. Inspection of the data and residual plots identified no outliers. The 35 data pairs were used to calibrate the SSC-turbidity model and are plotted on a log-log scale (fig. 3; table 4), with the final regression model as follows:
whereSSC
is suspended sediment concentration, in milligrams per liter; and
Turb
is turbidity, in formazin nephelometric units, measured with a YSI EXO2.
-
• number of calibration measurements=35;
-
• adjusted coefficient of determination=0.96;
-
• root mean squared error=0.153; and
-
• bias-correction factor=1.06.
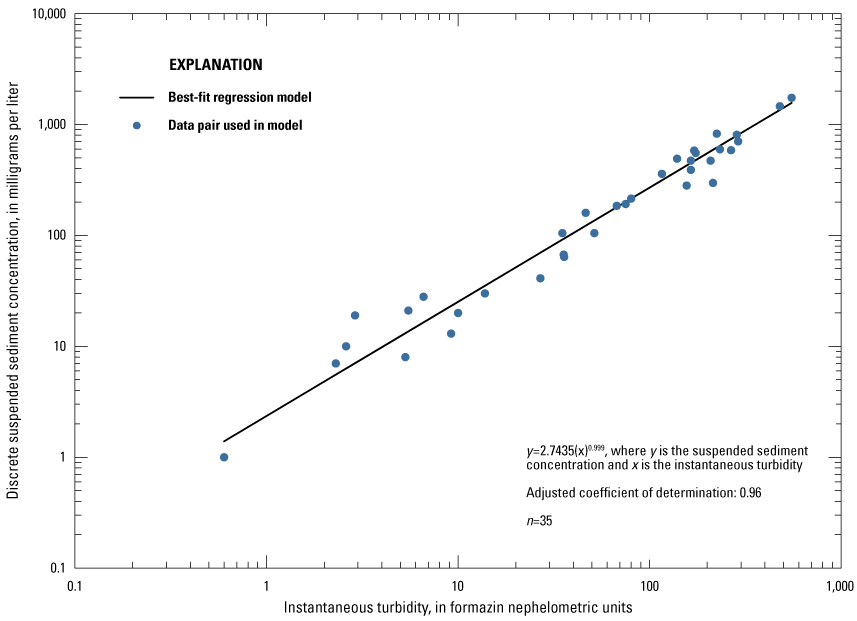
Instantaneous turbidity in relation to discrete suspended sediment concentrations used to develop a regression model for the computation of suspended sediment concentrations and loads for the Big River below Bonne Terre, Missouri, October 2018–September 2021. Data are from the U.S. Geological Survey National Water Information System database for site number 07017610 (U.S. Geological Survey, 2023).
Table 4.
Summary statistics of model-calibration datasets for the Big River below Bonne Terre, Missouri, October 2018–September 2021.[Data are from the U.S. Geological Survey National Water Information System database for site number 07017610 (U.S. Geological Survey, 2023). FNU, formazin nephelometric units; mg/L, milligram per liter; ft3/s, cubic foot per second; --, no data; n/a, not applicable]
This regression model using phase two data was compared to the regression model from phase one. An analysis of covariance was used to compare the two regression lines and whether they were significantly different with respect to either slope or intercept (defined as p-value <0.05). The slopes of the two regression models were not significantly different (p-value equal to 0.815), but the intercepts were different from each other (p-value <0.001). Because of the significant difference between the two regression models, the phase two model replaced the phase one model for SSC and SSL calculations for phase two of the study period. The shift in the regression between the two phases could be because of a change in the nature or grain-size of the sediment.
For periods when instantaneous turbidity was not available, a gap-fill framework was used by computing SSC using a secondary regression model based on instantaneous streamflow. Graphing the relation between SSC and streamflow identified a less statistically significant relation than the turbidity relation (fig. 4). Streamflow-derived regression models tend to have greater uncertainty than turbidity-derived regression models (Rasmussen and others, 2009). Suspended sediment concentrations computed using the streamflow-derived model (approximately 42 percent of the record) were flagged as estimated values. The suspended sediment model derived from streamflow is as follows:
whereSSC
is suspended sediment concentration, in milligrams per liter; and
Q
is instantaneous streamflow, in cubic feet per second.
-
• number of calibration measurements=40;
-
• adjusted coefficient of determination=0.80;
-
• root mean squared error=0.38; and
-
• bias-correction factor=1.38.
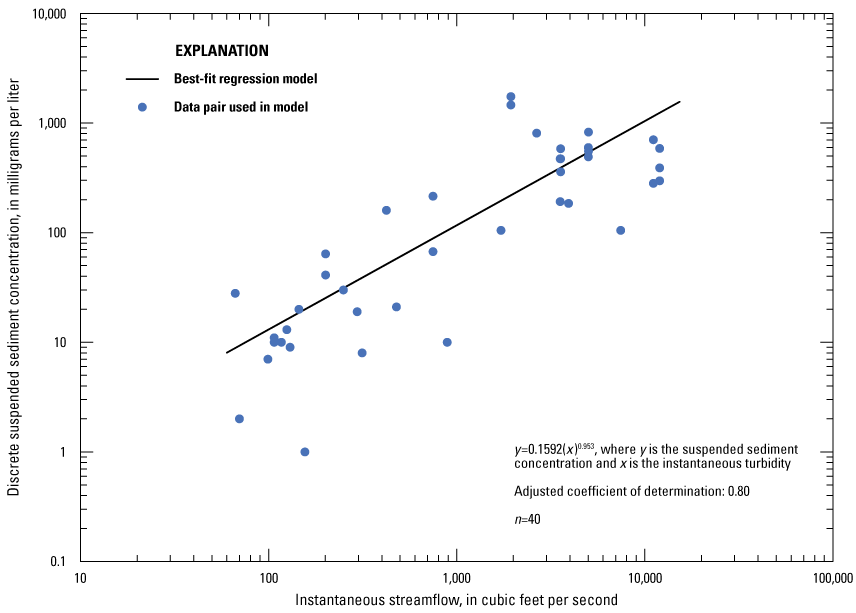
Instantaneous streamflow in relation to discrete suspended sediment concentrations used to develop a regression model for the computation of estimated suspended sediment concentrations and loads for the Big River below Bonne Terre, Missouri, October 2018–September 2021. Data are from the U.S. Geological Survey National Water Information System database for site number 07017610 (U.S. Geological Survey, 2023).
Streamflow and the regression-computed SSCs were used to compute daily mean SSLs. These SSC and SSL results are available via NWIS (USGS, 2023). To understand the effect of sampled events on sediment transport, event-based SSLs were computed using the runoff volumes and regression-computed SSCs. The total runoff volume is the sum of the 15-minute interval streamflow during the stormflow event divided by the duration of the event. The beginning of a stormflow event was generally determined as the time 1 hour before the streamflow doubled, and the end of a stormflow event was generally defined as when the streamflow decreased consistently by approximately 20 ft3/s during each 15-minute measurement for a continuous 2-hour period. Event-based SSL was computed using the following equation for each 15-minute interval, followed by a summation of all intervals:
whereESSL
is event-based suspended sediment load, in pounds;
EMSSC
is event-based suspended sediment concentration, in milligrams per liter;
RV
is runoff volume, in cubic feet; and
6.24 × 10⁻⁵
is a conversion from milligrams per liter to pounds per cubic foot.
EYield
is event-based suspended sediment yield, in pounds per square mile per hour;
ESSL
is event-based suspended sediment load, in pounds;
DA
is drainage area, in square miles; and
ED
is stormflow event duration, in hours.
Event-based loads and yields of barium, cadmium, lead, and zinc were computed from concentrations of the trace elements in the suspended sediment samples. Both sand and fine sediment size fractions were used to compute a bulk mass accumulation (sediment less than 2 mm in size) using the following equation:
whereConctotal
is the total trace element concentration in the suspended sediments, in milligrams per kilogram;
ConcS
is the trace element concentration in the sand fraction, in milligrams per kilogram;
%S
is the percent of mass in total samples considered sands (particles greater than 0.063 millimeter);
ConcF
is the trace element concentration in the fine fraction, in milligrams per kilogram; and
%F
is the percent mass in total samples considered fines (particles less than 0.063 millimeter).
In instances when only enough mass was available for trace element analysis on the bulk sample (rather than the separate size fractions), the bulk sample was analyzed, and the bulk concentrations were used. The arithmetic mean of the trace element concentrations for each stormflow event were computed from the suspended sediment samples collected during the event. The mean stormflow event concentration of each trace element was then expressed as a concentration in milligrams per liter using the SSC derived from the regression model for each 15-minute value. The following equation was used:
whereConcmg/L
is trace element concentration in suspended sediments, in milligrams per liter;
Conctotal
is the total trace element concentration in the suspended sediments, in milligrams per kilogram;
SSC
is the suspended sediment concentration calculated from the regression model; and
1,000,000
is the conversion factor from milligrams per kilogram to milligrams per liter.
Surface-Water Quality
The quality of a stream can be affected by many factors, including land use, topography, and weather conditions such as droughts and floods. These conditions were assessed to understand the surface-water quality of the Big River through computing the loads and yields of suspended sediment and associated trace elements.
Streamflow Conditions
Precipitation can greatly affect streamflow conditions. Monthly precipitation data were obtained from the DeSoto, Mo., climate station, which is about 13 mi north of the study site (NOAA, 2022; fig. 5). During phase two, total monthly precipitation ranged from 1.0 in. (September 2020) to 7.23 in. (May 2019). The normal annual precipitation amount for the climate station (years 1991–2020) is 44.73 in. All water years during phase two exceeded the normal annual precipitation. Water year 2019 had the most precipitation (56.29 in.) followed by water year 2020 (48.79 in.). The driest year of phase two was water year 2021 (46.04 in.; NOAA, 2022).
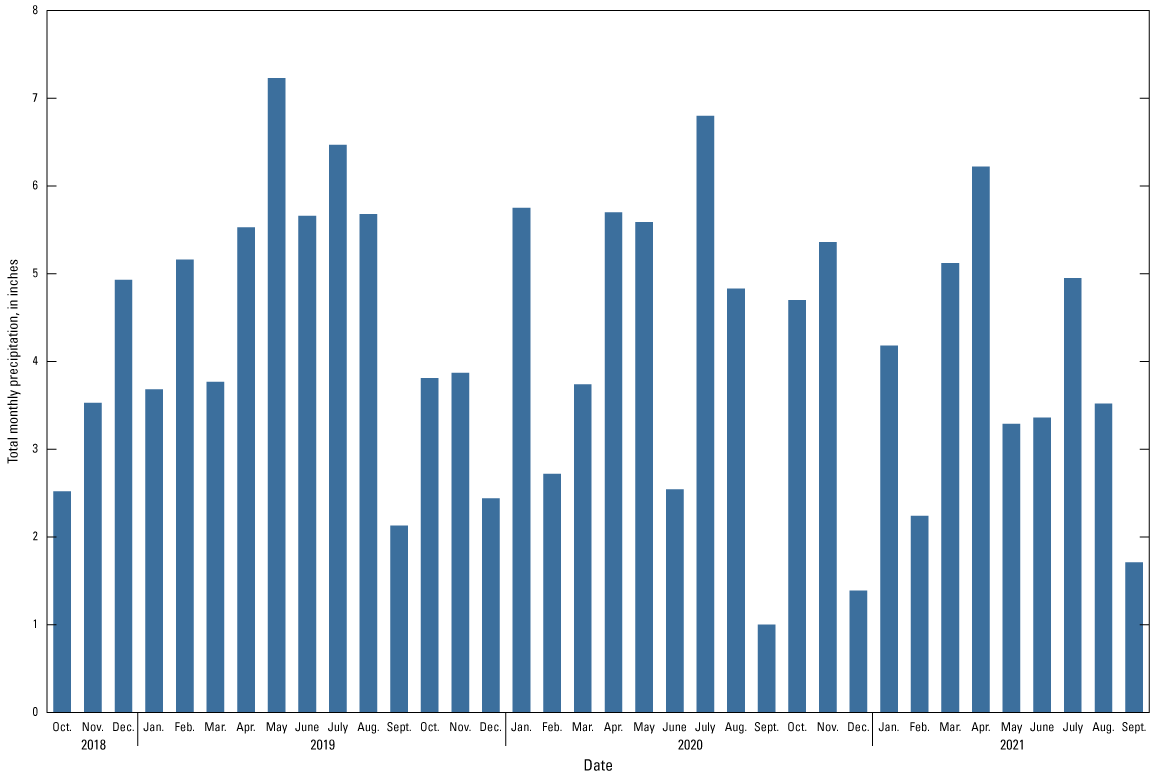
Total monthly precipitation at the National Oceanic and Atmospheric Administration DeSoto, Missouri, climate station near the Big River Basin, Mo., October 2018–September 2021 (National Oceanic and Atmospheric Administration, 2022).
Phase two consisted of wetter conditions and higher mean streamflows than the first year of phase one (table 5; Barr, 2016). Annual mean streamflows during phase one were 189 ft3/s in water year 2012 and 695 ft3/s in water year 2013. Annual mean streamflows during phase two were 640 ft3/s in water year 2019, 450 ft3/s in water year 2020, and 461 ft3/s in water year 2021 (table 5). In comparison, the mean annual streamflow measured while the streamgage has been operational (water years 2012–21) was 508 ft3/s (USGS, 2023). During phase one, daily mean streamflow was typically highest in the winter and spring months and lowest in the fall (fig. 6). The maximum daily mean streamflow for phase two was 12,000 ft3/s, which happened on January 11, 2020 (fig. 6, table 5). The minimum daily mean streamflow was 40.3 ft3/s on October 10, 2019. The maximum peak flow for each water year was 10,200 ft3/s (water year 2019), 16,000 ft3/s (water year 2020), and 13,100 ft3/s (water year 2021; table 5, fig. 6). The historical maximum peak streamflow was 41,100 ft3/s recorded on April 30, 2017 (table 5).
Table 5.
Streamflow statistics for the Big River below Bonne Terre, Missouri, October 2011–September 2013 and October 2018–September 2021.[Data are from the U.S. Geological Survey National Water Information System for site number 07017610 (U.S. Geological Survey, 2023). ft3/s, cubic foot per second; ft, foot; in., inch; --, no data]
Water year is defined as the 12-month period beginning October 1 and ending September 30 of the calendar year in which it ends (water year 2021 is the period October 1, 2020, through September 30, 2021).
Statistics indicated for water years 2012–13 for comparison to the previous study period (Barr, 2016).
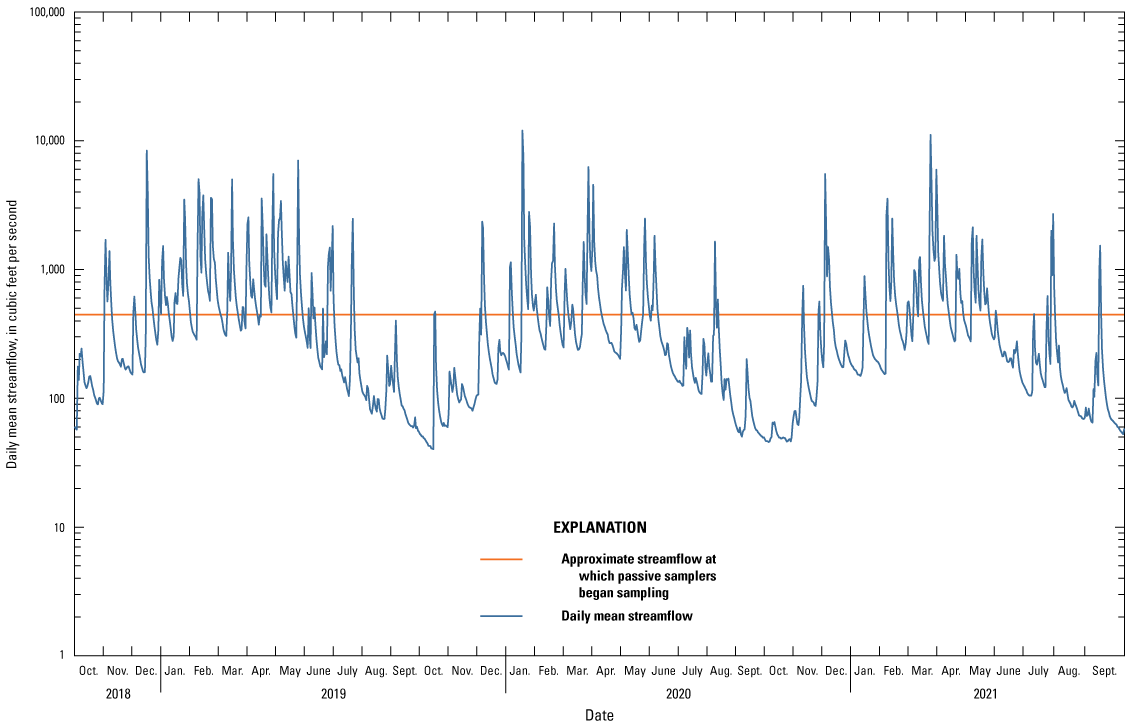
Daily mean streamflow during the study period at the Big River below Bonne Terre, Missouri, October 2018–September 2021. Data are from the U.S. Geological Survey National Water Information System database for site number 07017610 (U.S. Geological Survey, 2023).
A comparison of streamflow to the previous report by Barr (2016) highlights the drier conditions during water year 2012 (annual mean streamflow of 189 ft3/s). Streamflow conditions in water year 2013 (annual mean streamflow of 695 ft3/s) during phase one were comparable to the conditions in water year 2019 during phase two (annual mean streamflow of 640 ft3/s). Overall, streamflow during phase two was more consistent than in phase one (water years 2012–13).
Continuous Water-Quality Parameters
Water temperature data were collected at the study site because of its importance in monitoring sonde operations, such as indications of biological activity, streamflow conditions, and human influences (Wilde, 2006). Additionally, sediment transport efficiency is affected by water temperature because of its relation with viscosity (Charlton, 2008). The maximum water temperature recorded at the study site was 31.3 °C on July 9, 2020, and August 12, 2021 (table 6). The minimum water temperature recorded was −1.0 °C on several days (table 6). Water temperatures generally followed the expected diurnal and seasonal patterns (fig. 7). A few periods of the temperature record were removed during QA review.
Table 6.
Water-quality statistics for the Big River below Bonne Terre, Missouri, October 2018–September 2021.[Data are from the U.S. Geological Survey National Water Information System for site number 07017610 (U.S. Geological Survey, 2023)]
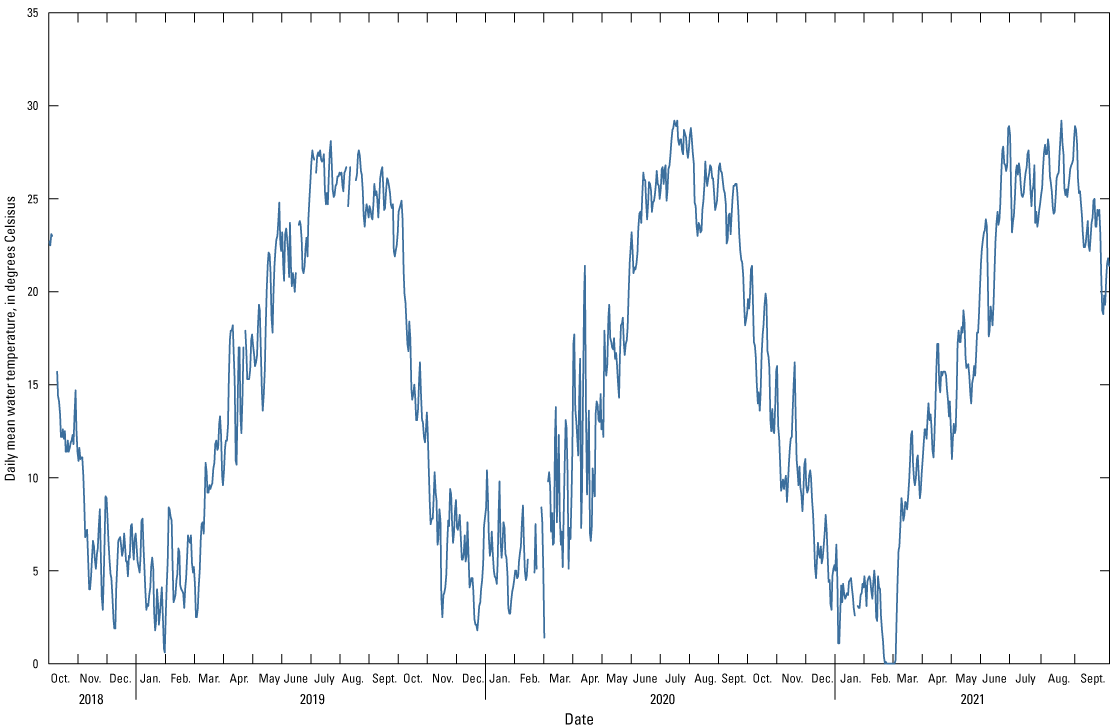
Daily mean water temperature measured at the Big River below Bonne Terre, Missouri, October 2018–September 2021. Data are from the U.S. Geological Survey National Water Information System database for site number 07017610 (U.S. Geological Survey, 2023).
Suspended sediment transport in the Big River may be better understood with the use of continuous turbidity data as turbidity can be used as a surrogate for SSC. The daily mean turbidity during phase two ranged from 0.4 FNU on November 17, 2018, and February 12–13, 2021, to 263 FNU on January 11, 2020 (table 6; fig. 8). The turbidity record is fragmentary in nature (missing approximately 44 percent of daily mean turbidity values) because of instrument biofouling during warmer months and siltation of the deployment pipe during stormflow event flows, as well as calibration drift and instrument malfunction (fig. 8).
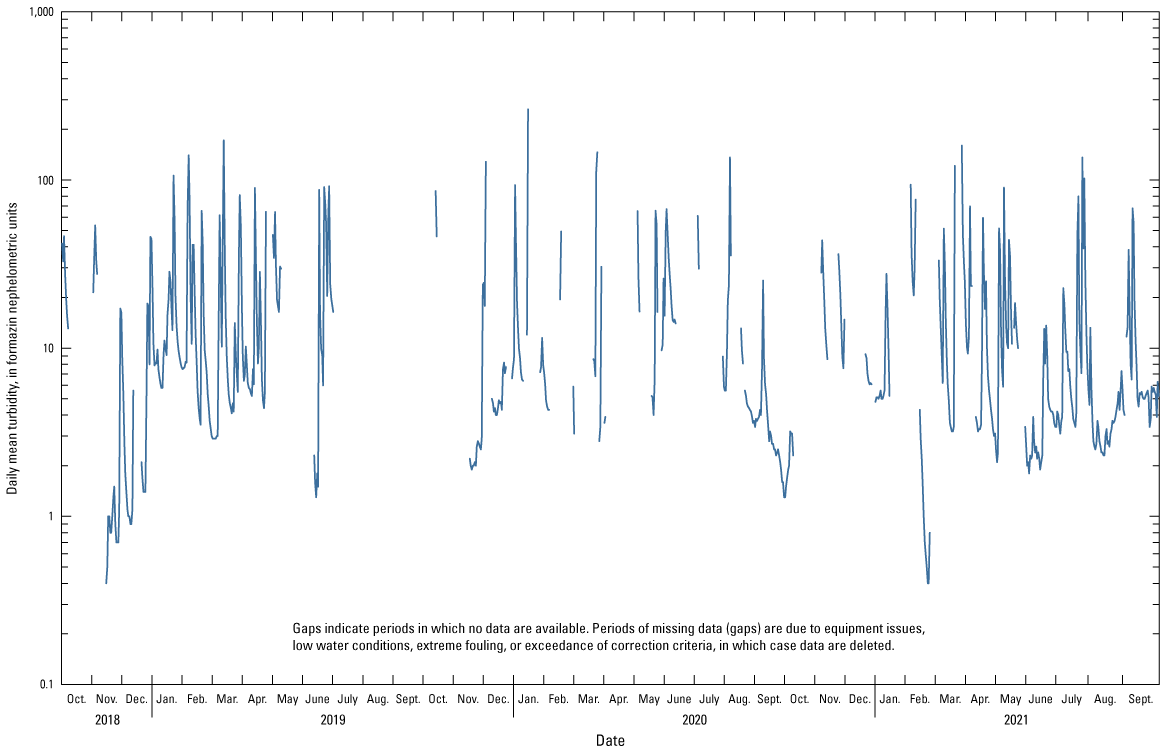
Daily mean turbidity measured at the Big River below Bonne Terre, Missouri, October 2018–September 2021. Data are from the U.S. Geological Survey National Water Information System database for site number 07017610 (U.S. Geological Survey, 2023).
Whereas increases in turbidity correlated with increases in streamgage height and streamflow, the rate at which each increased was not always consistent. Peaks in turbidity typically precede streamflow peaks for the same stormflow event (Mather and Johnson, 2014). The lag time between the peaks increased with higher flow events. As an example, the maximum turbidity for the study period (965 FNU on November 22, 2020; table 6) did not correlate with the maximum streamflow (16,000 ft3/s on January 12, 2020; table 5). External factors such as timing of previous stormflow events, runoff amounts, and location of rainfall can affect sediment availability and observed turbidity during stormflow events.
Turbidity observed during a stormflow event is the result of several factors, including sediment washed into the stream via runoff, increased suspended sediment transport, and erosion of streambanks because of higher stream velocities. When multiple stormflow events happen within a short time span, subsequent events can have reduced amounts of suspended sediment and turbidity as sediment becomes less available because it was transported from the land surface, stream bed, and streambank during prior events. The location and intensity of rainfall and where it falls within the drainage basin also may affect turbidity.
Suspended Sediment Transport
Forty suspended sediment samples were collected during phase two. These samples included 15 base-flow and 25 stormflow event samples collected during 8 stormflow events (table 7; fig. 9). During water year 2019, five base-flow samples and three sets of stormflow event samples were collected. During water year 2020, two base-flow samples and two sets of stormflow event samples were collected. Eight base-flow samples and three sets of stormflow event samples were collected in 2021 (table 7; fig. 9). Stormflow SSC during phase 2 ranged from 41 to 1,740 mg/L with a median value of 389 mg/L. Base-flow SSC during phase 2 ranged from 1 mg/L to 30 mg/L with a median value of 10 mg/L (table 7; fig. 9). When compared to the phase one study by Barr (2016), the median base-flow SSC during water years 2012–13 (10 mg/L) was the same as phase two. These values also closely align with a prior study within the Ozark Plateaus by Davis and Bell (1998) in similar streams to the Big River where median base-flow SSC ranged from 3 to 28 mg/L with increases during increased streamflow events.
Table 7.
Concentrations and particle-size distributions of suspended sediment in discrete samples collected at Big River below Bonne Terre, Missouri, October 2018–September 2021.[Data are from the U.S. Geological Survey National Water Information System database for site number 07017610 (U.S. Geological Survey, 2023). Dates are given in month/day/year. Times are given in hours:minutes (military). g, gram; mg/L, milligram per liter; %, percent; <, less than; mm, millimeter; -- no data; n/a, not applicable]
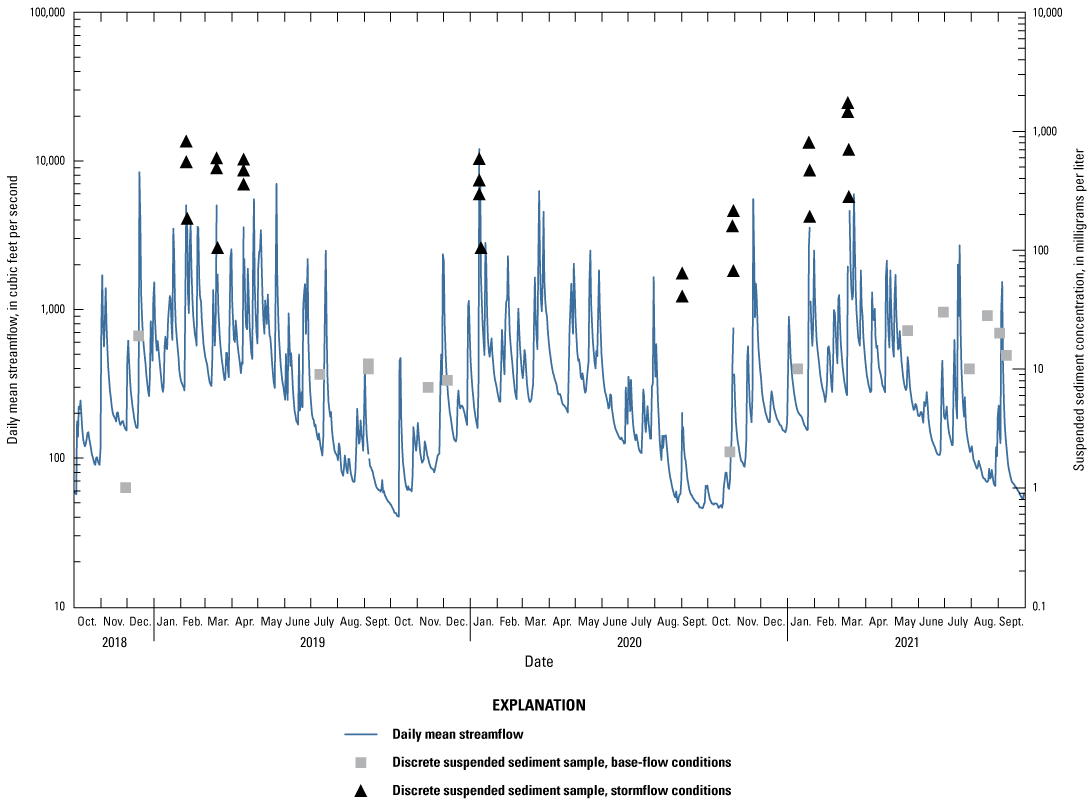
Continuous streamflow and discrete suspended sediment concentration samples collected at the Big River below Bonne Terre, Missouri, October 2018–September 2021. Data are from the U.S. Geological Survey National Water Information System database for site number 07017610 (U.S. Geological Survey, 2023).
Daily Suspended Sediment Concentrations and Loads
Daily SSCs and SSLs were computed using the regression models and followed similar patterns during the phase two study period, with maximum and minimum daily mean SSCs and SSLs frequently happening on the same dates (figs. 10 and 11). The daily mean SSL ranged from a minimum of 0.4 ton on September 24, 2020, to a maximum of 24,900 tons on March 13, 2021. During water year 2019, the maximum daily mean SSC of 816 mg/L and maximum daily mean SSL of 19,400 tons were measured on December 16, 2018 (table 8), which happened during the same stormflow event as the maximum daily mean streamflow for that water year (table 5). During water year 2020, the maximum daily mean SSC of 716 mg/L and maximum daily mean SSL of 22,600 tons were measured on January 12, 2020 (table 8), which was also during the same stormflow event as the maximum daily mean streamflow for water year 2020 (table 5). The maximum daily mean SSC and SSL (1,010 mg/L and 24,900 tons, respectively) during water year 2021 happened on separate dates (maximum concentration on November 23, 2020, and maximum load on March 13, 2021; table 8). The maximum daily mean streamflow for water year 2021 coincided with the same stormflow event as the maximum daily mean SSL in March 2021 (tables 5 and 8). The duration and magnitude of the stormflow event and availability of suspended sediment in the system likely played a role in the differing occurrences of the maximum daily mean concentrations and loads in water year 2021.
Table 8.
Summary of suspended sediment concentration and load statistics by water year at the Big River below Bonne Terre, Missouri, October 2018–September 2021.[Data are from the U.S. Geological Survey National Water Information System database for site number 07017610 (U.S. Geological Survey, 2023). mg/L, milligram per liter]
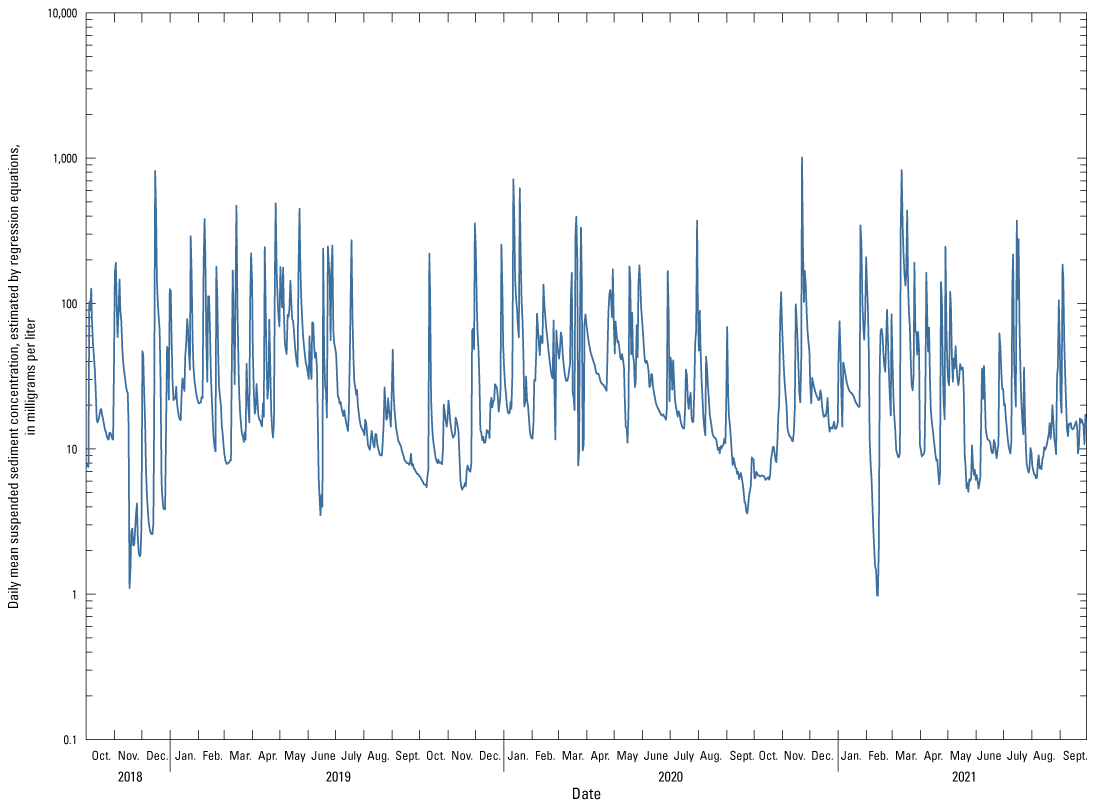
Daily mean suspended sediment concentrations computed at the Big River below Bonne Terre, Missouri, October 2018–September 2021. Data are from the U.S. Geological Survey National Water Information System database for site number 07017610 (U.S. Geological Survey, 2023).
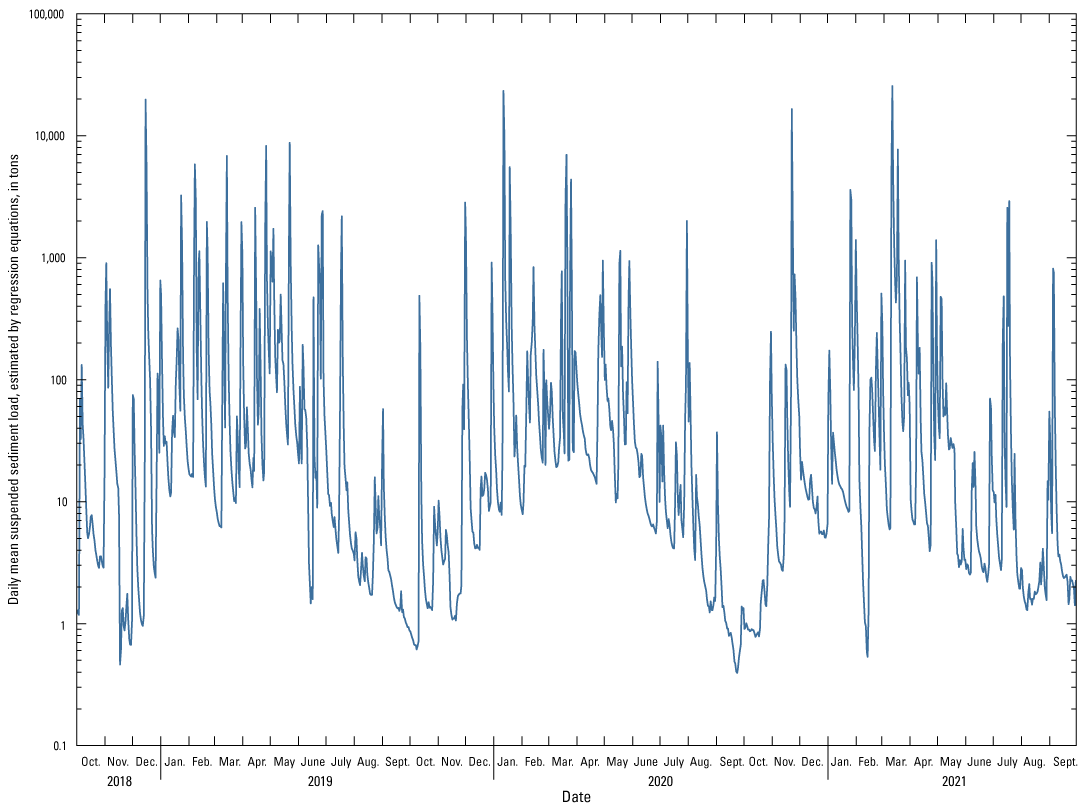
Daily mean suspended sediment loads computed at the Big River below Bonne Terre, Missouri, October 2018–September 2021. Data are from the U.S. Geological Survey National Water Information System database for site number 07017610 (U.S. Geological Survey, 2023).
The estimated annual SSL at the study site varied during phase two and was correlated with the annual mean streamflow with the largest mass of 113,000 tons transported during water year 2019 (annual mean streamflow of 640 ft3/s; tables 5 and 8). Water years 2020 and 2021 had annual SSLs of 83,400 and 96,500 tons, respectively (table 8). The lowest annual SSL for phase two (83,400 tons) happened during water year 2020, which coincided with the lowest annual mean streamflow (450 ft3/s; tables 5 and 8). Additionally, more turbidity record was missing during water year 2020 when compared to water years 2019 and 2021, which resulted in more of the SSC and SSL record for water year 2020 being estimated using the secondary streamflow-derived regression model. The secondary regression model underestimates the SSC more often than the primary regression model based on turbidity. Approximately 58 percent of the calculated (15-minute) SSCs for the study period were determined using the turbidity-based regression model; the remaining 42 percent of the record was calculated using the secondary streamflow-derived regression model.
Event-Based Suspended Sediment Concentrations, Loads, and Yields
Eight stormflow events were sampled during the phase two study period. Mean stormflow event SSCs and total stormflow event SSLs calculated using the regression model are reported for each of the individual events. Mean estimated stormflow event SSCs ranged from 50 to 717 mg/L, and total SSLs ranged from 45.3 to 32,500 tons (table 9). Events lasted an average of about 47 hours. Event runoff volumes ranged from 26,600,000 ft3 (event 5 on August 31–September 2, 2020) to 1,770,000,000 ft3 (event 4 on January 10–13, 2020). Event-based yields normalize each stormflow event based on the drainage area and the event duration. Sediment yield ranged from 5.03 pounds per square mile per hour (lb/mi2/hr) to 3,460 lb/mi2/hr (table 9). The stormflow events with the largest runoff volumes generally had the largest sediment yields.
Table 9.
Suspended sediment concentrations, load, and yields from sampled stormflow events at the Big River below Bonne Terre, Missouri, October 2018–September 2021.[Data are from the U.S. Geological Survey National Water Information System database for site number 07017610 (U.S. Geological Survey, 2023). hr, hour; ft3, cubic foot; mg/L, milligram per liter; lb, pound; lb/mi2/hr, pound per square mile per hour]
Sediment availability and rainfall intensity play critical roles in sediment transport in the Big River. Similar-size stormflow events (similar peak or total streamflow volume) are not always comparable. Events 2, 3, and 7 had comparable event runoff volumes, and they also had similar average SSCs (398, 471, and 491 mg/L, respectively; table 9); however, the two largest stormflow events—event 4 (6th highest peak streamflow for period of record) and event 8 (8th highest peak streamflow for period of record)—had differing mean SSCs (table 9). The mean estimated SSC during event 4 was 475 mg/L; the mean for event 8 was 717 mg/L. The timing and magnitude of prior stormflow events and the characteristics of each rainfall event can affect the transport of suspended sediment and associated trace elements.
The total SSL for the eight sampled stormflow events during phase two was computed as about 90,400 tons and accounted for 30.9 percent of the total SSL calculated using the regression models for phase two. To estimate a representative base-flow SSL for the phase two study period, the median base-flow SSC (10 mg/L; table 7) and the median of the daily mean streamflows associated with each base-flow sample during phase two were used (130 ft3/s; table 7). The estimated base-flow SSL was 3,840 tons, which accounted for 1.31 percent of the total SSL. This highlights that most suspended sediments in the Big River are transported during stormflow events as was concluded in phase one (Barr, 2016).
Trace Element Transport
A total of 18 stormflow event suspended sediment samples were analyzed for trace element concentrations during phase two (October 2018 to September 2021). When sufficient mass was available in sand (2–0.063 mm) and fine (<0.063 mm) fractions, separate trace element analyses were performed on each fraction. In instances when the mass of one or both fractions was less than the minimum required (0.5 g), the two fractions were recombined and submitted to MRL for trace element analysis as a bulk sample. Trace elements selected for this report include barium, cadmium, lead, and zinc. Concentrations of the select trace elements were used to determine trace element loads during storm events. These results were compared to phase one (October 2011 to September 2013) to determine if significant changes have happened during the entire study period. In addition, the sediments collected by the passive samplers during stormflow events also were analyzed for select trace elements and aided in determining trace element loads. Additional trace element results are available via NWIS (USGS, 2023) and Markland and others (2024).
Selected Trace Element Concentrations in Suspended Sediments
Stormflow event samples were analyzed separately for trace element concentrations among the sand and fine fractions except for samples collected during event 6 and a single sample from both events 1 and 7. All stormflow event samples analyzed for trace element concentrations were made up of mostly fines (median of 74 percent fines) with a range of 63 to 98 percent fines (table 10). Although samples collected during event 6, as well as a single sample from both events 1 and 7, were analyzed for trace elements in bulk, the samples were analyzed for particle-size distribution before chemical analysis, which indicated these samples also were predominately fines (88–90 percent fines for event 6; 70–75 percent fines for bulk-analyzed samples from events 1 and 7; table 10). In general, the fine fractions had higher concentrations of barium, cadmium, lead, and zinc than the sand fractions except for some samples collected during event 8. Barium concentrations in the fine fractions were about twice the concentrations of the sand fractions for all stormflow event samples. Differences in concentrations among sand and fine fractions for cadmium, lead, and zinc were less, with cadmium concentrations being most similar in the two size fractions (fig. 12; table 11).
Table 10.
Streamflow, suspended sediment concentrations and particle-size distributions, and selected total trace element concentrations in suspended sediments collected during stormflow events at the Big River below Bonne Terre, Missouri, October 2018–September 2021.[Data are from the U.S. Geological Survey National Water Information System database for site number 07017610 (U.S. Geological Survey, 2023) and Markland and others, 2024. Dates are given in month/day/year. Times are given in hours: minutes (military). ft3/s, cubic foot per second; mg/L, milligram per liter; %, percent; >, greater than; mm, millimeter; <, less than; --, no data]
Table 11.
Selected trace element concentrations in suspended sediment collected during stormflow events at the Big River below Bonne Terre, Missouri, October 2018–September 2021.[Data are from Markland and others, 2024. Dates are given in month/day/year. Times are given in military time. mg/kg, milligram per kilogram; --, not available]
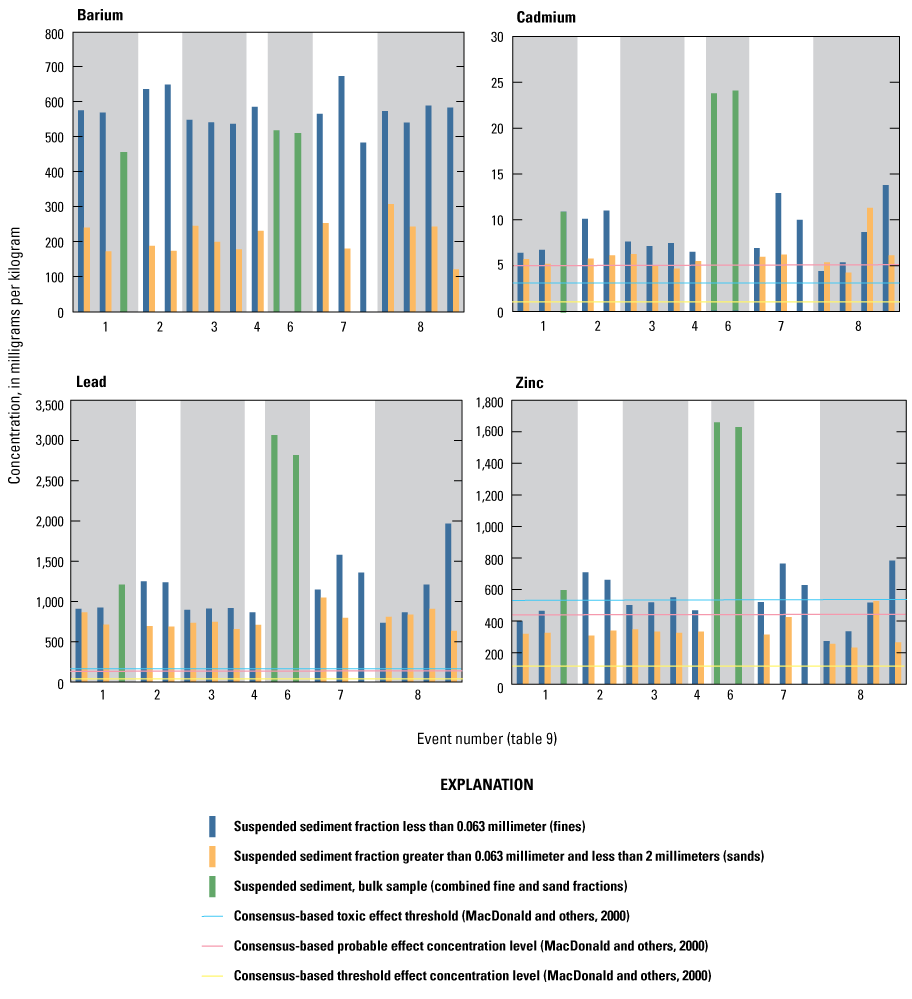
Trace element concentrations in two suspended sediment size fractions collected during stormflow events at the Big River below Bonne Terre, Missouri, October 2018–September 2021. Data are from Markland and others (2024).
Trace element concentrations of cadmium, lead, and zinc in suspended sediment from stormflow event samples generally were consistent throughout the duration of each individual event, except events 1 and 8, which indicated a general increase in concentrations within the fine fractions during the event (table 11; fig. 12). These two stormflow events were larger events, with the highest mean event sample SSCs during phase two (522 mg/L for event 1 and 1,050 mg/L for event 8; table 9). This general pattern could indicate new contributions of mine waste material with high concentrations of trace elements that were mobilized from the landscape upstream from the Big River below Bonne Terre, Mo., as the result of the large storm event. Concentrations of barium were generally consistent throughout the duration of each individual event.
Two samples were collected during event 6, which happened on October 29–30, 2020. The samples from event 6 were bulk analysis samples because of the lack of sediment mass between the two size fractions. Both bulk samples had the highest concentrations of cadmium (23.8 and 24.1 mg/kg), lead (3,060 and 2,820 mg/kg), and zinc (1,660 and 1,630 mg/kg) from all event samples during the phase two study (fig. 12, table 11). Suspended sediment samples collected during event 6 were 88–90 percent fines with SSCs ranging from 67 to 215 mg/L, which were low compared to other sampled stormflow events (table 10). Event 6 was the second smallest event (by event runoff volume) sampled during phase two (table 9); however, the heaviest rainfall was localized (average of 2.1 in.) to the immediate area of the major mine waste piles within the OLB (Federal, Desloge, Elvins, and National mine waste piles) within and just west of Park Hills. During the same period, the mean rainfall across the entire 409-mi2 drainage basin upstream from the streamgage below Bonne Terre was less than 1.5 in. Digital raster data of 24-hour rainfall estimates using NOAA Multi-Radar Multi-Sensor System data were obtained from the Iowa Environmental Mesonet (Iowa State University, 2023). One hypothesis is that the localized heavier rainfall and resulting runoff during event 6 eroded and suspended mine-waste contaminated sediments primarily in the area of the major mine waste piles within the OLB. These highly contaminated sediments were not diluted by runoff containing uncontaminated sediments from upstream in nonmined areas of the drainage basin. These signature high trace element concentrations from mine-waste contaminated sediments are likely present during all stormflow events, but they are diluted by runoff from other areas of the drainage basin during the larger stormflow events typically sampled. A second hypothesis is that this smaller event transported primarily fine bed sediments deposited from a previous event. Because the small event only transported the fine, more-contaminated bed material, the suspended sediment samples consisted of mostly these materials and were not diluted by coarser, lower concentration materials.
Cadmium, lead, and zinc are considered toxic to aquatic life at certain concentrations in bed sediments (MacDonald and others, 2000). Because the suspended sediments collected during this study were mobilized from bed sediments and many will return to the riverbed, the sediment quality guidelines for bed sediments were used for comparison to suspended sediment trace element concentrations. The toxic effect concentration (TEC) is defined as the concentration below which adverse effects are not expected to occur. The probable effect concentration (PEC) is the concentration at which adverse effects are expected to occur when concentrations are at or above the PEC. There are thresholds within these sediment quality guidelines, including the highest threshold in the PEC group, the toxic effect threshold (TET), which is the concentration above which sediment is considered heavily contaminated and likely to cause adverse effects on sediment-dwelling organisms (MacDonald and others, 2000). The bulk concentration of barium in suspended sediments ranged from 416 to 531 mg/kg with a median of 485 mg/kg (table 11; fig. 12). Barium does not have an established TEC, PEC, or TET. Bulk cadmium concentrations had a median of 7.90 mg/kg and ranged from 4.60 to 24.1 mg/kg, all of which all exceeded the TEC for cadmium in sediment (table 11, 12). Bulk lead concentrations exceeded the TEC, PEC, and TET in all samples, with a range of 747 to 3,060 mg/kg and a median of 1,070 mg/kg. Bulk zinc concentrations ranged from 271 to 1,660 mg/kg with a median of 500 mg/kg. Zinc concentrations in bulk suspended sediments exceeded the TEC, frequently exceeded the PEC, and occasionally exceeded the TET (table 11, 12).
Table 12.
Consensus-based sediment quality guidelines for selected trace elements (MacDonald and others, 2000).[mg/kg, milligram per kilogram; --, not available]
Samples for dissolved trace element concentrations were not collected during phase two or during the phase one completed by Barr (2016) because of low dissolved lead concentrations reported in previous studies of the Big River. Smith and Schumacher (1991, 1993) collected samples for dissolved trace element concentrations at different sites on the Big River—upstream near Desloge (USGS site number 07017260) and downstream near Richwoods (USGS site number 07018100; fig. 1)—and reported concentrations of dissolved lead below the reporting limit of 10 micrograms per liter (µg/L). Concentrations of dissolved lead in 55 samples collected during water years 2000 through 2021 from the Big River near Richwoods site as part of the Missouri Ambient Water Quality Network had a median dissolved lead concentration of 3.3 µg/L and a maximum lead concentration of 15.7 µg/L (USGS, 2023).
Trace element concentrations in the fine fraction of suspended sediments transported by the Big River generally are similar to those from phase one (water years 2012–13), with small differences in barium and zinc concentrations and no significant changes in cadmium and lead concentrations (fig. 13). In the fine fraction of suspended sediment samples, Barr (2016) reported median concentrations of barium, cadmium, lead, and zinc of 590, 10.0, 1,000, and 860 mg/kg, respectively. During phase two, the median concentrations of barium, cadmium, lead, and zinc in the fine fractions were 568, 8.15, 1,180, and 535 mg/kg, respectively (table 11). Wilcoxon rank-sum tests were performed to determine whether the concentrations of these trace elements in the fine fractions were significantly different from those determined for phase one of the study (Barr, 2016). The barium and zinc concentrations were significantly smaller (p-values of 0.028 and <0.001, respectively) than those reported by Barr (2016), whereas the cadmium and lead concentrations were not significantly different between the study period phases (p-value greater than 0.05; p-values of 0.1304 and 0.3116, respectively). It is possible that remediation of major mine waste areas within the OLB might have contributed to the significantly smaller zinc concentrations; however, barium is not associated with mineralization within the OLB and given the small dataset, additional monitoring data would be beneficial.
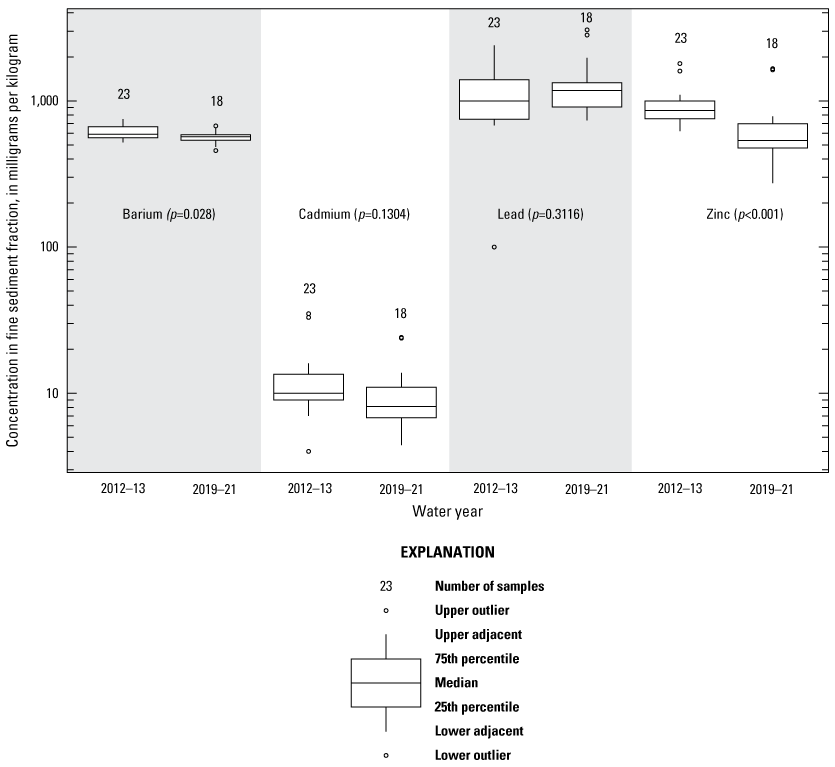
Comparison of trace element concentrations in the fine sediment size fraction for stormflow events collected at the Big River below Bonne Terre, Missouri, October 2011–September 2013, and October 2018–September 2021. Data are from Markland and others (2024).
The trace element concentrations in the suspended sediment also were expressed as whole-water concentrations (milligrams per liter, using the measured SSC concentration in water; table 10). The median barium and cadmium concentrations were 0.240 and 0.004 mg/L, respectively. Lead and zinc concentrations had median concentrations of 0.507 and 0.273 mg/L, respectively. The maximum lead concentration was 1.30 mg/L and happened during the first hydrologic rise during event 8. The maximum barium, cadmium, and lead concentrations also were observed in the same sample from event 8. This sample did not have the highest concentrations of trace elements in the sediment itself, but because of the high SSC (1,740 mg/L), the overall concentration of barium, cadmium, lead, and zinc were ultimately greatest in this sample. The concentration of trace elements in suspended sediments remained consistent during a sampled stormflow event (table 11); however, the calculated concentrations of trace elements in milligrams per liter generally decreased during a stormflow event as the SSC decreased as the event receded (table 10).
Loads and yields of barium, cadmium, lead, and zinc were calculated for the sampled stormflow events (table 13). Barium and cadmium event loads ranged from 0.199 to 17.1 tons and 0.009 to 0.239 ton, respectively. Lead event loads ranged from 1.14 to 34.0 tons, and zinc event loads ranged from 0.636 to 14.5 tons (table 13). The largest barium and zinc loads happened during event 4, and the largest cadmium and lead loads happened during event 8, with these two events having the largest suspended sediment loads of phase two (SSL of 32,500 tons during event 4 and 31,800 tons during event 8; table 9, 13).
Table 13.
Selected trace element concentrations, loads, and yields in suspended sediments collected during stormflow events at the Big River below Bonne Terre, Missouri, October 2018–September 2021.[Data are from the U.S. Geological Survey National Water Information System database for site number 07017610 (U.S. Geological Survey, 2023) and Markland and others, 2024. hr, hour; mg/kg, milligram per kilogram; lb, pound; lb/mi2/hr, pound per square mile per hour; --, no data]
The total event-based loads for each water year displayed in table 13 represent a minimum of the total trace element load because of the small number of stormflow events sampled or analyzed for trace elements. Event-based yields were calculated to make individual events more comparable by considering the drainage area (409 mi2 for all samples) and individual event durations. Yields were greatest for barium, cadmium, lead, and zinc during event 8, and trace element yields were similar between events 1, 2, and 7 (table 13).
When compared to phase one of the study by Barr (2016), the event-based trace element loads during water year 2012 (a drought year; Barr, 2016) were markedly less than the water years included in the current study period. For water year 2013, the trace element loads for sampled stormflow events were greater than water years 2019–21. The maximum daily mean streamflow for water year 2013 (18,600 ft3/s; Barr, 2016) was 6,600 ft3/s greater than the maximum daily mean streamflow recorded during phase two (12,000 ft3/s; table 5).
Selected Trace Element Concentrations in Suspended Sediments from Passive Samplers
Passive samplers were deployed throughout the duration of phase two and retrieved after major stormflow events or at periodic intervals throughout the water year. Samplers were located such that they would become inundated and begin collecting sediment during stormflow events when the stage exceeded approximately 4.82 ft. The samplers were serviced 18 times from the initial deployment on September 13, 2018, to the final retrieval on March 16, 2022, representing 18 events. Bulk concentrations of cadmium and lead exceeded the PEC, TEC, and TET in all passive samples, whereas bulk concentrations of zinc exceeded the PEC in all passive samples, the TEC in 17 of 18 samples, and the TET in 15 of 18 samples (tables 10 and 14).
Table 14.
Particle-size distribution and selected trace element concentrations in suspended sediments collected with passive samplers at the Big River below Bonne Terre, Missouri, October 2018–September 2021.[Data are from Markland and others, 2024. mg/kg, milligram per kilogram; %, percent; <, less than; mm, millimeter; >, greater than]
Bulk concentrations of barium, cadmium, lead, and zinc in the 18 passive samples were compared to bulk concentrations from the discrete suspended sediment stormflow event samples (tables 11 and 14; fig. 14). The median bulk concentrations of barium, cadmium, lead, and zinc in sediment from the passive samplers were 523, 13.6, 1,870, and 745 mg/kg, respectively (table 14). The median bulk concentrations of barium, cadmium, lead, and zinc from discrete stormflow event samples were 485, 7.90, 1,070, and 500 mg/kg, respectively (table 11). Wilcoxon rank-sum tests indicate that, although similar in magnitude, concentrations of barium, cadmium, lead, and zinc were significantly larger in the passive samples compared to the discrete stormflow event samples (p-values equal to 0.00824, <0.001, <0.001, and 0.00238, respectively). It should be noted that the passive samples were dry sieved during processing at the sediment laboratory, but the discrete samples were wet sieved. Because of the possibility of aggregated fines being included in the sand fraction after dry sieving, the fine fractions also were compared between the passive and discrete samples to avoid the potential bias caused by the difference in methods. Wilcoxon rank-sum tests of the fine fractions indicated similar conclusions as the bulk comparison with the concentrations of cadmium, lead, and zinc being significantly greater in the passive samples compared to the discrete suspended sediment samples (p-values equal to 0.00563, 0.00183, and 0.0156, respectively). Concentrations of barium were not significantly different when comparing the fine fractions in passive and discrete samples (p-value equal to 0.8247).
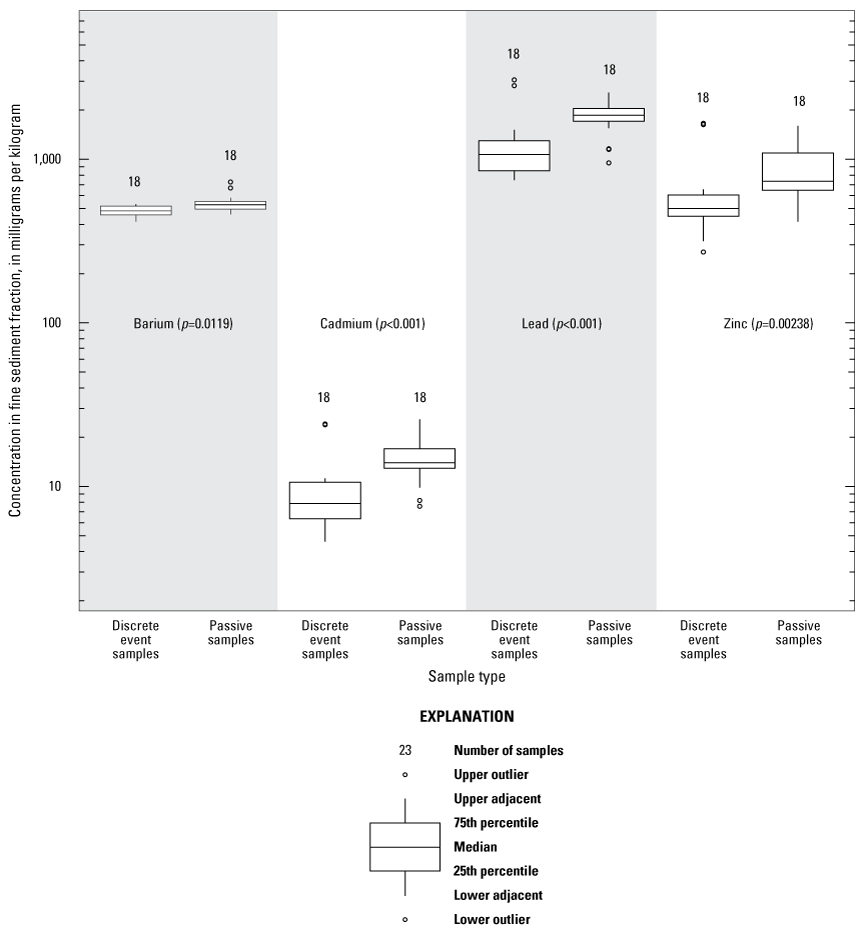
Trace element concentrations in suspended sediment collected with passive samplers and collected as discrete samples during stormflow events at the Big River below Bonne Terre, Missouri, October 2011–September 2013, and October 2018–September 2021. Data are from Markland and others (2024).
The most probable explanation for the higher trace element concentrations in the suspended sediments collected using the passive samplers is because the passive samplers are integrating sediment during a longer duration of the stormflow event (at about stage 4.82 ft and above), whereas the discrete cross-section samples are generally collected at much higher stages and later from the start of the individual event when a team can be present to obtain the sample. As such, discrete samples represent only a short period of time during the full hydrologic event and often miss high concentration early sediment transport. Each runoff event also has much variability especially if a bank of highly contaminated sediments sloughs into the river. The early part of a stormflow event at Bonne Terre has a larger proportion of locally derived sediment mobilized from the streambed and runoff from the OLB area in addition to the fine materials deposited from the previous runoff event. As the stage increases, the proportional contribution from the drainage basin upstream from the OLB gradually increases. Concentrations of mining-related trace elements in the fine fraction of the discrete samples collected on the rising limb of stormflow events during both phases of the study are inversely correlated with stage with correlation coefficients of −0.38 (cadmium), −0.26 (cobalt), −0.40 (lead), −0.63 (nickel), and −0.56 (zinc). In contrast, concentrations of barium in the rising limb samples had no correlation with stage (correlation coefficient of 0.00). Barium is not a trace element associated with mining in the OLB but is widely distributed across the middle and upper Big River drainage basin as barite. The largest lead concentration of 3,060 mg/kg detected in any discrete suspended sediment sample collected during both phases of the study was collected at a stage of only 4.74 ft, shortly after a small rise began on October 29, 2020 (event 6). Widespread projected heavy rains never materialized for that stormflow event. As previously discussed, the 24- and 48-hour rainfall estimates obtained from the Iowa State University Mesonet (Iowa State University, 2023) indicated the heavier rainfall was localized, with the highest totals (mean of about 2.1 in.) happening in the immediate area of the major mine waste piles within the OLB and Park Hills area. The stage peaked on October 29, 2020, at slightly less than 6.0 ft about 6 hours after it began rising. It is hypothesized that the initial rise of all stormflow events likely contains these higher lead concentrations derived from within the OLB and major mine waste areas and the fine materials deposited from the prior runoff event; however, during larger events, they are diluted by sediments derived from mostly nonmined areas from upstream parts of the drainage basin. During the rising limb of hydrologic events, the combination of high concentrations of lead in suspended sediments and the high concentrations of suspended sediments results in larger fluxes of lead at the beginning of events with SSC commonly peaking before or at the same time as the hydrologic peak (Guy, 1970).
The trace element concentrations in passive sediment samples were used to estimate total annual loads of barium, cadmium, lead, and zinc. The daily mean SSL calculated from the regression model (table 8) was used to calculate the SSL represented by each passive sampler deployment. The sum of the deployment period daily SSLs was then multiplied by the bulk trace element concentrations in the passive sample from that deployment period to estimate the total suspended sediment trace element load (table 15). Although the samplers were not submerged when stage was below 4.82 ft, the concentrations for the respective deployment period were used to calculate trace element loads for days when the sampler was not submerged and collecting sediment. This methodology was used knowing that most of the sediment and trace element load at the Big River below Bonne Terre sampling site is transported during stormflow events. Additionally, sediment samples were collected using a continuous flow centrifuge during base-flow conditions (March 5, 2021, and August 16 and 19, 2021) as part of another USGS project in the region to examine solid-phase associations of trace elements and trace element concentrations in particulates. These samples were collected at the Missouri Department of Conservation access at Cherokee Landing about 2 mi upstream from the Bonne Terre streamgage site (fig. 1). Generally, median bulk concentrations of barium, cadmium, lead, and zinc (553, 19.5, 2,130, and 1,646 mg/kg, respectively; Markland and others, 2024) fell within the range of concentrations observed in the discrete samples collected during stormflow conditions (table 11). The results from the continuous flow centrifuge sample further support the use of the passive sampler trace element data for the duration of the deployment period, even when the samplers were not submerged in the water column.
Table 15.
Annual loads of selected trace elements in suspended sediments collected with passive samplers at the Big River below Bonne Terre, Missouri, October 2018–September 2021.[Data are from the U.S. Geological Survey National Water Information System database for site number 07017610 (U.S. Geological Survey, 2023) and Markland and others, 2024. >, greater than; ft3/s, cubic foot per second]
The passive samplers were submerged for approximately 330 days. The annual loads of barium and cadmium ranged from 41.4 to 58.6 tons per year and 1.17 to 1.43 tons per year, respectively. The annual load of lead ranged from 152 to 194 tons per year, and the zinc load ranged from 68.1 to 76.5 tons per year. Water year 2019 had the largest loads for all four trace elements (table 15). The loads were primarily transported during days with a median daily streamflow associated with the approximate stage above which the passive sampler was submerged. Less than 5 percent of the total lead load calculated for phase two was transported when daily mean streamflow was less than 455 ft3/s, which further highlights that most of the sediment and trace element loads are transported during stormflow events. The use of passive samplers to obtain suspended sediment samples is an effective way to monitor the transport of lead and other trace elements in the Big River drainage basin.
Summary
The Big River in southeast Missouri drains the Old Lead Belt (OLB), an area of major lead mining from the 1860s until 1972 where more than 8.5 million tons of lead were mined. Waste from intense subsurface mining was placed in large mine waste piles, including chat piles and adjacent tailings impoundments. Six of the major mine waste areas are in the central part of the OLB along the Big River and its tributaries, covering more than 2,800 acres with an estimated volume of more than 39 million cubic yards (yd3). The proximity of these waste areas to streams resulted in a continuous source of contamination to the drainage basin since the mid-1800s. Trace elements of interest include barium, cadmium, lead, and zinc. Trace element-contaminated streambed and floodplain sediments have been detected along the approximately 90 miles of the Big River downstream from the OLB to its confluence with the Meramec River. Floodplain sediments contaminated above the residential soil threshold limits for lead (400 parts per million) exist along the entire reach of the Big River downstream from the OLB to a depth of 1–4 meters or more. The U.S. Environmental Protection Agency has stabilized most of the major mine waste areas and continues to clean up residential yards, while assessing remedial options for the contaminated streambed and floodplain sediments.
The U.S. Geological Survey, in cooperation with the U.S. Environmental Protection Agency Region 7, began a 2-year intensive study in October 2011 to assess the transport of suspended sediment and mining-related trace elements in the Big River to determine whether significant changes in trace element concentrations occurred in the OLB after major mine waste area remediation efforts. The study used streamgage and sediment stations with continuous turbidity monitors at two locations along the Big River. This current study period (water years 2019–21) is the second phase of the intensive effort. This second phase assessed changes in suspended sediment and trace element transport compared to phase one (water years 2012–13).
Stormflow event sampling was completed for eight events during phase two. Suspended sediment samples were collected, and sediment was analyzed for particle-size distributions and trace element concentrations. Loads of suspended sediment and select trace elements were calculated for the sampled stormflow events. Base-flow suspended sediment samples also were collected during the study period. Regression models were developed by pairing discrete suspended sediment concentration (SSC) samples with continuous turbidity and streamflow measurements. The models were used to compute time-series SSC and suspended sediment load (SSL) values. Daily mean streamflow during phase two ranged from 40.3 to 12,000 cubic feet per second (ft3/s). Turbidity ranged from 0 to 965 formazin nephelometric units. The annual SSLs calculated using the regression model were 113,000 tons for water year 2019, 83,400 tons for water year 2020, and 96,500 tons for water year 2021.
Using streamflow and estimated SSC from the regression models, event-based SSLs were computed for each sampled stormflow event to determine the approximate mass of sediment transported during each event. Stormflow event SSCs ranged from 41 to 1,740 milligrams per liter (mg/L), and event-based SSLs ranged from 45.3 to 32,500 tons. Event 4 happened in January 2020 and had a peak streamflow of 16,000 ft3/s and had the greatest load of suspended sediment of all sampled stormflow events. Discrete SSCs from base-flow samples ranged from 1 to 30 mg/L with a median of 10 mg/L. Using a base-flow SSC of 10 mg/L and the median of the daily mean streamflows associated with each base-flow sample for phase two, a total base-flow SSL was calculated as 3,840 tons for water years 2019–21. This base-flow SSL accounts for approximately 1.31 percent of the total SSL transported during phase two, as calculated using the regression models. The total SSL calculated during the eight sampled stormflow events during phase two was 90,400 tons, accounting for 30.9 percent of the SSL computed by the regression models.
Concentrations of barium, cadmium, lead, and zinc in discrete suspended sediment samples collected during stormflow events were used to determine event-based concentrations, loads, and yields of these select trace elements. When enough sediment mass was available, the sand (0.063 to less than [<] 2 millimeters [mm]) and fine (<0.063 mm) fractions were analyzed separately, with most samples having higher concentrations of trace elements in the fine fraction. Similar to the findings during phase one, concentrations of cadmium, lead, and zinc in suspended sediment (discrete event samples or passive samplers) at the study site frequently exceeded the threshold effect concentration, the probable effect concentration, and most also exceeded the toxic effect threshold during phase two. The continued high concentrations of lead in suspended sediments in the Big River despite reclamation activities is likely because of the continual release of lead-enriched sediment from streambeds, eroding stream banks, and the surrounding landscape, which remain in the system from historical mining activities. Concentrations of lead and cadmium in the fine fraction of discrete suspended sediment samples collected at the Bonne Terre study site were statistically similar between the two study phases (water years 2012–13 and 2019–21). Concentrations of barium and zinc in the fine fraction of suspended sediment samples from phase two (water years 2019–21) were statistically smaller than phase one (water years 2012–13). Lead concentrations in bulk suspended sediments (sediment less than 2 mm in size) collected during water years 2019–21 ranged from 747 to 3,060 mg/kg, and zinc concentrations ranged from 271 to 1,660 mg/kg.
Event-based loads of barium, cadmium, lead, and zinc were calculated for stormflow events in which trace element concentration data were available. Events 4 and 8, sampled in January 2020 and March 2021, respectively, had the largest trace element loads of the eight sampled events. During event 4, 17.1 tons of barium, 0.206 tons of cadmium, 27.2 tons of lead, and 14.5 tons of zinc were transported. During event 8, barium, cadmium, lead, and zinc loads were 15.6, 0.239, 34.0, and 13.6 tons, respectively.
New to phase two, suspended sediment samples were also collected using passive samplers. The passive samples allowed for suspended sediment sampling during all stormflow events exceeding the stage at which the samplers were set, rather than just those sampled using discrete sampling methods. Sediments collected from the passive samplers were analyzed for barium, cadmium, lead, and zinc, and concentrations were used to calculate annual and total loads of these select trace elements using the daily mean sediment load from the regression models. Water year 2019 had the largest loads of barium, cadmium, lead, and zinc (58.6, 1.43, 194, and 76.5 tons, respectively) followed by water year 2021 (49.2, 1.28, 173, and 69.0 tons, respectively). Water year 2020 had annual loads of 41.4, 1.17, 152, and 68.1 tons of barium, cadmium, lead, and zinc, respectively. Less than 5 percent of the lead load calculated for phase two was transported when daily mean streamflow was less than 455 ft3/s. This highlights that most of the trace elements are transported during stormflow events sampled by the passive samplers. Concentrations of barium, cadmium, lead, and zinc in suspended sediment obtained from the passive samplers were statistically higher than the concentrations in suspended sediments from discrete samples obtained during stormflow events. It is hypothesized that the passive samplers can better integrate suspended sediment during the entire duration of the stormflow event, capturing the initial rise of the river when sediments from the immediate area of the OLB are being transported by the Big River. Because of their ability to integrate runoff from the entirety of the stormflow event at a set depth and sampling point, rather than only when a sampling team can be physically present onsite for short periods of time during an event, the use of passive samplers is an effective way to monitor the transport of lead and other trace elements in the Big River and could be a useful tool in monitoring sediment trace element transport during future monitoring efforts.
References Cited
Barr, M.N., 2016, Surface water-quality and suspended-sediment quantity and quality within the Big River Basin, southeastern Missouri, 2011–13: U.S. Geological Survey Scientific Investigations Report 2015–5171, 39 p., accessed November 14, 2022, at https://doi.org/10.3133/sir20155171.
Davis, B.E., 2005, A guide to the proper selection and use of federally approved sediment and water-quality samplers: U.S. Geological Survey Open-File Report 2005–1087, 20 p. [Also available at https://doi.org/10.3133/ofr20051087.]
Davis, J.V., and Bell, R.W., 1998, Water-quality assessment of the Ozark Plateaus study unit, Arkansas, Kansas, Missouri, and Oklahoma – Nutrients, bacteria, organic carbon, and suspended sediment in surface water, 1993–95: U.S. Geological Survey Water-Resources Investigations Report 98–4164, 56 p. [Also available at https://doi.org/10.3133/wri984164.]
Edwards, T.K., and Glysson, G.D., 1999, Field methods for measurement of fluvial sediment: U.S. Geological Survey Techniques of Water-Resources Investigation, book 3, chap. C2, 80 p. [Also available at https://doi.org/10.3133/twri03C2.]
Guy, H.P., 1969, Laboratory theory and methods for sediment analysis: U.S. Geological Survey Techniques of Water-Resources Investigations, book 5, chap. C1, 58 p. [Also available at https://doi.org/10.3133/twri05C1.]
Guy, H.P., 1970, Fluvial sediment concepts: U.S. Geological Survey Techniques of Water-Resources Investigations, book 3, chap. C1, 55 p. [Also available at https://pubs.usgs.gov/twri/twri3-c1/.]
Iowa State University, 2023, MRMS Q3 rainfall estimates: Iowa Environmental Mesonet web page, accessed January 9, 2023, at https://mesonet.agron.iastate.edu/rainfall/.
MacDonald, D.D., Ingersoll, C.G., and Berger, T.A., 2000, Development and evaluation of consensus-based sediment quality guidelines for freshwater ecosystems: Archives of Environmental Contamination and Toxicology, v. 39, no. 1, p. 20–31, accessed July 18, 2023, at https://doi.org/10.1007/s002440010075.
Markland, K.M., Mills, C.T., Schumacher, J.G., Stricker, C.A., Knott, K., Kane, T.J., Lueckenhoff, L., and Campbell, K.M., 2024, Geochemical analyses of water, mine tailings, fluvial suspended sediments, fluvial bed sediments, and fluvial flood deposit sediments from the Big River and Meramec River drainage basins, Missouri: U.S. Geological Survey data release, accessed August 14, 2024, at https://doi.org/10.5066/P1B8YS78.
Mather, A.L., and Johnson, R.L., 2014, Quantitative characterization of stream turbidity-discharge behavior using event loop shape modeling and power law parameter decorrelation: Water Resources Research, v. 50, no. 10, p. 7766–7779. [Also available at https://doi.org/10.1002/2014WR015417.]
Missouri Department of Conservation, 1997, Big River—Watershed and Inventory Assessment: Missouri Department of Conservation web page, accessed December 30, 2022, at https://mdc.mo.gov/sites/default/files/mdcd7/downloads/page/020BigRiver_2020.pdf.
Missouri Department of Natural Resources, 2020, Lead fact sheet: Missouri Department of Natural Resources web page, accessed December 29, 2022, at https://dnr.mo.gov/print/document-search/pub0659.
Missouri Department of Natural Resources, 2021, History of lead mining in Missouri by county or district: Missouri Department of Natural Resources web page, accessed December 29, 2022, at https://dnr.mo.gov/document-search/history-lead-mining-missouri-county-or-district-pub2979/pub2979.
Mosby, D.E., and Weber, J.S., 2009, Final phase I damage assessment plan for southeast Missouri lead mining district—Big River mine tailings superfund site, St. Francois County and Viburnum Trend sites, Reynolds, Crawford, Washington, and Iron Counties: U.S. Fish and Wildlife Service web page, accessed December 30, 2022, at https://dnr.mo.gov/document-search/southeast-missouri-lead-mining-district-final-phase-1-damage-assessment-plan-january-2009.
Mueller, D.S., Wagner, C.R., Rehmel, M.S., Oberg, K.A., and Rainville, F., 2013, Measuring discharge with acoustic Doppler current profilers from a moving boat (ver. 2.0, December 2013): U.S. Geological Survey Techniques and Method, book 3, chap. A22, 95 p. [Also available at https://doi.org/10.3133/tm3A22.]
Mugel, D.N., 2017, Geology and mining history of the Southeast Missouri Barite District and the Valles Mines, Washington, Jefferson, and St. Francois Counties, Missouri: U.S. Geological Survey Scientific Investigations Report 2016–5173, 61 p., accessed January 19, 2023, at https://doi.org/10.3133/sir20165173.
National Oceanic and Atmospheric Administration [NOAA], 2022, NOWData—NOAA Online Weather Data: National Oceanic and Atmospheric Administration web page, accessed December 13, 2022, at https://www.weather.gov/wrh/Climate?wfo=lsx.
Oberg, K.A., Morlock, S.E., and Caldwell, W.S., 2005, Quality-assurance plan for discharge measurements using acoustic Doppler current profilers: U.S. Geological Survey Scientific Investigations Report 2005–5183, 46 p. [Also available at https://doi.org/10.3133/sir20055183.]
Pavlowsky, R.T., Owen, M.R., and Martin, D.J., 2010, Distribution, geochemistry, and storage of mining sediment in channel and floodplain deposits of the Big River System in St. Francois, Washington, and Jefferson Counties, Missouri: Missouri State University web page, accessed January 19, 2023, at https://oewri.missouristate.edu/_Files/Final_Report_2010_BigRiver_DistributionGeochemStorageSedimentChannelFP.pdf.
Pearson, A., and Hanes, D.M., 2016, How much sediment have we added to a floodplain? Preliminary results of using contaminated sediments to tease out enhanced deposition to a floodplain of the lower Meramec River, MO [abs.]: American Geophysical Union, Fall Meeting 2016, accessed April 4, 2023, at https://ui.adsabs.harvard.edu/abs/2016AGUFMEP31B0950P/abstract.
Phillips, J.M., Russell, M.A., and Walling, D.E., 2000, Time-integrated sampling of fluvial suspended sediment—A simple methodology for small catchments: Hydrological Processes, v. 14, no. 14, p. 2589–2602. [Also available at https://doi.org/10.1002/1099-1085(20001015)14:14<2589::AID-HYP94>3.0.CO;2-D.]
Rantz, S.E., and others, 1982, Measurement and computation of streamflow—Volume 1, Measurement of stage and discharge: U.S. Geological Survey Water Supply Paper 2175, 284 p. [Also available at https://doi.org/10.3133/wsp2175.]
Rasmussen, P.P., Gray, J.R., Glysson, G.D., and Ziegler, A.C., 2009, Guidelines and procedures for computing time-series suspended-sediment concentrations and loads from in-stream turbidity-sensor and streamflow data (revised 2011): U.S. Geological Survey Techniques and Methods, book 3, chap. C4, 52 p. [Also available at https://doi.org/10.3133/tm3C4.]
Smith, B.J., and Schumacher, J.G., 1991, Hydrochemical and sediment data for the Old Lead Belt, southeastern Missouri,1988–89: U.S. Geological Survey Open-File Report 91–211, 98 p. [Also available at https://doi.org/10.3133/ofr91211.]
Smith, B.J., and Schumacher, J.G., 1993, Surface-water and sediment quality in the Old Lead Belt, southeastern Missouri—1988-89: U.S. Geological Survey Water-Resources Investigations Report 93–4012, 92 p. [Also available at https://doi.org/10.3133/wri934012.]
Taggart, J.E., Jr., 2002, Analytical methods for chemical analysis of geologic and other materials: U.S. Geological Survey Open-File Report 02–223, 20 p. [Also available at https://doi.org/10.3133/ofr02223.]
Turnipseed, D.P., and Sauer, V.B., 2010, Discharge measurements at gaging stations: U.S. Geological Survey Techniques and Methods, book 3, chap. A8, 87 p. [Also available at https://doi.org/10.3133/tm3A8.]
U.S. Environmental Protection Agency [EPA], 2021, Big River Mine Tailing National Priorities List (NPL) Superfund Site, St. Francois County, Missouri—Fact sheet, October 2021: U.S. Environmental Protection Agency web page, accessed January 9, 2023, at https://www.epa.gov/mo/big-river-mine-tailings-national-priorities-list-npl-superfund-site-st-francois-county-1.
U.S. Environmental Protection Agency [EPA], 2022, Learn about lead: U.S. Environmental Protection Agency web page, accessed January 9, 2023, at https://www.epa.gov/lead/learn-about-lead.
U.S. Environmental Protection Agency [EPA], 2023, Big River mine tailings/St. Joe Minerals Corp. Desloge, Mo. cleanup progress: U.S. Environmental Protection Agency web page, accessed March 24, 2023, at https://cumulis.epa.gov/supercpad/SiteProfiles/index.cfm?fuseaction=second.Cleanup&id=0701639#bkground.
U.S. Geological Survey [USGS], 2006, Collection of water samples (ver. 2.0): U.S. Geological Survey Techniques of Water-Resources Investigations, book 9, chap. A4, accessed December 29, 2022, at https://pubs.water.usgs.gov/twri9A4/.
U.S. Geological Survey [USGS], 2023, USGS water data for the Nation: U.S. Geological Survey National Water Information System database, accessed April 10, 2023, at https://doi.org/10.5066/F7P55KJN.
Wagner, R.J., Boulger, R.W., Jr., Oblinger, C.J., and Smith, B.A., 2006, Guidelines and standard procedures for continuous water-quality monitors—Station operation, record computation, and data reporting: U.S. Geological Survey Techniques and Methods, book 1, chap. D3, 51 p., 8 attachments, accessed December 29, 2022, at https://pubs.water.usgs.gov/tm1d3.
Wilde, F.D., 2006, Temperature (ver. 2): U.S. Geological Survey Techniques of Water-Resources Investigations, book 9, chap. A6, sec. 6.1, accessed December 29, 2022, at https://doi.org/10.3133/twri09A6.1.
Wilde, F.D., Sandstrom, M.W., and Skrobialowski, S.C., 2014, Selection of equipment for water sampling (ver. 3.1): U.S. Geological Survey Techniques of Water-Resources Investigations, book 9, chap. A2, accessed December 29, 2022, at https://doi.org/10.3133/twri09A2.
Appendixes 1. –2. Model Archives Summaries for Regression Models
-
· Appendix 1. Model Archive Summary for Turbidity Regression Model to Estimate Suspended Sediment Concentration at U.S. Geological Survey Site Number 07017610; Big River below Bonne Terre, Missouri
-
· Appendix 2. Model Archive Summary for Streamflow Regression Model to Estimate Suspended Sediment Concentration at U.S. Geological Survey Site Number 07017610; Big River below Bonne Terre, Missouri
Conversion Factors
U.S. customary units to the International System of Units
Temperature in degrees Celsius (°C) may be converted to degrees Fahrenheit (°F) as follows:
°F=(1.8×°C)+32
Supplemental Information
Concentrations of chemical constituents in water are given in milligrams per liter (mg/L) or micrograms per liter (µg/L).
Concentrations of chemical constituents in sediments are given in milligrams per kilogram (mg/kg) or parts per million (ppm).
Turbidity is given in formazin nephelometric units (FNU).
A water year is the period from October 1 to September 30 and is designated by the year in which it ends; for example, water year 2021 was from October 1, 2020, to September 30, 2021.
Abbreviations
<
less than
CMWSC
Central Midwest Water Science Center
EPA
U.S. Environmental Protection Agency
EWI
equal-width increment
FNU
formazin nephelometric units
MRL
Mineral Research Laboratory
NOAA
National Oceanic and Atmospheric Administration
NWIS
National Water Information System
OLB
Old Lead Belt
PEC
probable effect concentration
PVC
polyvinyl chloride
QA
quality assurance
SSC
suspended sediment concentration
SSL
suspended sediment load
TEC
threshold effect concentration
TET
toxic effect threshold
USGS
U.S. Geological Survey
YSI
Yellow Springs Instruments
For more information about this publication, contact:
Director, USGS Central Midwest Water Science Center
400 South Clinton Street, Suite 269
Iowa City, IA 52240
319–337–4191
For additional information, visit: https://www.usgs.gov/centers/cm-water
Publishing support provided by the
Rolla Publishing Service Center
Disclaimers
Any use of trade, firm, or product names is for descriptive purposes only and does not imply endorsement by the U.S. Government.
Although this information product, for the most part, is in the public domain, it also may contain copyrighted materials as noted in the text. Permission to reproduce copyrighted items must be secured from the copyright owner.
Suggested Citation
Markland, K.M., and Buckley, C.E., 2024, Suspended sediment and trace element transport in the Big River downstream from the Old Lead Belt in southeastern Missouri, 2018–21: U.S. Geological Survey Scientific Investigations Report 2024–5085, 45 p., https://doi.org/10.3133/sir20245085.
ISSN: 2328-0328 (online)
Study Area
| Publication type | Report |
|---|---|
| Publication Subtype | USGS Numbered Series |
| Title | Suspended sediment and trace element transport in the Big River downstream from the Old Lead Belt in southeastern Missouri, 2018–21 |
| Series title | Scientific Investigations Report |
| Series number | 2024-5085 |
| DOI | 10.3133/sir20245085 |
| Publication Date | September 09, 2024 |
| Year Published | 2024 |
| Language | English |
| Publisher | U.S. Geological Survey |
| Publisher location | Reston, VA |
| Contributing office(s) | Central Midwest Water Science Center |
| Description | Report: ix, 45 p.; 2 Appendixes; Data Release; Dataset |
| Country | United States |
| State | Missouri |
| Online Only (Y/N) | Y |
| Additional Online Files (Y/N) | Y |