Mapping Karst Groundwater Flow Paths and Delineating Recharge Areas for Springs in the Little Sequatchie and Pryor Cove Watersheds, Tennessee
Links
- Document: Report (89.8 MB pdf) , HTML , XML
- Plate: Plate 1 (30.5 MB pdf)
- Figure: Figure 6, 11" X 17" (pdf)
- Data Releases:
- USGS Data Release - National Land Cover Database (NLCD) 2019 products
- USGS Data Release - Mapping karst groundwater flow paths and delineating recharge areas for springs in the Little Sequatchie and Pryor Cove watersheds, Tennessee
- USGS water data for the Nation - USGS NWIS database
- Version History: Version History (txt)
- NGMDB Index Page: National Geologic Map Database Index Page (html)
- Download citation as: RIS | Dublin Core
Acknowledgments
Special thanks are given to Kyle Lassiter who assisted with many different aspects of the project including his local knowledge of the landscape, providing transportation to remote parts of the study area, and for assisting on every round of dye injections. Thanks to Jason Richards for providing underwater cave survey data and in-cave observations for Blue Spring that were incorporated into both the dye flow paths and aided in some interpretations of tracer results. The author would also like to thank Rebecca McNabb, who also was crucial in helping the research team to access the more remote portions of the study area through the use of her off-road vehicle and expert driving skills. The author would also like to thank local landowners who provided access either for monitoring sites or for dye injection locations. Specific landowners we would like to thank include the Keener family, Ardevan Afrakteh, Dennis and Margaret Elliott, Daniel Fox, and the Hogan family. Bill Keener provided access for nearly every trip to the Little Sequatchie area, helped us to connect with other landowners, and even accompanied us on dye injections, providing photographic support. Thanks also to the Jasper Fire Department, who provided the use of a fire tanker truck to create temporary flowing conditions at dye injection sites in the Town of Jasper. The U.S. Fish and Wildlife Service and Tennessee Department of Environment and Conservation provided the funding for the project, and Santiago Martin and Brian Ham were instrumental in getting the project funded and executed. Tennessee Department of Environment and Conservation employees Roger McCoy and David Withers were helpful in acquiring permits for work at Sequatchie Cave, and in providing local knowledge of area biology. Finally, the author would like to thank Amy Hourigan and Kristi Hill of the U.S. Geological Survey who assisted in the gathering of charcoal packets throughout the study area and were extremely helpful in keeping the project on task and on time.
Abstract
The Little Sequatchie River and Pryor Cove Branch, in southern Tennessee, drain the eastern escarpment of the Cumberland Plateau to the Sequatchie River near the southern end of the Sequatchie Valley. The Little Sequatchie River is the largest tributary to the Sequatchie River by drainage area, covering over 120 square miles. The hydrology of the two drainage areas has been largely altered by karst processes, which has caused the majority of the streams to sink at the contact between the Mississippian Pennington Formation and the underlying Mississippian Bangor Limestone. The U.S. Geological Survey, in cooperation with and the U.S. Fish and Wildlife Service and Tennessee Department of Environment and Conservation, initiated a study in 2021 to map the karst groundwater pathways in both watersheds in order to delineate recharge areas for several springs. One of these springs, Sequatchie Cave, represents a significant habitat for two Species of Greatest Conservation Need, the Glyphopsyche sequatchie (Sequatchie caddisfly) and the federally endangered Marstonia ogmorhaphe (royal marstonia). Springs and springflow-dominated streams in the Little Sequatchie River valley and Pryor Cove also provide water for agricultural practices and serve as a drinking water source for nearby communities. During the study, a total of 25 dye injections were conducted over eight rounds from January 2022 through March 2023. Dye traces from these injections helped to delineate recharge areas for six major springs, ranging from 7.3 to 65.2 square miles in area. The majority of the dye traces remained subsurface (from sinkpoint to recovery site) for long distances, with karst groundwater travelling nearly 8 miles before resurfacing. The dye traces also had rapid traveltimes, often travelling hundreds to thousands of feet per hour. The goal of this project was to provide scientific data related to karst groundwater pathways and spring recharge areas to aid State and Federal agencies in making informed decisions to protect and preserve this unique and vulnerable karst system.
Introduction
Karst aquifers are some of the most vulnerable groundwater environments because of the inherent connectivity between surface streams and karst aquifers (Vesper and others, 2001; Goldscheider, 2005). Because of this connectivity, activities that occur within recharge areas for karst aquifers can have a direct and often rapid impact on water quality and quantity (Leibundgut,1998; Boyer and Pasquarell, 1999). Karst environments are also habitat for sensitive and often unique biota, and in the southeastern United States, these environments have a high endemism rate and can be particularly biodiverse (Niemiller and others, 2023). Thus, in karst environments, understanding the recharge areas that contribute flow to karst springs and caves is a crucial step toward protecting the biota that inhabit these systems (Jiang and others, 2008).
The southern Cumberland Plateau of Tennessee, Alabama, and Georgia is a physiographic region that has been noted as a hotspot for subterranean biodiversity (Culver and others, 2000, 2003; Niemiller and Zigler, 2013). This three-State region also has one of the highest densities of cave development in the United States, with over 15,000 documented caves. In Tennessee, the highest density of cave development occurs along the escarpment of the Cumberland Plateau, where alternating geologic units of siliciclastic and carbonate strata have created many opportunities for allogenic recharge to the karst aquifers.
The Little Sequatchie River valley and Pryor Cove drain the eastern escarpment of the Cumberland Plateau, near the southern end of the Sequatchie Valley (fig. 1). The hydrology of both drainage areas has been heavily altered by karst development, resulting in sinking streams, springs, and caves that are incorporated into the hydrology of the landscape (Mayfield, 1986). Some of these caves and springs have been documented as significant habitats for rare, threatened, and endangered species such as the Marstonia ogmorhaphe (royal marstonia) and the endemic Glyphopsyche sequatchie (Sequatchie caddisfly) (Thompson, 1977; U.S. Fish and Wildlife Service, 1994) (figs. 2 and 3).
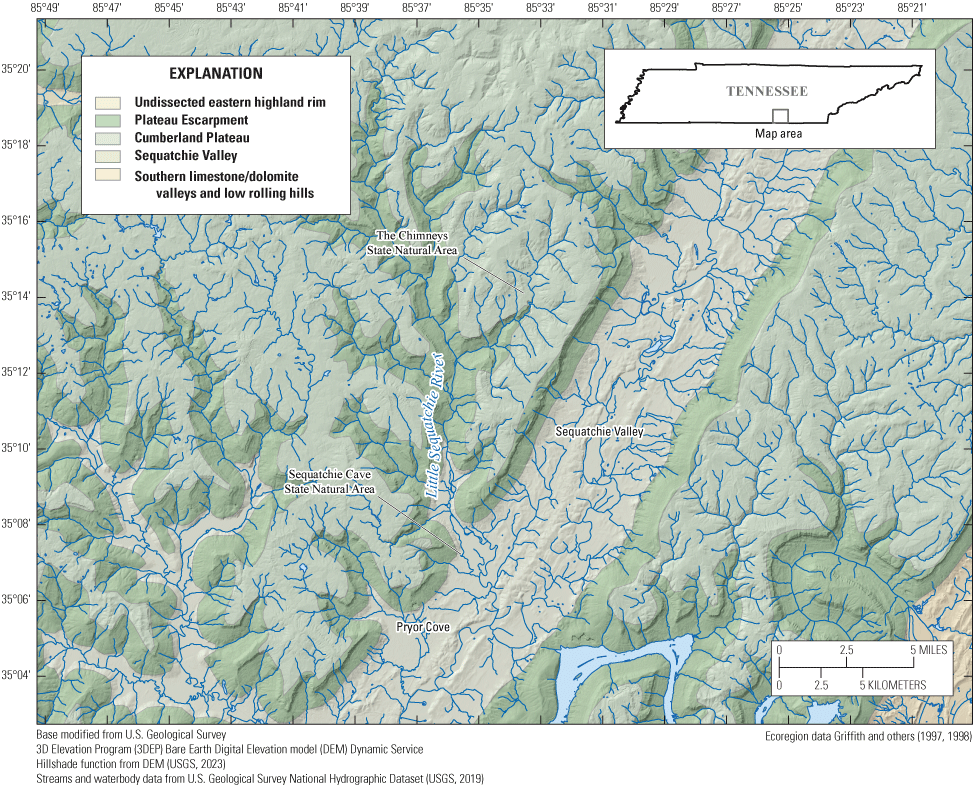
Map showing ecoregions in the study area.
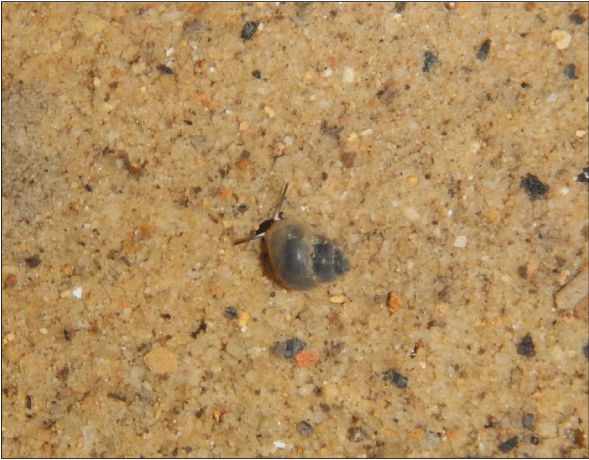
Photograph showing Marstonia ogmorhaphe (royal marstonia) snail. Photograph by David Withers, Tennessee Department of Environment and Conservation—Division of Natural Areas. Used with permission.
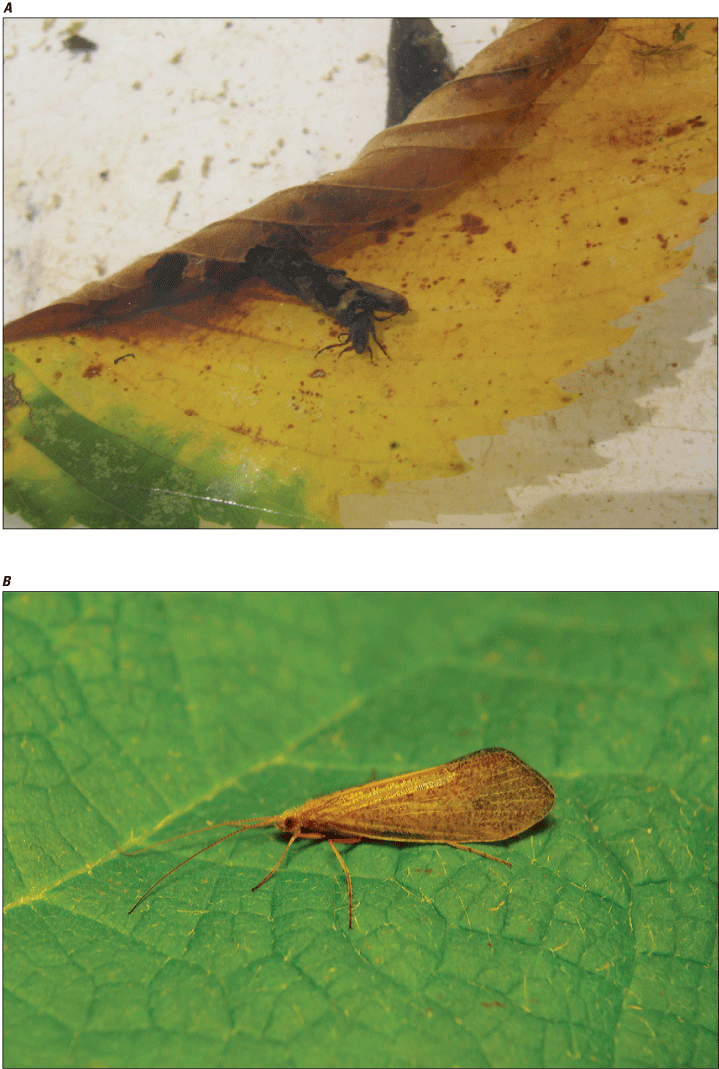
Photographs showing Glyphopsyche sequatchie (Sequatchie caddisfly) A, larva, and B, adult. Photograph of larval stage by David Withers, Tennessee Department of Environment and Conservation, Division of Natural Areas, used with permission; photograph of adult stage by Kevin Moulton, University of Tennessee, Knoxville, used with permission.
The U.S. Geological Survey (USGS), in cooperation with the U.S. Fish and Wildlife Service and Tennessee Department of Environment and Conservation, initiated a study in December 2021 to delineate recharge areas for springs utilized as habitat by these species through the use of dye tracing. The investigation supports Federal and State agencies in their management of sensitive biota and identification of areas that pose any major threat to the water quality of these karst resources. The project was conducted from December 2021 through May 2023 and included 25 dye injections and delineation of recharge areas for six major springs.
This report documents the mapping of karst groundwater flow paths and delineation of recharge areas for springs in the Little Sequatchie and Pryor Cove watersheds. Dye injections were performed and monitored at 39 cave stream, spring, and surface stream sites within the watersheds. The positive dye traces documented herein and delineated recharge areas are presented on a series of maps.
Setting
Geography and Hydrology
The Little Sequatchie River valley is located on the eastern escarpment of the Cumberland Plateau in southern Tennessee (fig. 1). The valley spans both Grundy and Marion Counties and is near the towns of Sequatchie and Gruetli-Laager (fig. 4A). The Little Sequatchie River is the largest tributary to the Sequatchie River, by drainage area, with an area of 131.7 square miles (mi2) at the confluence with the Sequatchie River. The Little Sequatchie watershed is bounded to the north by the Collins River watershed, to the west by the Battle Creek and Pryor Cove Branch watersheds, and to the east by the Griffith Creek watershed (USGS, 2019) (fig. 4B). Vertical relief is as much as 1,730 feet (ft) from the lowest to highest point in the watershed; however, the relief is closer to 1,000 ft within the valley itself. The river has no continuous record of stage or discharge, although streamflow measurements and peak streamflow data indicate a range in flow from 0.1 to 10,600 cubic feet per second (ft3/s) (USGS, 2023b).
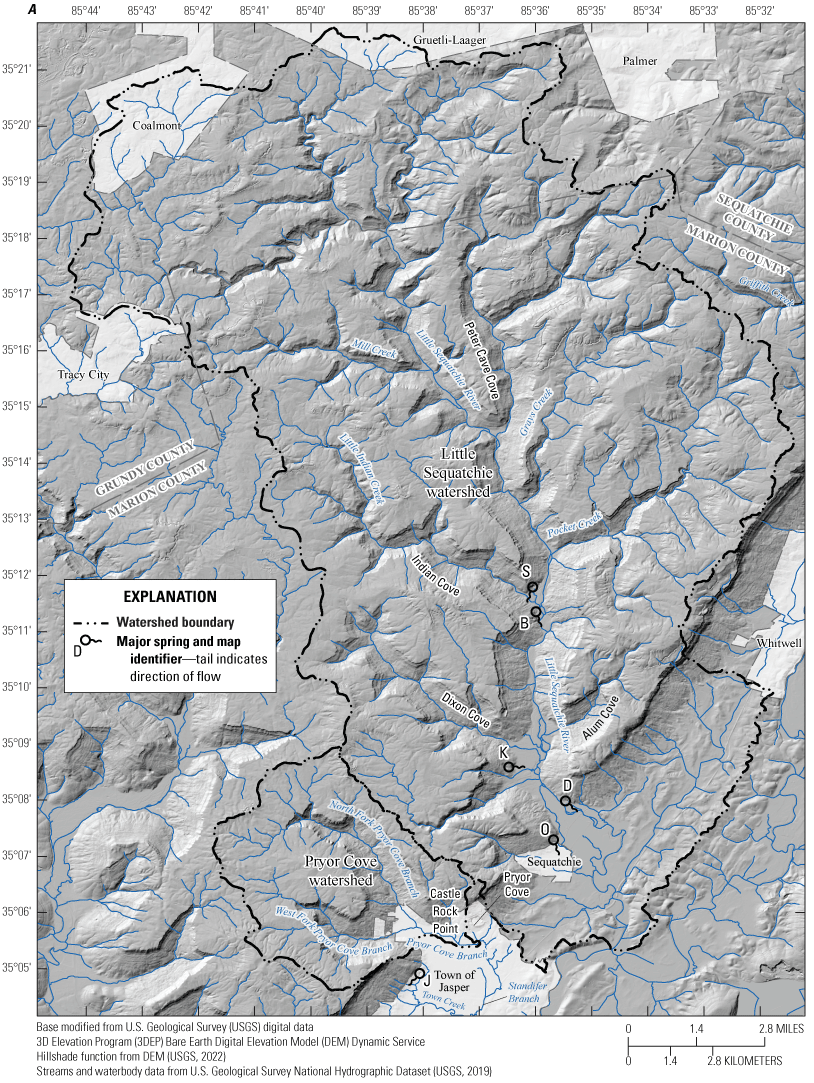
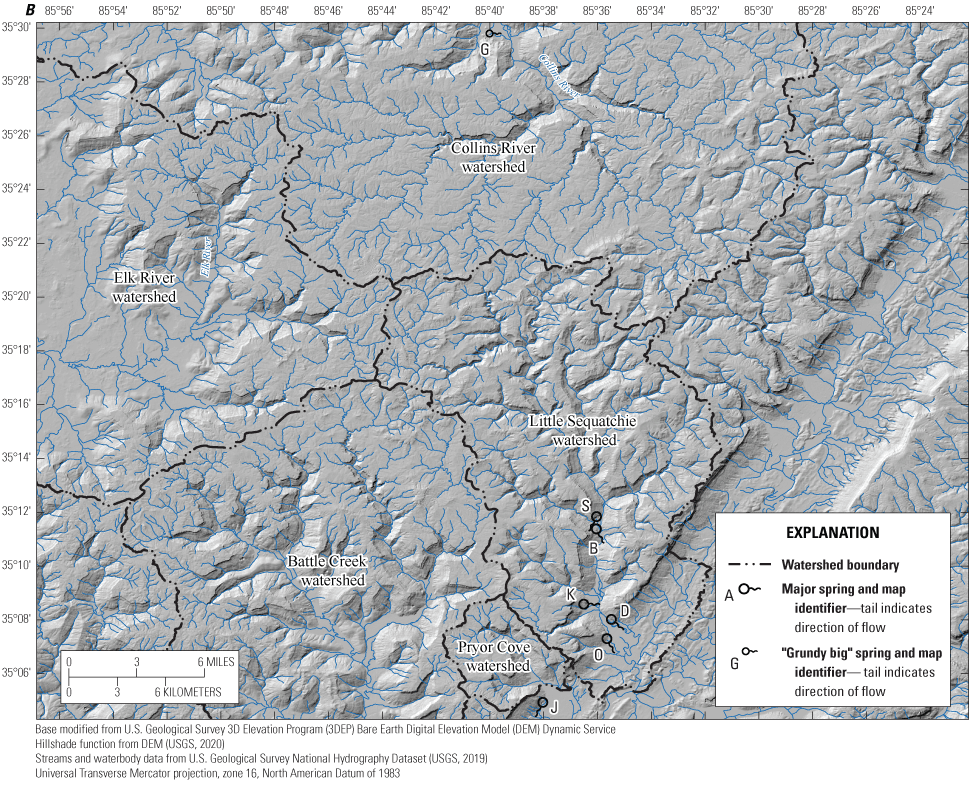
Maps showing A, Little Sequatchie watershed and adjacent areas, and B, regional watersheds and adjacent areas. B, the “Boils”; D, Dancing Fern Cave; J, Blue Spring; K, “Keira” spring; O, Owen Spring/Sequatchie Cave; S, Ship Cave.
Pryor Cove is located directly southwest of the lower Little Sequatchie River valley, sharing an east-west boundary with the Little Sequatchie watershed (fig. 4A). The cove consists of two main valleys whose principal streams, West and North Fork Pryor Cove Branches, contribute flow to Pryor Cove Branch. The total area for the Pryor Cove watershed is 12.8 mi2 at the confluence between Pryor Cove Branch and Standifer Branch. The cove is bounded on the east by the Little Sequatchie watershed, to the north by the Fiery Gizzard Cove watershed, and on the west by the Battle Creek watershed (fig. 4B) (USGS, 2019). Vertical relief of the Pryor Cove watershed is very similar to that of the Little Sequatchie watershed, with a total relief of 1,327 ft, and an elevation range from 650 to 1,977 ft above the National Geodetic Vertical Datum of 1929 (USGS, 1947).
Climate within the study area is classified as humid subtropical (Beck and others, 2018), with warm, humid summers and typically mild winters. Precipitation averages greater than 59 inches per year (U.S. Climate Data, 2023), with the winter and early spring being the seasons having the highest rainfall totals, although afternoon atmospheric convection brings additional rainfall during the summer months. The forest cover in the study area is a mixed mesophytic forest, with forest communities varying by both position along the Cumberland Plateau top and escarpment as well as by landform type (slopes versus gorges versus stream terraces) (Tennessee Division of Forestry, 2020). Pines are largely restricted to the top of the Cumberland Plateau on the acidic soils weathered from sandstones, whereas mixed oak and chestnut oak forests occupy the Cumberland Plateau escarpment and hemlocks may be found in deeper gorges and may occur next to river birch and sycamore trees alongside streams (Tennessee Division of Forestry, 2020). Forests in Tennessee have undergone dramatic changes since the initial settlement of the land because of historic logging practices and fire suppression (Baker and Van Lear, 1998, Woodbridge and Dovciak, 2022). Within the Little Sequatchie and Pryor Cove watersheds most areas have received some timber harvest, although some small areas of undisturbed forest do exist in the more remote and inaccessible portions of the study area. Land ownership within the study area is predominantly privately owned and several landowners own large parcels exceeding 1,000 acres, particularly within the Little Sequatchie watershed. State-owned lands are present in the Little Sequatchie watershed at Sequatchie Cave State Natural Area and The Chimneys State Natural Area, which total 133 and 33 acres, respectively. At least one small parcel of land in Pryor Cove is owned by a nonprofit organization, Tennessee River Gorge Trust, that preserves a rock-climbing area at Castle Rock Point (fig. 4A). Land use-land cover data were analyzed overall for each of the watersheds. Both watersheds are forest cover dominated, with over 75 percent of the watersheds classified as forest cover (Dewitz and USGS, 2021). Developed land is an overall higher percentage in the Pryor Cove watershed, because of the presence of the Town of Jasper, but is overall a much smaller area than the areas classified as developed in the Little Sequatchie watershed because the Little Sequatchie watershed is much larger. Land use-land cover data are more varied in the Little Sequatchie watershed, likely because of the much larger area (Dewitz and USGS, 2021).
Geology
The geology of the Little Sequatchie and Pryor Cove watersheds has been described and mapped at varying scales by multiple geologists and agencies (Wilson and others, 1956; Milici and Finlayson, 1979, 1983; Jones and Moore, 1986; Milici and others, 1986). The geology of the Little Sequatchie River valley and of nearby Pryor Cove (fig. 4) is similar to other portions of the Cumberland Plateau where the top of the plateau and ridgetops are capped by Lower Pennsylvanian siliciclastics although the lower slopes and valley floor are largely composed of Upper Mississippian carbonate strata (fig. 5A). Although much of the following discussion focuses on the surficial geology of the study area, the subsurface geology does play a role in the karst hydrology of the area, particularly within Pryor Cove. The units in the study area extend upward from the Mississippian Monteagle Limestone in the valley bottoms to the Pennsylvanian Rockcastle Conglomerate of the Crab Orchard Mountains Group along the top of the Cumberland Plateau. Quaternary alluvial deposits occur along the lower stream valleys for the Little Sequatchie River (fig. 5B) and Pryor Cove. The Cambrian and Ordovician units in the Sequatchie Valley east of the Sequatchie fault are not included in the study area. The following descriptions of the stratigraphic units are compiled and summarized from detailed geologic maps published at a scale of 1:24,000 and created by Milici and Finlayson (1979, 1983)26, Jones and Moore (1986), and Milici and others (1986).
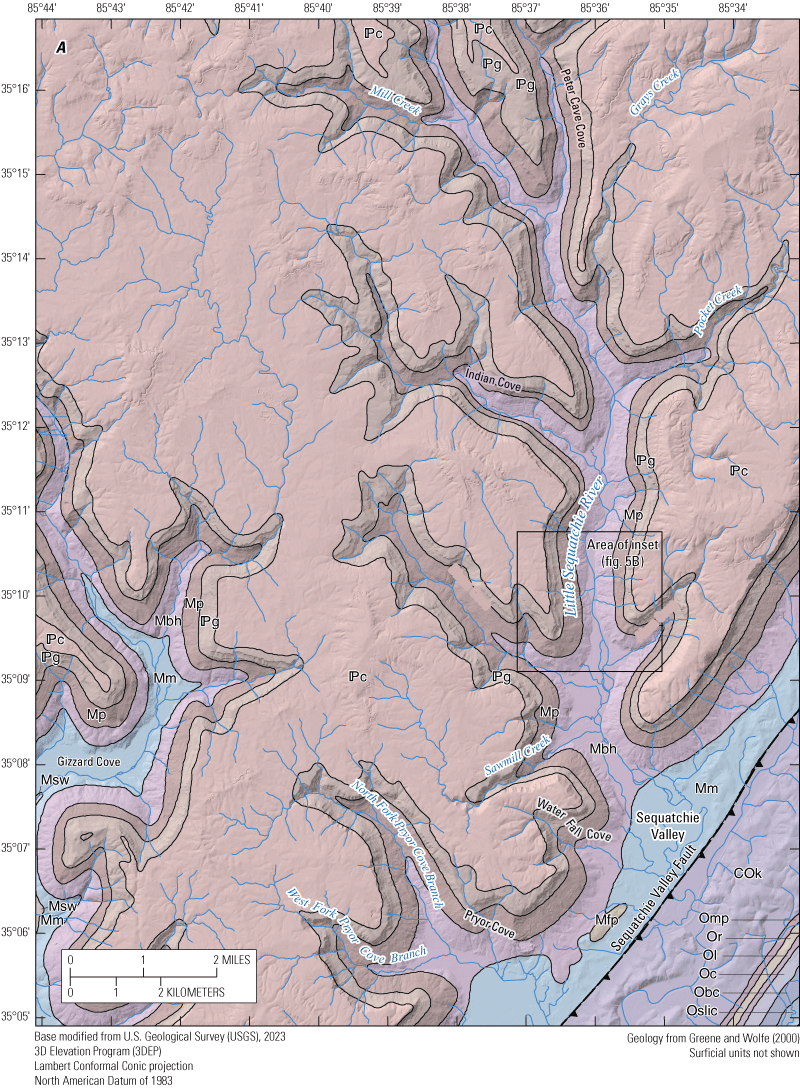
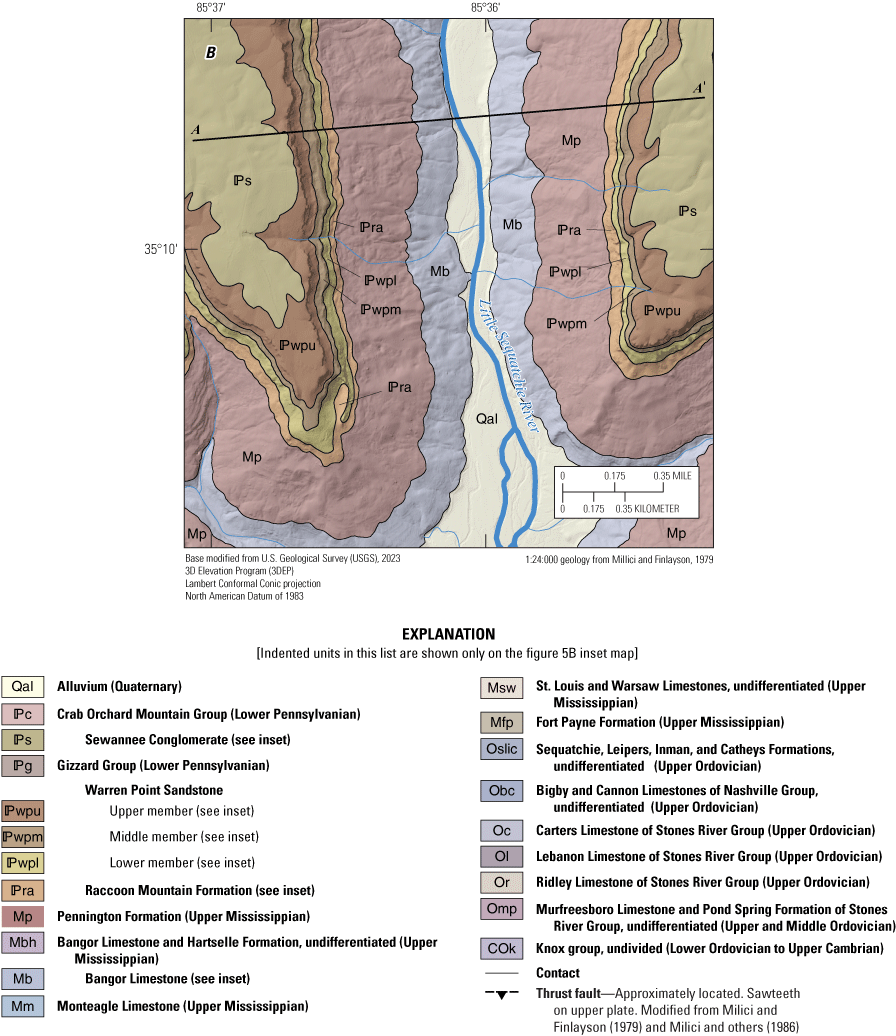
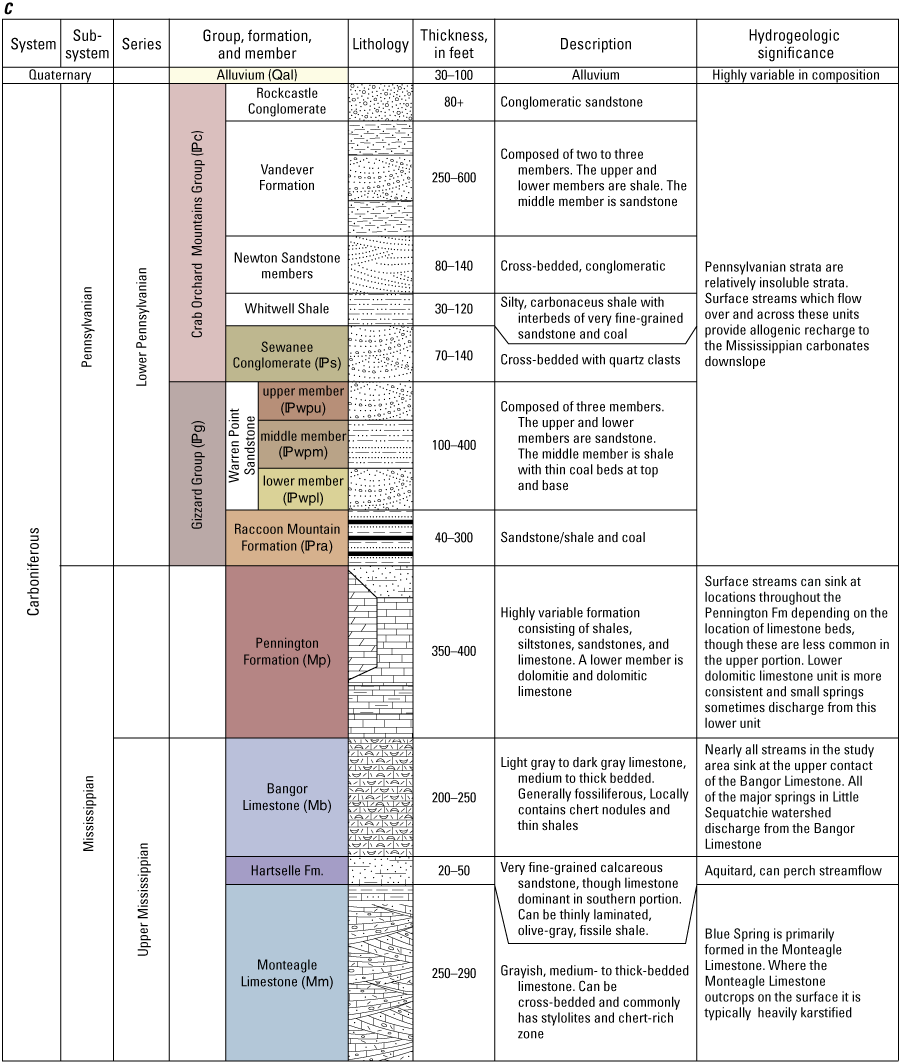
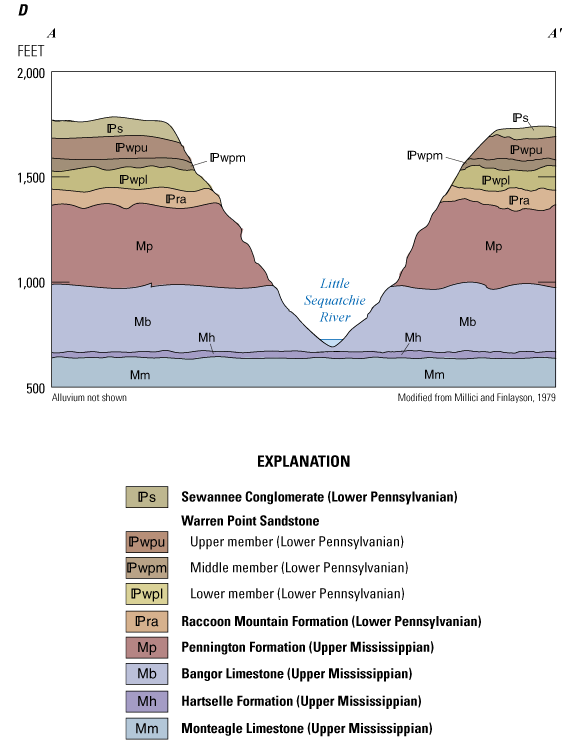
A, Geologic map, B, detailed geologic inset map; C, stratigraphic column, and D, schematic cross section the Little Sequatchie River valley north of Alum Cove. The Cambrian and Ordovician units in the southeastern part of the geologic map are not part of the study area and thus are excluded from the stratigraphic column.
The Mississippian Monteagle Limestone is a grayish, medium- to thick-bedded limestone, which can be cross-bedded and commonly has stylolites as well as chert-rich zones (fig. 5C). The Monteagle Limestone can be 250–290 ft thick in the study area; however, the unit crops out only in limited locations in the study area, existing below the valley floors and alluvial deposits. The Monteagle Limestone is the primary unit in which the passages of Blue Spring (known locally as “Jasper Blue spring”) are formed. Above the Monteagle Limestone, but still largely located beneath the valley floors, is the Mississippian Hartselle Formation, which is a calcareous sandstone and arenaceous limestone that can often act as an aquiclude or aquitard in similar areas. The Hartselle Formation is as much as 50 ft thick and is absent in portions of the study area where the Bangor Limestone lies unconformably on the Monteagle Limestone. Throughout the study area, the Hartselle is largely subvalley floor (fig. 5D), although some limited exposures are present in areas adjacent to the portion of the main Sequatchie Valley near the mouth of both Pryor Cove and the Little Sequatchie River valley (Milici and others, 1986). Throughout much of the study area, the valley floors and base of the Cumberland Plateau are underlain by Mississippian Bangor Limestone, a light gray to dark gray limestone with a total thickness of 200–250 ft. In the study area, the Bangor Limestone is heavily karstified, with many of the springs and caves located in the Bangor. Overlying the Bangor Limestone is the Mississippian Pennington Formation, a highly varied formation consisting of shales, siltstones, sandstones, and limestones, with a total thickness of 350–400 ft. A lower member of the Pennington is a carbonate member that can be either a dolomite or dolomitic limestone, which is often karstified; many small springs discharge from this lower unit before sinking at the contact with the Bangor Limestone.
Above the Pennington Formation are a series of Lower Pennsylvanian siliciclastic strata that range from shales to conglomeratic units. Directly above the Pennington Formation is the Gizzard Group, consisting of the Raccoon Mountain Formation and the Warren Point Sandstone (fig. 5B, C). The Raccoon Mountain Formation is a sandstone with shale interbeds and a coal unit near the base of the formation. The Raccoon Mountain Formation underlies the Warren Point Sandstone, a formation that contains a middle shale unit and is as much as 400 ft thick in the Little Sequatchie watershed. The Crab Orchard Mountains Group overlies the Gizzard Group and consists of the Sewanee Conglomerate, Whitwell Shale, and Newton Sandstone. The Sewanee Conglomerate overlies the Warren Point Sandstone and is a 70- to 140-ft-thick formation that is cross-bedded and includes quartz pebbles as much as 1.5 inches in length. Above the Sewanee Conglomerate is the Whitwell Shale, a grayish silty shale with two major coal seams (the Sewanee and Richland coal seams) found throughout the 30- to 120-ft thickness. The Newton Sandstone overlies the Whitwell Shale and can reach thicknesses of as much as 140 ft, and is generally cross-bedded but can be conglomeratic in areas. The Vandever Formation, which overlies the Newton Sandstone, consists of two to three members, depending on location, and generally consists of a middle sandstone member in between two shale members with a total thickness of 250–600 ft. In the northern portions of the watershed at the highest elevations are areas underlain by the Rockcastle Conglomerate, a medium- to coarse-grained conglomerate with quartz pebbles that is greater than 80 ft thick. The youngest geologic units in the study area are the Quaternary alluvial deposits, which are present in the valley floors, with thicknesses of 30 to 100 ft, although most deposits are near the lower end of this range.
Caves and Karst
Cave and karst features are abundant throughout the Little Sequatchie and Pryor Cove drainage areas, particularly in areas with exposures of the Pennington Formation and Bangor Limestone, which typically occur along the lower slopes and valley floors. Although limestone beds are present in the Pennington Formation, the interbeds of shale, chert, and sandstone can make cave and karst development less consistent than in the other Mississippian strata. However, in the study area, both caves and stream sinks can be found throughout the entire thickness of the Pennington Formation. The majority of the major stream sinks throughout the study area are located at the contact between the Pennington Formation and the underlying Bangor Limestone, hereafter referred to as the “Pennington-Bangor contact.” The sinkpoints can migrate upstream or downstream depending on hydrologic conditions, typically migrating upstream during drier periods and downstream during wetter periods. Downstream from these major sinkpoints, extensive reaches of dry streambed are common that only receive flow during large flood events (figs. 6 and 7). Eventually, several miles downstream from the stream sinkpoints, springs resurge creating the perennial reaches of the major streams. There are 103 documented caves in the Little Sequatchie and Pryor Cove drainage areas, ranging from 50 ft to 6.75 miles (mi) in length (Tennessee Cave Survey, unpub. data, 2023).1 In the study area, 60 caves (58 percent) are in the Bangor Limestone, 40 (39 percent) are in the Pennington Formation, 2 (2 percent) are in the Monteagle Limestone, and 1 (<1 percent) is in the Hartselle Formation (Tennessee Cave Survey, unpub. data, 2023). The numerous caves in the study area range widely in form, from stream caves to vertical pit caves to short bluff caves. Many of the longer caves in the upper portion of both Little Sequatchie River valley and Pryor Cove are formed below the elevation of the valley floor. In the Little Sequatchie River valley upstream from Pocket Creek, many of these “subvalley floor caves” are air-filled for much of the year, but portions of the caves may flood for extended periods following larger precipitation events. The longest cave in Pryor Cove, Blue Spring, is a 2.46-mi-long underwater cave, formed below the valley floor, and is the only known cave in Pryor Cove formed in Monteagle Limestone. The caves and springs in the study area are also habitat for unique biota, with threatened and endangered species inhabiting spring runs at both Sequatchie Cave and Blue Spring (Thompson, 1977; U.S. Fish and Wildlife Service, 1994).
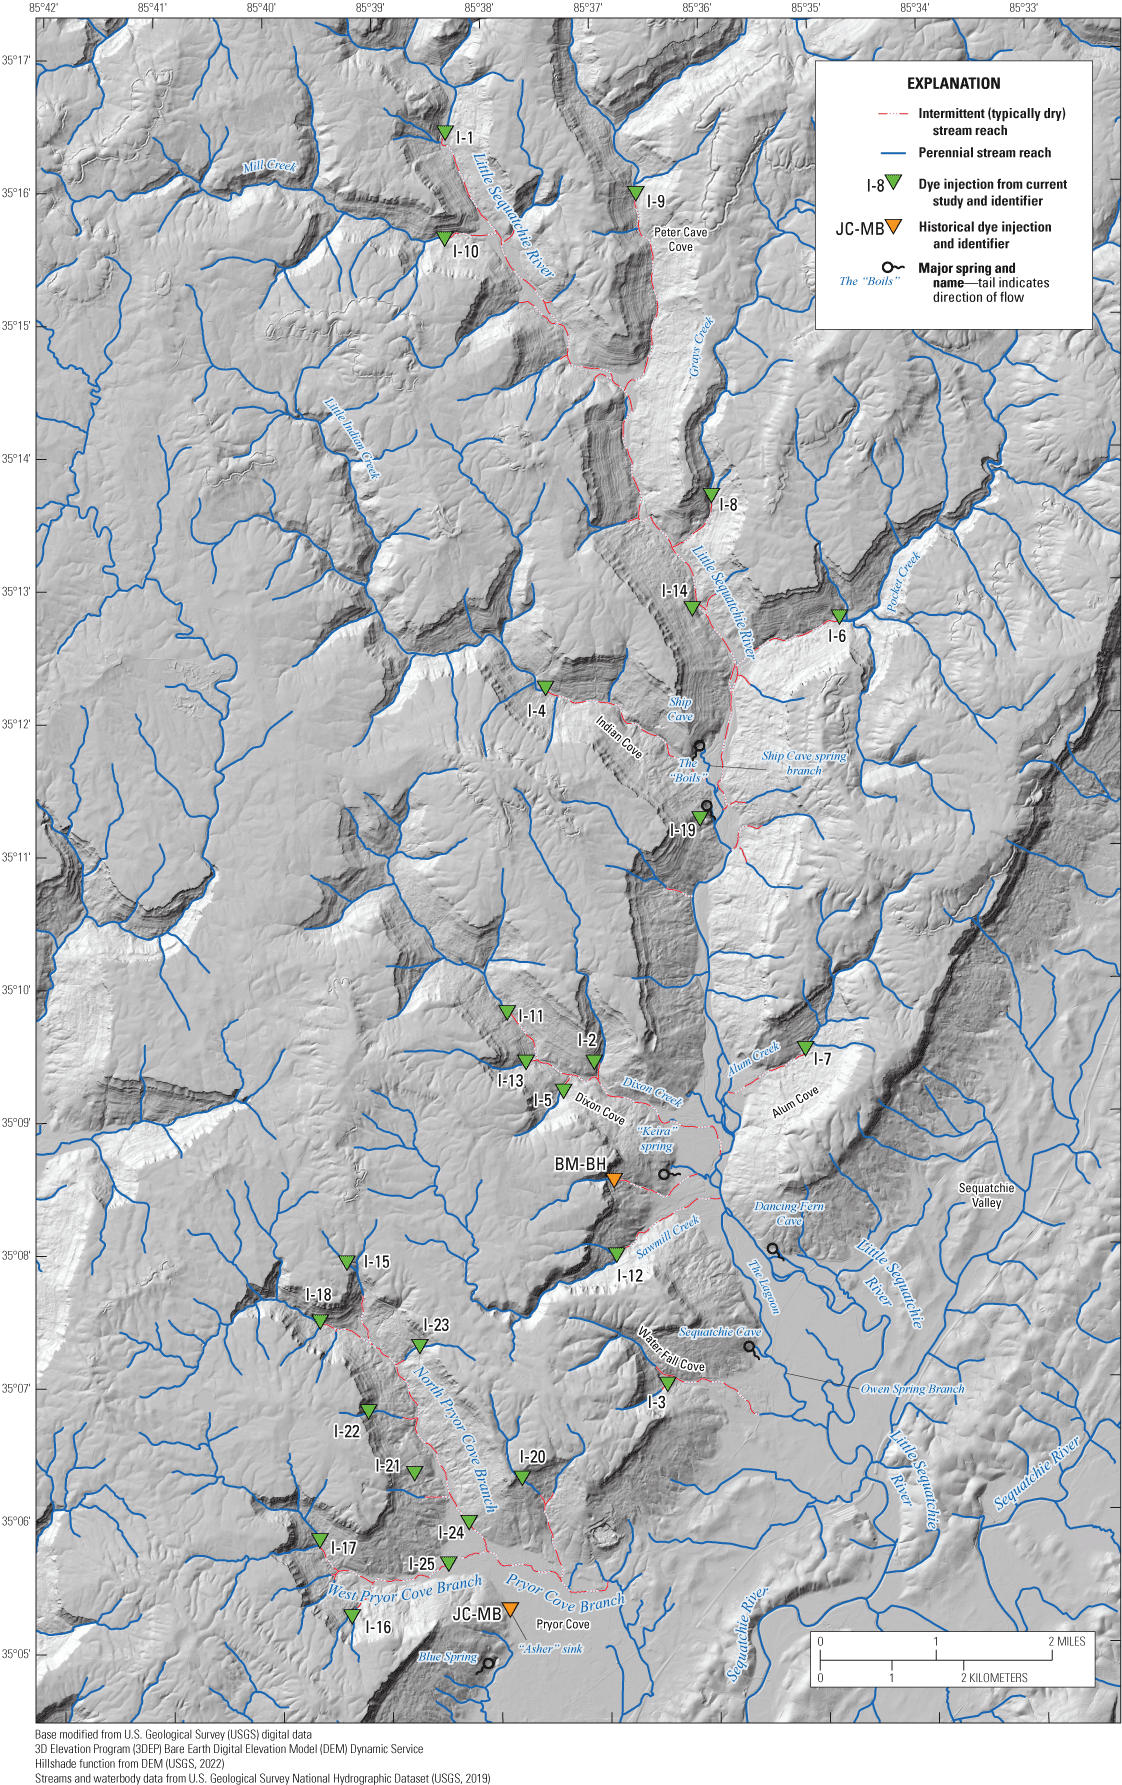
Map showing dry reaches and perennially flowing stream reaches in the Little Sequatchie River and Pryor Cove watersheds.
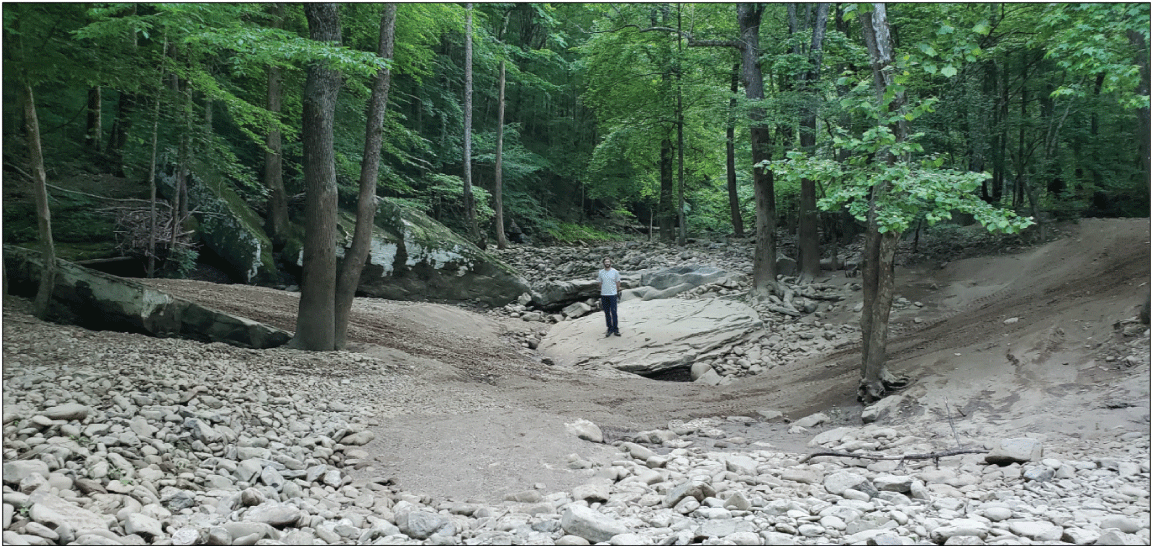
Photograph showing a dry reach of streambed for the Little Sequatchie River near Peter Cave Cove. Photograph by Benjamin V. Miller, U.S. Geological Survey.
This study initially focused on delineating recharge areas for some of the biologically significant springs; however, as fieldwork was conducted, results began to indicate that recharge areas could be delineated for several other significant springs. Each major spring that was studied and had a recharge area delineated is briefly described next. The locations of the springs and their geographic relation to one other are shown on figures 4 and 6.
Sequatchie Cave
Sequatchie Cave has several synonyms, namely “Owen” Spring, Blowing Spring, and Blowing Cave. The spring, located in the town of Sequatchie, Tennessee (fig. 4A), at the mouth of the Little Sequatchie River valley, issues from the entrance to a 1.25-mi-long stream cave (figs. 6 and 8) (Tennessee Cave Survey, unpub. data, 2023). The cave extends into the hillside and can be followed upstream travelling north before the cave turns westward approximately 1,700 ft from the entrance. The only accessible tributary to the main cave stream is located 400–500 ft in-cave from the entrance and enters the main stream from the southwest. The 1.25-mi-long spring branch, downstream from the cave, represents a significant portion of the habitat for the federally endangered Marstonia ogmorhaphe and for the Glyphopsyche sequatchie, which is designated as a Species of Greatest Conservation Need in Tennessee (Tennessee State Wildlife Action Plan, 2015).
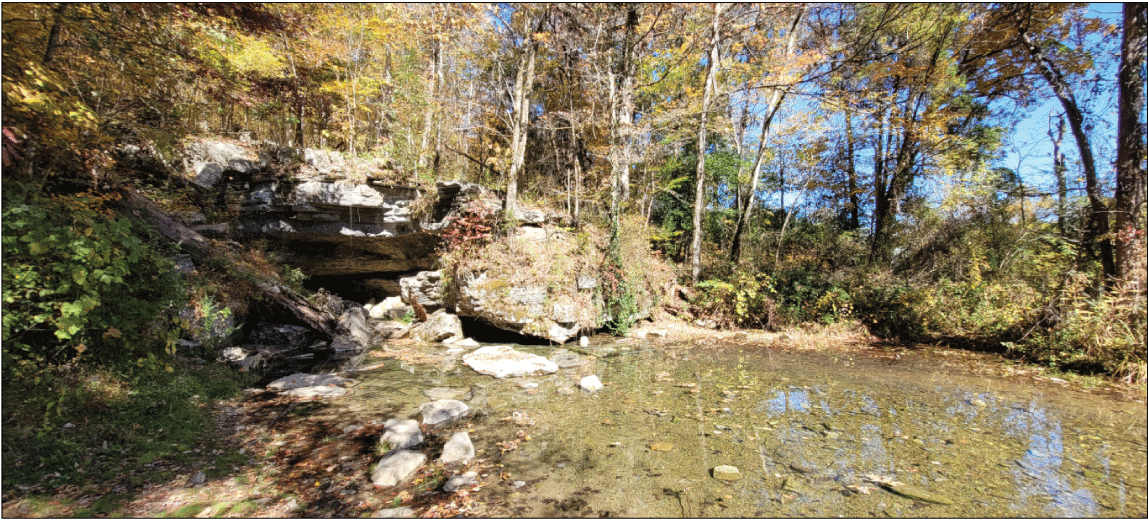
Photograph showing Sequatchie Cave entrance and spring outlet. Photograph by Benjamin V. Miller, U.S. Geological Survey.
“Keira” Spring
A feature known locally (and referred to herein) as “’Keira’ spring” is an ephemeral spring located on the west side of Little Sequatchie River valley between Sawmill Creek and Dixon Cove (fig. 6). The spring rises from a bluehole at the base of a Bangor Limestone bluff (fig. 9), ultimately issuing from a cave opening located 10–15 ft below the water surface when the spring is flowing. Spring flow can cease for extended periods during extremely dry conditions (fig. 9B). During these cessations in flow, the air-filled cave can be entered and its passage followed for 300 ft before reaching a sump pool (Tennessee Cave Survey, unpub. data, 2023).
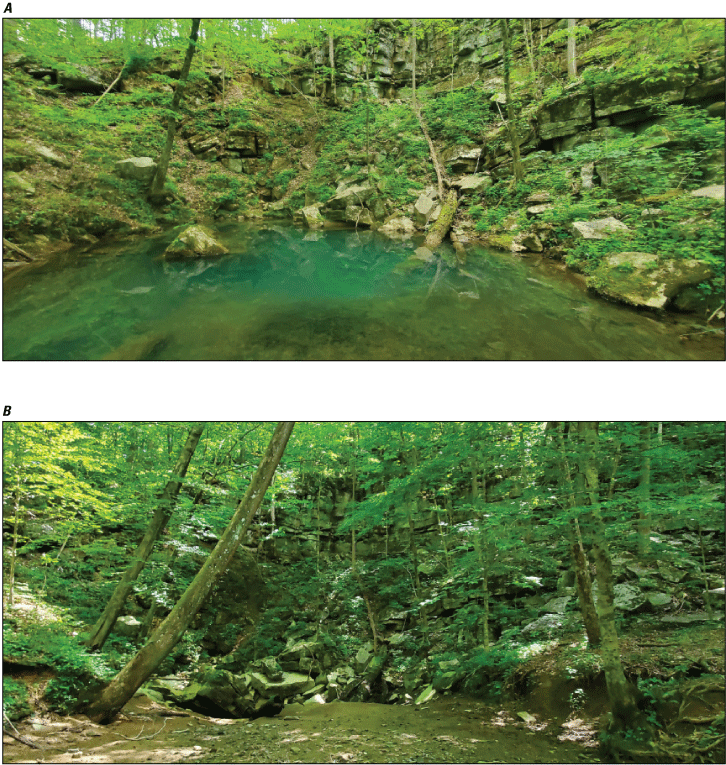
Side-by-side photographs showing “Keira” spring A, with, and B, without flow. Photographs by Benjamin V. Miller, U.S. Geological Survey.
Blue Spring
Blue Spring is a large spring located at the base of the Cumberland Plateau escarpment and near the mouth of Pryor Cove in the Town of Jasper, Tennessee (figs. 4 and 6). The spring discharges from a 2.46-mi-long underwater cave that is over 144 ft deep (Tennessee Cave Survey, unpub. data, 2023). The underwater cave is formed in Monteagle Limestone and spring flow rises from the underwater passage in a large, elongated sink (karst window) (fig. 10) before flowing beneath a short natural bridge to resurge from the spring outlet, which is the start of Town Creek (fig. 4). The spring is utilized as a drinking-water source by the Town of Jasper, and a treatment facility is located adjacent to the spring. The spring run is also habitat for the federally listed Marstonia ogmorhaphe (U.S. Fish and Wildlife Service, 1994; P.D. Johnson and others, Alabama Department of Conservation and Natural Resources, written commun. 2019).2 Flows at Blue Spring fluctuate with hydrologic conditions and, based upon observations of stream width, depth and velocity, are estimated to exceed 100 ft3/s during flood conditions.
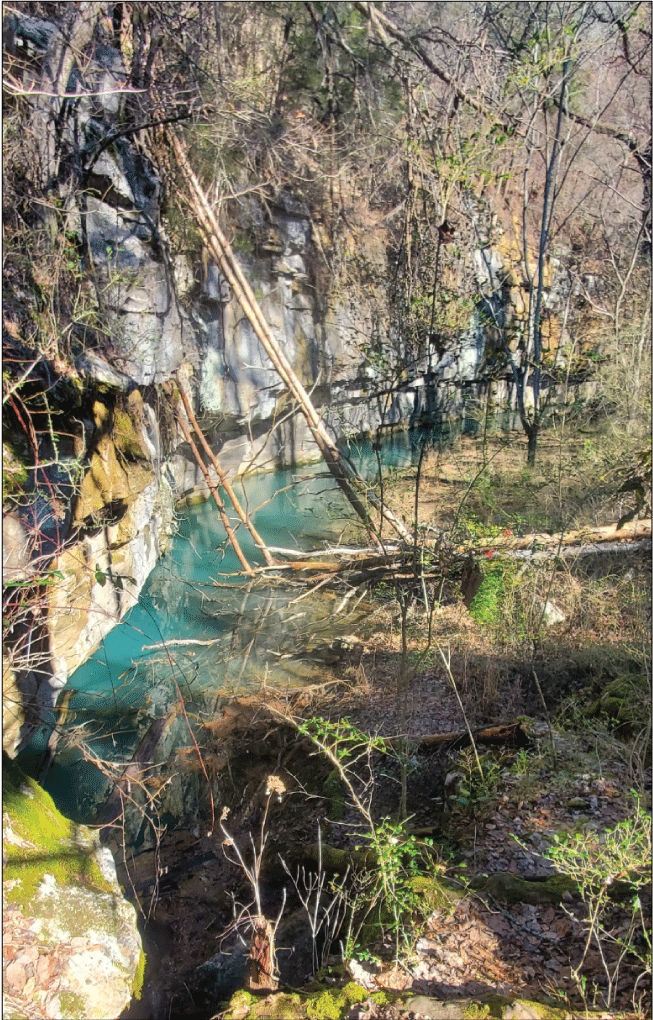
Photograph showing Blue Spring. Photograph by Benjamin V. Miller, U.S. Geological Survey.
Dancing Fern Cave
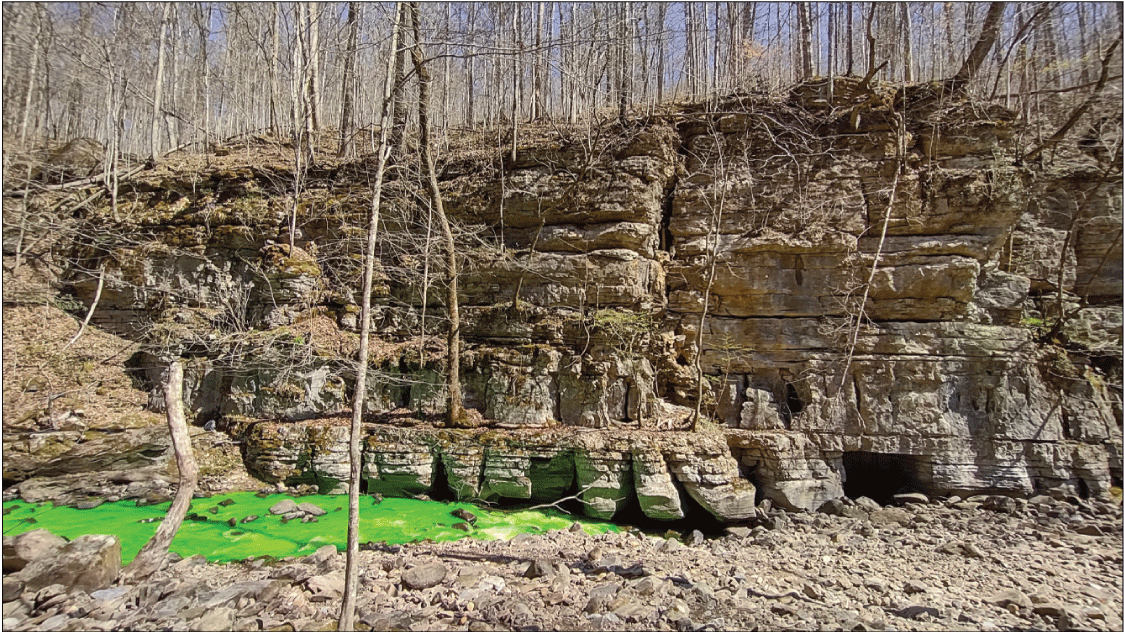
Dancing Fern Cave is a large spring cave located on the east side of the Little Sequatchie River valley near its mouth where the valley merges with the Sequatchie Valley (fig. 6). A large spring issues from the cave entrance (fig. 11) into a 2,000-ft-long spring branch that drains into the Little Sequatchie River. The cave is a 1 mi-long stream cave characterized by long sections of passage that require swimming and by faults in the Bangor Limestone that are located toward the back of the cave (Tennessee Cave Survey, unpub. data, 2023). The cave is largely one main passage, although one short side passage is located 75 percent of the way into the cave system. Flows from Dancing Fern Cave are typically large, and flows are estimated to exceed 50–100 ft3/s are not uncommon, based upon observations of stream width, depth, and velocity.
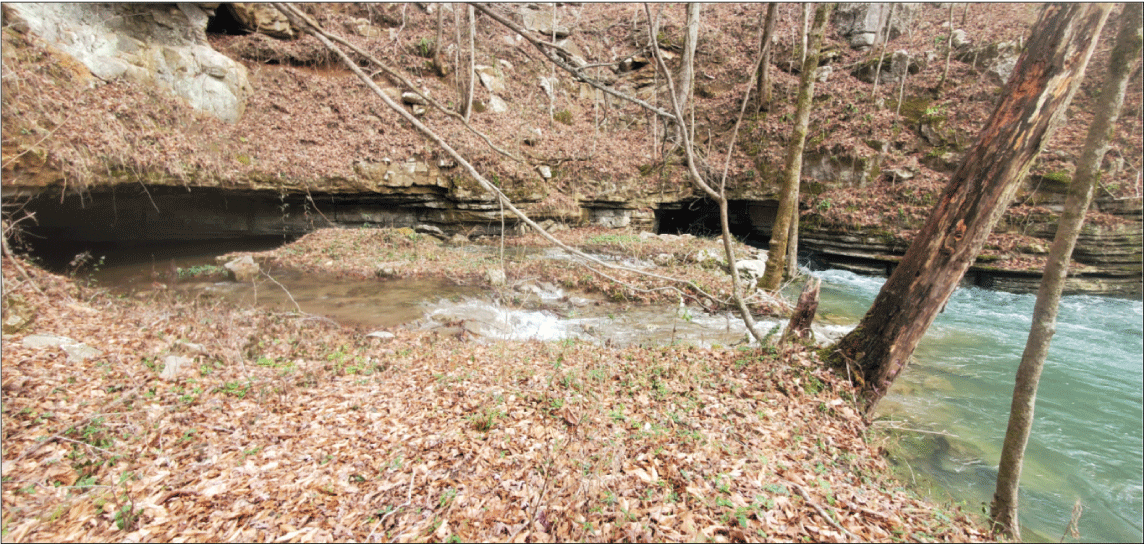
Photograph showing Dancing Fern entrance or spring branch. Photograph by Benjamin V. Miller, U.S. Geological Survey.
Ship Cave
Ship Cave and its accompanying spring are located upstream from a spring group known locally (and referred to herein) as “the ‘Boils’” on the tip of the ridge between Indian Cove and the main Little Sequatchie River valley (fig. 6). The spring issues from a large pile of boulders (fig. 12) before flowing down a 0.45 mi-long spring branch to join the stream from Indian Cove and then flowing 0.4 mi farther to the confluence with the Little Sequatchie River. The spring creates the first perennial flow in the Little Sequatchie River downstream from the major stream sinks and upstream from the “Boils.” The water that discharges from Ship Cave spring can also be followed underground for approximately 0.5 mi. through large, voluminous cave passages that generally trend up the north side of Indian Cove (Tennessee Cave Survey, unpub. data, 2023). Although the spring primarily discharges from one outlet, additional overflow springs are activated during high flow that are near the main outlet along the spring branch. One additional perennial spring, known locally (and referred to herein) as “’Indian Ship’ spring,” is part of the Ship Cave hydrologic system and is also near an ephemeral overflow spring.
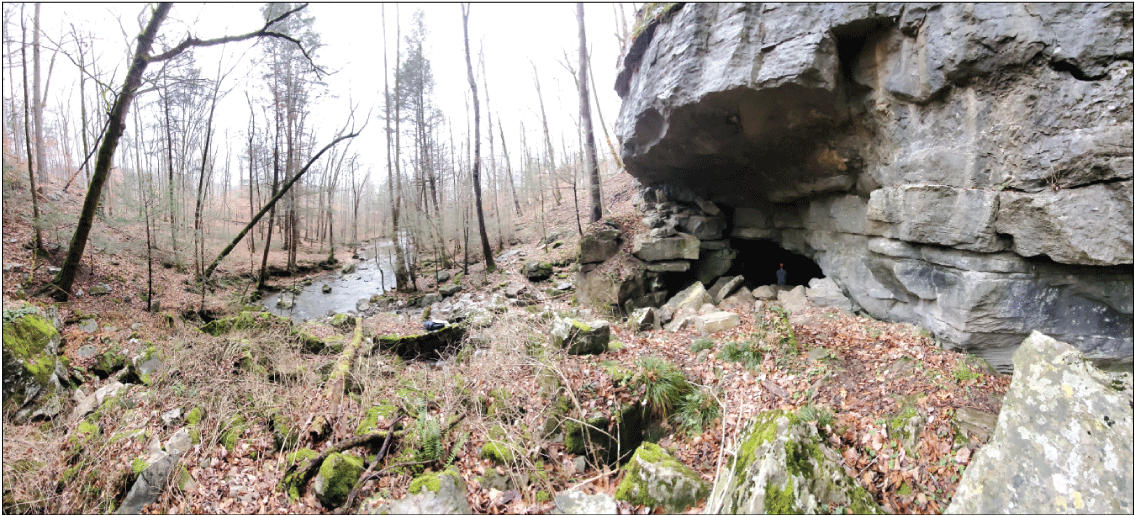
Photograph showing feature known locally as Ship Cave spring. Photograph by Benjamin V. Miller, U.S. Geological Survey.
The “Boils”
The “Boils” (fig. 13) is a multiple-outlet distributary spring system located on the west side of the Little Sequatchie River valley, approximately 0.5 mi downstream from the mouth of Indian Cove (fig. 6). The spring group varies in the number of spring outlets depending on hydrologic conditions, with only 1 or 2 outlets during low-flow conditions and greater than 11 outlets during high-flow conditions. Although one major spring “boils” up from the streambed out of cobbles and sediment (site no. 005 on table 1 and fig. 14C), the majority of the springs within this system discharge from outlets along the spring branch banks. Springs discharge from both sides of the spring branch as well as from the streambed sediments. During base-flow periods, the “Boils” provides the bulk of the flow observed in the Little Sequatchie River downstream from the springs. The river is nearly dry upstream from the “Boils,” except for the stream flow from Ship Cave that joins the river just upstream from the “Boils” spring branch. Discharge from the spring group is estimated to exceed 100 ft3/s during high-flow periods and drop below 10 ft3/s during low-flow periods, based upon observations of stream width, depth and velocity.
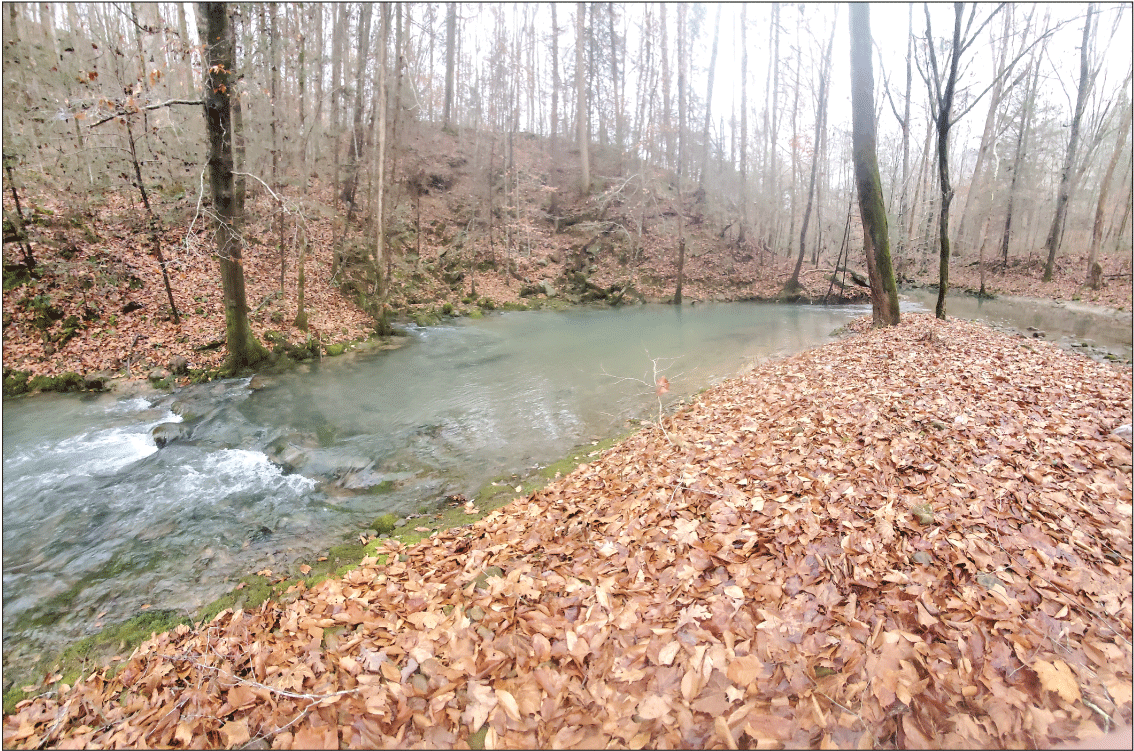
Photograph showing the “Boils” spring group. Photograph by Benjamin V. Miller, U.S. Geological Survey.
Table 1.
Monitoring sites used in this study.[Elevation data from the 3DEP lidar explorer (U.S. Geological Survey, 2023a). Elevation data referenced to the North American Vertical Datum of 1988. no., number; ft, foot; CV, cave stream; SP, spring; ST, surface stream; Hwy, Highway]
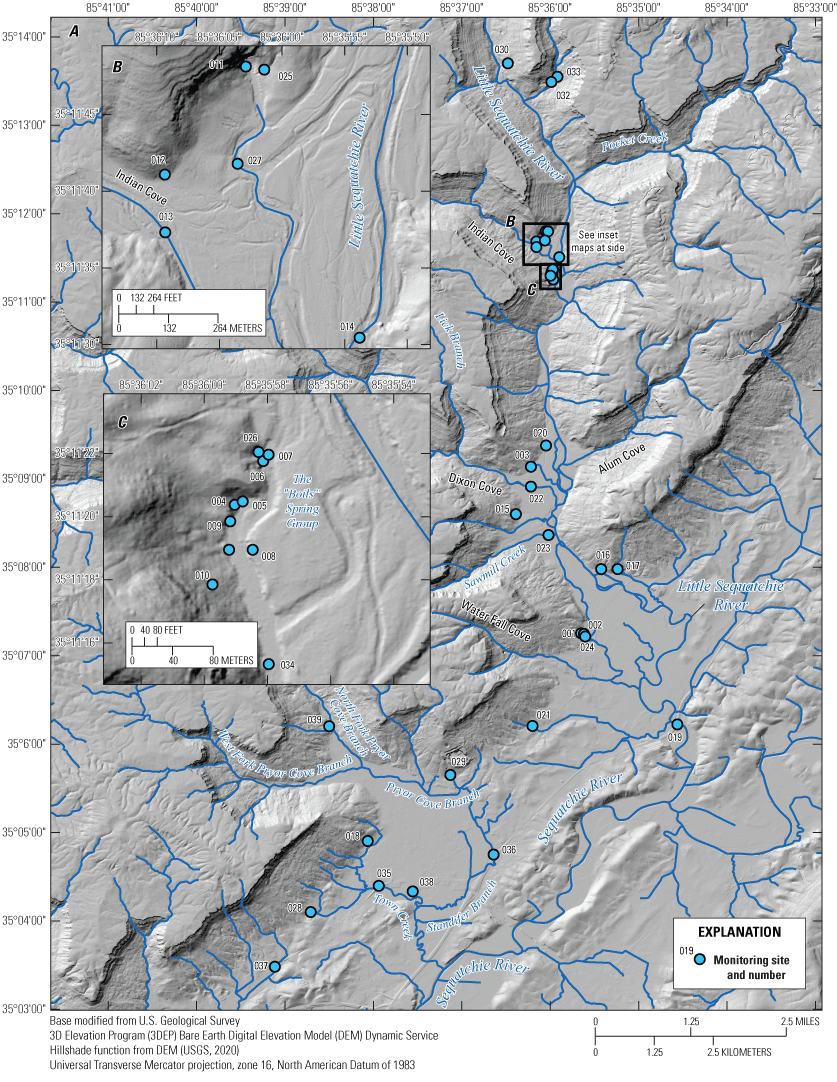
A, Map showing location of monitoring sites utilized for dye recovery in the study and insets showing monitoring sites near B, the mouth of Indian Cove and, C, the “Boils” spring group. Site numbers correspond to those listed in table 1.
Previous Dye Tracing Research
Some previous unpublished groundwater tracing had been conducted in the Little Sequatchie River valley and Pryor Cove by USGS personnel, environmental consultants, and volunteer researchers (Miller and Hourigan, 2023). In 1990, a sinkhole known locally (and referred to herein) as “’Asher’ sink” (fig. 6) opened up in the Town of Jasper following some construction activities. Rhodamine WT dye was injected into the sinkhole feature and flushed with nearly 50,000 gallons (gal) of water from a nearby fire hydrant. The dye was detected at nearby Blue Spring (site no. 018 on table 1 and fig. 14A) 8 days postinjection, via water samples, and continued to be at detectable levels for an additional 4 weeks. This trace is shown later in the “Round 4, August 2022” section of this report, and the injection is shown with an injection ID of JC-MB. Later, cave divers working in Blue Spring were able to document and map where flow from this sinkhole enters the cave system (Jason Richards, written commun., 2023).
Tracing was conducted in 2015 in the lower portion of the Little Sequatchie River valley and in tributaries near the mouth of the valley by an environmental consultant (Richard D. Martin, Griggs and Maloney Incorporated, unpub. data, 2015).3 This work delineated two recharge basins for Sequatchie Cave, referred to respectively as a “conduit recharge basin” and a “percolation recharge basin.” This work consisted of four different dye injections and was conducted on behalf of Tennessee Wildlife Resources Association. The total recharge area delineated by this work was approximately 5 mi2 and primarily encompassed the drainage areas of Sawmill Creek and Water Fall Cove (Richard D. Martin, Griggs and Maloney Incorporated, unpub. data, 2015).
In 2017, a dye injection was conducted by volunteers as a demonstration for a cave biology course from Berry College. The dye injection was conducted in an unnamed tributary to the Little Sequatchie River, located between Sawmill Creek and Dixon Cove. The stream sank entirely below a large waterfall and rhodamine WT was injected into the stream immediately upstream from the sinkpoint. Dye from the injection was expected to flow to nearby “Keira” spring (site no. 015 on table 1 and fig. 14A) only 0.5 mi away; however, the dye flowed to Sequatchie Cave nearly 2 mi to the south of the injection site (Miller and Hourigan, 2023). The dye arrived at Sequatchie Cave within 1 week postinjection. This trace is shown in the “Round 1, January 2022” section of this report and has an injection ID of BM-BH.
Methodology
At the onset of the project, a detailed inventory of hydrologic features was conducted in the Little Sequatchie River valley and within Pryor Cove to identify features that might be important for dye traces, including dye detection monitoring sites and injection locations (table 1). Features selected for dye detection sites (fig. 14 and table 1) were monitored using charcoal packets. These packets contained 6–8 grams of activated coconut charcoal inside of a milk filter sock that was then attached to a wire, weighted with a rock or washers, and placed in the flowing part of the stream or feature being monitored. During the initial inventory, a set of charcoal packets was deployed and collected prior to dye injections in order to monitor for any background levels of dyes or naturally occurring fluorescence in the study area; this procedure was repeated prior to each round of dye injections. Following dye injections, charcoal packets were changed intermittently, at daily to weekly intervals, to aid in determining the approximate traveltime from each dye injection point to recovery location. Although an initial set of monitoring sites was established at the start of the project, additional sites were added as new features were identified, and in some cases, new sites were added at locations where packets had been stolen or disturbed. A total of 39 monitoring sites were monitored using charcoal packets, with 16 sites being added to the initial 23 sites over the duration of the project.
After monitoring sites were documented and established, the initial sites planned for dye injections were selected with the objective of delineating recharge areas and mapping karst groundwater flow paths in both the Little Sequatchie River valley and Pryor Cove. Overall for the project, dye injections were planned for the Little Sequatchie River and all major tributaries with exposures of Bangor Limestone as well as similar locations in both the North and West Fork Pryor Cove Branches. Locations for subsequent dye injections were selected on the basis of the results of the previous dye injection rounds and in some cases differed slightly from the locations initially chosen because of hydrologic conditions. Dye injections (tables 2 and 3) utilized four nontoxic fluorescent dyes (fluorescein, eosine oj, rhodamine wt, and sulphorhodamine b) that were injected into losing streams, swallets, and cave streams. These dyes are commonly used in karst groundwater-tracing, because each dye fluoresces at a unique wavelength when exposed to light and the fluorescence wavelength can be identified through laboratory analyses. Flowing water was present at all injection locations except those for the lower North and West Fork Pryor Cove Branch injections (I-24 and I-25, table 2) where a fire tanker truck was used to flush the injections with 3,500 gal of fresh water.
Table 2.
Dye injections performed during this study and prior efforts.[Data within table 2 are available from Miller and Hourigan (2023). Elevation data from the 3DEP lidar explorer (U.S. Geological Survey, 2023a). Elevation referenced to the North American Vertical Datum of 1988. Dates shown as month, day, year. no., number; ID, identification; ft, foot; lb, pound; gal, gallon; --, not applicable]
Table 3.
Positive traces obtained during this study and prior efforts.[Data within table 3 are available from Miller and Hourigan (2023). Elevation data from the 3DEP lidar explorer (U.S. Geological Survey, 2023a). Elevation referenced to the North American Vertical Datum of 1988 Dates shown as month, day, year. ID, identification; no., number; ft, foot; ppb, part per billion; h, hour; min, minute; --, not applicable]
In some cases, certain monitoring sites were restrictively remote. Thus, packets were placed at more accessible sites downstream from the more-remote monitoring sites. These packets could be changed more often and gave a minimum date for arrival at the remote sites upstream, which were later confirmed via laboratory analysis after packet retrieval.
Once charcoal packets had been retrieved from the field, the packets were then shipped to Crawford Hydrology Lab in Bowling Green, Kentucky for processing and analysis. At the laboratory, packets were rinsed and dried. After drying, charcoal from the packets was measured out, eluted, and then analyzed using a calibrated spectrofluorophotometer (Crawford Hydrology Laboratory, 2021). A laboratory duplicate sample was analyzed, for quality assurance/quality control, every 10 samples from a randomly selected sample from the submitted sample set. Positive traces were confirmed for samples whose dye concentrations were greater than 10 times the background fluorescence for a given site. After the results were received, positive traces were plotted in a geographic information system (GIS) to begin delineating recharge areas for recovery sites with positive results. Additional information about the methods used for the study is included as part of the metadata within a separate USGS data release of geospatial datasets of the dye-tracing data for this study that include dye injection sites, monitoring sites, dye traces, recharge areas, and recharge area boundaries (Miller and Hourigan, 2023).
The results from these positive dye traces were then used to delineate the recharge areas for the monitored springs that were dye-recovery sites. The delineated boundaries for a given spring recharge area follow topographic divides upstream from the sinkpoint for each injection location that was positively traced to that particular spring. If there were additional positive traces to the spring from adjacent drainages, then those recharge areas were combined to create an overall recharge area for the spring. Boundaries were confirmed for an individual spring (spring A) when an adjacent spring (spring B) received a positive trace that was not detected at the first spring (spring A), indicating a groundwater basin divide. Dye injections that were detected at multiple springs indicated areas where a recharge area is shared by more than one spring system. Although dye tracing is a proven method for delineating groundwater basins in karst terrain, this method may be limited by the hydrologic conditions present during the tracing study, such as precipitation heterogeneity and changes in groundwater or stream levels that can cause basin divides to shift laterally. In addition to the work focused on delineating the groundwater basins, one dye injection was conducted in December 2022 to determine whether a large swallet adjacent to the “Boils” perhaps contributed recharge to a subset of the springs located at the “Boils.”
Results
Round 1, January 2022
The first round of dye injections was conducted in January 2022, with the injections occurring on January 6, 7, and 19. These injections focused on determining the flow paths for some of the upstream swallets on the Little Sequatchie River as well as investigating if some lower valley tributaries hydrologically connect to Sequatchie Cave. The first dye injection (I-1), was conducted on January 6, using approximately 2 pounds (lb) of fluorescein injected into the main stem of the Little Sequatchie River near a major swallet feature known locally (and referred to herein) as “Party Well” near the contact of the Pennington Formation and Bangor Limestone (Pennington-Bangor contact) (fig. 15). On the day of the injection, flow in the Little Sequatchie River at the sinkpoint was estimated to be approximately 200 ft3/s. Although the main “Party Well” swallet was overtopped, all of the streamflow sank underground within 300 ft of the injection location. The second dye injection (I-2) was conducted the following day at a large sinking waterfall in Lick Branch, where a spring, discharging from the Pennington Formation, sinks immediately into a 90-ft-deep swallet in the Bangor Limestone. At this location, 2 lb of sulphorhodamine b was injected directly below a spring discharging from the Pennington Formation (fig. 16). The third and final injection for round 1 (I-3) was conducted on January 19 at a subterranean waterfall located inside a cave in Water Fall Cove (fig. 14A). One lb of eosine oj was injected immediately downstream from the waterfall and upstream from the point beyond which the stream cannot be humanly accessed.
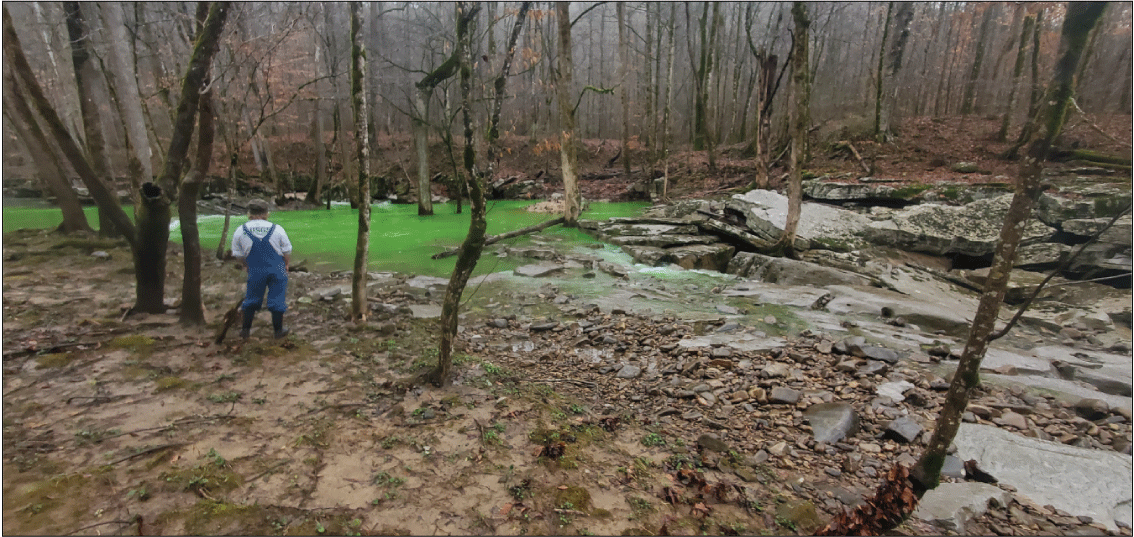
Photograph showing dye injection of fluorescein at injection site I-1, located at main sinkpoint for Little Sequatchie River, January 6, 2022. Photograph by Kyle Lassiter, used with permission. U.S. Geological Survey (USGS) scientists followed all appropriate safety protocols and requirements for working near, on, in, or over water consistent with approved USGS Job Hazard Analysis.
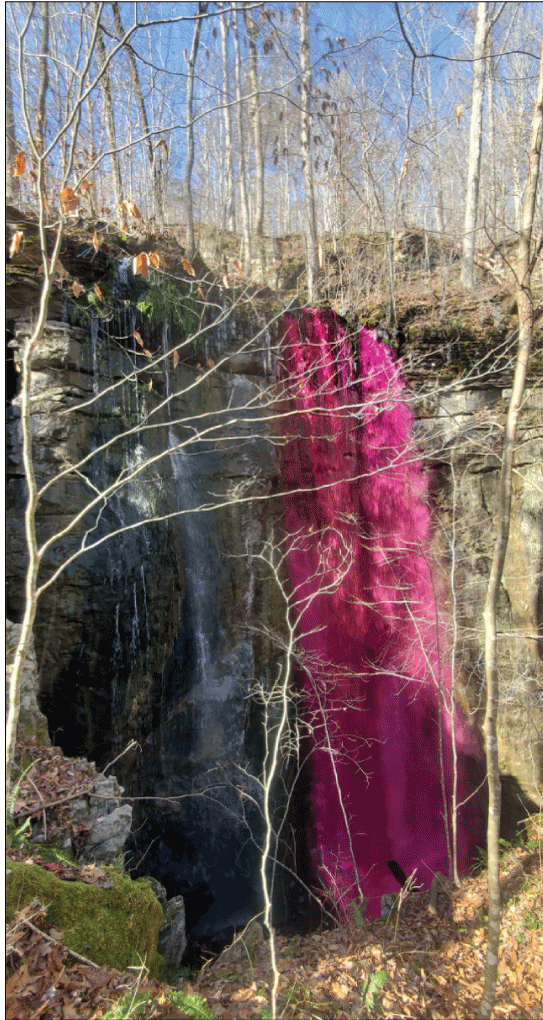
Photograph showing dye injection sulphorhodamine b at injection site I-2, January 7, 2022. At this site, a spring discharges from the Pennington Formation and immediately sinks into a large swallet formed in Bangor Limestone. Photograph by Bill Keener, used with permission.
Results from the round 1 dye injections helped to set some initial boundaries for the various recharge areas within the Little Sequatchie River valley. Injection I-1 was positively traced to all the monitored sites at the “Boils” (site nos. 004–010, figs. 14C and 17) and the subsequent sites located downstream from the “Boils” (site nos. 019 and 020, fig. 14A). Dye from this injection appears to have stayed subsurface the entire distance from the sinkpoint to the “Boils.” At a length of 7.8 mi, this trace is one of the longer documented dye traces in Tennessee, on par with major dye traces documented on the Cumberland Plateau (Crawford, 1989; Miller and others, 2019). Dye from injection I-2 was traced to “Keira” spring (site no. 015) (figs. 14A and 18) as well as a site downstream from “Keira” spring along the main Little Sequatchie River (site no. 019, fig. 14A). Dye at injection site I-3 was positively traced to Sequatchie Cave (site no. 001, figs. 14A and 18), creating a southwestern boundary for the Sequatchie Cave recharge area.
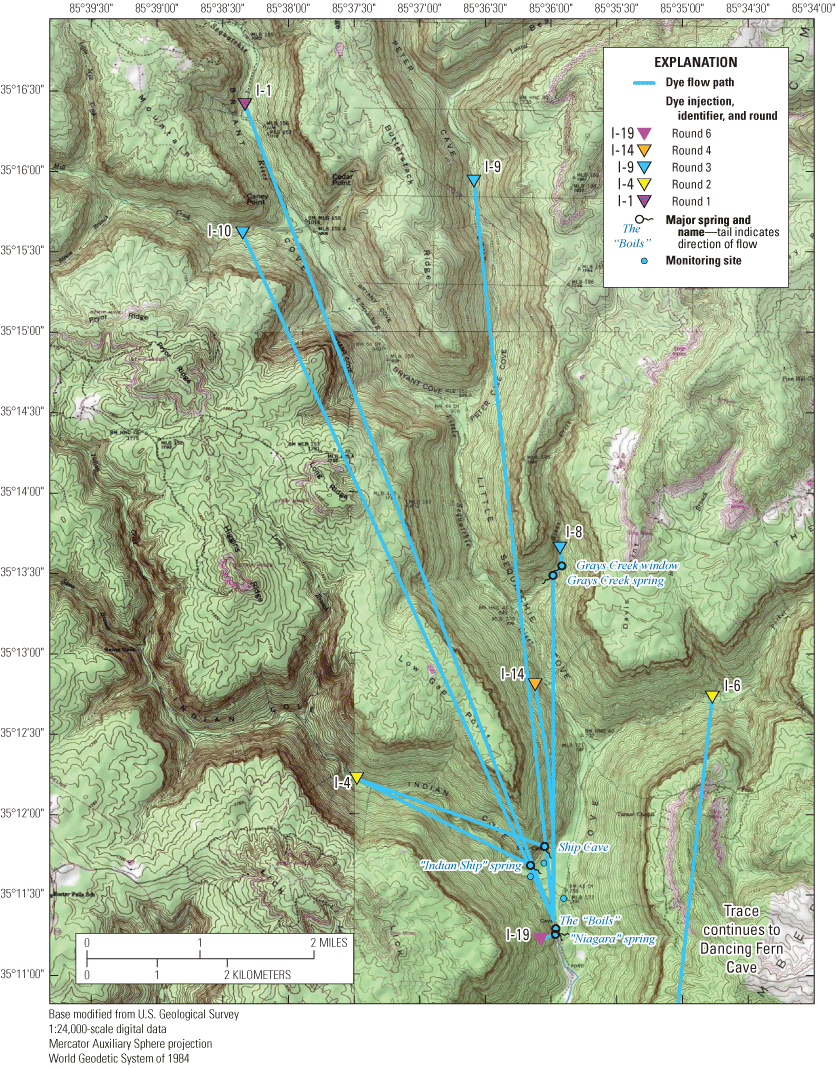
Map showing dye injection locations and positive dye traces in the upper portion of the Little Sequatchie River valley study area.
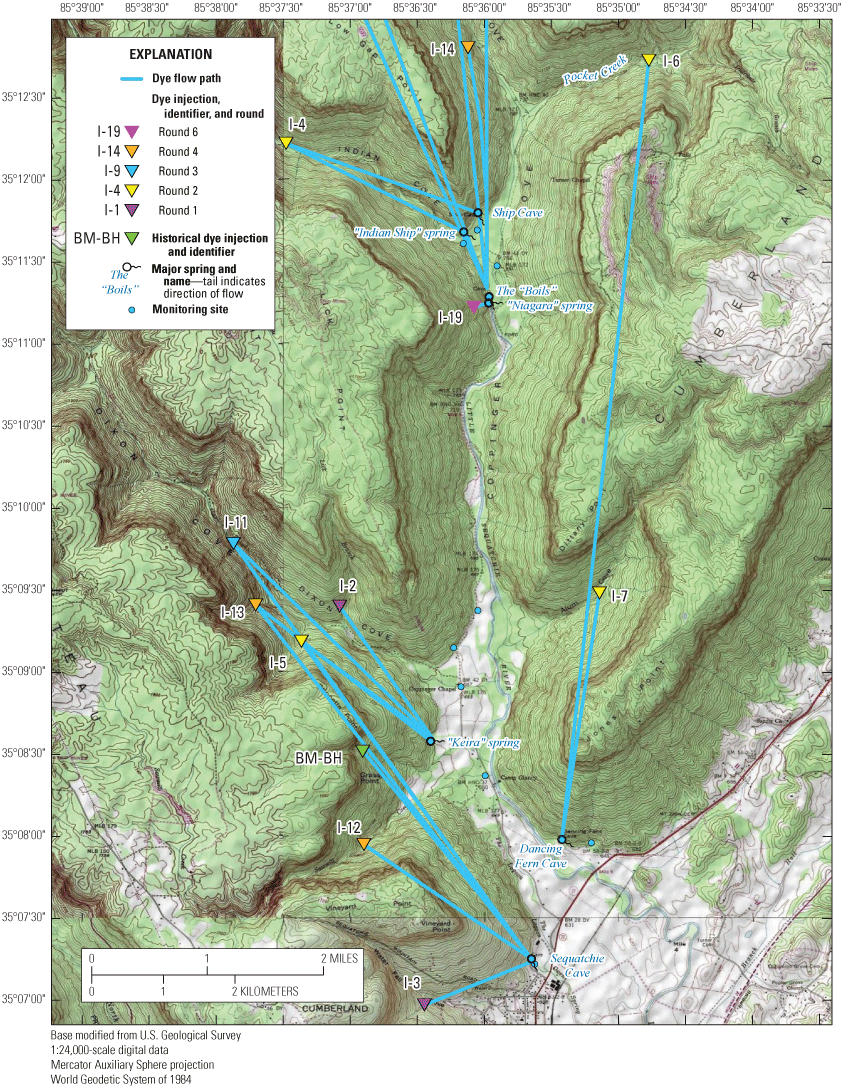
Map showing dye injection locations and positive dye traces in the lower portion of the Little Sequatchie River valley study area.
Round 2, March 2022
The second round of dye injections was conducted during March 28–29, 2022, and focused on determining flow paths for water that sinks in two major western tributaries to Little Sequatchie River, namely the main stream in Indian Cove and a side tributary to Dixon Creek, as well as two eastern tributaries, Pocket Creek and Alum Creek (fig. 6). Injection I-4 was conducted on March 28 in Indian Cove at a major stream sink located near the Pennington-Bangor contact (fig. 5A). Two lb of powdered fluorescein was injected into the main stream in Indian Cove, which sinks entirely into the open swallet at the base of a small bluff (fig. 19). The streambed from this point down to the Little Sequatchie River remains dry most of the year except following major rain events. Injection I-5 was conducted in a southern tributary to Dixon Cove with the intent to refine a possible recharge area boundary between “Keira” spring and Sequatchie Cave. In this unnamed tributary, 2 lb of sulphorhodamine b was injected into the flow of a small spring, which sank 20 ft downstream from the resurgence. Injection I-6 was conducted March 29 at a major swallet for Pocket Creek, where the entire stream sinks near the Pennington-Bangor contact (fig. 20). Following this injection, the dye was observed in the stream of a short cave formed in the Bangor Limestone approximately 200 ft downstream from the injection location. The last injection in round 2 (I-7) was conducted the same day in Alum Cove near the Pennington-Bangor contact, where 2 lb of powdered eosine oj was injected into a small sinking stream.
Photograph showing dye injection of fluorescein at injection site I-4 in the main stream in Indian Cove, March 28, 2022. Photograph by Kyle Lassiter, used with permission.
Photograph showing the main swallet in Pocket Creek following dye injection of rhodamine wt at injection site I-6, March 29, 2022. Photograph by Kyle Lassiter, used with permission.
Results from the second round of injections delineated what would ultimately become two of the larger recharge areas in the study area and provided insight into karst resurgences with shared recharge areas in western tributaries to the Little Sequatchie River. Injection I-4 in Indian Cove was positively traced to both Ship Cave (site no. 011) and the smaller adjacent “Indian Ship” spring (site no. 012) (figs. 14B and 17). “Indian Ship” spring appears to be a perennial overflow spring for the stream in Ship Cave, and other ephemeral springs have been observed near “Indian Ship” spring following rain events. Injection I-5 in the small sinking spring system in Dixon Cove was positively traced to both “Keira” spring and Sequatchie Cave (fig. 18), arriving at “Keira” spring within 3 days postinjection and at Sequatchie Cave, via the packet in Owen Spring (site no. 002, fig. 14A), within 2 weeks postinjection. Injections I-6 and I-7, from Pocket Creek and Alum Cove respectively, were both positively traced to Dancing Fern Cave (site no. 016) (figs. 14A and 18). The trace from Pocket Creek to Dancing Fern Cave had one of the fastest traveltimes for the longer traces in the project, with dye arrival less than 48 hours postinjection. These traces establish the Dancing Fern Cave recharge area as the second largest recharge area in the Little Sequatchie River and are notable for the fact that they appear to have stayed subsurface from sink to spring, which in the case of Pocket Creek is slightly less than 7 mi.
Round 3, June 2022
The third round of dye injections was conducted in early June 2022 and focused on upper tributaries to the Little Sequatchie River while defining recharge area boundaries between Dancing Fern Cave and the “Boils.” Additionally, an injection in Dixon Cove would help delineate a recharge area for Sequatchie Cave and might help further explain the shared recharge areas between “Keira” spring and Sequatchie Cave. Injection I-8, conducted on June 1, was located in Grays Creek, approximately 1,000 ft upstream from the Pennington-Bangor contact (fig. 5A). Prior to injection, two springs were discovered (Grays Creek Spring and Grays Creek karst window, fig. 18) and added to the monitoring network (site nos. 032 and 033, fig. 14A). Four lb of eosine oj was injected into a pool, and the small stream flowing out of the pool sank entirely within 20–30 ft. Injections I-9 to I-11 were conducted the following day, June 2. Injection I-9 was conducted in the main stream in Peter Cave Cove approximately 1,500 ft upstream from the Pennington-Bangor contact and near the namesake for the cove, a large shelter cave utilized by early settlers of the cove in the late 1800s through the early 1900s (Sequachee Valley News, 1900). A total of 3 lb of rhodamine wt was injected into the small stream immediately upstream from the discrete sinkpoint (fig. 21). Injection I-10 directly followed the Peter Cave Cove injection and was located in Mill Creek on the west side of the Little Sequatchie River valley (fig. 17). At this location, approximately 1,050 ft upstream from the Pennington-Bangor contact, a total of 2 lb of powdered fluorescein was injected into the flowing stream just above the sinkpoint. The final injection for round 3, namely I-11, was conducted in Dixon Cove where the main stream in the cove sank at a site 0.5 mi upstream from the “normal” sinkpoint for the Dixon Cove stream (fig. 18). At this site, 2 lb of sulphorhodamine b was injected into the stream and sank entirely 1–200 ft downstream from the injection site (fig. 22). All of the injection sites for round 3 were located upstream from the Pennington-Bangor contact or upstream from the perennial sinkpoints for the streams. This behavior may have occurred because round 3 was conducted in June and there had been an overall lack of rain for several weeks, causing the sinkpoints to migrate upstream as groundwater levels dropped in the system.
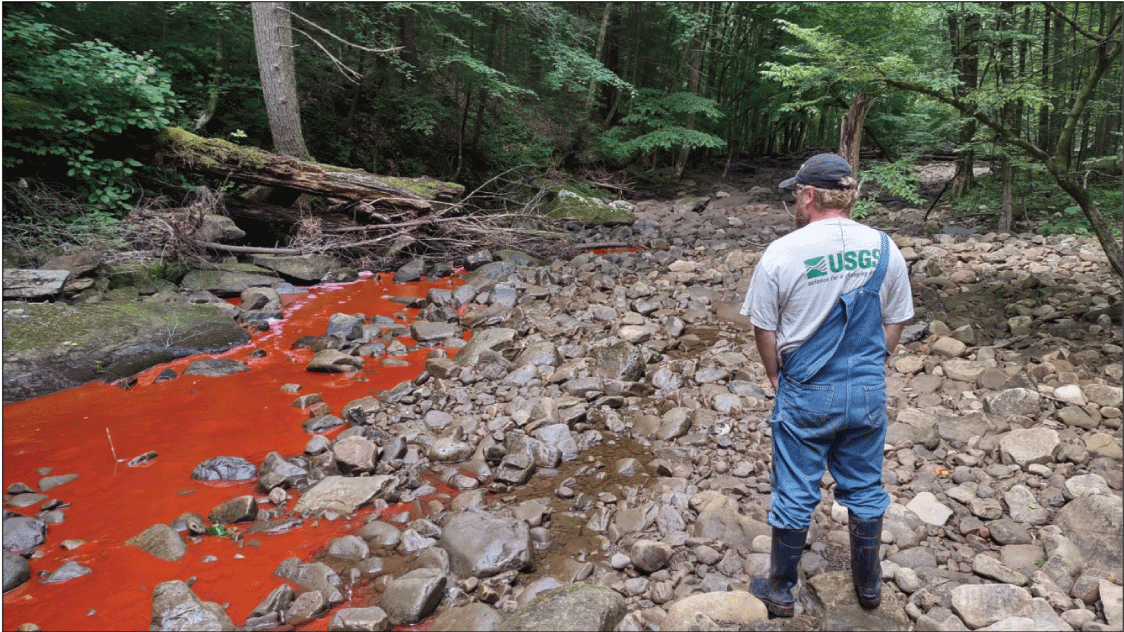
Photograph showing dye injection I-9 of rhodamine wt in the main stream in Peter Cave Cove, June 2, 2022. Stream sinkpoint for this stream in Peter Cave Cove is at downstream end of dyed stream. U.S. Geological Survey (USGS) scientists followed all appropriate safety protocols and requirements for working near, on, in, or over water consistent with approved USGS Job Hazard Analysis. Photograph by Kyle Lassiter, used with permission.
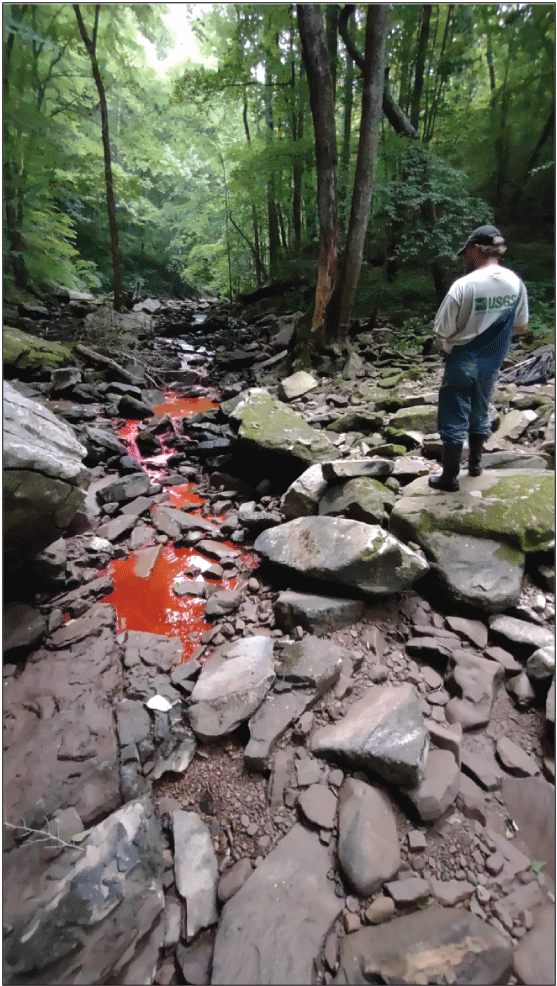
Photograph looking upstream from sinkpoint in Dixon Cove, dye injection I-11, following injection of sulphorhodamine b, June 2, 2022. U.S. Geological Survey (USGS) scientists followed all appropriate safety protocols and requirements for working near, on, in, or over water consistent with approved USGS Job Hazard Analysis. Photograph by Kyle Lassiter, used with permission.
Results from round 3 helped to further delineate a recharge area for the “Boils” and confirmed an additional shared recharge area between “Keira” spring and Sequatchie Cave. The dye injections in Grays Creek, Peter Cave Cove, and Mill Creek (I-8 through I-10) were positively traced to the “Boils” (site nos. 004–010, 026, figs. 14C and 17) and to the subsequent sites located downstream (site nos. 019 and 020, fig. 14A). This delineated a boundary between the “Boils” and the Dancing Fern Cave recharge areas, located along the drainage divide between Grays Creek and Pocket Creek. The dye injection in the main stream of Dixon Cove (I-11) was positively traced to both “Keira” spring (site no. 015) and Sequatchie Cave via the packet in Owen Spring (site no. 002) (figs. 14A and 18). Similar to the results from round 2, the dye arrived first at “Keira” spring, within 1 day for round 3, and then several days later at Sequatchie Cave, with 6 days for round 3. The faster traveltimes may be due to a short burst of heavy rainfall approximately 30 minutes after the dye injection in Dixon Cove. A light pink color was visible in the water at “Keira” spring the next morning, indicating sulphorhodamine b, as confirmed later in the charcoal packets retrieved from the site.
Round 4, August 2022
The fourth round of dye injections was conducted in August 2022 and focused on defining a southern boundary for the “Boils” recharge area, closing spatial gaps in the Sequatchie Cave and “Keira” spring recharge areas, and beginning work to delineate a recharge area for Blue Spring. Injection I-12 was conducted in Sawmill Creek, a large hollow located between Water Fall Cove, to the south, and Dixon Cove, to the north. During wetter time periods, Sawmill Creek flows overland to the Little Sequatchie River; however, in summertime, all of the flow sinks near the Pennington-Bangor contact. On August 1, a sinking stream was located in Sawmill Creek approximately 300 ft upstream from the mapped Pennington-Bangor contact and 1 lb of powdered fluorescein was injected into the pool at the sinkpoint (fig. 23). Following injection 1-12 in Sawmill Creek, injection I-13 was conducted the same day in a southern tributary to Dixon Cove between injections I-5 and I-11. Injection I-13 utilized 1 lb of sulphorhodamine b, which was injected into the sinking stream immediately above the sinkpoint for the small stream. Because of accessibility issues and flow conditions, the third and fourth injections (I-14 and I-15) were not conducted until 4 weeks later on August 29; this also allowed for dye from I-12 and I-13 to be recovered by charcoal packets and eliminated any possible masking or interference from dyes with similar wavelengths. On August 29, injection I-14 was conducted at a swallet on the western flank of the main Little Sequatchie River valley. At this site, 2 lb of rhodamine wt was injected into the small stream, which immediately sank into a small cave-like feature (fig. 24). Following this injection, the final injection (I-15) for round 4 was conducted into the eastern arm of the northern fork of Pryor Cove located to the west of the lower Little Sequatchie River valley near the Town of Jasper. Two lb of eosine oj was injected into a small flowing stream, and although it did not immediately sink at the injection site, the stream is known to sink entirely within a short distance downstream.
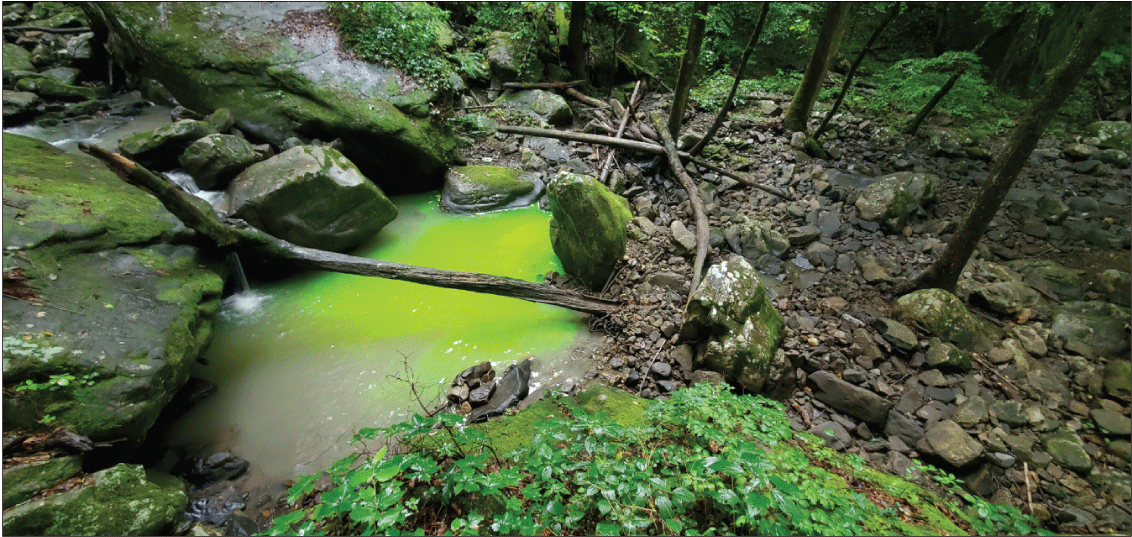
Photograph showing injection site I-12 in Sawmill Creek following dye injection of fluorescein, August 1, 2022. Photograph by Benjamin V. Miller, U.S. Geological Survey.
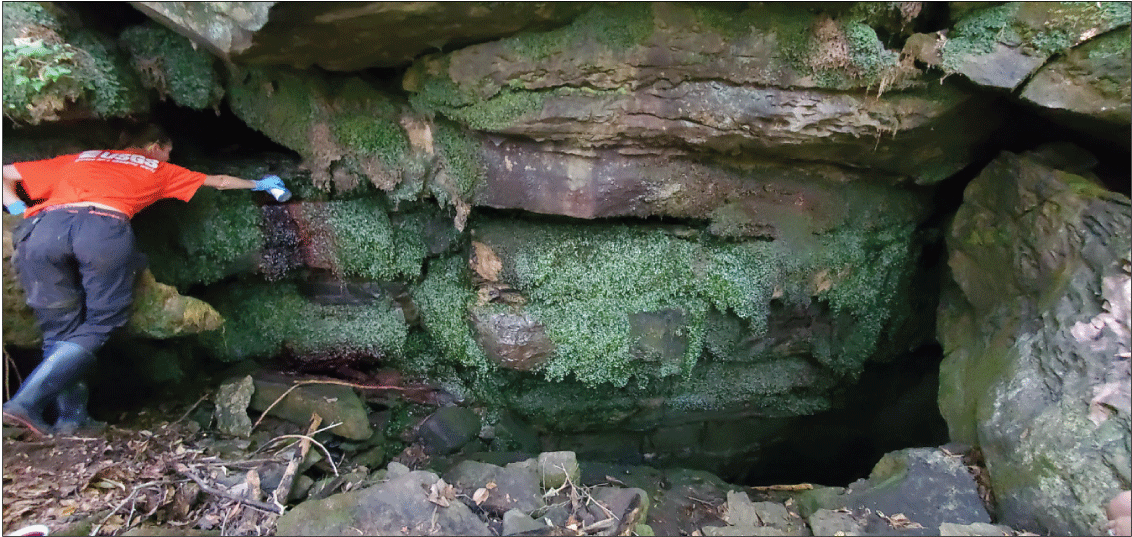
Photograph showing dye injection of rhodamine wt at injection site I-14, August 29, 2022. Stream sinks immediately into cave-like opening at right edge of photo. Photograph by Benjamin V. Miller, U.S. Geological Survey.
Round 4 results helped to extend the “Boils” recharge area, further delineated Sequatchie Cave and “Keira” spring recharge areas, and aided in the delineation of the first portions of a recharge area for Blue Spring. The dye injection in Sawmill Creek (I-12) was positively traced to Sequatchie Cave, arriving at the Owen Spring packet (site no. 002) within 1 week of the dye injection, and was not detected at “Keira” spring. The dye injection at Dixon Cove (I-13) was positively traced to both “Keira” spring (site no. 015) and Sequatchie Cave (via Owen Spring [site no. 002]), with the dye detected on packets collected 1 week postinjection (figs. 14A and 18). The dye injected into a swallet along the Little Sequatchie River upstream from Pocket Creek (I-14) was detected at the “Boils” spring group (site nos. 004–010, 026, fig. 14B) on packets collected 16 days postinjection, although the dye had not arrived at packets collected 3 days postinjection. This trace extends the recharge area for the “Boils” farther downstream and added 8.7 mi2 to the total area (fig. 17). The eosine oj from the injection site in the northern fork of Pryor Cove (I-15) was positively traced to Blue Spring (site no. 018) within 9 days of the dye injections (figs. 14A and 25); however, packets collected 3 days postinjection showed no dye. Aside from the JC-MB dye injection performed in 1990 from “Asher” sink (fig. 6), discussed in the “Previous Dye Tracing Research” section, this trace would represent the first dye injection positively traced to Blue Spring. This trace indicated that the northern fork of Pryor Cove is a significant recharge source for the spring because the trace was located far up the cove, well beyond the mapped end of the water-filled cave (fig. 25).
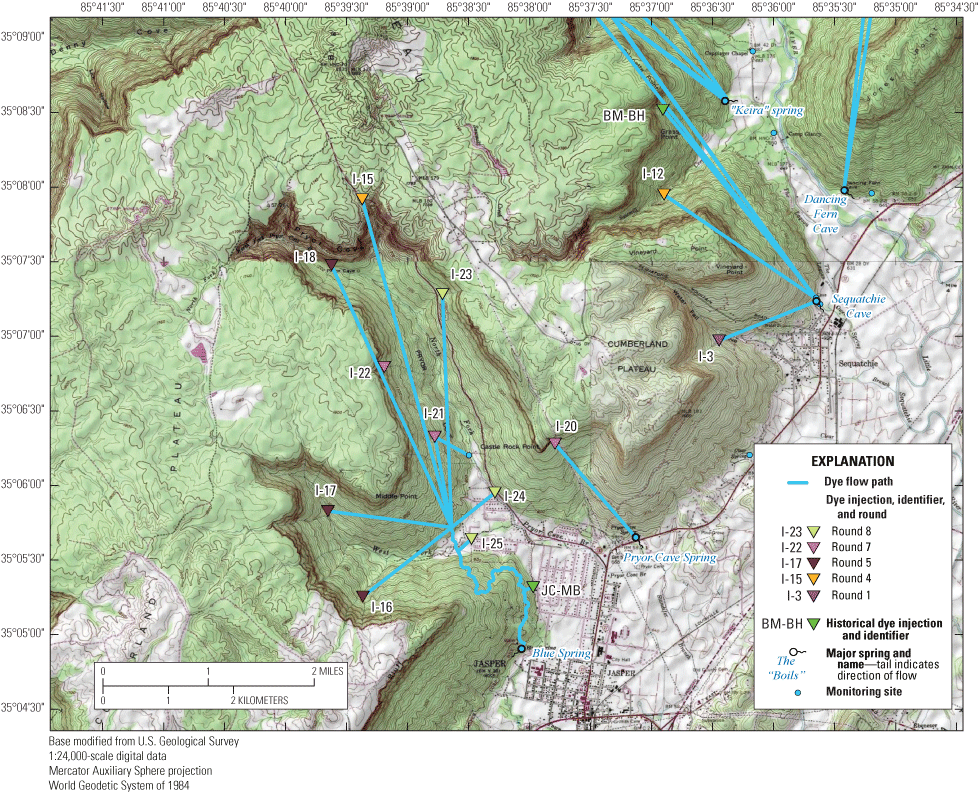
Map showing dye injection locations and positive traces in Pryor Cove and near the mouth of the Little Sequatchie River valley.
Round 5, November 2022
The fifth round of dye injections was conducted on November 1, 2022, to continue delineating a recharge area for Blue Spring. Building off the positive trace from injection I-15, the dye injection locations included sites in western fork of Pryor Cove and in the western arm of the northern fork of Pryor Cove. The current mapped end of the underwater cave at Blue Spring is located under West Fork Pryor Cove Branch; thus, this particular stream seemed to be a likely source of recharge to the spring. Hydrologic conditions during round 5 were similar to those during round 4 because the area had not received rainfall in a few weeks, and the stream sinkpoints appear to have migrated upvalley from their normal location near the Pennington-Bangor contact. Injections I-16 and I-17 were both conducted in the upper half of the western fork of Pryor Cove. Injection I-16 was conducted in an unnamed southern tributary to West Fork Pryor Cove Branch, approximately 600 ft upstream from the mapped Pennington-Bangor contact, near a small spring located on the streambank of the small channel. One lb of sulphorhodamine b was injected into the small spring and sank immediately below the outlet (fig. 26). Injection I-17 was conducted in the main stream channel of West Fork Pryor Cove Branch, 0.8 mi upstream from the confluence with the tributary where injection I-16 was conducted. One lb of eosine oj was injected at injection site I-17, where the small stream sinks at the Pennington-Bangor contact. Injection site I-18 was located in the western arm of the northern fork of Pryor Cove, 0.5 mi upstream from the mapped Pennington-Bangor contact (fig. 25). A hillside spring discharges from the lower Pennington Formation and flows a short distance overland (~500 ft) before sinking into an open swallet on the side of the main stream channel where 1 lb of fluorescein was injected (fig. 27).
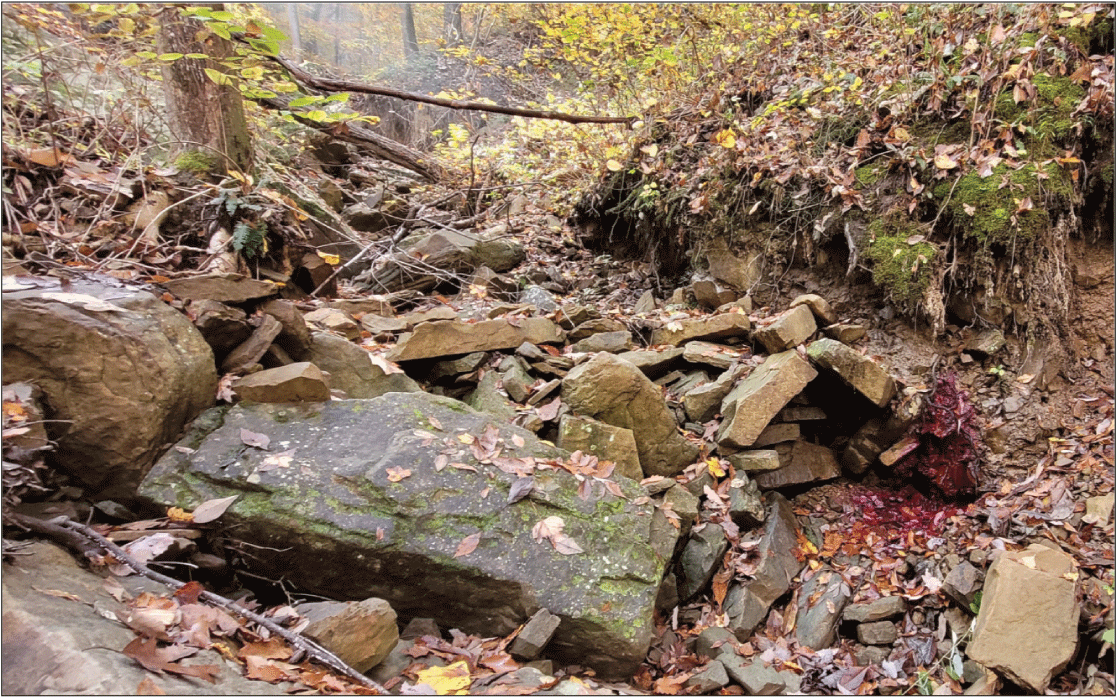
Photograph showing dye injection of sulphorhodamine b at dye injection site I-16, a small sinking spring in an unnamed tributary to West Fork Pryor Cove Branch, November 1, 2022. Dye is visible in lower right corner of photograph. Photograph by Benjamin V. Miller, U.S. Geological Survey.
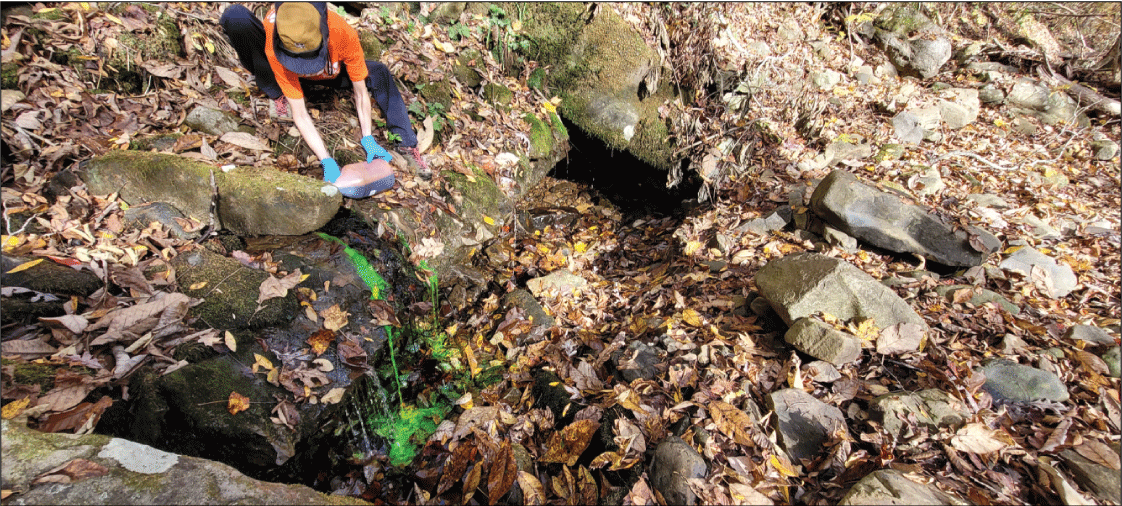
Photograph showing dye injection of fluorescein at injection site I-18, an open swallet in the streambed of the western arm of the northern fork of Pryor Cove, November 1, 2022. Photograph by Benjamin V. Miller, U.S. Geological Survey.
Results from round 5 helped to further refine the Blue Spring recharge area and significantly increased the size of the delineated recharge area. All three injections (I-16 to I-18) from round 5 were positively traced to Blue Spring (site no. 018, figs. 14A and 25). The dyes from the West Fork Pryor Cove Branch injections (I-16 and I-17) were detected on packets collected on November 16, indicating dye arrived between 10 and 15 days postinjection. Packets collected on November 30 indicated that dye from North Fork Pryor Cove Branch (injection I-18) had arrived between 15 and 29 days postinjection. Several rainfall events in November each exceeded 1 inch of precipitation (Community Collaborative Rain, Hail & Snow Network [Cocorahs], 2022); however, the dry conditions at the time of dye injection may have caused the traveltime (from sinkpoint to spring) to be longer than would have been during wetter time periods.
Round 6, December 2022
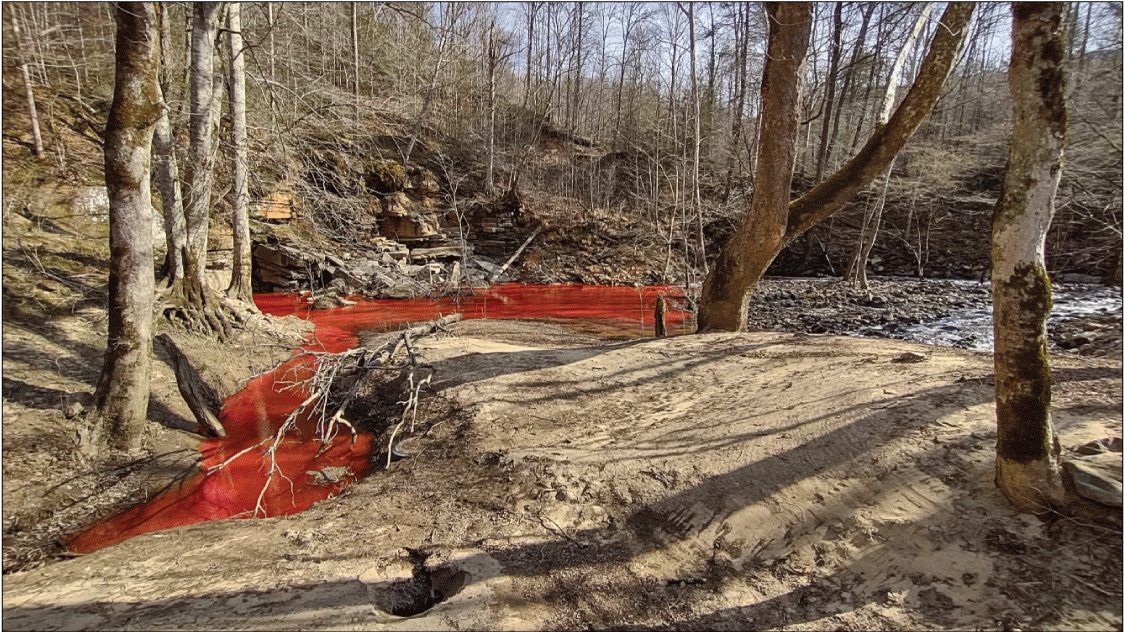
The sixth round was an intermediate round, consisting of a single dye injection conducted in a portion of the study area that previously had been confirmed to be hydrologically disconnected from any of the karst systems in Pryor Cove. This is important to note, as conducting traces can be problematic if all dyes have not been accounted for or sufficient precipitation has not flushed through a system, returning the system to preinjection background levels of fluorescence. The round 6 injection (I-19) was conducted at a large swallet adjacent to the “Boils” spring group. Here, a surface stream sinks into a short cave formed in the Pennington Formation before resurging immediately above a large swallet formed in the Bangor Limestone. The injection was conducted to determine whether this system, directly adjacent to the “Boils,” might resurge from a subset of the eight monitored springs. On December 12, 2022, 1 lb of fluorescein was injected upstream from the stream sink and was observed to quickly pass through the short cave segment and emerge into the large swallet (fig. 28). The USGS team then immediately made their way downslope to the “Boils” spring group to observe the dye emerging approximately 3–400 ft downstream from the “Boils” from three small springs on the western bank of the spring channel (figs. 17 and 29). The springs (site name: Niagara spring, site no. 034, table 1, fig. 14C) had eluded previous documentation because some resurgences were located under tree roots and others obscured by boulders. The time of travel was the shortest of any trace for the project, with the dye arriving at the spring resurgence less than 30 minutes postinjection. An average velocity for this trace would be approximately 1,400 feet per hour, nearly 60 percent faster than the trace from Pocket Creek to Dancing Fern Cave.
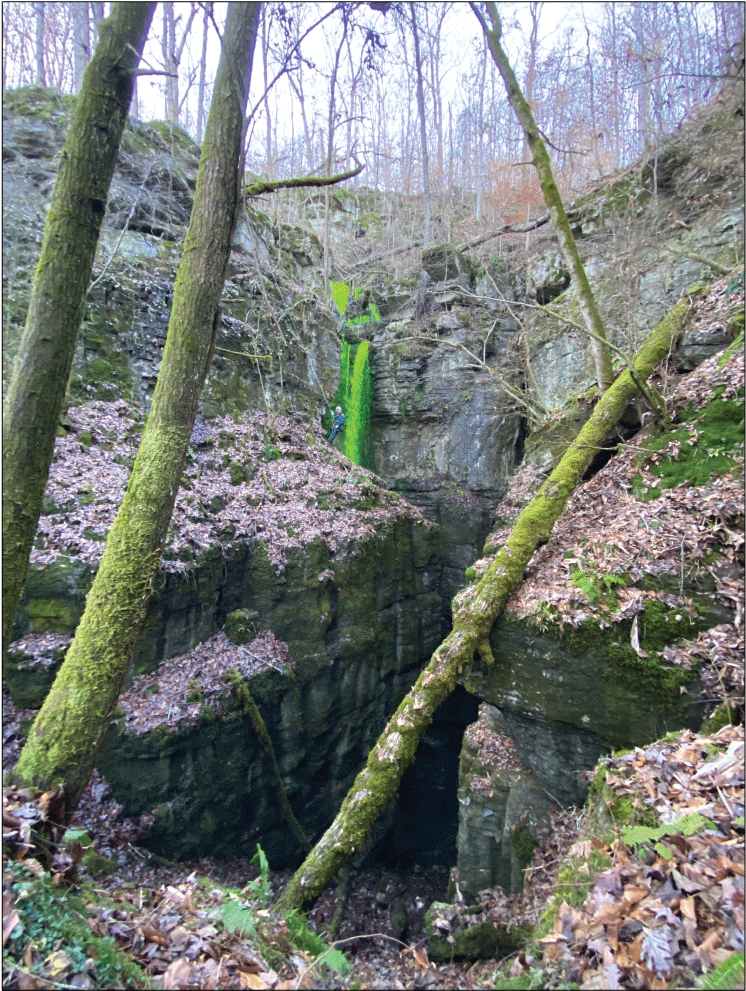
Photograph showing dye injection of fluorescein at injection site I-19 into large swallet formed in the Bangor Limestone, December 12, 2022. Note author on rope for scale, Photograph by Amy Hourigan, U.S. Geological Survey.
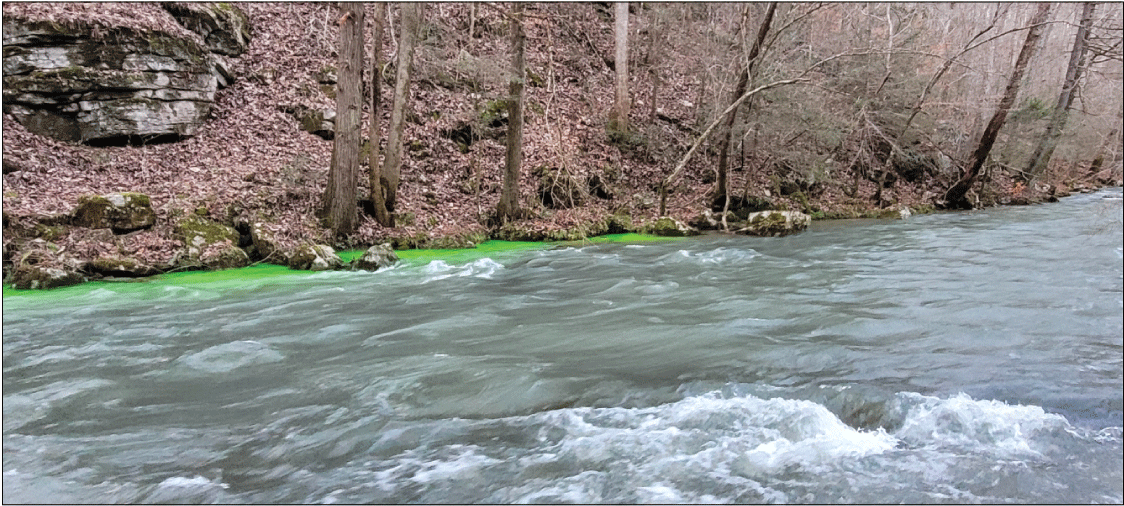
Photograph showing fluorescein dye emerging from resurgences along the spring branch downstream from the “Boils,” December 12, 2022. Dye traveled from injection site I-19 to spring resurgence in less than 30 minutes. View is facing downstream. Photograph by Benjamin V. Miller, U.S. Geological Survey.
Round 7, January 2023
The seventh round of dye injections was conducted on January 9, 2023, in several unnamed tributaries to North Fork Pryor Cove Branch as well as one unnamed tributary to main stem of Pryor Cove Branch, with the purpose of further delineating a recharge area for Blue Spring. The first injection for round 7 (I-20) was conducted in an unnamed tributary to Pryor Cove Branch near Castle Rock Point on the northeast side of Pryor Cove, where the stream flows across the Pennsylvanian siliciclastic strata and cascades over a series of waterfalls before sinking into the subsurface at the top of the Pennington Formation. One lb of fluorescein was injected into the flowing stream approximately 80 ft upstream from the sinkpoint and above an 18-ft waterfall (fig. 30). Injection I-21 was conducted in a small, unnamed ravine with a flowing stream on the western side of the northern fork of Pryor Cove. At the injection site, 1 lb of eosine oj was injected into the flowing stream immediately upstream from where the small stream sank into a closed depression (sinkhole) with an open throat near the Pennington-Bangor contact. The third and final dye injection for round 7 (I-22), was located in an unnamed western tributary to North Fork Pryor Cove Branch, where another stream flowed off the Pennsylvanian siliciclastic strata and then sank at the top of the Pennington Formation, similar to the geologic conditions at injection site I-20. One lb of sulphorhodamine b was injected approximately 20 ft upslope from the sinkpoint, which was covered by sandstone talus (fig. 31).
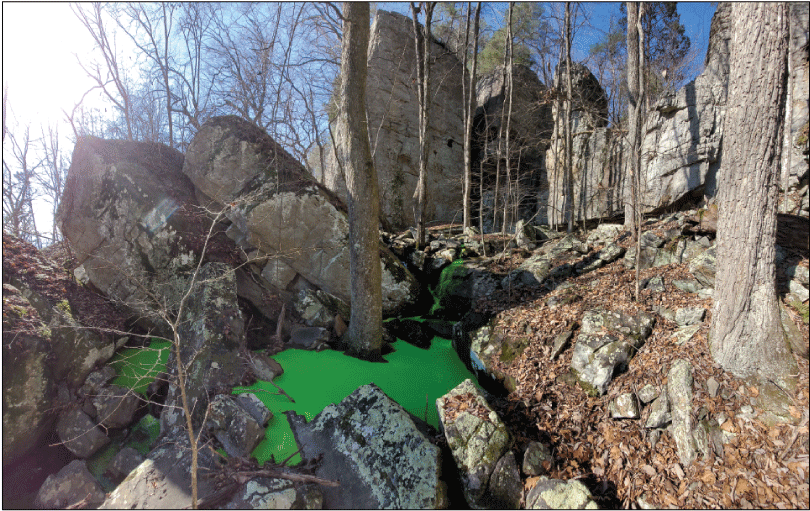
Photograph showing dye injection of fluorescein at injection site I-20, an unnamed surface stream near Castle Rock Point, January 9, 2023. Photograph by Benjamin V. Miller, U.S. Geological Survey.
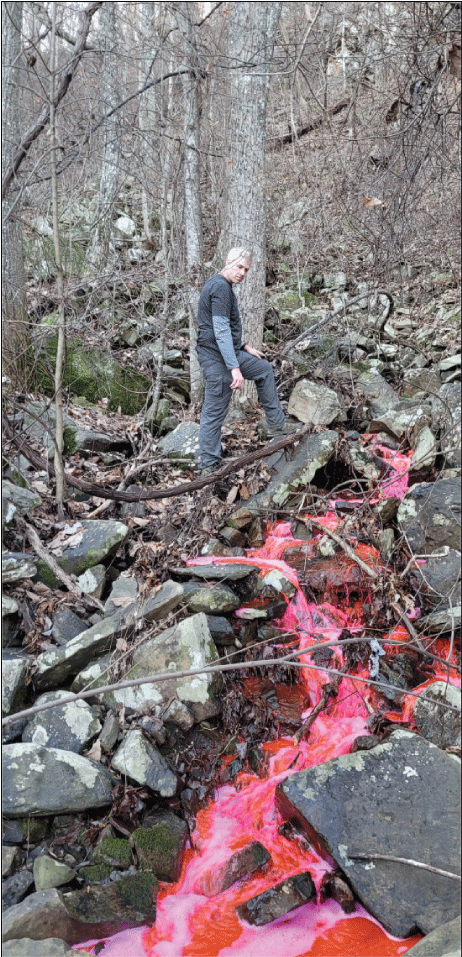
Photograph showing dye injection of sulphorhodamine b at injection site I-22, an unnamed tributary to North Fork Pryor Cove Branch, January 9, 2023. U.S. Geological Survey (USGS) scientists followed all appropriate safety protocols and requirements for working near, on, in, or over water consistent with approved USGS Job Hazard Analysis. Photograph by Benjamin V. Miller, U.S. Geological Survey.
Results from the seventh round of dye injections helped to further delineate the Blue Spring recharge area and defined part of its eastern boundary. Dye from injection I-20 was positively traced to Pryor Cave Spring (site no. 029) located near the head of Standifer Branch (figs. 14A and 25). The dye arrived at the site within 24 hours, and dye was still visible when packets were retrieved the next day, 22 hours postinjection. This trace further delineated an eastern boundary for the Blue Spring recharge area, which also shares a boundary with the recharge area for Sequatchie Cave. Dye from injection I-21 was detected at Blue Spring (site no. 018), arriving within 3 days postinjection, adding further confirmation that the western side of the northern fork of Pryor Cove provided recharge to the spring (figs. 14A and 25). The same dye from I-21 was also detected at a nearby spring monitoring site (site name: North Fork Pryor Cove spring, site no. 039), a valley floor spring downslope from the injection site (figs.14A and 25). Dye from injection I-22 was not detected at any of the monitoring sites established for the project.
Round 8, March 2023
The eighth round of dye injections was conducted on March 16, 2023, and focused on portions of the main streams of the North and West Fork Pryor Cove Branches, located in the Town of Jasper and one last unnamed tributary to North Fork Pryor Cove Branch near Highway 41. These injections aimed to show that portions of the Town of Jasper were hydrologically connected to Blue Spring and to extend the recharge for Blue Spring to the east and downstream toward the confluence of the two branches of the cove. The first injection of round 8 (I-23) was located in an eastern unnamed tributary to North Fork Pryor Cove Branch, where a stream sank into the lower Pennington Formation immediately upstream from the stream crossing at Highway 41. One lb of powdered fluorescein was injected into the small stream approximately 20 ft upstream from the sinkpoint for the stream (fig. 32). The second injection for round 8 (I-24) was conducted at the main stream channel of North Fork Pryor Cove Branch where it passes alongside North Pryor Cove Road. At this location the stream was completely dry, so a fire tanker truck provided by the Jasper Volunteer Fire Department was used to flush the 0.5 lb of sulphorhodamine b with approximately 3,500 gal of water postinjection. Following this injection, the third dye injection for round 8 (I-25) was conducted into the West Fork Pryor Cove Branch where the stream crosses Pryor Cove Road. Similar to the conditions present at I-24, the streambed was completely dry and a fire tanker truck flushed the 0.5 lb of eosine oj with 3,500 gal of water following the injection (fig. 33). Overall, smaller amounts of dye were used for injections I-24 and I-25 because of the close proximity of the dye injection locations to the mapped passages in Blue Spring.
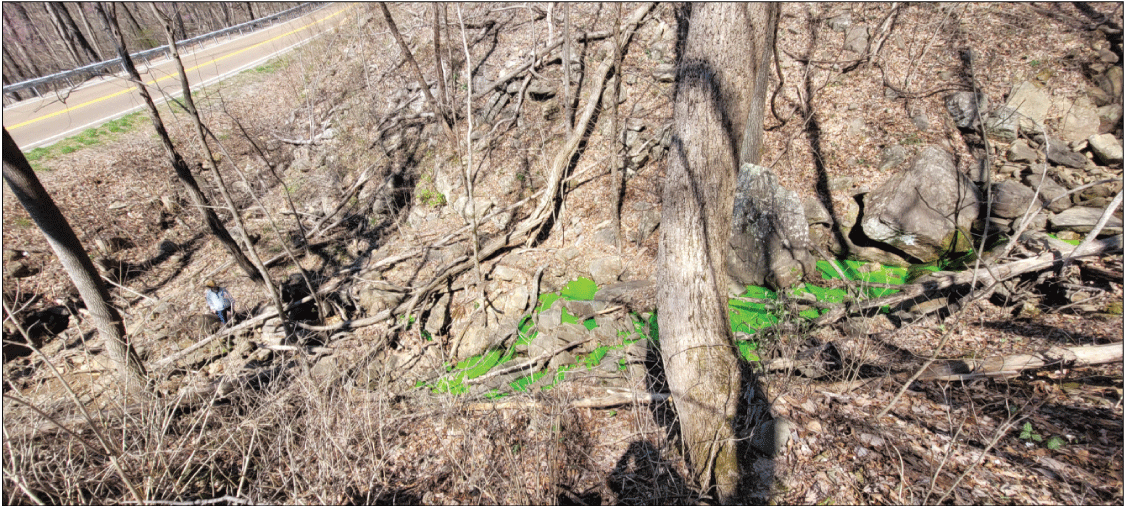
Photograph showing dye injection of fluorescein at injection site I-23, a sinking stream in the northern fork of Pryor Cove, March 16, 2023. Sink point of the stream is on the left side of the photo, flow is from right to left. Photograph by Benjamin V. Miller, U.S. Geological Survey.
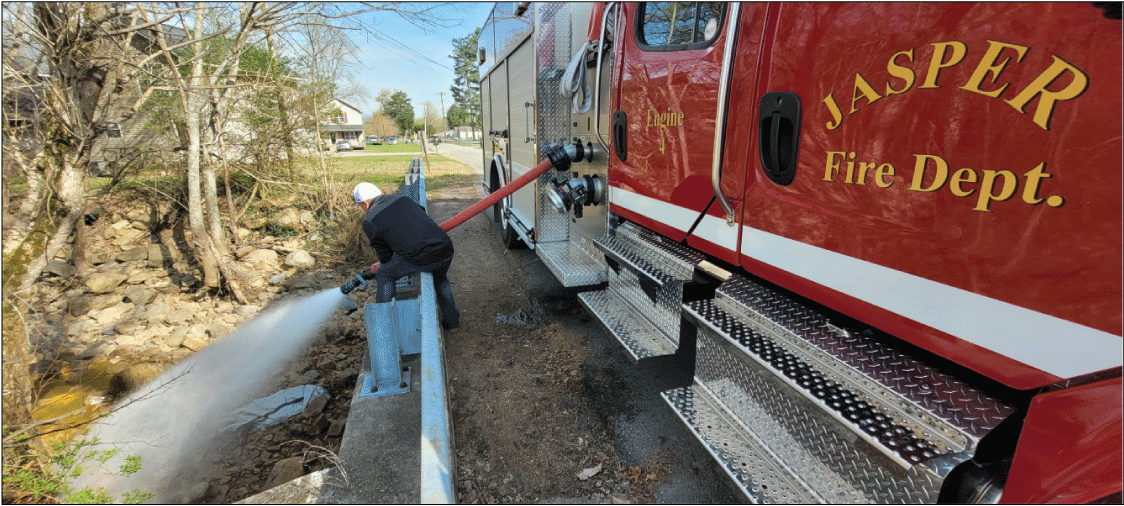
Photograph showing Jasper Volunteer Fire Department personnel flushing eosine oj dye by means of a fire tanker truck following dye injection I-25 in West Fork Pryor Cove Branch, March 16, 2023. Photograph by Benjamin V. Miller, U.S. Geological Survey.
Round 8 helped to extend the recharge area in the western fork of Pryor Cove and defined an eastern boundary for the Blue Spring recharge area. The dye from injection I-23 was detected on packets at Blue Spring (site no. 018) gathered 4 days postinjection and for several weeks thereafter (figs. 14A and 25). Eosine oj, from injection I-25, was detected on packets at Blue Spring gathered 8 days postinjection, but was not detected on the 4-day packets retrieved on March 20, 2023 (fig. 25). Sulphorhodamine b from injection I-24 was detected at Blue Spring on packets retrieved on April 10, indicating the dye took between 8 and 25 days to arrive at the spring. The reason for the delay on the arrival of the dye from injection I-24 compared to that of I-23 and I-25 is unknown and may have been due to the drier conditions at this site relative to the other two, the lack of a flowing stream, and the distance from this site to the spring conduit.
Discussion
Results from the dye tracing study have provided the necessary data to delineate recharge areas for six major springs and have allowed for analysis of the land use-land cover patterns for each recharge area. These data also help identify what potential threats to water quality and quantity exist in each recharge area. Dye tracing has provided insights into the controls on recharge area boundaries, shared recharge sources, karst groundwater flow paths and dye trace lengths from injection location to recovery sites.
Recharge Areas Delineated from Dye Tracing
Six recharge areas were delineated within the Little Sequatchie and Pryor Cove drainage areas using the traces and results from the eight rounds of dye injections. Recharge areas were delineated for Sequatchie Cave, “Keira” spring, Dancing Fern Cave, Ship Cave, the “Boils,” and Blue Spring. The recharge areas range in size from 7.25 to over 65.2 mi2 (table 4). Each of the delineated recharge areas is described in the following sections.
Sequatchie Cave Recharge Area
The recharge area for Sequatchie Cave covers approximately 11.76 mi2 and is primarily located in three different drainage areas: Dixon Cove, Sawmill Creek, and Water Fall Cove (fig. 34). A total of six traces hydrologically connected various portions of the recharge area to the cave system. Several dye injections in Dixon Cove were also traced to “Keira” spring, with the dye from injections in Dixon Cove typically appearing at “Keira” spring within 1–3 days and then at Sequatchie Cave 1–2 weeks postinjection. These results indicate that Sequatchie Cave shares approximately 51 percent of its recharge area with “Keira” spring. This finding may help explain why the streamflows observed at “Keira” spring were less than those at Sequatchie Cave, even ceasing during periods of drought. Land use-land cover data indicate that forest cover dominates the recharge area (table 5), with 87.75 percent of the recharge area being either deciduous forest, evergreen forest, or mixed forest (Dewitz and USGS, 2021). Developed land in the recharge area accounts for less the 2.5 percent of the overall recharge land use, and much of this development consists of roads and smaller subdivisions along U.S. Highway 41 and on top of the Cumberland Plateau between Dixon Cove and Sawmill Creek.
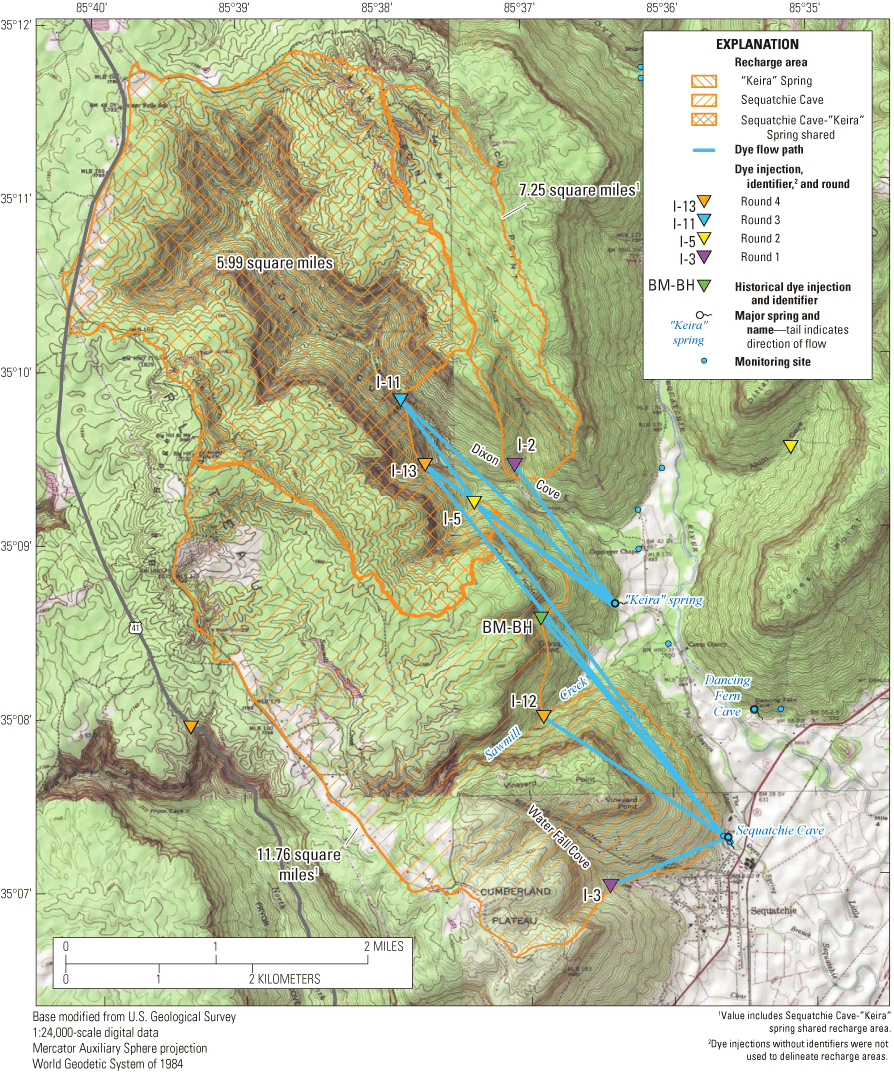
Map showing recharge areas for Sequatchie Cave and “Keira” spring, as well as recharge areas shared by the two systems. Only positive dye traces related to Sequatchie Cave and “Keira” spring are shown, and dye injection IDs correspond to those listed in tables 2 and 3. Values shown for Sequatchie Cave recharge area and Keira Spring recharge area extents include the area of overlap.
Table 5.
Land use-land cover percentages in the Sequatchie Cave recharge area.[Data from Dewitz and U.S. Geological Survey (2021). Totals provided for selected land use-land cover categories discussed in text]
“Keira” Spring Recharge Area
The recharge area for “Keira” spring covers approximately 7.25 mi2 and is located entirely within Dixon Cove (fig. 34), where dye injections in the main surface-water stream in Dixon Cove as well as from several tributaries were all positively traced to “Keira” spring. Most of these dye injection sites were also positively traced to Sequatchie Cave; however, injection I-2 in Lick Branch (fig. 18) was only traced to “Keira” spring. Thus, “Keira” spring shares over 83 percent of its recharge area with Sequatchie Cave. Multiple traces from Dixon Cove dye injections arrived at “Keira” spring prior to Sequatchie Cave, indicating that “Keira” spring is an overflow spring for the system, which only drains part of the overall recharge area for Sequatchie Cave. Land use-land cover data for the “Keira” spring recharge area (table 6) has the highest percentage of forest cover among the six recharge areas delineated, with 89.25 percent of the recharge area covered in forest (Dewitz and USGS, 2021). Slightly more than 1 percent of the recharge area is developed, mostly along Highway 41 to the west, and some portions to the west of the spring on the south side of Dixon Cove.
Table 6.
Land use-land cover percentages in the “Keira” spring recharge area.[Data from Dewitz and U.S. Geological Survey (2021). Totals provided for selected land use-land cover categories discussed in text]
Blue Spring Recharge Area
The recharge area for Blue Spring covers 11.68 mi2 and includes both the northern and western arms of Pryor Cove (fig. 35). Multiple dye injections conducted throughout both of the Pryor Cove drainage areas were positively traced to Blue Spring (fig. 25). Several of these traces were relatively rapid, arriving at the spring within a few days postinjection. Injections I-21 and I-23 were both detected at Blue Spring within 3–4 days postinjection. Dye injections in the Blue Spring recharge area were also conducted across a range of geologic units. Streams were commonly found to sink at the Pennington-Bangor contact; however, several sinking streams in the area sank at the top of the Pennington Formation, several hundred feet above the contact with the underlying Bangor Limestone. Several dye traces in the Sequatchie Cave-”Keira” springs recharge area helped to define an eastern boundary for the recharge area, as did the trace from injection I-20 near Castle Rock Point to Pryor Cave Spring (029). Traces in the Blue Spring recharge area indicate that sinking streams, both high on the flanks of the Cumberland Plateau and at the main valley sinkpoints, contribute recharge to this large spring. The final traces from the lower part of the Pryor Cove northern and western arms (I-24 and I-25) also show that portions of the Town of Jasper are located within the recharge area of the spring. Land use-land cover within the recharge area is similar in overall category percentages to the other spring recharge areas in the study area. Forestland covers 81.7 percent of the overall recharge area, and developed or barren land covers 3.2 percent (0.37 mi2; table 7) (Dewitz and USGS, 2021). The developed and barren land portions are largely located in the lower portions of the recharge area, in the neighborhoods along the North and West Fork Pryor Cove Branches. There are some larger pasture lands in upper portions of both coves above the rim of the Cumberland Plateau. Although the percentages of developed or barren land are relatively low, these areas are concentrated directly adjacent to the mapped spring conduit of Blue Spring; thus, these areas may have a larger influence on water quality than other land use-land cover types because of their proximity to the spring.
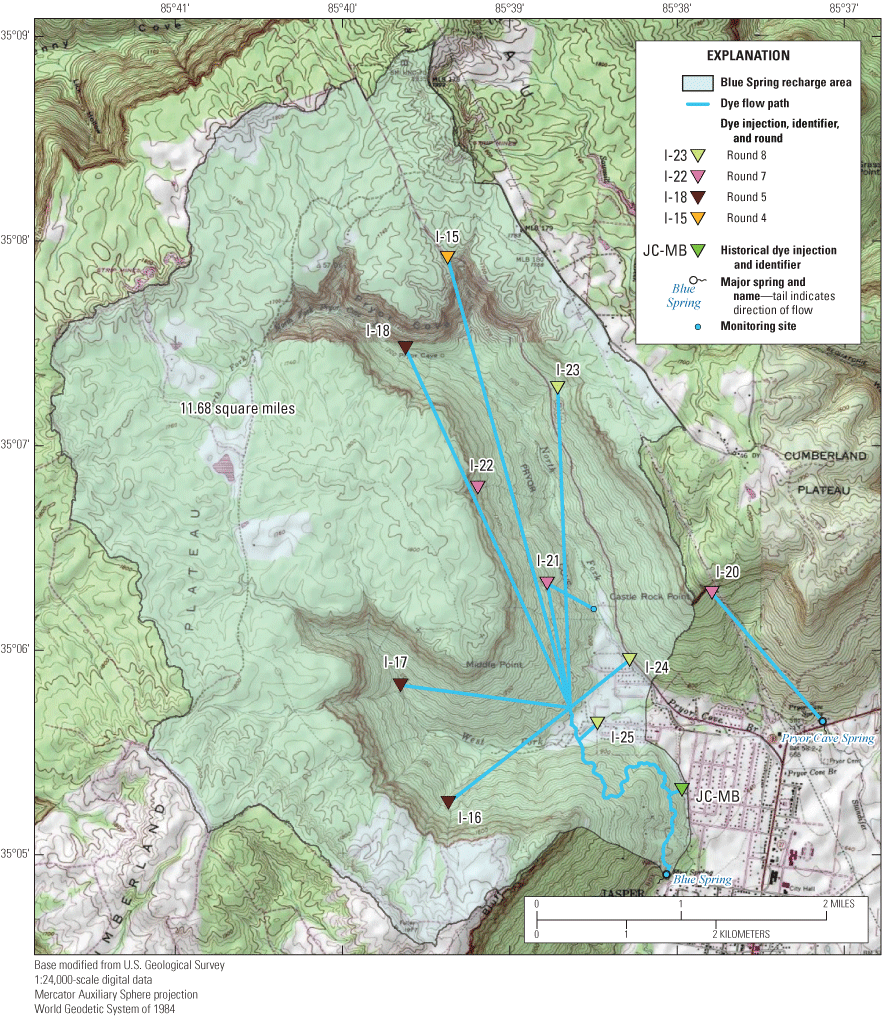
Map showing recharge area for Blue Spring. Only positive dye traces to Blue Spring and related to the delineation of a recharge area are shown, and dye injection IDs correspond to those listed in tables 2 and 3.
Table 7.
Land use-land cover percentages in the Blue Spring recharge area.[Data from Dewitz and U.S. Geological Survey (2021). Totals provided for selected land use-land cover categories discussed in text]
Dancing Fern Cave Recharge Area
The recharge area for Dancing Fern Cave was delineated from two positive traces in Pocket Creek (injection I-6) and Alum Cove (injection I-7). The Dancing Fern Cave recharge area covers 16.75 mi2 and consists of portions of each cove upstream from the injection sites (fig. 36). Similar to other settings in the Little Sequatchie River valley, there are valley segments downstream from the injection sites that may contribute additional recharge to Dancing Fern Cave, although in the case of Pocket Creek, it likely would contribute recharge to the “Boils” shortly thereafter, and in Alum Cove, these downstream segments may flow directly to the Little Sequatchie River. Land use and land cover data for the recharge area (table 8) indicate that forest covers 79.9 percent of the total area, with the majority of the forest cover being deciduous. Developed land, which includes barren land as well, totals 4.3 percent (0.67 mi2) of the recharge area (Dewitz and USGS, 2021). The trace from Pocket Creek to Dancing Fern Cave (fig. 18) was noteworthy both in the length of the trace (6.74 mi) and the short period of time for the dye to arrive at the spring (48.8 hours). The trace length from Pocket Creek to Dancing Fern Cave makes this trace one of the longer dye traces in the State, comparable to those for other major karst systems on the Cumberland Plateau (Crawford, 1989; Miller and others, 2019). The field-measured groundwater velocities for this trace were 749 feet per hour, which would only occur in an aquifer with a very high hydraulic conductivity (Freeze and Cherry, 1979; White, 1988), and indicate significant portions of conduit flow between the sinkpoint in Pocket Creek cove and Dancing Fern Cave.
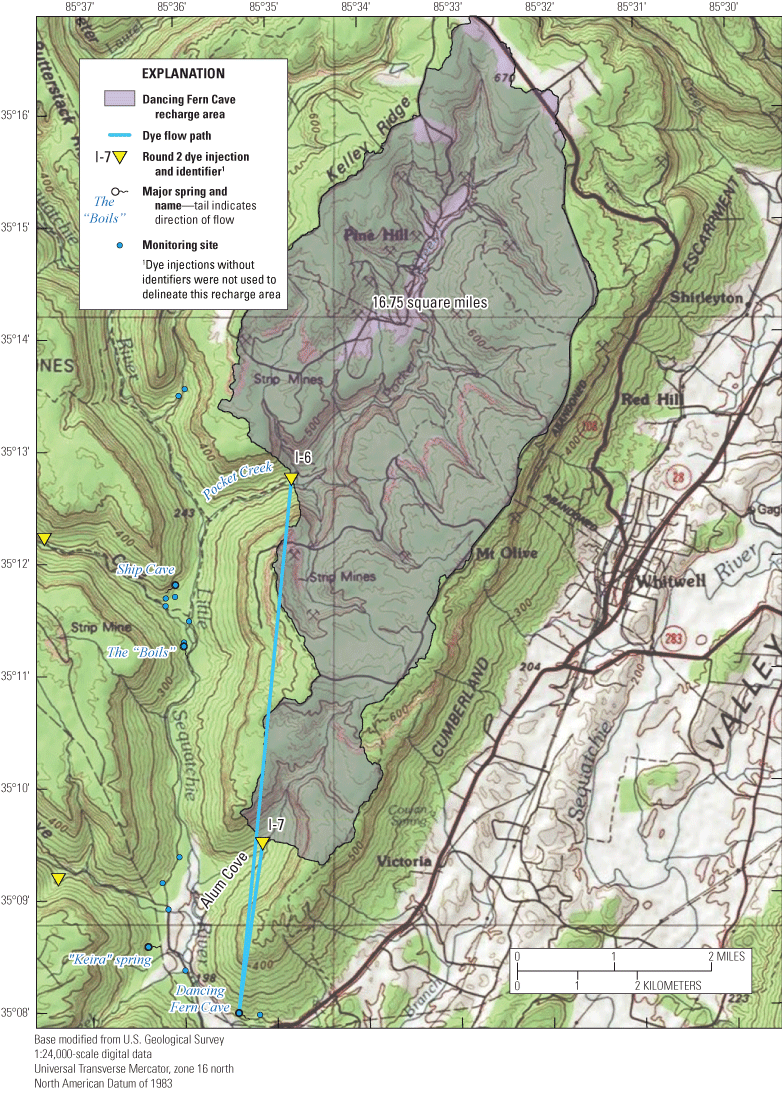
Map showing recharge area for Dancing Fern Cave. Only positive dye traces to Dancing Fern Cave and related to the delineation of a recharge area are shown, and dye injection IDs correspond to those listed in tables 2 and 3.
Table 8.
Land use-land cover percentages in the Dancing Fern Cave recharge area.[Data from Dewitz and U.S. Geological Survey (2021). Totals provided for selected land use-land cover categories discussed in text]
Ship Cave Recharge Area
The Ship Cave recharge area is located entirely within the Indian Cove drainage area and extends upstream from the injection site (I-4) to encompass a total of 10.18 mi2 (fig. 37). This recharge area is shared with “Indian Ship” spring, which appears to be a perennial overflow spring on the basis of trace results and observations following rainfall events. The streambed within Indian Cove is typically dry downstream from the injection site to the confluence with the Little Sequatchie River and it is likely that portions of the valley, in this reach, drain to Ship Cave and “Indian Ship” spring. However, the lack of flowing water precluded the ability to conduct further dye injections, and no additional traces were conducted in the valley to confirm any further connections. Land use within the Ship Cave recharge area (table 9) is largely forest, composing 77 percent of the recharge area, with deciduous forest being the predominant forest type. Developed or barren land constitutes 1.47 percent of the recharge area (Dewitz and USGS, 2021). Currently, the Ship Cave recharge represents the fifth largest recharge in the Little Sequatchie River valley.
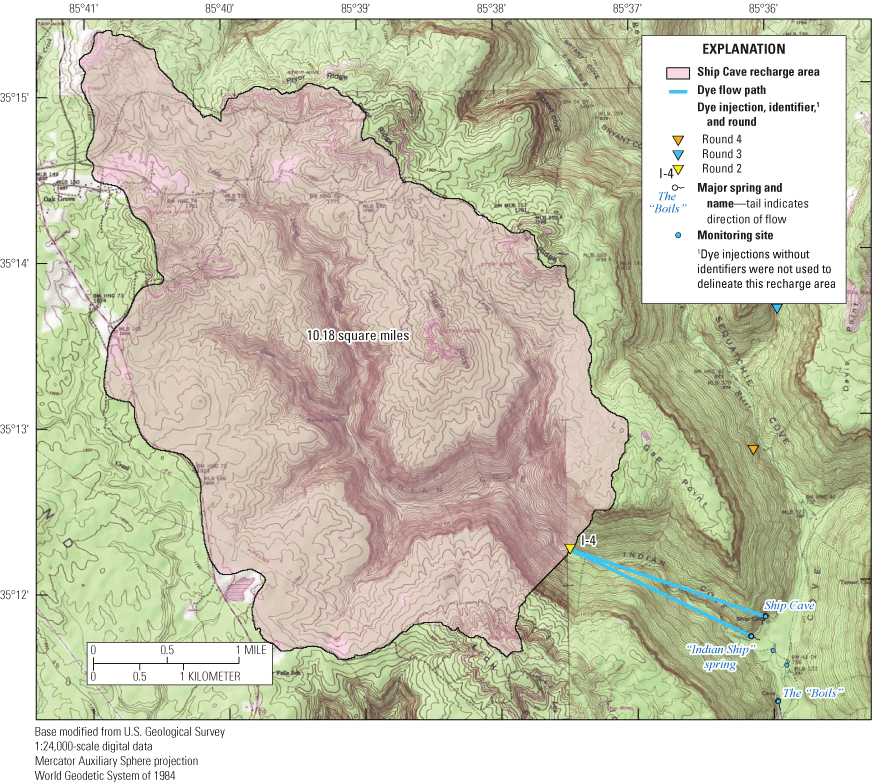
Map showing recharge area for Ship Cave. Only positive dye traces to Ship Cave or “Indian Ship” spring or those traces related to the delineation of a recharge area are shown, and dye injection IDs correspond to those listed in tables 2 and 3.
Table 9.
Land use-land cover percentages in the Ship Cave recharge area.[Data from Dewitz and U.S. Geological Survey (2021). Totals provided for selected land use-land cover categories discussed in text]
The “Boils” Recharge Area
The “Boils” recharge area is the largest recharge area in the Little Sequatchie watershed, covering 65.2 mi2, and includes the upper portion of the Little Sequatchie River as well as several major tributaries, including Mill Creek, Peter Cove Creek, and Grays Creek (fig. 38). Five total traces were used in the delineation of the recharge area, and several of these traces have lengths exceeding 5 mi, including the trace from injection I-1, which is one of the longer dye traces in Tennessee, with a length of 7.65 mi. The recharge area extends to the watershed divide with both the Collins River, to the north, and the Elk River, to the west (fig. 4B). Previous dye tracing research has shown that streams sinking in the headwater drainages of the Collins River watershed (consisting of the upper portion of the Collins River valley, Big Creek valley, and Savage Gulf) eventually flow to the large feature known locally (and referred to herein) as “’Grundy Big’ spring” near Tarlton, Tennessee (fig. 4B) (Miller and others, 2019). Thus, the recharge area for the “Boils” shares a boundary with the “Grundy Big” spring recharge area. The “Boils” recharge area is one of the only recharge areas in the Little Sequatchie drainage area that encompasses any towns or communities. The communities of Coalmont, Tracy City, and Gruetli-Laager are all partially located within the northern boundaries of the “Boils” recharge area (fig. 38). Land use-land cover within the “Boils” recharge area is dominated by forest cover, with approximately 87 percent of the recharge covered by forest (table 10) (Dewitz and USGS, 2021). Developed land or barren land covers 3.5 percent or approximately 2.28 mi2 of the recharge area and is the result of several communities that are, at least partially, located within the recharge area boundary.
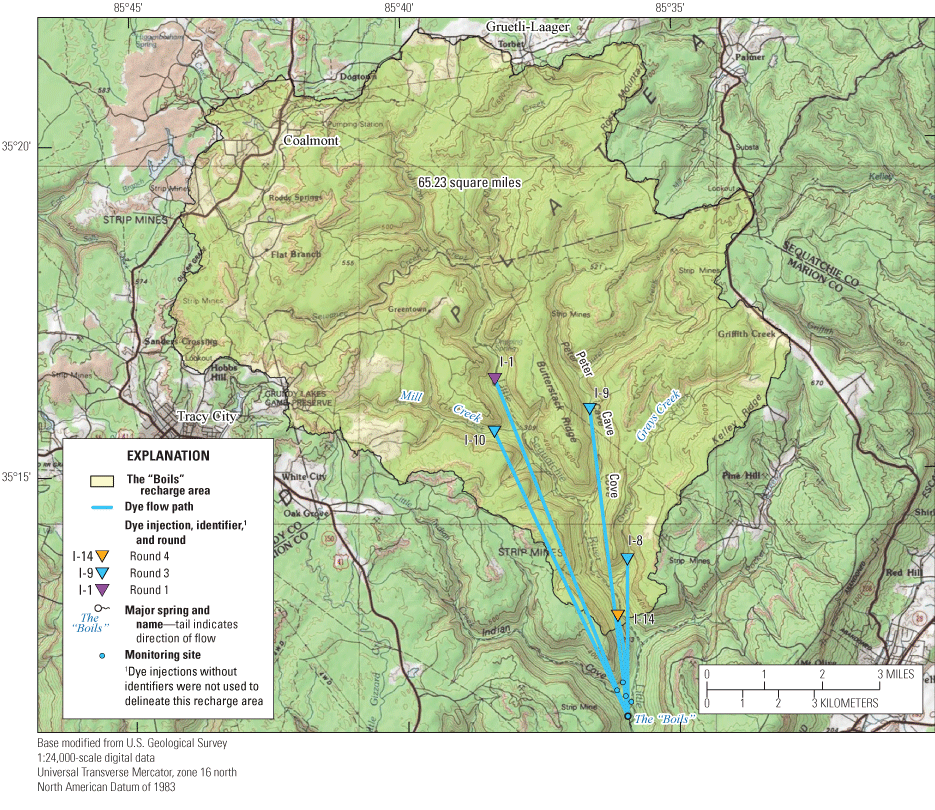
Map showing recharge area for the “Boils.” Only positive dye traces to the “Boils” and related to the delineation of a recharge area are shown, and dye injection IDs correspond to those listed in tables 2 and 3.
Table 10.
Land use-land cover percentages in the “Boils” recharge area.[Data from Dewitz and U.S. Geological Survey (2021). Totals provided for selected land use-land cover categories discussed in text]
Land Use–Land Cover Patterns and Possible Threats to Water Quality and Quantity
Within the study area are a number of land use-land cover types and other human activities that pose potential risks to water quality and quantity in the springs, caves, and stream ecosystems. Urban development, although relatively sparse in some of the recharge areas, does pose potential threats from roads, residential development, wastewater effluent discharges, and stormwater runoff from impervious surfaces. These areas are primarily in the higher elevation portions of the recharge areas, with the exception of the Town of Jasper, which overlaps with the recharge area for Blue Spring. In addition to the risks to water quality within the urban areas themselves, roadside dumps occur in the areas surrounding some towns and are especially common in rural areas having no community trash service. Both the Little Sequatchie and Pryor Cove drainage areas have numerous roadside dumps that vary widely in scale and size. In addition, barren land and hay/pasture land-use areas may pose potential threats to water quality from sedimentation of unvegetated areas or bacterial contamination from livestock grazing on pastures.
Although land use-land cover data are a valuable tool for examining larger scale patterns, potential risks to karst aquifers exist within the study area that may not be easily identified from land use-land cover data. Timber harvesting is prevalent within the study area, and extensive tracts of land are still owned by timber companies within the Little Sequatchie watershed. Logging on steep slopes above stream channels, particularly in areas near stream sinks or karst openings, can result in sedimentation from runoff that can have detrimental impacts to karst biota that often inhabit interstitial spaces in streambeds (Holliday and others, 2020). Rock harvesting or “rock mining” has increased in frequency throughout the Little Sequatchie and Pryor Cove drainage areas. This activity involves excavating talus and sandstone “float” from the side slopes of the Cumberland Plateau, and the resulting disruption of the forest floor results in increased runoff from precipitation events, leading to gully formation and increased sedimentation. The historical remains of coal mines in both drainages can be sources of acid-mine drainage where groundwater seepage through the mine interacts with minerals to create extremely acidic, low-pH water that then discharges into streams. Although this issue may not be as severe at this location as at similar settings in Tennessee, such as the East Fork Obey River (Sasowsky and White, 1993; Webb and Sasowsky, 1994), acid mine drainage can be particularly harmful to sensitive cave biota such as cavefish and cave crayfish. Two major pipelines cross through the Little Sequatchie River valley, one containing natural gas and the other containing a refined and (or) petroleum product (non-high volatile liquid). Pipeline locations and information for Marion County and Grundy County were obtained from the National Pipeline Mapping System (NPMS, 2024). The natural gas pipeline runs through portions of the Sequatchie Cave/“Keira” spring and Ship Cave recharge areas, and the non-high-volatile-liquid pipeline extends through the Dancing Fern Cave and the “Boils” recharge areas. Although this liquid is relatively inert if the pipeline is properly operating, the primary risk to karst groundwater is from accidental rupture of the pipeline. If the rupture occurred over or directly adjacent to stream channels, the liquid would likely sink nearly immediately into the subsurface (Vandike, 1982; Rosen, 1997; Haugh and Bradley, 2001). Lastly, another potential threat to water quality that is particularly prevalent in the Little Sequatchie River valley is off-road-vehicle (ORV) usage. Although sporadic ORV usage might not be a major water-quality disturbance, the valley has seen a dramatic increase in ORV usage in recent years. Often on summer weekends, dozens to even hundreds of ORVs travel up through portions of the Little Sequatchie drainage area. This activity frequently includes driving through streams, sometimes into cave entrances, and has the potential to denude relatively extensive portions of the forest floor because of trail widening. Off-road vehicle usage has the potential to create increased sedimentation into streams from trail migration or attempts to drive on steep slopes.
Characteristics of Recharge Areas in the Little Sequatchie River Valley and Pryor Cove
The upper reaches of the delineated recharge areas in both the Little Sequatchie River valley and Pryor Cove have fairly distinct boundaries (plate 1), in most cases, because of the Pennsylvanian siliciclastic strata (the Crab Orchard Mountain Group and the Gizzard Group) that cap the top of the Cumberland Plateau (fig. 5A, B). These strata are unlikely to be karstified, because of the lack of soluble strata, and thus the topography of these upper reaches is one of the constraints on the recharge areas. Once streams flow off the insoluble strata, they sink into soluble strata and the karst groundwater is able to move more freely through the landscape independent of topography. As a result of this combination of strata and topography, many of the spring systems have recharge areas that, although sharing a boundary with another spring, show limited evidence of interbasin transfer from one recharge area to another. A precipitation event may pass over one or more recharge areas and cause a corresponding rise (both in flow and turbidity) at one spring while other adjacent springs show no indication of the precipitation event and continue to flow at a lesser volume. This behavior was observed at the Ship Cave system on February 28, 2022, when the Ship Cave system was flooding from a precipitation event from the previous evening, creating an additional overflow spring near “Indian Ship” spring. On this date, Ship Cave was the only system in flood stage. Throughout the project, similar events were later observed at both “Keira” spring and at the “Boils,” on separate days, following storm events from the previous day.
The only exception to the distinct recharge area boundaries was the 5.8-mi2 shared recharge areas for Sequatchie Cave and “Keira” spring in Dixon Cove (plate 1). Multiple traces in Dixon Cove, both in the main stream and in western tributaries, were traced to both “Keira” spring and Sequatchie Cave (fig. 34). Typically dye appeared at “Keira” spring a few days prior to arriving at Sequatchie Cave. Although the documentation of shared recharge areas is not novel in karst areas (Vandike, 1992; Aley and others, 2007), this is an uncommon characteristic for karst systems on the Cumberland Plateau. In this system, it appears that “Keira” spring may function as an overflow spring for the Sequatchie Cave flow system, because “Keira” spring may dry up completely during low flow periods whereas Sequatchie Cave continues to flow. Although overflow springs are a common feature, often found in karst areas and even within the study area (for example, the “Boils,” “Indian Ship” spring), this particular overflow spring is located several miles up into the recharge area and thus is only recharged by a portion of the total recharge area for the main spring. Both “Keira” spring and Sequatchie Cave are clearly recharged, at least in part, by conduit flow systems and “Keira” spring appears to be an additional outlet for the system located along the conduit network from Dixon Cove to Sequatchie Cave.
Geologic Influences on Karst Groundwater Flow Paths and Trace Lengths
There are notable differences between the karst groundwater behavior in the upper portion of the Little Sequatchie River valley, specifically upstream from Indian Cove, compared to the behavior observed in the lower Little Sequatchie River valley and Pryor Cove (fig. 6). The differences between the two regions appear to be influenced by underlying geology and the degree to which streams have dissected into the Cumberland Plateau stratigraphy. Recharge features for the karst systems are largely focused at discrete locations where insoluble and soluble strata meet, allowing allogenic recharge to the karstic units. In both the Little Sequatchie and Pryor Cove drainage areas, these recharge features are concentrated along the Pennington-Bangor contact, although at some locations in Pryor Cove streams sank at the very top of the Pennington Formation several hundred feet above the Pennington-Bangor contact. Although stream sinks and recharge features are concentrated in the Pennington Formation and Bangor Limestone, the proximity of the valley floor to the top of the Hartselle Formation seems to affect the length of karst groundwater flow paths, the recharge areas that drain to specific springs, and whether perennial streamflow is present in the main channel. In other portions of the Cumberland Plateau, the Hartselle Formation is an aquitard that causes perching of both surface and subterranean streams (Crawford, 1987; Davis and Brook, 1993; Simpson and Florea, 2009; Blair and Vanderhoff, 2019). In the portions of the Little Sequatchie River valley that are upstream from Indian Cove, the Hartselle is considerably deeper, occurring below the valley floor. Enterable caves upstream from Indian Cove can be formed well below (as much as 120 ft beneath) the valley floor and are entirely within Bangor Limestone (Tennessee Cave Survey, unpub. data, 2023). Although these caves have active streams and periodically flood, the main flow from many of the major stream sinks is located below these caves, deeper in the Bangor Limestone. Farther down the valley, the surface streams have dissected further into the Bangor and the depth to the Hartselle below the valley floor decreases until the contact between the Bangor and Hartselle is at valley floor level, albeit covered by alluvium (Milici and Finlayson, 1979). In Pryor Cove (fig. 5A), the Hartselle Formation is beneath the valley floor for the entire drainage area and largely does not outcrop in the watershed. There is a small, documented Hartselle outcrop directly adjacent to the drainage near Pryor Cave Spring (Milici and others, 1986).
Traces in the middle to upper Little Sequatchie River valley had an overall longer distance from the injection locations to recovery sites than those in the lower Little Sequatchie River valley and Pryor Cove (figs. 17 and 18, table 11). Several traces in the upper Little Sequatchie River valley, particularly above Indian Cove, had lengths that exceeded 6 mi, and injection I-1 had a trace length that totaled 7.65 mi from the main sinkpoint on the Little Sequatchie River to the “Boils” (table 11). These longer traces may be due to conditions that allow flow from sinking streams to drop deep into the Bangor Limestone, following conduits or preferential flow paths and eventually resurging from springs. The added thickness of the Bangor Limestone below the valley floor also allows for more groundwater movement from a stream or cove on one side of the valley to traverse and eventually resurge from a spring on the opposite side of the valley. This is true for flow from stream sinks in Peter Cave Cove and Grays Creek that travels from the east side of the Little Sequatchie River valley, under the main valley, and resurges from the “Boils” on the west side of the valley (fig. 17).
Table 11.
Dye injection locations, recovery sites, and distances for dye traces used in this study.[mi, mile]
Toward the lower end of the Little Sequatchie watershed, below Indian Cove, the trace lengths are shorter, overall, and karst groundwater flow paths appear to be constrained to the flanks of the main valley (fig. 18, table 11). In the lower Little Sequatchie River valley, this may be due in part to the proximity of the Hartselle Formation beneath the valley floor inhibiting downward flow of stream water and decreasing the distances that subterranean streams can traverse. In these portions of the Little Sequatchie River valley, cave passages are typically located above the valley floor and the Little Sequatchie River flows perennially downstream from the “Boils.” The close proximity of the Hartselle to the floor of the lower Little Sequatchie River valley also means the ability for karst groundwater to travel from stream sinks below the main stream is limited and thus the recharge areas for the individual springs are located on the same side of Little Sequatchie River valley as the spring outlets. The inability for recharge from sinking streams in the lower part of the Little Sequatchie River valley to travel deep below the valley floor, because of the Hartselle Formation impeding the downward movement of water, likely influences both the distances that karst groundwater in the Bangor Limestone can travel before discharging at springs as well as what areas are able to contribute recharge to springs.
In Pryor Cove (fig. 25), trace length may have been more influenced by the smaller extent of the watershed itself than in areas with a similar geologic setting in the Little Sequatchie River valley. Karst groundwater from stream sinks in Pryor Cove successfully breaches the Hartselle Formation to flow to the conduits in the underlying Monteagle Limestone. The Blue Spring conduit is formed entirely in the Monteagle Limestone; thus, all positive traces performed from locations in the Pennington Formation or at the Pennington-Bangor contact had to pass through the Hartselle Formation to recharge the spring. Despite this behavior, the Hartselle Formation does appear to have some influence on streamflow in the Pryor Cove area, as perennial flow in Standifer Branch begins at or near where the Hartselle Formation crops out on the surface. Although both dye injections in the lower portions of the Pryor Cove northern and western arms are located on Bangor Limestone, on the basis of geologic mapping and outcrops, this proximity to the Hartselle Formation may have influenced traveltimes from injections I-24 and I-25. At injection site I-24 in the lower part of the northern fork of Pryor Cove, dye took considerably more time to flow to Blue Spring compared to the dye injected at site I-25 in the western fork of Pryor Cove. Injection I-25 in western fork of Pryor Cove was conducted nearly on top of the mapped spring conduit, whereas injection I-24 was only conducted 0.5 mi away (fig. 25). It is possible that a more competent section of the Hartselle Formation at injection site I-24 caused the dye to ultimately remain in the stream channel longer, rather than immediately sinking into the subsurface to recharge the spring. This may have been why the dye from the northern fork of Pryor Cove (I-24) was not detected on packets from Blue Spring until April 10, 2023 (25 days), whereas packets collected on March 28, 2023 (12 days) indicated dye from West Fork Pryor Cove Branch (I-25) had already arrived at Blue Spring.
Summary
Karst groundwater tracing studies were conducted by the U.S. Geological Survey in the Little Sequatchie River and Pryor Cove watersheds from December 2021 through May 2023 to delineate recharge areas for several springs. Over the 18-month period, a total of eight rounds of dye injections were conducted across a total of 25 dye injection locations. The dye injections and the subsequent dye traces were used to delineate recharge areas for six major springs: Sequatchie Cave, ”Keira” spring, Blue Spring, Dancing Fern Cave, the “Boils” spring group, and Ship Cave. The recharge areas range in size from 7.3 to 65.2 square miles. All of the recharge areas share a boundary with at least one other spring recharge area, and two of the springs (Sequatchie Cave and ”Keira” spring) share approximately 5.8 square miles of recharge area in Dixon Cove. Most of the dye injections occurred at or near the contact between the Mississippian Pennington Formation and the underlying Mississippian Bangor Limestone, where the majority of the streams sink entirely. Extensive dry reaches of streambed extend downstream from these sinkpoints until, eventually, springs farther down the valley create perennial flow at points where the sinking streams eventually resurge. As a result of this characteristic, many of the dye traces in the study were of significant length, with multiple traces exceeding 6 miles. Additionally, some of the traces were relatively rapid, indicating that portions of the flow path must be reliant on conduit flow and would be on the higher end of the range of hydraulic conductivities for karst limestones.
Land use-land cover varies across the multiple recharge areas, although forest cover generally is the dominant land use-land cover type, covering greater than 77 percent of the total area in all recharge areas. There are other potential risks to karst groundwater quality and quantity from development, logging, rock mining, acid mine drainage, off-road vehicle usage, pipelines, and roadside dumps. These human activities have the potential to degrade subterranean habitat or negatively impact sensitive biota reliant on clean and clear spring water.
The southern Cumberland Plateau, where both the Little Sequatchie River valley and Pryor Cove are located, is an area noted for extensive cave and karst development as well as for its abundance of subterranean biodiversity. Studies that help to identify what areas impact water quality and quantity for springs and caves, utilized as habitat by sensitive biota, enhance understanding toward maintaining a healthy and diverse subterranean ecosystem. Information from recharge area delineation studies may be used by resource managers to better protect areas draining to springs and the unique biota that inhabit karst ecosystems.
References Cited
Aley, T., Aley, C., Moss, P., and Hertzler, E., 2007, Hydrogeological characteristics of delineated recharge areas for 40 biologically significant cave and spring systems in Missouri, Arkansas, Oklahoma, and Illinois, in 2007 National Cave and Karst Management Symposium, St. Louis, Missouri, October 8–12, 2007, [Proceedings]: National Cave and Karst Research Institute, p. 154–167, accessed June 23, 2023, at http://st1.asflib.net/MEDIA/ASF-CD/ASF-M-00111/Papers/aley.pdf.
Baker, T.T., and Van Lear, D.H., 1998, Relations between density and rhododendron thickets and diversity of riparian forest: Forest Ecology and Management, v. 109, nos. 1–3, p. 21–32, accessed September 26, 2023, at https://www.sciencedirect.com/science/article/pii/S037811279800259X.
Beck, H., Zimmermann, N., McVicar, T., Vergopolan, N., Berg, A., and Wood, E.F., 2018, Present and future Köppen-Geiger climate classification maps at 1-km resolution: Scientific Data, v. 5, no. 1, article 180214, 12 p., accessed June 5, 2023, at https://doi.org/10.1038/sdata.2018.214.
Blair, R.J., and Vanderhoff, S.M., 2019, Karst groundwater tracer tests and basin delineation, Wayne and Clinton Counties, south central Kentucky—Non-point source groundwater study: Kentucky Department of Environmental Protection, 68 p., accessed May 12, 2023, at https://eec.ky.gov/Environmental-Protection/Water/Reports/Reports/NPS0903-SCKYKarst.pdf.
Community Collaborative Rain, Hail & Snow Network [Cocorahs], 2022, Daily precipitation maps for Marion County, Tennessee [November 1, 2022, through November 30, 2022]: Community Collaborative Rain, Hail & Snow Network database, accessed September 9, 2024, at https://www.cocorahs.org/Maps/ViewMap.aspx?state=usa.
Crawford, N.C., 1987, The karst hydrogeology of the Cumberland Plateau escarpment of Tennessee—Subterranean stream invasion, conduit cavern development, and slope retreat in the Lost Creek Cove area, White County, Tennessee: Tennessee Department of Conservation, Division of Geology, Report of Investigations, no. 44, pt. 1, 43 p.
Crawford, N.C., 1989, The karst hydrogeology of the Cumberland Plateau escarpment of Tennessee—Karst valley development and the headward advance of the Sequatchie Valley in the Grassy Cove area, Cumberland County, Tennessee: Tennessee Department of Conservation, Division of Geology, Report of Investigations, no. 44, pt. 2, 41 p.
Crawford Hydrology Laboratory, 2021, Karst groundwater investigation research procedures: Bowling Green, Kentucky, Western Kentucky University, 18 p., accessed February 13, 2023, at https://drive.google.com/file/d/1ftv3tn85dchhZP1s7r80t7zyKU3Di8WG/view.
Dewitz, J., and U.S. Geological Survey [USGS], 2021, National Land Cover Database (NLCD) 2019 products (ver. 2.0, June 2021): U.S. Geological Survey data release, https://doi.org/10.5066/P9KZCM54.
Greene, D.C., and Wolfe, W.J., 2000, Superfund GIS - 1:250,000 geology of Tennessee: U.S. Geological Survey data release, https://doi.org/10.5066/P99QEYIG.
Haugh, C.J., and Bradley, M.W., 2001, Emergency response sampling of air from caves following a diesel fuel release, Chickamauga-Chattanooga National Military Park, Lookout Mountain, Tennessee, p. 163, in U.S. Geological Survey Karst Interest Group—Proceedings, St. Petersburg, Florida, February 13–16, 2001: U.S. Geological Survey Water-Resources Investigations Report 2001–4011, 218 p.
Holliday, C., Hale, S., and Groves, C., 2020, Forest management considerations and best management practices on karst landscapes—A lesson in evidence-based management guidelines, in Conservation of Fragile Karst Resources—A virtual workshop on sustainability and community in support of UNESCO science programs, August 18–20, 2020, Proceedings: Western Kentucky University, George Wright Society, and Mammoth Cave Area Biosphere Reserve, video, 02:19:49, accessed June 6, 2023, at https://digitalcommons.wku.edu/con_karst_res_proc/con_karst_pro_2020/day_one/6.
Liebundgut, C., 1998, Vulnerability of karst aquifers, in Leibundgut, C., Gunn, J., and Dassagarues, A., eds., Karst hydrology—Proceedings of Workshop W2 Held at Rabat, Morocco, April 23–May 3, 1997: International Association of Hydrological Sciences publication 247, p. 45–60., accessed May 5, 2023, at https://www.researchgate.net/profile/Chris-Leibundgut/publication/294570938_Vulnerability_of_karst_aquifers/links/5b066d440f7e9b1ed7e8365f/Vulnerabili ty-of-karst-aquifers.pdf.
Miller, B.V., Ham, B., McKee, Z., and Schindel, G., 2019, Dye tracing large springs and complex karst systems along the Cumberland Plateau of Tennessee, in Sutherland, C., and Strand, C., eds., Guidebook for the 2019 NSS Convention, Cookeville, Tennessee—Land of 10,000 Caves: Huntsville, Alabama, National Speleological Society, 207 p.
Miller, B.V., and Hourigan, A.M., 2023, Mapping karst groundwater flow paths and delineating recharge areas for springs in the Little Sequatchie and Pryor Cove watersheds, Tennessee: U.S. Geological Survey data release, https://doi.org/10.5066/P95PX5UW.
National Pipeline Mapping System [NPMS], 2024, Public map viewer: National Pipeline Mapping System database, accessed May 1, 2023, at https://pvnpms.phmsa.dot.gov/PublicViewer/.
Niemiller, M.L., Slay, M.E., Inebnit, T., Miller, B., Tobin, B., Cramphorn, B., Hinkle, A., Jones, B.D., Mann, N., Niemiller, K.D.K., and Pitts, S., 2023, Fern Cave—A hotspot of subterranean biodiversity in the Interior Low Plateau karst region of Alabama in the southeastern United States: Diversity, v. 15, no. 5, article 633, 16 p., accessed May 8, 2023, at https://doi.org/10.3390/d15050633.
Niemiller, M.L., and Zigler, K.S., 2013, Patterns of cave biodiversity and endemism in the Appalachians and Interior Plateau of Tennessee, USA: PLoS One, v. 8, no. 5, article e64177, accessed September 17, 2020, at https://doi.org/10.1371/journal.pone.0064177.
Sequachee Valley News, 1900, The mills at Peter Cave: Sequachee Valley News, November 8, 1900, v. 8, no. 14, p. 1, accessed April 15, 2024, at https://chroniclingamerica.loc.gov/lccn/sn89058250/1900-11-08/ed-1/seq-1/.
Tennessee Division of Forestry, 2020, Tennessee Forest Action Plan—2020–2030: Tennessee Department of Forestry, 140 p., accessed September 26, 2023, at https://www.tn.gov/agriculture/forests/protection/ag-forests-action-plan.html.
U.S. Climate Data, 2023, Climate data for Tennessee: U.S. Climate Data database, accessed June 5, 2023, at https://www.usclimatedata.com/climate/tennessee/united-states/3212.
U.S. Geological Survey [USGS], 2019, The StreamStats program: U.S. Geological Survey web page, accessed August 12, 2023, at https://streamstats.usgs.gov/ss/.
U.S. Geological Survey [USGS], 2023a, 3DEP lidar explorer: U.S. Geological Survey database, accessed February 23, 2023, at https://apps.nationalmap.gov/lidar-explorer/#/.
U.S. Geological Survey [USGS], 2023b, Peak streamflow for the Nation—03571500 Little Sequatchie River at Sequatchie, TN, in USGS water data for the Nation: U.S. Geological Survey National Water Information System database, accessed September 18, 2023, at https://doi.org/10.5066/F7P55KJN. [Site information directly accessible at https://nwis.waterdata.usgs.gov/nwis/peak?site_no=03571500&agency_cd=USGS&format=html.]
Conversion Factors
U.S. customary units to International System of Units
Temperature in degrees Celsius (°C) may be converted to degrees Fahrenheit (°F) as follows:
°F = (1.8 × °C) + 32.
Temperature in degrees Fahrenheit (°F) may be converted to degrees Celsius (°C) as follows:
°C = (°F – 32) / 1.8.
Datums
Vertical coordinate information is referenced to the North American Vertical Datum of 1988 (NGVD 88).
Horizontal coordinate information is referenced to the North American Datum of 1983 (NAD 83) and to the World Geodetic System 1984 (WGS 84) datum.
Elevation, as used in this report, refers to distance above the vertical datum.
For more information about this publication, contact
Director, Lower Mississippi-Gulf Water Science Center
U.S. Geological Survey
640 Grassmere Park, Suite 100
Nashville, TN 37211
For additional information, visit
https://www.usgs.gov/centers/lmg-water/
Publishing support provided by
Lafayette Publishing Service Center
Disclaimers
Any use of trade, firm, or product names is for descriptive purposes only and does not imply endorsement by the U.S. Government.
Although this information product, for the most part, is in the public domain, it also may contain copyrighted materials as noted in the text. Permission to reproduce copyrighted items must be secured from the copyright owner.
Suggested Citation
Miller, B.V., 2024, Mapping karst groundwater flow paths and delineating recharge areas for springs in the Little Sequatchie and Pryor Cove watersheds, Tennessee (ver. 1.1, December 2024): U.S. Geological Survey Scientific Investigations Report 2024–5089, 67 p., 1 pl., https://doi.org/10.3133/sir20245089.
ISSN: 2328-0328 (online)
ISSN: 2328-031X (print)
Study Area
| Publication type | Report |
|---|---|
| Publication Subtype | USGS Numbered Series |
| Title | Mapping karst groundwater flow paths and delineating recharge areas for springs in the Little Sequatchie and Pryor Cove watersheds, Tennessee |
| Series title | Scientific Investigations Report |
| Series number | 2024-5089 |
| ISBN | 978-1-4113-4590-4 |
| DOI | 10.3133/sir20245089 |
| Edition | Version 1.0: November 22, 2024; Version 1.1: December 10, 2024 |
| Publication Date | November 22, 2024 |
| Year Published | 2024 |
| Language | English |
| Publisher | U.S. Geological Survey |
| Publisher location | Reston, VA |
| Contributing office(s) | Lower Mississippi-Gulf Water Science Center |
| Description | Report: viii, 67 p.; 1 Plate: 28.82 x 39.26 inches; 1 Figure: 11.00 x 17.00 inches; 3 Data Releases |
| Country | United States |
| State | Tennessee |
| Online Only (Y/N) | N |
| Additional Online Files (Y/N) | Y |


