Simulated Mean Monthly Groundwater-Transported Nitrogen Loads in Watersheds on the North Shore of Long Island Sound, 1993–2022
Links
- Document: Report (24.5 MB pdf) , HTML , XML
- Related Work: Scientific Investigations Report 2021–5116 - Simulation of Groundwater Budgets and Travel Times for Watersheds on the North Shore of Long Island Sound, With Implications for Nitrogen-Transport Studies
- Data Releases:
- USGS data release - Summary simulated groundwater-transported nitrogen loads on the north shore of Long Island Sound and associated data
- USGS data release - MODFLOW6 groundwater flow model, MODPATH particle-tracking simulation, and groundwater-transported nitrogen load model of average monthly conditions in coastal Connecticut and adjacent areas of New York and Rhode Island, 1993–2022
- USGS data release - Soil-Water-Balance model developed to simulate net infiltration in watersheds on the north shore of the Long Island Sound
- NGMDB Index Page: National Geologic Map Database Index Page (html)
- Download citation as: RIS | Dublin Core
Acknowledgments
The authors would like to thank Kelly Streich and Teresa Gagnon, with the Connecticut Department of Energy and Environmental Protection and the U.S. Environmental Protection Agency’s Long Island Sound Study, for helpful feedback and assistance with this project.
The authors also would like to thank Banu Bayraktar, Kendall Goldstein, and Leslie DeSimone, all with the U.S. Geological Survey, for their helpful feedback on an early draft of this report. Finally, the authors would like to recognize the dedicated hydrologic technicians and hydrologists who collected the water-level, streamflow, and water-quality data used to calibrate the models described in this report.
Abstract
Elevated nitrogen loads are pervasive in the Long Island Sound, an estuary that receives freshwater and nutrients from both surface-water and groundwater discharge. Surface-water nitrogen loads to the Long Island Sound are relatively well characterized, but less is known about groundwater-transported nitrogen loads. Prior work on the northern shore of Long Island Sound (Connecticut and areas of New York and Rhode Island) suggested that groundwater travel times are relatively short (median less than 2 years) and that decade-long nutrient legacies are not widespread. Because the travel times are short, groundwater flow and nutrient loads likely vary substantially between months. In the current study, the U.S. Geological Survey, in cooperation with the U.S. Environmental Protection Agency’s Long Island Sound Study and the Connecticut Department of Energy and Environmental Protection, developed a set of models to better characterize spatial and temporal patterns of groundwater-transported nitrogen loading from atmospheric deposition, septic systems, and fertilizers within the study area. The models provide an estimate, with uncertainty, of groundwater-transported nitrogen loads in the study area, filling a key gap in the nitrogen budget for Long Island Sound. The models also highlight the spatial and temporal variation in nitrogen loading throughout the study area.
The modeling workflow involved four models. (1) A soil-water-balance model was developed by using the Soil-Water-Balance software to simulate groundwater recharge across the study area for water years 2005 through 2022. The simulated mean monthly recharge from the soil-water-balance model was used as input into a groundwater-flow model. (2) The groundwater-flow model was developed by using the MODFLOW 6 software and data for water years 1993 through 2022 and simulates average monthly hydrologic conditions. The groundwater-flow model was calibrated by using the Iterative Ensemble Smoother method within the PEST++ software. The Iterative Ensemble Smoother method generates an ensemble of sets of parameter values, with each set producing reasonable simulated hydrologic parameter values. (3) An ensemble of MODPATH particle-tracking simulations were run to generate particle flow paths and travel times, with each simulation using a different set of the flow model parameters. (4) A nitrogen load model uses the MODPATH simulation outputs to track nitrogen from the land surface through multiple attenuation zones until it discharges into fresh or saline surface water. As with the groundwater-flow model, the nitrogen model simulated average monthly groundwater-transported nitrogen loads for water years 1993 through 2022. One novel aspect of the nitrogen load model is that the nitrogen attenuation parameters were calibrated to observed nitrogen loads.
Across the ensemble of simulated nitrogen loads, the median study-area-wide monthly simulated nitrogen loads from the aquifer to Long Island Sound throughout the year ranged from 900 to 18,600 kilograms of nitrogen per day, with a median load of 5,100 kilograms of nitrogen per day. The simulated loads were based on average monthly conditions for water years 1993 through 2022. Loads were highest during the winter and early spring and lowest during the late summer. However, simulated travel times for groundwater and nitrogen loads discharged to Long Island Sound during summer were longer than travel times for groundwater and loads discharged during the winter, indicating that, on average, groundwater discharged during summer traveled along different, and longer, flow paths, than groundwater discharged during winter. This indicates that summer loads would respond more slowly to changes in nitrogen inputs at the water table than winter loads. Over the entire study area, approximately 15 percent of the simulated load is from atmospheric deposition sources, 30 to 40 percent is from fertilizer, and 50 to 60 percent is from septic systems.
The final analysis of the study involved simulating the change in groundwater-transported nitrogen load in response to upgrading septic systems or reducing fertilizing inputs to areas of turf grass. Both management interventions reduced the groundwater-transported nitrogen load, and reductions were greater in areas with greater loads from septic systems or turf-grass fertilizers. The delay between management actions and substantial reductions in groundwater-transported nitrogen loads varied seasonally; loads during the late summer months remained elevated longer than the winter loads.
Introduction
In aquatic ecosystems, nitrogen in excess of what is needed to support aquatic life can have negative consequences. These consequences can include fish kills, harmful algal blooms, and hypoxia (Jessen and others, 2015; Smith, 2003). In the Long Island Sound, an estuary between Long Island, New York, and Connecticut (fig. 1), excess nitrogen from wastewater treatment facilities, septic systems, and agricultural and turf-grass fertilizer has been pervasive (Long Island Sound Study [LISS], 2015). Nitrogen inputs to Long Island Sound originating from large point sources, such as wastewater treatment facilities, have been well characterized, and concerted efforts have reduced the loads from these sources in recent years (Connecticut Department of Energy and Environmental Protection [CT DEEP], 2019; LISS, 2015; Mullaney, 2016; New York State Department of Environmental Conservation and Connecticut Department of Energy and Environmental Protection, 2000). Nitrogen from sources dispersed across the landscape, referred to as “nonpoint sources,” is less well characterized, though it has been estimated to contribute as much as 70 percent of the nitrogen load to Long Island Sound from Connecticut (CT DEEP, 2019). A substantial fraction of the nonpoint-source nitrogen may be transported through the groundwater system from its sources to either a freshwater stream or river or to coastal waters (Divers and others, 2013). Better characterizing the spatial and temporal patterns of groundwater flow and groundwater-transported nitrogen loading within the Long Island Sound watershed is essential to management efforts aimed at reducing nitrogen inputs to the Long Island Sound.
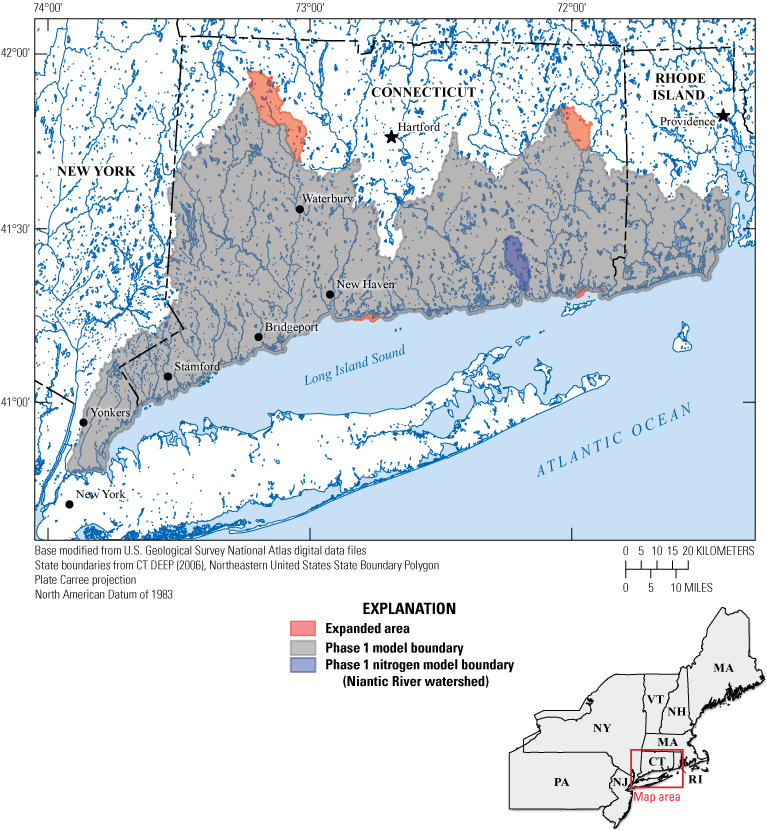
Map of the study area in Connecticut and adjacent areas of New York and Rhode Island, showing expanded boundaries relative to those used in the phase 1 model (Barclay and Mullaney, 2021a). CT DEEP, Connecticut Department of Energy and Environmental Protection.
To better understand the shallow groundwater flow system and groundwater-transported nitrogen on the north shore of Long Island Sound, the U.S. Geological Survey (USGS), in cooperation with the U.S. Environmental Protection Agency’s (EPA’s) LISS and the CT DEEP, began a study in 2020 to characterize monthly patterns of groundwater flow and groundwater-transported nitrogen in watersheds draining into the Long Island Sound along the Connecticut coast and adjacent areas of New York and Rhode Island (fig. 1). This study is a followup to a prior study that characterized long-term average groundwater-flow conditions across the north shore of Long Island Sound using a steady-state groundwater-flow model and developed a demonstration model of groundwater transport of nitrogen within one subwatershed (Barclay and Mullaney, 2021a). The prior study is referred to as the “phase 1 study” in the remainder of this report. In the current study, a groundwater-flow model of average monthly conditions was developed as a tool for understanding monthly patterns of groundwater flow and nitrogen loading. The demonstration model of nitrogen transport from the phase 1 study was updated and extended across the entire study area for use as a tool for understanding monthly patterns of nitrogen loading from groundwater-transported nitrogen to surface water in the 12-digit hydrologic unit code (HUC12) watersheds (Hydrologic Unit Code no. 12) (Seaber and others, 1987) within the study area (fig. 2). The nitrogen load model was used in this analysis to characterize the effects of septic system upgrades or reductions in turf-grass fertilizer use on groundwater-transported nitrogen loads. In the future, these models could be used to simulate changes in hydrologic conditions or nitrogen loads in response to nitrogen management activities, changing climate, or increases in sea level.
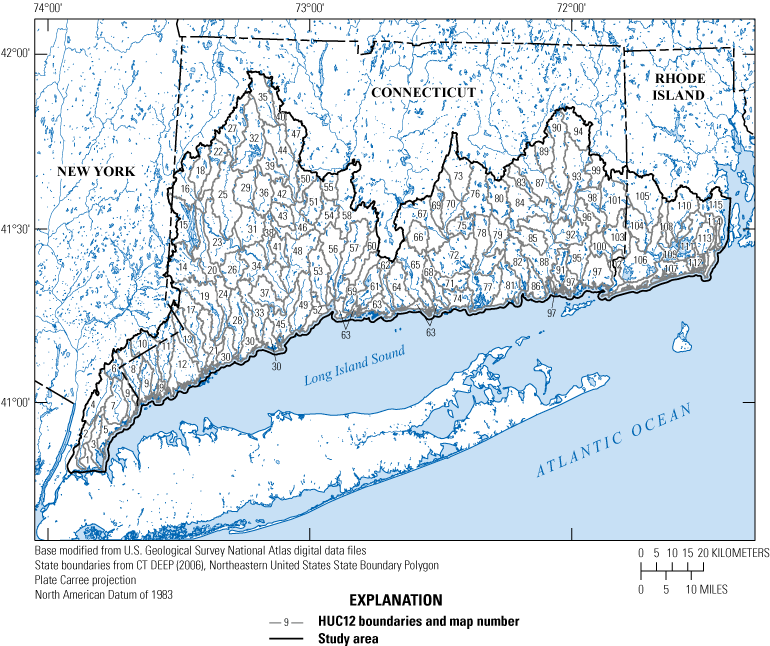
Map showing 12-digit hydrologic unit code (HUC12) watersheds within the study area (coastal Connecticut and adjacent areas of New York and Rhode Island). In some locations along the coast, multiple disconnected subbasins have been assigned to the same HUC12 watershed. The map number name and areal extent of each HUC12 watershed are provided in a companion data release (Table1_HUCS.csv in Barclay and Holland, 2024). CT DEEP, Connecticut Department of Energy and Environmental Protection.
Purpose and Scope
The purpose of this report is to document the analysis of monthly groundwater-transported nitrogen loads from watersheds on the north shore of Long Island Sound. This report includes documentation of four models used in that analysis: a daily soil-water-balance (SWB) model, a numerical groundwater-flow model, a particle-tracking model, and a nitrogen load model. The report describes (1) the development and calibration of the models, (2) simulated groundwater-transported nitrogen loads in each watershed, and (3) estimated nitrogen loads under a range of management scenarios focused on reducing fertilizer use on turf grass and upgrading residential septic systems. The report is accompanied by three data releases: (1) Barclay and Holland (2024) contains aggregated model outputs, supplemental figures, and boundary shapefiles; (2) Holland and Barclay (2024) contains the input and output files for the SWB model, as well as postprocessing scripts and some aggregated outputs; and (3) Barclay and others (2024) contains the input and output files for the numerical flow, particle-tracking, and nitrogen load models, as well as calibration files and postprocessing scripts.
Prior Investigations
In the phase 1 study, the USGS, in cooperation with the EPA’s LISS and the CT DEEP, developed a steady-state groundwater-flow model for watersheds draining into the Long Island Sound along the Connecticut coast and adjacent areas of New York and Rhode Island (fig. 1). The model was used as a framework for understanding groundwater discharge to surface water in the HUC12 watersheds (Seaber and others, 1987) within the study area and to a subset of coastal embayments along the north shore of Long Island Sound. An additional analysis was conducted to demonstrate the use of the model for quantifying spatial patterns of nitrogen loading and attenuation; the Niantic River watershed in eastern Connecticut was the geographic focus of this pilot study. These models, subsequently referred to as the “phase 1 models,” were documented and published in 2021 (Barclay and Mullaney, 2021a, b, c).
Many other investigations of nitrogen loading to and cycling within Long Island Sound included groundwater-transported nitrogen, but none explicitly quantified the contributions of groundwater-transported nitrogen from the north shore of Long Island Sound. Some investigations have focused on quantifying the total nitrogen load from rivers (Mullaney, 2013, 2023; Mullaney and others, 2002) and to coastal embayments (Vaudrey and others, 2016a). These studies included nitrogen transported to the rivers and embayments through surface processes such as runoff as well as through groundwater transport. Vlahos and others (2020) calculated seasonal nitrogen budgets for the entire Long Island Sound, including contributions from groundwater. Trends in the total nitrogen loads in rivers were quantified by two studies (Mullaney, 2016; Trench and others, 2012). Within the Niantic River watershed, Mullaney (2015) quantified the effects of converting septic systems to sanitary sewers on groundwater nitrogen concentrations.
Notable Changes From Phase 1 Models
The current study builds upon and extends the phase 1 models. Notable changes include the following:
-
• The study area was expanded slightly to include small watersheds that drain to the study area and larger nearshore islands (fig. 1).
-
• The groundwater model software was upgraded from MODFLOW–NWT (Niswonger and others, 2011) to MODFLOW 6 (Hughes and others, 2017; Langevin and others, 2017, 2021) to incorporate recent advances in groundwater modeling. Throughout this report, MODFLOW refers to MODFLOW 6.
-
• The temporal resolution was refined to simulate average monthly conditions because in the phase 1 models, the median simulated travel time was less than 2 years, suggesting that seasonal patterns of flow and transport may be important.
-
• A monthly soil-water-balance model was developed for the study to better simulate groundwater recharge, a key input to the groundwater-flow model. This model was developed by using the Soil-Water-Balance software (Westenbroek and others, 2018).
-
• Streams and rivers within the study area were represented by using the Streamflow-Routing package (Niswonger and Prudic, 2005) within MODFLOW, which simulated bidirectional flow between the river and the aquifer, rather than the Drain package (Harbaugh, 2005), which does not simulate flow from the river into the aquifer.
-
• Urban drains were added to better simulate the flow of water into storm drains and leaky urban infrastructure such as sewers.
-
• Septic return flows and private well withdrawals for seasonal residents were added to the model. In some coastal areas, water use by seasonal residents may drive a substantial fraction of the water budget.
-
• Nitrogen attenuation varied by season (in some zones), groundwater travel time, surficial geology, and river distance, and the model parameters were calibrated to fit measured loads within the study area. The phase 1 nitrogen model used literature values and did not account for seasonal variation in attenuation rates, groundwater travel time, or attenuation within the river corridor.
Data Compilation and Analysis
Meteorologic, lithologic, soil, surface-flow-routing, hydrologic, land-cover, water-use, and nitrogen data were used as model inputs or calibration observations in the models. Lithologic, land-use, and water-use data were compiled for the previously developed groundwater model (Barclay and Mullaney, 2021a) and, except as noted in the report subsections that follow, were not recompiled for this study. Meteorologic, lithologic, land-use, water-use, and soil data were used as inputs to the models. The hydrologic and nitrogen data were used as observations in the model calibration process.
Meteorologic Data
The daily meteorological data required by this study’s SWB model included daily precipitation, daily maximum temperature, and daily minimum temperature. These data were obtained from Oak Ridge National Laboratory’s (ORNL’s) Daymet Version 4 dataset (Thornton and others, 2022) for October 2003 through September 2022 at a 1-kilometer (km) spatial resolution. These data provided gridded estimates of daily weather patterns across North America by interpolating ground-based meteorological observations using an inverse-distance weighting technique.
Lithologic Data
Lithologic data were used as compiled for the prior model (Barclay and Mullaney, 2021a), except that the number of classes of surficial material lithology were reduced from eight to seven. Glacial deposits classified in the prior model as “stratified glacial deposits—intermediate hydraulic conductivity,” which were mapped only for Connecticut and identified as “Stacked Coarse Deposits Overlying Fine Deposits” in Stone and others (1992), were reclassified as “stratified glacial deposits—high hydraulic conductivity” in the uppermost model layer and “stratified glacial deposits—low hydraulic conductivity” in any lower surficial material layers.
Soil Data
Two types of soil data—hydrologic soil group (HSG) and available water capacity (AWC)—were used in the SWB model. Maps showing the distribution of hydrologic soil groups and available water capacity within the study area are provided in a companion data release (figs. 1 and 2 in Barclay and Holland, 2024). Grids of both datasets were obtained through the Natural Resources Conservation Service (NRCS) Soil Survey Geographic Database (SSURGO; Soil Survey Staff, 2022). Soil data were downloaded by using the NRCS Soil Data Development Toolbox for ArcGIS. HSG can have a value of A, A/D, B, B/D, C, C/D or D based on the infiltration capacity of the soil (Cronshey and others, 1986). Soils in group B, which are characterized by infiltration rates between 0.38 to 0.76 centimeter (cm) per hour, were most common across the study area (table 1). For soils assigned to a dual hydrologic group (A/D, B/D, and C/D), the first letter corresponds to the drained condition and the second letter corresponds to the undrained condition. In this study, dual hydrologic soil groups are assumed to behave like D soils, so the parameters values specified for A/D, B/D, C/D, and D are identical, effectively lumping the dual hydrologic groups in with the D group. The distinction between soil groups in the input HSG grid remains in place to allow for possible future calibration efforts that differentiate between D soils and dual hydrologic groups. AWC is the maximum amount of plant-available water that is contained in the soil horizon. In this study, AWC was averaged across the top 100 cm of soil and converted to a dimensionless fraction of water depth per soil thickness. The SWB software ultimately calculated the total available water capacity by multiplying AWC by the specified root zone depth for each grid cell. The root zone depth was a calibrated parameter.
Table 1.
Distribution of hydrologic soil groups across the north shore of Long Island Sound (coastal Connecticut and adjacent areas of New York and Rhode Island).[Distribution based on the Soil Survey Geographic Database (SSURGO; Soil Survey Staff, 2022)]
Surface-Flow-Routing Data
The SWB model uses topography-based flow direction data to enable flow routing. The D8 flow direction, in which flow from each cell is routed in one of eight horizontal directions to its steepest downslope neighbor, was derived from the National Elevation Dataset (Gesch and others, 2002). In the SWB software settings, the downhill routing method was selected; this method allows runoff from one or more cells to become runon to downslope cells.
Hydrologic Data
Hydrologic data were used in the calibration of the SWB and groundwater-flow models. In the SWB model, the daily streamflow at 14 gages was used to calibrate the annual rate of recharge to the aquifer. For the groundwater-flow model, five groups of hydrologic data were used in the calibration: (1) mean monthly groundwater levels and (2) the annual range in monthly groundwater levels from 66 wells (USGS, 2024); (3) mean monthly streamflows during base-flow conditions (referred to as “mean monthly base-flow data”) and (4) the annual range in mean monthly streamflows during base-flow conditions from 14 gages (USGS, 2024); and (5) land-surface altitude—the water table is below the land surface in terrestrial cells and therefore the shallowest simulated groundwater levels should also be below the land surface. The first and fifth groups—monthly groundwater levels and the water-table altitude relative to the land surface—provide information about water levels on a monthly time step. The mean monthly base-flow data (group 3) provide information about the quantities of water recharged and discharged from the groundwater system. The annual range in monthly groundwater levels and the annual range in base flow provide information about the intra-annual variation in hydrologic conditions.
Base Flow
Flow records for 14 streamgages at sites unaffected by water withdrawals, such as groundwater pumping, surface-water diversions, and regulation, were selected for the base-flow observations. The locations, site numbers, and other information about the streamgages are provided in a companion data release (Table2_Gages.csv and fig. 3 in Barclay and Holland, 2024). The 14 streamgages selected include those within the study area designated as “Ref” in the Geospatial Attributes of Gages for Evaluating Streamflow, version II (GAGES II) dataset (Falcone, 2011) and two additional streamgages (USGS sites 01208873 and 012035055). For each gage, daily streamflow was used to determine annual recharge, mean monthly base flow, and the standard deviation in monthly base flow; the mean annual range in monthly base flow and the standard deviation in annual range in monthly base flow were also calculated. The annual recharge was used to calibrate the SWB model; the mean monthly base flow, the standard deviation in monthly base flow, the mean annual range in monthly base flow, and the standard deviation in annual range in monthly base flow were used to calibrate the groundwater-flow model.
Annual Recharge
Annual recharge observations were calculated by using available streamflow measurements from water years (WYs) 2005 through 2022 (USGS, 2024). Annual recharge at each streamgage was calculated by using the RORA algorithm (Rutledge, 1998), as implemented in the DVstats package in the statistical software R (Lorenz, 2017; R Core Team, 2021). The RORA algorithm was selected because it focuses on identifying groundwater recharge, the primary input to the groundwater system. Streamflow data for all gages are available in the National Water Information System (USGS, 2024).
Mean Monthly Base Flow and Annual Base-Flow Range
Mean monthly base-flow observations were calculated by using available streamflow data from WYs 1993 through 2022 (USGS, 2024). Mean monthly base flow at each streamgage was calculated by using two algorithms, PART (Rutledge, 1998) and BFI (Gustard and others, 1992), as implemented in the DVstats package in the statistical software R (Lorenz, 2017; R Core Team, 2021). The PART and BFI algorithms were selected for two reasons. First, in contrast to RORA, which was used for calibrating the simulated groundwater recharge, PART and BFI focus on base flow, discharge from the groundwater system to streams. Base flow is typically less than recharge because of well withdrawals and evapotranspiration (Barlow and others, 2015; Rutledge, 1998), both of which are explicitly represented in the groundwater-flow model. Also, PART and BFI use different approaches to determine the percentage of streamflow originating as base flow rather than stormflow. PART and BFI calculate daily mean base flow from daily mean streamflow. The daily mean base flow was aggregated to mean monthly base flow, and then the average of PART- and BFI-estimated mean monthly base flow was used to calculate the mean monthly value of base flow for each gage. Interannual variation in base flow was estimated by adding and subtracting the standard deviation in base flow for all days of each month over all years. The annual range in mean monthly base flow for each gage was calculated by subtracting the smallest monthly value from the largest. Interannual variation in the annual range was estimated by adding and subtracting the standard deviation in annual range across all years (fig. 3). Streamflow data for all gages are available in the National Water Information System (USGS, 2024).
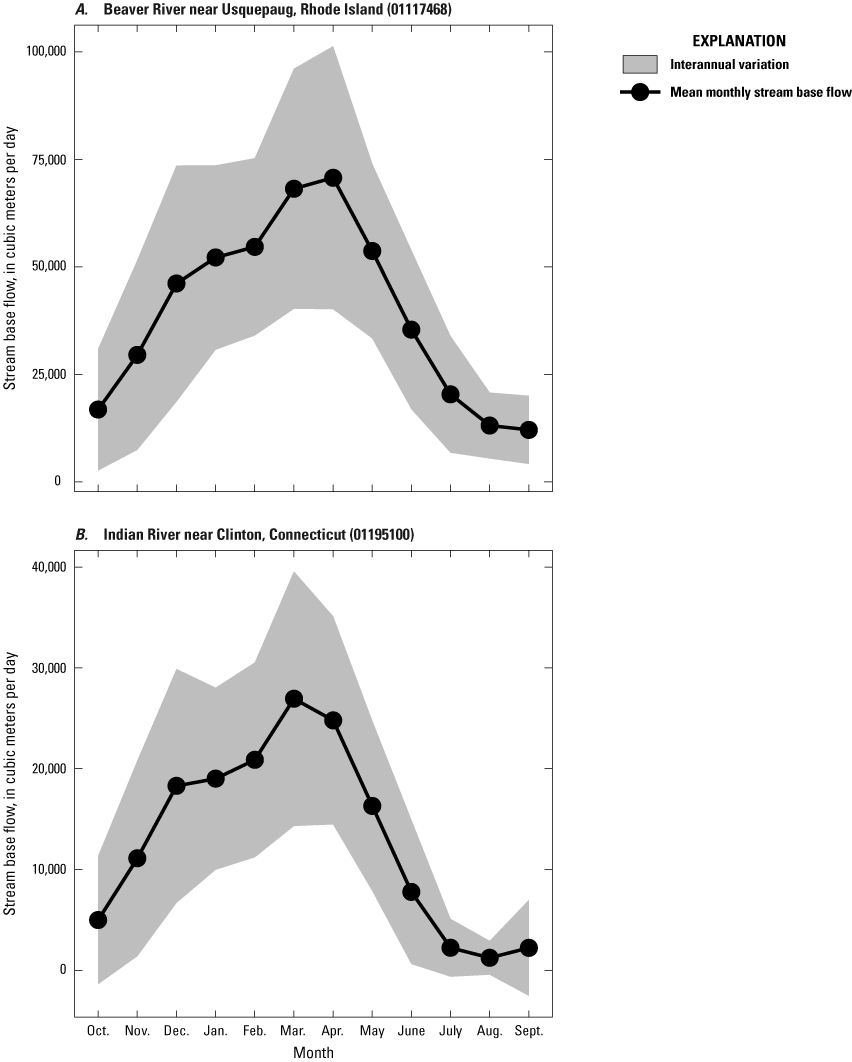
Graphs showing mean monthly base flow and interannual variation for two representative streamgages based on streamflow data from water years 1993 through 2022 (Barclay and Holland, 2024). A, Beaver River near Usquepaug, Rhode Island. B, Indian River near Clinton, Connecticut. Interannual variation was estimated by using the standard deviation in base flow for all days in each month.
Mean Monthly Groundwater Levels and Annual Groundwater-Level Ranges
Groundwater wells were selected on the basis of their period of record and number of measurements: water levels in all wells used in the analysis had been measured on 50 or more different days during WYs 1993 through 2022. To avoid overrepresentation of month-year combinations that had many measurements, available water-level data from WYs 1993 through 2022 were aggregated first by year and month (for example, January 2021), then month (for example, January), for a final total of at most 12 observations from each well. In total, water levels from 66 wells were used for model calibration. The locations, site numbers, and other information about the wells are provided in a companion data release (Table3_Wells.csv and fig. 4 in Barclay and Holland, 2024). The annual range in water levels for each well was calculated by subtracting the smallest monthly value from the largest. For the purposes of model calibration, uncertainty in the groundwater levels was estimated as the sum of three values: (1) the magnitude of the difference in land-surface altitude at the well and the mean land-surface altitude for the model cell, (2) the standard deviation in measured water levels by month, and (3) 0.3048 meter (m) (1 foot [ft]) as an estimate of measurement error (fig. 4). Water-level data for all wells are available in the National Water Information System (USGS, 2024).
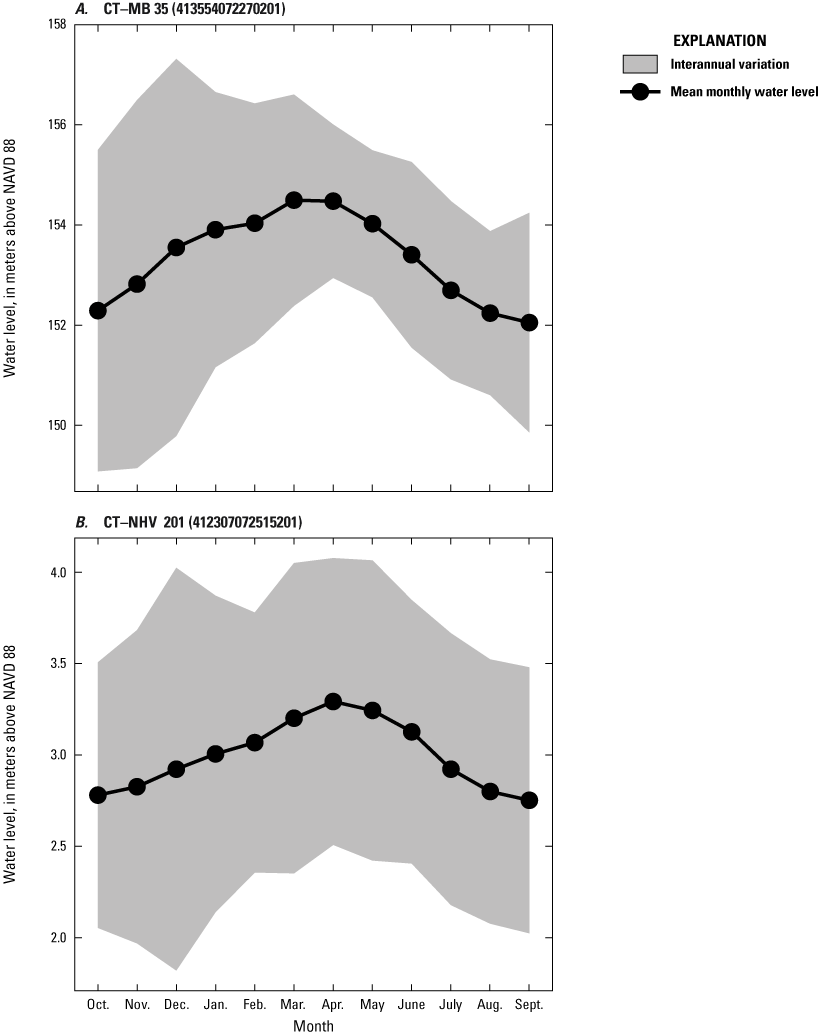
Graphs showing monthly water levels with associated interannual variation for two representative wells in Connecticut. A, well CT–MB 35 and B, well CT–NHV 201. Interannual variation was estimated using the standard deviation in groundwater levels for all measurements in each month. Altitude is in meters relative to the North American Vertical Datum of 1988 (NAVD 88). Aggregated water-level data for monitoring wells are available in Barclay and Holland (2024). Raw water-level data for monitoring wells are available in the National Water Information System (U.S. Geological Survey, 2024).
Land-Cover Data
Land-cover data were used in three of the models in this study, but the models use different versions of the land-cover databases to more closely match the average conditions during the modeling period. The SWB model simulates WYs 2005 through 2022 and uses the 2019 National Land Cover Database (NLCD2019) (Dewitz and U.S. Geological Survey, 2021). The groundwater-flow and nitrogen load models were developed using hydrologic and nitrogen data from WYs 1993 through 2022 and use the 2011 National Land Cover Database (NLCD2011) (Homer and others, 2015). In all three models, land cover is a static layer; it was assumed that land cover does not change significantly during the model period.
Based on NLCD2019, the most common land-cover class in the study domain was “Deciduous Forest,” and over one-half of the study area was classified as some type of forest (either “Deciduous Forest,” “Evergreen Forest,” or “Mixed Forest”). The next most common land-cover class was “Developed, Open Space,” and nearly one-third of the study area was classified as some level of developed land (either “Developed, Open Space”; “Developed, Low Intensity”; “Developed, Medium Intensity”; or “Developed, High Intensity”) (table 2). Maps showing the distribution of land cover within the study area are provided in a companion data release (fig. 5 in Barclay and Holland, 2024).
Table 2.
Distribution of land cover in the study area in Connecticut and adjacent areas of New York and Rhode Island.[Distribution based on the 2019 National Land Cover Database (Dewitz and U.S. Geological Survey, 2021)]
In the SWB model, the land-cover input layer consists of 14 classifications across the study area at a 30-m resolution. The “Open Water” National Land Cover Database (NLCD) classification is excluded because the SWB software does not calculate a water balance for ponded areas. Land cover is resampled to the model resolution within the model code by using a majority resampling technique.
In the groundwater-flow model, land cover was used to create land-cover- and surficial-geology-based zones of groundwater evapotranspiration. Four land-cover groups were identified: open space (NLCD classification of “Developed, Open Space”), forest (NLCD classifications of “Deciduous Forest,” “Evergreen Forest,” and “Mixed Forest”), shrubs/grassland (NLCD classifications of “Shrub/Scrub,” “Grassland/Herbaceous,” “Pasture/Hay”) and wetlands (NLCD classifications of “Woody Wetland” or “Emergent Herbaceous Wetlands”). Groundwater evapotranspiration was not simulated in areas with other land-cover classifications.
In the nitrogen load model, land cover was used to estimate nitrogen inputs from fertilizer and rates of attenuation of nitrogen from atmospheric deposition. Agricultural land was identified by classifications of “Pasture/Hay” or “Cultivated Crops.” Areas of turf grass were identified by areas that were classified as “Developed, Open Space” and not also classified as “Impervious.”
Water-Use Data
Water use was estimated for public water-supply wells, industrial wells, private residential wells, and septic return flows. The compilation of water-use data was as described in Barclay and Mullaney (2021a), with the following exceptions:
-
• Private well withdrawals (fig. 6 in Barclay and Holland, 2024) and septic return flows for seasonal residents were added to the model. The increase in population due to seasonal residents was estimated from census data (U.S. Census Bureau, 2010) as described in appendix 1. Rates of groundwater withdrawals and septic return flows were calculated by using a per capita use rate of 0.18 cubic meter per day (m3/d) (Dieter and others, 2018), a consumptive-use fraction of 0.15 (Shaffer and Runkle, 2007), and public water and sewer service maps, as described in Barclay and Mullaney (2021a). Seasonal residents were assumed to be present during the months of June, July, and August; rates were set to zero during all other months.
-
• New reporting requirements for water diversions in Connecticut began in 2020, which generated a more detailed and updated dataset of groundwater-withdrawal locations and rates than was available previously. This dataset was used to estimate groundwater-withdrawal rates from public water-supply and industrial wells. Industrial withdrawals were not included previously due to lack of data and a presumed small magnitude compared to public water-supply withdrawals. Withdrawal rates aggregated to the model cell are available in Barclay and others (2024).
In addition, the following datasets were updated to include newly available data:
-
• Sewer service areas within Connecticut (CT DEEP, 2022)
-
• Groundwater-withdrawal sites and rates for New York (Division of Water—Bureau of Water Resource Management, 2022)
Due to data-availability limitations, water-use rates did not vary throughout the year or modeling period in most instances. The two exceptions were (1) the inclusion of summer private well withdrawals and septic return flows due to seasonal residents and (2) monthly varying groundwater-withdrawal rates for public water-supply and industrial supply wells in Connecticut.
Nitrogen Data
Observed nitrogen loads and yields from streams during base-flow conditions were compiled from the National Water Information System (USGS, 2024) and Barclay and others (2023) for 60 USGS water-quality monitoring stations throughout the study area and used in the calibration of the nitrogen load model (Table5_ObservedNitrogenLoads.csv in Barclay and Holland, 2024). The observed loads and yields, as well as a map showing the locations of the monitoring stations, are provided in a companion data release (fig. 7 and Table5_ObservedNitrogenLoads.csv in Barclay and Holland, 2024). Selected sites had one or more measurements of total dissolved nitrogen (TDN) and were free from the influence of upstream wastewater treatment plants (EPA, 2021), mapped diversions (CT DEEP, 2005) or dams with storage of at least 100 acre-feet (U.S. Army Corps of Engineers and Federal Emergency Management Agency, 2019). The available observed loads and yields were filtered to those collected under base-flow conditions. Ninety of the observed loads were collected as part of a project that sampled only during base-flow conditions (Barclay and others, 2023); all observations from that study were used. For the remaining 293 observed loads, base-flow conditions were determined as follows:
-
• For stations with colocated streamflow gages, base-flow conditions for each day were determined by using the PART and BFI algorithms that were used to calculate the observed streamflow; selected sites had a minimum base-flow threshold of 75 percent.
-
• For stations without colocated streamflow gages, base-flow conditions were determined by using gages within the same six-digit hydrologic unit code (HUC6) watershed. If 75 percent of the gages within the HUC6 watershed had base-flow contributions of 75 percent or greater and none of the gages had base-flow contributions of 50 percent or less, then the station was determined to be at base-flow conditions on that day.
Loads were computed as the product of the TDN concentration and the streamflow at the time when the sample was collected; yields were computed as the quotient of the load divided by the watershed area. For most samples used in this study, TDN was calculated from concentration measurements of different forms of nitrogen rather than measured analytically. If the available TDN value was censored, then TDN was computed either as the sum of filtered Kjeldahl nitrogen (ammonia and organic nitrogen) and half the censored limit of filtered nitrate plus nitrite-nitrogen concentration or as the sum of half the censored limit of filtered Kjeldehl nitrogen plus the filtered nitrate plus nitrite-nitrogen concentration, depending upon which component was censored. For each site, the mean monthly nitrogen load and nitrogen yield were calculated by using all available base-flow nitrogen load and yield data, even if the data consisted of only one measurement. Most sites did not have observed nitrogen loads and yields for every month.
Some of the water samples used in calculating observed nitrogen loads exceeded the allowed holding time prior to laboratory analysis. The extended holding times affected only data collected during 2022 and primarily affected data from the short-term sites because many of those sites only had data from 2022. The effects of extended storage of natural water samples prior to laboratory analysis are not well understood, but the implications for the model are discussed in the section below on the limitations of the nitrogen model.
Sites were divided into two groups: sites with samples from 10 or more different months over 5 or more years were classified as “long-term” sites, and the remaining sites were classified as “short-term” sites. Across the five long-term sites, the number of observed nitrogen loads ranged from 20 to 78, with a median of 53. Nitrogen yields at the long-term sites ranged from 0.01 kilograms of nitrogen per square kilometer per day (kg-N/km2/d) to 3.07 kg-N/km2/d, with a median of 0.44 kg-N/km2/d. Long-term sites were weighted more heavily in the calibration because they were more representative of long-term conditions. Across the 56 short-term sites, the number of observed nitrogen loads ranged from 1 to 12, with 42 sites having 2 observed loads. Seventy percent of the short-term observed loads were from April, June, or July, and 65 percent were collected during 2022. The temporal bias was a result of a data-collection initiative to better understand spatial patterns in nitrogen loads under base-flow conditions, although over a limited temporal extent (Barclay and others, 2023). Nitrogen yields at the short-term sites ranged from 0.03 kg-N/km2/d to 5.25 kg-N/km2/d, with a median of 0.52 kg-N/km2/d.
The model was calibrated to the yields to minimize the influence of watershed size and maximize the influence of attenuation rates and processes. In addition, the annual ranges in the nitrogen load and nitrogen yield were calculated for each site by subtracting the smallest monthly load or yield from the largest. Compiled loads are available in Barclay and Holland (2024, Table5_ObservedNitrogenLoads.csv). Mean monthly nitrogen loads and associated variation for two stations with long-term nitrogen are shown in figure 5.
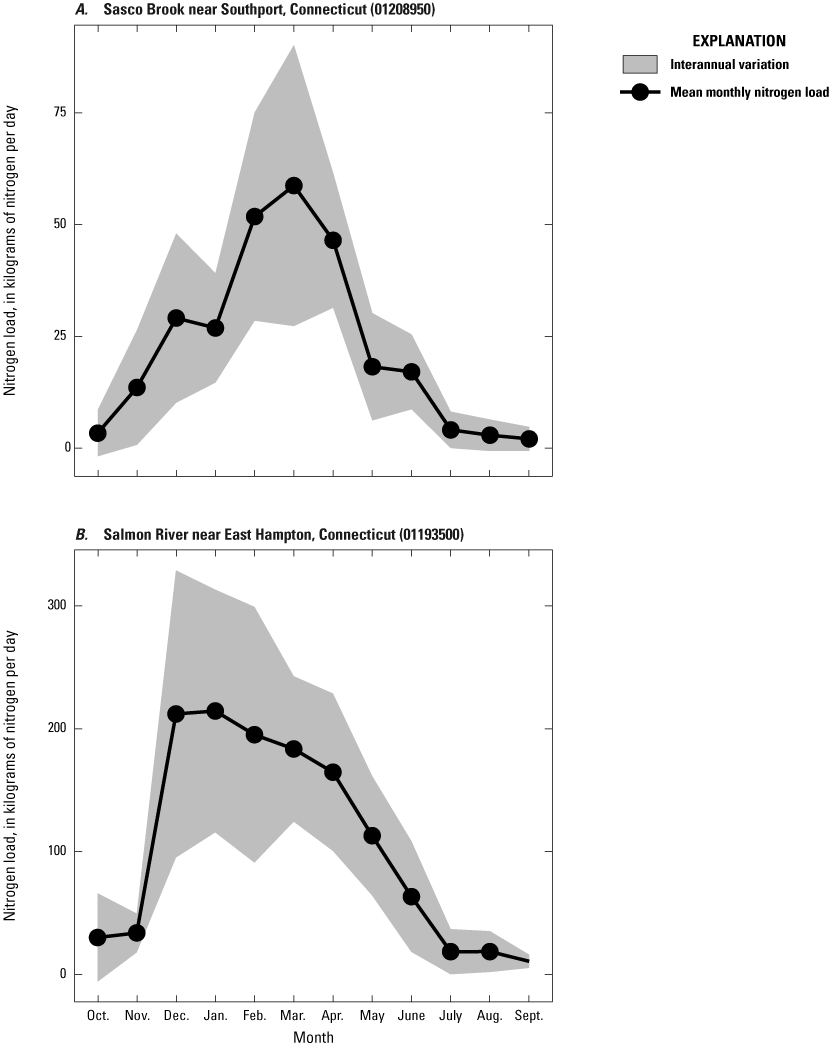
Graphs showing mean monthly nitrogen loads with associated interannual variation for two long-term water-quality monitoring stations in Connecticut. A, Sasco Brook near Southport, Connecticut. B, Salmon River near East Hampton, Conn. Interannual variation was estimated using the standard deviation in observed nitrogen loads for all measurements in each month. Aggregated data for monitoring states are available in Barclay and Holland (2024). Raw data for monitoring stations are available in the National Water Information System (U.S. Geological Survey, 2024).
Soil-Water-Balance Model Development
Potential groundwater recharge was estimated for the northern shore of Long Island Sound by using the SWB model software, version 2.0 (Westenbroek and others, 2018). The SWB model uses a modified Thornthwaite-Mather soil-water-balance approach (Thornthwaite, 1948; Thornthwaite and Mather, 1957) to calculate water-balance components of the soil zone, including net infiltration out of the root zone. In areas where groundwater is close to land surface, such as in the northeastern United States, net infiltration out of the root zone may be assumed to become groundwater recharge (Westenbroek and others, 2018). In the remainder of the report, “net infiltration out of the root zone” is referred to as “net infiltration.” For consistency with conventions for SWB and MODFLOW software, “net infiltration” is used in this report in reference to SWB and “recharge” is used in reference to MODFLOW. The model uses readily available gridded data, including land cover (Dewitz and USGS, 2021), soil properties (Soil Survey Staff, 2022), and daily meteorological data (Thornton and others, 2022), to produce spatially variable gridded estimates of groundwater recharge across the active model domain at a daily time step. The model was run from WYs 2004 through 2022, which includes a year for the model to properly initialize the state of soil moisture for the first year of the desired simulation (WY 2005). The SWB model covers the same active model domain as the groundwater model and has the same horizontal model resolution. However, the SWB model code does not support the rotated projection used in the groundwater model; because of this, reprojection of SWB output was required before it could be used in the groundwater model. The horizontal model resolution was 152.4 m (500 ft), resulting in 1,008 rows and 1,224 columns. Out of the 1,233,792 model grid cells, 405,908 were active and the rest were inactive.
Estimates of net infiltration calculated by the SWB model were calibrated to estimates of groundwater recharge calculated from streamflow values by using the RORA recession-curve displacement method (Rutledge, 1998). Recharge rates were further calibrated as part of the calibration process for the groundwater-flow model (described in “Calibration of the Numerical Model” below). A complete archive of model input and output files for the SWB model is available in Holland and Barclay (2024).
Design of the Soil-Water-Balance Model
The SWB model calculates net infiltration based on input meteorological data, soil data, land-cover data, and a parameter lookup table. The individual components of the water balance are calculated according to user-activated modules for grid cells in the model domain. Precipitation is partitioned into runoff and an initial abstraction term by using the U.S. Department of Agriculture (USDA) NRCS curve number method (Cronshey and others, 1986). Potential evapotranspiration is estimated by the Hargreaves-Samani method (Hargreaves and Samani, 1985), and actual evapotranspiration and soil moisture are estimated by the Thornthwaite-Mather method (Thornthwaite and Mather, 1957). Snowmelt is estimated by a temperature-index method (Dripps and Bradbury, 2007). Soil moisture is updated at a daily time step as the difference between each grid cell’s sources (precipitation, runon, snowmelt) and sinks (interception, runoff, and evapotranspiration):
whereθt
is the soil moisture on the current simulation day, in inches,
θ(t−1)
is the soil moisture on the previous simulation day, in inches, and
ET
is the actual evapotranspiration, in inches.
Where soil moisture exceeds a specified total available water capacity for a grid cell, infiltration is assumed to take place. The total available water capacity is calculated on the basis of the AWC and the maximum rooting depth, a calibrated parameter. A daily limit on net infiltration is specified by the maximum net infiltration parameter (table 3). This limit prevents the model from calculating unreasonably high net infiltration values. Flow routing was enabled in this model, so any amount of infiltration in excess of the specified maximum net infiltration for each grid cell was routed to the next downslope cell as runon.
Table 3.
Calibrated maximum net infiltration values specified by the soil-water-balance lookup table, by land cover and hydrologic soil group, for use by the soil-water-balance model for the study area in Connecticut and adjacent areas of New York and Rhode Island.[Hydrologic soil groups are described in table 1. Maximum net infiltration is given in inches per day]
Input Datasets
The SWB model requires tabular and gridded input datasets in addition to a control file that specifies the model grid, which modules to activate, and the paths to input datasets. Input datasets include (1) daily meteorological data, (2) land cover, (3) hydrologic soil groups, (4) available water capacity, (5) surface-water flow direction, and (6) a parameter lookup table. Meteorologic, soil, and flow-routing data were compiled as described above in the “Data Compilation and Analysis” section.
The SWB model requires soil and land-use parameter values in a parameter lookup table that controls how the SWB software assigns these characteristic values to the hydrologic system. Parameter values include maximum net infiltration, curve number, root zone depth, growing season start and end dates, and precipitation interception storage. These parameters are a function of land cover and hydrologic soil group (Table6_SWB_Parameters.csv in Barclay and Holland, 2024). The maximum net infiltration parameter indicates the maximum allowable daily infiltration rate, with calibrated values ranging from 0.03 to 18.3 centimeters per day. Calculated net infiltration greater than the maximum net infiltration rate is considered “rejected net infiltration” and is routed to the next downslope grid cell. The curve number parameter is used in the curve number method (Cronshey and others, 1986) to partition precipitation into runoff and an initial abstraction term. The curve number is dimensionless and, after calibration, ranged from 31.50 to 100.00. Root zone depth, the maximum depth of plant roots, is used to calculate total available water capacity and, after calibration, ranged from 0.12 to 1.1 m. The start and end of the growing season were set to the 133rd and 268th days of the year. Interception refers to the amount of precipitation that is intercepted by trees and plants and was set at 0.08 cm during the growing season and 0.00 cm during the nongrowing season. Initial parameter values were taken from a published SWB model for Long Island (Finkelstein and others, 2022), but some parameter values were adjusted during model calibration.
Calibration of the Soil-Water-Balance Model
Because the estimated values of net infiltration (that is, recharge) are further adjusted during calibration of the groundwater-flow model, a simple calibration approach focusing on just three parameter sets—curve number, maximum net infiltration, and root zone depth—was selected for the SWB model. In this approach, SWB-modeled net infiltration is aggregated to an annual time step and compared to estimates of groundwater recharge aggregated to an annual time step. Groundwater recharge was calculated from streamflow values by using the RORA recession-curve displacement method (Rutledge, 1998) for 14 basins across the study area (Table2_Gages.csv and fig. 3 in Barclay and Holland, 2024).
An automated calibration was done to scale each of three SWB parameter sets successively (curve number, maximum net infiltration, and root zone depth, in that order) by an optimal multiplier. The remaining model parameters were not calibrated. A series of SWB model runs were done in which one of eight multipliers (0.8, 0.85, 0.9, 0.95, 1.05, 1.1, 1.15, and 1.2) was applied to a parameter set. For each calibration run, a run error was calculated:
wherei
is the calibration basin
j
is the water year of the simulation
sim
is the annual, basin-averaged, SWB-simulated net infiltration value, and
obs
is the annual RORA recharge value at the calibration gage.
The run error is the sum of the residual sum of squares across all calibration basins. By quantifying the fit between simulated net infiltration and RORA estimated recharge, each successive parameter adjustment was evaluated. The multiplier corresponding to the lowest run error was carried on to the next step of calibration. This equated to a total of 24 model runs plus one base run to which the calibration runs were compared.
A base run was completed by using these initial parameter values, and a base run error was calculated. For the first round of calibration runs, multipliers were applied to all curve number parameters to create eight lookup tables. Curve numbers were not permitted to exceed 100. The eight SWB model runs were executed in parallel on the USGS Denali Supercomputer (Falgout and others, 2019), and a run error was calculated for each simulation. The eight run errors in addition to the run error for the base model were compared. The parameter lookup table corresponding to the model run with the lowest run error was advanced to the next round of calibration, and the lowest run error became the new base model run error. This procedure was applied to the parameter set for maximum net infiltration followed by the parameter set for root zone depth. Additional manual adjustments were made after the automated calibration to fine-tune parameter values and balance the residuals across the calibration basins.
Model calibration reduced the run error by 7 percent, and the final simulated net infiltration values agreed well with recharge estimated by the RORA method (fig. 6). The coefficient of determination (R2) for the simulated annual net infiltration in comparison to estimated RORA recharge values is 0.69. The Nash-Sutcliffe efficiency (Nash and Sutcliffe, 1970) for this model is 0.65. The Shapiro-Wilk test of normality indicates that the residuals follow a normal distribution at the α=0.05 level (p=0.057, so we do not reject the null hypothesis of normality), with a Shapiro-Wilk test statistic of 0.99. Model residuals were greater for years with higher net infiltration.
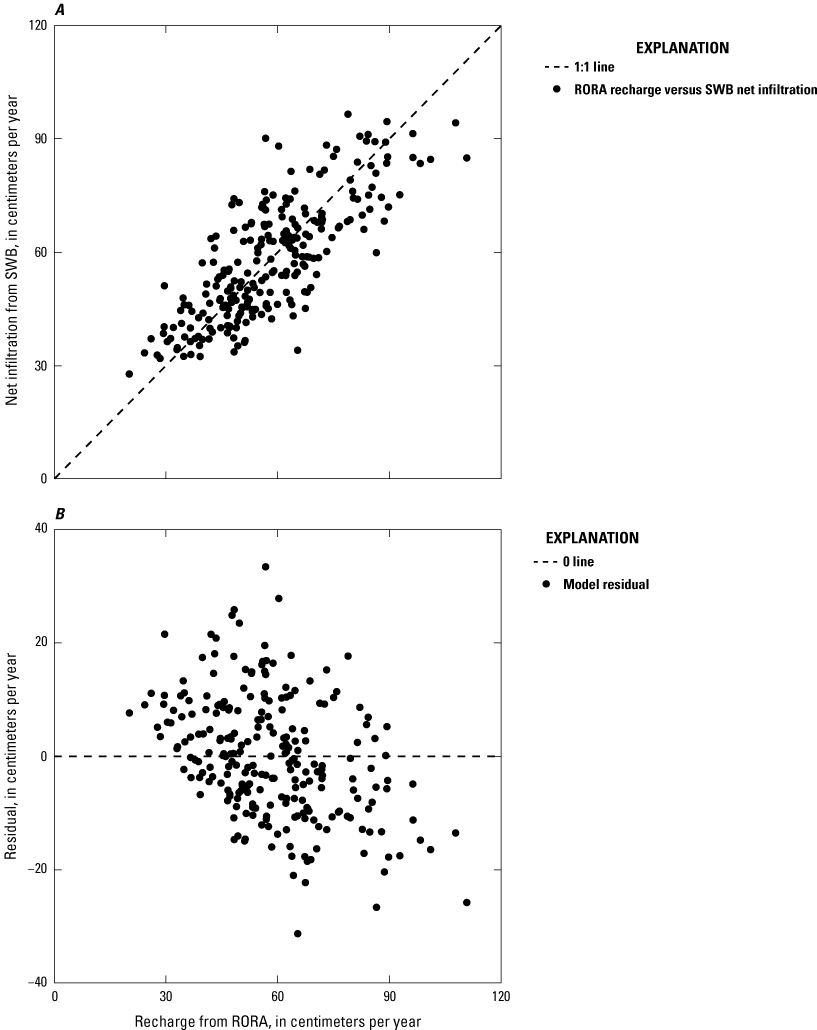
Graphs showing soil-water-balance (SWB) model calibration results (Holland and Barclay, 2024). A, Simulated net infiltration and recharge estimated by the RORA method. B, Model residuals and recharge estimated by the RORA method. Data points represent annual recharge for water years 2005 to 2022 for 14 streamflow monitoring stations in Connecticut and Rhode Island.
Additional calibration runs, including runs that sampled a wider parameter space, would likely result in a further reduction in run error, but the parameter space was limited to plus or minus 20 percent of the original parameter value as to not produce unreasonable parameter values. Furthermore, calibration efforts were limited so not to “overfit” the SWB model. The 14 calibration basins made up only 8.4 percent of the study area, and RORA recharge is only an estimation of recharge, not a true observation (Rutledge, 1998).
Simulation of Net Infiltration
Following calibration, the SWB model was run for WYs 2005 through 2022 to simulate potential groundwater net infiltration rates; WY 2004 was used to initialize soil-moisture values. It was assumed that recharge for this period of time was a reasonable representation of recharge during the entire study period of 1993 through 2022 because the recharge was further adjusted during the groundwater model calibration. Mean monthly net infiltration estimates were used as recharge inputs into the groundwater-flow model.
On an annual basis, simulated net infiltration is highly dependent on precipitation, with annual spikes in precipitation mirrored by spikes in recharge (fig. 7). Annual mean precipitation averaged across the study area ranged from 105.7 cm (WY 2016) to 181.8 cm (WY 2006), with a mean of 135.8 cm across the period of analysis. Annual mean simulated net infiltration across the study area ranged from 33.3 cm (WY 2016) to 77.2 cm (WY 2006), with a mean of 52.3 cm across the period of analysis. On a monthly basis, simulated net infiltration was affected by the seasonal cycle of evapotranspiration, with recharge peaking in the winter months when evapotranspiration is at its lowest and falling in the summer when evapotranspiration is at its highest (fig. 8). Spatially, for the 18 years modeled, annual simulated net infiltration varied substantially from less than 1 cm to more than 150 cm (fig. 9), with the lowest rates occurring in highly urbanized areas.
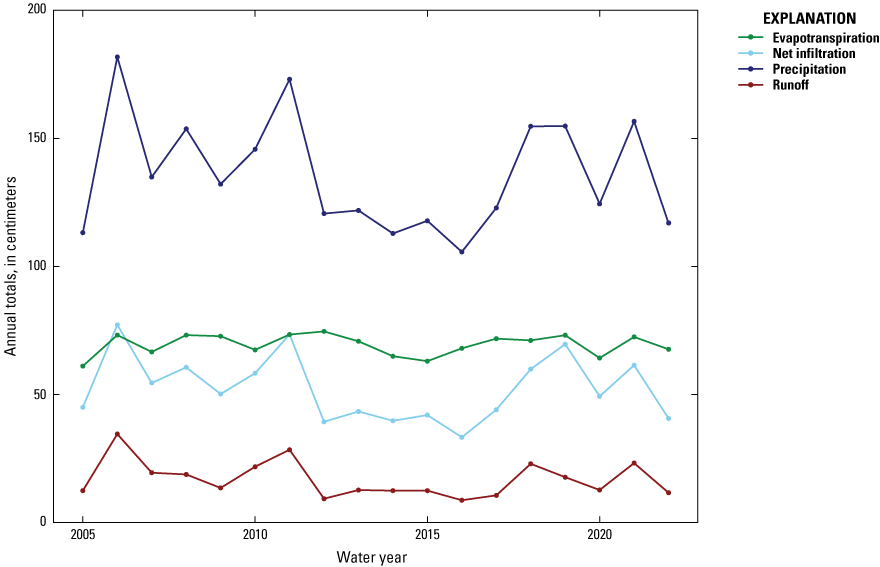
Graph showing annual totals of the major water-balance components from water years 2005 through 2022 across the study area in Connecticut and adjacent areas of New York and Rhode Island (Holland and Barclay, 2024). A water year is the 12-month period from October 1 through September 30 of the following year and is designated by the calendar year in which it ends.
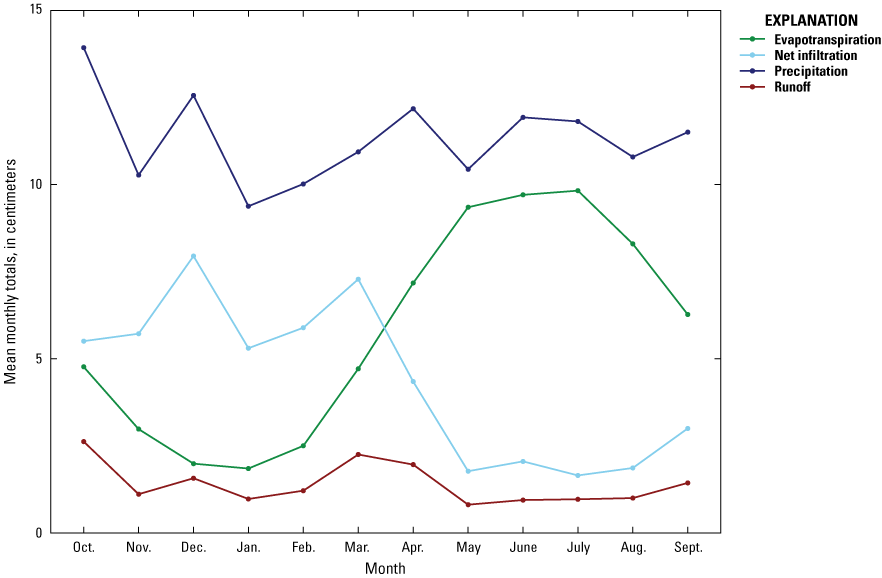
Graph showing mean monthly totals of the major water-balance components from water years 2005 through 2022 across the study area in Connecticut and adjacent areas of New York and Rhode Island (Holland and Barclay, 2024). A water year is the 12-month period from October 1 through September 30 of the following year and is designated by the calendar year in which it ends.
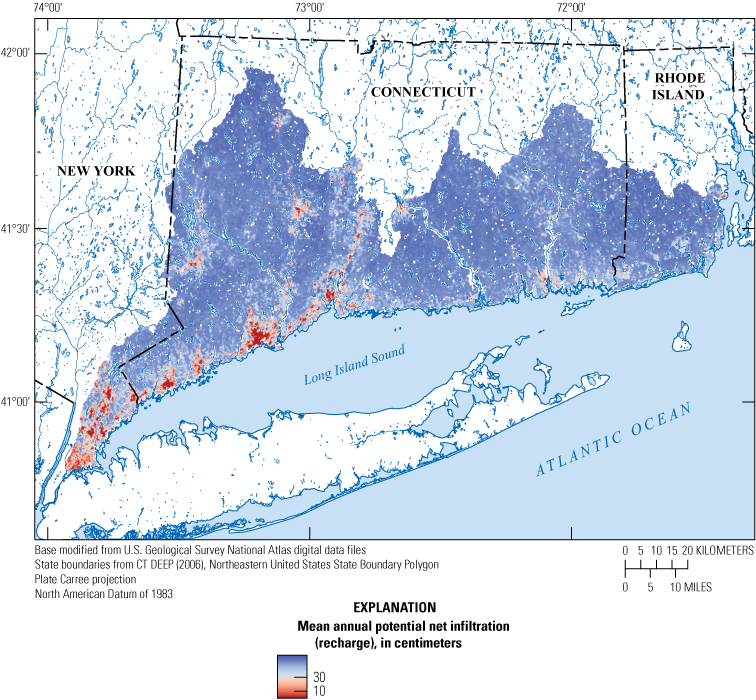
Map showing simulated 18-year mean annual potential net infiltration to groundwater (recharge) for the study area in Connecticut and adjacent areas of New York and Rhode Island, water years 2005 to 2022 (Holland and Barclay, 2024). CT DEEP, Connecticut Department of Energy and Environmental Protection.
Of the seven hydrologic soil groups, group A soils (sands and sandy loams with low runoff potential) have the highest annual net infiltration rates, and type D (clayey soils with high runoff potential) and the dual hydrologic soil groups (A/D, B/D, and C/D, which have the same properties as type D soils) have the lowest annual net infiltration rates. Net infiltration did not vary substantially between vegetated land covers. Graphs of net infiltration by hydrologic soil group and land cover are provided in a companion data release (figs. 8 and 9 in Barclay and Holland, 2024).
The lowest net infiltration values fell under the “Developed, High Intensity” land-cover classification because of the high curve numbers paired with the low maximum net infiltration parameter values assigned to these cells. These model grid cells are along the urban Connecticut coast, including near the cities of Bridgeport, Norwalk, and Stamford, as well as in New York in Westchester and Bronx Counties (counties not shown on any figure). In many of these areas, impervious surfaces cover 50 percent or more of the model grid cell. This SWB model does not account for groundwater recharge via managed recharge projects such as infiltration basins that are common in developed areas. As a result, net infiltration may be an underestimation of recharge in these areas.
Limitations of Soil-Water-Balance Model Net Infiltration Estimates
This SWB model provides temporally and spatially variable gridded estimates of groundwater recharge that are key inputs to the groundwater-flow model; however, there are several limitations to the approach of using these data as recharge estimates. The limitations are related to input datasets, to inherent limitations in the SWB model code, and to the use of simulated potential net infiltration as groundwater recharge in the groundwater-flow model.
It was assumed that input datasets, including hydrologic soil type, available water capacity, and land cover, did not change throughout the simulation period. This is a reasonable assumption for a 15-year simulation in this region. Additional uncertainty was introduced for parts of the study area where input data are not available. Within the SSRURGO database, missing values were present for both AWC and HSG. The most problematic area was SSURGO survey area NY199 (Westchester County, N.Y.), where map units designated in SSURGO as “Urban land” did not have an associated AWC or HSG. Missing values across the area were estimated by using the values of adjacent pixels at the data’s native 30-m resolution.
Several limitations were introduced by the SWB model code. The SWB code has no mechanism for infiltration rejection via saturation excess, and, as a result, in areas with a shallow water table, such as wetlands, the SWB model is expected to perform poorly. Furthermore, the SWB software does not calculate recharge for surface-water features, such as lakes and ponds. Wetlands, classified as either “Woody Wetland” or “Emergent Herbaceous Wetland,” were included in this model and make up 9.5 percent of the study area, whereas “Open Water” land-cover model cells were excluded from the SWB model entirely. In addition, the SWB model does not account for direct infiltration of streamflow loss through streambeds to aquifers or other processes that provide point-source recharge (Westenbroek and others, 2018).
Numerical Groundwater-Flow Model
A monthly dynamic-equilibrium numerical groundwater-flow model was developed to simulate monthly groundwater levels, fluxes, and budgets in the study area. A complete archive of model input and output files is available in Barclay and others (2024).
Design of the Numerical Model
The numerical groundwater-flow model was developed by using MODFLOW 6 (referred to simply as MODFLOW in this report) (Hughes and others, 2017; Langevin and others, 2017, 2021) and the FloPy package (Bakker and others, 2016) within Python. Input data were extracted and model files were compiled by using variations of the GenMod 1.0 Jupyter notebooks (Starn and Carlson, 2018).
Spatial Extent and Horizontal Model Grid
The active model domain covers the northern shore of Long Island Sound, extending from the East River in New York on the west side to Narragansett Bay in Rhode Island on the east side. The southern boundary extends 1 km into the sound beyond the coast. The northern boundary extends to HUC12 watershed boundaries and was expanded slightly beyond the boundary used by Barclay and Mullaney (2021a) (fig. 1); groundwater was assumed not to flow across the northern boundary. The model uses a horizontal discretization of square grid cells, each of which is 152.4 m (500 ft) per side. This discretization results in a grid of 709 rows and 1,491 columns. Although the model consists of a total of 1,007,119 cells in each of 4 layers, only 411,986 are active in each layer, resulting in a total of 1,647,944 active cells across the entire model domain.
Vertical Layering
The model uses a vertical discretization of four layers. The top of the model was set on the basis of mean land-surface altitude within each cell (U.S. Environmental Protection Agency and U.S. Geological Survey, 2012) and a preliminary simulation of the annual high water-table altitude without groundwater pumping. The top of the model was set at the land-surface altitude where (1) fresh or saline surface water was present, (2) the land-surface altitude was less than 10 meters, or (3) the simulated annual high water-table altitude was close to the land surface as indicated by either (a) a simulated high water-table altitude less than 5 m below the land surface or (b) the land surface being less than 20 percent higher than the simulated annual high water table. In all other cells, the top of the model was set to the simulated annual high water-table altitude plus a buffer of the maximum of 5 m or 20 percent of the annual high water-table altitude. This approach to setting the top of the model smoothed the model top and improved model convergence while ensuring that the model top was at or above the high water table altitude and at or below the land surface altitude.
Cell thickness and geologic unit varied spatially and by layer. The combined thickness of layers 1 through 3 was the greater of (1) the difference between the top of the model (as described in the previous paragraph) and the top of the bedrock and (2) 4.57 m (15 ft). The top of the bedrock was calculated by using land-surface altitude (U.S. Environmental Protection Agency and U.S. Geological Survey, 2012) and two datasets of surficial material thickness (Long Island Sound Resource Center and U.S. Geological Survey, 2004; Yager and others, 2018), as described in Barclay and Mullaney (2021a). A minimum thickness of 4.57 m (15 ft) was selected to facilitate model convergence. The combined thickness was distributed equally among the three layers. The thickness of layer 4 was set to 30.48 m (100 ft). The geologic unit for layers 1 through 3 was assigned on the basis of the cell altitude and the top of bedrock, as described in Barclay and Mullaney (2021a); layer 4 always represented bedrock.
Temporal Extent
The model is a monthly, dynamic-equilibrium model, meaning it simulates average conditions for each month of the year. The model begins with a steady-state period to establish average conditions and ends with a steady-state period to enable tracking of particles with long transit times. In between, the model has five identical annual cycles of twelve stress periods. Each stress period within an annual cycle represents one month in a water year (October through September). Each stress period is separated into three equal-length time steps. These 5 cycles of 12 stress periods represent average monthly conditions based on observed data from WYs 1993 through 2022. In total, the simulation includes 62 stress periods.
Hydraulic Boundaries
Within the model, all surface waterbodies except lakes are represented by head-dependent flux boundaries. This means that the flow between the aquifer and surface water varies on the basis of the hydraulic head within the aquifer, the water level in the surface waterbody, and user-defined sediment properties. MODFLOW provides multiple options for simulating head-dependent flux boundaries. In this model, flow between the aquifer and the river network was simulated by using the Streamflow-Routing package (SFR) (Niswonger and Prudic, 2005); flow from the aquifer to other freshwater waterbodies, such as wetlands, was simulated by using the Drain package (DRN) (Langevin and others, 2017, 2021); and flow across the marine (saline) boundary was simulated by using the General-Head Boundary package (GHB) (Harbaugh, 2005). As in the phase 1 model, lakes were simulated as areas of high hydraulic conductivity (3,048 meters per day [m/d] in the upper layer). Development of the DRN and GHB boundaries is described in Barclay and Mullaney (2021a) except as noted below; development of SFR inputs is described below. Urban drains were added by using the DRN package to represent the effects of storm drains and urban infrastructure on groundwater levels.
Simulation of River Boundaries
In the phase 1 model, all freshwater boundaries were represented with the DRN package. The DRN package is the simplest package to implement, but it does not account for recharge to the groundwater system from the river network. In this study, the river network boundaries were upgraded to the SFR package. The SFR package tracks streamflow and uses the surface inflows from upstream and channel geometry, in addition to the groundwater head in the aquifer, to determine both the magnitude and direction of flow between the aquifer and a river reach.
Inputs for the SFR package were compiled by using SFRMaker (Leaf and others, 2021) within Python. Stream locations, altitudes, and streambed slopes were extracted from the National Hydrography Dataset Plus (NHDPlus) dataset (U.S. Environmental Protection Agency and U.S. Geological Survey, 2012). SFRMaker estimates stream widths from the cumulative length of upstream river reaches, also known as the arbolate sum, using a power law relationship. Default values of 1.0 m for the thickness of the streambed and 0.037 for Manning’s roughness coefficient were used. The hydraulic conductivity of the streambed was assumed to be the same as that of the adjacent aquifer and, therefore, was adjusted as part of the calibration process.
Surface inflows across the study area boundary were estimated for five reaches that cross the study boundary (table 4). The rest of the study area boundary was assumed to be a no-flow boundary. For each reach that crossed the study area boundary, a nearby streamgage was identified and the estimated monthly base flow in the boundary reach was calculated as the product of the monthly base flow at the nearby streamgage and the ratio of the drainage areas of the boundary reach and the streamgage. One boundary reach (NHDPlus version 2 common identifier 6148885) is between two streamgages, and for this reach the average of the estimated flow calculated from each gage was used. A map of the reaches that cross the study area boundary and the streamgages used to estimate the inflows is provided in a companion data release (fig. 10 in Barclay and Holland, 2024).
Table 4.
U.S. Geological Survey streamgages, drainage areas, and estimated base flow used to estimate surface inflows to selected model reaches in Connecticut.[Drainage area is in square kilometers. Base flow is in cubic meters per day. Data for streamgages are available in the National Water Information System (U.S. Geological Survey, 2024). COMID, National Hydrography Dataset Plus, version 2, common identifier; USGS, U.S. Geological Survey; CT, Connecticut]
Simulation of the Marine Boundary
As in the phase 1 models, the overall spatial extent of the marine boundary was delineated by selecting areas classified as “Estuarine and Marine Deepwater” or “Estuarine and Marine Wetlands” in the National Wetlands Inventory (U.S. Fish and Wildlife Service, 2018). Model cells with more than 25 percent of their area within the marine boundary were collectively termed “coastal waters.” Model cells with more than 50 percent of their area within the marine boundary and land-surface altitude below 0 m were represented by using the GHB package within MODFLOW. The remaining coastal waters were represented with the DRN package within MODFLOW. The altitude of the marine boundary (water-table altitude) for cells on rivers was set by the river level, as with the phase 1 models. Cells with a land-surface altitude greater than 0 m were assumed to contain freshwater, and the remaining coastal water cells were assumed to contain saline waters. In cells with saline waters, the saltwater head was converted to an equivalent freshwater head as in the phase 1 models. The conductance for both GHB and DRN cells was calculated as the product of the sediment thickness, the boundary-cell area, the fraction of the cell covered by wetlands as mapped by the NLCD2011, and the vertical hydraulic conductivity of the wetland and nonwetland sediments. Marine-sediment thickness was assumed to be uniform at 5 m (Befus and others, 2017; Thompson and others, 2007), and the hydraulic conductivity was set at 0.18 m/d for nonwetland sediments and to 0.046 m/d for wetland sediments.
Simulation of Urban Drains
Urban areas frequently contain subsurface infrastructure, such as storm drains, sewer pipes, or subway tunnels, that have the potential to lower groundwater levels. Detailed representation of complex urban infrastructure was beyond the scope of this study, but the DRN package was used to represent in a simple way the aggregate effects of this infrastructure on lowering water levels. These urban drains were applied 3 m below the land surface to all active cells with 50 percent or more impervious cover that did not contain a river, wetland, or coastal waters.
Aquifer Properties
The thickness of unconsolidated sediments was estimated by using two datasets, a national dataset of aquifer characteristics for the glaciated United States (Yager and others, 2018) and a dataset of glacial sediment thickness for Connecticut (Long Island Sound Resource Center and U.S. Geological Survey, 2004). The national dataset has greater precision; therefore, it was the primary source. The Connecticut dataset was used for gap filling and in areas of particularly thick sediments, which were better represented in the local dataset.
As in the phase 1 model (Barclay and Mullaney, 2021a), horizontal hydraulic conductivity, vertical anisotropy, and porosity values were assigned on the basis of surficial or bedrock geologic unit (Domenico and Schwartz, 1997; Horton, 2017; Lyford and others, 2007; Masterson and Granato, 2013; Melvin and others, 1992; New York State Museum and New York State Geological Survey, 1999; Rhode Island Geographic Information System [RIGIS], 1989; Starn and Brown, 2007; Stone and others, 1992, 2005; U.S. Geological Survey and others, 2005). Specific yield and specific storage, two storage parameters that were not needed in the phase 1 model because it is a steady-state simulation, were also specified on the basis of surficial or bedrock geologic unit. The same geologic units were used as in the phase 1 model, except that “stratified glacial deposits—intermediate conductivity” was not used. This unit was previously used for a layered unit of coarse and fine sediments. In this model, areas within this unit were classified as “stratified glacial deposits—high conductivity” in the top model layer, and as “stratified glacial deposits—low conductivity” in any lower layers of surficial sediments. The initial horizontal hydraulic conductivity, vertical anisotropy, and porosity for each unit were the same as in the phase 1 model (table 5). Horizontal hydraulic conductivity was adjusted during the calibration process. Values for specific yield and specific storage were initially based on literature values (Lyford and others, 2007) and then adjusted during the calibration process.
Table 5.
Geologic units and associated parameters for the numerical groundwater-flow model of the study area in Connecticut and adjacent areas of New York and Rhode Island.[For the purposes of estimating porosity and vertical anisotropy, thin glacial till and the underlying bedrock were treated as separate units. For the purpose of calibrating hydraulic conductivity, thin glacial till and the underlying bedrock were treated as a combined unit. Hydraulic conductivity is in units of meters per day]
Hydraulic Stresses
Within the MODFLOW model, two sources contributed to groundwater recharge: precipitation and septic return flows. Groundwater recharge from precipitation was calculated by using the SWB model described above. Daily rates of recharge for WYs 2005 to 2022 were aggregated to mean monthly values for each month for each model cell (twelve values total per cell). It was assumed that recharge for this period of time was a reasonable representation of recharge during the entire study period of 1993 through 2022 because the recharge was further adjusted during the groundwater model calibration. The steady-state periods did not include month-to-month variation and therefore used the mean recharge across all months. Because of software limitations, the SWB and MODFLOW grids were not coincident; therefore, the recharge was resampled from the SWB grid to the MODFLOW grid. Recharge from precipitation was simulated using the Recharge (RCH) package with array-based inputs within MODFLOW (Langevin and others, 2017, 2021), and estimated rates were adjusted during the model calibration process.
Septic return flows were simulated as additional recharge in populated areas without public sewer service. Septic return flow rates were estimated on the basis of population density (Falcone, 2016; U.S. Census Bureau, 2010), per capita water use of 0.18 m3/d (Dieter and others, 2018), and a consumptive-use fraction of 0.15 (Shaffer and Runkle, 2007). The per capita use estimate was based on the average across all eight counties in Connecticut; Washington and Westchester Counties in New York; and Kent and Washington Counties in Rhode Island. As with recharge from precipitation, septic return flows were simulated by using the RCH package; however, list-based inputs were used, and the estimated rates were not adjusted during the calibration. Because of the incorporation of water use by seasonal residents, septic return flows were slightly higher in some areas during the summer months (June through August) than during the nonsummer months (September through May).
Groundwater withdrawals for public water supply and industrial uses were compiled and estimated from multiple State-level datasets. The vertical locations of the withdrawals were estimated on the basis of available information, including the presence or absence of an aquifer protection area (for public water-supply wells in Connecticut) and records of the geologic formation (for wells in Rhode Island). Wells with aquifer protection areas or unconsolidated geologic formations were placed in the deepest surficial material layer; all other wells were assumed to be in the lowest (bedrock) layer. Withdrawal rates for New York and Rhode Island were available only as annual aggregations; therefore, constant rates were used in these States. In Connecticut, monthly withdrawals for public water supply and industrial uses were available starting in 2020; therefore, it was assumed that the 2020 withdrawal rates applied throughout the study period. Groundwater withdrawals were simulated using the Well (WEL) package within MODFLOW (Langevin and others, 2017, 2021).
Populated areas outside of public water-supply service areas were assumed to be served by private wells. Private well withdrawal rates were estimated on the basis of population density and per capita usage rates of 0.18 m3/d (Dieter and others, 2018). As with the septic return flows, private well withdrawals in some areas were slightly higher during the summer months due to seasonal residents (fig. 6 in Barclay and Holland, 2024). We assumed that private wells were finished in bedrock; therefore, the withdrawals were from the deepest (bedrock) layer of the model. Private wells were simulated by using the WEL package within MODFLOW.
Transpiration by vegetation and even evaporation directly from the aquifer can reduce groundwater levels, particularly in the summer in areas with near-surface water tables. When temperatures are high and plants are actively growing, the groundwater system can lose a substantial amount of water. Groundwater evapotranspiration was simulated in this model for four broad land-cover classes—developed open space, forest, shrubs and herbaceous vegetation (including pasture and hay fields), and wetlands. Within each land-cover class, evapotranspiration was simulated by three broad sediment classes—glacial till (thick or thin), stratified glacial sediments of high conductivity, and all other sediments. Groundwater evapotranspiration was not simulated in areas of open water, developed land other than open space, barren land, or cultivated crops. Combining the land-cover and sediment classes resulted in 12 vegetation zones. Groundwater evapotranspiration was simulated using the Evapotranspiration (EVT) package within MODFLOW (Langevin and others, 2017, 2021). Within the EVT package, the maximum rate of evapotranspiration is simulated when the water table is at the land surface and the rate decreases linearly to zero at a user-specified extinction depth. The extinction depth was estimated on the basis of the vegetation zone, and the maximum rate was estimated on the basis of the vegetation zone and month of the year. The extinction depth and maximum rates were adjusted during the model calibration process.
Calibration of the Numerical Model
The groundwater-flow model was calibrated by using the PEST++ suite of calibration software tools (White and others, 2020) in parallel on the USGS Hovenweep Supercomputer (Falgout and others, 2023). Commonly, models are calibrated with a goal of finding one optimal set of parameter values that minimizes the discrepancies between observed values and their simulated equivalents. This focus on a single set of parameters obscures uncertainty that is inherent in the calibration process. In addition, this traditional calibration can unintentionally imply that the observed values are known with certainty. The Iterative Ensemble Smoother module within PEST++ (PESTPP–IES) instead seeks to explicitly acknowledge the limitations in our ability to simulate and observe complex real-world processes by identifying an ensemble of parameter sets that result in simulated values that fit reasonably well to an ensemble of observed values. The ensemble of parameters can then be used to calculate uncertainty bounds for the parameters and for the simulated values.
Calibrated Parameters for the Numerical Model
Model calibration focused on five aspects of the model: horizontal hydraulic conductivity, specific yield, specific storage, recharge from precipitation, and groundwater evapotranspiration (Table7_MODFLOW_StaticCalibrationParameters.csv and Table8_MODFLOW_TemporalCalibrationParameters.csv in Barclay and Holland, 2024).
Aquifer Properties
Static aquifer properties (horizontal hydraulic conductivity, specific yield, and specific storage) were calibrated by using 11 geology-based zones (Table7_MODFLOW_StaticCalibrationParameters.csv in Barclay and Holland, 2024). Initial values for hydraulic conductivity were based on the phase 1 model values (Barclay and Mullaney, 2021a), and initial values for specific yield and specific storage were based on literature values (Lyford and others, 2007). The median calibrated horizontal hydraulic conductivity across the parameter sets was 0.2 m/d in areas of “thin glacial till” (67 percent of the study area), 9.63 m/d in areas of “stratified glacial deposits—high conductivity” (17 percent of the study area), and 0.23 m/d in areas of “thick glacial till” (9 percent of the study area). The median calibrated specific yield across the parameter sets ranged from 0.08 in areas of “thin glacial till” to 0.31 in areas of “stratified glacial deposits—high conductivity,” and the median calibrated specific storage across the parameter sets ranged from 7.0 × 10⁻⁶ in areas of “metamorphic/sedimentary bedrock” (1 percent of the study area) to 1.4 × 10⁻⁴ in areas of “thin glacial till.”
Groundwater Recharge
Groundwater recharge, as estimated by the SWB model, was adjusted at two nested spatial scales for each month during the model calibration. At the broader spatial scale, a monthly scalar was used to increase or decrease simulated recharge across the entire study area. Then, monthly geologic-zone-based scalars were used to increase or decrease recharge within each geologic zone. The final recharge to a model cell is the product of the SWB-estimated recharge to that cell and the two calibrated scalars (Table8_MODFLOW_TemporalCalibrationParameters.csv in Barclay and Holland, 2024).
Groundwater Evapotranspiration
The extinction depth represents the depth of water, relative to the land surface, beyond which plants are unable to access groundwater and evapotranspiration does not occur. This value was calibrated for each of 12 vegetation zones, which represent 4 broad types of landcover and 3 groups of surficial sediments (Table7_MODFLOW_StaticCalibrationParameters.csv in Barclay and Holland, 2024). The median calibrated extinction depth across the parameter sets ranged from 0.54 m in areas of “developed land on glacial till sediments” (15 percent of the study area) to 5 m in areas of “forested land on glacial till sediments” (48 percent of the study area). The maximum evapotranspiration rate was calibrated for each month for each of the 12 vegetation zones (Table8_MODFLOW_TemporalCalibrationParameters.csv in Barclay and Holland, 2024). The median calibrated maximum evapotranspiration rates across the parameter sets ranged from 0 m/d during December in forested areas (55 percent of the study area) to 13.2 m/d during August in forested areas.
Observations for Numerical Model Calibration
Two primary types of observations—groundwater levels and streamflow under base-flow conditions were used in the model calibration. In addition, the land-surface altitude and the assumption that groundwater evapotranspiration rates varied smoothly throughout the year were used to constrain the model.
Groundwater Levels
Groundwater levels, as measured in monitoring wells, provide information about the water table at specific times and locations. In this study, water levels in 66 long-term monitoring wells during WYs 1993 through 2022 were used to calibrate the model (Table2_Wells.csv and fig. 4 in Barclay and Holland, 2024). The wells were selected on the basis of the number of measurements (50 or more measurements). Individual water-level measurements with measurement accuracies of 0.3048 m or greater were excluded. The mean monthly water level was calculated for each well (twelve values for each well) and compared to the corresponding simulated water level for that month. In addition, the annual range in water levels, calculated as the difference between the maximum and minimum mean monthly level, was calculated for each well. For wells located in unconsolidated sediments, the simulated water-table altitude at the location of the well was compared with the observed water-level altitude in the well. For wells located in bedrock, the altitude of the well bottom relative to the altitude of the center of the 30.48-m-thick bedrock layer was used to estimate the simulated water level in the well by vertically interpolating between the simulated water table and the hydraulic head in model layer 4. Then the simulated water level for the well was compared with the observed water-level altitude. Water-level data for all wells are available in the National Water Information System (U.S. Geological Survey, 2024).
Stream Base Flow
Observations of streamflow during base-flow conditions provide important information about flow through the groundwater system. The combined use of flow (streamflow under base-flow conditions) and head (groundwater levels) observations can provide critical constraints on the calibration of hydrologic parameters, such as the hydraulic conductivity, specific storage, and evapotranspiration rates. In this study, mean monthly base flows for 14 streamgages with relatively minimal streamflow alterations was used to calibrate simulated groundwater discharge (Table2_Gages.csv and fig. 3 in Barclay and Holland, 2024). Twelve of the 14 streamgages were classified as “Reference” streamgages in the GAGES II dataset (Falcone, 2011), which indicates minimal hydrologic disturbance, and two additional streamgages (USGS site 01208873, Rooster River at Fairfield, Connecticut; USGS site 012035055, Pootatuck River at Berkshire, Conn.) were determined to be relatively unaffected by water use and regulation in their drainage areas on the basis of observations during prior site visits. For each streamgage, mean base flow was calculated by using the PART (Rutledge, 1998) and BFI (Gustard and others, 1992) algorithms as implemented in the DVstats package in R (R Core Team, 2021). The mean monthly values from the longest continuous period of daily mean streamflow values at each site were used as a calibration observation. The effects of using gages with different periods of record was determined to be minimal based on analysis conducted as part of the phase 1 models (Barclay and Mullaney, 2021a). The streamflow values, both observed and simulated, were transformed by the use of logarithmic transformation. This transformation increased the relative influence of smaller streamflow values on the model calibration and decreased the relative influence of larger streamflow values. Without this transformation, the larger streamflow values would have dominated the calibration analysis. Streamflow data for all gages are available in the National Water Information System (U.S. Geological Survey, 2024). The natural log of the observed base flow at each streamgage was compared with the natural log of the total simulated groundwater discharge upstream from the streamgage location.
Land Surface
In coastal Connecticut and adjacent areas of Rhode Island and New York, extensive groundwater flooding (groundwater above the land surface) is relatively uncommon, as the water table is typically below the land surface. This expectation that the water table should be below the altitude of the land surface was leveraged to constrain the calibrated parameters. Observational points of land-surface altitude, uniformly spaced 1,524 m (10 model cells) apart on a grid, were used as observations of the maximum water-table altitude. The grid of land-surface observations was made coarser than the model grid to reduce computational resource requirements.
Local Minimum and Maximum
Rates of evapotranspiration are typically higher during the growing season and lower during the winter, with rates changing relatively smoothly from month to month. Preliminary calibration analyses resulted in anomalous peaks in the maximum evapotranspiration rate, likely due to limitations in the available hydrologic observations. To constrain the calibrated values to the expected general pattern without constraining the specific pattern (for example, to constrain the values to increase and decrease across the months of the year without requiring a sinusoidal pattern), an observation focused on minimums and maximums was added. The new observation specified that only 1 local minimum and 1 local maximum occurred. This means that the monthly rates should be higher than both the preceding and the succeeding month (a local maximum) for no more than 1 month during the year and that the monthly rates should be lower than both the preceding and succeeding month (a local minimum) for no more than 1 month during the year. The value of the local minimum/maximum observations did not vary across the ensemble (sets of parameters that result in simulated values that fit reasonably well to an ensemble of observed values, as described previously).
Calibration Results for the Numerical Model
The calibration process involved first generating simulated values for the observations by using each set of parameter values from the parameter ensemble (multiple sets of parameters). Then, each set of simulated values was compared with a set of observations from the observation ensemble, and the entire ensemble of parameter values was updated to better match the observations. To prevent overfitting, the flow model calibration was terminated after the first parameter-update cycle. The updated ensemble of parameter values was trimmed to the better performing sets of parameter values based on the overall model performance. The final ensemble of parameter values contained 144 sets of parameter values.
The simulated values of base-flow discharge, annual range in base-flow discharge, groundwater levels, and annual range in groundwater levels agreed well with the observed values (fig. 10). Ninety percent of base-flow discharge observations had median residuals across all parameter sets between −20,944 m3/d and 19,841 m3/d, with a median of −186 m3/d. As indicated by the percent error (fig. 10B), the simulated base-flow discharge tends to be lower than the observed values during the nonsummer season and higher than the observed values during the late summer. Because observed base-flow discharge is higher during the winter and spring and lower during the summer, this pattern of seasonal bias also results in undersimulation of the annual range in base-flow discharge (fig. 10C).
Simulated groundwater levels agree very well with observed values (fig. 10D). Ninety percent of groundwater-level observations had median residuals across all parameter sets between −9.16 m and 5.80 m, with a median of 0.45 m. Across all observations and parameter sets, the median monthly error in groundwater levels ranged from −0.27 m to 0.81 m (fig. 10E) and had a slight tendency to simulate higher than observed groundwater levels in March and April and lower than observed groundwater levels in the late summer and early fall. For most wells, the annual range in groundwater levels is well simulated (fig. 10F). For a few wells, the simulated range is much larger than the observed range.
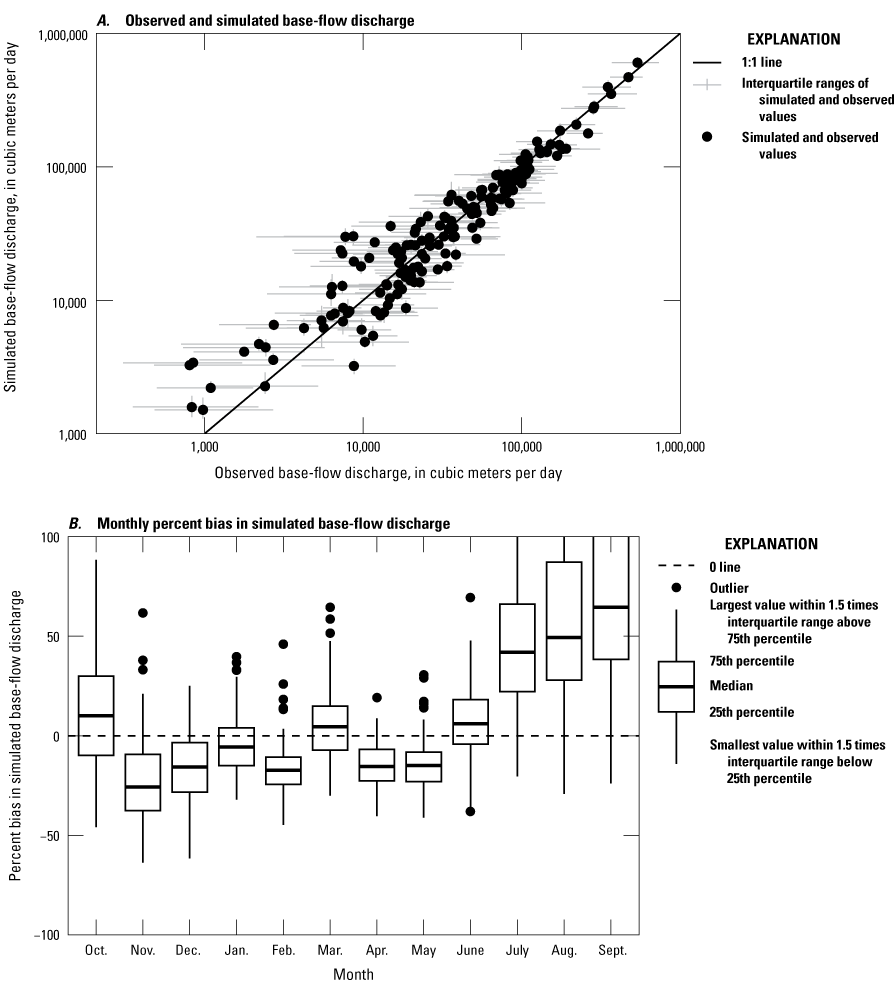
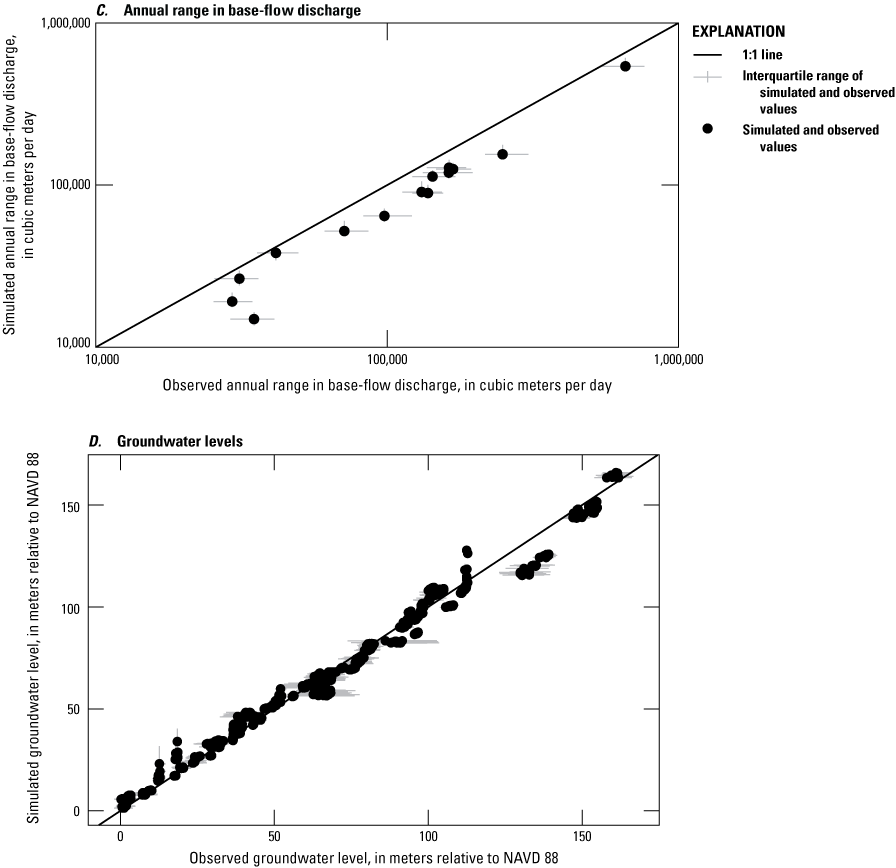
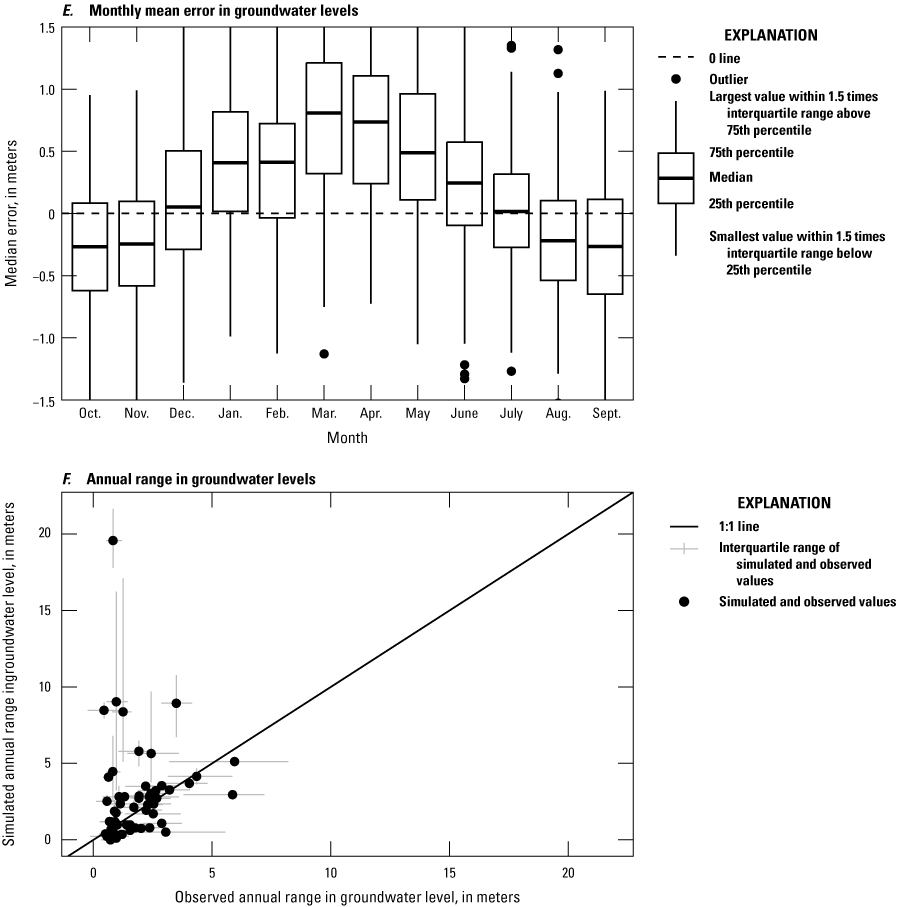
Graphs showing A, observed and simulated base-flow discharge, B, monthly percent bias in simulated base-flow discharge, C, observed and simulated annual range in base-flow discharge, D, observed and simulated groundwater levels, E, monthly mean error in groundwater levels, and F, observed and simulated annual range in groundwater levels, north shore of Long Island Sound (coastal Connecticut and adjacent areas of New York and Rhode Island) (Barclay and others, 2024). Note that vertical axes on B and E are truncated to improve visibility. NAVD 88, North American Vertical Datum of 1988.
With calibration, the median model-wide base-flow discharge residual across the ensemble decreased from 3,271 m3/d to −329 m3/d, and the median model-wide groundwater-level residual across the ensemble decreased from 0.44 m to 0.19 m. The greatest improvement in the median model-wide base-flow discharge residual occurred during March, with a decrease from 26,512 m3/d to 2,302 m3/d. The greatest improvement in median groundwater-level residual occurred in July, with a decrease from 0.44 m to 0.02 m.
Simulation of Monthly Groundwater Budgets
Across all seasons, natural recharge from precipitation is by far the largest source of water to the groundwater system, with the largest rates of recharge occurring during the winter months (fig. 11A). Across the entire study area, septic return flows are a small fraction of the groundwater budget, but they may be locally important in areas with a high concentration of septic systems. During the cold season of December through April, the largest fluxes of water out of the groundwater system are to wetlands, streams, and rivers. During the summer growing season, groundwater evapotranspiration becomes the dominant flux of water out of the groundwater. Groundwater storage is increasing from November through April and decreasing from May through October (fig. 11B).
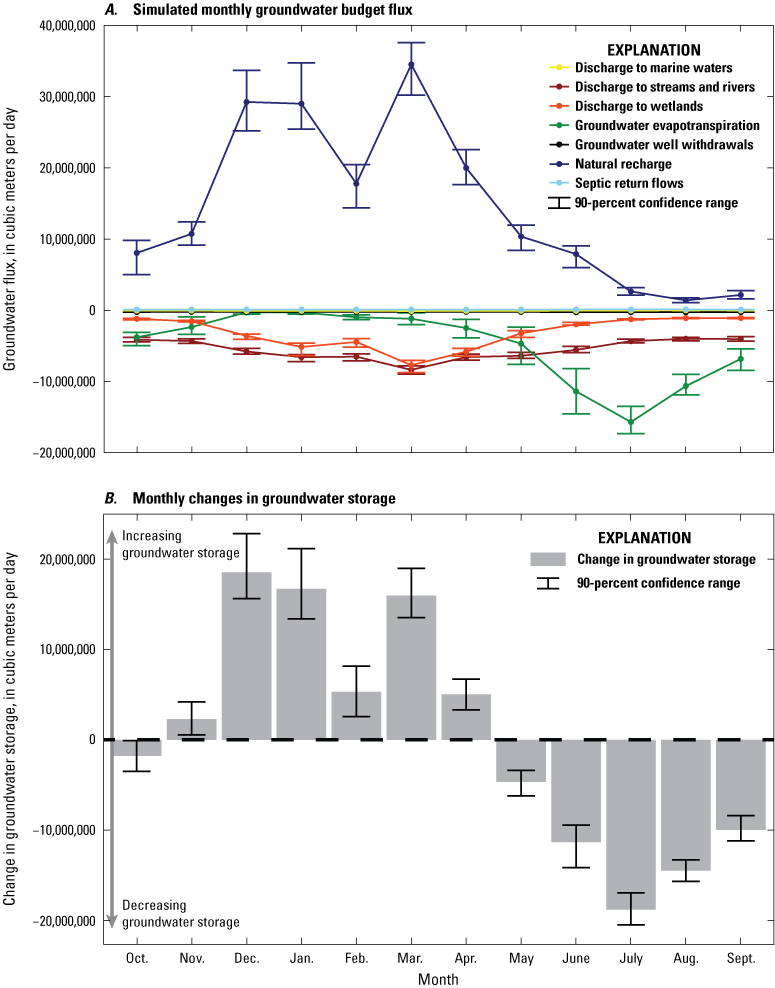
Graphs showing A, simulated monthly groundwater budget fluxes and B, monthly changes in groundwater storage. “Discharge to streams and rivers” is the net discharge to streams and rivers, accounting for groundwater recharge from the stream channel. The points and lines show the median values, and the error bars indicate the 90-percent confidence range over 144 model runs (Barclay and others, 2024).
Limitations of Groundwater-Flow Analysis
As with all models, the groundwater-flow model used in this study provides useful information about the groundwater system and contains necessary simplifications and assumptions. The phase 1 model report (Barclay and Mullaney, 2021a) documents some of the effects of these simplifications on model predictions. In particular, that report addresses the effects of (1) assuming steady-state conditions; (2) estimating water use; (3) complex urban water dynamics; (4) heterogeneity in and lack of information about aquifer properties such as hydraulic conductivity, porosity, and the thickness of unconsolidated sediments; and (5) model grid resolution. The updates in the current study reduce the assumptions for two of those simplifications: the assumption of steady-state conditions and estimated water use.
Water-Use Estimates
In the phase 1 models, public water-supply withdrawals for Connecticut were only available for higher yield wells. Smaller public water-supply withdrawals were estimated on the basis of per capita usage. Industrial withdrawals were not included due to a lack of data. For the current study, reported water withdrawals in Connecticut in 2020 were used to provide more accurate withdrawal rates and estimates of public water-supply withdrawals. Industrial withdrawals were also added for Connecticut. Because the reported withdrawal data were only available for 2020, it required the assumption that those withdrawals were representative of the entire study period. The region experienced a drought in 2020 (Lombard and others, 2020), which may have affected the reported withdrawal rates; however, the errors introduced by the drought are likely less than the errors from the previous coarse estimates. Water-withdrawal data continue to be collected in Connecticut, and future models can incorporate the expanded data.
Because the phase 1 models were steady state, private well withdrawals and septic return flows from seasonal residents were not included. These withdrawals and return flows were estimated for this study on the basis of census data and assumptions about the length of residency and household size (app. 1). Seasonal private well withdrawals and septic return flows are a small component of the water budget in most watersheds, with seasonal private wells withdrawing less than 2 percent of the natural recharge during August, when natural recharge rates are lowest and seasonal private well withdrawals are highest, in 110 of the 115 HUC12 watersheds in this study area. Seasonal private wells withdrawal more than 10 percent of the natural recharge during August in only one HUC12 watershed, Ninigret Pond-Frontal Block Island Sound (HUC12 010900050403; map number 107 in fig. 2). Because seasonal residences tend to be clustered along the shorelines of inland waters and Long Island Sound, seasonal private well withdrawals and septic return flows likely have larger effects on local water availability in these areas.
Temporal Dynamics
The phase 1 models were steady-state models, meaning that they represent long-term average conditions. The groundwater-flow model for this study represents average monthly conditions, which allows it to be used for understanding seasonal patterns in groundwater flow and transport. The model is not able to simulate long-term trends, interannual patterns, or specific events, such as the 2020 drought (Lombard and others, 2020) or Hurricane Irene in August 2011 (McCallum and others, 2012).
Spatial Discretization
The groundwater-flow model is a regional model and, as such, is robust for simulating broad regional patterns in groundwater flow. Local-scale heterogeneity in geologic and hydrologic properties is not represented, and neither local-scale patterns in groundwater levels nor groundwater discharge from very small catchments were evaluated. Therefore, the simulated values from this regional model should not be used as the basis for detailed, local-scale analysis; the model can, however, be used to identify local areas that may warrant further investigation. Two settings where further investigation may be needed are urban areas and upland areas with glacial till sediments. Representing the complex modifications to the hydrologic and geologic setting, such as artificial fill, subsurface infrastructure, and storm sewers, that are common in urban areas was beyond the scope of this study. Similarly, representing preferential flow paths and fine-scale variations in topography and sediment thickness that control local-scale groundwater flow in upland areas with glacial till was beyond the scope of this study.
Development of the Particle-Tracking Model
Groundwater-flow models can simulate the spatial and temporal patterns in hydraulic head and the flow of water into and out of each cell, but they are unable to simulate the path that water follows from the land surface to the point of discharge. Particle-tracking models, such as MODPATH (Pollock, 2016, 2017), are needed for this. MODPATH tracks hypothetical particles of water through the model domain, recording the starting and ending location, the starting and ending time, and, if desired, the specific path traveled.
For this study, a MODPATH model was used to calculate travel times through the aquifer and to connect recharge and discharge cells for the purpose of simulating nitrogen transport. A total of 69 million particles were distributed across the model domain throughout the year, proportionally to the rate of groundwater recharge. Particles were distributed in a grid formation in the uppermost nondry grid layer. Porosity values were based on geologic material (Lyford and others, 2007). To account for uncertainty in the porosity, the porosity values were multiplied by normally distributed random factors with a mean of 1 and a standard deviation of 0.1. Particles were released monthly during year two of the simulation, tracked in the forward direction, and allowed to pass through weak sinks.1 Particles remaining in the model at the end of the final monthly stress period were tracked in a steady-state stress period to a maximum of 100 years. This limit was set to reduce computational requirements and was sufficient for more than 99.5 percent of particles to exit the model domain. A complete archive of model input and output files is available in Barclay and others (2024).
Weak sinks occur in model cells where some, but not all, water flowing into the cell leaves the study area. For example, a well with a pumping rate less than the flux of water into the cell would be a weak sink.
Nitrogen Load Model
The nitrogen load model calculates groundwater-transported nitrogen loads and travel times throughout the study area on the basis of the approach developed by Valiela and others (1997), modified by Vaudrey and others (2016a, b), and tested within the Niantic River watersheds as part of the phase 1 models (Barclay and Mullaney, 2021a). Nitrogen inputs were estimated by using land-cover and land-use data, as well as national datasets of atmospheric deposition, and nitrogen removal rates were calibrated. Recharge locations, discharge locations, and travel times were based on the starting and ending locations and travel times of the particles from the particle-tracking model. Particles that exited the model through wells, groundwater evapotranspiration, or urban drains were treated as sinks of nitrogen; nitrogen associated with these particles was not included in the calculations of surface-water loads. A complete archive of input and output files for the nitrogen load model is available in Barclay and others (2024).
Nitrogen Inputs
The nitrogen model accounts for nitrogen from three sources: atmospheric deposition, agricultural and lawn fertilizer, and septic systems. Although nitrogen inputs to the land surface vary throughout the year, the many unknowns and variability of unsaturated zone travel times made simulating temporal variability in water-table inputs beyond the scope of the present study.
Atmospheric Deposition
Annual inputs of nitrogen from atmospheric deposition were estimated by using wet and dry deposition maps from the National Atmospheric Deposition Program (National Atmospheric Deposition Program, 2019), the same method used in Barclay and Mullaney (2021a). Wet deposition inputs were reduced by 23 percent and dry deposition inputs were reduced by 11.5 percent to account for nitrogen that is transported by surface processes and does not enter the groundwater system. These values were calculated during the phase 1 analysis under the assumptions that (1) wet deposition partitions between surface runoff and groundwater recharge with the same proportions that precipitation does and that (2) the fraction of deposition transported by surface runoff is smaller for dry deposition than for wet deposition. Streamflow data from two streamgages within the study area (01127500, Yantic River at Yantic, Conn.; 01194500, East Branch Eightmile River near North Lyme, Conn.) were used to estimate the fraction of precipitation that contributes to surface runoff and recharge.
Fertilizer
Annual nitrogen inputs from fertilizer were estimated from land-cover data and typical application rates according to the same basic method used in Barclay and Mullaney (2021a). Briefly, in agricultural areas, as identified by the NLCD (Homer and others, 2015), an annual application rate of 86 kilograms of nitrogen per hectare per year (kg-N/ha/yr) (Vaudrey and others, 2016b) was used. The dataset used to identify areas of grass in the prior study did not cover this study area; therefore, areas of grass were identified as areas classified by the NLCD as “Developed, Open Space” and not “Impervious Cover.” In these areas, an annual application rate of 67.6 kg-N/ha/yr (Vaudrey and others, 2016b) was used. Fertilizer inputs to each model cell were scaled by the fraction of the model cell with agricultural or grass land cover. It was assumed that some fertilizer was removed through surface processes; therefore, the fertilizer inputs were reduced by 11.5 percent, the same reduction applied to dry deposition.
Septic Systems
Nitrogen inputs from private septic systems were estimated for both year-round and seasonal residents. Inputs from year-round residents were estimated on the basis of maps of public sewer service (CT DEEP, 2022; New York City Department of Environmental Protection, 2017; RIGIS, 2012; Westchester County Department of Planning, 2015), population density maps (Falcone, 2016), and per resident nitrogen inputs of 4.8 kilograms of nitrogen per year (kg-N/yr) (Vaudrey and others, 2016b). Septic inputs for year-round residents were assumed to be constant throughout the year. Inputs from seasonal residents were estimated similarly, except that the seasonal population density map was developed as described in appendix 1. Seasonal residents were assumed to be present during the summer months of June, July, and August. Nonresidential septic systems were not included in this simulation to prevent double-counting of septic nitrogen for residents using private septic systems.
Nitrogen Attenuation
Nitrogen attenuation, or removal through plant uptake or reactive processes, was simulated using removal fractions that were applied sequentially as the nitrogen passed through five zones between the land surface and the watershed outlet (fig. 12). Removal rates within each zone varied by nitrogen source, land cover, soil type, surficial geology, groundwater travel time, distance, and (or) month.
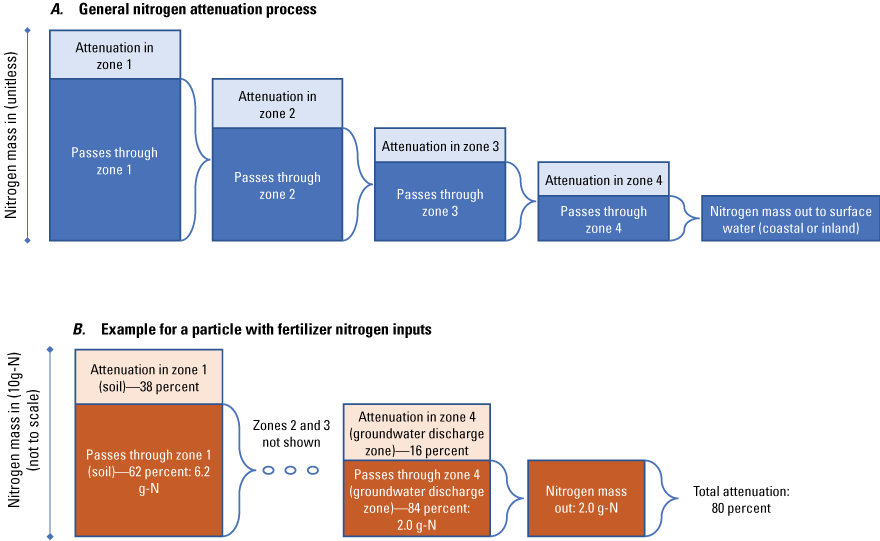
Schematics of the sequential nitrogen attenuation calculations shown A, in general, and B, with an example for a particle with nitrogen inputs from fertilizer. Schematic A shows zones 1 through 4 and schematic B only shows zones 1 and 4. g-N, grams of nitrogen. Figure modified from Barclay and Mullaney (2021a).
Zone 1: Plant and Soil Zone (Atmospheric Deposition and Fertilizer Nitrogen) or Septic Tanks (Septic Nitrogen)
The conceptual definition of the first attenuation zone varied by nitrogen source. For nitrogen from atmospheric deposition and fertilizers, it represented plant uptake and soil attenuation. For atmospheric deposition, the removal rate varied by land cover, with rates ranging from 31 percent for high-intensity developed land to 75 percent for wetlands (Valiela and others, 1997; Vaudrey and others, 2016b). The rates are available in Barclay and Holland (2024, Table11_Nitrogen_NonCalibratedParameters.csv). The removal rate for fertilizer was 38 percent (Valiela and others, 1997). For nitrogen from septic systems, the first attenuation zone represented removal within the septic tank, and a uniform removal rate of 5 percent was used (Valiela and others, 1997).
Zone 2: Vadose Zone (Atmospheric Deposition and Fertilizer Nitrogen) or Septic Drainage Field and Plume (Septic Nitrogen)
For atmospheric deposition- and fertilizer-sourced nitrogen, the attenuation rate in the vadose zone varied by surficial geology. Surficial geology also controlled the attenuation rate in the groundwater discharge zone (zone 4, described below); to account for differences between the vadose zone and the groundwater discharge zone, a calibrated scaling factor was used to adjust all the vadose zone attenuation rates up or down. Initial rates were set to 15 percent for all surficial geology types and were adjusted during the calibration process.
For septic systems, the vadose zone represents both the leaching field and the plume above the water table. In the phase 1 pilot study (Barclay and Mullaney, 2021a) and in Vaudrey and others (2016a, b) the leaching field and plume were treated as separate zones, each with the same rate. For consistency with the other sources, they are treated as a single zone within this model, with rates adjusted from those in Vaudrey and others (2016b) to be equivalent to the two-zone approach. Vadose zone removal rates for septic nitrogen ranged from 2 percent for sand to 94 percent for sandy clay (Vaudrey and others, 2016b) and were not calibrated.
Zone 3: Aquifer
Nitrogen attenuation in shallow groundwater is highly influenced by the residence time of water in the aquifer (Hinkle and Tesoriero, 2014); residence time is equivalent to the travel time of groundwater from its point of entry at the water table to its point of discharge. To account for this in the model, attenuation within the aquifer was simulated as first-order decay, rather than as a static fraction as in Vaudrey and others (2016a).
With first-order decay, the change in concentration with time is a function of a rate constant and the concentration at that point in time. In this model, the nitrogen is tracked by MODPATH particle; therefore, concentration is expressed as kilograms of nitrogen per particle:
where[A]
is the concentration of nitrogen in kilograms per MODPATH particle;
k
is a rate constant, with units per year; and
t
is time, in years.
After the concentration of nitrogen ([A]) is integrated over time and the equation is rearranged, the nitrogen concentration at end of the flow path through the aquifer can be expressed as a function of the concentration at the beginning of the flow path through the aquifer and a dimensionless removal fraction that is a function of the groundwater travel time:
where[Aend]
is the nitrogen concentration exiting the aquifer, in kilograms of nitrogen per MODPATH particle;
[Astart]
is the nitrogen concentration entering the aquifer, in kilograms of nitrogen per MODPATH particle;
e
is Euler’s number, approximately 2.718, dimensionless;
k
is a rate constant, with units per year; and
ttotal
is the groundwater travel time, in years.
Zone 4: Groundwater Discharge Zone
Attenuation rates also were allowed to vary by type of surficial geology at the point of discharge to surface water. In the groundwater discharge zone, the rates also varied by time of year. The attenuation rates specified for surficial geology were the same as those used for the vadose zone. Initial rates were 15 percent for all surficial geology types and were adjusted during the calibration process. The rates were modified by calibrated monthly attenuation factors that ranged from 0 to 1 to account for differing rates of biological activity throughout the year.
Zone 5: River Channel
Although the river channel is not part of the groundwater system, nitrogen removal in the river channel was estimated to facilitate comparison of the simulated loads and surface-water observations. Within the river channel, attenuation was simulated as first-order removal as a function of the downstream river distance between the discharge location and the observation site or the watershed outlet:
where[Aend]
is the nitrogen concentration at the point of interest, in kilograms of nitrogen per discharge location;
[Astart]
is the nitrogen concentration at the groundwater discharge point, in kilograms of nitrogen per discharge location;
e
is Euler’s number, approximately 2.718, dimensionless;
k
is a rate constant, with units per kilometer; and
ltotal
is the downstream river distance from the discharge point to the point of interest, in kilometers.
The rate constant for removal in the river channel varied by month of the year to account for increased biological activity during the warmer months.
Calibration of the Nitrogen Load Model
The nitrogen model was calibrated by using the Iterative Ensemble Smoother module within PEST++, the same approach used with the groundwater-flow model. This approach allows for explicit representation of uncertainty in observed and simulated nitrogen loads, as well as in model parameters.
Calibrated Parameters for the Nitrogen Load Model
The nitrogen model calibration focused on the nitrogen removal rates. Annual nitrogen inputs were not calibrated because the calibration process could not constrain both inputs and attenuation rates, and it was assumed that the inputs were known with less uncertainty than the attenuation rates.
Attenuation Parameters
Nitrogen attenuation rates varied by nitrogen source, land cover, soil type, surficial geology, groundwater travel time, distance, and (or) month. Many of the nitrogen attenuation rates were calibrated (Table9_Nitrogen_StaticCalibrationParameters.csv and Table10_Nitrogen_TemporalCalibrationParameters.csv in Barclay and Holland, 2024); soil zone removal rates for nitrogen from atmospheric deposition or fertilizer and attenuation in the tank, leaching field, and plume for septic nitrogen were not calibrated (Table11_Nitrogen_NonCalibratedParameters.csv in Barclay and Holland, 2024). Noncalibrated attenuation rates were based on rates used by Barclay and Mullaney (2021a) and Vaudrey and others (2016a).
Observations for Nitrogen Load Model Calibration
Three groups of observations were used to guide the model calibration process. Monthly nitrogen yields at short- and long-term stream data-collection sites provide snapshots of time-varying nitrogen outputs from watersheds with different characteristics. The annual ranges in nitrogen loads and nitrogen yields from long-term sites highlight the difference between the largest and smallest load during the year and help constrain the simulated monthly patterns. Finally, it was assumed that the inputs and attenuation rates varied smoothly through the year, without large spikes. This expectation was used as an additional type of observation.
Nitrogen Loads and Yields
Nitrogen loads and yields were compiled for 60 stream data-collection sites across the study area, as noted in “Nitrogen Data” above. Nitrogen yields for both short- and long-term sites and the annual range in nitrogen loads and yields at long-term sites were used in the calibration process. Except for annual ranges in nitrogen loads at long-term sites, nitrogen yields, rather than loads, were used in the calibration because loads are strongly correlated with watershed drainage area, which can obscure variations in the underlying processes.
Uncertainty in the nitrogen yields was estimated by using the interannual variation at the long-term sites. Across all long-term sites and months, the mean monthly nitrogen yield was correlated with the standard deviation in monthly nitrogen yield (Pearson’s product-moment correlation = 0.92). A regression equation was developed with the mean and standard deviations in monthly nitrogen yields at long-term sites and used to estimate the standard deviation at the short-term sites; these estimates assume that the observed values at the short-term sites were representative of the mean monthly yield at that site. The ensemble of nitrogen yield observations was generated as a normal distribution of values for each observation; the distribution uses the mean observed value as the mean and the estimated standard deviation. The ensemble of annual ranges in nitrogen yields was generated as a normal distribution using the mean annual range as the mean and 10 percent of the mean as the standard deviation. Ten percent was selected as a conservative estimate of both uncertainty and interannual variation in the observed nitrogen yields.
Holdout Observations
To better evaluate the ability of the nitrogen model to accurately simulate nitrogen loads, some of the nitrogen load observations were withheld from the calibration dataset. These “holdout” observations then provide an indication of model accuracy at new times or places. All observations were withheld from one site (USGS monitoring site 01208960, Sasco Brook at Southport, Conn.); this was a spatial holdout. All observations from January through March of 2012 and June through September of 2022 were withheld; this was a temporal holdout.
Local Minimum and Maximum
The monthly attenuation factors were expected to vary relatively smoothly from month to month. Preliminary calibration analyses resulted in anomalous peaks, likely due to limitations in the available observations. To constrain the calibrated values to the expected general pattern without constraining the specific pattern (for example, to constrain the values to increase and decrease across the months of the year without requiring a sinusoidal pattern), an observation was added specifying that only 1 local minimum and 1 local maximum occurred. This means that the calibrated monthly rates should be higher than both the preceding and the succeeding month (a local maximum) for no more than 1 month and that the calibrated monthly rates should be lower than both the preceding and succeeding month (a local minimum) for no more than 1 month. This observation was applied to the monthly attenuation factors. The value of the local minimum and maximum observations did not vary across the ensemble.
Calibration Results for the Nitrogen Load Model
As with the groundwater-flow model calibration, the nitrogen model calibration process involved generating simulated values for the observations by using the initial parameter ensemble, comparing the simulated values with the observation ensemble, and updating the entire ensemble of parameter values. To prevent overfitting, the nitrogen model calibration was terminated after the first parameter-update cycle. The updated ensemble of parameter values was trimmed to the better performing sets of parameter values based on the overall model performance. The final ensemble of parameter values contained 238 sets of parameter values.
With calibration, the median model-wide nitrogen yield residual across the ensemble for long-term observation sites decreased from 0.87 kilograms of nitrogen per square kilometer per year (kg-N/km2/yr) to 0.02 kg-N/km2/yr, and the median model-wide nitrogen yield residual across the ensemble for short-term observation sites decreased from 1.2 kg-N/km2/yr to −0.23 kg-N/km2/yr. The greatest improvement in the median model-wide nitrogen yield residual for long-term observation sites was during January, with a decrease from 4.05 kg-N/km2/yr to 0.28 kg-N/km2/yr. The greatest improvement in the median model-wide nitrogen yield residual for short-term observation sites was also during January, with a decrease from 2.85 kg-N/km2/yr to 0.13 kg-N/km2/yr.
Comparison of Observations and Simulated Equivalents
The simulated values of nitrogen yields agreed well with the observed values (fig. 13). Ninety percent of nitrogen yield observations in long-term sites had median residuals across all parameter sets between −1.16 and 0.76 kg-N/km2/yr, with a median of 0.03 kg-N/km2/yr; similarly, 90 percent of nitrogen yield observations in short-term sites had median residuals across all parameter sets between −1.52 and 0.61 kg-N/km2/yr, with a median of −0.29 kg-N/km2/yr. Among holdout observations that were not used in calibrating the model, 90 percent of holdout nitrogen yield observations from long-term sites had median residuals across all parameter sets between 0.03 and 2.2 kg-N/km2/yr, with a median of 0.39 kg-N/km2/yr; similarly, 90 percent of holdout nitrogen yield observations from short-term sites had median residuals across all parameter sets between 0.00 and 1.88 kg-N/km2/yr, with a median of 0.13 kg-N/km2/yr. The magnitude of simulated nitrogen yield residuals increased with increasing yields, but there was not a bias to overpredicting or underpredicting the yields (fig. 14).
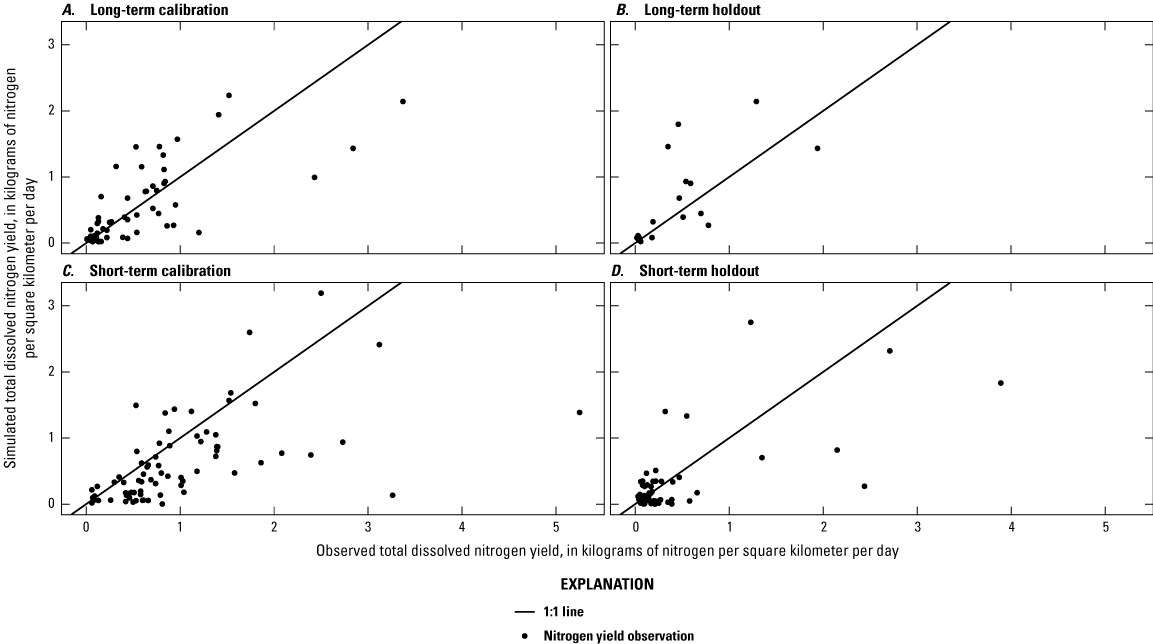
Graphs showing observed and simulated total dissolved nitrogen yield, north shore of Long Island Sound (coastal Connecticut and adjacent areas of New York and Rhode Island). A, Long-term calibration observations. B, Long-term holdout observations. C, Short-term calibration observations. D, Short-term holdout observations (Barclay and others, 2024).
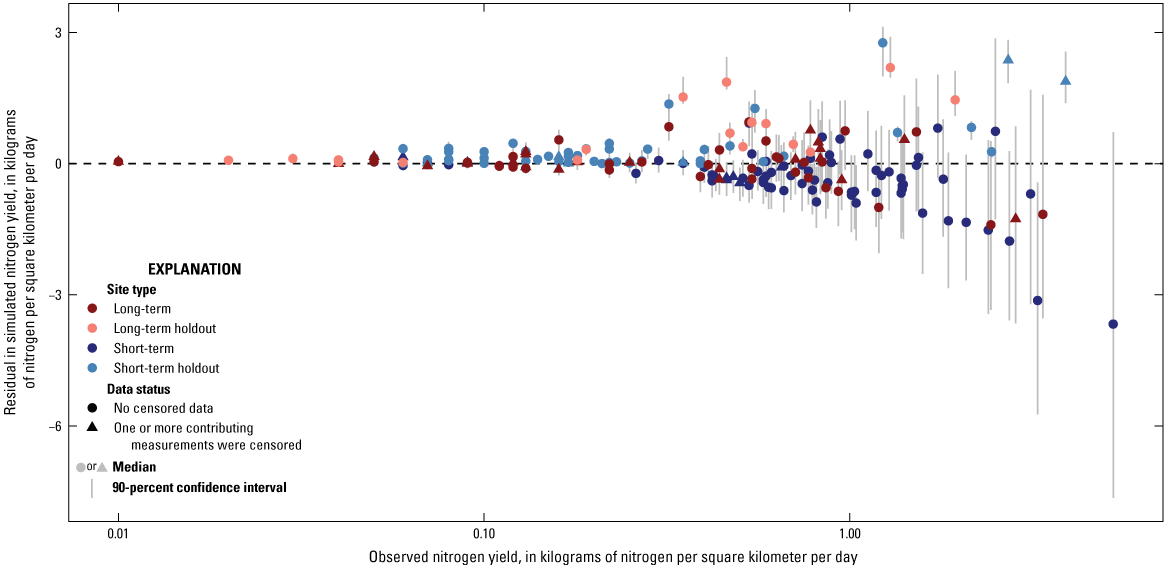
Graph showing residuals of simulated nitrogen yields compared to mean monthly observed yields, north shore of Long Island Sound (coastal Connecticut and adjacent areas of New York and Rhode Island). Points indicate the median and error bars indicate the 90-percent confidence interval based on 238 model runs (Barclay and others, 2024).
Nitrogen loads, which were not part of the model calibration, were also well simulated (fig. 15). Ninety percent of nitrogen load observations in long-term sites had median residuals across all parameter sets between −0.54 and 305 kg-N/yr, with a median of 10.1 kg-N/yr; similarly, 90 percent of nitrogen load observations in short-term sites had median residuals across all parameter sets between −0.70 and 50.0 kg-N/yr, with a median of 4.58 kg-N/yr.
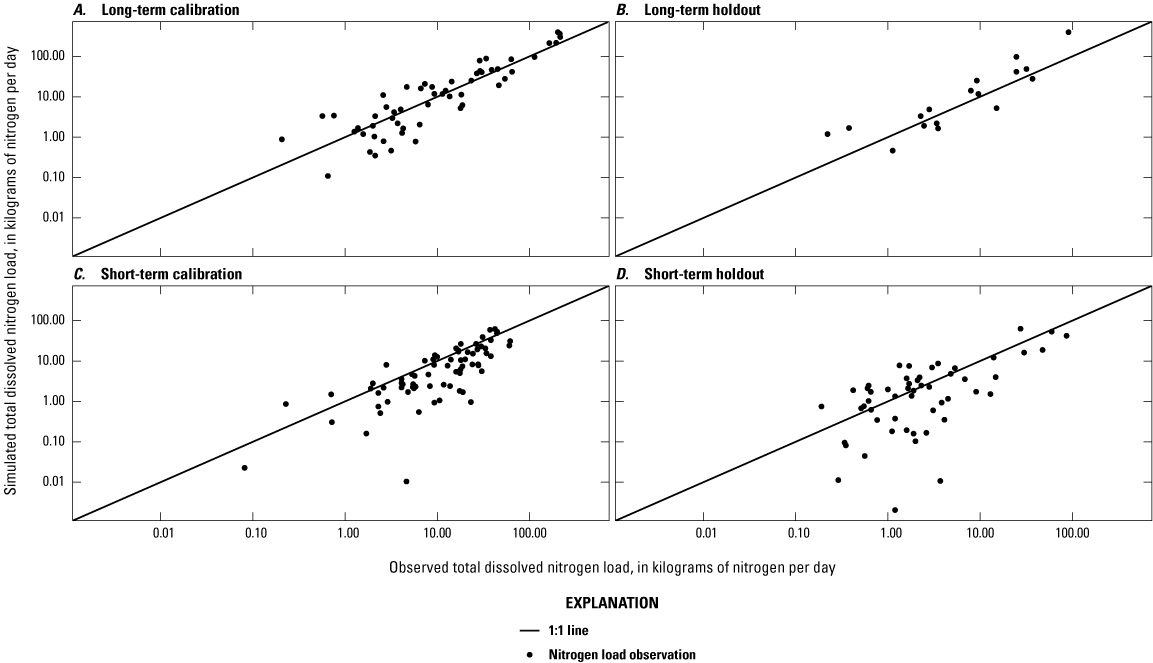
Graphs showing observed and simulated total dissolved nitrogen load, north shore of Long Island Sound (coastal Connecticut and adjacent areas of New York and Rhode Island). A, Long-term calibration observations. B, Long-term holdout observations. C, Short-term calibration observations. D, Short-term holdout observations (Barclay and others, 2024).
Simulation of Monthly Nitrogen Loads
Across the ensemble of simulated nitrogen loads, the median study-area-wide monthly simulated groundwater-transported nitrogen loads discharging to streams and Long Island Sound throughout the year ranged from 900 to 18,600 kilograms of nitrogen per day (kg-N/d), with a median load of 5,100 kg-N/d (fig. 16A). Loads of groundwater-transported nitrogen that were discharged directly to coastal waters ranged from 50.0 to 89.7 kg-N/d, with a median of 61.9 kg-N/d; loads discharged to streams and rivers downstream from the major tributary gages (Mullaney, 2023) ranged from 645 to 8,612 kg-N/d, with a median of 2,696 kg-N/d; and loads discharged to streams and rivers upstream from the major tributary gages ranged from 206 to 9,787 kg-N/d, with a median of 2,371 kg-N/d. Loads were highest during the winter and early spring and lowest during the late summer (fig. 16A). Groundwater travel times were longest during the late summer (fig. 17) because some areas did not contribute to summer discharge and because groundwater flowed slowly from the remaining areas, likely as a result of low groundwater levels that led to decreased groundwater-level gradients (fig. 12 in Barclay and Holland, 2024). This seasonal pattern in groundwater travel times indicates that summer loads respond more slowly to changes in nitrogen inputs than winter loads. Over the entire study area, approximately 15 percent of the simulated load at the HUC12 outlets is from atmospheric deposition sources, 30 to 40 percent is from fertilizer, and 50 to 60 percent is from septic systems (fig. 16B).
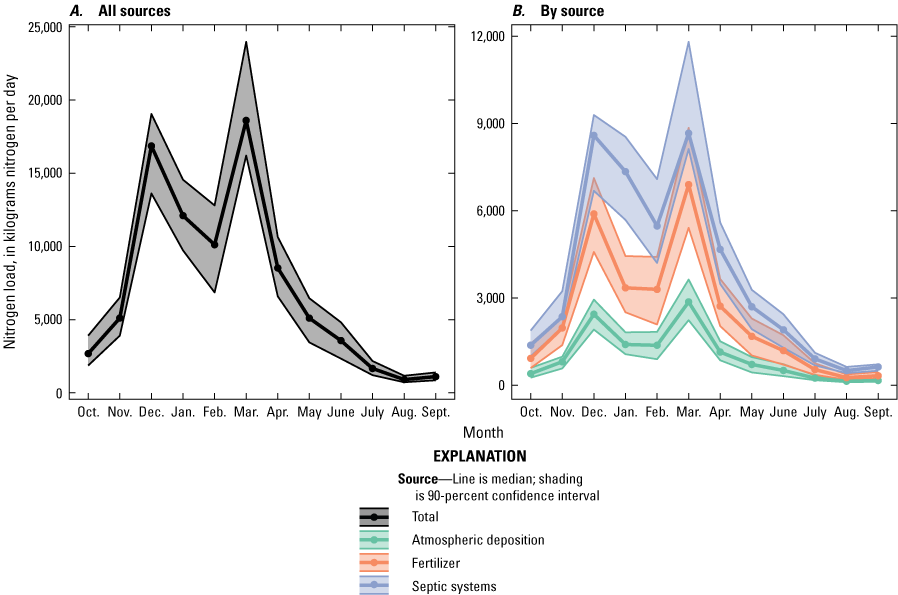
Graphs showing simulated monthly groundwater-transported total dissolved nitrogen load at the 12-digit hydrologic unit code (HUC12) outlets A, from all sources and B, by source, north shore of Long Island Sound (coastal Connecticut and adjacent areas of New York and Rhode Island) based on 238 model runs (Barclay and Holland, 2024; Barclay and others, 2024).
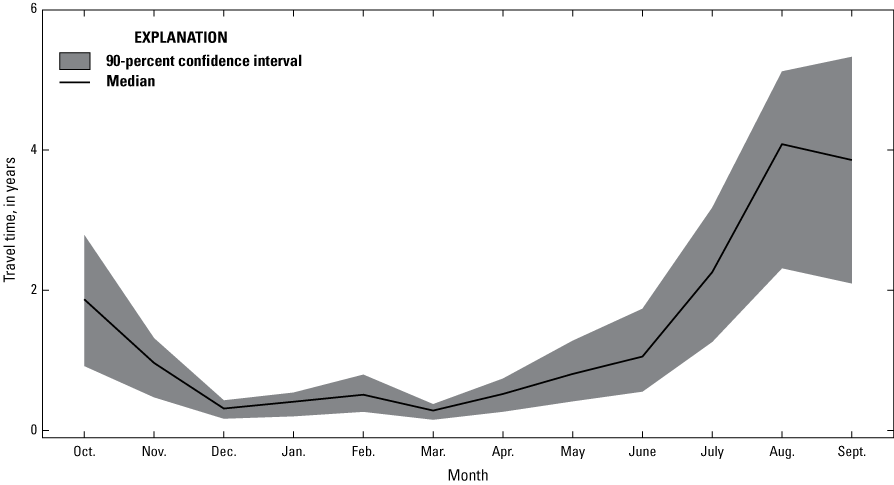
Graph showing simulated groundwater-transported nitrogen travel time by month of discharge, north shore of Long Island Sound (coastal Connecticut and adjacent areas of New York and Rhode Island) based on 238 model runs (Barclay and Holland, 2024; Barclay and others, 2024).
Overall nitrogen removal rates between the land surface and discharge to surface water were higher in watersheds where the surficial geology was dominated by “thin glacial till” than where dominated by “stratified glacial sediments—high conductivity.” The most abundant surficial sediment type in each watershed was either “thin glacial till” or “stratified glacial sediments—high conductivity.” Within watersheds dominated by “thin glacial till,” overall nitrogen removal rates ranged from 92.0 to 96.4 percent for nitrogen from atmospheric deposition, from 84.5 to 92.3 percent for nitrogen from fertilizer, and from 58.0 to 61.7 percent for nitrogen from septic systems (fig. 18). Within watersheds dominated by “stratified glacial sediments—high conductivity,” overall nitrogen removal rates ranged from 78.8 to 88.5 percent for nitrogen from atmospheric deposition, from 57.1 to 76.4 percent for nitrogen from fertilizer, and from 26.9 to 34.6 percent for nitrogen from septic systems. Rates do not include attenuation in the river channel (zone 5) because calculations of river-channel removal are dependent upon the downstream point of interest, such as a watershed outlet, surface-water monitoring station, or Long Island Sound. Removal rates are higher for nitrogen from atmospheric deposition and fertilizer sources than for nitrogen from septic systems because the estimates of atmospheric deposition and fertilizer nitrogen include removal by plants, whereas the septic system nitrogen is ideally discharged below the rooting zone of plants.
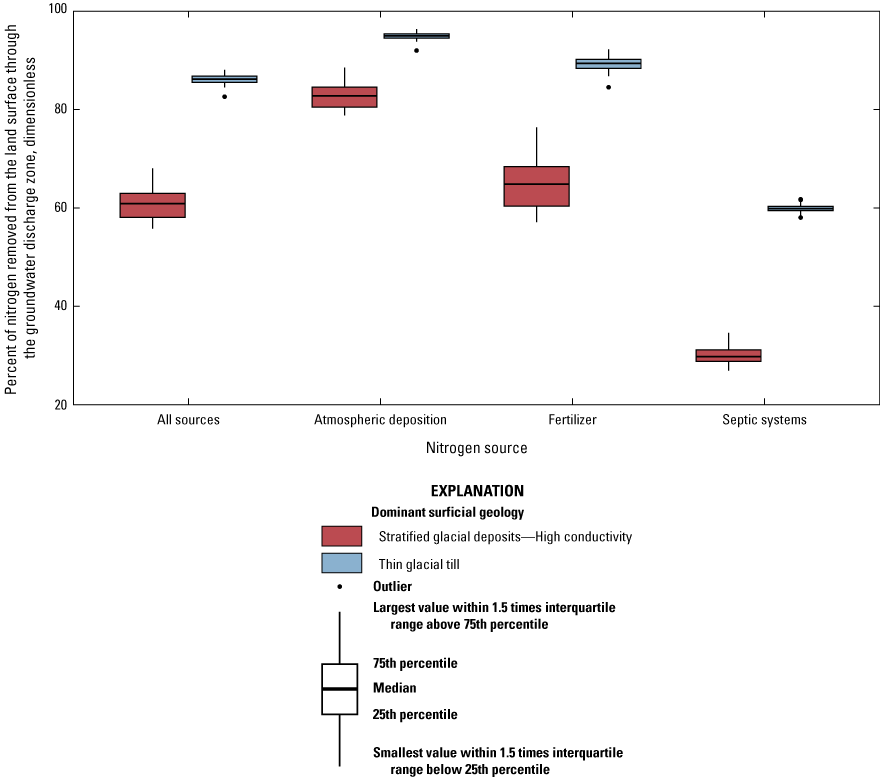
Boxplots showing fraction of nitrogen removed between the land surface, including plant uptake, and discharge to surface water, by source of the nitrogen and dominant surficial geology within the 12-digit hydrologic unit code (HUC12) watershed. Removal within the river channel is not included here because that depends upon the specific downstream point of interest. Results are based on 238 model runs (Barclay and Holland, 2024).
Nitrogen yields varied substantially across the study area. The median annual yield of groundwater-transported nitrogen from all sources by HUC12 watershed across the ensemble of model runs ranged from less than 5 kg-N/km2/yr to more than 900 kg-N/km2/yr, with a median yield of 268 kg-N/km2/yr (fig. 19). At the monthly timescale, yields were similarly variable (fig. 20; Table12_Simulated_Annual_Nitrogen_Loads_Yields_by_HUC.csv in Barclay and Holland, 2024). Median monthly yields were lowest in August, ranging from less than 0.01 kg-N/km2/d to 0.49 kg-N/km2/d, with a median of 0.058 kg-N/km2/d across all the HUC12 watersheds. Median monthly yields were highest in March, ranging from 0.025 kg-N/km2/d to 6.4 kg-N/km2/d, with a median of 1.9 kg-N/km2/d across all the HUC12 watersheds.
Yields were correlated with mean monthly recharge across the study area (rho=0.68, r≤0.05), the density of residents using septic systems (rho=0.22, r≤0.05), and the extent of coarse stratified sediment (rho=0.35, r≤0.05). Yields were inversely correlated with the extent of glacial till (rho= −0.32, r≤0.05). In areas without septic systems, the yields were also correlated with the extent of turf-grass land cover (rho=0.38, r≤0.05) and the extent of agricultural land cover (rho=0.33, r≤0.05). These correlations are indicative of the processes controlling the simulated yields. Groundwater recharge and sediment properties affect rates of nitrogen transport through the subsurface. The density of residents using septic systems and the extent of turf-grass or agricultural land cover are associated with nitrogen inputs. Sediment properties are associated with rates of nitrogen attenuation.
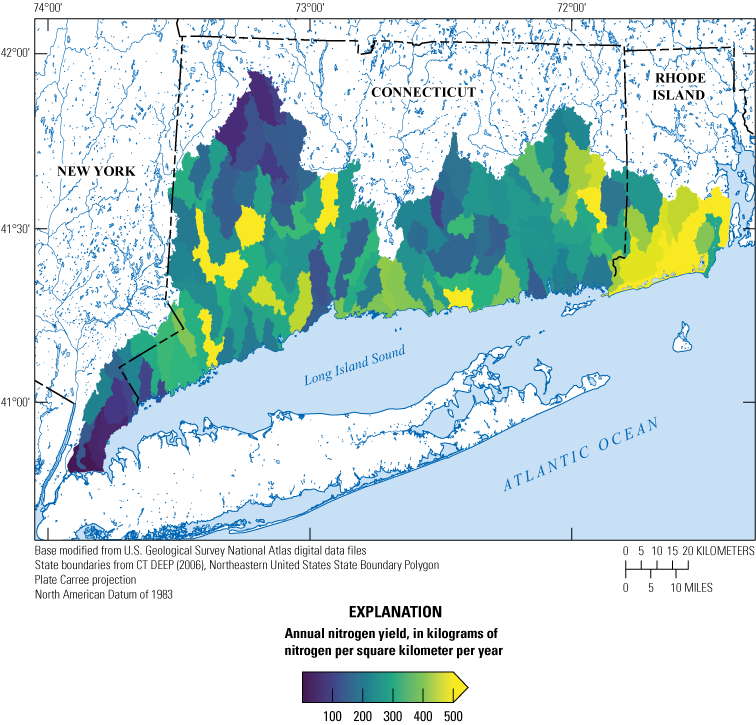
Map showing annual groundwater-transported nitrogen yield from all sources, by 12-digit hydrologic unit code watersheds, north shore of Long Island Sound (coastal Connecticut and adjacent areas of New York and Rhode Island) (Barclay and Holland, 2024; Barclay and others, 2024). Watersheds with yields greater than 500 kilograms of nitrogen per square kilometer per year are shown in yellow, regardless of the magnitude of the yield. CT DEEP, Connecticut Department of Energy and Environmental Protection.
The relative importance of the different nitrogen sources varied substantially across the study area (fig. 20). For example, in Susquetonscut Brook (HUC12 011000030102; map number 83 in fig. 2), fertilizer sources dominate the groundwater nitrogen load. In contrast, in Falls River (HUC12 010802050904; map number 71 in fig. 2), the groundwater nitrogen load is dominated by septic system sources. In other areas, such as the outlet of the Shepaug River (HUC12 011000050703; map number 25 in fig. 2) or the Weekeepeemee River (HUC12 011000050902; map number 29 in fig. 2), the magnitudes of the fertilizer and septic system contributions to the groundwater nitrogen load are similar. In most HUC12 watersheds, either septic systems or both septic systems and fertilizers were the major sources of nitrogen to the annual groundwater-transported nitrogen load (fig. 21). In this study, major sources were defined as those that contributed 33 percent or more of the annual load.
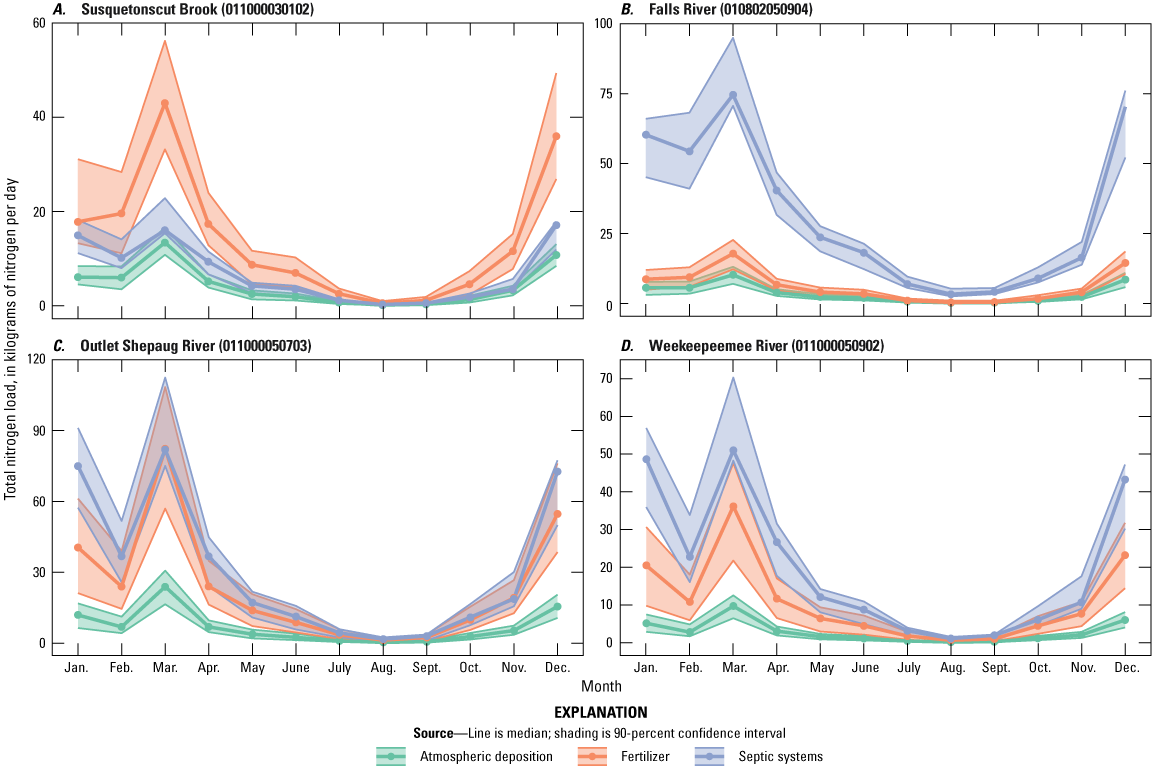
Graphs showing simulated monthly groundwater-transported total dissolved nitrogen load at the 12-digit hydrologic unit code (HUC12) outlets, by source, for four example 12-digit hydrologic unit code watersheds, north shore of Long Island Sound (coastal Connecticut and adjacent areas of New York and Rhode Island). A, Susquetonscut Brook. B, Falls River. C, Outlet Shepaug River. D, Weekeepeemee River (Barclay and Holland, 2024; Barclay and others, 2024). Results are based on 238 model runs.
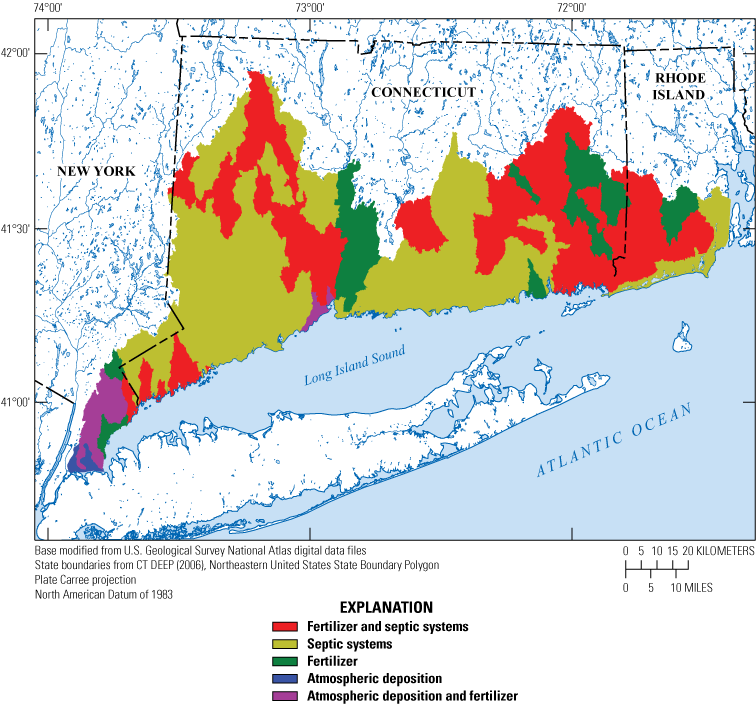
Map showing major sources of groundwater-transported nitrogen, by 12-digit hydrologic unit code watersheds, north shore of Long Island Sound (coastal Connecticut and adjacent areas of New York and Rhode Island). Major sources contribute 33 percent or more of the annual groundwater nitrogen load based on 238 model runs (Barclay and Holland, 2024). CT DEEP, Connecticut Department of Energy and Environmental Protection.
Comparisons With Other Studies
Using a regression analysis, Mullaney and Schwarz (2013) estimated annual nitrogen loads from unmonitored areas of Connecticut. That study estimated an annual load of 2.6 million kg-N/yr from sources other than wastewater treatment plants; for comparison, the current study estimated 1.8 million kg-N/yr for a similar area (fig. 22). One important difference between the studies is that Mullaney and Schwarz did not distinguish between surface and subsurface transport, whereas the current study included only groundwater-transported sources and would be expected to be lower.
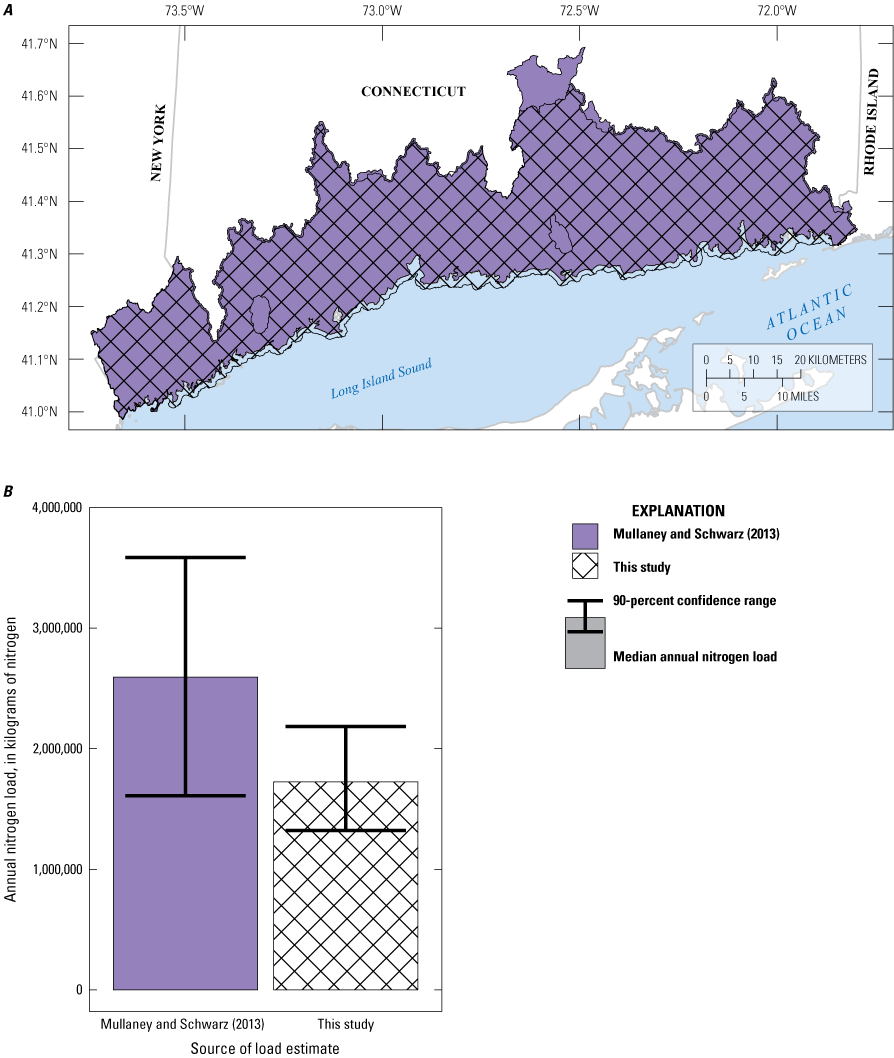
A, Map and B, graph comparing prior work estimating loads in unmonitored areas of the watershed by Mullaney and Schwarz (2013) with the estimates from this study (Barclay and others, 2024). Shading and hash marks on the map indicate the area included in the corresponding bars on the graph.
Multiple studies have estimated tributary-transported nitrogen loads based on measured stream discharge and nitrogen concentration at USGS gages (Mullaney, 2016, 2023; Mullaney and others, 2002; Mullaney and Schwarz, 2013; Trench and others, 2012). Two of those gages (USGS site 01195100, Indian River near Clinton, Conn., and USGS site 01208950 Sasco Brook near Southport, Conn.) are within the study area for this project and provide useful comparisons. The most recent estimates of nitrogen loads at Indian River and Sasco Brook (Mullaney, 2023) are similar to the loads estimated by this study (fig. 23). As with the load estimates for unmonitored areas, the loads estimated by Mullaney (2023) do not distinguish between nitrogen that reaches the stream by surface and subsurface transport and would therefore be expected to be larger than the loads estimated by this study.
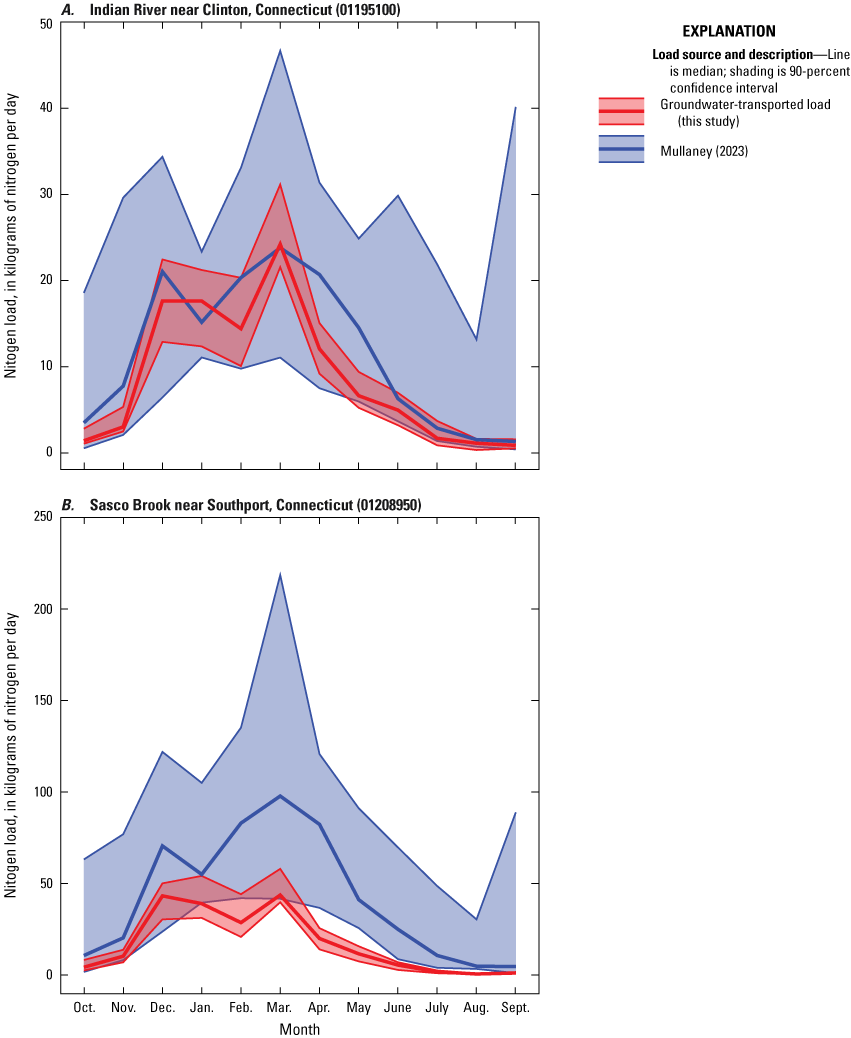
A, B, Graphs showing simulated monthly nitrogen loads, with uncertainty, from this study (Barclay and others, 2024) and from the most recent analysis of tributary loads (Mullaney, 2023) for two streamflow gages in coastal Connecticut. The loads compiled by Mullaney (2023) include both surface and subsurface (groundwater) transport of nitrogen; the loads compiled for this study include only groundwater-transported nitrogen. Note that for comparison with the results of Mullaney (2023), only a portion of the study area for this study is shown, and therefore the values should be less than what are shown in figure 16 for the whole study area.
Current estimates of nitrogen loads to Long Island Sound from Connecticut are based on estimates from 17 selected tributaries (Mullaney, 2023). The total estimated nitrogen load from these tributaries, in combination with the results from this study, can indicate the relative importance of groundwater-transported loads from coastal areas as compared to the load from the selected tributaries. Based on the most recent estimates (Mullaney, 2023), the load from the selected tributaries is 4 to 23 times larger, depending upon the month, than the groundwater-transported load from coastal areas, indicating that groundwater-transported nitrogen in coastal areas is a relatively small component of the overall Long Island Sound nitrogen budget (fig. 24). Because the selected tributaries discharge to Long Island Sound at discrete points, in many areas of the shoreline of Long Island Sound, particularly in embayments and coves that do not readily mix with Long Island Sound, groundwater-transported nitrogen is likely a larger component of the local load.
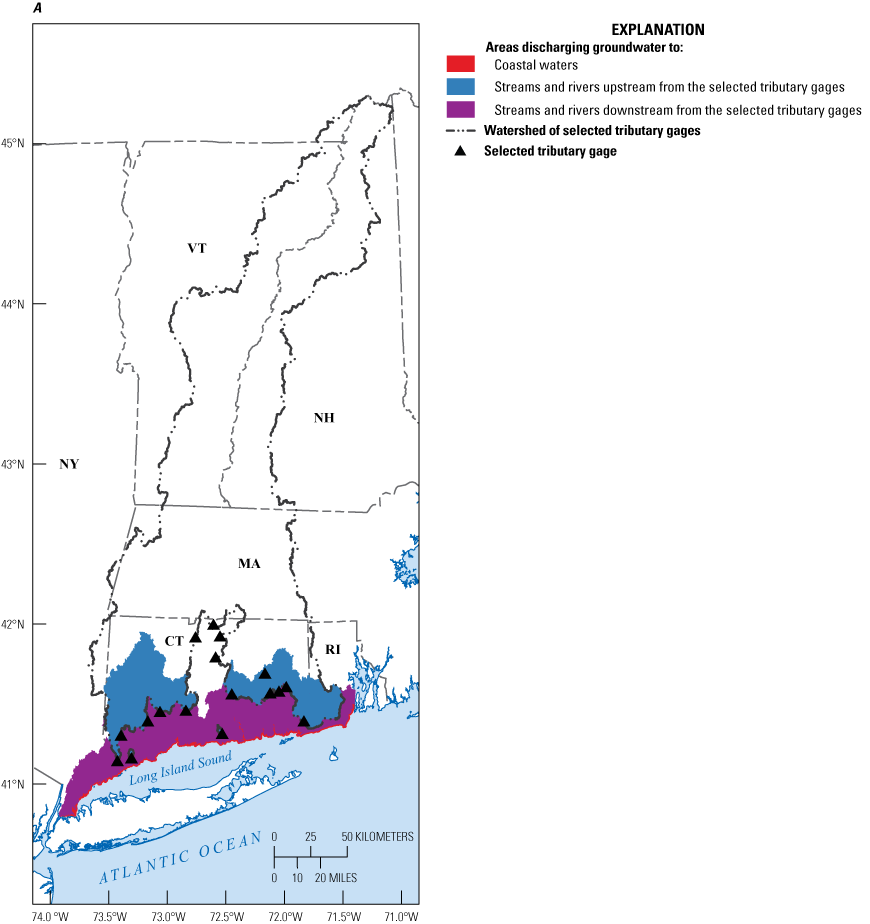
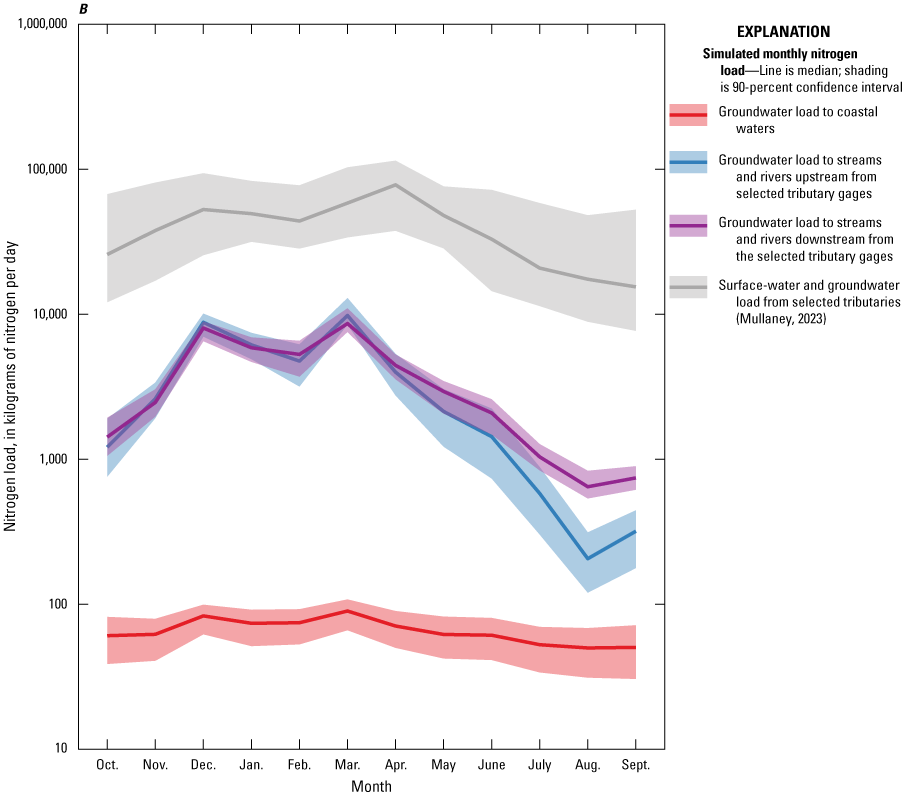
A, Map of simulation coverage indicating source areas for groundwater discharging (1) directly to coastal waters, (2) upstream from the selected tributary gages, and (3) downstream from the selected tributary gages and B, graph of simulated monthly nitrogen loads from selected tributaries from Mullaney (2023) and simulated groundwater-transported nitrogen loads for coastal Connecticut from this study (Barclay and Holland, 2024). The loads compiled by Mullaney (2023) include both surface and subsurface (groundwater) transport of nitrogen; the loads compiled for this study include only groundwater-transported nitrogen. Colors on the map indicate the source areas for the loads on the graph.
Limitations of Nitrogen Transport Analysis
The nitrogen load model was developed and calibrated by using measured nitrogen loads and yields in surface water under base-flow conditions. Observations of surface-water nitrogen loads are more abundant than direct measures of nitrogen flux in groundwater, and they provide an aggregated perspective of groundwater-transported nitrogen loads that may be more representative of regional patterns than direct measures of groundwater nitrogen flux. Groundwater aquifers have complex porosity patterns and are temporally and spatially heterogeneous. This creates challenges in determining how representative an observation of nitrogen flux from a monitoring well within the aquifer is of broader regional patterns. Direct measurements of nitrogen loading in discharging groundwater present similar challenges; preferential flow paths and heterogeneous conditions create substantial variations in measured nitrogen loads over tens of meters (Moore and others, 2023). Because measurements of surface-water nitrogen loads aggregate nitrogen from the entire watershed of the measurement point, the challenges of aquifer heterogeneity are avoided, but new challenges and assumptions are introduced.
Determining Base-Flow Conditions
Stream discharge is commonly conceptualized as having two components: quickflow, which increases and decreases quickly in response to storms, and base flow, which changes more slowly and sustains streamflow during the periods between storms. Base-flow separation techniques, such as RORA (Rutledge, 1998), PART (Rutledge, 1998) or BFI (Gustard and others, 1992), can be used to estimate the fractions of streamflow from quickflow and base flow. In this study, it was assumed that surface-water nitrogen loads under base-flow conditions (defined in this study as when the streamflow was 75 percent or more base flow) were groundwater-transported nitrogen loads. Often, base flow is assumed to be predominantly sourced from groundwater, but other processes that store water and slowly release it, such as reservoirs, snowpack, or wetlands, also contribute to base flow. None of the observation locations are below large reservoirs. In most years, the snowpack in the study area is not substantial but does contribute some water, and wetlands are abundant in some parts of the study area. In addition, base-flow separation techniques can only be applied to time series of streamflow; they cannot be used at sites lacking continuous streamflow measurements. Most of the nitrogen observation sites used in this study do not have continuous streamflow monitoring equipment. At these sites, the determination of base-flow conditions was made on the basis of nearby streamflow gages, which introduced additional uncertainty in the classification.
Errors in the classification of an observation as being collected under base-flow conditions or in the assumption that observed surface-water nitrogen loads were groundwater transported would result in larger observed groundwater-transported nitrogen loads than the actual groundwater-transported nitrogen loads because non-groundwater-transported nitrogen would be attributed to groundwater discharge. This error would likely have two effects. First, observed loads that are biased high would push the model, through the calibration process, to match those loads, resulting in simulated nitrogen loads that are higher than the actual loads. Second, even after calibration, the simulated loads may not match the erroneously high observed loads, resulting in greater errors between the simulated and observed groundwater nitrogen loads.
Calibrating to Outlet Loads
Observations of streamflow nitrogen loads aggregate nitrogen from the entire watershed of the sampling point. This prevents the challenges of determining the representativeness of a sample from an individual well, but it allows for the comparison only of outputs. Each nitrogen observation site aggregates nitrogen from a different combination of nitrogen sources and hydrogeologic conditions, which provides some resolution to the attenuation rates along the flow path but provides no comparison observations of nitrogen loads along the flow paths between the land surface and the surface-water sampling point. This means that though the simulated nitrogen loads are robust, and, given the estimated nitrogen inputs, the aggregated attenuation rates are robust, the specific attenuation rates for each zone and geologic context are much more uncertain.
Data-Availability and -Quality Limitations
Because the nitrogen load model is dependent upon observations of streamflow nitrogen loads for calibration, it is limited by the availability and quality of available nitrogen load observations. Because of the filtering criteria needed to determine that observations were representative of groundwater-transported nitrogen, only five sites were available with long-term data for representing monthly patterns. Nitrogen load observations were collected at 45 sites across the study area in support of this modeling effort, but delays in sample analysis increased the uncertainty in those observations (Barclay and others, 2023; Table5_ObservedNitrogenLoads.csv in Barclay and Holland, 2024). The extended holding times primarily affected the short-term site observations because (1) most of the affected samples were at short-term sites and (2) in most cases the only data at the short-term sites were affected, whereas long-term sites had multiple years of data. The good model calibration to data from the long-term sites, which were not so much affected by the holding time exceedances, lends confidence to the quality of the nitrogen data overall. Simulated groundwater-transported nitrogen loads in watersheds distant from or with conditions different from those of the observation sites have greater uncertainty than those closer or more similar to the calibration observations.
Nitrogen Management Scenarios
To guide management of groundwater-transported nitrogen, two sets of scenarios were simulated. The first focused on upgrades to septic systems and the second on nitrogen inputs from turf-grass fertilizer. In both cases, a gradient of inputs (due to upgrades to septic systems or changes in fertilizer use) was simulated. Because decisions about septic system upgrades or fertilizer use are typically made by individual landowners or residents, changes to existing inputs were randomly distributed across the model domain.
Septic System Upgrades
With traditional septic systems, typically 20 percent or less (Oakley and others, 2010; Valiela and others, 1997) of the nitrogen is removed in the tank and leach field. Enhanced systems, which are designed to remove nitrogen through denitrification, can remove more than 70 percent of the nitrogen inputs (Oakley and others, 2010). In this study, it was assumed that all septic systems were traditional systems. In this set of scenarios, for each of five levels of adoption (0 percent, 25 percent, 50 percent, 75 percent, and 100 percent), randomly selected subsets of model cells with septic systems within each HUC12 watershed were upgraded to enhanced systems with removal rates of 70 percent in the tank. For example, in the 50-percent scenario, 50 percent of the residents with septic systems in each HUC12 watershed upgraded their system. Each scenario was tested by using 50 different sets of model parameters from the final ensemble of 238 parameter sets. Uncertainty is represented as 50- and 90-percent confidence bands around the median of the 50 model runs.
Reduced Turf-Grass Fertilizer Applications
In this set of scenarios, fertilizer applications to turf grass were reduced by up to 100. For each of five levels of adoption (0 percent, 25 percent, 50 percent, 75 percent, and 100 percent), a randomly selected subset of model cells within each HUC12 watershed with turf-grass fertilizer applications had decreased fertilizer inputs. For each scenario, fertilizer inputs were reduced by the same percentage in all selected cells, with reductions of 25 percent, 50 percent, 75 percent, and 100 percent. In total, 20 scenarios were tested. Each scenario was tested by using 50 different sets of model parameters from the final ensemble of 238 parameter sets. Uncertainty is represented as 50-percent confidence bands around the median of the 50 model runs.
Nitrogen Load Reductions From Management
Reducing nitrogen inputs to the groundwater system, either by upgrading septic systems or reducing fertilizer application rates, reduces nitrogen in discharging groundwater once the groundwater reaches a new steady-state condition (fig. 25). Because the number of septic systems and the current fertilizer application rates vary by basin, the magnitude of the reduction primarily depends upon how many septic systems are upgraded (fig. 26) or the extent and degree of reductions in fertilizer applications (fig. 27), and the total number of septic systems or the extent of turf grass within the watershed. Surficial geology is a secondary control on the magnitude of the reduction; reductions are slightly greater in watersheds dominated by coarse stratified sediments than by glacial till because of lower attenuation, and therefore greater base loads, in coarse stratified sediments than in glacial till (fig. 18). Uncertainty in the resulting nitrogen loads under the different scenarios is primarily due to uncertainty in the nitrogen model parameters, as well as uncertainty in the groundwater-flow model parameters and randomness in where the management actions were implemented.
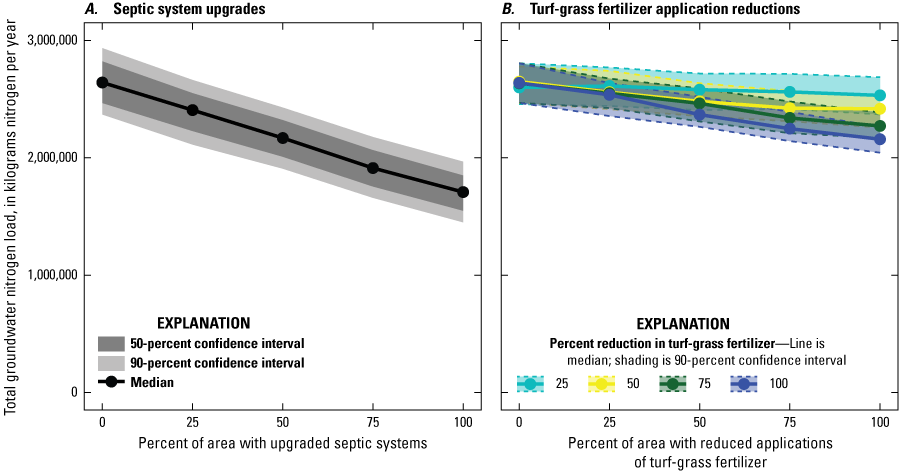
Graphs showing simulated groundwater-transported nitrogen load from A, septic systems and B, fertilizers with different management scenarios (Barclay and Holland, 2024; Barclay and others, 2024). Fertilizer loads include nitrogen from both agricultural and turf-grass fertilizer, but the simulated management scenarios focused only on reductions in turf-grass fertilizer. Agricultural inputs were left unchanged. Results are based on 50 model runs for each scenario.
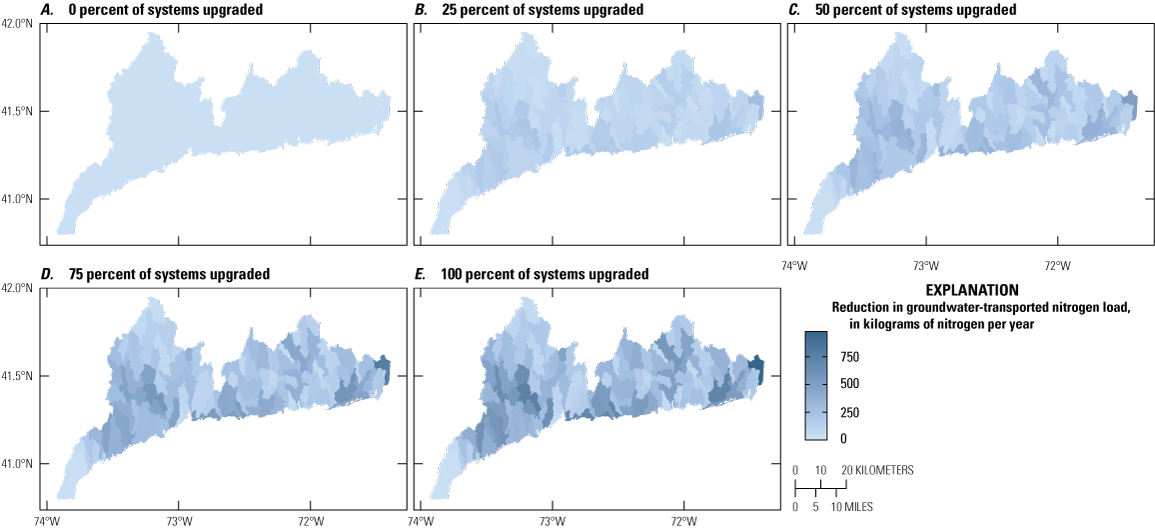
Maps showing reduction in nitrogen load in response to upgrading septic systems in watersheds on the north shore of Long Island Sound (coastal Connecticut and adjacent areas of New York and Rhode Island) (Barclay and Holland, 2024). Scenarios are A, 0 percent, B, 25 percent, C, 50 percent, D, 75 percent, and E, 100 percent of systems upgraded. Results are based on the median load reduction over 50 model runs for each scenario.
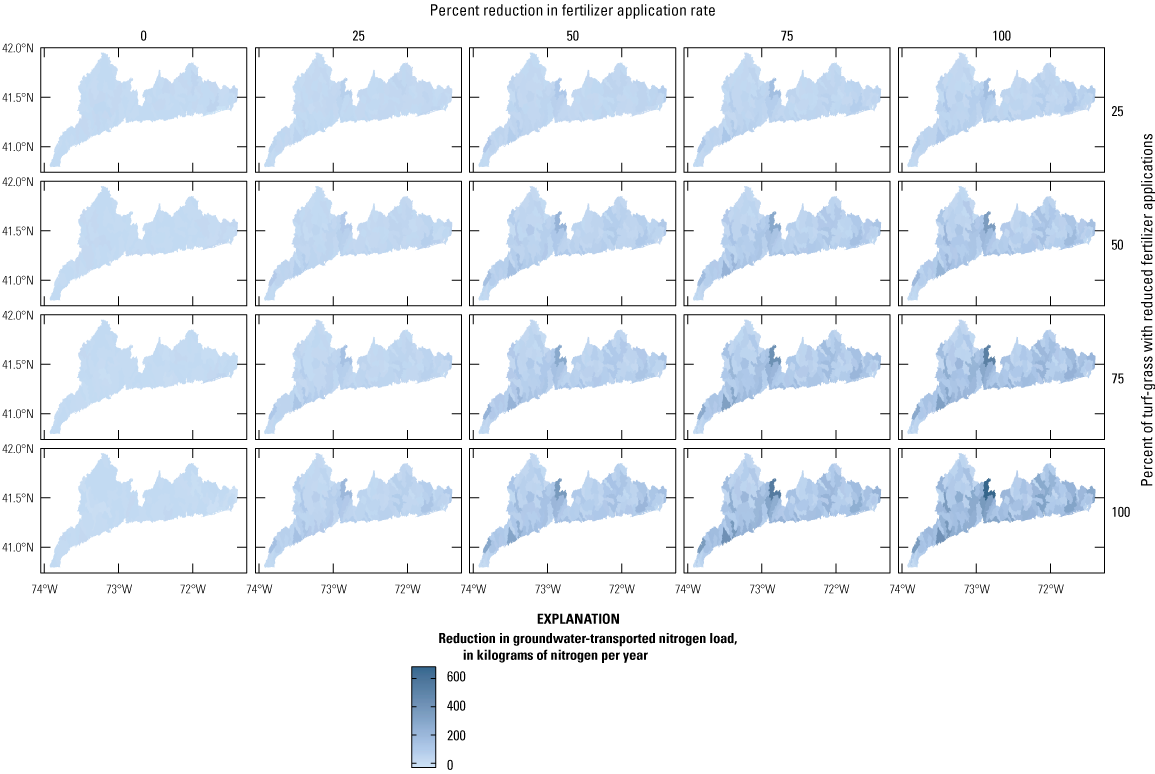
Maps showing reduction in nitrogen load in response to reducing fertilizer application to turf grass in watersheds on the north shore of Long Island Sound (coastal Connecticut and adjacent areas of New York and Rhode Island) (Barclay and Holland, 2024). Results are based on the median load reduction over 50 model runs for each scenario.
Multiple factors control the delay between when management actions are implemented and when changes in the resulting groundwater-transported nitrogen load to downstream waters will be evident. Important factors include nitrogen storage in unsaturated upland soils and riparian sediments and transport delays through groundwater system (Ascott and others, 2021; Meals and others, 2010; Van Meter and others, 2016). This study only considers the delay due to transport through the shallow groundwater system; storage in the soil and surface-water network are not quantified.
Because groundwater travel times vary throughout the year (fig. 17), the groundwater-transport component of the delay between management actions and decreased nitrogen loads varies throughout the year (fig. 28). At all times of year, the groundwater load to surface waters responds relatively quickly to decreases in the inputs to the water table, with almost 50 percent of the overall decrease after 1 year. The response is slower in the late summer than in the late winter, however. For example, only 38 percent of the reduction in August septic loads occurs in the first year, as compared to 97 percent of the reduction in December loads. Spatial variation in the response time is also substantial, with coastal areas tending to have longer times to reduced loads than inland areas (fig. 29).
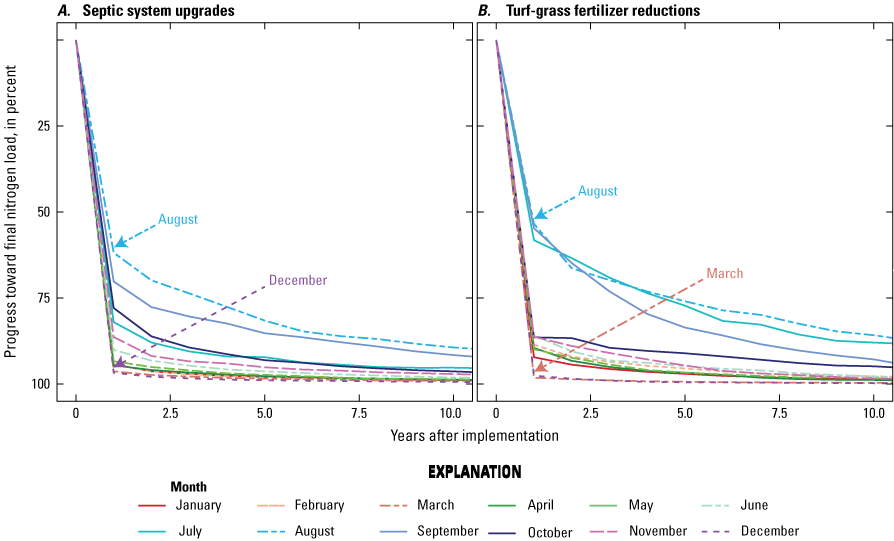
Graphs showing timeline of simulated nitrogen load reductions by month for A, upgrading 50 percent of septic systems and B, reducing fertilizer application by 50 percent to 50 percent of land with turf grass (Barclay and Holland, 2024; Barclay and others, 2024). Lines show the median and are based on 50 model runs for each scenario.
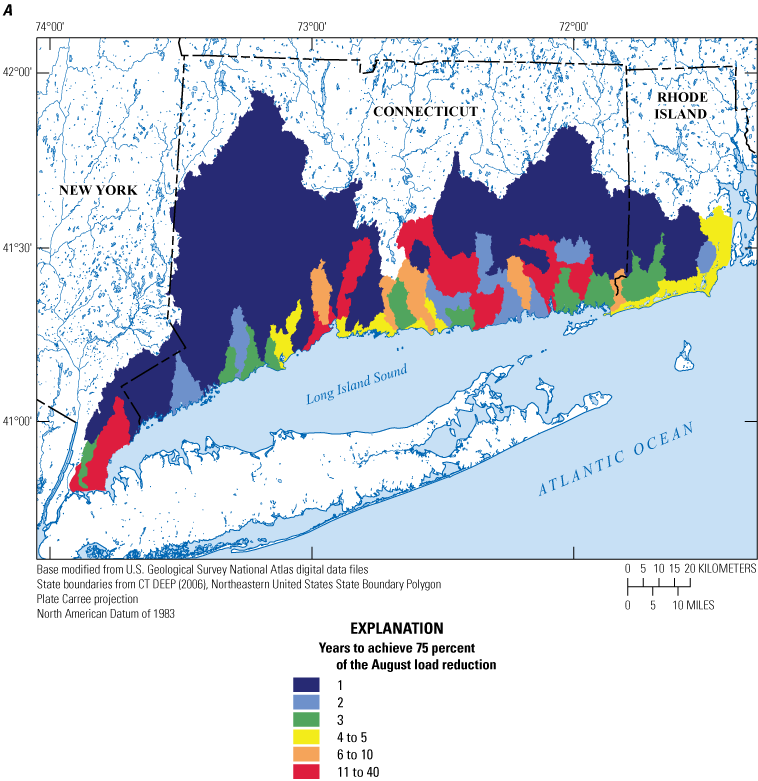
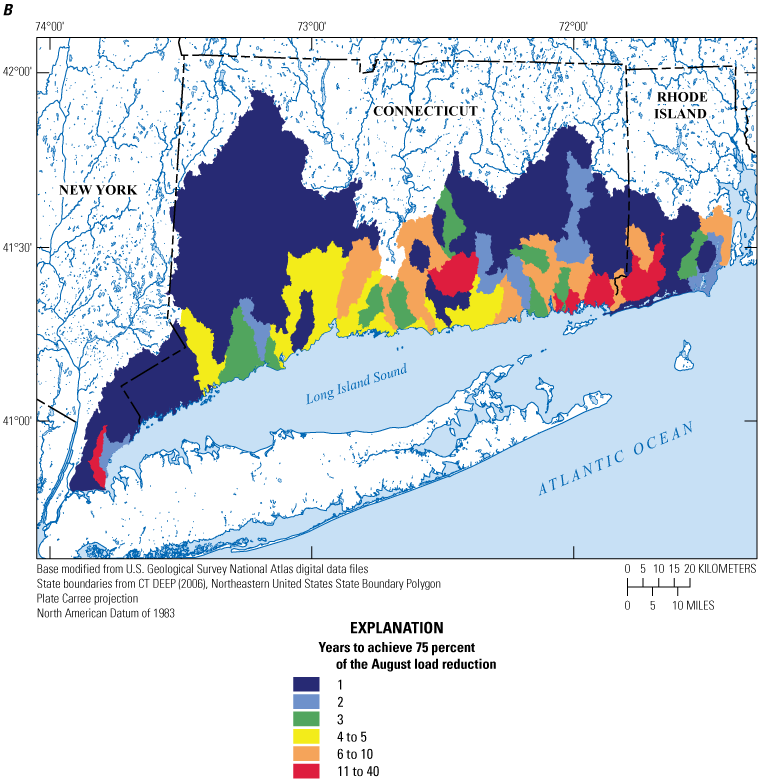
Maps showing time to reduce August nitrogen loads by 75 percent of the final reductions of loads from A, septic systems and B, fertilizers with different management scenarios (Barclay and Holland, 2024). Fertilizer loads include nitrogen from both agricultural and turf-grass fertilizer, but the simulated management scenarios focused only on reductions in turf-grass fertilizer. Agricultural inputs were left unchanged. Results are based on 50 model runs for each scenario. CT DEEP, Connecticut Department of Energy and Environmental Protection.
Summary
Elevated nitrogen loads are pervasive in the Long Island Sound, a saltwater estuary that receives freshwater and nutrients from both surface-water and groundwater discharge. Surface-water nitrogen loads to the Long Island Sound are relatively well characterized, but less is known about groundwater-transported nitrogen loads. Prior work on the northern shore of Long Island Sound (Connecticut and areas of New York and Rhode Island) suggested that groundwater travel times are relatively short (median less than 2 years) and that decade-long nutrient legacies are not widespread. Because the travel times are short, groundwater discharge and nutrient loads likely vary substantially between months. In the current study, the U.S. Geological Survey, in cooperation with the U.S. Environmental Protection Agency’s Long Island Sound Study and the Connecticut Department of Energy and Environmental Protection, developed a soil-water-balance model and a monthly MODFLOW groundwater-flow model coupled with a nitrogen transport simulation to better characterize spatial and temporal patterns of groundwater-transported nitrogen loading from atmospheric deposition, septic systems, and fertilizers within the study area.
The modeling workflow involved four models. (1) A soil-water-balance model was developed using the Soil-Water-Balance (SWB) software to simulate groundwater recharge across the study area for water years 2005 through 2022. The SWB model was calibrated to annual base flow at 14 streamflow gages within the study area with a simple grid-search approach. The simulated recharge from the SWB model was used as an input into the groundwater-flow model. (2) The groundwater-flow model was developed by using the MODFLOW 6 software and simulates average monthly hydrologic conditions for water years 1993 through 2022. The groundwater-flow model was calibrated by using the Iterative Ensemble Smoother method within the PEST++ software. The Iterative Ensemble Smoother method generates an ensemble of sets of parameter values, with each set producing reasonable simulated values. The groundwater-flow model was calibrated by using mean monthly base-flow discharge at 14 streamflow gages and mean monthly groundwater levels from 66 monitoring wells in the study area. (3) Next an ensemble of MODPATH particle-tracking simulations were run to generate particle flow paths and travel times, with each simulation using a different set of the flow model parameters. (4) Finally, a nitrogen load model uses the MODPATH simulation outputs to track nitrogen from the land surface through multiple attenuation zones until it discharges into fresh or saline surface water. As with the groundwater-flow model, the nitrogen model simulated average monthly groundwater-transported nitrogen loads for water years 1993 through 2022. The nitrogen model was calibrated with the Iterative Ensemble Smoother option within the PEST++ software by using observed nitrogen loads at 60 locations in the study area.
The annual mean net infiltration simulated by the SWB model ranged from 33.3 centimeters (water year 2016) to 77.2 centimeters (water year 2006), with a mean of 52.3 centimeters. After further refinement in the calibration of the groundwater-flow model, the estimated mean annual recharge ranged from 47 centimeters to 64 centimeters, with a median of 55 centimeters, across all model parameter sets.
Across all seasons, natural recharge from precipitation is the largest source of water to the groundwater system, and the largest rates of natural recharge are during the winter months. Across the entire study area, septic return flows are a small fraction of the groundwater budget, but they may be locally important in areas with a high concentration of septic systems. During the cold season of December through April, the largest fluxes of water out of the groundwater system are to wetlands, streams, and rivers. During the summer growing season, groundwater evapotranspiration becomes the dominant flux of water out of the groundwater. Groundwater storage increases from November through April and decreases from May through October.
Across the ensemble of simulated nitrogen loads, the median study-area-wide monthly simulated nitrogen loads throughout the year ranged from 900 to 18,600 kilograms of nitrogen per day, with a median load of 5,100 kilograms of nitrogen per day. Loads were highest during the winter and early spring and lowest during the late summer. Groundwater travel times were longer during the late summer. This indicates that summer loads respond more slowly to changes in nitrogen inputs than winter loads. Over the entire study area, approximately 15 percent of the simulated load is from atmospheric deposition sources, 30 to 40 percent is from fertilizer, and 50 to 60 percent is from septic systems.
The final analysis of the study involved simulating the change in groundwater-transported nitrogen load in response to (1) upgrading septic systems or (2) reducing fertilizer inputs to areas of turf grass. Both management interventions reduced the groundwater-transported nitrogen load, and reductions were greater in areas with greater loads from septic systems or turf-grass fertilizers. The decrease in loads was steeper with septic upgrades than with turf-grass fertilizer reductions. This is because the starting load from septic systems is greater than the starting load from fertilizer (fig. 16), and only some of the fertilizer load is from turf-grass fertilizer. The delay between management actions and substantial reductions in groundwater-transported nitrogen loads varied seasonally; loads during the late summer months remained elevated longer than the winter loads. For example, only 48 percent of the reduction in August fertilizer loads occurred in the first year, as compared to 95 percent of the reduction in February loads. Spatial variation in the response time was also substantial, with coastal areas tending to have longer times to reduced loads than inland areas.
References Cited
Ascott, M.J., Gooddy, D.C., Fenton, O., Vero, S., Ward, R.S., Basu, N.B., Worrall, F., Van Meter, K., and Surridge, B.W.J., 2021, The need to integrate legacy nitrogen storage dynamics and time lags into policy and practice: Science of the Total Environment, v. 781, article 146698, accessed July 10, 2024, at https://doi.org/10.1016/j.scitotenv.2021.146698.
Bakker, M., Post, V., Langevin, C.D., Hughes, J.D., White, J.T., Starn, J.J., and Fienen, M.N., 2016, Scripting MODFLOW model development using Python and FloPy: Groundwater, v. 54, no. 5, p. 733–739, accessed July 10, 2024, at https://doi.org/10.1111/gwat.12413.
Barclay, J.R., Holland, M.J., and Mullaney, J.R., 2024, MODFLOW6 groundwater flow model, MODPATH particle-tracking simulation, and groundwater-transported nitrogen load model of average monthly conditions in coastal Connecticut and adjacent areas of New York and Rhode Island, 1993–2022: U.S. Geological Survey data release, https://doi.org/10.5066/P1HKENGV.
Barclay, J.R., and Holland, M.J., 2024, Summary simulated groundwater-transported nitrogen loads on the north shore of Long Island Sound and associated data: U.S. Geological Survey data release, https://doi.org/10.5066/P1XEN74S.
Barclay, J.R., Laabs, K.L., and Mullaney, J.R., 2023, Nitrogen loads, yields, and associated field data collected during baseflow conditions and site attributes for small basins draining to Long Island Sound: U.S. Geological Survey data release, accessed at https://doi.org/10.5066/P99IAXUI.
Barclay, J.R., and Mullaney, J.R., 2021a, Simulation of groundwater budgets and travel times for watersheds on the north shore of Long Island Sound, with implications for nitrogen-transport studies: U.S. Geological Survey Scientific Investigations Report 2021–0020, 84 p., accessed July 10, 2024, at https://doi.org/10.3133/sir20215116.
Barclay, J.R., and Mullaney, J.R., 2021b, Steady-state MODFLOW–NWT and MODPATH groundwater flow models of coastal Connecticut and adjacent areas of New York and Rhode Island, as well as a nitrogen transport model of the Niantic River watershed: U.S. Geological Survey data release, accessed July 10, 2024, at https://doi.org/10.5066/P9BLHPIT.
Barclay, J.R., and Mullaney, J.R., 2021c, Summary simulated groundwater budgets and travel times for watersheds on the north shore of Long Island Sound: U.S. Geological Survey data release, accessed July 10, 2024, at https://doi.org/10.5066/P91TQ895.
Barlow, P.M., Cunningham, W.L., Zhai, T., and Gray, M., 2015, U.S. Geological Survey groundwater toolbox, a graphical and mapping interface for analysis of hydrologic data (version 1.0)—User guide for estimation of base flow, runoff, and groundwater recharge from streamflow data: U.S. Geological Survey Techniques and Methods, book 3, chap. B10, 40 p., accessed July 10, 2024, at https://doi.org/10.3133/tm3B10.
Befus, K.M., Kroeger, K.D., Smith, C.G., and Swarzenski, P.W., 2017, The magnitude and origin of groundwater discharge to eastern U.S. and Gulf of Mexico coastal waters: Geophysical Research Letters, v. 44, no. 20, p. 10,396–10,406, accessed July 10, 2024, at https://doi.org/10.1002/2017GL075238.
Connecticut Department of Energy and Environmental Protection [CT DEEP], 2005, Connecticut hydrography set: Connecticut Department of Energy and Environmental Protection dataset, accessed October 21, 2021, at https://deepmaps.ct.gov/maps/CTDEEP::connecticut-hydrography-set/about.
Connecticut Department of Energy and Environmental Protection [CT DEEP], 2019, Connecticut’s Second Generation Nitrogen Strategy—Long Island Sound, 2017–2022: Connecticut Department of Energy and Environmental Protection document, 17 p., accessed May 4, 2020, at https://portal.ct.gov/-/media/DEEP/water/lis_water_quality/nitrogen_control_program/2ndGenNitrogenStrategypdf.pdf?la=en.
Connecticut Department of Energy and Environmental Protection [CT DEEP], 2022, Connected sewer service areas: Connecticut Department of Energy and Environmental Protection dataset, accessed January 11, 2023, at https://ct-deep-gis-open-data-website-ctdeep.hub.arcgis.com/datasets/CTDEEP:connected-sewer-service-areas/about.
Cronshey, R., McCuen, R., Miller, N., Rawls, W., Robbins, S., and Woodward, D., 1986, Urban hydrology for small watersheds (2d ed.). U.S. Department of Agriculture, Natural Resources Conservation Service, Conservation Engineering Division, Technical Release 55, [164 p., variously paged], accessed January 27, 2023, at https://www.nrc.gov/docs/ML1421/ML14219A437.pdf.
Dewitz, J.A., and U.S. Geological Survey, 2021, National Land Cover Database (NLCD) 2019 products (ver. 2.0, June 2021): U.S. Geological Survey data release, accessed February 27, 2024, at https://doi.org/10.5066/P9KZCM54.
Dieter, C.A., Linsey, K.S., Caldwell, R.R., Harris, M.A., Ivahnenko, T.I., Lovelace, J.K., Maupin, M.A., and Barber, N.L., 2018, Estimated use of water in the United States county-level data for 2015 (ver. 2.0, June 2018): U.S. Geological Survey data release, accessed June 25, 2021, at https://doi.org/10.5066/F7TB15V5.
Divers, M.T., Elliott, E.M., and Bain, D.J., 2013, Constraining nitrogen inputs to urban streams from leaking sewers using inverse modeling—Implications for dissolved inorganic nitrogen (DIN) retention in urban environments: Environmental Science & Technology, v. 47, no. 4, p. 1816–1823, accessed July 10, 2024, at https://doi.org/10.1021/es304331m.
Division of Water—Bureau of Water Resource Management, 2022, NYS water withdrawals—Excludes DEC region 1 (NYSDEC): State of New York, accessed January 11, 2023, at https://gis.ny.gov/gisdata/inventories/details.cfm?DSID=1265.
Dripps, W.R., and Bradbury, K.R., 2007, A simple daily soil–water balance model for estimating the spatial and temporal distribution of groundwater recharge in temperate humid areas: Hydrogeology Journal, v. 15, no. 3, p. 433–444, accessed July 10, 2024, at https://doi.org/10.1007/s10040-007-0160-6.
Falcone, J.A., 2011, GAGES–II: Geospatial Attributes of Gages for Evaluating Streamflow: U.S. Geological Survey data release, accessed July 10, 2024, at https://doi.org/10.3133/70046617.
Falcone, J.A., 2016, U.S. block-level population density rasters for 1990, 2000, and 2010: U.S. Geological Survey data release, accessed June 24, 2021, at https://doi.org/10.5066/F74J0C6M.
Falgout, J., Gordon, J., Lee, L., Williams, B., and USGS Advanced Research Computing, [2023], USGS Hovenweep supercomputer: U.S. Geological Survey web page, accessed July 10, 2024, at https://doi.org/10.5066/P927BI7R.
Falgout, J., Gordon, J., Williams, B., Davis, M.J., and USGS Advanced Research Computing, [2019], USGS Denali supercomputer: U.S. Geological Survey web page, accessed July 10, 2024, at https://doi.org/10.5066/P9PSW367.
Finkelstein, J.S., Monti, J., Jr., Masterson, J.P., and Walter, D.A., 2022, Application of a soil-water-balance model to estimate annual groundwater recharge for Long Island, New York, 1900–2019: U.S. Geological Survey Scientific Investigations Report 2021–5143, 25 p., accessed January 27, 2023, at https://doi.org/10.3133/sir20215143.
Harbaugh, A.W., 2005, MODFLOW–2005, The U.S. Geological Survey modular ground-water model—The ground-water flow process: U.S. Geological Survey Techniques and Methods, book 7, chap. A16, 253 p., accessed June 24, 2021, at https://doi.org/10.3133/tm6A16.
Hargreaves, G.H., and Samani, Z.A., 1985, Reference crop evapotranspiration from temperature: Applied Engineering in Agriculture, v. 1, no. 2, p. 96–99. [Also available at https://doi.org/10.13031/2013.26773.]
Hinkle, S.R., and Tesoriero, A.J., 2014, Nitrogen speciation and trends, and prediction of denitrification extent, in shallow US groundwater: Journal of Hydrology, v. 509, p. 343–353, accessed September 16, 2020, at https://doi.org/10.1016/j.jhydrol.2013.11.048.
Holland, M.J., and Barclay, J.R., 2024, Soil-Water-Balance model developed to simulate net infiltration in watersheds on the north shore of the Long Island Sound: U.S. Geological Survey data release, https://doi.org/10.5066/P1GUC7FE.
Homer, C.G., Dewitz, J.A., Yang, L., Jin, S., Danielson, P., Xian, G., Coulston, J., Herold, N.D., Wickham, J., and Megown, K., 2015, Completion of the 2011 National Land Cover Database for the conterminous United States—Representing a decade of land cover change information: Photogrammetric Engineering and Remote Sensing, v. 81, no. 5, p. 345–354, accessed July 11, 2024, at https://doi.org/10.1016/S0099-1112(15)30100-2.
Horton, J.D., 2017, The State Geologic Map Compilation (SGMC) geodatabase of the conterminous United States (ver. 1.1, August 2017): U.S. Geological Survey data release: accessed July 22, 2019, at https://doi.org/10.5066/F7WH2N65.
Hughes, J.D., Langevin, C.D., and Banta, E.R., 2017, Documentation for the MODFLOW 6 framework: U.S. Geological Survey Techniques and Methods, book 6, chap. A7, 40 p., accessed July 10, 2024, at https://doi.org/10.3133/tm6A57.
Jessen, C., Bednarz, V.N., Rix, L., Teichberg, M., and Wild, C., 2015, Marine eutrophication, in Armon, R.H., and Hänninen, O., eds., Environmental indicators: Dordrecht, Netherlands, Springer, p. 177–203, accessed July 10, 2024, at https://doi.org/10.1007/978-94-017-9499-2_11.
Langevin, C.D., Hughes, J.D., Banta, E.R., Niswonger, R.G., Panday, S., and Provost, A.M., 2017, Documentation for the MODFLOW 6 groundwater flow model: U.S. Geological Survey Techniques and Methods, book 6, chap. A55, 197 p., accessed July 10, 2024, at https://doi.org/10.3133/tm6A55.
Langevin, C.D., Hughes, J.D., Banta, E.R., Provost, A.M., Niswonger, R.G., and Panday, S., 2021, MODFLOW 6 modular hydrologic model version 6.2.1: U.S. Geological Survey software release, February 18, 2021, accessed August 5, 2024, at https://doi.org/10.5066/F76Q1VQV.
Leaf, A.T., Fienen, M.N., and Reeves, H.W., 2021, SFRmaker and Linesink-Maker—Rapid construction of streamflow routing networks from hydrography data: Groundwater, v. 59, no. 5, p. 761–771, accessed July 10, 2024, at https://doi.org/10.1111/gwat.13095.
Long Island Sound Study [LISS], 2015, Long Island Sound Study Comprehensive Conservation and Management Plan—Returning the urban sea to abundance: Long Island Sound Study, 70 p., accessed December 2, 2019, at https://longislandsoundstudy.net/2015/09/2015-comprehensive-conservation-and-management-plan/.
Lombard, P.J., Barclay, J.R., and McCarthy, D.-A.E., 2020, 2020 drought in New England: U.S. Geological Survey Open-File Report 2020–1148, 12 p., accessed July 10, 2024, at https://doi.org/10.3133/ofr20201148.
Long Island Sound Resource Center and U.S. Geological Survey, 2004, Thickness of glacial sediments in Connecticut and the Long Island Sound basin polygon: State of Connecticut, Department of Environmental Protection data, accessed January 14, 2020, at ftp://ftp.state.ct.us/pub/dep/gis/shapefile_format_zip/Glacial_Sediment_Thickness_shp.zip.
Lorenz, D.L., 2017, DVstats—Functions to manipulate daily-values data: U.S. Geological Survey software release, R package version 0.3.4, accessed December 15, 2020, at https://code.usgs.gov/water/analysis-tools/DVstats.
Lyford, F.P., Carlson, C.S., Brown, C.J., and Starn, J.J., 2007, Hydrogeologic setting and ground-water flow simulations of the Pomperaug River Basin regional study area, Connecticut, section 6 of Paschke, S.S., ed., Hydrogeologic settings and ground-water flow simulations for regional studies of the transport of anthropogenic and natural contaminants to public-supply wells—studies begun in 2001: U.S. Geological Survey Professional Paper 1737–A, p. 6-1-6–26, accessed June 24, 2021, at https://doi.org/10.3133/pp1737A.
Masterson, J.P., and Granato, G.E., 2013, Numerical simulation of groundwater and surface-water interactions in the Big River Management Area, central Rhode Island: U.S. Geological Survey Scientific Investigations Report 2012–5077, 53 p., accessed June 24, 2021, at https://doi.org/10.3133/sir20125077.
McCallum, B.E., Painter, J.A., and Frantz, E.R., 2012, Monitoring inland storm tide and flooding from Hurricane Irene along the Atlantic Coast of the United States, August 2011: U.S. Geological Survey Open-File Report 2012–1022, 29 p., accessed March 7, 2024, at https://doi.org/10.3133/ofr20121022.
Meals, D.W., Dressing, S.A., and Davenport, T.E., 2010, Lag time in water quality response to best management practices—A review: Journal of Environmental Quality, v. 39, no. 1, p. 85–96, accessed July 10, 2024, at https://doi.org/10.2134/jeq2009.0108.
Melvin, R.L., Stone, B.D., Stone, J.R., and Trask, N.J., 1992, Hydrogeology of thick till deposits in Connecticut: U.S. Geological Survey Open-File Report 92–43, 43 p. accessed June 24, 2021, at https://doi.org/10.3133/ofr9243.
Moore, E.M., Barclay, J.R., Haynes, A.B., Jackson, K.E., Bisson, A.M., Briggs, M.A., and Helton, A.M., 2023, Where the past meets the present—Connecting nitrogen from watersheds to streams through groundwater flowpaths: Environmental Research Letters, v. 18, no. 12, article 124039, accessed July 10, 2024, at https://doi.org/10.1088/1748-9326/ad0c86.
Mullaney, J.R., 2013, Nutrient concentrations and loads and Escherichia coli densities in tributaries of the Niantic River estuary, southeastern Connecticut, 2005 and 2008–2011: U.S. Geological Survey Scientific Investigations Report 2013–5008, 27 p., accessed July 10, 2024, at https://doi.org/10.3133/sir20135008.
Mullaney, J.R., 2015, Evaluation of the effects of sewering on nitrogen loads to the Niantic River, southeastern Connecticut, 2005–2011: U.S. Geological Survey Scientific Investigations Report 2015–5011, 30 p., accessed July 10, 2024, at https://doi.org/10.3133/sir20155011.
Mullaney, J.R., 2016, Nutrient, organic carbon, and chloride concentrations and loads in selected Long Island Sound tributaries—Four decades of change following the passage of the Federal Clean Water Act: U.S. Geological Survey Scientific Investigations Report 2015–5189, 60 p., accessed July 10, 2024, at https://doi.org/10.3133/sir20155189.
Mullaney, J.R., 2023, Nitrogen concentrations and loads and seasonal nitrogen loads in selected Long Island Sound tributaries, water years 1995–2021 (ver. 1.1, February 2024): U.S. Geological Survey data release, accessed March 28, 2024, at https://doi.org/10.5066/P9A6S4BI.
Mullaney, J.R., and Schwarz, G.E., 2013, Estimated nitrogen loads from selected tributaries in Connecticut draining to Long Island Sound, 1999–2009: U.S. Geological Survey Scientific Investigations Report 2013–5171, 65 p., accessed July 10, 2024, at https://doi.org/10.3133/sir20135171.
Mullaney, J.R., Schwarz, G.E., and Trench, E.C.T., 2002, Estimation of nitrogen yields and loads from basins draining to Long Island Sound, 1988–98: U.S. Geological Survey Water-Resources Investigations Report 2002–4044, 85 p., accessed July 10, 2024, at https://doi.org/10.3133/wri024044.
Nash, J.E., and Sutcliffe, J.V., 1970, River flow forecasting through conceptual models part I—A discussion of principles: Journal of Hydrology, v. 10, no. 3, p. 282–290, accessed July 10, 2024, at https://doi.org/10.1016/0022-1694(70)90255-6.
National Atmospheric Deposition Program, 2019, Total deposition maps, v2018.02: National Atmospheric Deposition Program datasets, accessed December 2, 2019, at https://nadp.slh.wisc.edu/committees/tdep/#tdep-maps.
New York State Department of Environmental Conservation and Connecticut Department of Energy and Environmental Protection, 2000, A total maximum daily load analysis to achieve water quality standards for dissolved oxygen in Long Island Sound: Long Island Sound Study, [variously paged; 73 p.], accessed July 10, 2024, at https://longislandsoundstudy.net/wp-content/uploads/2010/03/Tmdl.pdf.
New York State Museum and New York State Geological Survey, 1999, Surficial geology—Lower Hudson: New York State Museum Technology Center digital dataset [corresponds with original 1989 map sheet], scale 1:250,000, accessed June 4, 2019, at https://www.nysm.nysed.gov/research-collections/geology/gis.
Niswonger, R.G., Panday, S., and Ibaraki, M., 2011, MODFLOW–NWT, A Newton formulation for MODFLOW–2005: U.S. Geological Survey Techniques and Methods, book 6, chap. A37, 44 p., accessed June 24, 2021, at https://doi.org/10.3133/tm6A37.
Niswonger, R.G., and Prudic, D.E., 2005, Documentation of the Streamflow-Routing (SFR2) Package to include unsaturated flow beneath streams—A modification to SFR1: U.S. Geological Survey Techniques and Methods, book 6, chap. A13, 50 p., accessed June 24, 2021, at https://doi.org/10.3133/tm6A13.
New York City Department of Environmental Protection, 2017, SEWERSHEDS_ALL: New York City Department of Environmental Protection dataset, accessed December 2, 2019, at https://services.arcgis.com/at3rDjch5X7i9Bag/arcgis/rest/services/SEWERSHEDS_ALL/FeatureServer.
Oakley, S.M., Gold, A.J., and Oczkowski, A.J., 2010, Nitrogen control through decentralized wastewater treatment—Process performance and alternative management strategies: Ecological Engineering, v. 36, no. 11, p. 1520–1531, accessed July 10, 2024, at https://doi.org/10.1016/j.ecoleng.2010.04.030.
Pollock, D.W., 2016, User guide for MODPATH Version 7—A particle-tracking model for MODFLOW: U.S. Geological Survey Open-File Report 2016–1086, 35 p., accessed July 10, 2024, at https://doi.org/10.3133/ofr20161086.
Pollock, D.W., 2017, MODPATH v7.2.01—A particle-tracking model for MODFLOW: U.S. Geological Survey software release, December 15, 2017, accessed August 5, 2024, at https://doi.org/10.5066/F70P0X5X.
R Core Team, 2021, R—A language and environment for statistical computing: R Foundation software release, accessed June 19, 2024, at https://www.r-project.org/.
Rhode Island Geographic Information System [RIGIS], 1989, Rhode Island glacial deposits—s44ggl88: Rhode Island Geographic Information System (RIGIS) Data Distribution System, accessed July 13, 2018, at https://www.rigis.org/datasets/glacial-deposits.
Rhode Island Geographic Information System [RIGIS], 2012, Rhode Island sewered areas—sewerAreas12: Rhode Island Geographic Information System (RIGIS) Data Distribution System, accessed March 4, 2019, at https://www.rigis.org/datasets/sewered-areas.
Rutledge, A.T., 1998, Computer programs for describing the recession of ground-water discharge and for estimating mean ground-water recharge and discharge from streamflow records-update: U.S. Geological Survey Water-Resources Investigations Report 98–4148, 43 p., accessed July 10, 2024, at https://doi.org/10.3133/wri984148.
Seaber, P.R., Kapinos, F.P., and Knapp, G.L., 1987, Hydrologic unit maps: U.S. Geological Survey Water Supply Paper 2294, 63 p., 1 pl., accessed July 10, 2024, at https://doi.org/10.3133/wsp2294.
Shaffer, K.H., and Runkle, D.L., 2007, Consumptive water-use coefficients for the Great Lakes Basin and climatically similar areas: U.S. Geological Survey Scientific Investigations Report 2007–5197, 191 p., accessed June 24, 2021, at https://doi.org/10.3133/sir20075197.
Smith, V.H., 2003, Eutrophication of freshwater and coastal marine ecosystems a global problem: Environmental Science and Pollution Research International, v. 10, no. 2, p. 126–139, accessed March 14, 2024, at https://doi.org/10.1065/espr2002.12.142.
Soil Survey Staff, 2022, The Gridded Soil Survey Geographic (gSSURGO) Database for the Conterminous United States: United States Department of Agriculture, Natural Resources Conservation Service, accessed March 14, 2024, at https://gdg.sc.egov.usda.gov/.
Starn, J.J., and Brown, C.J., 2007, Simulations of ground-water flow and residence time near Woodbury, Connecticut: U.S. Geological Survey Scientific Investigations Report 2007–5210, 45 p., accessed July 10, 2024, at https://doi.org/10.3133/sir20075210.
Starn, J.J., and Carlson, C.S., 2018, Supporting datasets used in the General Groundwater-Model Construction System Version 0.1: U.S. Geological Survey data release, accessed July 10, 2024, at https://doi.org/10.5066/F7FQ9VTD.
Stone, J.R., Schafer, J.P., London, E.H., DiGiacomo-Cohen, M.L., Lewis, R.S., and Thompson, W.B., 2005, Quaternary geologic map of Connecticut and Long Island Sound basin: U.S. Geological Survey Scientific Investigations Map 2784, 2 sheets, scale 1:125,000, 72-p. pamphlet, accessed July 10, 2024, at https://doi.org/10.3133/sim2784.
Stone, J.R., Schafer, J.P., London, E.H., and Thompson, W.B., 1992, Surficial materials map of Connecticut: Reston, Va., U.S. Geological Survey, 2 sheets, scale 1:125,000, accessed July 10, 2024, at https://doi.org/10.3133/70046712.
Thompson, C., Smith, L., and Maji, R., 2007, Hydrogeological modeling of submarine groundwater discharge on the continental shelf of Louisiana: Journal of Geophysical Research. Oceans, v. 112, no. C3, article C03014, p. 1–13, accessed July 11, 2024, at https://doi.org/10.1029/2006JC003557.
Thornthwaite, C.W., 1948, An Approach toward a rational classification of climate: Geographical Review, v 38, no. 1, p. 55–94, accessed July 10, 2024, at https://doi.org/10.2307/210739.
Thornton, M.M., Shrestha, R., Wei, Y., Thornton, P.E., Kao, S.-C., and Wilson, B.E., 2022, Daymet—Daily surface weather data on a 1-km grid for North America, version 4 R1: Oak Ridge National Laboratory Distributed Active Archive Center dataset, accessed July 10, 2024, at https://doi.org/10.3334/ORNLDAAC/2129.
Trench, E.C.T., Moore, R.B., Ahearn, E.A., Mullaney, J.R., Hickman, R.E., and Schwarz, G.E., 2012, Nutrient concentrations and loads in the northeastern United States—Status and trends, 1975–2003: U.S. Geological Survey Scientific Investigations Report 2011–5114, 169 p., accessed July 10, 2024, at https://doi.org/10.3133/sir20115114.
U.S. Army Corps of Engineers and Federal Emergency Management Agency, 2019, National inventory of dams: U.S. Army Corps of Engineers database, accessed January 28, 2022, at https://nid.sec.usace.army.mil/#/.
U.S. Census Bureau, 2010, Vacancy status, table H5 of 2010 decennial census: U.S. Census Bureau data, accessed April 8, 2024, at https://data.census.gov/table/DECENNIALSF12010.H5?q=H5: VACANCY STATUS&g=040XX00US09$1500000&y=2010.
U.S. Environmental Protection Agency [EPA], 2021, Enforcement and Compliance History Online (ECHO): U.S. Environmental Protection Agency database, accessed October 6, 2021, at https://echo.epa.gov/facilities/facility-search?mediaSelected=all.
U.S. Environmental Protection Agency and U.S. Geological Survey, 2012, National Hydrography Dataset Plus—NHDPlus, version 2.1: U.S. Environmental Protection Agency and U.S. Geological Survey database, accessed February 2, 2021, at https://www.epa.gov/waterdata/nhdplus-national-hydrography-dataset-plus.
U.S. Fish and Wildlife Service, 2018, National Wetlands Inventory: U.S. Fish and Wildlife Service datasets, accessed April 29, 2019, at https://www.fws.gov/wetlands/.
U.S. Geological Survey, 2024, USGS water data for the Nation: U.S. Geological Survey National Water Information System database, accessed January 4, 2024, at https://doi.org/10.5066/F7P55KJN.
U.S. Geological Survey, Connecticut Department of Environmental Protection, and Geological and Natural History Survey, 2005, Connecticut quaternary geology and surficial materials polygon: Connecticut Department of Environmental Protection data, accessed August 27, 2021, at https://ct-deep-gis-open-data-website-ctdeep.hub.arcgis.com/datasets/CTDEEP:quaternary-geology/about.
Valiela, I., Collins, G., Kremer, J., Lajtha, K., Geist, M., Seely, B., Brawley, J., and Sham, C.H., 1997, Nitrogen loading from coastal watersheds to receiving estuaries—New method and application: Ecological Applications, v. 7, no. 2, p. 358–380, accessed July 10, 2024, at https://doi.org/10.1890/1051-0761(1997)007[0358:NLFCWT]2.0.CO;2.
Van Meter, K., Basu, N., Veenstra, J., and Burras, C., 2016, The nitrogen legacy—Emerging evidence of nitrogen accumulation in anthropogenic landscapes: Environmental Research Letters, v. 11, no. 3, article 035014, accessed July 10, 2024, at https://doi.org/10.1088/1748-9326/11/3/035014.
Vaudrey, J.M.P., Yarish, C., Kim, J.K., Pickerell, C., and Brousseau, L., 2016a, Connecticut Sea Grant Project Report—Comparative analysis and model development for determining the susceptibility to eutrophication of Long Island Sound embayments: Final report to the Connecticut Sea Grant, New York Sea Grant, and Long Island Sound Study, project R/CE–34–CTNY, 46 p., accessed February 22, 2024, at https://vaudrey.lab.uconn.edu/wp-content/uploads/sites/1663/2017/02/Vaudrey_R-CE-34-CTNY_FinalReport_2016.pdf.
Vaudrey, J.M.P., Yarish, C., Kim, J.K., Pickerell, C., and Brousseau, L., 2016b, Long Island Sound nitrogen loading model, 2016 version: Groton, Conn., University of Connecticut data model, accessed February 22, 2024, at https://vaudrey.lab.uconn.edu/wp-content/uploads/sites/1663/2016/02/LongIslandSound_NLoadingModel_v2016.xlsx.
Vlahos, P., Whitney, M.M., Menniti, C., Mullaney, J.R., Morrison, J., and Jia, Y., 2020, Nitrogen budgets of the Long Island Sound estuary: Estuarine, Coastal and Shelf Science, v. 232, article 106493, accessed July 10, 2024, at https://doi.org/10.1016/j.ecss.2019.106493.
Westchester County Department of Planning, 2015, Sewer districts: Westchester County dataset, accessed March 4, 2019, at https://giswww.westchestergov.com/download/wcsewdst.zip.
Westenbroek, S.M., Engott, J.A., Kelson, V.A., and Hunt, R.J., 2018, SWB Version 2.0—A soil-water-balance code for estimating net infiltration and other water-budget components: U.S. Geological Survey Techniques and Methods, book 6, chap. A59, accessed January 27, 2023, at https://doi.org/10.3133/tm6A59.
White, J.T., Hunt, R.J., Fienen, M.N., and Doherty, J.E., 2020, Approaches to highly parameterized inversion: PEST++ Version 5, a software suite for parameter estimation, uncertainty analysis, management optimization and sensitivity analysis: U.S. Geological Survey Techniques and Methods, book 7, chap. C26, 52 p., accessed July 10, 2024, at https://pubs.er.usgs.gov/publication/tm7C26.
Yager, R.M., Kauffman, L.J., Buchwald, C.A., Westenbroek, S.M., and Reddy, J.E., 2018, Digital products from a hydrogeologic framework for Quaternary sediments within the glaciated conterminous United States: U.S. Geological Survey data release, accessed June 24, 2021, at https://doi.org/10.5066/F7HH6J8X.
Appendix 1. Estimation of Seasonal Population
-
1. The average year-round population per housing unit for each census block was calculated by dividing the block population by the number of housing units per block.
-
2. The population per seasonal unit for each census block was assumed to be twice the average year-round population per housing unit calculated in step 1, or at least four people per seasonal housing unit (CDM Smith, 2020).
-
3. The number of vacant housing units classified as “For seasonal, recreational, or occasional use” from census table H5 (U.S. Census Bureau, 2010) was taken to be the number of seasonally occupied units. Additional seasonal population for each census block was estimated by multiplying the number of seasonally occupied units per block by the population per seasonal unit estimated in step 2.
-
4. Additional seasonal population per census block was divided by census block area to calculate additional seasonal population density. The block-level additional seasonal population density was then converted to a 60-meter raster to match the resolution of the year-round population density map (Falcone, 2016).
-
5. Seasonal residents were assumed to be present during the summer months of June, July, and August.
References Cited
CDM Smith, 2020, Phase II Onsite Wastewater Treatment Systems Project (DEEP–WPLR–2019LISN) Executive Summary: Connecticut Department of Energy and Environmental Protection, prepared by CDM Smith, 33 p., accessed March 1, 2024, at https://portal.ct.gov/-/media/DEEP/water/lis_water_quality/nitrogen_control_program/CTDEEP_Phase_II_OWTS_Final_Executive_Summary_102720.pdf.
Falcone, J.A., 2016, U.S. block-level population density rasters for 1990, 2000, and 2010: U.S. Geological Survey data release, accessed June 24, 2021, at https://doi.org/10.5066/F74J0C6M.
U.S. Census Bureau, 2010, Vacancy status, table H5 of 2010 decennial census: U.S. Census Bureau data, accessed April 8, 2024, at https://data.census.gov/table/DECENNIALSF12010.H5?q=H5: VACANCY STATUS&g=040XX00US09$1500000&y=2010.
Conversion Factors
U.S. customary units to International System of Units
International System of Units to U.S. customary units
Datums
Vertical coordinate information is referenced to the North American Vertical Datum of 1988 (NAVD 88).
Horizontal coordinate information is referenced to the North American Datum of 1983 (NAD 83).
Altitude, as used in this report, refers to distance above the vertical datum.
Supplemental Information
Nitrogen loads are reported in kilograms of nitrogen per day (kg-N/d) or kilograms of nitrogen per year (kg-N/yr). Nitrogen yields are reported in kilograms of nitrogen per square kilometer per day ([kg-N/km2]/d), and nitrogen yield residuals are reported in kilograms of nitrogen per square kilometer per year ([kg-N/km2]/yr).
A water year (WY) is the 12-month period from October 1 through September 30 of the following year and is designated by the calendar year in which it ends.
Abbreviations
AWC
available water capacity
CT DEEP
Connecticut Department of Energy and Environmental Protection
DRN
Drain [package of MODFLOW groundwater-flow model]
EPA
U.S. Environmental Protection Agency
EVT
Evapotranspiration [package of MODFLOW groundwater-flow model]
GAGES II
Geospatial Attributes of Gages for Evaluating Streamflow, version II
GHB
General-Head Boundary [package of MODFLOW groundwater-flow model]
HSG
hydrologic soil group
HUC6
six-digit hydrologic unit code
HUC12
12-digit hydrologic unit code
LISS
Long Island Sound Study
NLCD
National Land Cover Database
NLCD2011
National Land Cover Database (published in 2011)
NLCD2019
National Land Cover Database (published in 2019)
NRCS
Natural Resources Conservation Service
RCH
Recharge [package of MODFLOW groundwater-flow model]
SFR
Stream-Flow Routing [package of MODFLOW groundwater-flow model]
SSURGO
Soil Survey Geographic Database [NRCS]
SWB
soil-water balance
TDN
total dissolved nitrogen
USGS
U.S. Geological Survey
WEL
Well [package of MODFLOW groundwater-flow model]
For more information about this report, contact:
Director, New England Water Science Center
U.S. Geological Survey
10 Bearfoot Road
Northborough, MA 01532
dc_nweng@usgs.gov
or visit our website at
https://www.usgs.gov/centers/new-england-water
Publishing support provided by the Pembroke Publishing Service Center
Disclaimers
Any use of trade, firm, or product names is for descriptive purposes only and does not imply endorsement by the U.S. Government.
Although this information product, for the most part, is in the public domain, it also may contain copyrighted materials as noted in the text. Permission to reproduce copyrighted items must be secured from the copyright owner.
Suggested Citation
Barclay, J.R., Holland, M.J., and Mullaney, J.R., 2024, Simulated mean monthly groundwater-transported nitrogen loads in watersheds on the north shore of Long Island Sound, 1993–2022: U.S. Geological Survey Scientific Investigations Report 2024–5090, 63 p., https://doi.org/10.3133/sir20245090.
ISSN: 2328-0328 (online)
Study Area
| Publication type | Report |
|---|---|
| Publication Subtype | USGS Numbered Series |
| Title | Simulated mean monthly groundwater-transported nitrogen loads in watersheds on the north shore of Long Island Sound, 1993–2022 |
| Series title | Scientific Investigations Report |
| Series number | 2024-5090 |
| DOI | 10.3133/sir20245090 |
| Publication Date | September 26, 2024 |
| Year Published | 2024 |
| Language | English |
| Publisher | U.S. Geological Survey |
| Publisher location | Reston, VA |
| Contributing office(s) | New England Water Science Center |
| Description | Report: xi, 63; 3 Data Releases |
| Country | United States |
| State | Connecticut, Rhode Island |
| Other Geospatial | Long Island Sound |
| Online Only (Y/N) | Y |
| Additional Online Files (Y/N) | N |


